
Advancing Energy Testing of Mobile Applications
222
UC Irvine UC Irvine Electronic Theses and Dissertations Title Advancing Energy Testing of Mobile Applications Permalink https://escholarship.org/uc/item/4vs7z6f2 Author Jabbarvand Behrouz, Reyhaneh Publication Date 2020 Copyright Information This work is made available under the terms of a Creative Commons Attribution- NonCommercial License, availalbe at https://creativecommons.org/licenses/by-nc/4.0/ Peer reviewed|Thesis/dissertation eScholarship.org Powered by the California Digital Library University of California
-
Upload
khangminh22 -
Category
Documents
-
view
0 -
download
0
Transcript of Advancing Energy Testing of Mobile Applications

UC IrvineUC Irvine Electronic Theses and Dissertations
TitleAdvancing Energy Testing of Mobile Applications
Permalinkhttps://escholarship.org/uc/item/4vs7z6f2
AuthorJabbarvand Behrouz, Reyhaneh
Publication Date2020
Copyright InformationThis work is made available under the terms of a Creative Commons Attribution-NonCommercial License, availalbe at https://creativecommons.org/licenses/by-nc/4.0/ Peer reviewed|Thesis/dissertation
eScholarship.org Powered by the California Digital LibraryUniversity of California
UNIVERSITY OF CALIFORNIA,IRVINE
Advancing Energy Testing of Mobile Applications
DISSERTATION
submitted in partial satisfaction of the requirementsfor the degree of
DOCTOR OF PHILOSOPHY
in Software Engineering
by
Reyhaneh Jabbarvand
Dissertation Committee:Professor Sam Malek, Chair
Professor Cristina Videira LopesAssociate Professor James A. Jones
2020

© 2020 Reyhaneh Jabbarvand

DEDICATION
To my beloved husband and daughter, Alireza and Nora
ii

TABLE OF CONTENTS
Page
LIST OF FIGURES vii
LIST OF TABLES ix
ACKNOWLEDGMENTS x
CURRICULUM VITAE xi
ABSTRACT OF THE DISSERTATION xiii
1 Introduction 11.1 Dissertation Overview . . . . . . . . . . . . . . . . . . . . . . . . . . . . . . 41.2 Dissertation Structure . . . . . . . . . . . . . . . . . . . . . . . . . . . . . . 6
2 Background 82.1 Methodology . . . . . . . . . . . . . . . . . . . . . . . . . . . . . . . . . . . 9
2.1.1 Search Protocol . . . . . . . . . . . . . . . . . . . . . . . . . . . . . . 92.1.2 Search Process . . . . . . . . . . . . . . . . . . . . . . . . . . . . . . 122.1.3 Threats To Validity . . . . . . . . . . . . . . . . . . . . . . . . . . . . 13
2.2 Defect Model . . . . . . . . . . . . . . . . . . . . . . . . . . . . . . . . . . . 142.2.1 Connectivity . . . . . . . . . . . . . . . . . . . . . . . . . . . . . . . . 142.2.2 Display . . . . . . . . . . . . . . . . . . . . . . . . . . . . . . . . . . 182.2.3 Location . . . . . . . . . . . . . . . . . . . . . . . . . . . . . . . . . . 192.2.4 Recurring Constructs . . . . . . . . . . . . . . . . . . . . . . . . . . . 202.2.5 Sensor . . . . . . . . . . . . . . . . . . . . . . . . . . . . . . . . . . . 212.2.6 Wakelock . . . . . . . . . . . . . . . . . . . . . . . . . . . . . . . . . 21
2.3 Analysis . . . . . . . . . . . . . . . . . . . . . . . . . . . . . . . . . . . . . . 232.3.1 RQ1: Distribution of Energy Defects . . . . . . . . . . . . . . . . . . 232.3.2 RQ2: Misused Resource Type . . . . . . . . . . . . . . . . . . . . . . 262.3.3 RQ4: Consequences of Energy Defects . . . . . . . . . . . . . . . . . 28
2.4 Discussion . . . . . . . . . . . . . . . . . . . . . . . . . . . . . . . . . . . . . 31
3 Related Work and Research Gap 323.1 Related Work . . . . . . . . . . . . . . . . . . . . . . . . . . . . . . . . . . . 32
3.1.1 Regression Testing . . . . . . . . . . . . . . . . . . . . . . . . . . . . 32
iii

3.1.2 Test Adequacy Criterion . . . . . . . . . . . . . . . . . . . . . . . . . 343.1.3 Mutation Testing . . . . . . . . . . . . . . . . . . . . . . . . . . . . . 353.1.4 Android Testing . . . . . . . . . . . . . . . . . . . . . . . . . . . . . . 363.1.5 Test Oracle . . . . . . . . . . . . . . . . . . . . . . . . . . . . . . . . 373.1.6 Green Software Engineering . . . . . . . . . . . . . . . . . . . . . . . 38
3.2 Research Gap . . . . . . . . . . . . . . . . . . . . . . . . . . . . . . . . . . . 40
4 Research Problem 444.1 Problem Statement . . . . . . . . . . . . . . . . . . . . . . . . . . . . . . . . 494.2 Research Hypotheses . . . . . . . . . . . . . . . . . . . . . . . . . . . . . . . 50
5 Energy-Aware Mutation Testing 535.1 Introduction . . . . . . . . . . . . . . . . . . . . . . . . . . . . . . . . . . . . 535.2 Framework Overview . . . . . . . . . . . . . . . . . . . . . . . . . . . . . . . 565.3 Mutation Operators . . . . . . . . . . . . . . . . . . . . . . . . . . . . . . . . 58
5.3.1 Location Mutation Operators . . . . . . . . . . . . . . . . . . . . . . 605.3.2 Connectivity Mutation Operators . . . . . . . . . . . . . . . . . . . . 615.3.3 Wakelock Mutation Operators . . . . . . . . . . . . . . . . . . . . . . 655.3.4 Display Mutation Operators . . . . . . . . . . . . . . . . . . . . . . . 655.3.5 Recurring Callback and Loop Mutation Operators . . . . . . . . . . . 665.3.6 Sensor Mutation Operators . . . . . . . . . . . . . . . . . . . . . . . 66
5.4 Analyzing Mutants . . . . . . . . . . . . . . . . . . . . . . . . . . . . . . . . 685.4.1 Killed Mutants . . . . . . . . . . . . . . . . . . . . . . . . . . . . . . 685.4.2 Equivalent and Stillborn Mutants . . . . . . . . . . . . . . . . . . . . 71
5.5 Evaluation . . . . . . . . . . . . . . . . . . . . . . . . . . . . . . . . . . . . . 725.5.1 Experimental Setup and Implementation . . . . . . . . . . . . . . . . 735.5.2 RQ1: Prevalence, Quality, and Contribution . . . . . . . . . . . . . . 765.5.3 RQ2: Effectiveness . . . . . . . . . . . . . . . . . . . . . . . . . . . . 775.5.4 RQ3: Association to Real Faults . . . . . . . . . . . . . . . . . . . . . 805.5.5 RQ4: Accuracy of Oracle . . . . . . . . . . . . . . . . . . . . . . . . . 815.5.6 RQ5: Performance . . . . . . . . . . . . . . . . . . . . . . . . . . . . 82
5.6 Discussion . . . . . . . . . . . . . . . . . . . . . . . . . . . . . . . . . . . . . 83
6 Energy-Aware Test Input Generation 856.1 Introduction . . . . . . . . . . . . . . . . . . . . . . . . . . . . . . . . . . . . 856.2 Illustrative Example . . . . . . . . . . . . . . . . . . . . . . . . . . . . . . . 886.3 Approach Overview and Challenges . . . . . . . . . . . . . . . . . . . . . . . 906.4 Model Extractor . . . . . . . . . . . . . . . . . . . . . . . . . . . . . . . . . 93
6.4.1 Component Transition Graph (CTG) . . . . . . . . . . . . . . . . . . 936.4.2 Lifecycle State Machine (LSM) . . . . . . . . . . . . . . . . . . . . . 976.4.3 Hardware State Machine (HSM) . . . . . . . . . . . . . . . . . . . . . 98
6.5 Test Generator . . . . . . . . . . . . . . . . . . . . . . . . . . . . . . . . . . 1016.5.1 Genetic Algorithm . . . . . . . . . . . . . . . . . . . . . . . . . . . . 1016.5.2 Genetic Operators . . . . . . . . . . . . . . . . . . . . . . . . . . . . 1036.5.3 Fitness Evaluation . . . . . . . . . . . . . . . . . . . . . . . . . . . . 108
iv

6.5.4 Test-Suite Minimization . . . . . . . . . . . . . . . . . . . . . . . . . 1106.6 Evaluation . . . . . . . . . . . . . . . . . . . . . . . . . . . . . . . . . . . . . 110
6.6.1 Experimental Setup . . . . . . . . . . . . . . . . . . . . . . . . . . . . 1126.6.2 RQ1: API and Execution Context Coverage . . . . . . . . . . . . . . 1136.6.3 RQ2: Effectiveness . . . . . . . . . . . . . . . . . . . . . . . . . . . . 1146.6.4 RQ3: Necessity of the Models . . . . . . . . . . . . . . . . . . . . . . 1156.6.5 RQ4: Energy Defects Coverage . . . . . . . . . . . . . . . . . . . . . 1176.6.6 RQ5: Performance . . . . . . . . . . . . . . . . . . . . . . . . . . . . 118
6.7 Discussion . . . . . . . . . . . . . . . . . . . . . . . . . . . . . . . . . . . . . 118
7 Energy-Aware Test Oracle 1207.1 Introduction . . . . . . . . . . . . . . . . . . . . . . . . . . . . . . . . . . . . 1217.2 Motivating Example . . . . . . . . . . . . . . . . . . . . . . . . . . . . . . . 1237.3 Approach Overview . . . . . . . . . . . . . . . . . . . . . . . . . . . . . . . . 1257.4 Sequence Collector . . . . . . . . . . . . . . . . . . . . . . . . . . . . . . . . 127
7.4.1 State Vector (SV) . . . . . . . . . . . . . . . . . . . . . . . . . . . . . 1277.4.2 Collecting Sequences . . . . . . . . . . . . . . . . . . . . . . . . . . . 129
7.5 Learning Engine . . . . . . . . . . . . . . . . . . . . . . . . . . . . . . . . . . 1307.5.1 Model Selection . . . . . . . . . . . . . . . . . . . . . . . . . . . . . . 1317.5.2 Long Short-Term Memory (LSTM) . . . . . . . . . . . . . . . . . . . 1327.5.3 Dataset Curation . . . . . . . . . . . . . . . . . . . . . . . . . . . . . 1347.5.4 Attention Mechanism . . . . . . . . . . . . . . . . . . . . . . . . . . . 135
7.6 Attention Analysis . . . . . . . . . . . . . . . . . . . . . . . . . . . . . . . . 1367.7 Evaluation . . . . . . . . . . . . . . . . . . . . . . . . . . . . . . . . . . . . . 140
7.7.1 Experimental Setup . . . . . . . . . . . . . . . . . . . . . . . . . . . . 1407.7.2 RQ1: Effectiveness . . . . . . . . . . . . . . . . . . . . . . . . . . . . 1447.7.3 RQ2: Usage of Attention Mechanism . . . . . . . . . . . . . . . . . . 1467.7.4 RQ3: Detecting Unseen Defect Types . . . . . . . . . . . . . . . . . . 1487.7.5 RQ4: Reusability of the Oracle . . . . . . . . . . . . . . . . . . . . . 1497.7.6 RQ5: Performance . . . . . . . . . . . . . . . . . . . . . . . . . . . . 151
7.8 Discussion . . . . . . . . . . . . . . . . . . . . . . . . . . . . . . . . . . . . . 152
8 Energy-Aware Test-Suite Minimization 1538.1 Introduction . . . . . . . . . . . . . . . . . . . . . . . . . . . . . . . . . . . . 1548.2 Motivation . . . . . . . . . . . . . . . . . . . . . . . . . . . . . . . . . . . . . 1568.3 Energy-Aware test-suite Minimization . . . . . . . . . . . . . . . . . . . . . . 1598.4 Approach Overview . . . . . . . . . . . . . . . . . . . . . . . . . . . . . . . . 1618.5 Energy-aware Coverage calculator . . . . . . . . . . . . . . . . . . . . . . . . 1628.6 energy-aware test-suite minimization . . . . . . . . . . . . . . . . . . . . . . 165
8.6.1 Integer Non-linear Programming . . . . . . . . . . . . . . . . . . . . . 1658.6.2 Integer Linear Programming . . . . . . . . . . . . . . . . . . . . . . . 1688.6.3 Greedy algorithm . . . . . . . . . . . . . . . . . . . . . . . . . . . . . 170
8.7 Experimental Evaluation . . . . . . . . . . . . . . . . . . . . . . . . . . . . . 1738.7.1 Experiment Setup . . . . . . . . . . . . . . . . . . . . . . . . . . . . . 1738.7.2 RQ1: Effectiveness . . . . . . . . . . . . . . . . . . . . . . . . . . . . 174
v

8.7.3 RQ2: Correlations . . . . . . . . . . . . . . . . . . . . . . . . . . . . 1778.7.4 RQ3: Performance . . . . . . . . . . . . . . . . . . . . . . . . . . . . 178
8.8 Discussion . . . . . . . . . . . . . . . . . . . . . . . . . . . . . . . . . . . . . 181
9 Conclusion 1839.1 Research Contributions . . . . . . . . . . . . . . . . . . . . . . . . . . . . . . 1849.2 Future Work . . . . . . . . . . . . . . . . . . . . . . . . . . . . . . . . . . . . 188
Bibliography 192
vi

LIST OF FIGURES
Page
2.1 Proposed taxonomy of energy defects . . . . . . . . . . . . . . . . . . . . . . . 152.2 The breakdown of hardware components involved in energy defects . . . . . . . . 282.3 Distribution of defect types’ impact severity . . . . . . . . . . . . . . . . . . . . 30
3.1 Categorization of problems to address Android energy assessment . . . . . . . . . 383.2 Categorization of proposed solution to address Android energy assessment . . . . 393.3 Categorization of assessment techniques in the domain of Android energy assessment 403.4 Distribution of energy defect patterns among sources . . . . . . . . . . . . . . . 413.5 Importance of energy defects missed by prior research . . . . . . . . . . . . . . . 42
4.1 Obtaining user location in Android . . . . . . . . . . . . . . . . . . . . . . . . 454.2 Downloading files in Android . . . . . . . . . . . . . . . . . . . . . . . . . . . . 46
5.1 Energy-aware mutation testing framework . . . . . . . . . . . . . . . . . . . . . 575.2 Example of obtaining user location in Android . . . . . . . . . . . . . . . . . . . 605.3 Example of downloading a file in Android . . . . . . . . . . . . . . . . . . . . . 635.4 Example of searching for Bluetooth devices in Android . . . . . . . . . . . . . . 645.5 Example of utilizing sensors in Android . . . . . . . . . . . . . . . . . . . . . . 675.6 (a) Baseline power trace for Sensorium [35], and the impact of (b) RLU, (c) FSW H
and (d) MSB mutation operators on the power trace . . . . . . . . . . . . . . . 68
6.1 MyTracker Android Application . . . . . . . . . . . . . . . . . . . . . . . . . . 886.2 Event sequences for testing the tracking/navigation and search/download function-
alities of MyTracker . . . . . . . . . . . . . . . . . . . . . . . . . . . . . . . . 896.3 Cobweb Framework . . . . . . . . . . . . . . . . . . . . . . . . . . . . . . . 916.4 CTG model for MyTracker. Gray boxes show the detailed CG, LSM, and HSM of
DownloadService and TrackingActivity components. Components marked with an
asterisk contain energy-greedy API invocations . . . . . . . . . . . . . . . . . . 946.5 Genetic representation of tests . . . . . . . . . . . . . . . . . . . . . . . . . . . 1016.6 Intuition behind convergence and divergence operators . . . . . . . . . . . . . . 1046.7 Evolved event sequences from illustrative example . . . . . . . . . . . . . . . . . 1066.8 Performance characteristics of Cobweb . . . . . . . . . . . . . . . . . . . . . . 118
7.1 Overview of the ACETON framework . . . . . . . . . . . . . . . . . . . . . . . 1267.2 State Vector Representation . . . . . . . . . . . . . . . . . . . . . . . . . . . . 1287.3 Architecture of an RNN and LSTM networks . . . . . . . . . . . . . . . . . . . 131
vii

7.4 Visualization of Attention Weight vector for energy defects related to a) CPU, b)
Display, c) Location, and d) Network . . . . . . . . . . . . . . . . . . . . . . . 1347.5 Sensitivity of the oracle’s accuracy to sampling rate . . . . . . . . . . . . . . . . 1467.6 A heatmap representing the attended features of SV for different subcategories of
energy defects . . . . . . . . . . . . . . . . . . . . . . . . . . . . . . . . . . . 1477.7 F1 Score of ACETON with and without Attention captured during the training
phase . . . . . . . . . . . . . . . . . . . . . . . . . . . . . . . . . . . . . . . . 151
8.1 Code snippet with energy bugs. . . . . . . . . . . . . . . . . . . . . . . . . . 1578.2 Energy consumption trace of a test case for the code snippet in Figure 8.1,
before (solid line) and after (dashed line) fixing energy bugs. . . . . . . . . . 1588.3 Energy-aware test-suite minimization framework . . . . . . . . . . . . . . . . 1628.4 Call graph of a hypothetical Android app. . . . . . . . . . . . . . . . . . . . 1638.5 Overview of the ECC component. . . . . . . . . . . . . . . . . . . . . . . . . 1638.6 Performance of Static Model Extractor . . . . . . . . . . . . . . . . . . . . . 1808.7 Sensitivity of execution time of integer programming approach to the size of
test suite . . . . . . . . . . . . . . . . . . . . . . . . . . . . . . . . . . . . . . 180
viii
LIST OF TABLES
Page
1.1 Potential stakeholders for each part of the dissertation. . . . . . . . . . . . . 6
2.1 Benchmarking energy defects of the proposed taxonomy. . . . . . . . . . . . 24
5.1 List of proposed energy-aware mutation operators. . . . . . . . . . . . . . . . 595.2 Test suites and mutants generated for subject apps. . . . . . . . . . . . . . . 755.3 Mutation analysis of each class of mutation operators for subject apps. . . . 755.4 Accuracy of µDroid’s oracle on the subject apps. . . . . . . . . . . . . . . . 825.5 Performance analysis of µDroid on the subject apps. . . . . . . . . . . . . . 83
6.1 Subject apps and coverage information for Cobweb and alternative approaches.1116.2 Comparing ability of energy analysis tools to find different types of energy
defects. . . . . . . . . . . . . . . . . . . . . . . . . . . . . . . . . . . . . . . . 116
7.1 Properties of Labeled Database, learned defect signatures, and ACETON’sperformance on unseen defects. . . . . . . . . . . . . . . . . . . . . . . . . . 142
7.2 Comparing ability of ACETON in detecting the category of different energydefects (* indicates the wrong predictions) . . . . . . . . . . . . . . . . . . . 143
7.3 ACETON’s performance on detection of real defects. . . . . . . . . . . . . . 143
8.1 Running example for the greedy algorithm . . . . . . . . . . . . . . . . . . . 1718.2 List of major energy bugs in Android apps as fault model and corresponding
energy-aware mutation operators . . . . . . . . . . . . . . . . . . . . . . . . 1758.3 Effectiveness of energy-aware test-suite minimization approaches in reducing
the size of test-suite and maintaining the ability to reveal energy bugs . . . . 1758.4 Pearson Correlation Coefficient (r) of <eCoverage, statement coverage> and
<eCoverage, energy cost> series for subject apps. . . . . . . . . . . . . . . . 179
ix

ACKNOWLEDGMENTS
First and foremost, I offer my sincerest gratitude to my brilliant PhD advisor, Professor SamMalek, for guiding and supporting me during my PhD studies. I appreciate him for takinga chance on me when I started my PhD in Software Engineering, without any backgroundin this area. He always believed in my abilities to independently conduct research and gaveme room to explore new ideas.
I am thankful to my mentors who fostered me along the way, namely, Professor CristinaLopes and Professor James Jones (my dissertation committee members), Professor JoshuaGarcia (who I always found approachable and welcoming to talk for hours), Professor HamidBagheri, Professor Andre van der Hoek and Professor Harry Xu (committee members on myadvancement to candidacy exam), Dr. Domagoj Babic (my Google mentor), and ProfessorPaul Ammann (from whom I learned the fundamentals of software testing). I would also liketo thank Professor Mark Harman, whose outstanding research in software testing inspiredme a great deal. His papers were my first source of referral whenever I wanted to work on anew topic related to Software Testing.
I greatly appreciate Google for recognizing my research towards advancing energy testing ofmobile apps and awarding me a Google PhD Fellowship. This fellowship gave me a confidencethat my research is practical, can be used by Google, and hopefully benefit millions of usersof Google products.
I would like to thank Debra (Debi) Brodbeck, Assistant Director of UCI Institute for SoftwareResearch, and Kari Nies, for the love and support provided to me during my PhD studies,specifically through my complicated pregnancy.
I am forever grateful for my parents, Professor Fariba Khoshzaban and Professor MahmoudJabbarvand, for their endless support and love during my PhD studies. I know it has been atough time for them to bear my absence at all moments of happiness and sorrow, which I wishI could be with them. I would like to thank my brother, Mohammadreza Jabbarvand, myaunt, Farahnaz Khoshzaban, and my cousin, Ghazaleh Rouhi, who emotionally supportedmy parents during my absence. I also like to thank my parents-in-law for their encouragementduring my PhD studies.
Finally, I wish I knew how to truly thank my husband and best friend, Dr. Alireza Sadeghi,for his endless support, inspiration, and love. This dissertation would not have been possiblewithout his support, encouragement, and even his technical contributions. He was my sourceof strength and wisdom in the pursuit of perfection during my PhD studies as well as jobsearch. I am very lucky to have him with me through so many journeys in my life.
x

CURRICULUM VITAE
Reyhaneh Jabbarvand
Education
Doctor of Philosophy May 2020University of California, Irvine Irvine, California
Masters of Science March 2011Sharif University of Technology Tehran, Iran
Bachelor of Science February 2008Sharif University of Technology Tehran, Iran
Research Experience
Graduate Research Assistant September 2015–May 2020University of California, Irvine Irvine, California
Researcher May 2013–May 2015George Mason University Fairfax, Virginia
Graduate Research Assistant March 2007–March 2011Sharif University of Technology Tehran, Iran
Publications
Conference Papers
C1. R. Jabbarvand, F. Mehralian, and S. Malek, “Automated Construction of Energy Test Or-acle for Android”, SIGSOFT Symposium on the Foundation of Software Engineering (FSE),Sacramento, California, USA, November 2020. (28% acceptance rate)
C2. J. W. Lin, R. Jabbarvand, and S. Malek, “Test Transfer Across Mobile Apps ThroughSemantic Mapping”, International Conference on Automated Software Engineering (ASE),San Diego, California, USA, November 2019. (20% acceptance rate)
C3. R. Jabbarvand, J.W. Lin, and S. Malek, “Search-Based Energy Testing of Android”, Inter-national Conference on Software Engineering (ICSE), Montreal, Canada, May 2019. (21%acceptance rate)
C4. J. W. Lin, R. Jabbarvand, J. Garcia, and S. Malek, “Nemo: Multi-Criteria Test-SuiteMinimization with Integer Nonlinear Programming”, International Conference on SoftwareEngineering (ICSE), Gothenburg, Sweden, May 2018. (21% acceptance rate)
C5. A. Sadeghi, R. Jabbarvand, N. Ghorbani, H. Bagheri, and S. Malek, “A Temporal Per-mission Analysis and Enforcement Framework for Android”, International Conference onSoftware Engineering (ICSE), Gothenburg, Sweden, May 2018. (21% acceptance rate)
xi

C6. R. Jabbarvand and S. Malek, “µDroid: An Energy-Aware Mutation Testing Frameworkfor Android”, SIGSOFT Symposium on the Foundation of Software Engineering (FSE),Paderborn, Germany, September 2017. (21% acceptance rate)
C7. A. Sadeghi, R. Jabbarvand, and S. Malek, “PATDroid: Permission-Aware GUI Testing ofAndroid”, SIGSOFT Symposium on the Foundation of Software Engineering (FSE), Pader-born, Germany, September 2017. (21% acceptance rate)
C8. R. Jabbarvand, A. Sadeghi, H. Bagheri, and S. Malek, “Energy-Aware Test-Suite Min-imization for Android Apps”, International Symposium on Software Testing and Analysis(ISSTA), Saarbrucken, Germany, July 2016. (25% acceptance rate)
C9. H. Bagheri, A. Sadeghi, R. Jabbarvand, and S. Malek “Practical, Formal Synthesis andAutomatic Enforcement of Security Policies for Android”, International Conference on De-pendable Systems and Networks (DSN), Toulouse, France, June 2016. (20% acceptancerate)
C10. M. Hajkazemi, M. Chorney, R. Jabbarvand Behrouz, M. Khavari Tavana, and H. Homay-oun, “Adaptive Bandwidth Management for Performance-Temperature Trade-offs in Hetero-geneous HMD-DDRx Memory”, ACM Great Leaks Symposium on VLSI (GLSVLSI), Pitts-burgh, Pennsylvania, USA, May 2015.
C11. R. Jabbarvand Behrouz, and H. Homayoun, “NVP: Non-uniform Voltage and Pulse WidthSettings for Power Efficient Hybrid STT-RAM”, International Green Computing Conference(IGCC), Dallas, Texas, USA, November 2014.
C12. M. Talebi, A. Khonsari, and R. Jabbarvand, “Cost-Aware Reactive Monitoring in ResourceConstrained Wireless Sensor Networks”, IEEE Wireless Communications and NetworkingConference (WCNC), Budapest, Hungary, April 2009.
Book Chapter
B1. R. Jabbarvand, M. Modarressi, and H. Sarbazi-Azad, “Fault Tolerant Routing Algorithms
in Networks-on-chip”, Chapter 4 in Routing Algorithms in Networks-on-Chip, Springer, 2013.
(Amazon) (Springer)
Workshop and Short Papers
W1. R. Jabbarvand, “Advancing Energy Testing in Android Apps”, International Conference onSoftware Engineering (ICSE), Doctoral Symposium, Buenos Aires, Argentina, May 2017.
W2. R. Jabbarvand, A. Sadeghi, J. Garcia, S. Malek, and P. Ammann, “EcoDroid: An Ap-proach for Energy-Based Ranking of Android Apps”, International Workshop on Green andSustainable Computing (GREENS) in Conjunction with ICSE, Florence, Italy, May 2015.
W3. R. Jabbarvand, M. Modarressi, and H. Sarbazi-Azad, “Reconfigurable Fault-Tolerant Rout-
ing Algorithm to Optimize the Network-on-Chip Performance and Latency in Presence of
Intermittent and Permanent Faults”, IEEE International Conference on Computer Design
(ICCD), Amherst, Massachusetts, USA, October 2011.
xii

ABSTRACT OF THE DISSERTATION
Advancing Energy Testing of Mobile Applications
By
Reyhaneh Jabbarvand
Doctor of Philosophy in Software Engineering
University of California, Irvine, 2020
Professor Sam Malek, Chair
Abstract: The rising popularity of mobile apps deployed on battery-constrained devices
has motivated the need for effective and efficient energy-aware testing techniques. However,
currently there is a lack of test generation tools for exercising the energy properties of apps.
Automated test generation is not useful without tools that help developers to measure the
quality of the tests. Additionally, the collection of tests generated for energy testing could
be quite large, as it may involve a test suite that covers all the energy-greedy parts of the
code under different use cases. Thereby, there is a need for techniques to manage the size
of test suite, while maintaining its effectiveness in revealing energy defects. This research
proposes a four-pronged approach to advance energy testing for mobile applications, includ-
ing techniques for energy-aware test input generation, energy-aware test oracle construction,
energy-aware test-suite adequacy assessment, and energy-aware test-suite minimization.
xiii
Chapter 1
Introduction
The utility of a smartphone is limited by its battery capacity and the ability of its hardware
and software to efficiently use the device’s battery. With more than 87% of smartphones
running the Android platform, it overwhelmingly dominates the smartphone marketshare [5].
Besides traditional hardware components (e.g., CPU, Radio), Android devices utilize a va-
riety of sensors (e.g., GPS, camera, accelerometer). The multitude of hardware on a mobile
device and the manner in which the Android platform interfaces with such hardware result
in a major challenge in determining the energy efficiency of Android apps. While recent
studies have shown energy to be a major concern for both users [196] and developers [162],
many mobile apps are still abound with energy defects.
Energy defects, which are the main culprits for draining the battery of mobile devices,
happen when execution of a code causes unnecessary energy consumption. The root cause
of energy defects is typically misuses of energy-greedy APIs, i.e., Android APIs that monitor
or manipulate the state of hardware elements on the mobile devices, in a way that the
app consumes resources more than it is supposed to do. The notion of unnecessary is very
important in the definition of energy defects and there are contextual factors that identify
1

whether a specific utilization of an energy-greedy API is considered energy defect on an app
or not. Thereby, to properly characterize the energy consumption of an app and identify
energy defects, it is critical that apps are properly tested, i.e., analyzed dynamically to assess
the app’s energy properties.
App developers, however, find it particularly difficult to properly evaluate the energy behav-
ior of their programs. Energy efficiency as a software quality attribute is a foreign concept
to many developers. There is generally a lack of mature software engineering principles and
tools aimed at addressing energy concerns. In the mobile setting, reasoning about energy
properties of software is further complicated by the fact that such defects manifest them-
selves under peculiar conditions that depend not only on the source code of the app, but
also on the framework, context of usage, and properties of the underlying hardware elements.
Finally, in contrast to the functional defects whose impact is almost explicit during and after
execution of tests, e.g., crash, the impact of energy defects is implicit. That is, it may take
several hours, days, or even weeks until developers or users realize that an app causes battery
drain on mobile devices.
None of the existing automated test generation tools for Android [83, 57, 154, 123, 52, 54,
207, 62, 157, 168, 170, 185], are suitable for energy testing. The few existing dynamic analysis
tools [149, 67] aimed at finding energy defects are severely limited by the types of defects
that they can detect. First, they are aimed at profiling an app’s energy behavior, rather than
the creation of reproducible and reusable tests, such that they can be used in a systematic
fashion as part of a regression testing regimen. Second, they do not consider the different
contexts in which energy defects may manifest themselves under them (e.g., when the device
is not connected to WiFi, or when the physical location of the device is changing rapidly).
Third, they do not consider the full spectrum of input interfaces exported by an app (e.g.,
lifecycle and system callbacks) that can affect an app’s energy behavior. There is, thus, a
2
need for more sophisticated automated test generation tools that can help the developers
with testing the energy properties of their apps.
Automated test generation, however, is not by itself useful, unless developers are aided with
tools that can help them measure the quality of tests. Given the varying amount of energy
consumed at different points during the execution of a mobile app, it is insufficient to utilize
traditional metrics to measure test adequacy (e.g., statement coverage, branch coverage).
Specifically, these coverage criteria do not consider different energy-greediness of different
parts of the code. For example, although a test suite may cover an overwhelming majority
of an app’s program statements, it would mischaracterize the energy behavior of the app if
the test suite misses the the code that invokes energy-greedy APIs. As a result, new test
coverage criteria are needed to help developers assess the coverage of a test suite for its
ability to reveal energy defects.
Energy testing is generally more labor intensive and time-consuming than functional testing,
as tests need to be executed in the deployment environment and specialized equipments need
to be used to collect energy measurements. Developers spend a significant amount of time
executing tests, collecting power traces, and analyzing the results to find energy defects. The
fragmentation of mobile devices, particularly for Android, further exacerbates the situation,
as developers have to repeat this process for each supported platform. Moreover, to accu-
rately measure the energy consumption of a test, it must be executed on a device and drain
its battery. While it is possible to collect energy measurements when the device is plugged
to a power source, such measurements tend to be less accurate due to the impact of charging
current [121, 20]. Continuously testing apps on a mobile device uses up limited charging
cycles of its battery. There is, thus, a need for test-suite management capabilities, such as
test-suite minimization and prioritization, that can aid the developers with finding energy
defects under time and resource constraints.
3

1.1 Dissertation Overview
To address the mentioned challenges and advance energy testing of Android mobile apps,
this dissertation proposes a four-pronged approach as follows:
1) Energy-Aware Test-Suite Adequacy Assessment — Test suite of a mobile app is ade-
quate for energy testing, if it can effectively find all of the energy defects in a program.
Developers usually utilize coverage score and mutation score to measure the adequacy
of their test suite. However, neither coverage metrics nor mutation testing approaches
in the literature consider energy consumption as a program property of interest. This
dissertation introduces fundamentally new techniques for energy-aware adequacy as-
sessment of test suites for mobile apps. The proposed techniques consider unique
aspects and features of Android (e.g., Android specific APIs and recurring callbacks)
as well as complex nature of energy defects.
2) Energy-Aware Test Input Generation — Existing literature on test generation for An-
droid apps has mainly focused on functional testing through either fuzzing to generate
Intent messages or exercising an Android app through its GUI. The main objective
of these test generation approaches is maximizing conventional code coverage metrics,
and thus not suitable for testing the energy properties of apps. Many energy issues
depend on the execution context and manifest themselves under peculiar conditions
(e.g., when the physical location of a device is changing rapidly, when particular system
events occur frequently). This dissertation proposes a technique that uses an evolu-
tionary search strategy with an energy-aware genetic makeup for test generation. By
leveraging a set of novel contextual models, representing lifecycle of components and
states of hardware elements on the phone, the proposed technique is able to generate
tests that execute the energy-greedy parts of the code under a variety of contextual
conditions.
4
3) Energy-Aware Test Oracle Construction — Test oracle automation is one of the most
challenging facets of test automation, and in fact, has received significantly less atten-
tion in the literature [69]. A test oracle compares the output of a program under test
for a given test to the output that it determines to be correct. While power trace is
an important output from an energy perspective, relying on that for creating energy
test oracles faces several non-trivial complications. First, collecting power traces is
unwieldy, as it requires additional hardware, e.g., Monsoon [7], or specialized software,
e.g., Trepn [71], to measure the power consumption of a device during test execution.
Second, noise and fluctuation in power measurement may cause many tests to become
flaky. Third, power trace-based oracles are device dependent, making them useless for
tests intended for execution on different devices. Finally, power traces are sensitive to
small changes in the code, thus are impractical for regression testing. This dissertation
proposes a technique that employs Deep Learning to determine the (mis)behaviors
corresponding to the different types of energy defects.
4) Energy-Aware Test-Suite Management — The collection of tests generated for energy
testing could be quite large, as it may involve a test suite that covers all the energy
hotspots (e.g., specific Android APIs that utilize the energy-greedy hardware such as
GPS) under different use cases (e.g., using the GPS when the user is stationary, moves
slowly, or moves fast) and configurations of the device (e.g., when the device is con-
nected to WiFi, cellular network, etc.). The labor intensive and time consuming nature
of energy testing underlines the need for test suite management techniques. The ma-
jority of test suite management and regression testing techniques consider adequacy
metrics for functional requirements of the test suite and to lesser extent non-functional
requirements [174]. This dissertation proposes a novel technique to help developers per-
form energy-aware test suite minimization by considering energy as a program property
of interest. The proposed technique not only reduces the manual effort involved in ex-
5

amining the test results, but also addresses the time and battery capacity constraints
that hinder extensive testing in the mobile setting.
1.2 Dissertation Structure
The reminder of this dissertation is organized as follows:
Chapter 2 provides required background about energy defects by introducing 28 different
types of energy defects, their root causes, and their consequences. Chapter 3 provides an
overview of the prior related research and identifies the position of this work in the research
landscape. Chapter 4 introduces the research problem and related hypotheses. Chapter 5
presents the energy-aware mutation testing framework in order to identify characteristics
of proper energy tests. Chapter 6 shows the proposed framework for automatic generation
of energy tests. Chapter 7 presents the proposed technique for automated construction of
energy test oracles. Chapter 8 introduces the proposed solution to overcome the challenge
of performing energy testing on resource-constrained mobile devices. Finally Chapter 9
concludes the dissertation with future work.
To help different readers of this dissertation find their parts of interest more easily, Table 1.1
suggests the potential stakeholders for each part of the dissertation.
Table 1.1: Potential stakeholders for each part of the dissertation.
Chapter Content Stakeholders
2,3 Taxonomy and Survey App Developers, Researchers
5 Mutation Testing App Developers, App Users, App Testers, Researchers
6 Test Input Generation App Developers, App Testers, Researchers
7 Test Oracle App Developers, App Testers, Researchers
8 Test-Suite Minimization App Testers, Researchers
6

The research presented in this dissertation has been published in the following venues:
• R. Jabbarvand, F. Mehralian, and S. Malek, “Automated Construction of Energy Test
Oracle for Android”, SIGSOFT Symposium on the Foundation of Software Engineering
(FSE), Sacramento, California, November 2020.
• R. Jabbarvand, J.W. Lin, and S. Malek, “Search-Based Energy Testing of Android”,
International Conference on Software Engineering (ICSE), Montreal, Canada, May
2019.
• R. Jabbarvand and S. Malek, “µDroid: An Energy-Aware Mutation Testing Frame-
work for Android”, SIGSOFT Symposium on the Foundation of Software Engineering
(FSE), Paderborn, Germany, September 2017.
• R. Jabbarvand, A. Sadeghi, H. Bagheri, and S. Malek, “Energy-Aware Test-Suite Min-
imization for Android Apps”, International Symposium on Software Testing and Anal-
ysis (ISSTA), Saarbrucken, Germany, July 2016.
In addition, the following publications are not included in the dissertation but are related:
• J. W. Lin, R. Jabbarvand, J. Garcia, and S. Malek, “Nemo: Multi-Criteria Test-
Suite Minimization with Integer Nonlinear Programming”, International Conference
on Software Engineering (ICSE), Gothenburg, Sweden, May 2018.
• R. Jabbarvand, “Advancing Energy Testing in Android Apps”, International Confer-
ence on Software Engineering (ICSE), Doctoral Symposium, Buenos Aires, Argentina,
May 2017.
• R. Jabbarvand, A. Sadeghi, J. Garcia, S. Malek, and P. Ammann, “EcoDroid: An
Approach for Energy-Based Ranking of Android Apps”, International Workshop on
Green and Sustainable Computing (GREENS) in Conjunction with ICSE, Florence,
Italy, May 2015.
7

Chapter 2
Background
This chapter provides a background on the energy defects. One of the contributions of
this dissertation is a new and more comprehensive definition for energy defects, as well as
construction of the most comprehensive energy defect model of Android to date. In fact,
in preparation for this work, I conducted an investigation to identify the variety of energy
defects in Android. While a few energy anti-patterns in Android, such as resource leakage
and sub-optimal binding [149, 150, 199], had been documented in the literature, they do not
cover the entire spectrum of energy issues that arise in practice.
Definition: Energy defects are identified as misuses of energy-greedy APIs, i.e., Android
APIs that monitor or manipulate the state of hardware elements on the mobile devices, that
cause unnecessary energy consumption.
The notion of unnecessary is very important in the definition of energy defects and the context
of usage identifies whether a specific utilization of an energy-greedy API is considered energy
defect on an app or not. The reminder of this chapter first illustrates our methodology to
collect energy defect patterns, and then introduces an energy defect model, a comprehensive
collection of energy defect patterns that cause unnecessary energy consumption in Android.
8

2.1 Methodology
We follow a data-driven approach for derivation of a defect model of energy defects. This
approach follows a grounded theory design principles [189] and consists of three main phase:
(1) Designing phase, where we design our search protocol on how to derive the defect patterns;
(2) Conducting phase, where we perform the search following the plan directions; and (3):
Reporting phase, where we collect the defect patterns and analyze them through an empirical
study to construct the benchmark. This section describes the Designing and Conducting
phase and Section 2.2 introduces the results of the data-driven approach.
2.1.1 Search Protocol
Our plan for derivation of the energy defect model includes identifying the sources to search,
keywords to guide the search, and inclusion/exclusion criteria for selection during search.
2.1.1.1 Selection of the source
The aim of this study is to construct a comprehensive defect model of energy defect patterns
in Android. Therefore, I need to look for energy anti-patterns, i.e., misuses of Android APIs
and specific constructs that lead to unnecessary energy consumption, in the implementation
of the Android apps. I identified the following sources to collect such data:
• Android API reference: This document lists all the Android APIs, with the detailed
description on how to use them. The description of the APIs that are related to utilization
of the energy-greedy hardware components, such as GPS and WiFi, includes guidelines
on how to properly use them to avoid energy drainage.
9

• Android developers guide: This online document includes training classes that describe
how to develop Android apps. In addition, it contains several guidelines for quality
assurance, e.g., best practices for battery, performance, and security.
• XDA Developers : This forum is a mobile software development community of over 6.6
million members worldwide, where the discussions primarily revolve around troubleshoot-
ing and development for Android.
• Android Open Source Project (AOSP) issue tracker : This platform provides facilities
for users and developers to report issues and feature requests related to Android. The
reported issues mostly contain a bug report, which could be very detailed including the
LogCat trace related to the issue, or informal description of the conditions under which
the issue manifested itself.
The primary investigation on the posts related to energy issues in XDA Developer forum and
AOSP issue tracker identified them as rich sources for collecting Android apps with known
energy issues. More specifically, the majority of posts in these two sources contained a list
of apps that were culprit of the issue. The source code of such apps, which are known to
suffer from energy issues, can provide common mistakes that developers make or mistakes
that have severe impact on the energy consumption of apps.
The first two sources, on the other hand, provide energy defects that either happen in specific
use-cases that are uncommon among apps, or their impact cannot be readily observed by end
users. Using both best practices and common bad practices, I can construct a comprehensive
defect model of energy defects.
2.1.1.2 Selection of the keywords
I aimed to automatically and systematically search the aforementioned sources for collecting
required artifacts to construct the defect model. To that end, I determined a set of the
10

following keywords to search for while automatically crawling each of the identified sources:
energy, power, battery, drain, consumption, consume. Any post in these online sources that
contains at least two of these keywords will be a candidate for further investigation.
It is worth to note that our initial set of keywords was larger, including GPS, Bluetooth, CPU,
camera, wakelock, service, WiFi, network. However, our initial investigation showed that I
need to exclude these keywords to avoid bias towards defects related to specific hardware
component and reduce false positives. For example, a post that includes keywords energy
and Bluetooth might not necessarily discuss an energy issue related to the Bluetooth, but
explains how to use Bluetooth Low Energy (BLE) technology and related APIs in Android
apps [12].
2.1.1.3 Selection of criteria
Not all the retrieved list of apps from the sources was useful for the purpose of our work.
In fact, I realized that when reporting an issue on AOSP issue tracker or XDA Developer
forum, users list all the potential apps they suspect to be the potential culprits, where as a
matter of fact only one of them caused the reported issue. Additionally, I wanted to find the
defect patterns, which requires the availability of the source code. Thereby, I identified the
following criteria for selecting the candidates for further manual investigation:
Inclusion Criteria: I selected apps that are (1) open source and (2) have an issue tracker.
Exclusion Criteria: From the list of open source apps, I excluded apps that:
• I was not able to find any reference related to the issue the app found culprit of it in
either its issue tracker (open or closed issue) or commit history. To that end, I searched
the issue tracker and commit history of apps for the same keywords used in crawling.
11

• The reported issue was not reproducible by the developers or there was no explanation
on how to reproduce the issue.
2.1.2 Search Process
I automatically crawled the identified sources using crawler4J [4]. The results from this step
provided me with 4064 pages from the first two sources, Android API reference and Android
developers guide, and a list of energy-related issues with 295 apps that possibly had instances
of those issues.
I manually investigated all the 4064 pages to obtain a list of best practices related to the
battery life. To find common bad practices, I first removed commercial apps from the list,
since our inclusion criteria entail the availability of source code. That left me with 130
open source apps for further investigation. Then, I searched the issue tracker and commit
history of the 130 apps for keywords, and narrowed down to 91 open source apps that had
at least one issue (open or closed) or commit related to energy. Regarding to issue trackers,
I excluded the apps matched our second exclusion criteria, which left me with 41 apps.
To ensure comprehensiveness of the proposed defect model, I finally studied the related lit-
erature [149, 67, 199, 103] and found 18 additional open-source apps with energy issues.
I performed this study as the final step, as grounded theory proponents [88, 99] recom-
mend limiting exposure to existing literature and theories to promote open-mindedness and
preempt confirmation bias.
I manually investigated the source code of these 59 apps to find misuse of Android APIs
utilizing energy-expensive hardware components (e.g., CPU, WiFi, radio, display, GPS, Blue-
tooth, and sensors) as reported in the corresponding bug trackers. For example, Omim [23]
issue 780 states ”App is using GPS all the time, or at least trying to use”. As a result, I inves-
12

tigated usage of APIs belonging to LocationManager package in Android. As another exam-
ple, SipDroid [41] issue 847 states ”after using the app, display brightness is increased almost
full and its stays that way”. Thereby, I investigated the source code for APIs dealing with
the adjustment of screen brightness, e.g., getWindow().addFlag(FLAG KEEP SCREEN ON)
and getWindow().getAttributes().screenBrightness.
From our investigation, I have constructed a defect model with 28 types of energy defects,
which we will discuss them with more details in Section 2.2.
2.1.3 Threats To Validity
We followed relevant principles of grounded theory to minimize the threats to the validity of
the results. Nevertheless, there are possible threats that deserve additional discussion.
One important threat is the completeness of this empirical study, that is, whether the pro-
posed defect model identifies all the energy defects in the domain of Android. This threat
could be due to missing some relevant posts in our sources as they did not match our key-
words. Although we make no claims that this set of keywords is minimal or complete, prior
research has shown that they are frequently used in the issue trackers of apps with energy
defects [149]. We acknowledge that the collection of energy defects identified through our
study may not be complete due to this reason. However, we believe the presented defect
model is the most comprehensive one in the literature to date.
Another threat is to bias towards specific types of defects or defects that have more severe
impact on the battery. To alleviate this threat, we excluded specific keywords that are
coupled to particular hardware component, as mentioned before. Moreover, we did not limit
our sources just to apps known to suffer from observable issues. Instead, we considered
13

Android documentations as an additional source to identify the defects that might not have
a severe impact on the battery observable by the users.
2.2 Defect Model
Figure 2.1 depicts our proposed taxonomy, derived as the result of empirical study described
in Section 2.1. The highest level of the taxonomy hierarchy consists of six dimensions, which
shows the scope of energy defect, and the sub-dimensions illustrate derived defect patterns.
Each scope captures the commonality among different types of energy defects. For example,
all the energy defects in the scope of Location happen due to misuse of Android Location
APIs. In the following, I will describe each type of energy defect in more details.
2.2.1 Connectivity
Connectivity energy defects happen due to misuse of Android APIs that monitor or manip-
ulate the state of Network and Bluetooth hardware.
2.2.1.1 Network
This category consists of six types of energy defects:
• Unnecessary attempt to connect: Searching for a cell signal is one of the most
power-draining operations on a mobile device. So, developers should check for con-
nectivity before performing any network operation to save battery by not forcing the
mobile radio or WiFi to search for signal if there is none available. One way to check for
connectivity is to leverage the method isConnected() on ConnectivityManager
14

Co
nn
ecti
vity
Dis
pla
yLo
cati
on
Rec
urr
ing
Co
nst
ruct
sSe
nso
rW
akel
ock
Ener
gy D
efec
ts
Unnecessary Attempt to Connect
Net
wo
rkB
luet
oo
th
Unnecessary Active Bluetooth
Frequently Scan for WiFi
Redundant WiFi Scan
Unnecessary Scan for Bluetooth Pairs
Redundant Bluetooth Discovery
Using Radio Over WiFi
Attempting Corrupted Connection
Keeping Screen On
Improper Utilization of Screen Flag
Using Light Background Color
Increasing and Holding Screen Brightness
High Frequency of Location Updates
Unnecessary Accurate Location Request
Redundant Location Updates
Neglecting Last Known Location
High Frequency Recurring Callback
Redundant Recurring Callback
Failing to Deactivate an Alarm
Failing to Adjust Frequency of Updates Based on Battery Level
Unnecessary and Repeatedly Execution of The Code
Failing to Release Wakelock
Unnecessary Wakelock Acquirement
Unnecessary Active WakefulBroadcastReceiver
Acquiring High Performance WiFi Wakelock
Failing to Unregister Sensor
Unnecessary Use of Fast Delivery Sensor
Downloading Redundant Data
Fig
ure
2.1:
Pro
pos
edta
xon
omy
ofen
ergy
def
ects
15

or WifiManager. Failing to perform this check before a network task can unneces-
sarily search for a network signal and cause energy defect.
• Frequently scan for WiFi: High frequency of scanning for WiFi networks consume
higher amount of energy. Thereby, developers should manage the search for signal
properly, e.g., adjust the frequency of scanning based on the user movement, etc.
Otherwise, frequent and unnecessary WiFi scan can drain the battery of device.
• Redundant WiFi scan: Recurring tasks such as scanning for available WiFi networks
can be handled by recurring callbacks in Android, e.g., Handler, and ScheduledThr
eadPoolExecutor. While developers should avoid the highly frequent of WiFi scan
as mentioned above, they should also remove the recurring callbacks at the termination
points of the program, e.g., when app is paused. Otherwise, the app may keep scanning
for WiFi signals without using the results of that.
• Using Radio over WiFi: Mobile data costs and energy consumption tend to be
significantly higher than WiFi. So, in most cases, an app’s update rate should be lower
when on Radio connections, or downloads of significant size should be suspended until
you have a WiFi connection. Failing to follow this best practice and not prioritizing
WiFi over Radio causes unnecessary energy consumption.
• Attempting corrupted connection: When a connection to a server is not successful,
e.g., the server is not reachable, the service that is responsible to connect to the server
can potentially wait for a long time and keep the connection. To avoid such case,
developers should set a Timeout for each URL Connection. Otherwise, keeping a
corrupted connection can consume high amount of energy.
• Downloading redundant data: Multiple downloads of the same data not only
wastes the network bandwidth, but also unnecessarily consumes battery. Caching
mechanism avoids downloading the previously downloaded data again. Developers can
enable caching of all of app’s HTTP requests by installing the cache at app startup.
16

Failing to implement a caching mechanism causes redundant connection establishment
and download of the data.
2.2.1.2 Bluetooth
This category consists of three types of energy defects:
• Unnecessary active Bluetooth: Developers should clear all the connections when
the Bluetooth turns off, or starts to turning off. Otherwise, the kernel keeps the
“BlueSleep” kernel wakelock which prevents the device for becoming idle. Devel-
opers should close all the Bluetooth connections if the Bluetooth is off or turning
off. The state of Bluetooth can be checked by calling getState() method on the
BluetoothAdapter.
• Unnecessary and frequent scan for Bluetooth pairs: High frequency of discovery
process for Bluetooth pairs consumes higher amount of energy, as device discovery is
a heavyweight procedure on battery. Thereby, developer should carefully manage the
Bluetooth discovery in their code.
• Redundant Bluetooth discovery: A recurring task of Bleutooth discovery can be
handled by recurring callbacks in Android, e.g., Handler, and ScheduledThreadPo
olExecutor. While developers should avoid the highly frequent of discovery of Blue-
tooth devices as mentioned above, they should also remove the recurring callbacks at
the termination points of the program, e.g., when app is paused. Otherwise, the app
may keep searching for available and visible Bluetooth devices without using the result
of discovery.
17

2.2.2 Display
This category consists of four types of energy defects:
• Keeping the screen on: Some apps such as games and videos require to keep the
device screen on while running. One possible way of keeping the screen on is modifying
the screen timeout preferences. Failing to restore the modified setting keeps the screen
on for a long time even when the app is not running, i.e., 30 minutes for most of recent
Android phones, which can drastically drain the battery.
• Improper utilization of screen flags: Similar to the previous energy defect, im-
proper utilization of screen flags can unnecessarily keep the screen on. That is, if
developer uses screen flag in background services or other app components rather than
• Using light background color: Prior research have shown that the darker colors
in OLED screens, which are currently used in all mobile devices, consume less energy
compared to the lighter colors. Thereby, it is recommended that developers utilize the
darker color instead of lighter color in the UI design, or adjust the color theme based
on the battery level. Failing to do so can unnecessarily use more energy on the phones.
• Increasing and holding the screen brightness: A subset of game, multi-media,
and camera apps automatically increase the screen brightness to provide a better user
experience. High screen brightness can drain the battery in few hours, thereby, devel-
opers should avoid to increase and hold the screen brightness when the battery level
is medium to low, when the user is not using the main features of the app, e.g., user
navigates through setting, or when user puts the app in the background, e.g., switches
to another app.
18

2.2.3 Location
This category consists of four types of energy defects:
• High frequency of location updates: Developers should adjust the frequency of lis-
tening to location updates based on the user movement. Otherwise, they unnecessarily
engage energy-greedy location hardware, i.e., GPS and Network. For example, when
user is walking or hiking, the frequency of listening to location updates should be less
than when user is biking or driving a car. Developers can adjust the frequency based
on user movement by using specific Android APIs, e.g., Activity Recognition listener,
that obtain user activity type from motion sensors
• Unnecessary accurate location request: User location can be obtained using GPS
or Network location provider, i.e., cellular or WiFi network. GPS consumes higher
amount of energy to acquire user location and should be utilized when it is necessary,
e.g., when user drives fast in the highway. Failing to use a proper provider location
information can negatively impact the battery life.
• Redundant location updates: Failing to remove the location listeners, which are
registered to obtain user location information, at termination points of the program
can keep the location hardware engaged, thereby, drastically drain the battery.
• Neglecting last known location: For many apps that do not heavily rely on lo-
cation information, utilization of location hardware in not necessary. Instead, they
can query for the latest location information that is obtained by other apps through
getLastKnownLocation API in LocationManager. Failing to follow this best
practice may causes frequent and unnecessary wake-ups for GPS or Network hardware
to obtain location information.
19

2.2.4 Recurring Constructs
This category consists of four types of energy defects:
• High frequency recurring callbacks: Repeating periodic tasks can be used for
polling new data from the network or updating the UI. Higher frequency of invocation
consumes higher amount of energy, especially if the callback is running a task that
includes invocation of energy-greedy APIs. Thereby, developers should either avoid
usage of energy-greedy APIs in recurring callbacks, or they should consider a low
frequency for invocation of them as long as it does not interfere with app’s functionality.
• Redundant recurring callbacks: Runnable category of recurring callbacks should
be released when they are not needed, specifically at the termination points of the pro-
gram. Otherwise, they keep running even when it is no longer required. For example,
a thread that is responsible to update the GUI should be killed after the activity is in
the background, i.e., paused. Otherwise, it performs a redundant task and consumes
battery unnecessarily.
• Failing to deactivate an alarm: Android system does not kill the alarms and failing
to cancel the alarm keeps the alarm active and triggers it forever. Thereby, developers
should consider policies on the appropriate time to cancel the registered repeating
alarms
• Failing to adjust the frequency based on battery level: Developers should check
for the battery charging status to adjust background service behavior, frequency and
type of different sensor listeners, and frequency of recurring callbacks. For example,
the app should poll for updates when the device is connected to the charger, or the
frequency of periodic tasks can be adjusted based on the battery level of the device.
Failing to do so causes the faster drain of battery on users’ devices.
20

2.2.5 Sensor
This category consists of two types of energy defects:
• Failing to unregister the sensors: Android system does not disable sensors au-
tomatically when the screen turns off. When developer fails to properly release the
sensor listeners at the termination points of the program, the app can keep listening
to sensors and updating the sensor information in background, even when it is not
actively running. This can drastically impact the battery life and drain the battery in
just a few hours.
• Unnecessary use of fast delivery sensors: Sensor listener events can be queued
in the hardware FIFO list before delivered. Setting delivery trigger of listener to the
lowest possible value, i.e., 0, interrupts Application Processor at the highest frequency
possible and prevents it to switch to lower power state, specially if the registered sensor
is a “wake-up” sensor. Thereby, it is important that developers properly adjust the
type of sensors based on the context.
2.2.6 Wakelock
This category consists of four types of energy defects:
• Failing to release wakelocks: Misuse of CPU wakelocks, i.e., failing to release
the wakelock at proper points or failing to properly release all the reference counted
wakelocks, can unnecessarily keep the CPU on. Thereby, the device will not enter the
idle mode and the battery drain continues, even when no app is running on the device.
• Unnecessary Wakelock acquirement: Wakelocks are a mechanism to keep the
CPU and WiFi hardware 1 awake. While this feature is helpful to ensure correctness of
1Earlier versions of Android allowed developers to keep the screen on using display wakelocks.
21
specific tasks on some categories of mobile apps, improper and unnecessary utilization
of wakelocks negatively impacts the battery life. For example, developers are advised to
acquire the wakelock once needed, and release it as soon as the locked task is finished.
Keeping the wakelock for longer time has no other benefit and only drains the battery.
Also, newer versions of Android API library support alternative solutions to keep the
CPU awake, instead of using wakelocks: Using DownloadManager when an app is
performing long-running HTTP downloads or creating a sync adapter, when an app is
synchronizing data from an external server.
• Unnecessary active WakefulBroadcastReceiver: A partial wakelock can be ac-
quired by using a specific broadcastreceiver, i.e., WakefulBroadcastReceiver, in
conjunction with a service. Failing to call method unregister this broadcastreceiver
after the work that requires the lock on the CPU, keeps the device awake even if not
required.
• Acquiring high performance WiFi wakelock: By acquiring a high-performance
Wakelock on the WiFi hardware, WiFi will be kept active and it operates at high
performance with minimum packet loss, which consumes higher amount of energy
compared to the regular wakelock. While this might be necessary for specific tasks,
developers should carefully acquire and manage the type of WiFi wakelocks. For
instance, they should monitor the strength and state of WiFi network and if the signal
quality degrades, WiFi wakelock should be either releases, or its type being changed to
normal WiFi wakelock instead of high performance lock. Failing to properly implement
this adjustment can negatively impact the battery life.
22

2.3 Analysis
In this section, I present an analysis of the energy defects in the proposed defect model.
Specifically, I investigate the following research questions:
RQ1. Distribution of Energy Defects : What is the distribution of each identified energy
defect among the studied sources? What portions of the defects cannot be identified by
limiting the study to just issue tracker of open source apps or Android documentation?
Is it possible to identify all types of energy defects by studying app repositories?
RQ2. Misused Resource Type: What hardware components are engaged as a result of energy
defect? How are these hardware components misused?
RQ3. Consequences of Energy Defects : What are the consequences of energy defects and to
what extent do they impact the battery life?
2.3.1 RQ1: Distribution of Energy Defects
Table 2.1 demonstrates all the identified energy defects in the proposed defect model, along
with the information that whether I found an instance of each defect in Android documentation—
the first two search sources—or any artifacts (source code, issue tracker, or commit history)
of the studied open source apps—obtained from the next two search sources (columns 2 and
3).
As shown in Table 2.1, while I found instances of some energy defects in both type of
sources, some of the defects were only found in Android documentation or artifacts of Apps
with energy issues. For example, there was no indication in either of the crawled Android
documentation—Android API reference and Android developers guide—that failing to close
Bluetooth connections can lead to Bluesleep wakelock, that can keep the device awake and
23

Tab
le2.
1:B
ench
mar
kin
gen
ergy
def
ects
ofth
epro
pos
edta
xon
omy.
Def
etT
yp
eS
ourc
eof
Def
ect
Res
ourc
eT
yp
eIm
pac
tp
erio
dS
ever
ity
An
dro
idD
ocu
men
tati
onA
pp
s’A
rtif
acts
Un
nec
essa
ryA
ttem
pt
toC
onn
ect
XX
WiF
i/R
adio
Non
-id
leB
Fre
qu
entl
yS
can
for
WiF
i-
XW
iFi
Non
-id
leB
Red
un
dant
WiF
iS
can
X-
WiF
iId
le,
Non
-id
leA
,B
Usi
ng
Rad
ioO
ver
WiF
i-
XR
adio
Non
-id
leB
Att
emp
tin
gC
orr
up
ted
Con
nec
tion
X-
WiF
i/R
adio
Non
-id
leB
Dow
nlo
adin
gR
edu
nd
ant
Data
X-
WiF
i/R
adio
/Mem
ory
Idle
AF
ail
ing
toC
lose
Blu
etooth
Con
nec
tion
s-
XB
luet
oot
h/C
PU
Idle
,N
on-i
dleA
,B
Un
nec
essa
ryS
earc
hfo
rB
luet
ooth
Pair
sX
-B
luet
oot
hN
on-i
dle
B
Red
un
dant
Blu
etoot
hD
isco
very
X-
Blu
etoot
hId
le,
Non
-id
leA
,B
Kee
pin
gS
cree
nO
nX
XD
isp
lay
Idle
AIm
pro
per
Uti
liza
tion
ofS
cree
nF
lags
X-
Dis
pla
yId
leA
Usi
ng
Lig
ht
Bac
kgr
oun
dC
olo
rX
XD
isp
lay
Non
-id
leB
Incr
easi
ng
an
dH
old
ing
Scr
een
Bri
ghtn
ess
X-
Dis
pla
yId
le,
Non
-id
leA
,B
Hig
hF
requ
ency
ofL
oca
tion
Up
date
sX
XG
PS
/WiF
i/R
adio
Non
-Id
leB
Un
nec
essa
ryA
ccura
teL
oca
tion
Req
ues
tX
-G
PS
Non
-id
leB
Red
un
dant
Loca
tion
Up
dat
eX
XG
PS
/WiF
i/R
adio
/CP
UId
le,
Non
-id
leA
,�
Neg
lect
ing
Last
Kn
own
Loca
tion
X-
GP
S/W
iFi/
Rad
ioN
on-i
dle
BH
igh
Fre
qu
ency
Rec
urr
ing
Callb
ack
-X
Any*
Non
-id
leB
,�
Red
un
dant
Rec
urr
ing
Call
back
X-
Any*
Idle
,N
on-i
dleA
,B
,�
Fail
ing
toD
eact
ivate
anA
larm
X-
CP
U/D
isp
lay
Idle
A,�
Fail
ing
toA
dju
stF
requ
ency
toB
atte
ryL
evel
XX
Any*
Non
-id
leB
,�
Un
nec
essa
ryan
dR
epea
ted
lyE
xec
uti
ng
Cod
e-
XA
ny*
Non
-id
leB
,�
Fai
lin
gto
Un
regi
ster
Sen
sor
X-
Any
Sen
sor
Idle
,N
on-i
dle
�U
nn
eces
sary
Use
of
Fast
Del
iver
yS
enso
rX
-A
ny
Sen
sor
Non
-id
le�
Fail
ing
toR
elea
seW
akel
ock
XX
WiF
i/R
adio
/Dis
pla
y/C
PU
Idle
A,�
Un
nec
essa
ryW
akel
ock
Acq
uir
emen
t-
XW
iFi/
Rad
io/D
isp
lay/C
PU
Non
-id
leB
,�
Un
nec
essa
ryA
ctiv
eW
akef
ulB
road
cast
Rec
eive
rX
-D
isp
lay/C
PU
Idle
A,�
Acq
uir
ing
Hig
hP
erfo
rman
ceW
iFi
Wak
elock
X-
WiF
iN
on-i
dle
B
*D
epen
din
gon
the
typ
eof
AP
Isuse
din
recu
rrin
gco
nst
ruct
s,e.
g.,
...,
any
typ
eof
har
dw
are
com
pon
ents
cou
ldb
eim
pac
ted
by
this
def
ect
patt
ern
24

drastically drain the battery. However, I found several posts on XDA Developers and AOSP
related to apps keeping Bluesleep wakelock and causing energy issues. Unlike app level
wakelocks that are acquired and released by apps, Bluesleep is a kernel level wakelock and
will be active in kernel as long as there is an active Bluetooth connection. If developers
fail to close Bluetooth connections after completion of data transfer, Bluesleep can keep the
phone unnecessarily awake and drain the battery. I found an instance of this defect in XDrip
apps [47], as corroborated by issue #169 [48].
Similarly, there are a subset of energy defects that I was not able to find any instance of them
in the studied apps. There are two possible justifications for this. First, majority of the open
source apps are either simple or not upgraded to newer version of Android SDK, thereby
do not use specific APIs and constructs that are discussed in Android documentation. For
instance, WakefulBroadcastReceiver introduced in the API level 22, to help developers keep
the phone awake during execution of services initiated by a broadcast receiver. None of
our studied apps used WakefulBroadcastReceiver in their implementation, let alone have an
instance of an energy defect related to it. Second, a subset of defects manifest themselves
under specific and not very common use-cases. For example, acquiring high performance
wakelock is not a defect itself. Under poor WiFi signals however, this type of wakelock
consumes more energy compared to normal WiFi wakelock, as it keeps WiFi active with
minimum packet loss and low packet latency. Therefore, developers should check the strength
of connection signal before acquiring this type of wakelock.
To summarize, the results from RQ1 confirm the proper choice of sources I used for derivation
of proposed defect model. Without any of these sources, I might have missed some types of
energy defects.
25

2.3.2 RQ2: Misused Resource Type
To answer this question, I tried to reproduce each instance of defect on a real Android app,
if the source of defect was apps’ artifact, or a synthetic app I created for this purpose, if
the source of defect was Android documentation. After identifying defect use-cases, i.e.,
the defect reproduction scenarios, I executed each on a Google Nexus 6, running Android
version 6.0.1, and monitored energy behavior of different hardware component of the phone
using Trepn [71]. Trepn is a profiling tool developed by Qualcomm that can be installed
on Android phones with Snapdragon chipsets developed by Qualcomm and collect the exact
power consumption data from various hardware component.
Trepn is reported to be highly accurate, with an average of 2.1% error in measurement [42],
and provides utilization traces for each hardware component during execution of each app.
To find out about misused hardware component, I collected the utilization traces of each
before, during, and after execution of each defect scenario. I then analyzed each trace,
looking for the following patterns:
• Idle time utilization: Spikes in the utilization traces when the user is not interacting
with the app can rise a red flag. Although running a background service without
any user interaction is not prohibited, apps are suggested to stop utilizing hardware
components when the app is not in the foreground, i.e., user pauses the app by switching
to another app. Failing to un-register listeners can cause such patterns in the utilization
trace.
• Utilization difference before and after the execution: Apps are supposed to
release all the hardware components when they are closed by users. Nevertheless, the
app can keep the phone on a high power consumption state, even if it is closed. Any
difference on the utilization level of a hardware component before and after execution
26

of each scenario can be an indicator of energy defect. For example, failing to release a
wakelock or closing Bluetooth connections causes this pattern in the utilization trace.
• Consecutive high amplitude spikes: Spikes in the utilization trace that last for a
long time can be an indicator of hardware over-utilization. High frequency of recurring
callbacks, acquiring wakelock sooner than it is required, or repeatedly execution energy-
greedy APIs can cause this pattern in the utilization trace.
The result of our analysis for this research question is summarized in the column 4 of Ta-
ble 2.1. As illustrated by these results, different instances of an energy defect type can
impact different hardware components. For example, depending on the type of wakelock
acquired by an app, e.g., screen wakelock, CPU wakelock, or WiFi wakelock, different hard-
ware components might remain in the high power consumption state and prevent the phone
to become idle. As another example, the engaged hardware component of High Frequency
Recurring Callback defect will be determined by the type of APIs used in the implemen-
tation of recurring constructs. This diversity on the type of engaged hardware component
later impacts the severity of instances for specific defect type, which I will discuss more on
RQ4.
It is worth to note that I were not able to find any instance of energy problems related the
camera and media hardware, such as speaker, and curser. Although failing to release these
hardware components can cause functional problems, e.g., if camera is acquired by an app
other apps can not acquire it again until it is released, such resource leaks are not reported
to cause battery drainage. By looking more closely on the usage of APIs related to these
hardware components, I discovered acquire and release APIs are performed on the software
level, rather than actually utilizing the hardware. For instance, the usage of acquire and
release APIs for camera deals with Camera object, at the software level, rather than directly
utilize camera hardware between acquirement and release [13]. In fact, the camera hardware
will be utilized only during video record and capturing a photo.
27

Figure 2.2: The breakdown of hardware components involved in energy defects
Additionally, I studied the breakdown of hardware components misused by any of the defect
patterns identified by our defect model. As illustrated by Figure 2.2, network-related hard-
ware, i.e., WiFi and radio, are the most misused components, together involved in 37% of
energy defects. This is not surprising, as majority of the Android apps, regardless of their
category, require access to internet for tasks such as update, offloading expensive compu-
tations to cloud, downloading files, and etc. The contribution is followed by display, CPU,
GPS, Bluetooth, sensors (e.g., accelerometer, gyroscope, and magnetometer), and memory.
These information can be valuable for developers, showing that they should be more careful
when using APIs related to WiFi, radio, display, and GPS, since 40% of energy defects are
related to the misuse of these APIs.
2.3.3 RQ4: Consequences of Energy Defects
The inevitable consequence of an energy defect is drainage of the battery. Unlike functional
defects however, energy defects do not cause immediate impacts observable by either users
or developers. In fact, for many energy defects, it may take several days until users suspect
28

the battery usage of their phone has changed. Additionally, the severity of the consequence
among energy defects varies among different type of energy defects. To determine the severity
of energy defects, I identified two of their characteristics: (1) the impact period and (2) the
type of misused hardware.
The impact period of an energy defect can be identified as idle or non-idle. While the impact
of non-idle defects is during the execution of an app, the impact of idle defects continues
even when an app is in the background or even stopped. To benchmark the impact period of
energy defects, I used the results of experiments performed for RQ2. Specifically, I marked
an energy defect as non-idle, if I found a consecutive high amplitude spikes pattern match
for utilization traces of its related hardware components. Similarly, I marked an energy
defect as non-idle, if its corresponding hardware utilization traces matched either “Idle time
utilization” or “Utilization difference before and after execution” patterns discussed in RQ2.
The energy greediness of the engaged hardware component is another important factor to be
considered when identifying impact severity of energy defects. According to Google, display,
GPS, WiFi, and radio are reported to consume the highest portion of device battery [11].
Therefore, I consider these hardware components as more-greedy, and other hardware com-
ponents less-greedy for determination of severity impact.
Based on the impact period and energy-greediness of misused hardware, I identified the
severity of each energy defect as severe, alarming, and minor as denoted in the last column
of Table 2.1 by A, B, and �, respectively. An energy defect has a severe impact, if the
impact period is idle and it misuses a more-greedy component during idle time. If the impact
period is non-idle, but the resource type is one of the more-greedy hardware components,
the defect has an alarming severity. Finally, if the impact period is either idle or non-idle
and the engaged hardware is less-greedy, I identify the energy defect to have a minor impact.
29

Figure 2.3: Distribution of defect types’ impact severity
Note that the severity of different instances of a defect type might different based on the use-
case. For instance, consider ”Redundant Location Updates“ energy defect. The impact of this
energy defect on the battery can be either severe or minor. As mentioned in Section 2.2, this
type of defect happens when developer fails to unregister the location listener. Unregistering
the location listener can be performed in several program points as discussed in RQ3, e.g., in
onPause(), onDestroy(), or onProviderDisabled(). If developer fails to unregister the listener
in the first two program points, the impact of defect on the battery would be severe, as the
app keeps GPS or network components engaged without any user interaction [149]. However,
if user manually disables GPS or network from the phone’s setting and developer has failed
to unregister the listener at onProviderDisabled callback, Android system itself disables all
the access to GPS or network components. Instead, the app keeps the CPU component
engaged, as there is still a listener thread registered to inquiry about location information.
Thereby, while the latter instance of defect still impacts the battery, the impact is minor.
As shown in Figure 2.3, the majority of identified defect types are alarming, meaning they
over-utilize more-greedy hardware component during execution of an app. Alarming defects
are potential points for optimization, i.e., developers can save the dynamic energy consump-
tion of an app by fixing such defects. For example, developers should always consider the
speed of user movement to choose appropriate frequency of location update and proper loca-
30

tion provider. If user is driving in a car, then the location update should be performed at the
highest frequency and high accuracy. If she walks, the frequency of location update should be
less frequent, adjusted to movement speed. Finally, if she is stationary, the location updates
should be canceled to save energy.
More that 40% of the defects have severe impacts, whereby they can drastically impact
the battery life of the device. Such defects should happen under no program path, as they
highly decrease usability of both the app and device. Currently, there is a lack of software
engineering tools and techniques that can help developers identifying energy defects and
the few existing techniques [149, 150] are limited by the types of defects that they can
detect.There is, thus, a need for tools that can fill this gap. Finally, near 40% of the energy
defects have minor consequences on the battery. Although the impact of such defects in one
app might not be significant on the battery life, the aggregation of these defects on many
apps can have a huge impact on the battery. Thereby, developers should also care to fix
energy defects with minor impact.
2.4 Discussion
In recent years, several techniques have been proposed to assist Android developers in iden-
tifying energy defects. Yet, there exist no common benchmark of real-world energy defects
for assessing effectiveness of such tools. In this chapter, we proposed a comprehensive defect
model of 28 types of energy defects, constructed from mining Android documentation and
artifacts of 59 real-world Android apps. The analysis on instances of identified energy defects
reveals the type of hardware components that are commonly misused, root causes of energy
defects,and their corresponding consequences and importance.
31
Chapter 3
Related Work and Research Gap
This chapter provides an overview of the related research on software testing and green
software engineering. Furthermore, I discuss the research gap and position of the proposed
techniques in this dissertation among the body of literature. To that end, I constructed a
taxonomy of existing approaches prior to this research that address the energy deficiency of
mobile apps through program analysis, i.e., static code analysis and software testing.
3.1 Related Work
The related work can be categorized into six categories. For each category, the literature
review was performed on the related work within the domain of Android and outside of it.
3.1.1 Regression Testing
Previous work in regression testing can be categorized as test-suite minimization, test case
selection, test case prioritization, and test-suite augmentation techniques [210]. These ap-
32

proaches have been further broken down to subcategories in the literature [102] as: (1) Ran-
dom, which selects arbitrary number of available test cases in an ad hoc manner; (2) Retest
all, which naively reruns all the available test cases; (3) Coverage-based data flow, which
selects test cases that exercise data interactions that have been affected by modifications;
and (4) Safe selection, which selects every test case that achieves a certain criterion.
The majority of regression testing techniques consider adequacy metrics for functional re-
quirements of the test suite and to lesser extent non-functional requirements [174]. To the
best of our knowledge, there are only few approaches in the literature that perform test-suite
management with respect to the energy consumption.
Kan [134] investigated the use of Dynamic Voltage and Frequency Scaling (DVFS) for energy
efficiency during regression testing. This work focuses on the assumption that over the
versions of a program that do not have significant changes in functionality, CPU-bound tests
remain CPU-bound, and similarly IO-bound tests remain IO-bound. It is effective therefore,
to optimize the processor frequency for the execution of CPU-bound test to achieve a good
level of energy savings. Unlike the proposed approach in this dissertation, which is a test-
suite minimization, this work utilizes retest all [102] technique and re-runs all the existing
test cases. In addition, the goal of this work is to reduce the energy consumption of whole
test-suite, rather than selecting test cases that are good for energy testing.
Another closely related work is an energy-directed approach for test-suite minimization [141].
The proposed approach in this paper tries to generate energy-efficient test suites that can
be used to perform post-deployment testing on embedded systems. To that end, the authors
measured the energy consumption of test cases, using a hardware, and used those measured
information to perform test-suite minimization. This approach is not suitable for energy
testing, since it discards tests with high energy consumption, which are necessary for detect-
ing energy defects. Furthermore, the proposed technique uses execution time as a metric for
test-suite optimization, when energy consumption information is not available. Though col-
33

lecting execution time for test cases is easy, using time as a proxy for energy is controversial.
Although some research shows that execution time is perceived to be positively correlated
with energy consumption [139], others suggest that time is not an appropriate proxy for
identifying energy-greedy segments of the program [109].
To summarize, no test-suite minimization approach attempts to reduce a test suite with
the goal of maintaining the reduced test suite’s ability to reveal energy defects. Unlike
the aforementioned techniques, which focus on running the test cases in the most energy-
efficient way, the proposed approach in this dissertation selects the minimum subset of the
existing test suite that can be used for energy testing of the Android apps. This approach
is complementary; an interesting avenue of future research is a combined multi-objective
approach, where both the energy cost of running the tests and their ability to reveal energy
defects are considered in the selection of tests.
3.1.2 Test Adequacy Criterion
Coverage criteria for software testing can be divided into those aimed at functional correct-
ness and non-functional properties. The great majority of prior work has focused on coverage
criteria for functional correctness [100, 77, 104, 116, 95, 96], and to a lesser extent on non-
functional properties [191, 93, 74, 204]. Even among the work focusing on non-functional
properties, none is applicable for energy testing, which hinders progress and comparison of
energy-aware testing techniques.
The coverage criterion suitable for energy testing needs to be aware of energy consumption
during test execution. Prior studies related to energy consumption of Android apps can be
categorized into power modeling and power measurement. Research in power modeling sug-
gests estimating the energy usage of mobile devices or apps in the absence of hardware power
monitors [140, 109]. Studies in power measurement make use of specialized hardware to de-
34

termine an app’s energy consumption at various granularities. While these techniques can
be adopted to measure or estimate the amount of energy consumption during test execution,
none of them address or provide test adequacy metric for determining the energy-efficiency
of tests.
3.1.3 Mutation Testing
Mutation testing has been widely used in testing programs written in different languages,
such as Fortran [137], C [89], C# [92], Java [153], and Javascript [167], as well as testing
program specifications [94, 165] and program memory usage [198]. However, there is a dearth
of research on mutation testing for mobile applications, specifically Android apps.
Mutation operators for testing Android apps were first introduced by Deng and colleagues [90,
91], where they proposed eleven mutation operators specific to Android apps. They designed
mutation operators based on the app elements, e.g., Intents, activities, widgets, and event
handlers. Unlike their operators that are designed for testing functional correctness, the
operators in this dissertation are intended for energy testing. Therefore, they are different
from those proposed in [91]. In addition, the proposed technique on this paper follows a
manual approach to analyze the generated mutants, rather than automatic technique for
mutation analysis proposed in this dissertation.
Since energy defects are complex and they manifest themselves under peculiar contextual
settings, an energy-aware mutation testing technique should design the mutation operators
based on a defect model. Liu et al. [149] identified missing sensors and wakelock deactivation
as two root causes of energy inefficiencies in Android apps. Banerjee and Roychoudhury [67]
provided a high level categorization for energy defects without identifying specific energy
anti-pattern. The proposed defect model in this dissertation is more comprehensive that
35

prior techniques, i.e., identify 28 types of energy defects. Only a subset of our operators are
overlaps with the energy defects that are described in these works.
Another important component of mutation testing is oracle. Gupta and colleagues [105]
provide a framework to identify common patterns of energy inefficiencies in power traces,
by clustering power traces of a Windows phone running different programs over a period of
time. Unlike their approach, I compare power traces of executing a test on two different
versions of an app, knowing one is mutated, to determine whether they are different.
3.1.4 Android Testing
Test input generation techniques for Android apps mainly focus on either fuzzing to generate
Intents or exercising an Android app through its GUI [85]. Several approaches generate
Intents with null payloads or by randomly generating payloads for Intents [209, 205, 186, 160].
Dynodroid [155] and Monkey [45] generate test inputs using random input values. Several
techniques [55, 53, 206, 63, 110] rely on a model of the GUI, usually constructed dynamically
and non-systematically, leading to unexplored program states. Another set of techniques
employ systematic exploration of an app in the construction of test cases: EvoDroid [158]
employs an evolutionary algorithm; ACTEve [58], JPF-Android [193], Collider [128], and
SIG Droid [169] utilize symbolic execution. Another group of techniques focus on testing for
specific defects. One technique, IntentDroid [117], explores boolean paths to test for inter-
app communication vulnerabilities. LEAKDroid [204] employs a GUI model-based technique
for testing resource leaks in Android that lead to slowdowns and crashes.
None of these approaches can be used to properly test the energy behavior of Android apps,
as they lack the ability to generate inputs meant to cover and exercise energy hotspots. The
closest work to the proposed research is perhaps that of Banerjee et al. [67]. They present a
search-based profiling strategy with the goal of identifying energy hotspots in an app. Their
36

approach does not consider system inputs that are independent of GUI or energy hotspots
that involve recurring constructs. Furthermore, their profiling process always starts from
the root activity of an app, making it infeasible to test particular sequences of the app’s
lifecycle.
3.1.5 Test Oracle
Automated test oracle approaches in the literature can be categorized into Specified [87, 194,
101, 146, 166, 201, 97, 98, 80, 81], Derived [202, 203, 115], and Implicit [76, 70, 161, 161,
119, 195, 79] test oracles [69]. Majority of these technique focus on the functional properties
of the program to generate test oracles, e.g., generating test oracles for GUI. Even among
those that consider non-functional properties of software [195, 70, 119, 161, 79], none has
aimed to develop an oracle for energy testing.
The biggest challenge to construction of an energy oracle is determining the observable
patterns during test execution that are indicators of energy defects. While prior research
attempted to categorize energy defects in mobile apps, the proposed fault models are either
broadly describing a category of energy defects [67], or identifying specific energy anti-
patterns in code that lead to excessive battery consumption [125]. Also, as energy defects
change and new types of defects emerge due to the evolution of mobile platform, i.e. Android
framework, the defect model proposed by prior work becomes obsolete.
While the mutation testing framework proposed in this dissertation rely on an automated
test oracle, the proposed technique cannot be generalized to energy test oracles, as it requires
a baseline power trace—that of original app—to identify anomalous patterns in a given power
trace—mutant app.
37

Approach Positioning
Analysis Objective Impact of Energy Defects
Ene
rgy
Deb
uggi
ng
Pow
erM
easu
rem
ent
Pow
erM
odel
ing
Ene
rgy
Test
ing*
Debugging Objective
Dia
gnos
is*
Rep
air
Sle
ep D
epriv
atio
n
Ove
rutil
izat
ion
Type of No-Sleep Energy Defects
Mis
sing
Wak
eloc
k D
eact
ivat
ion
Res
ourc
e Le
ak
Vacu
ous
Bac
kgro
und
Ser
vice
Type of Overutilization Energy Defects
Sub
-Opt
imal
Bin
ding
Dis
pens
able
Rec
urrin
g Ta
sk*
Futil
e E
xpen
sive
H
ardw
are
Que
ry*
Red
unda
nt
Exp
ensi
ve T
ask*
Net
wor
k*
Type of Connectivity
Blu
etoo
th*
Type of Testing Activity
Test
Inpu
t G
ener
atio
n*
Test
Ora
cle*
Loca
tion*
Con
nect
ivity
*
Dis
play
*
Rec
urrin
g C
onst
ruct
s*
Wak
eloc
k
Bod
y S
enso
rs*
Type of Misused Hardware APIs
Ene
rgy
Opt
imiz
atio
n
Reg
ress
ion
Test
ing*
Figure 3.1: Categorization of problems to address Android energy assessment
A closely related work to construction of energy test oracle is Banerjee et al. [67], which
presents a search-based profiling strategy with the goal of identifying energy defects in an
app. Their proposed technique profiles the energy consumption of the device while exploring
the GUI of apps and analyzes the power traces using statistical and anomaly detection
techniques to uncover energy-inefficient behavior. In their subsequent work [66], Banerjee
et al. fixed the scalability issue of the prior work [67] by using abstract interpretation-
based program analysis to detect resource leaks. None of these techniques offer a solution to
construct reusable energy test oracles.
3.1.6 Green Software Engineering
In recent years, automated approaches for analysis [103, 149, 105, 199], refactoring [163, 68],
and repair [142, 148] of programs have been developed to improve the energy efficiency of
programs. Liu et al. [149] identified missing sensors and wakelock deactivation as two root
38

Approach Characteristics
Type of Program Analysis
Supplementary Technique Automation Level
Sta
tic
Hyb
rid*
Dyn
amic
*
Mac
hine
Lea
rnin
g*
Aut
omat
ic
Sem
i-Aut
omat
ic
Analysis Model
Con
trol F
low
G
raph
(CFG
)
Cal
l Gra
ph (C
G)
Eve
nt F
low
Gra
ph
(ETG
)
Sensitivity of Analysis
Flow
Con
text
Pat
h
Abs
tract
Syn
tax
Tree
(AS
T)
Code Representation
Sta
tistic
al
Ana
lysi
s*S
ourc
e C
ode
Byt
ecod
e
Input Generation Technique
Sym
bolic
E
xecu
tion
Fuzz
ing
Man
ual
Inte
ger
Pro
gram
min
g*
Type of Inputs
GU
I Inp
uts
Sys
tem
Inpu
ts*
Power Measurement
Har
dwar
e
Sof
twar
e*
Pow
er M
odel
Analysis ArtifactC
ode
Pow
er
Mea
sure
men
t dat
a
Con
figur
atio
n*
Figure 3.2: Categorization of proposed solution to address Android energy assessment
causes of energy inefficiencies in Android. They also empirically studied the patterns of
wakelock utilization and the impact of wakelock misuse in real-world Android apps [150].
Banerjee and Roychoudhury [68] proposed a set of energy efficiency guidelines for refactoring
Android apps. These guidelines include fixing issues such as sub-optimal binding and nested
usage of resources. These approaches consider only a subset of the Android energy issues.
Additionally, none of these approaches attempt to develop techniques that aid the developers
with energy testing.
For a better understanding of the state of research in the field of energy analysis of mobile
apps, Figures 3.1- 3.3 present a taxonomy of how the related work address the energy ef-
ficiency of mobile apps and what techniques they use to evaluate and assess the proposed
approaches. The taxonomy entities that are marked with * indicates the contribution of this
dissertation in the domain. The remaining of this chapter will elaborate the shortcomings
of related work.
39

Approach Evaluation
Evaluation Method
Em
piric
al
Cas
e S
tudy
Use
r Stu
dy
App RepositoryG
oogl
e P
lay
Third
Par
ty
Replicability
Tool
Ava
ilabl
e
Res
ults
Rep
licab
le
Sou
rce
Cod
e Av
aila
ble
Figure 3.3: Categorization of assessment techniques in the domain of Android energy assessment
3.2 Research Gap
In this section, I identify the research gap in the related literature by answering the following
research questions:
• Studied energy defects : What type of energy defects have been studied by prior studies?
• Importance of unattended energy defects : How important are the energy defects not
studied by prior research?
• Analysis technique: What type of program analysis have been used assess the energy
behavior of Android apps? What are the limitations of such analysis techniques?
40

Figure 3.4: Distribution of energy defect patterns among sources
3.2.0.1 Studied energy defects
Prior body of work has only studied a subset of energy defects, i.e., resource leakage and
sub-optimal binding, that were presented in Section 2. The most important root cause of
this gap is that prior work only relied on app artifacts, specifically issue tracker of open
source apps, in order to determine the root causes of battery drainage in mobile apps. On
the other hand, the proposed methodology in Section 2 considers not only the issue tracker
of open source apps, but also Android API documentation and developer’s guide, AOSP
issue tracker, and developer’s discussions in public forums. Based on the insights obtained
from the additional sources, I was able to find more instances of energy defects in real-world
mobile apps and construct a comprehensive energy defect model for Android.
Figure 3.4 shows the distribution of identified energy defect in Section 2 among different
sources. As this chart suggests, 21% of energy defects in the energy defect model are identi-
fied through studying only app artifacts. For the remaining 79%, 54% of them are identified
based on the information obtained from documentations—Android API documentation, An-
droid developer’s guide, and developer’s discussions in public forums—and 25% of them are
identified by a cross analysis between these two sources. As an example for the latter cate-
41

Figure 3.5: Importance of energy defects missed by prior research
gory, I found several posts in the XDA Developers forum suggesting that specific Bluetooth
apps drain the battery even when the Bluetooth is off. While the issue tracker of those apps
did not contain any battery issues, by looking at the source code of those apps, I was able
to find that those apps have failed to close Bluetooth connections once a Bluetooth device
disconnects, thereby kept a kernel level wakelock active and drained the battery.
3.2.0.2 Importance of unattended energy defects
This research question investigates the importance of missing energy defects in prior studies.
Recall from Section 2.3.3, the impact of energy defects can be Minor, Alarming, and Severe,
based on the impact period and energy-greediness of the misused hardware. Figure 3.5
demonstrates the severity of the energy defects that are missed by related work:
• Minor defects : Only 36% of the minor energy defects are studied by prior research.
Although the impact of minor defects in one app might not be significant on the
battery life, the aggregation of these defects on many apps can have a huge impact on
the battery. Thereby, the proposed technique in the literature should consider these
types of defects in their Analyses.
42

• Alarming defects : Only 16% of the Alarming defects are studied by related work.
Alarming defects are potential points for optimization, i.e., developers can save the
dynamic energy consumption of an app by fixing such defects. Such optimization can
help reduce the battery consumption during execution of an app. Thereby, energy-
aware analyses should consider these type of defects.
• Severe defects : Only 36% of the Severe energy defects are studied by prior research.
These defects are very important to be studied, as they can drastically impact the
battery life.
These results confirm the importance of the energy defects, which are not studied by the prior
related work. Thereby, there is a need for automated techniques that take the unattended
energy defects into account in their analyses.
3.2.0.3 Analysis technique
Prior body of work mostly relies on the Static Program Analysis to address energy issues
in mobile apps. The first problem with the static analysis is that it relies on known defect
patterns and fails to generalize to a large set of energy issues. More importantly, the majority
of energy inefficiencies cannot be effectively detected using static analysis, as in addition to
the app, energy properties also depend on the framework, context of usage (e.g., speed of
movement), properties of the device (e.g., whether the device is connected to WiFi or not)
and even back-end servers (e.g., corrupted URL or unreachable server). At the same time,
none of the existing automated Android testing tools are able to generate tests that are
sufficiently sophisticated for finding the types of energy defects described above. Thereby,
there is a need for automated testing techniques to consider energy as a program property
of interest in their analysis.
43

Chapter 4
Research Problem
The utility of a smartphone is limited by its battery capacity and the ability of its hardware
and software to efficiently use the device’s battery. Besides traditional hardware components
(e.g., CPU, memory), mobile devices utilize a variety of sensors (e.g., GPS, WiFi, radio, cam-
era, accelerometer). The multitude of hardware on a mobile device and the manner in which
mobile platform interfaces with such hardware result in a major challenge in determining
the energy efficiency of mobile apps.
While recent studies have shown energy to be a major concern for both users [196] and
developers [162], many mobile apps are still abound with energy defects. App developers
find it difficult to properly evaluate the energy behavior of their programs [162]. To properly
characterize the energy consumption of an app and identify energy defects, it is critical that
apps are properly tested.
To understand the need to dynamically exercise an app, i.e., testing an app, to find energy
defects, consider the code snippets shown in Listing 4.1 and Listing 4.2 and. Listing 4.1
shows a code snippet that employs Android API to obtain user location. User location
can be obtained by creating a LocationListener (Line 8), implementing several callbacks
44

1 public class TrackActivity extends Activity {2 private LocationManager manager;3 private LocationListener listener;4 protected void onCreate(){5 time = 1*60*1000;6 distance = 20;7 manager = getSystemService("LOCATION_SERVICE");8 listener = new LocationListener(){9 public void onLocationChanged(Location loc){
10 if(loc.altitude > 2)11 // Update activity with new location12 }13 };14 manager.requestLocationUpdates("GPS", time, distance, listener);15 }16 protected void onPause(){ super.onPause(); }17 protected void onDestroy(){18 manager.removeUpdates(listener);19 }20 }
Figure 4.1: Obtaining user location in Android
(e.g., onLocationChanged in Lines 9-12), and then calling requestLocationUpdates
method of LocationManager to register the listener and receive location updates (Line
14). When developing location-aware apps, developers should use a location update strategy
that achieves the proper tradeoff between accuracy and energy consumption [19]. In the
code snippet of Listing 4.1, the app receives user location updates from GPS every 1 minute
(i.e., 1 × 60 × 1000 milliseconds) or every 20 meters change in location (Line 14). This
may not be the best strategy, as the app requests an update every 1 minute, even if the
user is stationary, leading to high frequency of location updates anti-pattern. Additionally,
the app always utilizes GPS to obtain location data instead of alternative, more energy
efficient approaches, e.g., Android’s Network Location Provider. Although more accurate,
GPS consumes higher amount of energy, leading to unnecessary accuracy of location anti-
pattern. Depending on the speed of movement, the app can obtain location data from
different sources, e.g., when a user moves rapidly and requires more accurate data, the app
should utilize GPS, and use network to obtain location information otherwise. To detect
such unnecessary energy inefficiencies, an app needs to be tested under different contextual
settings, e.g., speeds of movement.
45

1 protected void downloadFiles(String[] resourceLink){2 WifiLock lock = getSystemService().createWifiLock();3 lock.acquire();4 for(String link : resourceLink){5 URL url = new URL(link);6 HttpURLConnection conn = url.openConnection();7 conn.connect();8 file = downloadFile(conn.getInputStream);9 processFile(file);
10 conn.close();11 }12 lock.release();13 }
Figure 4.2: Downloading files in Android
When the app no longer requires the location information, it needs to stop listening to
updates and preserve battery by calling removeUpdates of LocationManager (Line 18).
Failing to unregister the location listener results in unnecessary delivery of location updates
and a constant energy draw [149]. In the example of Listing 4.1, when the app is neither
running nor destroyed (i.e., paused in the background), listener keeps receiving updates,
which is redundant as the activity is not visible, leading to redundant location updates anti-
pattern. To detect these sorts of defects, apps need to be tested under different combination
of lifecycle callbacks, as some combination of callbacks may fail to release resources and
unregister event listeners.
Listing 4.2 shows an Android program that connects to a set of servers, downloads files, and
processes them. Although the code is functionally correct, it suffers from several energy anti-
patterns. First, searching for a network signal is one of the most power-draining operations on
mobile devices [32]. As a result, an app should first check for connectivity before performing
any network operation to save battery, i.e., not forcing the mobile Radio or WiFi to search
for a signal if there is none available (to avoid unnecessary attempt to connect anti-pattern).
Second, energy cost of communication over cellular network is substantially higher than
WiFi. Therefore, developers should adjust the behavior of their apps depending on the
type of network connection (to avoid use Radio over WiFi anti-pattern). For example, the
update rate should be lowered on Radio connections, or downloads of significant size should
46

be suspended until there is a WiFi connection. Third, opening a network connection is
energy expensive [142] as it involves a successful three-way handshake. If the server is not
reachable—the server is not available or the URL is corrupted—the client waits for the ACK
from the server until there is a timeout. If the timeout value is not specified, an app can wait
forever for a response from the server, which unnecessarily utilizes WiFi or Radio hardware
components [46] (resulting in attempting corrupted connection anti-pattern). To detect these
types of energy defects, Android apps need to be tested under different network connections
(e.g., WiFi, Radio), different conditions (i.e., when network connection is available or not),
and different use-cases (e.g., the server is not reachable or the URL is corrupted).
Energy defects in the code snippet of Listings 4.1 and 4.2 show that the majority of energy
inefficiencies cannot be effectively detected using static analysis, as in addition to the app,
energy properties also depend on the framework, context of usage (e.g., speed of movement),
properties of the device (e.g., whether the device is connected to WiFi or not) and even
back-end servers (e.g., corrupted URL or unreachable server). At the same time, none of
the existing automated Android testing tools are able to generate tests that are sufficiently
sophisticated for finding the types of energy defects described above. In this context, the
goal of this research is to help mobile app developers with creating energy efficient apps by
enabling energy testing. To advance the state of energy testing on mobile applications, there
are four main challenges need to be tackled:
1. There is a lack of knowledge among developers and even software research community
about characteristics of the tests that can reveal energy defects. An important step
toward automatic test generation is to asses the quality of tests in revealing energy
defects, i.e., to understand the properties of tests that are good at revealing such defects.
Mutation testing is a well-known approach for evaluating fault detection ability of test
suites by seeding artificial defects, a.k.a, mutation operators. Thereby, an energy-aware
47

mutation testing technique can be useful to find out about the characteristics of tests
that can be potentially good at revealing energy defects.
2. Many energy issues depend on the execution context and manifest themselves under
peculiar conditions, e.g., when the physical location of a device is changing rapidly,
when particular system events occur frequently. Existing state-of-the-art and state-of-
practice Android testing tools are mainly designed for functional testing of Android
apps through either fuzzing or exercising apps through their GUI. The main objective
of these test generation approaches is maximizing conventional code coverage metrics
and they do not consider the contextual factor into account, making them not suitable
for testing the energy properties of apps. Thereby, there is a need to devise an energy
testing technique.
3. Energy testing is not complete without automated test oracles. Test oracle automation
is one of the most challenging facets of test automation, and in fact, has received
significantly less attention in the literature [69]. Automated test generation for non-
functional properties such as energy is more critical, as their impact after test execution
is not explicit. That is, unlike functional defects that can cause exceptions immediately
after test execution, it may take several hours, days, or even weeks until developer or
user notice an app is draining the device’s battery. There is, thus, a need for automated
test oracles to automatically determine if execution of a test can reveal an energy defect
or not.
4. Energy testing is generally more labor intensive and time-consuming than functional
testing, as tests need to be executed in the deployment environment and specialized
equipment need to be used to collect energy measurements. Developers spend a signif-
icant amount of time executing tests, collecting power traces, and analyzing the results
to find energy defects. The fragmentation of mobile devices, particularly for Android,
further exacerbates the situation, as developers have to repeat this process for each sup-
ported platform. Moreover, to accurately measure the energy consumption of a test,
48

it must be executed on a device and drain its battery. While it is possible to collect
energy measurements when the device is plugged to a power source, such measurements
tend to be less accurate due to the impact of charging current [121, 20]. Continuously
testing apps on a mobile device uses up limited charging cycles of its battery. There
is, thus, a need for test-suite management capabilities, such as test-suite minimization
and prioritization, that can aid the developers with finding energy defects under time
and resource constraints.
4.1 Problem Statement
The challenges caused by lack of automated techniques to effectively and efficiently test
energy behavior of Android applications can be summarized as follow:
The rising popularity of mobile apps deployed on battery-constrained devices has motivated
the need for effective energy-aware testing techniques. However, currently there is a lack of
test generation tools for exercising the energy properties of apps. Automated test generation is
not useful without tools that help developers to measure the quality of the tests. Additionally,
the collection of tests generated for energy testing could be quite large, which entails a need
for techniques to manage the size of test suite, while maintaining its effectiveness in revealing
energy defects. Thereby, there is a demand by developers, consumers, and market operators
for practical techniques to advance energy testing for mobile applications, including various
techniques for energy-aware test input generation, test oracle, test quality assessment, and
test-suite minimization
49

4.2 Research Hypotheses
This research investigates the following hypotheses:
• Mutation testing has been widely used in testing programs written in different lan-
guages [89, 153], as well as testing program specifications [165] and program memory
usage [198]. However, there is a lack of research on mutation testing for mobile apps.
More specifically, no prior work in the literature considers energy as a program prop-
erty of interest for mobile apps in the context of mutation testing. Therefore, there is
a need for an energy-aware mutation testing techniques to evaluate the quality of test
suites with respect to their ability to find energy defects.
Hypothesis 1: A mutation testing framework can be devised to effectively assess the
quality of test cases, in order to determine the characteristics of tests that are effective
in revealing energy defects.
• Existing literature on test generation for Android apps has mainly focused on func-
tional testing through exercising GUI of the apps. The main objective of these test
generation approaches is maximizing conventional code coverage metrics, and thus not
suitable for testing the energy properties of apps. That is mainly due to the fact that
many energy issues depend on the execution context and manifest themselves under
peculiar conditions (e.g., when the physical location of a device is changing rapidly,
when particular system events occur frequently). Therefore, a test input generation
technique for energy testing should consider both GUI and system inputs. While the
former is necessary for creation of tests that model user interactions with an app, the
latter creates a context for those interactions. Since the domain of both GUI and system
inputs is quite large in Android applications, a search-based evolutionary technique is
a reasonable solution to systematically search the input domain and automatically find
test data, guided by a fitness function. Such search-based testing framework should
50
model both the app and execution environment, whereby these models can be used
to guide the search for proper inputs that construct event sequences exercising energy
behavior of an app.
Hypothesis 2: A testing technique that considers both app and the execution context
can be used to generate system level tests for Android app, in order to effectively test
its energy behavior.
• Test oracle automation is one of the most challenging facets of test automation [69].
While power trace is an important output from an energy perspective, relying on that
for creating energy test oracles faces several non-trivial complications. First, collecting
power traces is unwieldy, as it requires additional hardware, e.g., Monsoon [7], or spe-
cialized software, e.g., Trepn [71], to measure the power consumption of a device during
test execution. Second, noise and fluctuation in power measurement may cause many
tests to become flaky. Third, power trace-based oracles are device dependent, making
them useless for tests intended for execution on different devices. Finally, power traces
are sensitive to small changes in the code, thus are impractical for regression testing.
The key insight for construction of oracle is that whether a test fails—detects an en-
ergy defect—or passes can be determined by comparing the state of app lifecycle and
hardware elements during the execution of a test. If such a state changes in specific
ways, we can determine that the test is failing, i.e., reveals an energy issue, irrespec-
tive of the power trace or hardware-specific differences. Determining such patterns is
exceptionally cumbersome, and requires deep knowledge of energy faults and their im-
pact on the app lifecycle and hardware elements. Furthermore, energy defects change,
and new types of defects emerge, as mobile platforms evolve, making it impractical to
manually derive such patterns.
Hypothesis 3: By levering a Deep Learning technique that can learn the (mis)behaviors
corresponding to the different types of energy defects during the test execution, it is pos-
sible to construct an oracle that automatically predicts the output of test execution.
51

• The great majority of test-suite minimization [173, 131, 183, 122, 107] techniques have
focused on the functional requirements and to a lesser extent non-functional require-
ments [210]. Even among the work focusing on non-functional properties, there is a
dearth of prior work that account for energy issues. Given the varying amount of energy
consumed at different points during the execution of a mobile app, it is insufficient to
utilize traditional metrics to measure test adequacy (e.g., statement coverage, branch
coverage) during test-suite minimization. As a result, a new test coverage criterion is
needed to guide an energy-aware test-suite minimization approach.
Hypothesis 4: By using a technique that considers energy properties of test cases
during test-suite minimization, it is possible to significantly reduce the size of test suites,
such that the minimized test suite maintains a comparable effectiveness in revealing
energy defects.
52

Chapter 5
Energy-Aware Mutation Testing
The fact that mobile apps are deployed on battery-constrained devices underlines the need
for effectively evaluating their energy properties. However, currently there is a lack of testing
tools for evaluating the energy properties of apps. As a result, for energy testing, developers
are relying on tests intended for evaluating the functional correctness of apps. Such tests may
not be adequate for revealing energy defects and inefficiencies in apps. This chapter presents
an energy-aware mutation testing framework that can be used by developers to assess the
quality of their test suite for revealing energy-related defects. In addition, mutation analysis
can unfold the characteristics of tests that are effective in finding energy defects.
5.1 Introduction
Energy is a demanding but limited resource on mobile and wearable devices. Improper
usage of energy consuming hardware components, such as GPS, WiFi, radio, Bluetooth, and
display, can drastically discharge the battery. Recent studies have shown energy to be a
53

major concern for both users [196] and developers [162]. In spite of that, many mobile apps
are abound with energy defects.
The majority of apps are developed by start-up companies and individual developers that
lack the resources to properly test their programs. The resources they have are typically
spent on testing the functional aspects of apps. However, tests designed for testing functional
correctness of a program may not be suitable for revealing energy defects. In fact, even in
settings where developers have the resources to test the energy properties of their apps,
there is generally a lack of tools and methodologies for energy testing [162]. Thus, there is
an increasing demand for solutions that can assist the developers in identifying and removing
energy defects from apps prior to their release.
One step toward this goal is to help the developers with evaluating the quality of their tests
for revealing energy defects. Mutation testing is an approach for evaluating fault detection
ability of a test suite by seeding the program under test with artificial defects, a.k.a, mutation
operators [106, 130]. Mutation operators can be designed based on a defect model, where
mutation operators create instances of known defects, or by mutating the syntactic elements
of the programming language. The latter creates enormously large number of mutants and
makes energy-aware mutation testing infeasible, as energy testing should be performed on
a real device to obtain accurate measurements of battery discharge. Additionally, energy
defects tend to be complex (e.g., manifest themselves through special user interactions or
peculiar sequence of external events). As Rene et al. [133] showed complex faults are not
highly coupled to syntactic mutants, energy-aware mutation operators should be designed
based on a defect model.
This chapter presents µDroid, an energy-aware mutation testing framework for Android.
The design of µDroid should overcome two challenges:
54

(1) An effective approach for energy-aware mutation testing needs an extensive list of energy
anti-patterns in Android to guide the development of mutation operators. An energy anti-
pattern is a commonly encountered development practice (e.g., misuse of Android API)
that results in unnecessary energy inefficiencies. While a few energy anti-patterns, such as
resource leakage and sub-optimal binding [149, 199], have been documented in the literature,
they do not cover the entire spectrum of energy defects that arise in practice. To that end,
I first conducted a systematic study of various sources of information, which allowed us to
construct the most comprehensive energy defect model for Android to date. Using this defect
model, I designed and implemented a total of fifty mutation operators that can be applied
automatically to apps under test.
(2) An important challenge with mutation testing is the oracle problem, i.e., determining
whether the execution of a test case kills the mutants or not. This is particularly a challenge
with energy testing, since the state-of-the-practice is mostly a manual process, where the
engineer examines the power trace of running a test to determine the energy inefficiencies
that might lead to finding defects. To address this challenge, I present a novel, and fully
automated oracle that is capable of determining whether an energy mutant is killed by
comparing the power traces of tests executed on the original and mutant versions of an app.
Extensive evaluation of µDroid using open-source Android apps shows that it is capable of
effectively and efficiently evaluating the adequacy of test suites for revealing energy defects.
There is a statistically significant correlation between mutation scores produced by µDroid
and test suites’ ability in revealing energy defects. Furthermore, µDroid’s automated or-
acle showed an average accuracy of 94%, making it possible to apply the mutation testing
techniques described in this chapter in a fully automated fashion. Finally, using µDroid,
helped identification of 15 previously unknown energy defects in the subject apps. Reporting
these defects to developers, 11 of them were verified as bugs and 7 are fixed to date, using
the patches I provided to developers.
55

The proposed approach in this chapter makes the following contributions:
• A comprehensive list of energy anti-patterns collected from issue trackers, Android
developers guide, and Android API reference.
• Design of fifty energy-aware mutation operators based on the energy anti-patterns and
their implementation in an Eclipse plugin, which is publicly available.
• A novel automatic oracle for mutation analysis to identify if an energy mutant can be
killed by a test suite.
• Experimental results demonstrating the utility of mutation testing for evaluating the
quality of test suites in revealing energy defects.
The remainder of this chapter is organized as follows. Section 5.2 provides an overview of
our framework. Sections 5.3 describes our extensive study to collect energy anti-patterns
from variety of sources and presents the details of our mutation operators with several
coding examples. Section 5.4 introduces our automated approach for energy-aware mutation
analysis. Finally, Section 5.5 presents the implementation and evaluation of the research.
5.2 Framework Overview
Figure 5.1 depicts our framework, µDroid, for energy-aware mutation testing of Android
apps, consisting of three major components: (1) Eclipse Plugin that implements the muta-
tion operators and creates a mutant from the original app; (2) Runner/Profiler component
that runs the test suite over both the mutated and original versions of the program, profiles
the power consumption of the device during execution of tests, and generates the corre-
sponding power traces (i.e., time series of profiled power values); and (3) Analysis Engine
that compares the power traces of tests in the original and mutated versions to determine if
a mutant can be killed by tests or not.
56

Figure 5.1: Energy-aware mutation testing framework
Our Eclipse plugin implements fifty energy-aware mutation operators derived from an ex-
tensive list of energy anti-patterns in Android. To generate mutants, our plugin takes the
source code of an app and extracts the Abstract Syntax Tree (AST) representation of it. It
then searches for anti-patterns encoded by mutation operators in AST, transforms the AST
according to the anti-patterns, and generates the implementation of the mutants from the
revised AST.
After generating a mutant, the Runner/Profiler component runs the test suite over the
original and mutant versions, while profiling the actual power consumption of the device
during execution of test cases. This component creates the power trace for each test case
that is then fed to the Analysis Engine.
Analysis engine employs a novel algorithm to decide whether each mutant is killed or lived.
At a high-level, it measures the similarity between time series generated by each test after
execution on the original and mutated versions of an app. In doing so, it accounts for
distortions in the collected data. If the temporal sequences of power values for a test executed
on the original and mutated app are not similar, Analysis Engine marks the test as killed.
A mutant lives if none of the tests in the test suite can kill it.
57

The implementation of µDroid’s framework is extensible to allow for inclusion of new
mutation operators, Android devices, and analysis algorithms. The following two sections
describe the details of proposed energy-aware mutation operators and mutation Analysis
Engine.
5.3 Mutation Operators
To design the mutation operators, we first conducted an extensive study to identify the
commonly encountered energy defects in Android apps, which we call energy anti-patterns.
To that end, we explored bug repositories of open-source projects, documents from Google
and others describing best practices of avoiding energy inefficiencies, and published literature
in the area of green software engineering.
Table 5.1 lists our energy-aware mutation operators. We designed and implemented 50
mutation operators (column 3 in Table 5.1)—corresponding to the identified energy defect
patterns, grouped into 28 classes (column 2 in Table 5.1). We also categorized these classes
of mutation operators into 6 categories, which further capture the commonality among the
different classes of operators. Each row of the table presents one class of mutation opera-
tors, providing (1) a brief description of the operators in the class, (2) the ID of mutation
operators that belong to the class, (3) list of the hardware components that the mutation
operators might engage, and (4) modification types made by the operators (R: Replacement,
I: Insertion, D: Deletion).
Due to space constraints, in the following sections, we describe a subset of our mutation
operators. Details about all mutation operators can be found on the project website [31].
58

Tab
le5.
1:L
ist
ofpro
pos
eden
ergy
-aw
are
muta
tion
oper
ator
s.
Cat
egory
Des
crip
tion
ofC
lass
Mu
tati
onO
per
ator
sH
ard
war
eT
yp
e
Loca
tion
Incr
ease
Loca
tion
Up
date
Fre
qu
ency
LU
FT
,L
UF
D
GP
S/W
iFi/
Rad
io
RC
han
ge
Loca
tion
Req
ues
tP
rovid
erL
RP
C,
LR
PA
R,I
Red
un
dan
tL
oca
tion
Up
dat
eR
LU
,R
LU
P,
RL
UD
DV
oid
ing
Las
tK
now
nL
oca
tion
LK
LR
Con
nec
tivit
y
Fail
toC
hec
kfo
rC
on
nec
tivit
yF
CC
R,
FC
CA
WiF
i/R
adio
/Blu
etoot
h
R,I
Fre
qu
entl
yS
can
for
WiF
iF
SW
H,
FS
WS
RR
edu
nd
ant
WiF
iS
can
RW
SD
Use
Cel
lula
rov
erW
iFi
UC
WC
,U
CW
WI
Lon
gT
imeo
ut
for
Corr
up
ted
Con
nec
tion
LT
CR
,ID
own
load
ing
Red
un
dant
Dat
aD
RD
DU
nn
eces
sary
Act
ive
Blu
etoot
hU
AB
RF
requ
entl
yD
isco
ver
Blu
etoot
hD
evic
esF
DB
H,
FD
BS
RR
edu
nd
ant
Blu
etooth
Dis
cove
ryR
BD
D
Wake
lock
Wake
lock
Rel
ease
Del
etio
nfo
rC
PU
WR
DC
,W
RD
CP
,W
RD
CD
CP
U/W
iFi
DK
eep
Wak
wfu
lBro
ad
cast
Rec
eive
rA
ctiv
eW
BR
DW
akel
ock
Rel
ease
Del
etio
nfo
rW
iFi
WR
DW
,W
RD
WP
,W
RD
WD
DA
cqu
ire
Hig
hP
erfo
rman
ceW
iFi
Wak
elock
HP
WR
Dis
pla
y
En
ab
leM
axim
um
Scr
een
Tim
eou
tM
ST
Dis
pla
y
IS
etS
cree
nF
lags
SS
FI
Use
Lig
ht
Back
grou
nd
Col
orL
BC
RE
nab
leM
axim
um
Scr
een
Bri
ghtn
ess
MS
BI
Rec
urr
ing
Call
back
and
Loop
Hig
hF
requ
ency
Rec
urr
ing
Cal
lbac
kH
FC
T,
HF
CS
,H
FC
A,
HF
CH
WiF
i/R
adio
/CP
U/M
emor
y/
Blu
etoot
h/D
isp
lay
RR
edu
nd
ant
Rec
urr
ing
Cal
lbac
kR
RC
DR
un
nin
gan
Ala
rmF
orev
erR
AF
D
Bat
tery
-rel
ated
Fre
qu
ency
Ad
just
men
tB
FA
TL
,BFA
TF
,B
FA
SL
,B
FA
SF
,B
FA
AL
,B
FA
AF
,B
FA
HL
,B
FA
HF
I
Incr
easi
ng
Loop
Iter
ati
ons
ILI
I
Sen
sor
Sen
sor
Lis
ten
erU
nre
gis
ter
Del
etio
nS
LU
DS
enso
rsD
Fast
Del
iver
yS
enso
rL
iste
ner
FD
SL
R
59

1 public class TrackActivity extends Activity {2 private LocationManager manager;3 private LocationListener listener;4 protected void onCreate(){5 manager = getSystemService("LOCATION_SERVICE");6 listener = new LocationListener(){7 public void onLocationChanged(){8 // Use location information to update activity9 }
10 };11 manager.requestLocationUpdates("NETWORK", 2*60*1000, 20, listener);12 }13 protected void onPause(){super.onPause();}14 protected void onDestroy(){15 super.onDestroy();16 manager.removeUpdates(listener);17 }18 }
Figure 5.2: Example of obtaining user location in Android
5.3.1 Location Mutation Operators
When developing location-aware apps, developers should use a location update strategy that
achieves the proper tradeoff between accuracy and energy consumption [19]. User location
can be obtained by registering a LocationListener, implementing several callbacks, and
then calling requestLocationUpdates method of LocationManager to receive location
updates. When the app no longer requires the location information, it needs to stop listening
to updates and preserve battery by calling removeUpdates of LocationManager. Though
seemingly simple, working with Android LocationManager APIs could be challenging for
developers and cause serious energy defects.
Figure 5.2 shows a code snippet inspired by real-world apps that employs this type of API.
When TrackActivity is launched, it acquires a reference to LocationManager (line 5),
creates a location listener (lines 6-10), and registers the listener to request location updates
from available providers every 2 minutes (i.e., 2 ∗ 60 ∗ 1000) or every 20 meters change in
location (line 11). Listening for location updates continues until the TrackActivity is
destroyed and the listener is unregistered (line 16).
60

We provide multiple mutation operators that manipulate the usage of LocationManager
APIs. LUF operators increase the frequency of location updates by replacing the second
(LUF T) or third (LUF D) parameters of requestLocationUpdates method with 0, such
that the app requests location notifications more frequently. If LUF mutant is killed (more
details in Section 5.4), it shows the presence of at least one test in the test suite that
exercises location update frequency of the app. Such tests, however, are not easy to write.
For instance, testing the impact of location update by distance requires tests that mock the
location. To our knowledge, none of the state-of-the-art Android testing tools are able to
generate tests with mocked object. Thereby, developers should manually write such test
cases.
Failing to unregister the location listener and listening for a long time consumes a lot of bat-
tery power and might lead to location data underutilization [149]. For example in Figure 5.2,
listener keeps listening for updates, even if TrackActivity is paused in the background.
Such location updates are redundant, as the activity is not visible. RLU mutants delete the
listener deactivation by commenting the invocation of removeUpdates method. This class
of mutants can be performed in onPause method (RLU P), onDestroy method (RLU D),
or anywhere else in the code (RLU). Killing RLU mutants, specially RLU D and RLU P,
requires test cases that instigate transitions between activity lifecycle and service lifecycle
to ensure that registering/unregistering of location listeners are performed properly under
different use cases.
5.3.2 Connectivity Mutation Operators
Connectivity-related mutation operators can be divided to network-related, which engage
the WiFi or radio, and Bluetooth-related. Mutation operators in both sub-categories mimic
61

energy anti-patterns that unnecessarily utilize WiFi, radio, and Bluetooth hardware compo-
nents, which can have a significant impact on the battery discharge rate.
5.3.2.1 Network Mutation Operators
Searching for a network signal is one of the most power-draining operations on mobile de-
vices [32]. As a result, an app needs to first check for connectivity before performing any
network operation to save battery, i.e., not forcing the mobile radio or WiFi to search for
a signal, if there is none available. For instance, the code snippet of Figure 5.3 shows
an Android program that checks for connectivity first, and then connects to a server at
a particular URL and downloads a file. This can be performed by calling the method
isConnected of NetworkInfo. FCC operator mutates the code by replacing the return
value of isConnected with true (FCC R), or adds a conditional statement to check con-
nectivity before performing a network task, if it is not already implemented by the app
(FCC A).
FCC R
if(true){HttpURLConnection conn = url.openConnection();conn.connect();// Code for downloading file from the url
}
FCC operators are hard to kill, as they require tests that exercise an app both when it is
connected to and disconnected from a network. To that end, tests need to either mock the
network connection or programmatically enable/disable network connections.
Another aspect of network connections related to energy is that energy cost of communication
over cellular network is substantially higher than WiFi. Therefore, developers should adjust
62

1 protected void downloadFiles(String link){2 WifiLock lock = getSystemService().createWifiLock();3 lock.acquire();4 URL url = new URL(link);5 ConnectivityManager manager = getSystemService(6 "CONNECTIVITY_SERVICE");7 NetworkInfo nets = manager.getActiveNetworkInfo();8 if(nets.isConnected()){9 HttpURLConnection conn = url.openConnection();
10 conn.connect();11 // Code for downloading file from the url12 }13 lock.release();14 }
Figure 5.3: Example of downloading a file in Android
the behavior of their apps depending on the type of network connection. For example,
downloads of significant size should be suspended until there is a WiFi connection.
UCW operator forces the app to perform network operations only if the device is connected
to cellular network (UCW C) or WiFi (UCW W) by adding a conditional statement. For
UCW W, network task is performed only when there is a WiFi connection available. For
UCW C, on the other hand, the mutation operator disables the WiFi connection and checks
if a cellular network connection is available to perform the network task. Therefore, killing
both mutants requires testing an app using both types of connections.
UCW W
WifiManager manager = getSystemService("WIFI_SERVICE");if(manager.isWifiEnabled()){
HttpURLConnection conn = url.openConnection();conn.connect();// Code for downloading file from the url
}
5.3.2.2 Bluetooth Mutation Operators
Figure 5.4 illustrates a code snippet that searches for paired Bluetooth devices in Android.
Device discovery is a periodic task and since it is a heavyweight procedure, frequent execution
63
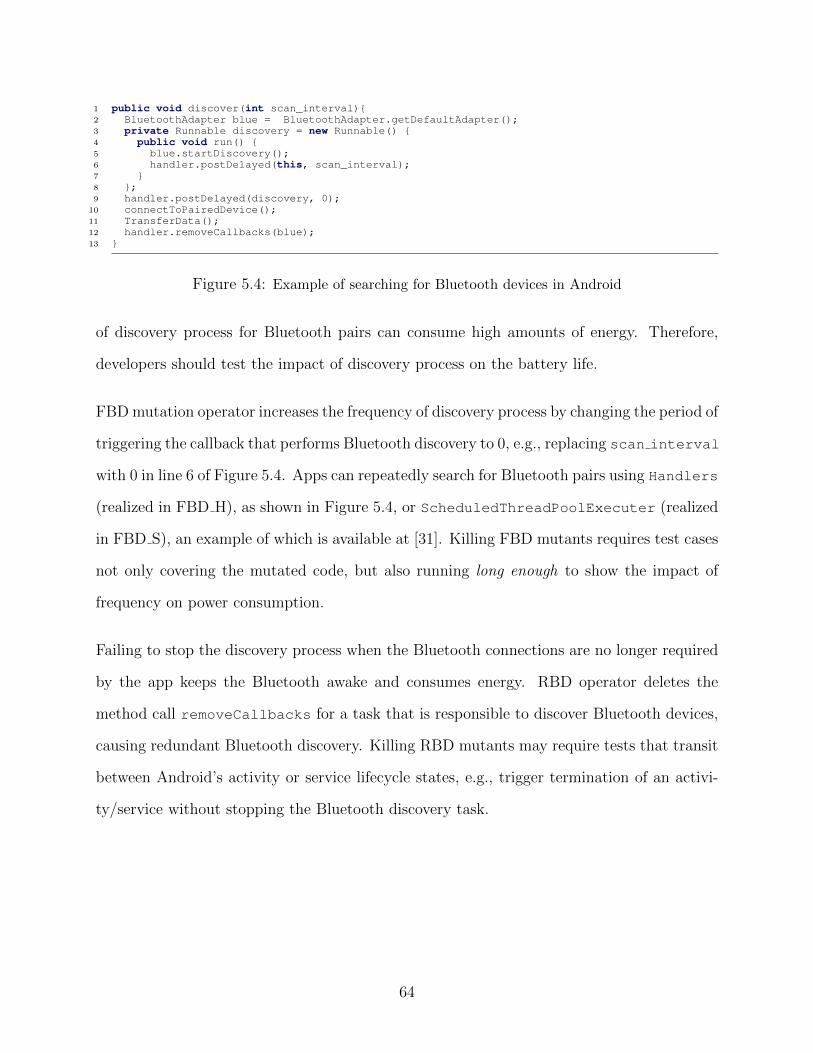
1 public void discover(int scan_interval){2 BluetoothAdapter blue = BluetoothAdapter.getDefaultAdapter();3 private Runnable discovery = new Runnable() {4 public void run() {5 blue.startDiscovery();6 handler.postDelayed(this, scan_interval);7 }8 };9 handler.postDelayed(discovery, 0);
10 connectToPairedDevice();11 TransferData();12 handler.removeCallbacks(blue);13 }
Figure 5.4: Example of searching for Bluetooth devices in Android
of discovery process for Bluetooth pairs can consume high amounts of energy. Therefore,
developers should test the impact of discovery process on the battery life.
FBD mutation operator increases the frequency of discovery process by changing the period of
triggering the callback that performs Bluetooth discovery to 0, e.g., replacing scan interval
with 0 in line 6 of Figure 5.4. Apps can repeatedly search for Bluetooth pairs using Handlers
(realized in FBD H), as shown in Figure 5.4, or ScheduledThreadPoolExecuter (realized
in FBD S), an example of which is available at [31]. Killing FBD mutants requires test cases
not only covering the mutated code, but also running long enough to show the impact of
frequency on power consumption.
Failing to stop the discovery process when the Bluetooth connections are no longer required
by the app keeps the Bluetooth awake and consumes energy. RBD operator deletes the
method call removeCallbacks for a task that is responsible to discover Bluetooth devices,
causing redundant Bluetooth discovery. Killing RBD mutants may require tests that transit
between Android’s activity or service lifecycle states, e.g., trigger termination of an activi-
ty/service without stopping the Bluetooth discovery task.
64

5.3.3 Wakelock Mutation Operators
Wakelocks are mechanisms in Android to indicate that an app needs to keep the device
(or part of the device such as CPU or WiFi) awake. Inappropriate usage of wakelocks can
cause no-sleep bugs [178] and seriously impact battery life and consequently user experience.
Developers should test their apps under different use-case scenarios to ensure that their
strategy of acquiring/releasing wakelocks does not unnecessarily keep the device awake.
Wakelock-related mutation operators delete the statements responsible to release the ac-
quired wakelock. Depending on the component that acquires a wakelock (e.g., CPU or
WiFi), the type of defining wakelock (e.g., PowerManager, WakefulBroadcastReceiver),
and the point of releasing wakelock. We identified and developed support for 8 wakelock-
related mutation operators (details and examples can be found at [31]).
5.3.4 Display Mutation Operators
Some apps, such as games and video players, need to keep the screen on during execution.
There are two ways of keeping the screen awake during execution of an app, namely using
screen flags (e.g., FLAG KEEP SCREEN ON) to force the screen to stay on, or increasing the
timeout of the screen.
Screen flags should only be used in the activities, not in services and other types of compo-
nents [18]. In addition, if an app modifies the screen timeout setting, these modifications
should be restored after the app exits. As an example of display-related mutation operators,
MST adds statements to activity classes to increase the screen timeout to the maximum
possible value. For MST, there is also a need to modify the manifest file in order to add the
permission to modify settings.
MST changes to source code and manifest file
65

Settings.System.putInt(getContentResolver(),"SCREEN_OFF_TIMEOUT", Integer.MAX_VALUE);
<uses-permission android:name="permission.WRITE_SETTINGS"/>
5.3.5 Recurring Callback and Loop Mutation Operators
Recurring callbacks, e.g., Timer, AlarmManager, Handler, and ScheduledThreadPoolExecuter,
are frequently used in Android apps to implement repeating tasks. Poorly designed strat-
egy to perform a repeating task may have serious implications on the energy usage of an
app [34, 21]. Similarly, loop bugs occur when energy greedy APIs are repeatedly, but un-
necessarily, executed in a loop [67, 178].
One of the best practices of scheduling repeating tasks is to adjust the frequency of invocation
depending on the battery status. For example, if the battery level drops below 10%, an
app should decrease the frequency of repeating tasks to conserve the battery for a longer
time. While HFC class of mutation operators unconditionally increases the frequency of
recurring callbacks, BFA operators do this only when the battery is discharging. Therefore,
the BFA mutants can be killed only when tests are run on a device with low battery or the
battery status is mocked. Depending on the APIs that are used in an app for scheduling
periodic tasks, we implemented 8 mutation operators of type BFA. As with some of the other
operators, details and examples can be found at [31].
5.3.6 Sensor Mutation Operators
Sensor events, such as those produced by accelerometer and gyroscope, can be queued in the
hardware before delivery. Setting delivery trigger of sensor listener to low values interrupts
66

1 private SensorEventListener listener;2 private SensorManager manager;3 protected void onCreate(){4 listener = new SensorEventListener();5 manager = getSystemService("SENSOR_SERVICE");6 Sensor acm = manager.getDefaultSensor(7 "ACCELEROMETER");8 manager.registerListener(listener, acm,9 "SENSOR_DELAY_NORMAL", 5*60*1e6);
10 }11 protected void onPause(){12 super.onPause();13 manager.unregisterListener(listener);14 }
Figure 5.5: Example of utilizing sensors in Android
the main processor at highest frequency possible and prevents it to switch to lower power
state. This is particularly so, if the sensor is a wake-up sensor [40]. The events generated
by wake-up sensors cause the main processor to wake up and can prevent the device from
becoming idle.
In the apps that make use of sensors, tests are needed to ensure that the usage of sensors is
implemented in an efficient way. FDSL operator replaces the trigger delay—last parameter in
method registerListener in line 7 of Figure 5.5—to 0, and changes the wake-up property
of the sensor in line 6.
In addition, apps should unregister the sensors properly, as the system will not disable sensors
automatically when the screen turns off. A thread continues to listen and update the sensor
information in the background, which can drain the battery in just a few hours[40]. SLUD
operator deletes the statements responsible for unregistering sensor listeners in an app. For
a test to kill a SLUD mutant, it needs to trigger a change in the state of app (e.g., terminate
or pause the app) without unregistering the sensor listener.
FDSL
Sensor acm = manager.getDefaultSensor("ACCELEROMETER", true);manager.registerListener(listener, acm,
"SENSOR_DELAY_NORMAL", 0);
67
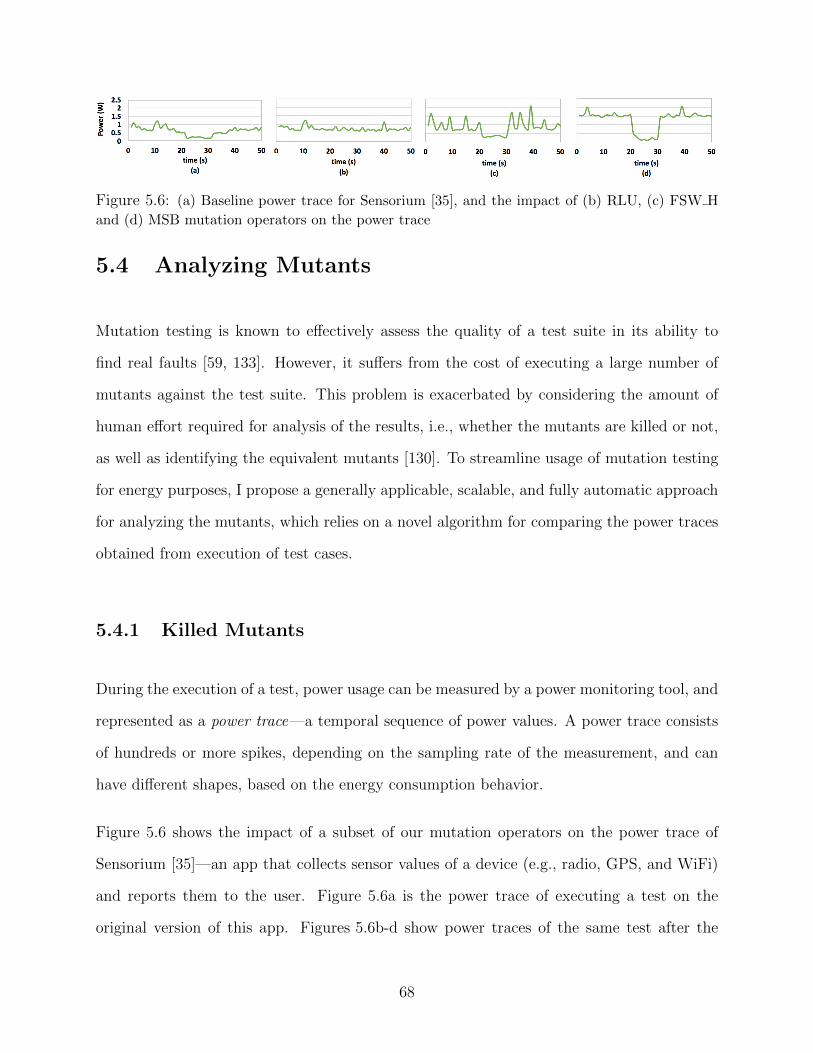
Figure 5.6: (a) Baseline power trace for Sensorium [35], and the impact of (b) RLU, (c) FSW H
and (d) MSB mutation operators on the power trace
5.4 Analyzing Mutants
Mutation testing is known to effectively assess the quality of a test suite in its ability to
find real faults [59, 133]. However, it suffers from the cost of executing a large number of
mutants against the test suite. This problem is exacerbated by considering the amount of
human effort required for analysis of the results, i.e., whether the mutants are killed or not,
as well as identifying the equivalent mutants [130]. To streamline usage of mutation testing
for energy purposes, I propose a generally applicable, scalable, and fully automatic approach
for analyzing the mutants, which relies on a novel algorithm for comparing the power traces
obtained from execution of test cases.
5.4.1 Killed Mutants
During the execution of a test, power usage can be measured by a power monitoring tool, and
represented as a power trace—a temporal sequence of power values. A power trace consists
of hundreds or more spikes, depending on the sampling rate of the measurement, and can
have different shapes, based on the energy consumption behavior.
Figure 5.6 shows the impact of a subset of our mutation operators on the power trace of
Sensorium [35]—an app that collects sensor values of a device (e.g., radio, GPS, and WiFi)
and reports them to the user. Figure 5.6a is the power trace of executing a test on the
original version of this app. Figures 5.6b-d show power traces of the same test after the
68

app is mutated by RLU, FSW H, and MSB operators, respectively. I can observe that these
mutation operators have different impacts on the power trace of the test case.
I have developed a fully-automatic oracle, that based on the differences in the power traces of
a test executed on the original and mutant versions of an app, is able to determine whether
the mutant was killed or not. Algorithm 5.1 shows the steps in our approach.
The algorithm first runs each test, ti, 30 times on the original version of an app, A, and
collects a set of power traces, PA (line 3). The repetition allows us to account for the noise
in profiling. Since our analysis to identify a threshold is based on a statistical approach, I
repeat the execution 30 times to ensure a reasonable confidence interval1.
The algorithm then runs each test ti on the mutant, A′, and collects its power trace ~pA′
(line 4). Alternatively, for higher accuracy, the test could be executed multiple times on the
mutant. However, our experiments showed that due to the substantial overlap between the
implementation of the original and mutant versions of the app, repetitive execution of a test
on the original version of the app already accounts for majority of the noise in profiling.
Following the collection of these traces, the algorithm needs to determine how different is
the power trace of mutant, ~pA′ , in comparison to the set of power traces collected from the
original version of the app, PA. To that end, the algorithm first has to determine the extent
of variation, α, in the 30 energy traces of PA that could be considered “normal” due to the
noise in profiling.
One possible solution to compute this variation is to take their Euclidean distances. However,
Euclidean distance is very sensitive to warping in time series [136]. I observed that power
traces of a given test on the same version of the app could be similar in the shape, but
locally out of phase. For example, depending on the available bandwidth, quality of the
1 According to Central Limit Theorem, by running the experiments at least thirty times, I areable to report the statistical values within a reasonable confidence interval [182].
69

network signal, and response time of the server, downloading a file can take 1 to 4 seconds.
Thereby, the power trace of the test after downloading the file might be in the same shape,
but shifted and warped in different repetitions of the test case. To account for inevitable
distortion in our power measurement over time, I measure the similarity between power
traces by computing the Dynamic Time Warping (DTW) distance between them. DTW is
an approach to measure the similarity between two time series, independent of their possible
non-linear variations in the time dimension [73]. More specifically, DTW distance is the
optimal amount of alignment one time series requires to match another time series.
Given two power traces ~P1 [1 . . . n] and ~P2 [1 . . .m], DTW leverages a dynamic programming
algorithm to compute the minimum amount of alignments required to transform one power
trace into the other. It constructs an n×m matrix D, where D[i, j] is the distance between
~P1 [1 . . . i] and ~P2 [1 . . . j]. The value of D[i, j] is calculated as follows:
D[i, j] = |P1[i]− P2[j] |+ min
D[i− 1, j]
D[i, j − 1]
D[i− 1, j − 1]
(5.1)
The DTW distance between ~P1 and ~P2 is D[n,m]. The lower is the DTW distance between
two power traces, the more similar in shape they are.
To determine α, the algorithm first uses DTW to find a representative trace for A, denoted
as ~rA (line 5). It does so by computing the mutual similarity between 30 instances of power
trace and choosing the one that has the highest average similarity to the other instances.
Once Algorithm 5.1 has derived a representative power trace, it lets α to be the upper bound
of the 95% confidence interval of the mean distances between the representative power trace
70

Algorithm 5.1: Energy-Aware Mutation Analysis
Input: T Test suite, A Original app, A′ MutantOutput: Determine if a mutant is killed or lived
1 foreach ti ∈ T do
2 isKilledi = false;3 PA = getTrace(A, ti, 30);4 ~pA′ = getTrace(A′, ti, 1);5 ~rA = findRepresentativeTrace(PA);6 α = computeThreshold( ~rA, PA \ ~rA);7 distance = computeDistance( ~rA, ~pA′);8 if distance > α then9 isKilledi = true;
and the remaining 29 in PA (line 6). This means that if I run ti on A again, the DTW
distance between its power trace and representative trace has a 95% likelihood of being less
than α different.
Finally, Algorithm 5.1 computes the DTW distance between ~rA and ~pA′ (line 7). If distance
is higher than α, the variation is higher than that typically caused by noise for test ti, and
the mutant is killed; Otherwise, the mutant lives (lines 8- 9).
5.4.2 Equivalent and Stillborn Mutants
An equivalent mutant is created when a mutation operator does not impact the observable
behavior of the program. To determine if a program and one of its mutants are equivalent
is an undecidable problem [75]. However, well-designed mutation operators can moderately
prevent creation of equivalent mutants. Our mutation operators are designed based on the
defect model derived from issue trackers and best practices related to energy. Therefore,
they are generally expected to impact the power consumption of the device.
In rare cases, however, mutation operators can change the program without changing its
energy behavior. For example, the arguments of a recurring callback that identifies the
frequency of invocation may be specified as a parameter, rather than a specific value, e.g.,
scan interval at line 6 of Figure 5.4. If this parameter is initialized to 0, replacing it with
71

0 by µDroid’s FBD operator creates an equivalent mutant. As another example, LRP C
can generate equivalent mutants. LRP C mutants change the provider of location data (e.g.,
first parameter of requestLocationUpdates at line 11 in Figure 5.2) to "GPS". Although
location listeners can be shared among different providers, each listener can be registered for
specific provider once. As a result, if the app already registers a listener for "GPS", LRP C
would create an equivalent mutant.
To avoid generation of equivalent mutants, µDroid employs several heuristics and performs
an analysis on the source code to identify the equivalent mutants. For example, µDroid
performs an analysis to resolve the parameter’s value and compares it with the value that
mutation operator wants to replace. If the parameter is initialized in the program and its
value is different from the replacement value, µDroid generates the mutant. Otherwise, it
identifies the mutant as equivalent and does not generate it.
The Eclipse plugin realizing µDroid is able to recognize stillborn mutants—those that make
the program syntactically incorrect and do not compile. µDroid does so by using Eclipse
JDT APIs to find syntax errors in the working copy of source code, and upon detecting such
errors, it rolls back the changes.
5.5 Evaluation
In this section, I present experimental evaluation of µDroid for energy-aware mutation
testing. Specifically, I investigate the following five research questions:
RQ1. Prevalence, Quality, and Contribution: How prevalent are energy-aware mutation op-
erators in real-world Android apps? What is the quality of energy-aware mutation
operators? What is the contribution of each mutant type to the overall mutants gen-
erated by µDroid?
72

RQ2. Effectiveness : Does µDroid help developers with creating better tests for revealing
energy defects?
RQ3. Association to Real Faults : Are mutation scores correlated with test suites’ ability in
revealing energy faults?
RQ4. Accuracy : How accurate is µDroid’s oracle in determining whether tests kill the energy
mutants or not?
RQ5. Performance: How long does it take for µDroid to create and analyze the mutants?
5.5.1 Experimental Setup and Implementation
Subject Apps: To evaluate µDroid in practice, I randomly collected 100 apps from sev-
enteen categories of F-Droid open-source repository. I then selected a subset of the subject
apps that satisfied the following criteria: (1) I selected apps for which µDroid was able
to generate at least 25 mutants and the generated mutants belonged to at least 3 different
categories identified in Table 5.1. (2) I further reduced the apps to a subset for which I was
able to find at least one commit related to fixing an energy defect in their commit history.
(3) Finally, to prevent biasing our results, I removed apps that were among the 59 apps
I studied to derive the energy defect model, and eventually our operators. At the end, I
ended up with a total of 9 apps suitable for our experiments. µDroid injected a total of
413 energy-aware mutation operators in these apps, distributed among them as shown in
Table 5.2.
Mutant Generation: I used µDroid to generate energy mutants. Our Eclipse plugin is
publicly available [31] and supports both first-order and higher-order mutation testing [129].
It takes the source code of the original app, parses it to an AST, traverses the AST to
find the patterns specified by mutation operators, and creates a mutant for each pattern
73

found in the source code. For an efficient traversal of the AST, the plugin implements
mutation operators based on the visitor pattern. For example, instead of traversing all nodes
of the AST to mutate one argument of a specific API call mentioned in the pattern, I only
traverse AST nodes of type MethodInvocation to find the API call in the code and mutate
its argument. In addition to changes that are applied to the source code, some mutation
operators require modification in the XML files of the app. For instance, mutation operators
MST and UCW C add statements to the source code to change phone or WiFi settings,
requiring the proper access permissions to be added to the app’s manifest file.
Additionally, I compare energy mutants generated by µDroid with mutants generated by
Major [132] and the Android mutation framework developed by Deng et al. [91].2
Power Measurement: The mobile device used in our experiments was Google Nexus 6,
running Android version 6.0.1. To profile power consumption of the device during execution
of test cases, I used Trepn [71]. Trepn is a profiling tool developed by Qualcomm that collects
the exact power consumption data from sensors embedded in the chipset. Trepn is reported
to be highly accurate, with an average of 2.1% error in measurement [42].
Test Suites: I used two set of reproducible tests to evaluate µDroid. The first set includes
tests in Robotium [44] and Espresso [10] format written by mobile app developers, and the
second set includes random tests generated by Android Monkey [45]. Both set of tests are
reproducible to ensure I are running identical tests on both original and mutant versions of
the app.
Faults: To evaluate the association between mutation score and fault detection ability of
test suites, I searched the issue tracker and commit history of the subject apps to find the
commits related to fixing energy-related faults. As shown in Table 5.2, I was able to isolate
and reproduce 18 energy-related faults for the subject apps.2I was not able to use PIT [43], as PIT does not support Android and its mutants are held only
in memory, which prevented us from building the mutant APKs.
74

Tab
le5.
2:T
est
suit
esan
dm
uta
nts
gener
ated
for
sub
ject
apps.
Ap
ps
LoC
Fau
lts
Mu
tants
Tes
tS
uit
esµDroid
Ma
jor
[132
]D
eng
etal
.[9
1]#
Tes
tsM
uta
nt
Cov
erag
eM
uta
tion
Sco
re#
[132
]-d
up
[91]
-du
p#
#Ti
Te
Ti
Te
Ti
Te
DS
ub
43,
032
131
10%
0%19
,411
1539
2434
63%
83%
19%
71%
Op
enb
map
31,
408
346
13%
4%3,
374
460
2133
79%
97%
32%
93%
aMet
ro26,
868
159
3%
0%13
,419
1,10
226
3877
%94
%37
%88
%G
Tal
k17,
834
342
12%
0%4,
505
336
3042
73%
95%
28%
95%
Ush
ah
idi
16,
470
186
2%
5%4,
682
368
2638
62%
97%
37%
97%
Op
enC
amer
a15,
064
132
17%
6%16
,717
142
3244
72%
100%
60%
96%
Jam
end
o8,
709
140
8%
3%3,
599
645
1829
88%
93%
33%
88%
a2d
p.V
ol
6,67
04
28
4%
4%4,
682
214
2534
96%
96%
32%
95%
Sen
sori
um
3,22
83
49
18%
0%1,
589
268
2835
84%
93%
33%
91%
Tab
le5.
3:M
uta
tion
anal
ysi
sof
each
clas
sof
muta
tion
oper
ator
sfo
rsu
bje
ctap
ps.
Op
erato
rID
LUF
LRP
RLU
LKL
WRDC
WRDW
HPW
FCC
FSW
RWS
UCW
LTC
DRD
MST
LBC
MSB
UAB
FDB
RBD
HFC
RRC
RAF
BFA
ILI
SLUD
FDSL
Tot
al
27
52
28
65
34
111
126
113
4644
483
11
1613
130
204
8E
qu
ival
ent
019
00
00
00
00
00
00
70
00
03
00
40
00
Con
trib
uti
on%
712
71
11
13
<1
<1
63
111
1112
1<1
<1
43
<1
75
12
Ti
Kil
led
12
24
03
00
00
10
08
00
1434
01
013
00
012
08
Ali
ve15
928
35
34
110
126
33
4623
143
01
013
126
84
0
Te
Kil
led
26
33
26
64
31
111
120
93
4628
443
11
1112
024
174
8A
live
10
20
10
00
00
62
00
94
00
02
11
23
00
75

5.5.2 RQ1: Prevalence, Quality, and Contribution
To understand the prevalence of energy-aware mutation operators, I first applied µDroid
on the 100 subject apps described in Section 5.5.1. I found that µDroid is able to produce
energy mutants for all programs, no matter how small, ranging from 5 to 110, with an average
of 28 mutants. This shows that all apps can potentially benefit from such a testing tool.
Table 5.2 provides a more detailed presentation of results for 9 of the subject apps, selected
according to the criteria described in Section 5.5.1. Here, I also compare the prevalence of
energy-aware operators with prior mutation testing tools, namely Major [132], and Android
mutation testing tool of Deng et al. [91]. The result of this comparison is shown in Ta-
ble 5.2. Overall, µDroid generates much fewer mutants compared to other tools, which is
important given the cost of energy mutation testing, e.g., the need to run and collect energy
measurements on resource-constrained devices. In total, µDroid generates 413 mutants for
the subject apps, thereby producing 99% and 92% less mutants than Major and Deng et al.,
respectively. Spearman’s Rank Correlation between the prevalence of energy-aware mutants
and mutants produced by other tools suggests that there is no significant monotonic rela-
tionship between them: Major (ρ = −0.28) and Deng et al. (ρ = 0.2) with significance level
p < 0.01. This is mainly due to the fact that µDroid targets specific APIs, Android-specific
constructs, and other resources, such as layout XML files, that are not considered in the
design of mutation operators in other tools.
Furthermore, I calculated the number of µDroid mutants that are duplicate of mutants
produced by the other tools. Table 5.2 presents the percentage of duplicate energy-aware
mutants under the dup columns. Due to the large number of mutants generated by other
tools, I used Trivial Compiler Equivalent (TCE) technique [176] to identify a lower bound for
duplicate mutants. TCE is a scalable and effective approach to find equivalent and duplicate
mutants by comparing the machine code of compiled mutants. In addition to compiled
76

classes, I also considered any difference in the XML files of the mutants, as µDroid modifies
layout and manifest files to create a subset of mutants. On average, only 9% and 2% of
mutants produced by µDroid are duplicates of the mutants produced by Major and Deng
et al., respectively. These results confirm that µDroid is addressing a real need in this
domain, as other tools are not producing the same mutants.
Table 5.3 also shows the contribution of each class of energy-aware mutation operators for
subject apps. Display-related mutation operators have the highest contribution (34%), fol-
lowed by Location-related (27%), Connectivity-related (16%), and Recurring-related (16%)
mutation operators. Wakelock-related (3%) and Sensor-related (3%) oeprators have less
contribution. These contributions are associated to the power consumption of hardware
components, since display, GPS, WiFi, and radio are reported to consume the highest por-
tion of device battery [11]. Finally, µDroid generates no stillborn mutants, and only 8% of
all the mutants were identified to be equivalent, as shown in Table 5.3.
To summarize, the results from RQ1 indicate that (1) potentially all apps can benefit from
such a testing tool, as µDroid was able to generate mutants for all 100 subject apps, (2) the
small number of mutants produced by µDroid makes it a practical tool for energy-aware
mutation testing of Android, (3) the great majority of energy-aware mutation operators are
unique and the corresponding mutants cannot be produced by previous mutation testing
tools, and (4) all operators incorporated in µDroid are useful, as they were all applied on
the subject apps, albeit with different degrees of frequency.
5.5.3 RQ2: Effectiveness
To evaluate whether µDroid can help developers to improve the quality of test suites, I
asked two mobile app developers, both with substantial professional Android development
experience at companies such as Google, to create test suites for validating the energy behav-
77

ior of 9 subject apps. These initial test suites, denoted as Ti, contained instrumented tests
to exercise the app under various scenarios. Tables 5.2 and 5.3 show the result of running
Ti on the subject apps. As I can see, while the initial test suites are able to execute the
majority of mutants (high mutant coverage values on Table 5.2), many of the mutants stay
alive (low mutation score on Table 5.2).
The fact that so many of the mutants could not be killed, prompted us to explore the
deficiencies in initial test suites with respect to alive mutants. I found lots of opportunities
for improving the initial test suites, such as adding tests with the following characteristics:
• Exercising sequences of activity lifecycle: Wakelocks and other resources such as
GPS are commonly acquired and released in lifecycle event handlers. Therefore, the
only way to test the proper management of resources and kill mutants such as RLU,
WRDW, WRDC, and MST, is to exercise particular sequence of lifecycle callbacks.
Tests that pause or tear-down activities and then resume or relaunch an app can help
with killing such mutant.
• Manipulate network connection: A subset of network-related mutation operators,
namely FCC, UCW, HPW, and RWS, only change the behavior of the app under
peculiar network connectivity. For example, FCC can be killed only when there is no
network connectivity, and HPW can be killed by testing the app under a poor WiFi
signal condition. Tests that programmatically manipulate network connections are
generally effective in killing such mutants.
• Manipulate Bluetooth or battery status: None of the UAB, RBD, and BFA
mutants were killed by the initial test suites. That is mainly due to the fact that
the impact of such mutants is only observable under specific status of Bluetooth and
battery. For example, BFAs change the behavior of an app only when the battery is
low, requiring tests that can programmatically change or emulate the state of such
components.
78

• Effectively mock location: Location-based mutants can be killed by mocking the
location. Although changing the location once may cover the mutated part, effectively
killing the location mutants, specifically LUF, requires mocking the location several
times and under different speeds of movement.
• Longer tests: Some mutants, namely LBC, LTC, and RAF, can be killed only if the
tests run long enough for their effect to be observed. For example, if the test tries to
download a file and terminates immediately, the impact of LTC forcing an app to wait
for a connection being established is not observable on the power trace.
• Repeating tasks: A subset of mutants are not killed unless a task is repeated to
observe the changes. For example, DRD mutants are only killed if a test tries to
download a file multiple times.
I subsequently asked the subject developers to generate new tests with the aforementioned
characteristics, which together with Ti, resulted in an enhanced test suite Te for each app. As
shown in Tables 5.2 and 5.3, Te was able to kill substantially more mutants in all apps. These
results confirm the expected benefits of µDroid in practice. While Ti achieves a reasonable
mutant coverage (80% on average among all subject apps), it was not able to accomplish
high mutation score (35% on average). This demonstrates that µDroid produces strong
mutants (i.e., hard to kill), thereby effectively challenging the developers in designing better
tests.
It is worth noting that even our enhanced test suites were not effective against 14% of the
mutants: about 8% of the mutants were equivalent, thus not changing the observable energy
behavior of the program, while another 6% could not be killed. For instance, I was not
able to kill LRP mutants in a2dp.Vol and aMetro apps. By investigating the source code
and behavior of these apps, I found that accessing the LocationManager and requesting
for location updates are performed in a short-lived service or activity, thereby the impact
of mutation operators on the power trace is negligible and can not be detected by µDroid.
79

Similarly, our test suite was not able to kill the RAF mutant and a subset of RRC mutants.
These mutants comment out statements that unregister callback methods of an app, such
as that shown in line 12 of Figure 5.4. As the frequency of recurring callbacks was low for
a subset of subject apps (e.g., a Handler callback in Sensorium app was invoked every 30
seconds), they required test cases running for several minutes to show the impact on power
trace.
Furthermore, running the enhanced test suites on the 9 subject apps, I was able to find 15
previously unknown energy bugs. After reporting them to the developers, 11 of them have
been confirmed as bugs by the developers and 7 of them have been fixed, as corroborated by
their issue trackers [14, 15, 16, 17, 24, 25, 26, 27, 28, 29, 30, 38, 39, 36, 37].
5.5.4 RQ3: Association to Real Faults
If mutation score is a good indicator of a test suite’s ability in revealing energy bugs, one
would expect to be able to show a statistical correlation between the two. Since calculating
such a correlation requires a large number of test suites per fault, I first generated 100
random tests for each app using Android Monkey [45]. For each app, I randomly selected 20
tests from its test suite (consisting of both random and developer-written tests mentioned
in the previous section) and repeated the sampling 20 times. That is, in the end, for each
subject app I created 20 test suites, each containing 20 tests from a pool of random and
developer-written tests.
I then ran each test suite against the 9 subject apps, and marked them as Tfail, if the test
suite was able to reveal any of its energy faults, or Tpass, if the test suite was not able to
reveal any of its energy faults. To avoid bias, in this experiment I did not consider the energy
faults found by us, rather focused on those that had been found and reported previously. For
each Tfail and Tpass, I computed the mutation score of the corresponding test suite. Finally,
80

for each fault, I constructed test suite pairs of 〈Tfail, Tpass〉 and computed the difference in
their mutation score, which I refer to as mutation score difference (MSD).
Among a total of 1,257 pairs of 〈Tfail, Tpass〉 generated for 18 faults, Tfail was able to attain
a higher mutation score compared to Tpass in 77% of pairs. Furthermore, to determine the
strength of correlation between mutation kill score and fault detection, I used one sample
t-test, as MSD values were normally distributed and there were no outliers in the dataset
(verified with Grubbs’ test). Our null hypothesis assumed that the average of the MSD
values among all pairs equals to 0, while the upper tailed alternative hypothesis assumed
that it is greater than 0. The result of one sample t-test over 1,257 pairs confirmed that
there is a statistically significant difference in the number of mutants killed by Tfail compared
to Tpass (p-value = 9.87E-50 with significance level p < 0.0001). Small p-value and large
number of samples confirm that the results are unlikely to occur by chance. Note that I
removed equivalent and subsumed mutants for MSD calculation to avoid Type I error [175].
5.5.5 RQ4: Accuracy of Oracle
To assess the accuracy of the µDroid’s oracle, I first manually built the ground-truth by
comparing the shape of power traces for each original app and its mutants. To build the
ground truth, I asked the previously mentioned developers to visually determine if power
traces of the original and mutant versions are similar. Visually comparing power traces for
similarity in their shape, even if they are out of phase (i.g., shifted, noisy), is an easy, albeit
time consuming, task for humans. In case of disagreement, I asked a third developer to
compare the power traces.
For each mutant, I only considered tests that executed a mutated part of the program, but
not necessarily killed the mutant, and calculated false positive (if the ground-truth identifies
a mutant as alive, while oracle considers it as killed), false negative (if the ground-truth
81

Table 5.4: Accuracy of µDroid’s oracle on the subject apps.
Apps Accuracy Precision Recall F-measure
DSub 95% 95% 97% 96%Openbmap 91% 94% 91% 92%aMetro 92% 90% 100% 95%GTalk 93% 97% 93% 95%Ushahidi 94% 97% 94% 95%OpenCamera 95% 100% 94% 97%Jamendo 100% 100% 100% 100%a2dp.Vol 91% 100% 98% 94%Sensorium 93% 91% 100% 95%
Average 94% 96% 96% 95%
identifies a mutant as killed, while oracle considers it as alive), true positive (if both agree a
mutant is killed), and true negative (if both agree a mutant is alive) metrics.
Table 5.4 shows the accuracy of µDroid’s oracle for the execution of all tests in Te on all the
subject apps. The results demonstrate an overall accuracy of 94% for all the subject apps.
Additionally, I observed an average precision of 96% and recall of 96% for the µDroid’s
oracle. I believe an oracle with this level of accuracy is acceptable for use in practice.
5.5.6 RQ5: Performance
To answer this research question, I evaluated the time required for µDroid to generate a
mutant as well as the time required to determine if the mutant can be killed. I ran the
experiments on a computer with 2.2 GHz Intel Core i7 processor and 16 GB DDR3 RAM.
To evaluate the performance of the Eclipse plugin that creates the mutants, I measured the
required time for analyzing the code, finding operators that match, and applying the changes
to code. From Table 5.5, I can see that µDroid takes less than 0.5 second on average to
create a mutant, and 11.7 seconds on average to create all the mutants for a subject app.
To evaluate the performance of oracle, I measured the time taken to determine if tests have
killed the mutants. Table 5.5 shows the time taken to analyze the power trace of all tests
from Te executed on all mutant versions of the subject apps. From these results I can see
82

Table 5.5: Performance analysis of µDroid on the subject apps.
AppsTime (s)
Pearson’s rTotal Per Mutant Analysis Per Test
DSub 27.3 1.0 20.74 0.61 0.91Openbmap 15.9 0.6 28.05 0.85 0.97aMetro 14.7 0.4 60.08 1.6 0.94GTalk 18.4 0.8 40.74 0.97 0.92Ushahidi 8.1 0.2 50.34 1.43 0.95OpenCamera 5.8 0.3 16.28 0.37 0.96Jamendo 9.3 0.4 16.24 0.56 0.94a2dp.Vol 3.5 0.2 19.38 0.57 0.94Sensorium 3.2 0.1 18.2 0.52 0.9
Average 11.7 0.4 30.5 0.83 -
that the oracle runs fast; it is able to make a determination as to whether a test is able to
kill all of the mutants for one of our subject apps in less than a few seconds. The analysis
time for each test depends on the size of power trace, which depends on the number of power
measurements sampled during the test’s execution. To confirm the correlation between
analysis time and the size of power trace, I computed their Pearson Correlation Coefficient,
denoted with Pearson’s r in Table 5.5. From the Pearson’s r values, I can see there is a
strong correlation between analysis time and the size of power trace among all subject apps.
5.6 Discussion
Naturally, prior to releasing apps, developers need to test them for energy defects. Yet,
there is a lack of practical tools and techniques for energy testing. µDroid, is a framework
for energy-aware mutation testing of Android apps to address this issue. The novel suite of
mutation operators implemented in µDroid is designed based on an energy defect model,
constructed through an extensive study of various sources (e.g., issue trackers, API documen-
tations). µDroid provides an automatic oracle for mutation analysis that compares power
traces collected from execution of tests to determine if mutants are killed. The experiences
83

with µDroid on real-world Android apps corroborate its ability to help the developers eval-
uate the quality of their test suites for energy testing. µDroid challenges the developers to
design tests that are more likely to reveal energy defects.
84

Chapter 6
Energy-Aware Test Input Generation
The utility of a smartphone is limited by its battery capacity and the ability of its hardware
and software to efficiently use the device’s battery. To properly characterize the energy
consumption of an app and identify energy defects, it is critical that apps are properly
tested, i.e., analyzed dynamically to assess the app’s energy properties. However, currently
there is a lack of testing tools for evaluating the energy properties of apps. This chapter
presents Cobweb, a search-based energy testing technique for Android. By leveraging a
set of novel models, representing both the functional behavior of an app as well as the
contextual conditions affecting the app’s energy behavior, Cobweb generates a test suite
that can effectively find energy defects. In addition, the proposed technique is superior over
prior technique in finding a wider and more diverse set of energy defects.
6.1 Introduction
Improper usage of energy consuming hardware elements, such as GPS, WiFi, radio, Blue-
tooth, and display, can drastically discharge the battery of a mobile device. Recent studies
85

have shown energy to be a major concern for both users [196] and developers [162]. In spite
of that, many mobile apps are abound with energy defects. This can be attributed to the
lack of tools and methodologies for energy testing [162]. Recent advancements in mobile
app testing have mostly focused on testing functional correctness of programs, which may
not be suitable for revealing energy defects [125]. There is, thus, an increasing demand for
solutions to assist developers in testing energy behavior of apps prior to their release.
The first step toward energy testing is to understand the properties of tests that are effective
in revealing energy defects in order to automatically generate such tests. Recently, Jabbar-
vand et al. [125] proposed a technique based on mutation testing to identify the properties
of proper tests for energy testing. They showed that to kill the energy mutants, tests need
to be executed under a variety of contextual settings. Based on the results of their study, I
have identified three contextual factors that are correlated to energy defects and should be
considered in energy-driven testing: (1) Lifecycle Context: A subset of energy defects,
e.g., wakelocks and resource leaks, manifest themselves under specific sequences of lifecy-
cle callbacks; (2) Hardware State Context: Some energy defects happen under peculiar
hardware states, e.g., poor network signal, no network connection, or low battery; and (3)
Interacting Environment Context: Certain energy defects manifest themselves under
specific interactions with the environment—consisting of user, backend server, other apps,
and connected devices such as smartwatches.
None of the prior automated Android testing techniques properly consider these contextual
factors in test generation [85, 125], thereby are not able to effectively test the energy behavior
of apps. That is, majority of the state-of-the-art Android testing tools [56, 64, 84, 208, 111,
159, 171, 164, 190, 211, 188] are aimed for GUI testing, which only considers the inputs
directly generated by user, e.g., clicking on a button. Even among the techniques that go
beyond GUI testing [156, 212], there is no systematic approach for altering the lifecycle of
components and state of hardware elements to properly evaluate the energy behavior of apps.
86

This chapter presents Cobweb, an energy testing technique for Android apps. Cobweb uses
an evolutionary search strategy with an energy-aware genetic makeup for test generation. By
leveraging a set of novel models, representing lifecycle of components and states of hardware
elements on the phone, Cobweb is able to generate tests that execute the energy-greedy
parts of the code under a variety of contextual conditions. Extensive evaluation of Cobweb
using real-world Android apps with confirmed energy defects demonstrates not only its ability
to effectively and efficiently test energy behavior of apps, but also its superiority over prior
techniques by finding a wider and more diverse set of energy defects.
This chapter shows the following contributions for the proposed technique:
• A search-based evolutionary technique with a novel, energy-aware genetic makeup that
considers both app and the execution context to generate system tests for Android apps
to effectively and efficiently test their energy behavior.
• A set of novel, generic models that represent different states of hardware components
on a phone, making the approach and produced test suites device independent.
• A practical Android testing tool, Cobweb, which is publicly available [31].
• Empirical evaluation of the proposed approach on real-world Android apps demon-
strating its effectiveness, efficacy, and scalability.
The remainder of this Chapter is organized as follows. Section 7.2 introduces an illustrative
example that is used to describe our research. Section 7.3 provides an overview of our
approach, while Sections 6.4-6.5 describe the details. Section 7.7 presents the evaluation
results.
87

Welcome to MyTrackerDownload Maps
Download MapsTorontoVancouverMontreal
From:To:
Start
Enter Location:
Find by Internet
Find by GPS
MainActivity
MapSearchActivity
LocationActivity TrackingActivity
Stop
Internet Service
GPS Service
Montreal Montreal
Download Service
Figure 6.1: MyTracker Android Application
6.2 Illustrative Example
As an illustrative example, I use an Android app called MyTracker [22]. In this section, I
describe two main functionalities of MyTracker, two tests to exercise these functionalities,
and two energy defects in this app that cannot be caught by tests that do not take execution
context into account.
App: As shown in Figure 6.1, MyTracker allows users to search for the map of different
locations using either the internet or GPS, download them, and navigate through each specific
downloaded map. This app consists of seven components, i.e., four Activities and three
Services. MyTracker provides two functionalities: tracking/navigation and search/download
map.
88

Sequence 2: <MainActivity<onCreate, onItemClick(“Montreal”)>, LocationActivity<onCreate, enterText(“airport”), enterText(“conference”), onClick(“Start”)>, TrackingActivity<onCreate, onLocationChanged(“location1”), onClick(“Stop”)>>
Sequence 1: <MainActivity<onCreate, onClick(“Download Maps”)>, MapSearchActivity<onCreate, enterText(“Ottawa”), onClick(“Find by Internet”)>, InternetService<onStartCommand, searchOnServer, startService(“DownloadService”)>,DownloadService<onStartCommand, startDownload, onDownloadComplete>>
Figure 6.2: Event sequences for testing the tracking/navigation and search/download functionali-ties of MyTracker
When a user clicks on the Download Maps button, the app navigates to MapSearchActivity,
where the user can search for maps using the Internet or GPS. If the user decides to search
using the Internet, she needs to provide the name of the city, e.g., Ottawa, and then click on
the Find by Internet button. Otherwise, she can just click on the Find by GPS button.
Depending on the selected search option, the app starts InternetService or GPSService
in the background, which searches for the map on a specific server. Upon finding a match
with the name provided by user or location coordinates, DownloadService downloads the
map, resulting in the list of maps displayed on MainActivity to be updated.
For tracking, once the user clicks on one of the downloaded maps in MainActivity, e.g.
the map of Montreal shown in Figure 6.1, the app navigates to LocationActivity. In this
activity, the user can see the map of Montreal and provide a source and destination address
to start the navigation. By clicking on the Start button, the app starts TrackingActivity
and registers a location listener, which updates the GUI of TrackingActivity upon move-
ment.
Tests: Android tests can be represented as a sequence of events, where each event is an
input to the app and can be triggered by the user or system. I formally define each test t
in test suite T , as 〈c1〈e1, . . . , ep1〉, . . . , cm〈e1, . . . , epm〉〉, where ci indicates the ith component
covered during the execution of t. The execution of each component ci, which could be
Activity, Service, or Broadcast Receiver, by test t is represented as an event sequence, where
each event is denoted as e. I consider two types of events: (1) input events that take inputs
89

using specific APIs, e.g., filling a text box, and (2) callback events that are invocation of
Android callbacks, e.g., click on a button or transition to a lifecycle state. Figure 6.2 shows
representation of two tests according to this formalism that target the two functionalities of
MyTracker app. I use these tests throughout this chapter for illustrating our approach.
Energy Defects: MyTracker suffers from two energy defects:
1) Fail to check connectivity energy defect [125] occurs when an app fails to check for
connectivity before performing a network operation. MyTracker unnecessarily searches for
a network signal when there is no network connection available, which is a power draining
operation. To find this energy defect, MyTracker should be tested both when there is a
network connection available and not. The test corresponding to Sequence 1 in Figure 6.2
does not enable or disable network connectivity, therefore, cannot detect this defect.
2) MyTracker starts listening to location updates in TrackingActivity by registering a
location listener for GPS. As long as TrackingActivity is visible to the user and GUI is
rendered based on location updates, MyTracker can keep the GPS active. However, when
user puts the app in the Paused state, i.e., MyTracker is sent to background, it does not
unregister the location listener, thereby, unnecessarily updates a GUI that is not visible to
the user [19, 149]. To find this energy defect, a test needs to put TrackingActivity into
paused state for some time to assess utilization of GPS hardware in this state. Clearly, the
test corresponding to Sequence 2 in Figure 6.2 does not have this property.
6.3 Approach Overview and Challenges
Since the domain of events and inputs for android apps is quite large, Cobweb follows a
search-based testing technique for input generation. Every search-based testing technique
has three facets: (1) search space, which is a set of possible solutions, (2) meta-heuristics to
90

Mod
el E
xtra
ctor
Test
Gen
erat
or
Fitness Evaluation
Test Execution
PopulationOffspringsTest Suite
Minimization
Test Suite
App
CTG HSM LSMCG
Figure 6.3: Cobweb Framework
guide the search through the search space, and (3) evaluation metrics to measure the quality
of potential solutions.
Cobweb identifies the search space as a set of event sequences, i.e., system tests. To guide
the search through the search space, our approach utilizes an evolutionary algorithm to
globally search for an optimal solution. Similar to other search-based techniques, Cobweb
relies on the abstract representation of the program, i.e., models, to generate event sequences
and compute the fitness function as an evaluation metric. However, a key novelty of Cobweb
is that unlike prior search-based testing techniques, it also utilizes several other contextual
models, representing the state of hardware and environment, in the search process.
Figure 6.3 provides an overview of Cobweb, consisting of two major components: (1)
Model Extractor component that derives the required models for test generation; and (2)
Test Generator component that utilizes an evolutionary search-based technique to create
system tests. Cobweb’s fitness function rewards the tests based on two criteria: (1) how
close they are to covering energy-greedy APIs in the application logic, and (2) how well they
contribute to exercising different contextual factors. There are three main challenges that
Cobweb should overcome:
91

Invalid or useless tests: The order of events is important for exercising specific behaviors
in apps. For example, a common approach to test whether an app like MyTracker is properly
utilizing GPS is to mock location/movement. However, mocking can only produce a callback
on the app if the app under test has already registered a location listener. Otherwise,
mocking the location is useless, as it cannot test the usage of GPS by the app. In addition,
prior research has shown genetic operations, such as cross over, may produce many invalid
event sequences that fail to execute [159]. To reduce the generation of invalid or useless
tests, Cobweb relies on two models representing the app’s functional behavior, namely
Component Transition Graph (CTG) and Call Graph (CG).
Contexual factors: In addition to the models that represent the app’s functional behavior,
further models are required to take the execution context into account during test generation.
Cobweb uses two additional models, namely Lifecycle State Machine (LSM) and Hardware
State Machine (HSM) to account for contextual factors.
Scalability: Search-based techniques are susceptible to generation of large number of
tests [113, 114], which can pose a scalability barrier due to the time consuming fitness
evaluation. Although fitness evaluation can be performed in parallel [78, 61], it entails usage
of distributed devices or special multi-core PCs. The majority of mobile apps are developed
at a nominal cost by entrepreneurs that do not have such resources. To tackle the scalability
issue during test generation, Cobweb generates intermediate tests in the form of Robolectirc
tests [33], which can be executed atop JVM very fast. The final test suite is transformed to
Espresso [10] tests that can be executed on emulator or mobile devices.
92

6.4 Model Extractor
Cobweb uses four types of models: Component Transition Graph (CTG), Call Graph (CG),
Lifecycle State Machine (LSM), and Hardware State Machine (HSM). Figure 6.4 shows a
subset of these models for MyTracker app. At the highest-level is the CTG model, which
represents the components comprising the app as nodes and the Intents as transitions among
the nodes. Intents are Android events (messages) that result in the execution flow to move
from one component to a different component. Each node of the CTG in turn contains
one CG—representing the internal behavior of the corresponding software component, one
LSM—representing the possible lifecycle states of the corresponding software component,
and zero or more HSM—each of which represents the states of an energy-greedy hardware
element utilized during the execution of the corresponding software component. LSM and
HSM models are generic and app/device independent, constructed manually by the authors,
while CTG and CG models are app-specific and automatically extracted through static
analysis of an app’s bytecode. I describe each model and how it is obtained in the remainder
of this section.
6.4.1 Component Transition Graph (CTG)
Cobweb utilizes CTG to ensure generation of valid and useful event sequences. Events can
be categorized into (1) input events that take inputs to the app using specific APIs, e.g.,
EditText.getText() that reads a string provided by user for a text box, and (2) callback
events that invoke Android callbacks, e.g., onLocationChanged(), which is invoked when
the physical location of the device changes.
Cobweb uses CTG model of the app under test to generate the proper order of event calls.
Finding the proper order of event call invocations is particularly a challenge in Android due
93

MapSearchActivity
MainActivity
*InternetService
*GPSService
LocationActivity
*TrackingActivity
*DownloadService
ConnectedNot Utilized
(Poor Signal)
Disconnected
ConnectedNot Utilized(Full Signal)
Scanning Locked
Utilized(Poor Signal)
Utilized(Full Signal)
HSM
Intent transition
Registration transition
Call transition
Lifecycle transition Stopped
Running
Paused
onDestroy()
onCreate()onStart()
onResume()
onStart()
onRestart()onResume()
onStop()
onPause() onResume()
OnStartCommand()
*startDownload()
onDownloadComplete()
CG LSM
LSM
*onProvider
Enabled()
*onLocation
Changed()
*onStatus
Changed()
*onProvider
Disabled()
onClick()
onCreate()
CGHSM
CTGLegend
Stopped
Idle
Running
onCreate()
onUnbind()
onBind()onStartCommand()
onDestroy()stopSelf()
Destroyed
Enabled Utilized Speed Changed
Location Changed
Availability Changed
Accuracy Changed
Disabled
Figure 6.4: CTG model for MyTracker. Gray boxes show the detailed CG, LSM, and HSM ofDownloadService and TrackingActivity components. Components marked with an asterisk containenergy-greedy API invocations
94

to usage of callbacks, each considered a possible entry point for an application. For exam-
ple, onLocationChanged() callback is an entry point for MyTracker app. The call graph
obtained from running the state-of-the-art static analysis tools, such as Soot [192], does not
model any particular order for the execution of entry points. That is, using such call graphs
to generate event sequences, onLocationChanged() can appear before the onCreate() of
TrackingActivity or even onCreate() of MainActivity. However, proper invocation
of onLocationChanged() is after the execution of onCreate() of TrackingActivity,
as shown in Sequence 2 of Figure 6.2.
Furthermore, to properly test the energy behavior of MyTracker with respect to its track-
ing functionality, Cobweb needs to mock the location, such that Android platform in-
vokes onLocationChanged() callback. The tricky part of generating such tests is that
onLocationChanged() callback should only be invoked if the app has already registered
a location listener to receive location updates, which happens in the onCreate() method
of TrackingActivity component. In other words, mocking the location should be per-
formed after TrackingActivity starts. Otherwise, mocking has no effect and will not
result in the invocation of onLocationChanged() callback. Generating valid and useful
events entails not only an inter-procedural analysis—to find the proper component for call-
back invocation—but also requires considering the specific types of dependencies among
events. To overcome these challenges, CTG considers five types of transitions:
1- Call transition: These intra-component transitions are inferred from the basic call graph
generated for the app under test using Soot [192].
2- Intent transition: These transitions are inter-component, which result in transferring
the control from one component to another component. A method or callback inside one
component that starts another component is connected to the lifecycle entry point of that
component using this kind of transition. Cobweb uses IC3 [172] to infer Intent transitions.
95

3- GUI transition: These intra-component transitions indicate the order of execution be-
tween GUI widgets. For example, the Start button in the LocationActivity of MyTracker
should be clicked after user provides source and destination addresses in the From and To
text boxes. Cobweb builds on top of TrimDroid [171] to infer such transitions.
4- Registration transition: This type of transition consists of two sub-categories: broadcast
receiver registration and event listener registration. A broadcast receiver receives an intent
for which it has registered for via the onReceive() callback method. While static broad-
cast receivers—those identified in the manifest file—are registered when the app launches,
dynamic broadcast receivers are registered using registerReceiver() API. Broadcast
registration transition, which could be inter- or intra-component, connects a CG node that
registers a broadcast receiver to its corresponding onReceive() callback, which is also a
CG node.
An event listener is an interface that contains one or more callbacks. Listener callbacks are
called by the Android framework when the event that the listener has been registered for
is triggered either by user or environment. For example, onLocationChanged() is called
upon any change in the location of the device, if the app has previously registered a location
listener. Listener registration transition, which could also be inter- or intra-component,
connects a CG node that registers a listener to its corresponding callbacks, which is also a
CG node. The listener callbacks have no order among themselves.
Cobweb’s approach for identifying registration transition works as follows. For a given
registered callback, Cobweb performs an inter-procedural, flow-sensitive static program
analysis to find the registrar—the entity that registers the broadcast receiver or listener of
that callback. It then assigns a transition from the registrar to the registered callback node
in CG. For broadcast registration, the registered callback is onReceive()—either defined
inside an inner-class broadcast receiver or a broadcast receiver component, and registrar
is callback or method that invokes the registerReceiver() API. For listener transition,
96

Cobweb takes a list of listener callbacks available in Android API1 to identify registered
callbacks. The listener registrar is a callback or method that registers a listener with the
given callback implemented. Flow-sensitivity is required for this analysis, as a broadcast
receiver may subscribe to receive multiple Intents, and multiple listeners of the same kind
might be registered for an app. For example, an app may register two location listeners, one
listening to GPS location updates, and another one tracking location updates via network.
5- Lifecycle transition: These intra-component transitions are between starting lifecycle
callback nodes of a component, e.g., onCreate() for Activities or onStartCommand() for
Services, and every non-lifecycle node with no incoming edge inside the component. That is,
every callback or method inside a component with no incoming edge can be called after the
component is started. Cobweb resolves lifecycle transitions after all other transitions are
identified. It ignores all other lifecycle callbacks that do not instantiate/start a component,
e.g., onPause() or onDestroy(), since these other lifecycle callbacks are considered using
the LSM model, discussed next.
6.4.2 Lifecycle State Machine (LSM)
Wakelocks and other resources, such as GPS, are commonly acquired and released in lifecycle
event handlers [150]. Thereby, proper implementation of lifecycle callbacks is important, as
developers need to ensure apps are not unnecessarily consuming power due to changes in
the lifecycle state. To that end, I represent possible transitions among lifecycle states of an
Android component type as a finite state machine, called Lifecycle State Machine (LSM).
Since the lifecycle callbacks are handled by the Android framework itself, I can define an LSM
for each Android component type, regardless of which callbacks are actually implemented by
instances of that component. Such a representation also ensures thorough testing of an app,1Derivation of this list is discussed in Section 6.4.3
97

as developers may have failed to implement important lifecycle callbacks, where resources
should be managed properly.
I derived three types of LSM models, one for each of the Android components types (Ac-
tivities, Services, and Broadcast Receivers), based on the lifecycle callbacks identified for
them in the Android documentation. Figure 6.4 shows LSMs of the Activity and Service
components for TrackingActivity and InternetService, respectively. For example,
the Activity LSM demonstrates four different lifecycle states for an Activity component.
The Activity LSM indicates how the execution of lifecycle callbacks results in transitions to
different states.
6.4.3 Hardware State Machine (HSM)
Developers should adjust the functionality of apps according to the states of hardware el-
ements. For instance, per Android developer guidelines [19], a location listener should be
unregistered when user is stationary, or the frequency of location update should be lowered
when user is walking rather than driving. To take such factors into account, I need to look for
changes in the hardware states from the inputs generated by the environment (e.g., change in
the strength of network signal), or the user, directly or indirectly (e.g., user can turn on/off
location directly from setting, or she can trigger changes in the state of GPS by changing
her location).
Identifying different states of hardware elements for energy testing is crucial, since apps con-
sume different amounts of energy in different states [179]. I followed a systematic approach
to derive generic and reusable models for each hardware element on a mobile device, called
Hardware State Machine (HSM).
98

Android provides libraries to access and utilize hardware elements. These libraries provide
APIs and constant values, i.e., fields, which can be used to inquire about possible states of
hardware elements. Developers can use the APIs implemented by such libraries to monitor
the state of hardware elements (e.g., using LocationManager to track user location changes
and ConnectivityManager to query about the state of network connections) or manipulate
the states (e.g., hold a lock on the CPU using PowerManager.Wakelock APIs to prevent
the phone from going to sleep). Documentation of these APIs is a rich source for identifying
different hardware states.
Similarly, constant values introduced in such libraries can be used to identify hardware
states, as they usually are either representative of different states of hardware elements, or
the action field of broadcast Intents that show a change in the state of hardware. For ex-
ample, WIFI MODE FULL, WIFI MODE FULL HIGH PERF, and WIFI MODE SCAN ONLY are con-
stants associated with WiFiManager library, indicating that WiFi hardware can operate in
different modes, each consuming battery of the device differently.
To find a thorough list of such libraries, I started by automatically crawling Android API
reference [9] using Crawler4J [4] to search for classes, where description of their public meth-
ods or fields contained at least two of the following keywords: location, lock, gps, network,
connect, radio, cellular, bluetooth, display, sensor, cpu, battery, power, consume, drain,
charge, discharge, monitor, hardware, state, and telephone. I crawled 6, 279 pages in total
and collected 1, 971 libraries after keyword filtering. I further processed the documentation
of those libraries to find all the possible states of hardware elements as follows:
1. APIs: To automatically collect a set of APIs that monitor state of the hardware elements,
I searched for event listeners and callbacks in the public methods of the 1, 971 collected
libraries, as they monitor the changes in the state of hardware elements. From a total of
38, 626 APIs in these classes, I searched for APIs that have the keyword listener in their
signature—for event listener APIs—and APIs that start with on—for callbacks. This yielded
99

441 listeners and 2, 968 callbacks. To collect APIs that manipulate state of hardware, I
searched for methods that have derivation of the following keywords in their description:
scan, access, acquire, release, state, register, disable, enable, connect, and disconnect. In
the end, I collected a total of 104 APIs correlated to different states of various hardware
elements.
2. Fields: I automatically searched for the constant values identified for the collected
libraries, whose description contained one of the keywords I used for initial filtering. This
search left us with 225 constant values.
Once the states of each hardware element were identified using the aforementioned approach,
I constructed seven HSMs for major hardware elements on mobile phones. These HSMs
correspond to battery, Bluetooth, CPU, display, GPS, radio, and sensors, e.g., accelerometer
and gyroscope.
HSM is a finite state machine that represents different states of a hardware element. Fig-
ure 6.4 shows HSM models derived for Network and Location hardware elements (in the
details of InternetService and TrackingActivity components). For Network HSM
for example, from 46 APIs and 12 fields of two libraries—ConnectivityManager and
WiFiManager—along with their nested classes, I identified 9 states for Network, namely
Disconnected, Connected (with poor or full signal strength), Utilized (under poor or full
signal strength), Scanning, and Locked (full, multi-cast, and high performance).2 Edges be-
tween different states of the hardware can be traversed by calling one of the Android APIs
inside the app or triggering events outside of it.3 Hence, it is crucial to have a generic HSM
for each hardware without considering just the source code of the app. For example, an
application can start scanning for available WiFi networks using startScan() API, or the2For a better illustration, different locked states are merged in the HSM3Labels of edges are not shown here for sake of simplicity
100

Chromosome 1 Chromosome 2 Chromosome n...Population(Test Suite)
Chromosome(Test)
Gene(Component)
Component 1 Component 2 Component i Component m... ...
Event pi...Event 2Event 1
Figure 6.5: Genetic representation of tests
state of hardware can be changed to scanning by manipulating the platform. I have made
the HSM models of other hardware elements publicly available [31].
6.5 Test Generator
The objective here is to generate tests that (1) cover energy-greedy APIs, and (2) exe-
cute them under different contextual conditions. In this section, I describe the evolutionary
search-based test generation algorithm utilized in Cobweb that aims to satisfy this objec-
tive.
6.5.1 Genetic Algorithm
Cobweb identifies the search space for energy testing problem as a set of system tests. Fig-
ure 6.5 illustrates the genetic representation of a test suite generated by Cobweb. Overall,
Cobweb generates a set of system tests that corresponds to a population of chromosomes in
the evolutionary algorithm. At a finer granularity, each chromosome consists of genes, which
are the main Android components of an app, and each gene contains multiple sub-genes,
which are either input events or callback events (recall Section 7.2).
101

Algorithm 6.1: Evolutionary Energy Test GenerationInput: App app, Set of LSMs, Set of HSMs, List of energy-greedy APIs
HW, threshold, breedSizeOutput: Test suite TE
1 CTG,CG← staticAnalysis(app)2 model← mergeModels(CTG,CG,HSM,LSM)3 P ← randomPopulation(app)4 while improvement in fitness(TR,model) ≤ threshold do5 Poffspring ← select(P, breedSize)6 Poffspring ← converge(model, Poffspring)7 Poffspring ← diverge(model,HW,Poffspring)8 TRtmp ← generate(Poffspring)9 fitness(TRtmp ,model)
10 P ← merge(P, Poffspring)11 TR ← TR ∪ TRtmp
12 TE ← minimize(TR)
Algorithm 6.1 presents the evolutionary approach of Cobweb for test generation. It takes
the app along with LSM and HSM models as inputs and generates a set of Espresso [10]
tests—TE. The algorithm starts by constructing the CTG and CG models through static
analysis of the app (Line 1) and integrating those with LSM and HSM models to arrive at the
final model of the app under test (Line 2). Next, it randomly generates the initial population
P , which is later evolved using evolutionary search operators through multiple iterations
(Lines 5-7). Once the new generation is available, Cobweb generates Robolectric tests for
each chromosome (Line 8), executes them on JVM, and calculates their corresponding fitness
(Line 9). At the end of iteration, Cobweb adds newly generated tests to the test suite and
starts a new iteration. This process continues until the termination condition is met: if
the improvement in the average fitness of generated tests in two consecutive iterations is less
than a configurable threshold, the algorithm terminates (Line 4). Afterwards, Algorithm 6.1
minimizes the generated Robolectric test suite and transforms them to Espresso tests for
execution on a mobile device (Line 12), such that energy measurements can be collected.
For input fields, Cobweb follows an approach similar to Sapienz [164] and extracts statically-
defined values from the source code and layout files. Additionally, developers can provide
a list of inputs, e.g., list of cities for MyTracker. Alternatively, the input values can be
102

provided to Cobweb through symbolic execution of the app, using one of the many tools
available for this purpose (e.g., [58, 193, 128, 169]).
6.5.2 Genetic Operators
I now provide a more detailed explanation of the three genetic operators in Algorithm 6.1.
6.5.2.1 Selection Operator
Cobweb implements a fitness proportionate selection strategy, a.k.a., roulette wheel selec-
tion, for breeding the next generation. That is, the likelihood of selecting a chromosome is
proportional to its fitness value. The intuition behind this selection strategy is that tests
that are closer to covering energy-greedy APIs or exercise them under previously unexplored
contexts—thus having a higher fitness value—should have a higher chance of selection. Cob-
web sorts chromosomes based on their fitness value and selects a subset of them, denoted
as Poffspring, for inclusion in the next generation. The size of selected chromosomes is deter-
mined by breedSize variable that is an input to the algorithm. If F (i) is the fitness value for
a chromosome i in the current population with size n, the probability of this chromosome to
be selected for breeding is computed as follows:
p(i) =F (i)
n∑j=1
F (j)(6.1)
103

Figure 6.6: Intuition behind convergence and divergence operators
6.5.2.2 Convergence Operator
The goal of convergence operator is to pull the population towards local optima, i.e., generate
new chromosomes that largely inherit the genetic makeup of their parents. The convergence
operator only changes the execution context of tests. That is, from the parents identified by
the selection operator, Poffspring, it chooses those that have reached energy-greedy APIs, then
uses LSM and HSM models or mocking to create a new context for those tests. The intuition
behind this operator is shown in Figure 6.6. LSM and HSM models have finite states, thereby
their search space—identified by dashed circle in Figure 6.6—is relatively small compared to
the typical search space associated with the functional behavior of a program, represented
by CTG and CG models. Convergence operator, denoted by the orange arrow in Figure 6.6,
promotes exploration of the search space within close proximity of parent chromosomes,
thereby aids the algorithm to converge to local optima.
For each chromosome in Poffspring, Cobweb randomly selects a gene to modify its context
by inserting proper events in the chromosome event sequence. To avoid bloated populations,
Cobweb applies convergence operator if the gene has events associated with lifecycle call-
backs or hardware-related APIs. Cobweb uses two types of convergence operator: lifecycle
context operator and hardware context operator.
104

Lifecycle context operator: To show the necessity of lifecycle context and usage of LSM
for test generation, consider the second energy defect for MyTracker app described in Sec-
tion 7.2. Recall that to effectively detect this bug, a test needs to put the TrackingActivity
into the paused state to assess utilization of GPS hardware in this state. To generate such
test, lifecycle context operator determines current lifecycle state of the chromosome that
utilizes GPS in one of its genes, and inserts the proper lifecycle callback event based on the
next possible state determined from LSM.
Consider Sequence 2 of Figure 6.2 to see how lifecycle context operator works. The onLocationChanged
event in TrackingActivity gene indicates access to GPS hardware. Cobweb realizes the
lifecycle state of TrackingActivity is Running based on the last lifecycle callback in the
event sequence. The next eligible state for TrackingActivity is Paused based on LSM,
which can be reached by executing onPause() lifecycle callback. Additionally, since proper
execution of a test requires the component to be in the Running state, Cobweb needs to
include a callback to restore the component to the running state to avoid generation of in-
valid tests. Thereby, Cobweb generates a new chromosome corresponding to Sequence 2 of
Figure 6.7. The input argument of onPause indicates that during the execution of this test,
TrackingActivity remains in the paused state for 10 seconds.
Hardware context operator: Many energy defects manifest themselves under specific
hardware settings [125], making it important to test an app under different hardware states.
Recall “fail to check for connectivity” energy defect in MyTracker described in Section 7.2. To
find this energy defect, MyTracker should be tested both when there is a network connection
available and not. For each chromosome in Poffspring, hardware context operator finds a gene
that utilizes hardware, if any, determines the next hardware state based on the last explored
state in HSM, and inserts a specific hardware state sub-gene right before the sub-gene that
is a callback or contains APIs that utilize a hardware element.
105

Sequence 2: <MainActivity<onCreate, onItemClick(“Montreal”)>, LocationActivity<onCreate, enterText(“airport”), enterText(“conference”), onClick(“Start”)>, TrackingActivity<onCreate, onLocationChanged(“location1”), onPause(“10”), onResume(), onClick(“Stop”)>>
Sequence 1: <MainActivity<onCreate, onClick(“Download Maps”)>, MapSearchActivity<onCreate, enterText(“Ottawa”), onClick(“Find by Internet”)>, InternetService<onStartCommand, searchOnServer, startService(“DownloadService”)>,DownloadService<onStartCommand, Utilized_Full, startDownload, onDownloadComplete>>
Sequence 3: <MainActivity<onCreate, onClick(“Download Maps”)>, MapSearchActivity<onCreate, onClick(“Find by GPS”)>, GPSService<onStartCommand, getLastKnownLocation, startService(“DownloadService”)>,DownloadService<onStartCommand, startDownload, onDownloadComplete>>
Figure 6.7: Evolved event sequences from illustrative example
For example, consider a chromosome represented by Sequence 1 in Figure 6.2. The startDownload
sub-gene inside the DownloadService gene makes an app connect to a server and download
the map of Ottawa. If no prior hardware context operator is applied on DownloadService,
the state of network would be Disconnected based on the Network HSM presented in Fig-
ure 6.4. Hence, Cobweb randomly chooses to transfer the state to either Scanning, Utilized
Poor, or Utilized Full. Supposing the next state is chosen to be Utilized Full, Cobweb
changes this event sequence to Sequence 1 in Figure 6.7. Unlike lifecycle context operator,
there is no need to restore the state of hardware. That is, if a test crashes by changing the
hardware state, developer has failed to properly handle that situation.
6.5.2.3 Divergence Operator
In contrast to convergence operator, the goal of divergence operator is to bring the population
out of local optima to discover potentially better solutions, i.e., find solutions that cover new
energy-greedy APIs not previously covered by tests in the current population. The intuition
behind this operator is shown in Figure 6.6. Unlike convergence operators that perform
a neighborhood search, divergence operator, denoted by the dashed green arrow, causes
exploration of the whole new areas of the search space.
The goal of this operator is to explore new paths, specifically paths that cover energy-greedy
APIs. To that end, it combines two operations, namely breakup and reconcile to breed a new
106

chromosome. For each chromosome in Poffspring, breakup operation breaks it into two set of
genes, passes the first set to reconcile operation, and discards the seconds set. Note that the
breakup point is selected randomly and could also be the end of the chromosome, i.e., the
first set is the entire chromosome and the second set is empty. At the next step, reconcile
operation creates a new individual from the broken chromosome. Starting from the last gene
of the broken chromosome, reconcile operation uses the CTG and CG models to generate a
sequence of events that cover a path toward their leaf nodes. The operator selects a path
based on a priority value. Given the following path, 〈Ci〈e1, . . . , epi〉, . . . , Cm〈e1, . . . , epm〉〉,
its priority value is calculated as follows:
PRi,m =m∑j=i
APIj APIj =l∑
k=0
wk (6.2)
where APIj is a weighted sum of the number of energy-greedy APIs, l, that might be invoked
during the execution of event sequences in component Cj. Cobweb takes a list of 38, 626
energy-greedy APIs from our empirical study described in Section 6.4.3, and counts the
number of their invocations for each component using a conventional use-def static analysis.
Since energy-greediness of APIs vary, Cobweb employs a weighted sum. To obtain the
weight of each energy-greedy API, Cobweb relies on a prior study [147] that has ranked
energy-greedy APIs based on their energy-greediness to compute wk in Equation 6.2.
Reconcile operation may need to change the sub-genes of the last gene in the broken chromo-
some to reduce the likelihood of generating invalid tests. For example, consider Sequence 1 in
Figure 6.2, where breakup operation divides it into 〈MainActivity, MapSearchActivity〉
and 〈InternetService, DownloadService〉 sequences of components. Referring to the
CTG of MyTracker shown in Figure 6.4, reconcile chooses 〈GPSService, DownloadService〉
to create a new chromosome 〈MainActivity, MapSearchActivity, GPSService, DownloadService〉.
107

Without changing the event sequences of MapSearchActivity, the test corresponding to
this new chromosome would fail, as clicking on the “Find by Internet” button does not instan-
tiate GPSService. Thereby, Cobweb changes the genetic makeup of MapSearchActivity
and generates a new chromosome corresponding to Sequence 3 shown in Figure 6.7.
6.5.3 Fitness Evaluation
The fitness function rewards tests based on two criteria: (C1) how close they are to covering
energy-greedy APIs; and (C2) how well they contribute to exercising different contextual
factors. The first criterion is measured using CTG and CG, while the second criterion is
measured using LSM and HSM.
Cobweb calculates the fitness value in two steps. First, it computes the fitness of ti with
respect to each energy-greedy API j. Then, it averages those values to compute a single
fitness value for test. For each test ti, Cobweb computes the fitness value as follows:
F (i) =1
n×
n∑j=1
fi(j) (6.3)
where n is the number of energy-greedy APIs on the path of ti to a leaf in CTG and fi(j) is
the fitness value of ti with respect to energy-greedy API j, calculated as follows:
fi(j) =
13× [c1i(j) + c2i(j)]
API j is on the path to a leaf
0 otherwise
(6.4)
108

Here, c1i(j) determines the fitness of ti with respect to fitness criteria C1. It computes how
close test ti is to cover energy-greedy API j. It is calculated as xy, where x is the number
of edges in CG to the node that contains API j, starting from the last node covered by
ti, and y is the total number of edges from root to the node that contains API j. The
intuition behind this formulation is that, a test may not cover energy-greedy APIs in the
early iterations. However, if it comes close to covering energy-greedy APIs, it is likely to
be able to eventually cover those APIs in future iterations. Thereby, tests that exercise
paths that contain more energy-greedy APIs or get close to covering such APIs should have
a higher priority to evolve. If a test covers API j, c1i(j) attains a value of 1.
c2i(j) corresponds to fitness criterion C2 and determines how well ti exercises lifecycle and
hardware state contexts:
c2i(j) = bc1i(j)c × [li(j) + hi(j)] (6.5)
Here, li(j) and hi(j) are indicators of how well ti exercises the lifecycles of a software com-
ponent and different states of a hardware element that implements API j, respectively.
Cobweb computes li(j) and hi(j) values as follows:
1 if the test achieve prime path coverage
zq
otherwise
(6.6)
where z is the length of path covered in LSM/HSM, and q is the length of the longest prime
path for LSM/HSM. This formulation enables tests that exercise more states in LSM/HSM
models to have a higher fitness value. Since execution context matters only if an API is
109

covered by a test, Equation 6.5 has a coefficient bc1i(j)c, such that it is 0, when ti has not
reached API j, and 1, otherwise. Unless c1i(j) equals to 1, the value of bc1i(j)c, hence c2i(j),
is 0 and the execution context does not matter in calculation of fitness. Finally, note that
coefficient 1/3 in Formula 6.4 is to ensure that the fitness value is between 0 and 1.
6.5.4 Test-Suite Minimization
To minimize the size of test suite, Cobweb removes tests that are subset of others, as they
are unlikely to find new defects. Cobweb uses Lowest Common Ancestor (LCA) algorithm
to find tests corresponding to overlapping paths in the graph and removes the shortest tests
from TR. For two tests t1 = 〈C1, · · · , Cm〉 and t2 = 〈C1, · · · , Cn〉, if the LCA between Cm
and Cn is either of these nodes, these tests are likely to be overlapping. The algorithm then
checks the events inside overlapping components and if they are the same, it removes the
shorter test and keeps the longer one. In addition, Cobweb removes tests that fail to cover
any energy-greedy APIs, as such tests are unlikely to have a significant impact on energy.
Finally, the reduced test suite is transformed to Espresso tests, which can be executed on a
mobile device.
6.6 Evaluation
I investigate the following five research questions in the evaluation of Cobweb:
RQ1. API and execution context coverage: How well do the generated tests cover energy-
greedy APIs and exercise different lifecycle and hardware state contexts?
RQ2. Effectiveness : How effective are the generated tests in revealing energy defects in real-
world Android apps?
110

Tab
le6.
1:Sub
ject
apps
and
cove
rage
info
rmat
ion
forCobweb
and
alte
rnat
ive
appro
aches
.
Apps
Ver
sion
Cov
erag
e#
Tes
tsE
ner
gy-G
reed
yA
PIs
LSM
HSM
Det
ecti
on
O(e
vents
)∼
L∼
HO
MS
OM
SO
MS
O∼
L∼
HM
S
a2dp.V
ol
8624
c4f
2234
(157
96)
3504
922
435
86%
36%
23%
96%
22%
36%
86%
0%0%
YY
YN
Nb9a
5768
1681
(183
83)
2711
117
398
87%
33%
23%
96%
22%
36%
76%
0%0%
NN
NN
N82
31d4d
1612
(228
24)
2703
617
674
90%
35%
26%
96%
22%
36%
78%
0%0%
YY
YN
Y*
4767
d64
1836
(208
49)
2919
518
775
88%
36%
23%
96%
22%
36%
76%
0%0%
YY
NN
N*
GT
alk
dce
8b85
586
(250
7)47
669
6275
994
%49
%49
%53
%14
%25
%56
%0%
0%Y
YN
NN
c0f8
fa2
531
(483
6)45
406
5961
194
%51
%49
%53
%14
%25
%51
%0%
0%Y
YY
NY
*5c
e2d94
466
(355
8)44
748
5932
394
%49
%49
%53
%14
%25
%53
%0%
0%Y
NN
NN
Op
enbm
ap56
c3a6
775
1(2
328)
4933
2786
90%
46%
62%
80%
28%
38%
77%
0%0%
YY
NN
N14
d16
6f74
6(2
984)
5343
3060
89%
45%
62%
80%
28%
38%
83%
0%0%
YN
YN
*N
*f7
2421
f75
4(2
980)
5410
3153
96%
46%
62%
80%
28%
38%
78%
0%0%
YY
NN
N
Op
enC
amer
a1.
060
6(3
916)
7224
154
296
33%
49%
54%
100%
26%
66%
66%
0%0%
YY
YY
*Y
*
Sen
oriu
me1
53fd
f96
(288
)35
411
2763
%37
%56
%10
0%30
%51
%86
%0%
0%Y
NY
NN
94c9
a8d
99(3
36)
394
1145
63%
36%
56%
100%
30%
51%
96%
0%0%
YN
YN
N94
c9a8
d10
5(3
37)
428
1360
63%
37%
57%
100%
30%
51%
85%
0%0%
YN
YN
*N
Ush
ahid
i4f
2061
235
19(1
2523
)48
6550
3279
%46
%39
%86
%59
%41
%59
%0%
0%Y
YY
Y*
Y*
O:
Ori
ginal
Cobweb
,∼
L:Cobweb
wit
hou
tL
SM
,∼
H:Cobweb
wit
hou
tH
SM
,M
:M
onke
y,S:
Sto
at
111

RQ3. Necessity of the models : To what extent does using the LSM and HMS models and
considering the execution context aid Cobweb to find energy defects?
RQ4. Energy defects coverage: What types of energy defects can be detected by Cobweb
and not other energy analysis tools?
RQ5. Performance: How long does it take to generate tests using Cobweb?
6.6.1 Experimental Setup
Alternative Approaches: For a thorough evaluation of Cobweb, I compare it with other
testing tools as well as a variety of other energy analysis approaches targeting Android.
I compare Cobweb against Monkey [45], since (1) it is arguably the most widely used
automated testing tool for Android, and (2) in practice, it has shown to outperform other
academic test generation tools [85]. I also compare against the most recent publicly available
Android testing tool, Stoat [190], shown to be superior to prior testing tools. Stoat uses a
combination of model-based stochastic exploration of a GUI model of an app and randomly
injected system-level events to maximize code coverage.
Subject Apps: To evaluate effectiveness of Cobweb, I needed Android apps with real
energy defects. To eliminate any bias toward selection of subject apps in favor of Cobweb,
I looked at the dataset of 8 related approaches presented in Table 6.2 and used two criteria
in selecting apps. First, the energy defects identified by the approach should be confirmed
by the developers of studied subject apps through a commit in the repository. Second,
information about the faulty version of an app or pointers to a commit fixing the issue
should be publicly available. These criteria are required to ensure the defects reported by
those tools are in fact reproducible in our experimental setup and do not impose a threat
to the validity of our results. From the total of 2, 035 apps studied in related approaches,
only 25 matched our inclusion criteria. From those apps, I was able to reproduce the faults
112

in 18 of them, mostly because a subset of faults in those apps related to older versions of
Android and could not be reproduced in Android 6.0 that I used in our evaluation. Out
of these 18 apps, I removed 3, since Soot was not able to generate complete call graphs for
them. Table 6.1 shows information about our 15 subjects with real energy defects.
Fault Reproduction: To ensure the energy issues are reproducible, I executed each defec-
tive subject app under the documented use-case known to exhibit the defect. I profiled the
state of hardware elements during and after execution of the app using Trepn [71]. Trepn is a
profiling tool developed by Qualcomm that collects the exact power consumption data from
sensors embedded in the chipset. If the profiled data indicated over-utilization of a hardware
element during the execution of use-case, I marked the energy defect to be reproducible. For
example, if the energy defect to reproduce is categorized as a location defect, I monitored
the state of GPS to see if the GPS hardware is released after the execution.
6.6.2 RQ1: API and Execution Context Coverage
The objective of Cobweb is to maximize the coverage of energy-greedy APIs under various
execution contexts. To evaluate the extent to which Cobweb achieves this goal, I measured
API, LSM, and HSM coverage of test suites produced for our subjects. Similarly, I calculated
these metrics for Monkey and Stoat as an alternative testing approach. I collected coverage
information of the subjects using EMMA [3] during test execution. I ran Stoat for 3 hours,
similar to the configuration used by its authors [190]. Monkey is shown to converge very
close to its highest coverage at around 10 minutes [85]. However, I ran it for 1 hour to
ensure sufficient testing budget. During 1 hour, it generates over 100, 000 events per subject,
which is significantly higher than the 7, 630 events generated on average by Cobweb in our
experiments. Table 6.1 illustrates the result of this experiment under Coverage column. I
observe that:
113

Cobweb achieves a higher API coverage compared to alternative approaches.
Cobweb achieves 79% API coverage on average, ranging from 33% to 96% with the median
of 89%. In contrast, Monkey and Stoat are able to cover on average 42% and 46% of energy-
greedy APIs.
Cobweb is more effective in exercising different execution contexts compared to
Monkey. While Cobweb achieves an average of 85% in covering prime paths of LSMs,
ranging from 53% to 100% with the median of 96%, Monkey and Stoat are able to cover
only 27% and 40% LSM prime paths on average. Alternative approaches perform worse in
terms of HSM coverage, failing to cover even a single HSM prime path. This is due to the
fact that neither Monkey nor Stoat are capable of effectively manipulating hardware and
systematically create system events during testing.
6.6.3 RQ2: Effectiveness
I investigated the ability of Cobweb, Monkey, and Stoat for finding the energy defects in
the subject apps. To that end, I executed the generated tests on a Google Nexus 6 device,
running Android version 6.0. During the execution of each test, Trepn was running in the
background to profile the states of hardware elements during and after execution of each
test. I used the results of fault reproduction (recall Section 7.7.1) as our oracle. Similar
to prior work [125], if the energy traces obtained during the fault reproduction and test
execution matched, I determined that the test suite was able to detect the corresponding
fault. Column Detection in Table 6.1 demonstrates the result of this study. These results
show that:
Random GUI exploration and random system event injection proves to be highly
ineffective. Monkey and Stoat were able to detect only 2 and 4 energy defects, respectively.
The root cause of this weakness comes from their inability to cover energy-greedy APIs under
114

different execution contexts. In fact, Monkey and Stoat were able to cover the code related to
4 and 5 energy defects, respectively—those marked with asterisk under Detection column.
Even when covered by these tools, manifestation of those defects requires the apps to be
executed under specific component lifecycle or hardware states.
Cobweb is effective for detecting energy defects. From the total of 15 verified energy
defects, Cobweb was able to detect 14, where 10 of them could be detected by exercising
different component lifecycle states and 4 of them could be revealed under specific hardware
states. Cobweb was not able to find 1 energy defect in a2dp.Vol. Further investigation
showed that manifestation of this energy defect requires complex interactions with the app.
In fact, a2dp.Vol requires a user to connect a Bluetooth device to her phone, change her
location, save her location in a database, and disconnect the Bluetooth device from her phone.
Cobweb generated a test for each of these use-cases, but not a single test to reproduce the
whole scenario, as they cover different branches of CTG.
6.6.4 RQ3: Necessity of the Models
To evaluate necessity and usefulness of LSM and HSM models, I first compared the size of
test suites originally generated by Cobweb that considers these models with that generated
by a modified version of Algorithm 6.1 that exhaustively injects lifecycle or hardware related
events into event sequences, i.e., changed the convergence operator. In addition, I compared
the ability of test suites originally generated by Cobweb in finding energy defects with that
generated without using the models, i.e., I removed the consideration of execution context
from the test generation process. From the results presented in Table 6.1, I can observe that:
Contextual models make energy testing scalable. Without a model, each component
of app should be exhaustively tested under all possible lifecycle/hardware states. Columns
∼L and ∼H under #Tests show the size of test suites generate by exhaustively injecting
115

Tab
le6.
2:C
ompar
ing
abilit
yof
ener
gyan
alysi
sto
ols
tofind
diff
eren
tty
pes
ofen
ergy
def
ects
.
Def
ect
Model
Cobweb
[151
][6
6][1
50]
[200
][1
48]
[149
][6
7][1
43]
Anal
ysi
sT
yp
e-
Hybri
dSta
tic
Hybri
dSta
tic
Sta
tic
Sta
tic
Dynam
icD
ynam
icSta
tic
Lif
ecycl
eC
onte
xt
-Y
NN
YN
YY
NN
Har
dw
are
Con
text
-Y
NN
NN
NN
NN
Blu
etoot
h3
30
00
00
02
0D
ispla
y4
30
00
01
01
1L
oca
tion
42
01
01
01
10
Net
wor
k6
50
10
10
01
0R
ecurr
ing
Cal
lbac
k5
31
00
00
02
0Sen
sor
22
01
01
01
20
Wak
elock
44
02
22
02
30
Tot
al28
221
52
51
412
1
116

lifecycle/hardware related events to explore all possible states. I can see that by using LSM
and HSM models, Cobweb is able to generate test suites that are 27 and 28 times smaller,
respectively.
Execution context is crucial for detecting energy defects. Columns ∼L and ∼H
under Detection illustrate the number of faults that can be detected by test suites not using
either LSM or HSM models. Test suites generated without using LSM and HSM models can
only detect 9 energy defects, thereby are inferior to those generated by Cobweb in terms of
their ability to find energy defects. These results confirm our intuition about the importance
of considering contextual conditions for energy testing.
6.6.5 RQ4: Energy Defects Coverage
I evaluated Cobweb’s ability to find different types of energy defect by comparing it with
the state-of-the-art energy analysis approaches. To that end, I used a recently published
energy defect model for Android [125], consisting of 28 energy defect types, categorized into
seven groups, namely bluetooth, display, location, network, recurring callback, sensor, and
wakelock. For approaches that are either not publicly available or do not work on newer
versions of Android, I rely on the corresponding paper, i.e., description of the approach
and limitations stated in the paper, to determine if it is able to detect each type of defect.
Table 6.2 shows how these approaches differ in terms of their ability to find various types of
energy defect.
I can see that Cobweb is able to detect a wider range of energy defects compared
to prior techniques. Furthermore, it appears that dynamic analysis solutions, such as
Cobweb and [67], are able to detect a wider variety of energy defects compared to static
analysis solutions.
117

Figure 6.8: Performance characteristics of Cobweb
6.6.6 RQ5: Performance
To answer this research question, I evaluated the time required for Cobweb to extract
models as well as the time required for test generation and test minimization. To evaluate
test generation time, I measured time from when the algorithm starts generating initial
population to when it terminates the loop in Algorithm 6.1 at Line 11. I ran the experiments
on a laptop with 2.2 GHz Intel Core i7 processor and 16 GB DDR3 RAM. Figure 6.8 shows
the performance characteristics of Cobweb for each subject app (results are averaged over
various faulty versions of apps presented in Table 6.1). From this data, I can see that
Cobweb takes 23 seconds on average to extract models, 8 minutes for test generation and
execution (including calculation of fitness value), and 57 seconds for test-suite minimization.
These results corroborate scalability of Cobweb for test generation, making it a reasonably
efficient testing tool for detecting energy issues.
6.7 Discussion
This chapter presented Cobweb, a search-based energy testing framework for Android.
The approach employs a set of novel models to take execution context into account, i.e.,
lifecycle and hardware state context, in the generation of tests that can effectively find
118

energy defects. Additionally, Cobweb implements novel genetic operators tailored to the
generation of energy tests. Unlike related search-based Android testing approaches, the
approach runs tests on the JVM rather than emulator or real device, making it highly
scalable. Using Cobweb on Android apps with real energy defects corroborate its ability
to effectively generate useful tests to find energy defects in a scalable fashion, outperforming
state-of-the-art and state-of-the-practice Android testing techniques.
119

Chapter 7
Energy-Aware Test Oracle
Energy efficiency is an increasingly important quality attribute for software, particularly
for mobile apps. Just like any other software attribute, energy behavior of mobile apps
should be properly tested prior to their release. However, mobile apps are riddled with
energy defects, as currently there is a lack of proper energy testing tools. Indeed, energy
testing is a fledgling area of research and recent advances have mainly focused on test input
generation. This chapter presents ACETON, the first approach aimed at solving the oracle
problem for testing the energy behavior of mobile apps. ACETON employs Deep Learning
to automatically construct an oracle that not only determines whether a test execution
reveals an energy defect, but also the type of energy defect. By carefully selecting features
that can be monitored on any app and mobile device, the oracle constructed using ACETON
is highly reusable, highly accurate, and efficient.
120

7.1 Introduction
Improper usage of energy-greedy hardware components on a mobile device, such as GPS,
WiFi, radio, Bluetooth, and display, can drastically discharge its battery. Recent studies
have shown energy to be a major concern for both users [196] and developers [162]. In spite
of that, many mobile apps abound with energy defects. This is mainly due to the lack of
tools and techniques for effectively testing the energy behavior of apps prior to their release.
In fact, advancements on mobile app testing have in large part focused on functional cor-
rectness, rather than non-functional properties, such as energy efficiency [125]. To alleviate
this shortcoming, recent studies have tried to generate effective energy tests [124, 86]. While
the proposed techniques have shown to be effective for generating energy-aware test inputs,
they either use manually constructed oracles [124, 86] or rely on observation of power traces,
i.e., series of energy consumption measurements throughout the test execution, to determine
the outcome of energy testing [67, 125, 66].
Test oracle automation is one of the most challenging facets of test automation, and in
fact, has received significantly less attention in the literature [69]. A test oracle compares
the output of a program under test for a given test to the output that it determines to be
correct. While power trace is an important output from an energy perspective, relying on
that for creating energy test oracles faces several non-trivial complications. First, collecting
power traces is unwieldy, as it requires additional hardware, e.g., Monsoon [7], or special-
ized software, e.g., Trepn [71], to measure the power consumption of a device during test
execution. Second, noise and fluctuation in power measurement may cause many tests to
become flaky. Third, power trace-based oracles are device dependent, making them useless
for tests intended for execution on different devices. Finally, power traces are sensitive to
small changes in the code, thus are impractical for regression testing.
121

The key insight in this work is that whether a test fails—detects an energy defect—or passes
can be determined by comparing the state of app lifecycle and hardware elements before,
during, and after the execution of a test. If such a state changes in specific ways, I can
determine that the test is failing, i.e., reveals an energy issue, irrespective of the power trace
or hardware-specific differences. The challenge here lies in the fact that determining such
patterns is exceptionally cumbersome, and requires deep knowledge of energy faults and their
impact on the app lifecycle and hardware elements. Furthermore, energy defects change, and
new types of defects emerge, as mobile platforms evolve, making it impractical to manually
derive such patterns.
To overcome this challenge, this chapter presents ACETON, an approach for automated
construction of energy test oracles for Android. ACETON employs Deep Learning to
determine the (mis)behaviors corresponding to the different types of energy defects. It rep-
resents the state of app lifecycle and hardware elements in the form of a feature vector, called
State Vector (SV). Each instance of our training dataset is a sequence of SVs sampled before,
during, and after the execution of a test. ACETON leverages Attention mechanism [65] to
ensure generation of explainable DL models.
To summarize, this chapter makes the following contributions:
• A Deep Learning technique for automated construction of an energy test oracle in An-
droid apps that relies on a novel representation of app lifecycle and hardware elements
as a feature vector. ACETON is app and device independent.
• A novel utilization of Attention Mechanism from the Deep Learning literature to go
beyond the usage of Deep Learning as a black-box technique and understand how
ACETON determines the correctness of test execution outcome.
• An extensive empirical evaluation on real-world Android apps demonstrating that
ACETON is (1) highly accurate—achieves an overall precision and recall of 99%, (2)
122

efficient—detects the existence of energy defects in only 37 milliseconds on average,
and (3) reusable across a variety of apps and devices.
• An implementation of ACETON, which is publicly available [31].
The remainder of this chapter is organized as follows. Section 7.2 provides a background
on energy defects and illustrates a motivating example. Section 7.3 provides an overview
of ACETON, while Sections 7.4-7.6 describe details of the proposed approach. Section 7.7
presents the evaluation results.
7.2 Motivating Example
An energy defect occurs when the execution of code leads to unnecessary energy consump-
tion. The root cause of such issues is typically misuse of hardware elements on the mobile
device by apps or Android framework under peculiar conditions. To determine whether test
execution reveals an energy defect, developers can monitor the state of hardware elements
and environmental factors, e.g., speed of user or strength of network signal, before, during,
and after the test execution. If those states change in a specific way (or do not change as
expected) between consecutive observations, it can be an indicator of energy defect.
For example, When developing location-aware apps, developers should use a location update
strategy that achieves the proper trade-off between accuracy and energy consumption [19].
User location can be obtained by registering a LocationListener. While the accuracy of
the location updates obtained from a GPS location listener is higher than that of a Network
location listener, GPS consumes more power than Network to collect location information.
To achieve the best strategy, developers should adjust the accuracy and frequency of listening
to location updates based on the user movement. Example of violating the best practice is
when the app uses GPS to listen to location updates while the user is stationary. This
123

energy defect can be detected if the following pattern in the state of user and GPS hardware
is observed during test execution:
GPSi == GPSi+1 == “On” ∧
Location Listeneri == Location Listeneri+1 == “GPS” ∧
User Movementi == User Movementi+1 == “Stationary”
Here, GPS, Location Listener, and User Movement are the factors corresponding to man-
ifestation of energy defect and the indices indicate to which state, Statei or Statei+1, they
belong.
As shown in the above example, existence of a defect can be determined by monitoring for
certain patterns in the state of hardware and environmental settings during test execution.
Identifying such patterns manually requires significant expertise, and can be extremely com-
plicated and time consuming. For example, a pattern corresponding to violation of location
best practice by listening to location updates at a high frequency when user moves slowly, i.e.,
walking, should include additional invariants related to Network and Listener Frequency.
Thereby, our objective in this chapter is to construct an oracle that automatically learns
such patterns to determine the correctness of test execution. Such oracle can be reusable
across different apps and mobile devices, as long as the changes in the state of software and
hardware can be monitored. Automatic construction of test oracles this way is specifically
important for Android, as the platform rapidly evolves, i.e., substantial amount of APIs
become deprecated and new APIs and features are introduced in newer versions.
124
7.3 Approach Overview
Prior research has shown that energy defects manifest themselves under specific contextual
settings [124]. Specifically, some energy defects, e.g., wakelocks and resource leaks, hap-
pen under specific sequences of lifecycle callbacks, while others manifest themselves under
peculiar hardware states, e.g., poor network signal, no network connection, or low battery.
This observation forms the basis of our work. I hypothesize an automated energy test oracle
can be constructed by monitoring and comparing the state of app lifecycle and hardware
elements before, during, and after the execution of a test. If such a state changes in specific
ways, the oracle determines that the test is failing, i.e., reveals an energy issue.
Determining such patterns requires a deep knowledge of both energy defects and their cor-
responding impact on the app lifecycle and hardware elements. To overcome this challenge,
ACETON leverages Deep Learning (DL) techniques to automatically learn the (mis)behaviors
corresponding to the different types of energy defects. Specifically, ACETON monitors the
state of app lifecycle and hardware elements during the execution of a test. Each sampled
state is represented as a bit vector, called State Vector (SV). The result of executing a test
is thus a sequence of SVs, which serves as the feature vector for the DL algorithm. Each
instance of training and test dataset is a sequence of SVs sampled during the execution of a
test. ACETON feeds the SVs and their corresponding labels (indicating the presence of an
energy defect or not) to a Long Short Term Memory (LSTM) network, which is a variant of
Recurrent Neural Networks (RNNs), to train a classifier. This classifier is subsequently used
as our test oracle to determine the label of new tests.
The DL engine of ACETON uses Attention Mechanism, a method for making the RNNs
work better by letting the network know where to look as it predicts a label [65], to generate
an explainable model. Specifically, ACETON is able to identify a subset of SVs that the
oracle attends to for determining the final passing or failing outcome. By analyzing in what
125

Attention Analysis
DL Engine
Test Case
Training DatasetLabeled Database
P
P F
P
FDL
Algorithm
Oracle
Label
SV Sequence
AttentionWeights
Attended Features
Sequence Collector
Trai
ning
Test
ing
ACETON
Figure 7.1: Overview of the ACETON framework
features the attended SVs are different from their predecessor SVs, I can verify whether the
DL model has attended to the relevant features corresponding to the energy defects, in order
to determine the correctness of a test.
Figure 7.1 provides an overview of our proposed approach, consisting of three major compo-
nents: (1) Sequence Collector, (2) DL Engine, and (3) Attention Analysis. To construct the
oracle, ACETON takes a labeled database of apps with energy defects accompanied with
test suites as input. The Sequence Collector component executes each test case and captures
SVs at a fixed rate during test execution to build the training dataset for ACETON. The
training dataset is then fed to the DL Engine, which constructs the classifier that serves
as our test oracle. To use the oracle, ACETON takes a test case as input and collects a
sequence of SVs during its execution. The oracle takes the sequence as input and produces a
fine-grained label for it, indicating whether the test has failed, and if so, the type of energy
defect that was revealed by the test. To help us understand the nature of patterns learned by
the model, the oracle also produces an Attention Weights vector. Attention Analysis compo-
nent then takes the Attention Weights vector to determine the list of features that involved
126

in the oracle’s decision. These features essentially constitute the defect signature learned by
the oracle. In the following sections, I describe the details of ACETON’s components.
7.4 Sequence Collector
The Sequence Collector component takes a test case ti as input, executes it, and captures
the state of app lifecycle and hardware components at a fixed rate to generate a sequence
of SVs,# »
Seqi = 〈SV0, SV1, . . . , SVm〉. In ACETON,# »
Seqi serves as the feature vector for the
DL algorithm. In this section, I first explain details of SV and then describe the process of
sequence collection.
7.4.1 State Vector (SV)
Proper feature selection, i.e., feature engineering, is fundamental to the application of DL
techniques, as the quality and quantity of features greatly impact the utility of a model. I
chose our features to reflect the changes in the state of app lifecycle and hardware elements
during the execution of a test, as these factors have shown to play an important role in
manifestation of energy defects [124]. To capture the state during the execution of a test,
ACETON relies on a model called State Vector (SV). At the highest level, SV consists
of entries representing the lifecycle state of app under test and the state of major energy-
greedy hardware elements, namely Battery, Bluetooth, CPU, Display, Location, Network
(e.g., WiFi or radio), and Sensors (e.g., Accelerometer, Gravity, Gyroscope, Temperature,
etc.),# »
SV = 〈C0, C1, . . . , C7〉, where C represents the element category. At a finer granularity,
each category is broken down to sub-entries that capture the corresponding state in terms
of multiple features,# »
Cj = 〈f0, f1, . . . , fnj〉, where f is a binary value representing the state
of feature.
127

Lifecycle Battery Bluetooth CPU Display Location Network Sensor
ActivityRunning
Activity Paused
Activity Stopped
Activity Destroyed
Service Idle
Service Running
Service Stopped
Broadcast Registered
Broadcast Called
Broadcast Destroyed
Charging AC Powered
USB Powered
Wireless Powered
Battery Full
Battery Ok
Battery Low
Battery Very Low Overheat Temperature
IncreasingLow Power
Mode
Enabled Connected/Connecting
Scanning/Discovering Discoverable Bonded/
PairedA2DP Service
Connected
Lifecycle
Battery
Bluetooth
Awake Dozing Enabled
Process Exists Utilized Partial
Wakelock WakelockCPU
Display
Location
Network
Sensor
On Brightness Dark
Brightness Dim
Brightness Medium
Brightness Light
Brightness Bright
Auto Brightness
Long Tieout
GPS Registered
Network Registered
High Frequency
Last Known Location
GPS Enabled
User Still
User Walking
User Running
User Biking
User Driving
Airplane Mode Scanning WiFi
AvailableWiFi
ConnectedRadio
AvailableRadio
ConnectedSignal Poor
Signal Good
Signal Great
High Perf Locked
Full Locked
Scanning Locked
Infinite Wait
BackgroundNetwork
Active Sensor
Wake Up Fast Delivery
Fast Delivery Accelerometer
Fast Delivery Gravity
Fast Delivery...
Fast Delivery Temperature
Figure 7.2: State Vector Representation
Figure 7.2 demonstrates the representation of SV at the highest level in the first row and
at a finer granularity for all the entries. As shown in Figure 7.2, Location element consists
of ten sub-entries, namely GPS Registered (indicates whether a GPS listener is registered
by an app), Network Registered (indicates whether a Network listener is registered by an
app), High Frequency (indicates if the registered location listener listens to location updates
frequently), Last Known Location (indicates whether the last known location is available
for an app), GPS Enabled (indicates whether the GPS hardware is on or off), and entries
indicating the type of user movement as the test executes.
To determine sub-entries, i.e., features, I needed two sets of information: (1) a set of lifecycle
states for Android components, i.e., Activity, Lifecycle, and BroadcastReceiver, and (2)
states of key hardware elements that can be changed at the software level. I referred to
Android documentation [51, 50, 49] to determine the former. For the latter, I followed
a systematic approach similar to that presented in the prior work [124] to obtain all the
Android APIs and constant values in the libraries that allow developers to monitor or utilize
hardware components. Specifically, I performed a keyword-based search on the Android
API documentation to collect hardware-relevant APIs and fields, identified all the hardware
states that can be changed or monitored at the software level, and constructed State Vector
as demonstrated in Figure 7.2. By identifying the hardware features using the mentioned
approach, i.e., determining the hardware states that can be manipulated or monitored using
application software or Android framework, I are assured the oracles constructed following
128

our approach are device independent. Additionally, the constructed oracle is app independent,
as it monitors the features that are related to app’s lifecycle state, which are managed by
Android framework, in contrast to features that are related to the code of apps, e.g., usage
of specific APIs. Thereby, once trained on a set of apps, the oracle can be reused for testing
of other apps.
An SV consists of a total of 84 binary features. I leveraged One-Hot encoding to transform
all the categorical data into binary values. For example, while user movement can be a single
feature with categorical text values of Still, Walking, Running, Biking, and Driving1, I model
it as five binary features. This is mainly because binary features are easier to learn by DL
techniques, thereby lead to a higher level of accuracy in a shorter amount of time.
7.4.2 Collecting Sequences
The Sequence Collector component executes a given test, ti, and collects the values for
different sub-entries of SV at a fixed sampling rate to generate# »
Seqi. ACETON’s DL Engine
requires the size of all the# »
Seqis be the same. Since tests may take different amounts of time to
execute, Sequence Collector adjusts the frequency of sampling based on the length of tests.
Current implementation of ACETON requires 128 SV samples (details in Section 7.7).
Thereby, if the execution time of ti is 15 second, Sequence Collector samples SV values every
100 milliseconds. On the other hand, for a shorter test that takes 5 seconds to finish, SV
sampling takes place every 40 milliseconds.
Sequence Collector leverages dumpsys and systrace capabilities of the Android Debug Bridge
(ADB), along with instrumentation of apps, to collect the necessary information at different
time stamps. dumpsys is a command-line tool that provides information about system
services, such as batterystats, connectivity, wifi, power, etc. For example, “adb shell1These categories are specified in the Android documentation.
129

dumpsys wifi” command collects and dumps the statistics related to the WiFi hardware
element. To determine if there is a WiFi network available, I look at the value of “WiFi is”
line in the dumpsys report. Similarly, to see if the phone is connected to a WiFi network, I
look at the value of “curState”. If “curState = NotConnectedState”, the phone
is not connected to a WiFi network. If “curState = ConnectedState”, the phone
has connection to a WiFi network, in which case I collect additional information about the
connection, e.g., the strength of signal.
While dumpsys provides detailed information about all the running services on a phone, its
reporting time for CPU is very long. That is, it batches all the CPU usage information
and updates CPU report every several minutes. Thereby, I used systrace to collect the
information about CPU usage of an app during test execution. Finally, I could not find
information in either dumpsys or systrace report for a subset of features. To that end,
ACETON automatically instruments the app under test to collect such information. For
example, Location category contains features related to the type of user movement. To
identify how and when user movement changes, ACETON instruments the app to register
an Activity Recognition listener and listens to the changes in user movement. That is, when
the device recognizes a change in the user movement by collecting the data from various
sensors, Android will notify the listener about the type of detected activity, e.g., walking,
running. As another example, all the lifecycle callbacks will be instrumented to print a
message Android log, i.e., LogCat, as they are invoked. By processing the log files collected
for an SV during test execution, I determine the values for lifecycle features.
7.5 Learning Engine
In this section, I describe the DL-based construction of our energy test oracle.
130

RNN =
=
(a)
(b)
x i
hi
x 0
h t
RNN
h0
x0
RNN
h t
x t... ...
x i
LSTMLSTM
x 0 x t... ...
hih0 h t
LSTM
x 0
h t
Figure 7.3: Architecture of an RNN and LSTM networks
7.5.1 Model Selection
To determine what Machine Learning model is suitable for solving the energy oracle problem,
I considered the following criteria:
1) The construction of energy oracle is a form of Classification problem, i.e., I train our
model based on a set of labeled passing or failing tests. Hence, the model should be suitable
for such supervised learning problem;
2) I have a relatively high-dimensional data, i.e., each single input to the model is a sequence
of SVs sampled during execution of a test. For a sequence size of 128 and SV size of 84
with binary features, each instance of our feature vector can take 128× 84 = 2, 1504 values.
Thereby, the model should be able to deal with both sequential and high-dimensional data;
3) Energy defects can occur anywhere during the execution of a test. As a result, the index
of SVs where an energy defect occurs can be different among tests. Thereby, our proposed
oracle should be able to detect emergence of the anomalous energy behavior in SVk from the
131

SVs that appear before it, {SVl | l < k}. That is, our model should be able to holistically
consider the observed SVs in order to accurately detect energy defects.
Given these criteria, the learning component of ACETON uses Long Short-Term Memory
(LSTM), which is a type of Recurrent Neural Network (RNN). Specifically, ACETON uses
an LSTM Neural Network, augmented by Attention mechanism, to construct oracles for
energy defects in Android.2 In the remainder of this section, I describe the intuition behind
why LSTM is the best DL model for construction of an energy test oracle.
7.5.2 Long Short-Term Memory (LSTM)
Neural Networks (NNs) have been widely used to recognize underlying relationships in a
set of data through a statistical process. Such systems learn to perform a task or predict
an output by considering examples (supervised learning) rather than pre-defined rules. For
example, NN algorithms have been shown to effectively identify presence of a certain object
in a given image, only by analyzing previously seen images that contain that object and
without knowing its particular properties. Neural Networks are basically a collection of
nodes, i.e., artificial neurons, which are typically aggregated into layers. The network forms
by connecting the output of certain neurons in one layer to the input of other neurons in
the predecessor layer, forming a directed, weighted graph. Neurons and their corresponding
edges typically have a weight that adjusts as the learning proceeds. “Classic” NNs transmit
information between neurons in a single direction, thereby are not effective in dealing with
sequential data.
Recurrent Neural Networks (RNNs) are specific type of NNs that have shown to be effective
in solving large and complex problems with sequential data, e.g., speech recognition, transla-2Our preliminary experiments showed that traditional Machine Learning techniques, e.g., Decision Tree
or Support Vector Machine, are not suitable for sequential data, as they cannot produce results in a reasonablenumber of epochs for most cases and when they do, they yield very poor precision and recall for the oracle.
132

tion, and time-series forecasting. They are networks with loops in them, which allows them
to read the input data one sequence after the other. That is, if the input data consists of a
sequence of length k, RNN reads the data in a loop with k iterations. Figure 7.3-a shows
the architecture of an RNN on the left, which is unfolded over time on the right. While the
chain-like nature of RNNs enables them to reason about previous sequences, basic RNNs are
unable to learn long-term dependencies due to the Vanishing Gradient problem [72].
Learning long-term dependencies is essential in the energy oracle problem, defect patterns
should persist for some time in order to be considered a defect. For example, registering
a GPS listener that listens to location updates as frequently as possible—by setting the
time and distance parameters of requestLocationUpdates() to 0—is an example of
an energy defect [125]. The pattern of this defect may involve GPS Registered and High
Frequency sub-entries in the SV (Figure 7.2), i.e., turn their corresponding value to “1”
as an app registers the listener. However, simply observing that pattern in a sampled SV
does not necessarily entail an energy defect. That is, if developer registers a high frequency
location listener in a short-lived Broadcast Receiver or Service, or set a short timeout to
unregister it, the pattern does not impact the battery life, hence, should not be considered
a defect. In other words, the pattern should persist among several consecutive SVs during
the execution of a test, or persist after the test terminates to be an energy defect.
LSTM networks are special kind of RNNs that are capable of learning long-term dependen-
cies [120], thereby can remember the patterns that will persist. Similar to classic RNNs,
LSTMs have the form of a chain of repeating modules of neural network, as shown in Fig-
ure 7.3-b. However, the repeating module in LSTM (right hand side of Figure 7.3-b) has
a different structure compared to that of RNN (right hand side of Figure 7.3-a). While
RNNs have a single NN layer (demonstrated by black rectangle), LSTMs have four of them,
which are interacting in a special way to create an internal memory state. The combination
133

SV index SV index SV index SV index(a) (b) (c) (d)
Atte
ntio
n W
eigh
t
Figure 7.4: Visualization of Attention Weight vector for energy defects related to a) CPU, b)Display, c) Location, and d) Network
of layers enable LSTM to decide what information to throw away and what to keep, i.e.,
empowering LSTM to remember what it has learned till present.
The LSTM layer consists of several LSTM modules that take a sequence of SVs as input
and generate an output vector,# »
hm. A regular classification algorithm projects this output
to the classification space, with dimensions equal to the number of classes, and then applies
a probabilistic function, a.k.a. softmax, to normalize the values between [0, 1] and generate
a label. However, to produce more accurate labels, ACETON takes# »
hm as an input to an
additional layer, i.e., Attention layer, as discussed next.
7.5.3 Dataset Curation
A DL approach requires the availability of large amounts of high quality training data, i.e.,
a large dataset with diverse types of energy defects in mobile apps accompanied by test
suites that reveal their existence. I present a novel usage of mutation testing to curate such
dataset. Specifically, I used µDroid, an energy-aware mutation testing framework designed
for Android [125]. The rationale behind this choice includes:
(1) µDroid can provide us with a large, diverse, and high quality dataset. The mutation
operators of µDroid are designed based on the most comprehensive energy defect model for
Android to date, which is constructed from real energy defects obtained from several dozens
of Android apps. These defects have been shown to strongly associate with previously
134

unknown real energy defects in apps that were different from those where the defect model
was derived from. µDroid also comes with a set of high quality developer-written passing
and failing tests, which are essential for generating a labeled dataset for our classification
problem. Each pair of 〈mutant, test〉 from µDroid contributes one data point for our dataset.
(2) µDroid categorizes mutants based on the hardware components that they misuse, pro-
viding us with fine-grained labels for failing tests, namely Pass, FailBluetooth, FailCPU ,
FailDisplay, FailLocation, FailNetwork, and FailSensor, to perform additional analysis and ver-
ify the validity of the DL model (see Section 7.6).
7.5.4 Attention Mechanism
While LSTMs have memory, their performance drastically degrades as the length of sequences
gets longer, known as the long sequence problem in the literature [82]. Attention mechanism
is a method for making LSTMs overcome this challenge by reminding the network where it
has previously looked as it performs its task [65]. Thereby, no matter how long the sequences,
LSTM knows where it has focused and decides what to do next based on that information.
In addition to solving the long sequence problem, Attention mechanism is extensively used
in the deep learning community to resolve the explainability of neural networks.
The responsibility of Attention layer is to generate an Attention Weight vector,# »
AW =
〈w0, w1, . . . , xm〉, and adjust the weights as SVs are sequentially being fed to the LSTMs.
Once the oracle receives all the SVs,# »
AW contains weight values corresponding to each SV.
ACETON uses soft attention, where wi values in# »
AW are between 0 and 1 and∑m
i=0wi = 1.
Thereby, it provides a convenient probabilistic interpretation of which SVs in the test case
the oracle has relied on to determine the outcome of a given test. For example, if ACETON
decides a test fails due to a location-related energy defect, i.e., predicts FailLocation label for
it, I expect that the highest weights in# »
AW belong to SVs in which Location sub-entries
135

were actively changed as the test executed. If so, the model proves to focus on relevant
sequences to predict the outcome. Otherwise, it has learned an incorrect pattern and might
be invalid.
7.6 Attention Analysis
Interpretability of DL models is essential, as they are highly vulnerable to the data leakage
problem [135]. Data leakage causes a model to create unrealistically good predictions based
on learning from irrelevant features. A famous example of data leakage is a cancer predictive
model that makes its decision based on the lab’s label on the X-Ray, rather than focusing
on the content of X-Ray itself. While this model may make good predictions, it is invalid.
To ensure validity of a model, it is hence crucial to determine the features that impact its
decision and verify they are relevant.
Utilization of Attention by itself improves the performance and accuracy of the energy oracle.
ACETON takes advantage of Attention layer’s product, i.e., Attention Weight vector to
identify a set of features that ACETON’s model has focused on to predict a label. This
set can be used for two purposes: (1) verify validity of the learned model, and (2) enhance
energy fault localization.
Algorithm 7.1 presents ACETON’s approach for Attention Analysis. For a given failing
test, ti, it takes the sequence of SVs,# »
Seqi = 〈SV0, SV1, . . . , SVm〉, Attention Weight vector,
# »
AWi, and predicted label, li, as input, and produces a list of features that were involved in
the decision, i.e., attended features, as output. The algorithm starts by identifying a subset
of SVs in# »
Seqi that the oracle has attended to decide the label,# »
Seq′i = 〈SVn, . . . , SVk〉, 0 <
n ≤ k < m (Line 2), and determines the features that are common between SVs in# »
Seq′i
to construct Commonsi (Line 3). Next, the Algorithm takes the predecessor to the first
136

Algorithm 7.1: Attention Analysis Algorithm
Input: SV sequence of a failing test# »
Seqi, Predicted label li, Attention Weight vector# »
AWi
Output: Attended Features Featuresi1 Featuresi ← ∅2
# »
Seq′i ← getAttendedSV s(Seqi, AWi)3 Commonsi = getCommonAttendedFeatures(Seq′i)4 Predi ← getPredecessor(Seq′i)5 foreach 〈fx, vx〉 ∈ Commonsi do6 v′x ← getFeatureV alue(fx, P redi)7 if v′x 6= vx then8 Featuresi ← Featuresi ∪ fx
9 ci ← getAttendedCategory(Featuresi)10 if ci matches li then11 return Featuresi
12 else13 return ∅
element in# »
Seq′i, Predi = SVn−1 (Line 4), and compares the values of features in Commonsi
with that of in Predi’s features to identify attended features, Featuresi (Lines 5-8).
Finally, Algorithm 7.1 extracts the SV category corresponding to the attended features, ci
(Line 9). If li matches the attended category, ci, Algorithm 7.1 verifies that the model
attended to the features relevant to the type of defect and returns Featuresi (Lines 10-11).
Otherwise, it returns an empty set, as the model has attended to the incorrect SVs and
might be invalid (Lines 12-13).
To explain the intuition behind Algorithm 7.1, consider Figure 7.4, which visualizes# »
AW for
four samples of our dataset, related to energy defects that engage CPU, Display, Location,
and Network. Figure 7.4-a is for an energy defect related to the CPU, which utilizes CPU
when the app is paused, i.e., goes in the background. In this example, the spike in the
attention weights that remains for some time corresponds to when the test puts an app in
the background. Figure 7.4-b is for an energy defect related to the Display that increases
the display brightness to the max during app execution. The spike in this Figure is where
the app increases the screen brightness by setting the screen flag. As the app terminates,
137

Android clears the flag and the brightness goes back to normal, thereby, the attention of
the model also fades. Figure 7.4-c is for an energy defect related to the Location, where the
developer registers a listener for receiving location updates with high frequency and forgets
to unregister the listener when the app terminates. In this case, attention of the model goes
up at the SV index in which the app registers the listener and does not drop even when
the test terminates. Finally, Figure 7.4-d is for a Network energy defect, where the app
fails to check for connectivity before performing a network task. When there is no network
connection available, the app still performs a signal search, which consumes an unnecessary
battery consumption. In Figure 7.4-d, the attention of model lasts shorter compared to other
examples, as searching for the signal is effective for a short period of time, compared to the
length of test. Thereby, it appears in few sampled SVs.
As shown in Figure 7.4, depending on where the energy defects in these energy-greedy apps
occur, how much they last, and whether their impact remains when a test terminates or not,
attention of the model to the sampled SVs varies. However, there is one pattern common
among them. There is always a sharp jump in the attention weights, which indicates where
the model starts to notice the pattern. The spike of attention either remains until end or
sharply drops after some time. To that end, Algorithm 7.1 sets SVn as the start of the biggest
jump in the weights in# »
AWi, and SVk as the end of biggest drop following the sharpest jump.
If there is no sharp drop until the end of# »
AWi, Algorithm 7.1 sets SVk to the last SV in Seqi,
i.e., SVm. The SVs between SVn and SVk construct Seq′i.
The next step after identifying the attended SVs is to determine the attended fea-
tures. To that end, Algorithm 7.1 first collects the features that are common (i.e., have
the same value) among all SVs in# »
Seq′i to construct Commonsi. Formally speaking,
Commonsi := { 〈fx, vx〉 | ∀SVj ∈# »
Seq′i, fx.vx = 1 ∨ fx.vx = 0 }. That is, Commonsi is a set
of pairs 〈fx, vx〉, where the value vx of each feature fx among all the SVs in# »
Seq′i is always
0 or always 1. While these features are common among the attended SVs, not all of them
138

are relevant to the final decision of the oracle. For example, Commonsi is very likely to
contain Display On feature in most cases, as test execution happens when the display is on.
However, this feature should not appear in the attended features if a test that fails due to a
Network misuse.
To exclude the irrelevant features, Algorithm 7.1 refers to SVn−1, which is the predecessor
to the first SV in# »
Seq′i. The intuition here is that SVn ∈# »
Seq′i is where the model starts
to attend, indicating a change in the state of lifecycle and hardware elements that cause
the energy defect. Hence, SVn−1 indicates a safe state with no energy defect. For each fx
in Commonsi, Algorithm 7.1 finds the value of its corresponding feature in SVn−1. If that
value is different from vx, Algorithm 7.1 adds it to the attended features Featuresi.
Once the list of attended features is extracted, Algorithm 7.1 identifies the category corre-
sponding to those features by referring to the high-level structure of SV (recall Figure 7.2).
For example, if Featuresi contains Enabled, Connected/Connecting, and Bonded/Paired fea-
tures, category ci is set to Bluetooth. If the predicted category for the given test, li, matches
ci, we determine that the model has attended to the right features to decide the label.
Attended features can be viewed as the footprint of energy defects on the app’s lifecycle
and hardware states, i.e., Defect Signature. Thereby, in addition to verifying the validity
of the oracle, they can be used by developers to enhance the fault localization process. In
fact, knowing the fine-grained properties of the app lifecycle and hardware elements that are
involved in the manifestation of an energy defect can focus the developers effort on parts
of the code that utilizes Android APIs related to them, making the identification of the
root cause easier. For example, if the defect signature contains GPS Registered and High
Frequency features from the Location category, developers are provided with strong hints
that parts of the program that register location listeners for GPS and adjust the frequency
of receiving location updates are culpable for the energy defect.
139
7.7 Evaluation
I investigate the following five research questions in the evaluation of ACETON:
RQ1. Effectiveness : How effective is the generated test oracle for detection of energy defects
in Android apps?
RQ2. Usage of Attention Mechanism: To what extent usage of Attention Mechanism im-
proves the performance of the model? What features impact the oracle’s decision?
RQ3. Detection of Unseen Energy Defects : To what extent can ACETON detect unseen
energy defect types, i.e., those that are not in the training dataset?
RQ4. Reusability of the Oracle: Can the generated oracle be used to detect energy issues on
different apps and mobile devices?
RQ5. Performance: How long does it take for ACETON to train and test a model?
7.7.1 Experimental Setup
Dataset: µDroid dataset contains 413 mutants from various categories of energy defects
and comes with 329 high quality tests generated by Android developers, making it suitable
to generate our dataset. Each pair of 〈mutant, test〉 from µDroid serves as a data point
in our Labeled Database (Figure 7.1). µDroid provides only passed or killed labels for its
tests. I transformed the killed label into a more fine-grained label in our approach (ref.
Section 7.5.3), based on the high-level categories related to the hardware components that
the mutants misuse. That is, if the killed mutant belongs to Bluetooth category in µDroid,
I change its label to FailBluetooth. In addition, I removed the mutants that were reported as
equivalent by µDroid, as well as mutants which could not be killed by test suites, leaving us
140

with 295 mutants containing 22 types of energy defect. The first six columns of Table 7.1 show
details about the properties of the Labeled Database. Overall, the Labeled Dataset contains
16, 347 instances of 〈mutant, test〉, where 9, 266 of them are passing and 7, 081 are failing.3
I executed each instance using Sequence Collector component and collected corresponding
SVs for each instance to generate our final dataset. Table 7.1 shows the details of µDroid’s
dataset.
DL Engine Configuration: I implemented our learning model using PyTorch [177], an
open-source ML library for Python. There are multiple parameters in the implementation
that impact the performance of a DL model. One of them is the loss function, which
determines how well the algorithm approaches to learn a model. While Cross-Entropy is
the most commonly used loss function for classification problems [213], it was not the best
option in this problem due to the imbalanced nature of our dataset, i.e., the number of
passing instances in our database is higher than failing ones. Thereby, I used Weighted
Cross-Entropy [145] loss function to enforce model focus on minority classes. To enhance
the performance, I utilize Adam optimizer [138] to update the network weights and minimize
this loss function iteratively. Overfitting can also have a negative impact on the performance
of a model. To overcome Overfitting and ensure the generalization of the model on new data,
I use early stopping technique [181]. That is, I track the performance of the trained model on
the validation dataset at each epoch and stop the training if there is an increasing trend in the
validation loss in 2 consecutive epochs. Thereby, I get a model with the least validation loss.
I have also followed the 10-fold cross validation methodology in evaluating the performance
of oracle.
For hyperparameter tuning, I conducted a guided grid search strategy to find a configuration
for the model that results in the best performance on the validation data. One of the3The actual size of Labeled Dataset in the context of DL is 1, 961, 640 = 16, 347 × 120, as each
〈mutant, test〉 consists of 120 SVs, where the model should consider each of them to generate a correctlabel. For the sake of simplicity, I only report the size of 〈mutant, test〉 pairs.
141

Tab
le7.
1:P
rop
erti
esof
Lab
eled
Dat
abas
e,le
arned
def
ect
sign
ature
s,an
dACETON
’sp
erfo
rman
ceon
unse
endef
ects
.
Hard
ware
Cate
gory
Su
bca
tegory
IDD
efec
tD
escr
ipti
on
#M
uta
nts
#In
stan
ces
Def
ect
Sig
natu
reU
nse
enR
ecall
Failin
gP
ass
ing
Blu
etooth
B1
Un
nec
essa
ryact
ive
Blu
etooth
conn
ecti
on
s5
83
110
BE
=0,
BC
=1,
(AP∨
AD∨
SS
)=
193.0
4
B2
Fre
qu
entl
ysc
an
for
dis
cover
ab
led
evic
eB
S=
1,
BT
I=
182.5
4
B3
Kee
pd
isco
ver
ing
for
dev
ices
wh
enn
ot
inte
ract
ing
BE
=1,
BS
=1,
AP
=1
83.3
3
CP
U
C1
Hig
hC
PU
uti
liza
tion
51
1704
2022
CP
UA
=1,
PE
=1,
CP
UU
=1,
Ch
arg
ing
=0,
BT
I=
1,
BO
=1,
(AP∨
AD∨
SR
)=
199.6
4
C2
Hig
hC
PU
uti
liza
tion
wh
enb
att
ery
islo
wC
PU
A=
1,
PE
=1,
CP
UU
=1,
Ch
arg
ing
=0,
BV
L=
1,
BT
I=
1,
BO
=1
(AP∨
AD∨
SR
)=
199.1
2
C3
Hig
hC
PU
uti
liza
tion
wh
enn
ot
inte
ract
ing
CP
UA
=1,
PE
=0,
CP
UU
=1,
Ch
arg
ing
=0,
BT
I=
1,
BO
=1,
(AP∨
AD∨
SR
)=
198.8
5
C4
Act
ive
CP
Uw
akel
ock
wh
ile
not
inte
ract
ing
AD
=1,
CP
UW
=1
6.7
*
Dis
pla
yD
1F
ailin
gto
rest
ore
lon
gsc
reen
tim
eou
t90
1506
2458
DLT
=1,
(AP∨
AD
)=
1-
D2
Maxim
um
scre
enb
rightn
ess
set
by
ap
pD
SB
B=
1,
AR
=1
-
Loca
tion
L1
Hig
hfr
equ
ency
Loca
tion
up
date
91
2632
3195
(GL∨
NL
)=
1,
HF
LU
=1,
GO
=1,
LK
LA
=1,
(US∨
UW
)=
197.6
2
L2
Un
nec
essa
ryacc
ura
teL
oca
tion
Lis
ten
erG
L=
1,
NL
=1,
LK
LA
=1,
GO
=1,
(US∨
UW
)=
1,
UD
=0
99.5
3
L3
Act
ive
GP
Sw
hen
not
inte
ract
ing
(GL∨
NL
)=
1,
LK
LA
=1,
GO
=1,
(AP∨
AD
)=
1,
UD
=0
82.0
1
L4
Neg
lect
ing
Last
Kn
ow
nL
oca
tion
GL
=1,
LK
LA
=1,
HF
LU
=1,
GO
=1,
UD
=0
100
Net
work
N1
Fail
toch
eck
for
con
nec
tivit
y
46
824
1321
WS
=1,
WA
=0,
WC
=0
5.2
1*
N2
Fre
qu
entl
ysc
an
for
WiF
iW
S=
1,
WC
=1,
BT
I=
0,
AP
=1
100
N3
Sca
nn
ing
for
WiF
iw
hile
not
inte
ract
ing
WS
=1,
WA
=1,
(AP∨
AD
)=
133.3
3*
N4
Usi
ng
cellu
lar
over
WiF
iis
availab
leW
A=
1,
WC
=0,
RA
=1,
RC
=1,
(SG
o∨
SG
r)=
197.3
7
N5
Lon
gT
imeo
ut
for
Corr
up
ted
Con
nec
tion
WA
=1,
WC
=1,
ICW
=1,
(AP∨
AD
)=
196.1
5
N6
Act
ive
WiF
iw
akel
ock
wh
ile
not
inte
ract
ing
WA
=1,
WC
=1,
NA
B=
1,
(WL
S∨
WL
HP
)=
1,
(AP∨
AD
)=
198.0
8
N7
Imp
rop
erH
igh
Per
form
an
ceW
iFil
ock
WA
=1,
WC
=1,
SP
=1,
WL
HP
=1,
(AP∨
AD
)=
1100
Sen
sor
S1
Un
nec
essa
ryact
ive
sen
sors
12
332
160
SA
=1,
(AP∨
AD
=1)
96.4
7
S2
Fast
del
iver
yw
akeu
pse
nso
rsS
A=
1,
WF
DS
=1,
AS
Acc
=1,
AS
Pre
=1,
AS
Mag
=1
94.0
7
Tota
l-
-295
7081
9266
--
Table
Legend:
AD
:A
ctiv
ity
Des
troyed
,A
P:
Act
ivit
yP
au
sed
,A
R:
Act
ivit
yR
un
nin
g,
BE
:B
luet
ooth
En
ab
led
,B
C:
Blu
etooth
Con
nec
ted
,B
S:
Blu
etooth
Sca
nn
ing,
BT
I:B
att
ery
Tem
per
atu
reIn
crea
sin
g,
BO
:B
att
ery
Over
hea
t,B
VL
:B
att
ery
Ver
yL
ow
,C
PU
A:
CP
UA
wake,
CP
UU
:C
PU
Uti
lize
d,
CP
UW
:C
PU
Wakel
ock
,D
LT
:D
isp
lay
Lon
gT
imeo
ut,
DS
BB
:D
isp
lay
Scr
een
Bri
ghtn
ess
Bri
ght,
GL
:G
PS
Lis
ten
er,
HF
LU
:H
igh
Fre
qu
ency
Loca
tion
Up
date
,G
O:
GP
SO
n,
LK
LA
:L
ast
Kn
ow
nL
oca
tion
Availab
le,
LC
T:
Long
Con
nec
tion
Tim
eou
t,N
L:
Net
work
Lis
ten
er,
NA
B:
Net
work
Act
ive
Back
gro
un
d,
PE
:P
roce
ssE
xis
ts,
RA
:R
ad
ioA
vailab
le,
RC
:R
ad
ioC
on
nec
ted
,S
Go:
Sig
nal
Good
,S
Gr:
Sig
nal
Gre
at,
SP
:S
ign
al
Poor,
SA
:S
enso
rA
ctiv
e,S
S:
Ser
vic
eS
top
ped
,W
A:
WiF
iA
vail
ab
le,
WC
:W
iFi
Con
nec
ted
,W
LS
:W
akel
ock
Sca
nn
ing,
WL
HP
:W
akel
ock
Hig
hP
erfo
rman
ce,
WS
:W
iFi
Sca
nn
ing,
UD
:U
ser
Dri
vin
g,
US
:U
ser
Sti
ll,
UW
:U
ser
Walk
ing,
WF
DS
:W
akeu
pF
ast
Del
iver
yS
enso
r,A
SA
cc=
Act
ive
Acc
eler
om
eter
Sen
sor,
SP
re:
Act
ive
Pre
ssu
reS
enso
r,A
SM
ag:
Act
ive
Magn
etic
Sen
sor
142

Tab
le7.
2:C
ompar
ing
abilit
yof
AC
ET
ON
indet
ecti
ng
the
cate
gory
ofdiff
eren
ten
ergy
def
ects
(*in
dic
ates
the
wro
ng
pre
dic
tion
s)
ACETON
wit
hA
tten
tion
ACETON
wit
hou
tA
tten
tion
Pas
sB
luet
oot
hC
PU
Dis
pla
yL
oca
tion
Net
wor
kS
enso
rP
ass
Blu
etoot
hC
PU
Dis
pla
yL
oca
tion
Net
wor
kS
enso
rP
ass
916
00
03*
00
903
01*
2*3*
9*1*
Blu
etooth
08
00
00
04*
80
00
00
CP
U0
016
80
00
00
016
70
00
0D
isp
lay
00
0150
00
00
00
148
00
0L
oca
tion
00
00
258
00
1*0
00
258
00
Net
wor
k0
00
00
800
00
00
071
0S
enso
r0
00
00
032
80
00
00
31
Pre
cisi
on
(%)
99.6
710
010
0100
100
100
100
98.2
666
.67
100
100
99.6
110
079
.49
Rec
all(
%)
100
100
100
100
98.8
510
010
098
.58
100
99.4
98.6
798
.85
88.7
596
.88
Tab
le7.
3:ACETON
’sp
erfo
rman
ceon
det
ecti
onof
real
def
ects
.
Ap
ps
a2d
p.V
olG
talk
Op
enb
map
Op
enC
amer
aS
enso
riu
mU
shah
idi
Ver
sion
8624
c4f
8231d
4d
4767
d64
dce
8b85
c0f8
fa2
5ce2
d94
56c3
a67
14d
166f
f724
21f
1.0
e153
fdf
94c9
a8d
94c9
a8d
4f20
612
Def
ect
Typ
eL
oca
tion
Loca
tion
Blu
etoot
hC
PU
Loca
tion
CP
UC
PU
CP
UN
etw
ork
Dis
pla
yC
PU
CP
UC
PU
Loca
tion
Lab
elL
oca
tion
Loca
tion
Blu
etoot
hC
PU
Loca
tion
CP
UC
PU
CP
UN
etw
ork
Dis
pla
yC
PU
CP
UC
PU
Loca
tion
143
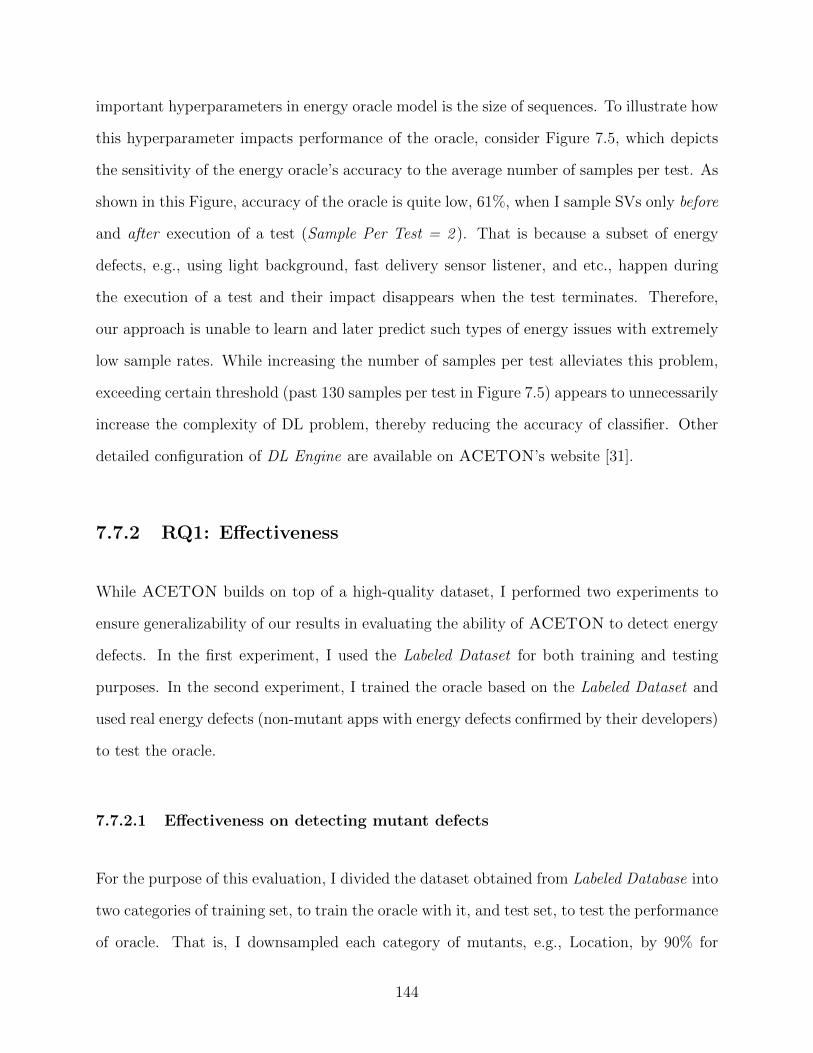
important hyperparameters in energy oracle model is the size of sequences. To illustrate how
this hyperparameter impacts performance of the oracle, consider Figure 7.5, which depicts
the sensitivity of the energy oracle’s accuracy to the average number of samples per test. As
shown in this Figure, accuracy of the oracle is quite low, 61%, when I sample SVs only before
and after execution of a test (Sample Per Test = 2 ). That is because a subset of energy
defects, e.g., using light background, fast delivery sensor listener, and etc., happen during
the execution of a test and their impact disappears when the test terminates. Therefore,
our approach is unable to learn and later predict such types of energy issues with extremely
low sample rates. While increasing the number of samples per test alleviates this problem,
exceeding certain threshold (past 130 samples per test in Figure 7.5) appears to unnecessarily
increase the complexity of DL problem, thereby reducing the accuracy of classifier. Other
detailed configuration of DL Engine are available on ACETON’s website [31].
7.7.2 RQ1: Effectiveness
While ACETON builds on top of a high-quality dataset, I performed two experiments to
ensure generalizability of our results in evaluating the ability of ACETON to detect energy
defects. In the first experiment, I used the Labeled Dataset for both training and testing
purposes. In the second experiment, I trained the oracle based on the Labeled Dataset and
used real energy defects (non-mutant apps with energy defects confirmed by their developers)
to test the oracle.
7.7.2.1 Effectiveness on detecting mutant defects
For the purpose of this evaluation, I divided the dataset obtained from Labeled Database into
two categories of training set, to train the oracle with it, and test set, to test the performance
of oracle. That is, I downsampled each category of mutants, e.g., Location, by 90% for
144

training, and used the remaining 10% for testing. While our feature vector is designed to
reflect information that is app independent—not dependent to usage of specific APIs or
code constructs—I ensured that during downsampling, the mutants in the test set belong to
different apps compared to that used in the training set. This strategy accounts for overfitting
and potential bias in favor of specific apps. I select Precision and Recall, and not Accuracy,
as metrics to measure effectiveness of ACETON in predicting correct labels, since our data
is imbalanced. With imbalanced classes, it is easy to get a high accuracy without actually
making useful predictions, as the majority class impacts true negative values. Table 7.2
shows the result for this experiment under ACETON with Attention column. These results
are obtained through a 10-fold cross validation, i.e., downsampling repeated 10 times.
Each row in this Table shows the number of test instances in a predicted class, where each
column indicates the instances in actual class. From this result I observe that: ACETON
predicts correct labels for each category with a very high precision and recall. In
fact, ACETON was able to detect all the defects related to the Sensor, Network, Display,
CPU, and Bluetooth and only missed 3 Location defects (marked by * in Table 7.2), i.e.,
identified them as passed. The average precision and recall values over all categories are
99.9% and 99.8%, respectively. Categorical precision and recall values are listed in the last
two rows.
7.7.2.2 Effectiveness on detecting real defects
While ACETON is able to effectively detect the outcome of tests in mutants, I also wanted
to see how it performs on Android apps that have real but similar energy defects. To that
end, I referred to a prior work [124], which provides a dataset of 14 Android apps with real
energy defects. Each app is accompanied by a test generated using their test generation tool,
which is manually confirmed to reproduce the energy defect. The supplementary information
in the artifact of that dataset also indicates the type of hardware element that is misused by
145

Aver
age
Rec
all
Average #Samples Per Test
Figure 7.5: Sensitivity of the oracle’s accuracy to sampling rate
the defect, which I used to identify if ACETON correctly identifies the outcome of tests.
Table 7.3 represents the results for this experiment. As shown in Table 7.3, ACETON was
able to correctly identify the outcome of tests on all subjects. This observation indicates
that ACETON can effectively detect real energy defects in mobile apps.
7.7.3 RQ2: Usage of Attention Mechanism
Recall that I use the Attention mechanism for two purposes: (1) to enhance performance of
the model; and (2) to verify validity of the model. In this research question, I evaluate to
what extent Attention mechanism affects these objectives.
To evaluate the extent of performance enhancement, I removed the Attention layer (Sec-
tion 7.5.4) of Learning Engine and repeated the experiment in Section 7.7.2.1. The result of
this experiment is shown in Table 7.2 under the ACETON without Attention column. As
corroborated by these results, removing the Attention negatively impacts the pre-
cision and recall values. For example in Network category, the recall drops to 88.75%
compared to 100% in ACETON with Attention, i.e., the model misses 9 out of 71 Network
defects. Removing Attention from ACETON also negatively impacts training time. That
146
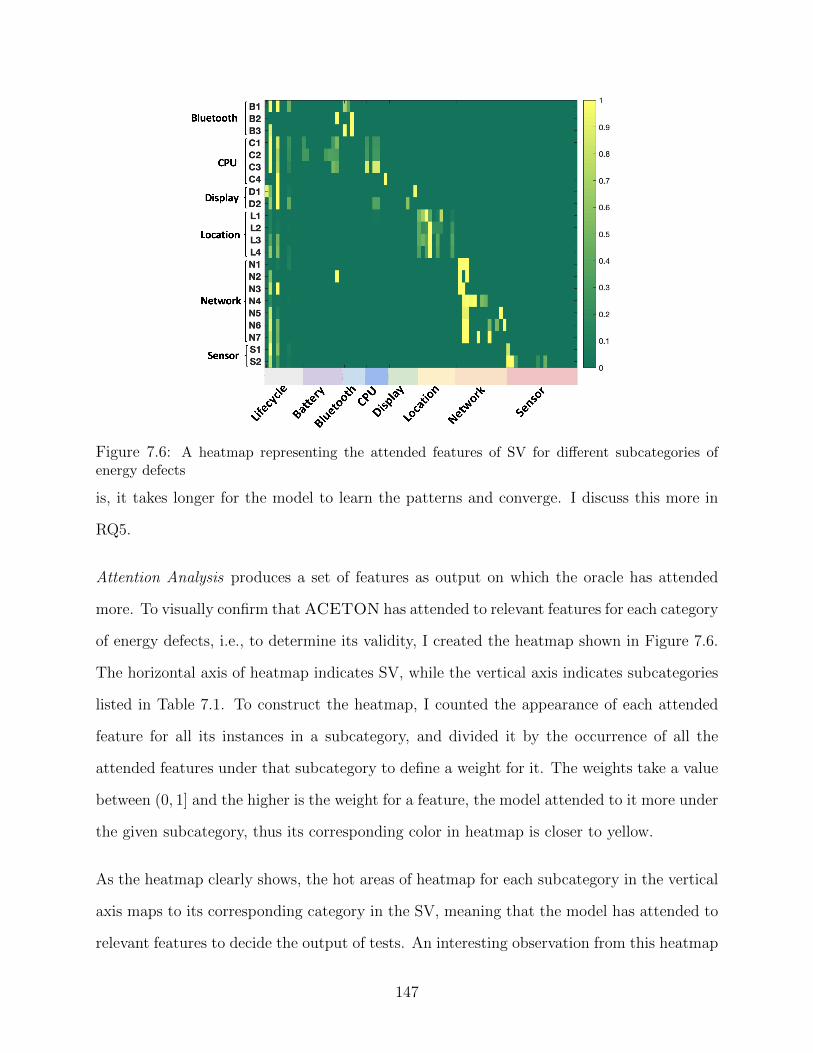
Figure 7.6: A heatmap representing the attended features of SV for different subcategories ofenergy defects
is, it takes longer for the model to learn the patterns and converge. I discuss this more in
RQ5.
Attention Analysis produces a set of features as output on which the oracle has attended
more. To visually confirm that ACETON has attended to relevant features for each category
of energy defects, i.e., to determine its validity, I created the heatmap shown in Figure 7.6.
The horizontal axis of heatmap indicates SV, while the vertical axis indicates subcategories
listed in Table 7.1. To construct the heatmap, I counted the appearance of each attended
feature for all its instances in a subcategory, and divided it by the occurrence of all the
attended features under that subcategory to define a weight for it. The weights take a value
between (0, 1] and the higher is the weight for a feature, the model attended to it more under
the given subcategory, thus its corresponding color in heatmap is closer to yellow.
As the heatmap clearly shows, the hot areas of heatmap for each subcategory in the vertical
axis maps to its corresponding category in the SV, meaning that the model has attended to
relevant features to decide the output of tests. An interesting observation from this heatmap
147

is that lifecycle features, specifically Activity Paused, Activity Destroyed, and Service Stopped,
frequently appear in the attended features. This shows that energy defects are not solely
related to the changes in app or hardware states, but a combination of both.
Finally, I aggregated the list of attended features for each category and formally specified
them, as shown in Table 7.1 under Defect Signature column. While our intention for deriving
defect signatures was to verify the validity of the DL model, I believe that the ability of
ACETON to extract and formalize the signatures can further help developers to localize
the energy defects, specifically for new types of energy defects that will emerge as Android
framework evolves. For example, the signature of Unnecessary Active Bluetooth Connections
shows the root cause of this issue is failing to close a Bluetooth connection (BC = 1) when
the Bluetooth is off or turning off (BE = 0), which causes battery consumption even when
the app is paused (AP = 1) or destroyed (AD = 1, SS = 1).
7.7.4 RQ3: Detecting Unseen Defect Types
While prior research question evaluated effectiveness of ACETON in detection of defect
types it was trained on, this research question investigates its ability to detect previously
unseen defect types. Generally speaking, DL models can only predict patterns that they
have been trained on. However, I hypothesize that if our oracle is trained on a subset of
defect types for a specific hardware element, it may be able to detect unseen defect types
related to that hardware as well. To that end, I excluded one subcategory listed in Table 7.1
at a time, trained the model on the energy defects related to all other subcategories among
all hardware categories, and used instances of the excluded subcategory as test data4.
Here, I use recall as an evaluation metric to evaluate effectiveness of ACETON. Precision is
not a proper metric here, since our test data only belongs to one subcategory (class) in this4I excluded Display defects from this experiment, as it has only two types of defects with no overlapping
features.
148

experiment and no false positive is generated. Column Unseen Recall in Table 7.1 shows
the result for this experiment. I can see that in the majority of the cases ACETON is
able to effectively detect previously unseen energy defect types. In fact, the recall
value for majority of the excluded sub-categories is above 93%. However, there are a few
subcategories with lower recall values, which are marked by * in Table 7.1. These are the
cases in which the attended features, i.e., defect signature, is drastically different from that
of in the training dataset. I believe as additional energy defects are included in the training
dataset of ACETON, its ability to detect previously unseen energy defects can improve too.
7.7.5 RQ4: Reusability of the Oracle
In answering prior research questions, I showed that the oracle generated by ACETON
is reusable among different apps. Here, I investigate if the oracle is also reusable across
different mobile devices. Experiments in prior research questions were performed on a Google
Nexus 5X phone, running Android version 7.0 (API level 24). For this experiment, I used an
additional phone, Nexus 6P, running Android version 6.0.1 (API level 23). These two devices
are not only different in terms of Android version, but they also have different hardware
configurations, e.g., different pixel density and resolution for Display, CPU frequency, RAM
size, Battery capacity, etc.
I first repeated the experiments in Section 7.7.2.1 on the new device to ensure that the oracle
model is still effective in detecting energy defects. The result of this experiment showed the
same level of precision and recall for the new oracle (average precision = 98.27%, average
recall = 99.48%). Afterwards, I wanted to see if the oracle trained on one device can correctly
predict the label of tests executed on the other device.
To that end, I split the instances of Labeled Database into two subsets, 90% of them to be used
for training and the remaining 10% for testing. Next, I trained two oracles on the mentioned
149

devices, oracle1 on Nexus 5x device and oracle2 on the Nexus 6P device, by executing the
instances in the training set and collecting their sampled SVs on the corresponding device.
Similarly, I executed instances of test dataset on both devices, test1 on Nexus 5x and test2
on the Nexus 6P. I then evaluated test1 using oracle2 and test2 using oracle1. The average
precision and recall values for test1 on oracle2 are 99.95% and 99.81%, respectively. Similarly,
oracle1 was able to detect the labels for test2 with an average precision of 99.89% and recall
of 99.45%. These results confirm that our energy oracles are device independent, hence,
reusable.
I also performed a statistical one-sample t-test to investigate the correlation between the
correct prediction of labels for tests using an oracle trained on another device. For each
test case in test1 and test2, I calculated two values, d1 and d2, which indicate whether the
oracle has correctly predicted the label. That is di = 0 if the prediction is wrong, and di = 1
otherwise. Finally, I constructed pairs of 〈d1i , d2i〉 and defined uniformityi = |d1i − d2i|.
Our null hypothesis assumes that the average value for uniformity metric to be 0, i.e., an
oracle trained on one device can correctly predict the label of a test executed on the other
device. To avoid type II error, accepting a false null-hypothesis, I excluded all the pairs in
which d1i = d2i = 0. These pairs indicate cases where the oracle failed to predict the correct
label on both test1 and test2.
Among a total of 1, 615 pairs of 〈d1i , d2i〉, none was observed in which d1i = d2i = 0, i.e.,
incorrectly labeled on both devices, while in 99.4% of them d1i = d2i = 1, i.e., correctly
labeled on both devices. In the remaining 0.06%, the test was not correctly labeled by either
oracle1 or oracle2. Furthermore, to determine the strength of correlation between correct
predictions on different devices, I used one-sample t-test. The result of one-sample t-test
over 1, 615 pairs confirmed that there is a statistically significant correlation between the
correct prediction of labels for tests using an oracle trained on another device (p-value =
150

Figure 7.7: F1 Score of ACETON with and without Attention captured during the training phase
0.0013 with significance level p < 0.01). Small p-value and large number of samples confirm
that the results are unlikely to occur by chance.
7.7.6 RQ5: Performance
To answer this research question, I evaluated the time required to train and test the oracle.
I ran the experiments on a laptop with 2.2 GHz Intel Core i7 CPU and 16 GB RAM. It
took 4.5 minutes on average for ACETON to train an energy oracle on the whole dataset,
while it took only 37.6 milliseconds on average for the trained oracle to predict the label
of tests in our experiments. In addition, I examined to what extent Attention Mechanism
speeds up ACETON’s learning. To that end, I disabled the early-stopping criterion (recall
Section 7.7.1) and tracked the F1 Score of the following two models during their training:
ACETON with Attention and ACETON without Attention. As shown in Figure 7.7, ACE-
TON without Attention requires more time to train a model that achieves a comparable F1
Score as ACETON with Attention. In fact, even after 14 minutes of training, ACETON
without Attention was not able to match the F1 Score of ACETON with Attention. These
results confirm that ACETON is sufficiently efficient for practical use.
151

7.8 Discussion
Energy efficiency is an increasingly important quality attribute for mobile apps that should
be properly tested. Recent advancements in energy testing have in large part focused on
test input generation, and not on the automated construction of test oracles. The key
challenge for the construction of energy test oracles is derivation of reusable patterns that
are indicative of energy defects. This chapter introduced ACETON, the first approach for
automated construction of energy test oracles that leverages Deep Learning techniques to
learn such patterns. The experimental results show that the energy oracle constructed using
ACETON is highly reusable across mobile apps and devices, achieves an overall accuracy
of 99%, and efficiently detects the existence of energy defects in only 37 milliseconds on
average.
152

Chapter 8
Energy-Aware Test-Suite
Minimization
The rising popularity of mobile apps deployed on battery-constrained devices has motivated
the need for effective energy-aware testing techniques. Energy testing is generally more
labor intensive and expensive than functional testing, as tests need to be executed in the
deployment environment and specialized equipment needs to be used to collect energy mea-
surements. Currently, there is a dearth of automatic mobile testing techniques that consider
energy as a program property of interest. This chapter presents an energy-aware test-suite
minimization approach to significantly reduce the number of tests needed to effectively test
the energy properties of an Android app. It relies on an energy-aware coverage criterion that
indicates the degree to which energy-greedy segments of a program are tested. The proposed
solution to solve energy-aware test-suite minimization problem includes two complementary
algorithms, which will be discussed thoroughly in this Chapter.
153

8.1 Introduction
Mobile apps have expanded into every aspect of our modern life. As the apps deployed
on mobile devices continue to grow in size and complexity, resource constraints pose an
ever-increasing challenge. Specifically, energy is the most demanding and at the same time
a limited resource in battery-constrained mobile devices. The improper usage of energy-
consuming hardware components, such as Wifi and GPS, or recurring constructs, such as
loops and callbacks, can drastically drain the battery, directly affecting the usability of the
mobile device [67, 1, 2].
Recent studies [196, 118] have shown energy consumption of apps to be a major concern for
end users. In spite of that, many apps are abound with energy bugs, as testing the energy
behavior of mobile apps is challenging. To determine the energy issues in a mobile app, a
developer needs to execute a set of tests that cover energy-greedy parts of the program. This
is particularly a challenge when apps are constantly evolving, as new features are added, and
old ones are revised or altogether removed.
Energy testing is generally more time consuming and labor intensive than functional testing.
To collect accurate energy measurements, tests often need to be executed in the deployment
environment (e.g., physical mobile device), while the great majority of conventional testing
can occur on capacious development environments (e.g., device emulator running on desk-
top or cloud). With automated mobile testing tools still in their infancy, developers spend
a significant amount of their time manually executing such tests and collecting the energy
measurements. The fragmentation of mobile devices, particularly for Android, further exac-
erbates the situation, as developers have to repeat this process for each supported platform.
Thus, there is an increasing demand for reducing the number of tests needed to detect energy
issues of evolving mobile software.
154

Prior research efforts have proposed various test-suite management techniques, such as test-
suite minimization, test case selection, and test case prioritization, to help developers effec-
tively assess the quality of software. The great majority of prior techniques have focused
on the functional requirements (e.g., structural coverage and fault detection capability),
and to a lesser extent non-functional requirements. Even among the the work focusing on
non-functional properties, there is a dearth of prior work to account for energy issues.
In this chapter, I present and evaluate a novel, fully-automated energy-aware test-suite min-
imization approach to determine the minimum set of tests appropriate for assessing energy
properties of Android apps. The approach relies on a coverage criterion, called eCoverage,
that indicates the degree to which energy-greedy parts of a program are covered by a test
case. I solve the energy-aware test-suite minimization problem in two complementary ways.
I first model it as an integer programming (IP) problem, which can be solved optimally
with a conventional IP solver. Since the energy-aware test-suite minimization problem is
NP-hard, solving the integer programming model when there are many test cases is compu-
tationally prohibitive. I thus propose an approximate greedy algorithm that efficiently finds
the near-optimal solution.
This proposed approach on this chapter makes the following contributions:
• To the best of our knowledge, the first attempt at test-suite minimization that considers
energy as a program property of interest;
• An energy-aware metric for assessing the quality of test cases in revealing the energy
properties of the system under test without the need for specialized power measurement
hardware;
• A novel suite of energy-aware mutation operators that are derived from known energy
bugs, in order to evaluate the effectiveness of a test suite for revealing energy bugs;
155

• Empirical evaluation of the proposed approach over test suites for real-world apps,
corroborating the ability to reduce the size of test suites by 84%, on average, while
maintaining a comparable effectiveness of original test suite for assessing the energy
properties of Android apps and revealing energy bugs.
The remainder of this chapter is organized as follows. Section 8.2 provides a background on
energy issues in Android apps and motivates our work. Section 8.3 introduces and formu-
lates the energy-aware test-suite minimization problem. Section 8.4 provides an overview
of our approach, and Sections 8.5- 8.6 describe the details of our coverage metric and the
minimization techniques. Section 8.7 presents the implementation and evaluation of the
research.
8.2 Motivation
Energy defects are the main cause of battery drainage on mobile and wearable devices.
They are essentially faults in the program that cause the device to consume high amounts
of energy, or prevent the device from becoming idle, even when there is no user activity.
Figure 8.1 presents an example of such bugs inspired by those found in real-world Android
apps. The code snippet depicts a loop that accesses and downloads X files from a list of
servers (line 4–7), processes them (line 8), and closes the connection (line 9). Before starting
the loop, the code acquires a lock on the Wi-Fi resource (line 2) to prevent the phone from
going into stand-by during download. This implementation can result in both the wakelock
and loop bugs. Studies have shown that network components can remain in a high power
state, even after a routine has completed [179, 180]. Such a state is referred to as tail
energy. Tail energy is not an energy bug itself, but interleaving a network related code and
a CPU-intensive code in a loop can exacerbate its impact and cause energy bug.
156

Figure 8.1: Code snippet with energy bugs.
To perform energy testing and find possible energy bugs, a developer should design test cases
that cover energy-greedy segments of the program—segments that contribute more to the
energy cost of the app—and measure the energy consumption of device during execution
of those test cases. Spikes in energy measurements that last long period of time as well as
high energy consumption of a device without the user interacting with the device are good
indicators of energy bugs [67, 152].
Figure 8.2 shows the energy consumption trace of a Nexus 6, during the execution of a
test case for the code shown in Figure 8.1 that downloads five files, before (solid line) and
after (dashed line) fixing the mentioned energy bugs. Keeping the Wi-Fi connection open
during processing the files increases the average power consumption of the device (the area
under curve). Also, failing to release Wi-Fi lock keeps the device awake and the phone keeps
consuming energy, even after a routine has completed. By splitting the single loop into two
loops to fix the loop bug (one for downloading all the files first and one for processing them
later) and releasing the Wi-Fi wakelock after downloading files to fix the wakelock bug, the
average power consumption of test case is decreased and the power state of the device before
and after execution of test case remains the same.
Testing non-functional properties, particularly energy consumption, which is recently gaining
substantial interests due to the increasing use of battery-constraint devices, is relatively
under-explored compared to those aimed at functional correctness [112]. A test suite of a
157

Figure 8.2: Energy consumption trace of a test case for the code snippet in Figure 8.1, before(solid line) and after (dashed line) fixing energy bugs.
mobile app is adequate for energy testing, if it can effectively find all energy bugs in the
code. That is, if test cases of a test suite cover all the energy-greedy segments of the program
that contribute to total energy cost of the app under different use-cases, the test suite is
adequate for energy testing. Detecting all the energy bugs in the program is not decidable.
For example, for a small number of data files in Figure 8.1 (X), the impact of tail energy
might be negligible. However, for a large number of such files, the loop bug occurs, which
can rapidly drains the battery of the device. As such, deciding what values for X may result
in energy bug is complicated. Testers, thus, usually settle on coverage metrics as adequacy
criteria.
The commonly used coverage metric in test-suite minimization problems, statement coverage,
is unable to discriminate among statements according to their energy consumption. Studies
have shown that energy consumption varies significantly across bytecodes [108], lines of
code [140], and system APIs [147]. That is, test cases with the same statement coverage may
cover different lines and consume different amount of energy during execution. For example,
the test case a, even with a lower statement coverage than the test case b, may demonstrate
higher energy cost, if it executes the code that utilizes energy-greedy API calls. As a result,
statement coverage is not a suitable metric for energy-aware test-suite minimization.
For an energy-aware test adequacy criterion, the energy consumption needs to be measured,
estimated, or modeled for further identification of energy inefficiencies of the code [67].
158

Prior research proposed fine-grained approaches to either measure or estimate the energy
consumption of mobile apps [140, 179]. The precise energy measurement can be used for
optimizing energy usage of an application under test. However, an intuitive metric for
assessing the quality of test case to identify energy-greedy segments is still missing. Moreover,
most techniques require power measurement hardware to measure energy cos, which comes
with technical requirements and challenges.
To overcome the limitations of structural coverage metrics, I propose a novel energy-aware
coverage metric, collectively referred as eCoverage, that indicates the degree to which energy-
greedy segments of a program are covered by a test. eCoverage discriminates among different
energy-greedy segments based on their energy cost and whether they re-execute during the
execution of test case.
8.3 Energy-Aware test-suite Minimization
To clarify our proposed idea for energy-aware test-suite minimization, I formally define the
problem as follows:
Given: (1) A program P consisting of p segments, S = {s1, s2, . . . , sp}, with m ≤ p energy-
greedy segments ∈ S ′, to be tested for assessing energy properties of P ; (2) A test suite
T = {t1, t2, . . . , tn} with each test case represented as a coverage vector ~Vti = 〈vi,1, . . . , vi,m〉,
such that vi,j is 1 if ti covers energy-greedy segment sj, and 0 if ti does not cover energy-
greedy segment sj; and (3) a non-negative function w(ti) that represents the significance of
a test case in identifying energy bugs.
Problem: Find the smallest test suite T ′ ⊆ T , such that T ′ covers all energy-greedy seg-
ments covered by T , and for every other T ′′ that also covers all energy-greedy segments
|T ′| ≤ |T ′′| and∑
ti∈T ′ w(ti) ≥∑
ti∈T ′′ w(ti).
159

Program segments are individual units of a program, which can be defined fine-grained (e.g.,
statements) or coarse-grained (e.g., methods). The energy consumption of a segment depends
mainly on the energy-greedy APIs invoked by that segment (e.g., network APIs consume
more energy than log APIs [147]) and on recurring constructs (e.g., loops or recurring call-
backs [139]). Energy-greedy segments highly contribute to the total energy consumption of
the program. Therefore, a test case that covers energy-greedy segments during its execution
has a higher significance for energy testing of app, compared to the one covering less greedy
segments.
To reduce the risk of discarding significant test cases during test-suite minimization, I calcu-
late the eCoverage of each test case. eCoverage takes a value between 0 and 1, and indicates
the degree to which energy-greedy segments of the program are covered by a test case (more
details in Section 8.5). The function w(ti) = eCoverageti in problem definition allows us to
characterize the significance of a test case ti so that I select tests with the highest eCoverage.
There might be several test cases in a test suite that cover the same energy-greedy segments.
Thereby, the original test suite T can be partitioned into subsets of T1, T2, . . . , Tm ⊆ T , such
that any test case ti belonging to Tj covers energy-greedy segment sj ∈ S ′. A representative
set of test cases that covers all of the sjs in S ′ must contain at least one test case from each
Tj; such a set is called the hitting set of T1, T2, . . . , Tm. The minimal hitting set problem is
shown to be NP-hard, using a reduction to the set covering problem [187]. Our formulation
of test-suite minimization is, therefore, an instance of weighted set cover. The original test
suite might not be intended for energy testing, rather developed for functional or structural
testing. As a result, the test cases in T might not cover all the energy-greedy segments, but
a subset of them.
160

8.4 Approach Overview
Figure 8.3 depicts our framework for energy-aware test-suite minimization, consisting of two
major components: (1) Energy-Aware Coverage Calculator (ECC) which is responsible to
calculate the eCoverage for each test case, ti, in the original test suite of the given app, using
program analysis; and (2) Energy-Aware Test-Suite Minimization (ETM) component that
identifies the minimum subset of test cases from T , suitable for energy testing of the given
app.
Our ECC component statically analyzes an app to obtain its call graph and annotates each
node of the call graph with energy cost estimates. Using the execution traces of test cases
in the available test suite, the eCoverage of each test case will be calculated by mapping
execution path information to the annotated call graph (Section 8.5).
After computing eCoverage of tests in the test suite, ETM component produces a minimized
test suite suitable for energy testing, which aids a developer by reducing the effort needed to
inspect the test results, especially for identifying energy bugs in the code. ETM component
performs the energy-aware test-suite minimization in two complementary ways, optimal yet
computationally expensive integer programming (IP) technique, and efficient near-optimal
greedy approach (Section 8.6).
Using energy-aware test-suite minimization, the search space for assessing energy properties
of the app and identifying plausible energy bugs is reduced to handful of test cases, helping
the developer in fixing such issues with less effort and time. Our framework also delivers
execution traces of test cases and energy estimate of executed energy-greedy segments, help-
ing developers to understand which sequences of invoking energy-greedy segments are more
energy consuming and to pinpoint root cause of energy bugs.
161

Figure 8.3: Energy-aware test-suite minimization framework
In the following two sections, I describe the details of the Energy-Aware Coverage Calculator
and Energy-Aware Test-Suite Minimization components.
8.5 Energy-aware Coverage calculator
For the purpose of this work, I propose eCoverage that has the following beneficial properties:
(1) it is computationally efficient to measure; (2) it can be defined at different levels of
granularity (e.g., statement, API, or method levels); and (3) measuring it does not actively
require the use of special monitoring hardware. I developed a hybrid static and dynamic
analysis approach to calculate the eCoverage.
In this research, I consider program segments (cf. Problem Definition in Section 8.3) to be
methods of a program or system APIs and thereby, the definition of eCoverage is at the
granularity of methods. For illustrating the concepts in this section, I use a hypothetical
app whose call graph is shown in Figure 8.4. Each node of the call graph is a segment,
and the colored nodes denote energy-greedy segments that highly contribute to the energy
consumption of the app.
162

Figure 8.4: Call graph of a hypothetical Android app.
Figure 8.5: Overview of the ECC component.
ECC component that is responsible to calculate the eCoverage for each test case consists
of two sub-components shown in Figure 8.5: (1) Static Model Extractor, which statically
analyzes the app to obtain its call graph; and (2) Dynamic Integrator, which collects the
execution trace of the input test case, maps it to the call graph, and annotates call graph
segments with the energy estimates in order to compute eCoverage for the given test case.
To calculate eCoverage, Static Model Extractor first extracts the app’s call graph and then
identifies energy-greedy segments—methods with at least one system API in their imple-
mentation. For a test case ti, each energy-greedy segment sj (i.e., a method in an Android
app) is then annotated by Dynamic Integrator with a segment score, scj,i, which represents
the estimated amount of energy consumption by the given segment during execution of test
163

case ti. The segment score is calculated as scj,i = rj × fj,i ×Ij,i∑k=1
ek, where rj denotes the
structural importance of energy-greedy segment sj in the call graph, fj,i represents the fre-
quency at which energy-greedy segment sj is invoked during execution of test case ti, Ij,i
is the number of system APIs in the implementation of energy-greedy segment sj invoked
during execution of test ti, and ek is a pre-measured average energy cost for an API k.
Methods reachable along more paths in a call graph are more likely to contribute to the
energy cost of the app. Thus, the Static Model Extractor component heuristically calculates
rj as the multiplication of its incoming and outgoing edges. If the segment is a sink (with no
outgoing edge) or a source (with no incoming edge), I consider only the number of incoming
or outgoing edges, respectively. For example, there are two incoming and three outgoing
edges for the segment s10 in the call graph of Figure 8.4; thus r10 = 6.
To assess the values of fj,i and Ij,i, the Dynamic Integrator component records the invocation
of methods and system APIs in a log file and counts the number of invocations for segment
sj and APIs inside it during execution of ti. For ek, our approach uses the results from [147]
to supply the average energy cost of each API.
After calculating segment scores and annotating the call graph, the Dynamic Integrator
component computes eCoverage of test case ti as follows:
eCoverageti =
m∑j=1
scj,i × vi,jm∑j=1
maxa{scj,1, . . . , scj,a}(8.1)
where m is the number of energy-greedy segments and vi,j is a binary variable denoting
whether test case ti covers energy-greedy segment sj (cf. Problem Definition). eCoverage
164

takes a value between 0 and 1. A test with a higher eCoverage is more likely to reveal the
presence of an energy bug with a substantial impact on the energy consumption of the app.
Similar to other coverage criteria, the denominator computes the ideal coverage that can
be achieved and the numerator indicates the coverage achieved by a given test case. In our
formulation of eCoverage, the numerator estimates the energy consumed by a given test
and the denominator estimates the highest energy consumed in each energy-greedy segment,
considering all the test cases in the test suite. That is, the denominator is the maximum
segment score estimated by test cases that cover the energy-greedy segment sj, for all a test
cases that cover it.
8.6 energy-aware test-suite minimization
In this section, I describe two approaches to perform energy-aware test-suite minimization
for Android apps. The first one leverages integer programming, IP, to model the problem,
and the second one is a greedy algorithm. Our proposed approaches aim to determine the
minimum set of tests appropriate for assessing energy properties of Android apps and find
possible energy bugs in the program.
8.6.1 Integer Non-linear Programming
The energy-aware test-suite minimization problem can be represented as an IP model con-
sisting of (1) decision variables, (2) an objective function, and (3) a constraint system.
165

8.6.1.1 Decision Variables
I let the binary variable ti represent the decision of whether a test case appears in the
minimized test-suite or not. That is, a value of 1 for ti indicates that the minimized test-
suite includes the corresponding test, while a value of 0 indicates otherwise. Using boolean
decision variables, the minimized test suite can be represented as an array of binary values
〈t1, t2, ..., tn〉, where n is the number of test cases in the original test suite.
8.6.1.2 Objective Function
The goal of energy-aware test-suite minimization is to reduce the size of test suite, while
maintaining the ability of the original test suite to assess energy properties of the app and
reveal energy bugs. To achieve this goal, test cases in the minimized test suite should cover
all the energy-greedy segments of the program that are covered by the original test suite. In
addition, tests should be distinguished according to their ability in identifying energy bugs
to avoid discarding important test cases during minimization. To find such a subset of the
original test suite, I formulate the objective function as follows:
minn∑
i=1
(1− eCoverageti)× ti (8.2)
where n is the number of test cases in the original test suite. Definition of objective with a
minimum function ensures that the solution is the smallest subset of original test suite. Since
eCoverageti value for a test takes a value between 0 and 1, a test with high eCoverage has low
value for 1− eCoverageti . Thereby, weighing test cases by the coefficient 1− eCoverageti
ensures selection of significant test cases such that∑
ti∈T ′ eCoverageti ≥∑
ti∈T ′′ eCoverageti
for any other subset T ′′ ⊆ T with |T ′| ≤ |T ′′| (cf. problem definition in Section 8.3). By
166
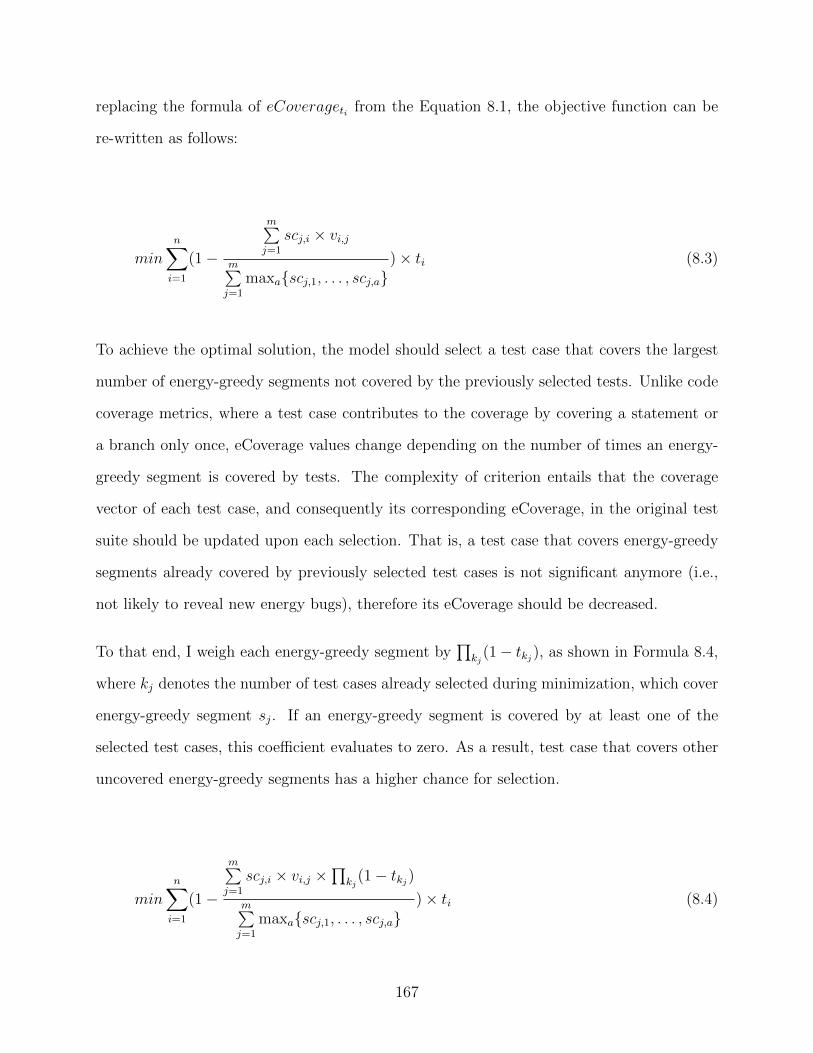
replacing the formula of eCoverageti from the Equation 8.1, the objective function can be
re-written as follows:
minn∑
i=1
(1−
m∑j=1
scj,i × vi,jm∑j=1
maxa{scj,1, . . . , scj,a})× ti (8.3)
To achieve the optimal solution, the model should select a test case that covers the largest
number of energy-greedy segments not covered by the previously selected tests. Unlike code
coverage metrics, where a test case contributes to the coverage by covering a statement or
a branch only once, eCoverage values change depending on the number of times an energy-
greedy segment is covered by tests. The complexity of criterion entails that the coverage
vector of each test case, and consequently its corresponding eCoverage, in the original test
suite should be updated upon each selection. That is, a test case that covers energy-greedy
segments already covered by previously selected test cases is not significant anymore (i.e.,
not likely to reveal new energy bugs), therefore its eCoverage should be decreased.
To that end, I weigh each energy-greedy segment by∏
kj(1− tkj), as shown in Formula 8.4,
where kj denotes the number of test cases already selected during minimization, which cover
energy-greedy segment sj. If an energy-greedy segment is covered by at least one of the
selected test cases, this coefficient evaluates to zero. As a result, test case that covers other
uncovered energy-greedy segments has a higher chance for selection.
minn∑
i=1
(1−
m∑j=1
scj,i × vi,j ×∏
kj(1− tkj)
m∑j=1
maxa{scj,1, . . . , scj,a})× ti (8.4)
167

Note that due to the multiplication of decision variables in Formula 8.4, IP formulation of
energy-aware test-suite minimization is non-linear.
8.6.1.3 Constraints
To ensure that the minimized test suite covers all the energy-greedy segments that are covered
by the original test suite, I need to certify that each energy-greedy segment is covered by at
least one of the test cases in the minimized test suite. Such constraints can be encoded in
the IP model as follows:
n∑i=1
vi,j × ti ≥ 1 (1 ≤ j ≤ m) (8.5)
where m denotes the number of energy-greedy segments and n is the available test cases in
the original test suite. The jth constraint in Formula 8.5, thus, ensures that at least one of
the test cases covering the energy-greedy segment sj will be in the minimized test suite. The
model does not require constraints on other segments, since the right hand of the constraint
is 0, which makes the constraint trivial.
8.6.2 Integer Linear Programming
There is no known algorithm for solving an integer non-linear programming (INLP) prob-
lem optimally other than trying every possible selection. Furthermore, for problems with
non-convex functions, IP solvers are not guaranteed to find a solution [197]. For all of these
reasons, I needed to investigate other options to solve the energy-aware test-suite minimiza-
tion problem.
168

I have leveraged a technique for transforming the above non-linear problem into a linear one
by adding new auxiliary variables, v′i,j, defined as vi,j ×∏
kj(1− tkj)× ti. As a result, v′i,j
takes a value of 1, if the test case ti covers the energy-greedy segment sj that is not covered
by the previously selected test cases, and 0 otherwise. The value of 1 for v′i,j stipulates
that the test case ti covers the energy-greedy segment sj, which is not covered by previously
selected test cases. If a test case does not cover sj, or if it is covered by the selected test
cases, v′i,j takes the value 0. Using auxiliary variables v′i,j, the objective function of our IP
model from Formula 8.4 can be rewritten as follows:
minn∑
i=1
(ti −
m∑j=1
scj,i × v′i,jm∑j=1
maxa{scj,1, . . . , scj,a}) (8.6)
In addition to the adjustment of objective function, I need to introduce additional constraints
to control the auxiliary variables. To ensure that v′i,j equals to 1 for energy-greedy segments
not previously covered by selected test cases and equals to 0 otherwise, I add the following
set of constraints to the model:
v′i,j ≤ ti (∀ sj covered by ti) (8.7)
n∑i=1
vi,j × v′i,j = 1 (1 ≤ j ≤ m) (8.8)
169

According to Formula 8.7, if a test case ti is not selected, then v′i,j takes a value of 0. On
the other hand, if the test case ti is selected, the variable v′i,j can take a value of either 0 (if
energy-greedy segment sj is covered by the previously selected test cases) or 1 (if sj is not
covered by the previously selected test cases). The constraint in the Equation 8.8 entails
that if sj is covered by one of the selected test cases, the value of v′i,j for any test case ti
which is not selected yet being set to 0.
The use of auxiliary variables allows us to remove the multiplication of decision variables from
the objective function. However, this transformation significantly increases the complexity
of the problem, which in turn makes it computationally expensive. The high complexity of
ILP approach for large-size problems motivated us to devise additional algorithms.
8.6.3 Greedy algorithm
Algorithm 8.1 outlines the heuristic, energy-aware test-suite minimization process. It takes
the original test suite generated for an Android app under test as input, and provides a
minimized set of test cases as output. The algorithm first iterates over tests in the test suite
and computes coverage vector (line 5) of tests as well as the coverage vector of original test
suite (line 6). It then selects the test case with highest eCoverage that covers energy-greedy
segments not yet covered by previously selected tests (lines 8–11). Afterwards, the algorithm
updates the coverage vector and eCoverage value of the remaining tests in the original test
suite (lines 12–13). This greedy process then repeats until selected test cases cover all the
energy-greedy segments that are initially covered by the original test suite.
To make the idea concrete, consider Table 8.1 that illustrates the algorithm through five
test cases t1, t2, t3, t4, and t5 for our running hypothetical app, whose call graph is shown
in Figure 6.1. Each inner table represents the coverage vector for the test cases—sorted
according to their eCoverage for a better comprehension—and the coverage vector of the
170

Tab
le8.
1:R
unnin
gex
ample
for
the
gree
dy
algo
rith
m
Iter
atio
n1:t 5
isse
lect
edIt
erat
ion
2:t 1
isse
lect
ed
Tes
tss 5
s 6s 8
s 9s 1
0s 1
1s 1
2eC
ovT
ests
s 5s 6
s 8s 9
s 10
s 11
s 12
eCov
t 20
10
10
00
0.42
t 40
00
00
01
0.01
t 11
00
10
00
0.53
t 30
10
00
01
0.04
t 30
10
01
01
0.54
t 20
10
10
00
0.12
t 40
01
01
01
0.63
t 11
00
10
00
0.23
t 50
01
01
10
0.69
t 5
~ V′ T
00
10
11
0~ V′ T
10
11
11
0
Iter
ati
on
3:t 2
isse
lect
edIt
erat
ion
4:t 3
isse
lect
ed
Tes
tss 5
s 6s 8
s 9s 1
0s 1
1s 1
2eC
ovT
ests
s 5s 6
s 8s 9
s 10
s 11
s 12
eCov
t 40
00
00
01
0.01
t 40
00
00
01
0.01
t 30
10
00
01
0.04
t 30
00
00
01
0.03
t 20
10
00
00
0.05
t 2t 1
t 1t 5
t 5
~ V′ T
11
11
11
0~ V′ T
11
11
11
1
171

Algorithm 8.1: Greedy Algorithm for Energy-Aware Test-Suite MinimizationInput: T Original Test SuiteOutput: T ′ Minimized Test Suite with the same eCoverage
1 T ′ ← {};2 ~VT ← ~0;
3 ~VT ′ ← ~0;4 foreach ti ∈ T do
5 ~Vti ← getCoverageInfo(ti);
6 ~VT ← ~VT ∨ ~Vti ;
7 while ~VT ′ 6= ~VT do8 findMax(tis ∈ {T − T ′}) based on ti.eCoverage;9 ti ← removeMax(T );
10 T ′ ← T ′ ∪ {ti};11 ~VT ′ ← ~VT ′ ∨ ~Vti ;12 foreach ti ∈ T − T ′ do13 reCalculate( ~Vti , ti.eCoverage);
minimized test suite ( ~VT ′) at one iteration of the algorithm. The first iteration selects t5
(covering segments s1, s8, s10, and s11) as the test with the highest eCoverage.
Algorithm 8.1 then updates the coverage vector of the remaining test cases. Table 8.1 shows
the updated coverage information for the test suite in iteration 2 and after the selection
of t5. Since t5 is already selected, the segments covered by t5 are no longer considered in
calculating eCoverage of remaining tests. Only the energy-greedy segments that have not
been covered by t5 (s5, s6, s9, and s12) are included. Test case t1 is then selected at the
end of iteration 2. This process repeats until selected test cases in the minimized test suite
cover all the energy-greedy segments covered by the original test suite. In this example, the
greedy approach selects t5, t1, t2, and t3 as the minimized test suite after four iterations.
The example illustrates the point that the greedy algorithm can result in sub-optimal solu-
tions. While the ILP-based approach solves this problem with three test cases, t1, t3, and t5,
to cover all the energy-greedy segments, the greedy strategy selects four test cases. This is
mainly due to the fact that the greedy algorithm starts from the test case with the greatest
eCoverage, which may lead to a local optimum solution.
172
8.7 Experimental Evaluation
In this section, I present the experimental evaluation of our proposed framework for energy-
aware test-suite minimization. Our evaluation addresses the following questions:
RQ1. Effectiveness: How effective are our proposed techniques in reducing the size of original
test suite? Is the minimized test suite as effective as the original test suite in revealing
energy bugs?
RQ2. Correlations: What is the relationship between eCoverage and statement coverage of
a test case? What is the relationship between eCoverage and energy consumption of a
test case?
RQ3. Performance: What is the performance of our prototype tool implemented atop a static
analysis framework and an IP solver? How scalable are the proposed IP and greedy
algorithms?
8.7.1 Experiment Setup
To evaluate our proposed techniques in practice, I collected real world apps from F-Droid,
a software repository that contains open source Android apps. I randomly selected 15 apps
from different categories of F-Droid repository for evaluation.
I used test cases automatically generated using Android Monkey [45]. To that end, I ran
Monkey for two hours for all apps, with configuration to generate test cases exercising 500
events (i.e., touch, motion, trackball, and system key events). I considered the test cases
generated during this time as the original test suite of apps. Prior to applying optimization
techniques, our framework requires obtaining eCoverage information about the test cases of
173

subject apps. In addition to eCoverage, I collected statement coverage information using
EMMA.
To statically analyze the apps for calculating eCoverage, Static Model Extractor (Figure 8.5)
employs the Soot framework [60, 192] that provides the libraries for Android static program
analysis. To collect the execution traces of test cases, I implemented a module using the
Xposed framework [8] that records the invocation of methods and system APIs in a log file,
which is later processed to extract information about the executed paths in each app.
In calculating eCoverage, I rely on the average energy consumption of system APIs, ek,
measured by another group [147]. These ek values are obtained by manually utilizing and
running 50 popular apps on Google Play several times, and is the average of energy con-
sumption of each API in different scenarios. The energy consumption of APIs might change
depending on the context and the device the apps are running on. Considering more devices
and context only require additional pre-measured values as an input to our ECC component,
but does not impose any change to the approach.
I used lp-solve [6], an open source mixed integer linear programming solver, to solve the IP
models, and ran the experiments on a computer with 2.2 GHz Intel Core i7 processor and
16 GB DDR3 RAM. The input files for the solver are automatically generated using the
coverage information provided by the ECC component. Our research artifacts are available
for download [31].
8.7.2 RQ1: Effectiveness
To evaluate the effectiveness of our minimization techniques, I compared the percentage of
reduction in size of original test suite for the subject apps. Additionally, I assessed the
impact of reduction on the effectiveness of the original test suite in revealing energy bugs.
174

Tab
le8.
2:L
ist
ofm
ajo
ren
ergy
bugs
inA
ndro
idap
ps
asfa
ult
model
and
corr
esp
ondin
gen
ergy
-aw
are
muta
tion
oper
ator
s
En
ergy
Bu
gT
yp
eM
uta
tion
Op
erat
orE
xam
ple
s
Wi-
Fi
wake
lock
((W
ifiM
an
ager
)get
Syst
emS
ervic
e(C
onte
xt.
WIF
IS
ER
VIC
E))
.cre
ate
Wifi
Lock
(WIF
IM
OD
ES
CA
NO
NLY
).acq
uir
e()
CP
Uw
akel
ock
((P
ow
erM
an
ager
)get
Syst
emS
ervic
e(C
onte
xt.
PO
WE
RS
ER
VIC
E))
.cre
ate
Wifi
Lock
(PA
RT
IAL
WA
KE
LO
CK
).acq
uir
e()
Sen
sor
wake
lock
((S
enso
rMan
ager
)get
Syst
emS
ervic
e(S
EN
SO
RS
ER
VIC
E))
.get
Def
au
ltS
enso
r(S
enso
rty
pe)
Rec
urr
ing
call
bac
kT
imer
.sch
edu
le(p
erio
d),
Tim
er.s
ched
ule
AtF
ixed
Rate
(per
iod
)
Rec
urr
ing
call
bac
kS
ched
ule
dT
hre
ad
PoolE
xec
uto
r.sc
hed
ule
AtF
ixed
Rate
(per
iod
),
Rec
urr
ing
call
back
Ala
rmM
an
ager
.set
Rep
eati
ng(i
nte
rvalM
illis)
,A
larm
Man
ager
.set
InE
xact
Rep
eati
ng(i
nte
rvalM
illi
s)
Loop
Java
loop
con
stru
cts
e.g.,
wh
ile
an
dfo
r
Tab
le8.
3:E
ffec
tive
nes
sof
ener
gy-a
war
ete
st-s
uit
em
inim
izat
ion
appro
aches
inre
duci
ng
the
size
ofte
st-s
uit
ean
dm
ainta
inin
gth
eab
ilit
yto
reve
alen
ergy
bugs
IPG
reed
yA
pp
s#
Tes
tsL
oC#
Met
hod
s%
Kil
led
Red
uct
ion
%K
ille
dR
edu
ctio
n%
Kil
led
Ap
ollo
150
20,5
201,
691
46%
72%
33%
66%
38%
Op
enC
amer
a106
15,0
641,
035
57%
76%
55%
69%
51%
Jam
end
o183
8,7
0974
910
0%70
%85
%68
%85
%L
ightn
ing
Bro
wse
r100
7,2
1942
765
%84
%62
%81
%62
%L
9D
roid
189
7,4
5844
675
%86
%75
%83
%75
%A
2D
PV
olu
me
130
6,6
7039
543
%80
%43
%77
%43
%B
lock
inger
124
3,9
2427
656
%76
%56
%72
%56
%A
pp
Tra
cker
221
3,3
4629
150
%88
%50
%85
%50
%S
enso
riu
m229
3,2
8825
975
%93
%75
%92
%75
%A
nd
roid
omati
c156
2,1
5691
100%
83%
100%
83%
100%
An
dro
Fis
h250
1,4
9910
953
%88
%51
%88
%48
%S
an
dw
ich
Rou
lett
e233
1,4
4312
910
0%87
%10
0%86
%10
0%an
DO
F224
1,1
7610
874
%91
%74
%89
%61
%A
nd
roid
Ru
n100
1,0
2153
100%
85%
100%
84%
100%
Acr
yli
cP
aint
200
936
6168
%94
%68
%92
%68
%
Ave
rage
--
-71
%84
%68
%81
%67
%
175

To assess the effectiveness of test suite, I developed a novel form of mutation analysis for
energy testing according to known energy bugs in Android apps, as outlined in Section 8.2.
Table 8.2 shows examples of our energy-aware mutation operators. For wakelock mutants,
I created the mutants by injecting the mutation operators in proper parts of the code. For
example, I created Wi-Fi wakelock mutants by adding the acquire API before the code that
is responsible to download object(s). If the app already used Wi-Fi wakelock, I commented
out the release API on onPause and onDestroy methods. For expensive background service
mutants, I changed the arguments of the mentioned methods in Table 8.2 to a smaller values
so that the periodic task executed at a higher rate during execution of test cases. For
expensive loop mutants, I increased the number of iterations whenever possible, thereby the
loop in mutant version executed more times than the original version of app.
To determine whether an energy mutant is killed, I measured the energy consumption of
the tests using Trepn [71]. I experienced that the energy consumption level of the device
on the post-run phase—after the execution of test is completed—is higher than the pre-run
phase—before the execution of test—in most of the mutants (recall Figure 8.2). Since this
pattern was not seen among all the wakelock mutants, I monitored the active system calls
to kernel related to the wakelocks, before and after the execution of test cases. As a result,
a test case kills a wakelock mutant if the number of wakelocks after the execution of test
case is more than the number of wakelocks before it. For expensive background service and
expensive loop mutants, our measurements demonstrated that a test case kills the mutant,
if the average energy consumption of test case during the execution of mutant is higher than
that of the original version.
Table 8.3 shows the number of tests in the original test suite of subject apps (column 2) and
the percentage of mutants killed by the tests in the original test suite (column 5), as well
as percentage of reduction by each proposed minimization approach (column 6 and 8 for IP
and greedy, respectively) and the percentage of mutants killed by the tests in the minimized
176

test suites (column 7 and 9 for IP and greedy, respectively). These results demonstrate that
I can on average reduce the size of a given test suite by 84% using IP approach and 81%
using greedy approach, with a negligible penalty of loosing effectiveness of the test suite by
3% and 4% using IP and greedy, respectively.
As expected, IP achieves a greater test reduction than greedy in all cases, corroborating
that the solutions produced by IP are in fact optimal. For the majority of subject apps,
both IP and greedy kill the same number of mutants. In Apollo app, however, the greedy
algorithm achieves a higher ratio of killed mutants compared to the IP approach. This can
be attributed to two factors: (1) The greedy approach does not reduce the number of tests
as much as IP, thus, the higher number of killed mutants can be due to the fact that more
tests are executed in the case of greedy. (2) eCoverage is only an estimate for evaluating
the quality of tests for revealing energy properties of the software. Any discrepancy between
eCoverage and the actual energy cost of executing a test can prevent the IP and greedy
algorithms from picking the best tests, i.e., tests that kill the mutants.
8.7.3 RQ2: Correlations
To demonstrate the need for a new coverage metric for energy testing, I examined the
correlation between eCoverage and statement coverage, as well as its correlation with energy
consumption. Statement coverage is commonly used as an adequacy metric in test-suite
minimization. As a result, I compared the correlation of eCoverage with statement coverage
to assess the extent in which statement coverage can be substituted for eCoverage.
To that end, I calculated the Pearson correlation coefficient for two series of
〈eCoverage, statementcoverage〉 and 〈eCoverage, energyconsumption〉. I estimated the en-
ergy cost of each test case similar to [127], by aggregating the average energy cost of all system
APIs invoked during execution of test case. Pearson correlation coefficient, a.k.a. Pearson’s
177

r correlation, measures the linear relationship between two variables and takes a value be-
tween -1 and +1 inclusive. A value of 1 indicates positive correlation, 0 indicates no relation,
and -1 indicates negative correlation. More precisely [184], absolute value of r between 0 to
0.3 stipulates no or negligible relationship, between 0.3 to 0.5 indicates weak relationship,
between 0.5 to 0.7 indicates moderate relationship, and higher than that indicates strong
relationship.
The results on Pearson correlation coefficient—denoted by r—of 2,255 test cases for subject
apps are shown in Table 8.4. r values in Table 8.4 indicate that there is almost a negligible
or weak correlation between eCoverage and statement coverage of subject apps. On the
other hand, eCoverage holds a strong correlation with the actual energy cost of a test case,
confirming eCoverage to be a proper metric for energy testing. I noticed that for two of
the subject apps, Jamendo and Blockinger, the correlation between statement coverage and
eCoverage is strong. Our manual investigation shows that the majority of statements in
the implementation of these two apps are system APIs. As a result, the overlap between
covered statements and covered APIs are high, thereby eCoverage is correlated to statement
coverage.
8.7.4 RQ3: Performance
In this section, I evaluate the performance of different elements of our approach (recall
Figure 6.3).
8.7.4.1 Energy-aware Coverage Calculator
Energy-aware coverage calculator, ECC, consists of two sub-components, Static Model Ex-
tractor and Dynamic Integrator. To calculate eCoverage of tests for an app, I need to extract
178

Table 8.4: Pearson Correlation Coefficient (r) of <eCoverage, statement coverage> and<eCoverage, energy cost> series for subject apps.
Apps rstatement coverage renergy cost
Apollo 0.21 0.94Open Camera 0.2 0.57Jamendo 0.89 0.93Lightning Browser -0.11 0.99L9Droid 0.5 0.92A2DP Volume 0.43 0.82Blockinger 0.86 0.94App Tracker 0.35 0.85Sensorium 0.37 0.72Androidomatic 0.52 0.85AndroFish 0.34 0.95SandwichRoulette 0.59 0.81anDOF 0.41 0.94AndroidRun 0.17 0.69Acrylic Paint 0.1 0.75
the app’s call graph, and then map the execution paths of each test case to the call graph.
Figure 8.6 presents the time taken by the Static Model Extractor to extract call graphs of
the subject apps. The scatter plot shows both the analysis time and the app size in kilo
number of instructions. According to the results, our approach analyzes 80% of subject apps
in less than one minute to extract their models, with the overall average of 38 seconds per
app.
The performance analyses on test suite of subject apps show that the time taken by the
Dynamic Integrator component to calculate eCoverage of tests in the full test suite is negli-
gible, 2 seconds on average for all subject apps. Our approach leverages Xposed for run-time
instrumentation of the root Android process, rather than instrumentation of an app’s imple-
mentation. The execution time overhead incurred using Xposed to collect execution paths
of test cases is 7.36%±1.22% on average with 95% confidence interval.
179

Figure 8.6: Performance of Static Model Extractor
Figure 8.7: Sensitivity of execution time of integer programming approach to the size of testsuite
8.7.4.2 Energy-Aware Test-Suite Minimization
To compare the performance of techniques for energy-aware test-suite minimization proposed
in this chapter, I measured the execution time of each approach. Our evaluation results
indicate that the greedy approach takes less than a second, 14.2 ± 10.3 milliseconds on
average with 95% confidence interval, to solve the minimization problem. The execution
of the IP approach on the other hand, takes between 1 second to 7 hours, to minimize test
suites of different subject apps. I observed that the execution time of the IP approach heavily
depends on the characteristics of the problem, e.g., the number of constraints (bounded by
180

the size of test suite × number of energy-greedy segments) and decision variables (the size
of test suite).
Figure 8.7 shows the sensitivity of IP approach for the five subject apps whose execution
time takes more than an hour. The IP formulation of these apps for their original test suite
consists of over 10,000 constraints. To generate the graph, I gradually increased the set of
tests included from the full test suite of these subject apps. I repeated the experiments for
30 times to ensure the confidence interval of 95% on the average execution time values. It
can be seen that execution time of the IP approach for each app increases logarithmically,
as the size of test suite—number of decision variables—grows linearly.
These results confirm that the greedy algorithm demonstrates better performance than IP,
and is more scalable to larger problems. However, the IP approach is optimal and results in
test suites with smaller size. As a result, test suites generated by the IP approach consume
less energy and save the developer’s time.
8.8 Discussion
As mobile apps continue to grow in size and complexity, the need for effective testing tech-
niques and tools that can aid developers with catching energy bugs grows. This chapter
presented a fully-automated, energy-aware test-suite minimization approach to derive the
minimum subset of available tests appropriate for energy testing of Android apps. The ap-
proach employs a novel energy-aware metric for assessing the ability of test cases in revealing
energy bugs.
The proposed approach reduces the size of test suites in two ways: an integer programming
formulation that produces the optimal solution, but may take a long time to execute; and a
greedy algorithm that employs heuristics to find a near-optimal solution, but runs fast. The
181

experimental results of evaluating the two algorithms on real-world apps corroborate their
ability to significantly reduce the size of test suites (on average 84% in the case of IP and
81% in the case of Greedy), while maintaining test suite quality to reveal the great majority
of energy bugs. A novel suite of energy-aware mutation operators that are derived from
known energy bugs were used to evaluate the effectiveness of the test suites.
182

Chapter 9
Conclusion
We are increasingly reliant on battery-operated mobile devices in our daily lives. Software
applications running on such devices need to be free of energy defects, i.e., implementation
mistakes that result in unnecessary energy usage. This makes energy efficiency a first class
concern not only for the users, but also for developers. Thereby, it is critical to aid the de-
velopers with automated tools and technique to assess the energy behavior of their software
effectively and efficiently. Energy defects are complex and they manifest themselves under
peculiar conditions that depend not only on the source code of the apps, but also on the
framework, context of usage, and properties of the underlying hardware devices. The impact
of these factors can only be assessed by analyzing the the behavior of apps during execution
and through dynamic program analysis, i.e., testing. In this dissertation, I designed, imple-
mented, and evaluated several techniques to advance the state of energy testing for mobile
apps. More specifically, the proposed techniques help developers to automatically generate
energy test inputs and test oracles for mobile apps, assess the quality of the test suites with
respect to their ability to detect energy defects, and manage the size of their test suites by
considering energy as a program property of interest.
183

In the remainder of this chapter I conclude my dissertation by enumerating the contributions
of my work and avenues for future work
9.1 Research Contributions
This dissertation makes the following contributions to the Software Engineering research
community:
• Theory:
1. Novel formulation of test-suite minimization problem through nonlinear integer
programming : I proposed a novel formulation for test-suite minimization problem
through non-linear integer programming in [126] to reduce the size of test-suites
by considering energy as a program property of interest, which was later ex-
tended to a multi-criteria test-suite minimization framework [144]. My proposed
technique considers the dependency among the minimization criteria to find the
optimal solution, which was ignored by prior technique, and hence they generated
approximate or sub-optimal solutions.
2. A novel and device-independent energy-aware coverage metric to asses quality of
tests : I proposed a novel test coverage criterion, which indicates the degree to
which energy-greedy parts of a program are covered by a test case, to guide an
energy-aware test-suite minimization approach. This coverage criteria is device-
independent and computes the coverage based on the average energy-greediness
of Android APIs.
3. An automated mutation testing oracle: While state-of-the-art mutation testing
technique mostly rely on human oracle to predict the output of tests on mutants,
I proposed a novel and scalable oracle for mutation testing that automatically
184

do so. The proposed oracle rely on collected power traces during test execution
through a low overhead technique. It then decides whether a test kills a mutant
or not by comparing the shape of power traces. The high accuracy, precision,
and recall of the proposed oracle makes the usage of mutation testing framework
easier for developers.
4. Development of generic and device independent hardware models : I constructed
a set of finite state machines for the common hardware devices on mobile phones
through a semi-systematic approach. These hardware models demonstrate dif-
ferent states of each hardware device that can be changed at the software level,
i.e., Android framework or apps. Thereby, the models are high level and device
independent.
5. Design of novel genetic operators for search-based testing : Instead of designing
my search-based test generation technique using conventional genetic operators,
i.e., crossover and mutation operators, I designed new genetic operators by relying
on the intuition behind them. The new genetic operators helped my technique
find a better solution and converge to a solution faster, compared to conventional
crossover and mutation genetic operators.
6. Automated extraction of new classes of event dependencies through static anal-
yses : The order of events is important for exercising specific behaviors in apps
and failing to consider the proper order of events can produce invalid test se-
quences. I identified and implemented two new classes of events dependencies,
namely registration dependency and lifecycle dependency to be considered during
construction of call-graph of mobile apps.
7. A novel and interpretable Deep Learning technique for automated construction
of energy test oracles : I proposed a technique that employs Deep Learning to
learn the (mis)behaviors corresponding to the different types of energy defects.
It represents the state of app lifecycle and hardware elements in the form of a
185

feature vector. Each instance of our training dataset is a sequence of feature
vectors sampled before, during, and after the execution of a test. The proposed
technique uses Attention mechanism to generate an interpretable model. While
utilization of Attention mechanism by itself improves the performance and accu-
racy of the energy oracle, my proposed technique takes advantage of Attention
layer’s product to identify a set of features that the model has focused on to
predict a label for a given test, which can be used to verify validity of the learned
model.
• Experiments:
1. Identification of previously unknown energy defects in open source Android apps :
My proposed technique were able to identify 15 previously unknown energy issues
in open source Android apps. I reported all of the issues to the developers of those
apps, where 11 of them were confirmed as a bug or enhancement, and 7 of them
were fixed through the patches I provided to the developers.
• Tool:
To help other researchers re-use and expand the proposed approaches and build more
advanced techniques on top of them, I made all research artifacts and tools publicly
available, via the following web addresses:
1. An energy-aware test suite minimization framework for Android :
https://seal.ics.uci.edu/projects/energy-test-min/index.html
2. An energy-aware mutation testing framework for Android :
https://seal.ics.uci.edu/projects/mu droid/index.html
3. An energy-aware test input generation framework for Android :
https://seal.ics.uci.edu/projects/cobweb/index.html
4. An energy-aware test oracle for Android :
https://seal.ics.uci.edu/projects/oracle/index.html
186

• Dataset:
1. A comprehensive energy defect model for Android : I constructed an energy defect
model for Android that contains 28 types of energy defects. Energy defects in
this model are in fact energy anti-patterns, a commonly encountered development
practice (e.g., misuse of Android API) that results in unnecessary energy con-
sumption. To construct the defect model, I collected both best practices and bad
practices regarding battery life. For the former, I followed a systematic approach
to crawl the Android API reference and for the latter, I reviewed the source code
and code repositories of 130 Android apps over one year. This defect model is
publicly available as an Artifact of Tool 2.
2. A dataset of 15 confirmed and reproducible energy defects in real-world Android
apps : This dataset contains the apk files of 15 Android apps, whose energy defects
are confirmed by their developers. The dataset comes with additional data, such
as commit number, type of energy defect, and location of energy defect in the
code, to help other researcher use the dataset easily. This dataset is available
upon request.
3. A dataset of size 17K for Machine Learning and Deep Learning techniques
that aim to address energy testing and debugging : This labeled dataset con-
tains 17K datapoints, where each data point represents runtime information of
<mutant,test> pairs. The label of each datapoint could be Pass, FailBluetooth,
FailCPU , FailDisplay, FailLocation, FailNetwork, and FailSensor. This dataset can
be used for researchers who want to apply Machine Learning or Deep Learning
techniques to the domain of energy testing and is available upon request.
187
9.2 Future Work
By leveraging the experience and knowledge in testing and analysis of mobile apps and
considering energy as a program property of interest, I am considering several directions for
the future work.
• Other Variations of Energy Test Oracles. Presence of an energy defect can
be determined by either (1) an anomaly in the power trace from the execution of a
test, or (2) matching an energy defect pattern. While my previous work addresses
the later, I am planning to work on the former case in future. Power traces are
temporal sequences of power measurements through execution of a test. Thereby,
I can use LSTM sequence classification to construct an oracle and find anomalous
patterns in power measurements. For the situations where a labeled dataset similar
to what is used in [7] is not possible, power trace-based oracles can be constructed
using clustering technique. To that end, I plan to use k-means unsupervised learning
techniques. K-means is a hierarchical clustering technique, which is based on the core
idea of objects being more related to nearby objects than to objects farther away. To
determine the similarity of power-traces to each other, I propose to use Dynamic Time
Warping (DTW) as a distance metric to account for inevitable distortions in power
measurements over time (Chapter 5.4).
• Energy Debugging Through Fault Localization. The aim of debugging is to
help the developers identify why and where the energy defects in the code occur. For
this purpose, I aim to construct a hybrid approach that leverages both static and
dynamic analyses that recommend the root causes of energy defects and locates them
in the code. The output of this technique would be a list of warnings that prioritizes
energy defects and inefficiencies in code according to their severity. The static analyzer
component of the debugging technique can leverage the defect patterns from my prior
188

study presented in Chapter 5 to identify possible occurrence of energy defects in the
code. In fact, the static analyzer component can generate many false warnings due
to over-approximation, making the debugging task time-consuming. To overcome this
issue, I will use the test input generation and test oracle approaches presented in
Sections 7-8 to prioritize the warnings that are covered by a test and caused a test to
fail. To that end, the apps need to be instrumented during static analysis, so that I can
map each warning to a set of tests that execute the code responsible for that warning.
For tests that keep the hardware component active after the execution, corresponding
warnings will be marked to have a higher priority.
• Automatic Repair of Energy Defects. The ultimate goal of my research on en-
ergy testing and debugging is to automatically fix energy defects in the code. To that
end, I intend to devise a framework that leverages a combination of analysis, testing,
and debugging techniques I previously mentioned to pinpoint energy defects in mobile
software and repair them. My plan is to first develop an automatic repair technique
for Android, which I am more familiar with due to my background, and then extend
the analysis to be cross-platform. For the first task, I can identify repair information
from the anti-patterns I have previously collected (Section 2) to produce concrete re-
pair operations or repair templates. I can further use my energy-aware test generation
technique (Section 7) and test oracles (Section 8) to conduct test suite-based automatic
repair. For the second task, I plan to develop a framework that given the repairs that
have already worked in Android—source platform, it can fix energy defects in another
platform—target platform, e.g., iOS. The rationale behind this idea is that while the
implementation, i.e., syntax, of energy anti-patterns on different languages and plat-
forms are different, their semantics remains the same. To that end, I will leverage a
combination of natural language processing, to find APIs in target platform perform-
ing similar operations in the source platform, and cross-platform program analysis, to
189

identify if the usage pattern of the similar APIs in the target platform matches the
energy anti-pattern in the source platform.
• Gamification of Energy Testing. Even with automated testing and debugging
tools, human involvement in these processes is inevitable. That is, developer’s intu-
ition and understanding of program context are still needed to improve the quality
of automatically generated tests. However, numerous studies have shown that writing
good software tests is a difficult task and the situation is exacerbated for non-functional
testing, e.g., energy testing. Gamification can be useful in this context, as it converts
the tedious or boring task of testing to entertaining gameplay. More importantly, gam-
ification makes it possible to crowdsource complex testing tasks through games with
a purpose and thereby, improve software testing practice. furthermore, gamification
of energy testing can be used to educate students about the concepts and techniques
for energy testing. I plan to investigate different gameplay for energy testing and de-
bugging. For example, one gameplay involves testers as players who are responsible
to uncover energy hotspots in the code—where the code consumes more energy—by
writing tests. The game rewards a player based on the severity of hotspots she catches
and game leader board ranks players based on their score. This gameplay requires an
IDE plugin to identify energy hotspots in the code. The energy anti-patterns I have
collected (Section 2) can serve as a starting point to identify energy hotspots in the
code. The score of each test can also be measured using the coverage metric I identified
(Section 5).
• Energy Efficiency in Other Platforms. Energy efficiency is not a problem specific
to the domain of mobile apps. It will always remain a concern wherever the resources
are limited, such as in IoT, data centers, drones, and even autonomous vehicles. Many
of my previous and future ideas can be extended to the mentioned platforms. The
rationale behind this claim is that the proposed techniques rely on either power trace,
which can be collected during execution of a test no matter on which platform, or
190

monitoring the state of hardware and running software, which can be redesigned for
different platforms. While new platforms imply unique challenges, I believe that with a
suitable power-measurement tools/techniques for other platforms and proper modeling
of their corresponding environment, majority of my proposed techniques should work
for new platforms.
191
Bibliography
[1] Android developer website: Alarm manager. http://developer.android.com/reference/android/app/AlarmManager.html.
[2] Android developer website: Sensor manager. http://developer.android.com/reference/android/app/AlarmManager.html.
[3] Emma java code coverage tool. http://emma.sourceforge.net/.
[4] Google play crawler. http://goo.gl/BFc51M.
[5] IDC: Smartphone OS Market Share 2015, 2014, 2013, and 2012. http://www.idc.com/prodserv/smartphone-os-market-share.jsp.
[6] lpsplve. http://lpsolve.sourceforge.net/5.5/.
[7] Monsoon. http://goo.gl/8G7Xgf.
[8] Xposed Framework. http://repo.xposed.info/.
[9] Android api reference, 2017.
[10] Android testing support library : Espresso, 2017.
[11] Battery life, 2017.
[12] Bluetooth low energy, 2017.
[13] Camera apis documentation, 2017.
[14] GTalk:issue 279, 2017.
[15] GTalk:issue 280, 2017.
[16] Jamendo:issue 38, 2017.
[17] Jamendo:issue 39, 2017.
[18] Keeping the device awake, 2017.
[19] Location manager strategies, 2017.
192

[20] Mobile Device Power Monitor Manual, 2017.
[21] Monitoring the battery level and charging state, 2017.
[22] MyTracker Android App, 2017.
[23] omim app, 2017.
[24] Openbmap:issue 175, 2017.
[25] Openbmap:issue 176, 2017.
[26] Openbmap:issue 177, 2017.
[27] Openbmapissue :178, 2017.
[28] Openbmap:issue 179, 2017.
[29] Openbmap:issue 184, 2017.
[30] OpenCamera:issue 251, 2017.
[31] Project website, 2017.
[32] Reducing network battery drain, 2017.
[33] Robolectric, 2017.
[34] Scheduling repeating alarms, 2017.
[35] Sensorium android app, 2017.
[36] Sensorium:19, 2017.
[37] Sensorium:20, 2017.
[38] Sensorium:issue 17, 2017.
[39] Sensorium:issue 18, 2017.
[40] Sensormanager, 2017.
[41] sipdroid app, 2017.
[42] Trepn accuracy report, 2017.
[43] Trepn accuracy report, 2017.
[44] Trepn accuracy report, 2017.
[45] UI/Application Excersizer Monkey, 2017.
[46] Urlconnection, 2017.
193

[47] Xdrip android app, 2017.
[48] Xdrip issue 169, 2017.
[49] Android Broadcasts Overview, 2019.
[50] Android Service Overview, 2019.
[51] Understanding Android Activity Lifecycle, 2019.
[52] D. Amalfitano, A. Fasolino, and P. Tramontana. A gui crawling-based technique forandroid mobile application testing. In Software Testing, Verification and ValidationWorkshops (ICSTW), 2011 IEEE Fourth International Conference on, pages 252–261,March 2011.
[53] D. Amalfitano, A. Fasolino, P. Tramontana, B. Ta, and A. Memon. Mobiguitar: Au-tomated model-based testing of mobile apps. Software, IEEE, 32(5):53–59, Sept 2015.
[54] D. Amalfitano, A. R. Fasolino, P. Tramontana, S. De Carmine, and A. M. Memon.Using gui ripping for automated testing of android applications. In Proceedings of the27th IEEE/ACM International Conference on Automated Software Engineering, ASE2012, pages 258–261, New York, NY, USA, 2012. ACM.
[55] D. Amalfitano, A. R. Fasolino, P. Tramontana, S. De Carmine, and A. M. Memon.Using gui ripping for automated testing of android applications. In Proceedings of the27th IEEE/ACM International Conference on Automated Software Engineering, ASE2012, pages 258–261, New York, NY, USA, 2012. ACM.
[56] D. Amalfitano, A. R. Fasolino, P. Tramontana, S. De Carmine, and A. M. Memon.Using gui ripping for automated testing of android applications. In Proceedings of the27th IEEE/ACM International Conference on Automated Software Engineering, pages258–261. ACM, 2012.
[57] S. Anand, M. Naik, M. J. Harrold, and H. Yang. Automated concolic testing ofsmartphone apps. In Proceedings of the ACM SIGSOFT 20th International Symposiumon the Foundations of Software Engineering, FSE ’12, pages 59:1–59:11, New York, NY,USA, 2012. ACM.
[58] S. Anand, M. Naik, M. J. Harrold, and H. Yang. Automated concolic testing ofsmartphone apps. In Proceedings of the ACM SIGSOFT 20th International Symposiumon the Foundations of Software Engineering, FSE ’12, pages 59:1–59:11, New York, NY,USA, 2012. ACM.
[59] J. H. Andrews, L. C. Briand, and Y. Labiche. Is mutation an appropriate tool fortesting experiments?[software testing]. In Proceedings. 27th International Conferenceon Software Engineering, 2005. ICSE 2005., pages 402–411. IEEE, 2005.
194

[60] S. Arzt, S. Rasthofer, C. Fritz, E. Bodden, A. Bartel, J. Klein, Y. Le Traon, D. Octeau,and P. McDaniel. Flowdroid: Precise context, flow, field, object-sensitive and lifecycle-aware taint analysis for android apps. In ACM SIGPLAN Notices, volume 49, pages259–269, 2014.
[61] F. Asadi, G. Antoniol, and Y.-G. Gueheneuc. Concept location with genetic algorithms:A comparison of four distributed architectures. In Search Based Software Engineering(SSBSE), 2010 Second International Symposium on, pages 153–162. IEEE, 2010.
[62] T. Azim and I. Neamtiu. Targeted and depth-first exploration for systematic testingof android apps. In Proceedings of the 2013 ACM SIGPLAN International Conferenceon Object Oriented Programming Systems Languages & Applications, OOPSLA ’13,pages 641–660, New York, NY, USA, 2013. ACM.
[63] T. Azim and I. Neamtiu. Targeted and depth-first exploration for systematic testingof android apps. SIGPLAN Not., 48(10):641–660, Oct. 2013.
[64] T. Azim and I. Neamtiu. Targeted and depth-first exploration for systematic testingof android apps. In Acm Sigplan Notices, volume 48, pages 641–660. ACM, 2013.
[65] D. Bahdanau et al. Neural machine translation by jointly learning to align and trans-late. arXiv preprint arXiv:1409.0473, 2014.
[66] A. Banerjee, L. K. Chong, C. Ballabriga, and A. Roychoudhury. Energypatch: Repair-ing resource leaks to improve energy-efficiency of android apps. IEEE Transactions onSoftware Engineering, 44(5):470–490, 2018.
[67] A. Banerjee, L. K. Chong, S. Chattopadhyay, and A. Roychoudhury. Detecting energybugs and hotspots in mobile apps. In Proceedings of the 22nd ACM SIGSOFT Inter-national Symposium on Foundations of Software Engineering, pages 588–598. ACM,2014.
[68] A. Banerjee and A. Roychoudhury. Automated re-factoring of android apps to enhanceenergy-efficiency. 2016.
[69] E. T. Barr, M. Harman, P. McMinn, M. Shahbaz, and S. Yoo. The oracle problem insoftware testing: A survey. IEEE transactions on software engineering, 41(5):507–525,2015.
[70] S. Bekrar, C. Bekrar, R. Groz, and L. Mounier. Finding software vulnerabilities bysmart fuzzing. In 2011 Fourth IEEE International Conference on Software Testing,Verification and Validation, pages 427–430. IEEE, 2011.
[71] L. Ben-Zur. Using Trepn Profiler for Power-EfficientApps. https://developer.qualcomm.com/blog/developer-tool-spotlight-using-trepn-profiler-power-efficient-apps,2017.
195

[72] Y. Bengio, P. Simard, P. Frasconi, et al. Learning long-term dependencies with gradientdescent is difficult. IEEE transactions on neural networks, 5(2):157–166, 1994.
[73] D. J. Berndt and J. Clifford. Using dynamic time warping to find patterns in timeseries. In KDD workshop, volume 10, pages 359–370. Seattle, WA, 1994.
[74] R. C. Bryce and C. J. Colbourn. One-test-at-a-time heuristic search for interactiontest suites. In Proceedings of the 9th annual conference on Genetic and evolutionarycomputation, pages 1082–1089. ACM, 2007.
[75] T. A. Budd and D. Angluin. Two notions of correctness and their relation to testing.Acta Informatica, 18(1):31–45, 1982.
[76] C. Cadar, V. Ganesh, P. M. Pawlowski, D. L. Dill, and D. R. Engler. Exe: auto-matically generating inputs of death. ACM Transactions on Information and SystemSecurity (TISSEC), 12(2):10, 2008.
[77] X. Cai and M. R. Lyu. The effect of code coverage on fault detection under differenttesting profiles. ACM SIGSOFT Software Engineering Notes, 30(4):1–7, 2005.
[78] E. Cantu-Paz and D. E. Goldberg. Efficient parallel genetic algorithms: theory andpractice. Computer methods in applied mechanics and engineering, 186(2-4):221–238,2000.
[79] M. Ceccato, C. D. Nguyen, D. Appelt, and L. C. Briand. Sofia: An automated securityoracle for black-box testing of sql-injection vulnerabilities. In Proceedings of the 31stIEEE/ACM International Conference on Automated Software Engineering, pages 167–177. ACM, 2016.
[80] Y. Cheon. Abstraction in assertion-based test oracles. In Seventh International Con-ference on Quality Software (QSIC 2007), pages 410–414. IEEE, 2007.
[81] Y. Cheon and G. T. Leavens. A simple and practical approach to unit testing: Thejml and junit way. In European Conference on Object-Oriented Programming, pages231–255. Springer, 2002.
[82] K. Cho, B. Van Merrienboer, D. Bahdanau, and Y. Bengio. On the properties of neuralmachine translation: Encoder-decoder approaches. arXiv preprint arXiv:1409.1259,2014.
[83] W. Choi, G. Necula, and K. Sen. Guided gui testing of android apps with minimalrestart and approximate learning. In Proceedings of the 2013 ACM SIGPLAN Interna-tional Conference on Object Oriented Programming Systems Languages & Applications,OOPSLA ’13, pages 623–640, New York, NY, USA, 2013. ACM.
[84] W. Choi, G. Necula, and K. Sen. Guided gui testing of android apps with minimalrestart and approximate learning. In Acm Sigplan Notices, volume 48, pages 623–640.ACM, 2013.
196

[85] S. R. Choudhary, A. Gorla, and A. Orso. Automated test input generation for an-droid: Are we there yet?(e). In Automated Software Engineering (ASE), 2015 30thIEEE/ACM International Conference on, pages 429–440. IEEE, 2015.
[86] S. Chowdhury, S. Borle, S. Romansky, and A. Hindle. Greenscaler: training soft-ware energy models with automatic test generation. Empirical Software Engineering,24(4):1649–1692, 2019.
[87] D. Coppit and J. M. Haddox-Schatz. On the use of specification-based assertionsas test oracles. In 29th Annual IEEE/NASA Software Engineering Workshop, pages305–314. IEEE, 2005.
[88] J. Corbin and A. Strauss. Basics of qualitative research: Techniques and proceduresfor developing grounded theory. 2008.
[89] M. E. Delamaro, J. Maidonado, and A. P. Mathur. Interface mutation: An approachfor integration testing. IEEE Transactions on Software Engineering, 27(3):228–247,2001.
[90] L. Deng, N. Mirzaei, P. Ammann, and J. Offutt. Towards mutation analysis of androidapps. In Software Testing, Verification and Validation Workshops (ICSTW), 2015IEEE Eighth International Conference on, pages 1–10. IEEE, 2015.
[91] L. Deng, J. Offutt, P. Ammann, and N. Mirzaei. Mutation operators for testing androidapps. Information and Software Technology, 2016.
[92] A. Derezinska and A. Szustek. Tool-supported advanced mutation approach for ver-ification of c# programs. In Dependability of Computer Systems, 2008. DepCos-RELCOMEX’08. Third International Conference on, pages 261–268. IEEE, 2008.
[93] M. Di Penta, G. Canfora, G. Esposito, V. Mazza, and M. Bruno. Search-based testingof service level agreements. In Proceedings of the 9th annual conference on Geneticand evolutionary computation, pages 1090–1097. ACM, 2007.
[94] S. P. F. Fabbri, M. E. Delamaro, J. C. Maldonado, and P. C. Masiero. Mutationanalysis testing for finite state machines. In Software Reliability Engineering, 1994.Proceedings., 5th International Symposium on, pages 220–229. IEEE, 1994.
[95] C. Fang, Z. Chen, K. Wu, and Z. Zhao. Similarity-based test case prioritization usingordered sequences of program entities. Software Quality Journal, 22(2):335–361, 2014.
[96] G. Fraser and N. Walkinshaw. Behaviourally adequate software testing. In SoftwareTesting, Verification and Validation (ICST), 2012 IEEE Fifth International Confer-ence on, pages 300–309. IEEE, 2012.
[97] M.-C. Gaudel. Testing from formal specifications, a generic approach. In InternationalConference on Reliable Software Technologies, pages 35–48. Springer, 2001.
197

[98] G. Gay, S. Rayadurgam, and M. P. Heimdahl. Improving the accuracy of oracle verdictsthrough automated model steering. In Proceedings of the 29th ACM/IEEE interna-tional conference on Automated software engineering, pages 527–538. ACM, 2014.
[99] B. G. Glaser. Basics of grounded theory analysis: Emergence vs forcing. SociologyPress, 1992.
[100] M. Gligoric, A. Groce, C. Zhang, R. Sharma, M. A. Alipour, and D. Marinov. Guide-lines for coverage-based comparisons of non-adequate test suites. ACM Trans. Softw.Eng. Methodol., 24(4):22:1–22:33, 2015.
[101] A. Goffi, A. Gorla, M. D. Ernst, and M. Pezze. Automatic generation of oracles forexceptional behaviors.
[102] T. L. Graves, M. J. Harrold, J.-M. Kim, A. Porter, and G. Rothermel. An empiricalstudy of regression test selection techniques. ACM Transactions on Software Engi-neering and Methodology (TOSEM), 10(2):184–208, 2001.
[103] C. Guo, J. Zhang, J. Yan, Z. Zhang, and Y. Zhang. Characterizing and detectingresource leaks in android applications. In Automated Software Engineering (ASE),2013 IEEE/ACM 28th International Conference on, pages 389–398. IEEE, 2013.
[104] A. Gupta and P. Jalote. An approach for experimentally evaluating effectiveness andefficiency of coverage criteria for software testing. International Journal on SoftwareTools for Technology Transfer, 10(2):145–160, 2008.
[105] A. Gupta, T. Zimmermann, C. Bird, N. Nagappan, T. Bhat, and S. Emran. Miningenergy traces to aid in software development: An empirical case study. In Proceedingsof the 8th ACM/IEEE International Symposium on Empirical Software Engineeringand Measurement, page 40. ACM, 2014.
[106] R. G. Hamlet. Testing programs with the aid of a compiler. IEEE Transactions onSoftware Engineering, (4):279–290, 1977.
[107] D. Hao, L. Zhang, X. Wu, H. Mei, and G. Rothermel. On-demand test suite reduction.In Proceedings of the 34th International Conference on Software Engineering, pages738–748. IEEE Press, 2012.
[108] S. Hao, D. Li, W. G. Halfond, and R. Govindan. Estimating android applications’ cpuenergy usage via bytecode profiling. In The Intl. Workshop on Green and SustainableSoftware, pages 1–7, 2012.
[109] S. Hao, D. Li, W. G. Halfond, and R. Govindan. Estimating mobile application energyconsumption using program analysis. In The Intl. Conf. on Software Engineering,2013.
[110] S. Hao, B. Liu, S. Nath, W. G. Halfond, and R. Govindan. Puma: Programmableui-automation for large-scale dynamic analysis of mobile apps. In Proceedings of the12th Annual International Conference on Mobile Systems, Applications, and Services,MobiSys ’14, pages 204–217, New York, NY, USA, 2014. ACM.
198

[111] S. Hao, B. Liu, S. Nath, W. G. Halfond, and R. Govindan. Puma: programmable ui-automation for large-scale dynamic analysis of mobile apps. In Proceedings of the 12thannual international conference on Mobile systems, applications, and services, pages204–217. ACM, 2014.
[112] M. Harman, Y. Jia, and Y. Zhang. Achievements, open problems and challenges forsearch based software testing. 2015.
[113] M. Harman and P. McMinn. A theoretical and empirical study of search-based test-ing: Local, global, and hybrid search. IEEE Transactions on Software Engineering,36(2):226–247, 2010.
[114] M. Harman, P. McMinn, J. T. De Souza, and S. Yoo. Search based software engineering:Techniques, taxonomy, tutorial. In Empirical software engineering and verification,pages 1–59. Springer, 2012.
[115] M. J. Harrold, G. Rothermel, K. Sayre, R. Wu, and L. Yi. An empirical investigationof the relationship between spectra differences and regression faults. Software TestingVerification and Reliability, 10(3):171–194, 2000.
[116] M. M. Hassan and J. H. Andrews. Comparing multi-point stride coverage and dataflowcoverage. In Proceedings of the 2013 International Conference on Software Engineering,pages 172–181. IEEE Press, 2013.
[117] R. Hay, O. Tripp, and M. Pistoia. Dynamic detection of inter-application communi-cation vulnerabilities in android. In Proceedings of the 2015 International Symposiumon Software Testing and Analysis, ISSTA 2015, pages 118–128, New York, NY, USA,2015. ACM.
[118] M. V. Heikkinen, J. K. Nurminen, T. Smura, and H. Hammainen. Energy efficiencyof mobile handsets: Measuring user attitudes and behavior. The Telematics and In-formatics, 2012.
[119] D. L. Heine and M. S. Lam. A practical flow-sensitive and context-sensitive c and c++memory leak detector. In ACM SIGPLAN Notices, volume 38, pages 168–181. ACM,2003.
[120] S. Hochreiter and J. Schmidhuber. Long short-term memory. Neural computation,9(8):1735–1780, 1997.
[121] M. A. Hoque, M. Siekkinen, K. N. Khan, Y. Xiao, and S. Tarkoma. Modeling, profiling,and debugging the energy consumption of mobile devices. ACM Computing Surveys(CSUR), 48(3):39, 2016.
[122] H.-Y. Hsu and A. Orso. Mints: A general framework and tool for supporting test-suiteminimization. In Software Engineering, 2009. ICSE 2009. IEEE 31st InternationalConference on, pages 419–429. IEEE, 2009.
199

[123] C. Hu and I. Neamtiu. Automating gui testing for android applications. In Proceedingsof the 6th International Workshop on Automation of Software Test, AST ’11, pages77–83, New York, NY, USA, 2011. ACM.
[124] R. Jabbarvand, J.-W. Lin, and S. Malek. Search-based energy testing of android. InICSE 2019, pages 1119–1130. IEEE Press, 2019.
[125] R. Jabbarvand and S. Malek. µdroid: an energy-aware mutation testing frameworkfor android. In Proceedings of the 2017 11th Joint Meeting on Foundations of SoftwareEngineering, pages 208–219. ACM, 2017.
[126] R. Jabbarvand, A. Sadeghi, H. Bagheri, and S. Malek. Energy-aware test-suite min-imization for android apps. In Proceedings of the 25th International Symposium onSoftware Testing and Analysis, pages 425–436. ACM, 2016.
[127] R. Jabbarvand, A. Sadeghi, J. Garcia, S. Malek, and P. Ammann. Ecodroid: Anapproach for energy-based ranking of android apps. In Proceedings of the Fourth In-ternational Workshop on Green and Sustainable Software, pages 8–14. IEEE Press,2015.
[128] C. S. Jensen, M. R. Prasad, and A. Møller. Automated testing with targeted eventsequence generation. In Proceedings of the 2013 International Symposium on SoftwareTesting and Analysis, ISSTA 2013, pages 67–77, New York, NY, USA, 2013. ACM.
[129] Y. Jia and M. Harman. Higher order mutation testing. Information and SoftwareTechnology, 51(10):1379–1393, 2009.
[130] Y. Jia and M. Harman. An analysis and survey of the development of mutation testing.IEEE transactions on software engineering, 37(5):649–678, 2011.
[131] J. A. Jones and M. J. Harrold. Test-suite reduction and prioritization for modifiedcondition/decision coverage. Software Engineering, IEEE Transactions on, 29(3):195–209, 2003.
[132] R. Just. The major mutation framework: Efficient and scalable mutation analysisfor java. In Proceedings of the 2014 international symposium on software testing andanalysis, pages 433–436. ACM, 2014.
[133] R. Just, D. Jalali, L. Inozemtseva, M. D. Ernst, R. Holmes, and G. Fraser. Are mutantsa valid substitute for real faults in software testing? In Proceedings of the 22nd ACMSIGSOFT International Symposium on Foundations of Software Engineering, pages654–665. ACM, 2014.
[134] E. Y. Kan. Energy efficiency in testing and regression testing–a comparison of dvfstechniques. In Quality Software (QSIC), 2013 13th International Conference on, pages280–283. IEEE, 2013.
200

[135] S. Kaufman, S. Rosset, C. Perlich, and O. Stitelman. Leakage in data mining: For-mulation, detection, and avoidance. ACM Transactions on Knowledge Discovery fromData (TKDD), 6(4):15, 2012.
[136] E. Keogh and C. A. Ratanamahatana. Exact indexing of dynamic time warping.Knowledge and information systems, 7(3):358–386, 2005.
[137] K. N. King and A. J. Offutt. A fortran language system for mutation-based softwaretesting. Software: Practice and Experience, 21(7):685–718, 1991.
[138] D. P. Kingma and J. Ba. Adam: A method for stochastic optimization. arXiv preprintarXiv:1412.6980, 2014.
[139] D. Li, S. Hao, J. Gui, and W. G. Halfond. An empirical study of the energy con-sumption of android applications. In The Intl. Conf. on Software Maintenance andEvolution, 2014.
[140] D. Li, S. Hao, W. G. Halfond, and R. Govindan. Calculating source line level energyinformation for android applications. In The Intl. Symposium on Software Testing andAnalysis, pages 78–89, 2013.
[141] D. Li, Y. Jin, C. Sahin, J. Clause, and W. G. Halfond. Integrated energy-directed testsuite optimization. In Proceedings of the 2014 International Symposium on SoftwareTesting and Analysis, pages 339–350. ACM, 2014.
[142] D. Li, Y. Lyu, J. Gui, and W. G. Halfond. Automated energy optimization of httprequests for mobile applications. In Proceedings of the 38th International Conferenceon Software Engineering, pages 249–260. ACM, 2016.
[143] D. Li, A. H. Tran, and W. G. Halfond. Making web applications more energy efficientfor oled smartphones. In Proceedings of the 36th International Conference on SoftwareEngineering, pages 527–538. ACM, 2014.
[144] J.-W. Lin, R. Jabbarvand, J. Garcia, and S. Malek. Nemo: multi-criteria test-suiteminimization with integer nonlinear programming. In 2018 IEEE/ACM 40th Interna-tional Conference on Software Engineering (ICSE), pages 1039–1049. IEEE, 2018.
[145] T.-Y. Lin, P. Goyal, R. Girshick, K. He, and P. Dollar. Focal loss for dense objectdetection. In Proceedings of the IEEE international conference on computer vision,2017.
[146] Y.-D. Lin, J. F. Rojas, E. T.-H. Chu, and Y.-C. Lai. On the accuracy, efficiency,and reusability of automated test oracles for android devices. IEEE Transactions onSoftware Engineering, 40(10):957–970, 2014.
[147] M. Linares-Vasquez, G. Bavota, C. Bernal-Cardenas, R. Oliveto, M. Di Penta, andD. Poshyvanyk. Mining energy-greedy api usage patterns in android apps: an empiricalstudy. In Proceedings of the 11th Working Conference on Mining Software Repositories,pages 2–11. ACM, 2014.
201

[148] M. Linares-Vasquez, G. Bavota, C. E. B. Cardenas, R. Oliveto, M. Di Penta, andD. Poshyvanyk. Optimizing energy consumption of guis in android apps: a multi-objective approach. In Proceedings of the 2015 10th Joint Meeting on Foundations ofSoftware Engineering, pages 143–154. ACM, 2015.
[149] Y. Liu, C. Xu, S.-C. Cheung, and J. Lu. Greendroid: Automated diagnosis of energyinefficiency for smartphone applications. IEEE Transactions on Software Engineering,40(9):911–940, 2014.
[150] Y. Liu, C. Xu, S.-C. Cheung, and V. Terragni. Understanding and detecting wake lockmisuses for android applications. pages 396–409, 2016.
[151] Y. Lyu, D. Li, and W. G. Halfond. Remove rats from your code: automated optimiza-tion of resource inefficient database writes for mobile applications. In Proceedings ofthe 27th ACM SIGSOFT International Symposium on Software Testing and Analysis,pages 310–321. ACM, 2018.
[152] X. Ma, P. Huang, X. Jin, P. Wang, S. Park, D. Shen, Y. Zhou, L. K. Saul, andG. M. Voelker. edoctor: Automatically diagnosing abnormal battery drain issues onsmartphones. In NSDI, volume 13, pages 57–70, 2013.
[153] Y.-S. Ma, J. Offutt, and Y. R. Kwon. Mujava: an automated class mutation system.Software Testing, Verification and Reliability, 15(2):97–133, 2005.
[154] A. Machiry, R. Tahiliani, and M. Naik. Dynodroid: An input generation system forandroid apps. In Proceedings of the 2013 9th Joint Meeting on Foundations of SoftwareEngineering, ESEC/FSE 2013, pages 224–234, New York, NY, USA, 2013. ACM.
[155] A. Machiry, R. Tahiliani, and M. Naik. Dynodroid: An input generation system forandroid apps. In Proceedings of the 2013 9th Joint Meeting on Foundations of SoftwareEngineering, ESEC/FSE 2013, pages 224–234, New York, NY, USA, 2013. ACM.
[156] A. Machiry, R. Tahiliani, and M. Naik. Dynodroid: An input generation system forandroid apps. In Proceedings of the 2013 9th Joint Meeting on Foundations of SoftwareEngineering, pages 224–234. ACM, 2013.
[157] R. Mahmood, N. Mirzaei, and S. Malek. Evodroid: Segmented evolutionary testing ofandroid apps. In Proceedings of the 22Nd ACM SIGSOFT International Symposiumon Foundations of Software Engineering, FSE 2014, pages 599–609, New York, NY,USA, 2014. ACM.
[158] R. Mahmood, N. Mirzaei, and S. Malek. Evodroid: segmented evolutionary testing ofandroid apps. In Proceedings of the 22nd ACM SIGSOFT International Symposiumon Foundations of Software Engineering, pages 599–609. ACM, 2014.
[159] R. Mahmood, N. Mirzaei, and S. Malek. Evodroid: Segmented evolutionary testing ofandroid apps. In Proceedings of the 22nd ACM SIGSOFT International Symposiumon Foundations of Software Engineering, pages 599–609. ACM, 2014.
202

[160] A. Maji, F. Arshad, S. Bagchi, and J. Rellermeyer. An empirical study of the robustnessof Inter-component Communication in Android. In 2012 42nd Annual IEEE/IFIPInternational Conference on Dependable Systems and Networks (DSN), pages 1–12,June 2012.
[161] H. Malik, H. Hemmati, and A. E. Hassan. Automatic detection of performance devia-tions in the load testing of large scale systems. In 2013 35th International Conferenceon Software Engineering (ICSE), pages 1012–1021. IEEE, 2013.
[162] I. Manotas, C. Bird, R. Zhang, D. Shepherd, C. Jaspan, C. Sadowski, L. Pollock, andJ. Clause. An empirical study of practitioners’ perspectives on green software engi-neering. In Proceedings of the 38th International Conference on Software Engineering,pages 237–248. ACM, 2016.
[163] I. Manotas, L. Pollock, and J. Clause. Seeds: a software engineer’s energy-optimizationdecision support framework. In Proceedings of the 36th International Conference onSoftware Engineering, pages 503–514. ACM, 2014.
[164] K. Mao, M. Harman, and Y. Jia. Sapienz: Multi-objective automated testing forandroid applications. In Proceedings of the 25th International Symposium on SoftwareTesting and Analysis, pages 94–105. ACM, 2016.
[165] E. Martin and T. Xie. A fault model and mutation testing of access control policies. InProceedings of the 16th international conference on World Wide Web, pages 667–676.ACM, 2007.
[166] A. M. Memon, M. E. Pollack, and M. L. Soffa. Automated test oracles for guis. InACM SIGSOFT Software Engineering Notes, volume 25, pages 30–39. ACM, 2000.
[167] S. Mirshokraie, A. Mesbah, and K. Pattabiraman. Efficient javascript mutation testing.In 2013 IEEE Sixth International Conference on Software Testing, Verification andValidation, pages 74–83. IEEE, 2013.
[168] N. Mirzaei, H. Bagheri, R. Mahmood, and S. Malek. Sig-droid: Automated systeminput generation for android applications. In Software Reliability Engineering (ISSRE),2015 IEEE 26th International Symposium on, pages 461–471. IEEE, 2015.
[169] N. Mirzaei, H. Bagheri, R. Mahmood, and S. Malek. Sig-droid: Automated systeminput generation for android applications. In Software Reliability Engineering (ISSRE),2015 IEEE 26th International Symposium on, pages 461–471. IEEE, 2015.
[170] N. Mirzaei, J. Garcia, H. Bagheri, A. Sadeghi, and S. Malek. Reducing combinatorics ingui testing of android applications. In Proceedings of the 38th International Conferenceon Software Engineering, pages 559–570. ACM, 2016.
[171] N. Mirzaei, J. Garcia, H. Bagheri, A. Sadeghi, and S. Malek. Reducing combinatorics ingui testing of android applications. In Proceedings of the 38th International Conferenceon Software Engineering, pages 559–570. ACM, 2016.
203

[172] D. Octeau, D. Luchaup, M. Dering, S. Jha, and P. McDaniel. Composite constantpropagation: Application to android inter-component communication analysis. InProceedings of the 37th International Conference on Software Engineering-Volume 1,pages 77–88. IEEE Press, 2015.
[173] A. J. Offutt, J. Pan, and J. M. Voas. Procedures for reducing the size of coverage-basedtest sets. In In Proc. Twelfth Int’l. Conf. Testing Computer Softw. Citeseer, 1995.
[174] A. Orso and G. Rothermel. Software testing: a research travelogue (2000–2014). InProceedings of the on Future of Software Engineering, pages 117–132. ACM, 2014.
[175] M. Papadakis, C. Henard, M. Harman, Y. Jia, and Y. Le Traon. Threats to the validityof mutation-based test assessment. In Proceedings of the 25th International Symposiumon Software Testing and Analysis, pages 354–365. ACM, 2016.
[176] M. Papadakis, Y. Jia, M. Harman, and Y. Le Traon. Trivial compiler equivalence: Alarge scale empirical study of a simple, fast and effective equivalent mutant detectiontechnique. In Software Engineering (ICSE), 2015 IEEE/ACM 37th IEEE InternationalConference on, volume 1, pages 936–946. IEEE, 2015.
[177] A. Paszke, S. Gross, S. Chintala, G. Chanan, E. Yang, Z. DeVito, Z. Lin, A. Desmaison,L. Antiga, and A. Lerer. Automatic differentiation in pytorch. 2017.
[178] A. Pathak, Y. C. Hu, and M. Zhang. Bootstrapping energy debugging on smartphones:a first look at energy bugs in mobile devices. In Proceedings of the 10th ACM Workshopon Hot Topics in Networks, page 5. ACM, 2011.
[179] A. Pathak, Y. C. Hu, and M. Zhang. Where is the energy spent inside my app?: finegrained energy accounting on smartphones with eprof. In Proceedings of the 7th ACMeuropean conference on Computer Systems, pages 29–42. ACM, 2012.
[180] A. Pathak, Y. C. Hu, M. Zhang, P. Bahl, and Y.-M. Wang. Fine-grained power mod-eling for smartphones using system call tracing. In Proceedings of the Sixth Conferenceon Computer Systems, EuroSys ’11, pages 153–168, 2011.
[181] L. Prechelt. Early stopping-but when? In Neural Networks: Tricks of the trade, pages55–69. Springer, 1998.
[182] J. Rice. Mathematical statistics and data analysis. Nelson Education, 2006.
[183] G. Rothermel, M. J. Harrold, J. Von Ronne, and C. Hong. Empirical studies of test-suite reduction. Software Testing, Verification and Reliability, 12(4):219–249, 2002.
[184] D. J. Rumsey. Statistics for dummies. John Wiley & Sons, 2011.
[185] A. Sadeghi, R. Jabbarvand, and S. Malek. Patdroid: permission-aware gui testing ofandroid. In Proceedings of the 2017 11th Joint Meeting on Foundations of SoftwareEngineering, pages 220–232. ACM, 2017.
204

[186] R. Sasnauskas and J. Regehr. Intent Fuzzer: Crafting Intents of Death. In Pro-ceedings of the 2014 Joint International Workshop on Dynamic Analysis (WODA)and Software and System Performance Testing, Debugging, and Analytics (PERTEA),WODA+PERTEA 2014, pages 1–5, New York, NY, USA, 2014. ACM.
[187] M. Sipser. Introduction to the Theory of Computation, 3rd edition. Course Technology,2012.
[188] W. Song, X. Qian, and J. Huang. Ehbdroid: beyond gui testing for android applica-tions. In Proceedings of the 32nd IEEE/ACM International Conference on AutomatedSoftware Engineering, pages 27–37. IEEE Press, 2017.
[189] K.-J. Stol, P. Ralph, and B. Fitzgerald. Grounded theory in software engineeringresearch: a critical review and guidelines. In Software Engineering (ICSE), 2016IEEE/ACM 38th International Conference on, pages 120–131. IEEE, 2016.
[190] T. Su, G. Meng, Y. Chen, K. Wu, W. Yang, Y. Yao, G. Pu, Y. Liu, and Z. Su. Guided,stochastic model-based gui testing of android apps. In Proceedings of the 2017 11thJoint Meeting on Foundations of Software Engineering, pages 245–256. ACM, 2017.
[191] M. Tlili, S. Wappler, and H. Sthamer. Improving evolutionary real-time testing. InProceedings of the 8th annual conference on Genetic and evolutionary computation,pages 1917–1924. ACM, 2006.
[192] R. Vallee-Rai, P. Co, E. Gagnon, L. Hendren, P. Lam, and V. Sundaresan. Soot-a javabytecode optimization framework. In Proceedings of the 1999 conference of the Centrefor Advanced Studies on Collaborative research, page 13. IBM Press, 1999.
[193] H. van der Merwe, B. van der Merwe, and W. Visser. Execution and property specifi-cations for jpf-android. SIGSOFT Softw. Eng. Notes, 39(1):1–5, Feb. 2014.
[194] C. Wang, F. Pastore, and L. Briand. Oracles for testing software timeliness withuncertainty. ACM Transactions on Software Engineering and Methodology (TOSEM),28(1):1, 2018.
[195] E. J. Weyuker and F. I. Vokolos. Experience with performance testing of software sys-tems: issues, an approach, and case study. IEEE transactions on software engineering,26(12):1147, 2000.
[196] C. Wilke, S. Richly, S. Gotz, C. Piechnick, and U. Aßmann. Energy consumption andefficiency in mobile applications: A user feedback study. In The Internation Conf. onGreen Computing and Communications, 2013.
[197] L. Wolsey. Integer programming. Wiley, 1998.
[198] F. Wu, J. Nanavati, M. Harman, Y. Jia, and J. Krinke. Memory mutation testing.Information and Software Technology, 81:97–111, 2017.
205

[199] H. Wu, S. Yang, and A. Rountev. Static detection of energy defect patterns in an-droid applications. In Proceedings of the 25th International Conference on CompilerConstruction, pages 185–195. ACM, 2016.
[200] T. Wu, J. Liu, Z. Xu, C. Guo, Y. Zhang, J. Yan, and J. Zhang. Light-weight, inter-procedural and callback-aware resource leak detection for android apps. IEEE Trans.Software Eng., 42(11):1054–1076, 2016.
[201] Q. Xie and A. M. Memon. Designing and comparing automated test oracles for gui-based software applications. ACM Transactions on Software Engineering and Method-ology (TOSEM), 16(1):4, 2007.
[202] T. Xie. Augmenting automatically generated unit-test suites with regression oraclechecking. In European Conference on Object-Oriented Programming, pages 380–403.Springer, 2006.
[203] T. Xie and D. Notkin. Checking inside the black box: Regression testing by comparingvalue spectra. IEEE Transactions on Software Engineering, 31(10):869–883, 2005.
[204] D. Yan, S. Yang, and A. Rountev. Systematic testing for resource leaks in android ap-plications. In Software Reliability Engineering (ISSRE), 2013 IEEE 24th InternationalSymposium on, pages 411–420. IEEE, 2013.
[205] K. Yang, J. Zhuge, Y. Wang, L. Zhou, and H. Duan. IntentFuzzer: Detecting Capa-bility Leaks of Android Applications. In Proceedings of the 9th ACM Symposium onInformation, Computer and Communications Security, ASIA CCS ’14, pages 531–536,New York, NY, USA, 2014. ACM.
[206] W. Yang, M. Prasad, and T. Xie. A grey-box approach for automated gui-modelgeneration of mobile applications. In V. Cortellessa and D. Varro, editors, Fundamen-tal Approaches to Software Engineering, volume 7793 of Lecture Notes in ComputerScience, pages 250–265. Springer Berlin Heidelberg, 2013.
[207] W. Yang, M. R. Prasad, and T. Xie. A grey-box approach for automated gui-modelgeneration of mobile applications. In Proceedings of the 16th International Conferenceon Fundamental Approaches to Software Engineering, FASE’13, pages 250–265, Berlin,Heidelberg, 2013. Springer-Verlag.
[208] W. Yang, M. R. Prasad, and T. Xie. A grey-box approach for automated gui-modelgeneration of mobile applications. In International Conference on Fundamental Ap-proaches to Software Engineering, pages 250–265. Springer, 2013.
[209] H. Ye, S. Cheng, L. Zhang, and F. Jiang. DroidFuzzer: Fuzzing the Android Apps withIntent-Filter Tag. In Proceedings of International Conference on Advances in MobileComputing & Multimedia, MoMM ’13, pages 68:68–68:74, New York, NY, USA, 2013.ACM.
[210] S. Yoo and M. Harman. Regression testing minimization, selection and prioritization:a survey. Software Testing, Verification and Reliability, 22(2):67–120, 2012.
206

[211] C. Zhang, H. Cheng, E. Tang, X. Chen, L. Bu, and X. Li. Sketch-guided gui test gen-eration for mobile applications. In Proceedings of the 32nd IEEE/ACM InternationalConference on Automated Software Engineering, pages 38–43. IEEE Press, 2017.
[212] L. L. Zhang, C.-J. M. Liang, Y. Liu, and E. Chen. Systematically testing back-ground services of mobile apps. In Automated Software Engineering (ASE), 2017 32ndIEEE/ACM International Conference on, pages 4–15. IEEE, 2017.
[213] Z. Zhang and M. Sabuncu. Generalized cross entropy loss for training deep neuralnetworks with noisy labels. In Advances in neural information processing systems,pages 8778–8788, 2018.
207