Iterative Design and Testing of a Mobile Application to Support ...
152
Clemson University TigerPrints All Dissertations Dissertations 12-2015 Iterative Design and Testing of a Mobile Application to Support Food Consumption Monitoring and Decision Making Melva James Clemson University, [email protected] Follow this and additional works at: hps://tigerprints.clemson.edu/all_dissertations Part of the Computer Sciences Commons is Dissertation is brought to you for free and open access by the Dissertations at TigerPrints. It has been accepted for inclusion in All Dissertations by an authorized administrator of TigerPrints. For more information, please contact [email protected]. Recommended Citation James, Melva, "Iterative Design and Testing of a Mobile Application to Support Food Consumption Monitoring and Decision Making" (2015). All Dissertations. 1567. hps://tigerprints.clemson.edu/all_dissertations/1567
-
Upload
khangminh22 -
Category
Documents
-
view
1 -
download
0
Transcript of Iterative Design and Testing of a Mobile Application to Support ...

Clemson UniversityTigerPrints
All Dissertations Dissertations
12-2015
Iterative Design and Testing of a MobileApplication to Support Food ConsumptionMonitoring and Decision MakingMelva JamesClemson University, [email protected]
Follow this and additional works at: https://tigerprints.clemson.edu/all_dissertations
Part of the Computer Sciences Commons
This Dissertation is brought to you for free and open access by the Dissertations at TigerPrints. It has been accepted for inclusion in All Dissertations byan authorized administrator of TigerPrints. For more information, please contact [email protected].
Recommended CitationJames, Melva, "Iterative Design and Testing of a Mobile Application to Support Food Consumption Monitoring and Decision Making"(2015). All Dissertations. 1567.https://tigerprints.clemson.edu/all_dissertations/1567
ITERATIVE DESIGN AND TESTING OF A MOBILE APPLICATION TO SUPPORT FOOD CONSUMPTION MONITORING AND DECISION MAKING
A Dissertation Presented to
the Graduate School of Clemson University
In Partial Fulfillment of the Requirements for the Degree
Doctor of Philosophy Human-Centered Computing
by Melva Tonisha James
December 2015
Accepted by: Dr. Kelly Caine, Committee Chair
Dr. Shaundra Daily, Co-chair Dr. Eric Muth
Dr. Sekou Remy
ii
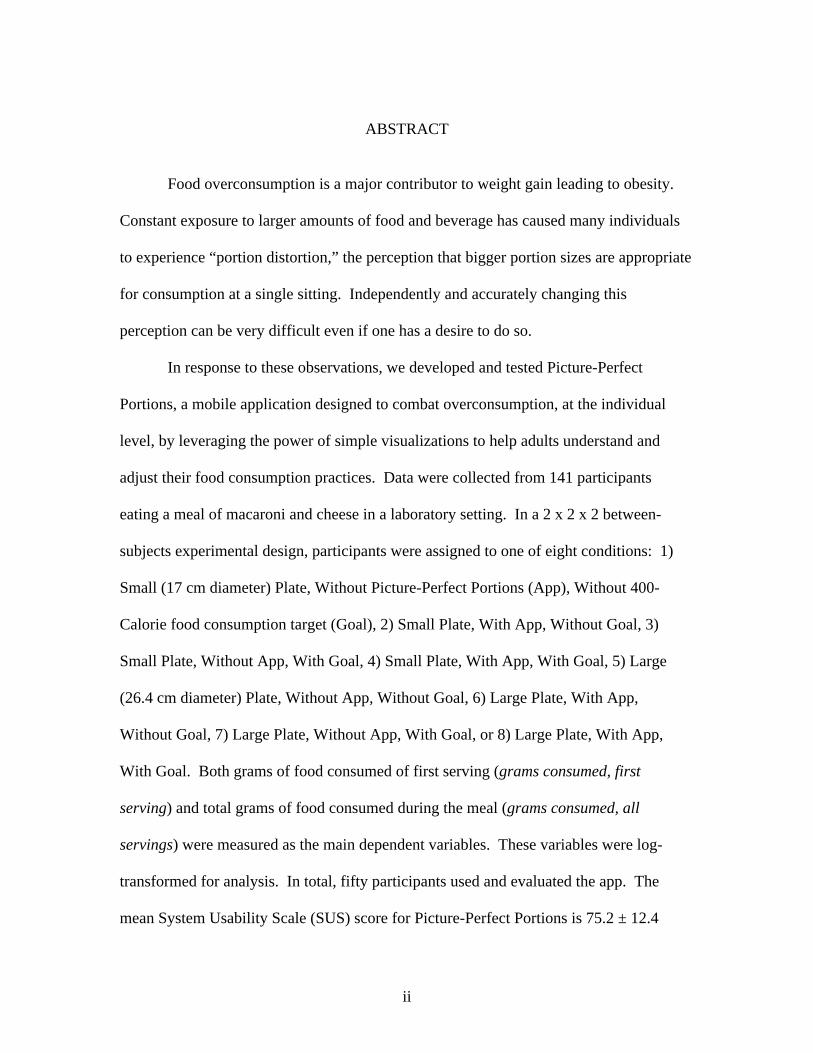
ABSTRACT
Food overconsumption is a major contributor to weight gain leading to obesity.
Constant exposure to larger amounts of food and beverage has caused many individuals
to experience “portion distortion,” the perception that bigger portion sizes are appropriate
for consumption at a single sitting. Independently and accurately changing this
perception can be very difficult even if one has a desire to do so.
In response to these observations, we developed and tested Picture-Perfect
Portions, a mobile application designed to combat overconsumption, at the individual
level, by leveraging the power of simple visualizations to help adults understand and
adjust their food consumption practices. Data were collected from 141 participants
eating a meal of macaroni and cheese in a laboratory setting. In a 2 x 2 x 2 between-
subjects experimental design, participants were assigned to one of eight conditions: 1)
Small (17 cm diameter) Plate, Without Picture-Perfect Portions (App), Without 400-
Calorie food consumption target (Goal), 2) Small Plate, With App, Without Goal, 3)
Small Plate, Without App, With Goal, 4) Small Plate, With App, With Goal, 5) Large
(26.4 cm diameter) Plate, Without App, Without Goal, 6) Large Plate, With App,
Without Goal, 7) Large Plate, Without App, With Goal, or 8) Large Plate, With App,
With Goal. Both grams of food consumed of first serving (grams consumed, first
serving) and total grams of food consumed during the meal (grams consumed, all
servings) were measured as the main dependent variables. These variables were log-
transformed for analysis. In total, fifty participants used and evaluated the app. The
mean System Usability Scale (SUS) score for Picture-Perfect Portions is 75.2 ± 12.4

iii
(median 78.8). This suggests that Picture-Perfect Portions is an application with high
overall system usability.
An ANOVA of ln(grams consumed, first serving) for all participants revealed a
main effect of PLATE SIZE such that, on average, participants given a large plate
consumed more of the first serving than participants given a small plate. A main effect of
PLATE SIZE was also observed for the dependent variable ln(grams consumed, all
servings) such that, on average, the total amount of food consumed by participants given
a large plate was more than the total amount of food consumed by participants given a
small plate.
A main effect of DEVICE was observed for all participants under the “With
Goal” treatment such that, on average, participants with a 400-Calorie consumption goal
and the assistance of Picture-Perfect Portions ate less of the first serving than participants
with a 400-Calorie consumption goal without the assistance of the app. In addition, a
significant effect of DEVICE on ln(grams consumed, first serving) was observed for the
“Small Plate” treatment such that, on average, participants using the app ate less than
participants not using the app.
These results demonstrate the powerful effect of plate size on individuals’ food
consumption. They also, however, demonstrate that there are scenarios in which “just-in-
time” feedback from an application such as Picture-Perfect Portions can impact food
consumption, especially for those individuals with a specific food consumption goal.

iv
DEDICATION
This work is dedicated to my parents, Oscar James, Sr., and Adonna J. James.
v
ACKNOWLEDGMENTS
I offer thanks to my family and friends for their continuous support of me as a
person and as a scholar. I also thank Dr. Karen Kemper, Associate Professor of Public
Health Sciences at Clemson University, Dr. Katherine Cason, Professor of Food,
Nutrition, and Packaging at Clemson University, and Dr. Andrea Grimes-Parker,
Assistant Professor of Computer and Information Science and Health Sciences at
Northeastern University, for their subject matter expertise and their guidance at the
earliest stages of my research. In addition, I thank University of Florida computer
engineering Ph.D. candidate Kara Gundersen, Clemson University industrial engineering
Ph.D. candidate Myrtede Alfred, and Venkatramanan Chanchapalli Madhavan, M.S., for
lending their design and human factors expertise to the application evaluation process. I
also thank Professor Deidra Morrison of Morris College for her mentorship and guidance.
I am indebted to all of my colleagues from the CyberInnovations Laboratory, the
Humans and Technology Laboratory (HATLab), and the Applied Psychophysiology
Laboratory. I am especially grateful to Phil Jasper, Jenna Darrah, Yifang Li, Priscilla
Burgess, Sameer Singh, and Emily Matthews for their help with data collection, data
entry, and data analysis. In addition, I thank Dr. Eric Muth, Director of the Applied
Psychophysiology Laboratory at Clemson University, for granting me use of his
laboratory space and equipment to perform my experiments. I also thank Dr. Bart
Knijnenburg, Co-director of the HATLab, for elucidating key statistical methods and for
helping me with data analysis and interpretation.

vi
I am tremendously grateful to my committee chair, Dr. Kelly Caine, for her
wisdom, her generosity, and her enthusiastic support of my research career. I thank Dr.
Sekou Remy for his kindness and his depth of insight. I am profoundly grateful for my
friend and advisor, Dr. Shaundra (Shani) Daily. Thank you, Shani, for believing in me
when I didn’t believe in myself. Lastly, I thank Dr. Juan Gilbert both for his tireless
efforts to promote the success of people of color in the STEM professions and for giving
me the opportunity to earn my Ph.D. in the field of computing.
The GEM Foundation, the Adobe Foundation, the Bill and Melinda Gates
Foundation, the Clemson University Graduate School, and the Clemson University
Human Factors and Ergonomics Research Institute provided financial support for this
work.

vii
TABLE OF CONTENTS
Page
TITLE PAGE .................................................................................................................... i ABSTRACT ..................................................................................................................... ii DEDICATION ................................................................................................................ iv ACKNOWLEDGMENTS ............................................................................................... v LIST OF TABLES .......................................................................................................... ix LIST OF FIGURES ......................................................................................................... x CHAPTER I. INTRODUCTION ......................................................................................... 1 II. BACKGROUND AND RELATED WORK ................................................ 5 Defining portion size ................................................................................ 5 Measuring and estimating portion size .................................................... 6 Relating portion size to eating behavior .................................................. 7 Technology-based strategies and interventions ....................................... 8 III. ITERATIVE DESIGN OF APPLICATION ............................................... 15 Iterative refinement of proposed solution ............................................. 15 Implementation 0: Mock-up .................................................................. 15 Implementation 1: Low-fidelity prototype ............................................. 17 Implementation 2: Picture-Perfect Plate application ............................. 21 Implementation 3: Picture-Perfect Portions application ........................ 29 IV. APPLICATION EVALUATION ............................................................... 34 Statement of Hypotheses ........................................................................ 34 Experimental Design .............................................................................. 35 Target Population ................................................................................... 36 Location Selection ................................................................................. 38 Power Analysis ...................................................................................... 39
viii
Table of Contents (Continued)
Page
Participant Recruitment ......................................................................... 39 Experimental Protocol ........................................................................... 39 Usability Evaluation ............................................................................... 41 Study of Application Effectiveness in Supporting Decision Making .... 44 V. DISSCUSSION ........................................................................................... 73 Discussion of Experimental Results ...................................................... 73 Key Considerations for General Mobile Nutrition Application Design 76 VI. CONCLUSION AND FUTURE WORK ................................................... 78 APPENDICES ............................................................................................................... 81 A: Participant Demographics Sheet .................................................................. 82 B: Demographics Questionnaire ....................................................................... 83 C: Relationship Questionnaire .......................................................................... 86 D: Start SLIM ................................................................................................... 87 E: End SLIM..................................................................................................... 88 F: End LAM ..................................................................................................... 89 G: Self-Control Scale ........................................................................................ 90 H: Nutrition Knowledge Questionnaire ............................................................ 93 I: Nutrition Consciousness Questionnaire ....................................................... 94 J: System Usability Scale ................................................................................ 95 K: Heuristic Evaluation Guidelines .................................................................. 96 L: Consent Form ............................................................................................ 116 M: Experimental Protocol .............................................................................. 119 N: Means Table .............................................................................................. 127 WORKS CITED .......................................................................................................... 129

ix
LIST OF TABLES
Table Page 3.1 Critique of mock-up (Implementation 0) ..................................................... 17 3.2 Application design priorities ........................................................................ 19 3.3 Critique of low-fidelity prototype (Implementation 1) ................................ 21 3.4 Critique of Picture-Perfect Plate application (Implementation 2) ............... 30 4.1 Experimental conditions for 2 x 2 x 2 between-subjects study design ........ 36 4.2 G-Power a priori sample size computation results ...................................... 40 4.3 Complimentary remarks from participants about Picture-Perfect Portions . 43 4.4 Constructive criticism from participants about Picture-Perfect Portions .... 44 4.5 Number of participants by experimental condition ..................................... 45 4.6 ANOVA results for all participants, ln(grams consumed, first serving) ..... 48 4.7 ANOVA results for all participants, ln(grams consumed, all servings) ...... 49
x
LIST OF FIGURES
Figure Page 3.1 Mock-up (Implementation 0) images ........................................................... 16 3.2 Sequential screenshots of low-fidelity prototype (Implementation 1) ......... 20 3.3 Sequential screenshots of Picture-Perfect Plate (Implementation 2) ........... 23 3.4 ER diagram of Picture-Perfect Plate (Implementation 2) food item database ................................................................................................. 29 3.5 Sequential screenshots of Picture-Perfect Portions (Implementation 3) ...... 32 4.1 Experimental eating station with small-diameter (17 cm) plates shown ..... 41 4.2 Histogram of System Usability Scale scores (N = 50) for Picture-Perfect Portions (Implementation 3). ................................................................. 42 4.3 Box plots for grams consumed (first serving) by experimental condition ... 46 4.4 Box plots for grams consumed (all servings) by experimental condition ... 47 4.5 Mean grams consumed (first serving) for all participants by Plate Size ..... 50 4.6 Mean Calories consumed (first serving) for all participants by Plate Size .. 50 4.7 Mean grams consumed (all servings) for all participants by Plate Size ...... 51 4.8 Mean Calories consumed (all servings) for all participants by Plate Size .. 51 4.9 Mean grams consumed (first serving) for “With App” by Plate Size .......... 53 4.10 Mean Calories consumed (first serving) for “With App” by Plate Size ...... 53 4.11 Mean grams consumed (all servings) for “With App” by Plate Size .......... 54 4.12 Mean Calories consumed (all servings) for “With App” by Plate Size ...... 54 4.13 Mean grams consumed (first serving) for “With Goal” treatment by Plate Size ................................................................................................ 56

xi
List of Figures (Continued) Figure Page 4.14 Mean Calories consumed (first serving) for “With Goal” treatment by Plate Size ............................................................................................... 56 4.15 Mean grams consumed (all servings) for “With Goal” treatment by Plate Size ................................................................................................ 58 4.16 Mean Calories consumed (all servings) for “With Goal” treatment by Plate Size ................................................................................................ 58 4.17 Mean grams consumed (first serving) for “Small Plate” treatment by device presence ...................................................................................... 60 4.18 Mean Calories consumed (first serving) for “Small Plate” treatment by device presence ...................................................................................... 60 4.19 Mean ln(grams consumed, first serving) for “Large Plate” treatment by device presence ...................................................................................... 61 4.20 Mean ln(grams consumed, first serving) for “Large Plate” treatment by goal ......................................................................................................... 61 4.21 Mean grams consumed (all servings) for “Small Plate, Without Goal” treatment by device presence ................................................................. 62 4.22 Mean Calories consumed (all servings) for “Small Plate, Without Goal” treatment by device presence ................................................................. 62 4.23 Mean grams consumed (first serving) for “Large Plate, Without Goal” treatment by device presence ................................................................. 63 4.24 Mean Calories consumed (first serving) for “Large Plate, Without Goal” treatment by device presence ................................................................. 63 4.25 Mean grams consumed (first serving) for “Large Plate, With Goal” treatment by device presence ................................................................. 64 4.26 Mean Calories consumed (first serving) for “Large Plate, With Goal” treatment by device presence ................................................................. 64

xii
List of Figures (Continued) Figure Page 4.27 Mean grams consumed (first serving) for “With App, Without Goal” treatment by plate size ........................................................................... 65 4.28 Mean Calories consumed (first serving) for “With App, Without Goal” treatment by plate size ........................................................................... 65 4.29 Mean grams consumed (all servings) for “With App, Without Goal” treatment by plate size ........................................................................... 66 4.30 Mean Calories consumed (all servings) for “With App, Without Goal” treatment by plate size ........................................................................... 66 4.31 Mean grams consumed (first serving) for all conditions in which a main effect of PLATE SIZE was found. ......................................................... 68 4.32 Mean Calories consumed (first serving) for all conditions in which a main effect of PLATE SIZE was found .......................................................... 68 4.33 Mean grams consumed (all servings) for all conditions in which a main effect of PLATE SIZE was found .......................................................... 70 4.34 Mean Calories consumed (all servings) for all conditions in which a main effect of PLATE SIZE was found .......................................................... 70 4.35 Mean grams consumed (first serving) for all conditions in which a main effect of DEVICE was found ................................................................. 71 4.36 Mean Calories consumed (first serving) for all conditions in which a main effect of DEVICE was found ................................................................. 71 4.37 Mean grams consumed (first serving) for the “With Goal” treatment by plate size and device presence ............................................................... 74 4.38 Mean Calories consumed (first serving) for the “With Goal” treatment by plate size and device presence ............................................................... 74 4.39 Mean grams consumed (first serving) for the “Without Goal” treatment by plate size and device presence ............................................................... 75

xiii
List of Figures (Continued) Figure Page 4.40 Mean Calories consumed (first serving) for the “Without Goal” treatment by plate size and device presence ............................................................... 75
1
CHAPTER ONE
INTRODUCTION
In the United States, the prevalence of overweight and obesity is increasing across
all ages, races, genders, ethnicities, and economic backgrounds (Jelalian & McCullough,
2012). However, this increase has occurred most rapidly amongst college students and
young adults aged 18-29 years (Flegal, Carroll, Ogden, & Curtin, 2010; Mokdad et al.,
1999, 2003), and today, at least 40% of U.S. college students are either overweight or
obese (The American College Health Association, 2012).
Obesity, the state of having excess body fat, is a complex disease whose
fundamental cause is a positive discrepancy between energy intake and energy
expenditure (Finkelstein, Ruhm, & Kosa, 2005). Clinically, a metric called body mass
index (BMI) is used to classify individuals as underweight, overweight, or obese
(Eknoyan, 2008; Garrow & Webster, 1985). Individuals with a BMI greater than or
equal to 30 kg/m2 are considered obese (Jelalian & McCullough, 2012; NHLBI Obesity
Education Initiative Expert Panel on the Identification Evaluation and Treatment of
Overweight and Obesity in Adults, 1998).
Addressing the issue of obesity is important, both for individuals and for the
nation as a whole. Overweight and obesity are closely correlated to a wide range of other
morbidities, including type 2 diabetes, hypertension, kidney disease, heart disease, stroke,
depression, liver disease, and various cancers (Finkelstein et al., 2005). Collectively,
Americans will spend hundreds of billions of dollars on health care for the treatment of
individuals with obesity and obesity-related diseases. In addition, the economy will lose

2
billons more in productivity due to worker illness (Finkelstein et al., 2005; Jelalian &
McCullough, 2012; Nayga, 2014). These expenses and productivity losses are expected
to exponentially increase over time due to the high correlation between overweight/obese
parents and overweight/obese children (Finkelstein et al., 2005). Thus, preventive
education is not only appropriate, but also necessary for the young adult and
postsecondary student populations in the United States.
The ease with which obesity can be diagnosed belies the difficulty many
individuals face in fighting the disease and preventing its onset. This discrepancy
suggests that there is a need for tools that give individuals information and feedback
about behaviors that can influence their obesity risk in real-time. Toward that end, we
have developed a mobile application, Picture-Perfect Portions, whose design is meant
both to encourage reflection on one’s meal before food consumption and to combat the
tendency to overeat in the presence of certain environmental cues. Within the
application, users can photograph a meal, identify food objects, and visualize
discrepancies that may exist between self-served portions and recommended single
serving sizes of the food objects of interest. There are three (3) research questions related
to the proposed application that will be explored: 1) what kind of system might support
decision making around portion sizes?; 2) what is the proposed system’s level of
usability, as evaluated by qualitative and quantitative usability metrics?; and 3) in what
ways might individuals using the system overcome specific environmental cues to
overeat? The expected contributions of this work are enumerated below:

3
• Picture-Perfect Portions, an application whose purpose is to support food
consumption decision making through the identification of single serving sizes, is the
first key contribution. The application uses commonly available items (e.g., coins) as
fiducial markers and engages users in the food identification process without
requiring them to guess the amount of food represented in the related photographs.
• The second contribution is a report of the findings from an experimental study
designed to test the hypothesis that a mobile, image-based application can assist
individuals in resisting environmental cues to overeat.
• The final contribution is a list of general recommendations for mobile nutrition
application design gleaned from a comparison of observations from the literature and
data collected over the iterative design process and during experimentation.
This dissertation consists of six chapters and thirteen appendices. Chapter 2
clarifies the difference between servings and portions and describes the relationship
between these concepts and the national obesity epidemic. This chapter also provides a
broad overview of closely related technological interventions. Chapter 3 provides a full
description of each iteration of the application’s design, ending with the current system,
Picture-Perfect Portions. Chapter 4 describes the findings from an experimental
evaluation of the application’s usability and its effectiveness in combating environmental
cues to overeat. Chapter 5 discusses the experimental results detailed in Chapter 4 and
lists key considerations for general mobile nutrition application design, based on
empirical observations. Chapter 6 provides an overall summary of the contributions of
this research and presents several suggestions for future research directions. Finally, the

4
appendices list all documents, forms, and surveys used in support of the experiments
described in Chapter 4.

5
CHAPTER TWO
BACKGROUND AND RELATED WORK
Defining Portion Size
A portion is the amount of a particular food intended to be eaten on a single
occasion; it can be self-selected or externally determined (Division of Nutrition and
Physical Activity, 2006; “Serving Sizes and Portions,” 2013). Portion sizes vary widely
depending on the food item selected, the context in which the meal or snack is consumed,
and individual choice (Division of Nutrition and Physical Activity, 2006). In general,
portion sizes for food and beverages consumed by Americans have increased
substantially over time (Division of Nutrition and Physical Activity, 2006; Finkelstein et
al., 2005; Levi et al., 2011; National Heart Lung and Blood Institute (NHLBI), 2013;
Nielsen & Popkin, 2003; Young & Nestle, 2002).
A serving is a measured amount of food described by standard units, such as
grams, cups, or ounces (“Serving Sizes and Portions,” 2013). Defining a serving size,
however, is more complex. In 1990, the United States Congress signed Nutrition
Labeling and Education Act into law, which established mandatory nutrition labeling for
packaged foods (Food Labeling: Serving Sizes of Foods That Can Reasonably Be
Consumed at One-Eating Occasion, 2014). This piece of legislation, in 1993, was
amended to include a definition of the phrase “serving size.” Serving sizes, in the context
of the law, are defined as “an amount of food customarily consumed per eating occasion
by persons 4 years of age or older which is expressed in a common household measure
that is appropriate to the food.” (Nutrition Labeling of Food, 21 C. F. R. § 101, 1993). In

6
this case, “serving” and “serving size” are used interchangeably (Food Labeling: Serving
Sizes of Foods That Can Reasonably Be Consumed at One-Eating Occasion, 2014).
Reference amounts customarily consumed have been empirically determined. The
serving sizes listed on nutritional labeling are based on the average amounts of individual
food items consumed by American adults as reported by the Nationwide Food
Consumption Surveys (NFCS) conducted by the U.S. Department of Agriculture in 1977-
1978 (Pao, Fleming, Guenther, & Mickle, 1982) and 1987-1988 (Food and Nutrient
Intakes by Individuals in the United States by Sex and Age, 1994-96. USDA Nationwide
Food Surveys Report No. 96-2, 1998).
Measuring and Estimating Portion Size
The two most accurate ways to measure portion size are 1) weighing food with
scales and 2) measuring food with measuring cups (Division of Nutrition and Physical
Activity, 2006). These methods, while accurate, are often not practical in everyday life.
This means that individuals, in practice, must try to estimate their portions. Research has
shown, however, that people tend to poorly perform this task (Rolls, Morris, & Roe,
2002; L R Young & Nestle, 1995; L. R. Young & Nestle, 1998). Because the problems
with individual estimation of portions are well known, many research efforts have been
directed toward accurate recognition and measurement of food items using image-based
technologies (see Section 2.4). What remains to be seen, however, is whether or not
high-accuracy image recognition is truly necessary to achieve behavioral change. The
proposed work will directly address this question.

7
Relating Portion Size to Eating Behavior
Portion sizes, both for meals prepared at home and meals consumed away from
home, have increased dramatically over the past few decades, creating a phenomenon
labeled “portion distortion” (Division of Nutrition and Physical Activity, 2006;
Finkelstein et al., 2005; S. J. Nielsen & Popkin, 2013; “Serving Sizes and Portions,”
2013; Lisa R. Young & Nestle, 2002). Larger portions are closely correlated to higher
caloric intake, and when a person is given a large portion, they tend to eat more without
realizing it (Diliberti, Bordi, Conklin, Roe, & Rolls, 2004; Ello-Martin, Roe, Meengs,
Wall, & Robinson, 2002; Finkelstein et al., 2005; Jelalian & McCullough, 2012; Pudel &
Oetting, 1977; Rolls et al., 2002; Rolls, Roe, Meengs, & Wall, 2004; “Serving Sizes and
Portions,” 2013; B. Wansink & Park, 2001; Brian Wansink & Cheney, 2005; Brian
Wansink & Kim, 2005; Brian Wansink, Painter, & North, 2005; Brian Wansink, van
Ittersum, & Painter, 2006). This sort of “mindless eating” can also occur during
snacking, especially if the snacking occurs during television viewing (Finkelstein et al.,
2005; Jeffery & French, 1998; Jelalian & McCullough, 2012). Television viewing, in
fact, “has been shown to increase snacking, portion sizes, the percentage of calories from
fat, and calories [consumed]” (Finkelstein et al., 2005; Jeffery & French, 1998) .
The practice of “supersizing”—also known as “value sizing”—or the marketing
of extremely large portions of food and/or beverages at the expense of quality, is made
possible by the relatively low cost of producing energy-dense, nutrient-poor food
products (Finkelstein et al., 2005; Jelalian & McCullough, 2012; Lakdawalla &

8
Philipson, 2002; Rolls, 2003). It is suggested that the practice is economical for
businesses because it simplifies the preparation process by permitting the purchasing and
preparation of food items in bulk, and that it is desirable to consumers because they
perceive themselves to be getting a "good value" (Division of Nutrition and Physical
Activity, 2006; Finkelstein et al., 2005; Jelalian & McCullough, 2012; Lakdawalla &
Philipson, 2002). Chou et al., in addition, assert that consumers’ perceptions of value
extend to time and that the increased popularity of restaurants, particularly fast food
restaurants, can be explained as a logical manifestation of consumers’ personal values
(Chou, Grossman, & Saffer, 2004; Finkelstein et al., 2005). More specifically, they
suggest that consumers are willing to sacrifice nutrition for the opportunity to secure
household time, a more valuable commodity (Chou et al., 2004; Finkelstein et al., 2005).
This theory, while logically valid, assumes that individuals consciously choose unhealthy
options in the presences of healthy alternatives. However, more than 20 million
Americans, live in “food deserts,” neighborhoods that don’t have a supermarket or other
consistently available location from which to purchase fresh fruits and vegetables within
a 1-mile radius (Finkelstein et al., 2005). Thus, for these Americans, their environment
limits their ability to make healthy food choices.
Technology-Based Strategies and Interventions
Many different technology-based interventions have been designed for the
purpose of facilitating changes in the dietary patterns of individuals. One important
subset of these technologies is mobile health or mHealth (Istepanaian & Zhang, 2012;
9
Istepanian, Jovanov, & Zhang, 2004) technologies. The concept of mHealth has been
described as “mobile computing, medical sensor, and communications technologies for
healthcare” (Istepanaian & Zhang, 2012; Istepanian et al., 2004) and is a derivative of
telemedicine, a precursor discipline (Laxminarayan & Istepanian, 2000). mHealth
solutions can be divided into three major categories: 1) wearable devices and sensor
technologies, such as activity monitors (Amft & Tröster, 2008; Beaudin, Intille, &
Morris, 2006; Chang et al., 2006; Consolvo et al., 2008; Consolvo, Everitt, Smith, &
Landay, 2006; Dong, Hoover, Scisco, & Muth, 2012; Newton, Wiltshire, & Elley, 2009;
Parker, Harper, & Grinter, 2011); 2) computing and internet technologies, such as
computer-tailored education (Brug, Oenema, Kroeze, & Raat, 2005; Haapala, Barengo,
Biggs, Surakka, & Manninen, 2009; Krebs, Prochaska, & Rossi, 2010; Portnoy, Scott-
Sheldon, Johnson, & Carey, 2008; Saperstein, Atkinson, & Gold, 2007; Vandelanotte,
Spathonis, Eakin, & Owen, 2007); and 3) information and communications technologies,
such as cell phones, tablets, and personal digital assistants (PDAs) (Istepanaian & Zhang,
2012; Martin et al., 2009, 2012; Pinzon & Iyengar, 2012). Due to their ubiquitous
presence in nearly every culture and economy, mobile phones are of extreme interest as
agents of health communication and persuasion. Indeed, mobile phone features such as
text messaging (Cole-Lewis & Kershaw, 2010), cameras, native applications, automated
sensing, and Internet access have been used to support many different health intervention
strategies including health information tracking, healthcare team involvement, leveraging
of social influence, increasing the accessibility and availability of health information, and
the use entertainment as an educational tool (Baumer et al., 2012; Grimes, Kantroo, &

10
Grinter, 2010; Klasnja & Pratt, 2012). Several such interventions, each highlighting a
different mobile phone feature, are described below.
Text messaging is “is widely available, inexpensive, and instant” (Cole-Lewis &
Kershaw, 2010). In addition, it does not require devices that support advanced graphics.
Taking advantage of these characteristics, Haapala and colleagues conducted a 1-year
study of the interaction of overweight adults in Finland with an automated system that
delivered “targeted, weight-specific tailored text messages to reduce daily food intake,
increase physical activity, encourage daily weight recording, and provide instant
feedback” (Cole-Lewis & Kershaw, 2010; Haapala et al., 2009). A companion website
was also made available for the purpose of weight tracking. The goal of the intervention
was to facilitate weight loss in the experimental group compared to participants in the
control group. They found, after 12 months, that the intervention group, on average, lost
more than four times the weight of the control group. In addition, the intervention group
also showed a greater decrease in waist diameter, consistent with the comparative weight
loss data (Cole-Lewis & Kershaw, 2010; Haapala et al., 2009). The feasibility of the
system to support long-term, permanent behavioral change, however, is in question.
Most weight loss for participants occurred within the first three months, and the
frequency of system use by participants decreased dramatically over time data (Cole-
Lewis & Kershaw, 2010; Haapala et al., 2009).
Voice messaging, like text messaging, is readily available and inexpensive
compared to more computationally intensive mobile technologies. Unlike text
messaging, however, it lends itself to more personal interactions because it involves the
11
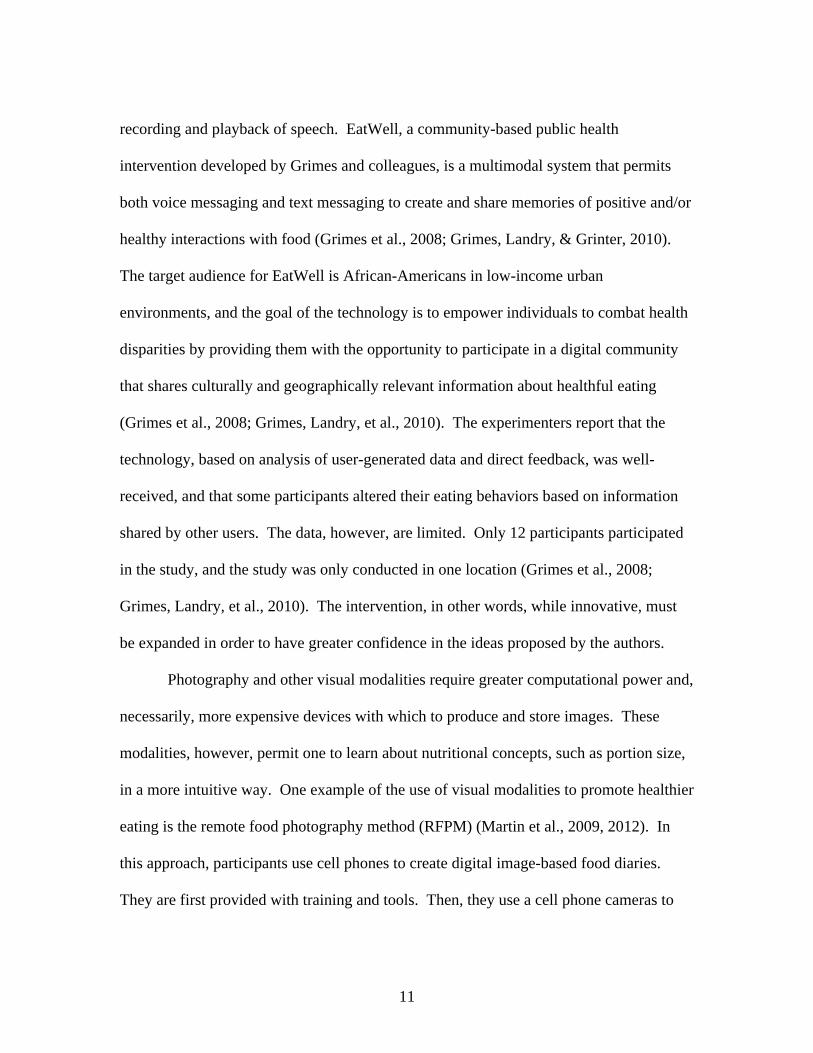
recording and playback of speech. EatWell, a community-based public health
intervention developed by Grimes and colleagues, is a multimodal system that permits
both voice messaging and text messaging to create and share memories of positive and/or
healthy interactions with food (Grimes et al., 2008; Grimes, Landry, & Grinter, 2010).
The target audience for EatWell is African-Americans in low-income urban
environments, and the goal of the technology is to empower individuals to combat health
disparities by providing them with the opportunity to participate in a digital community
that shares culturally and geographically relevant information about healthful eating
(Grimes et al., 2008; Grimes, Landry, et al., 2010). The experimenters report that the
technology, based on analysis of user-generated data and direct feedback, was well-
received, and that some participants altered their eating behaviors based on information
shared by other users. The data, however, are limited. Only 12 participants participated
in the study, and the study was only conducted in one location (Grimes et al., 2008;
Grimes, Landry, et al., 2010). The intervention, in other words, while innovative, must
be expanded in order to have greater confidence in the ideas proposed by the authors.
Photography and other visual modalities require greater computational power and,
necessarily, more expensive devices with which to produce and store images. These
modalities, however, permit one to learn about nutritional concepts, such as portion size,
in a more intuitive way. One example of the use of visual modalities to promote healthier
eating is the remote food photography method (RFPM) (Martin et al., 2009, 2012). In
this approach, participants use cell phones to create digital image-based food diaries.
They are first provided with training and tools. Then, they use a cell phone cameras to
12
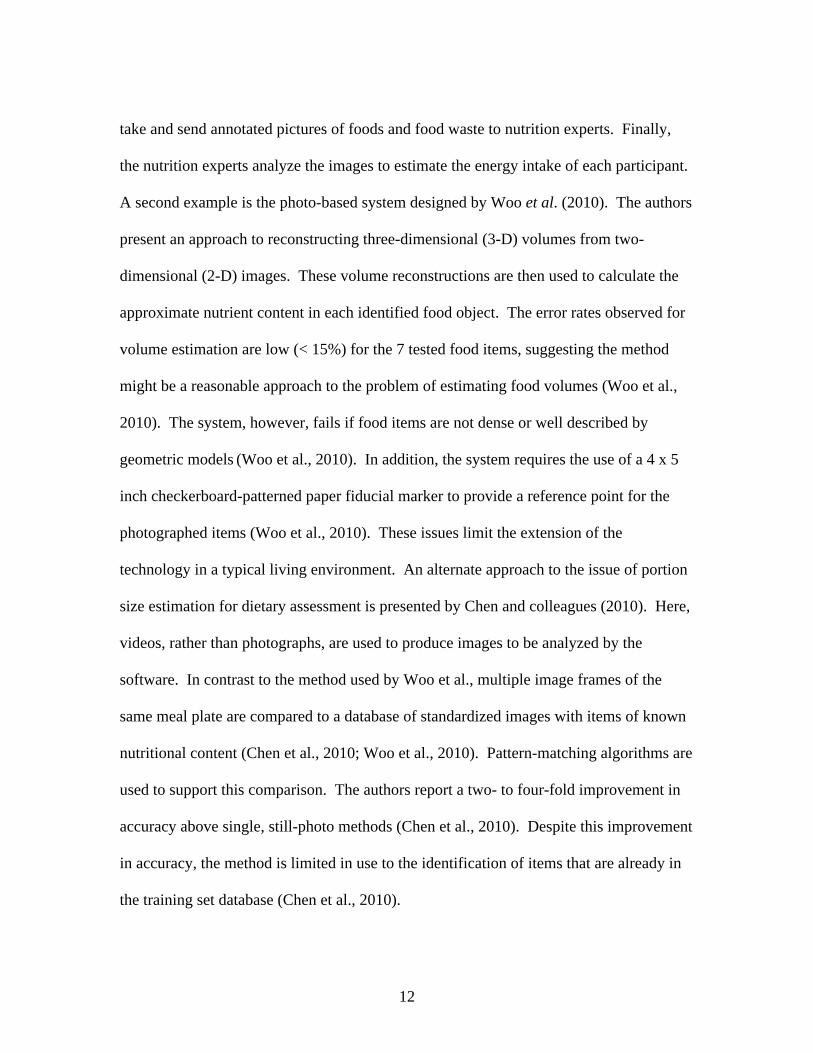
take and send annotated pictures of foods and food waste to nutrition experts. Finally,
the nutrition experts analyze the images to estimate the energy intake of each participant.
A second example is the photo-based system designed by Woo et al. (2010). The authors
present an approach to reconstructing three-dimensional (3-D) volumes from two-
dimensional (2-D) images. These volume reconstructions are then used to calculate the
approximate nutrient content in each identified food object. The error rates observed for
volume estimation are low (< 15%) for the 7 tested food items, suggesting the method
might be a reasonable approach to the problem of estimating food volumes (Woo et al.,
2010). The system, however, fails if food items are not dense or well described by
geometric models (Woo et al., 2010). In addition, the system requires the use of a 4 x 5
inch checkerboard-patterned paper fiducial marker to provide a reference point for the
photographed items (Woo et al., 2010). These issues limit the extension of the
technology in a typical living environment. An alternate approach to the issue of portion
size estimation for dietary assessment is presented by Chen and colleagues (2010). Here,
videos, rather than photographs, are used to produce images to be analyzed by the
software. In contrast to the method used by Woo et al., multiple image frames of the
same meal plate are compared to a database of standardized images with items of known
nutritional content (Chen et al., 2010; Woo et al., 2010). Pattern-matching algorithms are
used to support this comparison. The authors report a two- to four-fold improvement in
accuracy above single, still-photo methods (Chen et al., 2010). Despite this improvement
in accuracy, the method is limited in use to the identification of items that are already in
the training set database (Chen et al., 2010).

13
In addition to purely academic efforts, there are three commercially developed
applications that bear mentioning. One application is the Figwee Portion Explorer,
released by Density Limit, LLC, as an iPhone/iPad app in 2011 (Apple, 2011; Vocus
PRW Holdings, 2011). Figwee is designed to provide visual support to users who are
tracking their diet with a separate calorie counter or food diary. Within the app, users can
choose food one of approximately 1,500 food items from a fixed, text-searchable
database of images and use a slider within the interface to see how pre-determined calorie
and nutrient information changes as or less of the selected food item is displayed. The
application is simply designed and easy to use. It does not, however, offer the ability to
add new food images or the ability to store favorite images. The second application of
note is PhotoCalorie, released by PhotoCalorie, LLC, in 2010. PhotoCalorie is a visual
food journaling application that allows users to take and store food images within the
app. Users must identify the food items in the image by finding the items in a text-
searchable database, and then they must estimate the number of servings of each food to
get an estimate of calories and nutrients associated with the foods shown in the image
(Laskowski, 2010). The last commercial application that will be described is PlateMate,
a visual food journaling application. PlateMate, released in 2011, is a product of
academic research that was later sold to Sweetbee Corporation (Noronha, Hysen, Zhang,
& Gajos, 2011). The PlateMate application allows users to take food images within the
application; those images are then uploaded to the cloud to be identified by workers
participating in Amazon’s Mechanical Turk. The developers, through the use of a novel
work allocation system, were able to obtain calorie content estimate performances similar
14
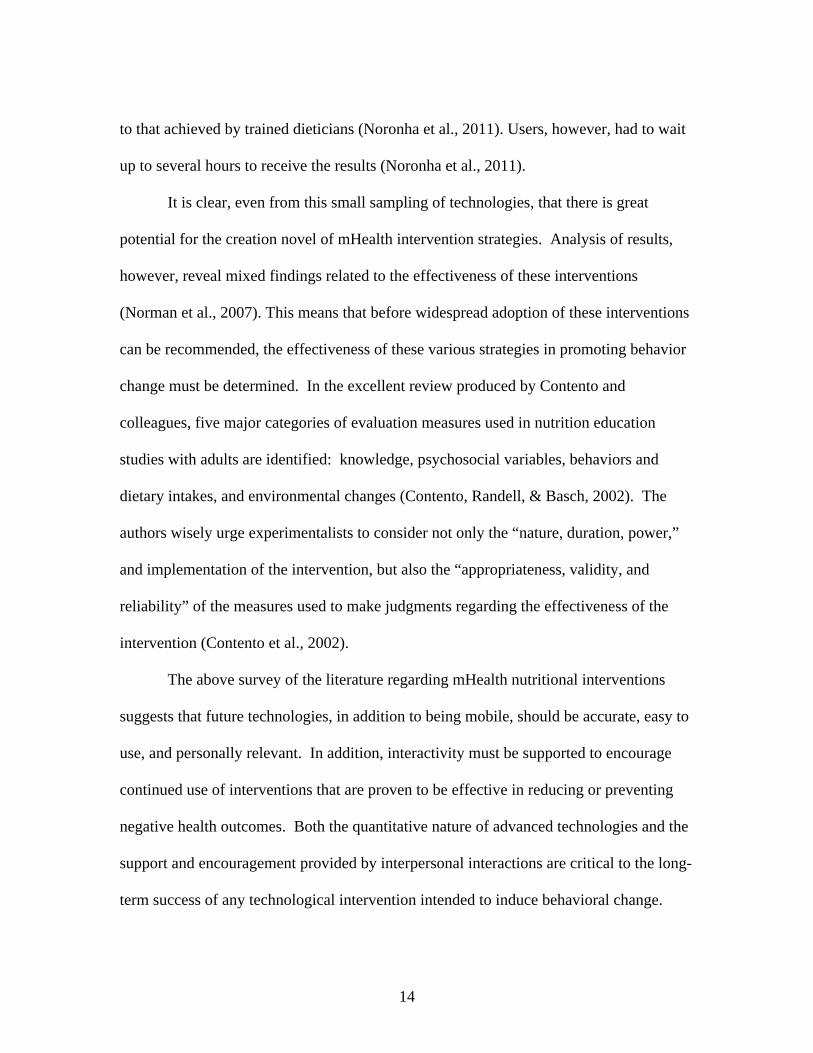
to that achieved by trained dieticians (Noronha et al., 2011). Users, however, had to wait
up to several hours to receive the results (Noronha et al., 2011).
It is clear, even from this small sampling of technologies, that there is great
potential for the creation novel of mHealth intervention strategies. Analysis of results,
however, reveal mixed findings related to the effectiveness of these interventions
(Norman et al., 2007). This means that before widespread adoption of these interventions
can be recommended, the effectiveness of these various strategies in promoting behavior
change must be determined. In the excellent review produced by Contento and
colleagues, five major categories of evaluation measures used in nutrition education
studies with adults are identified: knowledge, psychosocial variables, behaviors and
dietary intakes, and environmental changes (Contento, Randell, & Basch, 2002). The
authors wisely urge experimentalists to consider not only the “nature, duration, power,”
and implementation of the intervention, but also the “appropriateness, validity, and
reliability” of the measures used to make judgments regarding the effectiveness of the
intervention (Contento et al., 2002).
The above survey of the literature regarding mHealth nutritional interventions
suggests that future technologies, in addition to being mobile, should be accurate, easy to
use, and personally relevant. In addition, interactivity must be supported to encourage
continued use of interventions that are proven to be effective in reducing or preventing
negative health outcomes. Both the quantitative nature of advanced technologies and the
support and encouragement provided by interpersonal interactions are critical to the long-
term success of any technological intervention intended to induce behavioral change.

15
CHAPTER THREE
ITERATIVE DESIGN OF APPLICATION
Iterative Refinement of Proposed Solution
An iterative process has been used to refine the proposed system’s design. Each
design iteration can be described in terms of a three-part cycle consisting of: initial
design, feedback solicitation, and redesign. The proposed solution has undergone two
design iteration cycles, yielding three implementations of increasing sophistication. The
three system implementations, as well as the associated design cycles, are described in
detail below.
Implementation 0: Mock-up
The application mock-up was a Powerpoint presentation with series of still
images arranged to illustrate the desired functionality of the future application (Figure
3.1). The concept, as initially conceived, was completely dependent on the ability to
automate the food recognition process. The design of the mock-up was presented to
faculty and peers in the Clemson University School of Computing in class presentations,
research group meetings, and individual meetings. The primary critiques and the
associated design responses are listed in Table 3.1. Design responses were implemented
in the subsequent application iteration (see Section 3.3).

16
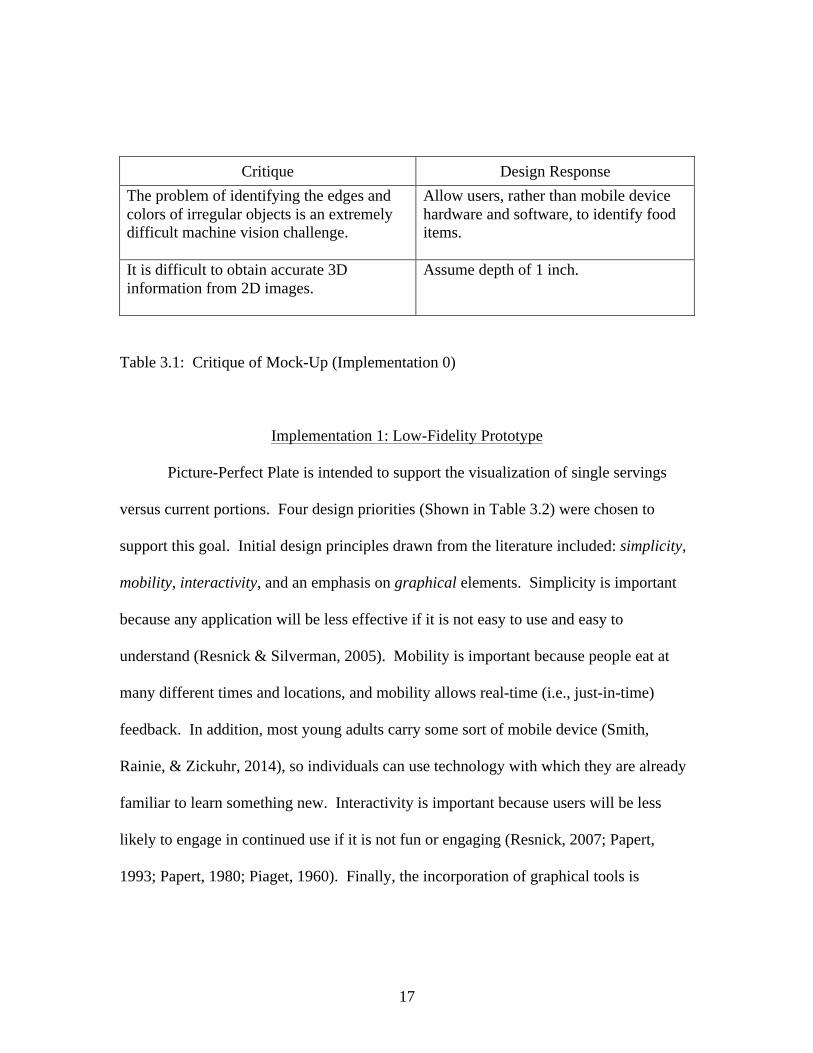
Figure 3.1: Mock-up (Implementation 0) images. Powerpoint slide mock-up images with captions.
17
Critique Design Response The problem of identifying the edges and colors of irregular objects is an extremely difficult machine vision challenge.
Allow users, rather than mobile device hardware and software, to identify food items.
It is difficult to obtain accurate 3D information from 2D images.
Assume depth of 1 inch.
Table 3.1: Critique of Mock-Up (Implementation 0)
Implementation 1: Low-Fidelity Prototype
Picture-Perfect Plate is intended to support the visualization of single servings
versus current portions. Four design priorities (Shown in Table 3.2) were chosen to
support this goal. Initial design principles drawn from the literature included: simplicity,
mobility, interactivity, and an emphasis on graphical elements. Simplicity is important
because any application will be less effective if it is not easy to use and easy to
understand (Resnick & Silverman, 2005). Mobility is important because people eat at
many different times and locations, and mobility allows real-time (i.e., just-in-time)
feedback. In addition, most young adults carry some sort of mobile device (Smith,
Rainie, & Zickuhr, 2014), so individuals can use technology with which they are already
familiar to learn something new. Interactivity is important because users will be less
likely to engage in continued use if it is not fun or engaging (Resnick, 2007; Papert,
1993; Papert, 1980; Piaget, 1960). Finally, the incorporation of graphical tools is
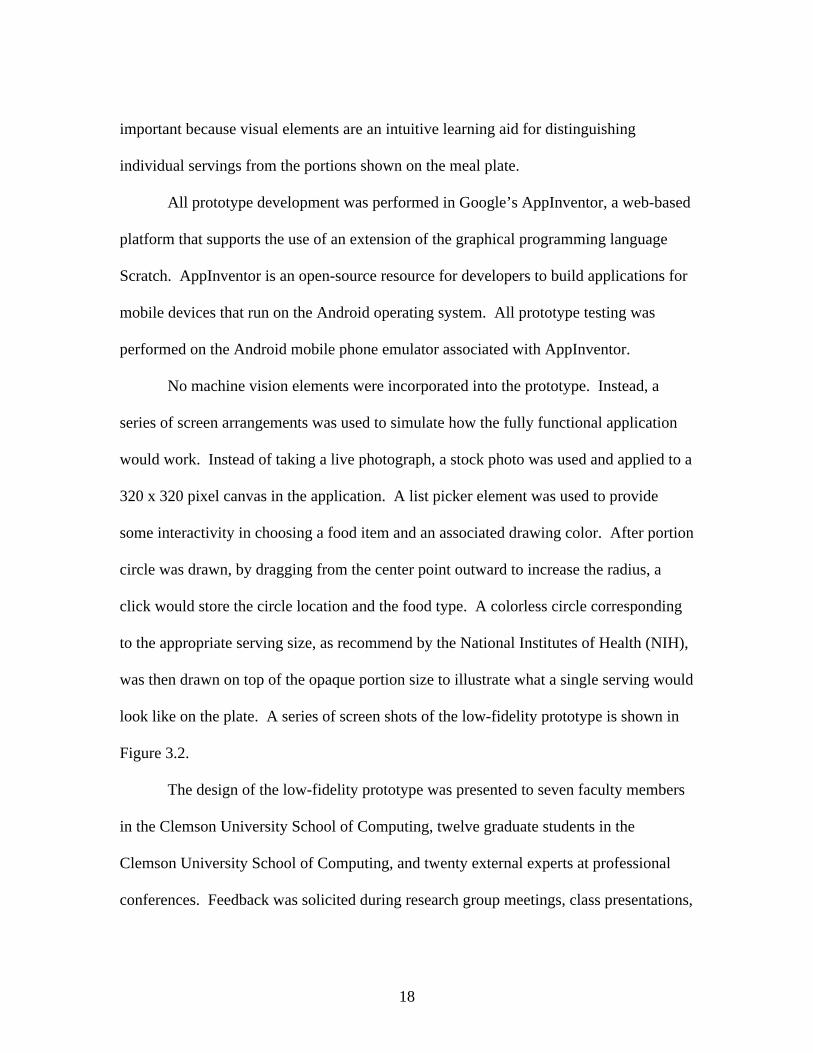
18
important because visual elements are an intuitive learning aid for distinguishing
individual servings from the portions shown on the meal plate.
All prototype development was performed in Google’s AppInventor, a web-based
platform that supports the use of an extension of the graphical programming language
Scratch. AppInventor is an open-source resource for developers to build applications for
mobile devices that run on the Android operating system. All prototype testing was
performed on the Android mobile phone emulator associated with AppInventor.
No machine vision elements were incorporated into the prototype. Instead, a
series of screen arrangements was used to simulate how the fully functional application
would work. Instead of taking a live photograph, a stock photo was used and applied to a
320 x 320 pixel canvas in the application. A list picker element was used to provide
some interactivity in choosing a food item and an associated drawing color. After portion
circle was drawn, by dragging from the center point outward to increase the radius, a
click would store the circle location and the food type. A colorless circle corresponding
to the appropriate serving size, as recommend by the National Institutes of Health (NIH),
was then drawn on top of the opaque portion size to illustrate what a single serving would
look like on the plate. A series of screen shots of the low-fidelity prototype is shown in
Figure 3.2.
The design of the low-fidelity prototype was presented to seven faculty members
in the Clemson University School of Computing, twelve graduate students in the
Clemson University School of Computing, and twenty external experts at professional
conferences. Feedback was solicited during research group meetings, class presentations,

19
individual meetings, and poster presentations (James & Daily, 2014; James, 2013). The
primary critiques and the associated design responses are listed in Table 3.3. Design
responses were implemented in the subsequent application iteration, Picture-Perfect
Plate.
Design Priorities Specific Instances Afforded Activities Mobile Mobile device
implementation Ability to practice portion size understanding anywhere Just-in-time vs. transporting photo to a desktop/laptop at a later time Ability to easily share learning experiences and provide the opportunity for others to practice the portion size determination skill
Graphical, Interactive
Take photographs of meal plates
Creates opportunities for additional reflection in the moment, and (optionally) stores a record that can be revisited in the future
Graphical, Interactive, Simple
Draw opaque colored circles to represent portion sizes on photographed food image
Creates opportunities for additional reflection in the moment Provides mechanism for unit conversion to “real world” units (i.e., pixels!inches) Adds a potentially fun, interactive element to learning process
Graphical, Simple
Show single serving size as a transparent circle on the previously drawn opaque portion circle.
Allows users to quantitatively compare current consumption behavior with ideal consumption behavior Positive emphasis--Highlights what one can eat, rather than what one should not eat.
Table 3.2: Application Design Priorities

20
1. 2.
3. 4.
Figure 3.2: Sequential screenshots of low-fidelity prototype (Implementation 1). 1) Opening splash screen, 2) Screen post-photo, 3) Single food object identified by opaque colored circle, and 4) Single portion size represented by colorless circle for all user-identified food objects in image.
21
Critique Design Response Opaque circles used to indicate portion size obscure the view of the food items on the plate
Increased portion circle transparencies (i.e., color alpha values)
Next version of app should allow users to take pictures
Deployed application on real, rather than virtual, hardware Implemented expanded functionality, including the ability to take photos with the device’s camera
Users might want a database of food items to choose from
Implemented version of the USDA SR25 database inside the application
People might have trouble accurately estimating plate diameter; consider ways to scale the image that don’t require users to guess
Adapt application to accept the use of quarters as fiducial markers
Table 3.3: Critique of Low-Fidelity Prototype (Implementation 1)
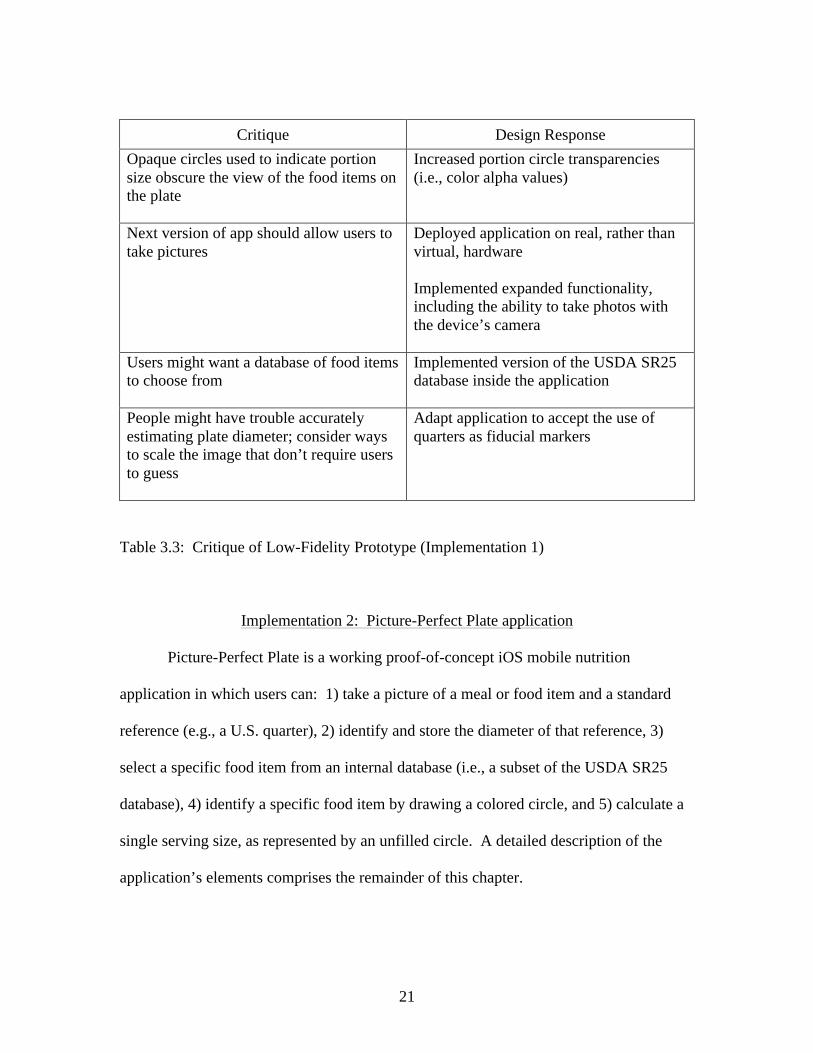
Implementation 2: Picture-Perfect Plate application
Picture-Perfect Plate is a working proof-of-concept iOS mobile nutrition
application in which users can: 1) take a picture of a meal or food item and a standard
reference (e.g., a U.S. quarter), 2) identify and store the diameter of that reference, 3)
select a specific food item from an internal database (i.e., a subset of the USDA SR25
database), 4) identify a specific food item by drawing a colored circle, and 5) calculate a
single serving size, as represented by an unfilled circle. A detailed description of the
application’s elements comprises the remainder of this chapter.
22
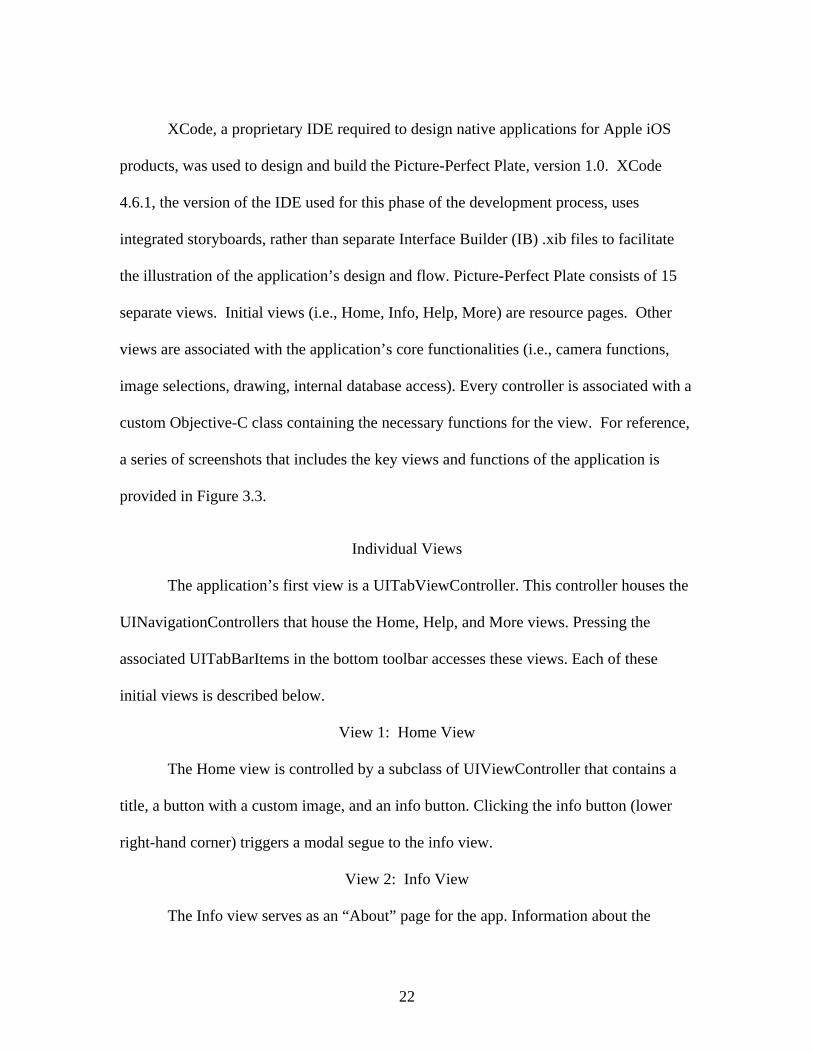
XCode, a proprietary IDE required to design native applications for Apple iOS
products, was used to design and build the Picture-Perfect Plate, version 1.0. XCode
4.6.1, the version of the IDE used for this phase of the development process, uses
integrated storyboards, rather than separate Interface Builder (IB) .xib files to facilitate
the illustration of the application’s design and flow. Picture-Perfect Plate consists of 15
separate views. Initial views (i.e., Home, Info, Help, More) are resource pages. Other
views are associated with the application’s core functionalities (i.e., camera functions,
image selections, drawing, internal database access). Every controller is associated with a
custom Objective-C class containing the necessary functions for the view. For reference,
a series of screenshots that includes the key views and functions of the application is
provided in Figure 3.3.
Individual Views
The application’s first view is a UITabViewController. This controller houses the
UINavigationControllers that house the Home, Help, and More views. Pressing the
associated UITabBarItems in the bottom toolbar accesses these views. Each of these
initial views is described below.
View 1: Home View
The Home view is controlled by a subclass of UIViewController that contains a
title, a button with a custom image, and an info button. Clicking the info button (lower
right-hand corner) triggers a modal segue to the info view.
View 2: Info View
The Info view serves as an “About” page for the app. Information about the

23
1. 2.
3. 4.
5. 6.
Figure 3.3: Sequential screenshots of Picture-Perfect Plate (Implementation 2). 1) Opening splash screen, 2) Screen prompting new drawing, 3) Empty drawing palette, 4) Drawing palette post-photo, 5) Reference object identified (right), 6) General food group display.

24
7. 8.
9. 10.
11.
Figure 3.3 (cont.): Sequential screenshots of Picture-Perfect Plate (Implementation 2). 7) Specialized food group display, 8) Individual food item display, 9) Selected food item alert, 10) Food object identified (left), and 11) Single portion size represented by colorless circle.

25
application and its creators are listed here. The home view can be seen again by pressing
the Done button (upper left-hand corner) in the upper toolbar. This view is controlled by
a subclass of UIViewController that contains a UIScrollView with several text labels.
View 3: Help View
The Help view displays instructions for how to use the app. It includes a
description of the views associated with the HomeTabBarController and gives a short list
of steps to help user’s understand how to get to the applications main functions. The Help
view is controlled by a subclass of UIViewController that contains a UIScrollView with
several text labels.
View 4: More View
The More view is controlled by a subclass of UIViewController and contains a
UIWebView that connects to the Internet and links to a page that allows one to search the
USDA National Nutrient Database for Standard Reference, Release 25 (SR25) (US
Department of Agriculture Agricultural Research Service Nutrient Data Laboratory,
2012).
View 5: Drawings View
The Drawings view is the first view associated with the core functions of the
applications. The Drawings view is controlled by a subclass of UIViewController and
displays an iCarousel which contains a clickable image, the touching of which triggers a
segue to the Drawings view. The reader is directed to Nathaniel Woolls’ project website
(http://www.nwoolls.com/projects.aspx?id=f068d85c-473d-41b2-ac09-761e194d324b) to
view information related to SimpleDrawing, an open source drawing application

26
provided to illustrate iOS drawing capabilities.
View 6: Drawing View
The Drawing view is the main view associated with the core functions of the
applications. This view is controlled by a subclass of UIViewController and contains a
UIView displaying a custom image, an upper and lower toolbar, and 17
UIBarButtonItems.
View 7: Drawing Tools View
The Drawing Tools view is controlled by a subclass of UITableViewController
and contains a view that displays available drawing tools. Several drawing tools are made
available to the user (i.e., pen, brush, line, text, rectangle stroke, rectangle fill, ellipse
stroke, fill, a). “Ellipse (fill),” which draws color-filled ellipses, is the default drawing
tool.
View 8: Map View
The Map view is controlled by a subclass of UIViewController and contains an
MKMapView and 3 UIBarButtonItems. The Map view is currently non-essential to the
function of the application, but may later be used to visualize user information in the
future.
View 9: Line Width View
The Line Width view is controlled by a subclass of UIViewController and
contains a text label and a UISlider. The line width slider allows the user to change the
size of lines that are draw for circle borders. The Line Width view is currently non-
essential to the function of the application.
27
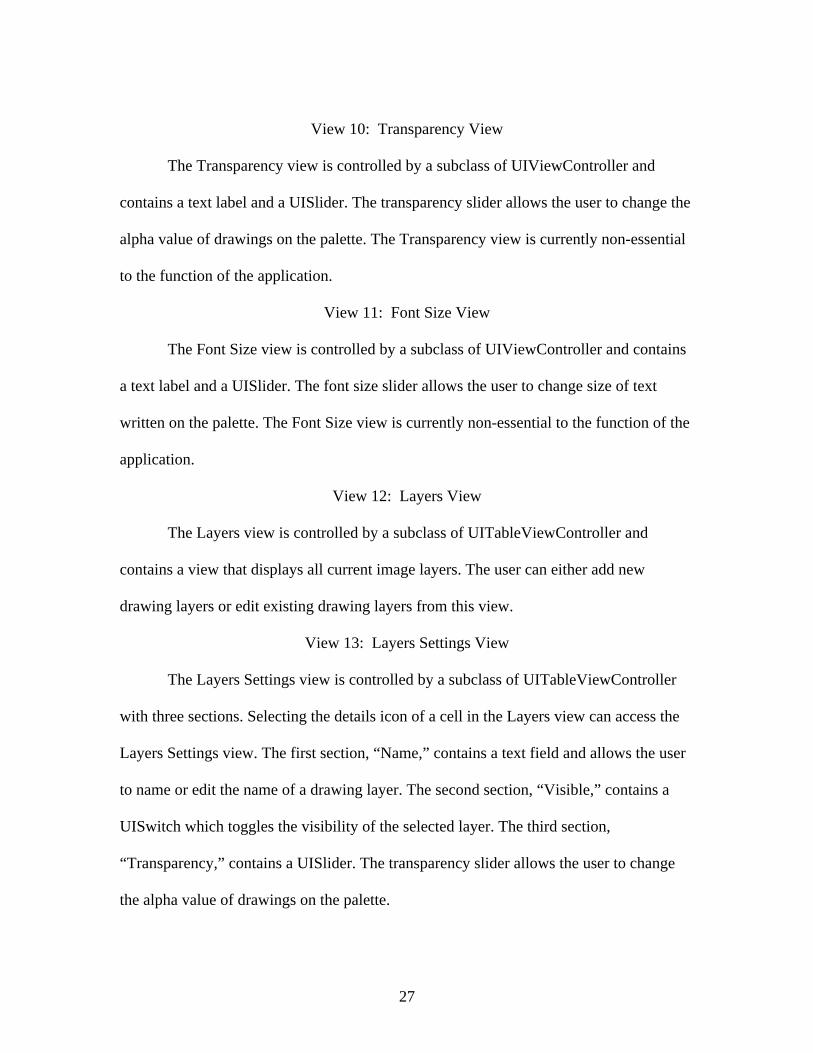
View 10: Transparency View
The Transparency view is controlled by a subclass of UIViewController and
contains a text label and a UISlider. The transparency slider allows the user to change the
alpha value of drawings on the palette. The Transparency view is currently non-essential
to the function of the application.
View 11: Font Size View
The Font Size view is controlled by a subclass of UIViewController and contains
a text label and a UISlider. The font size slider allows the user to change size of text
written on the palette. The Font Size view is currently non-essential to the function of the
application.
View 12: Layers View
The Layers view is controlled by a subclass of UITableViewController and
contains a view that displays all current image layers. The user can either add new
drawing layers or edit existing drawing layers from this view.
View 13: Layers Settings View
The Layers Settings view is controlled by a subclass of UITableViewController
with three sections. Selecting the details icon of a cell in the Layers view can access the
Layers Settings view. The first section, “Name,” contains a text field and allows the user
to name or edit the name of a drawing layer. The second section, “Visible,” contains a
UISwitch which toggles the visibility of the selected layer. The third section,
“Transparency,” contains a UISlider. The transparency slider allows the user to change
the alpha value of drawings on the palette.
28
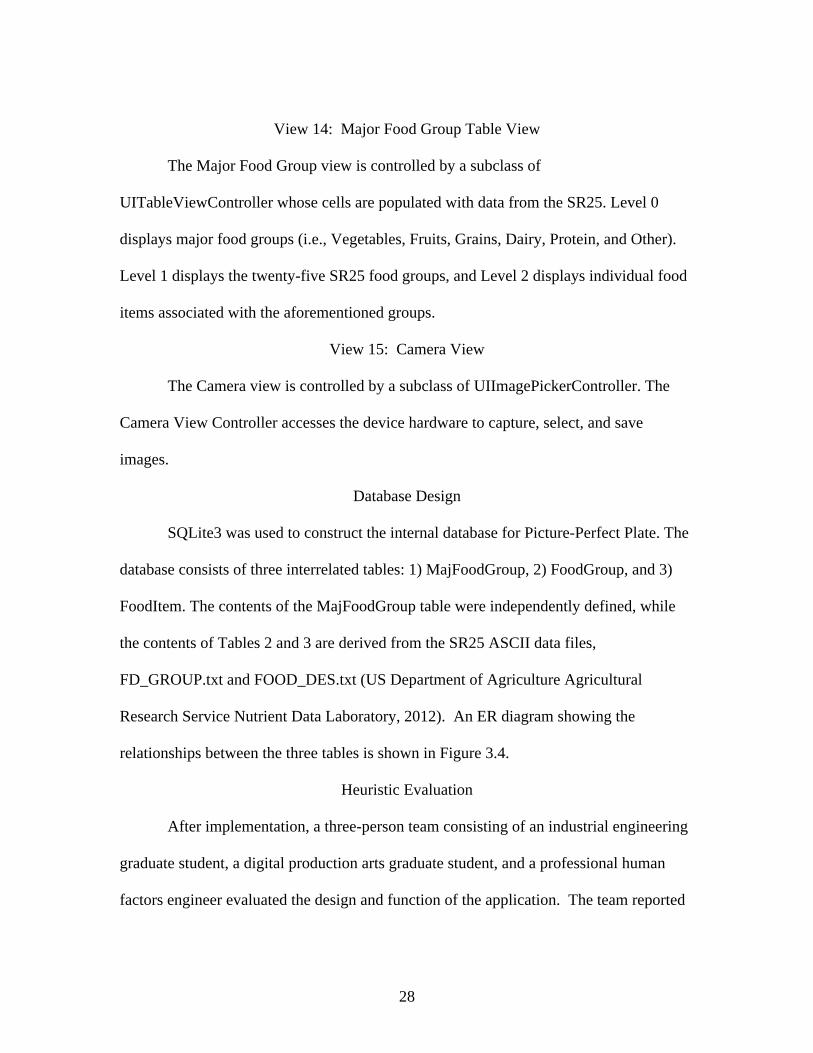
View 14: Major Food Group Table View
The Major Food Group view is controlled by a subclass of
UITableViewController whose cells are populated with data from the SR25. Level 0
displays major food groups (i.e., Vegetables, Fruits, Grains, Dairy, Protein, and Other).
Level 1 displays the twenty-five SR25 food groups, and Level 2 displays individual food
items associated with the aforementioned groups.
View 15: Camera View
The Camera view is controlled by a subclass of UIImagePickerController. The
Camera View Controller accesses the device hardware to capture, select, and save
images.
Database Design
SQLite3 was used to construct the internal database for Picture-Perfect Plate. The
database consists of three interrelated tables: 1) MajFoodGroup, 2) FoodGroup, and 3)
FoodItem. The contents of the MajFoodGroup table were independently defined, while
the contents of Tables 2 and 3 are derived from the SR25 ASCII data files,
FD_GROUP.txt and FOOD_DES.txt (US Department of Agriculture Agricultural
Research Service Nutrient Data Laboratory, 2012). An ER diagram showing the
relationships between the three tables is shown in Figure 3.4.
Heuristic Evaluation
After implementation, a three-person team consisting of an industrial engineering
graduate student, a digital production arts graduate student, and a professional human
factors engineer evaluated the design and function of the application. The team reported

29
observed usability heuristics violations (Molich & Nielsen, 1990; J. Nielsen, Molich, &
Ballerup, 1990; J. Nielsen, 1994) and made aesthetic design suggestions. The team’s
comments are summarized in Table 3.4.
Figure 3.4: ER diagram of Picture-Perfect Plate (Implementation 2) food item database.
Implementation 3: Picture-Perfect Portions application
The Picture-Perfect Portions application is conceptually related to the Picture-
Perfect Plate application, but it is a completely different software product. Unlike
Picture-Perfect Plate, Picture-Perfect Portions uses no open-source code to implement its
primary functions. In addition, Picture-Perfect Portions was built using Swift, Apple’s
current language standard. The migration to Swift was necessary to ensure application
behavior consistency across devices with different underlying hardware. All iPads used
for application development and testing ran iOS 8.4, and XCode 6.4 was used for

30
Critique Design Response It is not obvious that the image on the splash screen is the start button.
Text instructions added to splash screen below button image
There are no real-time instructions to guide individuals through the process of using the application. The current design does not promote independent usage of the application.
User-responsive alert screens added at each step of the application usage process.
There is no way to move or redraw circles once they are drawn.
“Back,” “Redraw,” or Yes/No option added to each instruction step
Some and icons are either confusing or redundant (e.g., trash can icon and delete button).
All non-interactive button and icons removed
All redundant icons removed
Full text used for buttons where a standard icon is not available
Application redesigned such that icon interaction is not necessary for usage
High-contrast colors should be used to identify the single serving circle and make it easier to see.
Single serving circle illustration changed from 1-point black border to 4.5-point black-and-white dashed border
Application name is vague and does not suggest the function of the app
App name changed from Picture-Perfect Plate to Picture-Perfect Portions
Table 3.4: Critique of Picture-Perfect Plate Application (Implementation 2)

31
development.
Picture-Perfect Portions is a streamlined and minimalist application compared to
Picture-Perfect Plate. Rather than fifteen view controllers, Picture-Perfect Portions
implements three—the opening splash screen, the main view (i.e., drawing palette), and
the database table view. In addition, the three-entity relational database implemented in
Picture-Perfect Plate was replaced by the abbreviated SR27 database table (US
Department of Agriculture Agricultural Research Service Nutrient Data Laboratory,
2015). The abbreviated database table provides serving data for 8,618 individual food
items. The food item data is stored on a distributed network and is retrieved dynamically
for use in the application with the Parse Core package
(https://www.parse.com/products/core). A series of screenshots that includes the key
views and functions of the application is provided in Figure 3.5.

32
1. 2.
3. 4.
5. 6.
Figure 3.5: Sequential screenshots of Picture-Perfect Portions (Implementation 3). 1) Opening splash screen, 2) Alert prompting photo, 3) Camera view, 4) Camera view post-photo, 5) Alert prompting reference object identification, 6) Alert prompting food item selection and reference object identified (right).

33
7. 8.
9. 10.
11.
Figure 3.5 (cont.): Sequential screenshots of Picture-Perfect Portions (Implementation 3). 7) Food item list, 8) Food item selection alert, 9) Alert prompting food object identification, 10) Food object identified and alert containing portion and calorie information shown, 11) Single serving size represented by dashed black and white circle.
34
CHAPTER FOUR
APPLICATION EVALUATION
After iterative design and development of the Picture-Perfect Portions app, our
focus shifted to the remaining two research questions: 1) what is the proposed system’s
level of usability, as evaluated by qualitative and quantitative usability metrics?; and 2) in
what ways might individuals using the system overcome specific environmental cues to
overeat? These questions were answered during a multi-day study during which Picture-
Perfect Portions was evaluated both for usability and for functionality. First, a set of
hypotheses to be tested was identified. Next, an experiment was designed to test these
hypotheses. After designing the experiment, a power analysis was performed to see how
many participants from the target population would be required to obtain results with
statistically significant power. The experiments were then carried out. After data
collection, statistical analyses were performed on the experimental data. Finally, the
results of the statistical analyses were assessed to determine whether or not the data
supported the initially stated hypotheses.
Statement of Hypotheses
Previous studies have shown that individuals tend to consume more when served
more (Diliberti et al., 2004; Rolls et al., 2002; Rolls, Roe, Meengs, et al., 2004) and when
presented with larger bowls (Pudel & Oetting, 1977; Brian Wansink & Cheney, 2005;
Brian Wansink et al., 2005), spoons (Brian Wansink et al., 2006), or other containers
(Rolls, Roe, Kral, Meengs, & Wall, 2004). This behavior bias holds true regardless of

35
the type of food or self-reported enjoyment of the food’s flavor (B. Wansink & Park,
2001; Brian Wansink & Kim, 2005). Large plate size, thus, can be a powerful
environmental cue to overeat. Knowing this behavioral bias, we explored whether or not
individuals, with the use of the Picture-Perfect Portions app, could overcome the
unconscious urge to overeat when provided a large plate. Five hypotheses were tested
using the univariate analysis of variance (ANOVA) statistical procedure in SPSS:
1. A main effect of PLATE SIZE will be observed such that participants eating from
a larger plate will consume more than participants eating from a smaller plate.
2. A main effect of DEVICE will be observed such that participants who use the
Picture-Perfect Portions application will consume less than participants who do
not use the Picture-Perfect Portions application.
3. A main effect of GOAL will be observed such that participants who receive a
400-Calorie consumption goal will consume more than participants who do not
receive a 400-Calorie consumption goal.
4. A PLATE SIZE * DEVICE interaction will be observed such that the presence of
the Picture-Perfect Portions application will reduce the effect of plate size.
5. A PLATE SIZE * GOAL interaction will be observed such that the presence of
the 400-Calorie consumption goal will reduce the effect of plate size.
Experimental Design
To test the previously stated hypotheses, a 2 x 2 x 2 between-subjects experiment
for which the dependent variable (DV) is grams consumed was designed. This variable

36
was further divided into grams consumed (first serving) and grams consumed (all
servings) during subsequent analyses. The independent variables (IV) for the study are
PLATE SIZE, DEVICE, and GOAL. Each IV has two levels: PLATE SIZE (1. Large:
26.4 cm diameter, 2. Small: 17 cm diameter, DEVICE (1. Without Picture-Perfect
Portions application, 2. With Picture-Perfect Portions application), and GOAL (1.
Without consumption goal, 2. With 400-Calorie consumption goal). This design results
in the eight experimental conditions shown in Table 4.1.
Condition Plate Size Device Goal
1 Small Plate Without App (-) Without Goal (-)
2 Small Plate With App (+) Without Goal (-)
3 Small Plate Without App (-) With Goal (+)
4 Small Plate With App (+) With Goal (+)
5 Large Plate Without App (-) Without Goal (-)
6 Large Plate With App (+) Without Goal (-)
7 Large Plate Without App (-) With Goal (+)
8 Large Plate With App (+) With Goal (+)
Table 4.1: Experimental conditions for 2 x 2 x 2 between-subjects study design
Target Population
Representing approximately 7% of the total population, there are nearly 20
million college students in the United States (United States Census Bureau, 2013). These
individuals are the audience for the proposed intervention. The youngest college students

37
may be most appropriately categorized as adolescents. The vast majority (84%) of
undergraduates, however, are between the ages of 18-24 (The American College Health
Association, 2012). These students, the target audience of this program, are most
accurately described as young, or emerging, adults (Nelson, Story, Larson, Neumark-
Sztainer, & Lytle, 2008)
Emerging adults, more so than the general adult population, are in an exploratory
and transformational stage of life. For college students, particularly freshmen, this often
involves a dramatic shift in environment, support systems, physical resources, and
personal responsibilities. This life stage can also be characterized by increased
independence and the development of personal identity (Nelson et al., 2008). The
establishment of new or continuing healthy consumption habits can be greatly influenced
by the current surroundings, peer behavior, and economic circumstance. Statistically,
once a trend of unhealthy behavior patterns and weight gain occurs in the first year, it
continues throughout the remaining undergraduate years (Nelson et al., 2008). Obesity
prevention measures targeted toward emerging adults, such as the Picture-Perfect
Portions app, may therefore have an important role in reducing the incidence rate of
overweight and obesity within this population.
Beginning with those born after 1980, another significant characteristic of this
cohort is their comfort with digital technology. These “digital natives” (Bennett, Maton,
& Kervin, 2008) are highly dependent on access to electronic devices, such as laptops or
cell phones, and they trust the world of digitized information to the point that they prefer
the Internet, over parents or health professionals, as their most frequently used source of

38
health information (The American College Health Association, 2009). This familiarity,
along with the observations that 96% of undergraduates own cell phones (Smith et al.,
2014), and 92% of undergraduates use either laptops or cell phones to connect to the
Internet wirelessly (Smith et al., 2014), suggest that digital technology can and should be
an important tool in any intervention developed for this population.
Location Selection
The Picture-Perfect Portions application was developed and deployed at Clemson
University, a public, land-grant institution located in South Carolina. The total
enrollment of Clemson is 20,768 students. 16,562, or approximately 80%, of these
students are undergraduates (Clemson University Office of Institutional Research,
2012b). The “typical” Clemson undergraduate is white (84%), male (54%), between the
ages of 18 and 24 years old (National Center For Education Statistics, 2007), and a native
of the state of South Carolina (60%) (Clemson University Office of Institutional
Research, 2012a, 2012b). With very few exceptions, all (~98%) of freshman live on-
campus; beyond freshman year, however, more than 60% of undergraduates live off-
campus (Clemson University Office of Institutional Research, 2012a, 2012b).
Clemson University is an ideal location to conduct a young adult or college
student nutritional intervention study for several reasons: 1) There is ready access to the
population of interest, 2) The university supports several high visibility longitudinal
research programs in health disparities (The EXPORT Center, 2007), nutrition education
(Cason, 2013), and health technologies (Eysenck, 1988), and 3) the university is located

39
in cultural and geographical region known as “the South” – the epicenter of the national
obesity epidemic (Finkelstein et al., 2005).
Power Analysis
Using data from Wansink (2005) and the Applied Psychophysiology Laboratory
at Clemson University (Jasper, 2014), a power analysis was performed to determine the
optimal sample size for the proposed study. The open-source software product G-Power
(Faul, Erdfelder, Buchner, & Lang, 2009; Faul, Erdfelder, Lang, & Buchner, 2007) was
used to perform the analysis. The power analysis resulted in a total sample size of 84
participants, or a minimum of ten participants per condition (Table 4.2).
Participant Recruitment
The final number of participants for whom data were collected is 141 participants.
All participants were recruited using the Clemson Psychology Research System, an
internal online participant recruiting system developed by Sona Systems, Ltd. Both male
participants and female participants were oversampled to increase the likelihood that a
sufficient number of participants were available for each experimental condition and to
control for the contribution of gender to the overall variance.
Experimental Protocol
The experimental protocol used for this study was based on a protocol developed
by the Applied Psychophysiology Laboratory at Clemson University for data collection
40
with the Bite Counter device (Jasper, 2014). Participants were run in groups of 3-4
participants per session, and each participant experienced one and only one experimental
condition. During the experiment, participants had their height, weight, and BMI
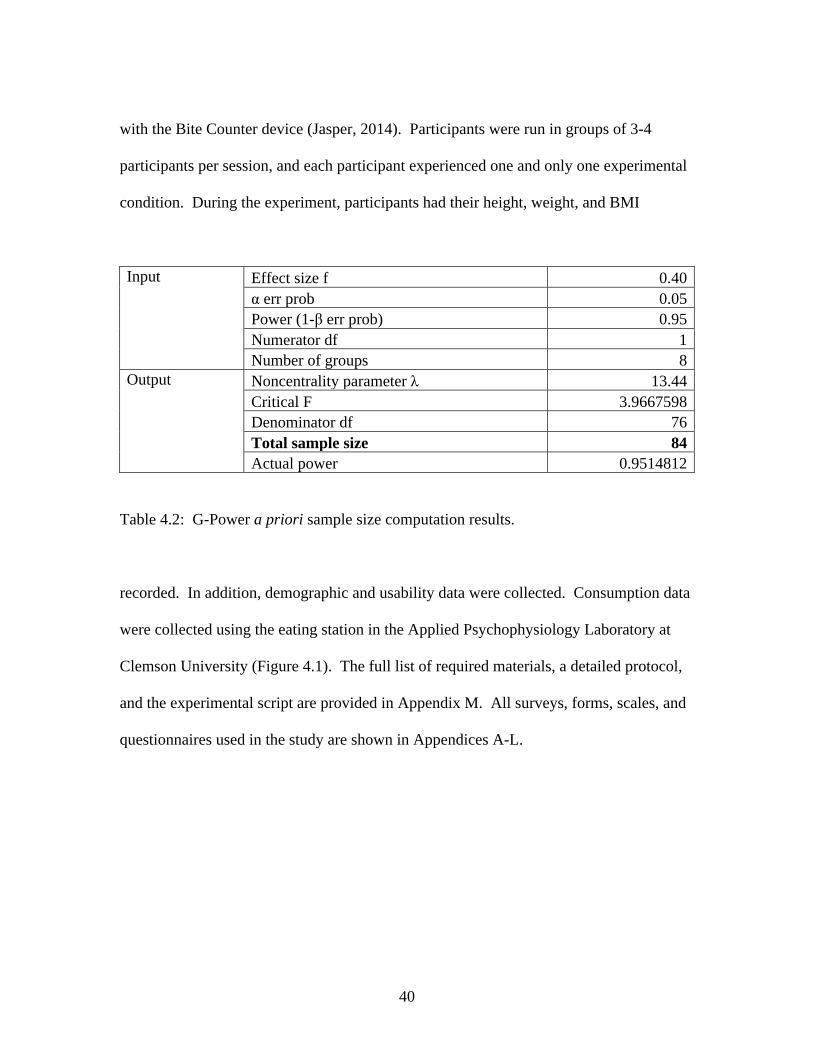
Input Effect size f 0.40 α err prob 0.05 Power (1-β err prob) 0.95 Numerator df 1 Number of groups 8
Output Noncentrality parameter λ 13.44 Critical F 3.9667598 Denominator df 76 Total sample size 84 Actual power 0.9514812
Table 4.2: G-Power a priori sample size computation results.
recorded. In addition, demographic and usability data were collected. Consumption data
were collected using the eating station in the Applied Psychophysiology Laboratory at
Clemson University (Figure 4.1). The full list of required materials, a detailed protocol,
and the experimental script are provided in Appendix M. All surveys, forms, scales, and
questionnaires used in the study are shown in Appendices A-L.
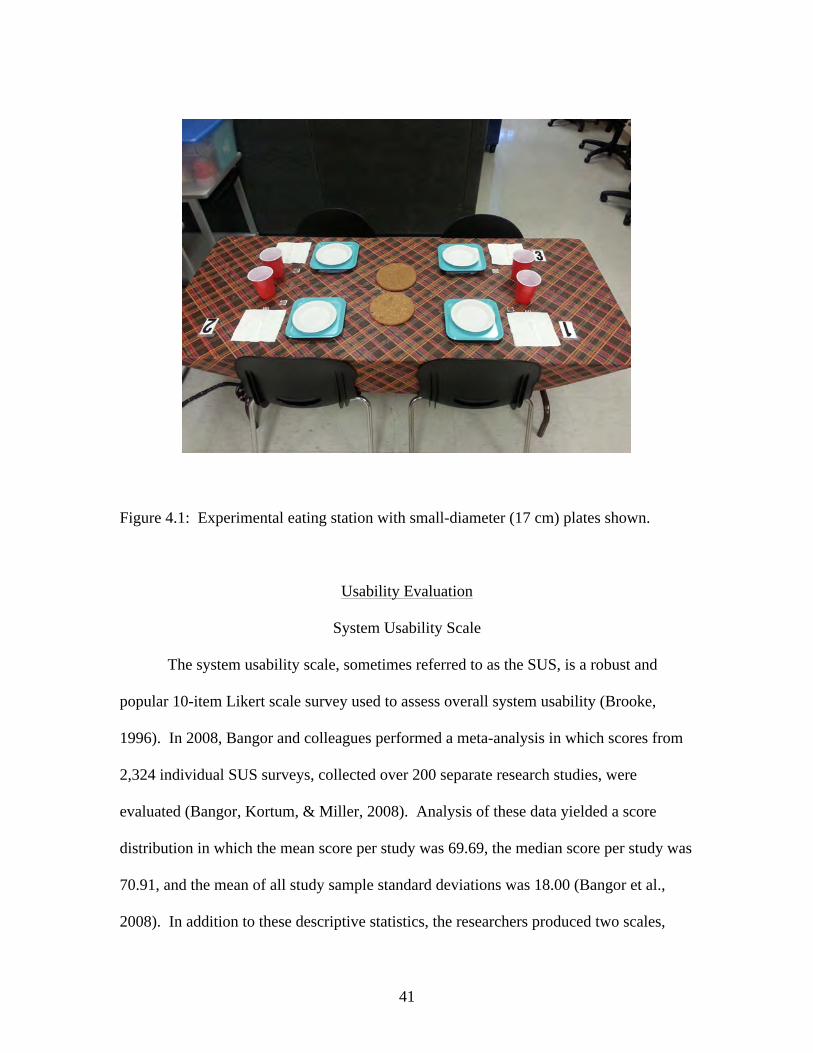
41
Figure 4.1: Experimental eating station with small-diameter (17 cm) plates shown.
Usability Evaluation
System Usability Scale
The system usability scale, sometimes referred to as the SUS, is a robust and
popular 10-item Likert scale survey used to assess overall system usability (Brooke,
1996). In 2008, Bangor and colleagues performed a meta-analysis in which scores from
2,324 individual SUS surveys, collected over 200 separate research studies, were
evaluated (Bangor, Kortum, & Miller, 2008). Analysis of these data yielded a score
distribution in which the mean score per study was 69.69, the median score per study was
70.91, and the mean of all study sample standard deviations was 18.00 (Bangor et al.,
2008). In addition to these descriptive statistics, the researchers produced two scales,
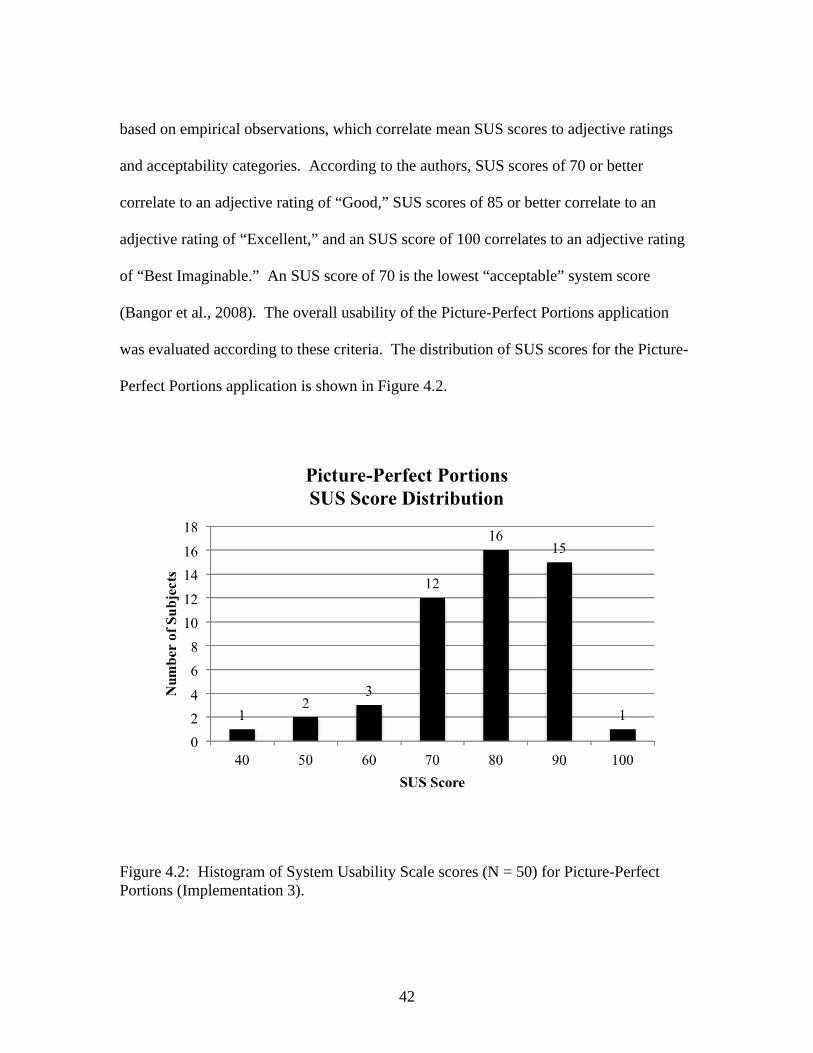
42
based on empirical observations, which correlate mean SUS scores to adjective ratings
and acceptability categories. According to the authors, SUS scores of 70 or better
correlate to an adjective rating of “Good,” SUS scores of 85 or better correlate to an
adjective rating of “Excellent,” and an SUS score of 100 correlates to an adjective rating
of “Best Imaginable.” An SUS score of 70 is the lowest “acceptable” system score
(Bangor et al., 2008). The overall usability of the Picture-Perfect Portions application
was evaluated according to these criteria. The distribution of SUS scores for the Picture-
Perfect Portions application is shown in Figure 4.2.
Figure 4.2: Histogram of System Usability Scale scores (N = 50) for Picture-Perfect Portions (Implementation 3).
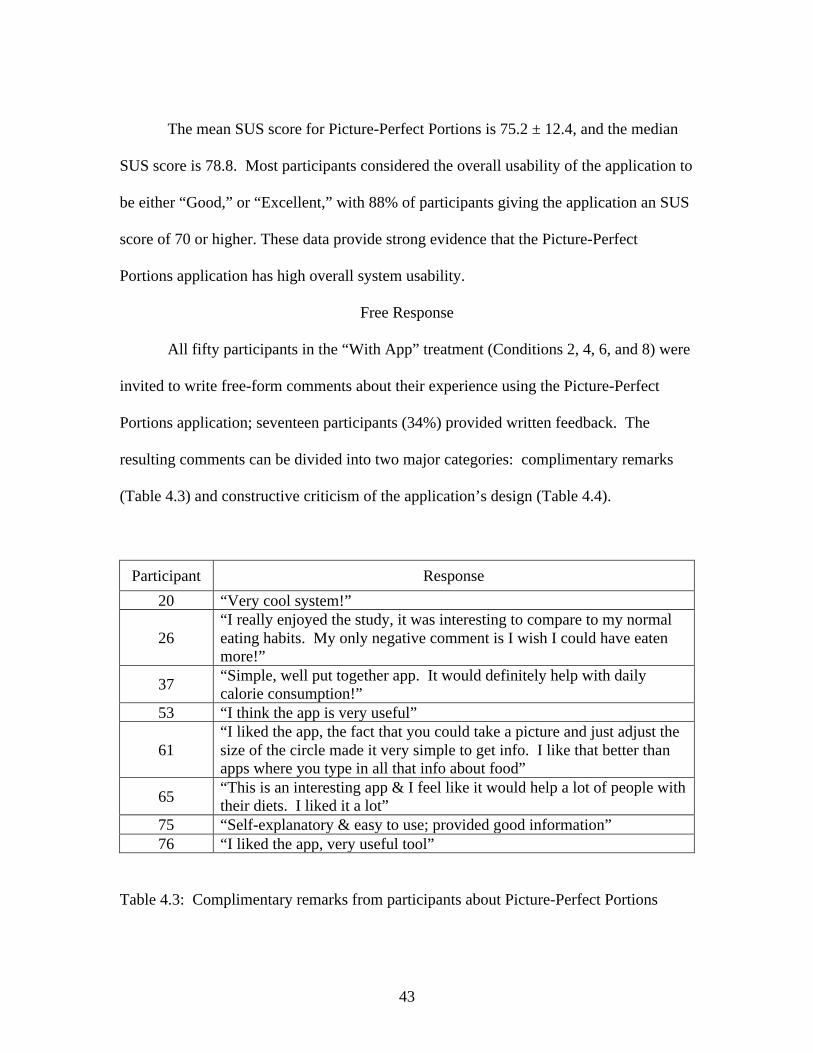
43
The mean SUS score for Picture-Perfect Portions is 75.2 ± 12.4, and the median
SUS score is 78.8. Most participants considered the overall usability of the application to
be either “Good,” or “Excellent,” with 88% of participants giving the application an SUS
score of 70 or higher. These data provide strong evidence that the Picture-Perfect
Portions application has high overall system usability.
Free Response
All fifty participants in the “With App” treatment (Conditions 2, 4, 6, and 8) were
invited to write free-form comments about their experience using the Picture-Perfect
Portions application; seventeen participants (34%) provided written feedback. The
resulting comments can be divided into two major categories: complimentary remarks
(Table 4.3) and constructive criticism of the application’s design (Table 4.4).
Participant Response 20 “Very cool system!”
26 “I really enjoyed the study, it was interesting to compare to my normal eating habits. My only negative comment is I wish I could have eaten more!”
37 “Simple, well put together app. It would definitely help with daily calorie consumption!”
53 “I think the app is very useful”
61 “I liked the app, the fact that you could take a picture and just adjust the size of the circle made it very simple to get info. I like that better than apps where you type in all that info about food”
65 “This is an interesting app & I feel like it would help a lot of people with their diets. I liked it a lot”
75 “Self-explanatory & easy to use; provided good information” 76 “I liked the app, very useful tool”
Table 4.3: Complimentary remarks from participants about Picture-Perfect Portions

44
Participant Response
18 “It was hard to draw a circle completely around the food I had since it wasn’t a perfect circle.”
19 “It may be hard in a normal public environment to do that.” 25 “The only difficulty in using the system was drawing the circles."
27 “You should have made an adjustment tool to increase or decrease the circle after you’ve drawn it. It would’ve made me feel more confident in portion size if I could fit everything in.”
38 “Circling the food may not be accurate since you don’t know how big the serving of food is in height.”
39 “A cross drawn over the quarter would be better than estimating where the circle will line up”
64 “Fairly easy to use, but I am unsure how practical it would be in public settings”
66 “The only problem with the app is that it only looks at a flat surface and compares that to the reference size. Doesn’t take into effect the height of the food.”
67 “App was cool, needs to measure height of food pile not just width”
Table 4.4: Constructive criticism from participants about Picture-Perfect Portions
Study of Application Effectiveness in Supporting Decision Making
Overall Descriptive Statistics
The overall sample of 141 participants was 50.3% female and 49.6% male. The
average age of the sample was 19 ± 1 years, and the range of ages was 17-29. The
average BMI for the sample was 23.5 ± 4.5 kg/m2. The number of participants by
condition is shown in Table 4.5.

45
Condition N Percent Missing 1 SP, Without App, Without Goal 31 100.00% 0 2 SP, With App, Without Goal 12 100.00% 0 3 SP, Without App, With Goal 11 100.00% 0 4 SP, With App, With Goal 13 92.90% 1 5 LP, Without App, Without Goal 39 100.00% 0 6 LP, With App, Without Goal 12 100.00% 0 7 LP, Without App, With Goal 11 100.00% 0 8 LP, With App, With Goal 11 100.00% 0
Table 4.5: Number of participants by experimental condition
Hypothesis Testing
Before running the ANOVA procedure on each subpopulation of interest, the data
were checked for extreme outliers. Both the number of grams consumed after the first
serving, grams consumed (first serving), and the number of grams consumed after all
servings, grams consumed (all servings), were used as dependent variables. Six outliers
were detected for grams consumed (first serving) (Figure 4.3), and seven outliers,
including one extreme outlier, were detected for grams consumed (all servings) (Figure
4.4). The ANOVA results for both dependent variables revealed statistically significant
evidence that the error variance was not equal across groups. Based on Levene’s Test of
equality of error variances, the null hypothesis was rejected for grams consumed (first
serving) (F(7, 133) = 2.898, p = 0.008), and the null hypothesis was rejected for grams
consumed (all servings) (F(7, 132) = 2.684, p = 0.012). The data for both dependent
variables were log-transformed to correct for the differences in error variance across

46
conditions. The Levene’s Test null hypothesis was not rejected for ln(grams consumed,
first serving) (F(7, 133) = 1.636, p = 0.131), and the Levene’s Test null hypothesis was
not rejected for ln(grams consumed, all servings) (F(7, 132) = 1.591, p = 0.144).
Figure 4.3: Box plots for grams consumed (first serving) by experimental condition
Log-transformed data were used when performing all subsequent ANOVA procedures.
The results were then inverse transformed to recover the original unit, grams. To
promote interpretation of these results, the measured unit, grams, was converted to the

47
derived unit, Calories, by the linear conversion factor of 330 Calories per 225 grams.
This conversion factor is based on the reported nutritional information for Stouffer’s
Party Size (76 oz.) Macaroni and Cheese. The reported serving size of this food item is 1
cup. This amount of food is equivalent to 225 grams and approximately 330 Calories.
Results beyond the first ANOVA procedure are reported in both Calories and grams.
Figure 4.4: Box plots for grams consumed (all servings) by experimental condition
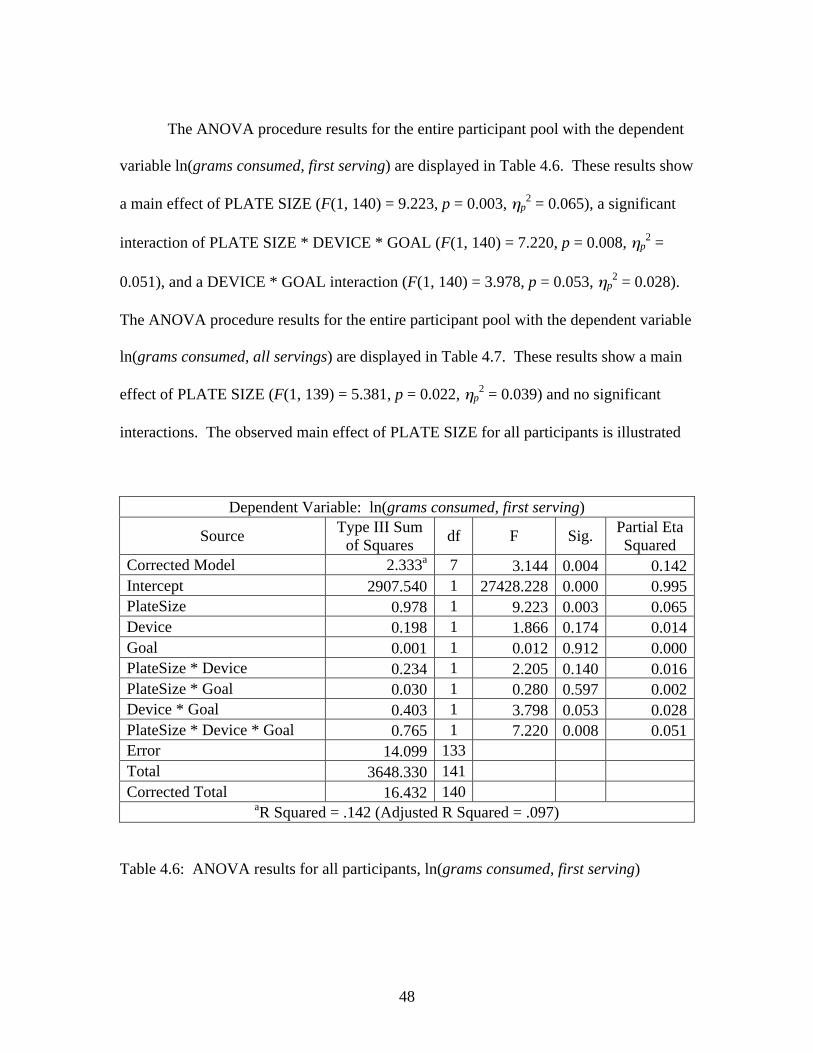
48
The ANOVA procedure results for the entire participant pool with the dependent
variable ln(grams consumed, first serving) are displayed in Table 4.6. These results show
a main effect of PLATE SIZE (F(1, 140) = 9.223, p = 0.003, ηp2 = 0.065), a significant
interaction of PLATE SIZE * DEVICE * GOAL (F(1, 140) = 7.220, p = 0.008, ηp2 =
0.051), and a DEVICE * GOAL interaction (F(1, 140) = 3.978, p = 0.053, ηp2 = 0.028).
The ANOVA procedure results for the entire participant pool with the dependent variable
ln(grams consumed, all servings) are displayed in Table 4.7. These results show a main
effect of PLATE SIZE (F(1, 139) = 5.381, p = 0.022, ηp2 = 0.039) and no significant
interactions. The observed main effect of PLATE SIZE for all participants is illustrated
Dependent Variable: ln(grams consumed, first serving)
Source Type III Sum of Squares df F Sig. Partial Eta
Squared Corrected Model 2.333a 7 3.144 0.004 0.142 Intercept 2907.540 1 27428.228 0.000 0.995 PlateSize 0.978 1 9.223 0.003 0.065 Device 0.198 1 1.866 0.174 0.014 Goal 0.001 1 0.012 0.912 0.000 PlateSize * Device 0.234 1 2.205 0.140 0.016 PlateSize * Goal 0.030 1 0.280 0.597 0.002 Device * Goal 0.403 1 3.798 0.053 0.028 PlateSize * Device * Goal 0.765 1 7.220 0.008 0.051 Error 14.099 133 Total 3648.330 141 Corrected Total 16.432 140 aR Squared = .142 (Adjusted R Squared = .097)
Table 4.6: ANOVA results for all participants, ln(grams consumed, first serving)

49
Dependent Variable: ln(grams consumed, all servings)
Source Type III Sum of Squares df F Sig. Partial Eta
Squared Corrected Model 1.922a 7 1.555 0.154 0.076 Intercept 2994.558 1 16967.929 0.000 0.992 PlateSize 0.950 1 5.381 0.022 0.039 Device 0.232 1 1.314 0.254 0.010 Goal 0.005 1 0.028 0.868 0.000 PlateSize * Device 0.372 1 2.106 0.149 0.016 PlateSize * Goal 0.002 1 0.010 0.919 0.000 Device * Goal 0.005 1 0.031 0.861 0.000 PlateSize * Device * Goal 0.505 1 2.861 0.093 0.021 Error 23.296 132 Total 3808.946 140 Corrected Total 25.217 139 aR Squared = .076 (Adjusted R Squared = .027)
Table 4.7: ANOVA results for all participants, ln(grams consumed, all servings)
in Figure 4.5 for grams consumed (first serving), Figure 4.6 for Calories consumed (first
serving), Figure 4.7 for grams consumed (all servings), and Figure 4.8 for Calories
consumed (all servings). The difference in mean grams consumed for the first serving is
approximately 15 grams (i.e., 22 Cal), and the difference in mean grams consumed for all
servings is approximately 18 grams (i.e., 26 Cal). These results provide direct support for
Hypothesis 1, which predicts that a main effect of PLATE SIZE will be observed.
Furthermore, these results provide indirect support for Hypotheses 4 and 5, which predict
that neither the presence of the Picture-Perfect Portions app (DEVICE) nor the presence
of a 400-Calorie consumption goal (GOAL) will overcome the effect of PLATE SIZE.

50
Figure 4.5: Mean grams consumed (first serving) for all participants by Plate Size. Mean ± S.E. shown.
Figure 4.6: Mean Calories consumed (first serving) for all participants by Plate Size. Mean ± S.E. shown.

51
Figure 4.7: Mean grams consumed (all servings) for all participants by Plate Size. Mean ± S.E. shown.
Figure 4.8: Mean Calories consumed (all servings) for all participants by Plate Size. Mean ± S.E. shown.

52
When considering only the subset of the participant pool that experienced the
“With App” treatment (Conditions 2, 4, 6, and 8), a main effect of PLATE SIZE (F(1,
45) = 10.937, p = 0.002, ηp2 = 0.196) is observed for the dependent variable ln(grams
consumed, first serving). The main effect of PLATE SIZE for participants under the
“With App” treatment is illustrated in Figure 4.9 for grams consumed (first serving) and
Figure 4.10 for Calories consumed (first serving). This result provides direct support for
Hypothesis 1, which predicts that a main effect of PLATE SIZE will be observed.
Furthermore, this result provides partial support for Hypothesis 4, which predicts that the
presence of the Picture-Perfect Portions app (DEVICE) will reduce, but not overcome,
the effect of PLATE SIZE. A main effect of PLATE SIZE is also observed for the
dependent variable ln(grams consumed, all servings) (F(1, 44) = 8.203, p = 0.006, ηp2 =
0.157) for the same subpopulation. The main effect of PLATE SIZE is illustrated in
Figure 4.11 for grams consumed (all servings), and Figure 4.12 for Calories consumed
(all servings). This result provides direct support for Hypothesis 1, which predicts that a
main effect of PLATE SIZE will be observed. Furthermore, this result provides partial
support for Hypothesis 4, which predicts that the presence of the Picture-Perfect Portions
app (DEVICE) will reduce, but not overcome, the effect of PLATE SIZE.
When considering only the subset of the participant pool that experienced the
“With Goal” treatment (Conditions 3, 4, 7, and 8), a main effect of PLATE SIZE (F(1,
45) = 7.289, p = 0.010, ηp2 = 0.145) is observed for the dependent variable ln(grams
consumed, first serving). The main effect of PLATE SIZE for participants under the

53
Figure 4.9: Mean grams consumed (first serving) for “With App” treatment by Plate Size. Mean ± S.E. shown.
Figure 4.10: Mean Calories consumed (first serving) for “With App” treatment by Plate Size. Mean ± S.E. shown.

54
Figure 4.11: Mean grams consumed (all servings) for “With App” treatment by Plate Size. Mean ± S.E. shown.
Figure 4.12: Mean Calories consumed (all servings) for “With App” treatment by Plate Size. Mean ± S.E. shown.
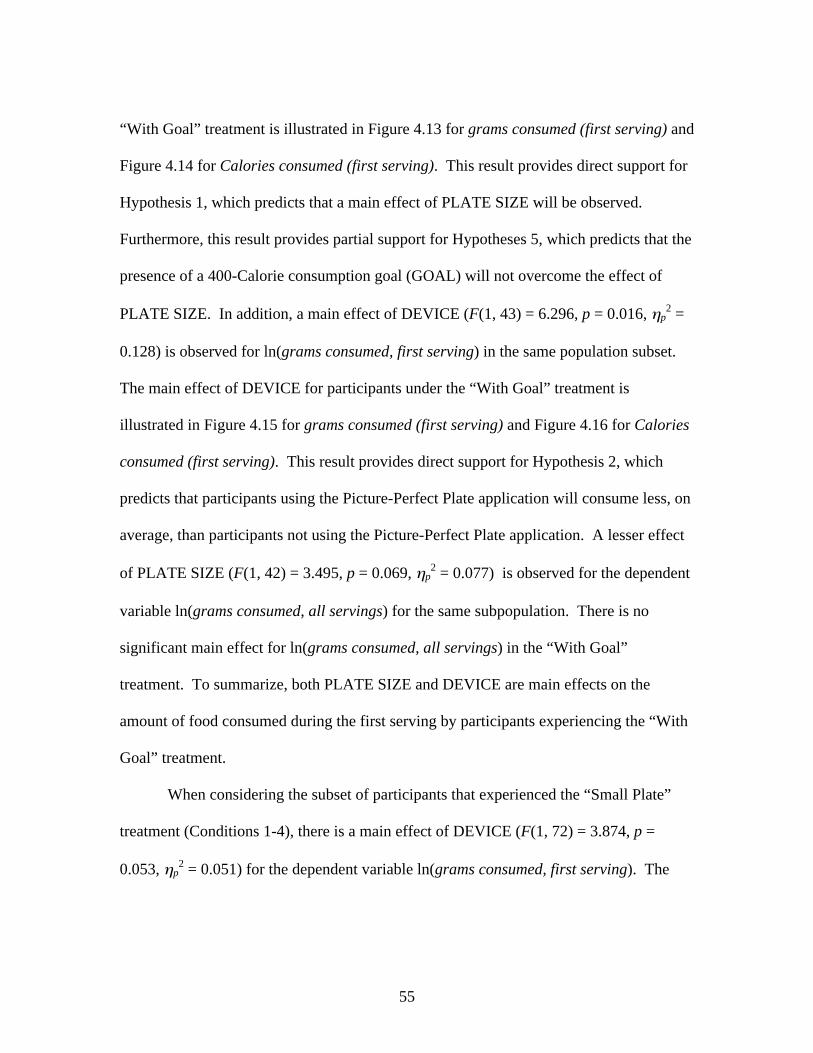
55
“With Goal” treatment is illustrated in Figure 4.13 for grams consumed (first serving) and
Figure 4.14 for Calories consumed (first serving). This result provides direct support for
Hypothesis 1, which predicts that a main effect of PLATE SIZE will be observed.
Furthermore, this result provides partial support for Hypotheses 5, which predicts that the
presence of a 400-Calorie consumption goal (GOAL) will not overcome the effect of
PLATE SIZE. In addition, a main effect of DEVICE (F(1, 43) = 6.296, p = 0.016, ηp2 =
0.128) is observed for ln(grams consumed, first serving) in the same population subset.
The main effect of DEVICE for participants under the “With Goal” treatment is
illustrated in Figure 4.15 for grams consumed (first serving) and Figure 4.16 for Calories
consumed (first serving). This result provides direct support for Hypothesis 2, which
predicts that participants using the Picture-Perfect Plate application will consume less, on
average, than participants not using the Picture-Perfect Plate application. A lesser effect
of PLATE SIZE (F(1, 42) = 3.495, p = 0.069, ηp2 = 0.077) is observed for the dependent
variable ln(grams consumed, all servings) for the same subpopulation. There is no
significant main effect for ln(grams consumed, all servings) in the “With Goal”
treatment. To summarize, both PLATE SIZE and DEVICE are main effects on the
amount of food consumed during the first serving by participants experiencing the “With
Goal” treatment.
When considering the subset of participants that experienced the “Small Plate”
treatment (Conditions 1-4), there is a main effect of DEVICE (F(1, 72) = 3.874, p =
0.053, ηp2 = 0.051) for the dependent variable ln(grams consumed, first serving). The

56
Figure 4.13: Mean grams consumed (first serving) for “With Goal” treatment by Plate Size. Mean ± S.E. shown.
Figure 4.14: Mean Calories consumed (first serving) for “With Goal” treatment by Plate Size. Mean ± S.E. shown.
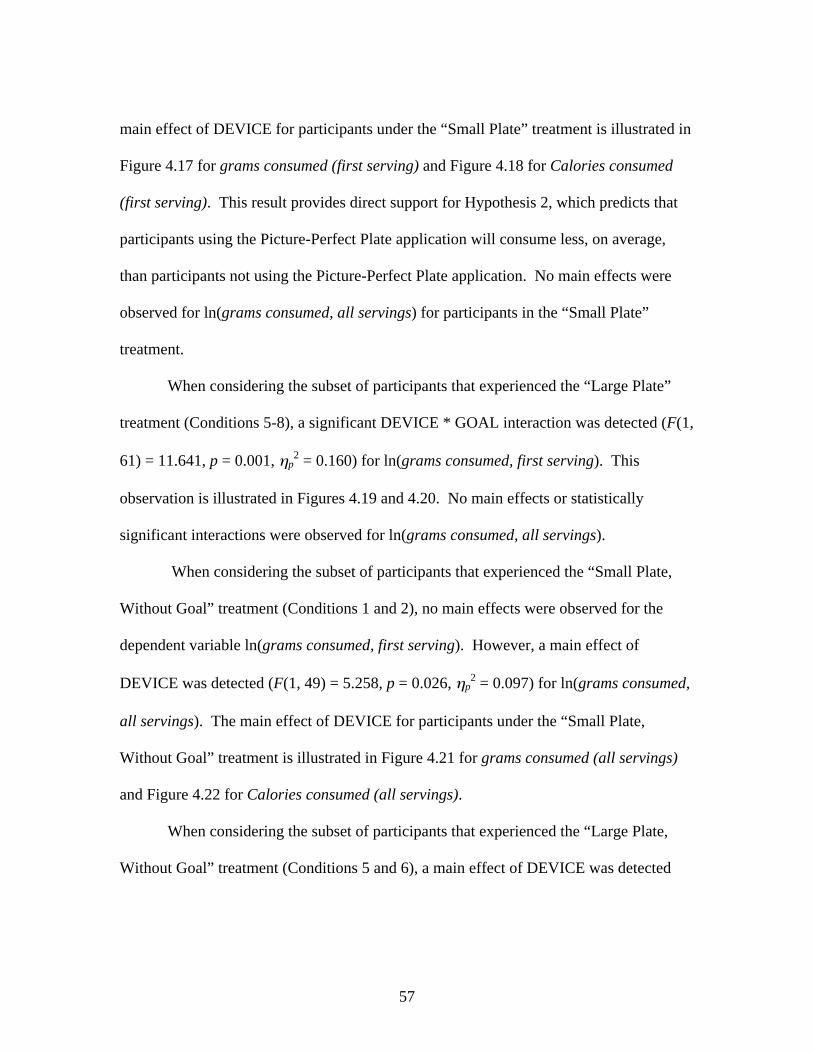
57
main effect of DEVICE for participants under the “Small Plate” treatment is illustrated in
Figure 4.17 for grams consumed (first serving) and Figure 4.18 for Calories consumed
(first serving). This result provides direct support for Hypothesis 2, which predicts that
participants using the Picture-Perfect Plate application will consume less, on average,
than participants not using the Picture-Perfect Plate application. No main effects were
observed for ln(grams consumed, all servings) for participants in the “Small Plate”
treatment.
When considering the subset of participants that experienced the “Large Plate”
treatment (Conditions 5-8), a significant DEVICE * GOAL interaction was detected (F(1,
61) = 11.641, p = 0.001, ηp2 = 0.160) for ln(grams consumed, first serving). This
observation is illustrated in Figures 4.19 and 4.20. No main effects or statistically
significant interactions were observed for ln(grams consumed, all servings).
When considering the subset of participants that experienced the “Small Plate,
Without Goal” treatment (Conditions 1 and 2), no main effects were observed for the
dependent variable ln(grams consumed, first serving). However, a main effect of
DEVICE was detected (F(1, 49) = 5.258, p = 0.026, ηp2 = 0.097) for ln(grams consumed,
all servings). The main effect of DEVICE for participants under the “Small Plate,
Without Goal” treatment is illustrated in Figure 4.21 for grams consumed (all servings)
and Figure 4.22 for Calories consumed (all servings).
When considering the subset of participants that experienced the “Large Plate,
Without Goal” treatment (Conditions 5 and 6), a main effect of DEVICE was detected
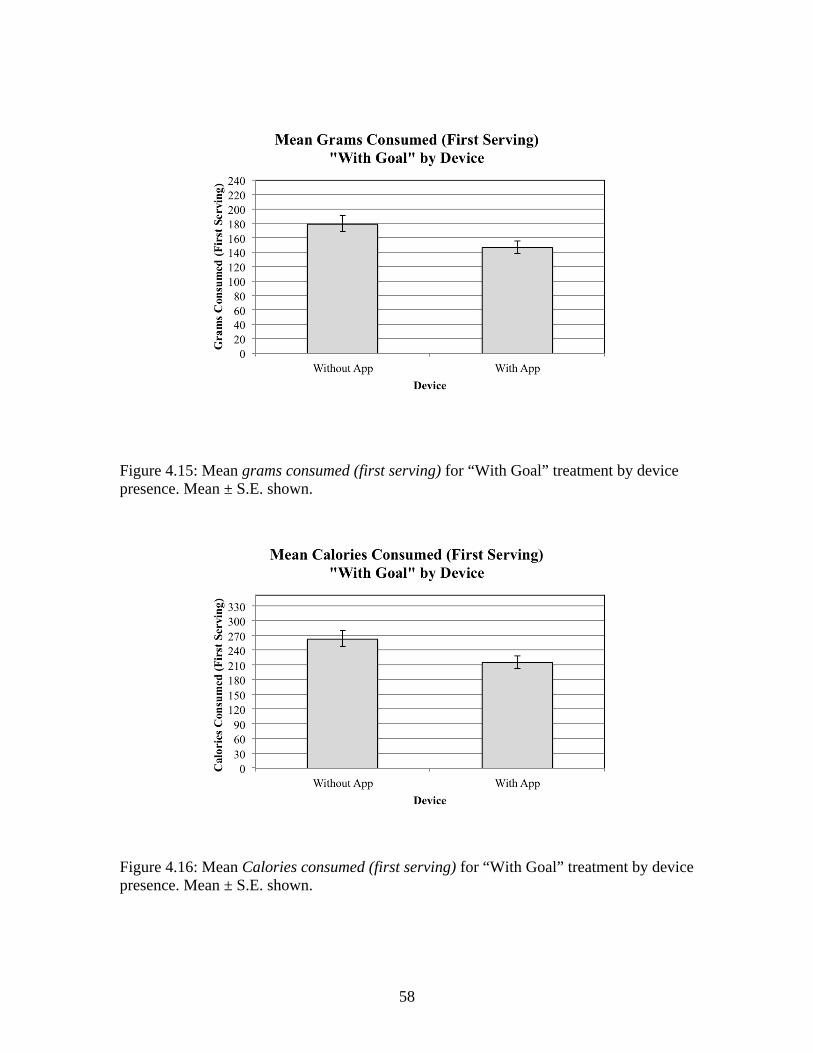
58
Figure 4.15: Mean grams consumed (first serving) for “With Goal” treatment by device presence. Mean ± S.E. shown.
Figure 4.16: Mean Calories consumed (first serving) for “With Goal” treatment by device presence. Mean ± S.E. shown.

59
(F(1, 41) = 7.817, p = 0.008, ηp2 = 0.160) for ln(grams consumed, first serving). The
main effect of DEVICE for participants under the “Large Plate, Without Goal” treatment
is illustrated in Figure 4.23 for grams consumed (first serving) and Figure 4.24 for
Calories consumed (first serving). No main effects or statistically significant interactions
were observed for ln(grams consumed, all servings).
When considering the subset of participants that experienced the “Small Plate,
With Goal” treatment (Conditions 3 and 4), no main effects were observed for either
ln(grams consumed, first serving) or ln(grams consumed, all servings).
When considering the subset of participants that experienced the “Large Plate,
With Goal” treatment (Conditions 7 and 8), a main effect of DEVICE was detected (F(1,
21) = 4.591, p = 0.045, ηp2 = 0.187) for ln(grams consumed, first serving). The main
effect of DEVICE for participants under the “Large Plate, With Goal” treatment is
illustrated in Figure 4.25 for grams consumed (first serving) and Figure 4.26 for Calories
consumed (first serving). This result provides direct support for Hypothesis 2, which
predicts that participants using the Picture-Perfect Plate application will consume less, on
average, than participants not using the Picture-Perfect Plate application. No main effects
or statistically significant interactions were observed for ln(grams consumed, all
servings) under this condition.
When considering the subset of participants that experienced the “With App,
Without Goal” treatment (Conditions 2 and 6), a main effect of PLATE SIZE was
detected (F(1, 23) = 11.742, p = 0.002) for ln(grams consumed, first serving), and a main
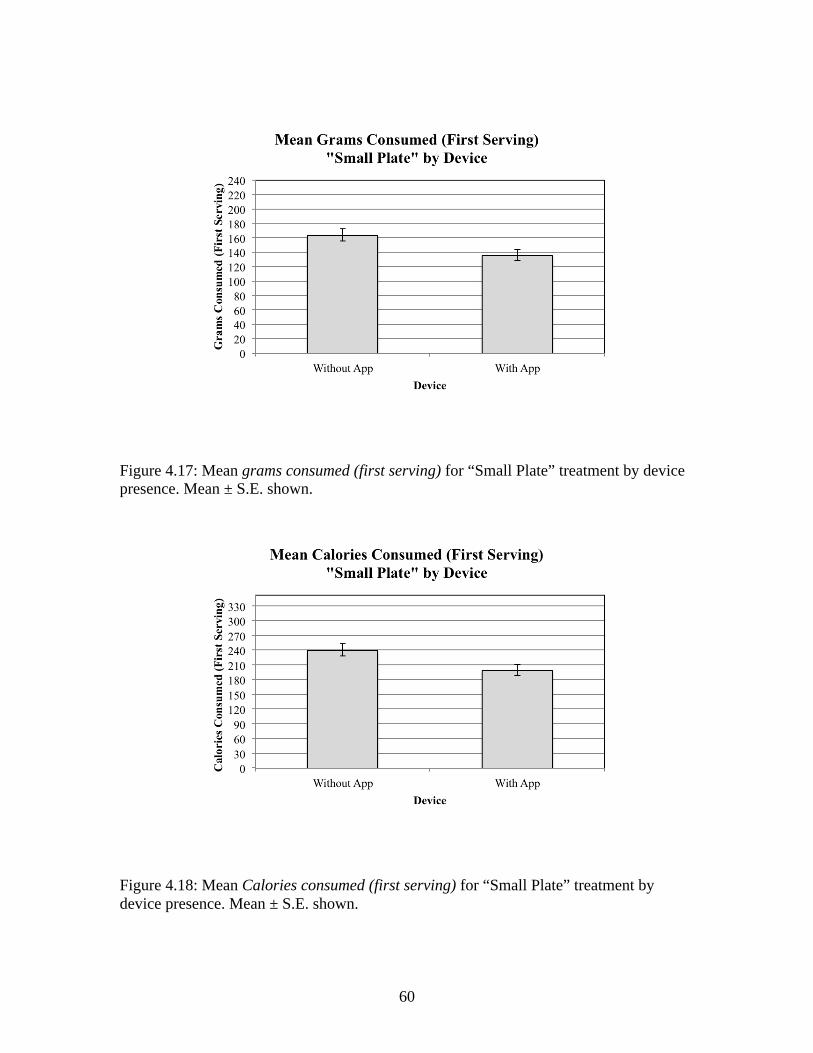
60
Figure 4.17: Mean grams consumed (first serving) for “Small Plate” treatment by device presence. Mean ± S.E. shown.
Figure 4.18: Mean Calories consumed (first serving) for “Small Plate” treatment by device presence. Mean ± S.E. shown.

61
Figure 4.19: Mean ln(grams consumed, first serving) for “Large Plate” treatment by device.
Figure 4.20: Mean ln(grams consumed, first serving) for “Large Plate” treatment by goal.

62
Figure 4.21: Mean grams consumed (all servings) for “Small Plate, Without Goal” treatment by device presence. Mean ± S.E. shown.
Figure 4.22: Mean Calories consumed (all servings) for “Small Plate, Without Goal” treatment by device presence. Mean ± S.E. shown.
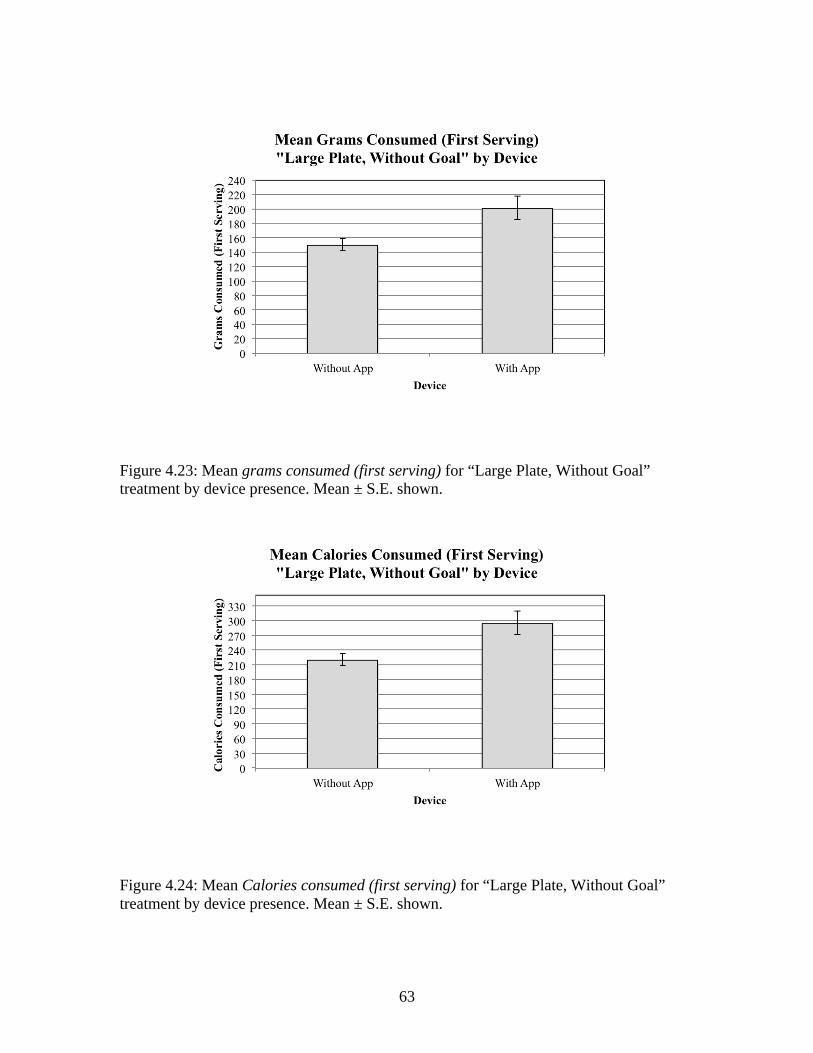
63
Figure 4.23: Mean grams consumed (first serving) for “Large Plate, Without Goal” treatment by device presence. Mean ± S.E. shown.
Figure 4.24: Mean Calories consumed (first serving) for “Large Plate, Without Goal” treatment by device presence. Mean ± S.E. shown.

64
Figure 4.25: Mean grams consumed (first serving) for “Large Plate, With Goal” treatment by device presence. Mean ± S.E. shown.
Figure 4.26: Mean Calories consumed (first serving) for “Large Plate, With Goal” treatment by device presence. Mean ± S.E. shown.
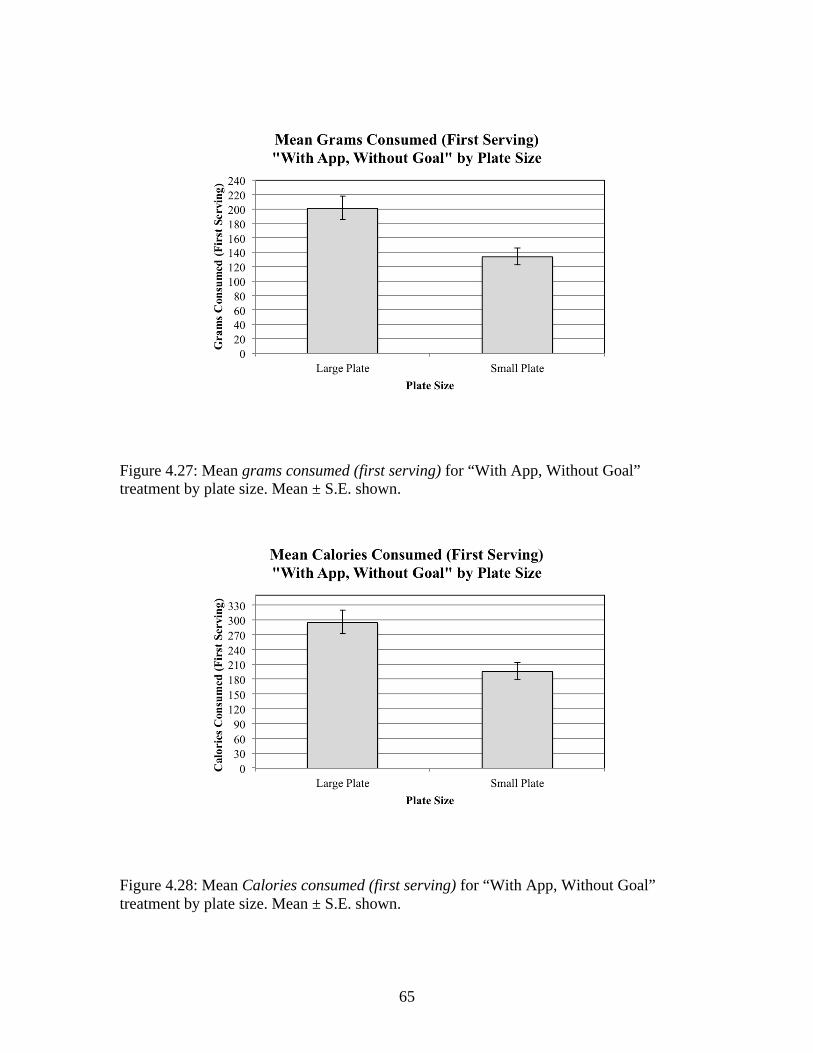
65
Figure 4.27: Mean grams consumed (first serving) for “With App, Without Goal” treatment by plate size. Mean ± S.E. shown.
Figure 4.28: Mean Calories consumed (first serving) for “With App, Without Goal” treatment by plate size. Mean ± S.E. shown.

66
Figure 4.29: Mean grams consumed (all servings) for “With App, Without Goal” treatment by plate size. Mean ± S.E. shown.
Figure 4.30: Mean Calories consumed (all servings) for “With App, Without Goal” treatment by plate size. Mean ± S.E. shown.
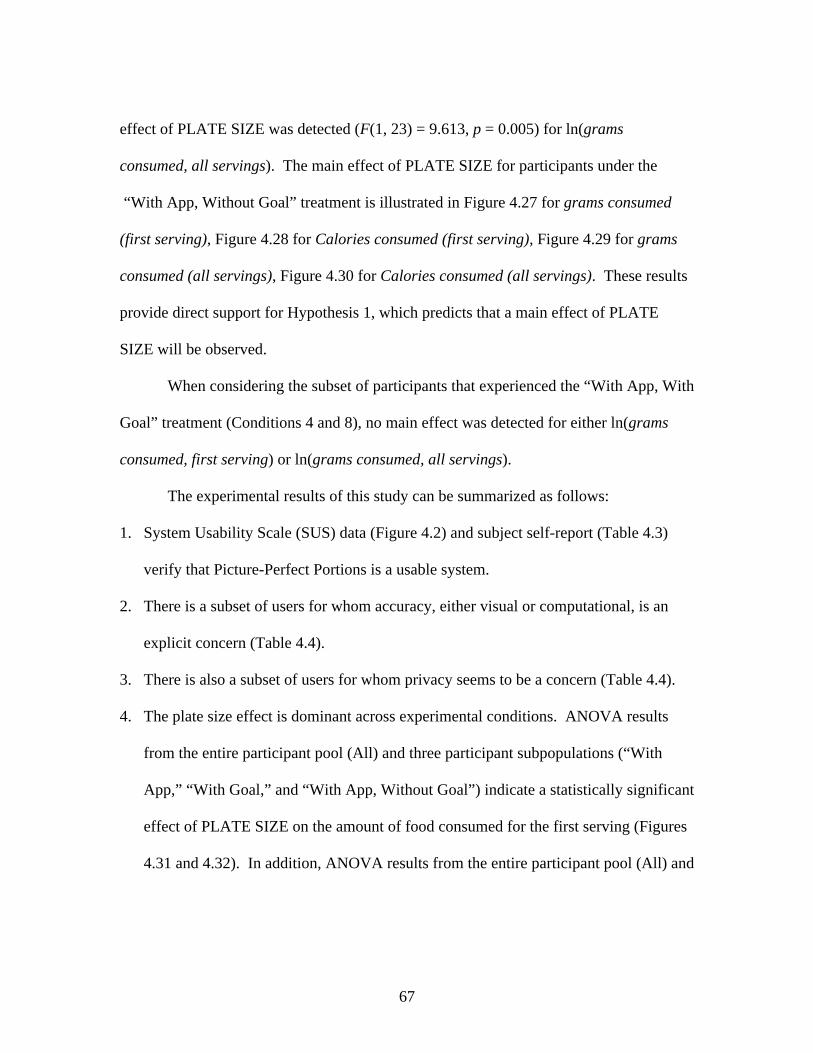
67
effect of PLATE SIZE was detected (F(1, 23) = 9.613, p = 0.005) for ln(grams
consumed, all servings). The main effect of PLATE SIZE for participants under the
“With App, Without Goal” treatment is illustrated in Figure 4.27 for grams consumed
(first serving), Figure 4.28 for Calories consumed (first serving), Figure 4.29 for grams
consumed (all servings), Figure 4.30 for Calories consumed (all servings). These results
provide direct support for Hypothesis 1, which predicts that a main effect of PLATE
SIZE will be observed.
When considering the subset of participants that experienced the “With App, With
Goal” treatment (Conditions 4 and 8), no main effect was detected for either ln(grams
consumed, first serving) or ln(grams consumed, all servings).
The experimental results of this study can be summarized as follows:
1. System Usability Scale (SUS) data (Figure 4.2) and subject self-report (Table 4.3)
verify that Picture-Perfect Portions is a usable system.
2. There is a subset of users for whom accuracy, either visual or computational, is an
explicit concern (Table 4.4).
3. There is also a subset of users for whom privacy seems to be a concern (Table 4.4).
4. The plate size effect is dominant across experimental conditions. ANOVA results
from the entire participant pool (All) and three participant subpopulations (“With
App,” “With Goal,” and “With App, Without Goal”) indicate a statistically significant
effect of PLATE SIZE on the amount of food consumed for the first serving (Figures
4.31 and 4.32). In addition, ANOVA results from the entire participant pool (All) and
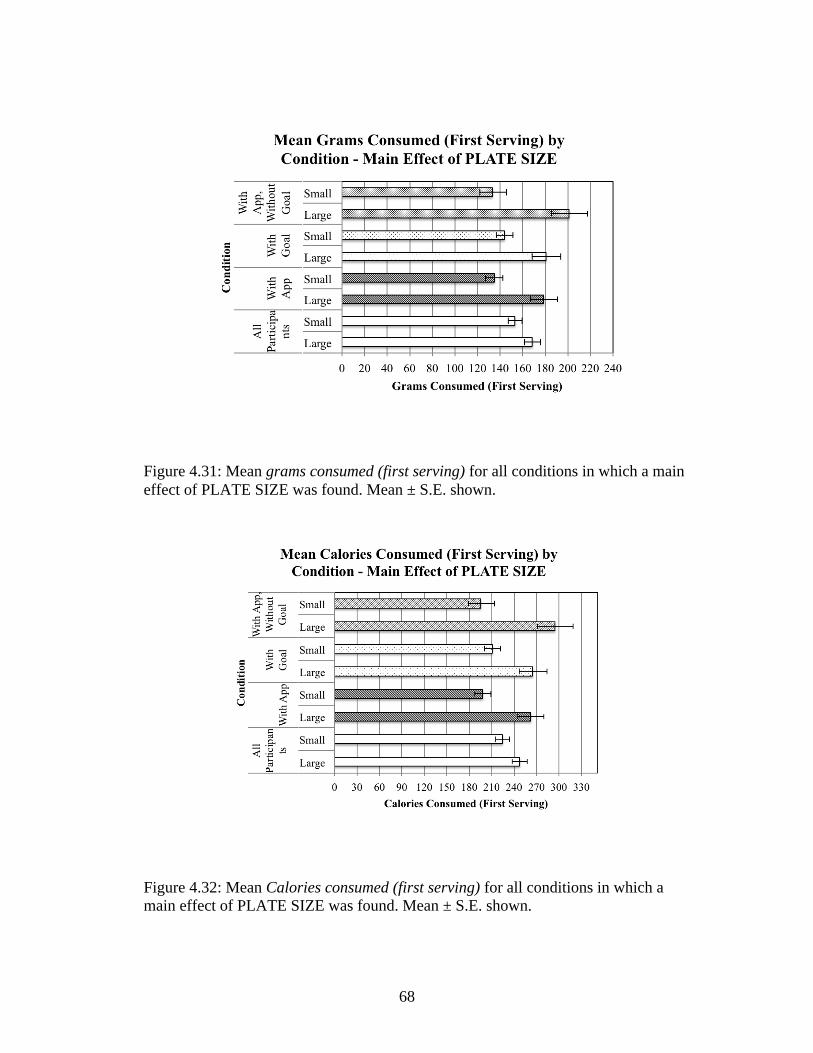
68
Figure 4.31: Mean grams consumed (first serving) for all conditions in which a main effect of PLATE SIZE was found. Mean ± S.E. shown.
Figure 4.32: Mean Calories consumed (first serving) for all conditions in which a main effect of PLATE SIZE was found. Mean ± S.E. shown.

69
two participant subpopulations (“With App” and “With App, Without Goal”) indicate
a statistically significant effect of PLATE SIZE on the amount of food consumed for
all servings (Figures 4.33 and 4.34).
5. There are some conditions for which a significant effect of DEVICE is observed.
ANOVA results from four participant subpopulations (“With Goal,” “Small Plate,”
“Large Plate, Without Goal,” and “Large Plate, With Goal”) indicate a statistically
significant effect of PLATE SIZE on the amount of food consumed for the first
serving (Figures 4.35 and 4.36). In addition, ANOVA results from one participant
subpopulation (“Small Plate, Without Goal”) indicate a statistically significant effect
of PLATE SIZE on the amount of food consumed for all servings (Figures 4.21 and
4.22).
6. There is one condition, “Large Plate, Without Goal,” that shows a significant effect of
DEVICE such that the mean ln(grams consumed, first serving) for participants using
the app is greater than the mean ln(grams consumed, first serving) for participants not
using the app (Figures 4.23 and 4.24).
7. Significant PLATE SIZE * DEVICE * GOAL and DEVICE * GOAL interactions are
observed across conditions for the dependent variable ln(grams consumed, first
serving) (Table 4.6).
8. A significant DEVICE * GOAL interaction is also observed for participants under the
“Large Plate” treatment (Figures 4.19 and 4.20).
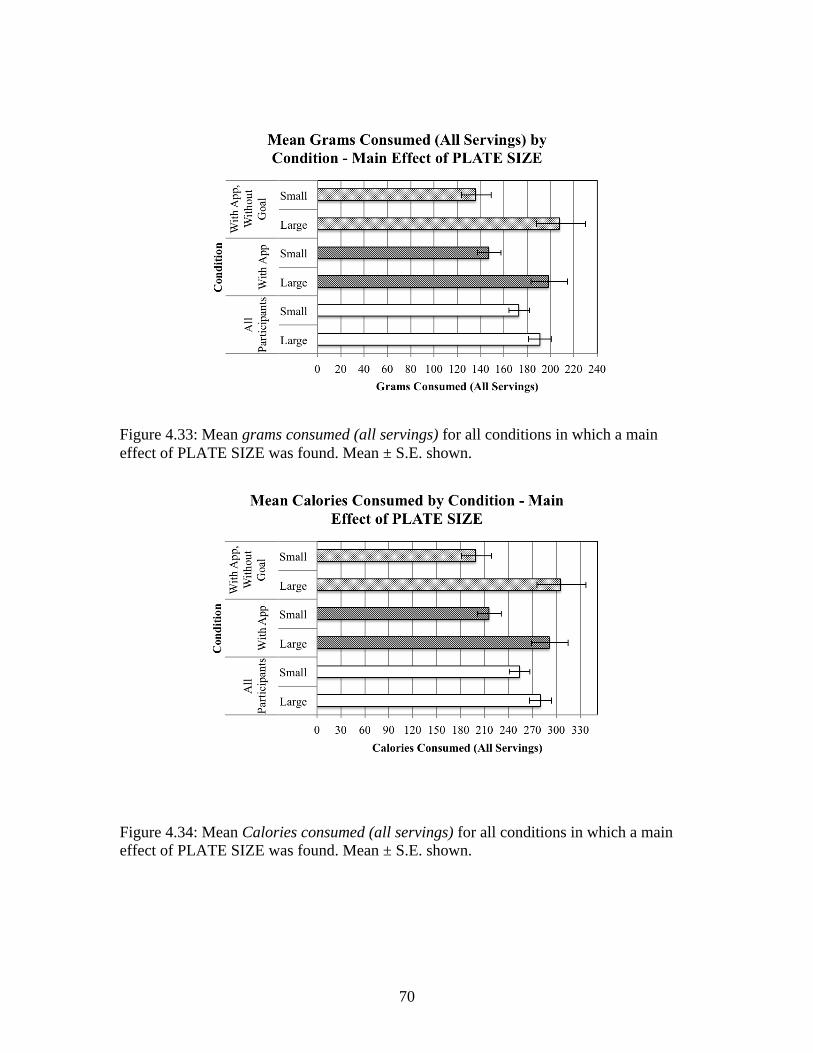
70
Figure 4.33: Mean grams consumed (all servings) for all conditions in which a main effect of PLATE SIZE was found. Mean ± S.E. shown.
Figure 4.34: Mean Calories consumed (all servings) for all conditions in which a main effect of PLATE SIZE was found. Mean ± S.E. shown.

71
Figure 4.35: Mean grams consumed (first serving) for all conditions in which a main effect of DEVICE was found. Mean ± S.E. shown.
Figure 4.36: Bar chart of all conditions for which a main effect of DEVICE was found for the dependent variable Calories consumed (first serving). Mean ± S.E. shown.

72
9. Hypothesis 1, which predicts that a main effect of PLATE SIZE will be observed
such that participants eating from a larger plate will consume more than participants
eating from a smaller plate, is supported across multiple conditions. This effect is
observed both for the dependent variable grams consumed (first serving) and for the
dependent variable grams consumed (all servings).
10. Hypothesis 2, which predicts that a main effect DEVICE will be observed such that
participants using the Picture-Perfect Portions application will consume less than
participants not using the Picture-Perfect Portions application is supported across
multiple conditions. This effect is primarily observed when the dependent variable is
grams consumed (first serving).
11. Hypothesis 3, which predicts that a main effect of GOAL will be observed, is not
supported.
12. Hypothesis 4, which predicts that a PLATE SIZE * DEVICE interaction will be
observed, is not supported.
13. Hypothesis 5, which predicts that a PLATE SIZE * GOAL interaction will be
observed, is not supported.
73
CHAPTER FIVE
DISCUSSION
Discussion of Experimental Results
The result of the study described in Chapter 4 demonstrate that while plate size is
an extremely powerful influence on overall food consumption, “just-in-time” feedback
can still be an effective short-term intervention. We observed that Picture-Perfect
Portions has its greatest impact on intake for participants’ first serving. It is likely that
this observation is a function of the experimental design, as participants were only asked
to use the app for the first serving. We hypothesize that if participants were solicited to
use the app before each serving, a more widespread effect of the app on the total amount
of food consumed would have been observed.
The results also show that Picture-Perfect Portions is more effective for
individuals with a food consumption goal (Figures 4.37 and 4.38) than those without a
food consumption goal (Figures 4.39 and 4.40). This observation suggests that, in
practice, the target users of the application would be those individuals who are
specifically seeking to gain, lose, or maintain weight. Thus, it is reasonable to
hypothesize that Picture-Perfect Portions or similar applications may be effective in
helping to curb overeating for young adults who want to maintain a healthy weight.
Finally, the results provide strong evidence that accuracy of portion size
measurement is not required to affect eating behaviors in real-time. This is an important
finding because much of the previous work in this domain has been focused on

74
Figure 4.37: Mean grams consumed (first serving) for the “With Goal” treatment by plate size and device presence. Mean ± S.E. shown.
Figure 4.38: Mean grams consumed (first serving) for the “With Goal” treatment by plate size and device presence. Mean ± S.E. shown.
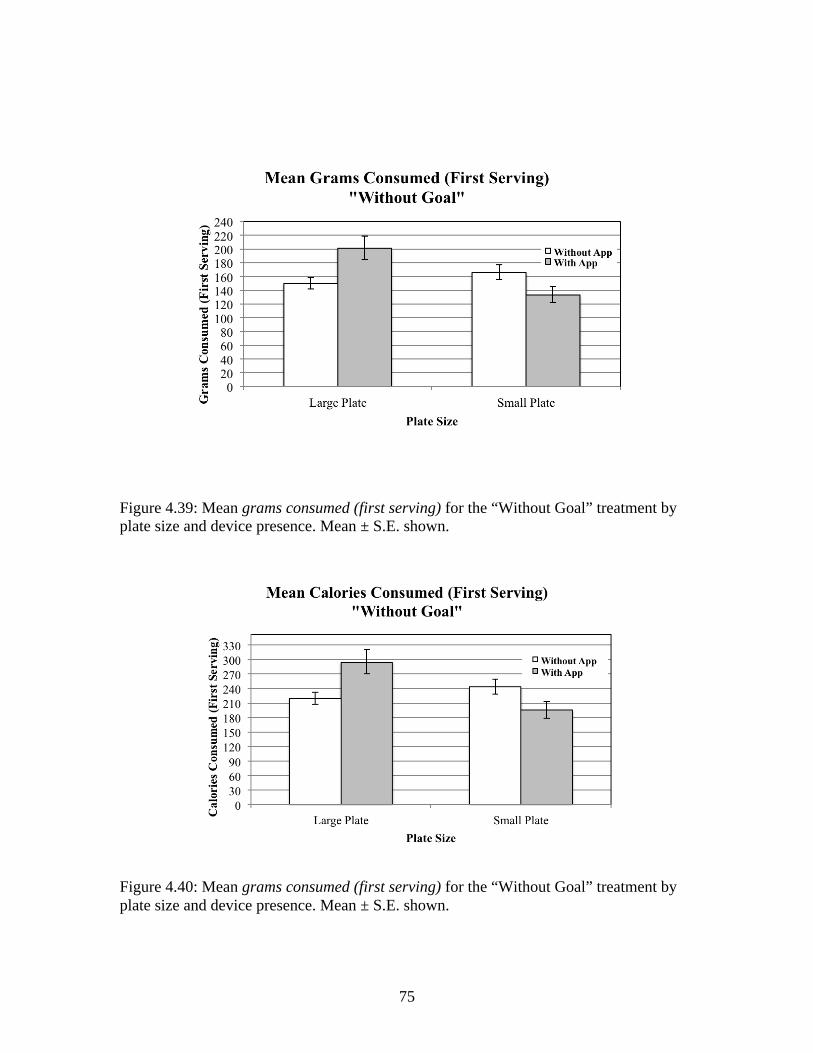
75
Figure 4.39: Mean grams consumed (first serving) for the “Without Goal” treatment by plate size and device presence. Mean ± S.E. shown.
Figure 4.40: Mean grams consumed (first serving) for the “Without Goal” treatment by plate size and device presence. Mean ± S.E. shown.

76
identifying food objects and food volumes with increasing accuracy. These results
suggest that once a desired level of accuracy is reached, additional efforts to improve the
application should focus on usability.
Key Considerations for General Mobile Nutrition Application Design
Several key considerations for general mobile nutrition application design can be
gleaned from the previously described study:
1. Ease of food identification and ease of portion data entry are important elements of
both usability and user satisfaction for mobile nutrition applications.
2. Simplicity of design eases use and increases user satisfaction, however, there is a risk
that hiding how calculations are performed may cause some users to question the
accuracy of information provided by the app.
3. The time scale over which one is trying to elicit change must be considered in mobile
nutrition application design. In this case, a short-term effect on decision making was
sought. Additional design elements may need to be incorporated into applications
seeking to impact actions over longer periods of time.
4. Absolute volumetric image computational accuracy is not required to elicit changes in
short-term food consumption.
5. The target audience for most mobile nutrition applications is the subset of the
population focused on weight loss. These results show that mobile nutrition
applications designed for weight maintenance and obesity prevention can have a
short-term impact on eating behaviors and may be a promising direction for future

77
mobile nutrition application development.

78
CHAPTER SIX
CONCLUSION AND FUTURE WORK
We have developed Picture-Perfect Portions, a mobile application designed to
combat overconsumption at the individual level by providing “just-in-time” information
about portion size and calorie content to users before they eat. The application’s design
leverages the power of simple visualizations to help adults monitor, understand and
adjust their food consumption practices. We have shown that the application has a
statistically significant impact on food consumption when users have a food consumption
goal, and we have demonstrated that true volumetric accuracy is not required to achieve
this result. In the previous chapters, we describe, in detail, the development and
implementation of the application, the usability evaluation process and its results, and the
impact of the application on food consumption, as determined by empirical evidence.
Finally, we use these collective observations to suggest key considerations relevant to
general mobile nutrition application design.
The results of this study suggest several interesting possibilities for future
research. One possible direction to explore is accuracy. Here, we demonstrate that
volumetric accuracy is not required to impact real-time, short-term decision making. The
impact of accuracy as an independent variable, however, is unknown. It may be
interesting to create an application with similar functionality but with differing levels of
food volume estimation accuracy and see whether or not the accuracy of feedback has a
significant effect on food consumption. One specific method of varying accuracy within
Picture-Perfect Portions would be to expand the complexity of shapes and drawing
79
methods available to users to identify both food and reference objects. Another strategy
might be to modify the application to accept information from two separate photos—one
that captures area and one that captures height. The results of such a study would reveal
the minimum level of food volume calculation accuracy required to show an effect on
food consumption.
Another possible direction to explore is the question of how to sustain user
engagement. Picture-Perfect Portions is designed to help users take action. It does not,
however, attempt to motivate action or support behavioral change maintenance. Several
strategies could be used to address this issue. One possible strategy is to pair the
application with external support. One way to provide external support would be to
create a virtual community space. This network of individuals could share data,
experiences, and goals with one another. In addition, competitive gaming elements could
be added to the application to incentivize both application usage and community
participation. Finally, the ability to communicate food consumption data with a network
of individuals with similar goals could provide an external mechanism for personal
accountability.
Consumer empowerment strategies related to food image data could also be
investigated. The design and execution of the proposed application is rooted in the goal
of supporting empowerment at the personal level (Contento, 2011; Freire, 1970; Israel,
Checkoway, Schulz, & Zimmerman, 1994). Digital images of meals are frequently
posted online to various social media outlets. It is unclear whether or not individual users
reap any tangible benefits from the collecting and sharing of this data. Various strategies

80
to raise awareness of digital photographs as one of many underutilized sources of
personal data could be created and their impact on self-reported user empowerment could
be studied.

81
APPENDICES

82
Appendix A
Participant Demographic Sheet
ID: _______________
Age:_____________________
Gender: Male Female (circle one)
More familiar system of measurement (circle one):
English (pound/foot/°F) Metric (kilogram/meter/°C)

83
Appendix B
Demographics Questionnaire
1. Please enter your unique participant ID provided by the experimenter. (If you donot remember your participant ID, please e-mail [email protected] or call864-656-1144 to receive your ID.) __________________________
2. What is your age in years? ______ years3. What is your gender?
� Male� Female
4. What is your ethnicity? (optional)� American Indian or Alaska Native� Asian or Pacific Islander� African American� Caucasian� Hispanic� Other (please specify): _____________________________
5. What level of education have you obtained?� Less than a high school diploma� High school diploma or equivalent� Some college� Bachelor’s degree� Master’s degree� Doctoral or professional degree (PhD, MD, JD, DPharm, DPT, etc.)
6. What is your annual household income? (optional)� $0-10,000 � $60,001-70,000 � $10,001-20,000 � $70,001-80,000 � $20,001-30,000 � $80,001-90,000 � $30,001-40,000 � $90,001-100,000 � $40,001 – 50,000 � More than $100,000 � $50,001-60,000
7. How frequently do you use a computer?
� Never� Once per month� Once per week� A few times per week� Daily
8. Do you have DAILY access to a computer with:
- a high-speed Internet connection (such as cable, DSL, or FIOS)
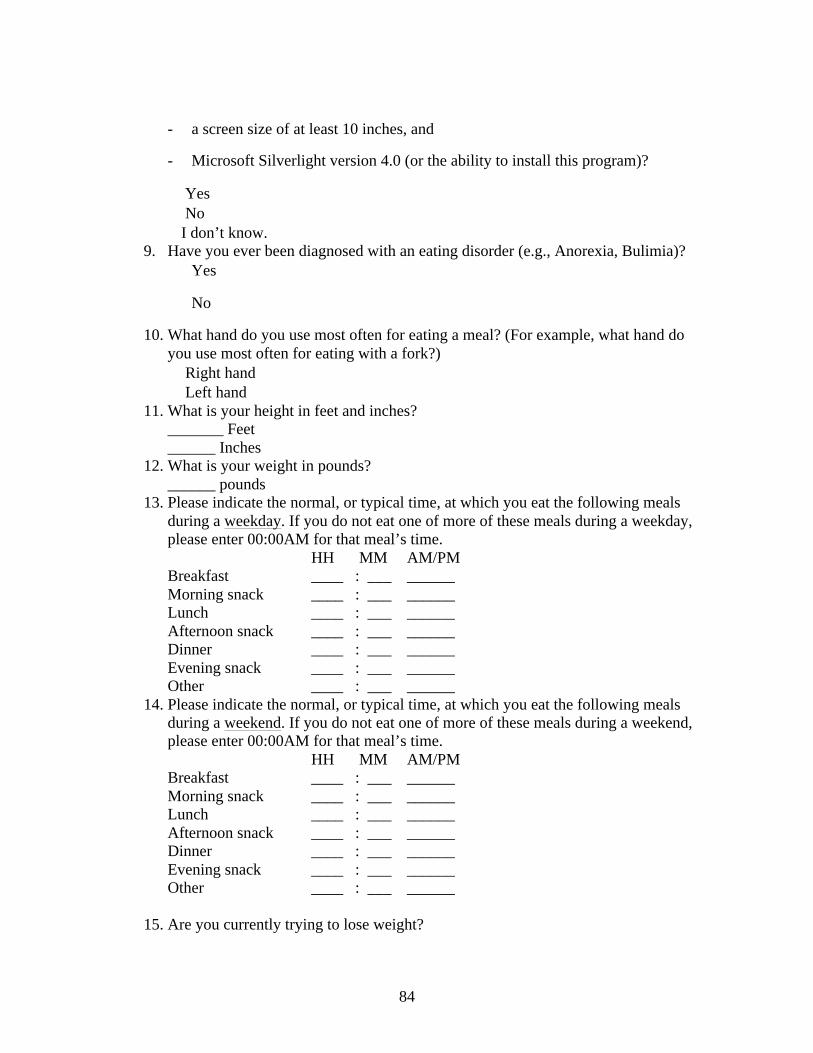
84
- a screen size of at least 10 inches, and
- Microsoft Silverlight version 4.0 (or the ability to install this program)?
� Yes � No � I don’t know.
9. Have you ever been diagnosed with an eating disorder (e.g., Anorexia, Bulimia)?� Yes
� No
10. What hand do you use most often for eating a meal? (For example, what hand doyou use most often for eating with a fork?)� Right hand� Left hand
11. What is your height in feet and inches?_______ Feet______ Inches
12. What is your weight in pounds?______ pounds
13. Please indicate the normal, or typical time, at which you eat the following mealsduring a weekday. If you do not eat one of more of these meals during a weekday,please enter 00:00AM for that meal’s time.
HH MM AM/PM Breakfast ____ : ___ ______ Morning snack ____ : ___ ______ Lunch ____ : ___ ______ Afternoon snack ____ : ___ ______ Dinner ____ : ___ ______ Evening snack ____ : ___ ______ Other ____ : ___ ______
14. Please indicate the normal, or typical time, at which you eat the following mealsduring a weekend. If you do not eat one of more of these meals during a weekend,please enter 00:00AM for that meal’s time.
HH MM AM/PM Breakfast ____ : ___ ______ Morning snack ____ : ___ ______ Lunch ____ : ___ ______ Afternoon snack ____ : ___ ______ Dinner ____ : ___ ______ Evening snack ____ : ___ ______ Other ____ : ___ ______
15. Are you currently trying to lose weight?

85
� Yes � No
16. Are you currently trying to gain weight?� Yes� No
17. Do you have any food allergies?� Yes� NoIf yes, please list the foods you are allergic to: ____________________________
18. Are you currently following a specific diet, or way of eating?� Yes� NoIf yes, please describe your diet: _______________________________________

86
Appendix C
Relationship Questionnaire
Do you know any of the other participants? _____________________________________________________________________________________
How many of the other participants do you know? _____________________________________________________________________________________ Please list by Participant ID each participant you know:
1. ___________________2. ___________________3. ___________________
How long have you known each participant listed above? 1. ___________________2. ___________________3. ___________________
How do you primarily know each participant listed above (work, school, club, other)? 1. ____________________2. ____________________3. ____________________

87
Appendix D
START SLIM
Participant #:_________ Station #: ______________ Date:______________ Time:______________ Please rate the degree of hunger/fullness that you currently feel by putting a slash (/)
mark somewhere on the line below.
Greatest Imaginable Fullness
Extremely Full Very Full
Moderately Full
Slightly Full
Neither Hungry nor Full
Slightly Hungry
Moderately Hungry
Very Hungry
Extremely Hungry
Greatest Imaginable Hunger

88
Appendix E
END SLIM
Participant #:_________ Station #: ______________ Date:______________ Time:______________ Please rate the degree of hunger/fullness that you currently feel by putting a slash (/)
mark somewhere on the line below.
Greatest Imaginable Fullness
Extremely Full Very Full
Moderately Full
Slightly Full
Neither Hungry nor Full
Slightly Hungry
Moderately Hungry
Very Hungry
Extremely Hungry
Greatest Imaginable Hunger
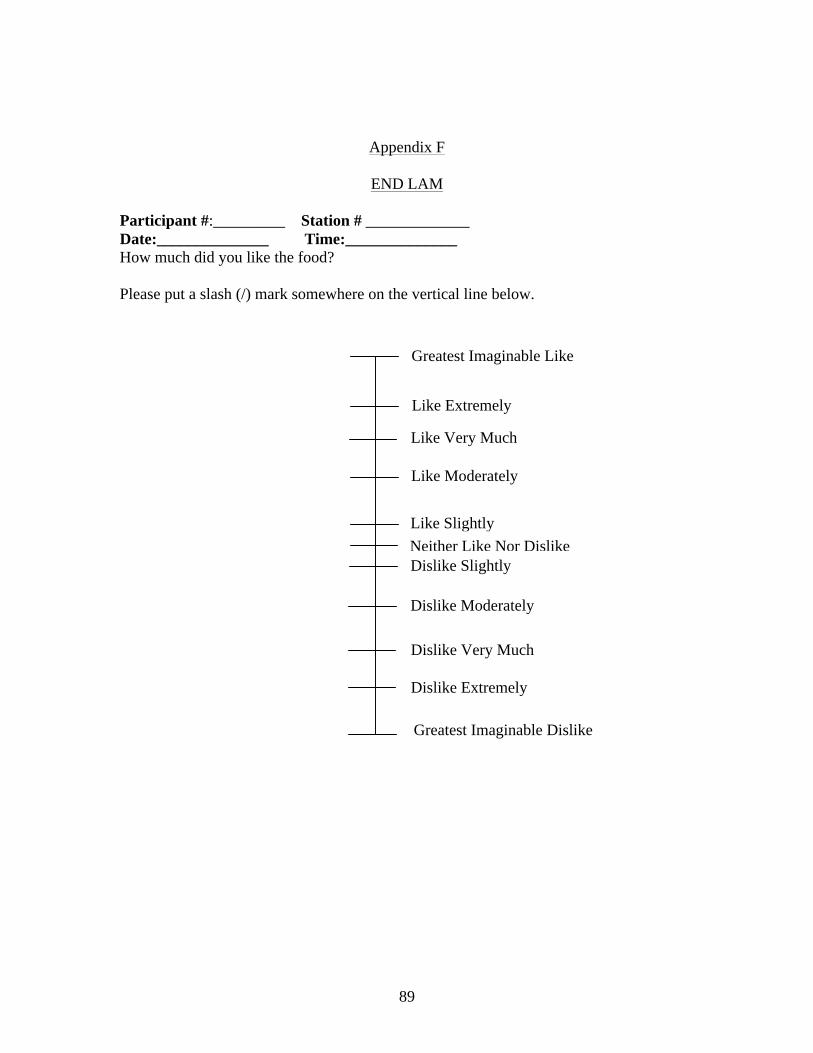
89
Appendix F
END LAM
Participant #:_________ Station # _____________ Date:______________ Time:______________ How much did you like the food?
Please put a slash (/) mark somewhere on the vertical line below.
Greatest Imaginable Like
Greatest Imaginable Dislike
Like Extremely
Like Very Much
Like Moderately
Like Slightly Neither Like Nor Dislike Dislike Slightly
Dislike Moderately
Dislike Very Much
Dislike Extremely

90
Appendix G
Self-Control Scale
Based on your eating experience, indicate how much you agree or disagree with the statements below and on the following page by circling one number for each statement. Some of the statements may seem similar, but please consider each statement carefully before responding.
First, think about before you began eating.
Strongly disagree
Neither agree nor disagree
Strongly agree
Before I began eating, there was a certain amount of food I intended to
eat.
1 2 3 4 5 6 7
Before I ate, I knew precisely how much
to eat. 1 2 3 4 5 6 7
Before I ate, I was certain about how
much to eat. 1 2 3 4 5 6 7
Prior to eating, the amount that I should
eat was unmistakable.
1 2 3 4 5 6 7
Prior to eating, I had a clear idea of how
much to eat. 1 2 3 4 5 6 7
Now, think about the situation while you were eating. What was happening around you? Were you distracted, talking with others, or thinking about other things?
Strongly disagree
Neither agree nor disagree
Strongly agree
Based on the situation, I had the
ability to monitor my eating while I was
eating.
1 2 3 4 5 6 7
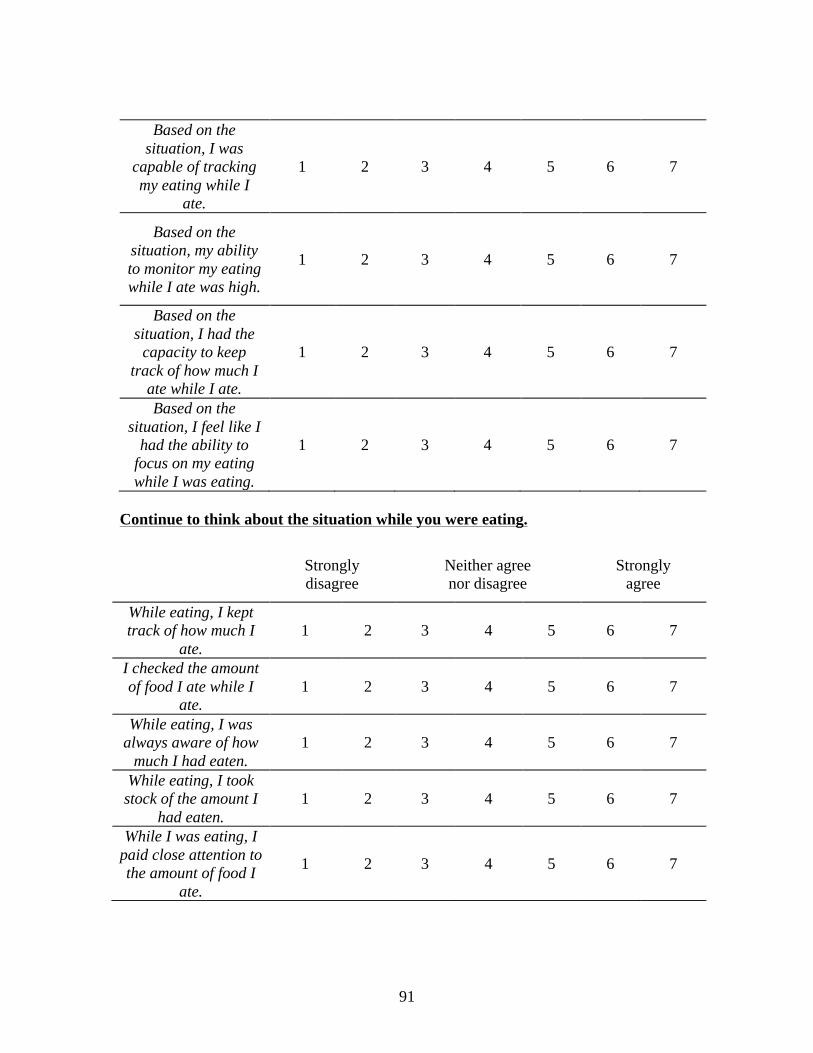
91
Based on the situation, I was
capable of tracking my eating while I
ate.
1 2 3 4 5 6 7
Based on the situation, my ability to monitor my eating while I ate was high.
1 2 3 4 5 6 7
Based on the situation, I had the
capacity to keep track of how much I
ate while I ate.
1 2 3 4 5 6 7
Based on the situation, I feel like I
had the ability to focus on my eating while I was eating.
1 2 3 4 5 6 7
Continue to think about the situation while you were eating.
Strongly disagree
Neither agree nor disagree
Strongly agree
While eating, I kept track of how much I
ate. 1 2 3 4 5 6 7
I checked the amount of food I ate while I
ate. 1 2 3 4 5 6 7
While eating, I was always aware of how
much I had eaten. 1 2 3 4 5 6 7
While eating, I took stock of the amount I
had eaten. 1 2 3 4 5 6 7
While I was eating, I paid close attention to the amount of food I
ate.
1 2 3 4 5 6 7

92
Finally, think about how you felt after you finished eating.
Strongly disagree
Neither agree nor disagree
Strongly agree
I ate more than I should have. 1 2 3 4 5 6 7
I feel like I ate a reasonable amount. 1 2 3 4 5 6 7
I stopped eating when I should have. 1 2 3 4 5 6 7
I ate an appropriate amount. 1 2 3 4 5 6 7
I successfully controlled my eating. 1 2 3 4 5 6 7

93
Appendix H
Nutrition Knowledge Questionnaire
ID: _______________ For each statement, circle the correct response from the answer choices provided. 1. Nutrition guidelines suggest that no more than ____ percent of the calories consumed
in a day should come from fat. a. 10 b. 20 c. 30 d. 40 e. 50 2. A gram of fat provides about ____ as many calories as a gram of protein.
a. one-half b. twice c. four times d. six times 3. Which food group provides protein, B vitamins, iron, and zinc?
a. Meat, poultry, and fish b. Milk and dairy products c. Fruits d. Grain products 4. Nutrition guidelines suggest that no more than ____ percent of the calories consumed
in a day should come from saturated fat.
a. 1 b. 2 c. 5 d. 10 e. 20 5. The source of all dietary cholesterol is ____ products.
a. seafood b. fruit c. grain d. vegetable e. animal 6. Moderate drinking, for men, is defined as ____ or fewer alcoholic drinks per day.
a. 1 b. 2 c. 3 d. 4 e. 5 7. Nutrition guidelines suggest a minimum of ____ servings of vegetables a day.
a. 1 b. 2 c. 3 d. 4 e. 5
8. ____ cup(s) of raw leafy greens counts as a single serving of vegetables. a. 0.25 b. 0.50 c. 0.75 d. 1 e. 2

94
Appendix I
Nutrition Consciousness Questionnaire ID: _______________ For each question, circle the number most closely associated with your own opinion: 1. I usually am interested in looking for nutritional information on food packages. 1 2 3 4 5 6 7 Strongly Disagree Neutral Strongly Agree 2. Compared to other people, how much do you feel you know about nutrition? 1 2 3 4 5 6 7 Almost Nothing About Average A Lot 3. I would like to see additional nutritional information on food packages. 1 2 3 4 5 6 7 Strongly Disagree Neutral Strongly Agree

95
Appendix J
System Usability Scale ID: _______________ For each question, circle the number most closely associated with your own opinion: 1. I think that I would like to use this system frequently.
1 2 3 4 5 Strongly Disagree Neutral Strongly Agree 2. I found the system unnecessarily complex.
1 2 3 4 5 Strongly Disagree Neutral Strongly Agree 3. I thought the system was easy to use.
1 2 3 4 5 Strongly Disagree Neutral Strongly Agree 4. I think that I would need the support of a technical person to be able to use this system.
1 2 3 4 5 Strongly Disagree Neutral Strongly Agree 5. I found the various functions in this system were well integrated.
1 2 3 4 5 Strongly Disagree Neutral Strongly Agree 6. I thought there was too much inconsistency in this system.
1 2 3 4 5 Strongly Disagree Neutral Strongly Agree 7. I would imagine that most people would learn to use this system very quickly.
1 2 3 4 5 Strongly Disagree Neutral Strongly Agree 8. I found the system very cumbersome to use.
1 2 3 4 5 Strongly Disagree Neutral Strongly Agree 9. I felt very confident using the system.
1 2 3 4 5 Strongly Disagree Neutral Strongly Agree 10. I needed to learn a lot of things before I could get going with this system.
1 2 3 4 5 Strongly Disagree Neutral Strongly Agree COMMMENTS:

96
Appendix K
Heuristic Evaluation Guidelines
Heuristic Evaluation – A System Checklist © Usability Analysis & Design, Xerox Corporation, 1995
1. Visibility of System Status
The system should always keep user informed about what is going on, through appropriate feedback within reasonable time.
# Review Checklist Yes No N/A Comments
1.1 Does every display begin with a title or header that describes screen contents? O O O
1.2 Is there a consistent icon design scheme and stylistic treatment across the system? O O O
1.3 Is a single, selected icon clearly visible when surrounded by unselected icons? O O O
1.4 Do menu instructions, prompts, and error messages appear in the same place(s) on each menu?
O O O
1.5 In multipage data entry screens, is each page labeled to show its relation to others?
O O O
1.6 If overtype and insert mode are both available, is there a visible indication of which one the user is in?
O O O
1.7 If pop-up windows are used to display error messages, do they allow the user to see the field in error?
O O O
1.8 Is there some form of system feedback for every operator action? O O O

97
1.13 Is there visual feedback when objects are selected or moved? O O O
1.14 Is the current status of an icon clearly indicated? O O O
1.15 Is there feedback when function keys are pressed? O O O
1.16 If there are observable delays (greater than fifteen seconds) in the system’s response time, is the user kept informed of the system's progress?
O O O
1.17 Are response times appropriate to the task? O O O
1.18 Typing, cursor motion, mouse selection: 50-1 50 milliseconds O O O
1.19 Simple, frequent tasks: less than 1 second O O O
1.20 Common tasks: 2-4 seconds O O O
1.21 Complex tasks: 8-12 seconds O O O
1.22 Are response times appropriate to the user's cognitive processing? O O O
1.23 Continuity of thinking is required and information must be remembered throughout several responses: less than two seconds.
O O O
1.9 After the user completes an action (or group of actions), does the feedback indicate that the next group of actions can be started?
O O O
1.10 Is there visual feedback in menus or dialog boxes about which choices are selectable?
O O O
1.11 Is there visual feedback in menus or dialog boxes about which choice the cursor is on now?
O O O
1.12 If multiple options can be selected in a menu or dialog box, is there visual feedback about which options are already selected?
O O O
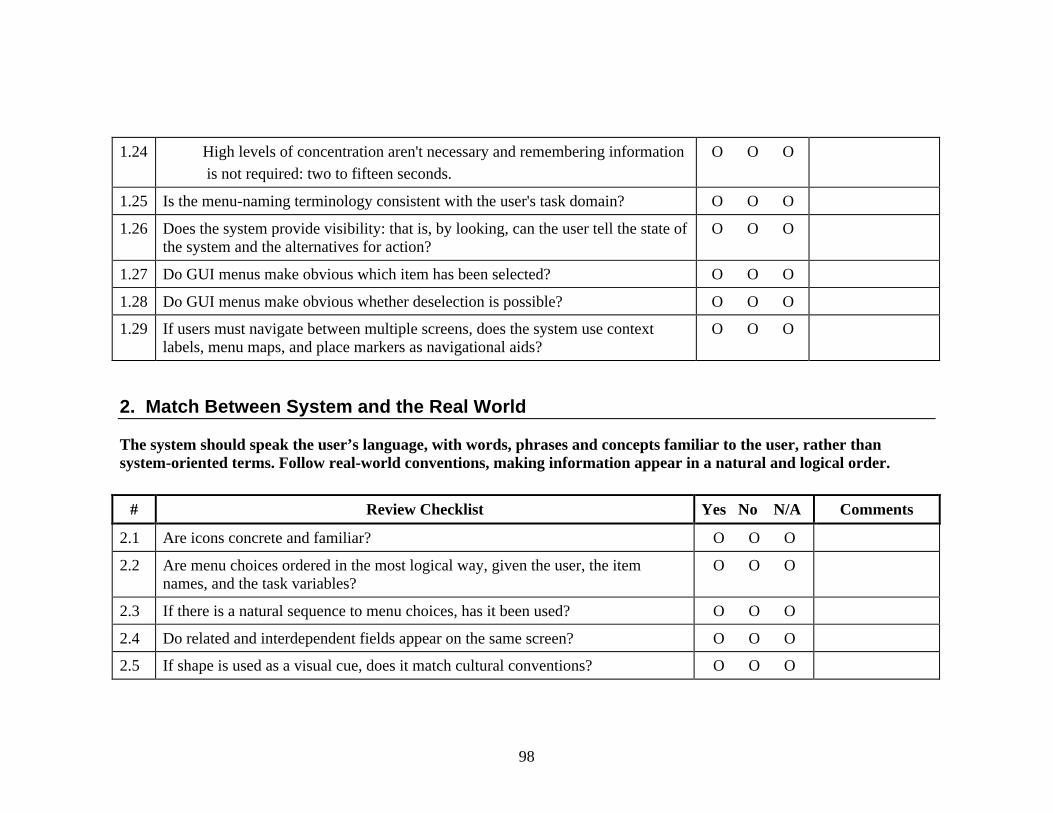
98
1.24 High levels of concentration aren't necessary and remembering information
is not required: two to fifteen seconds. O O O
1.25 Is the menu-naming terminology consistent with the user's task domain? O O O
1.26 Does the system provide visibility: that is, by looking, can the user tell the state of the system and the alternatives for action?
O O O
1.27 Do GUI menus make obvious which item has been selected? O O O
1.28 Do GUI menus make obvious whether deselection is possible? O O O
1.29 If users must navigate between multiple screens, does the system use context labels, menu maps, and place markers as navigational aids?
O O O
2. Match Between System and the Real World
The system should speak the user’s language, with words, phrases and concepts familiar to the user, rather than system-oriented terms. Follow real-world conventions, making information appear in a natural and logical order.
# Review Checklist Yes No N/A Comments
2.1 Are icons concrete and familiar? O O O
2.2 Are menu choices ordered in the most logical way, given the user, the item names, and the task variables?
O O O
2.3 If there is a natural sequence to menu choices, has it been used? O O O
2.4 Do related and interdependent fields appear on the same screen? O O O
2.5 If shape is used as a visual cue, does it match cultural conventions? O O O

99
2.6 Do the selected colors correspond to common expectations about color codes? O O O
2.7 When prompts imply a necessary action, are the words in the message consistent with that action?
O O O
2.8 Do keystroke references in prompts match actual key names? O O O
2.9 On data entry screens, are tasks described in terminology familiar to users? O O O
2.10 Are field-level prompts provided for data entry screens?
2.11 For question and answer interfaces, are questions stated in clear, simple language?
O O O
2.12 Do menu choices fit logically into categories that have readily understood meanings?
O O O
2.13 Are menu titles parallel grammatically? O O O
2.14 Does the command language employ user jargon and avoid computer jargon? O O O
2.15 Are command names specific rather than general? O O O
2.16 Does the command language allow both full names and abbreviations? O O O
2.17 Are input data codes meaningful? O O O
2.18 Have uncommon letter sequences been avoided whenever possible? O O O
2.19 Does the system automatically enter leading or trailing spaces to align decimal points?
O O O
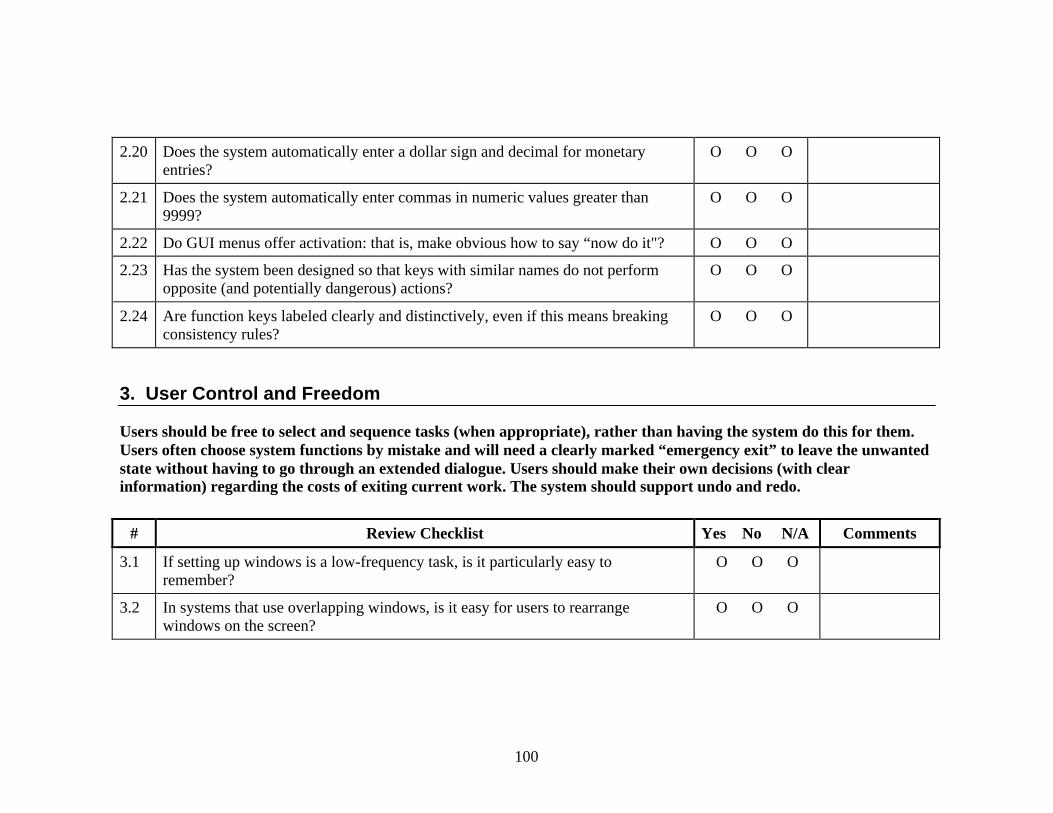
100
2.20 Does the system automatically enter a dollar sign and decimal for monetary
entries? O O O
2.21 Does the system automatically enter commas in numeric values greater than 9999?
O O O
2.22 Do GUI menus offer activation: that is, make obvious how to say “now do it"? O O O
2.23 Has the system been designed so that keys with similar names do not perform opposite (and potentially dangerous) actions?
O O O
2.24 Are function keys labeled clearly and distinctively, even if this means breaking consistency rules?
O O O
3. User Control and Freedom
Users should be free to select and sequence tasks (when appropriate), rather than having the system do this for them. Users often choose system functions by mistake and will need a clearly marked “emergency exit” to leave the unwanted state without having to go through an extended dialogue. Users should make their own decisions (with clear information) regarding the costs of exiting current work. The system should support undo and redo.
# Review Checklist Yes No N/A Comments
3.1 If setting up windows is a low-frequency task, is it particularly easy to remember?
O O O
3.2 In systems that use overlapping windows, is it easy for users to rearrange windows on the screen?
O O O
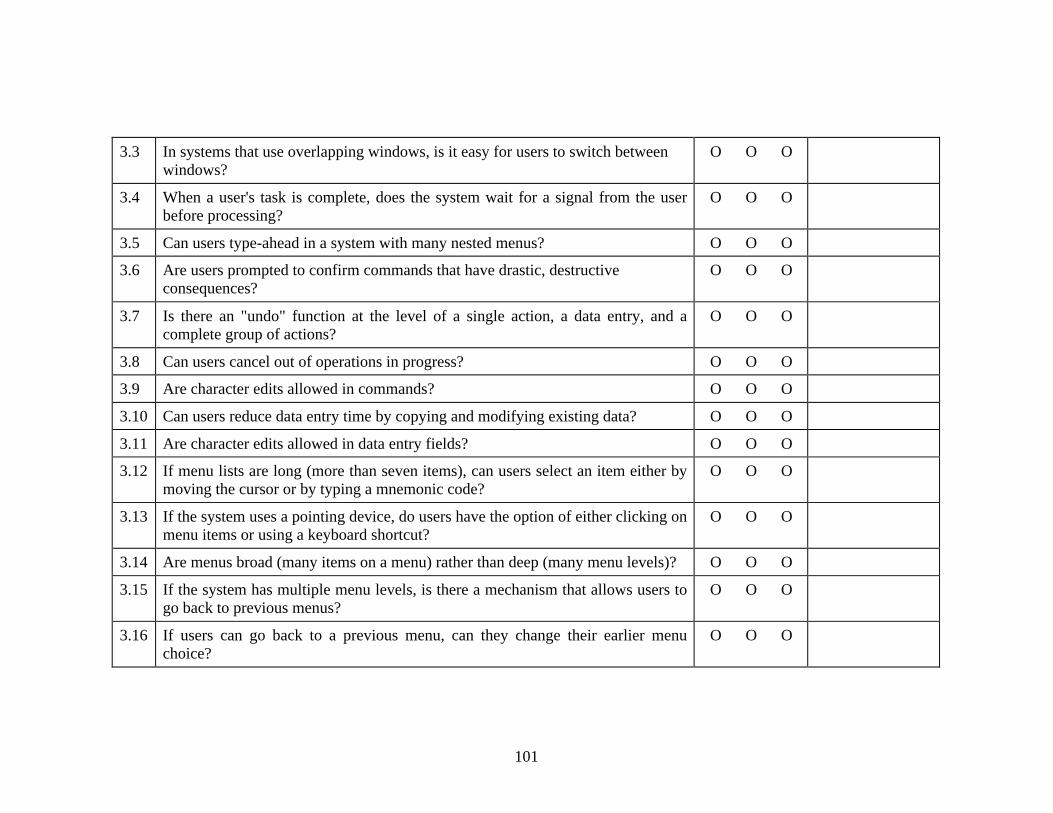
101
3.3 In systems that use overlapping windows, is it easy for users to switch between
windows? O O O
3.4 When a user's task is complete, does the system wait for a signal from the user before processing?
O O O
3.5 Can users type-ahead in a system with many nested menus? O O O
3.6 Are users prompted to confirm commands that have drastic, destructive consequences?
O O O
3.7 Is there an "undo" function at the level of a single action, a data entry, and a complete group of actions?
O O O
3.8 Can users cancel out of operations in progress? O O O
3.9 Are character edits allowed in commands? O O O
3.10 Can users reduce data entry time by copying and modifying existing data? O O O
3.11 Are character edits allowed in data entry fields? O O O
3.12 If menu lists are long (more than seven items), can users select an item either by moving the cursor or by typing a mnemonic code?
O O O
3.13 If the system uses a pointing device, do users have the option of either clicking on menu items or using a keyboard shortcut?
O O O
3.14 Are menus broad (many items on a menu) rather than deep (many menu levels)? O O O
3.15 If the system has multiple menu levels, is there a mechanism that allows users to go back to previous menus?
O O O
3.16 If users can go back to a previous menu, can they change their earlier menu choice?
O O O
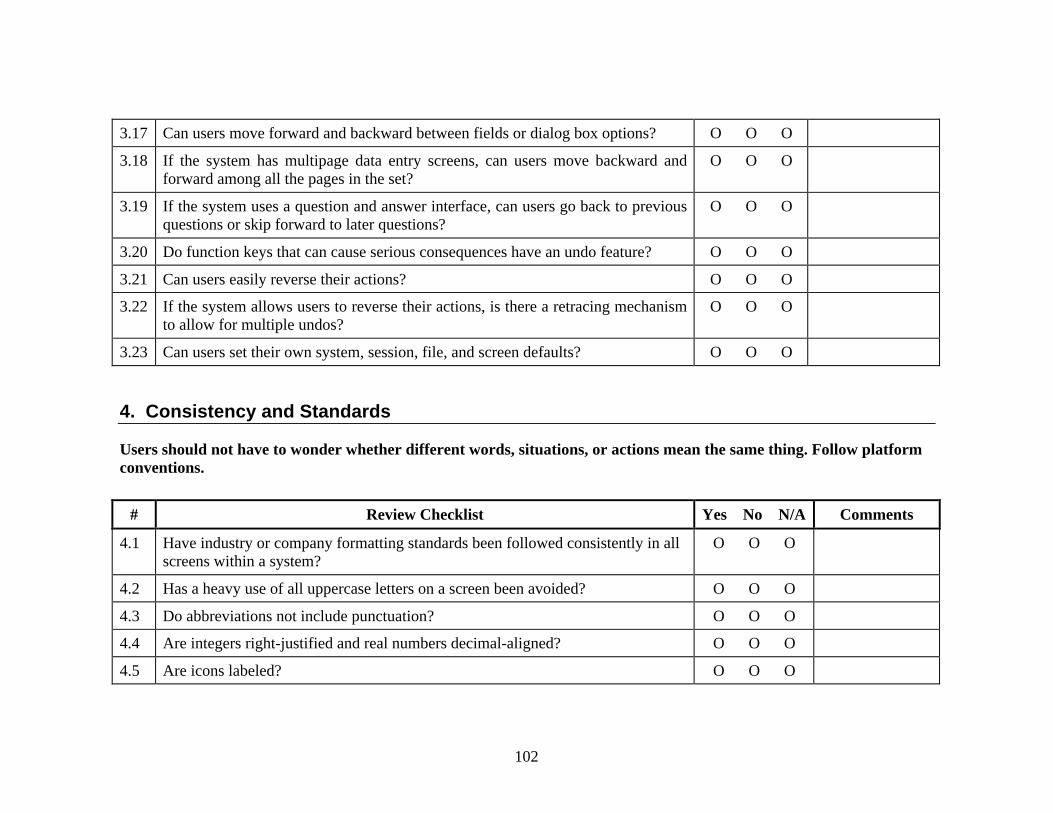
102
3.17 Can users move forward and backward between fields or dialog box options? O O O
3.18 If the system has multipage data entry screens, can users move backward and forward among all the pages in the set?
O O O
3.19 If the system uses a question and answer interface, can users go back to previous questions or skip forward to later questions?
O O O
3.20 Do function keys that can cause serious consequences have an undo feature? O O O
3.21 Can users easily reverse their actions? O O O
3.22 If the system allows users to reverse their actions, is there a retracing mechanism to allow for multiple undos?
O O O
3.23 Can users set their own system, session, file, and screen defaults? O O O
4. Consistency and Standards
Users should not have to wonder whether different words, situations, or actions mean the same thing. Follow platform conventions.
# Review Checklist Yes No N/A Comments
4.1 Have industry or company formatting standards been followed consistently in all screens within a system?
O O O
4.2 Has a heavy use of all uppercase letters on a screen been avoided? O O O
4.3 Do abbreviations not include punctuation? O O O
4.4 Are integers right-justified and real numbers decimal-aligned? O O O
4.5 Are icons labeled? O O O

103
4.6 Are there no more than twelve to twenty icon types? O O O
4.7 Are there salient visual cues to identify the active window? O O O
4.8 Does each window have a title? O O O
4.9 Are vertical and horizontal scrolling possible in each window? O O O
4.10 Does the menu structure match the task structure? O O O
4.11 Have industry or company standards been established for menu design, and are they applied consistently on all menu screens in the system?
O O O
4.12 Are menu choice lists presented vertically? O O O
4.13 If "exit" is a menu choice, does it always appear at the bottom of the list? O O O
4.14 Are menu titles either centered or left-justified? O O O
4.15 Are menu items left-justified, with the item number or mnemonic preceding the name?
O O O
4.16 Do embedded field-level prompts appear to the right of the field label? O O O
4.17 Do on-line instructions appear in a consistent location across screens? O O O
4.18 Are field labels and fields distinguished typographically? O O O
4.19 Are field labels consistent from one data entry screen to another? O O O
4.20 Are fields and labels left-justified for alpha lists and right-justified for numeric lists?
O O O
4.21 Do field labels appear to the left of single fields and above list fields? O O O
4.22 Are attention-getting techniques used with care? O O O
4.23 Intensity: two levels only O O O
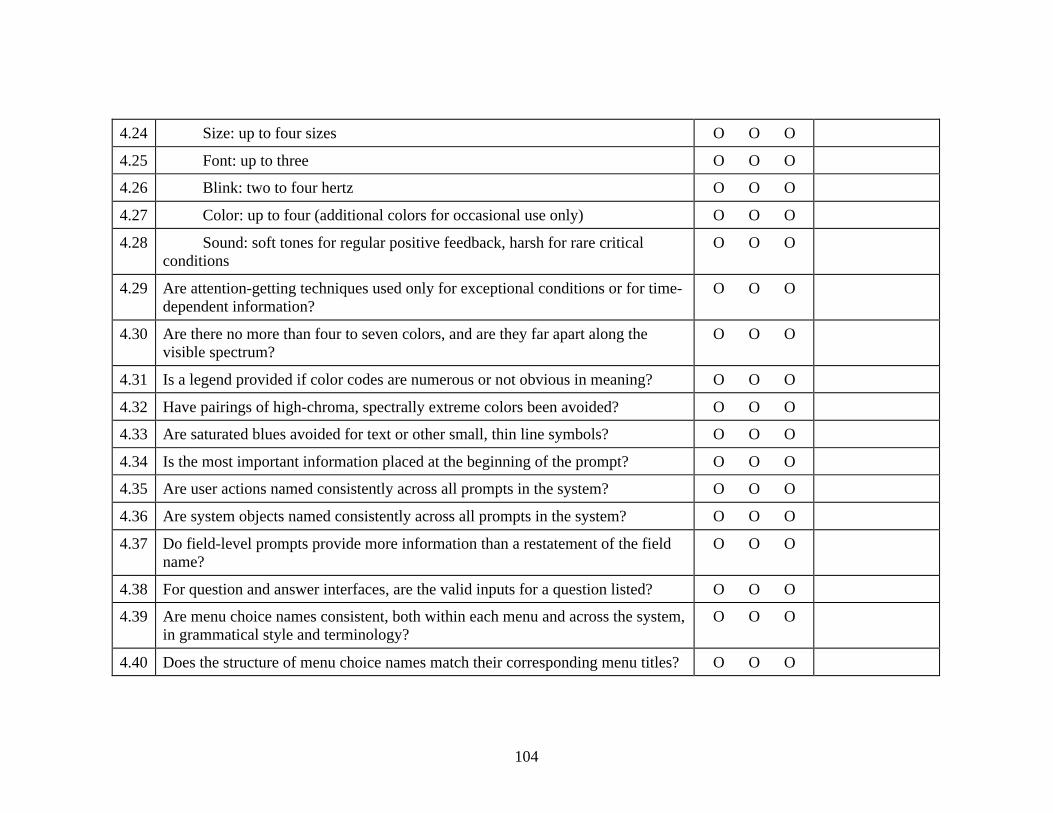
104
4.24 Size: up to four sizes O O O
4.25 Font: up to three O O O
4.26 Blink: two to four hertz O O O
4.27 Color: up to four (additional colors for occasional use only) O O O
4.28 Sound: soft tones for regular positive feedback, harsh for rare critical conditions
O O O
4.29 Are attention-getting techniques used only for exceptional conditions or for time-dependent information?
O O O
4.30 Are there no more than four to seven colors, and are they far apart along the visible spectrum?
O O O
4.31 Is a legend provided if color codes are numerous or not obvious in meaning? O O O
4.32 Have pairings of high-chroma, spectrally extreme colors been avoided? O O O
4.33 Are saturated blues avoided for text or other small, thin line symbols? O O O
4.34 Is the most important information placed at the beginning of the prompt? O O O
4.35 Are user actions named consistently across all prompts in the system? O O O
4.36 Are system objects named consistently across all prompts in the system? O O O
4.37 Do field-level prompts provide more information than a restatement of the field name?
O O O
4.38 For question and answer interfaces, are the valid inputs for a question listed? O O O
4.39 Are menu choice names consistent, both within each menu and across the system, in grammatical style and terminology?
O O O
4.40 Does the structure of menu choice names match their corresponding menu titles? O O O
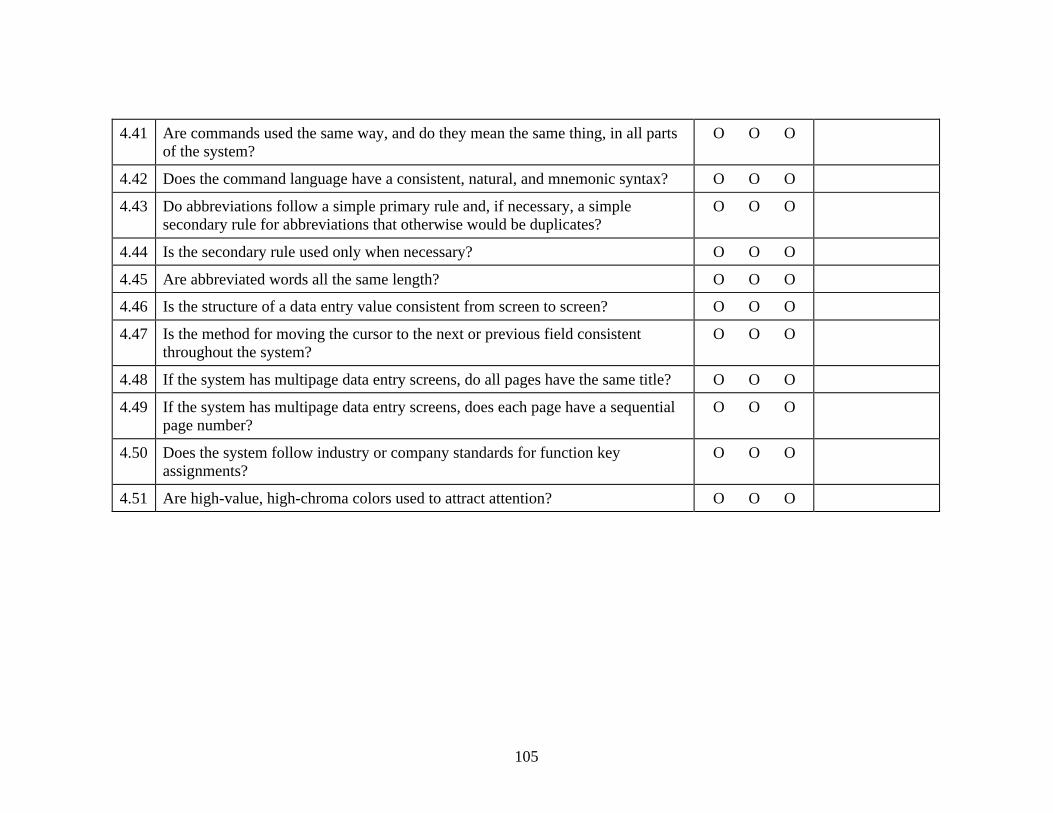
105
4.41 Are commands used the same way, and do they mean the same thing, in all parts of the system?
O O O
4.42 Does the command language have a consistent, natural, and mnemonic syntax? O O O
4.43 Do abbreviations follow a simple primary rule and, if necessary, a simple secondary rule for abbreviations that otherwise would be duplicates?
O O O
4.44 Is the secondary rule used only when necessary? O O O
4.45 Are abbreviated words all the same length? O O O
4.46 Is the structure of a data entry value consistent from screen to screen? O O O
4.47 Is the method for moving the cursor to the next or previous field consistent throughout the system?
O O O
4.48 If the system has multipage data entry screens, do all pages have the same title? O O O
4.49 If the system has multipage data entry screens, does each page have a sequential page number?
O O O
4.50 Does the system follow industry or company standards for function key assignments?
O O O
4.51 Are high-value, high-chroma colors used to attract attention? O O O

106
5. Help Users Recognize, Diagnose, and Recover From Errors Error messages should be expressed in plain language (NO CODES).
# Review Checklist Yes No N/A Comments
5.1 Is sound used to signal an error? O O O
5.2 Are prompts stated constructively, without overt or implied criticism of the user? O O O
5.3 Do prompts imply that the user is in control? O O O
5.4 Are prompts brief and unambiguous. O O O
5.5 Are error messages worded so that the system, not the user, takes the blame? O O O
5.6 If humorous error messages are used, are they appropriate and inoffensive to the user population?
O O O
5.7 Are error messages grammatically correct? O O O
5.8 Do error messages avoid the use of exclamation points? O O O
5.9 Do error messages avoid the use of violent or hostile words? O O O
5.10 Do error messages avoid an anthropomorphic tone? O O O
5.11 Do all error messages in the system use consistent grammatical style, form, terminology, and abbreviations?
O O O
5.12 Do messages place users in control of the system? O O O
5.13 Does the command language use normal action-object syntax? O O O
5.14 Does the command language avoid arbitrary, non-English use of punctuation, except for symbols that users already know?
O O O
5.15 If an error is detected in a data entry field, does the system place the cursor in that O O O
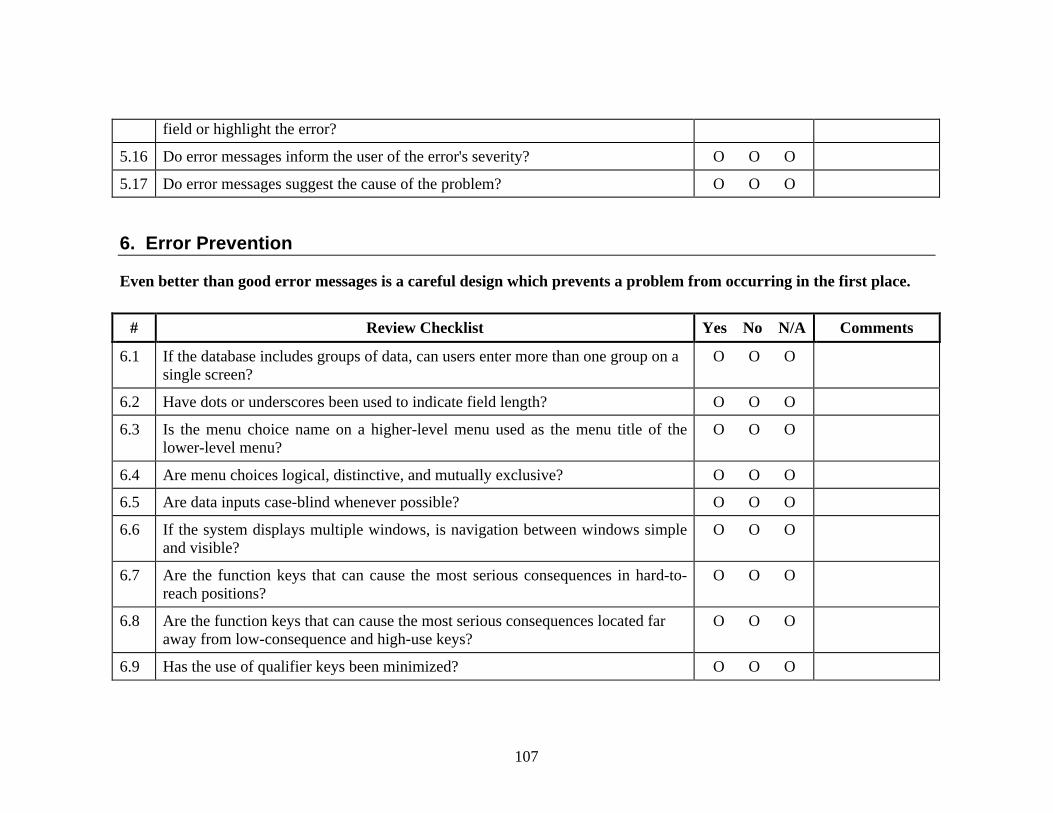
107
field or highlight the error?
5.16 Do error messages inform the user of the error's severity? O O O
5.17 Do error messages suggest the cause of the problem? O O O
6. Error Prevention
Even better than good error messages is a careful design which prevents a problem from occurring in the first place.
# Review Checklist Yes No N/A Comments
6.1 If the database includes groups of data, can users enter more than one group on a single screen?
O O O
6.2 Have dots or underscores been used to indicate field length? O O O
6.3 Is the menu choice name on a higher-level menu used as the menu title of the lower-level menu?
O O O
6.4 Are menu choices logical, distinctive, and mutually exclusive? O O O
6.5 Are data inputs case-blind whenever possible? O O O
6.6 If the system displays multiple windows, is navigation between windows simple and visible?
O O O
6.7 Are the function keys that can cause the most serious consequences in hard-to-reach positions?
O O O
6.8 Are the function keys that can cause the most serious consequences located far away from low-consequence and high-use keys?
O O O
6.9 Has the use of qualifier keys been minimized? O O O

108
6.10 If the system uses qualifier keys, are they used consistently throughout the system?
O O O
6.11 Does the system prevent users from making errors whenever possible? O O O
6.12 Does the system warn users if they are about to make a potentially serious error? O O O
6.13 Does the system intelligently interpret variations in user commands? O O O
6.14 Do data entry screens and dialog boxes indicate the number of character spaces available in a field?
O O O
6.15 Do fields in data entry screens and dialog boxes contain default values when appropriate?
O O O
7. Recognition Rather Than Recall
Make objects, actions, and options visible. The user should not have to remember information from one part of the dialogue to another. Instructions for use of the system should be visible or easily retrievable whenever appropriate.
# Review Checklist Yes No N/A Comments
7.1 For question and answer interfaces, are visual cues and white space used to distinguish questions, prompts, instructions, and user input?
O O O
7.2 Does the data display start in the upper-left corner of the screen? O O O
7.3 Are multiword field labels placed horizontally (not stacked vertically)? O O O
7.4 Are all data a user needs on display at each step in a transaction sequence? O O O
7.5 Are prompts, cues, and messages placed where the eye is likely to be looking on the screen?
O O O

109
7.6 Have prompts been formatted using white space, justification, and visual cues for easy scanning?
O O O
7.7 Do text areas have "breathing space" around them? O O O
7.8 Is there an obvious visual distinction made between "choose one" menu and "choose many" menus?
O O O
7.9 Have spatial relationships between soft function keys (on-screen cues) and keyboard function keys been preserved?
O O O
7.10 Does the system gray out or delete labels of currently inactive soft function keys? O O O
7.11 Is white space used to create symmetry and lead the eye in the appropriate direction?
O O O
7.12 Have items been grouped into logical zones, and have headings been used to distinguish between zones?
O O O
7.13 Are zones no more than twelve to fourteen characters wide and six to seven lines high?
O O O
7.14 Have zones been separated by spaces, lines, color, letters, bold titles, rules lines, or shaded areas?
O O O
7.15 Are field labels close to fields, but separated by at least one space? O O O
7.16 Are long columnar fields broken up into groups of five, separated by a blank line?
O O O
7.17 Are optional data entry fields clearly marked? O O O
7.18 Are symbols used to break long input strings into "chunks"? O O O
7.19 Is reverse video or color highlighting used to get the user's attention? O O O
7.20 Is reverse video used to indicate that an item has been selected? O O O
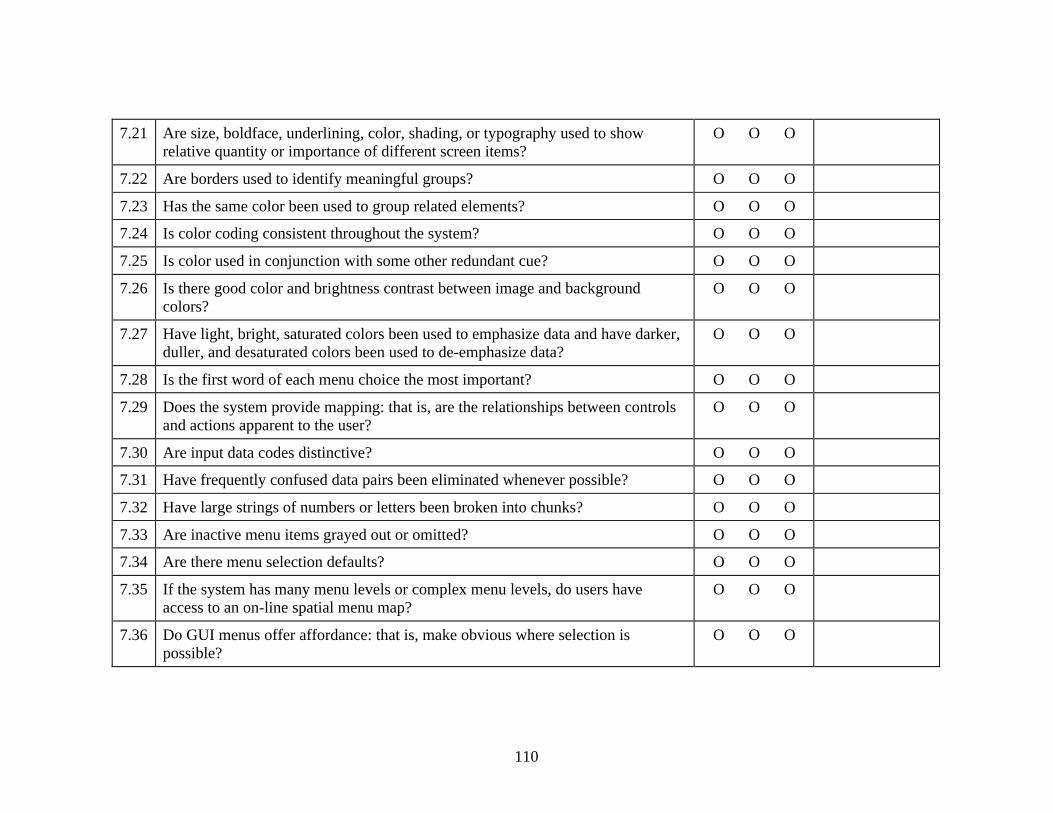
110
7.21 Are size, boldface, underlining, color, shading, or typography used to show relative quantity or importance of different screen items?
O O O
7.22 Are borders used to identify meaningful groups? O O O
7.23 Has the same color been used to group related elements? O O O
7.24 Is color coding consistent throughout the system? O O O
7.25 Is color used in conjunction with some other redundant cue? O O O
7.26 Is there good color and brightness contrast between image and background colors?
O O O
7.27 Have light, bright, saturated colors been used to emphasize data and have darker, duller, and desaturated colors been used to de-emphasize data?
O O O
7.28 Is the first word of each menu choice the most important? O O O
7.29 Does the system provide mapping: that is, are the relationships between controls and actions apparent to the user?
O O O
7.30 Are input data codes distinctive? O O O
7.31 Have frequently confused data pairs been eliminated whenever possible? O O O
7.32 Have large strings of numbers or letters been broken into chunks? O O O
7.33 Are inactive menu items grayed out or omitted? O O O
7.34 Are there menu selection defaults? O O O
7.35 If the system has many menu levels or complex menu levels, do users have access to an on-line spatial menu map?
O O O
7.36 Do GUI menus offer affordance: that is, make obvious where selection is possible?
O O O

111
7.37 Are there salient visual cues to identify the active window? O O O
7.38 Are function keys arranged in logical groups? O O O
7.39 Do data entry screens and dialog boxes indicate when fields are optional? O O O
7.40 On data entry screens and dialog boxes, are dependent fields displayed only when necessary?
O O O
8. Flexibility and Minimalist Design
Accelerators-unseen by the novice user-may often speed up the interaction for the expert user such that the system can cater to both inexperienced and experienced users. Allow users to tailor frequent actions. Provide alternative means of access and operation for users who differ from the “average” user (e.g., physical or cognitive ability, culture, language, etc.)
# Review Checklist Yes No N/A Comments
8.1 If the system supports both novice and expert users, are multiple levels of error message detail available?
O O O
8.2 Does the system allow novices to use a keyword grammar and experts to use a positional grammar?
O O O
8.3 Can users define their own synonyms for commands? O O O
8.4 Does the system allow novice users to enter the simplest, most common form of each command, and allow expert users to add parameters?
O O O
8.5 Do expert users have the option of entering multiple commands in a single string? O O O
8.6 Does the system provide function keys for high-frequency commands? O O O
8.7 For data entry screens with many fields or in which source documents may be O O O
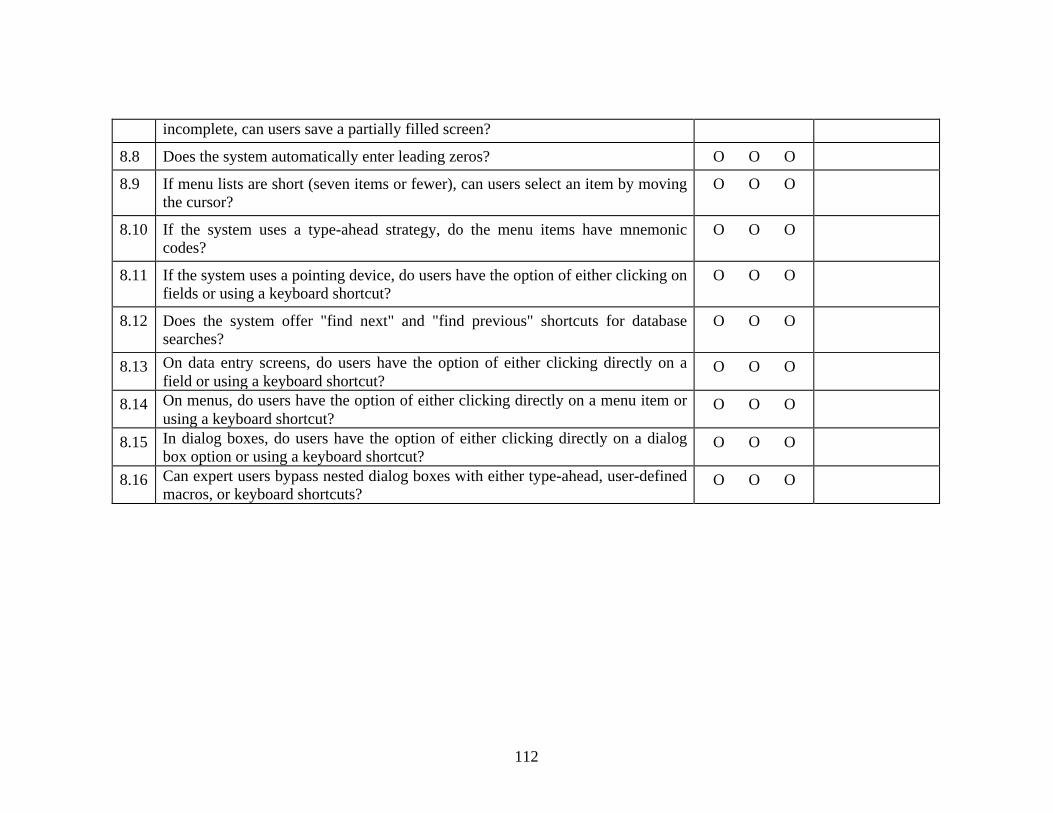
112
incomplete, can users save a partially filled screen?
8.8 Does the system automatically enter leading zeros? O O O
8.9 If menu lists are short (seven items or fewer), can users select an item by moving the cursor?
O O O
8.10 If the system uses a type-ahead strategy, do the menu items have mnemonic codes?
O O O
8.11 If the system uses a pointing device, do users have the option of either clicking on fields or using a keyboard shortcut?
O O O
8.12 Does the system offer "find next" and "find previous" shortcuts for database searches?
O O O
8.13 On data entry screens, do users have the option of either clicking directly on a field or using a keyboard shortcut?
O O O
8.14 On menus, do users have the option of either clicking directly on a menu item or using a keyboard shortcut?
O O O
8.15 In dialog boxes, do users have the option of either clicking directly on a dialog box option or using a keyboard shortcut?
O O O
8.16 Can expert users bypass nested dialog boxes with either type-ahead, user-defined macros, or keyboard shortcuts?
O O O
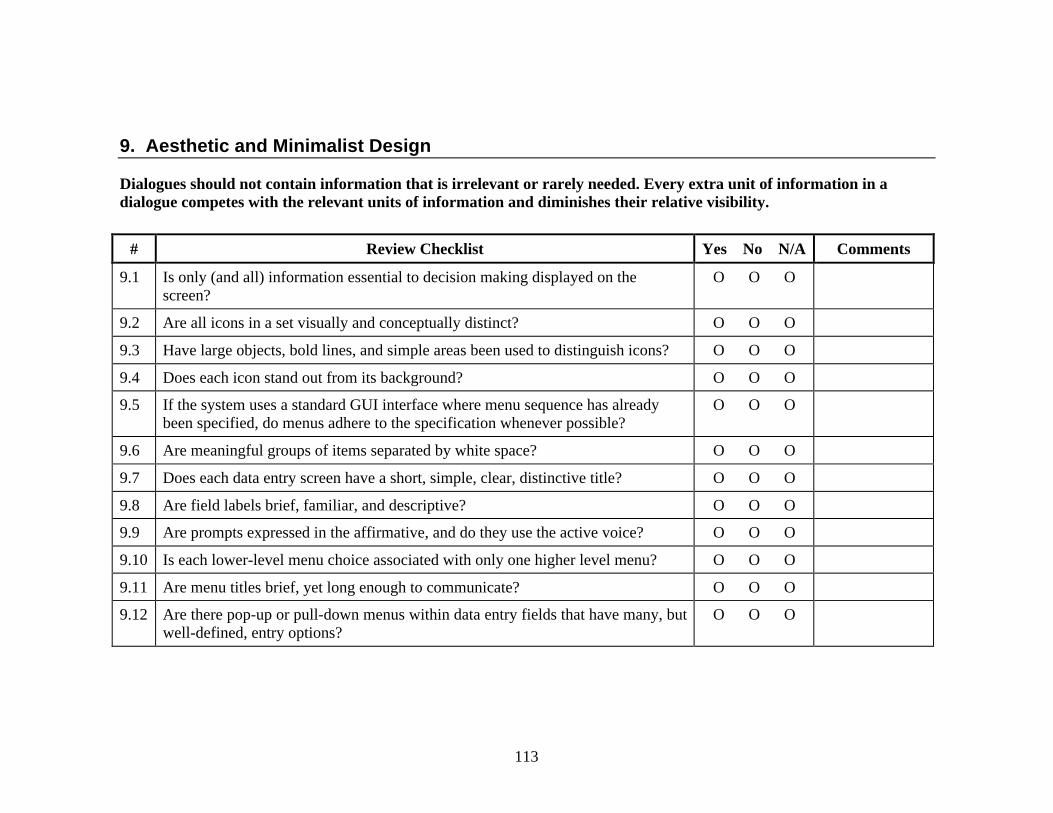
113
9. Aesthetic and Minimalist Design
Dialogues should not contain information that is irrelevant or rarely needed. Every extra unit of information in a dialogue competes with the relevant units of information and diminishes their relative visibility.
# Review Checklist Yes No N/A Comments
9.1 Is only (and all) information essential to decision making displayed on the screen?
O O O
9.2 Are all icons in a set visually and conceptually distinct? O O O
9.3 Have large objects, bold lines, and simple areas been used to distinguish icons? O O O
9.4 Does each icon stand out from its background? O O O
9.5 If the system uses a standard GUI interface where menu sequence has already been specified, do menus adhere to the specification whenever possible?
O O O
9.6 Are meaningful groups of items separated by white space? O O O
9.7 Does each data entry screen have a short, simple, clear, distinctive title? O O O
9.8 Are field labels brief, familiar, and descriptive? O O O
9.9 Are prompts expressed in the affirmative, and do they use the active voice? O O O
9.10 Is each lower-level menu choice associated with only one higher level menu? O O O
9.11 Are menu titles brief, yet long enough to communicate? O O O
9.12 Are there pop-up or pull-down menus within data entry fields that have many, but well-defined, entry options?
O O O
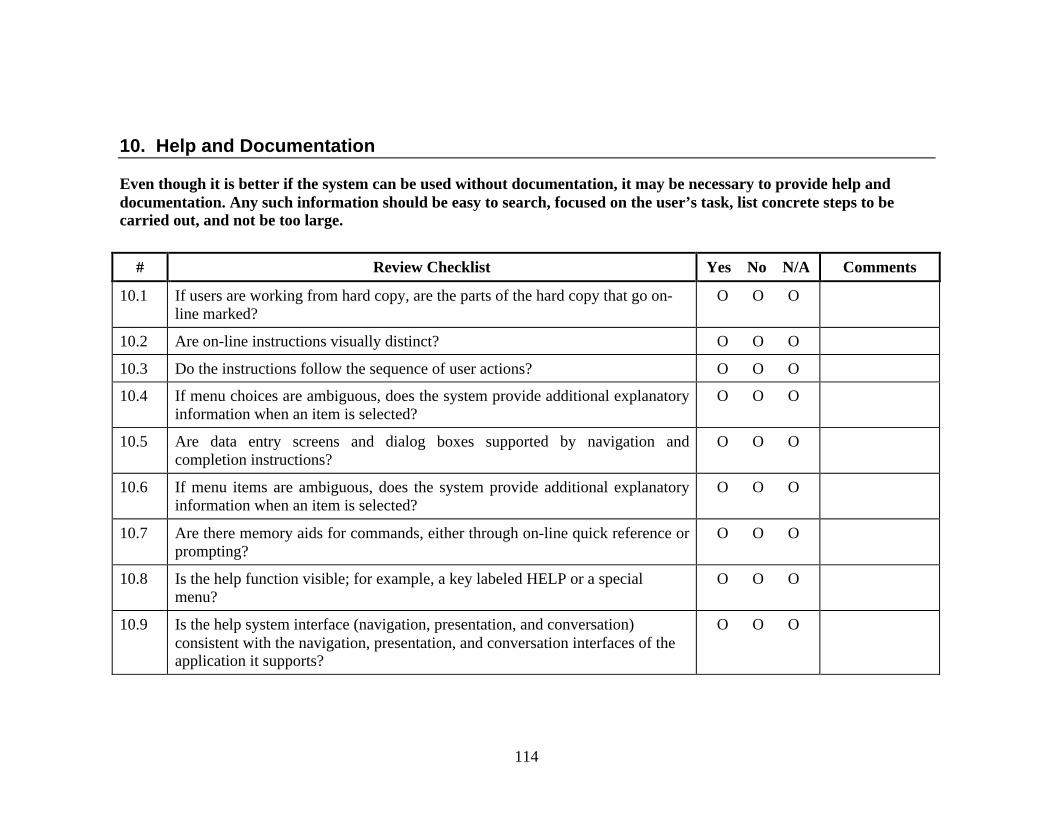
114
10. Help and Documentation
Even though it is better if the system can be used without documentation, it may be necessary to provide help and documentation. Any such information should be easy to search, focused on the user’s task, list concrete steps to be carried out, and not be too large.
# Review Checklist Yes No N/A Comments
10.1 If users are working from hard copy, are the parts of the hard copy that go on-line marked?
O O O
10.2 Are on-line instructions visually distinct? O O O
10.3 Do the instructions follow the sequence of user actions? O O O
10.4 If menu choices are ambiguous, does the system provide additional explanatory information when an item is selected?
O O O
10.5 Are data entry screens and dialog boxes supported by navigation and completion instructions?
O O O
10.6 If menu items are ambiguous, does the system provide additional explanatory information when an item is selected?
O O O
10.7 Are there memory aids for commands, either through on-line quick reference or prompting?
O O O
10.8 Is the help function visible; for example, a key labeled HELP or a special menu?
O O O
10.9 Is the help system interface (navigation, presentation, and conversation) consistent with the navigation, presentation, and conversation interfaces of the application it supports?
O O O
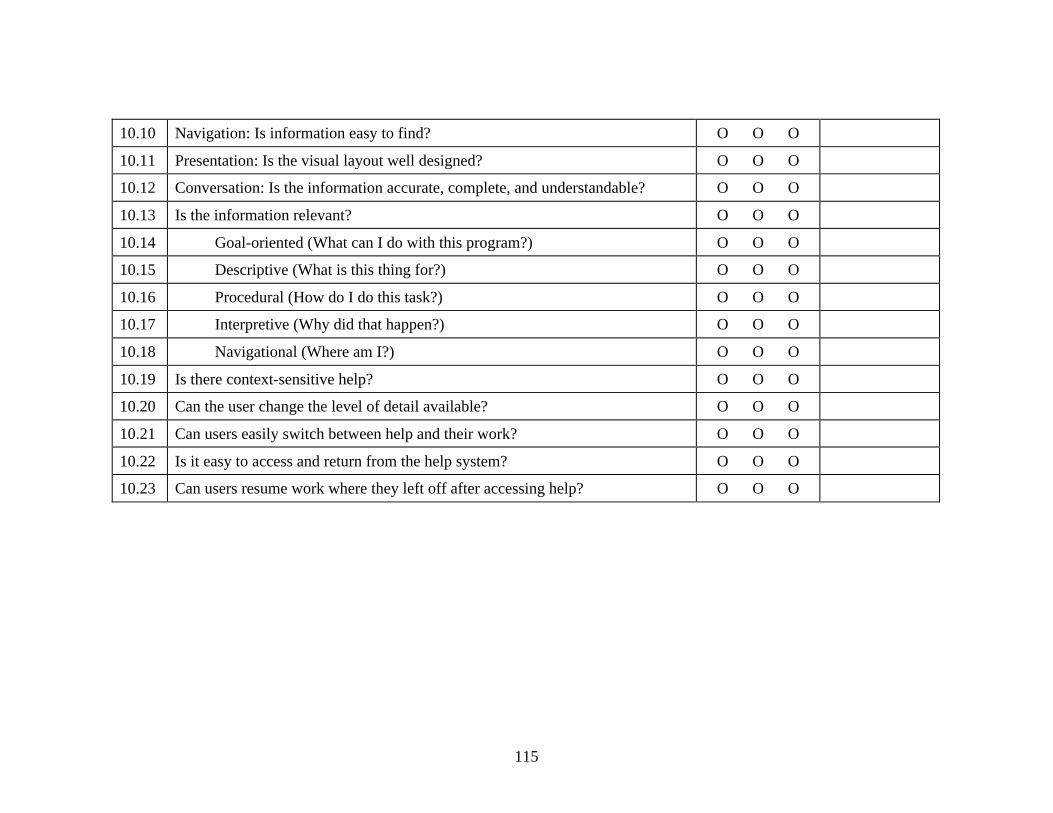
115
10.10 Navigation: Is information easy to find? O O O
10.11 Presentation: Is the visual layout well designed? O O O
10.12 Conversation: Is the information accurate, complete, and understandable? O O O
10.13 Is the information relevant? O O O
10.14 Goal-oriented (What can I do with this program?) O O O
10.15 Descriptive (What is this thing for?) O O O
10.16 Procedural (How do I do this task?) O O O
10.17 Interpretive (Why did that happen?) O O O
10.18 Navigational (Where am I?) O O O
10.19 Is there context-sensitive help? O O O
10.20 Can the user change the level of detail available? O O O
10.21 Can users easily switch between help and their work? O O O
10.22 Is it easy to access and return from the help system? O O O
10.23 Can users resume work where they left off after accessing help? O O O
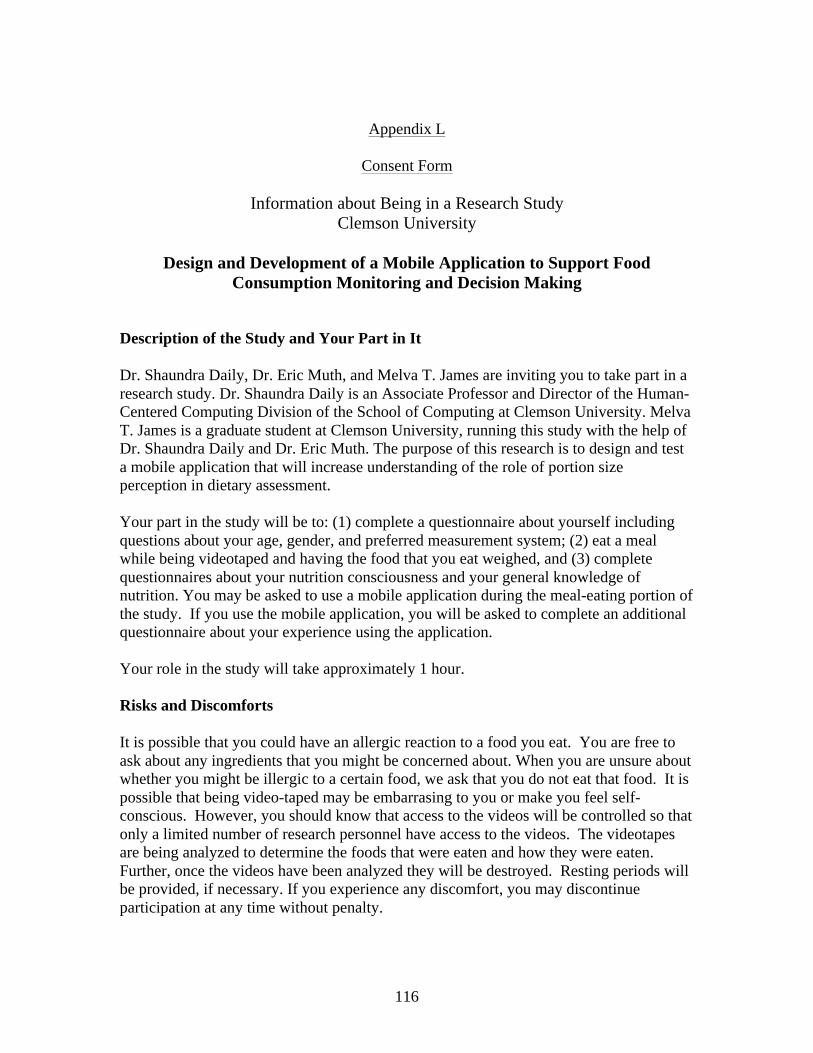
116
Appendix L
Consent Form
Information about Being in a Research Study Clemson University
Design and Development of a Mobile Application to Support Food
Consumption Monitoring and Decision Making
Description of the Study and Your Part in It Dr. Shaundra Daily, Dr. Eric Muth, and Melva T. James are inviting you to take part in a research study. Dr. Shaundra Daily is an Associate Professor and Director of the Human-Centered Computing Division of the School of Computing at Clemson University. Melva T. James is a graduate student at Clemson University, running this study with the help of Dr. Shaundra Daily and Dr. Eric Muth. The purpose of this research is to design and test a mobile application that will increase understanding of the role of portion size perception in dietary assessment. Your part in the study will be to: (1) complete a questionnaire about yourself including questions about your age, gender, and preferred measurement system; (2) eat a meal while being videotaped and having the food that you eat weighed, and (3) complete questionnaires about your nutrition consciousness and your general knowledge of nutrition. You may be asked to use a mobile application during the meal-eating portion of the study. If you use the mobile application, you will be asked to complete an additional questionnaire about your experience using the application. Your role in the study will take approximately 1 hour. Risks and Discomforts It is possible that you could have an allergic reaction to a food you eat. You are free to ask about any ingredients that you might be concerned about. When you are unsure about whether you might be illergic to a certain food, we ask that you do not eat that food. It is possible that being video-taped may be embarrasing to you or make you feel self-conscious. However, you should know that access to the videos will be controlled so that only a limited number of research personnel have access to the videos. The videotapes are being analyzed to determine the foods that were eaten and how they were eaten. Further, once the videos have been analyzed they will be destroyed. Resting periods will be provided, if necessary. If you experience any discomfort, you may discontinue participation at any time without penalty.

117
Possible Benefits The potential direct benefits to you are that you may receive a free meal or course credit for your participation in this study. If you receive extra course credit in the Psychology Department for participating in the subject pool, you should be aware that your instructors must also provide you with alternative assignments for extra credit instead of participating in the subject pool. Broader benefits of this research may include the creation of an effective mobile application to aid in the understanding of food consumption monitoring and decision making. Protection of Privacy and Confidentiality We will do everything we can to protect your privacy and confidentiality. Your name will not be associated with your data. We will collect demographic information in this study, and associated video and audio recordings will be used for research purposes only. The demographic and usability data provided by participants will be stored safely in a secured location. No demographic or usability response data will reside online or on any of the workstations. Once videotapes have been analyzed, they will be destroyed. We will not tell anybody outside of the research team that you were in this study or what information we collected about you in particular. We might be required to share the information we collect from you with the Clemson University Office of Research Compliance or the federal Office for Human Research Protections. If this happens, the information would only be used to find out if we ran this study properly and protected your rights in the study. Choosing to Be in the Study You do not have to be in this study. You may choose not to take part and you may choose to stop taking part at any time. You will not be punished in any way if you decide not to be in the study or to stop taking part in the study. If you choose to stop taking part in this study, the information you have already provided will be used in a confidential manner. Contact Information If you have any questions or concerns about this study or if any problems arise, please contact Dr. Shaundra Daily at Clemson University at 864-656-5778 or Dr. Eric Muth at Clemson University at 864-656-6741.

118
If you have any questions or concerns about your rights in this research study, please contact the Clemson University Office of Research Compliance (ORC) at 864-656-6460 or [email protected]. If you are outside of the Upstate South Carolina area, please use the ORC’s toll-free number, 866-297-3071.
Consent
I have read this form and have been allowed to ask any questions I might have. I agree to take part in this study.
Participant’s signature: __________________Date: _________________
A copy of this form will be given to you.

119
Appendix M
Protocol for Picture-Perfect Portions App and Calorie Consumption Goal Study
Recruitment 1. Participants will be recruited via flyers, advertisements, word of mouth, and the
SONA website.2. 8 participants will be recruited per session. 4 participants will be kept for the
experimental session with the remaining participant being given credit.a. This will help ensure that 4 participants are run at each session, even if
there is one drop out.b. This will help with balancing gender during the study.
Laboratory session Materials
• Consent form• Participant Notes Sheet• Demographics questionnaire• Relationship questionnaire• START Satiety Labeled Intensity Magnitude (SLIM) scale• END Satiety Labeled Intensity Magnitude (SLIM) scale• Labeled Affective Magnitude (LAM) scale• Self- control Scale• ASA24 instruction sheet• Large plate: Chinet Classic White Dinner Plate. 26.4cm diameter (Fig. 1).• Small plate: Chinet Classic White Appetizer and Dessert. 17cm diameter (Fig.2 ).• Hefty Everyday Easy Grip Cups. 532mL (Fig. 5).• 500ml liquid measuring cup.• Great Value White Plastic Forks (Fig. 6).• Great Value White Plastic Spoons (Fig 6).• Vanity Fair Everyday 2-ply Printed Napkins. Design Collection (Fig. 7).• Proctor Silex 18 quart Roaster Oven. Model 32190Y (Fig. 8)• Hot plates (2)• Oven mitts (2)• SkinTEK Powder Free Multi-Purpose Vinyl Gloves (Fig. 10).• Stouffer’s Party Size Macaroni and Cheese. 76 oz (4lb 12oz) 2.15kg (Fig. 11).
o About 10 servings per container. Serving size = 225g

120
o Calories per serving 330• Instrumented Eating Station
Reminder email.
1. 24 hours before each participant is scheduled to participate in the laboratorysession, send them the following e-mail:
Dear Participant,
This is a reminder for your participation in the Bite Counter Eating BehaviorStudy. You are scheduled for tomorrow (date) at (time). We will be meeting inBrackett Hall, Room 422. Remember, your height and weight will be measured,please wear or bring light clothing such as shorts, t-shirt, and socks for yourmeasurements. In addition please make sure you fast for three (3) hours leadingup to your scheduled session time. If you have any comments, questions, orconcerns, please feel free to contact Melva James at [email protected].
Sincerely,(Experimenter)
Food preparation 2. 1 hour and 25 minutes prior to the scheduled arrival of the participants, plug in the
roaster oven and set the temperature to 450 degrees Fahrenheit (450F) for pre-heating. Allow 15 minutes for the roaster oven to pre-heat.
a. Verify that the iPads are sufficiently charged during this time.3. After pre-heating the roaster oven, locate the macaroni and cheese in the freezer
and remove one box of 76oz Stouffer’s Party Size Macaroni and Cheese. Takethe aluminum macaroni and cheese container from the box.
4. Put on a pair of plastic gloves and remove the aluminum lid from the macaroniand cheese.
5. Using the scale on top of the computer cabinet, weigh the macaroni and cheeseprior to cooking and record the weight on the experimenter note sheet.
6. Using oven mitts, place the oven rack holding the macaroni and cheese into theroaster oven.
7. Set the timer for 60 minutes.8. Once the timer goes off and the 60 minute cook time is complete, Leave oven on.9. Leave macaroni and cheese in the oven until the participants are ready to serve
themselves.10. Before allowing the participants to serve themselves, weigh the macaroni and
cheese after cooking and record the weight on the experimenter note sheet.
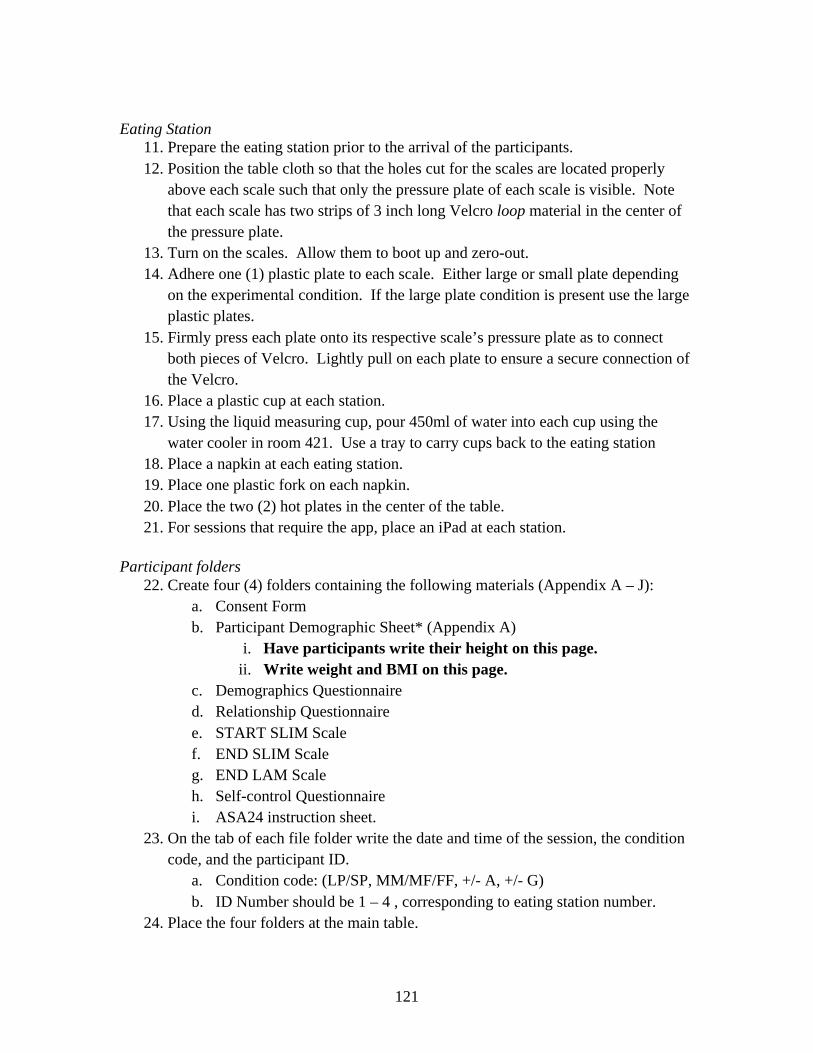
121
Eating Station 11. Prepare the eating station prior to the arrival of the participants.12. Position the table cloth so that the holes cut for the scales are located properly
above each scale such that only the pressure plate of each scale is visible. Notethat each scale has two strips of 3 inch long Velcro loop material in the center ofthe pressure plate.
13. Turn on the scales. Allow them to boot up and zero-out.14. Adhere one (1) plastic plate to each scale. Either large or small plate depending
on the experimental condition. If the large plate condition is present use the largeplastic plates.
15. Firmly press each plate onto its respective scale’s pressure plate as to connectboth pieces of Velcro. Lightly pull on each plate to ensure a secure connection ofthe Velcro.
16. Place a plastic cup at each station.17. Using the liquid measuring cup, pour 450ml of water into each cup using the
water cooler in room 421. Use a tray to carry cups back to the eating station18. Place a napkin at each eating station.19. Place one plastic fork on each napkin.20. Place the two (2) hot plates in the center of the table.21. For sessions that require the app, place an iPad at each station.
Participant folders 22. Create four (4) folders containing the following materials (Appendix A – J):
a. Consent Formb. Participant Demographic Sheet* (Appendix A)
i. Have participants write their height on this page.ii. Write weight and BMI on this page.
c. Demographics Questionnaired. Relationship Questionnairee. START SLIM Scalef. END SLIM Scaleg. END LAM Scaleh. Self-control Questionnairei. ASA24 instruction sheet.
23. On the tab of each file folder write the date and time of the session, the conditioncode, and the participant ID.
a. Condition code: (LP/SP, MM/MF/FF, +/- A, +/- G)b. ID Number should be 1 – 4 , corresponding to eating station number.
24. Place the four folders at the main table.

122
Participants 25. Greet the participants26. Upon the participants’ arrival, introduce yourself and thank them again for their
participation.27. Give a brief over view of the proceedings. Say the following: “I am going to
give you a quick overview of what we will be doing today. First, we will takea few basic body measurements and fill out a few pre-meal questionnairesand scales. We will then instruct you on how to use the iPad and/or goalinformation. You will then be allowed to eat the macaroni and cheese. Afterthe meal, we will fill out a few more questionnaires and scales. We willdebrief you, and you will be free to leave.”
28. Direct the participants to file folder containing the consent form. Instruct them toread it, initial each page and sign and date the last page of the form. Say thefollowing: “Some things on the form may not apply to you. If you have anyquestions feel free to ask.”
29. Once the participant has finished reading and signing the consent form begin thebody measurements.
30. Measure height (to the nearest ¼ inch – only if they don’t know it) and weight (tothe nearest ½ pound) using the Tanita WB-3000 scale. Record all measurementson the Participant Demographic Sheet. To take the measurements, perform thefollowing:
NOTE: Take all height and weight measurements with participant in stocking or bare feet.
Say the following: “To help us get accurate measurements, please remove all extraneous objects from your pockets. Such items may include keys and cell phones. In addition, remove your shoes, if you feel comfortable doing so. Bring your Participant Demographic Sheet with you when you approach the scale.”
a. Power on the device, and wait for it to start up and zero itself.b. To measure weight and BMI:
i. Ask the participant to step onto the scale.ii. Wait for the “beep.”
iii. Record the weight.iv. Ask the participant to step off of the scale.v. Press the BMI button.
vi. Enter the participant’s height in feet and inches.
123
vii. Press the BMI button.viii. Record the participant’s BMI.
c. To measure height:i. Extend the stadiometer so that it is above the participant’s head.
ii. Ask the participant to step onto the scale with their back to thestadiometer.
iii. Level the stadiometer with the participant’s head, and recordheight and weight.
iv. Measure height to the nearest quarter inch.31. Give each participant the Demographics Questionnaire (Appendix B). Say the
following: “Please answer the questions to the best of your ability.”32. Give each participant the relationship questionnaire (Appendix C). Say the
following: “This form is to collect information regarding any possiblerelationships you may have with the other participants. If you have anyquestions feel free to ask.”
33. Upon completion of the above steps, direct each participant to the eating stationand sit them at their pre-assigned station.
34. Instruct the participants on the use of the app. Say the following:a. “If the screen iPad at your station is blank. Press the circular home
button at the edge of the device.”b. “Touch the screen and swipe to the right to unlock it.”c. “Once the home screen appears, find the Portions 1 icon and click it to
open the app.”d. “Before you begin eating, you will use the app to take a bird’s eye
view photo of your meal.”e. The app will guide you through a process that ends with the
illustration of a single serving of macaroni and cheese.”35. Give the participants the following instruction:
a. Depending on the experimental condition say either “You are free toserve yourself as much as you want. After you serve your desiredportion please wait until instructed before eating.”
b. Then say: “You are free to eat as much macaroni and cheese as youwant” (instruction not given), or “Please eat the number of caloriesassigned to you on your paper” (instruction given).
c. “There are scales beneath your trays that are measuring the weightchange in your food. We ask that if you set your utensil down, pleaseset it on the napkin beside your plate. Also, please try to keep yourhands off of the plate.”

124
d. “Please note that there is sensitive equipment and wiring on theunderside of the table. Please try to avoid jolting the table with yourknees.”
e. “If you would like more at any point, please let us know, so we canrecord the appropriate weights.”
f. “Again, you may serve yourself as much as you want. Also, feel freeto talk to one another during the meal. We want your eatingexperience to be as comfortable and as natural as possible.”
36. Using oven mitts, remove the macaroni and cheese from the roaster oven usingthe handles on the oven rack.
37. Weigh the macaroni and cheese after cooking and record the weight on theexperimenter not sheet
38. Place the macaroni and cheese on the hot plates in the middle of the eating station.39. Place the serving spoon into the macaroni and cheese.40. Give the participants the START SLIM (Appendix D) scale. Say the following:
“This scale indexes how hungry or full you feel currently, please mark itappropriately.”
41. Instruct the participants to serve themselves. Note: if in the instruction not givencondition, remind them that they can eat as much as they want. If the instructiongiven condition is present remind them to eat the number of calories assigned tothem on their paper.
42. Once the participants serve their food, record the appropriate weights.a. Record the pre-meal weight on experimenter note sheet (Wet+Plastic)
43. Make a note of any problems or anomalies that arise.44. Monitor the equipment to make sure that everything is running as it should be.45. If the participant finishes or wants to get seconds (or thirds), ask them to pause for
instructions.a. Record post meal or course (Waste+Plastic) weight on the experimenter
note sheet.46. Resume the data recording when the participant returns with seconds or thirds.47. Once all participants indicate completing the meal direct them back to the main
table.48. Give the participants the END SLIM (Appendix E) scale. Say the following:
“This scale is identical to the one you filled out before the meal. Again, itindexes how hungry or full you feel currently, please mark it appropriately.”
49. Give the participants the END LAM (Appendix F) scale. Say the following:“This scale indexes how much you liked the food. Please markappropriately.”

125
50. Instruct the participants to complete the Self-Control Scale (Appendix G) on a 1-7strongly disagree / strongly agree Likert scale. Say the following: “Thisquestionnaire has 20 items and uses a 1-7 Likert scale response system.Please read each item carefully and complete the scale appropriately.”
51. Instruct the participants to complete the Nutrition Knowledge Questionnaire(Appendix H). Say the following: “This questionnaire indexes your generalnutrition knowledge. Please answer the questions to the best of your ability.”
52. Instruct the participants to complete the Nutrition Consciousness Questionnaire(Appendix I). Say the following: “This questionnaire indexes your nutritionconsciousness. Please answer the questions to the best of your ability.”
53. Instruct the participants to complete the System Usability Scale (Appendix J). Saythe following: “This scale indexes your experience with using the app. Thisquestionnaire has 10 items and uses a 1-5 Likert scale response system.Please read each item carefully and complete the scale appropriately.”
54. Once the participants have completed all of the post meal scales, collect thepapers and return to the participants file folder.
55. Offer a copy of the consent form to the participants to take home is desired.56. Debrief the participants. Say the following: “The purpose of this study was to
determine if individuals will use feedback from the Picture-Perfect Portionsapp on portion size and calorie intake to change their behavior during thecourse of a single meal. Particularly, this study was interested indetermining if feedback from the app provided a more powerfulenvironmental cue to stop eating than the known environmental cue of platesize is to overeat. Any questions?”
57. Thank the participants and dismiss them, reminding them not to discuss any of thedetails of the experiments with others.
58. Once the session is finished, weigh the leftover macaroni and cheese and recordweight on experimenter note sheet.
59. Clear the table. Throw away aluminum macaroni and cheese container, plates,cups, napkins, and utensils.
Computer Boot-up 1. Unlock the cabinet and boot up both laptops.2. The password for each laptop is “tiger5”.3. Click “EatStat.exe”. This is the program that monitors the bite count and the
scale data.4. Click “Start” then “Record.” This will not actually begin recording data; it will
just begin monitoring the devices. (Do this on each laptop)

126
5. Clicking “Record” will open a new window showing the video from two of thefour cameras. The top laptop will show stations 1 and 2, and the bottom laptopwill show stations 3 and 4:
Station 1 Station 2 (Blank) (Blank)
(Blank) (Blank) Station 3 Station 4
a. Make sure that each camera is focused on the correct station.
If there are any errors, close all windows and restart them. If this does not fix the problem, contact the graduate assistant.
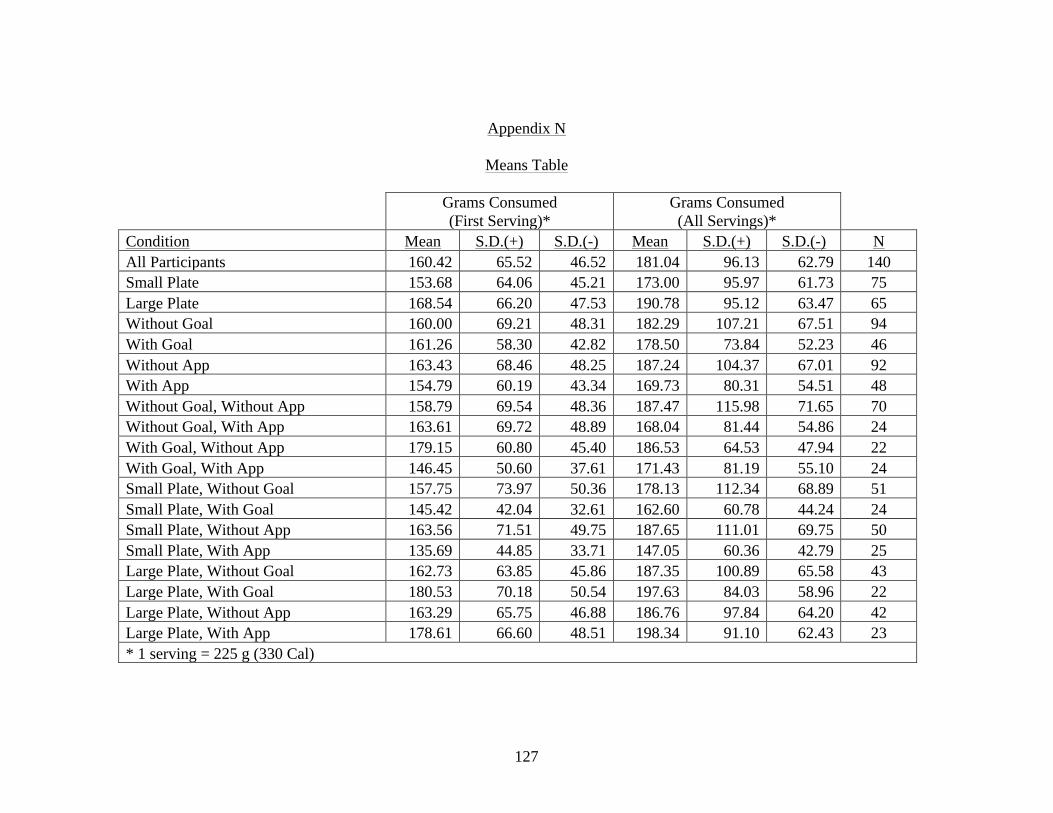
127
Appendix N
Means Table
!
Grams Consumed (First Serving)*
Grams Consumed (All Servings)*
Condition Mean S.D.(+) S.D.(-) Mean S.D.(+) S.D.(-) N All Participants 160.42 65.52 46.52 181.04 96.13 62.79 140 Small Plate 153.68 64.06 45.21 173.00 95.97 61.73 75 Large Plate 168.54 66.20 47.53 190.78 95.12 63.47 65 Without Goal 160.00 69.21 48.31 182.29 107.21 67.51 94 With Goal 161.26 58.30 42.82 178.50 73.84 52.23 46 Without App 163.43 68.46 48.25 187.24 104.37 67.01 92 With App 154.79 60.19 43.34 169.73 80.31 54.51 48 Without Goal, Without App 158.79 69.54 48.36 187.47 115.98 71.65 70 Without Goal, With App 163.61 69.72 48.89 168.04 81.44 54.86 24 With Goal, Without App 179.15 60.80 45.40 186.53 64.53 47.94 22 With Goal, With App 146.45 50.60 37.61 171.43 81.19 55.10 24 Small Plate, Without Goal 157.75 73.97 50.36 178.13 112.34 68.89 51 Small Plate, With Goal 145.42 42.04 32.61 162.60 60.78 44.24 24 Small Plate, Without App 163.56 71.51 49.75 187.65 111.01 69.75 50 Small Plate, With App 135.69 44.85 33.71 147.05 60.36 42.79 25 Large Plate, Without Goal 162.73 63.85 45.86 187.35 100.89 65.58 43 Large Plate, With Goal 180.53 70.18 50.54 197.63 84.03 58.96 22 Large Plate, Without App 163.29 65.75 46.88 186.76 97.84 64.20 42 Large Plate, With App 178.61 66.60 48.51 198.34 91.10 62.43 23 * 1 serving = 225 g (330 Cal)

128
Means Table (Continued)
!
Grams Consumed (First Serving)*
Grams Consumed (All Servings)*
Condition Mean S.D.(+) S.D.(-) Mean S.D.(+) S.D.(-) N
Small Plate, Without Goal, Without App 166.13 80.35 54.16 193.68 126.76 76.62 39 Small Plate, Without Goal, With App 133.29 47.80 35.18 135.75 52.20 37.70 12 Small Plate, With Goal, Without App 154.75 38.25 30.67 167.79 53.77 40.72 11 Small Plate, With Goal, With App 137.95 43.92 33.31 158.32 67.85 47.50 13 Large Plate, Without Goal, Without App 149.99 55.88 40.72 179.94 104.38 66.06 31 Large Plate, Without Goal, With App 200.84 64.64 48.90 207.99 86.69 61.19 12 Large Plate, With Goal, Without App 207.37 69.43 52.02 207.37 69.43 52.02 11 Large Plate, With Goal, With App 157.17 58.72 42.75 188.33 97.86 64.40 11 * 1 serving = 225 g (330 Cal)
129
WORKS CITED
Amft, O., & Tröster, G. (2008). Recognition of dietary activity events using on-body sensors. Artificial Intelligence in Medicine, 42(2), 121–136. doi:10.1016/j.artmed.2007.11.007
Apple. (2011). Figwee Portion Explorer on the App Store on iTunes. Apple, Inc. Retrieved April 1, 2015, from https://itunes.apple.com/us/app/figwee-portion-explorer/id435839234
Bangor, A., Kortum, P. T., & Miller, J. T. (2008). An Empirical Evaluation of the System Usability Scale. International Journal of Human-Computer Interaction, 24(March 2015), 574–594. doi:10.1080/10447310802205776
Baumer, E. P. E., Katz, S. J. S., Freeman, J. E. J., Adams, P., Gonzales, A. L., Pollak, J., … Gay, G. K. (2012). Prescriptive persuasion and open-ended social awareness: Expanding the design space of mobile health. Proceedings of the ACM 2012 Conference on Computer Supported Cooperative Work, 475–484. doi:10.1145/2145204.2145279
Beaudin, J. S., Intille, S. S., & Morris, M. E. (2006). To track or not to track: User reactions to concepts in longitudinal health monitoring. Journal of Medical Internet Research, 8(4). doi:10.2196/jmir.8.4.e29
Bennett, S., Maton, K., & Kervin, L. (2008). The “digital natives” debate: A critical review of the evidence. British Journal of Educational Technology, 39(5), 775–786. doi:10.1111/j.1467-8535.2007.00793.x
Brooke, J. (1996). SUS: a “quick and dirty” usability scale. In P. W. Jordan, B. Thomas, B. A. Weerdmeester, & I. L. McClelland (Eds.), Usability Evaluation In Industry (pp. 189–194). London: Taylor & Francis.
Brug, J., Oenema, A., Kroeze, W., & Raat, H. (2005). The internet and nutrition education: challenges and opportunities. European Journal of Clinical Nutrition, 59 Suppl 1, S130–S137; discussion S138–S139. doi:10.1038/sj.ejcn.1602186
Cason, K. (2013). EFNEP Home. Retrieved from http://www.clemson.edu/efnep/
Chang, K. H., Liu, S. Y., Chu, H. H., Hsu, J. Y. J., Chen, C., Lin, T. Y., … Huang, P. (2006). The diet-aware dining table: Observing dietary behaviors over a tabletop surface. In Lecture Notes in Computer Science (including subseries Lecture Notes in

130
Artificial Intelligence and Lecture Notes in Bioinformatics) (Vol. 3968 LNCS, pp. 366–382). Springer. doi:10.1007/11748625_23
Chen, N., Lee, Y. Y., Rabb, M., & Schatz, B. (2010). Toward Dietary Assessment via Mobile Phone Video Cameras. AMIA Annual Symposium Proceedings, 2010, 106–110. Retrieved from www.ncbi.nlm.nih.gov/pmc/articles/PMC3041289/
Chou, S.-Y., Grossman, M., & Saffer, H. (2004). An economic analysis of adult obesity: results from the Behavioral Risk Factor Surveillance System. Journal of Health Economics, 23(3), 565–587. doi:10.1016/j.jhealeco.2003.10.003
Clemson University Office of Institutional Research. (2012a). Clemson University 2012-13 Common Data Set. Clemson University. Retrieved from http://www.clemson.edu/oirweb1/FB/factbook/CommonDataSet2012.pdf
Clemson University Office of Institutional Research. (2012b). Clemson University Factbook and Data Center. Clemson University. Retrieved from http://www.clemson.edu/oirweb1/fb/factBook/
Cole-Lewis, H., & Kershaw, T. (2010). Text messaging as a tool for behavior change in disease prevention and management. Epidemiologic Reviews, 32, 56–69. doi:10.1093/epirev/mxq004
Consolvo, S., Everitt, K., Smith, I., & Landay, J. A. (2006). Design requirements for technologies that encourage physical activity. In Proceedings of the SIGCHI conference on Human Factors in computing systems - CHI ’06 (pp. 457–466). doi:10.1145/1124772.1124840
Consolvo, S., McDonald, D. W., Toscos, T., Chen, M. Y., Froehlich, J., Harrison, B., … Landay, J. a. (2008). Activity sensing in the wild: a field trial of ubifit garden. Proceedings of the SIGCHI Conference on Human Factors in Computing Systems (CHI ’08), 1797–1806. doi:10.1145/1357054.1357335
Contento, I. R. (2011). Nutrition Education: Linking Research, Theory, And Practice (2nd ed.). Sudbury, MA, USA: Jones and Bartlett Publishers, LLC. Retrieved from http://www.amazon.com/Nutrition-Education-Linking-Research-Practice/dp/0763775088/ref=asap_bc?ie=UTF8
Contento, I. R., Randell, J. S., & Basch, C. E. (2002). Review and Analysis of Evaluation Measures Used in Nutrition Education Intervention Research. Journal of Nutrition Education and Behavior, 34(1), 2–25. doi:10.1016/S1499-4046(06)60220-0

131
Diliberti, N., Bordi, P. L., Conklin, M. T., Roe, L. S., & Rolls, B. J. (2004). Increased portion size leads to increased energy intake in a restaurant meal. Obesity Research, 12(3), 562–568. doi:10.1038/oby.2004.64
Division of Nutrition and Physical Activity. (2006). Research to Practice Series, No. 1. Atlanta, GA.
Dong, Y., Hoover, A., Scisco, J., & Muth, E. (2012). A new method for measuring meal intake in humans via automated wrist motion tracking. Applied Psychophysiology Biofeedback, 37(3), 205–215. doi:10.1007/s10484-012-9194-1
Eknoyan, G. (2008). Adolphe Quetelet (1796-1874) - The average man and indices of obesity. Nephrology Dialysis Transplantation, 23(September 2007), 47–51. doi:10.1093/ndt/gfm517
Ello-Martin, J. A., Roe, L. S., Meengs, J. S., Wall, D. E., & Robinson, T. E. (2002). Increasing the portion size of a unit food increases energy intake. Appetite, 39(3), 367 – 372.
Eysenck, H. J. (1988, January). Ongoing research. Personality and Individual Differences. doi:10.1016/0191-8869(88)90080-3
Faul, F., Erdfelder, E., Buchner, A., & Lang, A.-G. (2009). Statistical power analyses using G* Power 3.1: Tests for correlation and regression analyses. Behavior Research Methods, 41, 1149–1160. doi:10.3758/BRM.41.4.1149
Faul, F., Erdfelder, E., Lang, A.-G., & Buchner, A. (2007). G * Power 3!: A flexible statistical power analysis program for the social , behavioral , and biomedical sciences. Behavior Research Methods, 39(2), 175–191. doi:10.3758/bf03193146
Finkelstein, E. A., Ruhm, C. J., & Kosa, K. M. (2005). Economic causes and consequences of obesity. Annual Review of Public Health, 26, 239–257. doi:10.1146/annurev.publhealth.26.021304.144628
Flegal, K. M., Carroll, M. D., Ogden, C. L., & Curtin, L. R. (2010). Prevalence and trends in obesity among US adults, 1999-2008. JAMA!: The Journal of the American Medical Association, 303(3), 235–241. doi:10.1016/S0739-5930(10)79493-9
Food and Nutrient Intakes by Individuals in the United States by Sex and Age, 1994-96. USDA Nationwide Food Surveys Report No. 96-2. (1998).
Food Labeling: Serving Sizes of Foods That Can Reasonably Be Consumed at One-Eating Occasion; Dual-Column Labeling; Updating, Modifying, and Establishing
132
Certain Reference Amounts Customarily Consumed (Proposed Rule). , 79 Federal Register 11989 –12029. United States.
Freire, P. (1970). Pedagogy of the Oppressed: 30th Anniversary Edition. New York, NY, USA: The Continuum International Publishing Group, Inc.
Garrow, J. S., & Webster, J. (1985). Quetelet’s index (W/H2) as a measure of fatness. International Journal of Obesity, 9(2), 147–153.
Grimes, A., Bednar, M., Bolter, J. D., Grinter, R. E., & Atlanta, C. S. (2008). EatWell!: Sharing Nutrition-Related Memories in a Low-Income Community. In Proceedings of the 2008 ACM conference on Computer supported cooperative work (pp. 87–96). San Diego, CA USA: ACM. doi:10.1145/1460563.1460579
Grimes, A., Kantroo, V., & Grinter, R. E. (2010). Let’s play!: mobile health games for adults. Proceedings of the 12th ACM International Conference on Ubiquitous Computing, 241–250. doi:10.1145/1864349.1864370
Grimes, A., Landry, B. M., & Grinter, R. E. (2010). Characteristics of shared health reflections in a local community. Proceedings of the 2010 ACM Conference on Computer Supported Cooperative Work, 435–444. doi:10.1145/1718918.1718992
Haapala, I., Barengo, N. C., Biggs, S., Surakka, L., & Manninen, P. (2009). Weight loss by mobile phone: a 1-year effectiveness study. Public Health Nutrition, 12(12), 2382–2391. doi:10.1017/S1368980009005230
Israel, B. A., Checkoway, B., Schulz, A., & Zimmerman, M. (1994). Health Education and Community Empowerment: Conceptualizing and Measuring Perceptions of Individual, Organizational, and Community Control. Health Education & Behavior, 21(2), 149–170. doi:10.1177/109019819402100203
Istepanaian, R. S. H., & Zhang, Y.-T. (2012). Guest editorial. Introduction to the special section: 4G Health--the long-term evolution of m-Health. IEEE Transactions on Information Technology in Biomedicine!: A Publication of the IEEE Engineering in Medicine and Biology Society, 16(1), 1–5. doi:10.1109/TITB.2012.2183269
Istepanian, R. S. H., Jovanov, E., & Zhang, Y. T. (2004). Introduction to the special section on m-Health: Beyond seamless mobility and global wireless health-care connectivity. IEEE Transactions on Information Technology in Biomedicine, 8(4), 405–414. doi:10.1109/TITB.2004.840019
James, M. T. (2013). Picture-Perfect Plate: A Culturally Relevant Mobile Health App.

133
CRA-W Grad Cohort. Boston, MA, USA.
James, M. T., & Daily, S. B. (2014). Design of a Mobile Application to Support Food Consumption Monitoring and Decision Making. ACM Richard Tapia Celebration of Diversity in Computing. Seattle, WA, USA.
Jasper, P. (2014). Using the Bite Counter to Overcome the Effect of Plate Size on Food Intake. Clemson University. Retrieved from http://tigerprints.clemson.edu/all_theses/1841
Jeffery, R. W., & French, S. a. (1998). Epidemic obesity in the United States: Are fast foods and television viewing contributing? American Journal of Public Health, 88, 277–280. doi:10.2105/AJPH.88.2.277
Jelalian, E., & McCullough, M. B. (2012). Accelerating Progress in Obesity Prevention: Solving the Weight of the Nation. (D. Glickman, L. Parker, L. J. Sim, H. D. V. Cook, & E. A. Miller, Eds.)American Journal of Lifestyle Medicine. Washington, DC, USA: The National Academies Press. doi:10.1177/1559827612458633
Klasnja, P., & Pratt, W. (2012). Healthcare in the pocket: Mapping the space of mobile-phone health interventions. Journal of Biomedical Informatics, 45(1), 184–198. doi:10.1016/j.jbi.2011.08.017
Krebs, P., Prochaska, J. O., & Rossi, J. S. (2010). A meta-analysis of computer-tailored interventions for health behavior change. Preventive Medicine, 51(3-4), 214–221. doi:10.1016/j.ypmed.2010.06.004
Lakdawalla, D., & Philipson, T. (2002). The growth of obesity and technological change: A theoretical and empirical examination. Economics and human biology (Vol. 7). doi:10.1016/j.ehb.2009.08.001
Laskowski, A. (2010). Measuring Calories on the iPhone. BU Today. Retrieved April 2, 2015, from http://www.bu.edu/today/2010/measuring-calories-on-the-iphone/
Laxminarayan, S., & Istepanian, R. S. (2000). UNWIRED E-MED: the next generation of wireless and internet telemedicine systems. IEEE Transactions on Information Technology in Biomedicine!: A Publication of the IEEE Engineering in Medicine and Biology Society, 4(3), 189–193. doi:10.1109/TITB.2000.5956074
Martin, C. K., Correa, J. B., Han, H., Allen, H. R., Rood, J. C., Champagne, C. M., … Bray, G. A. (2012). Validity of the Remote Food Photography Method (RFPM) for estimating energy and nutrient intake in near real-time. Obesity (Silver Spring, Md.),

134
20(4), 891–9. doi:10.1038/oby.2011.344
Martin, C. K., Han, H., Coulon, S. M., Allen, H. R., Champagne, C. M., & Anton, S. D. (2009). A novel method to remotely measure food intake of free-living individuals in real time: the remote food photography method. The British Journal of Nutrition, 101(3), 446–56. doi:10.1017/S0007114508027438
Mokdad, A. H., Ford, E. S., Bowman, B. A., Dietz, W. H., Vinicor, F., Bales, V. S., & Marks, J. S. (2003). Prevalence of Obesity, Diabetes, and Obesity-Related Health Risk Factors, 2001. JAMA: The Journal Of The American Medical Association, 289(1), 76–79.
Mokdad, A. H., Serdula, M. K., Dietz, W. H., Bowman, B. A., Marks, J. S., & Koplan, J. P. (1999). The spread of the obesity epidemic in the United States, 1991-1998. JAMA!: The Journal of the American Medical Association, 282(16), 1519–1522. doi:10.1001/jama.282.16.1519
Molich, R., & Nielsen, J. (1990). Improving a human-computer dialogue. Communications of the ACM. doi:10.1145/77481.77486
National Center For Education Statistics. (2007). Digest of Education Statistics. Statistics, 114(2), 215. doi:10.5860/CHOICE.51-5366
Nayga, R. M. (2014). of Food Label Use on The Effect Intakes!: An Endogenous Nutrient Regression Analysis Switching. Journal of Agricultural and Resource Economics, 25(1), 215–231.
Nelson, M. C., Story, M., Larson, N. I., Neumark-Sztainer, D., & Lytle, L. a. (2008). Emerging adulthood and college-aged youth: an overlooked age for weight-related behavior change. Obesity, 16(10), 2205–2211. doi:10.1038/oby.2008.365
Newton, K. H., Wiltshire, E. J., & Elley, C. R. (2009). Pedometers and text messaging to increase physical activity: Randomized controlled trial of adolescents with type 1 diabetes. Diabetes Care, 32(5), 813–815. doi:10.2337/dc08-1974
NHLBI Obesity Education Initiative Expert Panel on the Identification Evaluation and Treatment of Overweight and Obesity in Adults. (1998). Clinical Guidelines on the Identification, Evaluation, and Treatment of Overweight and Obesity in Adults - The Evidence Report. Obesity Research (Vol. 6). doi:10.1001/jama.2012.39
Nielsen, J. (1994). Enhancing the explanatory power of usability heuristics. Conference Companion on Human Factors in Computing Systems CHI 94, 152–158.

135
doi:10.1145/191666.191729
Nielsen, J., Molich, R., & Ballerup, D.-. (1990). Heuristic Evaluation of user interfaces. Chi’90, (April), 249–256. doi:10.1145/97243.97281
Nielsen, S. J., & Popkin, B. M. (2013). Patterns and trends in food portion sizes, 1977-1998. JAMA!: The Journal of the American Medical Association, 289(4), 450–453. doi:10.1001/jama.289.4.450
Norman, G. J., Zabinski, M. F., Adams, M. a., Rosenberg, D. E., Yaroch, A. L., & Atienza, A. a. (2007). A Review of eHealth Interventions for Physical Activity and Dietary Behavior Change. American Journal of Preventive Medicine, 33(4). doi:10.1016/j.amepre.2007.05.007
Noronha, J., Hysen, E., Zhang, H., & Gajos, K. Z. (2011). PlateMate: Crowdsourcing nutrition analysis from food photographs. Proceedings of the 24th Annual ACM Symposium on User Interface Software and Technology, 1–12. doi:10.1145/2047196.2047198
Nutrition Labeling of Food, 21 C. F. R. § 101 (1993).
Pao, E. M., Fleming, K. H., Guenther, P. M., & Mickle, S. J. (1982). Foods commonly eaten by individuals: amount per day and per eating occasion (Vol. 44). Hyattsville, Maryland, USA.
Parker, A. G., Harper, R., & Grinter, R. E. (2011). Celebratory health technology. Journal of Diabetes Science and Technology, 5(2), 319–324.
Pinzon, O. E., & Iyengar, M. S. (2012). Persuasive Technology And Mobile Health: A Systematic Review. Persuasive Technology, 45.
Portnoy, D. B., Scott-Sheldon, L. a J., Johnson, B. T., & Carey, M. P. (2008). Computer-delivered interventions for health promotion and behavioral risk reduction: A meta-analysis of 75 randomized controlled trials, 1988-2007. Preventive Medicine, 47, 3–16. doi:10.1016/j.ypmed.2008.02.014
Pudel, V. E., & Oetting, M. (1977). Eating in the laboratory: behavioural aspects of the positive energy balance. International Journal of Obesity, 1(4), 369–386.
Resnick, M., & Silverman, B. (2005). Some reflections on designing construction kits for kids. In Proceeding of the 2005 conference on Interaction design and children - IDC ’05 (pp. 117–122). doi:10.1145/1109540.1109556
Rolls, B. J. (2003). The Supersizing of America. Nutrition Today. doi:10.1097/00017285-
136
200303000-00004
Rolls, B. J., Morris, E. L., & Roe, L. S. (2002). Portion size of food affects energy intake in normal-weight and. The American Journal of Clinical Nutrition, 76, 1207–1213.
Rolls, B. J., Roe, L. S., Kral, T. V. E., Meengs, J. S., & Wall, D. E. (2004). Increasing the portion size of a packaged snack increases energy intake in men and women. Appetite, 42(1), 63–69. doi:10.1016/S0195-6663(03)00117-X
Rolls, B. J., Roe, L. S., Meengs, J. S., & Wall, D. E. (2004). Increasing the portion size of a sandwich increases energy intake. Journal of the American Dietetic Association, 104(3), 367–372. doi:10.1016/j.jada.2003.12.013
Saperstein, S. L. S., Atkinson, N. L. N., & Gold, R. S. R. (2007). The impact of Internet use for weight loss. Obesity Reviews, 8(5), 459–465. doi:10.1111/j.1467-789X.2007.00374.x
Serving Sizes and Portions. (2013). National Heart, Lung, and Blood Institute. Retrieved March 30, 2015, from http://www.nhlbi.nih.gov/health/educational/wecan/eat-right/distortion.htm
Smith, B. Y. A., Rainie, L. E. E., & Zickuhr, K. (2014). College students and technology. Pew Internet & American Life Project, 1–5.
The American College Health Association. (2009). American College Health Association National College Health Assessment Spring 2008 Reference Group Data Report (abridged). Journal of American College Health, 57(May 2013), 477–488.
The American College Health Association. (2012). American College Health Association National College Health Assessment II Fall 2012 Reference Report Executive Summary.
The EXPORT Center. (2007). EXPORT Home. Retrieved from http://www.clemson.edu/export/index.html
United States Census Bureau. (2013, September). 2007 – 2011 American Community Survey. Retrieved from http://ftp2.census.gov/
US Department of Agriculture Agricultural Research Service Nutrient Data Laboratory. (2012). USDA National Nutrient Database for Standard Reference, Release 25. Retrieved from http://www.ars.usda.gov/ba/bhnrc/ndl
US Department of Agriculture Agricultural Research Service Nutrient Data Laboratory. (2015). USDA National Nutrient Database for Standard Reference, Release 27
137
(slightly revised). Retrieved from http://www.ars.usda.gov/ba/bhnrc/ndl
Vandelanotte, C., Spathonis, K. M., Eakin, E. G., & Owen, N. (2007). Website-Delivered Physical Activity Interventions. A Review of the Literature. American Journal of Preventive Medicine, 33(1), 54–64. doi:10.1016/j.amepre.2007.02.041
Vocus PRW Holdings. (2011). Figwee Portion Explorer App is a First in Interactive Portion Visualization. Vocus PRW Holdings, LLC. Retrieved April 1, 2015, from http://www.prweb.com/releases/2011/6/prweb8507742.htm
Wansink, B., & Cheney, M. M. (2005). Super Bowls: serving bowl size and food consumption. JAMA!: The Journal of the American Medical Association, 293(14), 1727–1728. doi:10.1001/jama.293.14.1727
Wansink, B., & Kim, J. (2005). Bad popcorn in big buckets: portion size can influence intake as much as taste. Journal of nutrition education and behavior (Vol. 37). doi:10.1016/S1499-4046(06)60278-9
Wansink, B., Painter, J. E., & North, J. (2005). Bottomless bowls: why visual cues of portion size may influence intake. Obesity research (Vol. 13). doi:10.1038/oby.2005.12
Wansink, B., & Park, S. B. (2001). At the movies: How external cues and perceived taste impact consumption volume. Food Quality and Preference, 12(1), 69–74. doi:10.1016/S0950-3293(00)00031-8
Wansink, B., van Ittersum, K., & Painter, J. E. (2006). Ice Cream Illusions. Bowls, Spoons, and Self-Served Portion Sizes. American Journal of Preventive Medicine, 31(3), 240–243. doi:10.1016/j.amepre.2006.04.003
Woo, I., Otsmo, K., Kim, S., Ebert, D. S., Delp, E. J., & Boushey, C. J. (2010). Automatic portion estimation and visual refinement in mobile dietary assessment. Proceedings of SPIE, 7533, 1–10. doi:10.1117/12.849051
Young, L. R., & Nestle, M. (1998). Variation in perceptions of a “medium” food portion: Implications for dietary guidance. J Am Diet Assoc, 98(4), 458 – 459.
Young, L. R., & Nestle, M. (2002). The contribution of expanding portion sizes to the US obesity epidemic. American Journal of Public Health, 92(2), 246–249. doi:10.2105/AJPH.92.2.246
Young, L. R., & Nestle, M. S. (1995). Portion sizes in dietary assessment: issues and policy implications. Nutrition Reviews, 53, 149–158. doi:10.1111/j.1753-

138
4887.1995.tb01542.x