16.0 GREENHOUSE GASES AND CLIMATE CHANGE
240
16.0 GREENHOUSE GASES AND CLIMATE CHANGE
-
Upload
khangminh22 -
Category
Documents
-
view
3 -
download
0
Transcript of 16.0 GREENHOUSE GASES AND CLIMATE CHANGE

16.0 GREENHOUSE GASES AND CLIMATE CHANGE
16.0 Greenhouse Gases and Climate Change
November 2013 Page 16-1 DEIR
16.0 GREENHOUSE GASES AND CLIMATE CHANGE
This section provides a discussion of the project’s effect on greenhouse gas emissions and the associated effects of climate change. The reader is referred to Section 10.0, Air Quality, for a discussion of project impacts associated with air quality.
16.1 EXISTING SETTING
16.1.1 EXISTING CLIMATE SETTING
Since the early 1990s, scientific consensus holds that the world’s population is releasing greenhouse gases (GHGs) faster than the earth’s natural systems can absorb them. These gases are released as byproducts of fossil fuel combustion, waste disposal, energy use, land use changes, and other human activities. This release of gases, such as carbon dioxide (CO2), methane (CH4), and nitrous oxide (N2O), creates a blanket around the earth that allows light to pass through but traps heat at the surface, preventing its escape into space. While this is a naturally occurring process known as the greenhouse effect, human activities have accelerated the generation of greenhouse gases beyond natural levels. The overabundance of greenhouse gases in the atmosphere has led to a warming of the earth and has the potential to severely impact the earth’s climate system.
While often used interchangeably, there is a difference between the terms “climate change” and “global warming.” According to the National Academy of Sciences, climate change refers to any significant, measurable change of climate lasting for an extended period of time that can be caused by both natural factors and human activities. Global warming, on the other hand, is an average increase in the temperature of the atmosphere caused by increased greenhouse gas emissions. The use of the term climate change is becoming more prevalent because it encompasses all changes to the climate, not just temperature.
To fully understand global climate change, it is important to recognize the naturally occurring greenhouse effect and to define the greenhouse gases that contribute to this phenomenon. Various gases in the earth’s atmosphere, classified as atmospheric GHGs, play a critical role in determining the earth’s surface temperature. Solar radiation enters the earth’s atmosphere from space and a portion of the radiation is absorbed by the earth’s surface. The earth emits this radiation back toward space, but the properties of the radiation change from high-frequency solar radiation to lower-frequency infrared radiation. Greenhouse gases, which are transparent to solar radiation, are effective in absorbing infrared radiation. As a result, this radiation that otherwise would have escaped back into space is now retained, resulting in a warming of the atmosphere. This phenomenon is known as the greenhouse effect. Among the prominent GHGs contributing to the greenhouse effect are CO2, CH4, N2O, hydrofluorocarbons (HFCs), perfluorocarbons (PFCs), and sulfur hexafluoride (SF6).
Table 16-1 provides descriptions of the primary greenhouse gases attributed to global climate change, including a description of their physical properties, primary sources, and contribution to the greenhouse effect.

Northstar Mountain Master Plan EIR
DEIR Page 16-2 November 2013
TABLE 16-1 GREENHOUSE GASES
Greenhouse Gas Description
Carbon Dioxide (CO2)
Carbon dioxide is a colorless, odorless gas. CO2 is emitted in a number of ways, both naturally and through human activities. The largest source of CO2 emissions globally is the combustion of fossil fuels such as coal, oil, and gas in power plants, automobiles, industrial facilities, and other sources. A number of specialized industrial production processes and product uses such as mineral production, metal production, and the use of petroleum-based products can also lead to CO2 emissions. The atmospheric lifetime of CO2 is variable because it is so readily exchanged in the atmosphere.1
Methane (CH4)
Methane is a colorless, odorless gas that is not flammable under most circumstances. CH4 is the major component of natural gas, about 87 percent by volume. It is also formed and released to the atmosphere by biological processes occurring in anaerobic environments. Methane is emitted from a variety of both human-related and natural sources. Human-related sources include fossil fuel production, animal husbandry (intestinal fermentation in livestock and manure management), rice cultivation, biomass burning, and waste management. These activities release significant quantities of methane to the atmosphere. Natural sources of methane include wetlands, gas hydrates, permafrost, termites, oceans, freshwater bodies, non-wetland soils, and other sources such as wildfires. Methane‘s atmospheric lifetime is about 12 years.2
Nitrous Oxide (N2O)
Nitrous oxide is a clear, colorless gas with a slightly sweet odor. N2O is produced by both natural and human-related sources. Primary human-related sources of N2O are agricultural soil management, animal manure management, sewage treatment, mobile and stationary combustion of fossil fuels, adipic acid production, and nitric acid production. N2O is also produced naturally from a wide variety of biological sources in soil and water, particularly microbial action in wet tropical forests. The atmospheric lifetime of N2O is approximately 120 years.3
Hydrofluorocarbons (HFCs)
Hydrofluorocarbons are man-made chemicals, many of which have been developed as alternatives to ozone-depleting substances for industrial, commercial, and consumer products. The only significant emissions of HFCs before 1990 were of the chemical HFC-23, which is generated as a byproduct of the production of HCFC-22 (or Freon 22, used in air conditioning applications). The atmospheric lifetime for HFCs varies from just over a year for HFC-152a to 260 years for HFC-23. Most of the commercially used HFCs have atmospheric lifetimes less than 15 years (e.g., HFC-134a, which is used in automobile air conditioning and refrigeration, has an atmospheric life of 14 years).4
Perfluorocarbons (PFCs)
Perfluorocarbons are colorless, highly dense, chemically inert, and nontoxic. There are seven PFC gases: perfluoromethane (CF4), perfluoroethane (C2F6), perfluoropropane (C3F8), perfluorobutane (C4F10), perfluorocyclobutane (C4F8), perfluoropentane (C5F12), and perfluorohexane (C6F14). Natural geological emissions have been responsible for the PFCs that have accumulated in the atmosphere in the past; however, the largest current source is aluminum production, which releases CF4 and C2F6 as byproducts. The estimated atmospheric lifetimes for CF4 and C2F6 are 50,000 and 10,000 years, respectively.4,5
Sulfur Hexafluoride (SF6)
Sulfur hexafluoride is an inorganic compound that is colorless, odorless, nontoxic, and generally nonflammable. SF6 is primarily used as an electrical insulator in high voltage equipment. The electric power industry uses roughly 80 percent of all SF6 produced worldwide. Significant leaks occur from aging equipment and during equipment maintenance and servicing. SF6 has an atmospheric life of 3,200 years.4
Sources: 1EPA 2011a, 2EPA 2011b, 3EPA 2010a, 4EPA 2010b, 5EFCTC 2003
Each GHG differs in its ability to absorb heat in the atmosphere based on the lifetime, or persistence, of the gas molecule in the atmosphere. Gases with high global warming potential, such as HFCs, PFCs, and SF6, are the most heat-absorbent. Methane traps over 21 times more heat per molecule than CO2, and N2O absorbs 310 times more heat per
16.0 Greenhouse Gases and Climate Change
November 2013 Page 16-3 DEIR
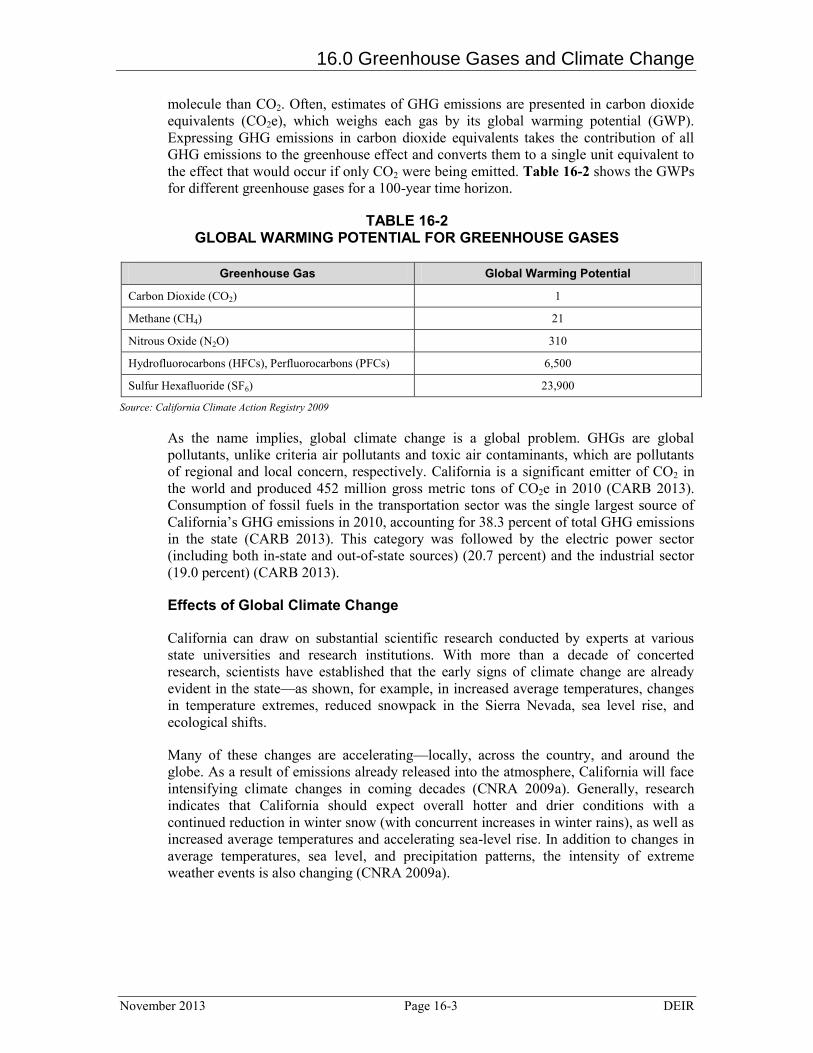
molecule than CO2. Often, estimates of GHG emissions are presented in carbon dioxide equivalents (CO2e), which weighs each gas by its global warming potential (GWP). Expressing GHG emissions in carbon dioxide equivalents takes the contribution of all GHG emissions to the greenhouse effect and converts them to a single unit equivalent to the effect that would occur if only CO2 were being emitted. Table 16-2 shows the GWPs for different greenhouse gases for a 100-year time horizon.
TABLE 16-2 GLOBAL WARMING POTENTIAL FOR GREENHOUSE GASES
Greenhouse Gas Global Warming Potential
Carbon Dioxide (CO2) 1
Methane (CH4) 21
Nitrous Oxide (N2O) 310
Hydrofluorocarbons (HFCs), Perfluorocarbons (PFCs) 6,500
Sulfur Hexafluoride (SF6) 23,900
Source: California Climate Action Registry 2009
As the name implies, global climate change is a global problem. GHGs are global pollutants, unlike criteria air pollutants and toxic air contaminants, which are pollutants of regional and local concern, respectively. California is a significant emitter of CO2 in the world and produced 452 million gross metric tons of CO2e in 2010 (CARB 2013). Consumption of fossil fuels in the transportation sector was the single largest source of California’s GHG emissions in 2010, accounting for 38.3 percent of total GHG emissions in the state (CARB 2013). This category was followed by the electric power sector (including both in-state and out-of-state sources) (20.7 percent) and the industrial sector (19.0 percent) (CARB 2013).
Effects of Global Climate Change
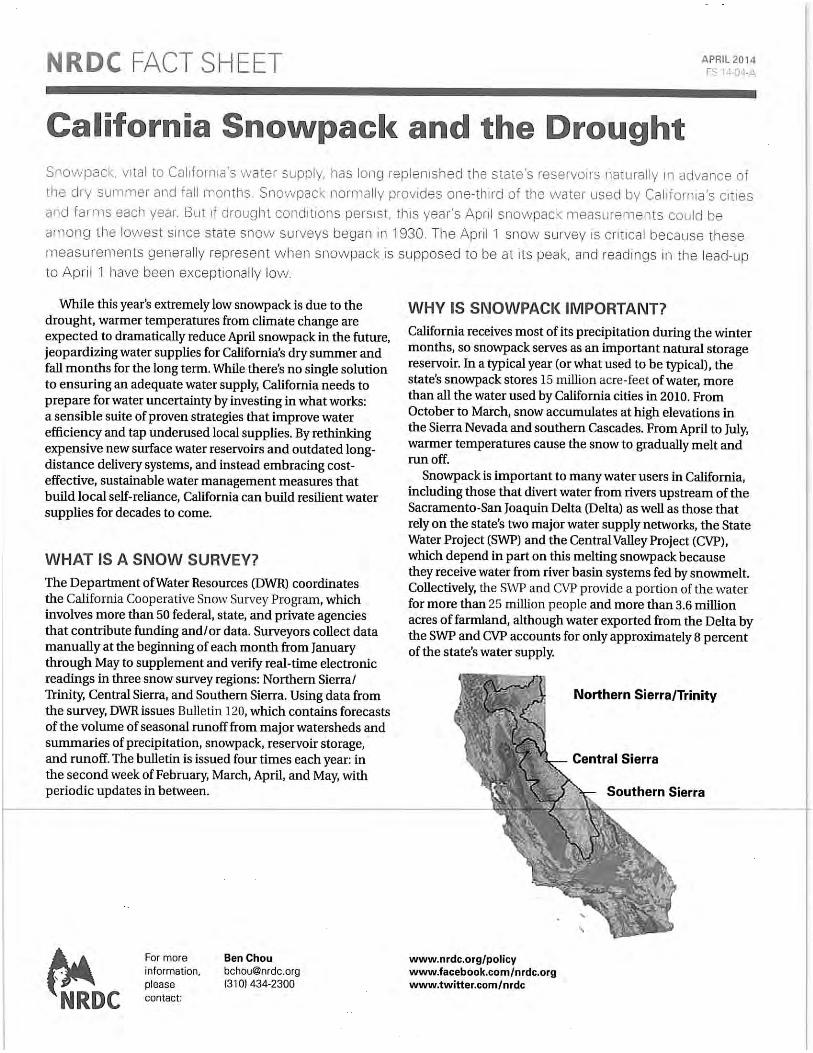
California can draw on substantial scientific research conducted by experts at various state universities and research institutions. With more than a decade of concerted research, scientists have established that the early signs of climate change are already evident in the state—as shown, for example, in increased average temperatures, changes in temperature extremes, reduced snowpack in the Sierra Nevada, sea level rise, and ecological shifts.
Many of these changes are accelerating—locally, across the country, and around the globe. As a result of emissions already released into the atmosphere, California will face intensifying climate changes in coming decades (CNRA 2009a). Generally, research indicates that California should expect overall hotter and drier conditions with a continued reduction in winter snow (with concurrent increases in winter rains), as well as increased average temperatures and accelerating sea-level rise. In addition to changes in average temperatures, sea level, and precipitation patterns, the intensity of extreme weather events is also changing (CNRA 2009a).
Northstar Mountain Master Plan EIR
DEIR Page 16-4 November 2013
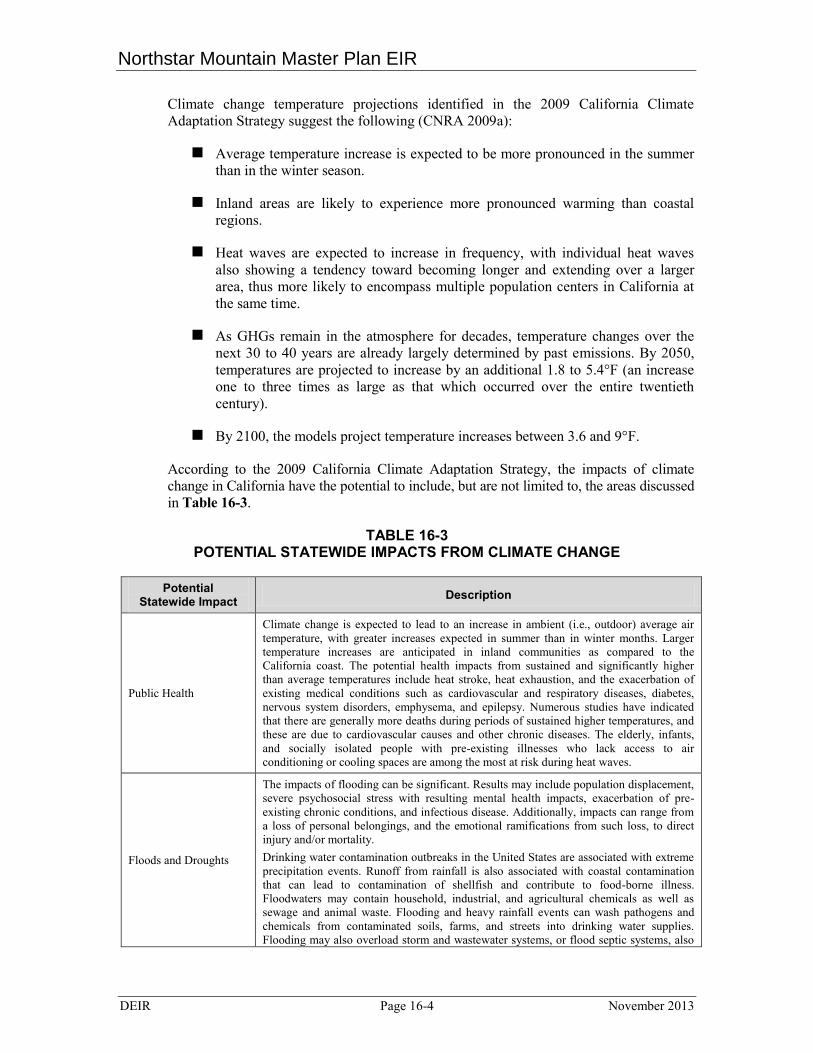
Climate change temperature projections identified in the 2009 California Climate Adaptation Strategy suggest the following (CNRA 2009a):
Average temperature increase is expected to be more pronounced in the summer than in the winter season.
Inland areas are likely to experience more pronounced warming than coastal regions.
Heat waves are expected to increase in frequency, with individual heat waves also showing a tendency toward becoming longer and extending over a larger area, thus more likely to encompass multiple population centers in California at the same time.
As GHGs remain in the atmosphere for decades, temperature changes over the next 30 to 40 years are already largely determined by past emissions. By 2050, temperatures are projected to increase by an additional 1.8 to 5.4°F (an increase one to three times as large as that which occurred over the entire twentieth century).
By 2100, the models project temperature increases between 3.6 and 9°F.
According to the 2009 California Climate Adaptation Strategy, the impacts of climate change in California have the potential to include, but are not limited to, the areas discussed in Table 16-3.
TABLE 16-3 POTENTIAL STATEWIDE IMPACTS FROM CLIMATE CHANGE
Potential Statewide Impact Description
Public Health
Climate change is expected to lead to an increase in ambient (i.e., outdoor) average air temperature, with greater increases expected in summer than in winter months. Larger temperature increases are anticipated in inland communities as compared to the California coast. The potential health impacts from sustained and significantly higher than average temperatures include heat stroke, heat exhaustion, and the exacerbation of existing medical conditions such as cardiovascular and respiratory diseases, diabetes, nervous system disorders, emphysema, and epilepsy. Numerous studies have indicated that there are generally more deaths during periods of sustained higher temperatures, and these are due to cardiovascular causes and other chronic diseases. The elderly, infants, and socially isolated people with pre-existing illnesses who lack access to air conditioning or cooling spaces are among the most at risk during heat waves.
Floods and Droughts
The impacts of flooding can be significant. Results may include population displacement, severe psychosocial stress with resulting mental health impacts, exacerbation of pre-existing chronic conditions, and infectious disease. Additionally, impacts can range from a loss of personal belongings, and the emotional ramifications from such loss, to direct injury and/or mortality. Drinking water contamination outbreaks in the United States are associated with extreme precipitation events. Runoff from rainfall is also associated with coastal contamination that can lead to contamination of shellfish and contribute to food-borne illness. Floodwaters may contain household, industrial, and agricultural chemicals as well as sewage and animal waste. Flooding and heavy rainfall events can wash pathogens and chemicals from contaminated soils, farms, and streets into drinking water supplies. Flooding may also overload storm and wastewater systems, or flood septic systems, also
16.0 Greenhouse Gases and Climate Change
November 2013 Page 16-5 DEIR
Potential Statewide Impact Description
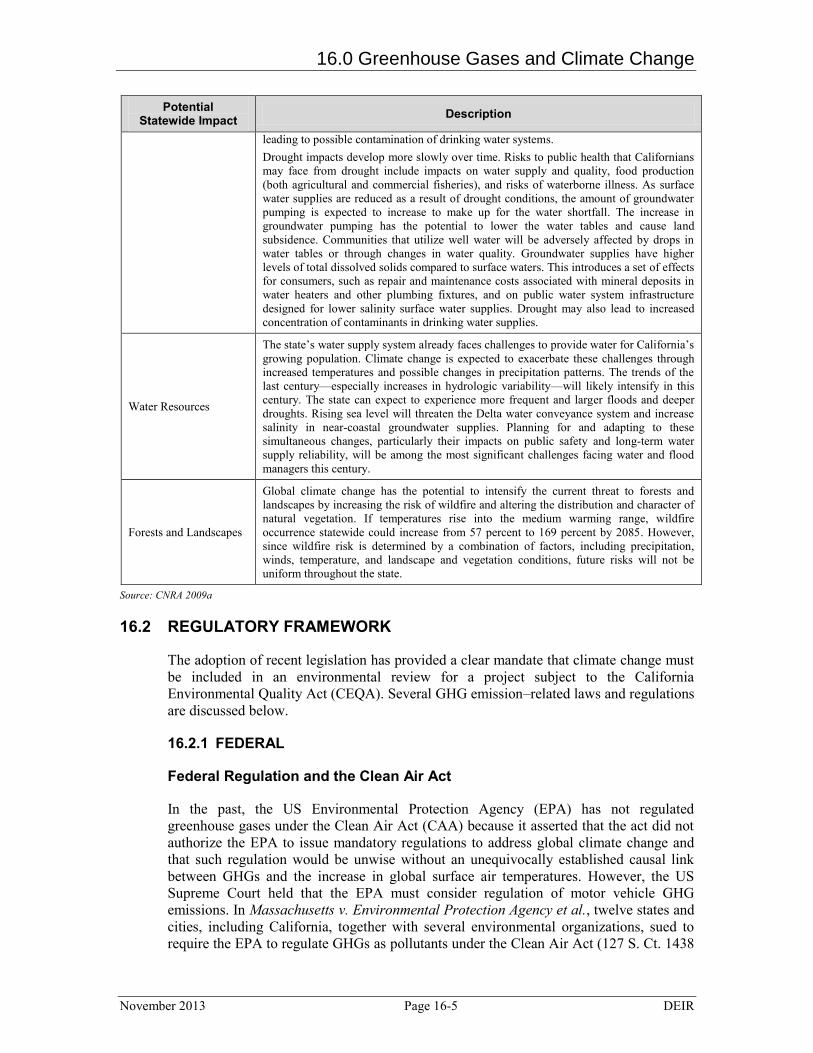
leading to possible contamination of drinking water systems. Drought impacts develop more slowly over time. Risks to public health that Californians may face from drought include impacts on water supply and quality, food production (both agricultural and commercial fisheries), and risks of waterborne illness. As surface water supplies are reduced as a result of drought conditions, the amount of groundwater pumping is expected to increase to make up for the water shortfall. The increase in groundwater pumping has the potential to lower the water tables and cause land subsidence. Communities that utilize well water will be adversely affected by drops in water tables or through changes in water quality. Groundwater supplies have higher levels of total dissolved solids compared to surface waters. This introduces a set of effects for consumers, such as repair and maintenance costs associated with mineral deposits in water heaters and other plumbing fixtures, and on public water system infrastructure designed for lower salinity surface water supplies. Drought may also lead to increased concentration of contaminants in drinking water supplies.
Water Resources
The state’s water supply system already faces challenges to provide water for California’s growing population. Climate change is expected to exacerbate these challenges through increased temperatures and possible changes in precipitation patterns. The trends of the last century—especially increases in hydrologic variability—will likely intensify in this century. The state can expect to experience more frequent and larger floods and deeper droughts. Rising sea level will threaten the Delta water conveyance system and increase salinity in near-coastal groundwater supplies. Planning for and adapting to these simultaneous changes, particularly their impacts on public safety and long-term water supply reliability, will be among the most significant challenges facing water and flood managers this century.
Forests and Landscapes
Global climate change has the potential to intensify the current threat to forests and landscapes by increasing the risk of wildfire and altering the distribution and character of natural vegetation. If temperatures rise into the medium warming range, wildfire occurrence statewide could increase from 57 percent to 169 percent by 2085. However, since wildfire risk is determined by a combination of factors, including precipitation, winds, temperature, and landscape and vegetation conditions, future risks will not be uniform throughout the state.
Source: CNRA 2009a
16.2 REGULATORY FRAMEWORK
The adoption of recent legislation has provided a clear mandate that climate change must be included in an environmental review for a project subject to the California Environmental Quality Act (CEQA). Several GHG emission–related laws and regulations are discussed below.
16.2.1 FEDERAL
Federal Regulation and the Clean Air Act
In the past, the US Environmental Protection Agency (EPA) has not regulated greenhouse gases under the Clean Air Act (CAA) because it asserted that the act did not authorize the EPA to issue mandatory regulations to address global climate change and that such regulation would be unwise without an unequivocally established causal link between GHGs and the increase in global surface air temperatures. However, the US Supreme Court held that the EPA must consider regulation of motor vehicle GHG emissions. In Massachusetts v. Environmental Protection Agency et al., twelve states and cities, including California, together with several environmental organizations, sued to require the EPA to regulate GHGs as pollutants under the Clean Air Act (127 S. Ct. 1438
Northstar Mountain Master Plan EIR
DEIR Page 16-6 November 2013
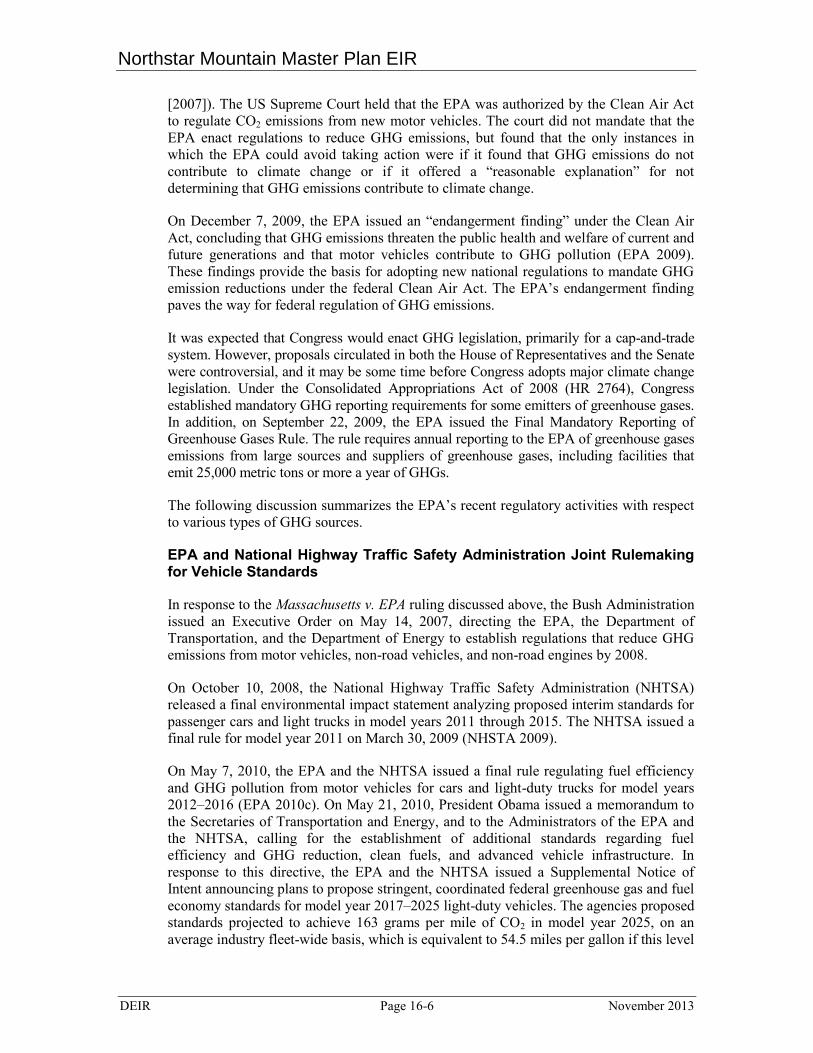
[2007]). The US Supreme Court held that the EPA was authorized by the Clean Air Act to regulate CO2 emissions from new motor vehicles. The court did not mandate that the EPA enact regulations to reduce GHG emissions, but found that the only instances in which the EPA could avoid taking action were if it found that GHG emissions do not contribute to climate change or if it offered a “reasonable explanation” for not determining that GHG emissions contribute to climate change.
On December 7, 2009, the EPA issued an “endangerment finding” under the Clean Air Act, concluding that GHG emissions threaten the public health and welfare of current and future generations and that motor vehicles contribute to GHG pollution (EPA 2009). These findings provide the basis for adopting new national regulations to mandate GHG emission reductions under the federal Clean Air Act. The EPA’s endangerment finding paves the way for federal regulation of GHG emissions.
It was expected that Congress would enact GHG legislation, primarily for a cap-and-trade system. However, proposals circulated in both the House of Representatives and the Senate were controversial, and it may be some time before Congress adopts major climate change legislation. Under the Consolidated Appropriations Act of 2008 (HR 2764), Congress established mandatory GHG reporting requirements for some emitters of greenhouse gases. In addition, on September 22, 2009, the EPA issued the Final Mandatory Reporting of Greenhouse Gases Rule. The rule requires annual reporting to the EPA of greenhouse gases emissions from large sources and suppliers of greenhouse gases, including facilities that emit 25,000 metric tons or more a year of GHGs.
The following discussion summarizes the EPA’s recent regulatory activities with respect to various types of GHG sources.
EPA and National Highway Traffic Safety Administration Joint Rulemaking for Vehicle Standards
In response to the Massachusetts v. EPA ruling discussed above, the Bush Administration issued an Executive Order on May 14, 2007, directing the EPA, the Department of Transportation, and the Department of Energy to establish regulations that reduce GHG emissions from motor vehicles, non-road vehicles, and non-road engines by 2008.
On October 10, 2008, the National Highway Traffic Safety Administration (NHTSA) released a final environmental impact statement analyzing proposed interim standards for passenger cars and light trucks in model years 2011 through 2015. The NHTSA issued a final rule for model year 2011 on March 30, 2009 (NHSTA 2009).
On May 7, 2010, the EPA and the NHTSA issued a final rule regulating fuel efficiency and GHG pollution from motor vehicles for cars and light-duty trucks for model years 2012–2016 (EPA 2010c). On May 21, 2010, President Obama issued a memorandum to the Secretaries of Transportation and Energy, and to the Administrators of the EPA and the NHTSA, calling for the establishment of additional standards regarding fuel efficiency and GHG reduction, clean fuels, and advanced vehicle infrastructure. In response to this directive, the EPA and the NHTSA issued a Supplemental Notice of Intent announcing plans to propose stringent, coordinated federal greenhouse gas and fuel economy standards for model year 2017–2025 light-duty vehicles. The agencies proposed standards projected to achieve 163 grams per mile of CO2 in model year 2025, on an average industry fleet-wide basis, which is equivalent to 54.5 miles per gallon if this level
16.0 Greenhouse Gases and Climate Change
November 2013 Page 16-7 DEIR
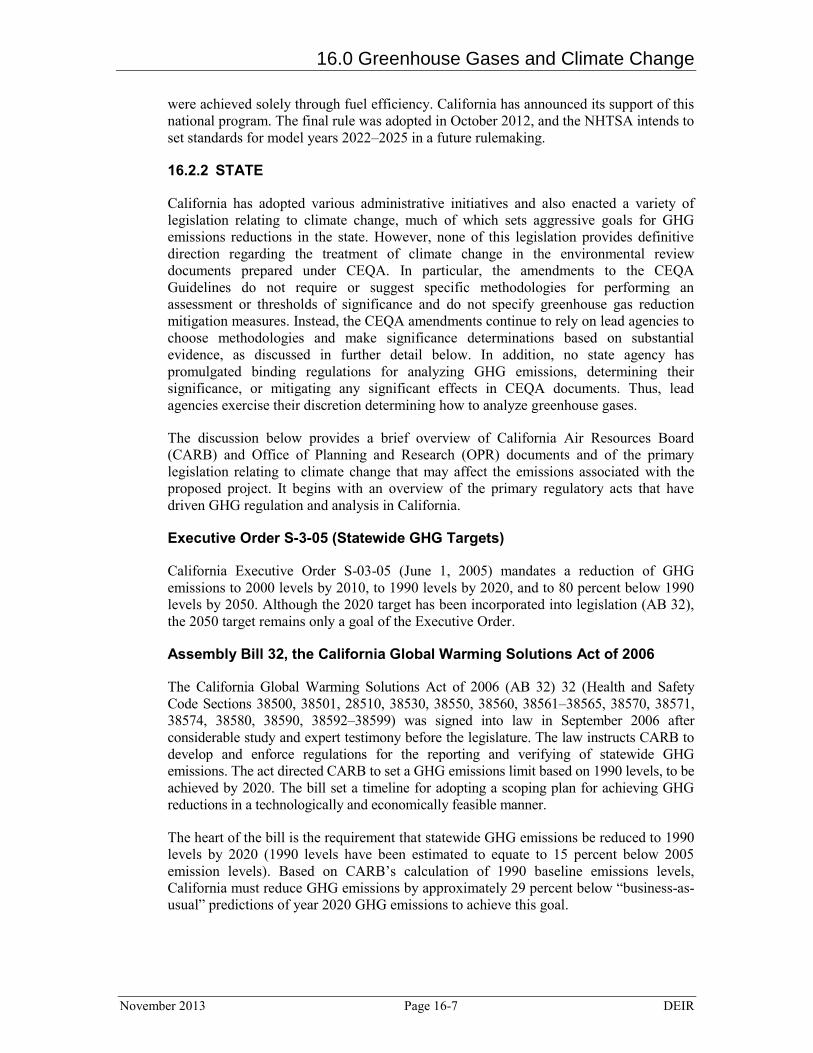
were achieved solely through fuel efficiency. California has announced its support of this national program. The final rule was adopted in October 2012, and the NHTSA intends to set standards for model years 2022–2025 in a future rulemaking.
16.2.2 STATE
California has adopted various administrative initiatives and also enacted a variety of legislation relating to climate change, much of which sets aggressive goals for GHG emissions reductions in the state. However, none of this legislation provides definitive direction regarding the treatment of climate change in the environmental review documents prepared under CEQA. In particular, the amendments to the CEQA Guidelines do not require or suggest specific methodologies for performing an assessment or thresholds of significance and do not specify greenhouse gas reduction mitigation measures. Instead, the CEQA amendments continue to rely on lead agencies to choose methodologies and make significance determinations based on substantial evidence, as discussed in further detail below. In addition, no state agency has promulgated binding regulations for analyzing GHG emissions, determining their significance, or mitigating any significant effects in CEQA documents. Thus, lead agencies exercise their discretion determining how to analyze greenhouse gases.
The discussion below provides a brief overview of California Air Resources Board (CARB) and Office of Planning and Research (OPR) documents and of the primary legislation relating to climate change that may affect the emissions associated with the proposed project. It begins with an overview of the primary regulatory acts that have driven GHG regulation and analysis in California.
Executive Order S-3-05 (Statewide GHG Targets)
California Executive Order S-03-05 (June 1, 2005) mandates a reduction of GHG emissions to 2000 levels by 2010, to 1990 levels by 2020, and to 80 percent below 1990 levels by 2050. Although the 2020 target has been incorporated into legislation (AB 32), the 2050 target remains only a goal of the Executive Order.
Assembly Bill 32, the California Global Warming Solutions Act of 2006
The California Global Warming Solutions Act of 2006 (AB 32) 32 (Health and Safety Code Sections 38500, 38501, 28510, 38530, 38550, 38560, 38561–38565, 38570, 38571, 38574, 38580, 38590, 38592–38599) was signed into law in September 2006 after considerable study and expert testimony before the legislature. The law instructs CARB to develop and enforce regulations for the reporting and verifying of statewide GHG emissions. The act directed CARB to set a GHG emissions limit based on 1990 levels, to be achieved by 2020. The bill set a timeline for adopting a scoping plan for achieving GHG reductions in a technologically and economically feasible manner.
The heart of the bill is the requirement that statewide GHG emissions be reduced to 1990 levels by 2020 (1990 levels have been estimated to equate to 15 percent below 2005 emission levels). Based on CARB’s calculation of 1990 baseline emissions levels, California must reduce GHG emissions by approximately 29 percent below “business-as-usual” predictions of year 2020 GHG emissions to achieve this goal.
Northstar Mountain Master Plan EIR
DEIR Page 16-8 November 2013
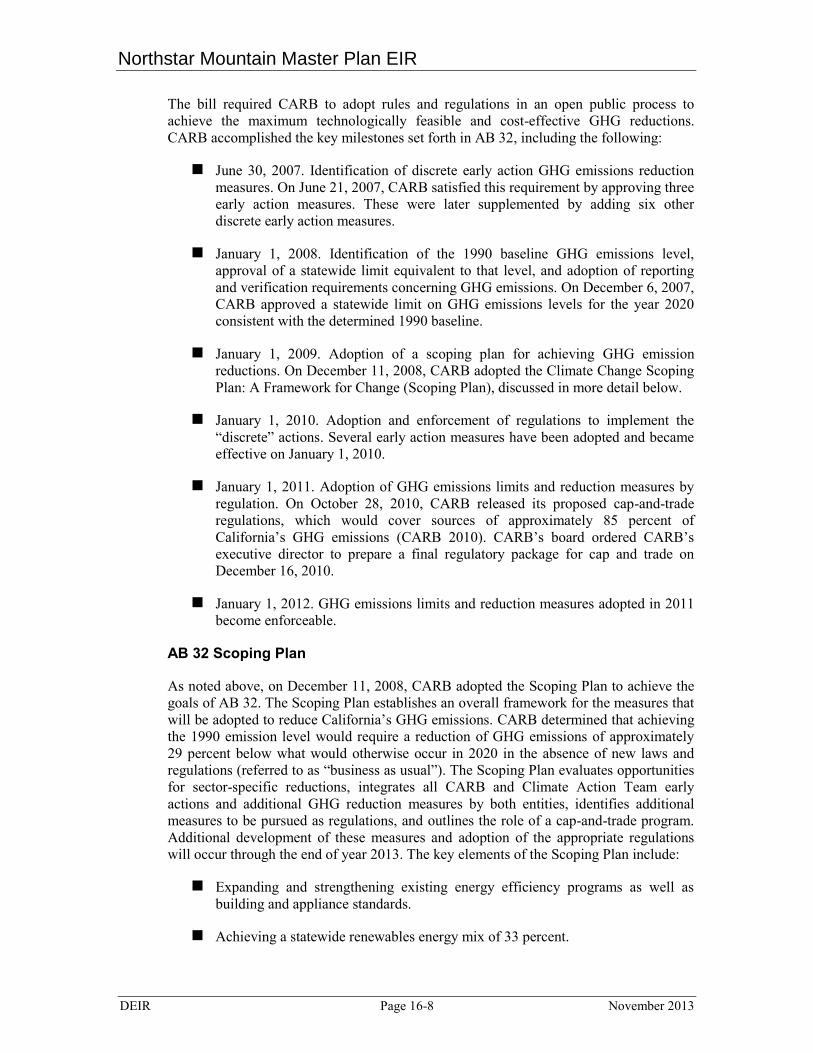
The bill required CARB to adopt rules and regulations in an open public process to achieve the maximum technologically feasible and cost-effective GHG reductions. CARB accomplished the key milestones set forth in AB 32, including the following:
June 30, 2007. Identification of discrete early action GHG emissions reduction measures. On June 21, 2007, CARB satisfied this requirement by approving three early action measures. These were later supplemented by adding six other discrete early action measures.
January 1, 2008. Identification of the 1990 baseline GHG emissions level, approval of a statewide limit equivalent to that level, and adoption of reporting and verification requirements concerning GHG emissions. On December 6, 2007, CARB approved a statewide limit on GHG emissions levels for the year 2020 consistent with the determined 1990 baseline.
January 1, 2009. Adoption of a scoping plan for achieving GHG emission reductions. On December 11, 2008, CARB adopted the Climate Change Scoping Plan: A Framework for Change (Scoping Plan), discussed in more detail below.
January 1, 2010. Adoption and enforcement of regulations to implement the “discrete” actions. Several early action measures have been adopted and became effective on January 1, 2010.
January 1, 2011. Adoption of GHG emissions limits and reduction measures by regulation. On October 28, 2010, CARB released its proposed cap-and-trade regulations, which would cover sources of approximately 85 percent of California’s GHG emissions (CARB 2010). CARB’s board ordered CARB’s executive director to prepare a final regulatory package for cap and trade on December 16, 2010.
January 1, 2012. GHG emissions limits and reduction measures adopted in 2011 become enforceable.
AB 32 Scoping Plan
As noted above, on December 11, 2008, CARB adopted the Scoping Plan to achieve the goals of AB 32. The Scoping Plan establishes an overall framework for the measures that will be adopted to reduce California’s GHG emissions. CARB determined that achieving the 1990 emission level would require a reduction of GHG emissions of approximately 29 percent below what would otherwise occur in 2020 in the absence of new laws and regulations (referred to as “business as usual”). The Scoping Plan evaluates opportunities for sector-specific reductions, integrates all CARB and Climate Action Team early actions and additional GHG reduction measures by both entities, identifies additional measures to be pursued as regulations, and outlines the role of a cap-and-trade program. Additional development of these measures and adoption of the appropriate regulations will occur through the end of year 2013. The key elements of the Scoping Plan include:
Expanding and strengthening existing energy efficiency programs as well as building and appliance standards.
Achieving a statewide renewables energy mix of 33 percent.
16.0 Greenhouse Gases and Climate Change
November 2013 Page 16-9 DEIR
Developing a California cap-and-trade program that links with other Western Climate Initiative partner programs to create a regional market system and caps sources contributing 85 percent of California’s GHG emissions.
Establishing targets for transportation-related GHG emissions for regions throughout California, and pursuing policies and incentives to achieve those targets.
Adopting and implementing measures pursuant to existing state laws and policies, including California’s clean car standards, heavy-duty truck measures, and the Low Carbon Fuel Standard.
Creating targeted fees, including a public goods charge on water use, fees on high global warming potential gases, and a fee to fund the administrative costs of the State of California’s long-term commitment to AB 32 implementation. (CARB 2008)
In 2009, a coalition of special interest groups brought a challenge to the Scoping Plan alleging that it violated AB 32 and that the environmental review document (called a “Functional Equivalent Document”) violated CEQA by failing to appropriately analyze alternatives to the proposed cap-and-trade program. On May 20, 2011, the San Francisco Superior Court entered a final judgment ordering that CARB take no further action with respect to cap-and-trade rulemaking until it complies with CEQA. While CARB disagrees with the trial court finding and appealed the decision on May 23, 2011, in order to remove any doubt about the matter and in keeping with CARB’s interest in public participation and informed decision-making, CARB revisited the alternatives. The revised analysis includes the five alternatives included in the original environmental analysis: a “no project” alternative (that is, taking no action at all); a plan relying on a cap-and-trade program for the sectors included in a cap; a plan relying more on source-specific regulatory requirements with no cap-and-trade component; a plan relying on a carbon fee or tax; and a plan relying on a variety of proposed strategies and measures. The public hearing to consider approval of the AB 32 Scoping Plan Functional Equivalent Document and the AB 32 Scoping Plan was held on August 24, 2011. On this date, CARB re-approved the Scoping Plan.
In August 2012, CARB released revised estimates of the expected 2020 emissions reductions. The revised analysis relies on emissions projections updated in light of current economic forecasts which account for the economic downturn since 2008 as well as reduction measures already approved and put in place. This reduced the projected 2020 emissions from 596 million metric tons (MMT) CO2e to 545 MMTCO2e. The reduction in projected 2020 emissions means that the revised business-as-usual (BAU) reduction necessary to achieve AB 32’s goal of reaching 1990 levels by 2020 is now only 21 percent.
Assembly Bill 1493
Assembly Bill 1493 (“the Pavley Standard,” or AB 1493) (Health and Safety Code Sections 42823 and 43018.5) required CARB to adopt regulations by January 1, 2005, to reduce GHG emissions from noncommercial passenger vehicles and light-duty trucks of model years 2009–2016. The bill also required the California Climate Action Registry to develop and adopt protocols for the reporting and certification of GHG emissions
Northstar Mountain Master Plan EIR
DEIR Page 16-10 November 2013
reductions from mobile sources for use by CARB in granting emissions reduction credits. The bill authorizes CARB to grant emissions reduction credits for reductions in GHG emissions prior to the date of enforcement of regulations, using model year 2000 as the baseline for reduction.
In 2004, CARB applied to the EPA for a waiver under the federal Clean Air Act to authorize implementation of these regulations. The waiver request was formally denied by the EPA in December 2007 after California filed suit to prompt federal action. In January 2008, the California Attorney General filed a new lawsuit against the EPA for denying California’s request for a waiver to regulate and limit GHG emissions from these vehicles. In January 2009, President Barack Obama issued a directive to the EPA to reconsider California’s request for a waiver. On June 30, 2009, the EPA granted the waiver to California for its GHG emission standards for motor vehicles. As part of this waiver, the EPA specified the provision that CARB may not hold a manufacturer liable or responsible for any noncompliance caused by emission debits generated by a manufacturer for the 2009 model year. CARB has adopted a new approach to passenger vehicles—cars and light trucks—by combining the control of smog-causing pollutants and GHG emissions into a single coordinated package of standards. The new approach also includes efforts to support and accelerate the numbers of plug-in hybrids and zero-emission vehicles in California. These standards will apply to all passenger and light-duty trucks used in the state.
Low Carbon Fuel Standard
Executive Order S-01-07 (January 18, 2007) requires a 10 percent or greater reduction in the average fuel carbon intensity for transportation fuels in California regulated by CARB. CARB identified the Low Carbon Fuel Standard (LCFS) as a discrete early action item under AB 32, and the final resolution (09-31) was issued on April 23, 2009. In 2009, CARB approved for adoption of the LCFS regulation, which became fully effective in April 2010 and is codified at Title 17, California Code of Regulations, Sections 95480–95490. The Low Carbon Fuel Standard will reduce greenhouse gas emissions by reducing the carbon intensity of transportation fuels used in California by at least 10 percent by 2020. Carbon intensity is a measure of the GHG emissions associated with the various production, distribution, and use steps in the “life cycle” of a transportation fuel.
On December 29, 2011, the US District Court for the Eastern District of California issued several rulings in the federal lawsuits challenging the LCFS. One of the district court’s rulings preliminarily enjoined CARB from enforcing the regulation. In January 2012, CARB appealed that decision to the Ninth Circuit Court of Appeals and then moved to stay the injunction pending resolution of the appeal. On April 23, 2012, the Ninth Circuit granted CARB’s motion for a stay of the injunction while it continues to consider CARB’s appeal of the lower court’s decision.
Clean Cars
In January 2012, CARB approved the Advanced Clean Cars Program, a new emissions-control program for model years 2017–2025. The program combines the control of smog, soot, and GHG emissions with requirements for greater numbers of zero-emission vehicles. By 2025, when the rules will be fully implemented, the new automobiles will emit 34 percent fewer global warming gases and 75 percent fewer smog-forming emissions.
16.0 Greenhouse Gases and Climate Change
November 2013 Page 16-11 DEIR
Renewables Portfolio Standard (Senate Bill 1078, Senate Bill 107, and Senate Bill X1-2)
Established in 2002 under Senate Bill (SB) 1078, and accelerated in 2006 under SB 107 and again in 2011 under SBX1-2, California’s Renewables Portfolio Standard (RPS) requires retail sellers of electric services to increase procurement from eligible renewable energy resources to 33 percent of total retail sales by 2020. The 33 percent standard is consistent with the RPS goal established in the Scoping Plan. As interim measures, the RPS requires 20 percent of retail sales to be sourced from renewable energy by 2013, and 25 percent by 2016. Initially, the RPS provisions applied to investor-owned utilities, community choice aggregators, and electric service providers. SBX1-2 added, for the first time, publicly owned utilities to the entities subject to the RPS. The expected growth in the RPS to meet the standards in effect in 2008 is not reflected in the BAU calculation in the AB 32 Scoping Plan. In other words, the Scoping Plan’s 2020 business as usual does not take credit for implementation of the RPS that occurred after its adoption.
Senate Bill 375
SB 375 (codified at Government Code and Public Resources Code1), signed in September 2008, provides for a new planning process to coordinate land use planning, regional transportation plans, and funding priorities in order to help California meet the GHG reduction goals established in AB 32. SB 375 will be implemented over the next several years and includes provisions for streamlined CEQA review for some infill projects such as transit-oriented development. SB 375 also requires Metropolitan Planning Organizations (MPOs) to incorporate a “sustainable communities strategy” (SCS) in their regional transportation plans (RTPs) that will achieve GHG emission reduction targets by reducing vehicle miles traveled from light-duty vehicles through the development of more compact, complete, and efficient communities.
SB 375 is similar to the Regional Blueprint Planning Program, established by the California Department of Transportation (Caltrans), which provides discretionary grants to fund regional transportation and land use plans voluntarily developed by MPOs working in cooperation with councils of governments. The Scoping Plan relies on the requirements of SB 375 to implement the carbon emissions reductions anticipated from land use decisions.
On September 23, 2010, CARB adopted regional targets for the reduction of greenhouse gases applying to the years 2020 and 2035 (CARB 2011a). The project site is located in an area that is not represented by a MPO due to the rural nature of the region and therefore is not in an area that received CARB-adopted regional targets for reduction of GHG emissions (CARB 2011b).
California Building Energy Efficiency Standards
Energy conservation standards for new residential and commercial buildings were originally adopted by the California Energy Resources Conservation and Development Commission in June 1977 and most recently revised in 2008 (Title 24, Part 6 of the California Code of Regulations (CCR)). In general, Title 24 requires the design of
1 Senate Bill 375 is codified at Government Code Sections 65080, 65400, 65583, 65584.01, 65584.02, 65584.04, 65587, 65588, 14522.1, 14522.2, and 65080.01 as well as Public Resources Code Sections 21061.3 and 21159.28 and Chapter 4.2.
Northstar Mountain Master Plan EIR
DEIR Page 16-12 November 2013
building shells and building components to conserve energy. The standards are updated periodically to allow for consideration and possible incorporation of new energy efficiency technologies and methods.
On July 17, 2008, the California Building Standards Commission adopted the nation’s first green building standards. The California Green Building Standards Code (Part 11, Title 24) was adopted as part of the California Building Standards Code (Title 24, California Code of Regulations). Part 11 establishes voluntary standards on planning and design for sustainable site development, energy efficiency (in excess of the California Energy Code requirements), water conservation, material conservation, and internal air contaminants. Some of these standards became mandatory in the 2010 edition of the Part 11 code. Current mandatory standards include:
Twenty (20) percent mandatory reduction in indoor water use, with voluntary goal standards for 30, 35, and 40 percent reductions
Separate water meters for nonresidential buildings’ indoor and outdoor water use, with a requirement for moisture-sensing irrigation systems for larger landscape projects
Diversion of 50 percent of construction waste from landfills, increasing voluntarily to 65 and 75 percent for new homes and 80 percent for commercial projects
Mandatory inspections of energy systems (i.e., heat furnace, air conditioner, mechanical equipment) for nonresidential buildings over 10,000 square feet to ensure that all are working at their maximum capacity according to their design efficiencies
Low-pollutant-emitting interior finish materials such as paints, carpet, vinyl flooring, and particleboard
The California Energy Commission has opened a public process and rulemaking proceeding for the adoption of changes to the 2013 Building Energy Efficiency Standards contained in the California Code of Regulations, Title 24, Part 6 (also known as the California Energy Code) and associated administrative regulations in Part 1 (collectively referred to here as the standards). The proposed amended standards will be adopted in 2014. The 2013 Building Energy Efficiency Standards are 25 percent more efficient than previous standards for residential construction and 30 percent better for nonresidential construction. The standards, which take effect on January 1, 2014, will offer builders better windows, insulation, lighting, ventilation systems, and other features that reduce energy consumption in homes and businesses.
16.2.3 LOCAL
Placer County Air Pollution Control District
The project is under the jurisdiction of the Placer County Air Pollution Control District (PCAPCD), which regulates air quality according to the standards established in the federal and California Clean Air Acts and amendments to those acts. The PCAPCD
16.0 Greenhouse Gases and Climate Change
November 2013 Page 16-13 DEIR
regulates air quality through its permitting authority and through air quality–related planning and review activities over most types of stationary emission sources.
The PCAPCD has not yet established significance thresholds for GHG emissions from project operations.
16.3 IMPACTS
16.3.1 STANDARDS OF SIGNIFICANCE
Per Appendix G of the State CEQA Guidelines, the County considers impacts related to climate change significant if implementation of the proposed project would result in any of the following:
1) Generate greenhouse gas emissions, either directly or indirectly, that may have a significant impact on the environment.
2) Conflict with any applicable plan, policy, or regulation of an agency adopted for the purpose of reducing the emissions of greenhouse gases.
Implementation of the proposed project would result in the generation of GHG emissions associated with construction activities, consisting primarily of emissions from equipment exhaust, as well as long-term operations, consisting primarily of new vehicular trips and indirect source emissions from electricity usage.
Addressing GHG generation impacts requires an agency to make a determination as to what constitutes a significant impact. The amendments to the CEQA Guidelines specifically allow lead agencies to determine thresholds of significance that illustrate the extent of an impact and are a basis from which to apply mitigation measures. This means that each agency is left to determine if a project’s GHG emissions will have a “significant” impact on the environment. The guidelines direct that agencies are to use “careful judgment” and “make a good-faith effort, based to the extent possible on scientific and factual data, to describe, calculate or estimate” the project’s GHG emissions (14 CCR Section 15064.4(a)).
In its Final Statement of Reasons for Regulatory Action accompanying the CEQA Amendments (FSOR), the California Natural Resources Agency (2009b) explains that quantification of GHG emissions “is reasonably necessary to ensure an adequate analysis of GHG emissions using available data and tools” and that “quantification will, in many cases, assist in the determination of significance.” However, as explained in the FSOR, the revised Section 15064.4(b) assigns lead agencies the discretion to determine the methodology to quantify GHG emissions. The FSOR also notes that CEQA case law has long stated that “there is no iron-clad definition of ‘significance.’ Accordingly, lead agencies must use their best efforts to investigate and disclose all that they reasonably can concerning a project’s potential adverse impacts.”
Determining a threshold of significance for a project’s climate change impacts poses a special difficulty for lead agencies. Much of the science in this area is new and is evolving constantly. At the same time, neither the state nor local agencies are specialized in this area, and there are currently no local, regional, or state thresholds for determining whether a proposed project has a significant impact on climate change. The CEQA
Northstar Mountain Master Plan EIR
DEIR Page 16-14 November 2013
Amendments do not prescribe specific significance thresholds but instead leave considerable discretion to lead agencies to develop appropriate thresholds to apply to projects within their jurisdiction.
As noted earlier, AB 32 is a legal mandate requiring that statewide GHG emissions be reduced to 1990 levels by 2020. In adopting AB 32, the legislature determined the necessary GHG reductions for the state to make in order to sufficiently offset its contribution to the cumulative climate change problem to reach 1990 levels. AB 32 is the only legally mandated requirement for the reduction of greenhouse gases. As such, compliance with AB 32 is the adopted basis upon which the agency can base its significance threshold for evaluating the project’s GHG impacts.
As previously stated, significance thresholds for GHG emission increases resulting from land use development projects have not been established in Placer County (as previously mentioned, the PCAPCD has not yet established significance thresholds for GHG emissions from project operations). In April 2012, the San Luis Obispo County Air Pollution Control District (SLOAPCD) published its greenhouse gas threshold (1,150 metric tons of CO2e annually) in its CEQA Handbook. If the proposed project would generate GHG emissions above the threshold level, it would be considered to contribute substantially to a cumulative impact and the impact would be considered significant. The SLOAPCD thresholds were chosen based on the substantial evidence that such thresholds represent quantitative and/or qualitative levels of GHG emissions, compliance with which means that the environmental impact of the GHG emissions will normally not be cumulatively considerable under CEQA. Compliance with such thresholds will be part of the solution to the cumulative GHG emissions problem, rather than hinder the State’s ability to meet its goals of reduced statewide GHG emissions under AB 32 by attributing an appropriate share of the GHG reductions needed from new land use projects subject to CEQA. This approach is a conservative method that focuses on a limited set of state mandates that are currently expected to have the greatest potential to reduce land use-related GHG emissions. This approach is predicated on the premise that there is a shortfall, or “gap” between the current emissions trajectory (projected emissions with existing control measures) and the desired emissions trajectory needed to reach a defined emissions level.
Thus, 1,150 metric tons of CO2e annually was used to determine if the project would generate new GHG emissions that may have a significant impact on the environment (standard of significance 1 above).
The proposed project would also be considered to have a significant impact if it would be in conflict with the AB 32 goals for reducing GHG emissions (standard of significance 2 above). As shown under the impact analysis below, the proposed project would contribute to the generation of GHG emissions primarily from electricity consumption and tree removal activities. Therefore, this DEIR assesses the project’s potential to result in a significant GHG impact by determining its consistency with the AB 32 Scoping Plan and Senate Bill X-2 (Renewables Portfolio Standard), which both require 33 percent of supply from renewable energy sources by 2020, and its consistency with AB 32 Scoping Plan GHG reduction measure F-1, Sustainable Forest Target. As stated previously, the AB 32 Scoping Plan contains the main strategies California is implementing to achieve a reduction of 169 MMT of CO2e, or approximately 30 percent from the State’s projected 2020 emissions level of 596 MMT of CO2e under a business-as-usual scenario. Thus, the impact analysis evaluates whether the project’s electrical provider would meet the
16.0 Greenhouse Gases and Climate Change
November 2013 Page 16-15 DEIR
Renewables Portfolio Standard or if project features would conflict with AB 32 greenhouse gas reduction measures.
16.3.2 METHODOLOGY
The resultant GHG emissions of the proposed project were calculated using the California Emissions Estimator Model (CalEEMod), version 2013.2, computer program (see Appendix 16). CalEEMod is a statewide land use emissions computer model designed to provide a uniform platform for the use of government agencies, land use planners, and environmental professionals. This model was developed in coordination with the South Coast Air Quality Management District (SCAQMD) and is the most current emissions model approved for use in California by various other air districts.
As stated in Section 3.0, Project Description, construction phasing of the proposed improvements is unknown at this time; however, construction is anticipated to occur in 5.5-month segments starting on May 1 of each year over a buildout period of 20 years. For the purposes of this analysis, a construction timeline of 4.5 months per year for 10 consecutive years is assumed in order to provide a conservative analysis to factor variations in snow conditions in the late spring months. The specific equipment used to construct the proposed features of the project was obtained from Table 3-4 in Section 3.0, Project Description. As shown in Table 3-4, lift construction will include the operation of a helicopter. Helicopter emissions modeling for lift construction-related helicopter flights is based on the assumption of 4 hours of use per constructed lift as anticipated by the project applicant. The anticipated area of disturbance from tree removal activities was obtained from Table 3-5 in Section 3.0, and the anticipated area of disturbance from all other construction activities was obtained by Table 3-6 in Section 3.0.
The proposed project would result in a substantial increase of electricity consumption as a result of new ski lifts and snowmaking facilities. GHG emissions generated by increased electricity consumption are projected based on anticipated energy consumption in kilowatt-hours provided by the project applicant. The increase of traffic over existing conditions as a result of the project was obtained from LSC Transportation Consultants, Inc. (see Appendix 9).
The California Natural Resources Agency CNRA has noted that impacts of GHG emissions should focus on the cumulative impact on climate change. The public notice states (CNRA 2009c):
While the Proposed Amendments do not foreclose the possibility that a single project may result in greenhouse gas emissions with a direct impact on the environment, the evidence before [CNRA] indicates that in most cases, the impact will be cumulative. Therefore, the Proposed Amendments emphasize that the analysis of greenhouse gas emissions should center on whether a project’s incremental contribution of greenhouse gas emissions is cumulatively considerable.
Thus, the CEQA Amendments continue to make clear that the significance of GHG emissions is most appropriately considered on a cumulative level. Therefore, for the purposes of evaluating the proposed project’s GHG impacts, construction-generated GHG emissions will be quantified, amortized over the life of the project (30 years), and added to the annual operational emissions.
Northstar Mountain Master Plan EIR
DEIR Page 16-16 November 2013
16.3.3 IMPACTS AND MITIGATION MEASURES
IMPACT 16.1: Greenhouse Gas Emissions
GHG emissions contribute, on a cumulative basis, to the significant adverse environmental impacts of global climate change. No single land use project could generate enough GHG emissions to noticeably change the global average temperature. The combination of GHG emissions from past, present, and future projects contributes substantially to the phenomenon of global climate change and its associated environmental impacts and as such is addressed only as a cumulative impact.
Construction GHG Emissions
Subsequent development proposed under the proposed project would result in direct emissions of GHGs from construction.
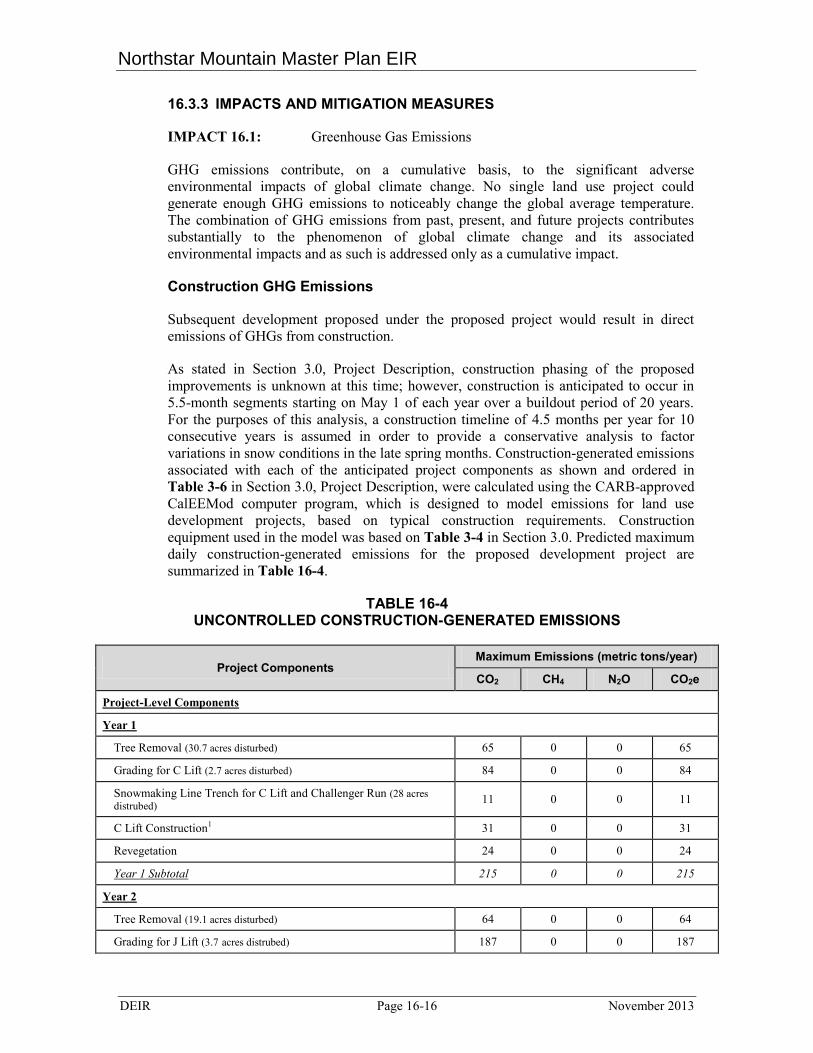
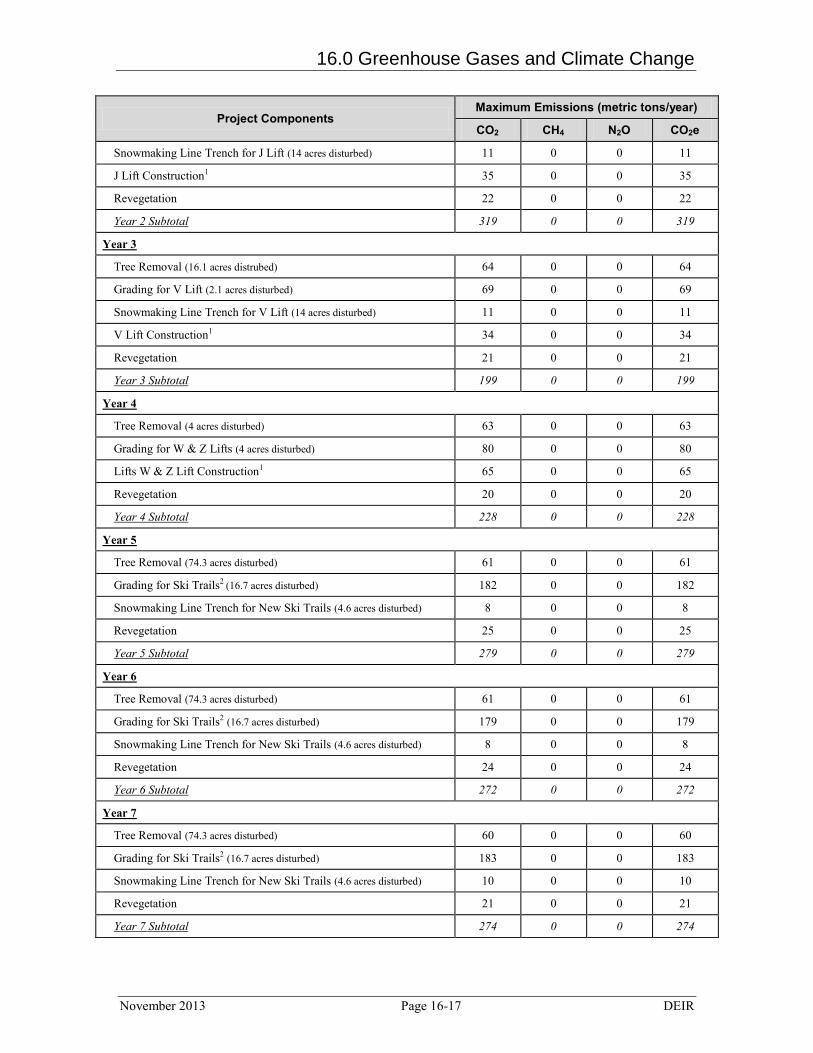
As stated in Section 3.0, Project Description, construction phasing of the proposed improvements is unknown at this time; however, construction is anticipated to occur in 5.5-month segments starting on May 1 of each year over a buildout period of 20 years. For the purposes of this analysis, a construction timeline of 4.5 months per year for 10 consecutive years is assumed in order to provide a conservative analysis to factor variations in snow conditions in the late spring months. Construction-generated emissions associated with each of the anticipated project components as shown and ordered in Table 3-6 in Section 3.0, Project Description, were calculated using the CARB-approved CalEEMod computer program, which is designed to model emissions for land use development projects, based on typical construction requirements. Construction equipment used in the model was based on Table 3-4 in Section 3.0. Predicted maximum daily construction-generated emissions for the proposed development project are summarized in Table 16-4.
TABLE 16-4 UNCONTROLLED CONSTRUCTION-GENERATED EMISSIONS
Project Components Maximum Emissions (metric tons/year)
CO2 CH4 N2O CO2e
Project-Level Components
Year 1
Tree Removal (30.7 acres disturbed) 65 0 0 65
Grading for C Lift (2.7 acres disturbed) 84 0 0 84
Snowmaking Line Trench for C Lift and Challenger Run (28 acres distrubed) 11 0 0 11
C Lift Construction1 31 0 0 31
Revegetation 24 0 0 24
Year 1 Subtotal 215 0 0 215
Year 2
Tree Removal (19.1 acres disturbed) 64 0 0 64
Grading for J Lift (3.7 acres distrubed) 187 0 0 187
16.0 Greenhouse Gases and Climate Change
November 2013 Page 16-17 DEIR
Project Components Maximum Emissions (metric tons/year)
CO2 CH4 N2O CO2e
Snowmaking Line Trench for J Lift (14 acres disturbed) 11 0 0 11
J Lift Construction1 35 0 0 35
Revegetation 22 0 0 22
Year 2 Subtotal 319 0 0 319
Year 3
Tree Removal (16.1 acres distrubed) 64 0 0 64
Grading for V Lift (2.1 acres disturbed) 69 0 0 69
Snowmaking Line Trench for V Lift (14 acres disturbed) 11 0 0 11
V Lift Construction1 34 0 0 34
Revegetation 21 0 0 21
Year 3 Subtotal 199 0 0 199
Year 4
Tree Removal (4 acres disturbed) 63 0 0 63
Grading for W & Z Lifts (4 acres disturbed) 80 0 0 80
Lifts W & Z Lift Construction1 65 0 0 65
Revegetation 20 0 0 20
Year 4 Subtotal 228 0 0 228
Year 5
Tree Removal (74.3 acres disturbed) 61 0 0 61
Grading for Ski Trails2 (16.7 acres disturbed) 182 0 0 182
Snowmaking Line Trench for New Ski Trails (4.6 acres disturbed) 8 0 0 8
Revegetation 25 0 0 25
Year 5 Subtotal 279 0 0 279
Year 6
Tree Removal (74.3 acres disturbed) 61 0 0 61
Grading for Ski Trails2 (16.7 acres disturbed) 179 0 0 179
Snowmaking Line Trench for New Ski Trails (4.6 acres disturbed) 8 0 0 8
Revegetation 24 0 0 24
Year 6 Subtotal 272 0 0 272
Year 7
Tree Removal (74.3 acres disturbed) 60 0 0 60
Grading for Ski Trails2 (16.7 acres disturbed) 183 0 0 183
Snowmaking Line Trench for New Ski Trails (4.6 acres disturbed) 10 0 0 10
Revegetation 21 0 0 21
Year 7 Subtotal 274 0 0 274
Northstar Mountain Master Plan EIR
DEIR Page 16-18 November 2013
Project Components Maximum Emissions (metric tons/year)
CO2 CH4 N2O CO2e
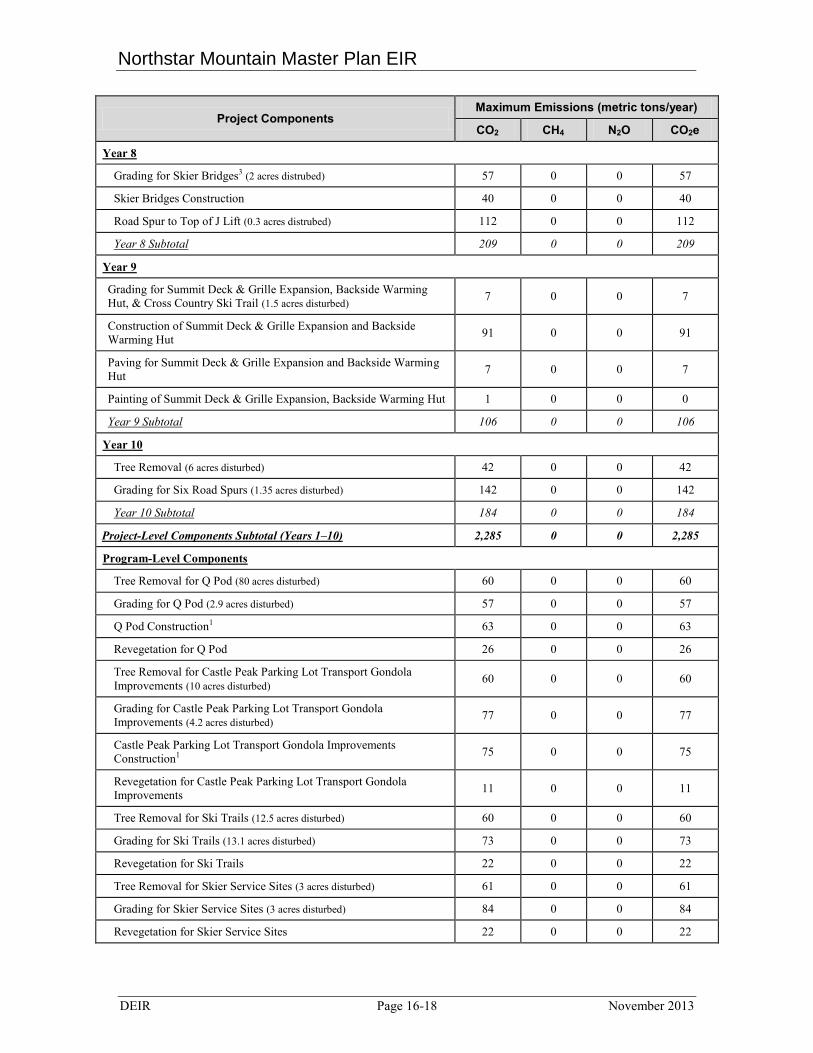
Year 8
Grading for Skier Bridges3 (2 acres distrubed) 57 0 0 57
Skier Bridges Construction 40 0 0 40
Road Spur to Top of J Lift (0.3 acres distrubed) 112 0 0 112
Year 8 Subtotal 209 0 0 209
Year 9
Grading for Summit Deck & Grille Expansion, Backside Warming Hut, & Cross Country Ski Trail (1.5 acres disturbed) 7 0 0 7
Construction of Summit Deck & Grille Expansion and Backside Warming Hut 91 0 0 91
Paving for Summit Deck & Grille Expansion and Backside Warming Hut 7 0 0 7
Painting of Summit Deck & Grille Expansion, Backside Warming Hut 1 0 0 0
Year 9 Subtotal 106 0 0 106
Year 10
Tree Removal (6 acres disturbed) 42 0 0 42
Grading for Six Road Spurs (1.35 acres disturbed) 142 0 0 142
Year 10 Subtotal 184 0 0 184
Project-Level Components Subtotal (Years 1–10) 2,285 0 0 2,285
Program-Level Components
Tree Removal for Q Pod (80 acres disturbed) 60 0 0 60
Grading for Q Pod (2.9 acres disturbed) 57 0 0 57
Q Pod Construction1 63 0 0 63
Revegetation for Q Pod 26 0 0 26
Tree Removal for Castle Peak Parking Lot Transport Gondola Improvements (10 acres disturbed) 60 0 0 60
Grading for Castle Peak Parking Lot Transport Gondola Improvements (4.2 acres disturbed) 77 0 0 77
Castle Peak Parking Lot Transport Gondola Improvements Construction1 75 0 0 75
Revegetation for Castle Peak Parking Lot Transport Gondola Improvements 11 0 0 11
Tree Removal for Ski Trails (12.5 acres disturbed) 60 0 0 60
Grading for Ski Trails (13.1 acres disturbed) 73 0 0 73
Revegetation for Ski Trails 22 0 0 22
Tree Removal for Skier Service Sites (3 acres disturbed) 61 0 0 61
Grading for Skier Service Sites (3 acres disturbed) 84 0 0 84
Revegetation for Skier Service Sites 22 0 0 22
16.0 Greenhouse Gases and Climate Change
November 2013 Page 16-19 DEIR
Project Components Maximum Emissions (metric tons/year)
CO2 CH4 N2O CO2e
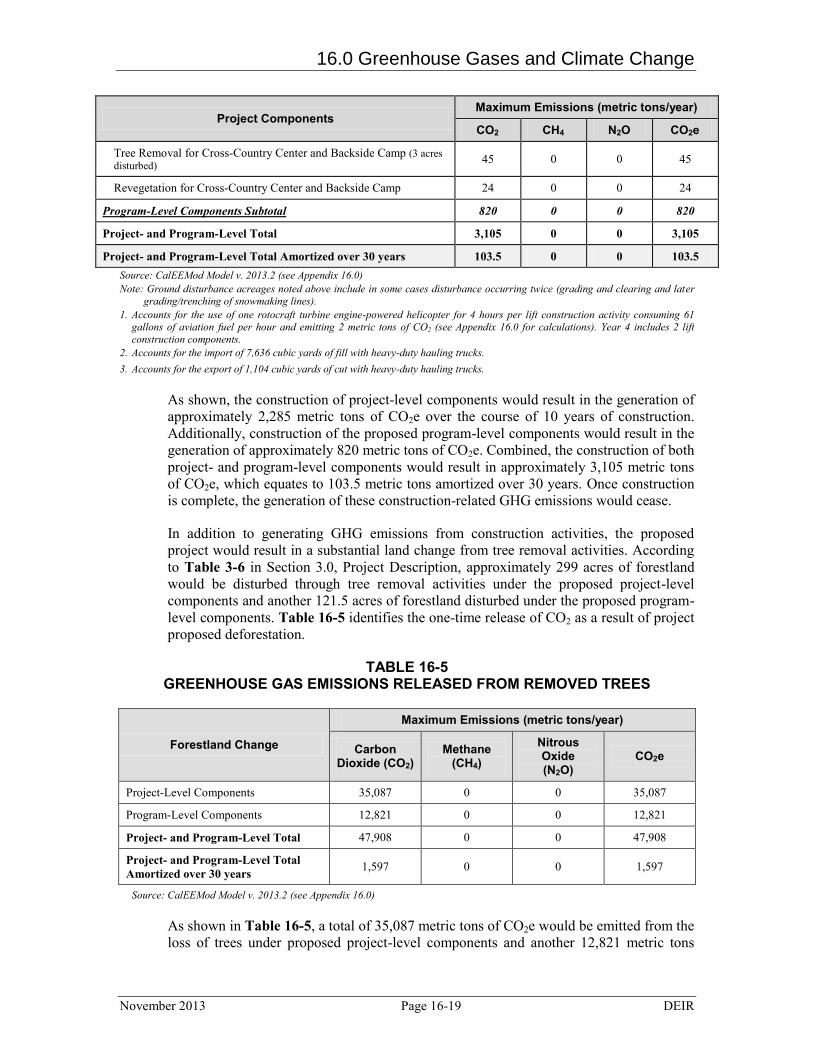
Tree Removal for Cross-Country Center and Backside Camp (3 acres disturbed) 45 0 0 45
Revegetation for Cross-Country Center and Backside Camp 24 0 0 24
Program-Level Components Subtotal 820 0 0 820
Project- and Program-Level Total 3,105 0 0 3,105
Project- and Program-Level Total Amortized over 30 years 103.5 0 0 103.5 Source: CalEEMod Model v. 2013.2 (see Appendix 16.0) Note: Ground disturbance acreages noted above include in some cases disturbance occurring twice (grading and clearing and later
grading/trenching of snowmaking lines). 1. Accounts for the use of one rotocraft turbine engine-powered helicopter for 4 hours per lift construction activity consuming 61
gallons of aviation fuel per hour and emitting 2 metric tons of CO2 (see Appendix 16.0 for calculations). Year 4 includes 2 lift construction components.
2. Accounts for the import of 7,636 cubic yards of fill with heavy-duty hauling trucks. 3. Accounts for the export of 1,104 cubic yards of cut with heavy-duty hauling trucks.
As shown, the construction of project-level components would result in the generation of approximately 2,285 metric tons of CO2e over the course of 10 years of construction. Additionally, construction of the proposed program-level components would result in the generation of approximately 820 metric tons of CO2e. Combined, the construction of both project- and program-level components would result in approximately 3,105 metric tons of CO2e, which equates to 103.5 metric tons amortized over 30 years. Once construction is complete, the generation of these construction-related GHG emissions would cease.
In addition to generating GHG emissions from construction activities, the proposed project would result in a substantial land change from tree removal activities. According to Table 3-6 in Section 3.0, Project Description, approximately 299 acres of forestland would be disturbed through tree removal activities under the proposed project-level components and another 121.5 acres of forestland disturbed under the proposed program-level components. Table 16-5 identifies the one-time release of CO2 as a result of project proposed deforestation.
TABLE 16-5 GREENHOUSE GAS EMISSIONS RELEASED FROM REMOVED TREES
Forestland Change
Maximum Emissions (metric tons/year)
Carbon Dioxide (CO2)
Methane (CH4)
Nitrous Oxide (N2O)
CO2e
Project-Level Components 35,087 0 0 35,087
Program-Level Components 12,821 0 0 12,821
Project- and Program-Level Total 47,908 0 0 47,908
Project- and Program-Level Total Amortized over 30 years 1,597 0 0 1,597
Source: CalEEMod Model v. 2013.2 (see Appendix 16.0)
As shown in Table 16-5, a total of 35,087 metric tons of CO2e would be emitted from the loss of trees under proposed project-level components and another 12,821 metric tons
Northstar Mountain Master Plan EIR
DEIR Page 16-20 November 2013
would be emitted from the loss of trees under the proposed program-level components. When amortized over 30 years, the result is 1,597 metric tons of CO2e.
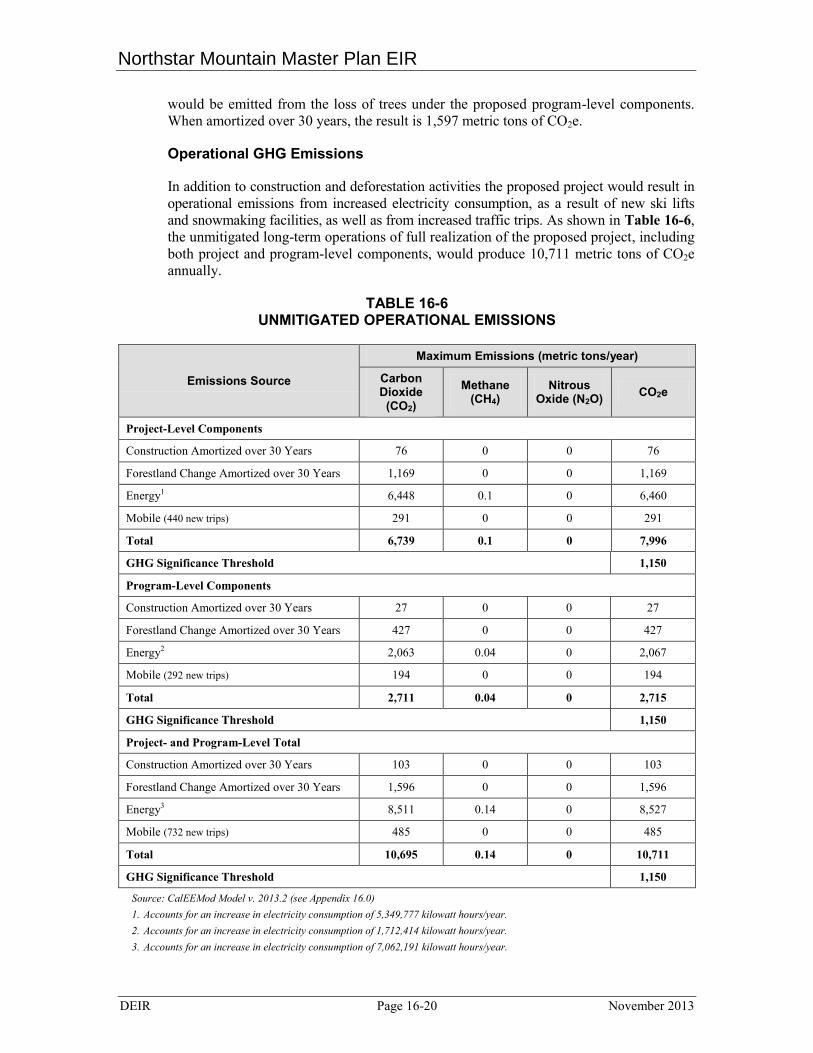
Operational GHG Emissions
In addition to construction and deforestation activities the proposed project would result in operational emissions from increased electricity consumption, as a result of new ski lifts and snowmaking facilities, as well as from increased traffic trips. As shown in Table 16-6, the unmitigated long-term operations of full realization of the proposed project, including both project and program-level components, would produce 10,711 metric tons of CO2e annually.
TABLE 16-6 UNMITIGATED OPERATIONAL EMISSIONS
Emissions Source
Maximum Emissions (metric tons/year)
Carbon Dioxide (CO2)
Methane (CH4)
Nitrous Oxide (N2O) CO2e
Project-Level Components
Construction Amortized over 30 Years 76 0 0 76
Forestland Change Amortized over 30 Years 1,169 0 0 1,169
Energy1 6,448 0.1 0 6,460
Mobile (440 new trips) 291 0 0 291
Total 6,739 0.1 0 7,996
GHG Significance Threshold 1,150
Program-Level Components
Construction Amortized over 30 Years 27 0 0 27
Forestland Change Amortized over 30 Years 427 0 0 427
Energy2 2,063 0.04 0 2,067
Mobile (292 new trips) 194 0 0 194
Total 2,711 0.04 0 2,715
GHG Significance Threshold 1,150
Project- and Program-Level Total
Construction Amortized over 30 Years 103 0 0 103
Forestland Change Amortized over 30 Years 1,596 0 0 1,596
Energy3 8,511 0.14 0 8,527
Mobile (732 new trips) 485 0 0 485
Total 10,695 0.14 0 10,711
GHG Significance Threshold 1,150
Source: CalEEMod Model v. 2013.2 (see Appendix 16.0) 1. Accounts for an increase in electricity consumption of 5,349,777 kilowatt hours/year. 2. Accounts for an increase in electricity consumption of 1,712,414 kilowatt hours/year. 3. Accounts for an increase in electricity consumption of 7,062,191 kilowatt hours/year.

16.0 Greenhouse Gases and Climate Change
November 2013 Page 16-21 DEIR
As shown, the GHG significance threshold would be surpassed under the operation of project- and program-level components. Therefore, the following mitigation is required.
MITIGATION MEASURE 16-1 Mitigate for Greenhouse Gas Impacts from Project Operation
The project applicant shall implement one or more of the following measures to reduce total new greenhouse gas (GHG) emissions associated with the project below 1,150 metric tons annually. To ensure this mitigation remains proportional to the individual impacts of the project, each phase of the development must demonstrate appropriate GHG reduction measures to offset the incremental increase in GHG production prior to approval of Improvement/Grading Plans for that phase. During review of Improvement/Grading Plans for each phase, the project applicant shall provide a report to the Placer County Planning Services Division that describes the suite of options selected to reduce GHG emissions and quantifies the specific reductions according to the California Emissions Estimator Model (CalEEMod) or other model accepted by the California Air Resources Board.
a. Measures to mitigate GHG emissions associated with the project may include the following:
o Plant trees in areas appropriate for restoration or reforestation, such as reclaimed land or sites previously impacted by wildfires. In the Sierra Nevada, conifer species can sequester approximately 0.0367 metric tons of CO2e annually. As an example, the planting of 1,000 trees would sequester 734 metric tons of CO2e over a 20-year period. Assuming a construction time frame of 10 years and 1,000 trees planted annually, the result would be a total sequestration of 7,340 metric tons of CO2e over a 20-year period. In this manner, planting trees annually with each phase of development can offset some or all of the production of GHG emissions by the project. Since climate change is a global issue, not limited to a specific area or air basin, planting may occur on- or off-site provided the planting location is deemed appropriate by the US Forest Service (if forests are on federal lands), by the California Department of Forestry and Fire Protection (Cal Fire) (if forests are on state lands), or by a registered forester. A monitoring, maintenance and reporting plan shall be submitted for review and approval by the Planning Services Division and Placer County Air Pollution Control District prior to approval of Improvement/Grading Plans for each phase.
o Replace existing resort equipment and/or vehicles with newer or more efficient models to reduce water and/or energy consumption.
o Implement emission offsets as new technology becomes available and as determined acceptable by the Placer County Air Pollution Control District and Placer County.
o Increase usage of renewable energy sources.

Northstar Mountain Master Plan EIR
DEIR Page 16-22 November 2013
o Implement transportation management demand measures that decrease the number of vehicle trips to the site, including incentives for employee and guest carpooling, improved public transport, and increased employee housing
o Exceed California minimum energy and water efficiency standards (Title 24, Part 6) in project facilities.
o Demonstrate increased carbon sequestration from implementation of forest management or habitat conservation/enhancement using practices such as those identified in the Northstar Habitat Management Plan and mitigation measure 6-9.
b. Should the project applicant not demonstrate GHG emissions below 1,150 metric tons annually, as required, through item (a) above, prior to approval of the Improvement/Grading Plans for each phase of development, the project applicant shall purchase carbon offset credits that are (1) from the Climate Action Reserve (CAR) registry or other similar entity as determined acceptable by the Placer County Air Pollution Control District (PCAPCD) and Placer County, and (2) quantified through an approved protocol by either the State of California or other similar entity and verified by a qualified verification body accredited by either the Climate Action Reserve or the State of California, or other similar entity as determined acceptable.
These carbon credits would be used to offset both construction and operational GHG emissions of the project. Prior to purchase, the project applicant shall provide an analysis to Placer County and the PCAPCD for review and approval. This analysis shall include the project’s estimated emissions, calculation methodology, and proposed offset purchase. The applicant shall submit either the purchase certification from CAR registry or verification certification issued by a qualified verification body for all carbon offset credits purchased. In either case, the certification received for payment of credit shall indicate that the emissions are “retired.”
Emissions and required offsets associated with specific NMMP project components will utilize emission estimates provided in Draft EIR Tables 16-4 and 16-5. The project applicant will provide documentation of compliance for review and approval by Placer County and the PCAPCD as a condition of final approval.
SIGNIFICANCE AFTER MITIGATION
Mitigation measures 10-2b through 10-2d in Section 10.0, Air Quality, would substantially reduce GHG emissions during construction. These items include the requirement to reduce the project-wide fleet average by 20 percent for nitrous oxide (NOx) as compared to CARB statewide fleet average emissions which would also reduce GHG emissions. Mitigation measure 6-9 implements habitat mitigation measures identified in Section 6.0, Biological Resources, which would mandate forest enhancement plans and conservation areas, as identified in the Northstar Habitat Management Plan (HMP), that lead to the sequestration of GHG emissions from the atmosphere and reduction of the risk for catastrophic wildfire. The purpose of the HMP is to achieve habitat management goals and provide a programmatic framework for long-
16.0 Greenhouse Gases and Climate Change
November 2013 Page 16-23 DEIR
term management, conservation, and monitoring of biological resources at Northstar while allowing for reasonable economic uses for development and recreational activities. Biological mitigation measure 6-9 requires 1:1 forest enhancement treatments for the project site for late-seral forest, riparian, and conifer forest habitat. Mitigation measure 16-1 above would require the project to demonstrate reduction of its GHG emissions to below 1,150 metric tons annually through various mitigation measures and/or the purchase of carbon offsets. The Climate Action Reserve utilizes a standardized approach for the independent and rigorous verification of GHG emissions reductions reported by project developers into its offset registry. This standardized approach defines a verification process that promotes the relevance, completeness, consistency, accuracy, transparency and conservativeness of emissions reductions data reported in the CAR. The CAR has approval from the California Air Resources Board (CARB) to serve as an Offset Project Registry for the Compliance Offset Program under the State’s Cap-and-Trade Program. Thus, implementation of these mitigation measures would reduce the project’s increase in GHG emissions to less than significant.
IMPACT 16.2: AB 32 Compliance
The project is considered to have a significant impact if it would be in conflict with the AB 32 goals for reducing GHG emissions. In December 2008, CARB approved the AB 32 Scoping Plan outlining the State’s strategy to achieve the 2020 GHG emissions limit. This Scoping Plan, developed by CARB, proposes a comprehensive set of actions designed to reduce overall GHG emissions in California, improve the environment, reduce dependence on oil, diversify California’s energy sources, save energy, create new jobs, and enhance public health. As shown under the impact analysis below, the proposed project would contribute to the generation of GHG emissions, primarily from electricity consumption and tree removal activities. Therefore, this DEIR assesses the project’s potential to result in a significant GHG impact by determining its consistency with the AB 32 Scoping Plan and Senate Bill 2X (Renewables Portfolio Standard), which both require 33 percent of supply from renewable energy sources by 2020, and its consistency with AB 32 Scoping Plan GHG reduction measure F-1, Sustainable Forest Target, which sets the goal of planting 5 million trees statewide by the year 2020. The Northstar Habitat Management Plan and mitigation measure 6-9 (habitat mitigation) are consistent with reduction measure F-1.
In terms of electric service, the project site is currently within the service area of the energy provider Liberty Utilities CalPeco. Therefore, for the purposes of this analysis, project-estimated electrical use consumption is compared to Liberty Utilities CalPeco’s ability to comply with AB 32 Scoping Plan Strategy E-3, Renewables Portfolio Standard.
According to the California Public Utilities Commission (2012), Liberty Utility CalPeco currently serves approximately 49,000 customers in California. Table 16-7 identifies the most recently available electric energy information for Liberty Utilities CalPeco as well as the current renewable energy mix.
Northstar Mountain Master Plan EIR
DEIR Page 16-24 November 2013
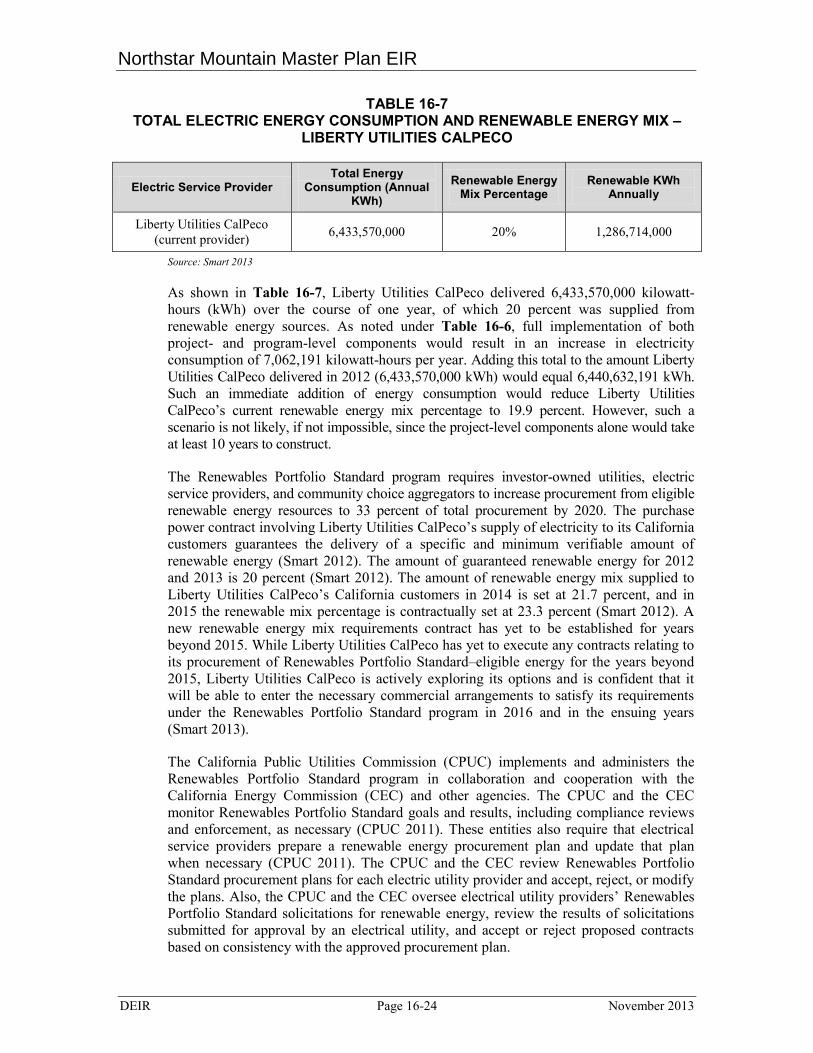
TABLE 16-7 TOTAL ELECTRIC ENERGY CONSUMPTION AND RENEWABLE ENERGY MIX –
LIBERTY UTILITIES CALPECO
Electric Service Provider Total Energy
Consumption (Annual KWh)
Renewable Energy Mix Percentage
Renewable KWh Annually
Liberty Utilities CalPeco (current provider) 6,433,570,000 20% 1,286,714,000
Source: Smart 2013
As shown in Table 16-7, Liberty Utilities CalPeco delivered 6,433,570,000 kilowatt-hours (kWh) over the course of one year, of which 20 percent was supplied from renewable energy sources. As noted under Table 16-6, full implementation of both project- and program-level components would result in an increase in electricity consumption of 7,062,191 kilowatt-hours per year. Adding this total to the amount Liberty Utilities CalPeco delivered in 2012 (6,433,570,000 kWh) would equal 6,440,632,191 kWh. Such an immediate addition of energy consumption would reduce Liberty Utilities CalPeco’s current renewable energy mix percentage to 19.9 percent. However, such a scenario is not likely, if not impossible, since the project-level components alone would take at least 10 years to construct.
The Renewables Portfolio Standard program requires investor-owned utilities, electric service providers, and community choice aggregators to increase procurement from eligible renewable energy resources to 33 percent of total procurement by 2020. The purchase power contract involving Liberty Utilities CalPeco’s supply of electricity to its California customers guarantees the delivery of a specific and minimum verifiable amount of renewable energy (Smart 2012). The amount of guaranteed renewable energy for 2012 and 2013 is 20 percent (Smart 2012). The amount of renewable energy mix supplied to Liberty Utilities CalPeco’s California customers in 2014 is set at 21.7 percent, and in 2015 the renewable mix percentage is contractually set at 23.3 percent (Smart 2012). A new renewable energy mix requirements contract has yet to be established for years beyond 2015. While Liberty Utilities CalPeco has yet to execute any contracts relating to its procurement of Renewables Portfolio Standard–eligible energy for the years beyond 2015, Liberty Utilities CalPeco is actively exploring its options and is confident that it will be able to enter the necessary commercial arrangements to satisfy its requirements under the Renewables Portfolio Standard program in 2016 and in the ensuing years (Smart 2013).
The California Public Utilities Commission (CPUC) implements and administers the Renewables Portfolio Standard program in collaboration and cooperation with the California Energy Commission (CEC) and other agencies. The CPUC and the CEC monitor Renewables Portfolio Standard goals and results, including compliance reviews and enforcement, as necessary (CPUC 2011). These entities also require that electrical service providers prepare a renewable energy procurement plan and update that plan when necessary (CPUC 2011). The CPUC and the CEC review Renewables Portfolio Standard procurement plans for each electric utility provider and accept, reject, or modify the plans. Also, the CPUC and the CEC oversee electrical utility providers’ Renewables Portfolio Standard solicitations for renewable energy, review the results of solicitations submitted for approval by an electrical utility, and accept or reject proposed contracts based on consistency with the approved procurement plan.
16.0 Greenhouse Gases and Climate Change
November 2013 Page 16-25 DEIR
The Liberty Utilities CalPeco electric service provider is overseen, through the requirement of submitting renewable energy procurement plans, by the CPUC and the CEC, which accept, reject, or modify these procurement plans as needed and review the results of solicitations submitted for approval by an electrical utility, such as Liberty Utilities CalPeco, and accept or reject proposed contracts based on consistency with the approved procurement plan.
For the reasons above, the proposed project would not conflict with AB 32 goals for reducing GHG emissions from electricity consumption. Liberty Utilities CalPeco is expected to achieve the mandated requirements of the Renewables Portfolio Standard program regardless of the additional electricity consumption proposed by the project due to CPUC and CEC oversight.
AB 32 Scoping Plan GHG reduction measure F-1, Sustainable Forest Target, sets the goal of planting 5 million trees statewide by the year 2020. While the project proposes to ultimately remove trees on up to 420 acres of forest lands, mitigation measure 6-9 requires forest enhancement treatments and a conservation area effort, to ensure no net loss of the habitat in Northstar. These measures have a benefit to GHG through forest enhancement treatments that would result in increased timber growth rates, healthier forest stands and carbon sequestration as well as the reduction of the likelihood of catastrophic fire. Additionally, these lands would be protected from future development thus the benefit would remain in perpetuity. The purpose of the Northstar HMP is to achieve habitat management goals and provide a programmatic framework for long-term management, conservation, and monitoring of biological resources at Northstar while allowing for reasonable economic uses for development and recreational activities.
The proposed project would not conflict with AB 32 goals for reducing GHG emissions, since Liberty Utilities CalPeco is expected to achieve the mandated requirements of the Renewables Portfolio Standard program due to CPUC and CEC oversight. This impact is therefore less than cumulatively considerable.
CEQA & Climate Change Evaluating and Addressing Greenhouse Gas Emissions from Projects Subject to the California Environmental Quality Act
January 2008

Disclaimer
The California Air Pollution Control Officers Association (CAPCOA) has prepared this white paper consideration of evaluating and addressing greenhouse gas emissions under the California Environmental Quality Act (CEQA) to provide a common platform of information and tools to support local governments. This paper is intended as a resource, not a guidance document. It is not intended, and should not be interpreted, to dictate the manner in which an air district or lead agency chooses to address greenhouse gas emissions in the context of its review of projects under CEQA. This paper has been prepared at a time when California law has been recently amended by the Global Warming Solutions Act of 2006 (AB 32), and the full programmatic implications of this new law are not yet fully understood. There is also pending litigation in various state and federal courts pertaining to the issue of greenhouse gas emissions. Further, there is active federal legislation on the subject of climate change, and international agreements are being negotiated. Many legal and policy questions remain unsettled, including the requirements of CEQA in the context of greenhouse gas emissions. This paper is provided as a resource for local policy and decision makers to enable them to make the best decisions they can in the face of incomplete information during a period of change. Finally, this white paper reviews requirements and discusses policy options, but it is not intended to provide legal advice and should not be construed as such. Questions of legal interpretation, particularly in the context of CEQA and other laws, or requests for advice should be directed to the agency’s legal counsel.
i
Acknowledgements
This white paper benefited from the hard work and creative insights of many people. CAPCOA appreciates the efforts of all who contributed their time and energy to the project. In particular, the Association thanks the following individuals:
Principal Authors
Greg Tholen, BAAQMD Matt Jones, YSAQMD Dave Vintze, BAAQMD Larry Robinson, SMAQMD Jean Getchell, MBUAPCD Ron Tan, SBCAPCD
Editor Barbara Lee, NSAPCD
Reviewers
External Reviewers James Goldstene, CARB Annmarie Mora, CARB Terri Roberts, OPR
Proofing & Layout Jake Toolson, CAPCOA John Yu, CAPCOA
Contract Support Jones & Stokes, Sacramento, CA (analysis of non-zero threshold approaches)
EDAW, Inc., Sacramento, CA (review of analytical methods and mitigation strategies).
CAPCOA Climate Protection Committee
Barbara Lee (NSCAPCD), Chair
Larry Allen, SLOCPCD Bobbie Bratz, SBAPCD Karen Brooks, SLOCAPCD Chris Brown, MCAQMD Tom Christofk, PCAPCD Jorge DeGuzman, SMAQMD Mat Ehrhardt, YSAQMD Jean Getchell, MBUAPCD Larry Greene, SMAQMD Henry Hilken, BAAQMD Alan Hobbs, PCAPCD Jim Jester, SMAQMD Dave Jones, KCAPCD Tom Jordan, SJVUAPCD Tom Murphy, SBAPCD Don Price, VCAPCD Jean Roggenkamp, BAAQMD Ana Sandoval, BAAQMD Amy Taketomo, MBUAPCD Tim Taylor, SMAQMD Mike Villegas, VCAPCD David Vintze, BAAQMD Dave Warner, SJVUAPCD Jill Whynot, SCAQMD John Yu, CAPCOA Mel Zeldin, CAPCOA
CAPCOA Planning Managers: CEQA & Climate Change Subcommittee
Dave Vintze (BAAQMD), Chair Greg Tholen (BAAQMD), Project Manager
Charles Anderson, SMAQMD Aeron Arlin Genet, SLOCAPCD Jean Getchell, MBUAPCD Melissa Guise, SLOCAPCD Matt Jones, YSAQMD Barbara Lee, NSCAPCD Ryan Murano, NSAQMD Tom Murphy, SBCAPCD Susan Nakamura, SCAQMD Larry Robinson, SMAQMD Jean Roggenkamp, BAAQMD Ana Sandoval, BAAQMD Ron Tan, SBCAPCD Brigette Tollstrup, SMAQMD Jill Whynot, SCAQMD
ii
Table of Contents
Executive Summary ..................................................................................1
Chapter
1. Introduction...............................................................................................5
2. Air Districts and CEQA Thresholds .......................................................11
3. Consideration of Fundamental Issues .....................................................13
4. Consideration of a Statewide Threshold .................................................21
5. CEQA with No GHG Thresholds ...........................................................23
6. CEQA With GHG Threshold of Zero.....................................................27
7. CEQA With Non-Zero Thresholds .........................................................31
Approach 1: Statute and Executive Order Approach..............................32
Approach 2: Tiered Approach ................................................................36
8. Analytical Methodologies for GHG........................................................59
9. Mitigation Strategies for GHG................................................................79
10. Examples of Other Approaches ..............................................................85
Appendix A – Relevant Citations
Appendix B – Mitigation Measure Summary
Appendix C – Rule and Regulation Summary
iii
List of Figures Figure 1 – Climate Change Significance Criteria Flow Chart......................................38
List of Tables
Table 1 – Analysis of GHG Emissions from Stationary Combustion Equipment
Permits ......................................................................................................18
Table 2 – Approach 2 Tiering Options ..........................................................................41
Table 3 – Comparison of Approach 2 Tiered Threshold Options .................................49
Table 4 – Non-Zero Threshold Evaluation Matrix – Approach 1 .................................56
Table 5 – Non-Zero Threshold Evaluation Matrix – Approach 2 .................................57
Table 6 – Residential Project Example GHG Emissions Estimates ..............................62
Table 7 – Commercial Project Example GHG Emissions Estimates ............................63
Table 8 – Specific Plan Example GHG Emissions Estimates .......................................64
Table 9 – General Plan Example GHG Emissions Estimates........................................68
Table 10 – Summary of Modeling Tools for GHG Emissions ......................................75
Table 11 – Residential Project Example GHG Emissions Estimates with Mitigation ..81
Table 12 – Residential Projects Example Methodology and Mitigation .......................82
Table 13 – Commercial Projects Example Methodology and Mitigation .....................82
Table 14 – Specific Plans Example Methodology and Mitigation ................................83
Table 15 – General Plans Example Methodology and Mitigation.................................83
Table 16 – Mitigation Measure Summary .....................................................................B-1
Table 17 – General Planning Level Mitigation Strategies Summary ............................B-35
Table 18 – Rule and Regulation Summary ....................................................................C-1
iv
List of Acronyms and Abbreviations
Acronym/ Abbreviation Meaning AB 32 Assembly Bill 32 Global Warming Solutions Act of 2006 AG Attorney General ARB Air Resources Board ASTM American Society of Testing and Material BAAQMD Bay Area Air Quality Management District BAU Business as Usual BEES Building for Environmental and Economic Sustainability Calfire California Fire Caltrans California Department of Transportation CAP Criteria Air Pollutants CAPCOA California Air Pollution Control Officers Association CARB California Air Resource Board CAT Climate Action Team CCAP Center for Clean Air Policy CCAR California Climate Action Registry CDFA California Department of Food and Agriculture CEC California Energy Commission CEQA California Environmental Quality Act CF Connectivity Factor CH4 Methane CIWMB California Integrated Waste Management Board CO Carbon Monoxide CO2 Carbon Dioxide CNG Compressed Natural Gas CPUC California Public Utilities Commission CUFR California Urban Forestry DGS Department of General Services DOE U.S. Department of Energy DOF Department of Finance DPF Diesel Particulate Filter DWR Department of Water Resources E85 85% Ethanol EEA Massachusetts Executive Office of Energy and Environmental Affairs EERE Energy Efficiency and Renewable Energy EIR Environmental Impact Report EOE Encyclopedia of Earth EPA U.S. Environmental Protection Agency ETC Edmonton Trolley Coalition EV Electric Vehicles FAR Floor Area Ratio
v
GHG Greenhouse Gas GGEP Greenhouse Gas Emissions Policy GGRP Greenhouse Gas Reduction Plan GP General Plan GWP Global Warming Potential IGCC Integrated Gasification Combined Cycle IOU Investor Owned Utility IPCC International Panel on Climate Change IT Information Technology ITE Institute of Transportation Engineers J&S Jones & Stokes km Kilometer LandGem Landfill Gas Emissions Model LEED Leadership in Energy and Environmental Design LNG Liquefied Natural Gas MBUAPCD Monterey Bay Unified Air Pollution Control District MEPA Massachusetts Environmental Policy Act MND Mitigated Negative Declaration MMT CO2e Million Metric Tons Carbon Dioxide Equivalent MW Megawatts N2O Nitrous Oxide NACAA National Association Clean Air Agencies ND Negative Declaration NEV Neighborhood Electric Vehicle NIST National Institute of Standards and Technology NOX Oxides of Nitrogen NREL National Renewable Energy Laboratory NSCAPCD Northern Sonoma County Air Pollution Control District NSR New Source Review OPR State Office of Planning and Research PFC Perfluorocarbon PG&E Pacific Gas & Electric POU Publicly Owned Utility PM Particulate Mater RoadMod Road Construction Emissions Model ROG Reactive Organic Gas RPS Renewable Portfolio Standards RTP Regional Transportation Plan S-3-05 Executive Order S-3-05 SB Senate Bill SBCAPCD Santa Barbara County Air Pollution Control District SCAQMD South Coast Air Quality Management District SCM Sustainable Communities Model SIP State Implementation Plan SJVAPCD San Joaquin Valley Unified Air Pollution Control District SLOCAPCD San Luis Obispo County Air Pollution Control District
vi
SMAQMD Sacramento Metropolitan Air Quality Management District SMUD Sacramento Municipal Utilities District SOX Sulfur Oxides SP Service Population SRI Solar Reflectance Index SWP State Water Project TAC Toxic Air Contaminants TBD To Be Determined TDM Transportation Demand Management TMA Transportation Management Association THC Total Hydrocarbon UC University of California ULEV Ultra Low Emission Vehicle UNFCCC United Nations Framework Convention on Climate Change URBEMIS Urban Emissions Model USGBC U.S. Green Building Council VMT Vehicle Miles Traveled VTPI Victoria Transit Policy YSAQMD Yolo-Solano Air Quality Management District
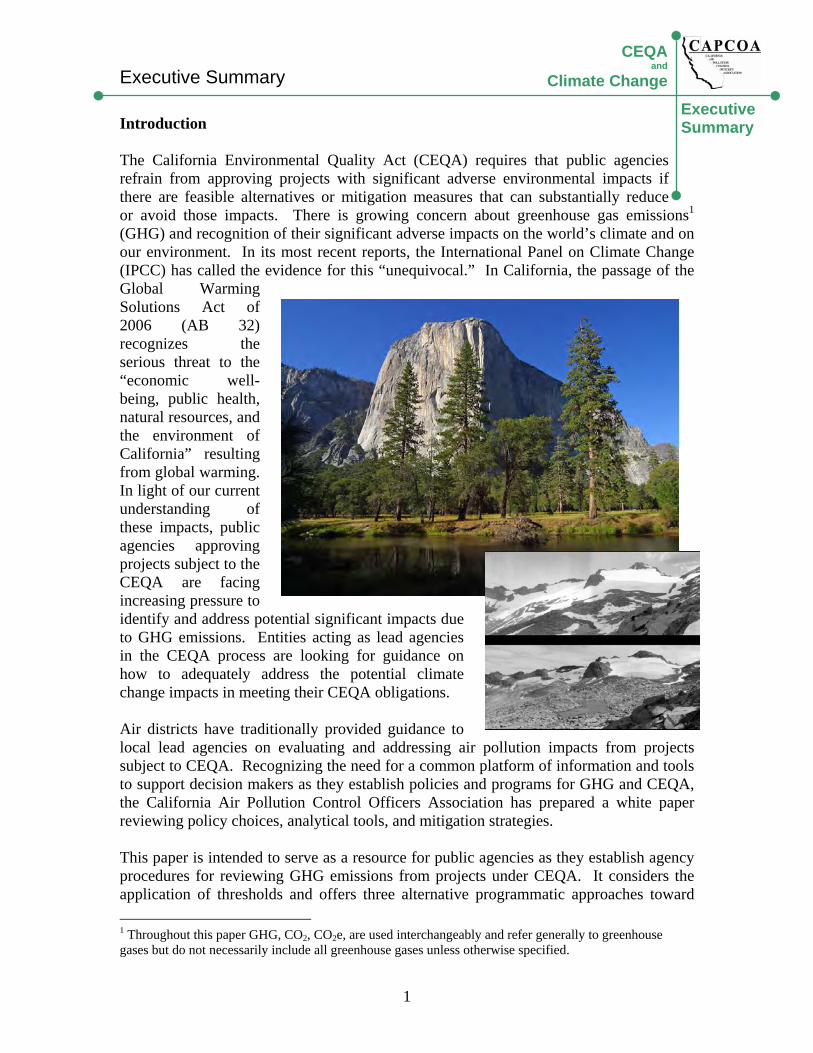
Executive Summary
1
CEQAand
Climate Change
Executive Summary
Introduction The California Environmental Quality Act (CEQA) requires that public agencies refrain from approving projects with significant adverse environmental impacts if there are feasible alternatives or mitigation measures that can substantially reduce or avoid those impacts. There is growing concern about greenhouse gas emissions1 (GHG) and recognition of their significant adverse impacts on the world’s climate and on our environment. In its most recent reports, the International Panel on Climate Change (IPCC) has called the evidence for this “unequivocal.” In California, the passage of the Global Warming Solutions Act of 2006 (AB 32) recognizes the serious threat to the “economic well-being, public health, natural resources, and the environment of California” resulting from global warming. In light of our current understanding of these impacts, public agencies approving projects subject to the CEQA are facing increasing pressure to identify and address potential significant impacts due to GHG emissions. Entities acting as lead agencies in the CEQA process are looking for guidance on how to adequately address the potential climate change impacts in meeting their CEQA obligations. Air districts have traditionally provided guidance to local lead agencies on evaluating and addressing air pollution impacts from projects subject to CEQA. Recognizing the need for a common platform of information and tools to support decision makers as they establish policies and programs for GHG and CEQA, the California Air Pollution Control Officers Association has prepared a white paper reviewing policy choices, analytical tools, and mitigation strategies. This paper is intended to serve as a resource for public agencies as they establish agency procedures for reviewing GHG emissions from projects under CEQA. It considers the application of thresholds and offers three alternative programmatic approaches toward 1 Throughout this paper GHG, CO2, CO2e, are used interchangeably and refer generally to greenhouse gases but do not necessarily include all greenhouse gases unless otherwise specified.
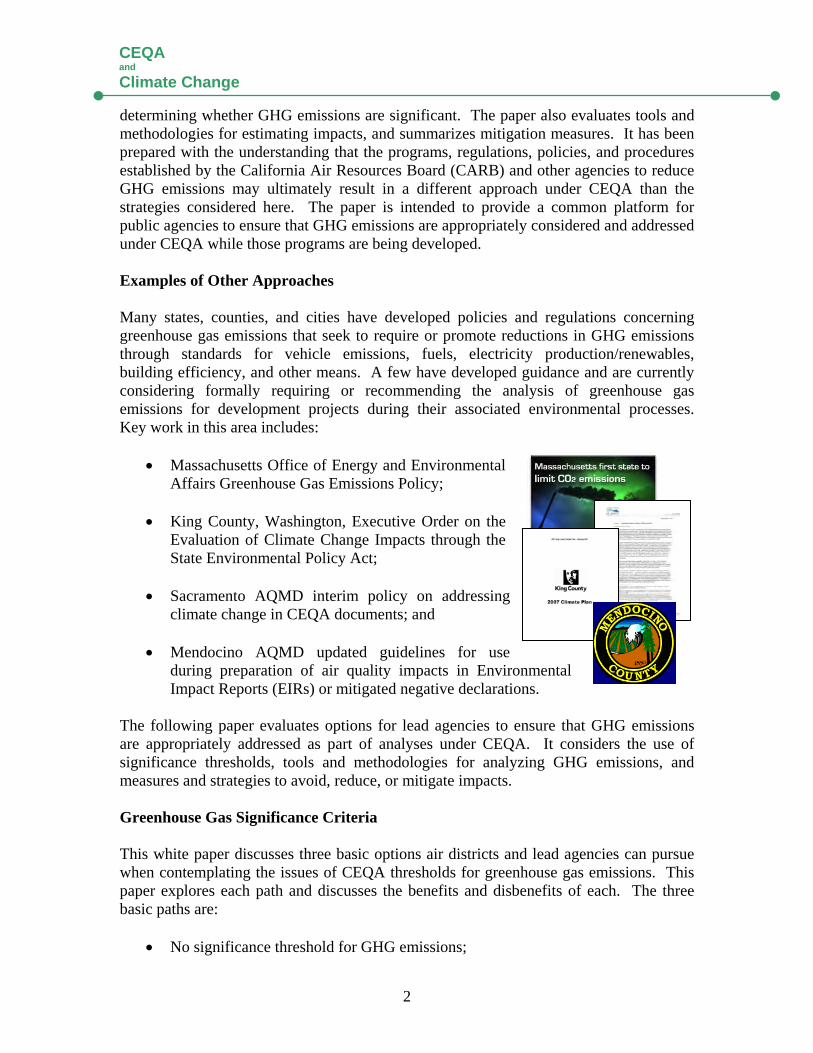
2
CEQA and
Climate Change
determining whether GHG emissions are significant. The paper also evaluates tools and methodologies for estimating impacts, and summarizes mitigation measures. It has been prepared with the understanding that the programs, regulations, policies, and procedures established by the California Air Resources Board (CARB) and other agencies to reduce GHG emissions may ultimately result in a different approach under CEQA than the strategies considered here. The paper is intended to provide a common platform for public agencies to ensure that GHG emissions are appropriately considered and addressed under CEQA while those programs are being developed. Examples of Other Approaches Many states, counties, and cities have developed policies and regulations concerning greenhouse gas emissions that seek to require or promote reductions in GHG emissions through standards for vehicle emissions, fuels, electricity production/renewables, building efficiency, and other means. A few have developed guidance and are currently considering formally requiring or recommending the analysis of greenhouse gas emissions for development projects during their associated environmental processes. Key work in this area includes:
• Massachusetts Office of Energy and Environmental Affairs Greenhouse Gas Emissions Policy;
• King County, Washington, Executive Order on the
Evaluation of Climate Change Impacts through the State Environmental Policy Act;
• Sacramento AQMD interim policy on addressing
climate change in CEQA documents; and
• Mendocino AQMD updated guidelines for use during preparation of air quality impacts in Environmental Impact Reports (EIRs) or mitigated negative declarations.
The following paper evaluates options for lead agencies to ensure that GHG emissions are appropriately addressed as part of analyses under CEQA. It considers the use of significance thresholds, tools and methodologies for analyzing GHG emissions, and measures and strategies to avoid, reduce, or mitigate impacts. Greenhouse Gas Significance Criteria This white paper discusses three basic options air districts and lead agencies can pursue when contemplating the issues of CEQA thresholds for greenhouse gas emissions. This paper explores each path and discusses the benefits and disbenefits of each. The three basic paths are:
• No significance threshold for GHG emissions;
3
CEQAand
Climate Change
Executive Summary
• GHG emissions threshold set at zero; or • GHG threshold set at a non-zero level.
Each has inherent advantages and disadvantages. Air districts and lead agencies may believe the state or national government should take the lead in identifying significance thresholds to address this global impact. Alternatively, the agency may believe it is premature or speculative to determine a clear level at which a threshold should be set. On the other hand, air districts or lead agencies may believe that every GHG emission should be scrutinized and mitigated or offset due to the cumulative nature of this impact. Setting the threshold at zero will place all discretionary projects under the CEQA microscope. Finally, an air district or lead agency may believe that some projects will not benefit from a full environmental impact report (EIR), and may believe a threshold at some level above zero is needed. This paper explores the basis and implications of setting no threshold, setting a threshold at zero and two primary approaches for those who may choose to consider a non-zero threshold. The first approach is grounded in statute (AB 32) and executive order (EO S-3-05) and explores four possible options under this scenario. The options under this approach are variations of ways to achieve the 2020 goals of AB 32 from new development, which is estimated to be about a 30 percent reduction from business as usual. The second approach explores a tiered threshold option. Within this option, seven variations are discussed. The concepts explored here offer both quantitative and qualitative approaches to setting a threshold as well as different metrics by which tier cut-points can be set. Variations range from setting the first tier cut-point at zero to second-tier cut-points set at defined emission levels or based on the size of a project. It should be noted that some applications of the tiered threshold approach may require inclusion in a General Plan or adoption of enabling regulations or ordinances to render them fully effective and enforceable. Greenhouse Gas Analytical Methodologies The white paper evaluates various analytical methods and modeling tools that can be applied to estimate the greenhouse gas emissions from different project types subject to CEQA. In addition, the suitability of the methods and tools to characterize accurately a project’s emissions is discussed and the paper provides recommendations for the most appropriate methodologies and tools currently available. The suggested methodologies are applied to residential, commercial, specific plan and general plan scenarios where GHG emissions are estimated for each example. This chapter also discusses estimating emissions from solid waste facilities, a wastewater treatment plant, construction, and air district rules and plans.
4
CEQA and
Climate Change
Another methodology, a service population metric, that would measure a project’s overall GHG efficiency to determine if a project is more efficient than the existing statewide average for per capita GHG emissions is explored. This methodology may be more directly correlated to a project’s ability to help achieve objectives outlined in AB 32, although it relies on establishment of an efficiency-based significance threshold. The subcommittee believes this methodology may eventually be appropriate to evaluate the long-term GHG emissions from a project in the context of meeting AB 32 goals. However, this methodology will need further work and is not considered viable for the interim guidance presented in this white paper. Greenhouse Gas Mitigation Measures Common practice in environmental protection is first to avoid, then to minimize, and finally to compensate for impacts. When an impact cannot be mitigated on-site, off-site mitigation can be effectively implemented in several resource areas, either in the form of offsetting the same impact or preserving the resource elsewhere in the region. This white paper describes and evaluates currently available mitigation measures based on their economic, technological and logistical feasibility, and emission reduction effectiveness. The potential for secondary impacts to air quality are also identified for each measure. A summary of current rules and regulations affecting greenhouse gas emissions and climate change is also provided.
Reductions from transportation related measures (e.g., bicycle, pedestrian, transit, and parking) are explored as a single comprehensive approach to land use. Design measures that focus on enhancing alternative transportation are discussed. Mitigation measures are identified for transportation, land use/building design, mixed-use development, energy efficiency, education/social awareness and construction.
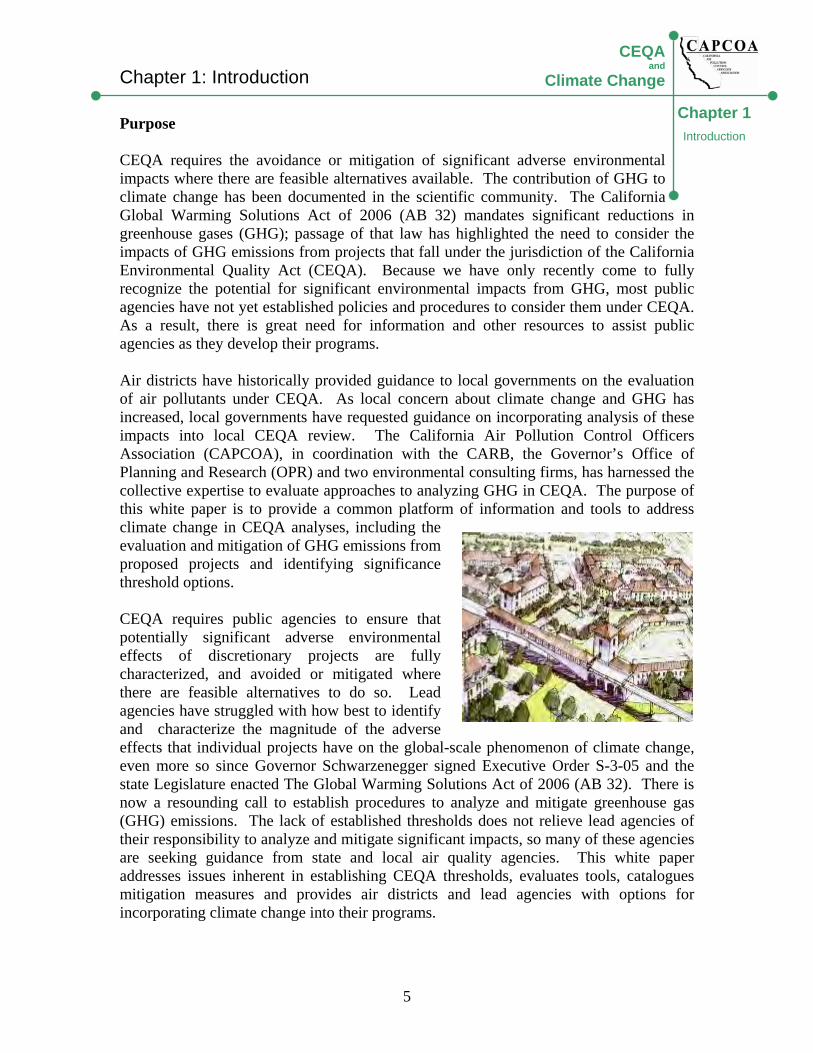
Chapter 1: Introduction
5
CEQAand
Climate Change
Chapter 1
Introduction
Purpose CEQA requires the avoidance or mitigation of significant adverse environmental impacts where there are feasible alternatives available. The contribution of GHG to climate change has been documented in the scientific community. The California Global Warming Solutions Act of 2006 (AB 32) mandates significant reductions in greenhouse gases (GHG); passage of that law has highlighted the need to consider the impacts of GHG emissions from projects that fall under the jurisdiction of the California Environmental Quality Act (CEQA). Because we have only recently come to fully recognize the potential for significant environmental impacts from GHG, most public agencies have not yet established policies and procedures to consider them under CEQA. As a result, there is great need for information and other resources to assist public agencies as they develop their programs. Air districts have historically provided guidance to local governments on the evaluation of air pollutants under CEQA. As local concern about climate change and GHG has increased, local governments have requested guidance on incorporating analysis of these impacts into local CEQA review. The California Air Pollution Control Officers Association (CAPCOA), in coordination with the CARB, the Governor’s Office of Planning and Research (OPR) and two environmental consulting firms, has harnessed the collective expertise to evaluate approaches to analyzing GHG in CEQA. The purpose of this white paper is to provide a common platform of information and tools to address climate change in CEQA analyses, including the evaluation and mitigation of GHG emissions from proposed projects and identifying significance threshold options. CEQA requires public agencies to ensure that potentially significant adverse environmental effects of discretionary projects are fully characterized, and avoided or mitigated where there are feasible alternatives to do so. Lead agencies have struggled with how best to identify and characterize the magnitude of the adverse effects that individual projects have on the global-scale phenomenon of climate change, even more so since Governor Schwarzenegger signed Executive Order S-3-05 and the state Legislature enacted The Global Warming Solutions Act of 2006 (AB 32). There is now a resounding call to establish procedures to analyze and mitigate greenhouse gas (GHG) emissions. The lack of established thresholds does not relieve lead agencies of their responsibility to analyze and mitigate significant impacts, so many of these agencies are seeking guidance from state and local air quality agencies. This white paper addresses issues inherent in establishing CEQA thresholds, evaluates tools, catalogues mitigation measures and provides air districts and lead agencies with options for incorporating climate change into their programs.
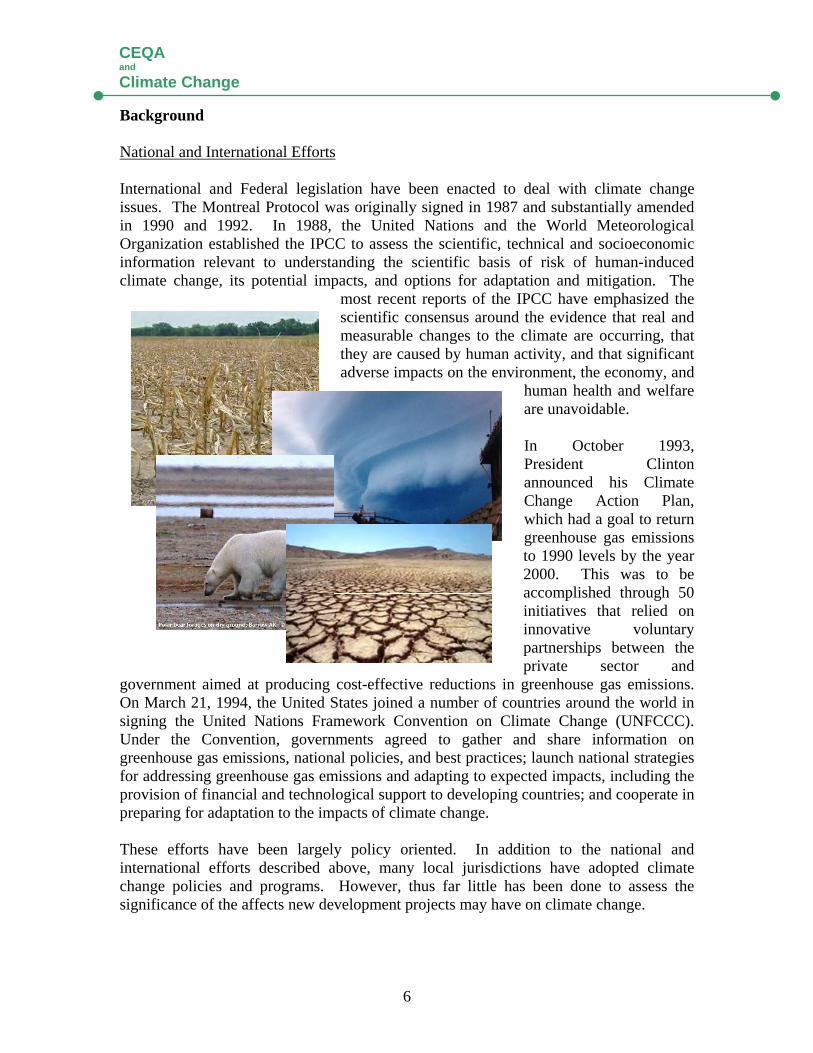
6
CEQA and
Climate Change
Background National and International Efforts International and Federal legislation have been enacted to deal with climate change issues. The Montreal Protocol was originally signed in 1987 and substantially amended in 1990 and 1992. In 1988, the United Nations and the World Meteorological Organization established the IPCC to assess the scientific, technical and socioeconomic information relevant to understanding the scientific basis of risk of human-induced climate change, its potential impacts, and options for adaptation and mitigation. The
most recent reports of the IPCC have emphasized the scientific consensus around the evidence that real and measurable changes to the climate are occurring, that they are caused by human activity, and that significant adverse impacts on the environment, the economy, and
human health and welfare are unavoidable. In October 1993, President Clinton announced his Climate Change Action Plan, which had a goal to return greenhouse gas emissions to 1990 levels by the year 2000. This was to be accomplished through 50 initiatives that relied on innovative voluntary partnerships between the private sector and
government aimed at producing cost-effective reductions in greenhouse gas emissions. On March 21, 1994, the United States joined a number of countries around the world in signing the United Nations Framework Convention on Climate Change (UNFCCC). Under the Convention, governments agreed to gather and share information on greenhouse gas emissions, national policies, and best practices; launch national strategies for addressing greenhouse gas emissions and adapting to expected impacts, including the provision of financial and technological support to developing countries; and cooperate in preparing for adaptation to the impacts of climate change. These efforts have been largely policy oriented. In addition to the national and international efforts described above, many local jurisdictions have adopted climate change policies and programs. However, thus far little has been done to assess the significance of the affects new development projects may have on climate change.
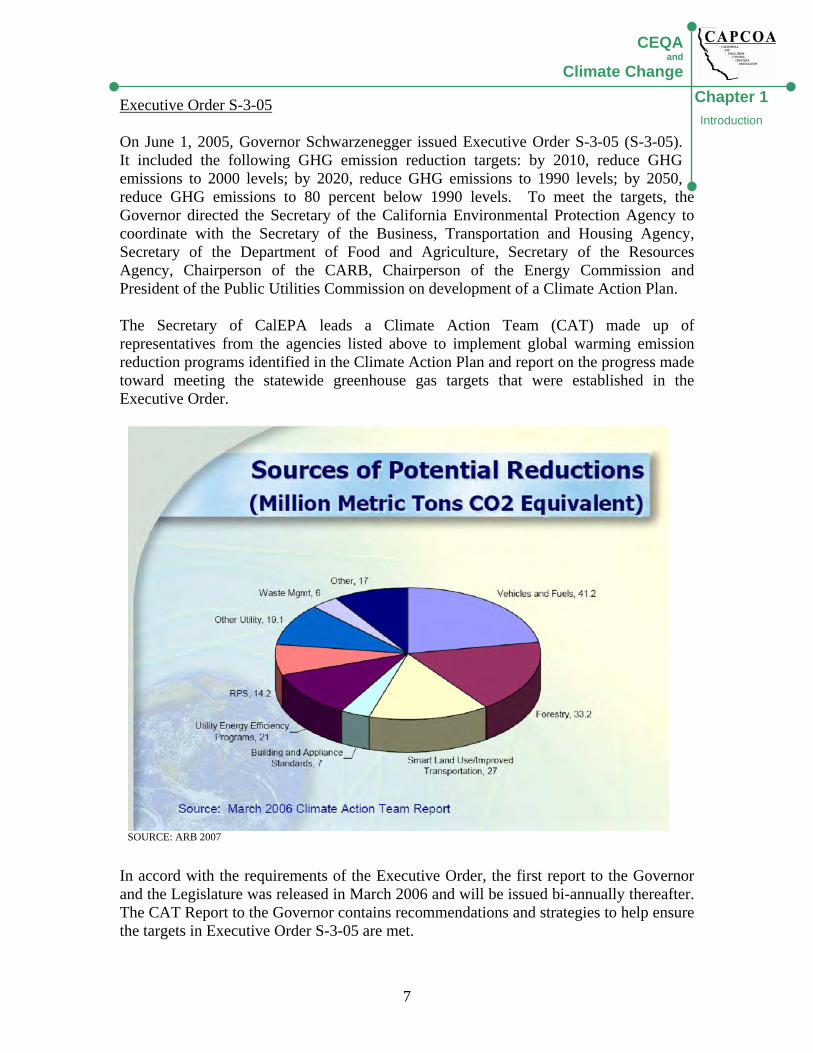
7
CEQAand
Climate Change Chapter 1
Introduction
Executive Order S-3-05 On June 1, 2005, Governor Schwarzenegger issued Executive Order S-3-05 (S-3-05). It included the following GHG emission reduction targets: by 2010, reduce GHG emissions to 2000 levels; by 2020, reduce GHG emissions to 1990 levels; by 2050, reduce GHG emissions to 80 percent below 1990 levels. To meet the targets, the Governor directed the Secretary of the California Environmental Protection Agency to coordinate with the Secretary of the Business, Transportation and Housing Agency, Secretary of the Department of Food and Agriculture, Secretary of the Resources Agency, Chairperson of the CARB, Chairperson of the Energy Commission and President of the Public Utilities Commission on development of a Climate Action Plan. The Secretary of CalEPA leads a Climate Action Team (CAT) made up of representatives from the agencies listed above to implement global warming emission reduction programs identified in the Climate Action Plan and report on the progress made toward meeting the statewide greenhouse gas targets that were established in the Executive Order.
In accord with the requirements of the Executive Order, the first report to the Governor and the Legislature was released in March 2006 and will be issued bi-annually thereafter. The CAT Report to the Governor contains recommendations and strategies to help ensure the targets in Executive Order S-3-05 are met.
SOURCE: ARB 2007
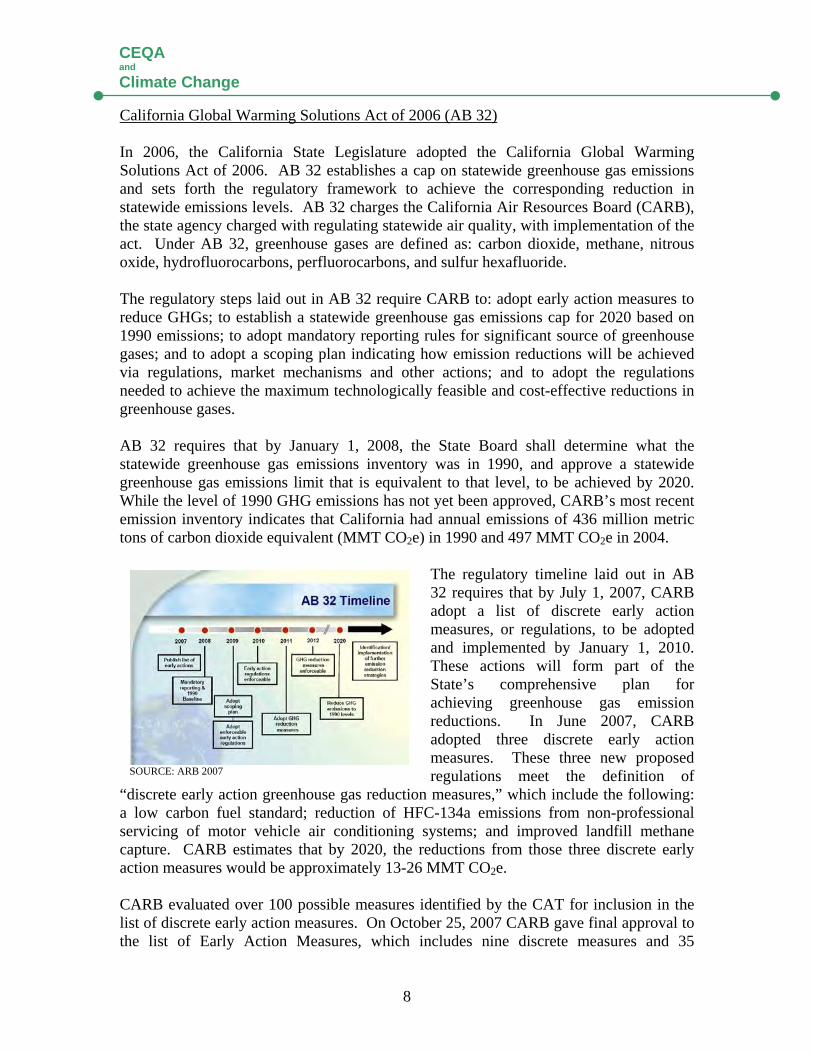
8
CEQA and
Climate Change
California Global Warming Solutions Act of 2006 (AB 32) In 2006, the California State Legislature adopted the California Global Warming Solutions Act of 2006. AB 32 establishes a cap on statewide greenhouse gas emissions and sets forth the regulatory framework to achieve the corresponding reduction in statewide emissions levels. AB 32 charges the California Air Resources Board (CARB), the state agency charged with regulating statewide air quality, with implementation of the act. Under AB 32, greenhouse gases are defined as: carbon dioxide, methane, nitrous oxide, hydrofluorocarbons, perfluorocarbons, and sulfur hexafluoride. The regulatory steps laid out in AB 32 require CARB to: adopt early action measures to reduce GHGs; to establish a statewide greenhouse gas emissions cap for 2020 based on 1990 emissions; to adopt mandatory reporting rules for significant source of greenhouse gases; and to adopt a scoping plan indicating how emission reductions will be achieved via regulations, market mechanisms and other actions; and to adopt the regulations needed to achieve the maximum technologically feasible and cost-effective reductions in greenhouse gases. AB 32 requires that by January 1, 2008, the State Board shall determine what the statewide greenhouse gas emissions inventory was in 1990, and approve a statewide greenhouse gas emissions limit that is equivalent to that level, to be achieved by 2020. While the level of 1990 GHG emissions has not yet been approved, CARB’s most recent emission inventory indicates that California had annual emissions of 436 million metric tons of carbon dioxide equivalent (MMT CO2e) in 1990 and 497 MMT CO2e in 2004.
The regulatory timeline laid out in AB 32 requires that by July 1, 2007, CARB adopt a list of discrete early action measures, or regulations, to be adopted and implemented by January 1, 2010. These actions will form part of the State’s comprehensive plan for achieving greenhouse gas emission reductions. In June 2007, CARB adopted three discrete early action measures. These three new proposed regulations meet the definition of
“discrete early action greenhouse gas reduction measures,” which include the following: a low carbon fuel standard; reduction of HFC-134a emissions from non-professional servicing of motor vehicle air conditioning systems; and improved landfill methane capture. CARB estimates that by 2020, the reductions from those three discrete early action measures would be approximately 13-26 MMT CO2e. CARB evaluated over 100 possible measures identified by the CAT for inclusion in the list of discrete early action measures. On October 25, 2007 CARB gave final approval to the list of Early Action Measures, which includes nine discrete measures and 35
SOURCE: ARB 2007

9
CEQAand
Climate Change Chapter 1
Introduction
additional measures, all of which are to be enforceable by January 1, 2010. AB 32 requires that by January 1, 2009, CARB adopt a scoping plan indicating how emission reductions will be achieved via regulations, market mechanisms and other actions. Senate Bill 97 Senate Bill (SB) 97, signed in August 2007, acknowledges that climate change is an important environmental issue that requires analysis under CEQA. This bill directs the OPR to prepare, develop, and transmit to the Resources Agency guidelines for the feasible mitigation of GHG emissions or the effects of GHG emissions, by July 1, 2009. The Resources Agency is required to certify or adopt those guidelines by January 1, 2010. This bill also protects projects funded by the Highway Safety, Traffic Reduction, Air Quality and Port Security Bond Act of 2006, or the Disaster Preparedness and Flood Protection Bond Act of 2006 (Proposition 1B or 1E) from claims of inadequate analysis of GHG as a legitimate cause of action. This latter provision will be repealed on January 1, 2010. Thus, this “protection” is highly limited to a handful of projects and for a short time period. The Role of Air Districts in the CEQA Process Air districts assume one of three roles in the CEQA process. They may be lead agencies when they are adopting regulations and air quality plans. In some instances, they can also be a lead agency when approving permits to construct or operate for applicants subject to district rules. However, in many cases where an air district permit is involved, another agency has broader permitting authority over the project and assumes the role of lead agency. In these situations, the air district becomes what is referred to as a responsible agency under CEQA. When CEQA documents are prepared for projects that do not involve discretionary approval of a district regulation, plan or permit, the air district may assume the role of a concerned or commenting agency. In this role, it is typical for air districts to comment on CEQA documents where there may be air quality-related adverse impacts, such as projects that may create significant contributions to existing violations of ambient standards, cause a violation of an ambient standard or create an exposure to toxic air contaminants or odors. In some cases, the air district may also act in an “advisory” capacity to a lead agency early on in its review of an application for a proposed development project. A few air districts in California began developing significance thresholds for use in CEQA analyses in the late 1980’s and early 1990’s. By the mid-1990’s most air districts had developed CEQA thresholds for air quality analyses. Many of the districts have included in their guidance the analysis of rule development and permits that may be subject to CEQA.
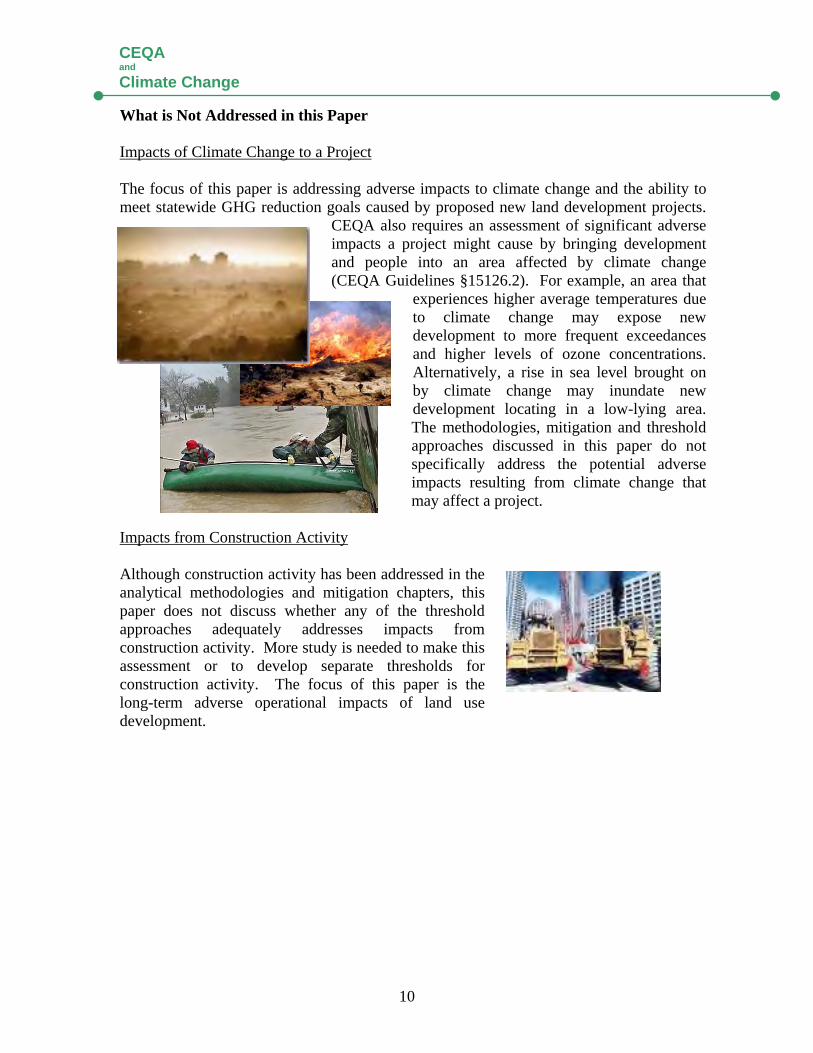
10
CEQA and
Climate Change
What is Not Addressed in this Paper Impacts of Climate Change to a Project The focus of this paper is addressing adverse impacts to climate change and the ability to meet statewide GHG reduction goals caused by proposed new land development projects.
CEQA also requires an assessment of significant adverse impacts a project might cause by bringing development and people into an area affected by climate change (CEQA Guidelines §15126.2). For example, an area that
experiences higher average temperatures due to climate change may expose new development to more frequent exceedances and higher levels of ozone concentrations. Alternatively, a rise in sea level brought on by climate change may inundate new development locating in a low-lying area. The methodologies, mitigation and threshold approaches discussed in this paper do not specifically address the potential adverse impacts resulting from climate change that may affect a project.
Impacts from Construction Activity Although construction activity has been addressed in the analytical methodologies and mitigation chapters, this paper does not discuss whether any of the threshold approaches adequately addresses impacts from construction activity. More study is needed to make this assessment or to develop separate thresholds for construction activity. The focus of this paper is the long-term adverse operational impacts of land use development.
Chapter 2: Air Districts & CEQA Thresholds
11
CEQAand
Climate Change
Chapter 2
Air Districts & CEQA Thresholds
Introduction
Any analysis of environmental impacts under CEQA includes an assessment of the nature and extent of each impact expected to result from the project to determine whether the impact will be treated as significant or less than significant. CEQA gives lead agencies discretion whether to classify a particular environmental impact as significant. "The determination of whether a project may have a significant effect on the environment calls for careful judgment on the part of the public agency involved," ref: CEQA Guidelines §15064(b) (“Guidelines”). Ultimately, formulation of a standard of significance requires the lead agency to make a policy judgment about where the line should be drawn distinguishing adverse impacts it considers significant from those that are not deemed significant. This judgment must, however, be based on scientific information and other factual data to the extent possible (Guidelines §15064(b)).
CEQA does not require that agencies establish thresholds of significance. Guidelines §15064.7(a) encourages each public agency “…to develop and publish thresholds of significance that the agency uses in the determination of the significance of environmental effects. A threshold of significance is an identifiable quantitative, qualitative or performance level of a particular environmental effect, non-compliance with which means the effect will normally be determined to be significant by the agency and compliance with which normally means the effect will be determined to be less than significant.” Once such thresholds are established, an impact that complies with the applicable threshold will "normally" be found insignificant and an impact that does not comply with the applicable threshold will "normally" be found significant. Additionally, Guidelines §15064.7(b) requires that if thresholds of significance are adopted for general use as part of the lead agency’s environmental review process they must be adopted by ordinance, resolution, rule or regulation, and developed through a public review process and be supported by substantial evidence. While many public agencies adopt regulatory standards as thresholds, the standards do not substitute for a public agency’s use of careful judgment in determining significance. They also do not replace the legal standard for significance (i.e., if there is a fair argument, based on substantial evidence in light of the whole record that the project may have a significant effect, the effect should be considered significant) (Guidelines §15064(f)(1). Also see Communities for a Better Environment v. California Resource Agency 103 Cal. App. 4th 98 (2002)). In other words, the adoption of a regulatory standard does not create an irrebuttable presumption that impacts below the regulatory standard are less than significant.

12
CEQA and
Climate Change
Summary of CEQA Thresholds at Air Districts This section briefly summarizes the evolution of air district CEQA significance thresholds. Ventura County APCD, in 1980, was the first air district in California that formally adopted CEQA significance thresholds. Their first CEQA assessment document contained impact thresholds based on project type: residential, nonresidential, and government. Then, as now, the District’s primary CEQA thresholds applied only to ROG and NOx. The 1980 Guidelines did not address other air pollutants. Santa Barbara County APCD and the Bay Area AQMD adopted thresholds in 1985. The South Coast AQMD recommended regional air quality thresholds in 1987 for CO, SO2, NO2, particulates, ROG, and lead. Most of the other California air districts adopted CEQA guidance and thresholds during the 1990’s. Air districts have updated their thresholds and guidelines several times since they were first published. Originally, most districts that established CEQA thresholds focused on criteria pollutants for which the district was nonattainment and the thresholds only addressed project level impacts. Updates during the 1990’s began to add additional air quality impacts such as odors, toxic air contaminants and construction. Several air districts also developed thresholds for General Plans that relied on an assessment of the plan consistency with the district’s air quality plans. A consistency analysis involves comparing the project’s land use to that of the general plan and the population and employment increase to the forecasts underlying the assumptions used to develop the air quality plan. Most air district thresholds for CEQA are based on the threshold for review under the New Source Review (NSR). The NSR threshold level is set by district rule and is different depending on the nonattainment classification of the air district. Areas with a less severe classification have a higher NSR trigger level while the most polluted areas have the lowest NSR trigger level. Some districts, such as Ventura County APCD, have significantly lower CEQA thresholds that are not tied to the NSR requirements. In Ventura, one set of CEQA thresholds is 25 pounds per day for all regions of Ventura County, except the Ojai Valley. The second set of CEQA thresholds was set at 5 pounds per day for the Ojai Valley. The Sacramento Metropolitan AQMD bases its thresholds for ozone precursors on the projected land use share of emission reductions needed for attainment. The emission reductions needed to reach attainment are based on commitments made in the state implementation plan (SIP) prepared for the federal clean air act.
Chapter 3: Consideration of Fundamental Issues
13
CEQAand
Climate Change
Chapter 3
Consideration of Fundamental Issues
CEQA Considerations in Setting Thresholds Public agencies use significance thresholds to disclose to their constituents how they plan on evaluating and characterizing the severity of various environmental impacts that could be associated with discretionary projects that they review. Significance thresholds are also used to help identify the level of mitigation needed to reduce a potentially significant impact to a less than significant level and to determine what type
of an environmental document should be prepared for a project; primarily a negative declaration, mitigated negative declaration or an environmental impact report. While public agencies are not required to develop significance thresholds, if they decide to develop them, they are required to adopt them by ordinance, resolution, rule or regulation through a
public process. A lead agency is not restrained from adopting any significance threshold it sees as appropriate, as long as it is based on substantial evidence. CEQA Guidelines §15064.7 encourages public agencies to develop and publish significance thresholds that are identifiable, quantitative, qualitative or performance level that the agency uses in the determination of the significance of environmental effects. The courts have ruled that a “threshold of significance” for a given environmental effect is simply that level at which the lead agency finds the effects of the project to be significant. Before an agency determines its course with regard to climate change and CEQA, it must be made clear that a threshold, or the absence of one, will not relieve a lead agency from having to prepare an EIR or legal challenges to the adequacy of an analysis leading to a conclusion, or lack of a conclusion, of significance under CEQA. CEQA has generally favored the preparation of an EIR where there is any substantial evidence to support a fair argument that a significant adverse environmental impact may occur due to a proposed project. This paper explores three alternative approaches to thresholds, including a no threshold option, a zero threshold option and a non-zero threshold option. Fair Argument Considerations Under the CEQA fair argument standard, an EIR must be prepared whenever it can be fairly argued, based on substantial evidence in the administrative record, that a project may have a significant adverse effect on the environment. “Substantial evidence” comprises “enough relevant information and reasonable inferences from this information that a fair argument can be made to support a conclusion, even though other conclusions might also be reached.” (Guidelines §15384) This means that if factual information is presented to the public agency that there is a reasonable possibility the project could have
14
CEQA and
Climate Change
a significant effect on the environment, an EIR is required even if the public agency has information to the contrary (Guidelines §15064 (f)). The courts have held that the fair argument standard “establishes a low threshold for initial preparation of an EIR, which reflects a preference for resolving doubts in favor of environmental review.” (Santa Teresa Citizen Action Group v. City of San Jose [2003] 114 Cal.App.4th 689) Although the determination of whether a fair argument exists is made by the public agency, that determination is subject to judicial scrutiny when challenged in litigation. When the question is whether an EIR should have been prepared, the court will review the administrative record for factual evidence supporting a fair argument. The fair argument standard essentially empowers project opponents to force preparation of an EIR by introducing factual evidence into the record that asserts that the project may have a significant effect on the environment. This evidence does not need to be conclusive regarding the potential significant effect. In 1998, the Resources Agency amended the State CEQA Guidelines to encourage the use of thresholds of significance. Guidelines §15064 (h) provided that when a project’s impacts did not exceed adopted standards, the impacts were to be considered less than significant. The section went on to describe the types of adopted standards that were to be considered thresholds. Guidelines § 15064.7 provided that agencies may adopt thresholds of significance to guide their determinations of significance. Both of these sections were challenged when environmental groups sued the Resources Agency in 2000 over the amendments. The trial court concluded that §15064.7 was proper, if it was applied in the context of the fair argument standard. At the appellate court level, §15064(h) was invalidated. 2 Establishing a presumption that meeting an adopted standard would avoid significant impacts was “inconsistent with controlling CEQA law governing the fair argument approach.” The Court of Appeal explained that requiring agencies to comply with a regulatory standard “relieves the agency of a duty it would have under the fair argument approach to look at evidence beyond the regulatory standard, or in contravention of the standard, in deciding whether an EIR must be prepared. Under the fair argument approach, any substantial evidence supporting a fair argument that a project may have a significant environmental effect would trigger the preparation of an EIR.” (Communities for a Better Environment v. California Resources Agency [2002] 103 Cal.App.4th 98)
2 Prior §15064(h) has been removed from the State CEQA Guidelines. Current §15064(h) discusses cumulative impacts.
Governor's Office of Planning and Research
INTRODUCTION
Overview of the California Environmental Review and Permit Approval Process
15
CEQAand
Climate Change
Chapter 3
Consideration of Fundamental Issues
In summary, CEQA law does not require a lead agency to establish significance thresholds for GHG. CEQA guidelines encourage the development of thresholds, but the absence of an adopted threshold does not relieve the agency from the obligation to determine significance. Defensibility of CEQA Analyses The basic purposes of CEQA, as set out in the State CEQA Guidelines, include: (1) informing decision makers and the public about the significant environmental effects of
proposed projects; (2) identifying ways to reduce or avoid those impacts; (3) requiring the implementation of feasible mitigation measures or alternatives that would reduce or avoid those impacts; and (4) requiring public agencies to disclose their reasons for approving any project that would have significant and unavoidable impacts (Guidelines §15002). CEQA is enforced through civil litigation over procedure (i.e., did the public agency follow the correct CEQA procedures?) and adequacy (i.e., has the potential for impacts been disclosed, analyzed, and mitigated to the extent feasible?).
The California Supreme Court has held that CEQA is "to be interpreted in such manner as to afford the fullest possible protection to the environment within the reasonable scope of the statutory language." (Friends of Mammoth v. Board of Supervisors [1972] 8 Cal.3d 247, 259) Within that context, the role of the courts is to weigh the facts in each case and apply their judgment. Although the court may rule on the adequacy of the CEQA work, the court is not empowered to act in the place of the public agency to approve or deny the project for which the CEQA document was prepared. Further, the court’s review is limited to the evidence contained in the administrative record that was before the public agency when it acted on the project. Putting aside the issue of CEQA procedure, the defensibility of a CEQA analysis rests on the following concerns:
• whether the public agency has sufficiently analyzed the environmental consequences to enable decision makers to make an intelligent decision;
• whether the conclusions of the public agency are supported by substantial
evidence in the administrative record; and
• whether the agency has made a good faith effort at the full disclosure of significant effects.
CEQA analyses need not be perfect or exhaustive -- the depth and breadth of the analysis is limited to what is “reasonably feasible.” (Guidelines §15151) At the same time, the analysis "must include detail sufficient to enable those who did not participate in its preparation to understand and to consider meaningfully the issues raised by the proposed
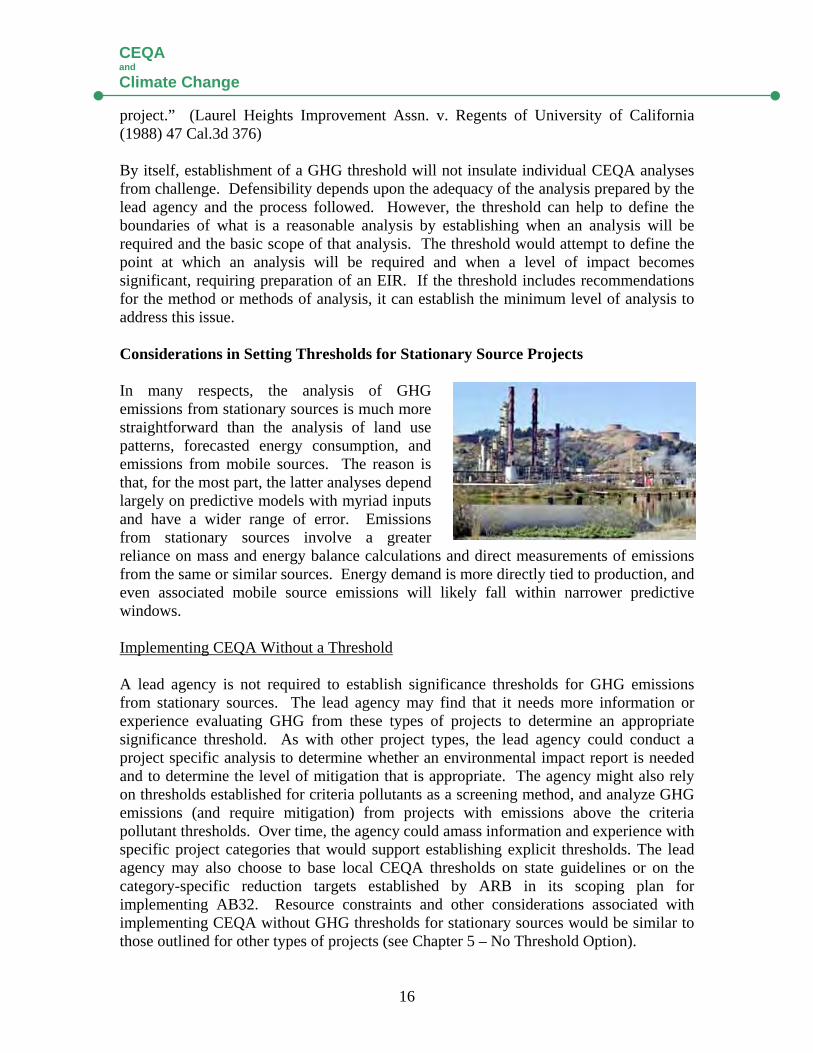
16
CEQA and
Climate Change
project.” (Laurel Heights Improvement Assn. v. Regents of University of California (1988) 47 Cal.3d 376) By itself, establishment of a GHG threshold will not insulate individual CEQA analyses from challenge. Defensibility depends upon the adequacy of the analysis prepared by the lead agency and the process followed. However, the threshold can help to define the boundaries of what is a reasonable analysis by establishing when an analysis will be required and the basic scope of that analysis. The threshold would attempt to define the point at which an analysis will be required and when a level of impact becomes significant, requiring preparation of an EIR. If the threshold includes recommendations for the method or methods of analysis, it can establish the minimum level of analysis to address this issue. Considerations in Setting Thresholds for Stationary Source Projects In many respects, the analysis of GHG emissions from stationary sources is much more straightforward than the analysis of land use patterns, forecasted energy consumption, and emissions from mobile sources. The reason is that, for the most part, the latter analyses depend largely on predictive models with myriad inputs and have a wider range of error. Emissions from stationary sources involve a greater reliance on mass and energy balance calculations and direct measurements of emissions from the same or similar sources. Energy demand is more directly tied to production, and even associated mobile source emissions will likely fall within narrower predictive windows. Implementing CEQA Without a Threshold A lead agency is not required to establish significance thresholds for GHG emissions from stationary sources. The lead agency may find that it needs more information or experience evaluating GHG from these types of projects to determine an appropriate significance threshold. As with other project types, the lead agency could conduct a project specific analysis to determine whether an environmental impact report is needed and to determine the level of mitigation that is appropriate. The agency might also rely on thresholds established for criteria pollutants as a screening method, and analyze GHG emissions (and require mitigation) from projects with emissions above the criteria pollutant thresholds. Over time, the agency could amass information and experience with specific project categories that would support establishing explicit thresholds. The lead agency may also choose to base local CEQA thresholds on state guidelines or on the category-specific reduction targets established by ARB in its scoping plan for implementing AB32. Resource constraints and other considerations associated with implementing CEQA without GHG thresholds for stationary sources would be similar to those outlined for other types of projects (see Chapter 5 – No Threshold Option).
17
CEQAand
Climate Change
Chapter 3
Consideration of Fundamental Issues
Implementing CEQA with Threshold of Zero A lead agency may find that any increase in GHG emissions is potentially significant under CEQA. The resources and other considerations for implementing a threshold of zero for stationary sources are the same as those outlined for other types of projects (see Chapter 6 – Zero Threshold Option). Implementing CEQA with a Non-Zero Threshold A lead agency may identify one or more non-zero thresholds for significance of emissions of GHG from stationary sources. The agency could elect to rely on existing thresholds for reviewing new or modified stationary sources of GHG, if the state or local air district has established any. The agency could also apply the threshold(s) established for non-stationary sources to GHG emissions from stationary sources. Significance thresholds could also be established by ordinance, rule, or policy for a given category of stationary sources; this approach is especially conducive to a tiered threshold approach. For example, the agency could establish significance and mitigation tiers for stationary compression-ignition diesel-fueled generators. Under such an approach, the project proponent could be first required to use a lower GHG-emitting power source if feasible, and if not, to apply mitigation based on the size of the generator and other defined considerations, such as hours of operation. Certain classes of generators could be found to be insignificant under CEQA (e.g., those used for emergency stand-by power only, with a limit on the annual hours of use). As with non-stationary projects, the goal of establishing non-zero thresholds is to maximize environmental protection, while minimizing resources used. Resource and other considerations outlined for non-stationary projects are applicable here (see Chapter 7 – Non-Zero Threshold Options). Implementing CEQA with Different Thresholds for Stationary and Non-stationary Projects Although a lead agency may apply the same thresholds to stationary and non-stationary projects, it is not required to do so. There are, in fact, some important distinctions between the two types of projects that could support applying different thresholds. The lead agency should consider the methods used to estimate emissions. Are the estimates a “best/worst reasonable scenario” or are they based on theoretical maximum operation? How accurate are the estimates (are they based on models, simulations, emission factors, source test data, manufacturer specifications, etc.)? To what extent could emissions be reduced through regulations after the project is constructed if they were found to be greater than originally expected (i.e., is it possible to retrofit emissions control technology onto the source(s) of GHG at a later date, how long is the expected project life, etc.)? Are there emission limits or emissions control regulations (such as New Source Review) that provide certainty that emissions will be mitigated? Generally, stationary source emissions are based on maximum emissions (theoretical or allowed under law or regulation), are more accurate, and are more amenable to retrofit at a later time than non-stationary source emissions. It is also more likely that category specific
18
CEQA and
Climate Change
rules or some form of NSR will apply to stationary sources than non-stationary projects. Notwithstanding, it is almost always more effective and cost-efficient to apply emission reduction technology at the design phase of a project. There are, therefore, a number of considerations that need to be evaluated and weighed before establishing thresholds – and which may support different thresholds for stationary and non-stationary projects. Furthermore, the considerations may change over time as new regulations are established and as emissions estimation techniques and control technology evolves. Direct GHG Emissions from Stationary Sources
The main focus of this paper has been the consideration of projects that do not, in the main, involve stationary sources of air pollution, because stationary source projects are generally a smaller percentage of the projects seen by most local land use agencies. That said, some discussion of stationary sources is warranted. As the broader program for regulating GHG from these sources is developed, the strategies for addressing them
under CEQA will likely become more refined. The primary focus of analysis of stationary source emissions has traditionally been those pollutants that are directly emitted by the source, whether through a stack or as fugitive releases (such as leaks). CAPCOA conducted a simplified analysis of permitting activity to estimate the number of stationary source projects with potentially significant emissions of greenhouse gases that might be seen over the course of a year. This analysis looked only at stationary combustion sources (such as boilers and generators), and only considered direct emissions. A lead agency under CEQA may see a different profile of projects than the data provided here suggest, depending on what other resources are affected by projects. In addition, air districts review like-kind replacements of equipment to ensure the new equipment meets current standards, but such actions might not constitute a project for many land use agencies or other media regulators. The data does provide a useful benchmark, however, for lead agencies to assess the order of magnitude of potential stationary source projects. A similar analysis is included for non-stationary projects in Chapter 7. Table 1: Analysis of GHG Emissions from Stationary Combustion Equipment Permits3
BAAQMD SMAQMD SJVUAPCD SCAQMD
Total Applications for Year 1499 778 1535 1179
Affected at threshold of:
900 metric tons/year 26 43 63 108
10,000 metric tons/year 7 5 26 8
25,000 metric tons/year 3 1 11 4 3 District data varies based on specific local regulations and methodologies.
19
CEQAand
Climate Change
Chapter 3
Consideration of Fundamental Issues
Emissions from Energy Use In addition to the direct emissions of GHG from stationary projects, CEQA will likely need to consider the project’s projected energy use. This could include an analysis of opportunities for energy efficiency, onsite clean power generation (e.g., heat/energy recovery, co-generation, geothermal, solar, or wind), and the use of dedicated power
contracts as compared to the portfolio of generally available power. In some industries, water use and conservation may provide substantial GHG emissions reductions, so the CEQA analysis should consider alternatives that reduce water consumption and wastewater discharge. The stationary project may also have the opportunity to use raw or feedstock materials that have a smaller GHG footprint; material substitution should be evaluated where information is available to do so.
Emissions from Associated Mobile Sources The stationary project will also include emissions from associated mobile sources. These will include three basic components: emissions from employee trips, emissions from delivery of raw or feedstock materials, and emissions from product transport. Employee trips can be evaluated using trip estimation as is done for non-stationary projects, and mitigations would include such measures as providing access to and incentives for use of public transportation, accessibility for bicycle and pedestrian modes of transport, employer supported car or vanpools (including policies such as guaranteed rides home, etc). Upstream and downstream emissions related to goods movement can also be estimated with available models. The evaluation will need to determine the extent of the transport chain that should be included (to ensure that all emissions in the chain have been evaluated and mitigated, but to avoid double counting). Mitigations could include direct actions by operators who own their own fleet, or could be implemented through contractual arrangements with independent carriers; again, the evaluation will need to consider how far up and down the chain mitigation is feasible and can be reasonably required. Comparing Emissions Changes Across Pollutant Categories The potential exists for certain GHG reduction measures to increase emissions of criteria and toxic pollutants known to cause or aggravate respiratory, cardiovascular, and other health problems. For instance, GHG reduction efforts such as alternative fuels and methane digesters may create significant levels of increased pollutants that are detrimental to the health of the nearby population (e.g.; particulate matter, ozone precursors, toxic air contaminants). Such considerations should be included in any CEQA analysis of a project’s environmental impacts. While there are many win-win
20
CEQA and
Climate Change
strategies that can reduce both GHG and criteria/toxic pollutant emissions, when faced with situations that involve tradeoffs between the two, the more immediate public health concerns that may arise from an increase in criteria or toxic pollutant emissions should take precedence. GHG emission reductions could be achieved offsite through other mitigation programs.

Chapter 4: Considerations of a Statewide Threshold
21
CEQAand
Climate Change
Chapter 4
Consideration of a Statewide Threshold
Introduction Under state law, it is the purview of each lead agency to determine what, if any, significance thresholds will be established to guide its review of projects under CEQA. While the state does provide guidelines for implementing CEQA, the guidelines have left the decision of whether to establish thresholds (and if so, at what level) to individual lead agencies. Frequently, lead agencies consult with resource-specific agencies (such as air districts) for assistance in determining what constitutes a significant impact on that specific resource. With the passage of AB 32, the ARB has broad authority to regulate GHG emissions as necessary to meet the emission reduction goals of the statute. This may include authority to establish emission reduction requirements for new land use projects, and may also enable them to recommend statewide thresholds for GHG under CEQA. In developing this white paper, CAPCOA recognizes that, as the GHG reduction program evolves over time, GHG thresholds and other policies and procedures for CEQA may undergo significant revision, and that uniform statewide thresholds and procedures may be established. This paper is intended to serve as a resource for public agencies until such time that statewide guidance is established, recognizing that decisions will need to be made about GHG emissions from projects before such guidance is available. This paper is not, however, uniform statewide guidance. As stated before, it outlines several possible approaches without endorsing any one over the others. Some air districts may choose to use this paper to support their establishment of guidance for GHG under CEQA, including thresholds. This paper does not, nor should it be construed to require a district to implement any of the approaches evaluated here. Decisions about whether to provide formal local guidance on CEQA for projects with GHG emissions, including the question of thresholds, will be made by individual district boards. Each of the 35 air districts operates independently and has its own set of regulations and programs to address the emissions from stationary, area and mobile sources, consistent with state and federal laws, regulations, and guidelines. The independence of the districts allows specific air quality problems to be addressed on a local level. In addition, districts have also established local CEQA thresholds of significance for criteria pollutants – also to address the specific air quality problems relative to that particular district. The overall goal of air district thresholds is to achieve and maintain health based air quality standards within their respective air basins and to reduce transport of emissions to other air basins. In establishing recommended thresholds, air districts consider the existing emission inventory of criteria pollutants and the amount of emission reductions needed to attain and maintain ambient air quality standards.
22
CEQA and
Climate Change
However, unlike criteria pollutants where individual districts are characterized by varying levels of pollutant concentrations and source types, greenhouse gases (GHG) and their attendant climate change ramifications are a global problem and, therefore, may suggest a uniform approach to solutions that ensure both progress and equity. Under SB97, the Office of Planning and Research is directed to prepare, develop, and transmit to the Resources Agency guidelines for the feasible mitigation of GHG emissions or the effects of GHG emissions through CEQA by July 1, 2009. Those guidelines may recommend thresholds. As stated, this paper is intended to provide a common platform of information and tools to support local decision makers until such time that statewide guidance or requirements are promulgated. Local Ability to Promulgate District-Specific GHG Thresholds One of the primary reasons behind the creation of air districts in California is the recognition that some regions within the state face more critical air pollution problems than others and, as has often been pointed out – one size does not fit all. For example, a “Serious” federal nonattainment district would need greater emission reductions than a district already in attainment – and, therefore, the more “serious” district would set its criteria pollutant CEQA thresholds of significance much lower than the air district already in attainment. The action of GHGs is global in nature, rather than local or regional (or even statewide or national). Ultimately there may be a program that is global, or at least national in scope. That said, actions taken by a state, region, or local government can contribute to the solution of the global problem. Local governments are not barred from developing and implementing programs to address GHGs. In the context of California and CEQA, lead agencies have the primary responsibility and authority to determine the significance of a project’s impacts. Further, air districts have primary authority under state law for "control of air pollution from all sources, other than emissions from motor vehicles." (H&SC §40000) The term air contaminant or "air pollutant" is defined extremely broadly, to mean "any discharge, release, or other propagation into the atmosphere" and includes, but is not limited to, soot, carbon, fumes, gases, particulate matter, etc. Greenhouse gases and other global warming pollutants such as black carbon would certainly be included in this definition, just as the U.S. Supreme Court held in Massachusetts v. EPA that greenhouse gases were air pollutants under the federal Clean Air Act. Therefore, air districts have the primary authority to regulate global warming pollutants from nonvehicular sources. AB 32 does not change this result. Although it gives wide responsibility to CARB to regulate greenhouse gases from all sources, including nonvehicular sources, it does not preempt the districts. AB 32 specifically states That "nothing in this division shall limit or expand the existing authority of any district..."(H&SC § 38594). Thus, districts and CARB retain concurrent authority over nonvehicular source greenhouse gas emissions.

Chapter 5: CEQA with No GHG Thresholds
23
CEQAand
Climate Change
Chapter 5
CEQA with No GHG Thresholds
Introduction The CEQA statutes do not require an air district or any lead agency to establish significance thresholds under CEQA for any pollutant. While there are considerations that support the establishment of thresholds (which are discussed in other sections of this document), there is no obligation to do so. An air district or other lead agency may elect not to establish significance thresholds for a number of reasons. The agency may believe that the global nature of the climate change problem necessitates a statewide or national framework for consideration of environmental impacts. SB 97 directs OPR to develop “guidelines for the mitigation of greenhouse gas emissions or the effects of greenhouse gas emissions by July 1, 2009,” and directs the California Resources Agency to certify and adopt the guidelines by June 30, 2010.
An agency may also believe there is insufficient information to support selecting one specific threshold over another. As described earlier, air districts have historically set CEQA thresholds for air pollutants in the context of the local clean air plan, or (in the case of toxic air pollutants) within the framework of a rule or policy that manages risks and exposures due to toxic pollutants. There is no current framework that would similarly
manage impacts of greenhouse gas pollutants, although the CARB is directed to establish one by June 30, 2009, pursuant to AB 32. A local agency may decide to defer any consideration of thresholds until this framework is in place. Finally, an agency may believe that the significance of a given project should be assessed on a case-by-case basis in the context of the project at the time it comes forward. Implementing CEQA Without Significance Thresholds for GHG The absence of a threshold does not in any way relieve agencies of their obligations to address GHG emissions from projects under CEQA. The implications of not having a threshold are different depending on the role the agency has under CEQA – whether it is acting in an advisory capacity, as a responsible agency, or as a lead agency. Implications of No Thresholds for an Agency Acting in an Advisory Capacity Air districts typically act in an advisory capacity to local governments in establishing the framework for environmental review of air pollution impacts under CEQA. This may include recommendations regarding significance thresholds, analytical tools to assess emissions and impacts, and mitigations for potentially significant impacts. Although districts will also address some of these issues on a project-specific basis as responsible agencies, they may provide general guidance to local governments on these issues that
24
CEQA and
Climate Change
are program wide, and these are advisory (unless they have been established by regulation). An air district that has not established significance thresholds for GHG will not provide guidance to local governments on this issue. This does not prevent the local government from establishing thresholds under its own authority. One possible result of this would be the establishment of different thresholds by cities and counties within the air district. Alternatively, the air district could advise local governments not to set thresholds and those jurisdictions may follow the air district’s guidance. It is important to note here (as has been clearly stated by the Attorney General in comments and filings) that lack of a threshold does not mean lack of significance. An agency may argue lack of significance for any project, but that argument would have to be carried forth on a case-by-case, project specific basis. By extension then, a decision not to establish thresholds for GHG is likely to result in a greater workload for responsible and lead agencies as they consider individual projects under CEQA. Implications of No Thresholds for a Responsible Agency If there are no established thresholds of significance, the significance of each project will have to be determined during the course of review. The responsible agency (e.g., the air district) will review each project referred by the lead agency. The review may be qualitative or quantitative in nature. A qualitative review would discuss the nature of GHG emissions expected and their potential effect on climate change as the district understands it. It could also include a discussion of the relative merits of alternative scenarios. A quantitative analysis would evaluate, to the extent possible, the expected GHG emissions; it would also need to evaluate their potential effect on climate change and might include corresponding analysis of alternatives. The air district, as a responsible agency, may also identify mitigation measures for the project. The lack of established thresholds will make the determination of significance more resource intensive for each project. The district may defer to the lead agency to make this determination, however the district may be obligated, as a responsible agency, to evaluate the analysis and determination. Implications of No Thresholds for a Lead Agency The main impact of not having significance thresholds will be on the primary evaluation of projects by the lead agency. Without significance thresholds, the agency will have to conduct some level of analysis of every project to determine whether an environmental impact report is needed. There are three fundamental approaches to the case-by-case analysis of significance, including presumptions of significance or insignificance, or no presumption:

25
CEQAand
Climate ChangeChapter 5
CEQA with No GHG Thresholds
1. The agency can begin with a presumption of significance and the analysis would be used to support a case-specific finding of no significance. This is similar to establishing a threshold of zero, except that here, the “threshold” is rebuttable. This approach may result in a large number of projects proceeding to preparation of an environmental impact report. Because of the attendant costs, project proponents may challenge the determination of significance, although formal challenge is less likely than attempts to influence the determination.
2. The agency can begin with a presumption of insignificance, and the analysis
would be used to support a case-specific finding of significance. A presumption of insignificance could be based on the perspective that it would be speculative to attempt to identify the significance of GHG emissions from a project relative to climate change on a global scale. This approach might reduce the number of projects proceeding to preparation of environmental impact reports. It is likely to have greater success with smaller projects than larger ones, and a presumption of insignificance may be more likely to be challenged by project opponents.
3. It is not necessary for the
lead agency to have any presumption either way. The agency could approach each project from a tabula rasa perspective, and have the determination of significance more broadly tied to the specific context of the project; this approach is likely to be resource intensive, and creates the greatest uncertainty for project proponents. To the extent that it results in a lead agency approving similar projects based on different determinations of significance for GHG emissions, it may be more vulnerable to challenge from either proponents or opponents of the project. Alternatively, in the absence of either thresholds or presumptions, the lead agency could use each determination of significance to build its approach in the same way that subsequent judgments define the law.
26
CEQA and
Climate Change
Relevant Citations The full text of relevant citations is in Appendix A. Public Resources Code – §21082.2, Significant Effect on Environment; Determination; Environmental Impact Report Preparation. State CEQA Guidelines – §15064, Determining the Significance of the Environmental Effects Caused by a Project.
Chapter 6: CEQA with a GHG Threshold of Zero
27
CEQAand
Climate Change
Chapter 6
CEQA with a GHG Threshold of Zero
Introduction If an air district or lead agency determines that any degree of project-related increase in GHG emissions would contribute considerably to climate change and therefore would be a significant impact, it could adopt a zero-emission threshold to identify projects that would need to reduce their emissions. A lead agency may determine that a zero-emission threshold is justified even if other experts may disagree. A lead agency is not prevented from adopting any significance threshold it sees as appropriate, as long as it is based on substantial evidence. If the zero threshold option is chosen, all projects subject to CEQA would be required to quantify and mitigate their GHG emissions, regardless of the size of the project or the availability of GHG reduction measures available to reduce the project’s emissions. Projects that could not meet the zero-emission threshold would be required to prepare environmental impact reports to disclose the unmitigable significant impact, and develop the justification for a statement of overriding consideration to be adopted by the lead agency. Implementing CEQA With a Zero Threshold for GHG The scientific community overwhelmingly agrees that the earth’s climate is becoming warmer, and that human activity is playing a role in climate change. Unlike other environmental impacts, climate change is a global phenomenon in that all GHG emissions generated throughout the earth contribute to it. Consequently, both large and small GHG generators cause the impact. While it may be true that many GHG sources are individually too small to make any noticeable difference to climate change, it is also true that the countless small sources around the globe combine to produce a very substantial portion of total GHG emissions. A zero threshold approach is based on a belief that, 1) all GHG emissions contribute to global climate change and could be considered significant, and 2) not controlling emissions from smaller sources would be neglecting a major portion of the GHG inventory. CEQA explicitly gives lead agencies the authority to choose thresholds of significance. CEQA defers to lead agency discretion when choosing thresholds. Consequently, a zero-emission threshold has merits.
28
CEQA and
Climate Change
The CEQA review process for evaluating a project’s impact on global climate change under the zero threshold option would involve several components. Air quality sections would be written by lead agencies to include discussions on climate change in CEQA documents, GHG emissions would be calculated, and a determination of significance would be made. The local air districts would review and comment on the climate change discussions in environmental documents. Lead agencies may then revise final EIRs to accommodate air district comments. More than likely, mitigation measures will be specified for the project, and a mitigation monitoring program will need to be put in place to ensure that these measures are being implemented. Since CEQA requires mitigation to a less than significant level, it is conceivable that many projects subjected to a zero threshold could only be deemed less than significant with offsite reductions or the opportunity to purchase greenhouse gas emission reduction credits. GHG emission reduction credits are becoming more readily available however the quality of the credits varies considerably. High quality credits are generated by actions or projects that have clearly demonstrated emission reductions that are real, permanent, verifiable, enforceable, and not otherwise required by law or regulation. When the pre- or post-project emissions are not well quantified or cannot be independently confirmed, they are considered to be of lesser quality. Similarly, if the reductions are temporary in nature, they are also considered to be poor quality. Adoption of a zero threshold should consider the near-term availability and the quality of potential offsets. There are also environmental justice concerns about the effects of using offsite mitigations or emission reduction credits to offset, or mitigate, the impacts of a new project. Although GHGs are global pollutants, some of them are emitted with co-pollutants that have significant near-source or regional impacts. Any time that increases in emissions at a specific site will be mitigated at a remote location or using emission reduction credits, the agency evaluating the project should ensure that it does not create disproportionate impacts. Administrative Considerations If electing to pursue a zero threshold, an air district or lead agency should consider the administrative costs and the environmental review system capacity. Some projects that previously would have qualified for an exemption could require further substantial analysis, including preparation of a Negative Declaration (ND), a Mitigated Negative Declaration (MND) or an EIR. Moreover, the trade-offs between the volume of projects requiring review and the quality of consideration given to reviews should be considered. It may also be useful to consider whether meaningful mitigation can be achieved from smaller projects.
29
CEQAand
Climate ChangeChapter 6
CEQA with a GHG Threshold of Zero
Consideration of Exemptions from CEQA A practical concern about identifying GHG emissions as a broad cumulative impact is whether the zero threshold option will preclude a lead agency from approving a large set of otherwise qualified projects utilizing a Categorical Exemption, ND, or MND. The results could be a substantial increase in the number of EIR’s. This is a valid and challenging concern, particularly for any threshold approach that is based on a zero threshold for net GHG emission increases. CEQA has specified exceptions to the use of a categorical exception. Specifically, CEQA Guidelines §15300.2 includes the following exceptions: “(b) Cumulative Impact. All exemptions for these classes are inapplicable when the cumulative impact of successive projects of the same type in the same place, over time is significant.” (c) Significant Effect. A categorical exemption shall not be used for an activity where there is a reasonable possibility that the activity will have a significant effect on the environment due to unusual circumstances.” These CEQA Guidelines sections could be argued to mean that any net increase in GHG emissions would preclude the use of a categorical exemption. However, as described below, if the following can be shown, then the exceptions above could be argued not to apply: (1) Cumulative local, regional and/or state GHG emissions are being reduced or will be reduced by adopted, funded, and feasible measures in order to meet broader state targets. (2) Mandatory state or local GHG reduction measures would apply to the project’s emissions such that broader GHG reduction goals would still be met and the project contributions would not be cumulatively considerable. (3) Project GHG emissions are below an adopted significance threshold designed to take into account the cumulative nature of GHG emissions. A similar argument could be made relative to the use of a ND (provided no additional mitigation (beyond existing mandates) is required to control GHG emissions) and to the use of a MND instead of an EIR. However, due to the “fair argument” standard, which is discussed in Chapter 3, caution is recommended in use of a ND or MND unless all three elements above can be fully supported through substantial evidence and there is no substantial evidence to the contrary. Establishing a significance threshold of zero is likely to preclude the use of a categorical exemption.
30
CEQA and
Climate Change
Relevant Citations The full text of relevant citations is in Appendix A. Public Resources Code – §21004, Mitigating or Avoiding a Significant Effect; Powers of Public Agency. State CEQA Guidelines – §15064, Determining the Significance of the Environmental Effects Caused by a Project. State CEQA Guidelines – §15130, Discussion of Cumulative Impacts. State CEQA Guidelines – §15064.7, Thresholds of Significance.
Chapter 7: CEQA with Non-Zero GHG Thresholds
31
CEQAand
Climate Change
Chapter 7
CEQA with Non-Zero GHG Thresholds
Introduction A non-zero threshold could minimize the resources spent reviewing environmental analyses that do not result in real GHG reductions or to prevent the environmental review system from being overwhelmed. The practical advantages of considering non-zero thresholds for GHG significance determinations can fit into the concept regarding whether the project’s GHG emissions represent a “considerable contribution to the cumulative impact” and therefore warrant analysis. Specifying a non-zero threshold could be construed as setting a de minimis value for a cumulative impact. In effect, this would be indicating that there are certain GHG emission sources that are so small that they would not contribute substantially to the global GHG budget. This could be interpreted as allowing public agencies to approve certain projects without requiring any mitigation of their GHG. Any threshold framework should include a proper context to address the de minimis issue. However, the CEQA Guidelines recognize that there may be a point where a project’s contribution, although above zero, would not be a considerable contribution to the cumulative impact and, therefore, not trigger the need for a significance determination. GHG emissions from all sources are under the purview of CARB and as such may eventually be “regulated” no matter how small. Virtually all projects will result in some direct or indirect release of GHG. However, a decision by CARB to regulate a class of sources does not necessarily mean that an individual source in that class would constitute a project with significant GHG impacts under CEQA. For example, CARB has established criteria pollutant emission standards for automobiles, but the purchase and use of a single new car is not considered a project with significant impacts under CEQA. At the same time, it is important to note that it is likely that all meaningful sources of emissions, no matter how small are likely to be considered for regulation under AB 32. It is expected that projects will have to achieve some level of GHG reduction to comply with CARB’s regulations meant to implement AB 32. As such all projects will have to play a part in reducing our GHG emissions budget and no project, however small, is truly being considered de minimis under CARB’s regulations. This chapter evaluates a range of conceptual approaches toward developing GHG significance criteria. The air districts retained the services of J&S an environmental consulting, firm to assist with the development of a Statute and Executive Order-based threshold (Approach 1) and a tiered threshold (Approach 2) based on a prescribed list of tasks and deliverables. Time and financial constraints limited the scope and depth of this analysis, however, the work presented here may be useful in developing interim guidance while AB 32 is being implemented. J&S recognized that approaches other than those described here could be used. As directed, J&S explored some overarching issues, such as:
• what constitutes “new” emissions?
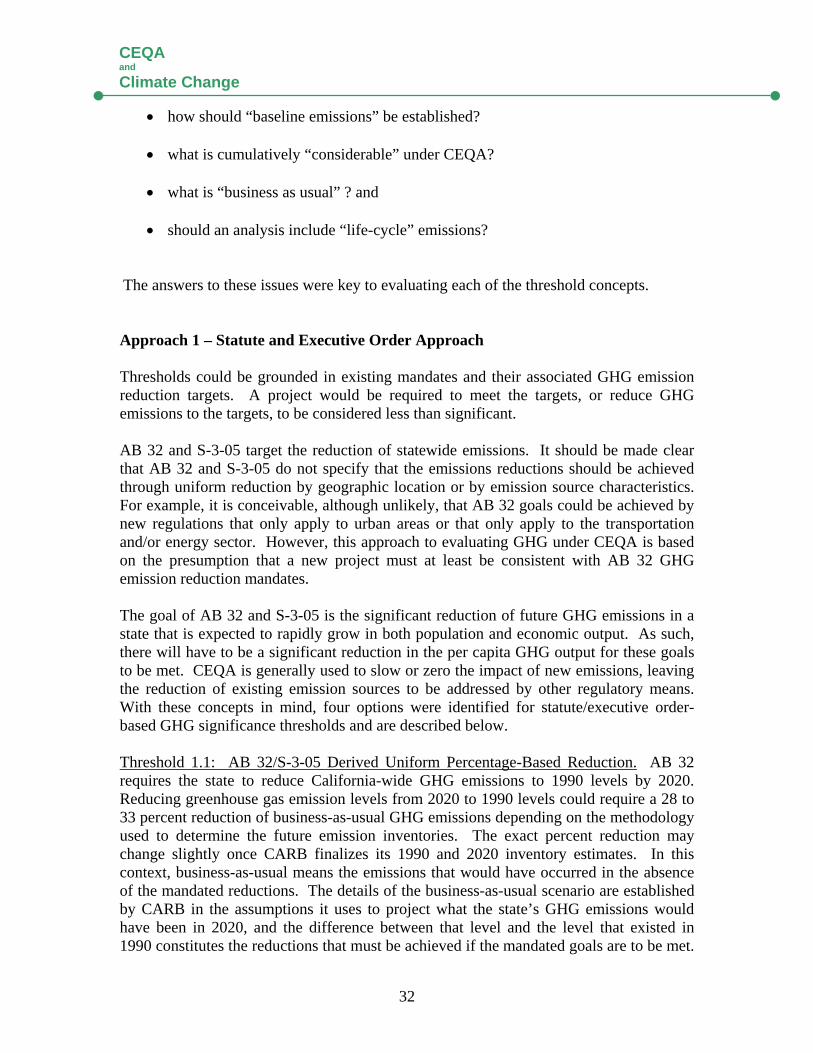
32
CEQA and
Climate Change
• how should “baseline emissions” be established? • what is cumulatively “considerable” under CEQA? • what is “business as usual” ? and • should an analysis include “life-cycle” emissions?
The answers to these issues were key to evaluating each of the threshold concepts. Approach 1 – Statute and Executive Order Approach Thresholds could be grounded in existing mandates and their associated GHG emission reduction targets. A project would be required to meet the targets, or reduce GHG emissions to the targets, to be considered less than significant. AB 32 and S-3-05 target the reduction of statewide emissions. It should be made clear that AB 32 and S-3-05 do not specify that the emissions reductions should be achieved through uniform reduction by geographic location or by emission source characteristics. For example, it is conceivable, although unlikely, that AB 32 goals could be achieved by new regulations that only apply to urban areas or that only apply to the transportation and/or energy sector. However, this approach to evaluating GHG under CEQA is based on the presumption that a new project must at least be consistent with AB 32 GHG emission reduction mandates. The goal of AB 32 and S-3-05 is the significant reduction of future GHG emissions in a state that is expected to rapidly grow in both population and economic output. As such, there will have to be a significant reduction in the per capita GHG output for these goals to be met. CEQA is generally used to slow or zero the impact of new emissions, leaving the reduction of existing emission sources to be addressed by other regulatory means. With these concepts in mind, four options were identified for statute/executive order-based GHG significance thresholds and are described below. Threshold 1.1: AB 32/S-3-05 Derived Uniform Percentage-Based Reduction. AB 32 requires the state to reduce California-wide GHG emissions to 1990 levels by 2020. Reducing greenhouse gas emission levels from 2020 to 1990 levels could require a 28 to 33 percent reduction of business-as-usual GHG emissions depending on the methodology used to determine the future emission inventories. The exact percent reduction may change slightly once CARB finalizes its 1990 and 2020 inventory estimates. In this context, business-as-usual means the emissions that would have occurred in the absence of the mandated reductions. The details of the business-as-usual scenario are established by CARB in the assumptions it uses to project what the state’s GHG emissions would have been in 2020, and the difference between that level and the level that existed in 1990 constitutes the reductions that must be achieved if the mandated goals are to be met.
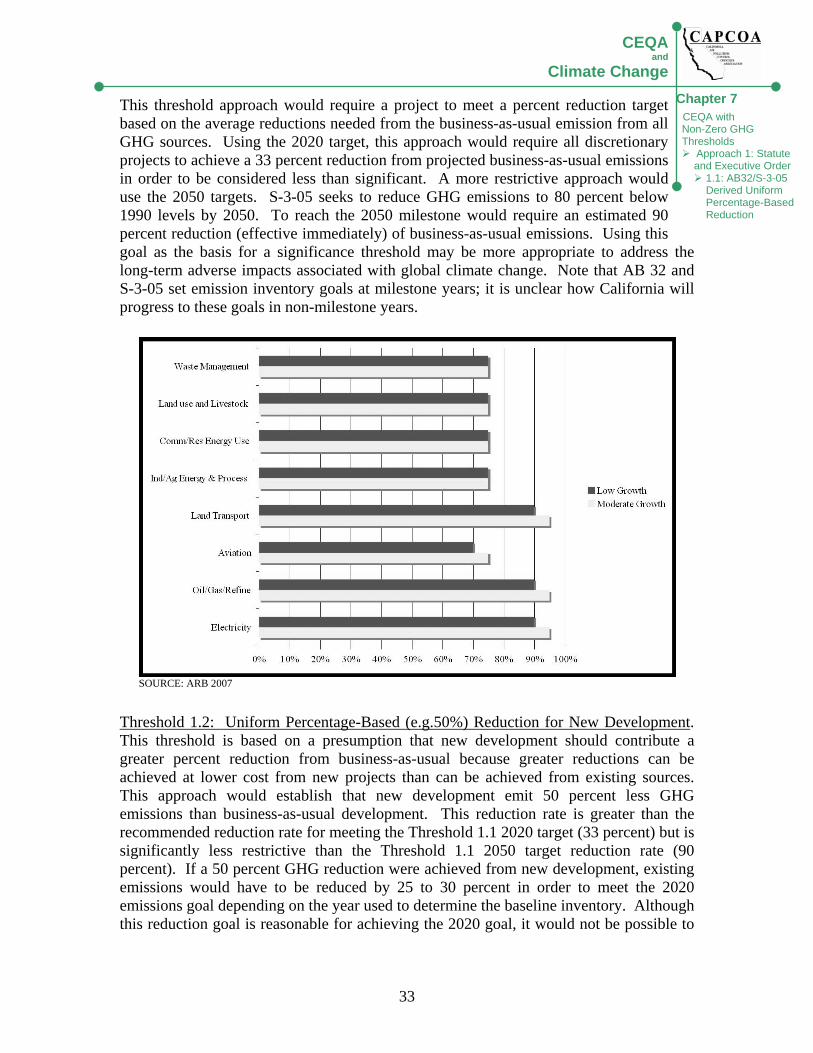
33
CEQAand
Climate ChangeChapter 7
CEQA with Non-Zero GHG Thresholds
Approach 1: Statute and Executive Order
1.1: AB32/S-3-05 Derived Uniform Percentage-Based Reduction
This threshold approach would require a project to meet a percent reduction target based on the average reductions needed from the business-as-usual emission from all GHG sources. Using the 2020 target, this approach would require all discretionary projects to achieve a 33 percent reduction from projected business-as-usual emissions in order to be considered less than significant. A more restrictive approach would use the 2050 targets. S-3-05 seeks to reduce GHG emissions to 80 percent below 1990 levels by 2050. To reach the 2050 milestone would require an estimated 90 percent reduction (effective immediately) of business-as-usual emissions. Using this goal as the basis for a significance threshold may be more appropriate to address the long-term adverse impacts associated with global climate change. Note that AB 32 and S-3-05 set emission inventory goals at milestone years; it is unclear how California will progress to these goals in non-milestone years.
Threshold 1.2: Uniform Percentage-Based (e.g.50%) Reduction for New Development. This threshold is based on a presumption that new development should contribute a greater percent reduction from business-as-usual because greater reductions can be achieved at lower cost from new projects than can be achieved from existing sources. This approach would establish that new development emit 50 percent less GHG emissions than business-as-usual development. This reduction rate is greater than the recommended reduction rate for meeting the Threshold 1.1 2020 target (33 percent) but is significantly less restrictive than the Threshold 1.1 2050 target reduction rate (90 percent). If a 50 percent GHG reduction were achieved from new development, existing emissions would have to be reduced by 25 to 30 percent in order to meet the 2020 emissions goal depending on the year used to determine the baseline inventory. Although this reduction goal is reasonable for achieving the 2020 goal, it would not be possible to
SOURCE: ARB 2007
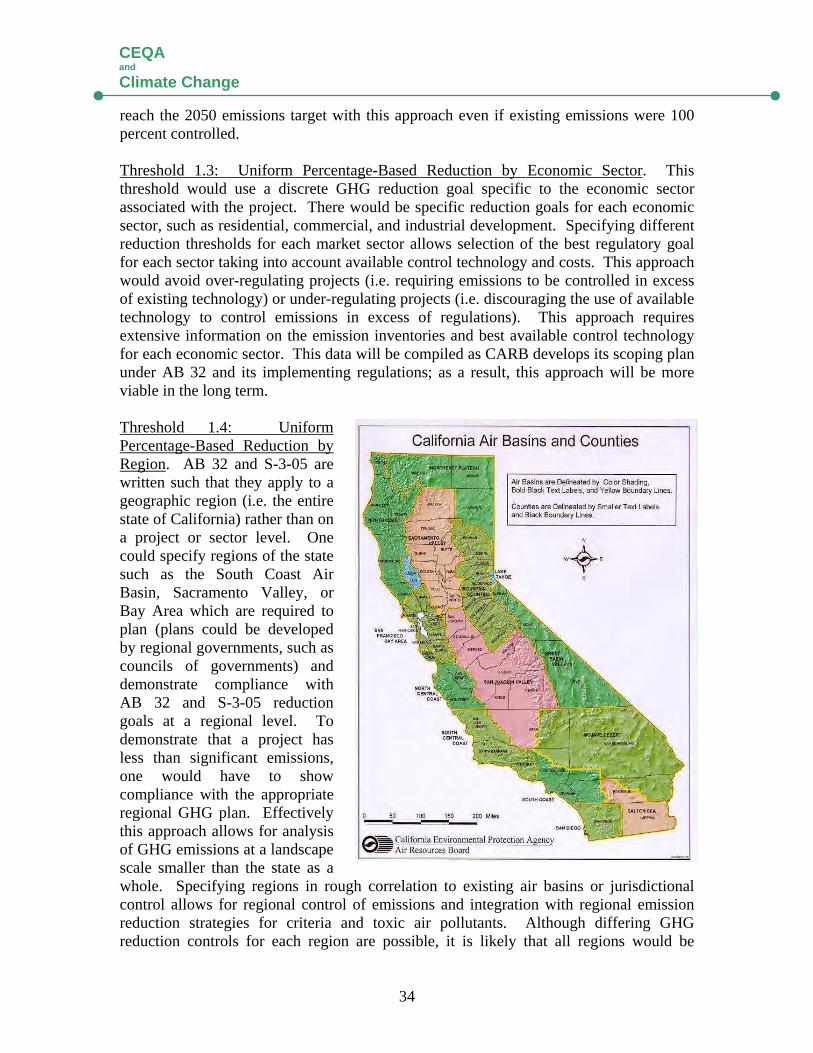
34
CEQA and
Climate Change
reach the 2050 emissions target with this approach even if existing emissions were 100 percent controlled. Threshold 1.3: Uniform Percentage-Based Reduction by Economic Sector. This threshold would use a discrete GHG reduction goal specific to the economic sector associated with the project. There would be specific reduction goals for each economic sector, such as residential, commercial, and industrial development. Specifying different reduction thresholds for each market sector allows selection of the best regulatory goal for each sector taking into account available control technology and costs. This approach would avoid over-regulating projects (i.e. requiring emissions to be controlled in excess of existing technology) or under-regulating projects (i.e. discouraging the use of available technology to control emissions in excess of regulations). This approach requires extensive information on the emission inventories and best available control technology for each economic sector. This data will be compiled as CARB develops its scoping plan under AB 32 and its implementing regulations; as a result, this approach will be more viable in the long term. Threshold 1.4: Uniform Percentage-Based Reduction by Region. AB 32 and S-3-05 are written such that they apply to a geographic region (i.e. the entire state of California) rather than on a project or sector level. One could specify regions of the state such as the South Coast Air Basin, Sacramento Valley, or Bay Area which are required to plan (plans could be developed by regional governments, such as councils of governments) and demonstrate compliance with AB 32 and S-3-05 reduction goals at a regional level. To demonstrate that a project has less than significant emissions, one would have to show compliance with the appropriate regional GHG plan. Effectively this approach allows for analysis of GHG emissions at a landscape scale smaller than the state as a whole. Specifying regions in rough correlation to existing air basins or jurisdictional control allows for regional control of emissions and integration with regional emission reduction strategies for criteria and toxic air pollutants. Although differing GHG reduction controls for each region are possible, it is likely that all regions would be
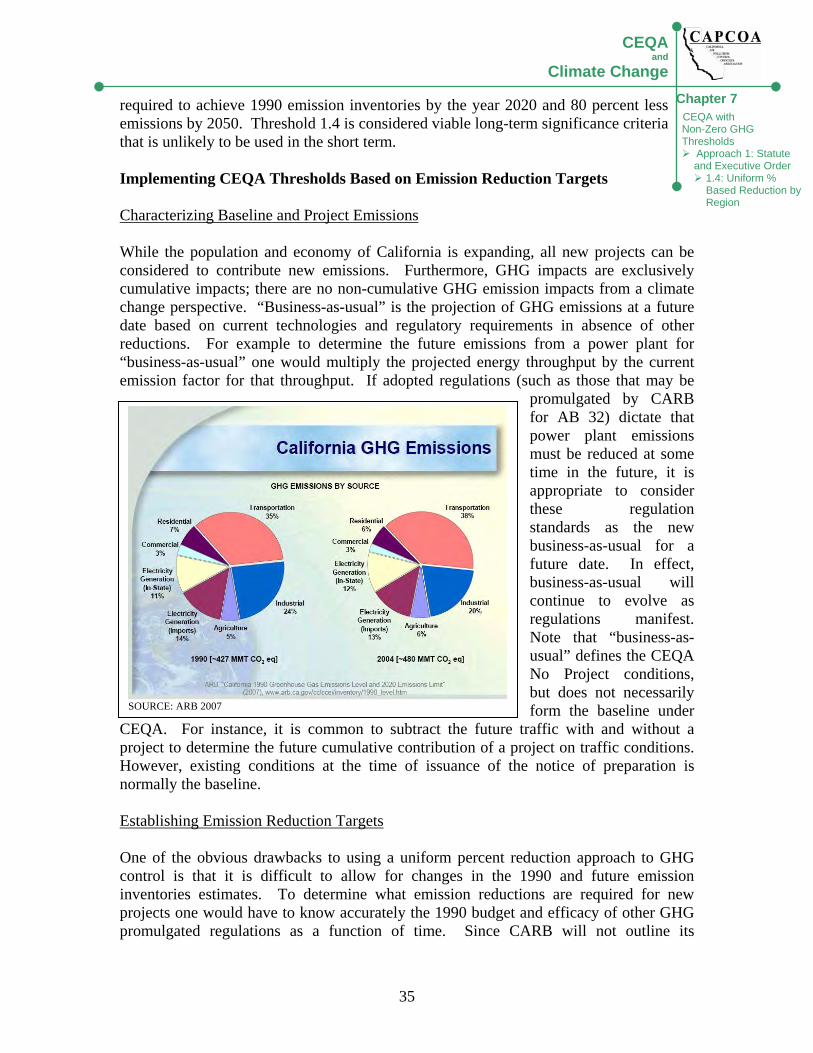
35
CEQAand
Climate ChangeChapter 7
CEQA with Non-Zero GHG Thresholds
Approach 1: Statute and Executive Order
1.4: Uniform % Based Reduction by Region
required to achieve 1990 emission inventories by the year 2020 and 80 percent less emissions by 2050. Threshold 1.4 is considered viable long-term significance criteria that is unlikely to be used in the short term. Implementing CEQA Thresholds Based on Emission Reduction Targets Characterizing Baseline and Project Emissions While the population and economy of California is expanding, all new projects can be considered to contribute new emissions. Furthermore, GHG impacts are exclusively cumulative impacts; there are no non-cumulative GHG emission impacts from a climate change perspective. “Business-as-usual” is the projection of GHG emissions at a future date based on current technologies and regulatory requirements in absence of other reductions. For example to determine the future emissions from a power plant for “business-as-usual” one would multiply the projected energy throughput by the current emission factor for that throughput. If adopted regulations (such as those that may be
promulgated by CARB for AB 32) dictate that power plant emissions must be reduced at some time in the future, it is appropriate to consider these regulation standards as the new business-as-usual for a future date. In effect, business-as-usual will continue to evolve as regulations manifest. Note that “business-as-usual” defines the CEQA No Project conditions, but does not necessarily form the baseline under
CEQA. For instance, it is common to subtract the future traffic with and without a project to determine the future cumulative contribution of a project on traffic conditions. However, existing conditions at the time of issuance of the notice of preparation is normally the baseline. Establishing Emission Reduction Targets One of the obvious drawbacks to using a uniform percent reduction approach to GHG control is that it is difficult to allow for changes in the 1990 and future emission inventories estimates. To determine what emission reductions are required for new projects one would have to know accurately the 1990 budget and efficacy of other GHG promulgated regulations as a function of time. Since CARB will not outline its
SOURCE: ARB 2007
36
CEQA and
Climate Change
regulation strategy for several more years, it is difficult to determine accurately what the new project reductions should be in the short term. Future updates to the 1990 inventory could necessitate changes in thresholds that are based on that inventory. It is important to note that it is difficult to create near term guidance for a uniform reduction threshold strategy since it would require considerable speculation regarding the implementation and effectiveness of forthcoming CARB regulations. Of greater importance are the assumptions used to make the projected 2020 emission inventories. Projecting future inventories over the next 15-50 years involves substantial uncertainty. Furthermore, there are likely to be federal climate change regulations and possibly additional international GHG emission treaties in the near future. To avoid such speculation, this paper defines all future emission inventories as hypothetical business-as-usual projections. This white paper is intended to support local decisions about CEQA and GHG in the near term. During this period, it is unlikely that a threshold based on emission reduction targets would need to be changed. However, it is possible that future inventory updates will show that targets developed on the current inventory were not stringent enough, or were more stringent than was actually needed. Approach 2 – Tiered Approach The goal of a tiered threshold is to maximize reduction predictability while minimizing administrative burden and costs. This would be accomplished by prescribing feasible mitigation measures based on project size and type, and reserving the detailed review of an EIR for those projects of greater size and complexity. This approach may require inclusion in a General Plan, or adoption of specific rules or ordinances in order to fully and effectively implement it. A tiered CEQA significance threshold could establish different levels at which to determine if a project would have a significant impact. The tiers could be established based on the gross GHG emission estimates for a project or could be based on the physical size and characteristics of the project. This approach would then prescribe a set of GHG mitigation strategies that would have to be incorporated into the project in order for the project to be considered less than significant. The framework for a tiered threshold would include the following:
• disclosure of GHG emissions for all projects; • support for city/county/regional GHG emissions reduction planning; • creation and use of a “green list” to promote the construction of projects that have
desirable GHG emission characteristics; • a list of mitigation measures;
37
CEQAand
Climate ChangeChapter 7
CEQA with Non-Zero GHG Thresholds
Approach 2: Tiered
• a decision tree approach to tiering; and • quantitative or qualitative thresholds.
Decision-Tree Approach to Tiering CEQA guidance that allows multiple methodologies to demonstrate GHG significance will facilitate the determination of significance for a broad range of projects/plans that would otherwise be difficult to address with a single non-compound methodology. Even though there could be multiple ways that a project can determine GHG significance using a decision-tree approach, only one methodology need be included in any single CEQA document prepared by the applicant. The presence of multiple methodologies to determine significance is designed to promote flexibility rather than create additional analysis overhead. Figure 1 shows a conceptual approach to significance determination using a tiered approach that shows the multiple routes to significance determination. Figure 1 Detail Description Figure 1 pictorially represents how an agency can determine a project’s or plan’s significance for CEQA analysis using the non-zero threshold methodology. The emissions associated with a project/plan are assumed to have a significant impact unless one can arrive at a less-than-significant finding by at least one of the methodologies below. 1. Demonstrate that a General Plan (GP) or Regional Plan is in Compliance with AB32
• For most GPs or RPs this will require demonstration that projected 2020 emissions will be equal to or less than 1990 emissions.
• GPs or RPs are expected to fully document 1990 and 2020 GHG emission inventories.
• Projection of 2020 emissions is complicated by the fact that CARB is expected to promulgate emission reductions in the short term. Until explicit CARB regulations are in place, unmitigated GP 2020 emission inventories represent business-as-usual scenarios.
• EIRs for GPs or RPs which demonstrate 2020 mitigated emissions are less than or equal to 1990 emissions are considered less than significant.
2. Demonstrate the Project is Exempt Based on SB 97
• As specified in SB 97, projects that are funded under November 2006 Proposition 1B (Highway Safety, Traffic Reduction, Air Quality and Port Security Bond Act) and 1C (Disaster Preparedness and Flood Prevention Bond Act) may be exempt from analysis until January 1, 2010.
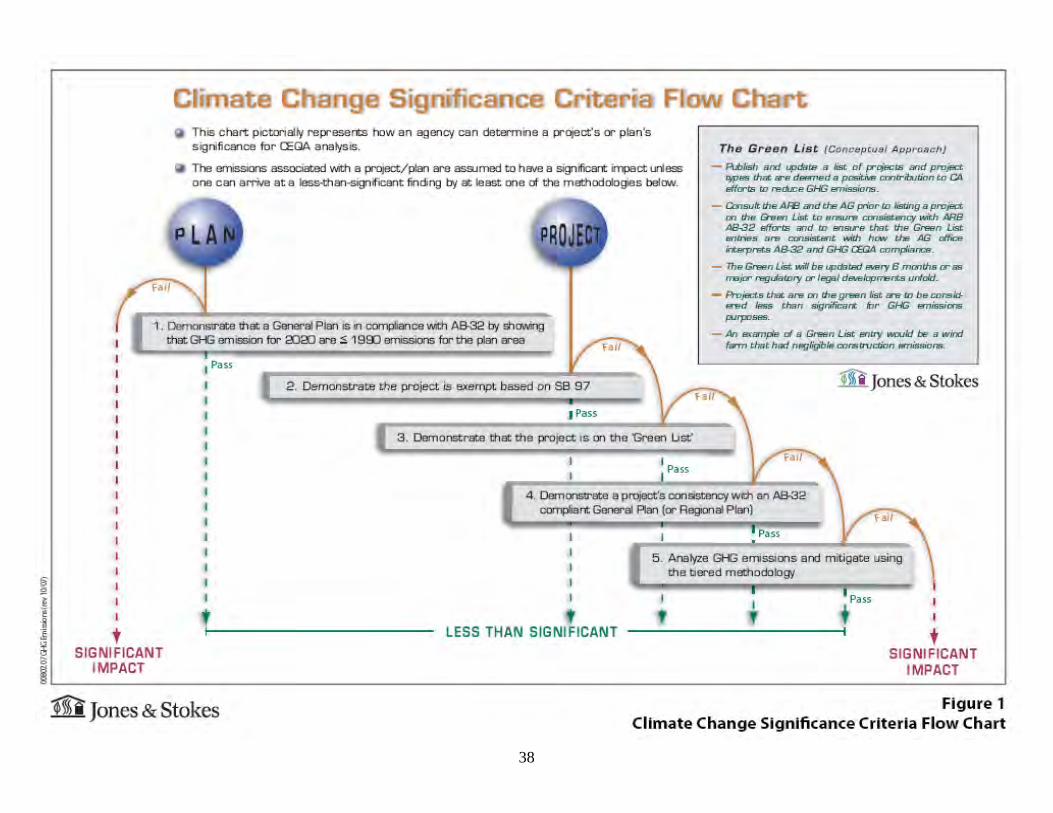
38
Chapter 7
CEQA with Non-Zero GHG Thresholds
Approach 2: Tiered

39
CEQAand
Climate ChangeChapter 7
CEQA with Non-Zero GHG Thresholds
Approach 2: Tiered
• An exemption can be used in an ND, MND, or EIR to support a less than significant finding for GHG impacts.
3. Demonstrate that the Project is on the ‘Green List’
• This list would include projects that are deemed a positive contribution to California efforts to reduce GHG emissions. If the project is of the type described on the Green List it is considered less than significant.
• If the Green List entry description requires mitigation for impacts other than GHG, this methodology can be used in MNDs or EIRs; if the Green List entry does not require mitigation this methodology can be used in NDs, MNDs, or EIRs.
4. Demonstrate a Project’s Compliance with a General Plan
• If a project is consistent with an appropriate General Plan’s Greenhouse Gas Reduction Plan (GGRP), a project can be declared less than significant.
• Note that at this time there are no known jurisdictions that have a GGRP that has been fully subject to CEQA review. While Marin County has adopted a forward-thinking GGRP and it is described in the most recent GP update, the associated EIR does not analyze the secondary environmental impacts of some of the GGRP measures such as tidal energy. While one can reference GGRPs that have not been reviewed fully in CEQA, to attempt to show a project’s compliance with such a plan as evidence that the project’s GHG emission contributions are less than significant may not be supported by substantial evidence that cumulative emissions are being fully addressed in the particular jurisdiction.
• Compliance with a CEQA-vetted GGRP can be cited as evidence for all CEQA documents (Categorical Exemption, ND, MND, and EIR).
5. Analyze GHG Emissions and Mitigate using the Tiered Methodology
• Guidance and mitigation methodology for various development projects (residential, commercial, industrial) are listed in the form of tiered thresholds. If a project incorporates the mitigation measures specified in the tiered threshold tables the project is considered less than significant.
• All project emissions are considered less than significant if they are less than the threshold(s).
• If the tiered approach requires mitigation, this methodology can be used in MNDs or EIRs; if the tiered approach does not require mitigation this methodology can be used in NDs, MNDs, or EIRs.
40
CEQA and
Climate Change
The Green List
• The Green List would be a list of projects and project types that are deemed a positive contribution to California’s efforts to reduce GHG emissions.
• If this approach is followed, it is suggested that CARB and the Attorney General (AG) are consulted prior to listing a project on the Green List to ensure consistency with CARB AB 32 efforts and to ensure that the Green List entries are consistent with how the AG office interprets AB 32 and GHG CEQA compliance.
• The Green List should be updated every 6 months or as major regulatory or legal developments unfold.
• Projects that are on the Green List are to be considered less than significant for GHG emissions purposes.
• A tentative list of potential Green List entries is presented below. Actual Green List entries should be far more specific and cover a broad range of project types and mitigation approaches. The list below is merely a proof-of-concept for the actual Green List.
1. Wind farm for the generation of wind-powered electricity 2. Extension of transit lines to currently developed but underserved communities 3. Development of high-density infill projects with easily accessible mass transit 4. Small hydroelectric power plants at existing facilities that generate 5 mw or
less (as defined in Class 28 Categorical Exemption) 5. Cogeneration plants with a capacity of 50 mw or less at existing facilities (as
defined in Class 29 Cat Exemption) 6. Increase in bus service or conversion to bus rapid transit service along an
existing bus line 7. Projects with LEED "Platinum" rating 8. Expansion of recycling facilities within existing urban areas 9. Recycled water projects that reduce energy consumption related to water
supplies that services existing development 10. Development of bicycle, pedestrian, or zero emission transportation
infrastructure to serve existing regions There are also several options for tiering and thresholds, as shown in Table 2 below. One could establish strictly numeric emissions thresholds and require mitigation to below the specific threshold to make a finding of less than significant. One could establish narrative emissions threshold that are based on a broader context of multiple approaches to GHG reductions and a presumption that projects of sufficiently low GHG intensity are less than significant. In Concept 2A, a zero threshold would be applied to projects and thus only projects that result in a reduction of GHG emissions compared to baseline emissions would be less than significant absent mitigation. All projects would require quantified inventories. All projects that result in a net increase of GHG emissions would be required to mitigate their emissions to zero through direct mitigation or through fees or offsets or the impacts
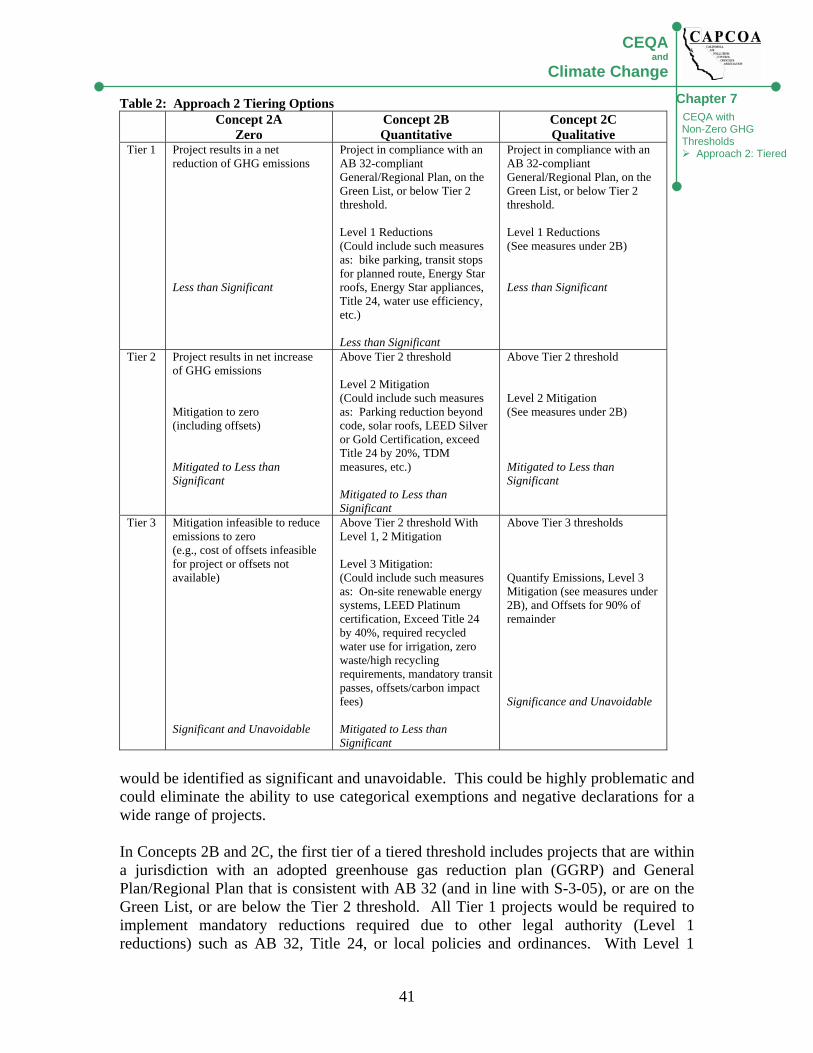
41
CEQAand
Climate ChangeChapter 7
CEQA with Non-Zero GHG Thresholds
Approach 2: Tiered
Table 2: Approach 2 Tiering Options Concept 2A
Zero Concept 2B Quantitative
Concept 2C Qualitative
Tier 1 Project results in a net reduction of GHG emissions Less than Significant
Project in compliance with an AB 32-compliant General/Regional Plan, on the Green List, or below Tier 2 threshold. Level 1 Reductions (Could include such measures as: bike parking, transit stops for planned route, Energy Star roofs, Energy Star appliances, Title 24, water use efficiency, etc.) Less than Significant
Project in compliance with an AB 32-compliant General/Regional Plan, on the Green List, or below Tier 2 threshold. Level 1 Reductions (See measures under 2B) Less than Significant
Tier 2 Project results in net increase of GHG emissions Mitigation to zero (including offsets) Mitigated to Less than Significant
Above Tier 2 threshold Level 2 Mitigation (Could include such measures as: Parking reduction beyond code, solar roofs, LEED Silver or Gold Certification, exceed Title 24 by 20%, TDM measures, etc.) Mitigated to Less than Significant
Above Tier 2 threshold Level 2 Mitigation (See measures under 2B) Mitigated to Less than Significant
Tier 3 Mitigation infeasible to reduce emissions to zero (e.g., cost of offsets infeasible for project or offsets not available) Significant and Unavoidable
Above Tier 2 threshold With Level 1, 2 Mitigation Level 3 Mitigation: (Could include such measures as: On-site renewable energy systems, LEED Platinum certification, Exceed Title 24 by 40%, required recycled water use for irrigation, zero waste/high recycling requirements, mandatory transit passes, offsets/carbon impact fees) Mitigated to Less than Significant
Above Tier 3 thresholds Quantify Emissions, Level 3 Mitigation (see measures under 2B), and Offsets for 90% of remainder Significance and Unavoidable
would be identified as significant and unavoidable. This could be highly problematic and could eliminate the ability to use categorical exemptions and negative declarations for a wide range of projects. In Concepts 2B and 2C, the first tier of a tiered threshold includes projects that are within a jurisdiction with an adopted greenhouse gas reduction plan (GGRP) and General Plan/Regional Plan that is consistent with AB 32 (and in line with S-3-05), or are on the Green List, or are below the Tier 2 threshold. All Tier 1 projects would be required to implement mandatory reductions required due to other legal authority (Level 1 reductions) such as AB 32, Title 24, or local policies and ordinances. With Level 1
42
CEQA and
Climate Change
reduction measures, qualifying Tier 1 projects would be considered less than significant without being required to demonstrate mitigation to zero. In Concept 2B, the Tier 2 threshold would be quantitative, and quantified inventories would be required. Several quantitative threshold options are discussed below. A more comprehensive set of Level 2 mitigation would be required. If the project’s emissions still exceed the Tier 2 threshold, an even more aggressive set of Level 3 mitigation measures would be required including offsets (when feasible) to reduce emissions below the Tier 2 threshold. In Concept 2C, there would be two thresholds, a lower Tier 2 threshold (the “low bar”) and a higher Tier 3 threshold (the “high bar”). The Tier 2 threshold would be the significance threshold for the purposes of CEQA and would be qualitative in terms of units (number of dwelling units, square feet of commercial space, etc.) or a per capita ratio. Projects above the Tier 2 threshold would be required to implement the comprehensive set of Level 2 mitigation. Projects below the Tier 2 threshold would not be required to quantify emissions or reductions. The Tier 3 threshold would be a threshold to distinguish the larger set of projects for which quantification of emissions would be required. Level 3 mitigation would be required and the project would be required to purchase offsets (when feasible) in the amount of 90 percent of the net emissions after application of Level 1 reductions and Level 2 and 3 mitigation. A variant on Concept 2C would be to require mandatory Level 3 mitigation without quantification and offsets. Approach 2 Threshold Options Seven threshold options were developed for this approach. The set of options are framed to capture different levels of new development in the CEQA process and thus allow different levels of mitigation. Options range from a zero first-tier threshold (Threshold 2.1) up to a threshold for GHG that would be equivalent to the capture level (i.e., number of units) of the current criteria pollutant thresholds used by some air districts (Threshold 2.4). The decision-based implementation approach discussed above could be used for any of these options. Table 3 below compares the results of each of the approaches discussed here. Threshold 2.1: Zero First Tier Tiered Threshold. This option would employ the decision tree concept and set the first tier cut-point at zero. The second tier cut-point could be one of the qualitative or quantitative thresholds discussed below. First-tier projects would be required to implement a list of very feasible and readily available mitigation measures. Threshold 2.2: Quantitative Threshold Based on Market Capture A single quantitative threshold was developed in order to ensure capture of 90 percent or more of likely future discretionary developments. The objective was to set the emission
43
CEQAand
Climate ChangeChapter 7
CEQA with Non-Zero GHG Thresholds
Approach 2: Tiered 2.2: Quantitative Threshold Based on Market Capture
threshold low enough to capture a substantial fraction of future residential and non-residential development that will be constructed to accommodate future statewide population and job growth, while setting the emission threshold high enough to exclude small development projects that will contribute a relatively small fraction of the cumulative statewide GHG emissions. The quantitative threshold was created by using the following steps:
• Reviewing data from four diverse cities (Los Angeles in southern California and Pleasanton, Dublin, and Livermore in northern California) on pending applications for development.
• Determining the unit (dwelling unit or square feet) threshold that would capture
approximately 90 percent of the residential units or office space in the pending application lists.
• Based on the data from the four cities, the thresholds selected were 50 residential
units and 30,000 square feet of commercial space.
• The GHG emissions associated with 50 single-family residential units and 30,000 square feet of office were estimated and were found to be 900 metric tons and 800 metric tons, respectively. Given the variance on individual projects, a single threshold of 900 metric tons was selected for residential and office projects.
• A 900 metric ton threshold was also selected for non-office commercial projects
and industrial projects to provide equivalency for different projects in other economic sectors.
• If this threshold is preferred, it is suggested that a more robust data set be
examined to increase the representativeness of the selected thresholds. At a minimum, a diverse set of at least 20 cities and/or counties from throughout the state should be examined in order to support the market capture goals of this threshold. Further, an investigation of market capture may need to be conducted for different commercial project types and for industrial projects in order to examine whether multiple quantitative emissions thresholds or different thresholds should be developed.
The 900-ton threshold corresponds to 50 residential units, which corresponds to the 84th percentile of projects in the City of Los Angeles, the 79th percentile in the City of Pleasanton, the 50th percentile in the City of Livermore and the 4th percentile in the City of Dublin. This is suggestive that the GHG reduction burden will fall on larger projects that will be a relatively small portion of overall projects within more developed central cities (Los Angeles) and suburban areas of slow growth (Pleasanton) but would be the higher portion of projects within moderately (Livermore) or more rapidly developing areas (Dublin). These conclusions are suggestive but not conclusive due to the small sample size. The proposed threshold would exclude the smallest proposed developments
44
CEQA and
Climate Change
from potentially burdensome requirements to quantify and mitigate GHG emissions under CEQA. While this would exclude perhaps 10 percent of new residential development, the capture of 90 percent of new residential development would establish a strong basis for demonstrating that cumulative reductions are being achieved across the state. It can certainly serve as an interim measure and could be revised if subsequent regulatory action by CARB shows that a different level or different approach altogether is called for. The 900-ton threshold would correspond to office projects of approximately 35,000 square feet, retail projects of approximately 11,000 square feet, or supermarket space of approximately 6,300 square feet. 35,000 square feet would correspond to the 46th percentile of commercial projects in the City of Los Angeles, the 54th percentile in the City of Livermore, and the 35th percentile in the City of Dublin. However, the commercial data was not separated into office, retail, supermarket or other types, and thus the amount of capture for different commercial project types is not known. The proposed threshold would exclude smaller offices, small retail (like auto-parts stores), and small supermarkets (like convenience stores) from potentially burdensome requirements to quantify and mitigate GHG emissions under CEQA but would include many medium-scale retail and supermarket projects. The industrial sector is less amenable to a unit-based approach given the diversity of projects within this sector. One option would be to adopt a quantitative GHG emissions threshold (900 tons) for industrial projects equivalent to that for the residential/commercial thresholds described above. Industrial emissions can result from both stationary and mobile sources. CARB estimates that their suggested reporting threshold for stationary sources of 25,000 metric tons accounts for more than 90 percent of the industrial sector GHG emissions (see Threshold 2.3 for 25,000 metric ton discussion). If the CARB rationale holds, then a 900 metric ton threshold would likely capture at least 90 percent (and likely more) of new industrial and manufacturing sources. If this approach is advanced, we suggest further examination of industrial project data to determine market capture. This threshold would require the vast majority of new development emission sources to quantify their GHG emissions, apportion the forecast emissions to relevant source categories, and develop GHG mitigation measures to reduce their emissions. Threshold 2.3: CARB Reporting Threshold CARB has recently proposed to require mandatory reporting from cement plants, oil refineries, hydrogen plants, electric generating facilities and electric retail providers, cogeneration facilities, and stationary combustion sources emitting ≥ 25,000 MT CO2e/yr. AB 32 requires CARB to adopt a regulation to require the mandatory reporting and verification of emissions. CARB issued a preliminary draft version of its proposed reporting requirements in August 2007 and estimates that it would capture 94 percent of the GHG emissions associated with stationary sources.

45
CEQAand
Climate Change Chapter 7
CEQA with Non-Zero GHG Thresholds
Approach 2: Tiered 2.3: CARB Mandatory Reporting
2.4: Regulated Emissions Inventory Capture
This threshold would use 25,000 metric tons per year of GHG as the CEQA significance level. CARB proposed to use the 25,000 metric tons/year value as a reporting threshold, not as a CEQA significance threshold that would be used to define mitigation requirements. CARB is proposing the reporting threshold to begin to compile a statewide emission inventory, applicable only for a limited category of sources (large industrial facilities using fossil fuel combustion). A 25,000 metric ton significance threshold would correspond to the GHG emissions of approximately 1,400 residential units, 1 million square feet of office space, 300,000 square feet of retail, and 175,000 square feet of supermarket space. This threshold would capture far less than half of new residential or commercial development. As noted above, CARB estimates the industrial-based criteria would account for greater than 90 percent of GHG emissions emanating from stationary sources. However, industrial and manufacturing projects can also include substantial GHG emissions from mobile sources that are associated with the transportation of materials and delivery of products. When all transportation-related emissions are included, it is unknown what portion of new industrial or manufacturing projects a 25,000-ton threshold would actually capture. An alternative would be to use a potential threshold of 10,000 metric tons considered by the Market Advisory Committee for inclusion in a Greenhouse Gas Cap and Trade System in California. A 10,000 metric ton significance threshold would correspond to the GHG emissions of approximately 550 residential units, 400,000 square feet of office space, 120,000 square feet of retail, and 70,000 square feet of supermarket space. This threshold would capture roughly half of new residential or commercial development. Threshold 2.4: Regulated Emissions Inventory Capture Most California air districts have developed CEQA significance thresholds for NOx and ROG emissions to try to reduce emissions of ozone precursors from proposed sources that are not subject to NSR pre-construction air quality permitting. The historical management of ozone nonattainment issues in urbanized air districts is somewhat analogous to today’s concerns with greenhouse gas emissions in that regional ozone concentrations are a cumulative air quality problem caused by relatively small amounts of NOx and ROG emissions from thousands of individual sources, none of which emits enough by themselves to cause elevated ozone concentrations. Those same conditions apply to global climate change where the environmental problem is caused by emissions from a countless number of individual sources, none of which is large enough by itself to cause the problem. Because establishment of NOx/ROG emissions CEQA significance thresholds has been a well-tested mechanism to ensure that individual projects address cumulative impacts and to force individual projects to reduce emissions under CEQA, this threshold presumes the analogy of NOx/ROG emission thresholds could be used to develop similar GHG thresholds.
46
CEQA and
Climate Change
The steps to develop a GHG emission threshold based on the NOx/ROG analogy were as follows:
• For each agency, define its NOx/ROG CEQA thresholds.
• For each agency, define the regional NOx/ROG emission inventory the agency is trying to regulate with its NOx/ROG thresholds.
• For each agency, calculate the percentage of the total emission inventory for NOx
represented by that agency’s CEQA emission threshold. That value represents the “minimum percentage of regulated inventory” for NOx.
• The current (2004) California-wide GHG emission inventory is 499 million
metric tons per year of CO2 equivalent (MMT CO2e). Apply the typical “minimum percentage of regulated inventory” value to the statewide GHG inventory, to develop a range of analogous GHG CEQA thresholds.
The preceding methodology was applied to two different air quality districts: the Bay Area Air Quality Management District (BAAQMD), a mostly-urbanized agency within which most emissions are generated from urban areas; and the San Joaquin Valley Air Pollution Control District (SJVAPCD), which oversees emissions emanating in part from rural areas that are generated at dispersed agricultural sources and area sources. For example, in the Bay Area the NOx threshold is 15 tons/year. The total NOx inventory for 2006 was 192,000 tons/year (525 tons/day). The threshold represents 0.008 percent of the total NOx inventory. Applying that ratio to the total statewide GHG emissions inventory of 499 MMT CO2e (2004) yields an equivalent GHG threshold of 39,000 MMT CO2e. The range of analogous CEQA GHG thresholds derived from those two agencies is tightly clustered, ranging from 39,000 to 46,000 tons/year. A 39,000 to 46,000 metric ton threshold would correspond to the GHG emissions of approximately 2,200 to 2,600 residential units, 1.5 to 1.8 million square feet of office space, 470,000 to 560,000 square feet of retail, and 275,000 to 320,000 square feet of supermarket space. This threshold would capture far less than half of new residential or commercial development. Similarly, this threshold would capture less of new industrial/manufacturing GHG emissions inventory than Thresholds 2.2 or 2.3. Threshold 2.5: Unit-Based Thresholds Based on Market Capture Unit thresholds were developed for residential and commercial developments in order to capture approximately 90 percent of future development. The objective was to set the unit thresholds low enough to capture a substantial fraction of future housing and commercial developments that will be constructed to accommodate future statewide population and job growth, while setting the unit thresholds high enough to exclude small development projects that will contribute a relatively small fraction of the cumulative statewide GHG emissions. Sector-based thresholds were created by using the same steps
47
CEQAand
Climate ChangeChapter 7
CEQA with Non-Zero GHG Thresholds
Approach 2: Tiered 2.5: Unit-Based Thresholds Based on Market Capture
and data used to create Threshold 2.2- Quantitative Threshold Based on Market Capture above. The distribution of pending application data suggests that the GHG reduction burden will fall on larger projects that will be a relatively small portion of overall projects within more developed central cities and suburban areas of slow growth but would be the higher portion of projects within moderately or rapidly developing areas. The proposed threshold would exclude the smallest proposed developments from potentially burdensome requirements to quantify and mitigate GHG emissions under CEQA. While this would exclude perhaps 10 percent of new residential development, the capture of 90 percent of new residential development would establish a strong basis for demonstrating that cumulative reductions are being achieved across the state. It can certainly serve as an interim measure and could be revised if subsequent regulatory action by CARB shows that a different level or different approach altogether is called for. A similar rationale can be applied to the development of a commercial threshold. Threshold 2.5 would exclude many smaller businesses from potentially burdensome requirements to quantify and mitigate GHG emissions under CEQA. It should be noted that the GHG emissions of commercial projects vary substantially. For example, the carbon dioxide emissions associated with different commercial types were estimated as follows:
• 30,000 square-foot (SF) office = 800 metric tons/year CO2
• 30,000 SF retail = 2,500 metric tons/year CO2
• 30,000 SF supermarket = 4,300 metric tons/year CO2 Thus, in order to assure appropriate market capture on an emissions inventory basis, it will be important to examine commercial project size by type, instead of in the aggregate (which has been done in this paper). The industrial sector is less amenable to a unit-based approach given the diversity of projects within this sector. One option would be to use a quantitative threshold of 900 tons for industrial projects in order to provide for rough equivalency between different sectors. Industrial emissions can result from both stationary and mobile sources. However, if the CARB rationale for > 90 percent stationary source capture with a threshold of 25,000 metric tons holds, then a 900 metric ton threshold would likely capture at least 90 percent (and likely more) of new industrial sources. Further examination of unit-based industrial thresholds, such as the number of employees or manufacturing floor space or facility size, may provide support for a unit-based threshold based on market capture. This threshold would require the vast majority of new development emission sources to quantify their GHG emissions, apportion the forecast emissions to relevant source categories, and develop GHG mitigation measures to reduce their emissions.
48
CEQA and
Climate Change
Threshold 2.6. Projects of Statewide, Regional, or Areawide Significance For this threshold, a set of qualitative, tiered CEQA thresholds would be adopted based on the definitions of “projects with statewide, regional or areawide significance” under the Guidelines for California Environmental Quality Act, CCR Title 14, Division 6, Section 15206(b). Project sizes defined under this guideline include the following:
• Proposed residential development of more than 500 dwelling units.
• Proposed shopping center or business establishment employing more than 1,000 persons or encompassing more than 500,000 square feet of floor space.
• Proposed commercial office building employing more than 1,000 persons or
encompassing more than 250,000 square feet of floor space.
• Proposed hotel/motel development of more than 500 rooms.
• Proposed industrial, manufacturing or processing plant or industrial park planned to house more than 1,000 persons, or encompassing more than 600,000 square feet of floor space.
These thresholds would correspond to the GHG emissions of approximately 9,000 metric tons for residential projects, 13,000 metric tons for office projects, and 41,000 metric tons for retail projects. These thresholds would capture approximately half of new residential development and substantially less than half of new commercial development. It is unknown what portion of the new industrial or manufacturing GHG inventory would be captured by this approach. Threshold 2.7 Efficiency-Based Thresholds For this approach, thresholds would be based on measurements of efficiency. For planning efforts, the metric could be GHG emissions per capita or per job or some combination thereof. For projects, the metric could be GHG emission per housing unit or per square foot of commercial space. In theory, one could also develop metrics for GHG emissions per dollar of gross product to measure the efficiency of the economy. This approach is attractive because it seeks to benchmark project GHG intensity against target levels of efficiency. The thresholds would need to be set such that there is reasonably foreseeable and sufficient reductions compared to business as usual to support meeting AB 32 and S-3-05 goals in time (in combination with command and control regulations). Because this approach would require substantial data and modeling to fully develop, this is a concept considered as a potential future threshold and not appropriate
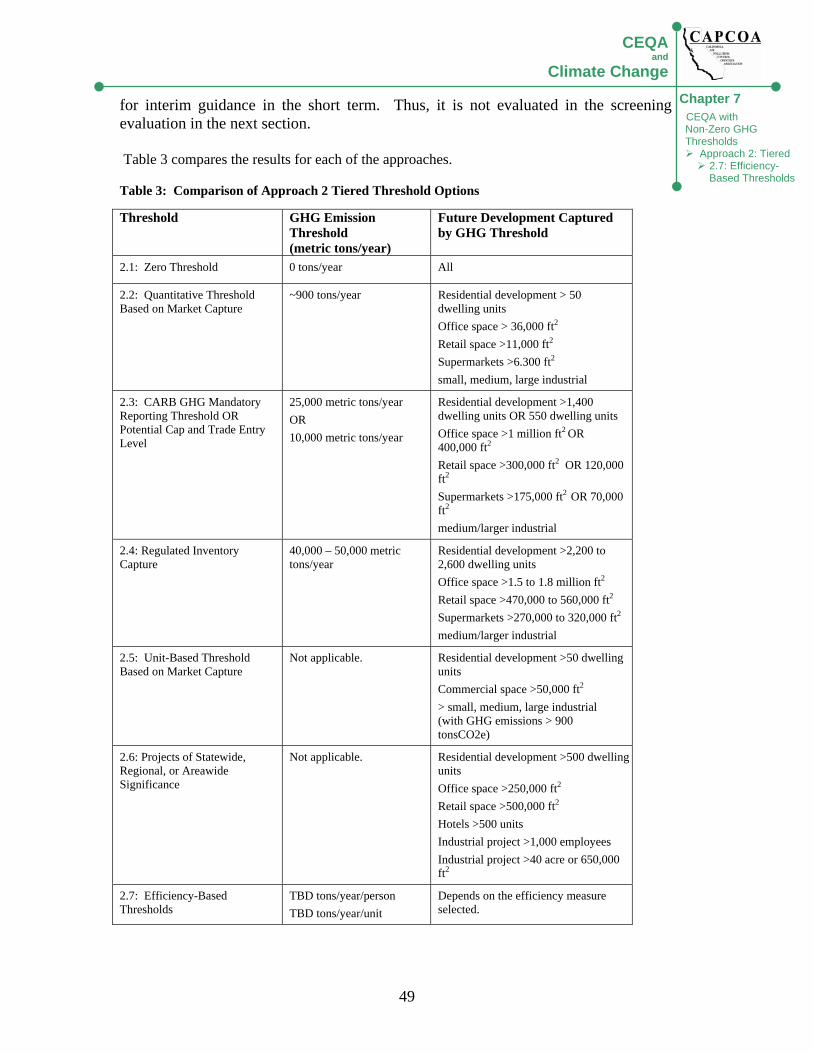
49
CEQAand
Climate ChangeChapter 7
CEQA with Non-Zero GHG Thresholds
Approach 2: Tiered 2.7: Efficiency-Based Thresholds
for interim guidance in the short term. Thus, it is not evaluated in the screening evaluation in the next section. Table 3 compares the results for each of the approaches. Table 3: Comparison of Approach 2 Tiered Threshold Options
Threshold GHG Emission Threshold (metric tons/year)
Future Development Captured by GHG Threshold
2.1: Zero Threshold 0 tons/year All
2.2: Quantitative Threshold Based on Market Capture
~900 tons/year Residential development > 50 dwelling units Office space > 36,000 ft2 Retail space >11,000 ft2 Supermarkets >6.300 ft2 small, medium, large industrial
2.3: CARB GHG Mandatory Reporting Threshold OR Potential Cap and Trade Entry Level
25,000 metric tons/year OR 10,000 metric tons/year
Residential development >1,400 dwelling units OR 550 dwelling units Office space >1 million ft2 OR 400,000 ft2 Retail space >300,000 ft2 OR 120,000 ft2 Supermarkets >175,000 ft2 OR 70,000 ft2 medium/larger industrial
2.4: Regulated Inventory Capture
40,000 – 50,000 metric tons/year
Residential development >2,200 to 2,600 dwelling units Office space >1.5 to 1.8 million ft2 Retail space >470,000 to 560,000 ft2 Supermarkets >270,000 to 320,000 ft2 medium/larger industrial
2.5: Unit-Based Threshold Based on Market Capture
Not applicable. Residential development >50 dwelling units Commercial space >50,000 ft2 > small, medium, large industrial (with GHG emissions > 900 tonsCO2e)
2.6: Projects of Statewide, Regional, or Areawide Significance
Not applicable. Residential development >500 dwelling units Office space >250,000 ft2 Retail space >500,000 ft2 Hotels >500 units Industrial project >1,000 employees Industrial project >40 acre or 650,000 ft2
2.7: Efficiency-Based Thresholds
TBD tons/year/person TBD tons/year/unit
Depends on the efficiency measure selected.
50
CEQA and
Climate Change
Implementing CEQA With Tiered Thresholds Several issues related to Approach 2 are addressed below:
1. Some applications of this approach may need to be embodied in a duly approved General Plan, or in some other formal regulation or ordinance to be fully enforceable. Because CEQA does not expressly provide that projects may be deemed insignificant based on implementation of a set of mitigations, this approach may need to be supported with specific and enforceable mechanisms adopted with due public process.
2. How would this concept affect adoption of air district rules and regulations? Proposed air district rules and regulations may be subject to CEQA like other projects and plans. Thus, if significance thresholds were adopted by an APCD or AQMD, then they could also apply to air district discretionary actions. If GHG emissions would be increased by a rule or regulation for another regulated pollutant, that would be a potential issue for review under CEQA.
3. Mitigation measures may not be all-inclusive; better measures now or new future
technology would make these measures obsolete. The mandatory mitigation measures could be periodically updated to reflect current technology, feasibility, and efficiency.
4. Total reduction may not be quantified or difficult to quantify. CEQA only
requires the adoption of feasible mitigation and thus the reduction effectiveness of required mitigation should not be in question. However, the precise reduction effectiveness may indeed be difficult to identify. As described above, if a quantitative threshold is selected as the measure of how much mitigation is mandated, then best available evidence will need to be used to estimate resultant GHG emissions with mitigation adoption. If a qualitative threshold is selected, then it may not be necessary to quantify reductions.
5. Difficult to measure progress toward legislative program goals. One could
require reporting of project inventories to the Climate Action Registry, air district, or regional council of governments, or other suitable body. Collection of such data would allow estimates of the GHG intensity of new development over time, which could be used by CARB to monitor progress toward AB 32 goals.
6. Measures may have adverse impacts on other programs. The identification of
mandatory mitigation will need to consider secondary environmental impacts, including those to air quality.
7. Consideration of life-cycle emissions. In many cases, only direct and indirect
emissions may be addressed, rather than life-cycle emissions. A project applicant has traditionally been expected to only address emissions that are closely related and within the capacity of the project to control and/or influence. The long chain
51
CEQAand
Climate Change Chapter 7
CEQA with Non-Zero GHG Thresholds
Approach 2: Tiered
8. of economic production resulting in materials manufacture, for example, involves numerous parties, each of which in turn is responsible for the GHG emissions associated with their particular activity. However, there are situations where a lead agency could reasonably determine that a larger set of upstream and downstream emissions should be considered because they are being caused by the project and feasible alternatives and mitigation measures may exist to lessen this impact.
Approach 2 Tiered Threshold with Mandatory Mitigation As shown in Table 2, due to the cumulative nature of GHG emissions and climate change impacts, there could be a level of mandatory reductions and/or mitigation for all projects integrated into a tiered threshold approach. In order to meet AB 32 mandates by 2020 and S-3-05 goals, there will need to be adoption of GHG reduction measures across a large portion of the existing economy and new development. As such, in an effort to support a determination under CEQA that a project has a less than considerable contribution to significant cumulative GHG emissions, mitigation could be required on a progressively more comprehensive basis depending on the level of emissions.
• Level 1 Reductions – These reduction measures would apply to all projects and would only consist of AB 32 and other local/state mandates. They would be applied to a project from other legal authority (not CEQA). Level 1 reductions could include such measures as bike parking, transit stops for planned routes, Energy Star roofs, Energy Star appliances, Title 24 compliance, water use efficiency, and other measures. All measures would have to be mandated by CARB or local regulations and ordinances.
• Level 2 Mitigation – Projects that exceed the determined threshold would be
required to first implement readily available technologies and methodologies with widespread availability. Level 2 Mitigation could include such measures as: parking reduction below code minimum levels, solar roofs, LEED Silver or Gold Certification, exceed Title 24 building standards by 20 percent, Traffic Demand Management (TDM) measures, and other requirements.
• Level 3 Mitigation - If necessary to reduce emissions to the thresholds, more
extensive mitigation measures that represent the top tier of feasible efficiency design would also be required. Level 3 Mitigation could include such measures as: on-site renewable energy systems, LEED Platinum certification, exceed Title 24 building requirements by 40 percent, required recycled water use for irrigation, zero waste/high recycling requirements, mandatory transit pass provision, and other measures.
• Offset Mitigation – If, after adoption of all feasible on-site mitigation, the project
is still found to exceed a Tier 2 quantitative threshold, or exceed a Tier 3 qualitative threshold, or if a project cannot feasibly implement the mandatory on-site mitigation, then purchases of offsets could be used for mitigation. In the case
52
CEQA and
Climate Change
of a quantitative threshold, the amount of purchase would be to offset below the Tier 2 significance threshold. In the case of a qualitative threshold, the amount of purchase could be to offset GHG emissions overall to below the lowest equivalent GHG emissions among the Tier 2 qualitative thresholds. With Threshold 2.5, this would be approximately 900 tons of GHG emissions (corresponding to 50 residential units). With Threshold 2.6, this would be approximately 9,000 tons (corresponding to 500 residential units). Alternatively, one could require purchase of offsets in the amount of a set percentage (such as 90% or 50% for example) of the residual GHG emissions (after other mitigation). As discussed earlier, any decision to include or require the use of emission reduction credits (or offsets) must consider issues of availability, quality, and environmental justice.
Substantial Evidence Supporting Different Thresholds If a project can be shown by substantial evidence not to increase GHG emissions relative to baseline emissions, then no fair argument will be available that the project contributes considerably to a significant cumulative climate change impact. It is more challenging to show that a project that increases GHG emissions above baseline emissions does not contribute considerably to a significant cumulative climate change impact. It is critical therefore, to establish an appropriate cumulative context, in which, although an individual project may increase GHG emissions, broader efforts will result in net GHG reductions. Approach 1-based thresholds that by default will require an equal level of GHG reductions from the existing economy (Thresholds 1.1, 1.3, and 1.4) may be less supportable in the short run (especially before 2012) than Approach 1.2 (which requires new development to be relatively more efficient than a retrofitted existing economy). This is because, prior to 2012, there will only be limited mandatory regulations implementing AB 32 that could address the existing economy in a truly systematic way that can be relied upon to demonstrate that overall GHG reduction goals can be achieved by 2020. Approach 1.2 will still rely on substantial reductions in the existing economy but to a lesser degree. Approach 1-based thresholds that would spread the mitigation burden across a sector (Threshold 1.3) or across a region (Threshold 1.4) will allow for tradeoffs between projects or even between municipalities. In order to demonstrate that a sector or a region is achieving net reductions overall, there would need to be feasible, funded, and mandatory requirements in place promoting an overall reduction scheme, in order for a project to result in nominal net increased GHG emissions. Approach 2-based thresholds that capture larger portions of the new development GHG inventory (Thresholds 2.2 and 2.5) would promote growth that results in a smaller increase in GHG emissions; they may therefore be more supportable than thresholds that do not and that have a greater reliance on reductions in the existing economy (Thresholds
53
CEQAand
Climate ChangeChapter 7
CEQA with Non-Zero GHG Thresholds
Approach 2: Tiered
2.3, 2.4, and 2.6), especially in the next three to five years. With an established cumulative context that demonstrates overall net reductions, all threshold approaches could be effective in ensuring growth and development that significantly mitigates GHG emissions growth in a manner that will allow the CARB to achieve the emission reductions necessary to meet AB 32 targets. In that respect, all of these thresholds are supported by substantial evidence. Evaluation of Non-Zero Threshold Options Overarching issues concerning threshold development are reviewed below. Where appropriate, different features or application of the two conceptual approaches and the various options for thresholds under each conceptual approach described above are analyzed. The screening evaluation is summarized in Tables 4 (Approach 1) and 5 (Approach 2). The summary tables rate each threshold for the issues discussed below based on the level of confidence (low, medium or high) ascribed by J&S. The confidence levels relate to whether a threshold could achieve a particular attribute, such as emission reduction effectiveness. For example, a low emission reduction effectiveness rating means the threshold is not expected to capture a relatively large portion of the new development inventory. As described above, Threshold 2.7 is not included in this evaluation because the data to develop an efficiency-based threshold has not been reviewed at this time and because this threshold is not considered feasible as an interim approach until more detailed inventory information is available across the California economy. What is the GHG Emissions Effectiveness of Different Thresholds? Effectiveness was evaluated in terms of whether a threshold would capture a large portion of the GHG emissions inventory and thus require mitigation under CEQA to control such emissions within the larger framework of AB 32. In addition, effectiveness was also evaluated in terms of whether a threshold would require relatively more or less GHG emissions reductions from the existing economy verses new development. This is presumptive that gains from the existing economy (through retrofits, etc.) will be more difficult and inefficient relative to requirements for new development. Approach 1-based thresholds that require equivalent reductions relative to business-as-usual (Thresholds 1.1, 1.3, and 1.4) for both the existing and new economy will be less effective than thresholds that support lower-GHG intensity new development (Approach 1.2). However, since Approach 1-based thresholds do not establish a quantitative threshold below which projects do not have to mitigate, the market capture for new development is complete. Approach 2-based thresholds can be more or less effective at capturing substantial portions of the GHG inventory associated with new development depending on where the quantitative or qualitative thresholds are set. Lower thresholds will capture a broader range of projects and result in greater mitigation. Based on the review of project data for
54
CEQA and
Climate Change
the select municipalities described in the Approach 2 section above, thresholds based on the CARB Reporting Threshold/Cap and Trade Entry Level (Threshold 2.4) or CEQA definitions of “Statewide, Regional or Areawide” projects (Threshold 2.6) will result in a limited capture of the GHG inventory. Lower quantitative or qualitative thresholds (Thresholds 2.1, 2.2 and 2.5) could result in capture of greater than 90 percent of new development. Are the Different Thresholds Consistent with AB 32 and S-3-05? Thresholds that require reductions compared to business-as-usual for all projects or for a large portion of new development would be consistent with regulatory mandates. In time, the required reductions will need to be adjusted from 2020 (AB 32) to 2050 (S-3-05) horizons, but conceptually broad identification of significance for projects would be consistent with both of these mandates. Thresholds that exclude a substantial portion of new development would likely not be consistent, unless it could be shown that other more effective means of GHG reductions have already been, or will be adopted, within a defined timeframe. All Approach 1-based thresholds would be consistent with AB 32 and S-3-05 if it can be demonstrated that other regulations and programs are effective in achieving the necessary GHG reduction from the existing economy to meet the overall state goals. Approach 2-based thresholds that include substantive parts of the new development GHG inventory (Thresholds 2.1, 2.2 and 2.5) will be more consistent with AB 32 and S-3-05 than those that do not (Thresholds 2.3, 2.4, and 2.6) unless it can be demonstrated that other regulations and programs are effective in achieving the necessary GHG reduction from the existing economy to meet the overall state goals. What are the Uncertainties Associated with Different Thresholds? All thresholds have medium to high uncertainties associated with them due to the uncertainty associated with the effectiveness of AB 32 implementation overall, the new character of GHG reduction strategies on a project basis, the immaturity of GHG reduction technologies or infrastructure (such as widespread biodiesel availability), and the uncertainty of GHG reduction effectiveness of certain technologies (such as scientific debate concerning the relative lifecycle GHG emissions of certain biofuels, for example). In general, Approach 1-based thresholds have higher uncertainties than Approach 2 thresholds because they rely on a constantly changing definition of business-as-usual. Threshold 1.2, with its relatively smaller reliance on the existing economy for GHG reductions has relatively less uncertainty than other Approach 1 thresholds. Thresholds that spread mitigation more broadly (Thresholds 1.3 and 1.4) have less uncertainty by avoiding the need for every project to mitigate equally. Approach 2 thresholds with lower quantitative (2.1 and 2.2) or qualitative (2.5) thresholds will have uncertainties associated with the ability to achieve GHG reductions
55
CEQAand
Climate ChangeChapter 7
CEQA with Non-Zero GHG Thresholds
Approach 2: Tiered
from small to medium projects. Approach 2 thresholds with higher quantitative (2.3, 2.4) or qualitative (2.6) thresholds will have uncertainties associated with the ability to achieve relatively larger GHG reductions from the existing economy. What are Other Advantages/Disadvantages of the Different Thresholds? Thresholds with a single project metric (Thresholds 1.1, 1.2, 2.1, 2.2, 2.3, 2.4, 2.5, and 2.6) will be easier to apply to individual projects and more easily understood by project applicants and lead agencies broadly. Thresholds that spread mitigation across sectors (1.3) or regions (1.4), while simple in concept, will require adoption of more complicated cross-jurisdictional reduction plans or evaluation of broad sector-based trends in GHG intensity reduction over time. Approach 1 options would require all projects to quantify emissions in order to determine needed reductions relative to business-as-usual (which will change over time as described above). Concepts that are unit-based (Threshold 2.5 and 2.6) will not result in thresholds that have equal amount of GHG emissions, and thus equity issues may arise.
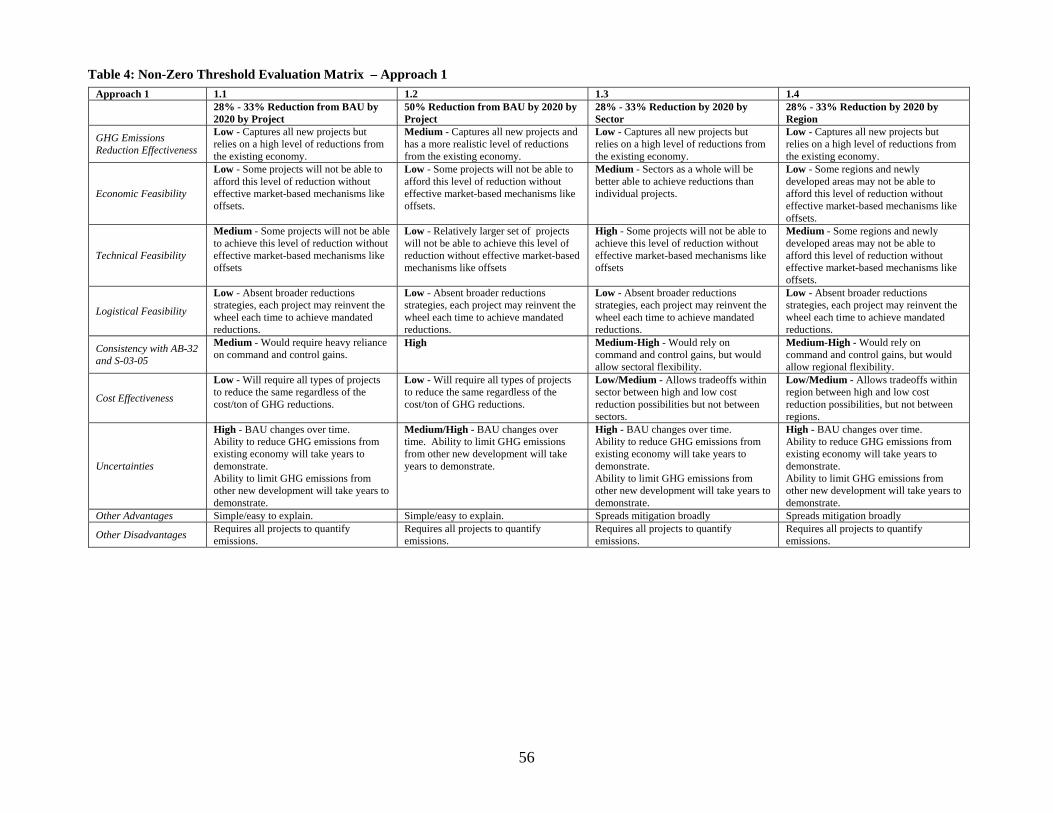
56
Table 4: Non-Zero Threshold Evaluation Matrix – Approach 1Approach 1 1.1 1.2 1.3 1.4
28% - 33% Reduction from BAU by 2020 by Project
50% Reduction from BAU by 2020 by Project
28% - 33% Reduction by 2020 by Sector
28% - 33% Reduction by 2020 by Region
GHG Emissions Reduction Effectiveness
Low - Captures all new projects but relies on a high level of reductions from the existing economy.
Medium - Captures all new projects and has a more realistic level of reductions from the existing economy.
Low - Captures all new projects but relies on a high level of reductions from the existing economy.
Low - Captures all new projects but relies on a high level of reductions from the existing economy.
Economic Feasibility
Low - Some projects will not be able to afford this level of reduction without effective market-based mechanisms like offsets.
Low - Some projects will not be able to afford this level of reduction without effective market-based mechanisms like offsets.
Medium - Sectors as a whole will be better able to achieve reductions than individual projects.
Low - Some regions and newly developed areas may not be able to afford this level of reduction without effective market-based mechanisms like offsets.
Technical Feasibility
Medium - Some projects will not be able to achieve this level of reduction without effective market-based mechanisms like offsets
Low - Relatively larger set of projects will not be able to achieve this level of reduction without effective market-based mechanisms like offsets
High - Some projects will not be able to achieve this level of reduction without effective market-based mechanisms like offsets
Medium - Some regions and newly developed areas may not be able to afford this level of reduction without effective market-based mechanisms like offsets.
Logistical Feasibility
Low - Absent broader reductions strategies, each project may reinvent the wheel each time to achieve mandated reductions.
Low - Absent broader reductions strategies, each project may reinvent the wheel each time to achieve mandated reductions.
Low - Absent broader reductions strategies, each project may reinvent the wheel each time to achieve mandated reductions.
Low - Absent broader reductions strategies, each project may reinvent the wheel each time to achieve mandated reductions.
Consistency with AB-32 and S-03-05
Medium - Would require heavy reliance on command and control gains.
High Medium-High - Would rely on command and control gains, but would allow sectoral flexibility.
Medium-High - Would rely on command and control gains, but would allow regional flexibility.
Cost Effectiveness
Low - Will require all types of projects to reduce the same regardless of the cost/ton of GHG reductions.
Low - Will require all types of projects to reduce the same regardless of the cost/ton of GHG reductions.
Low/Medium - Allows tradeoffs within sector between high and low cost reduction possibilities but not between sectors.
Low/Medium - Allows tradeoffs within region between high and low cost reduction possibilities, but not between regions.
Uncertainties
High - BAU changes over time. Ability to reduce GHG emissions from existing economy will take years to demonstrate. Ability to limit GHG emissions from other new development will take years to demonstrate.
Medium/High - BAU changes over time. Ability to limit GHG emissions from other new development will take years to demonstrate.
High - BAU changes over time. Ability to reduce GHG emissions from existing economy will take years to demonstrate. Ability to limit GHG emissions from other new development will take years to demonstrate.
High - BAU changes over time. Ability to reduce GHG emissions from existing economy will take years to demonstrate. Ability to limit GHG emissions from other new development will take years to demonstrate.
Other Advantages Simple/easy to explain. Simple/easy to explain. Spreads mitigation broadly Spreads mitigation broadly
Other Disadvantages Requires all projects to quantify emissions.
Requires all projects to quantify emissions.
Requires all projects to quantify emissions.
Requires all projects to quantify emissions.
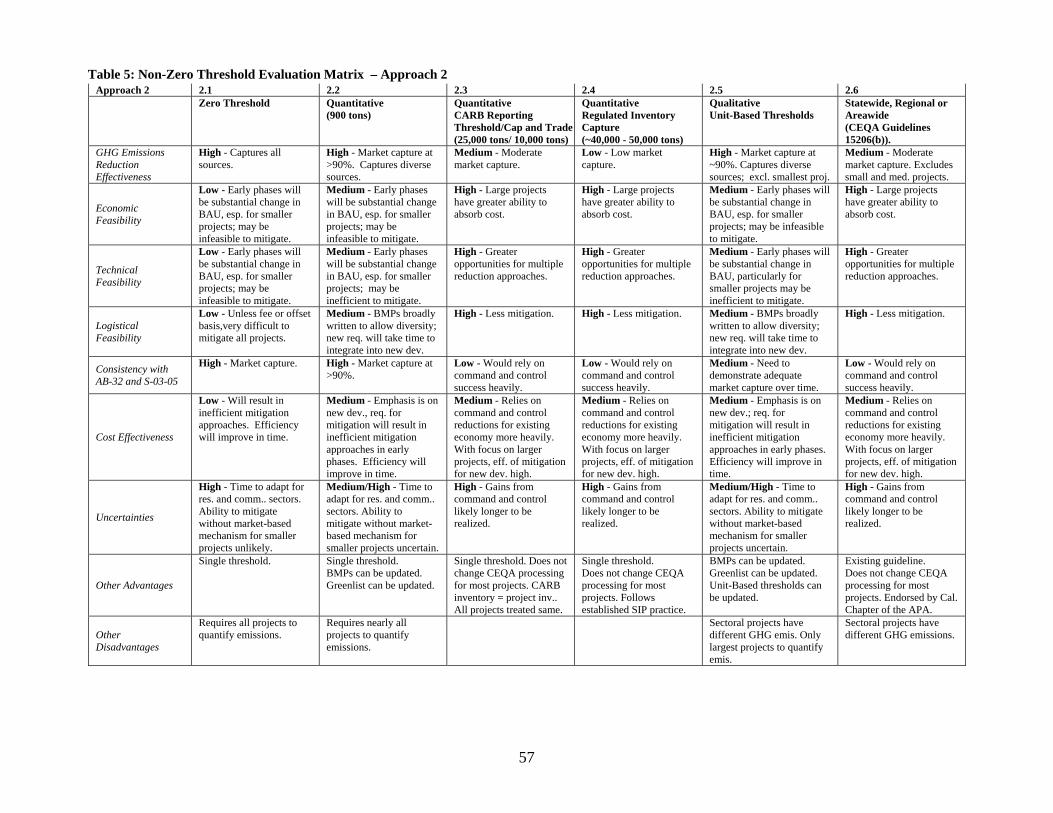
57
Table 5: Non-Zero Threshold Evaluation Matrix – Approach 2 Approach 2 2.1 2.2 2.3 2.4 2.5 2.6
Zero Threshold Quantitative (900 tons)
Quantitative CARB Reporting Threshold/Cap and Trade (25,000 tons/ 10,000 tons)
Quantitative Regulated Inventory Capture (~40,000 - 50,000 tons)
Qualitative Unit-Based Thresholds
Statewide, Regional or Areawide (CEQA Guidelines 15206(b)).
GHG Emissions Reduction Effectiveness
High - Captures all sources.
High - Market capture at >90%. Captures diverse sources.
Medium - Moderate market capture.
Low - Low market capture.
High - Market capture at ~90%. Captures diverse sources; excl. smallest proj.
Medium - Moderate market capture. Excludes small and med. projects.
Economic Feasibility
Low - Early phases will be substantial change in BAU, esp. for smaller projects; may be infeasible to mitigate.
Medium - Early phases will be substantial change in BAU, esp. for smaller projects; may be infeasible to mitigate.
High - Large projects have greater ability to absorb cost.
High - Large projects have greater ability to absorb cost.
Medium - Early phases will be substantial change in BAU, esp. for smaller projects; may be infeasible to mitigate.
High - Large projects have greater ability to absorb cost.
Technical Feasibility
Low - Early phases will be substantial change in BAU, esp. for smaller projects; may be infeasible to mitigate.
Medium - Early phases will be substantial change in BAU, esp. for smaller projects; may be inefficient to mitigate.
High - Greater opportunities for multiple reduction approaches.
High - Greater opportunities for multiple reduction approaches.
Medium - Early phases will be substantial change in BAU, particularly for smaller projects may be inefficient to mitigate.
High - Greater opportunities for multiple reduction approaches.
Logistical Feasibility
Low - Unless fee or offset basis,very difficult to mitigate all projects.
Medium - BMPs broadly written to allow diversity; new req. will take time to integrate into new dev.
High - Less mitigation. High - Less mitigation. Medium - BMPs broadly written to allow diversity; new req. will take time to integrate into new dev.
High - Less mitigation.
Consistency with AB-32 and S-03-05
High - Market capture. High - Market capture at >90%.
Low - Would rely on command and control success heavily.
Low - Would rely on command and control success heavily.
Medium - Need to demonstrate adequate market capture over time.
Low - Would rely on command and control success heavily.
Cost Effectiveness
Low - Will result in inefficient mitigation approaches. Efficiency will improve in time.
Medium - Emphasis is on new dev., req. for mitigation will result in inefficient mitigation approaches in early phases. Efficiency will improve in time.
Medium - Relies on command and control reductions for existing economy more heavily. With focus on larger projects, eff. of mitigation for new dev. high.
Medium - Relies on command and control reductions for existing economy more heavily. With focus on larger projects, eff. of mitigation for new dev. high.
Medium - Emphasis is on new dev.; req. for mitigation will result in inefficient mitigation approaches in early phases. Efficiency will improve in time.
Medium - Relies on command and control reductions for existing economy more heavily. With focus on larger projects, eff. of mitigation for new dev. high.
Uncertainties
High - Time to adapt for res. and comm.. sectors. Ability to mitigate without market-based mechanism for smaller projects unlikely.
Medium/High - Time to adapt for res. and comm.. sectors. Ability to mitigate without market-based mechanism for smaller projects uncertain.
High - Gains from command and control likely longer to be realized.
High - Gains from command and control likely longer to be realized.
Medium/High - Time to adapt for res. and comm.. sectors. Ability to mitigate without market-based mechanism for smaller projects uncertain.
High - Gains from command and control likely longer to be realized.
Other Advantages
Single threshold. Single threshold. BMPs can be updated. Greenlist can be updated.
Single threshold. Does not change CEQA processing for most projects. CARB inventory = project inv.. All projects treated same.
Single threshold. Does not change CEQA processing for most projects. Follows established SIP practice.
BMPs can be updated. Greenlist can be updated. Unit-Based thresholds can be updated.
Existing guideline. Does not change CEQA processing for most projects. Endorsed by Cal. Chapter of the APA.
Other Disadvantages
Requires all projects to quantify emissions.
Requires nearly all projects to quantify emissions.
Sectoral projects have different GHG emis. Only largest projects to quantify emis.
Sectoral projects have different GHG emissions.

58
CEQA and
Climate Change
Chapter 8: Analytical Methodologies for GHG
59
CEQAand
Climate Change
Chapter 8
Analytical Methodologies For GHG
Introduction This chapter evaluates the availability of various analytical methods and modeling tools that can be applied to estimate the greenhouse gas emissions from different project types subject to CEQA. This chapter will also provide comments on the suitability of the methods and tools to accurately characterize a projects emissions and offer recommendations for the most favorable methodologies and tools available. Some sample projects will be run through the methodologies and modeling tools to demonstrate what a typical GHG analysis might look like for a lead agency to meet its CEQA obligations. The air districts retained the services of EDAW environmental consultants to assist with this effort. Methodologies/Modeling Tools There are wide varieties of discretionary projects that fall under the purview of CEQA. Projects can range from simple residential developments to complex expansions of petroleum refineries to land use or transportation planning documents. It is more probably than not, that a number of different methodologies would be required by any one project to estimate its direct and indirect GHG emissions. Table 10 contains a summary of numerous modeling tools that can be used to estimate GHG emissions associated with various emission sources for numerous types of project’s subject to CEQA. The table also contains information about the models availability for public use, applicability, scope, data requirements and its advantages and disadvantages for estimating GHG emissions. In general, there is currently not one model that is capable of estimating all of a project’s direct and indirect GHG emissions. However, one of the models identified in Table 9 would probably be the most consistently used model to estimate a projects direct GHG emissions based on the majority of projects reviewed in the CEQA process. The Urban Emissions Model (URBEMIS) is designed to model emissions associated with development of urban land uses. URBEMIS attempts to summarize criteria air pollutants and CO2 emissions that would occur during construction and operation of new development. URBEMIS is publicly available and already widely used by CEQA practitioners and air districts to evaluate criteria air pollutants emissions against air district-adopted significance thresholds. URBEMIS is developed and approved for statewide use by CARB. The administrative reasons for using URBEMIS are less important than the fact that this model would ensure consistency statewide in how CO2 emissions are modeled and reported from various project types. One of the shortfalls of URBEMIS is that the model does not contain emission factors for GHGs other than CO2, except for methane (CH4) from mobile-sources, which is converted to CO2e. This may not be a major problem since CO2 is the most important GHG from land development projects. Although the other GHGs have a higher global warming potential, a metric used to normalize other GHGs to CO2e, they are emitted in far fewer quantities. URBEMIS does not calculate other GHG emissions associated with
60
CEQA and
Climate Change
off-site waste disposal, wastewater treatment, emissions associated with goods and services consumed by the residents and workers supported by a project. Nor does URBEMIS calculate GHGs associated with consumption of energy produced off-site. (For that matter, URBEMIS does not report criteria air pollutant emissions from these sources either). Importantly, URBEMIS does not fully account for interaction between land uses in its estimation of mobile source operational emissions. Vehicle trip rates are defaults derived from the Institute of Transportation Engineers trip generation manuals. The trip rates are widely used and are generally considered worst-case or conservative. URBEMIS does not reflect “internalization” of trips between land uses, or in other words, the concept that a residential trip and a commercial trip are quite possibly the same trip, and, thus, URBEMIS counts the trips separately. There are some internal correction settings that the modeler can select in URBEMIS to correct for “double counting”; however, a project-specific “double-counting correction” is often not available. URBEMIS does allow the user to overwrite the default trip rates and characteristics with more project-specific data from a traffic study prepared for a project. Residential, Commercial, Mixed-Use Type Projects/ Specific Plans Direct Emissions URBEMIS can be used to conduct a project-specific model run and obtain CO2e emissions for area and mobile sources from the project, and convert to metric tons CO2e. When a project-specific traffic study is not available, the user should consult with their local air district for guidance. Many air district staff are experienced practitioners of URBEMIS and can advise the lead agency or the modeler on how to best tailor URBEMIS default input parameters to conduct a project-specific model run. When a traffic study has been prepared for the project, the user must overwrite default trip length and trip rates in URBEMIS to match the total number of trips and vehicle miles traveled (VMT) contained in the traffic study to successfully conduct a project-specific model run. URBEMIS is recommended as a calculation tool to combine the transportation study (if available) and EMFAC emission factors for mobile-sources. Use of a project-specific traffic study gets around the main shortfall of URBEMIS: the lack of trip internalization. URBEMIS also provides the added feature of quantifying direct area-source GHG emissions. Important steps for running URBEMIS
1. Without a traffic study prepared for the project, the user should consult with the local air district for direction on which default options should be used in the modeling exercise. Some air districts have recommendations in the CEQA guidelines.
2. If a traffic study was prepared specifically for the project, the following
information must be provided:
61
CEQAand
Climate Change
Chapter 8
Analytical Methodologies For GHG
a. Total number of average daily vehicle trips or trip-generation rates by land use type per number of units; and,
b. Average VMT per residential and nonresidential trip.
c. The user overwrites the “Trip Rate (per day)” fields for each land use in URBEMIS such that the resultant “Total Trips” and the “Total VMT” match the number of total trips and total VMT contained in the traffic study.
d. Overwrite “Trip Length” fields for residential and nonresidential trips in UBEMIS with the project-specific lengths obtained form the traffic study.
3. Calculate results and obtain the CO2 emissions from the URBEMIS output file (units of tons per year [TPY]).
Indirect Emissions URBEMIS does estimate indirect emissions from landscape maintenance equipment, hot water heaters, etc. URBEMIS does not however, provide modeled emissions from indirect sources of emissions, such as those emissions that would occur off-site at utility providers associated with the project’s energy demands. The California Climate Action Registry (CCAR) Protocol v.2.2 includes methodology, which could be used to quantify and disclose a project’s increase in indirect GHG emissions from energy use. Some assumptions must be made for electrical demand per household or per square foot of commercial space, and would vary based on size, orientation, and various attributes of a given structure. An average rate of electrical consumption for residential uses is 7,000 kilowatt hours per year per household and 16,750 kilowatt hours per thousand square feet of commercial floor space. Commercial floor space includes offices, retail uses, warehouses, and schools. These values have been increasing steadily over the last 20 years. Energy consumption from residential uses has increased due to factors such as construction and occupation of larger homes, prices of electricity and natural gas, and increased personal income allowing residents to purchase more electronic appliances. Commercial energy consumption is linked to factors such as vacancy rates, population, and sales. The modeler will look up the estimated energy consumption for the project’s proposed land uses under year of project buildout, or use the values given in the previous paragraph for a general estimate. The CCAR Protocol contains emission factors for CO2, CH4, and nitrous oxide. The “CALI” region grid serves most of the State of California. If a user has information about a specific utility provider’s contribution from renewable sources, the protocol contains methodology to reflect that, rather than relying on the statewide average grid. The incremental increase in energy production associated with project operation should be accounted for in the project’s total GHG emissions for inclusion in the environmental document.

62
CEQA and
Climate Change
The incremental increase in energy production associated with project operation should be accounted for in the project’s total GHG emissions, but it should be noted that these emissions would be closely controlled by stationary-source control-based regulations and additional regulations are expected under AB 32. However, in the interest of disclosing project-generated GHG emissions and mitigating to the extent feasible, the indirect emissions from off-site electricity generation can be easily calculated for inclusion in the environmental document. Example Project Estimates for GHG Emissions Residential Project Project Attributes:
• 68 detached dwelling units • 15.9 acres • 179 residents • 0 jobs • Located in unincorporated Placer County (PCAPCD jurisdiction) • Analysis year 2009
As shown in Table 6, the project’s direct GHG emissions per service population (SP) would be approximately 8 metric tons CO2e/SP/year. Table 6: Residential Project Example GHG Emissions Estimates
URBEMIS Output (Project Specific) Metric Tons/Year CO2e
Demographic Data
Area-source emissions 251 Residents 179
Mobile-source emissions 1,044 Jobs 0
Indirect emissions (from CCAR Protocol)
174
Total operational emissions 1,469
Operational emissions/SP 8.2
Service population 179
Notes: CO2e = carbon dioxide equivalent; CCAR = California Climate Action Registry; SP = service population(see definition of service population below in discussion of Normalization/Service Population Metric). Sources: EDAW 2007, ARB 2007b, CCAR 2007, CEC 2000
Commercial Project Project Attributes:
• Free Standing Discount Superstore: 241 thousand square feet (ksf) • 0 residents
63
CEQAand
Climate Change
Chapter 8
Analytical Methodologies For GHG
• 400 jobs • Located in the San Joaquin Valley Air Pollution Control District’s (SJVAPCD)
jurisdiction • Analysis year 2009
Table 7: Commercial Project Example GHG Emissions Estimates
URBEMIS Output (Project Specific) Metric Tons/Year CO2e
Demographic Data
Area-source emissions 464 Residents 0
Mobile-source emissions 13,889 Jobs 400
Indirect emissions (from CCAR Protocol) 1,477
Total operational emissions 15,830
Operational emissions/SP 39.6
Service population 400
Notes: CO2e = carbon dioxide equivalent; CCAR = California Climate Action Registry; SP = service population (see definition of service population below in discussion of Normalization/Service Population Metric). Sources: EDAW 2007, ARB 2007b, CCAR 2007, CEC 2000
Specific Plan If used traditionally with default trip rates and lengths, rather than project-specific (Traffic Analysis Zone-specific) trip rates and lengths, URBEMIS does not work well for specific plan or general plan-sized projects with multiple land use types proposed. However, in all instances, projects of these sizes (several hundred or thousand acres) would be accompanied by a traffic study. Thus, for large planning-level projects, URBEMIS can be used as a calculation tool to easily obtain project-specific mobile-source emissions. The user should follow the steps discussed above; wherein he/she overwrites the default ITE trip rates for each land use type with that needed to make total VMT match that contained in the traffic study. The URBEMIS interface is a simple calculator to combine the traffic study and EMFAC emissions factors for mobile-source CO2. Project Attributes:
• 985 acres • Total dwelling units: 5,634 • Commercial/Mixed Use: 429 ksf • Educational: 2,565 ksf • 14,648 residents • 3,743 jobs • Located in Sacramento County (SMAQMD jurisdiction) • Analysis year 2009

64
CEQA and
Climate Change
Table 8: Specific Plan Example GHG Emissions Estimates URBEMIS Output (Project Specific) Metric Tons/Year
CO2e Demographic Data
Area-source emissions 23,273 Residents 14,648
Mobile-source emissions 73,691 Jobs 3,743
Indirect emissions (from CCAR Protocol)
32,744
Total operational emissions 129,708
Operational emissions/SP 7.1
Service population 18,391
Notes: CO2e = carbon dioxide equivalent; CCAR = California Climate Action Registry; SP = service population (see definition of service population below in discussion of Normalization/Service Population Metric). Sources: EDAW 2007, ARB 2007b, CCAR 2007, CEC 2000
The specific plan example, when compared to the residential or commercial examples, illustrates the benefit of a mixed-use development when you look at CO2e emissions per resident or job (service population) metric (see definition of service population below in discussion of Normalization/Service Population Metric). Though this particular specific plan is not an example of a true jobs/housing balance, the trend is clear: accommodating residents and jobs in a project is more efficient than residents or jobs alone. Stationary- and Area-Source Project Types GHG emissions from stationary or area sources that require a permit to operate from the air district also contain both direct and indirect sources of emissions. Examples of these types of sources would be fossil fuel power plants, cement plants, landfills, wastewater treatment plants, gas stations, dry cleaners and industrial boilers. All air districts have established procedures and methodologies for projects subject to air district permits to calculate their regulated pollutants. It is anticipated that these same procedures and methodologies could be extended to estimate a permitted facility’s GHG calculations. For stationary and area sources that do not require air district permits, the same methodologies used for permitted sources could be used in addition to URBEMIS and CCAR GRP to calculate GHG emissions from these facilities. Wastewater Treatment Facilities Direct GHG emissions associated with a proposed waste water treatment plant can be calculated using AP-42 emission factors from Chapter 4.3.5 Evaporative Loss Sources: Waste Water-Greenhouse Gases and the CCAR methodology. In general, most wastewater operations recover CH4 for energy, or use a flare to convert the CH4 to CO2. There are many types of wastewater treatment processes and the potential for GHG emissions from different types of plants varies substantially. There is not one standard set of emission factors that could be used to quantify GHG emissions for a state

65
CEQAand
Climate Change
Chapter 8
Analytical Methodologies For GHG
“average” treatment plant. Thus, research will need to be conducted on a case-by-case basis to determine the “Fraction Anaerobically Digested” which is a function of the type of treatment process. Indirect emissions from these facilities can be calculated using the CCAR energy use protocols and URBEMIS model for transportation emissions. Solid Waste Disposal Facilities Air districts will have emission estimate methodologies established for methane emissions at permitted landfills. In addition, EPA’s Landfill Gas Emissions Model (LandGem) and the CCAR methodology could also be used to quantify GHG emissions from landfill off gassing; however, this model requires substantial detail be input. The model uses a decomposition rate equation, where the rate of decay is dependent on the quantity of waste in place and the rate of change over time. This modeling tool is free to the public, but substantial project detail about the operation of the landfill is needed to run the model. Indirect emissions from these facilities can be calculated using the CCAR energy use protocols and URBEMIS model for transportation emissions. Construction Emissions GHG emissions would occur during project construction, over a finite time. In addition, a project could result in the loss of GHG sequestration opportunity due primarily to the vegetation removed for construction. URBEMIS should be used to quantify the mass of CO2 that would occur during the construction of a project for land development projects. Some construction projects would occur over an extended period (up to 20–30 years on a planning horizon for general plan buildout, or 5–10 years to construct a dam, for example). OFFROAD emission factors are contained in URBEMIS for CO2 emissions from construction equipment. For other types of construction projects, such as roadway construction projects or levee improvement projects, SMAQMD’s spreadsheet modeling tool, the Road Construction Emissions Model (RoadMod), should be used. This tool is currently being updated to include CO2 emissions factors from OFFROAD. The full life-cycle of GHG emissions from construction activities is not accounted for in the modeling tools available, and the information needed to characterize GHG emissions from manufacture, transport, and end-of-life of construction materials would be speculative at the CEQA analysis level. The emissions disclosed will be from construction equipment and worker commutes during the duration of construction activities. Thus, the mass emissions in units of metric tons CO2e/year should be reported in the environmental document as new emissions. General Plans In the short-term, URBEMIS can be used as a calculation tool to model GHG emissions from proposed general plans, but only if data from the traffic study is incorporated into model input. The same methodology applied above in the specific plan example applies to general plans. The CCAR GRP can be used to approximate indirect emissions from
66
CEQA and
Climate Change
increased energy consumption associated with the proposed plan area. The same models and methodologies discussed previously for wastewater, water supply and solid waste would be used to estimate indirect emissions resulting from buildout of the general plan. In the longer-term, more complex modeling tools are needed, which would integrate GHG emission sources from land use interaction, such as I-PLACE3S or CTG Energetics’ Sustainable Communities Custom Model attempt to do. These models are not currently available to the public and only have applicability in certain areas of the state. It is important that a tool with statewide applicability be used to allow for consistency in project treatment, consideration, and approval under CEQA. Scenarios At the general plan level, the baseline used for analyzing most environmental impacts of a general plan update is typically no different from the baseline for other projects. The baseline for most impacts represents the existing conditions, normally on the date the Notice of Preparation is released. Several comparative scenarios could be relevant, depending on the exact methodological approach and significance criteria used for GHG assessment:
• Existing Conditions. The GHG emissions associated with the existing, on-the-ground conditions within the planning area.
• 1990 conditions. The GHG emissions associated with the general plan area in
1990. This is relevant due to the state’s AB 32 GHG emission reduction goals’ benchmark year of 1990. The GHG-efficiency of 1990 development patterns could be compared to that of the general plan buildout.
• Buildout of the Existing General Plan. The GHG emissions associated with
buildout of the existing general plan (without the subject update). This is the no project alternative for the purposes of general plan CEQA analysis.
• Buildout of the Updated General Plan. The GHG emissions associated with
buildout of the general plan, as proposed as a part of the subject update. This would include analysis of any changes included as a part of the general plan update for the existing developed portions of the planning area. Many communities include redevelopment and revitalization strategies as a part of the general plan update. The general plan EIR can include assumptions regarding what level and type of land use change could be facilitated by infill and redevelopment. Many jurisdictions wish to provide future projects consistent with these land use change assumptions with some environmental review streamlining. In addition, many communities include transit expansions, pedestrian/bicycle pathway improvements, multi-modal facility construction, travel demand policies, energy efficiency policies, or other measures that could apply to the existing developed area, just as they may apply to any new growth
67
CEQAand
Climate Change
Chapter 8
Analytical Methodologies For GHG
areas. Such policies could affect the overall GHG emissions of the built out general plan area.
• Increment between Buildout of Updated General Plan and Existing General
Plan Area. There are many important considerations associated with the characterization of the impact of the General Plan update. The actual GHG emissions impact could be described as the difference between buildout under the existing and proposed land use plan (No-Build Alternative). However, the courts have held that an EIR should also analyze the difference between the proposed General Plan and the existing environment (Environmental Planning & Information Council v. County of El Dorado (EPIC) (1982) 131 Cal.App.3d 350). At the General Plan level, over the course of buildout, some new land uses are introduced, which could potentially add operational GHG emissions and potentially remove existing sequestration potential. Some properties become vacant and are not redeveloped. Other properties become vacant and then are redeveloped. Communities cannot pretend to understand fully in advance each component of land use change. The programmatic document is the preferred method of environmental analysis. Through this programmatic framework, communities develop buildout assumptions as a part of the General Plan that are normally used as a basis of environmental analysis. For certain aspects of the impact analysis, it becomes important not just to understand how much “new stuff” could be accommodated under the updated General Plan, but also the altered interactions between both “new” and “existing” land uses within the planning area. As addressed elsewhere, there are tools available for use in understanding land use/transportation interactions at the General Plan level. Without the GHG targets established by AB 32, a simple mass comparison of existing conditions to General Plan buildout might be appropriate.
However, within the current legal context, the GHG efficiency of the updated General Plan becomes the focus of analysis. Some options in this regard include:
• Estimate the GHG emissions associated with all the land uses included within the planning area upon buildout of the General Plan using no project specific information (regional, countywide, or statewide defaults). Estimate GHG emissions using project specific information from the transportation engineer, transportation demand policies, community design elements, energy efficiency requirements, wastewater treatment and other public infrastructure design changes, and other components. Compare these two calculations. Is the second calculation reduced by the percent needed to meet AB 32 goals compared to the first calculation?
• Estimate the GHG emissions associated with the 1990 planning area and the per-
capita or per-service population GHG associated with the 1990 planning area. (Many communities are establishing GHG inventories using different tools). Estimate the GHG emissions associated with buildout of the proposed General Plan update and the resulting per-capita or per-service population GHG
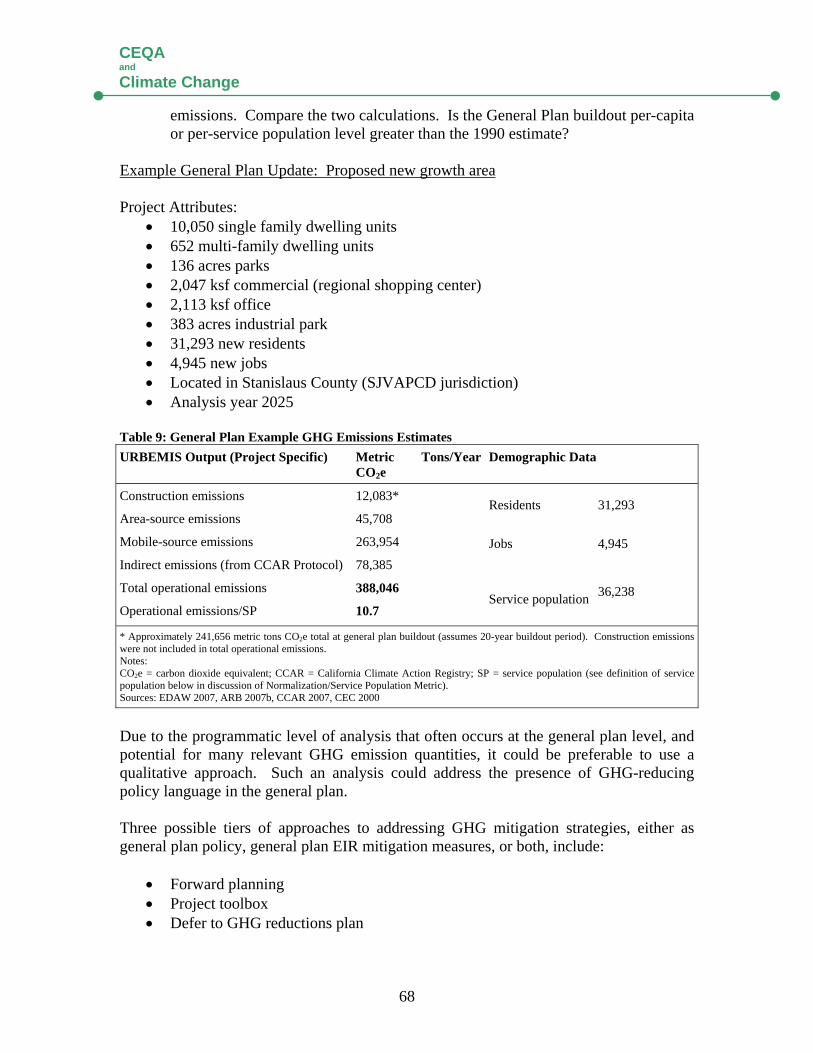
68
CEQA and
Climate Change
emissions. Compare the two calculations. Is the General Plan buildout per-capita or per-service population level greater than the 1990 estimate?
Example General Plan Update: Proposed new growth area Project Attributes:
• 10,050 single family dwelling units • 652 multi-family dwelling units • 136 acres parks • 2,047 ksf commercial (regional shopping center) • 2,113 ksf office • 383 acres industrial park • 31,293 new residents • 4,945 new jobs • Located in Stanislaus County (SJVAPCD jurisdiction) • Analysis year 2025
Table 9: General Plan Example GHG Emissions Estimates URBEMIS Output (Project Specific) Metric Tons/Year
CO2e Demographic Data
Construction emissions 12,083*
Area-source emissions 45,708 Residents 31,293
Mobile-source emissions 263,954
Indirect emissions (from CCAR Protocol) 78,385 Jobs
4,945
Total operational emissions 388,046
Operational emissions/SP 10.7 Service population 36,238
* Approximately 241,656 metric tons CO2e total at general plan buildout (assumes 20-year buildout period). Construction emissions were not included in total operational emissions. Notes: CO2e = carbon dioxide equivalent; CCAR = California Climate Action Registry; SP = service population (see definition of service population below in discussion of Normalization/Service Population Metric). Sources: EDAW 2007, ARB 2007b, CCAR 2007, CEC 2000
Due to the programmatic level of analysis that often occurs at the general plan level, and potential for many relevant GHG emission quantities, it could be preferable to use a qualitative approach. Such an analysis could address the presence of GHG-reducing policy language in the general plan. Three possible tiers of approaches to addressing GHG mitigation strategies, either as general plan policy, general plan EIR mitigation measures, or both, include:
• Forward planning • Project toolbox • Defer to GHG reductions plan
69
CEQAand
Climate Change
Chapter 8
Analytical Methodologies For GHG
The three basic approaches are described below. 1. Bring reduction strategies into the plan itself. The most effective way for local jurisdictions to achieve GHG emissions reductions in the medium- and long-term is through land use and transportation policies that are built directly into the community planning document. This involves creating land use diagrams and circulation diagrams, along with corresponding descriptive standards, that enable and encourage alternatives to travel and goods movement via cars and trucks. The land use and circulation diagrams provide a general framework for a community where people can conduct their everyday business without necessarily using their cars. The overall community layout expressed as a part of the land use and circulation diagrams is accompanied by a policy and regulatory scheme designed to achieve this community layout. Impact fees, public agency spending, regulations, administrative procedures, incentives, and other techniques are designed to facilitate land use change consistent with the communities’ overall vision, as expressed in policy and in the land use diagram. There are many widely used design principles that can be depicted in land use and circulation diagrams and implemented according to narrative objectives, standards, and policies:
• Connectivity. A finely-connected transportation network shortens trip lengths and creates the framework for a community where homes and destinations can be placed close in proximity and along direct routes. A hierarchical or circuitous transportation network can increase trip lengths and create obstacles for walking, bicycling, and transit access. This policy language would likely be found in the Circulation Element.
• Compactness. Compact development, by its nature, can increase the efficiency of
infrastructure provision and enable travel modes other than the car. If communities can place the same level of activity in a smaller space, GHG emissions would be reduced concurrently with VMT and avoid unnecessary conversion of open space. This policy language would likely be found in the Land Use Element.
• Diversity. Multiple land use types mixed in proximity around central “nodes” of
higher-activity land uses can accommodate travel through means other than a car. The character and overall design of this land use mix is, of course, different from community to community. This policy language would likely be found in the Land Use Element.
• Facilities. Pedestrian, bicycle, and public transportation improvements, planning,
and programming are sometimes an afterthought. To get a more GHG-efficient mode share, safe and convenient bike lanes, pedestrian pathways, transit shelters, and other facilities are required to be planned along with the vehicular travel network. This policy language would likely be found in the Circulation Element.
70
CEQA and
Climate Change
• Redevelopment. One way to avoid GHG emissions is to facilitate more efficient and economic use of the lands in already-developed portions of a community. Reinvestment in existing neighborhoods and retrofit of existing buildings is appreciably more GHG efficient than greenfield development, and can even result in a net reduction in GHG emissions. This policy language would likely be found in the Conservation or Land Use Element.
• Housing and Employment. Most communities assess current and future
economic prospects along with long-range land use planning. Part of the objective for many communities is to encourage the coalescence of a labor force with locally available and appropriate job opportunities. This concept is best known as “jobs-housing balance.” This policy language would likely be found in the Housing Element.
• Planning Level Versus Project Level. For transportation-related GHG emissions
that local governments can mitigate through land use entitlement authority, the overall community land use strategy and the overall transportation network are the most fruitful areas of focus. The reduction capacity of project-specific mitigation measures is greatly limited if supportive land use and transportation policies are lacking at the community planning level. The regional economic context, of course, provides an important backdrop for land use and transportation policy to address GHG emissions. Within this context, the general plan is the readily available tool for local governments to establish such land use and transportation strategies. This policy language would likely be found in the Land Use and Circulation Elements.
• Shipping Mode Shift. Locate shipping-intensive land uses in areas with rail
access. Some modes of shipping are more GHG-intensive than others. Rail, for example, requires only about 15 to 25 percent of the energy used by trucks to ship freight equivalent distances and involves reduced transportation-related GHG emissions. Cities and counties have little direct control over the method of shipment that any business may choose. Nevertheless, as a part of the general planning process, cities and counties can address constraints on the use of rail for transporting goods. This policy language would likely be found in the Land Use and Circulation Elements.
2. Provide a “toolbox” of strategies after the project site has been selected. In addition to the examples of design principles that are built into the community planning process, communities can offer project applicants a range of tools to reduce GHG emissions. Mitigation strategies are elaborated in detail in Chapter 9. 3. Defer to General Plan implementation measure. Develop and implement a GHG Emissions Reduction Plan. Another option for local governments would be development of an implementation measure as a part of the general plan that outlines an enforceable GHG reduction program. Perhaps the most well known example of this approach is the result of California’s Attorney General settlement of the lawsuit brought against San
71
CEQAand
Climate Change
Chapter 8
Analytical Methodologies For GHG
Bernardino County. The County has agreed to create a 1990 GHG inventory and develop measures to reduce such emissions according to the state’s overall goals. Other communities have pursued similar programs (i.e., the City of San Diego, Marin County). Along with the inventories, targets, and example reduction measures, these programs would include quantitative standards for new development; targets for reductions from retrofitting existing development; targets for government operations; fee and spending program for GHG reduction programs; monitoring and reporting; and other elements. The local government itself should serve as a model for GHG reduction plan implementation, by inventorying emissions from government operations and achieving emission reductions in accordance with the plan’s standards. An optional climate change element could be added to contain goals, policies, and this implementation strategy, or this could belong in an optional air quality element. Other Project Types Air District Rules, Regulations and Air Quality Plans Air district air quality plans, rules and regulations could have the potential to increase or decrease GHG emissions within their respective jurisdiction. In general, air district air quality plans, rules and regulations act to reduce ozone precursors, criteria air pollutant and toxic air contaminant emissions, which would almost always act to reduce GHG emissions simultaneously. However, this may not always be the case. Air Quality Plans Air districts will have to include GHG emissions analysis as part of their criteria air pollutant and toxic air contaminant air pollutant analysis when considering the adoption of air quality plans and their subsequent rules and regulations needed to implement the plans. Multiple models and methodologies will be needed to accomplish this analysis. Regional Transportation Plans Regional transportation plans would also need to be evaluated on a case-by-case basis to determine if a net increase or decrease in GHG emissions would occur. Complex interactions between the roadway network, operating conditions, alternative transportation availability (such as public transit, bicycle pathways, and pedestrian infrastructure), and many other independent parameters specific to a region should be considered. Regional transportation models exist to estimate vehicular emissions associated with regional transportation plans, which includes the ability to estimate GHG emissions. Normalization/Service Population Metric The above methodology would provide an estimate of the mass GHG emissions generated by a proposed project, which could be compared to a mass emission threshold. EDAW developed a methodology that would measure a project’s overall GHG efficiency

72
CEQA and
Climate Change
in order to determine if a project is more efficient than the existing statewide average for per capita GHG emissions. The following steps could be employed to estimate the GHG-“efficiency,” which may be more directly correlated to the project’s ability to help obtain objectives outlined in AB 32, although it relies on establishment of an efficiency-based significance threshold. The subcommittee believes this methodology may eventually be appropriate to evaluate the long-term GHG emissions from a project in the context of meeting AB 32 goals. However, this methodology will need substantially more work and is not considered viable for the interim guidance presented in this white paper.
• Divide the total operational GHG emissions by the Service Population (SP) supported by the project (where SP is defined as the sum of the number of residents and the number of jobs supported by the project). This value should be compared to that of the projected statewide GHG emissions inventory from the applicable end-use sectors (electricity generation, residential, commercial/institutional, and mobile-source) in 1990 divided by the projected statewide SP for the year 2020 (i.e., AB 32 requirements), to determine if the project would conflict with legislative goals.
o If the project’s operational GHG/SP falls below AB 32 requirements, then
the project’s GHG emissions are less than cumulatively considerable. o If the project’s operational GHG/SP exceed AB 32 requirements (a
substantial contribution), then the project’s GHG emissions would conflict with legislative requirements, and the impact would be cumulatively considerable and mitigation would be required where feasible.
• New stationary and area sources/facilities: calculate GHG emissions using the
CCAR GRP. All GHG emissions associated with new stationary or area sources should be treated as a net increase in emissions, and if deemed significant, should be mitigated where feasible.
• Road or levee construction projects or other construction-only projects: calculate
GHG emissions using the RoadMod, which will be updated to contain GHG emission factors from EMFAC and OFFROAD. All construction-generated GHG emissions should be treated as a net increase, and if deemed significant, should be mitigated to the extent feasible.
• Air District rulemaking or air quality management plan-type projects should be
evaluated on a case-by-case basis for secondary impacts of increased GHG emissions generation. In most cases, the types of projects that act to reduce regional air pollution simultaneously act to reduce GHG emissions, and would be beneficial, but should be evaluated for secondary effects from GHG emissions.
• Regional transportation plans should also be evaluated on a case-by-case basis for
potential to either reduce or increase GHG emissions from the transportation sector. EMFAC can be utilized to determine the net change in GHG emissions
73
CEQAand
Climate Change
Chapter 8
Analytical Methodologies For GHG
associated with projected vehicle VMT and from operating speed changes associated with additional or alleviated congestion.
To achieve the goals of AB 32, which are tied to GHG emission rates of specific benchmark years (i.e., 1990), California would have to achieve a lower rate of emissions per unit of population and per unit of economic activity than it has now. Further, in order to accommodate future population and economic growth, the state would have to achieve an even lower rate of emissions per unit than was generated in 1990. (The goal to achieve 1990 quantities of GHG emissions by 2020 means that this will need to be accomplished in light of 30 years of population and economic growth in place beyond 1990.) Thus, future planning efforts that would not encourage new development to achieve its fair share of reductions in GHG emissions would conflict with the spirit of the policy decisions contained in AB 32, thus impeding California’s ability to comply with the mandate. Thus, if a statewide context for GHG emissions were pursued, any net increase in GHG emissions within state boundaries would be considered “new” emissions. For example, a land development project, such as a specific plan, does not necessarily create “new” emitters of GHG, but would theoretically accommodate a greater number of residents in the state. Some of the residents that move to the project could already be California residents, while some may be from out of state (or would ‘take the place’ of in-state residents who ‘vacate’ their current residences to move to the new project). Some may also be associated with new births over deaths (net population growth) in the state. The out-of-state residents would be contributing new emissions in a statewide context, but would not necessarily be generating new emissions in a global context. Given the California context established by AB 32, the project would need to accommodate an increase in population in a manner that would not inhibit the state’s ability to achieve the goals of lower total mass of emissions. The average net influx of new residents to California is approximately 1.4 percent per year (this value represents the net increase in population, including the net contribution from births and deaths). With population growth, California also anticipates economic growth. Average statewide employment has grown by approximately 1.1 percent over the last 15 years. The average percentage of population employed over the last 15 years is 46 percent. Population is expected to continue growing at a projected rate of approximately 1.5 percent per year through 2050. Long-range employment projection data is not available from the California Department of Finance (DOF) and can be extrapolated in different ways (e.g., linear extrapolation by percentage rate of change, percentage of population employed, mathematical series expansion, more complex extrapolation based on further research of demographic projections such as age distribution). Further study would be needed to refine accurate employment projections from the present to 2050. For developing this framework, employment is assumed to have a constant proportionate relationship with the state’s population. The projected number of jobs is assumed to be roughly 46 percent of the projected population.
74
CEQA and
Climate Change
In light of the statewide context established by California law, consistency is most important for evaluating GHG emissions from projects. Thus, URBEMIS and the CCAR GRP are the recommended tools for quantification of GHG emissions from most project types in the short term. Over the long term, more sophisticated models that integrate the relationship between GHG emissions and land use, transportation, energy, water, waste, and other resources, and have similar application statewide would have better application to the problem, but may not currently be as accessible or as easily operable. I-PLACE3S and CTG Energetics’ Sustainable Communities Model (SCM) are two examples of such models that contain emission factors for GHGs, which could be refined to have applicability statewide and made available to CEQA practitioners. Other models are likely to be developed, given the importance of this issue. Short-Term and Long-Term Methodologies The following tools can be used to quantify a project’s GHG emissions until tools that are more comprehensive become available statewide:
1. Land development projects: URBEMIS 2007 v. 9.2 and the CCAR GRP v. 2.2 (short-term); further development of I-PLACE3S or CTG’s Sustainable Communities Model (long-term).
2. New stationary and area sources/facilities: AP-42 Chapter 4.3, LandGem v. 3.02, and/or CCAR GRP v. 2.2.
3. Road or levee construction projects or other construction-only projects: RoadMod/OFFROAD 2007.
Ideally, I-PLACE3S or CTG’s Sustainable Communities Model would be expanded to apply to all regions of the state. These types of models use an integrated approach, which is the best approach for reasonably approximating the emissions that result from interaction between land uses, but neither is available to the public and would create consistency problems in reporting emissions from projects across the state if these were used today. However, a similar model with statewide applicability will likely be developed due to the importance of the issue.Table 10 Summary of Modeling Tools for Estimating GHG Emissions and Project Applicability
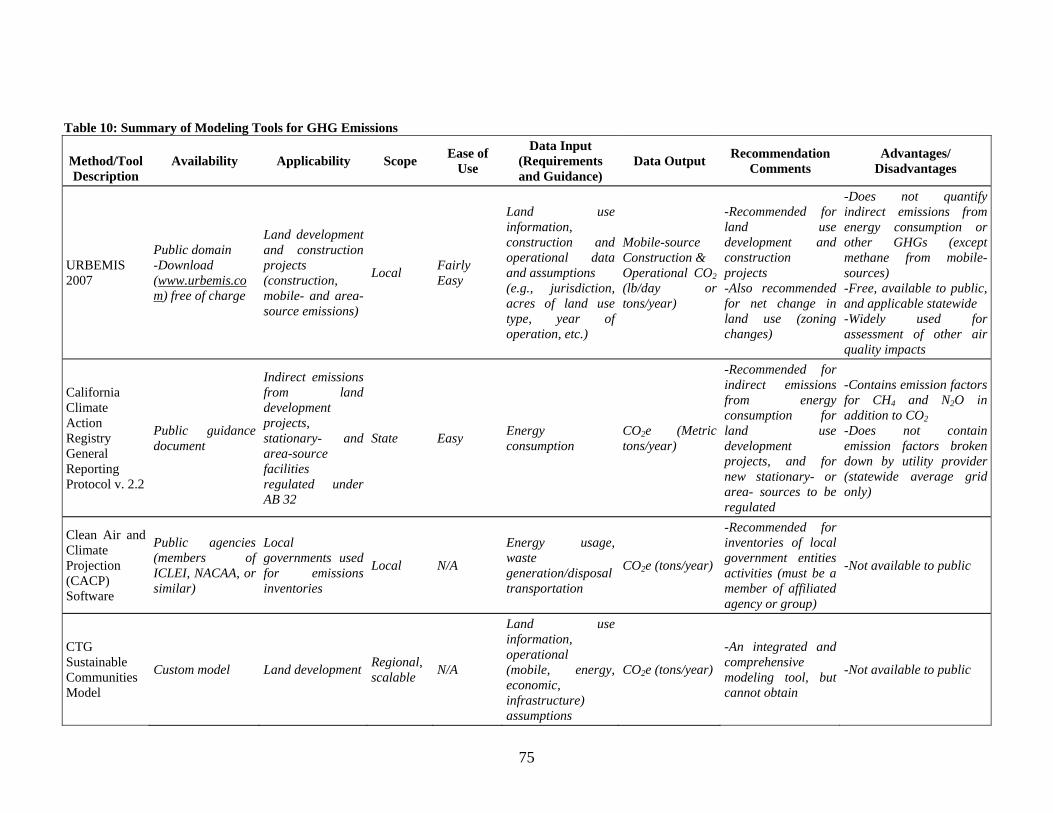
75
Table 10: Summary of Modeling Tools for GHG Emissions
Method/Tool Description
Availability Applicability Scope Ease of Use
Data Input (Requirements and Guidance)
Data Output Recommendation Comments
Advantages/ Disadvantages
URBEMIS 2007
Public domain -Download (www.urbemis.com) free of charge
Land development and construction projects (construction, mobile- and area- source emissions)
Local Fairly Easy
Land use information, construction and operational data and assumptions (e.g., jurisdiction, acres of land use type, year of operation, etc.)
Mobile-source Construction & Operational CO2 (lb/day or tons/year)
-Recommended for land use development and construction projects -Also recommended for net change in land use (zoning changes)
-Does not quantify indirect emissions from energy consumption or other GHGs (except methane from mobile-sources) -Free, available to public, and applicable statewide -Widely used for assessment of other air quality impacts
California Climate Action Registry General Reporting Protocol v. 2.2
Public guidance document
Indirect emissions from land development projects, stationary- and area-source facilities regulated under AB 32
State Easy Energy consumption
CO2e (Metric tons/year)
-Recommended for indirect emissions from energy consumption for land use development projects, and for new stationary- or area- sources to be regulated
-Contains emission factors for CH4 and N2O in addition to CO2 -Does not contain emission factors broken down by utility provider (statewide average grid only)
Clean Air and Climate Projection (CACP) Software
Public agencies (members of ICLEI, NACAA, or similar)
Local governments used for emissions inventories
Local N/A
Energy usage, waste generation/disposal transportation
CO2e (tons/year)
-Recommended for inventories of local government entities activities (must be a member of affiliated agency or group)
-Not available to public
CTG Sustainable Communities Model
Custom model Land development Regional, scalable N/A
Land use information, operational (mobile, energy, economic, infrastructure) assumptions
CO2e (tons/year)
-An integrated and comprehensive modeling tool, but cannot obtain
-Not available to public
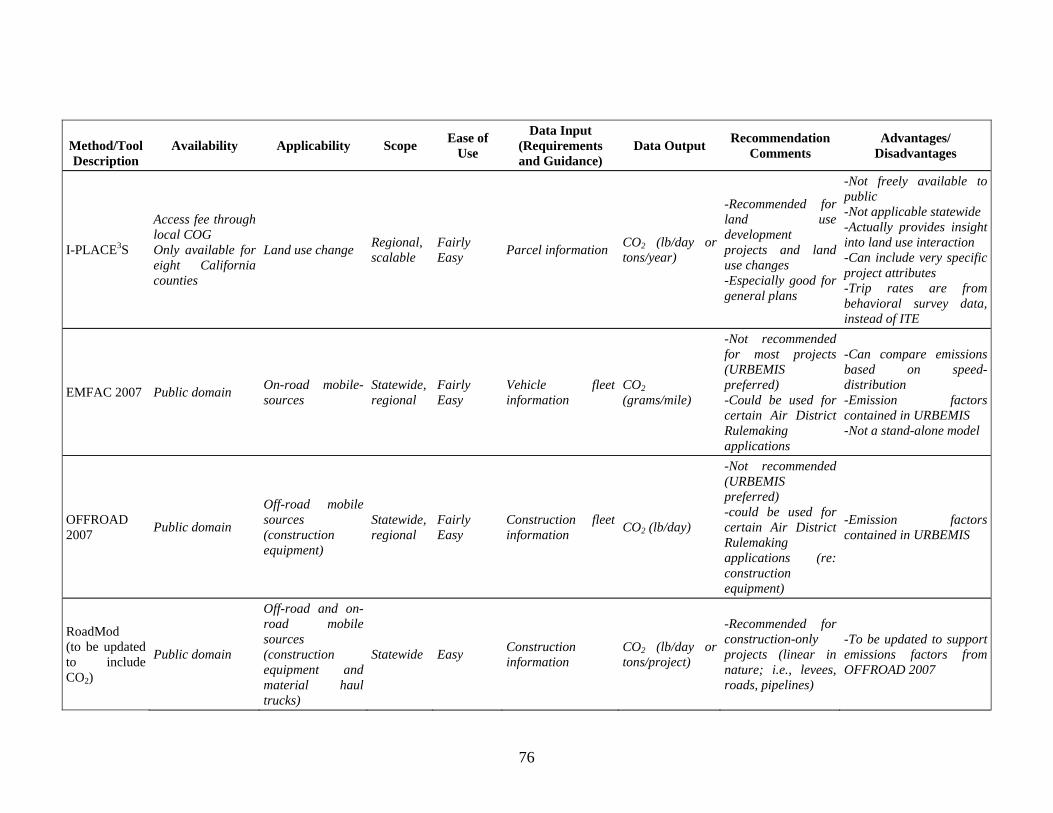
76
Method/Tool Description
Availability Applicability Scope Ease of Use
Data Input (Requirements and Guidance)
Data Output Recommendation Comments
Advantages/ Disadvantages
I-PLACE3S
Access fee through local COG Only available for eight California counties
Land use change Regional, scalable
Fairly Easy Parcel information CO2 (lb/day or
tons/year)
-Recommended for land use development projects and land use changes -Especially good for general plans
-Not freely available to public -Not applicable statewide -Actually provides insight into land use interaction -Can include very specific project attributes -Trip rates are from behavioral survey data, instead of ITE
EMFAC 2007 Public domain On-road mobile-sources
Statewide, regional
Fairly Easy
Vehicle fleet information
CO2 (grams/mile)
-Not recommended for most projects (URBEMIS preferred) -Could be used for certain Air District Rulemaking applications
-Can compare emissions based on speed-distribution -Emission factors contained in URBEMIS -Not a stand-alone model
OFFROAD 2007 Public domain
Off-road mobile sources (construction equipment)
Statewide, regional
Fairly Easy
Construction fleet information CO2 (lb/day)
-Not recommended (URBEMIS preferred) -could be used for certain Air District Rulemaking applications (re: construction equipment)
-Emission factors contained in URBEMIS
RoadMod (to be updated to include CO2)
Public domain
Off-road and on-road mobile sources (construction equipment and material haul trucks)
Statewide Easy Construction information
CO2 (lb/day or tons/project)
-Recommended for construction-only projects (linear in nature; i.e., levees, roads, pipelines)
-To be updated to support emissions factors from OFFROAD 2007
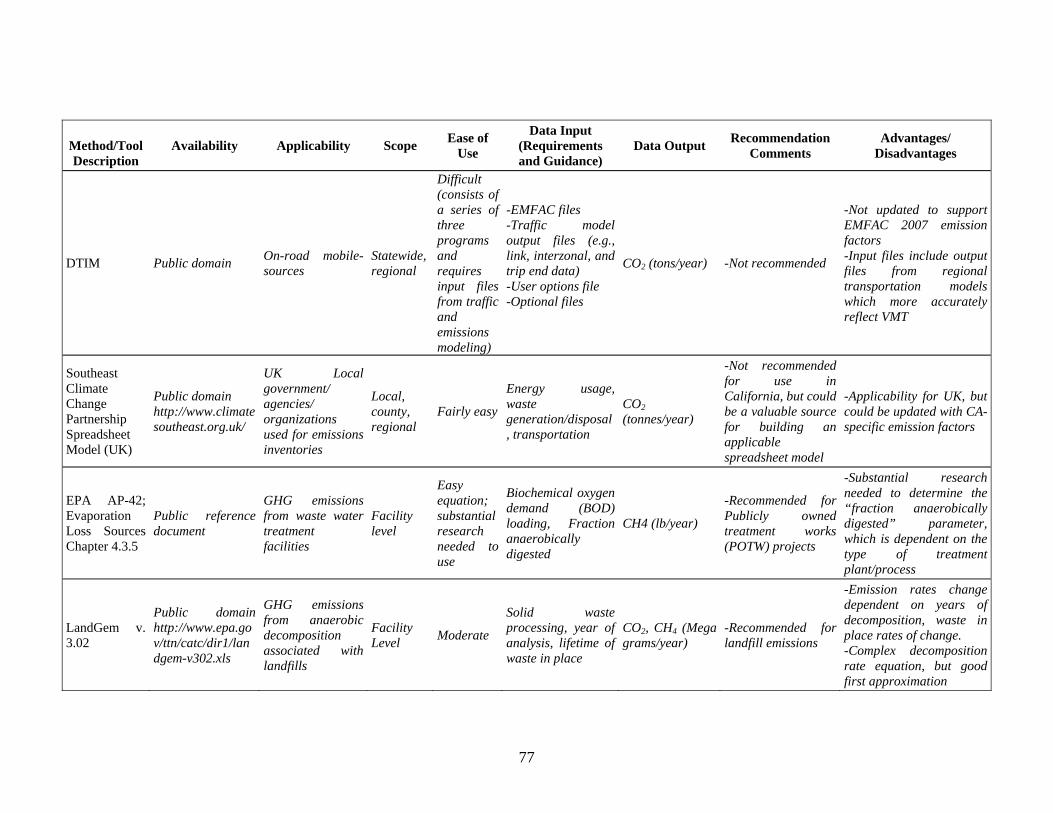
77
Method/Tool Description
Availability Applicability Scope Ease of Use
Data Input (Requirements and Guidance)
Data Output Recommendation Comments
Advantages/ Disadvantages
DTIM Public domain On-road mobile-sources
Statewide, regional
Difficult (consists of a series of three programs and requires input files from traffic and emissions modeling)
-EMFAC files -Traffic model output files (e.g., link, interzonal, and trip end data) -User options file -Optional files
CO2 (tons/year) -Not recommended
-Not updated to support EMFAC 2007 emission factors -Input files include output files from regional transportation models which more accurately reflect VMT
Southeast Climate Change Partnership Spreadsheet Model (UK)
Public domain http://www.climatesoutheast.org.uk/
UK Local government/ agencies/ organizations used for emissions inventories
Local, county, regional
Fairly easy
Energy usage, waste generation/disposal, transportation
CO2 (tonnes/year)
-Not recommended for use in California, but could be a valuable source for building an applicable spreadsheet model
-Applicability for UK, but could be updated with CA-specific emission factors
EPA AP-42; Evaporation Loss Sources Chapter 4.3.5
Public reference document
GHG emissions from waste water treatment facilities
Facility level
Easy equation; substantial research needed to use
Biochemical oxygen demand (BOD) loading, Fraction anaerobically digested
CH4 (lb/year)
-Recommended for Publicly owned treatment works (POTW) projects
-Substantial research needed to determine the “fraction anaerobically digested” parameter, which is dependent on the type of treatment plant/process
LandGem v. 3.02
Public domain http://www.epa.gov/ttn/catc/dir1/landgem-v302.xls
GHG emissions from anaerobic decomposition associated with landfills
Facility Level Moderate
Solid waste processing, year of analysis, lifetime of waste in place
CO2, CH4 (Mega grams/year)
-Recommended for landfill emissions
-Emission rates change dependent on years of decomposition, waste in place rates of change. -Complex decomposition rate equation, but good first approximation

78
Method/Tool Description
Availability Applicability Scope Ease of Use
Data Input (Requirements and Guidance)
Data Output Recommendation Comments
Advantages/ Disadvantages
CARROT Registry members
Stationary source emissions, vehicle fleet mobile sources
Facility level Moderate Facility-specific
information All GHGs
-Recommended for reporting facilities under AB 32 and for indirect emissions from energy consumption (CCAR Protocol)
-Estimates all GHGs and normalizes to CO2e -Not publicly available
Notes: GHG = greenhouse gas; AB = assembly bill; CO2e = carbon dioxide equivalent; CH4 = methane; N2O = nitrous oxide; COG = council of governments ; ITE = Institute of Transportation Engineers; CCAR = California Climate Action Registry Source: Data compiled by EDAW and the California Air Pollution Control Officers Association in 2007
Chapter 9: Mitigation Strategies for GHG
79
CEQAand
Climate Change
Chapter 9
Mitigation Strategies for GHG
Introduction This chapter (and Appendix B) identifies existing and potential mitigation measures that could be applied to projects during the CEQA process to reduce a project’s GHG emissions that would be identified using the analytical methodologies included in this white paper. The Subcommittee retained the services of EDAW to assist with this effort. EDAW performed a global search of mitigation measures currently in practice and under study that would reduce GHG emissions. Table 16 (Appendix B) provides a brief description of each measure along with an assessment of their feasibility (from a standpoint of economical, technological, and logistical feasibility, and emission reduction effectiveness), and identifies their potential for secondary impacts to air quality. During the global search performed, EDAW also took note of GHG reduction strategies being implemented as rules and regulation (e.g., early action items under AB 32), which are summarized in Table 18 (Appendix C). It is important to note that though compliance with such would be required by regulation for some sources, such strategies may be applicable to other project and source types. The recurring theme that echoes throughout a majority of these measures is the shift toward New Urbanism, and research has consistently shown that implementation of Neotraditional Development techniques reduces VMT and associated emissions. The material reviewed assessed reductions from transportation-related measures (e.g., bicycle, pedestrian, transit, and parking) as a single comprehensive approach to land use. This comprehensive approach focuses on development design criteria conducive to enhancing alternate modes of transportation, including transit, walking, and bicycling. Transportation Demand Management (TDM) programs are viewed as a mechanism to implement specific measures. TDM responsibilities may include offering incentives to potential users of alternative modes of transportation and monitoring and reporting mode split changes. The comprehensive approach makes it more difficult to assess reductions attributable to each measure. Nevertheless, there is a strong interrelationship between many of the measures, which justifies a combined approach. Consider the relationship between bike parking nonresidential, bike parking residential, endtrip facilities, and proximity to bike path/bike lane measures. In reality, these measures combined act as incentives for one individual to bike to work, while implementation of a single measure without the others reduces effectiveness. The global nature of GHG emissions is an important feature that enables unique mitigation: abatement. When designing a project subject to CEQA, the preferred practice is first to avoid, then to minimize, and finally to compensate for impacts. Where the impact cannot be mitigated on-site, off-site mitigation is often and effectively implemented in several resource areas, either in the form of offsetting the same impact or preserving the resource elsewhere in the region. Frequently, mitigation fee programs or funds are established, where the proponent pays into the program and fees collected
80
CEQA and
Climate Change
throughout the region or state are used to implement projects that, in turn, proportionately offset the impacts of the projects to the given resource. It may be more cost-effective to reduce as much GHG on-site as feasible (economically and technologically). Then the proponent would pay into a “GHG retrofit fund” to reduce equivalent GHG emissions off-site. In contrast to regional air pollutant offset programs such as the Carl Moyer Program, it matters greatly where reductions of ozone precursors occur, as ozone affects regional air quality. The GHG retrofit fund could be used to provide incentives to upgrade older buildings and make them more energy efficient. This would reduce demand on the energy sector and reduce stationary source emissions associated with utilities. This program has been successfully implemented in the United Kingdom where developments advertise “carbon neutrality.” Of course, some GHG emissions occur associated with operation of the development, but the development would offset the remainder of emissions through off-site retrofit. Avoiding emissions that would otherwise continue to occur at existing development would be a unique opportunity for mitigation of GHG emissions. Reduction of GHG emissions also may have important side benefits including reduction of other forms of pollution. Depending on the significance threshold concept adopted, projects subject to the CEQA process would either qualitatively or quantitatively identify the amount of GHG emissions associated with their project using the analytical methodologies identified in the previous chapter. The analysis would then apply the appropriate number of mitigation measures listed in Appendix B to their project to reduce their GHG emissions below the significance level. Calculating the amount of GHG emission reductions attributable to a given mitigation measure would require additional research. The examples below illustrate how a project would be mitigated using this approach. Residential Project Example Project Attributes:
• 68 detached dwelling units • 15.9 acres • Located in unincorporated Placer County PCAPCD jurisdiction) • Assume URBEMIS defaults for a rural project in Placer County, in absence of a
traffic study (This is contrary to the recommendations contained under Task 1; a traffic study is necessary to asses project-specific GHG emissions).
• Analysis year 2009

81
CEQAand
Climate Change
Chapter 9
Mitigation Strategies for GHG
Table 11: Residential Project Example GHG Emissions Estimates with Mitigation
URBEMIS Output (Unmitigated)
Metric Tons/Year CO2e
URBEMIS Output (Mitigated)
Metric Tons/Year
CO2e
Percent Reduction
Area-source emissions 252 Area-source emissions 215 14.6
Mobile-source emissions
1,047 Mobile-source emissions 916 12.5
Total direct operational emissions (area + mobile)
1,299 Total operational emissions (area + mobile)
1,131 12.9
Notes: CO2e = carbon dioxide equivalent Sources: Data compiled by EDAW in 2007
Using URBEMIS 2007 and assuming the project would implement the mitigation measures listed below, yearly project-generated emissions of CO2e would be reduced by approximately 13 percent. Implementation of the following mitigation measures is assumed:
• 100 housing units within one-half-mile radius of project’s center, including this project’s 68 residential units;
• provision of 80 jobs in the study area; • retail uses present with one-half-mile radius of project’s center; • 10 intersections per square mile; • 100% of streets with sidewalks on one side; • 50% of streets with sidewalks on both sides; • 30% of collectors and arterials with bike lanes, or where suitable, direct parallel
routes exist; • 15% of housing units deed restricted below market rate; • 20% energy efficiency increase beyond Title 24; and • 100% of landscape maintenance equipment electrically powered and electrical
outlets in front and rear of units.
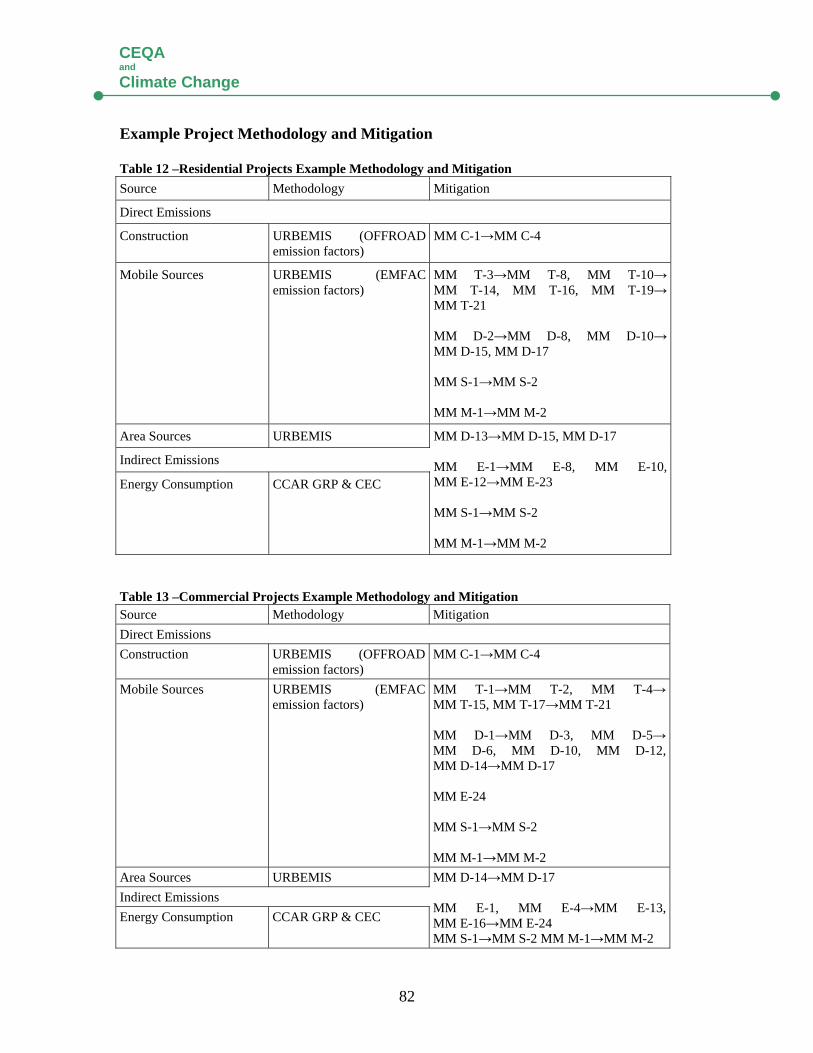
82
CEQA and
Climate Change
Example Project Methodology and Mitigation Table 12 –Residential Projects Example Methodology and Mitigation Source Methodology Mitigation
Direct Emissions
Construction URBEMIS (OFFROAD emission factors)
MM C-1→MM C-4
Mobile Sources URBEMIS (EMFAC emission factors)
MM T-3→MM T-8, MM T-10→MM T-14, MM T-16, MM T-19→MM T-21 MM D-2→MM D-8, MM D-10→MM D-15, MM D-17 MM S-1→MM S-2 MM M-1→MM M-2
Area Sources URBEMIS
Indirect Emissions
Energy Consumption CCAR GRP & CEC
MM D-13→MM D-15, MM D-17 MM E-1→MM E-8, MM E-10, MM E-12→MM E-23 MM S-1→MM S-2 MM M-1→MM M-2
Table 13 –Commercial Projects Example Methodology and Mitigation Source Methodology Mitigation Direct Emissions Construction URBEMIS (OFFROAD
emission factors) MM C-1→MM C-4
Mobile Sources URBEMIS (EMFAC emission factors)
MM T-1→MM T-2, MM T-4→MM T-15, MM T-17→MM T-21 MM D-1→MM D-3, MM D-5→MM D-6, MM D-10, MM D-12,MM D-14→MM D-17 MM E-24 MM S-1→MM S-2 MM M-1→MM M-2
Area Sources URBEMIS Indirect Emissions Energy Consumption CCAR GRP & CEC
MM D-14→MM D-17 MM E-1, MM E-4→MM E-13, MM E-16→MM E-24 MM S-1→MM S-2 MM M-1→MM M-2
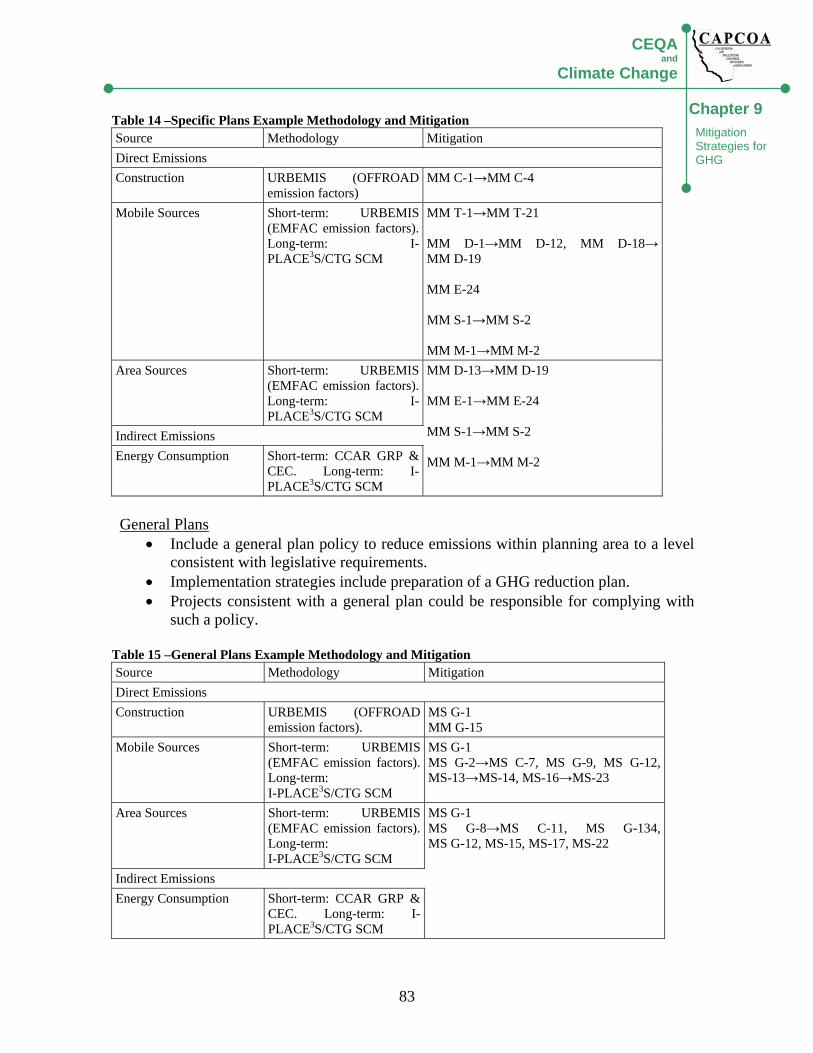
83
CEQAand
Climate Change
Chapter 9
Mitigation Strategies for GHG
Table 14 –Specific Plans Example Methodology and Mitigation Source Methodology Mitigation Direct Emissions Construction URBEMIS (OFFROAD
emission factors) MM C-1→MM C-4
Mobile Sources Short-term: URBEMIS (EMFAC emission factors). Long-term: I-PLACE3S/CTG SCM
MM T-1→MM T-21 MM D-1→MM D-12, MM D-18→MM D-19 MM E-24 MM S-1→MM S-2 MM M-1→MM M-2
Area Sources Short-term: URBEMIS (EMFAC emission factors). Long-term: I-PLACE3S/CTG SCM
Indirect Emissions Energy Consumption Short-term: CCAR GRP &
CEC. Long-term: I-PLACE3S/CTG SCM
MM D-13→MM D-19 MM E-1→MM E-24 MM S-1→MM S-2 MM M-1→MM M-2
General Plans
• Include a general plan policy to reduce emissions within planning area to a level consistent with legislative requirements.
• Implementation strategies include preparation of a GHG reduction plan. • Projects consistent with a general plan could be responsible for complying with
such a policy.
Table 15 –General Plans Example Methodology and Mitigation Source Methodology Mitigation Direct Emissions Construction URBEMIS (OFFROAD
emission factors). MS G-1 MM G-15
Mobile Sources Short-term: URBEMIS (EMFAC emission factors). Long-term: I-PLACE3S/CTG SCM
MS G-1 MS G-2→MS C-7, MS G-9, MS G-12, MS-13→MS-14, MS-16→MS-23
Area Sources Short-term: URBEMIS (EMFAC emission factors). Long-term: I-PLACE3S/CTG SCM
Indirect Emissions Energy Consumption Short-term: CCAR GRP &
CEC. Long-term: I-PLACE3S/CTG SCM
MS G-1 MS G-8→MS C-11, MS G-134, MS G-12, MS-15, MS-17, MS-22
84
CEQA and
Climate Change
Other Project Types Air District Rules and Regulations Air district rules and regulations could have the potential to increase or decrease GHG emissions within the respective jurisdiction. In general, air district rules and regulations act to decrease criteria air pollutant or toxic air contaminant emissions, which would usually act to reduce GHG emissions simultaneously. However, this may not always be the case and air district rules and regulations could address emissions from a large variety of different source types. Reductions of GHG emissions associated with implementation of applicable mitigation, which could also vary greatly, would need to be evaluated on a case-by-case basis. However, once applicable mitigation measures are identified, percent reductions based on the best available research to date, such as those specified in Table 15, could be applied to determine mitigated emissions. Air Quality Plans Similarly to air district rules and regulations, air quality plans could have the potential to increase or decrease GHG emissions because of criteria air pollutant reduction strategies. In general, strategies implemented by air districts to reduce criteria air pollutants also act to reduce GHG emissions. However, this may not always be the case. Reductions of GHG emissions associated with implementation of applicable mitigation would need to be evaluated on a case-by-case basis. The methodology identified above for determining whether the strategies contained within the GHG reduction plan would adhere to the level specified in general plan policy could also be used to determine the reductions associated with CAP strategies. Regional Transportation Plans Regional transportation plans and reductions of GHG emissions associated with implementation of applicable mitigation would also need to be evaluated on a case-by-case basis to determine if a net increase or decrease in GHG emissions would occur. Complex interactions between the roadway network, operating conditions, alternative transportation availability (such as public transit, bicycle pathways, and pedestrian infrastructure), and many other independent parameters specific to a region should be considered. EMFAC 2007 can be used with VMT from the RTP to create an inventory of GHG emissions. Reductions associated with implementation of applicable measures contained in Table 16 could be accomplished by accounting for VMT reductions in the traffic model.
Chapter 10: Examples of Other Approaches
85
CEQAand
Climate Change
Chapter 10
Examples of Other Approaches
Many states, counties, and cities have developed policies and regulations concerning greenhouse gas emissions that seek to require or promote reductions in GHG emissions through standards for vehicle emissions, fuels, electricity production/renewables, building efficiency, and other means. However, we could only identify three public agencies in the United States that are considering formally requiring the analysis of greenhouse gas emissions and climate change for development projects during their associated environmental processes. There may be others, but they were not identified during research conducted during preparation of this paper. The following is a summary of those three efforts. Commonwealth of Massachusetts - MEPA Greenhouse Gas Emissions Policy and Protocol The Massachusetts Executive Office of Energy and Environmental Affairs (EEA) has determined that the phrase “damage to the environment” as used in the Massachusetts Environmental Policy Act (MEPA) includes the emission of greenhouse gases caused by projects subjects to MEPA Review. EEA has published a Greenhouse Gas Emissions Policy (GGEP) to fulfill the statutory obligation to take all feasible measurers to avoid, minimize or mitigate damage to the environment. The GGEP concerns the following projects only:
• The Commonwealth or a state agency is the proponent; • The Commonwealth or a state agency is providing financial assistance; • The project is privately funded, but requires an Air Quality Permit from the
department of Environmental Protection; • The project is privately funded, but will generate:
o 3,000 or more new vehicle trips per day for office projects; o 6,000 or more new vehicle trips per day for mixed use projects that are
25% or more office space; or o 10,000 or more new vehicle trips per day for other projects.
As a comparison, the trip generation amounts correspond as follows:
• 3,000 vehicle trips per day = approximately 250,000 square foot office development;
• 6,000 or more new vehicle trips per day for mixed use projects that are 25% or more office space = if 25% office space, then equivalent to approximately 130,000 square feet of office and either 100,000 square feet of retail or 450 single-family residential units or some combination thereof.
• 10,000 or more new vehicle trips per day = approximately 1,000 single family residential units or 250,000 square feet retail.
86
CEQA and
Climate Change
The draft policy states it is not intended to create a numerical GHG emission limit or a numerical GHG emissions reduction target, but rather to ensure that project proponents and reviewers have considered the GHG emissions impacts of their projects and taken all feasible means and measure to reduce those impacts. The draft policy notes that some projects within these categories will have little or no greenhouse gas emission and the policy will not apply to such projects. EEA intends to identify in the scoping certificate whether a project falls within this de minimis exception. The GGEP requires qualifying projects to do the following:
• to quantify their GHG emissions; • identify measures to minimize or mitigate such emissions; • quantify the reduction in emissions and energy savings from mitigation.
Emissions inventories are intended to focus on carbon dioxide, but analysis of other GHGs may be required for certain projects. EEA will require analysis of direct GGH emissions and indirect (electricity and transportation) emissions. The GGEP references the protocols prepared by the World Resource Institute as guidance for inventory preparation. The policy is still in draft form, but the comment period closed on August 10, 2007. King County, Washington - Executive Order on the Evaluation of Climate Change Impacts through the State Environmental Policy Act (SEPA) On June 27, 2007, the King County Executive Ron Sims directed all King County Departments, as follows:
“…effective September 1, 2007 to require that climate impacts, including, but not limited to those pertaining to greenhouse gases, be appropriately identified and evaluated when such Departments are acting as the lead agency in reviewing the environmental impacts of private or public proposals pursuant to the State Environmental Policy Act”.
The Executive Order does not define what a “climate impact” is. Based on statements of the County Deputy Chief of Staff*
• County agencies will ask project proponents to supply information on transportation, energy usage and other impacts of proposed projects using the County’s existing SEPA checklist.
* Marten Law Group: Environmental News, August 1, 2007, “King County (WA) First in Nation to Require Climate Change Impacts to be Considered During Environmental Review of New Projects”.
87
CEQAand
Climate Change
Chapter 10
Examples of Other Approaches
• There is no current plan to require project proponents to take action to mitigate the impacts identifies.
• Development of emissions thresholds and mitigation requirements will be undertaken in connection with the County’s upcoming 2008 update of its Comprehensive Plan.
Sacramento Metropolitan Air Quality Management District The Sacramento Metropolitan Air Quality Management District released an interim guidance on addressing climate change in CEQA documents on September 6, 2007. While very general in nature, the District recommends that CEQA environmental documents include a discussion of anticipated GHG emissions during both the construction and operation phases of the project. This includes assessing the GHG emissions from projects (using readily available models) to determine whether a project may have a significant impact. If so, then the District recommends addressing all of the District’s GHG mitigation measures (drawn from comments made by the California Attorney General) – with explanations on how the mitigation will be implemented or providing rationale for why a measure would be considered infeasible. The District provides assistance to agencies in their analysis of GHG emissions and the applicability of specific mitigation measures. The District’s guidance can be found at: http://64.143.64.21/climatechange/ClimateChangeCEQAguidance.pdf Mendocino Air Quality Management District – CEQA Guidelines The Mendocino AQMD updated its “Guidelines for Use During Preparation of Air Quality Impacts in EIRs or Mitigated Negative Declarations” in May 2007. The guidelines call for preparing estimates of the increased emissions of air contaminations (including GHG) for projects. The guidelines state that GHG emissions should be presumed to have a significant impact if CO emissions from District-approved modeling exceed either of the following:
• 80% of the level defined as significant for stationary sources in Regulation1, Rule 130 (s2) of the District (which is 550 lbs/day for CO, meaning a threshold of 440 lbs/day for CO for stationary sources); or
• levels established in District Regulation 1 Rule 130 (i2) for indirect sources (which is 690 lbs/day for CO for indirect sources).
If an average passenger vehicle emits 22 grams of CO/mile and 0.8 lb/mile of CO2, then the 690-lb/day threshold for CO corresponds to approximately 11,400 lb/day CO2 threshold for passenger vehicle-related emissions. If one assumes that the average passenger vehicle goes 12,500 miles/year (about 35 miles/day), then this is a threshold equivalent to about 420 vehicles. Using an average in California of about 1.77 vehicles/household, this would correspond to about 250 households/dwelling units.
Appendix A
Relevant Citations
Appendix A: Relevant Citations
AG=Attorney General; ARB=California Air Resources Board; ASTM=American Society for Testing and Material; BAAQMD=Bay Area Air Quality Management District; BEES= Building for Environmental and Economic Sustainability; CA=California; Caltrans=California Department of Transportation; CAPs=Criteria Air Pollutants; CCAP=Center for Clean Air Policy; CF=Connectivity Factor; CIWMB=California Integrated Waste Management Board; CO= Carbon Monoxide; CO2=Carbon Dioxide; DGS=Department of General Services; DOE=U.S. Department of Energy; DPF=Diesel particulate Filter; E85=85% Ethanol; EERE=Energy Efficiency and Renewable Energy; EOE=Encyclopedia of Earth; EPA=U.S. Environmental Protection Agency; ETC=Edmonton Trolley Coalition; EVs/CNG=Electric Vehicles/Compressed Natural Gas; FAR=Floor Area Ratio; GHG=Greenhouse Gas; ITE=Institute of Transportation Engineers; kg/m2=kilogram per square meter; km=Kilometer; lb=pound; LEED=Leadership in Energy and Environmental Design; M=Million; NA=Not Available; NEV=Neighborhood Electric Vehicle; NIST=National Institute of Standards and Technology; NOX=Oxides of Nitrogen; NREL=National Renewable Energy Laboratory; N/S=North/South; PG&E=Pacific Gas and Electric; PM=Particulate Matter; SJVAPCD=San Joaquin Valley Air Pollution Control District; SMAQMD=Sacramento Metropolitan Air Quality Management District; SMUD=Sacramento Municipal Utilities District; SOx=Sulfur Oxides; SRI=Solar Reflectance Index; TACs=Toxic Air Contaminants; TDM=Transportation Demand Management; TMA=Transportation Management Association; THC=Total Hydrocarbon; ULEV=Ultra Low Emission Vehicle; USGBC=U.S. Green Building Council; and VTPI=Victoria Transit Policy.
A-1
CEQAand
Climate Change
Appendix A
Citations from the Public Resources Code (Division 13, §21000 et seq.) as amended through January 1, 2005. Public Resources Code – Section 21004, MITIGATING OR AVOIDING A SIGNIFICANT EFFECT; POWERS OF PUBLIC AGENCY: “In mitigating or avoiding a significant effect of a project on the environment, a public agency may exercise only those express or implied powers provided by law other than this division. However, a public agency may use discretionary powers provided by such other law for the purpose of mitigating or avoiding a significant effect on the environment subject to the express or implied constraints or limitations that may be provided by law.” Public Resources Code – Section 21082.2, SIGNIFICANT EFFECT ON ENVIRONMENT; DETERMINATION; ENVIRONMENTAL IMPACT REPORT PREPARATION: (a) The lead agency shall determine whether a project may have a significant effect on the environment based on substantial evidence in light of the whole record. (b) The existence of public controversy over the environmental effects of a project shall not require preparation of an environmental impact report if there is no substantial evidence in light of the whole record before the lead agency that the project may have a significant effect on the environment. (c) Argument, speculation, unsubstantiated opinion or narrative, evidence which is clearly inaccurate or erroneous, or evidence of social or economic impacts which do not contribute to, or are not caused by, physical impacts on the environment, is not substantial evidence. Substantial evidence shall include facts, reasonable assumptions predicated upon facts, and expert opinion supported by facts. (d) If there is substantial evidence, in light of the whole record before the lead agency, that a project may have a significant effect on the environment, an environmental impact report shall be prepared. (e) Statements in an environmental impact report and comments with respect to an environmental impact report shall not be deemed determinative of whether the project may have a significant effect on the environment. Citations from the Guidelines for California Environmental Quality Act, CCR, Title 14, Division 6 (§15000 et seq.) as amended through July 27, 2007.
2
CEQAand
Climate Change
Appendix A
State CEQA Guidelines – Section 15064, DETERMINING THE SIGNIFICANCE OF THE ENVIRONMENTAL EFFECTS CAUSED BY A PROJECT: (a) Determining whether a project may have a significant effect plays a critical role in the CEQA process. (1) If there is substantial evidence, in light of the whole record before a lead agency, that a project may have a significant effect on the environment, the agency shall prepare a draft EIR. (2) When a final EIR identifies one or more significant effects, the Lead Agency and each Responsible Agency shall make a finding under Section 15091 for each significant effect and may need to make a statement of overriding considerations under Section 15093 for the project. (b) The determination of whether a project may have a significant effect on the environment calls for careful judgment on the part of the public agency involved, based to the extent possible on scientific and factual data. An ironclad definition of significant effect is not always possible because the significance of an activity may vary with the setting. For example, an activity which may not be significant in an urban area may be significant in a rural area. (c) In determining whether an effect will be adverse or beneficial, the Lead Agency shall consider the views held by members of the public in all areas affected as expressed in the whole record before the lead agency. Before requiring the preparation of an EIR, the Lead Agency must still determine whether environmental change itself might be substantial. (d) In evaluating the significance of the environmental effect of a project, the Lead Agency shall consider direct physical changes in the environment which may be caused by the project and reasonably foreseeable indirect physical changes in the environment which may be caused by the project. (1) A direct physical change in the environment is a physical change in the environment which is caused by and immediately related to the project. Examples of direct physical changes in the environment are the dust, noise, and traffic of heavy equipment that would result from construction of a sewage treatment plant and possible odors from operation of the plant. (2) An indirect physical change in the environment is a physical change in the environment which is not immediately related to the project, but which is caused indirectly by the project. If a direct physical change in the environment in turn causes another change in the environment, then the other change is an indirect physical change in the environment. For example, the construction of a new sewage treatment plant may facilitate population growth in the service area due to the increase in sewage treatment capacity and may lead to an increase in air pollution. (3) An indirect physical change is to be considered only if that change is a reasonably foreseeable impact which may be caused by the project. A change which is speculative or unlikely to occur is not reasonably foreseeable. (e) Economic and social changes resulting from a project shall not be treated as significant effects on the environment. Economic or social changes may be used, however, to determine that a physical change shall be regarded as a significant effect on the environment. Where a physical change is caused by economic or social effects of a
A-3
CEQAand
Climate Change
Appendix A
project, the physical change may be regarded as a significant effect in the same manner as any other physical change resulting from the project. Alternatively, economic and social effects of a physical change may be used to determine that the physical change is a significant effect on the environment. If the physical change causes adverse economic or social effects on people, those adverse effects may be used as a factor in determining whether the physical change is significant. For example, if a project would cause overcrowding of a public facility and the overcrowding causes an adverse effect on people, the overcrowding would be regarded as a significant effect. (f) The decision as to whether a project may have one or more significant effects shall be based on substantial evidence in the record of the lead agency. (1) If the lead agency determines there is substantial evidence in the record that the project may have a significant effect on the environment, the lead agency shall prepare an EIR (Friends of B Street v. City of Hayward (1980) 106 Cal.App.3d 988). Said another way, if a lead agency is presented with a fair argument that a project may have a significant effect on the environment, the lead agency shall prepare an EIR even though it may also be presented with other substantial evidence that the project will not have a significant effect (No Oil, Inc. v. City of Los Angeles (1974) 13 Cal.3d 68). (2) If the lead agency determines there is substantial evidence in the record that the project may have a significant effect on the environment but the lead agency determines that revisions in the project plans or proposals made by, or agreed to by, the applicant would avoid the effects or mitigate the effects to a point where clearly no significant effect on the environment would occur and there is no substantial evidence in light of the whole record before the public agency that the project, as revised, may have a significant effect on the environment then a mitigated negative declaration shall be prepared. (3) If the lead agency determines there is no substantial evidence that the project may have a significant effect on the environment, the lead agency shall prepare a negative declaration (Friends of B Street v. City of Hayward (1980) 106 Cal.App. 3d 988). (4) The existence of public controversy over the environmental effects of a project will not require preparation of an EIR if there is no substantial evidence before the agency that the project may have a significant effect on the environment. (5) Argument, speculation, unsubstantiated opinion or narrative, or evidence that is clearly inaccurate or erroneous, or evidence that is not credible, shall not constitute substantial evidence. Substantial evidence shall include facts, reasonable assumptions predicated upon facts, and expert opinion support by facts. (6) Evidence of economic and social impacts that do not contribute to or are not caused by physical changes in the environment is not substantial evidence that the project may have a significant effect on the environment. (7) The provisions of sections 15162, 15163, and 15164 apply when the project being analyzed is a change to, or further approval for, a project for which an EIR or negative declaration was previously certified or adopted (e.g. a tentative subdivision, conditional use permit). Under case law, the fair argument standard does not apply to determinations of significance pursuant to sections 15162, 15163, and 15164. (g) After application of the principles set forth above in Section 15064(f)(g), and in marginal cases where it is not clear whether there is substantial evidence that a project may have a significant effect on the environment, the lead agency shall be guided by the following principle: If there is disagreement among expert opinion supported by facts
4
CEQAand
Climate Change
Appendix A
over the significance of an effect on the environment, the Lead Agency shall treat the effect as significant and shall prepare an EIR. (h)(1) When assessing whether a cumulative effect requires an EIR, the lead agency shall consider whether the cumulative impact is significant and whether the effects of the project are cumulatively considerable. An EIR must be prepared if the cumulative impact may be significant and the project’s incremental effect, though individually limited, is cumulatively considerable. “Cumulatively considerable” means that the incremental effects of an individual project are significant when viewed in connection with the effects of past projects, the effects of other current projects, and the effects of probable future projects. (2) A lead agency may determine in an initial study that a project’s contribution to a significant cumulative impact will be rendered less than cumulatively considerable and thus is not significant. When a project might contribute to a significant cumulative impact, but the contribution will be rendered less than cumulatively considerable through mitigation measures set forth in a mitigated negative declaration, the initial study shall briefly indicate and explain how the contribution has been rendered less than cumulatively considerable. (3) A lead agency may determine that a project’s incremental contribution to a cumulative effect is not cumulatively considerable if the project will comply with the requirements in a previously approved plan or mitigation program which provides specific requirements that will avoid or substantially lessen the cumulative problem (e.g., water quality control plan, air quality plan, integrated waste management plan) within the geographic area in which the project is located. Such plans or programs must be specified in law or adopted by the public agency with jurisdiction over the affected resources through a public review process to implement, interpret, or make specific the law enforced or administered by the public agency. If there is substantial evidence that the possible effects of a particular project are still cumulatively considerable notwithstanding that the project complies with the specified plan or mitigation program addressing the cumulative problem, an EIR must be prepared for the project. (4) The mere existence of significant cumulative impacts caused by other projects alone shall not constitute substantial evidence that the proposed project’s incremental effects are cumulatively considerable. State CEQA Guidelines – Section 15130, DISCUSSION OF CUMULATIVE IMPACTS: (a)(3). “An EIR may determine that a project’s contribution to a significant cumulative impact will be rendered less than cumulatively considerable and thus is not significant. A project’s contribution is less than cumulatively considerable if the project is required to implement or fund its fair share of a mitigation measure or measures designed to alleviate the cumulative impact. The lead agency shall identify facts and analysis supporting its conclusion that the contribution will be rendered less than cumulatively considerable. State CEQA Guidelines – Section 15064.7, THRESHOLDS OF SIGNIFICANCE: “Each public agency is encouraged to develop and publish thresholds of significance that the agency uses in the determination of the significance of environmental effects. A threshold of significance is an identifiable quantitative, qualitative or performance level

A-5
CEQAand
Climate Change
Appendix A
of a particular environmental effect, non-compliance with which means the effect will normally be determined to be significant by the agency and compliance with which means the effect normally will be determined to be less than significant.”
Appendix B: Mitigation Measure Summary
CEQAand
Climate Change
Appendix B
Appendix B
Mitigation Measure Summary
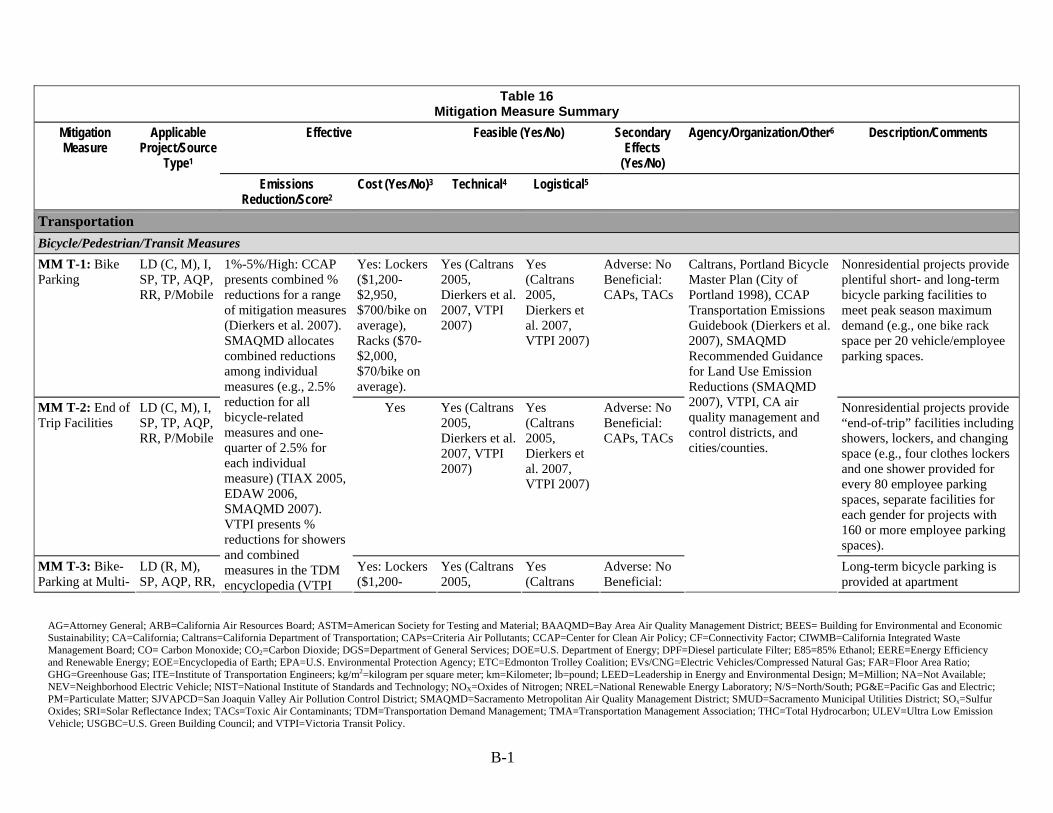
AG=Attorney General; ARB=California Air Resources Board; ASTM=American Society for Testing and Material; BAAQMD=Bay Area Air Quality Management District; BEES= Building for Environmental and Economic Sustainability; CA=California; Caltrans=California Department of Transportation; CAPs=Criteria Air Pollutants; CCAP=Center for Clean Air Policy; CF=Connectivity Factor; CIWMB=California Integrated Waste Management Board; CO= Carbon Monoxide; CO2=Carbon Dioxide; DGS=Department of General Services; DOE=U.S. Department of Energy; DPF=Diesel particulate Filter; E85=85% Ethanol; EERE=Energy Efficiency and Renewable Energy; EOE=Encyclopedia of Earth; EPA=U.S. Environmental Protection Agency; ETC=Edmonton Trolley Coalition; EVs/CNG=Electric Vehicles/Compressed Natural Gas; FAR=Floor Area Ratio; GHG=Greenhouse Gas; ITE=Institute of Transportation Engineers; kg/m2=kilogram per square meter; km=Kilometer; lb=pound; LEED=Leadership in Energy and Environmental Design; M=Million; NA=Not Available; NEV=Neighborhood Electric Vehicle; NIST=National Institute of Standards and Technology; NOX=Oxides of Nitrogen; NREL=National Renewable Energy Laboratory; N/S=North/South; PG&E=Pacific Gas and Electric; PM=Particulate Matter; SJVAPCD=San Joaquin Valley Air Pollution Control District; SMAQMD=Sacramento Metropolitan Air Quality Management District; SMUD=Sacramento Municipal Utilities District; SOx=Sulfur Oxides; SRI=Solar Reflectance Index; TACs=Toxic Air Contaminants; TDM=Transportation Demand Management; TMA=Transportation Management Association; THC=Total Hydrocarbon; ULEV=Ultra Low Emission Vehicle; USGBC=U.S. Green Building Council; and VTPI=Victoria Transit Policy. B-1
Table 16
Mitigation Measure Summary Effective Feasible (Yes/No) Secondary
Effects (Yes/No)
Agency/Organization/Other6 Description/Comments Mitigation Measure
Applicable Project/Source
Type1 Emissions
Reduction/Score2 Cost (Yes/No)3 Technical4 Logistical5
Transportation Bicycle/Pedestrian/Transit Measures
MM T-1: Bike Parking
LD (C, M), I, SP, TP, AQP, RR, P/Mobile
Yes: Lockers ($1,200-$2,950, $700/bike on average), Racks ($70-$2,000, $70/bike on average).
Yes (Caltrans 2005, Dierkers et al. 2007, VTPI 2007)
Yes (Caltrans 2005, Dierkers et al. 2007, VTPI 2007)
Adverse: No Beneficial: CAPs, TACs
Nonresidential projects provide plentiful short- and long-term bicycle parking facilities to meet peak season maximum demand (e.g., one bike rack space per 20 vehicle/employee parking spaces.
MM T-2: End of Trip Facilities
LD (C, M), I, SP, TP, AQP, RR, P/Mobile
Yes Yes (Caltrans 2005, Dierkers et al. 2007, VTPI 2007)
Yes (Caltrans 2005, Dierkers et al. 2007, VTPI 2007)
Adverse: No Beneficial: CAPs, TACs
Nonresidential projects provide “end-of-trip” facilities including showers, lockers, and changing space (e.g., four clothes lockers and one shower provided for every 80 employee parking spaces, separate facilities for each gender for projects with 160 or more employee parking spaces).
MM T-3: Bike-Parking at Multi-
LD (R, M), SP, AQP, RR,
1%-5%/High: CCAP presents combined % reductions for a range of mitigation measures (Dierkers et al. 2007). SMAQMD allocates combined reductions among individual measures (e.g., 2.5% reduction for all bicycle-related measures and one-quarter of 2.5% for each individual measure) (TIAX 2005, EDAW 2006, SMAQMD 2007). VTPI presents % reductions for showers and combined measures in the TDM encyclopedia (VTPI
Yes: Lockers ($1,200-
Yes (Caltrans 2005,
Yes (Caltrans
Adverse: No Beneficial:
Caltrans, Portland Bicycle Master Plan (City of Portland 1998), CCAP Transportation Emissions Guidebook (Dierkers et al. 2007), SMAQMD Recommended Guidance for Land Use Emission Reductions (SMAQMD 2007), VTPI, CA air quality management and control districts, and cities/counties.
Long-term bicycle parking is provided at apartment

B-2
Table 16 Mitigation Measure Summary
Effective Feasible (Yes/No) Secondary Effects
(Yes/No)
Agency/Organization/Other6 Description/Comments Mitigation Measure
Applicable Project/Source
Type1 Emissions
Reduction/Score2 Cost (Yes/No)3 Technical4 Logistical5
Unit Residential P/Mobile $2,950, $700/bike on average), Racks ($70-$2,000, $70/bike on average).
Dierkers et al. 2007, VTPI 2007)
2005, Dierkers et al. 2007, VTPI 2007)
CAPs, TACs complexes or condominiums without garages (e.g., one long-term bicycle parking space for each unit without a garage). Long-term facilities shall consist of one of the following: a bicycle locker, a locked room with standard racks and access limited to bicyclists only, or a standard rack in a location that is staffed and/or monitored by video surveillance 24 hours per day.
MM T-4: Proximity to Bike Path/Bike Lanes
LD (R, C, M), I, SP, TP, AQP, RR, P/Mobile
2007). JSA bases estimates on CCAP information (JSA 2004).
Yes Yes (Caltrans 2005, Dierkers et al. 2007, VTPI 2007)
Yes (Caltrans 2005, Dierkers et al. 2007, VTPI 2007)
Adverse: No Beneficial: CAPs, TACs
Entire project is located within one-half mile of an existing/planned Class I or Class II bike lane and project design includes a comparable network that connects the project uses to the existing offsite facility. Project design includes a designated bicycle route connecting all units, on-site bicycle parking facilities, offsite bicycle facilities, site entrances, and primary building entrances to existing Class I or Class II bike lane(s) within one-half mile. Bicycle route connects to all streets contiguous with project site. Bicycle route has minimum conflicts with automobile parking and circulation
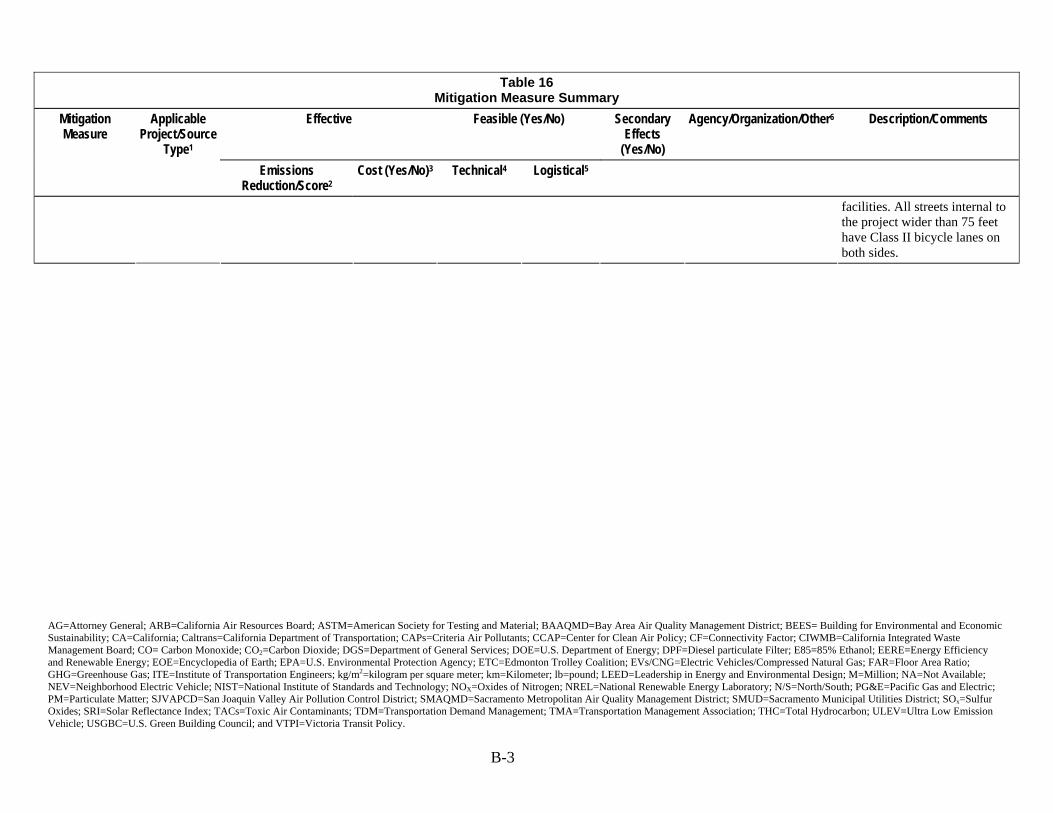
AG=Attorney General; ARB=California Air Resources Board; ASTM=American Society for Testing and Material; BAAQMD=Bay Area Air Quality Management District; BEES= Building for Environmental and Economic Sustainability; CA=California; Caltrans=California Department of Transportation; CAPs=Criteria Air Pollutants; CCAP=Center for Clean Air Policy; CF=Connectivity Factor; CIWMB=California Integrated Waste Management Board; CO= Carbon Monoxide; CO2=Carbon Dioxide; DGS=Department of General Services; DOE=U.S. Department of Energy; DPF=Diesel particulate Filter; E85=85% Ethanol; EERE=Energy Efficiency and Renewable Energy; EOE=Encyclopedia of Earth; EPA=U.S. Environmental Protection Agency; ETC=Edmonton Trolley Coalition; EVs/CNG=Electric Vehicles/Compressed Natural Gas; FAR=Floor Area Ratio; GHG=Greenhouse Gas; ITE=Institute of Transportation Engineers; kg/m2=kilogram per square meter; km=Kilometer; lb=pound; LEED=Leadership in Energy and Environmental Design; M=Million; NA=Not Available; NEV=Neighborhood Electric Vehicle; NIST=National Institute of Standards and Technology; NOX=Oxides of Nitrogen; NREL=National Renewable Energy Laboratory; N/S=North/South; PG&E=Pacific Gas and Electric; PM=Particulate Matter; SJVAPCD=San Joaquin Valley Air Pollution Control District; SMAQMD=Sacramento Metropolitan Air Quality Management District; SMUD=Sacramento Municipal Utilities District; SOx=Sulfur Oxides; SRI=Solar Reflectance Index; TACs=Toxic Air Contaminants; TDM=Transportation Demand Management; TMA=Transportation Management Association; THC=Total Hydrocarbon; ULEV=Ultra Low Emission Vehicle; USGBC=U.S. Green Building Council; and VTPI=Victoria Transit Policy. B-3
Table 16 Mitigation Measure Summary
Effective Feasible (Yes/No) Secondary Effects
(Yes/No)
Agency/Organization/Other6 Description/Comments Mitigation Measure
Applicable Project/Source
Type1 Emissions
Reduction/Score2 Cost (Yes/No)3 Technical4 Logistical5
facilities. All streets internal to the project wider than 75 feet have Class II bicycle lanes on both sides.
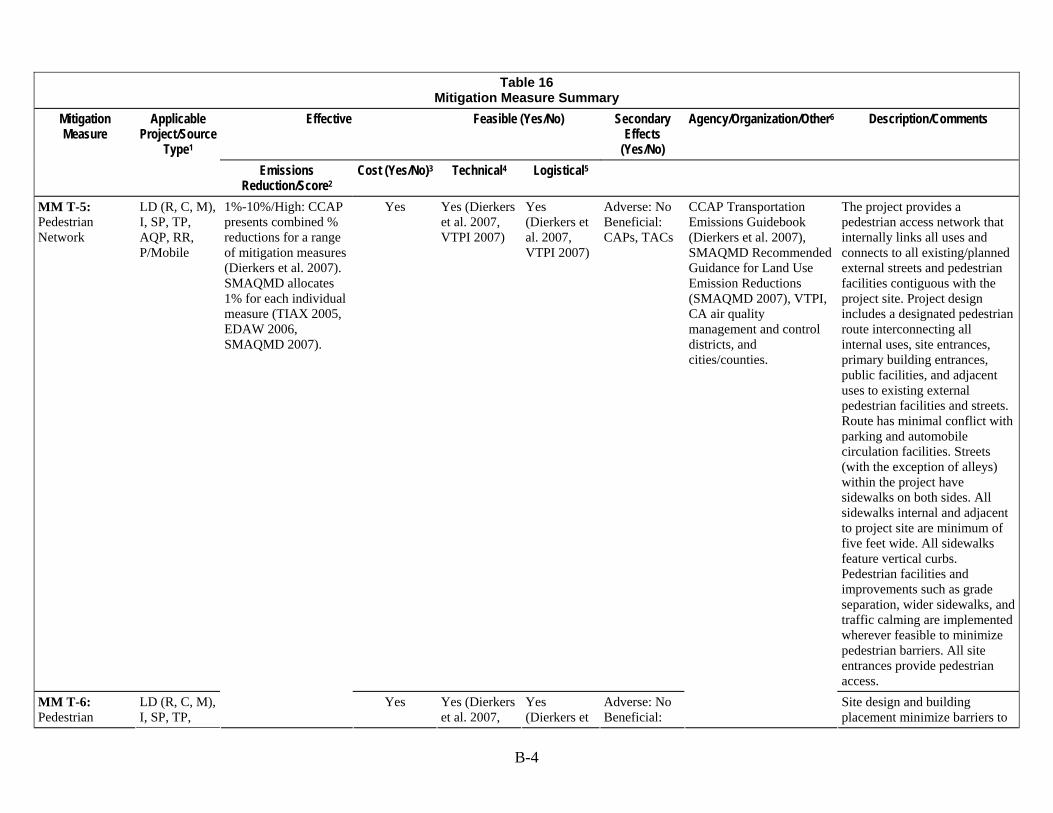
B-4
Table 16 Mitigation Measure Summary
Effective Feasible (Yes/No) Secondary Effects
(Yes/No)
Agency/Organization/Other6 Description/Comments Mitigation Measure
Applicable Project/Source
Type1 Emissions
Reduction/Score2 Cost (Yes/No)3 Technical4 Logistical5
MM T-5: Pedestrian Network
LD (R, C, M), I, SP, TP, AQP, RR, P/Mobile
Yes Yes (Dierkers et al. 2007, VTPI 2007)
Yes (Dierkers et al. 2007, VTPI 2007)
Adverse: No Beneficial: CAPs, TACs
The project provides a pedestrian access network that internally links all uses and connects to all existing/planned external streets and pedestrian facilities contiguous with the project site. Project design includes a designated pedestrian route interconnecting all internal uses, site entrances, primary building entrances, public facilities, and adjacent uses to existing external pedestrian facilities and streets. Route has minimal conflict with parking and automobile circulation facilities. Streets (with the exception of alleys) within the project have sidewalks on both sides. All sidewalks internal and adjacent to project site are minimum of five feet wide. All sidewalks feature vertical curbs. Pedestrian facilities and improvements such as grade separation, wider sidewalks, and traffic calming are implemented wherever feasible to minimize pedestrian barriers. All site entrances provide pedestrian access.
MM T-6: Pedestrian
LD (R, C, M), I, SP, TP,
1%-10%/High: CCAP presents combined % reductions for a range of mitigation measures (Dierkers et al. 2007). SMAQMD allocates 1% for each individual measure (TIAX 2005, EDAW 2006, SMAQMD 2007).
Yes Yes (Dierkers et al. 2007,
Yes (Dierkers et
Adverse: No Beneficial:
CCAP Transportation Emissions Guidebook (Dierkers et al. 2007), SMAQMD Recommended Guidance for Land Use Emission Reductions (SMAQMD 2007), VTPI, CA air quality management and control districts, and cities/counties.
Site design and building placement minimize barriers to
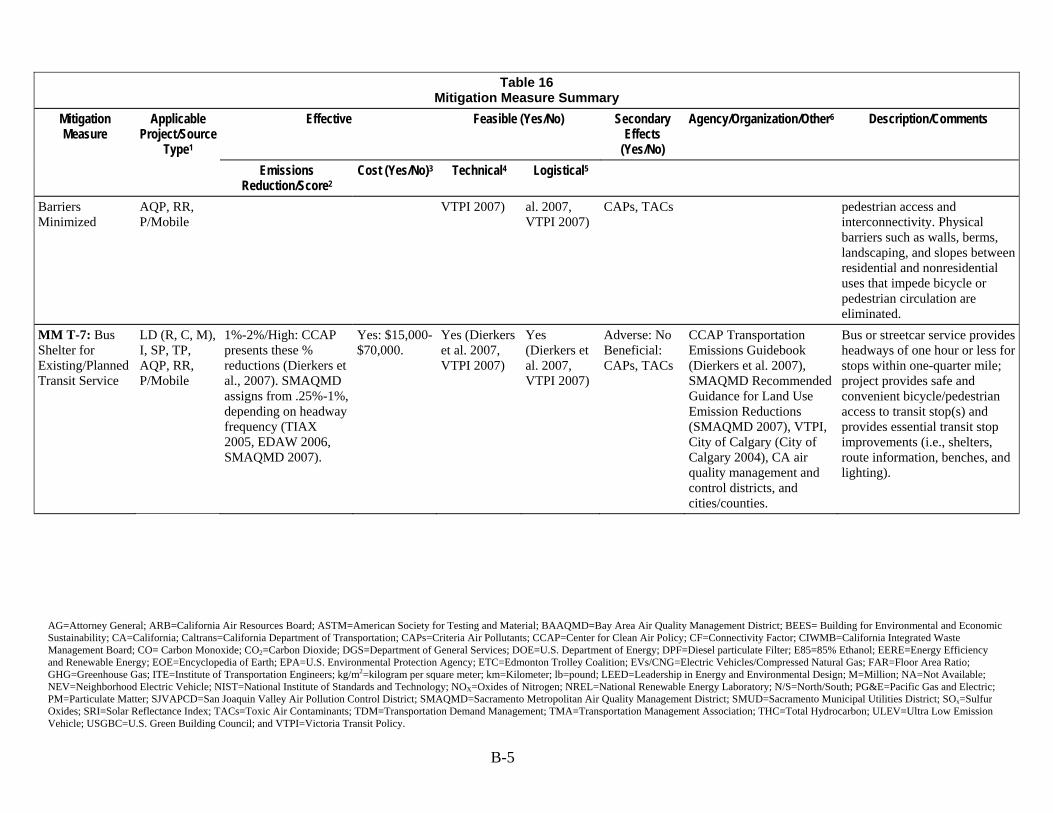
AG=Attorney General; ARB=California Air Resources Board; ASTM=American Society for Testing and Material; BAAQMD=Bay Area Air Quality Management District; BEES= Building for Environmental and Economic Sustainability; CA=California; Caltrans=California Department of Transportation; CAPs=Criteria Air Pollutants; CCAP=Center for Clean Air Policy; CF=Connectivity Factor; CIWMB=California Integrated Waste Management Board; CO= Carbon Monoxide; CO2=Carbon Dioxide; DGS=Department of General Services; DOE=U.S. Department of Energy; DPF=Diesel particulate Filter; E85=85% Ethanol; EERE=Energy Efficiency and Renewable Energy; EOE=Encyclopedia of Earth; EPA=U.S. Environmental Protection Agency; ETC=Edmonton Trolley Coalition; EVs/CNG=Electric Vehicles/Compressed Natural Gas; FAR=Floor Area Ratio; GHG=Greenhouse Gas; ITE=Institute of Transportation Engineers; kg/m2=kilogram per square meter; km=Kilometer; lb=pound; LEED=Leadership in Energy and Environmental Design; M=Million; NA=Not Available; NEV=Neighborhood Electric Vehicle; NIST=National Institute of Standards and Technology; NOX=Oxides of Nitrogen; NREL=National Renewable Energy Laboratory; N/S=North/South; PG&E=Pacific Gas and Electric; PM=Particulate Matter; SJVAPCD=San Joaquin Valley Air Pollution Control District; SMAQMD=Sacramento Metropolitan Air Quality Management District; SMUD=Sacramento Municipal Utilities District; SOx=Sulfur Oxides; SRI=Solar Reflectance Index; TACs=Toxic Air Contaminants; TDM=Transportation Demand Management; TMA=Transportation Management Association; THC=Total Hydrocarbon; ULEV=Ultra Low Emission Vehicle; USGBC=U.S. Green Building Council; and VTPI=Victoria Transit Policy. B-5
Table 16 Mitigation Measure Summary
Effective Feasible (Yes/No) Secondary Effects
(Yes/No)
Agency/Organization/Other6 Description/Comments Mitigation Measure
Applicable Project/Source
Type1 Emissions
Reduction/Score2 Cost (Yes/No)3 Technical4 Logistical5
Barriers Minimized
AQP, RR, P/Mobile
VTPI 2007) al. 2007, VTPI 2007)
CAPs, TACs pedestrian access and interconnectivity. Physical barriers such as walls, berms, landscaping, and slopes between residential and nonresidential uses that impede bicycle or pedestrian circulation are eliminated.
MM T-7: Bus Shelter for Existing/Planned Transit Service
LD (R, C, M), I, SP, TP, AQP, RR, P/Mobile
1%-2%/High: CCAP presents these % reductions (Dierkers et al., 2007). SMAQMD assigns from .25%-1%, depending on headway frequency (TIAX 2005, EDAW 2006, SMAQMD 2007).
Yes: $15,000-$70,000.
Yes (Dierkers et al. 2007, VTPI 2007)
Yes (Dierkers et al. 2007, VTPI 2007)
Adverse: No Beneficial: CAPs, TACs
CCAP Transportation Emissions Guidebook (Dierkers et al. 2007), SMAQMD Recommended Guidance for Land Use Emission Reductions (SMAQMD 2007), VTPI, City of Calgary (City of Calgary 2004), CA air quality management and control districts, and cities/counties.
Bus or streetcar service provides headways of one hour or less for stops within one-quarter mile; project provides safe and convenient bicycle/pedestrian access to transit stop(s) and provides essential transit stop improvements (i.e., shelters, route information, benches, and lighting).
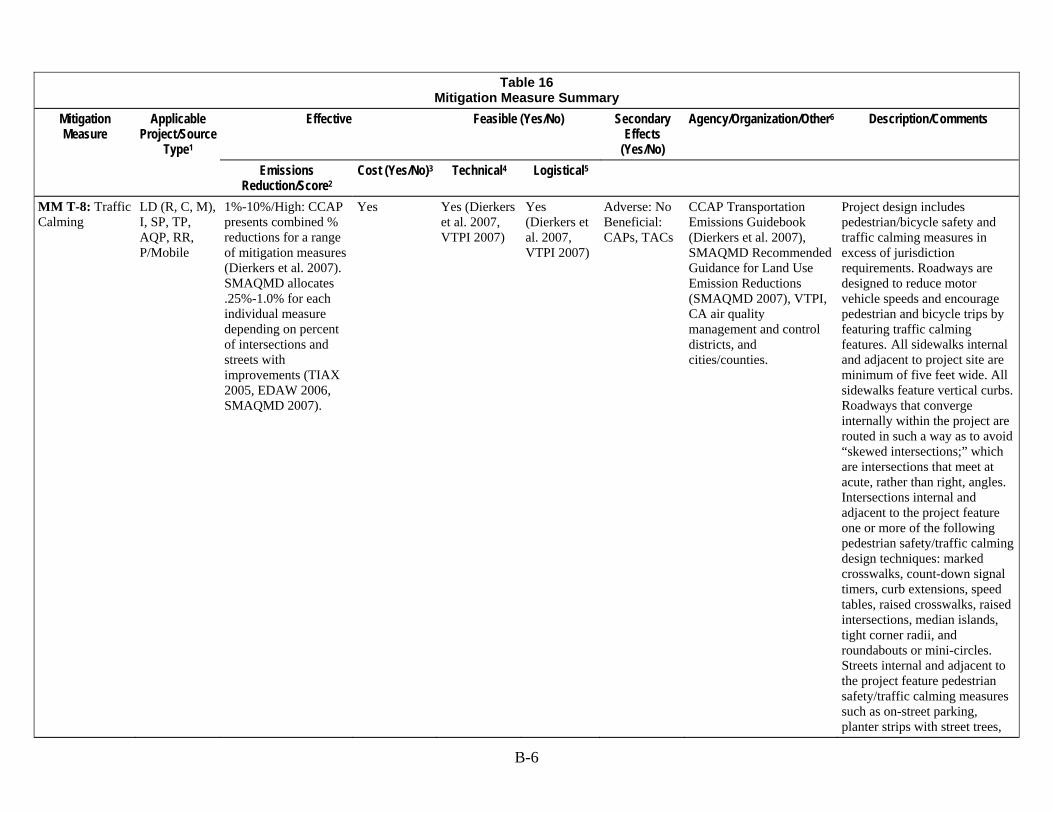
B-6
Table 16 Mitigation Measure Summary
Effective Feasible (Yes/No) Secondary Effects
(Yes/No)
Agency/Organization/Other6 Description/Comments Mitigation Measure
Applicable Project/Source
Type1 Emissions
Reduction/Score2 Cost (Yes/No)3 Technical4 Logistical5
MM T-8: Traffic Calming
LD (R, C, M), I, SP, TP, AQP, RR, P/Mobile
1%-10%/High: CCAP presents combined % reductions for a range of mitigation measures (Dierkers et al. 2007). SMAQMD allocates .25%-1.0% for each individual measure depending on percent of intersections and streets with improvements (TIAX 2005, EDAW 2006, SMAQMD 2007).
Yes Yes (Dierkers et al. 2007, VTPI 2007)
Yes (Dierkers et al. 2007, VTPI 2007)
Adverse: No Beneficial: CAPs, TACs
CCAP Transportation Emissions Guidebook (Dierkers et al. 2007), SMAQMD Recommended Guidance for Land Use Emission Reductions (SMAQMD 2007), VTPI, CA air quality management and control districts, and cities/counties.
Project design includes pedestrian/bicycle safety and traffic calming measures in excess of jurisdiction requirements. Roadways are designed to reduce motor vehicle speeds and encourage pedestrian and bicycle trips by featuring traffic calming features. All sidewalks internal and adjacent to project site are minimum of five feet wide. All sidewalks feature vertical curbs. Roadways that converge internally within the project are routed in such a way as to avoid “skewed intersections;” which are intersections that meet at acute, rather than right, angles. Intersections internal and adjacent to the project feature one or more of the following pedestrian safety/traffic calming design techniques: marked crosswalks, count-down signal timers, curb extensions, speed tables, raised crosswalks, raised intersections, median islands, tight corner radii, and roundabouts or mini-circles. Streets internal and adjacent to the project feature pedestrian safety/traffic calming measures such as on-street parking, planter strips with street trees,
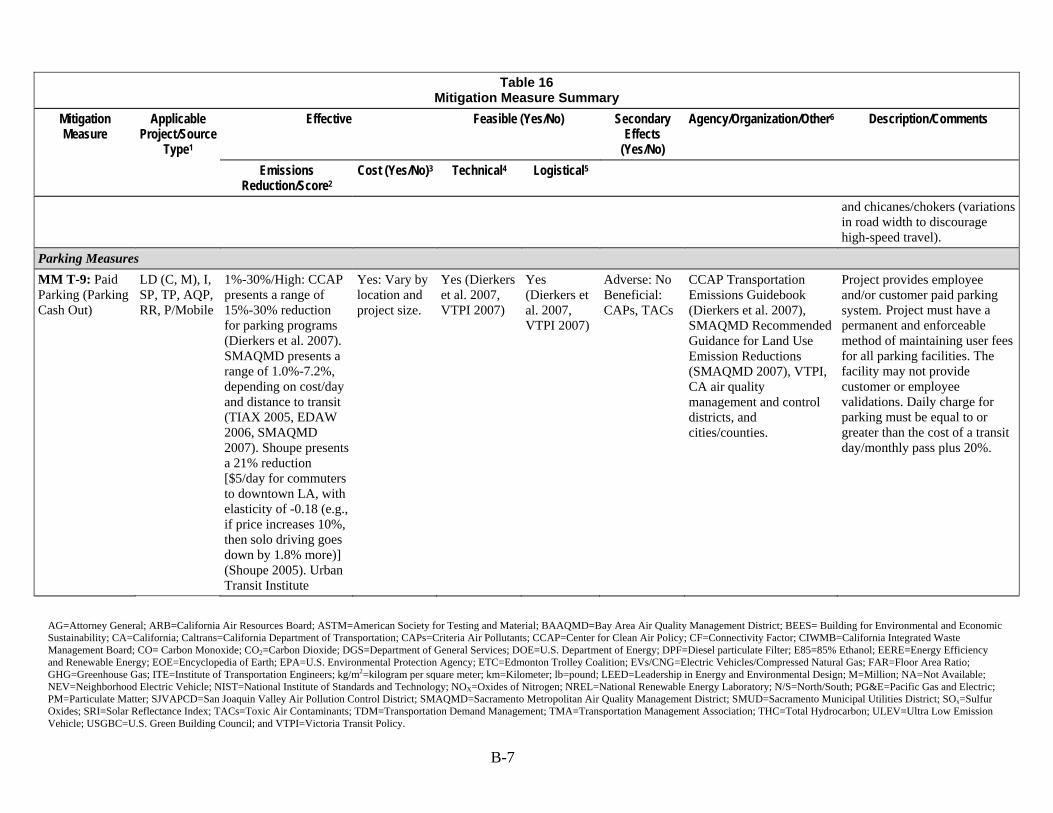
AG=Attorney General; ARB=California Air Resources Board; ASTM=American Society for Testing and Material; BAAQMD=Bay Area Air Quality Management District; BEES= Building for Environmental and Economic Sustainability; CA=California; Caltrans=California Department of Transportation; CAPs=Criteria Air Pollutants; CCAP=Center for Clean Air Policy; CF=Connectivity Factor; CIWMB=California Integrated Waste Management Board; CO= Carbon Monoxide; CO2=Carbon Dioxide; DGS=Department of General Services; DOE=U.S. Department of Energy; DPF=Diesel particulate Filter; E85=85% Ethanol; EERE=Energy Efficiency and Renewable Energy; EOE=Encyclopedia of Earth; EPA=U.S. Environmental Protection Agency; ETC=Edmonton Trolley Coalition; EVs/CNG=Electric Vehicles/Compressed Natural Gas; FAR=Floor Area Ratio; GHG=Greenhouse Gas; ITE=Institute of Transportation Engineers; kg/m2=kilogram per square meter; km=Kilometer; lb=pound; LEED=Leadership in Energy and Environmental Design; M=Million; NA=Not Available; NEV=Neighborhood Electric Vehicle; NIST=National Institute of Standards and Technology; NOX=Oxides of Nitrogen; NREL=National Renewable Energy Laboratory; N/S=North/South; PG&E=Pacific Gas and Electric; PM=Particulate Matter; SJVAPCD=San Joaquin Valley Air Pollution Control District; SMAQMD=Sacramento Metropolitan Air Quality Management District; SMUD=Sacramento Municipal Utilities District; SOx=Sulfur Oxides; SRI=Solar Reflectance Index; TACs=Toxic Air Contaminants; TDM=Transportation Demand Management; TMA=Transportation Management Association; THC=Total Hydrocarbon; ULEV=Ultra Low Emission Vehicle; USGBC=U.S. Green Building Council; and VTPI=Victoria Transit Policy. B-7
Table 16 Mitigation Measure Summary
Effective Feasible (Yes/No) Secondary Effects
(Yes/No)
Agency/Organization/Other6 Description/Comments Mitigation Measure
Applicable Project/Source
Type1 Emissions
Reduction/Score2 Cost (Yes/No)3 Technical4 Logistical5
and chicanes/chokers (variations in road width to discourage high-speed travel).
Parking Measures
MM T-9: Paid Parking (Parking Cash Out)
LD (C, M), I, SP, TP, AQP, RR, P/Mobile
1%-30%/High: CCAP presents a range of 15%-30% reduction for parking programs (Dierkers et al. 2007). SMAQMD presents a range of 1.0%-7.2%, depending on cost/day and distance to transit (TIAX 2005, EDAW 2006, SMAQMD 2007). Shoupe presents a 21% reduction [$5/day for commuters to downtown LA, with elasticity of -0.18 (e.g., if price increases 10%, then solo driving goes down by 1.8% more)] (Shoupe 2005). Urban Transit Institute
Yes: Vary by location and project size.
Yes (Dierkers et al. 2007, VTPI 2007)
Yes (Dierkers et al. 2007, VTPI 2007)
Adverse: No Beneficial: CAPs, TACs
CCAP Transportation Emissions Guidebook (Dierkers et al. 2007), SMAQMD Recommended Guidance for Land Use Emission Reductions (SMAQMD 2007), VTPI, CA air quality management and control districts, and cities/counties.
Project provides employee and/or customer paid parking system. Project must have a permanent and enforceable method of maintaining user fees for all parking facilities. The facility may not provide customer or employee validations. Daily charge for parking must be equal to or greater than the cost of a transit day/monthly pass plus 20%.
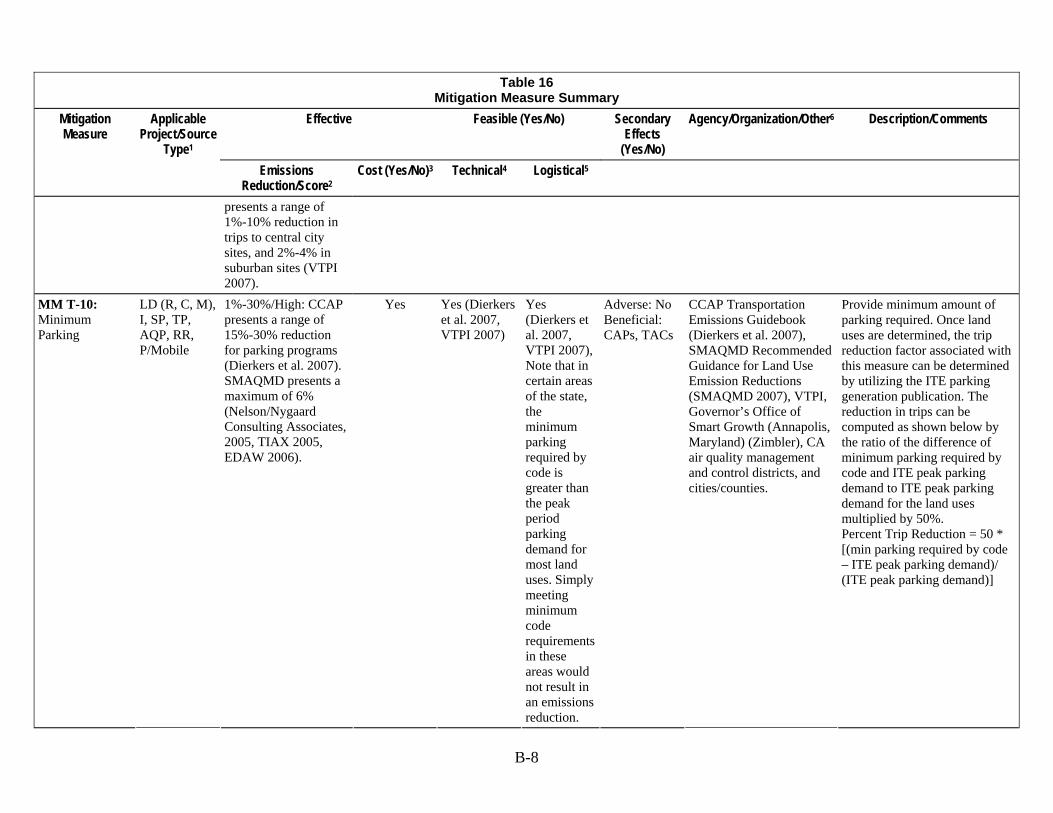
B-8
Table 16 Mitigation Measure Summary
Effective Feasible (Yes/No) Secondary Effects
(Yes/No)
Agency/Organization/Other6 Description/Comments Mitigation Measure
Applicable Project/Source
Type1 Emissions
Reduction/Score2 Cost (Yes/No)3 Technical4 Logistical5
presents a range of 1%-10% reduction in trips to central city sites, and 2%-4% in suburban sites (VTPI 2007).
MM T-10: Minimum Parking
LD (R, C, M), I, SP, TP, AQP, RR, P/Mobile
1%-30%/High: CCAP presents a range of 15%-30% reduction for parking programs (Dierkers et al. 2007). SMAQMD presents a maximum of 6% (Nelson/Nygaard Consulting Associates, 2005, TIAX 2005, EDAW 2006).
Yes Yes (Dierkers et al. 2007, VTPI 2007)
Yes (Dierkers et al. 2007, VTPI 2007), Note that in certain areas of the state, the minimum parking required by code is greater than the peak period parking demand for most land uses. Simply meeting minimum code requirements in these areas would not result in an emissions reduction.
Adverse: No Beneficial: CAPs, TACs
CCAP Transportation Emissions Guidebook (Dierkers et al. 2007), SMAQMD Recommended Guidance for Land Use Emission Reductions (SMAQMD 2007), VTPI, Governor’s Office of Smart Growth (Annapolis, Maryland) (Zimbler), CA air quality management and control districts, and cities/counties.
Provide minimum amount of parking required. Once land uses are determined, the trip reduction factor associated with this measure can be determined by utilizing the ITE parking generation publication. The reduction in trips can be computed as shown below by the ratio of the difference of minimum parking required by code and ITE peak parking demand to ITE peak parking demand for the land uses multiplied by 50%. Percent Trip Reduction = 50 * [(min parking required by code – ITE peak parking demand)/ (ITE peak parking demand)]
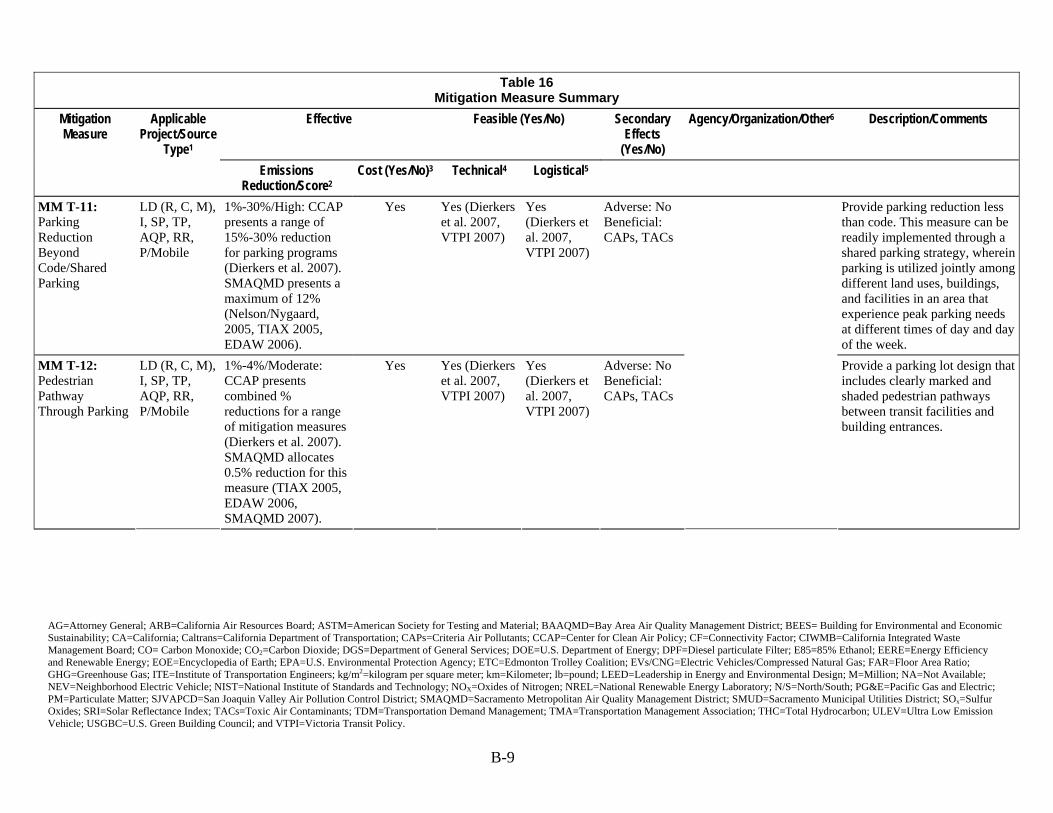
AG=Attorney General; ARB=California Air Resources Board; ASTM=American Society for Testing and Material; BAAQMD=Bay Area Air Quality Management District; BEES= Building for Environmental and Economic Sustainability; CA=California; Caltrans=California Department of Transportation; CAPs=Criteria Air Pollutants; CCAP=Center for Clean Air Policy; CF=Connectivity Factor; CIWMB=California Integrated Waste Management Board; CO= Carbon Monoxide; CO2=Carbon Dioxide; DGS=Department of General Services; DOE=U.S. Department of Energy; DPF=Diesel particulate Filter; E85=85% Ethanol; EERE=Energy Efficiency and Renewable Energy; EOE=Encyclopedia of Earth; EPA=U.S. Environmental Protection Agency; ETC=Edmonton Trolley Coalition; EVs/CNG=Electric Vehicles/Compressed Natural Gas; FAR=Floor Area Ratio; GHG=Greenhouse Gas; ITE=Institute of Transportation Engineers; kg/m2=kilogram per square meter; km=Kilometer; lb=pound; LEED=Leadership in Energy and Environmental Design; M=Million; NA=Not Available; NEV=Neighborhood Electric Vehicle; NIST=National Institute of Standards and Technology; NOX=Oxides of Nitrogen; NREL=National Renewable Energy Laboratory; N/S=North/South; PG&E=Pacific Gas and Electric; PM=Particulate Matter; SJVAPCD=San Joaquin Valley Air Pollution Control District; SMAQMD=Sacramento Metropolitan Air Quality Management District; SMUD=Sacramento Municipal Utilities District; SOx=Sulfur Oxides; SRI=Solar Reflectance Index; TACs=Toxic Air Contaminants; TDM=Transportation Demand Management; TMA=Transportation Management Association; THC=Total Hydrocarbon; ULEV=Ultra Low Emission Vehicle; USGBC=U.S. Green Building Council; and VTPI=Victoria Transit Policy. B-9
Table 16 Mitigation Measure Summary
Effective Feasible (Yes/No) Secondary Effects
(Yes/No)
Agency/Organization/Other6 Description/Comments Mitigation Measure
Applicable Project/Source
Type1 Emissions
Reduction/Score2 Cost (Yes/No)3 Technical4 Logistical5
MM T-11: Parking Reduction Beyond Code/Shared Parking
LD (R, C, M), I, SP, TP, AQP, RR, P/Mobile
1%-30%/High: CCAP presents a range of 15%-30% reduction for parking programs (Dierkers et al. 2007). SMAQMD presents a maximum of 12% (Nelson/Nygaard, 2005, TIAX 2005, EDAW 2006).
Yes Yes (Dierkers et al. 2007, VTPI 2007)
Yes (Dierkers et al. 2007, VTPI 2007)
Adverse: No Beneficial: CAPs, TACs
Provide parking reduction less than code. This measure can be readily implemented through a shared parking strategy, wherein parking is utilized jointly among different land uses, buildings, and facilities in an area that experience peak parking needs at different times of day and day of the week.
MM T-12: Pedestrian Pathway Through Parking
LD (R, C, M), I, SP, TP, AQP, RR, P/Mobile
1%-4%/Moderate: CCAP presents combined % reductions for a range of mitigation measures (Dierkers et al. 2007). SMAQMD allocates 0.5% reduction for this measure (TIAX 2005, EDAW 2006, SMAQMD 2007).
Yes Yes (Dierkers et al. 2007, VTPI 2007)
Yes (Dierkers et al. 2007, VTPI 2007)
Adverse: No Beneficial: CAPs, TACs
Provide a parking lot design that includes clearly marked and shaded pedestrian pathways between transit facilities and building entrances.
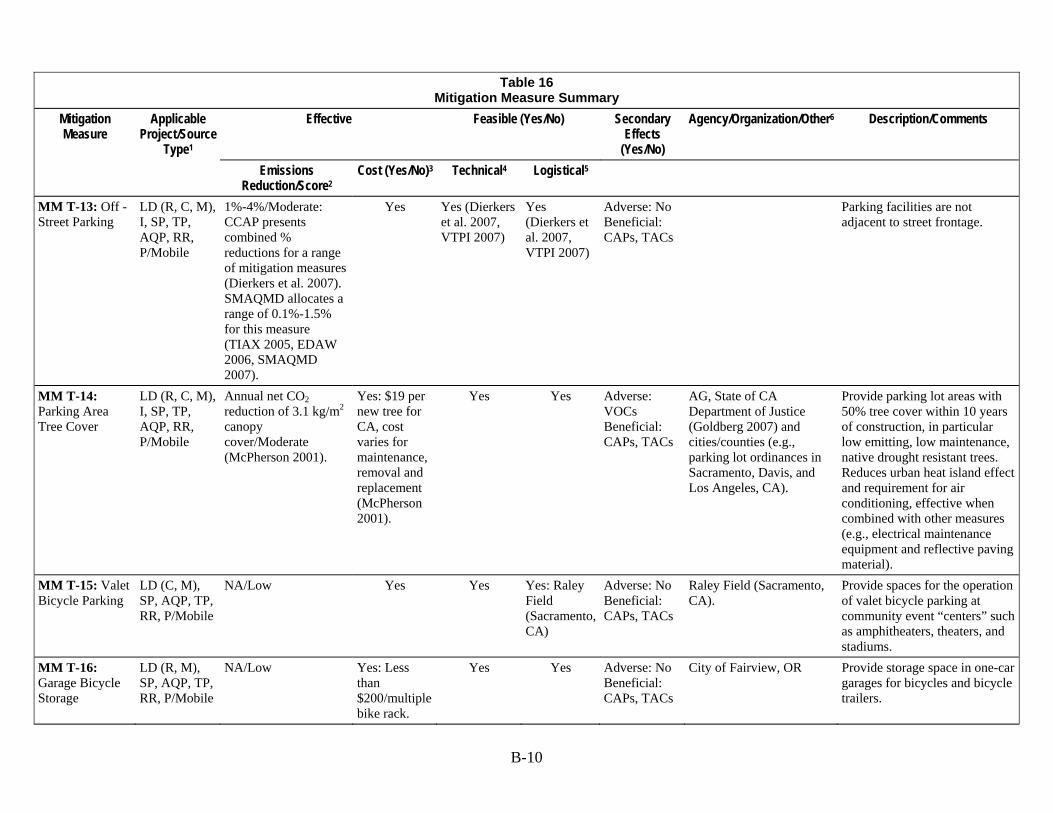
B-10
Table 16 Mitigation Measure Summary
Effective Feasible (Yes/No) Secondary Effects
(Yes/No)
Agency/Organization/Other6 Description/Comments Mitigation Measure
Applicable Project/Source
Type1 Emissions
Reduction/Score2 Cost (Yes/No)3 Technical4 Logistical5
MM T-13: Off -Street Parking
LD (R, C, M), I, SP, TP, AQP, RR, P/Mobile
1%-4%/Moderate: CCAP presents combined % reductions for a range of mitigation measures (Dierkers et al. 2007). SMAQMD allocates a range of 0.1%-1.5% for this measure (TIAX 2005, EDAW 2006, SMAQMD 2007).
Yes Yes (Dierkers et al. 2007, VTPI 2007)
Yes (Dierkers et al. 2007, VTPI 2007)
Adverse: No Beneficial: CAPs, TACs
Parking facilities are not adjacent to street frontage.
MM T-14: Parking Area Tree Cover
LD (R, C, M), I, SP, TP, AQP, RR, P/Mobile
Annual net CO2 reduction of 3.1 kg/m2 canopy cover/Moderate (McPherson 2001).
Yes: $19 per new tree for CA, cost varies for maintenance, removal and replacement (McPherson 2001).
Yes Yes Adverse: VOCs Beneficial: CAPs, TACs
AG, State of CA Department of Justice (Goldberg 2007) and cities/counties (e.g., parking lot ordinances in Sacramento, Davis, and Los Angeles, CA).
Provide parking lot areas with 50% tree cover within 10 years of construction, in particular low emitting, low maintenance, native drought resistant trees. Reduces urban heat island effect and requirement for air conditioning, effective when combined with other measures (e.g., electrical maintenance equipment and reflective paving material).
MM T-15: Valet Bicycle Parking
LD (C, M), SP, AQP, TP, RR, P/Mobile
NA/Low Yes Yes Yes: Raley Field (Sacramento, CA)
Adverse: No Beneficial: CAPs, TACs
Raley Field (Sacramento, CA).
Provide spaces for the operation of valet bicycle parking at community event “centers” such as amphitheaters, theaters, and stadiums.
MM T-16: Garage Bicycle Storage
LD (R, M), SP, AQP, TP, RR, P/Mobile
NA/Low Yes: Less than $200/multiple bike rack.
Yes Yes Adverse: No Beneficial: CAPs, TACs
City of Fairview, OR Provide storage space in one-car garages for bicycles and bicycle trailers.
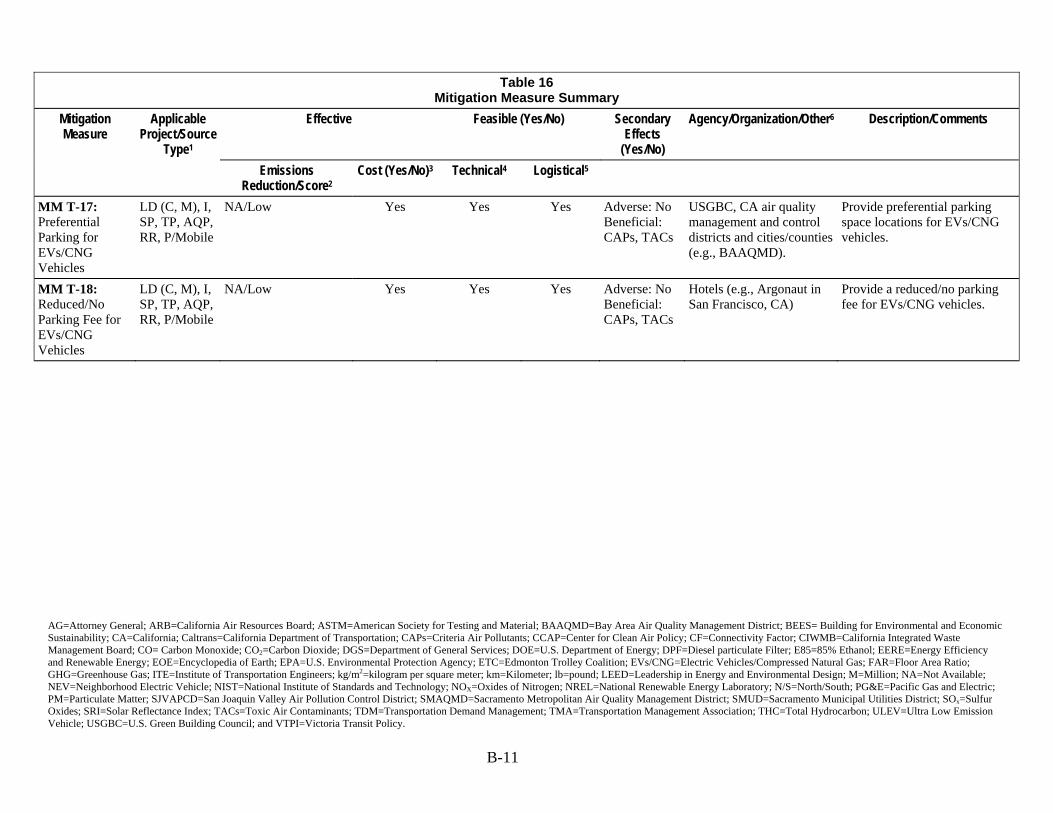
AG=Attorney General; ARB=California Air Resources Board; ASTM=American Society for Testing and Material; BAAQMD=Bay Area Air Quality Management District; BEES= Building for Environmental and Economic Sustainability; CA=California; Caltrans=California Department of Transportation; CAPs=Criteria Air Pollutants; CCAP=Center for Clean Air Policy; CF=Connectivity Factor; CIWMB=California Integrated Waste Management Board; CO= Carbon Monoxide; CO2=Carbon Dioxide; DGS=Department of General Services; DOE=U.S. Department of Energy; DPF=Diesel particulate Filter; E85=85% Ethanol; EERE=Energy Efficiency and Renewable Energy; EOE=Encyclopedia of Earth; EPA=U.S. Environmental Protection Agency; ETC=Edmonton Trolley Coalition; EVs/CNG=Electric Vehicles/Compressed Natural Gas; FAR=Floor Area Ratio; GHG=Greenhouse Gas; ITE=Institute of Transportation Engineers; kg/m2=kilogram per square meter; km=Kilometer; lb=pound; LEED=Leadership in Energy and Environmental Design; M=Million; NA=Not Available; NEV=Neighborhood Electric Vehicle; NIST=National Institute of Standards and Technology; NOX=Oxides of Nitrogen; NREL=National Renewable Energy Laboratory; N/S=North/South; PG&E=Pacific Gas and Electric; PM=Particulate Matter; SJVAPCD=San Joaquin Valley Air Pollution Control District; SMAQMD=Sacramento Metropolitan Air Quality Management District; SMUD=Sacramento Municipal Utilities District; SOx=Sulfur Oxides; SRI=Solar Reflectance Index; TACs=Toxic Air Contaminants; TDM=Transportation Demand Management; TMA=Transportation Management Association; THC=Total Hydrocarbon; ULEV=Ultra Low Emission Vehicle; USGBC=U.S. Green Building Council; and VTPI=Victoria Transit Policy. B-11
Table 16 Mitigation Measure Summary
Effective Feasible (Yes/No) Secondary Effects
(Yes/No)
Agency/Organization/Other6 Description/Comments Mitigation Measure
Applicable Project/Source
Type1 Emissions
Reduction/Score2 Cost (Yes/No)3 Technical4 Logistical5
MM T-17: Preferential Parking for EVs/CNG Vehicles
LD (C, M), I, SP, TP, AQP, RR, P/Mobile
NA/Low Yes Yes Yes Adverse: No Beneficial: CAPs, TACs
USGBC, CA air quality management and control districts and cities/counties (e.g., BAAQMD).
Provide preferential parking space locations for EVs/CNG vehicles.
MM T-18: Reduced/No Parking Fee for EVs/CNG Vehicles
LD (C, M), I, SP, TP, AQP, RR, P/Mobile
NA/Low Yes Yes Yes Adverse: No Beneficial: CAPs, TACs
Hotels (e.g., Argonaut in San Francisco, CA)
Provide a reduced/no parking fee for EVs/CNG vehicles.
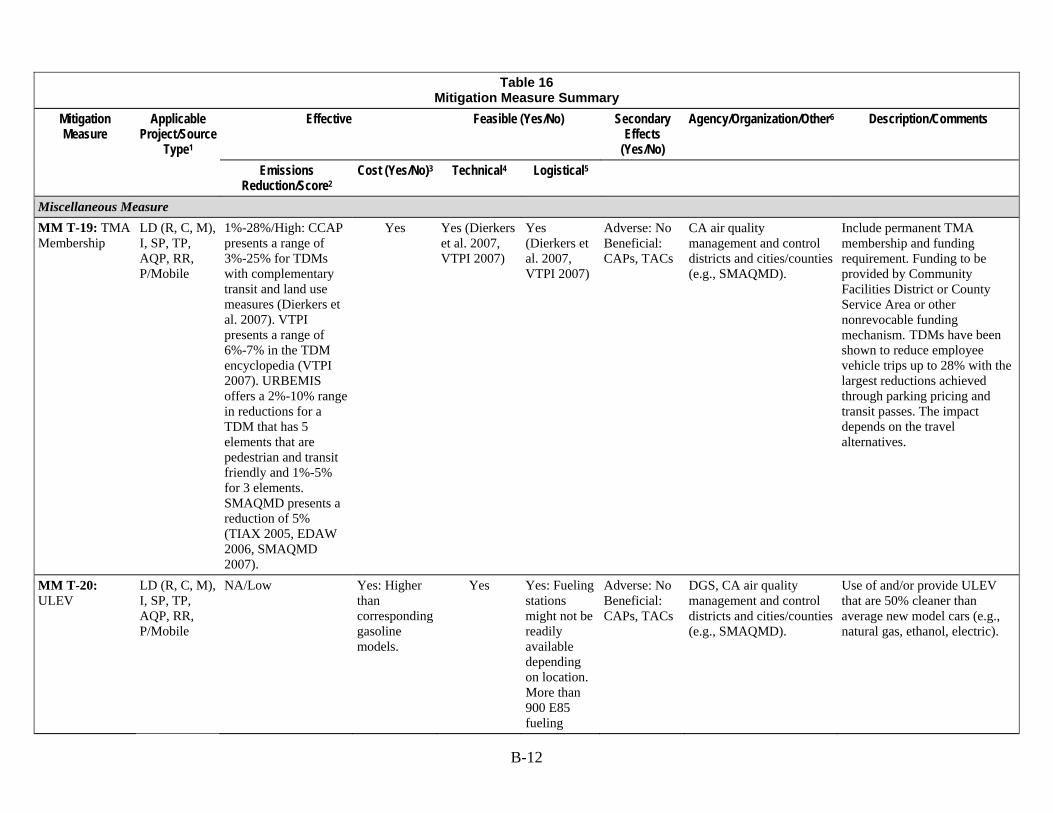
B-12
Table 16 Mitigation Measure Summary
Effective Feasible (Yes/No) Secondary Effects
(Yes/No)
Agency/Organization/Other6 Description/Comments Mitigation Measure
Applicable Project/Source
Type1 Emissions
Reduction/Score2 Cost (Yes/No)3 Technical4 Logistical5
Miscellaneous Measure
MM T-19: TMA Membership
LD (R, C, M), I, SP, TP, AQP, RR, P/Mobile
1%-28%/High: CCAP presents a range of 3%-25% for TDMs with complementary transit and land use measures (Dierkers et al. 2007). VTPI presents a range of 6%-7% in the TDM encyclopedia (VTPI 2007). URBEMIS offers a 2%-10% range in reductions for a TDM that has 5 elements that are pedestrian and transit friendly and 1%-5% for 3 elements. SMAQMD presents a reduction of 5% (TIAX 2005, EDAW 2006, SMAQMD 2007).
Yes Yes (Dierkers et al. 2007, VTPI 2007)
Yes (Dierkers et al. 2007, VTPI 2007)
Adverse: No Beneficial: CAPs, TACs
CA air quality management and control districts and cities/counties (e.g., SMAQMD).
Include permanent TMA membership and funding requirement. Funding to be provided by Community Facilities District or County Service Area or other nonrevocable funding mechanism. TDMs have been shown to reduce employee vehicle trips up to 28% with the largest reductions achieved through parking pricing and transit passes. The impact depends on the travel alternatives.
MM T-20: ULEV
LD (R, C, M), I, SP, TP, AQP, RR, P/Mobile
NA/Low Yes: Higher than corresponding gasoline models.
Yes Yes: Fueling stations might not be readily available depending on location. More than 900 E85 fueling
Adverse: No Beneficial: CAPs, TACs
DGS, CA air quality management and control districts and cities/counties (e.g., SMAQMD).
Use of and/or provide ULEV that are 50% cleaner than average new model cars (e.g., natural gas, ethanol, electric).
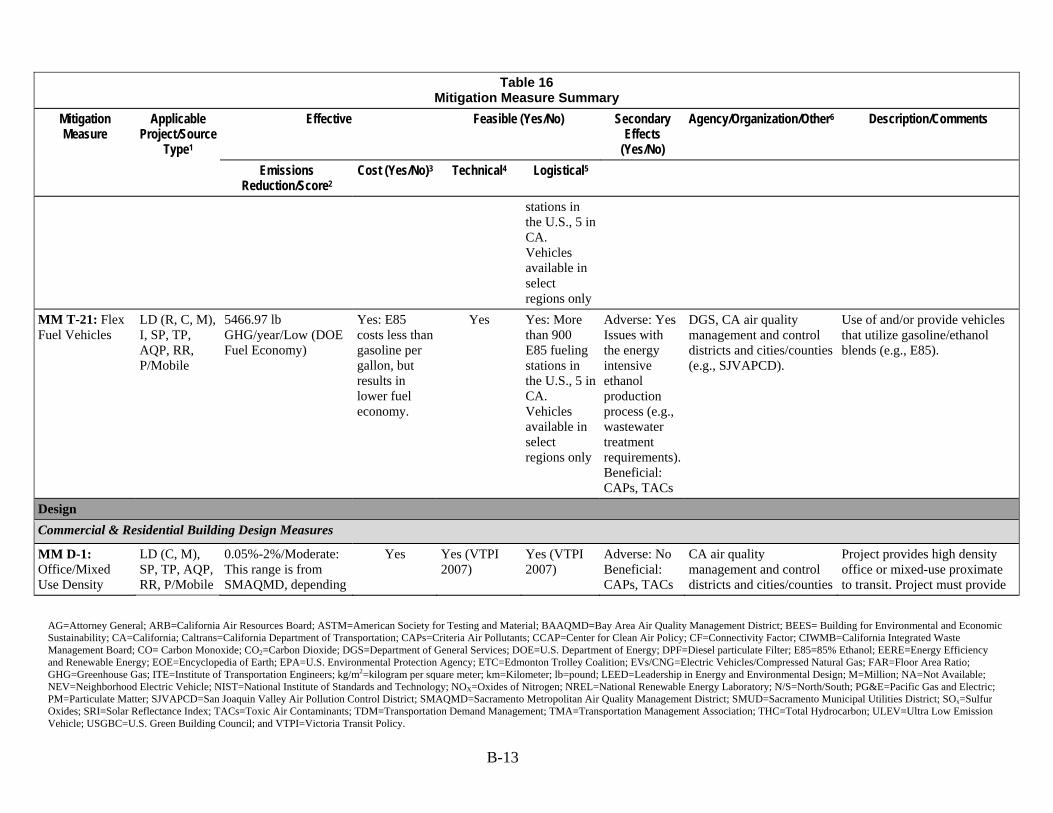
AG=Attorney General; ARB=California Air Resources Board; ASTM=American Society for Testing and Material; BAAQMD=Bay Area Air Quality Management District; BEES= Building for Environmental and Economic Sustainability; CA=California; Caltrans=California Department of Transportation; CAPs=Criteria Air Pollutants; CCAP=Center for Clean Air Policy; CF=Connectivity Factor; CIWMB=California Integrated Waste Management Board; CO= Carbon Monoxide; CO2=Carbon Dioxide; DGS=Department of General Services; DOE=U.S. Department of Energy; DPF=Diesel particulate Filter; E85=85% Ethanol; EERE=Energy Efficiency and Renewable Energy; EOE=Encyclopedia of Earth; EPA=U.S. Environmental Protection Agency; ETC=Edmonton Trolley Coalition; EVs/CNG=Electric Vehicles/Compressed Natural Gas; FAR=Floor Area Ratio; GHG=Greenhouse Gas; ITE=Institute of Transportation Engineers; kg/m2=kilogram per square meter; km=Kilometer; lb=pound; LEED=Leadership in Energy and Environmental Design; M=Million; NA=Not Available; NEV=Neighborhood Electric Vehicle; NIST=National Institute of Standards and Technology; NOX=Oxides of Nitrogen; NREL=National Renewable Energy Laboratory; N/S=North/South; PG&E=Pacific Gas and Electric; PM=Particulate Matter; SJVAPCD=San Joaquin Valley Air Pollution Control District; SMAQMD=Sacramento Metropolitan Air Quality Management District; SMUD=Sacramento Municipal Utilities District; SOx=Sulfur Oxides; SRI=Solar Reflectance Index; TACs=Toxic Air Contaminants; TDM=Transportation Demand Management; TMA=Transportation Management Association; THC=Total Hydrocarbon; ULEV=Ultra Low Emission Vehicle; USGBC=U.S. Green Building Council; and VTPI=Victoria Transit Policy. B-13
Table 16 Mitigation Measure Summary
Effective Feasible (Yes/No) Secondary Effects
(Yes/No)
Agency/Organization/Other6 Description/Comments Mitigation Measure
Applicable Project/Source
Type1 Emissions
Reduction/Score2 Cost (Yes/No)3 Technical4 Logistical5
stations in the U.S., 5 in CA. Vehicles available in select regions only
MM T-21: Flex Fuel Vehicles
LD (R, C, M), I, SP, TP, AQP, RR, P/Mobile
5466.97 lb GHG/year/Low (DOE Fuel Economy)
Yes: E85 costs less than gasoline per gallon, but results in lower fuel economy.
Yes Yes: More than 900 E85 fueling stations in the U.S., 5 in CA. Vehicles available in select regions only
Adverse: Yes Issues with the energy intensive ethanol production process (e.g., wastewater treatment requirements). Beneficial: CAPs, TACs
DGS, CA air quality management and control districts and cities/counties (e.g., SJVAPCD).
Use of and/or provide vehicles that utilize gasoline/ethanol blends (e.g., E85).
Design Commercial & Residential Building Design Measures
MM D-1: Office/Mixed Use Density
LD (C, M), SP, TP, AQP, RR, P/Mobile
0.05%-2%/Moderate: This range is from SMAQMD, depending
Yes Yes (VTPI 2007)
Yes (VTPI 2007)
Adverse: No Beneficial: CAPs, TACs
CA air quality management and control districts and cities/counties
Project provides high density office or mixed-use proximate to transit. Project must provide
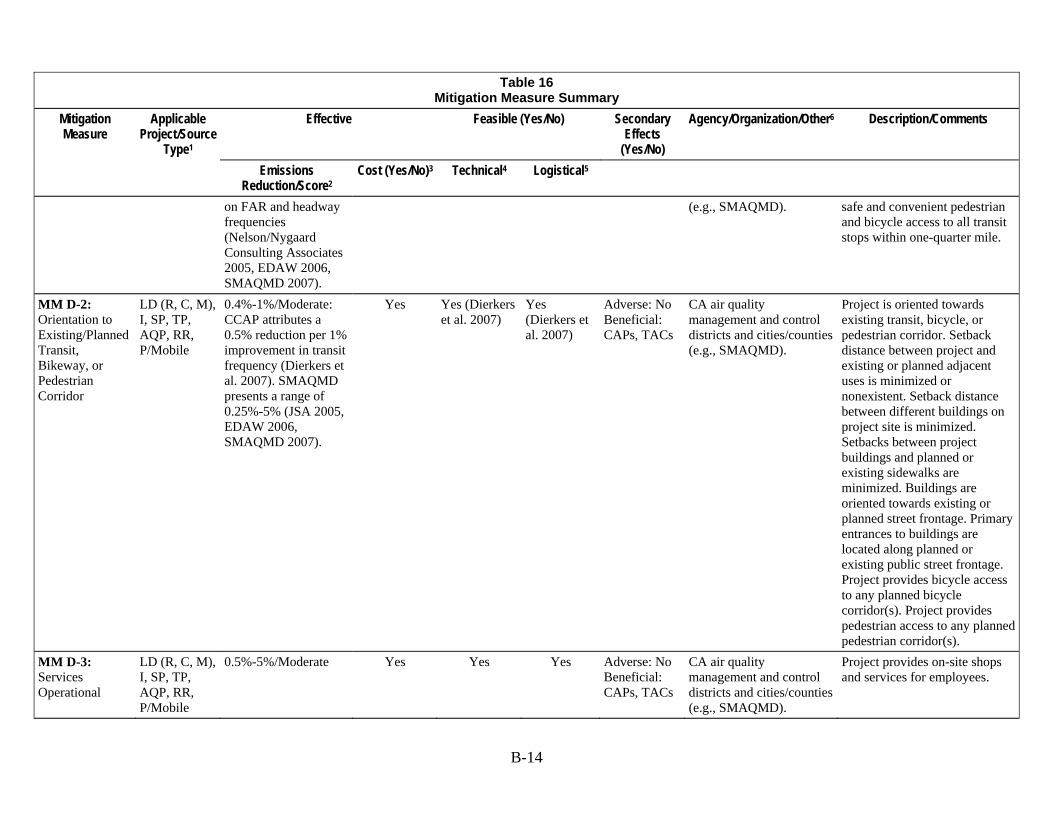
B-14
Table 16 Mitigation Measure Summary
Effective Feasible (Yes/No) Secondary Effects
(Yes/No)
Agency/Organization/Other6 Description/Comments Mitigation Measure
Applicable Project/Source
Type1 Emissions
Reduction/Score2 Cost (Yes/No)3 Technical4 Logistical5
on FAR and headway frequencies (Nelson/Nygaard Consulting Associates 2005, EDAW 2006, SMAQMD 2007).
(e.g., SMAQMD). safe and convenient pedestrian and bicycle access to all transit stops within one-quarter mile.
MM D-2: Orientation to Existing/Planned Transit, Bikeway, or Pedestrian Corridor
LD (R, C, M), I, SP, TP, AQP, RR, P/Mobile
0.4%-1%/Moderate: CCAP attributes a 0.5% reduction per 1% improvement in transit frequency (Dierkers et al. 2007). SMAQMD presents a range of 0.25%-5% (JSA 2005, EDAW 2006, SMAQMD 2007).
Yes Yes (Dierkers et al. 2007)
Yes (Dierkers et al. 2007)
Adverse: No Beneficial: CAPs, TACs
CA air quality management and control districts and cities/counties (e.g., SMAQMD).
Project is oriented towards existing transit, bicycle, or pedestrian corridor. Setback distance between project and existing or planned adjacent uses is minimized or nonexistent. Setback distance between different buildings on project site is minimized. Setbacks between project buildings and planned or existing sidewalks are minimized. Buildings are oriented towards existing or planned street frontage. Primary entrances to buildings are located along planned or existing public street frontage. Project provides bicycle access to any planned bicycle corridor(s). Project provides pedestrian access to any planned pedestrian corridor(s).
MM D-3: Services Operational
LD (R, C, M), I, SP, TP, AQP, RR, P/Mobile
0.5%-5%/Moderate Yes Yes Yes Adverse: No Beneficial: CAPs, TACs
CA air quality management and control districts and cities/counties (e.g., SMAQMD).
Project provides on-site shops and services for employees.
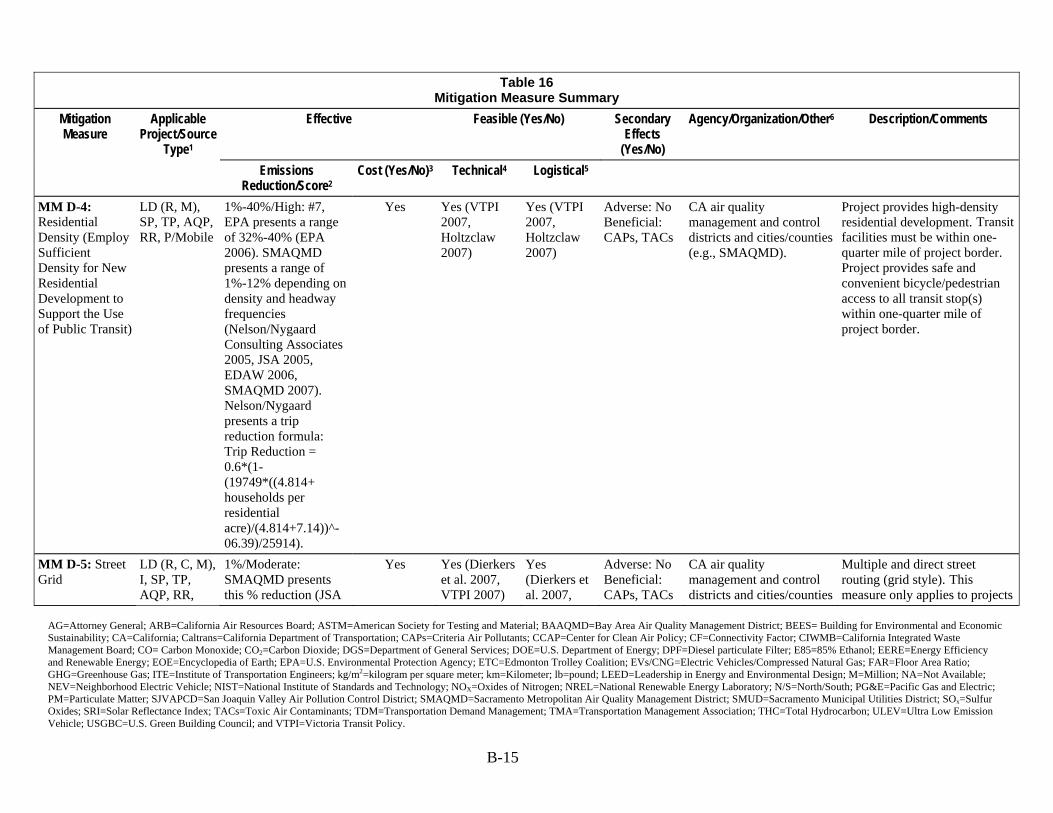
AG=Attorney General; ARB=California Air Resources Board; ASTM=American Society for Testing and Material; BAAQMD=Bay Area Air Quality Management District; BEES= Building for Environmental and Economic Sustainability; CA=California; Caltrans=California Department of Transportation; CAPs=Criteria Air Pollutants; CCAP=Center for Clean Air Policy; CF=Connectivity Factor; CIWMB=California Integrated Waste Management Board; CO= Carbon Monoxide; CO2=Carbon Dioxide; DGS=Department of General Services; DOE=U.S. Department of Energy; DPF=Diesel particulate Filter; E85=85% Ethanol; EERE=Energy Efficiency and Renewable Energy; EOE=Encyclopedia of Earth; EPA=U.S. Environmental Protection Agency; ETC=Edmonton Trolley Coalition; EVs/CNG=Electric Vehicles/Compressed Natural Gas; FAR=Floor Area Ratio; GHG=Greenhouse Gas; ITE=Institute of Transportation Engineers; kg/m2=kilogram per square meter; km=Kilometer; lb=pound; LEED=Leadership in Energy and Environmental Design; M=Million; NA=Not Available; NEV=Neighborhood Electric Vehicle; NIST=National Institute of Standards and Technology; NOX=Oxides of Nitrogen; NREL=National Renewable Energy Laboratory; N/S=North/South; PG&E=Pacific Gas and Electric; PM=Particulate Matter; SJVAPCD=San Joaquin Valley Air Pollution Control District; SMAQMD=Sacramento Metropolitan Air Quality Management District; SMUD=Sacramento Municipal Utilities District; SOx=Sulfur Oxides; SRI=Solar Reflectance Index; TACs=Toxic Air Contaminants; TDM=Transportation Demand Management; TMA=Transportation Management Association; THC=Total Hydrocarbon; ULEV=Ultra Low Emission Vehicle; USGBC=U.S. Green Building Council; and VTPI=Victoria Transit Policy. B-15
Table 16 Mitigation Measure Summary
Effective Feasible (Yes/No) Secondary Effects
(Yes/No)
Agency/Organization/Other6 Description/Comments Mitigation Measure
Applicable Project/Source
Type1 Emissions
Reduction/Score2 Cost (Yes/No)3 Technical4 Logistical5
MM D-4: Residential Density (Employ Sufficient Density for New Residential Development to Support the Use of Public Transit)
LD (R, M), SP, TP, AQP, RR, P/Mobile
1%-40%/High: #7, EPA presents a range of 32%-40% (EPA 2006). SMAQMD presents a range of 1%-12% depending on density and headway frequencies (Nelson/Nygaard Consulting Associates 2005, JSA 2005, EDAW 2006, SMAQMD 2007). Nelson/Nygaard presents a trip reduction formula: Trip Reduction = 0.6*(1-(19749*((4.814+ households per residential acre)/(4.814+7.14))^-06.39)/25914).
Yes Yes (VTPI 2007, Holtzclaw 2007)
Yes (VTPI 2007, Holtzclaw 2007)
Adverse: No Beneficial: CAPs, TACs
CA air quality management and control districts and cities/counties (e.g., SMAQMD).
Project provides high-density residential development. Transit facilities must be within one-quarter mile of project border. Project provides safe and convenient bicycle/pedestrian access to all transit stop(s) within one-quarter mile of project border.
MM D-5: Street Grid
LD (R, C, M), I, SP, TP, AQP, RR,
1%/Moderate: SMAQMD presents this % reduction (JSA
Yes Yes (Dierkers et al. 2007, VTPI 2007)
Yes (Dierkers et al. 2007,
Adverse: No Beneficial: CAPs, TACs
CA air quality management and control districts and cities/counties
Multiple and direct street routing (grid style). This measure only applies to projects
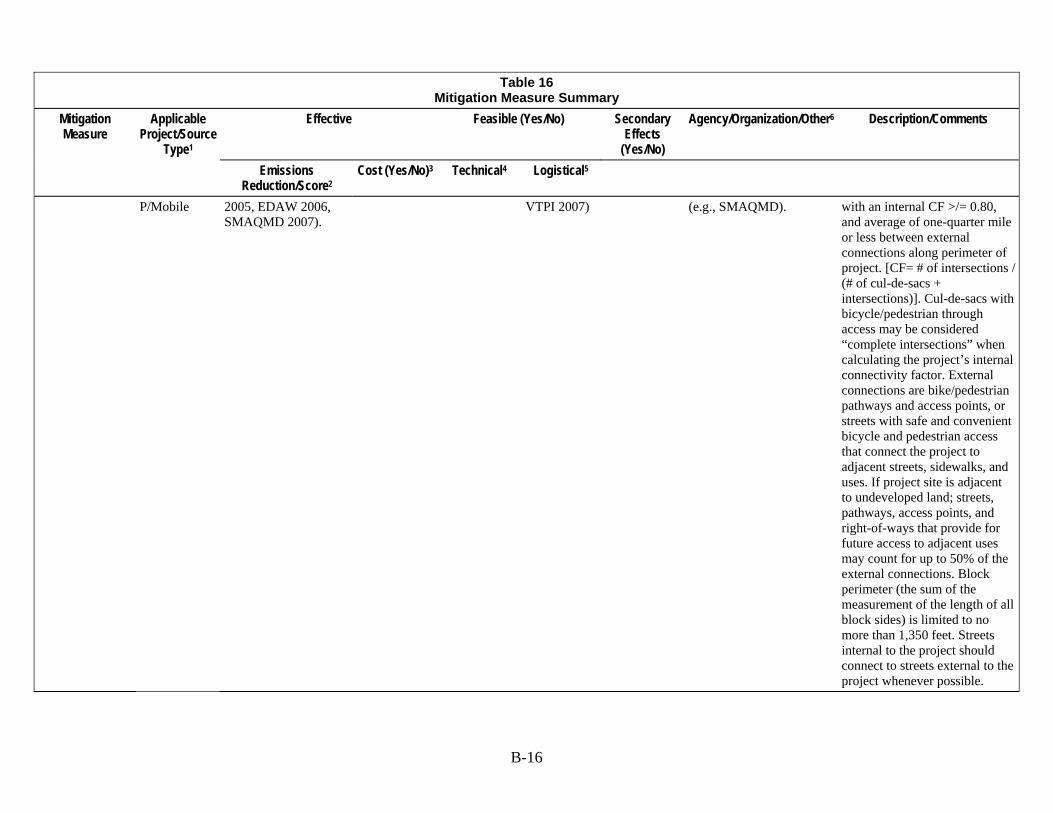
B-16
Table 16 Mitigation Measure Summary
Effective Feasible (Yes/No) Secondary Effects
(Yes/No)
Agency/Organization/Other6 Description/Comments Mitigation Measure
Applicable Project/Source
Type1 Emissions
Reduction/Score2 Cost (Yes/No)3 Technical4 Logistical5
P/Mobile 2005, EDAW 2006, SMAQMD 2007).
VTPI 2007) (e.g., SMAQMD). with an internal CF >/= 0.80, and average of one-quarter mile or less between external connections along perimeter of project. [CF= # of intersections / (# of cul-de-sacs + intersections)]. Cul-de-sacs with bicycle/pedestrian through access may be considered “complete intersections” when calculating the project’s internal connectivity factor. External connections are bike/pedestrian pathways and access points, or streets with safe and convenient bicycle and pedestrian access that connect the project to adjacent streets, sidewalks, and uses. If project site is adjacent to undeveloped land; streets, pathways, access points, and right-of-ways that provide for future access to adjacent uses may count for up to 50% of the external connections. Block perimeter (the sum of the measurement of the length of all block sides) is limited to no more than 1,350 feet. Streets internal to the project should connect to streets external to the project whenever possible.
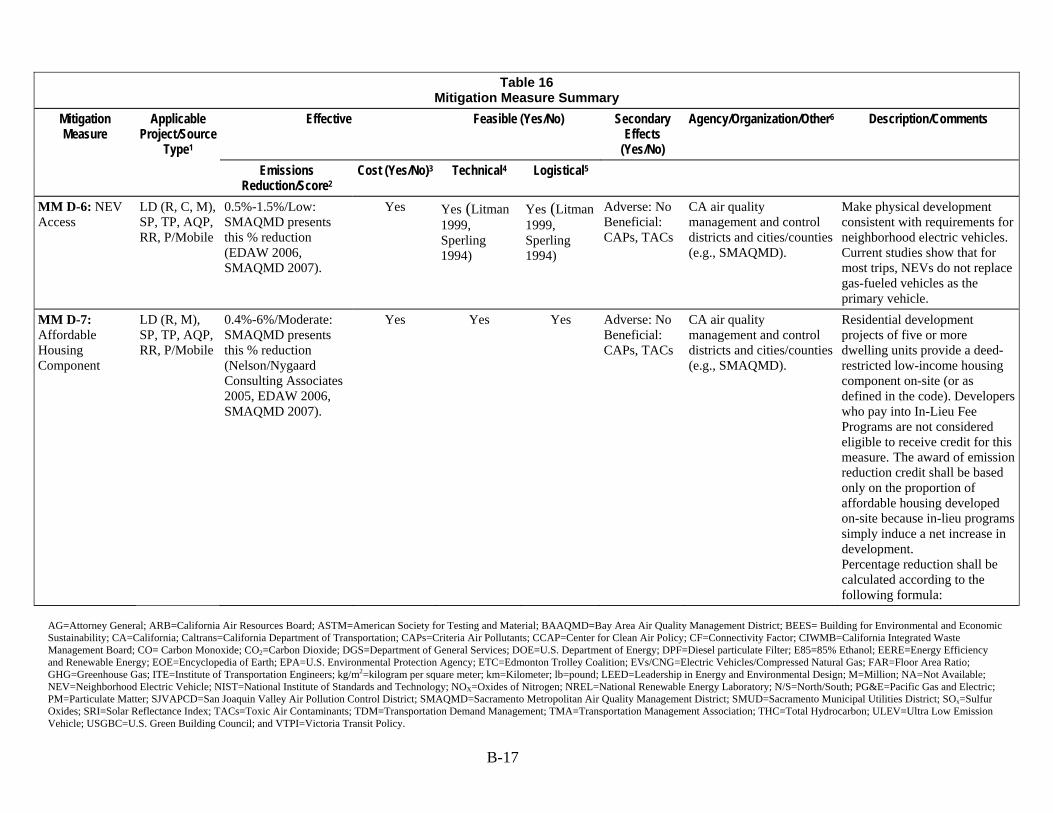
AG=Attorney General; ARB=California Air Resources Board; ASTM=American Society for Testing and Material; BAAQMD=Bay Area Air Quality Management District; BEES= Building for Environmental and Economic Sustainability; CA=California; Caltrans=California Department of Transportation; CAPs=Criteria Air Pollutants; CCAP=Center for Clean Air Policy; CF=Connectivity Factor; CIWMB=California Integrated Waste Management Board; CO= Carbon Monoxide; CO2=Carbon Dioxide; DGS=Department of General Services; DOE=U.S. Department of Energy; DPF=Diesel particulate Filter; E85=85% Ethanol; EERE=Energy Efficiency and Renewable Energy; EOE=Encyclopedia of Earth; EPA=U.S. Environmental Protection Agency; ETC=Edmonton Trolley Coalition; EVs/CNG=Electric Vehicles/Compressed Natural Gas; FAR=Floor Area Ratio; GHG=Greenhouse Gas; ITE=Institute of Transportation Engineers; kg/m2=kilogram per square meter; km=Kilometer; lb=pound; LEED=Leadership in Energy and Environmental Design; M=Million; NA=Not Available; NEV=Neighborhood Electric Vehicle; NIST=National Institute of Standards and Technology; NOX=Oxides of Nitrogen; NREL=National Renewable Energy Laboratory; N/S=North/South; PG&E=Pacific Gas and Electric; PM=Particulate Matter; SJVAPCD=San Joaquin Valley Air Pollution Control District; SMAQMD=Sacramento Metropolitan Air Quality Management District; SMUD=Sacramento Municipal Utilities District; SOx=Sulfur Oxides; SRI=Solar Reflectance Index; TACs=Toxic Air Contaminants; TDM=Transportation Demand Management; TMA=Transportation Management Association; THC=Total Hydrocarbon; ULEV=Ultra Low Emission Vehicle; USGBC=U.S. Green Building Council; and VTPI=Victoria Transit Policy. B-17
Table 16 Mitigation Measure Summary
Effective Feasible (Yes/No) Secondary Effects
(Yes/No)
Agency/Organization/Other6 Description/Comments Mitigation Measure
Applicable Project/Source
Type1 Emissions
Reduction/Score2 Cost (Yes/No)3 Technical4 Logistical5
MM D-6: NEV Access
LD (R, C, M), SP, TP, AQP, RR, P/Mobile
0.5%-1.5%/Low: SMAQMD presents this % reduction (EDAW 2006, SMAQMD 2007).
Yes Yes (Litman 1999, Sperling 1994)
Yes (Litman 1999, Sperling 1994)
Adverse: No Beneficial: CAPs, TACs
CA air quality management and control districts and cities/counties (e.g., SMAQMD).
Make physical development consistent with requirements for neighborhood electric vehicles. Current studies show that for most trips, NEVs do not replace gas-fueled vehicles as the primary vehicle.
MM D-7: Affordable Housing Component
LD (R, M), SP, TP, AQP, RR, P/Mobile
0.4%-6%/Moderate: SMAQMD presents this % reduction (Nelson/Nygaard Consulting Associates 2005, EDAW 2006, SMAQMD 2007).
Yes Yes Yes Adverse: No Beneficial: CAPs, TACs
CA air quality management and control districts and cities/counties (e.g., SMAQMD).
Residential development projects of five or more dwelling units provide a deed-restricted low-income housing component on-site (or as defined in the code). Developers who pay into In-Lieu Fee Programs are not considered eligible to receive credit for this measure. The award of emission reduction credit shall be based only on the proportion of affordable housing developed on-site because in-lieu programs simply induce a net increase in development. Percentage reduction shall be calculated according to the following formula:
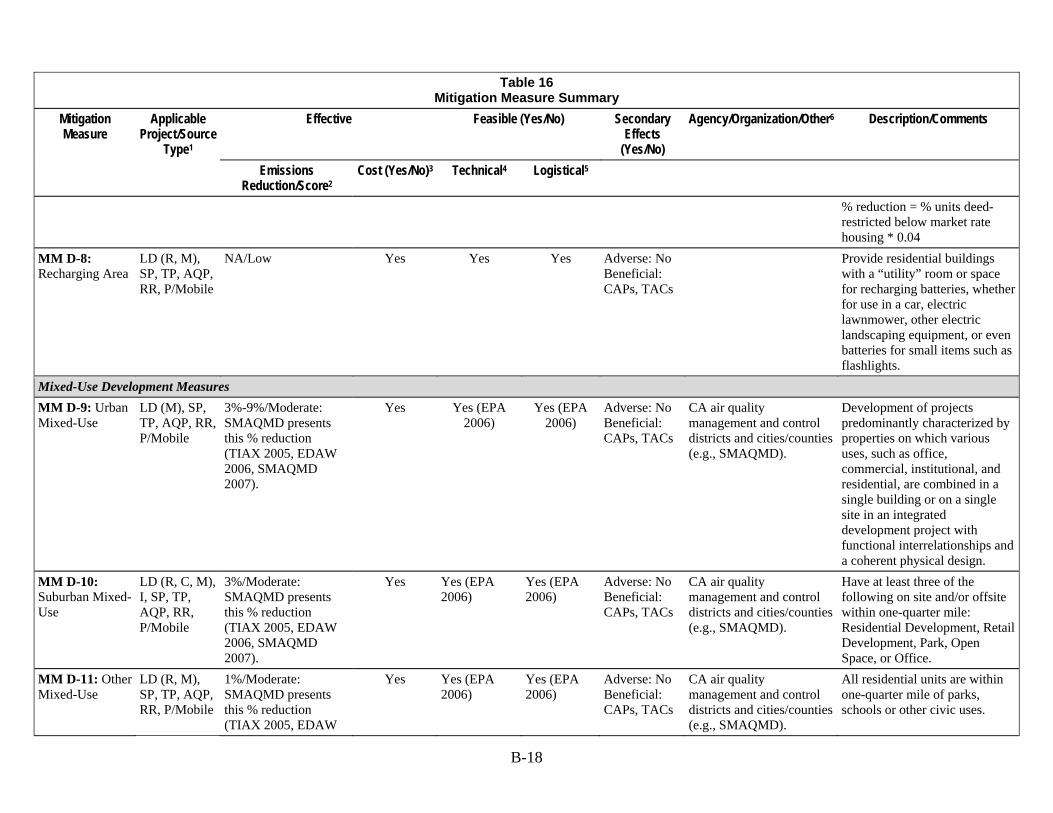
B-18
Table 16 Mitigation Measure Summary
Effective Feasible (Yes/No) Secondary Effects
(Yes/No)
Agency/Organization/Other6 Description/Comments Mitigation Measure
Applicable Project/Source
Type1 Emissions
Reduction/Score2 Cost (Yes/No)3 Technical4 Logistical5
% reduction = % units deed-restricted below market rate housing * 0.04
MM D-8: Recharging Area
LD (R, M), SP, TP, AQP, RR, P/Mobile
NA/Low Yes Yes Yes Adverse: No Beneficial: CAPs, TACs
Provide residential buildings with a “utility” room or space for recharging batteries, whether for use in a car, electric lawnmower, other electric landscaping equipment, or even batteries for small items such as flashlights.
Mixed-Use Development Measures
MM D-9: Urban Mixed-Use
LD (M), SP, TP, AQP, RR, P/Mobile
3%-9%/Moderate: SMAQMD presents this % reduction (TIAX 2005, EDAW 2006, SMAQMD 2007).
Yes Yes (EPA 2006)
Yes (EPA 2006)
Adverse: No Beneficial: CAPs, TACs
CA air quality management and control districts and cities/counties (e.g., SMAQMD).
Development of projects predominantly characterized by properties on which various uses, such as office, commercial, institutional, and residential, are combined in a single building or on a single site in an integrated development project with functional interrelationships and a coherent physical design.
MM D-10: Suburban Mixed-Use
LD (R, C, M), I, SP, TP, AQP, RR, P/Mobile
3%/Moderate: SMAQMD presents this % reduction (TIAX 2005, EDAW 2006, SMAQMD 2007).
Yes Yes (EPA 2006)
Yes (EPA 2006)
Adverse: No Beneficial: CAPs, TACs
CA air quality management and control districts and cities/counties (e.g., SMAQMD).
Have at least three of the following on site and/or offsite within one-quarter mile: Residential Development, Retail Development, Park, Open Space, or Office.
MM D-11: Other Mixed-Use
LD (R, M), SP, TP, AQP, RR, P/Mobile
1%/Moderate: SMAQMD presents this % reduction (TIAX 2005, EDAW
Yes Yes (EPA 2006)
Yes (EPA 2006)
Adverse: No Beneficial: CAPs, TACs
CA air quality management and control districts and cities/counties (e.g., SMAQMD).
All residential units are within one-quarter mile of parks, schools or other civic uses.
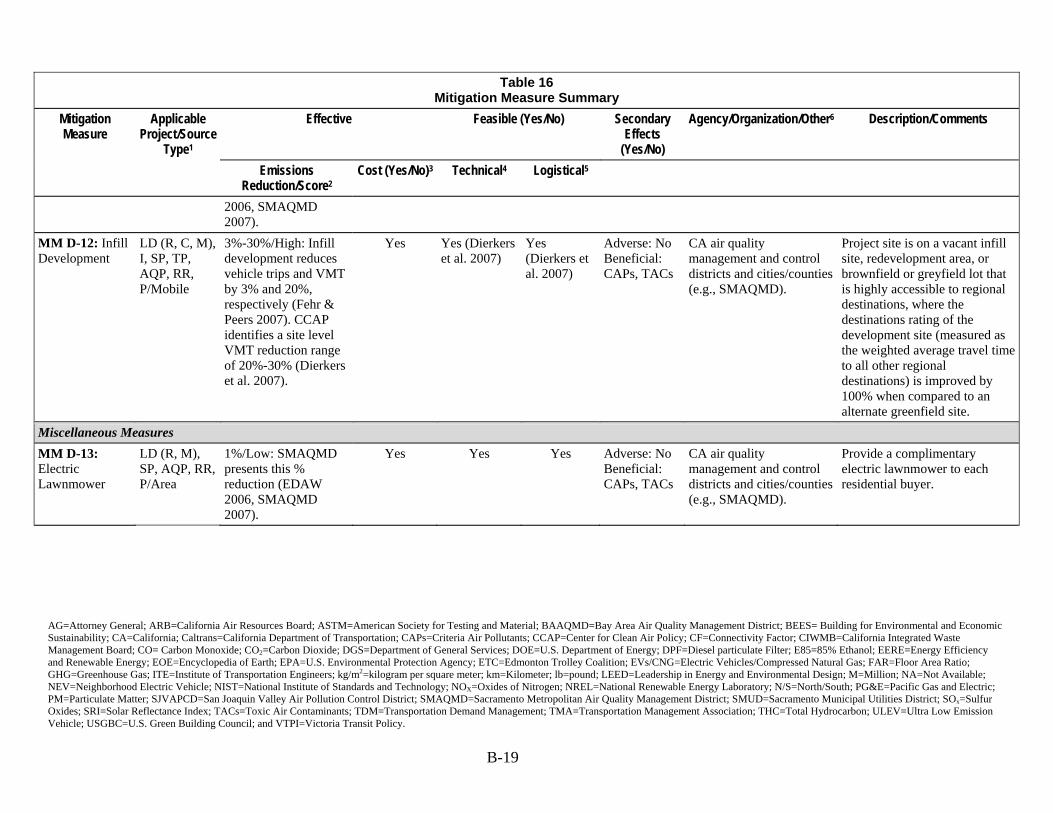
AG=Attorney General; ARB=California Air Resources Board; ASTM=American Society for Testing and Material; BAAQMD=Bay Area Air Quality Management District; BEES= Building for Environmental and Economic Sustainability; CA=California; Caltrans=California Department of Transportation; CAPs=Criteria Air Pollutants; CCAP=Center for Clean Air Policy; CF=Connectivity Factor; CIWMB=California Integrated Waste Management Board; CO= Carbon Monoxide; CO2=Carbon Dioxide; DGS=Department of General Services; DOE=U.S. Department of Energy; DPF=Diesel particulate Filter; E85=85% Ethanol; EERE=Energy Efficiency and Renewable Energy; EOE=Encyclopedia of Earth; EPA=U.S. Environmental Protection Agency; ETC=Edmonton Trolley Coalition; EVs/CNG=Electric Vehicles/Compressed Natural Gas; FAR=Floor Area Ratio; GHG=Greenhouse Gas; ITE=Institute of Transportation Engineers; kg/m2=kilogram per square meter; km=Kilometer; lb=pound; LEED=Leadership in Energy and Environmental Design; M=Million; NA=Not Available; NEV=Neighborhood Electric Vehicle; NIST=National Institute of Standards and Technology; NOX=Oxides of Nitrogen; NREL=National Renewable Energy Laboratory; N/S=North/South; PG&E=Pacific Gas and Electric; PM=Particulate Matter; SJVAPCD=San Joaquin Valley Air Pollution Control District; SMAQMD=Sacramento Metropolitan Air Quality Management District; SMUD=Sacramento Municipal Utilities District; SOx=Sulfur Oxides; SRI=Solar Reflectance Index; TACs=Toxic Air Contaminants; TDM=Transportation Demand Management; TMA=Transportation Management Association; THC=Total Hydrocarbon; ULEV=Ultra Low Emission Vehicle; USGBC=U.S. Green Building Council; and VTPI=Victoria Transit Policy. B-19
Table 16 Mitigation Measure Summary
Effective Feasible (Yes/No) Secondary Effects
(Yes/No)
Agency/Organization/Other6 Description/Comments Mitigation Measure
Applicable Project/Source
Type1 Emissions
Reduction/Score2 Cost (Yes/No)3 Technical4 Logistical5
2006, SMAQMD 2007).
MM D-12: Infill Development
LD (R, C, M), I, SP, TP, AQP, RR, P/Mobile
3%-30%/High: Infill development reduces vehicle trips and VMT by 3% and 20%, respectively (Fehr & Peers 2007). CCAP identifies a site level VMT reduction range of 20%-30% (Dierkers et al. 2007).
Yes Yes (Dierkers et al. 2007)
Yes (Dierkers et al. 2007)
Adverse: No Beneficial: CAPs, TACs
CA air quality management and control districts and cities/counties (e.g., SMAQMD).
Project site is on a vacant infill site, redevelopment area, or brownfield or greyfield lot that is highly accessible to regional destinations, where the destinations rating of the development site (measured as the weighted average travel time to all other regional destinations) is improved by 100% when compared to an alternate greenfield site.
Miscellaneous Measures
MM D-13: Electric Lawnmower
LD (R, M), SP, AQP, RR, P/Area
1%/Low: SMAQMD presents this % reduction (EDAW 2006, SMAQMD 2007).
Yes Yes Yes Adverse: No Beneficial: CAPs, TACs
CA air quality management and control districts and cities/counties (e.g., SMAQMD).
Provide a complimentary electric lawnmower to each residential buyer.
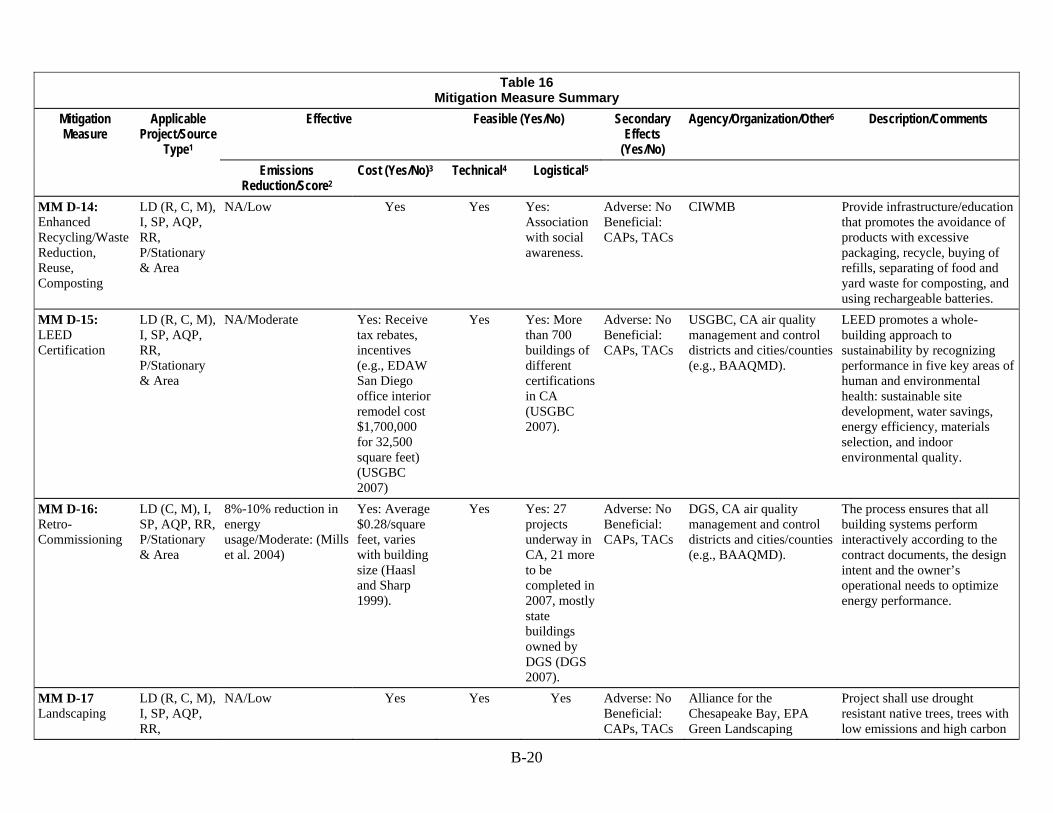
B-20
Table 16 Mitigation Measure Summary
Effective Feasible (Yes/No) Secondary Effects
(Yes/No)
Agency/Organization/Other6 Description/Comments Mitigation Measure
Applicable Project/Source
Type1 Emissions
Reduction/Score2 Cost (Yes/No)3 Technical4 Logistical5
MM D-14: Enhanced Recycling/Waste Reduction, Reuse, Composting
LD (R, C, M), I, SP, AQP, RR, P/Stationary & Area
NA/Low Yes Yes Yes: Association with social awareness.
Adverse: No Beneficial: CAPs, TACs
CIWMB Provide infrastructure/education that promotes the avoidance of products with excessive packaging, recycle, buying of refills, separating of food and yard waste for composting, and using rechargeable batteries.
MM D-15: LEED Certification
LD (R, C, M), I, SP, AQP, RR, P/Stationary & Area
NA/Moderate Yes: Receive tax rebates, incentives (e.g., EDAW San Diego office interior remodel cost $1,700,000 for 32,500 square feet) (USGBC 2007)
Yes Yes: More than 700 buildings of different certifications in CA (USGBC 2007).
Adverse: No Beneficial: CAPs, TACs
USGBC, CA air quality management and control districts and cities/counties (e.g., BAAQMD).
LEED promotes a whole-building approach to sustainability by recognizing performance in five key areas of human and environmental health: sustainable site development, water savings, energy efficiency, materials selection, and indoor environmental quality.
MM D-16: Retro-Commissioning
LD (C, M), I, SP, AQP, RR, P/Stationary & Area
8%-10% reduction in energy usage/Moderate: (Mills et al. 2004)
Yes: Average $0.28/square
feet, varies with building size (Haasl and Sharp 1999).
Yes Yes: 27 projects underway in CA, 21 more to be completed in 2007, mostly state buildings owned by DGS (DGS 2007).
Adverse: No Beneficial: CAPs, TACs
DGS, CA air quality management and control districts and cities/counties (e.g., BAAQMD).
The process ensures that all building systems perform interactively according to the contract documents, the design intent and the owner’s operational needs to optimize energy performance.
MM D-17 Landscaping
LD (R, C, M), I, SP, AQP, RR,
NA/Low Yes Yes Yes Adverse: No Beneficial: CAPs, TACs
Alliance for the Chesapeake Bay, EPA Green Landscaping
Project shall use drought resistant native trees, trees with low emissions and high carbon
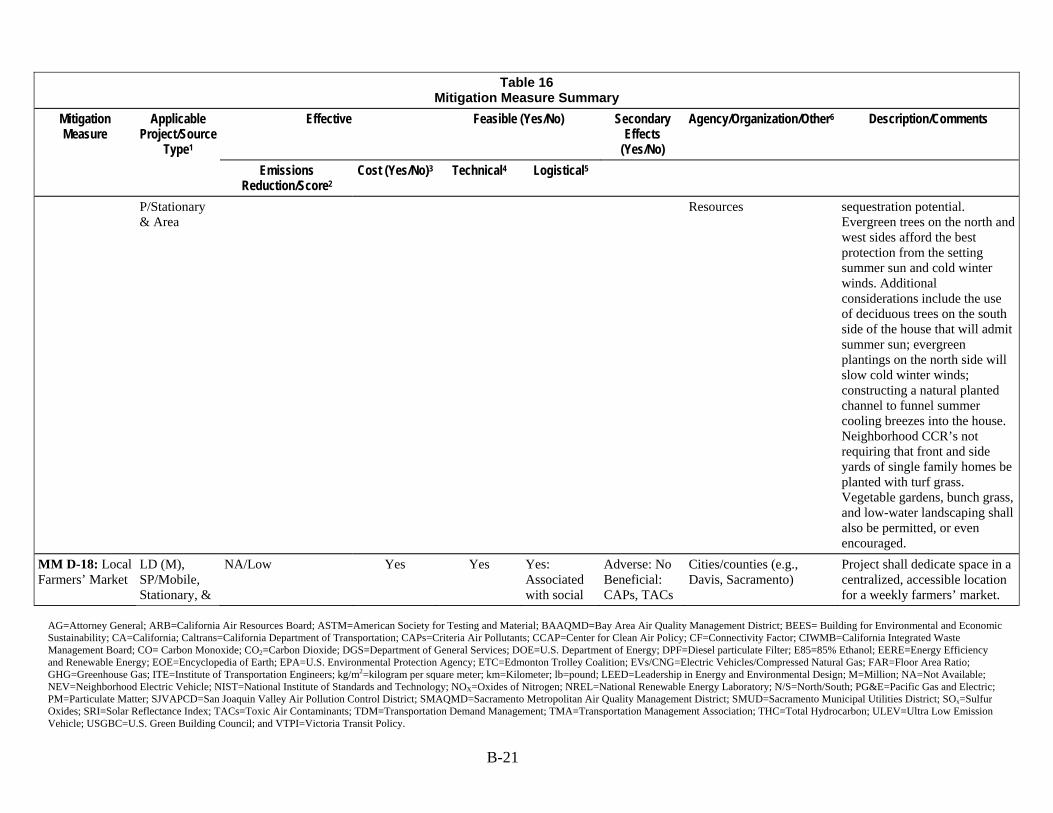
AG=Attorney General; ARB=California Air Resources Board; ASTM=American Society for Testing and Material; BAAQMD=Bay Area Air Quality Management District; BEES= Building for Environmental and Economic Sustainability; CA=California; Caltrans=California Department of Transportation; CAPs=Criteria Air Pollutants; CCAP=Center for Clean Air Policy; CF=Connectivity Factor; CIWMB=California Integrated Waste Management Board; CO= Carbon Monoxide; CO2=Carbon Dioxide; DGS=Department of General Services; DOE=U.S. Department of Energy; DPF=Diesel particulate Filter; E85=85% Ethanol; EERE=Energy Efficiency and Renewable Energy; EOE=Encyclopedia of Earth; EPA=U.S. Environmental Protection Agency; ETC=Edmonton Trolley Coalition; EVs/CNG=Electric Vehicles/Compressed Natural Gas; FAR=Floor Area Ratio; GHG=Greenhouse Gas; ITE=Institute of Transportation Engineers; kg/m2=kilogram per square meter; km=Kilometer; lb=pound; LEED=Leadership in Energy and Environmental Design; M=Million; NA=Not Available; NEV=Neighborhood Electric Vehicle; NIST=National Institute of Standards and Technology; NOX=Oxides of Nitrogen; NREL=National Renewable Energy Laboratory; N/S=North/South; PG&E=Pacific Gas and Electric; PM=Particulate Matter; SJVAPCD=San Joaquin Valley Air Pollution Control District; SMAQMD=Sacramento Metropolitan Air Quality Management District; SMUD=Sacramento Municipal Utilities District; SOx=Sulfur Oxides; SRI=Solar Reflectance Index; TACs=Toxic Air Contaminants; TDM=Transportation Demand Management; TMA=Transportation Management Association; THC=Total Hydrocarbon; ULEV=Ultra Low Emission Vehicle; USGBC=U.S. Green Building Council; and VTPI=Victoria Transit Policy. B-21
Table 16 Mitigation Measure Summary
Effective Feasible (Yes/No) Secondary Effects
(Yes/No)
Agency/Organization/Other6 Description/Comments Mitigation Measure
Applicable Project/Source
Type1 Emissions
Reduction/Score2 Cost (Yes/No)3 Technical4 Logistical5
P/Stationary & Area
Resources sequestration potential. Evergreen trees on the north and west sides afford the best protection from the setting summer sun and cold winter winds. Additional considerations include the use of deciduous trees on the south side of the house that will admit summer sun; evergreen plantings on the north side will slow cold winter winds; constructing a natural planted channel to funnel summer cooling breezes into the house. Neighborhood CCR’s not requiring that front and side yards of single family homes be planted with turf grass. Vegetable gardens, bunch grass, and low-water landscaping shall also be permitted, or even encouraged.
MM D-18: Local Farmers’ Market
LD (M), SP/Mobile, Stationary, &
NA/Low Yes Yes Yes: Associated with social
Adverse: No Beneficial: CAPs, TACs
Cities/counties (e.g., Davis, Sacramento)
Project shall dedicate space in a centralized, accessible location for a weekly farmers’ market.

B-22
Table 16 Mitigation Measure Summary
Effective Feasible (Yes/No) Secondary Effects
(Yes/No)
Agency/Organization/Other6 Description/Comments Mitigation Measure
Applicable Project/Source
Type1 Emissions
Reduction/Score2 Cost (Yes/No)3 Technical4 Logistical5
Area choice and public awareness.
MM D-19: Community Gardens
LD (M), SP/Mobile, Stationary, & Area
NA/Low Yes Yes Yes: Associated with social choice and public awareness.
Adverse: No Beneficial: CAPs, TACs
Cities/counties (e.g., Davis)
Project shall dedicate space for community gardens.
Energy Efficiency/Building Component MM E-1: High-Efficiency Pumps
LD (R, C, M), SP, AQP, RR, P/Stationary & Area
NA/Low Yes Yes Yes Adverse: No Beneficial: CAPs, TACs
CA air quality management and control districts and cities/counties (e.g., BAAQMD).
Project shall use high-efficiency pumps.
MM E-2: Wood Burning Fireplaces/Stoves
LD (R, M), SP, AQP, RR, P/Stationary & Area
NA/Low: EDAW 2006 Yes Yes Yes Adverse: No Beneficial: CAPs, TACs
CA air quality management and control districts and cities/counties (e.g., SMAQMD).
Project does not feature fireplaces or wood burning stoves.
MM E-3: Natural Gas Stove
LD (R, M), SP, AQP, RR, P/Stationary & Area
NA/Low: EDAW 2006 Yes: Cost of stove—$350 (gas) and $360 (electric) same brand, total yearly cost of $42.17 as opposed to $56.65 for electric (Saving Electricity 2006).
Yes Yes Adverse: No Beneficial: CAPs, TACs
CA air quality management and control districts and cities/counties (e.g., SMAQMD).
Project features only natural gas or electric stoves in residences.
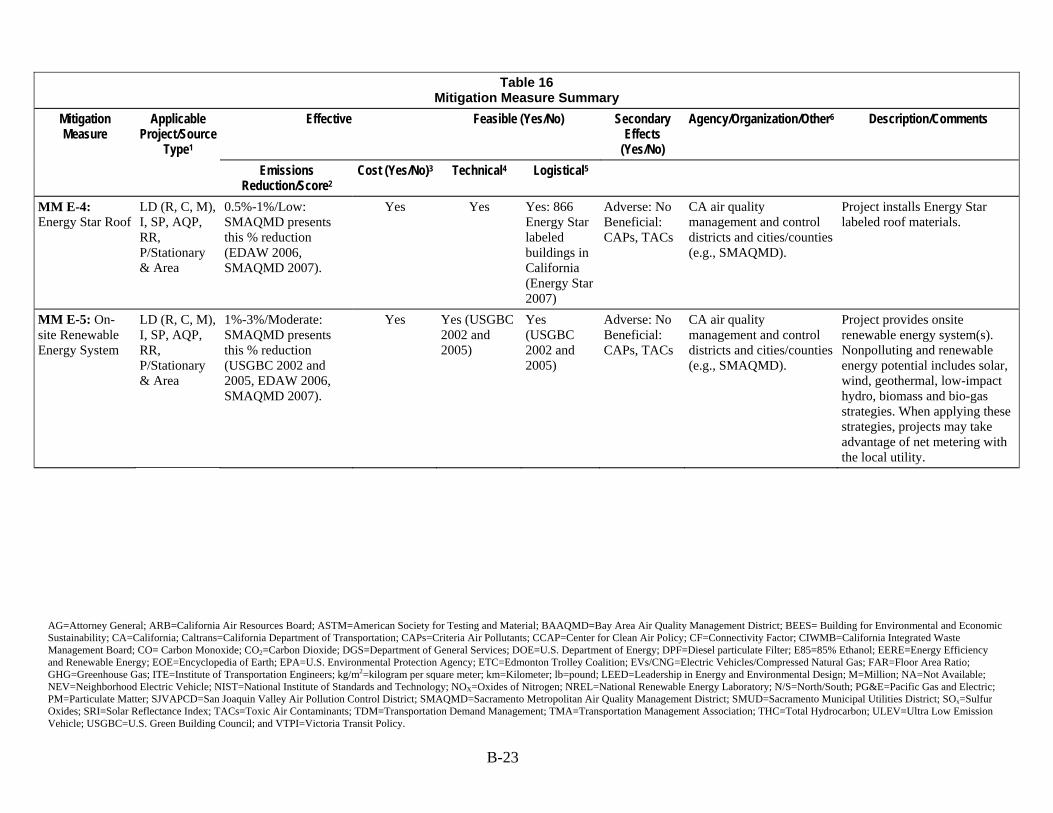
AG=Attorney General; ARB=California Air Resources Board; ASTM=American Society for Testing and Material; BAAQMD=Bay Area Air Quality Management District; BEES= Building for Environmental and Economic Sustainability; CA=California; Caltrans=California Department of Transportation; CAPs=Criteria Air Pollutants; CCAP=Center for Clean Air Policy; CF=Connectivity Factor; CIWMB=California Integrated Waste Management Board; CO= Carbon Monoxide; CO2=Carbon Dioxide; DGS=Department of General Services; DOE=U.S. Department of Energy; DPF=Diesel particulate Filter; E85=85% Ethanol; EERE=Energy Efficiency and Renewable Energy; EOE=Encyclopedia of Earth; EPA=U.S. Environmental Protection Agency; ETC=Edmonton Trolley Coalition; EVs/CNG=Electric Vehicles/Compressed Natural Gas; FAR=Floor Area Ratio; GHG=Greenhouse Gas; ITE=Institute of Transportation Engineers; kg/m2=kilogram per square meter; km=Kilometer; lb=pound; LEED=Leadership in Energy and Environmental Design; M=Million; NA=Not Available; NEV=Neighborhood Electric Vehicle; NIST=National Institute of Standards and Technology; NOX=Oxides of Nitrogen; NREL=National Renewable Energy Laboratory; N/S=North/South; PG&E=Pacific Gas and Electric; PM=Particulate Matter; SJVAPCD=San Joaquin Valley Air Pollution Control District; SMAQMD=Sacramento Metropolitan Air Quality Management District; SMUD=Sacramento Municipal Utilities District; SOx=Sulfur Oxides; SRI=Solar Reflectance Index; TACs=Toxic Air Contaminants; TDM=Transportation Demand Management; TMA=Transportation Management Association; THC=Total Hydrocarbon; ULEV=Ultra Low Emission Vehicle; USGBC=U.S. Green Building Council; and VTPI=Victoria Transit Policy. B-23
Table 16 Mitigation Measure Summary
Effective Feasible (Yes/No) Secondary Effects
(Yes/No)
Agency/Organization/Other6 Description/Comments Mitigation Measure
Applicable Project/Source
Type1 Emissions
Reduction/Score2 Cost (Yes/No)3 Technical4 Logistical5
MM E-4: Energy Star Roof
LD (R, C, M), I, SP, AQP, RR, P/Stationary & Area
0.5%-1%/Low: SMAQMD presents this % reduction (EDAW 2006, SMAQMD 2007).
Yes Yes Yes: 866 Energy Star labeled buildings in California (Energy Star 2007)
Adverse: No Beneficial: CAPs, TACs
CA air quality management and control districts and cities/counties (e.g., SMAQMD).
Project installs Energy Star labeled roof materials.
MM E-5: On-site Renewable Energy System
LD (R, C, M), I, SP, AQP, RR, P/Stationary & Area
1%-3%/Moderate: SMAQMD presents this % reduction (USGBC 2002 and 2005, EDAW 2006, SMAQMD 2007).
Yes Yes (USGBC 2002 and 2005)
Yes (USGBC 2002 and 2005)
Adverse: No Beneficial: CAPs, TACs
CA air quality management and control districts and cities/counties (e.g., SMAQMD).
Project provides onsite renewable energy system(s). Nonpolluting and renewable energy potential includes solar, wind, geothermal, low-impact hydro, biomass and bio-gas strategies. When applying these strategies, projects may take advantage of net metering with the local utility.
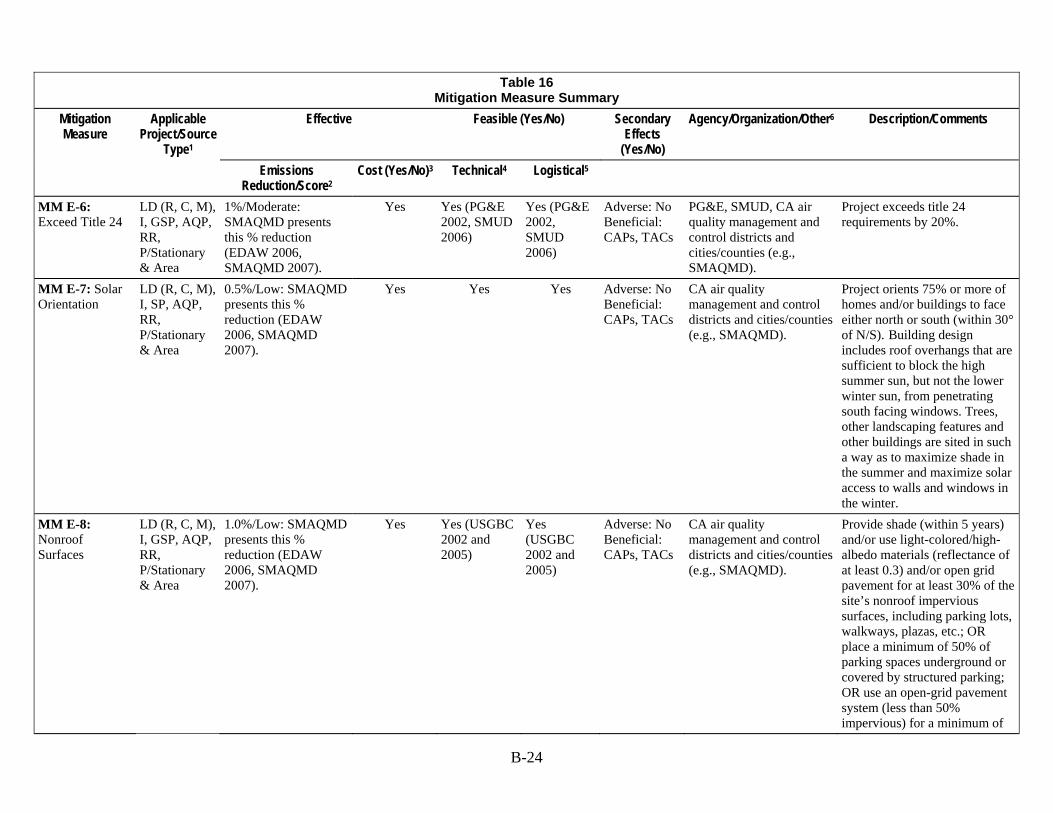
B-24
Table 16 Mitigation Measure Summary
Effective Feasible (Yes/No) Secondary Effects
(Yes/No)
Agency/Organization/Other6 Description/Comments Mitigation Measure
Applicable Project/Source
Type1 Emissions
Reduction/Score2 Cost (Yes/No)3 Technical4 Logistical5
MM E-6: Exceed Title 24
LD (R, C, M), I, GSP, AQP, RR, P/Stationary & Area
1%/Moderate: SMAQMD presents this % reduction (EDAW 2006, SMAQMD 2007).
Yes Yes (PG&E 2002, SMUD 2006)
Yes (PG&E 2002, SMUD 2006)
Adverse: No Beneficial: CAPs, TACs
PG&E, SMUD, CA air quality management and control districts and cities/counties (e.g., SMAQMD).
Project exceeds title 24 requirements by 20%.
MM E-7: Solar Orientation
LD (R, C, M), I, SP, AQP, RR, P/Stationary & Area
0.5%/Low: SMAQMD presents this % reduction (EDAW 2006, SMAQMD 2007).
Yes Yes Yes Adverse: No Beneficial: CAPs, TACs
CA air quality management and control districts and cities/counties (e.g., SMAQMD).
Project orients 75% or more of homes and/or buildings to face either north or south (within 30° of N/S). Building design includes roof overhangs that are sufficient to block the high summer sun, but not the lower winter sun, from penetrating south facing windows. Trees, other landscaping features and other buildings are sited in such a way as to maximize shade in the summer and maximize solar access to walls and windows in the winter.
MM E-8: Nonroof Surfaces
LD (R, C, M), I, GSP, AQP, RR, P/Stationary & Area
1.0%/Low: SMAQMD presents this % reduction (EDAW 2006, SMAQMD 2007).
Yes Yes (USGBC 2002 and 2005)
Yes (USGBC 2002 and 2005)
Adverse: No Beneficial: CAPs, TACs
CA air quality management and control districts and cities/counties (e.g., SMAQMD).
Provide shade (within 5 years) and/or use light-colored/high-albedo materials (reflectance of at least 0.3) and/or open grid pavement for at least 30% of the site’s nonroof impervious surfaces, including parking lots, walkways, plazas, etc.; OR place a minimum of 50% of parking spaces underground or covered by structured parking; OR use an open-grid pavement system (less than 50% impervious) for a minimum of
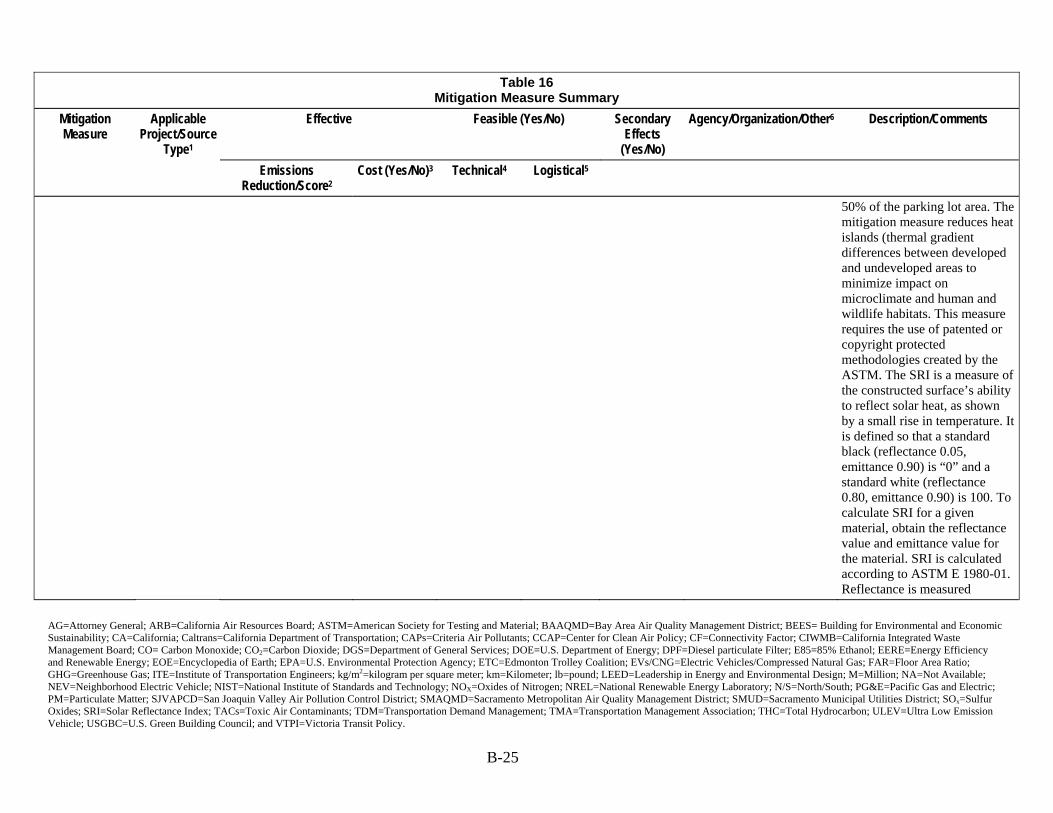
AG=Attorney General; ARB=California Air Resources Board; ASTM=American Society for Testing and Material; BAAQMD=Bay Area Air Quality Management District; BEES= Building for Environmental and Economic Sustainability; CA=California; Caltrans=California Department of Transportation; CAPs=Criteria Air Pollutants; CCAP=Center for Clean Air Policy; CF=Connectivity Factor; CIWMB=California Integrated Waste Management Board; CO= Carbon Monoxide; CO2=Carbon Dioxide; DGS=Department of General Services; DOE=U.S. Department of Energy; DPF=Diesel particulate Filter; E85=85% Ethanol; EERE=Energy Efficiency and Renewable Energy; EOE=Encyclopedia of Earth; EPA=U.S. Environmental Protection Agency; ETC=Edmonton Trolley Coalition; EVs/CNG=Electric Vehicles/Compressed Natural Gas; FAR=Floor Area Ratio; GHG=Greenhouse Gas; ITE=Institute of Transportation Engineers; kg/m2=kilogram per square meter; km=Kilometer; lb=pound; LEED=Leadership in Energy and Environmental Design; M=Million; NA=Not Available; NEV=Neighborhood Electric Vehicle; NIST=National Institute of Standards and Technology; NOX=Oxides of Nitrogen; NREL=National Renewable Energy Laboratory; N/S=North/South; PG&E=Pacific Gas and Electric; PM=Particulate Matter; SJVAPCD=San Joaquin Valley Air Pollution Control District; SMAQMD=Sacramento Metropolitan Air Quality Management District; SMUD=Sacramento Municipal Utilities District; SOx=Sulfur Oxides; SRI=Solar Reflectance Index; TACs=Toxic Air Contaminants; TDM=Transportation Demand Management; TMA=Transportation Management Association; THC=Total Hydrocarbon; ULEV=Ultra Low Emission Vehicle; USGBC=U.S. Green Building Council; and VTPI=Victoria Transit Policy. B-25
Table 16 Mitigation Measure Summary
Effective Feasible (Yes/No) Secondary Effects
(Yes/No)
Agency/Organization/Other6 Description/Comments Mitigation Measure
Applicable Project/Source
Type1 Emissions
Reduction/Score2 Cost (Yes/No)3 Technical4 Logistical5
50% of the parking lot area. The mitigation measure reduces heat islands (thermal gradient differences between developed and undeveloped areas to minimize impact on microclimate and human and wildlife habitats. This measure requires the use of patented or copyright protected methodologies created by the ASTM. The SRI is a measure of the constructed surface’s ability to reflect solar heat, as shown by a small rise in temperature. It is defined so that a standard black (reflectance 0.05, emittance 0.90) is “0” and a standard white (reflectance 0.80, emittance 0.90) is 100. To calculate SRI for a given material, obtain the reflectance value and emittance value for the material. SRI is calculated according to ASTM E 1980-01. Reflectance is measured
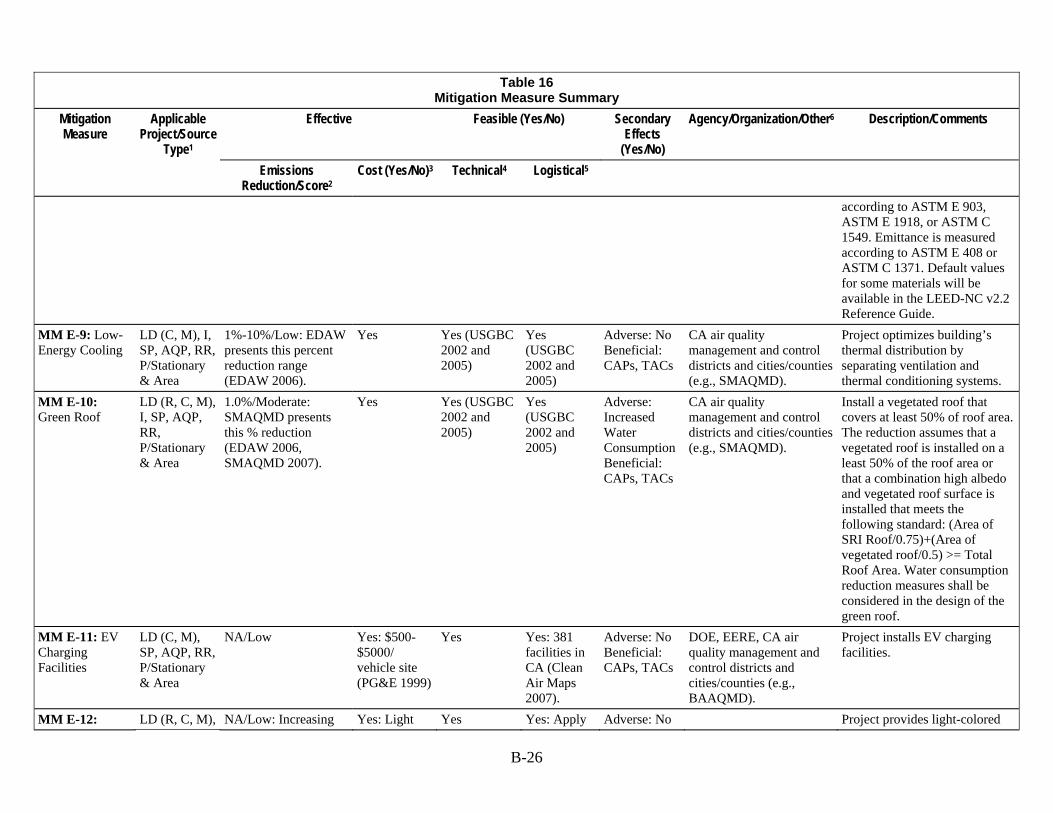
B-26
Table 16 Mitigation Measure Summary
Effective Feasible (Yes/No) Secondary Effects
(Yes/No)
Agency/Organization/Other6 Description/Comments Mitigation Measure
Applicable Project/Source
Type1 Emissions
Reduction/Score2 Cost (Yes/No)3 Technical4 Logistical5
according to ASTM E 903, ASTM E 1918, or ASTM C 1549. Emittance is measured according to ASTM E 408 or ASTM C 1371. Default values for some materials will be available in the LEED-NC v2.2 Reference Guide.
MM E-9: Low-Energy Cooling
LD (C, M), I, SP, AQP, RR, P/Stationary & Area
1%-10%/Low: EDAW presents this percent reduction range (EDAW 2006).
Yes Yes (USGBC 2002 and 2005)
Yes (USGBC 2002 and 2005)
Adverse: No Beneficial: CAPs, TACs
CA air quality management and control districts and cities/counties (e.g., SMAQMD).
Project optimizes building’s thermal distribution by separating ventilation and thermal conditioning systems.
MM E-10: Green Roof
LD (R, C, M), I, SP, AQP, RR, P/Stationary & Area
1.0%/Moderate: SMAQMD presents this % reduction (EDAW 2006, SMAQMD 2007).
Yes Yes (USGBC 2002 and 2005)
Yes (USGBC 2002 and 2005)
Adverse: Increased Water Consumption Beneficial: CAPs, TACs
CA air quality management and control districts and cities/counties (e.g., SMAQMD).
Install a vegetated roof that covers at least 50% of roof area. The reduction assumes that a vegetated roof is installed on a least 50% of the roof area or that a combination high albedo and vegetated roof surface is installed that meets the following standard: (Area of SRI Roof/0.75)+(Area of vegetated roof/0.5) >= Total Roof Area. Water consumption reduction measures shall be considered in the design of the green roof.
MM E-11: EV Charging Facilities
LD (C, M), SP, AQP, RR, P/Stationary & Area
NA/Low Yes: $500-$5000/ vehicle site (PG&E 1999)
Yes Yes: 381 facilities in CA (Clean Air Maps 2007).
Adverse: No Beneficial: CAPs, TACs
DOE, EERE, CA air quality management and control districts and cities/counties (e.g., BAAQMD).
Project installs EV charging facilities.
MM E-12: LD (R, C, M), NA/Low: Increasing Yes: Light Yes Yes: Apply Adverse: No Project provides light-colored
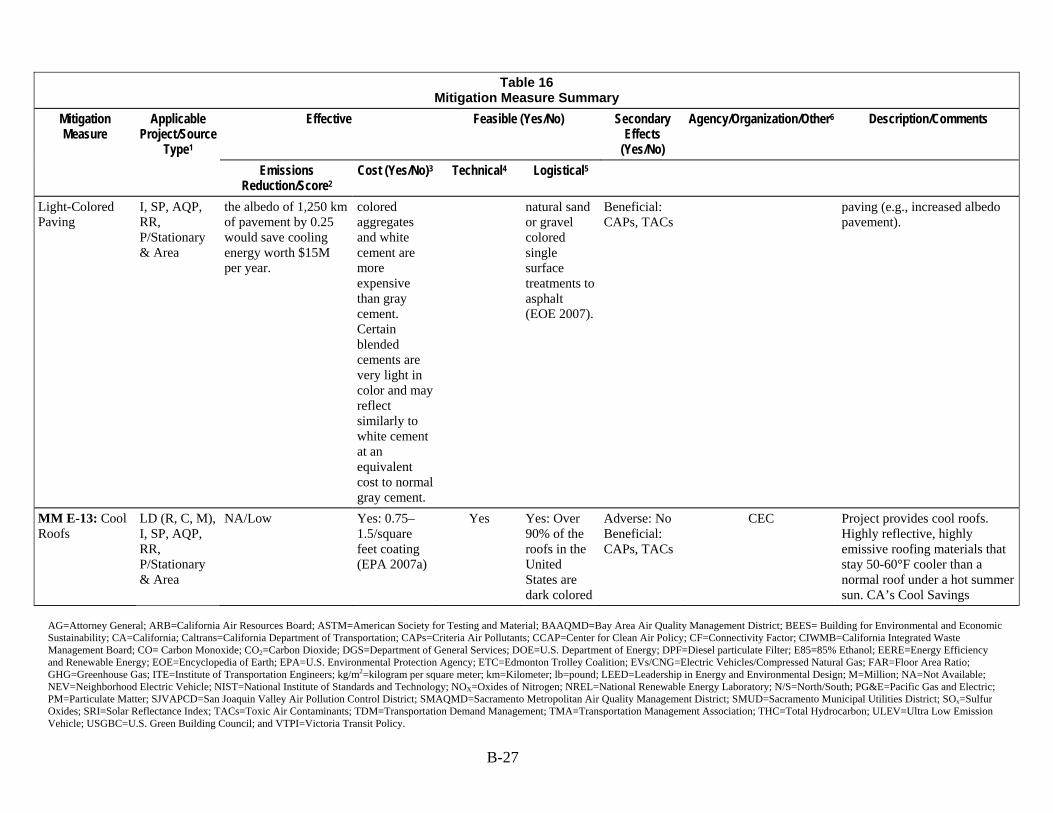
AG=Attorney General; ARB=California Air Resources Board; ASTM=American Society for Testing and Material; BAAQMD=Bay Area Air Quality Management District; BEES= Building for Environmental and Economic Sustainability; CA=California; Caltrans=California Department of Transportation; CAPs=Criteria Air Pollutants; CCAP=Center for Clean Air Policy; CF=Connectivity Factor; CIWMB=California Integrated Waste Management Board; CO= Carbon Monoxide; CO2=Carbon Dioxide; DGS=Department of General Services; DOE=U.S. Department of Energy; DPF=Diesel particulate Filter; E85=85% Ethanol; EERE=Energy Efficiency and Renewable Energy; EOE=Encyclopedia of Earth; EPA=U.S. Environmental Protection Agency; ETC=Edmonton Trolley Coalition; EVs/CNG=Electric Vehicles/Compressed Natural Gas; FAR=Floor Area Ratio; GHG=Greenhouse Gas; ITE=Institute of Transportation Engineers; kg/m2=kilogram per square meter; km=Kilometer; lb=pound; LEED=Leadership in Energy and Environmental Design; M=Million; NA=Not Available; NEV=Neighborhood Electric Vehicle; NIST=National Institute of Standards and Technology; NOX=Oxides of Nitrogen; NREL=National Renewable Energy Laboratory; N/S=North/South; PG&E=Pacific Gas and Electric; PM=Particulate Matter; SJVAPCD=San Joaquin Valley Air Pollution Control District; SMAQMD=Sacramento Metropolitan Air Quality Management District; SMUD=Sacramento Municipal Utilities District; SOx=Sulfur Oxides; SRI=Solar Reflectance Index; TACs=Toxic Air Contaminants; TDM=Transportation Demand Management; TMA=Transportation Management Association; THC=Total Hydrocarbon; ULEV=Ultra Low Emission Vehicle; USGBC=U.S. Green Building Council; and VTPI=Victoria Transit Policy. B-27
Table 16 Mitigation Measure Summary
Effective Feasible (Yes/No) Secondary Effects
(Yes/No)
Agency/Organization/Other6 Description/Comments Mitigation Measure
Applicable Project/Source
Type1 Emissions
Reduction/Score2 Cost (Yes/No)3 Technical4 Logistical5
Light-Colored Paving
I, SP, AQP, RR, P/Stationary & Area
the albedo of 1,250 km of pavement by 0.25 would save cooling energy worth $15M per year.
colored aggregates and white cement are more expensive than gray cement. Certain blended cements are very light in color and may reflect similarly to white cement at an equivalent cost to normal gray cement.
natural sand or gravel colored single surface treatments to asphalt (EOE 2007).
Beneficial: CAPs, TACs
paving (e.g., increased albedo pavement).
MM E-13: Cool Roofs
LD (R, C, M), I, SP, AQP, RR, P/Stationary & Area
NA/Low Yes: 0.75–1.5/square feet coating (EPA 2007a)
Yes Yes: Over 90% of the roofs in the United States are dark colored
Adverse: No Beneficial: CAPs, TACs
CEC Project provides cool roofs. Highly reflective, highly emissive roofing materials that stay 50-60°F cooler than a normal roof under a hot summer sun. CA’s Cool Savings
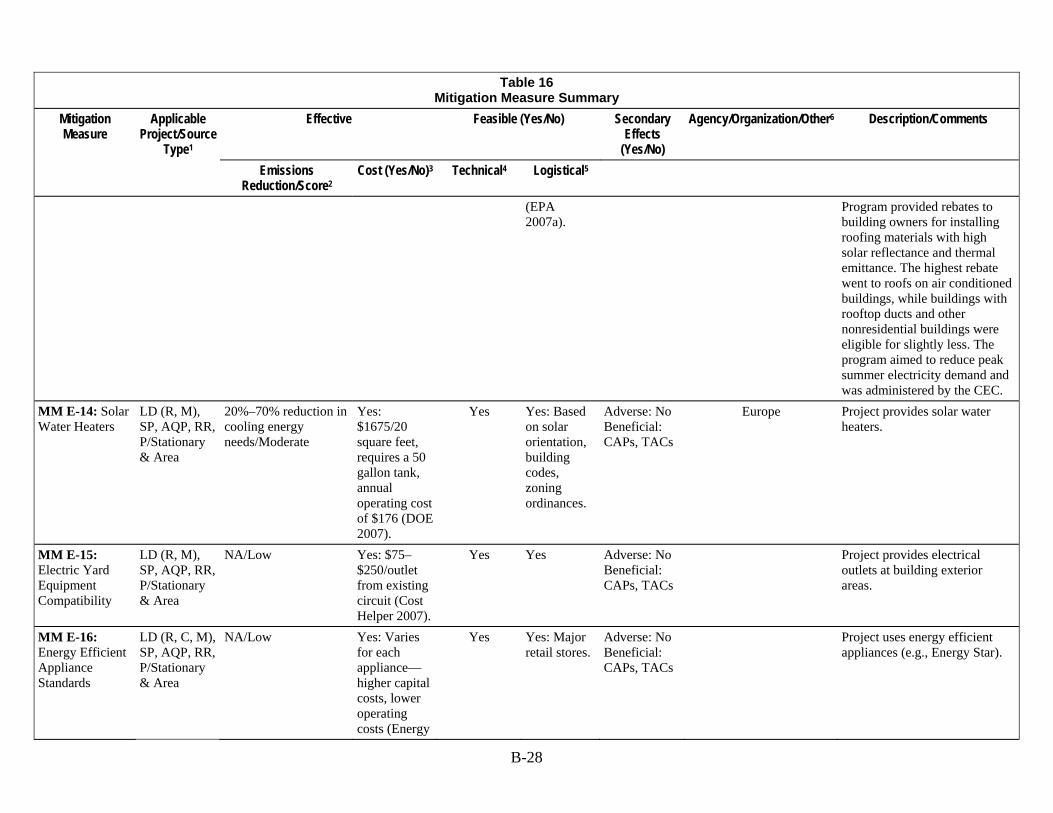
B-28
Table 16 Mitigation Measure Summary
Effective Feasible (Yes/No) Secondary Effects
(Yes/No)
Agency/Organization/Other6 Description/Comments Mitigation Measure
Applicable Project/Source
Type1 Emissions
Reduction/Score2 Cost (Yes/No)3 Technical4 Logistical5
(EPA 2007a).
Program provided rebates to building owners for installing roofing materials with high solar reflectance and thermal emittance. The highest rebate went to roofs on air conditioned buildings, while buildings with rooftop ducts and other nonresidential buildings were eligible for slightly less. The program aimed to reduce peak summer electricity demand and was administered by the CEC.
MM E-14: Solar Water Heaters
LD (R, M), SP, AQP, RR, P/Stationary & Area
20%–70% reduction in cooling energy needs/Moderate
Yes: $1675/20 square feet, requires a 50 gallon tank, annual operating cost of $176 (DOE 2007).
Yes Yes: Based on solar orientation, building codes, zoning ordinances.
Adverse: No Beneficial: CAPs, TACs
Europe Project provides solar water heaters.
MM E-15: Electric Yard Equipment Compatibility
LD (R, M), SP, AQP, RR, P/Stationary & Area
NA/Low Yes: $75–$250/outlet from existing circuit (Cost Helper 2007).
Yes Yes Adverse: No Beneficial: CAPs, TACs
Project provides electrical outlets at building exterior areas.
MM E-16: Energy Efficient Appliance Standards
LD (R, C, M), SP, AQP, RR, P/Stationary & Area
NA/Low Yes: Varies for each appliance—higher capital costs, lower operating costs (Energy
Yes Yes: Major retail stores.
Adverse: No Beneficial: CAPs, TACs
Project uses energy efficient appliances (e.g., Energy Star).
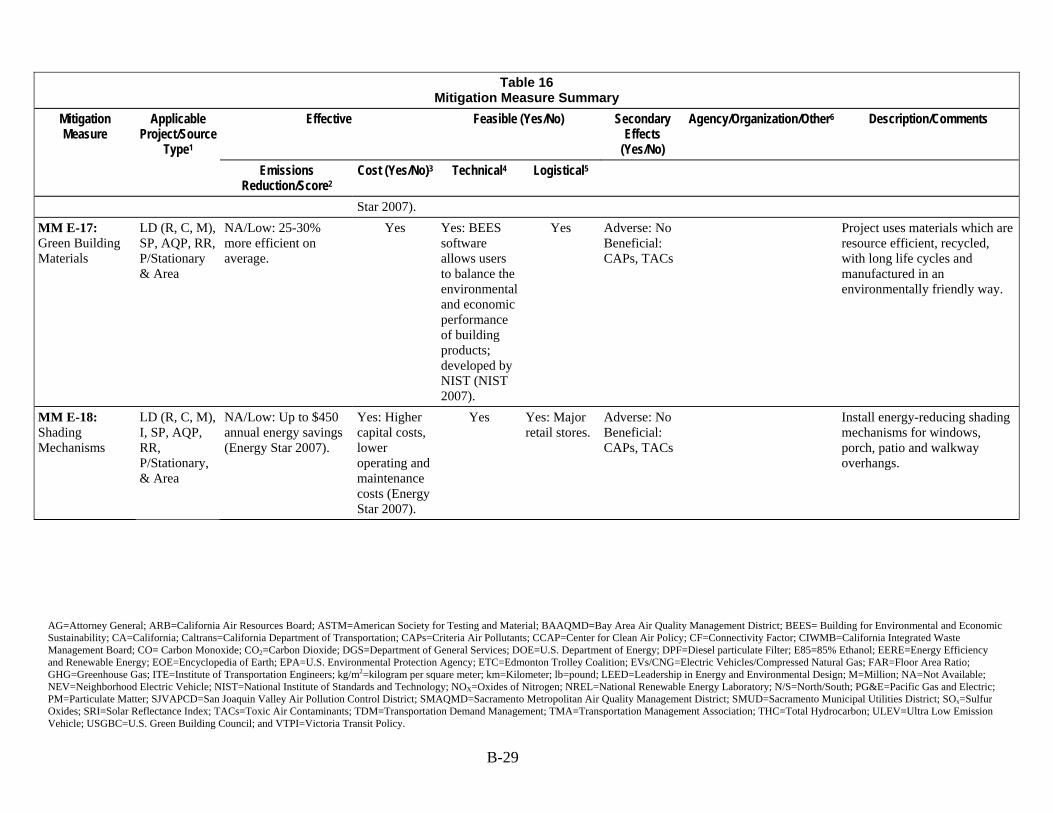
AG=Attorney General; ARB=California Air Resources Board; ASTM=American Society for Testing and Material; BAAQMD=Bay Area Air Quality Management District; BEES= Building for Environmental and Economic Sustainability; CA=California; Caltrans=California Department of Transportation; CAPs=Criteria Air Pollutants; CCAP=Center for Clean Air Policy; CF=Connectivity Factor; CIWMB=California Integrated Waste Management Board; CO= Carbon Monoxide; CO2=Carbon Dioxide; DGS=Department of General Services; DOE=U.S. Department of Energy; DPF=Diesel particulate Filter; E85=85% Ethanol; EERE=Energy Efficiency and Renewable Energy; EOE=Encyclopedia of Earth; EPA=U.S. Environmental Protection Agency; ETC=Edmonton Trolley Coalition; EVs/CNG=Electric Vehicles/Compressed Natural Gas; FAR=Floor Area Ratio; GHG=Greenhouse Gas; ITE=Institute of Transportation Engineers; kg/m2=kilogram per square meter; km=Kilometer; lb=pound; LEED=Leadership in Energy and Environmental Design; M=Million; NA=Not Available; NEV=Neighborhood Electric Vehicle; NIST=National Institute of Standards and Technology; NOX=Oxides of Nitrogen; NREL=National Renewable Energy Laboratory; N/S=North/South; PG&E=Pacific Gas and Electric; PM=Particulate Matter; SJVAPCD=San Joaquin Valley Air Pollution Control District; SMAQMD=Sacramento Metropolitan Air Quality Management District; SMUD=Sacramento Municipal Utilities District; SOx=Sulfur Oxides; SRI=Solar Reflectance Index; TACs=Toxic Air Contaminants; TDM=Transportation Demand Management; TMA=Transportation Management Association; THC=Total Hydrocarbon; ULEV=Ultra Low Emission Vehicle; USGBC=U.S. Green Building Council; and VTPI=Victoria Transit Policy. B-29
Table 16 Mitigation Measure Summary
Effective Feasible (Yes/No) Secondary Effects
(Yes/No)
Agency/Organization/Other6 Description/Comments Mitigation Measure
Applicable Project/Source
Type1 Emissions
Reduction/Score2 Cost (Yes/No)3 Technical4 Logistical5
Star 2007). MM E-17: Green Building Materials
LD (R, C, M), SP, AQP, RR, P/Stationary & Area
NA/Low: 25-30% more efficient on average.
Yes Yes: BEES software allows users to balance the environmental and economic performance of building products; developed by NIST (NIST 2007).
Yes Adverse: No Beneficial: CAPs, TACs
Project uses materials which are resource efficient, recycled, with long life cycles and manufactured in an environmentally friendly way.
MM E-18: Shading Mechanisms
LD (R, C, M), I, SP, AQP, RR, P/Stationary, & Area
NA/Low: Up to $450 annual energy savings (Energy Star 2007).
Yes: Higher capital costs, lower operating and maintenance costs (Energy Star 2007).
Yes Yes: Major retail stores.
Adverse: No Beneficial: CAPs, TACs
Install energy-reducing shading mechanisms for windows, porch, patio and walkway overhangs.
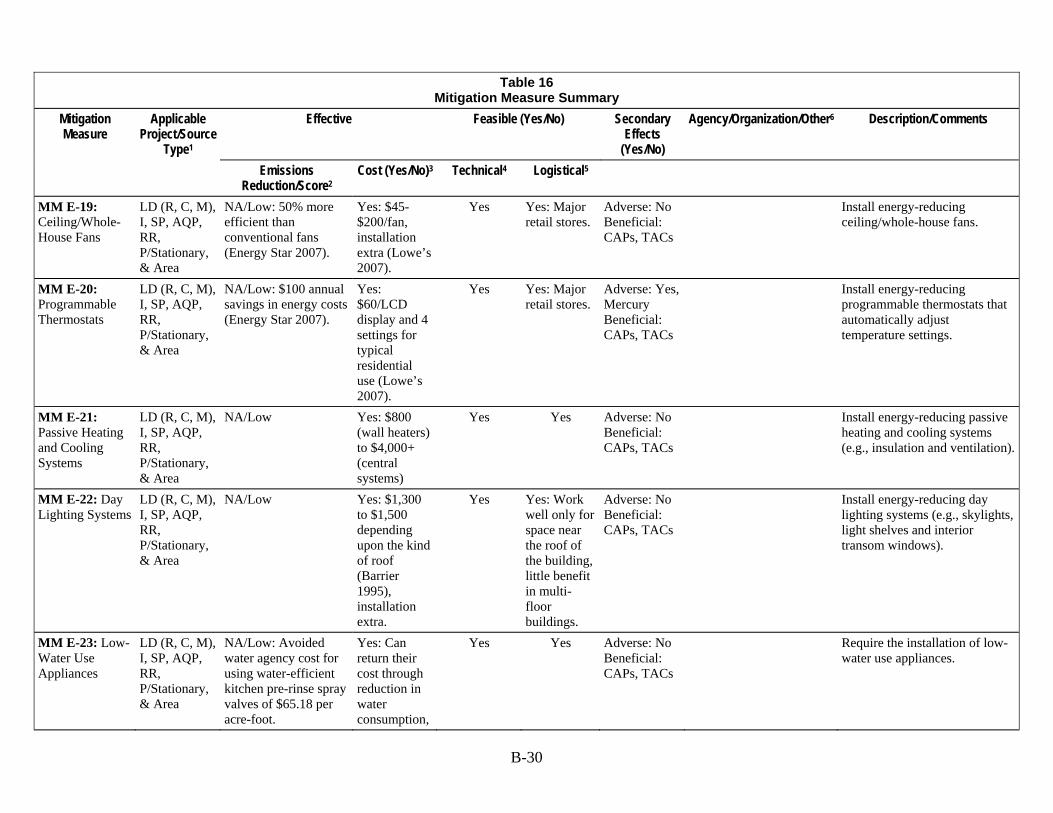
B-30
Table 16 Mitigation Measure Summary
Effective Feasible (Yes/No) Secondary Effects
(Yes/No)
Agency/Organization/Other6 Description/Comments Mitigation Measure
Applicable Project/Source
Type1 Emissions
Reduction/Score2 Cost (Yes/No)3 Technical4 Logistical5
MM E-19: Ceiling/Whole-House Fans
LD (R, C, M), I, SP, AQP, RR, P/Stationary, & Area
NA/Low: 50% more efficient than conventional fans (Energy Star 2007).
Yes: $45-$200/fan, installation extra (Lowe’s 2007).
Yes Yes: Major retail stores.
Adverse: No Beneficial: CAPs, TACs
Install energy-reducing ceiling/whole-house fans.
MM E-20: Programmable Thermostats
LD (R, C, M), I, SP, AQP, RR, P/Stationary, & Area
NA/Low: $100 annual savings in energy costs (Energy Star 2007).
Yes: $60/LCD display and 4 settings for typical residential use (Lowe’s 2007).
Yes Yes: Major retail stores.
Adverse: Yes, Mercury Beneficial: CAPs, TACs
Install energy-reducing programmable thermostats that automatically adjust temperature settings.
MM E-21: Passive Heating and Cooling Systems
LD (R, C, M), I, SP, AQP, RR, P/Stationary, & Area
NA/Low Yes: $800 (wall heaters) to $4,000+ (central systems)
Yes Yes Adverse: No Beneficial: CAPs, TACs
Install energy-reducing passive heating and cooling systems (e.g., insulation and ventilation).
MM E-22: Day Lighting Systems
LD (R, C, M), I, SP, AQP, RR, P/Stationary, & Area
NA/Low Yes: $1,300 to $1,500 depending upon the kind of roof (Barrier 1995), installation extra.
Yes Yes: Work well only for space near the roof of the building, little benefit in multi-floor buildings.
Adverse: No Beneficial: CAPs, TACs
Install energy-reducing day lighting systems (e.g., skylights, light shelves and interior transom windows).
MM E-23: Low-Water Use Appliances
LD (R, C, M), I, SP, AQP, RR, P/Stationary, & Area
NA/Low: Avoided water agency cost for using water-efficient kitchen pre-rinse spray valves of $65.18 per acre-foot.
Yes: Can return their cost through reduction in water consumption,
Yes Yes Adverse: No Beneficial: CAPs, TACs
Require the installation of low-water use appliances.
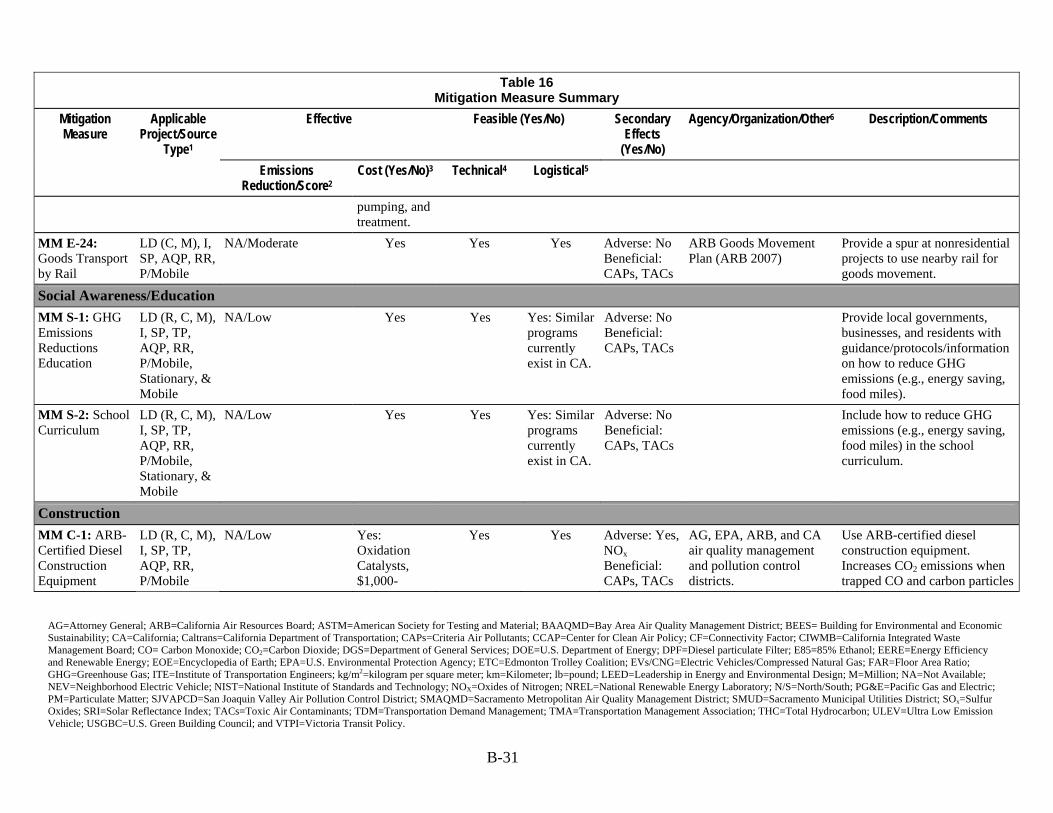
AG=Attorney General; ARB=California Air Resources Board; ASTM=American Society for Testing and Material; BAAQMD=Bay Area Air Quality Management District; BEES= Building for Environmental and Economic Sustainability; CA=California; Caltrans=California Department of Transportation; CAPs=Criteria Air Pollutants; CCAP=Center for Clean Air Policy; CF=Connectivity Factor; CIWMB=California Integrated Waste Management Board; CO= Carbon Monoxide; CO2=Carbon Dioxide; DGS=Department of General Services; DOE=U.S. Department of Energy; DPF=Diesel particulate Filter; E85=85% Ethanol; EERE=Energy Efficiency and Renewable Energy; EOE=Encyclopedia of Earth; EPA=U.S. Environmental Protection Agency; ETC=Edmonton Trolley Coalition; EVs/CNG=Electric Vehicles/Compressed Natural Gas; FAR=Floor Area Ratio; GHG=Greenhouse Gas; ITE=Institute of Transportation Engineers; kg/m2=kilogram per square meter; km=Kilometer; lb=pound; LEED=Leadership in Energy and Environmental Design; M=Million; NA=Not Available; NEV=Neighborhood Electric Vehicle; NIST=National Institute of Standards and Technology; NOX=Oxides of Nitrogen; NREL=National Renewable Energy Laboratory; N/S=North/South; PG&E=Pacific Gas and Electric; PM=Particulate Matter; SJVAPCD=San Joaquin Valley Air Pollution Control District; SMAQMD=Sacramento Metropolitan Air Quality Management District; SMUD=Sacramento Municipal Utilities District; SOx=Sulfur Oxides; SRI=Solar Reflectance Index; TACs=Toxic Air Contaminants; TDM=Transportation Demand Management; TMA=Transportation Management Association; THC=Total Hydrocarbon; ULEV=Ultra Low Emission Vehicle; USGBC=U.S. Green Building Council; and VTPI=Victoria Transit Policy. B-31
Table 16 Mitigation Measure Summary
Effective Feasible (Yes/No) Secondary Effects
(Yes/No)
Agency/Organization/Other6 Description/Comments Mitigation Measure
Applicable Project/Source
Type1 Emissions
Reduction/Score2 Cost (Yes/No)3 Technical4 Logistical5
pumping, and treatment.
MM E-24: Goods Transport by Rail
LD (C, M), I, SP, AQP, RR, P/Mobile
NA/Moderate Yes Yes Yes Adverse: No Beneficial: CAPs, TACs
ARB Goods Movement Plan (ARB 2007)
Provide a spur at nonresidential projects to use nearby rail for goods movement.
Social Awareness/Education MM S-1: GHG Emissions Reductions Education
LD (R, C, M), I, SP, TP, AQP, RR, P/Mobile, Stationary, & Mobile
NA/Low Yes Yes Yes: Similar programs currently exist in CA.
Adverse: No Beneficial: CAPs, TACs
Provide local governments, businesses, and residents with guidance/protocols/information on how to reduce GHG emissions (e.g., energy saving, food miles).
MM S-2: School Curriculum
LD (R, C, M), I, SP, TP, AQP, RR, P/Mobile, Stationary, & Mobile
NA/Low Yes Yes Yes: Similar programs currently exist in CA.
Adverse: No Beneficial: CAPs, TACs
Include how to reduce GHG emissions (e.g., energy saving, food miles) in the school curriculum.
Construction MM C-1: ARB-Certified Diesel Construction Equipment
LD (R, C, M), I, SP, TP, AQP, RR, P/Mobile
NA/Low Yes: Oxidation Catalysts, $1,000-
Yes Yes Adverse: Yes, NOx Beneficial: CAPs, TACs
AG, EPA, ARB, and CA air quality management and pollution control districts.
Use ARB-certified diesel construction equipment. Increases CO2 emissions when trapped CO and carbon particles
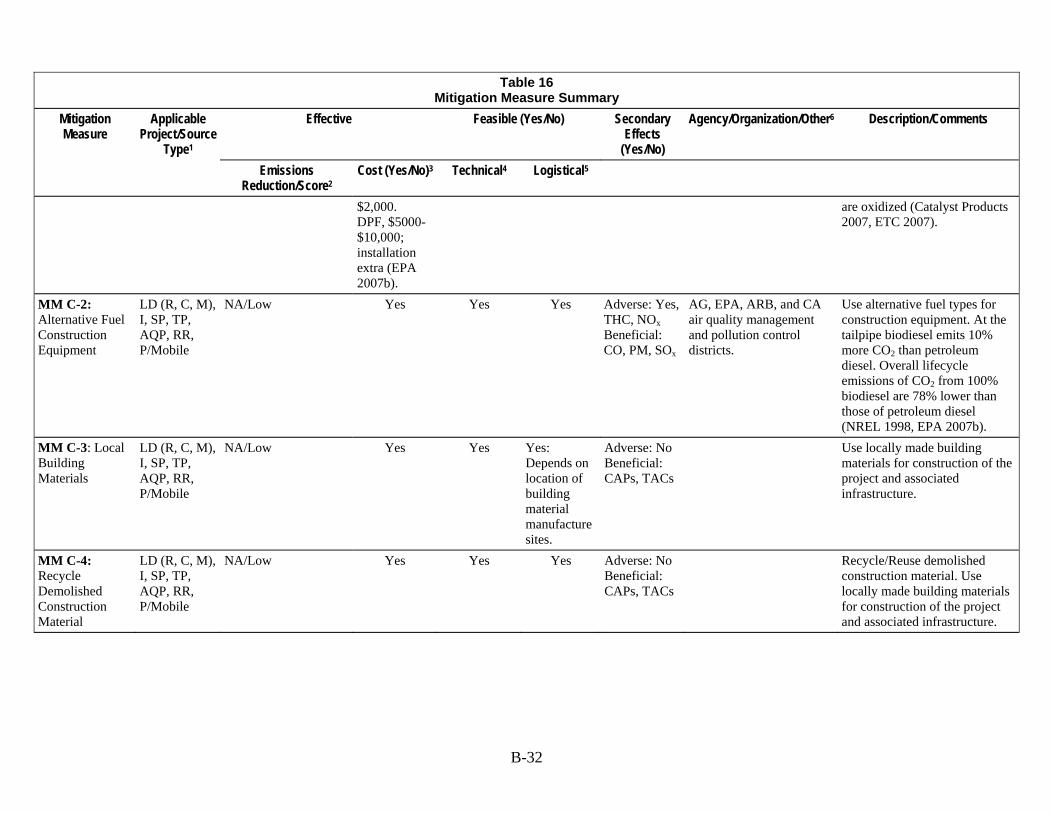
B-32
Table 16 Mitigation Measure Summary
Effective Feasible (Yes/No) Secondary Effects
(Yes/No)
Agency/Organization/Other6 Description/Comments Mitigation Measure
Applicable Project/Source
Type1 Emissions
Reduction/Score2 Cost (Yes/No)3 Technical4 Logistical5
$2,000. DPF, $5000-$10,000; installation extra (EPA 2007b).
are oxidized (Catalyst Products 2007, ETC 2007).
MM C-2: Alternative Fuel Construction Equipment
LD (R, C, M), I, SP, TP, AQP, RR, P/Mobile
NA/Low Yes Yes Yes Adverse: Yes, THC, NOx Beneficial: CO, PM, SOx
AG, EPA, ARB, and CA air quality management and pollution control districts.
Use alternative fuel types for construction equipment. At the tailpipe biodiesel emits 10% more CO2 than petroleum diesel. Overall lifecycle emissions of CO2 from 100% biodiesel are 78% lower than those of petroleum diesel (NREL 1998, EPA 2007b).
MM C-3: Local Building Materials
LD (R, C, M), I, SP, TP, AQP, RR, P/Mobile
NA/Low Yes Yes Yes: Depends on location of building material manufacture sites.
Adverse: No Beneficial: CAPs, TACs
Use locally made building materials for construction of the project and associated infrastructure.
MM C-4: Recycle Demolished Construction Material
LD (R, C, M), I, SP, TP, AQP, RR, P/Mobile
NA/Low Yes Yes Yes Adverse: No Beneficial: CAPs, TACs
Recycle/Reuse demolished construction material. Use locally made building materials for construction of the project and associated infrastructure.
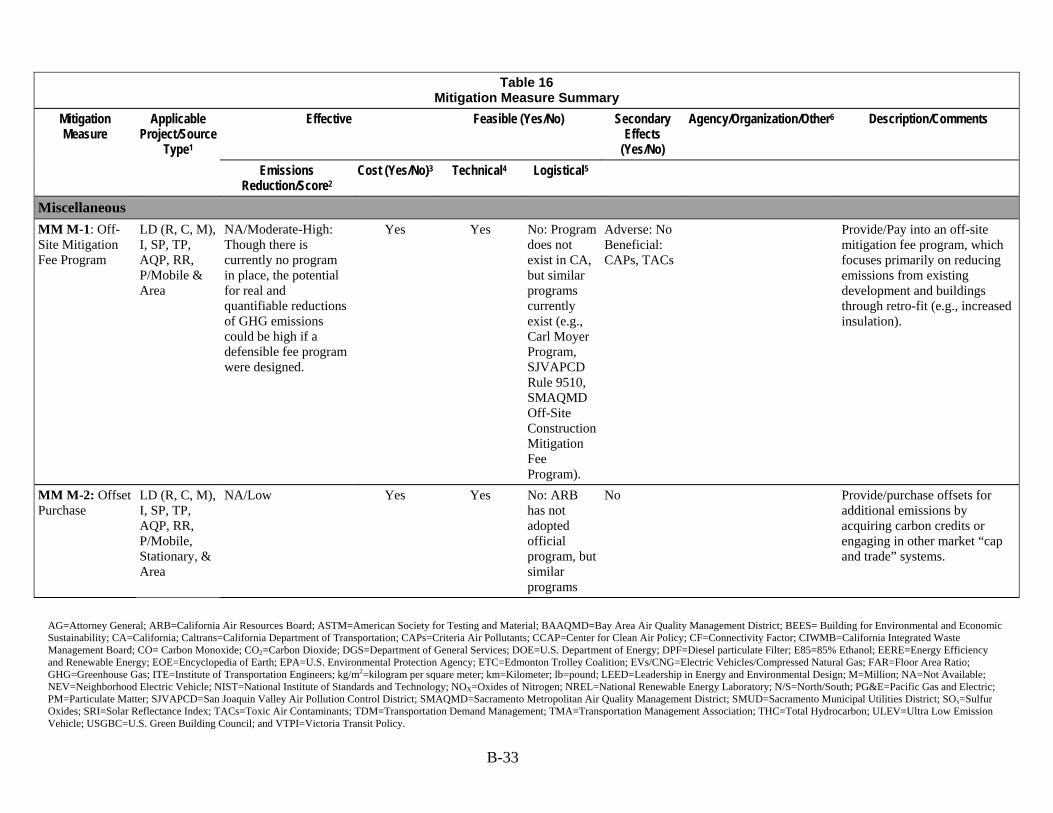
AG=Attorney General; ARB=California Air Resources Board; ASTM=American Society for Testing and Material; BAAQMD=Bay Area Air Quality Management District; BEES= Building for Environmental and Economic Sustainability; CA=California; Caltrans=California Department of Transportation; CAPs=Criteria Air Pollutants; CCAP=Center for Clean Air Policy; CF=Connectivity Factor; CIWMB=California Integrated Waste Management Board; CO= Carbon Monoxide; CO2=Carbon Dioxide; DGS=Department of General Services; DOE=U.S. Department of Energy; DPF=Diesel particulate Filter; E85=85% Ethanol; EERE=Energy Efficiency and Renewable Energy; EOE=Encyclopedia of Earth; EPA=U.S. Environmental Protection Agency; ETC=Edmonton Trolley Coalition; EVs/CNG=Electric Vehicles/Compressed Natural Gas; FAR=Floor Area Ratio; GHG=Greenhouse Gas; ITE=Institute of Transportation Engineers; kg/m2=kilogram per square meter; km=Kilometer; lb=pound; LEED=Leadership in Energy and Environmental Design; M=Million; NA=Not Available; NEV=Neighborhood Electric Vehicle; NIST=National Institute of Standards and Technology; NOX=Oxides of Nitrogen; NREL=National Renewable Energy Laboratory; N/S=North/South; PG&E=Pacific Gas and Electric; PM=Particulate Matter; SJVAPCD=San Joaquin Valley Air Pollution Control District; SMAQMD=Sacramento Metropolitan Air Quality Management District; SMUD=Sacramento Municipal Utilities District; SOx=Sulfur Oxides; SRI=Solar Reflectance Index; TACs=Toxic Air Contaminants; TDM=Transportation Demand Management; TMA=Transportation Management Association; THC=Total Hydrocarbon; ULEV=Ultra Low Emission Vehicle; USGBC=U.S. Green Building Council; and VTPI=Victoria Transit Policy. B-33
Table 16 Mitigation Measure Summary
Effective Feasible (Yes/No) Secondary Effects
(Yes/No)
Agency/Organization/Other6 Description/Comments Mitigation Measure
Applicable Project/Source
Type1 Emissions
Reduction/Score2 Cost (Yes/No)3 Technical4 Logistical5
Miscellaneous MM M-1: Off-Site Mitigation Fee Program
LD (R, C, M), I, SP, TP, AQP, RR, P/Mobile & Area
NA/Moderate-High: Though there is currently no program in place, the potential for real and quantifiable reductions of GHG emissions could be high if a defensible fee program were designed.
Yes Yes No: Program does not exist in CA, but similar programs currently exist (e.g., Carl Moyer Program, SJVAPCD Rule 9510, SMAQMD Off-Site Construction Mitigation Fee Program).
Adverse: No Beneficial: CAPs, TACs
Provide/Pay into an off-site mitigation fee program, which focuses primarily on reducing emissions from existing development and buildings through retro-fit (e.g., increased insulation).
MM M-2: Offset Purchase
LD (R, C, M), I, SP, TP, AQP, RR, P/Mobile, Stationary, & Area
NA/Low Yes Yes No: ARB has not adopted official program, but similar programs
No Provide/purchase offsets for additional emissions by acquiring carbon credits or engaging in other market “cap and trade” systems.
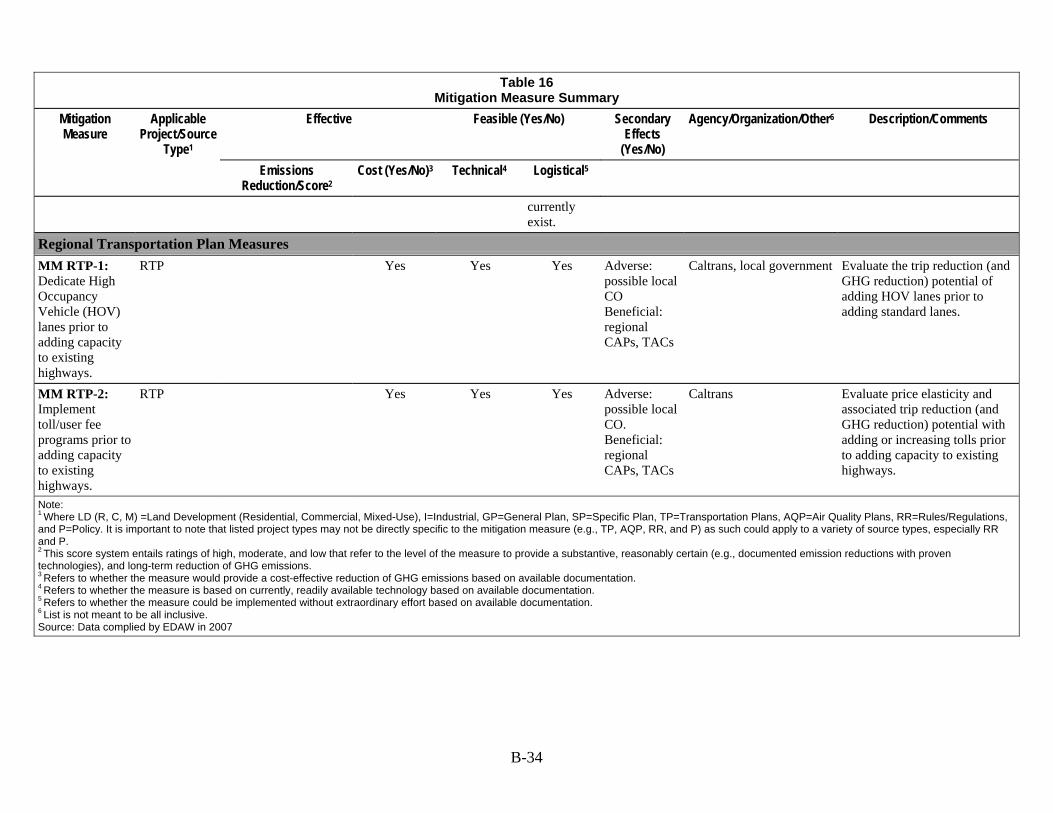
B-34
Table 16 Mitigation Measure Summary
Effective Feasible (Yes/No) Secondary Effects
(Yes/No)
Agency/Organization/Other6 Description/Comments Mitigation Measure
Applicable Project/Source
Type1 Emissions
Reduction/Score2 Cost (Yes/No)3 Technical4 Logistical5
currently exist.
Regional Transportation Plan Measures MM RTP-1: Dedicate High Occupancy Vehicle (HOV) lanes prior to adding capacity to existing highways.
RTP Yes Yes Yes Adverse: possible local CO Beneficial: regional CAPs, TACs
Caltrans, local government Evaluate the trip reduction (and GHG reduction) potential of adding HOV lanes prior to adding standard lanes.
MM RTP-2: Implement toll/user fee programs prior to adding capacity to existing highways.
RTP Yes Yes Yes Adverse: possible local CO. Beneficial: regional CAPs, TACs
Caltrans Evaluate price elasticity and associated trip reduction (and GHG reduction) potential with adding or increasing tolls prior to adding capacity to existing highways.
Note: 1 Where LD (R, C, M) =Land Development (Residential, Commercial, Mixed-Use), I=Industrial, GP=General Plan, SP=Specific Plan, TP=Transportation Plans, AQP=Air Quality Plans, RR=Rules/Regulations,
and P=Policy. It is important to note that listed project types may not be directly specific to the mitigation measure (e.g., TP, AQP, RR, and P) as such could apply to a variety of source types, especially RR and P. 2 This score system entails ratings of high, moderate, and low that refer to the level of the measure to provide a substantive, reasonably certain (e.g., documented emission reductions with proven
technologies), and long-term reduction of GHG emissions. 3 Refers to whether the measure would provide a cost-effective reduction of GHG emissions based on available documentation.
4 Refers to whether the measure is based on currently, readily available technology based on available documentation.
5 Refers to whether the measure could be implemented without extraordinary effort based on available documentation.
6 List is not meant to be all inclusive.
Source: Data complied by EDAW in 2007
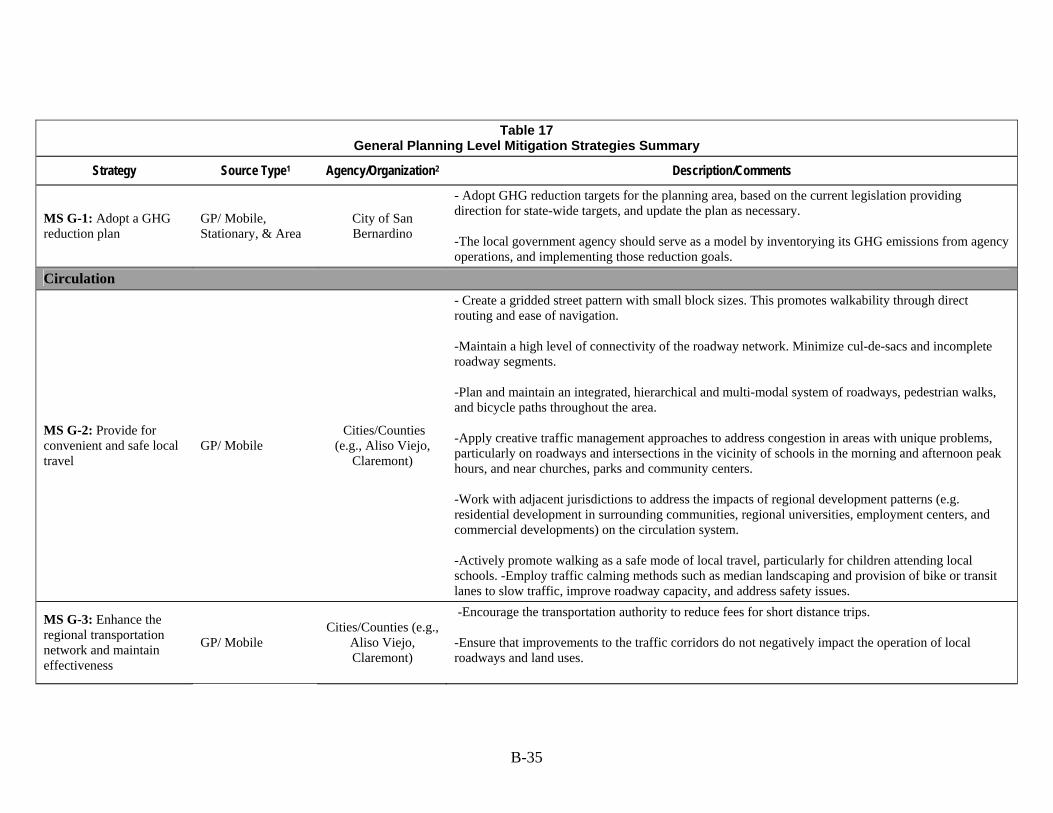
B-35
Table 17 General Planning Level Mitigation Strategies Summary
Strategy Source Type1 Agency/Organization2 Description/Comments
MS G-1: Adopt a GHG reduction plan
GP/ Mobile, Stationary, & Area
City of San Bernardino
- Adopt GHG reduction targets for the planning area, based on the current legislation providing direction for state-wide targets, and update the plan as necessary. -The local government agency should serve as a model by inventorying its GHG emissions from agency operations, and implementing those reduction goals.
Circulation
MS G-2: Provide for convenient and safe local travel
GP/ Mobile Cities/Counties
(e.g., Aliso Viejo, Claremont)
- Create a gridded street pattern with small block sizes. This promotes walkability through direct routing and ease of navigation. -Maintain a high level of connectivity of the roadway network. Minimize cul-de-sacs and incomplete roadway segments. -Plan and maintain an integrated, hierarchical and multi-modal system of roadways, pedestrian walks, and bicycle paths throughout the area. -Apply creative traffic management approaches to address congestion in areas with unique problems, particularly on roadways and intersections in the vicinity of schools in the morning and afternoon peak hours, and near churches, parks and community centers. -Work with adjacent jurisdictions to address the impacts of regional development patterns (e.g. residential development in surrounding communities, regional universities, employment centers, and commercial developments) on the circulation system. -Actively promote walking as a safe mode of local travel, particularly for children attending local schools. -Employ traffic calming methods such as median landscaping and provision of bike or transit lanes to slow traffic, improve roadway capacity, and address safety issues.
MS G-3: Enhance the regional transportation network and maintain effectiveness
GP/ Mobile Cities/Counties (e.g.,
Aliso Viejo, Claremont)
-Encourage the transportation authority to reduce fees for short distance trips. -Ensure that improvements to the traffic corridors do not negatively impact the operation of local roadways and land uses.
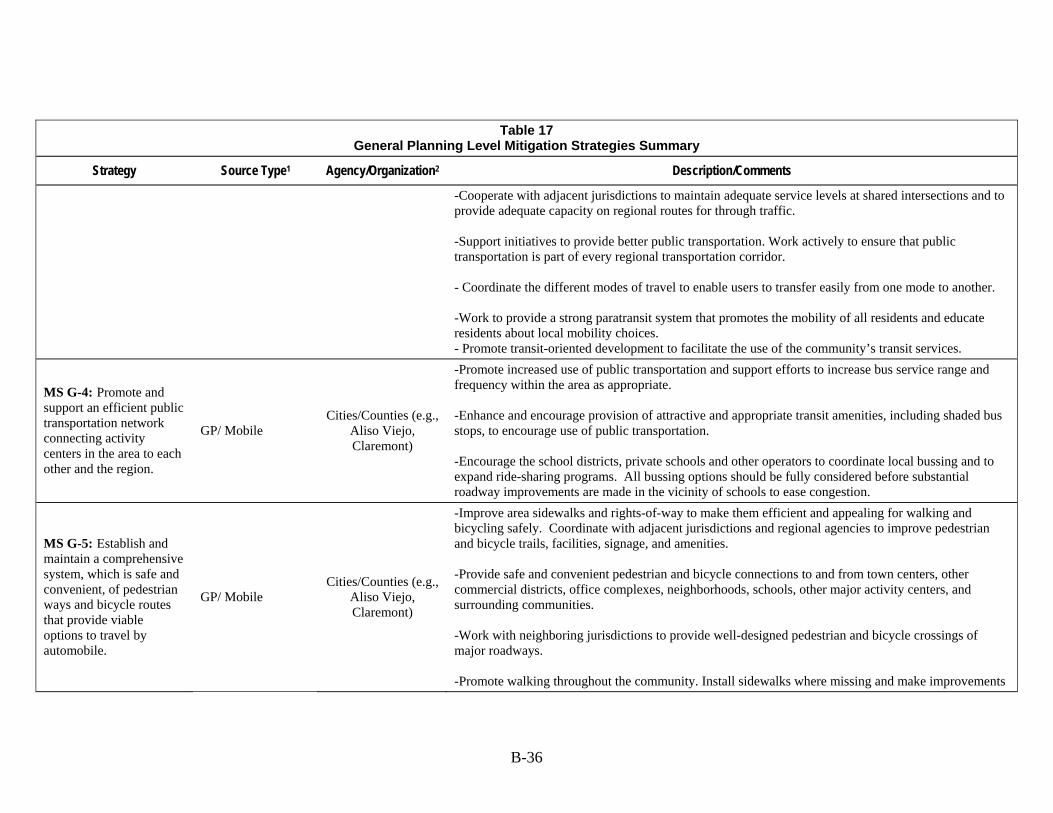
B-36
Table 17 General Planning Level Mitigation Strategies Summary
Strategy Source Type1 Agency/Organization2 Description/Comments
-Cooperate with adjacent jurisdictions to maintain adequate service levels at shared intersections and to provide adequate capacity on regional routes for through traffic. -Support initiatives to provide better public transportation. Work actively to ensure that public transportation is part of every regional transportation corridor. - Coordinate the different modes of travel to enable users to transfer easily from one mode to another. -Work to provide a strong paratransit system that promotes the mobility of all residents and educate residents about local mobility choices. - Promote transit-oriented development to facilitate the use of the community’s transit services.
MS G-4: Promote and support an efficient public transportation network connecting activity centers in the area to each other and the region.
GP/ Mobile Cities/Counties (e.g.,
Aliso Viejo, Claremont)
-Promote increased use of public transportation and support efforts to increase bus service range and frequency within the area as appropriate. -Enhance and encourage provision of attractive and appropriate transit amenities, including shaded bus stops, to encourage use of public transportation. -Encourage the school districts, private schools and other operators to coordinate local bussing and to expand ride-sharing programs. All bussing options should be fully considered before substantial roadway improvements are made in the vicinity of schools to ease congestion.
MS G-5: Establish and maintain a comprehensive system, which is safe and convenient, of pedestrian ways and bicycle routes that provide viable options to travel by automobile.
GP/ Mobile Cities/Counties (e.g.,
Aliso Viejo, Claremont)
-Improve area sidewalks and rights-of-way to make them efficient and appealing for walking and bicycling safely. Coordinate with adjacent jurisdictions and regional agencies to improve pedestrian and bicycle trails, facilities, signage, and amenities. -Provide safe and convenient pedestrian and bicycle connections to and from town centers, other commercial districts, office complexes, neighborhoods, schools, other major activity centers, and surrounding communities. -Work with neighboring jurisdictions to provide well-designed pedestrian and bicycle crossings of major roadways. -Promote walking throughout the community. Install sidewalks where missing and make improvements
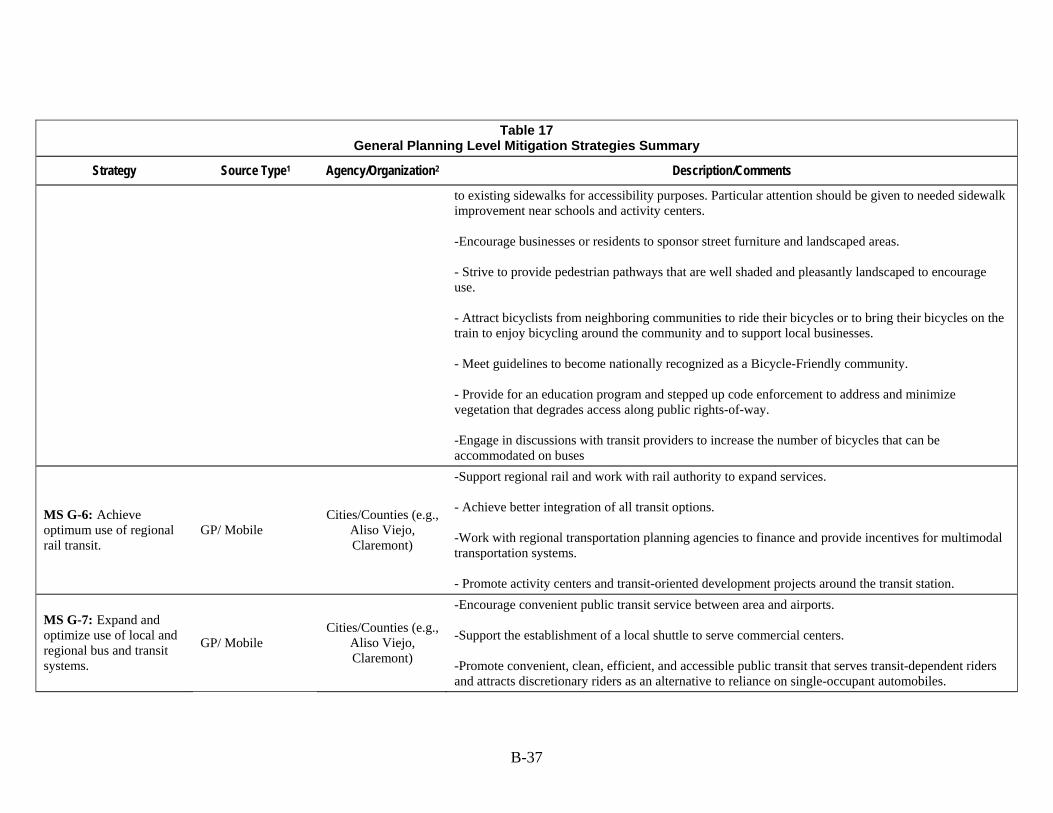
B-37
Table 17 General Planning Level Mitigation Strategies Summary
Strategy Source Type1 Agency/Organization2 Description/Comments
to existing sidewalks for accessibility purposes. Particular attention should be given to needed sidewalk improvement near schools and activity centers. -Encourage businesses or residents to sponsor street furniture and landscaped areas. - Strive to provide pedestrian pathways that are well shaded and pleasantly landscaped to encourage use. - Attract bicyclists from neighboring communities to ride their bicycles or to bring their bicycles on the train to enjoy bicycling around the community and to support local businesses. - Meet guidelines to become nationally recognized as a Bicycle-Friendly community. - Provide for an education program and stepped up code enforcement to address and minimize vegetation that degrades access along public rights-of-way. -Engage in discussions with transit providers to increase the number of bicycles that can be accommodated on buses
MS G-6: Achieve optimum use of regional rail transit.
GP/ Mobile Cities/Counties (e.g.,
Aliso Viejo, Claremont)
-Support regional rail and work with rail authority to expand services. - Achieve better integration of all transit options. -Work with regional transportation planning agencies to finance and provide incentives for multimodal transportation systems. - Promote activity centers and transit-oriented development projects around the transit station.
MS G-7: Expand and optimize use of local and regional bus and transit systems.
GP/ Mobile Cities/Counties (e.g.,
Aliso Viejo, Claremont)
-Encourage convenient public transit service between area and airports. -Support the establishment of a local shuttle to serve commercial centers. -Promote convenient, clean, efficient, and accessible public transit that serves transit-dependent riders and attracts discretionary riders as an alternative to reliance on single-occupant automobiles.
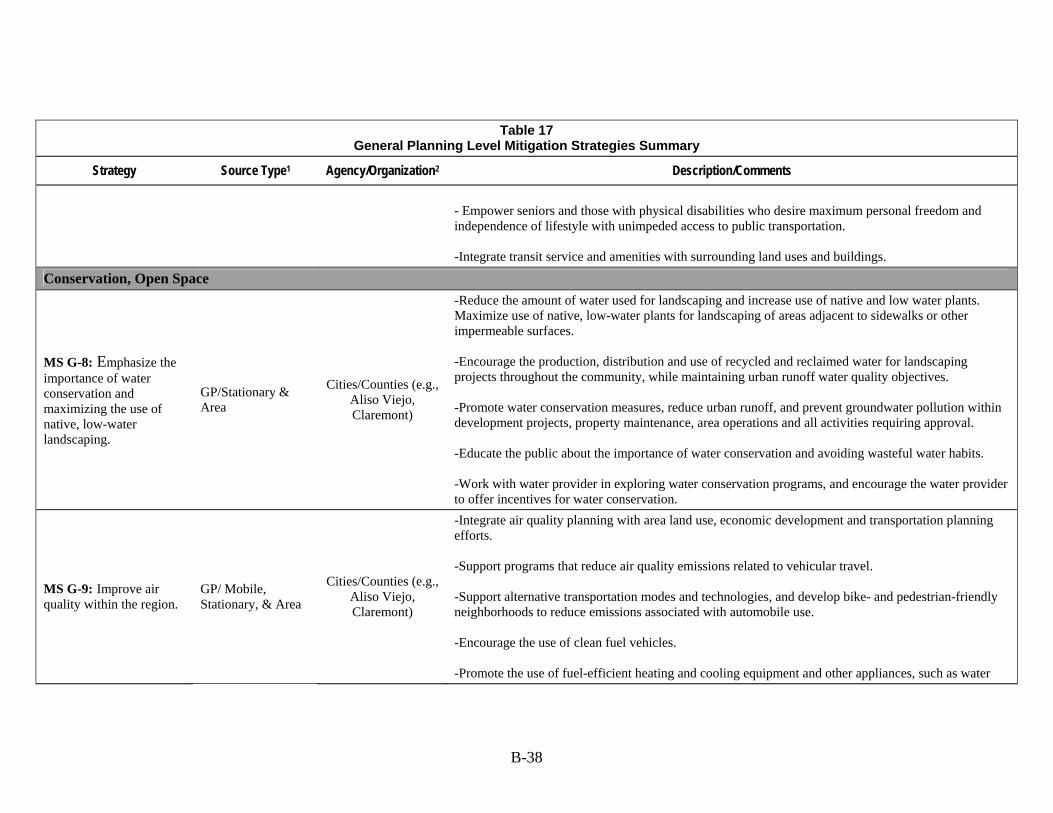
B-38
Table 17 General Planning Level Mitigation Strategies Summary
Strategy Source Type1 Agency/Organization2 Description/Comments
- Empower seniors and those with physical disabilities who desire maximum personal freedom and independence of lifestyle with unimpeded access to public transportation. -Integrate transit service and amenities with surrounding land uses and buildings.
Conservation, Open Space
MS G-8: Emphasize the importance of water conservation and maximizing the use of native, low-water landscaping.
GP/Stationary & Area
Cities/Counties (e.g., Aliso Viejo, Claremont)
-Reduce the amount of water used for landscaping and increase use of native and low water plants. Maximize use of native, low-water plants for landscaping of areas adjacent to sidewalks or other impermeable surfaces. -Encourage the production, distribution and use of recycled and reclaimed water for landscaping projects throughout the community, while maintaining urban runoff water quality objectives. -Promote water conservation measures, reduce urban runoff, and prevent groundwater pollution within development projects, property maintenance, area operations and all activities requiring approval. -Educate the public about the importance of water conservation and avoiding wasteful water habits. -Work with water provider in exploring water conservation programs, and encourage the water provider to offer incentives for water conservation.
MS G-9: Improve air quality within the region.
GP/ Mobile, Stationary, & Area
Cities/Counties (e.g., Aliso Viejo, Claremont)
-Integrate air quality planning with area land use, economic development and transportation planning efforts. -Support programs that reduce air quality emissions related to vehicular travel. -Support alternative transportation modes and technologies, and develop bike- and pedestrian-friendly neighborhoods to reduce emissions associated with automobile use. -Encourage the use of clean fuel vehicles. -Promote the use of fuel-efficient heating and cooling equipment and other appliances, such as water
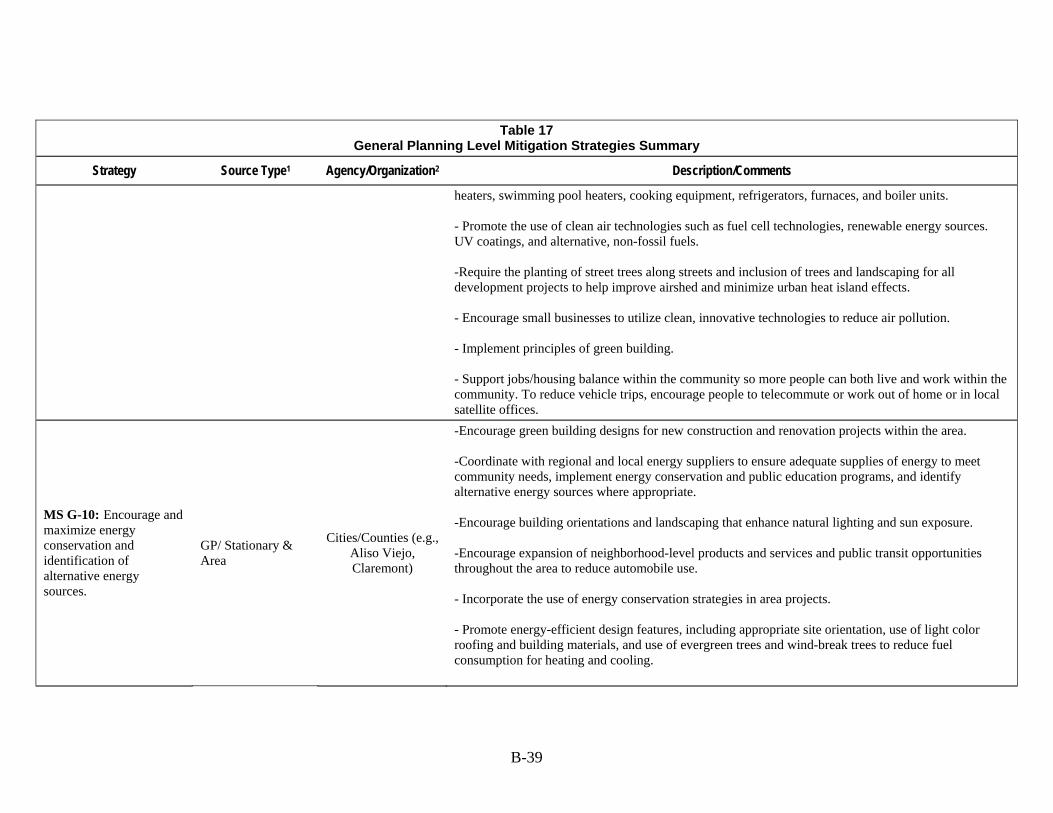
B-39
Table 17 General Planning Level Mitigation Strategies Summary
Strategy Source Type1 Agency/Organization2 Description/Comments
heaters, swimming pool heaters, cooking equipment, refrigerators, furnaces, and boiler units. - Promote the use of clean air technologies such as fuel cell technologies, renewable energy sources. UV coatings, and alternative, non-fossil fuels. -Require the planting of street trees along streets and inclusion of trees and landscaping for all development projects to help improve airshed and minimize urban heat island effects. - Encourage small businesses to utilize clean, innovative technologies to reduce air pollution. - Implement principles of green building. - Support jobs/housing balance within the community so more people can both live and work within the community. To reduce vehicle trips, encourage people to telecommute or work out of home or in local satellite offices.
MS G-10: Encourage and maximize energy conservation and identification of alternative energy sources.
GP/ Stationary & Area
Cities/Counties (e.g., Aliso Viejo, Claremont)
-Encourage green building designs for new construction and renovation projects within the area. -Coordinate with regional and local energy suppliers to ensure adequate supplies of energy to meet community needs, implement energy conservation and public education programs, and identify alternative energy sources where appropriate. -Encourage building orientations and landscaping that enhance natural lighting and sun exposure. -Encourage expansion of neighborhood-level products and services and public transit opportunities throughout the area to reduce automobile use. - Incorporate the use of energy conservation strategies in area projects. - Promote energy-efficient design features, including appropriate site orientation, use of light color roofing and building materials, and use of evergreen trees and wind-break trees to reduce fuel consumption for heating and cooling.
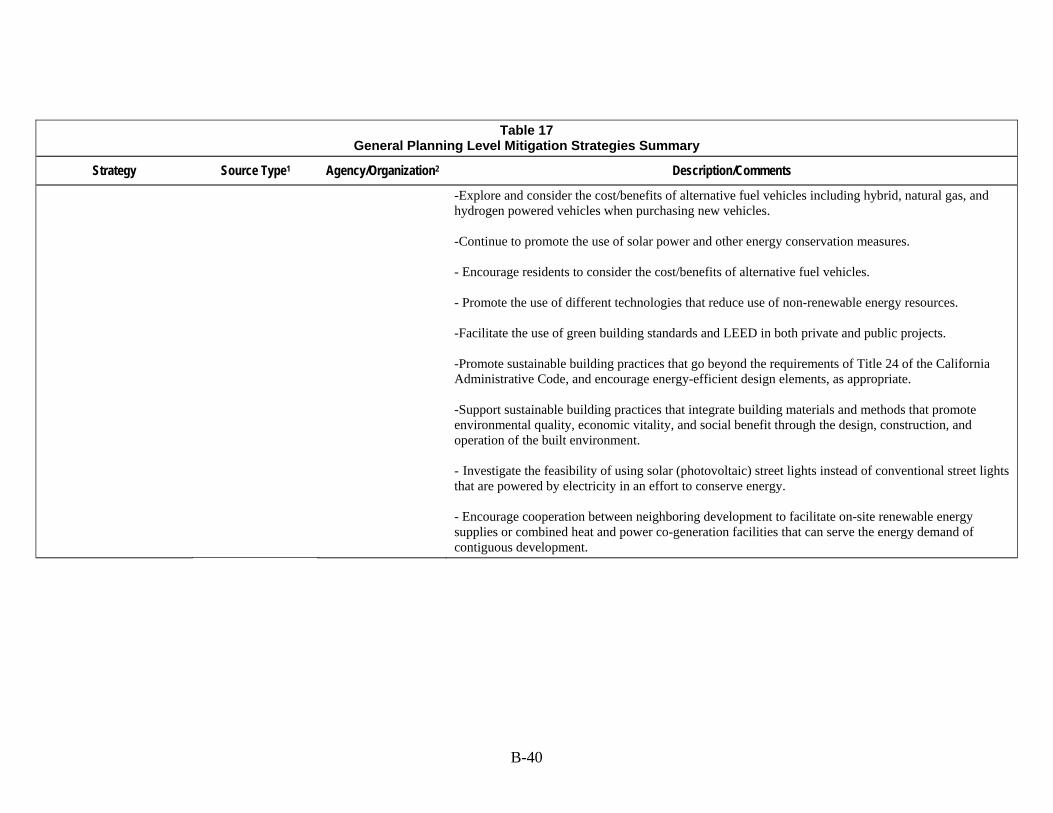
B-40
Table 17 General Planning Level Mitigation Strategies Summary
Strategy Source Type1 Agency/Organization2 Description/Comments
-Explore and consider the cost/benefits of alternative fuel vehicles including hybrid, natural gas, and hydrogen powered vehicles when purchasing new vehicles. -Continue to promote the use of solar power and other energy conservation measures. - Encourage residents to consider the cost/benefits of alternative fuel vehicles. - Promote the use of different technologies that reduce use of non-renewable energy resources. -Facilitate the use of green building standards and LEED in both private and public projects. -Promote sustainable building practices that go beyond the requirements of Title 24 of the California Administrative Code, and encourage energy-efficient design elements, as appropriate. -Support sustainable building practices that integrate building materials and methods that promote environmental quality, economic vitality, and social benefit through the design, construction, and operation of the built environment. - Investigate the feasibility of using solar (photovoltaic) street lights instead of conventional street lights that are powered by electricity in an effort to conserve energy. - Encourage cooperation between neighboring development to facilitate on-site renewable energy supplies or combined heat and power co-generation facilities that can serve the energy demand of contiguous development.
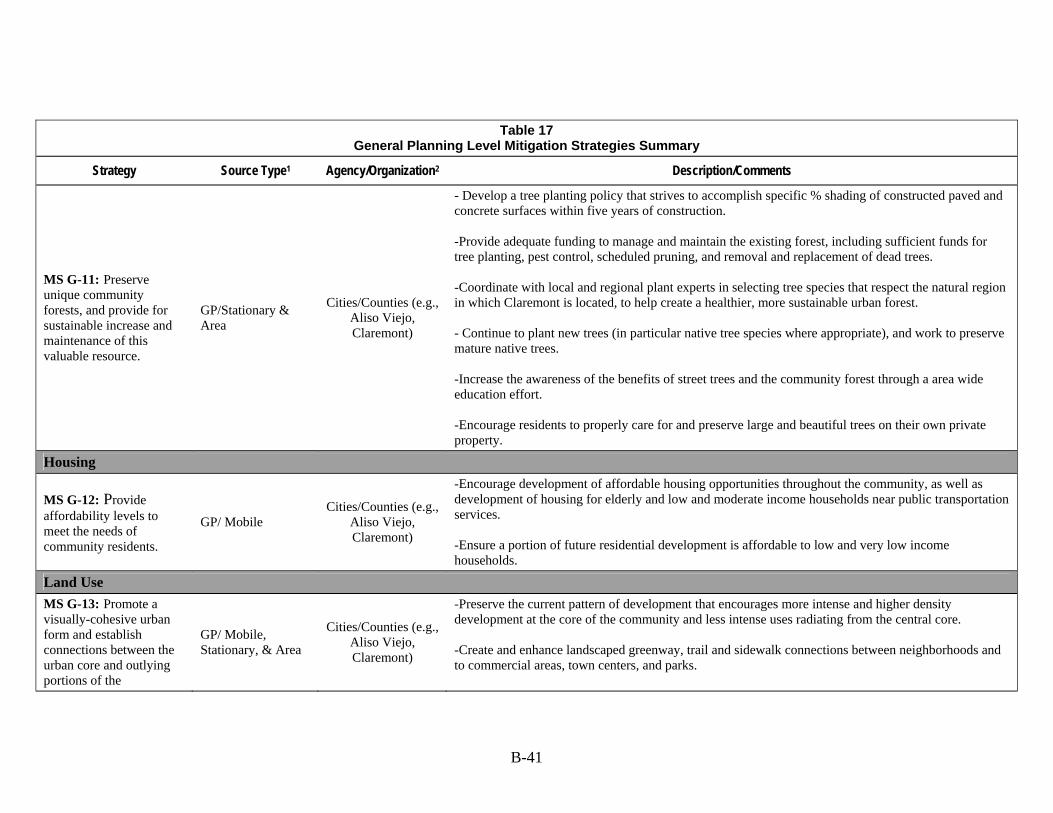
B-41
Table 17 General Planning Level Mitigation Strategies Summary
Strategy Source Type1 Agency/Organization2 Description/Comments
MS G-11: Preserve unique community forests, and provide for sustainable increase and maintenance of this valuable resource.
GP/Stationary & Area
Cities/Counties (e.g., Aliso Viejo, Claremont)
- Develop a tree planting policy that strives to accomplish specific % shading of constructed paved and concrete surfaces within five years of construction. -Provide adequate funding to manage and maintain the existing forest, including sufficient funds for tree planting, pest control, scheduled pruning, and removal and replacement of dead trees. -Coordinate with local and regional plant experts in selecting tree species that respect the natural region in which Claremont is located, to help create a healthier, more sustainable urban forest. - Continue to plant new trees (in particular native tree species where appropriate), and work to preserve mature native trees. -Increase the awareness of the benefits of street trees and the community forest through a area wide education effort. -Encourage residents to properly care for and preserve large and beautiful trees on their own private property.
Housing
MS G-12: Provide affordability levels to meet the needs of community residents.
GP/ Mobile Cities/Counties (e.g.,
Aliso Viejo, Claremont)
-Encourage development of affordable housing opportunities throughout the community, as well as development of housing for elderly and low and moderate income households near public transportation services. -Ensure a portion of future residential development is affordable to low and very low income households.
Land Use MS G-13: Promote a visually-cohesive urban form and establish connections between the urban core and outlying portions of the
GP/ Mobile, Stationary, & Area
Cities/Counties (e.g., Aliso Viejo, Claremont)
-Preserve the current pattern of development that encourages more intense and higher density development at the core of the community and less intense uses radiating from the central core. -Create and enhance landscaped greenway, trail and sidewalk connections between neighborhoods and to commercial areas, town centers, and parks.
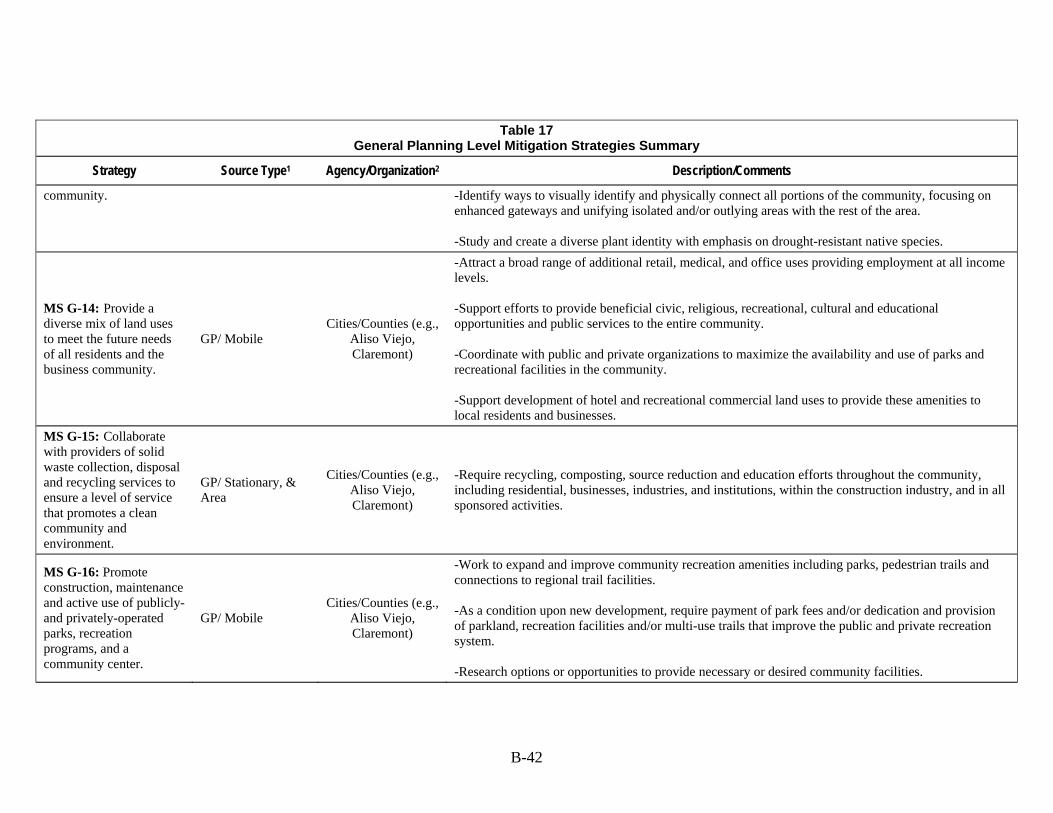
B-42
Table 17 General Planning Level Mitigation Strategies Summary
Strategy Source Type1 Agency/Organization2 Description/Comments
community. -Identify ways to visually identify and physically connect all portions of the community, focusing on enhanced gateways and unifying isolated and/or outlying areas with the rest of the area. -Study and create a diverse plant identity with emphasis on drought-resistant native species.
MS G-14: Provide a diverse mix of land uses to meet the future needs of all residents and the business community.
GP/ Mobile Cities/Counties (e.g.,
Aliso Viejo, Claremont)
-Attract a broad range of additional retail, medical, and office uses providing employment at all income levels. -Support efforts to provide beneficial civic, religious, recreational, cultural and educational opportunities and public services to the entire community. -Coordinate with public and private organizations to maximize the availability and use of parks and recreational facilities in the community. -Support development of hotel and recreational commercial land uses to provide these amenities to local residents and businesses.
MS G-15: Collaborate with providers of solid waste collection, disposal and recycling services to ensure a level of service that promotes a clean community and environment.
GP/ Stationary, & Area
Cities/Counties (e.g., Aliso Viejo, Claremont)
-Require recycling, composting, source reduction and education efforts throughout the community, including residential, businesses, industries, and institutions, within the construction industry, and in all sponsored activities.
MS G-16: Promote construction, maintenance and active use of publicly- and privately-operated parks, recreation programs, and a community center.
GP/ Mobile Cities/Counties (e.g.,
Aliso Viejo, Claremont)
-Work to expand and improve community recreation amenities including parks, pedestrian trails and connections to regional trail facilities. -As a condition upon new development, require payment of park fees and/or dedication and provision of parkland, recreation facilities and/or multi-use trails that improve the public and private recreation system. -Research options or opportunities to provide necessary or desired community facilities.
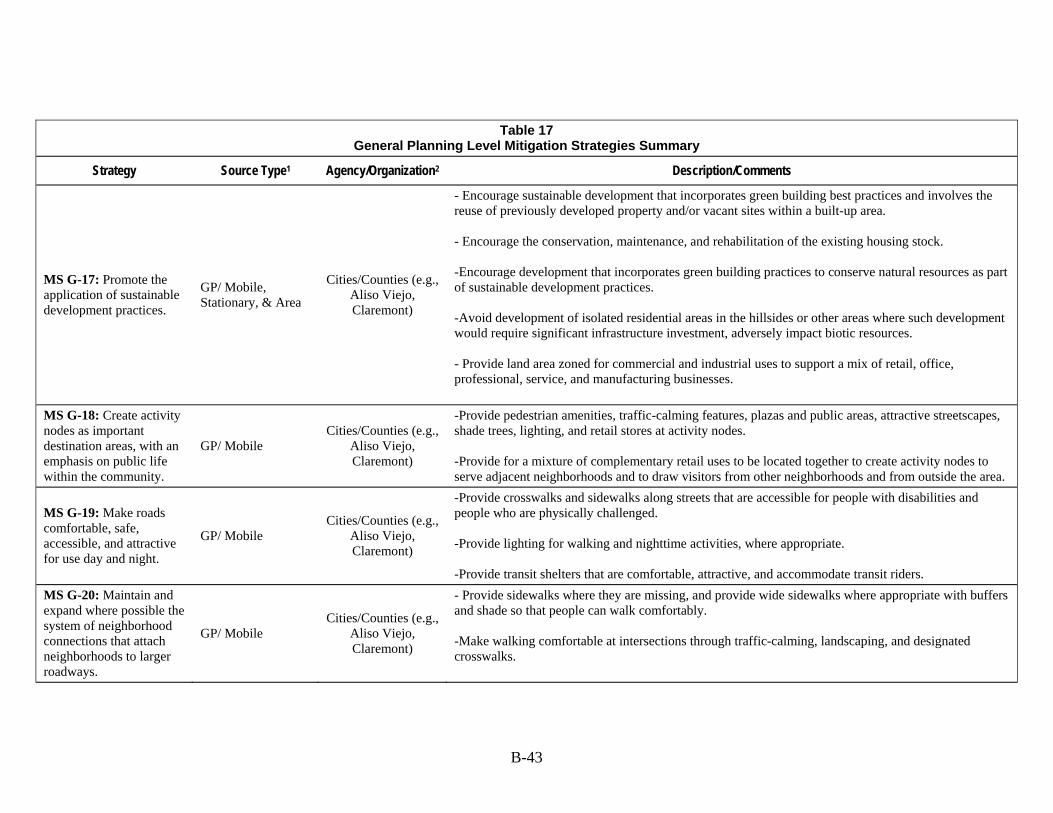
B-43
Table 17 General Planning Level Mitigation Strategies Summary
Strategy Source Type1 Agency/Organization2 Description/Comments
MS G-17: Promote the application of sustainable development practices.
GP/ Mobile, Stationary, & Area
Cities/Counties (e.g., Aliso Viejo, Claremont)
- Encourage sustainable development that incorporates green building best practices and involves the reuse of previously developed property and/or vacant sites within a built-up area. - Encourage the conservation, maintenance, and rehabilitation of the existing housing stock. -Encourage development that incorporates green building practices to conserve natural resources as part of sustainable development practices. -Avoid development of isolated residential areas in the hillsides or other areas where such development would require significant infrastructure investment, adversely impact biotic resources. - Provide land area zoned for commercial and industrial uses to support a mix of retail, office, professional, service, and manufacturing businesses.
MS G-18: Create activity nodes as important destination areas, with an emphasis on public life within the community.
GP/ Mobile Cities/Counties (e.g.,
Aliso Viejo, Claremont)
-Provide pedestrian amenities, traffic-calming features, plazas and public areas, attractive streetscapes, shade trees, lighting, and retail stores at activity nodes. -Provide for a mixture of complementary retail uses to be located together to create activity nodes to serve adjacent neighborhoods and to draw visitors from other neighborhoods and from outside the area.
MS G-19: Make roads comfortable, safe, accessible, and attractive for use day and night.
GP/ Mobile Cities/Counties (e.g.,
Aliso Viejo, Claremont)
-Provide crosswalks and sidewalks along streets that are accessible for people with disabilities and people who are physically challenged. -Provide lighting for walking and nighttime activities, where appropriate. -Provide transit shelters that are comfortable, attractive, and accommodate transit riders.
MS G-20: Maintain and expand where possible the system of neighborhood connections that attach neighborhoods to larger roadways.
GP/ Mobile Cities/Counties (e.g.,
Aliso Viejo, Claremont)
- Provide sidewalks where they are missing, and provide wide sidewalks where appropriate with buffers and shade so that people can walk comfortably. -Make walking comfortable at intersections through traffic-calming, landscaping, and designated crosswalks.
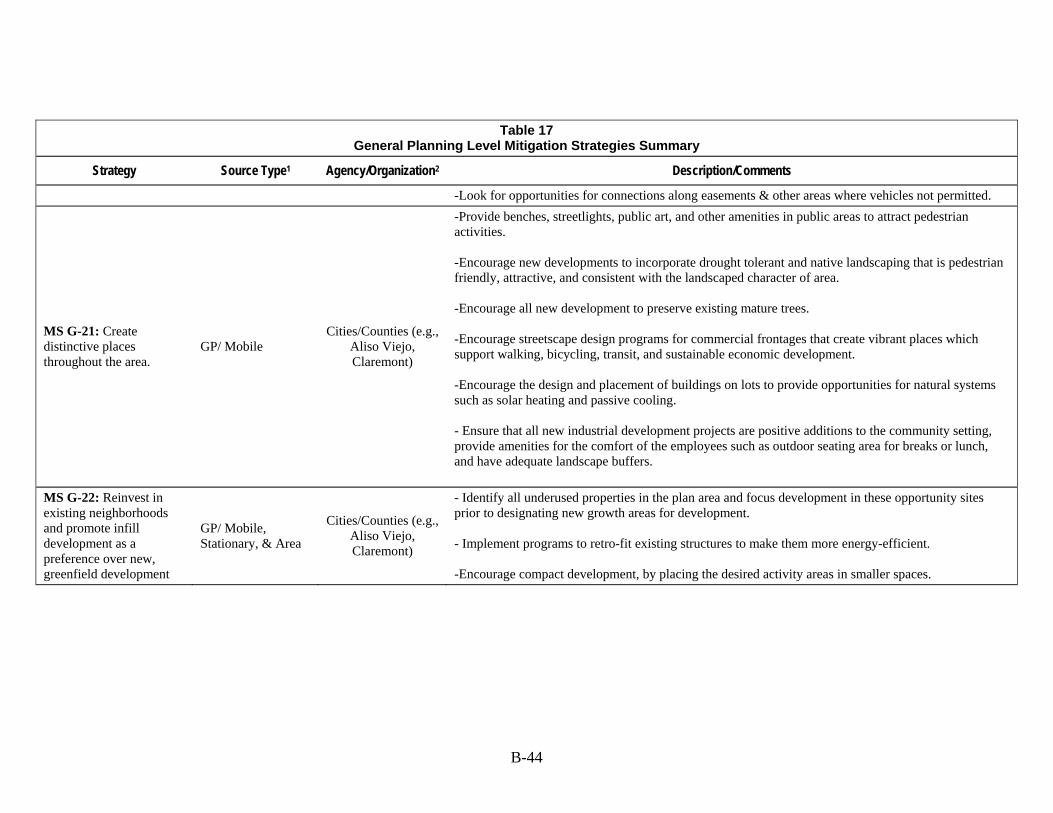
B-44
Table 17 General Planning Level Mitigation Strategies Summary
Strategy Source Type1 Agency/Organization2 Description/Comments
-Look for opportunities for connections along easements & other areas where vehicles not permitted.
MS G-21: Create distinctive places throughout the area.
GP/ Mobile Cities/Counties (e.g.,
Aliso Viejo, Claremont)
-Provide benches, streetlights, public art, and other amenities in public areas to attract pedestrian activities. -Encourage new developments to incorporate drought tolerant and native landscaping that is pedestrian friendly, attractive, and consistent with the landscaped character of area. -Encourage all new development to preserve existing mature trees. -Encourage streetscape design programs for commercial frontages that create vibrant places which support walking, bicycling, transit, and sustainable economic development. -Encourage the design and placement of buildings on lots to provide opportunities for natural systems such as solar heating and passive cooling. - Ensure that all new industrial development projects are positive additions to the community setting, provide amenities for the comfort of the employees such as outdoor seating area for breaks or lunch, and have adequate landscape buffers.
MS G-22: Reinvest in existing neighborhoods and promote infill development as a preference over new, greenfield development
GP/ Mobile, Stationary, & Area
Cities/Counties (e.g., Aliso Viejo, Claremont)
- Identify all underused properties in the plan area and focus development in these opportunity sites prior to designating new growth areas for development. - Implement programs to retro-fit existing structures to make them more energy-efficient. -Encourage compact development, by placing the desired activity areas in smaller spaces.
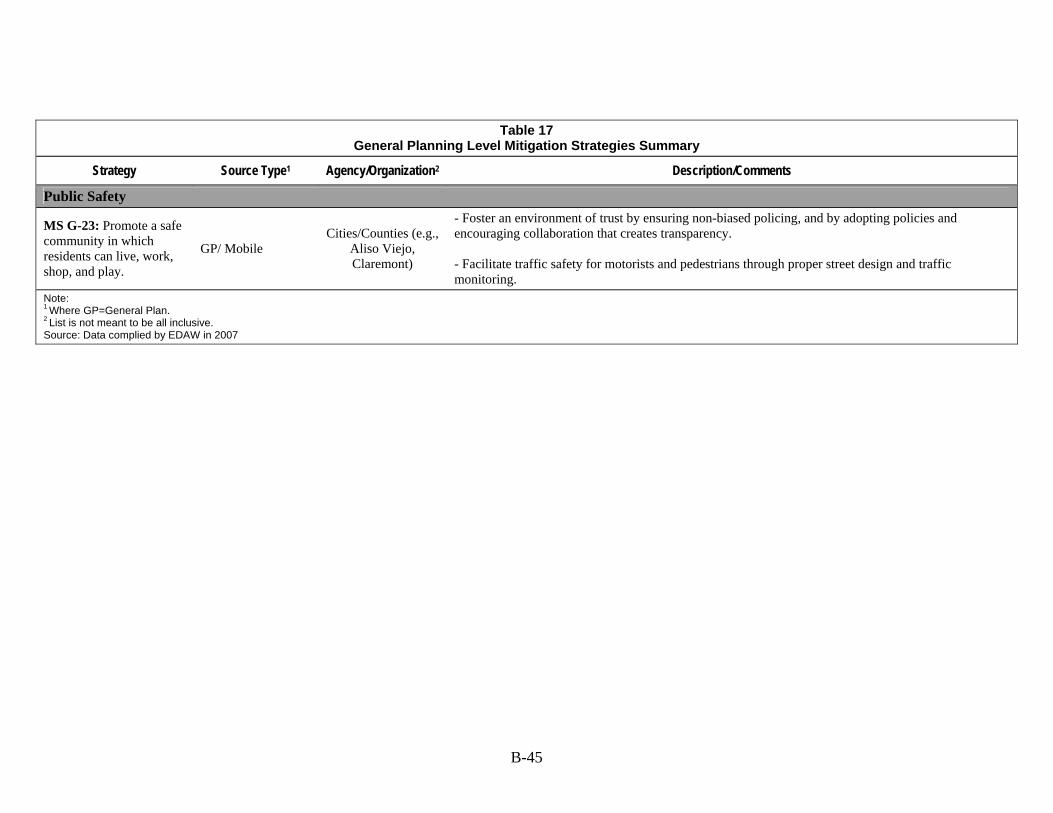
B-45
Table 17 General Planning Level Mitigation Strategies Summary
Strategy Source Type1 Agency/Organization2 Description/Comments
Public Safety
MS G-23: Promote a safe community in which residents can live, work, shop, and play.
GP/ Mobile Cities/Counties (e.g.,
Aliso Viejo, Claremont)
- Foster an environment of trust by ensuring non-biased policing, and by adopting policies and encouraging collaboration that creates transparency. - Facilitate traffic safety for motorists and pedestrians through proper street design and traffic monitoring.
Note: 1 Where GP=General Plan.
2 List is not meant to be all inclusive.
Source: Data complied by EDAW in 2007
Appendix C: Rule and Regulation Summary
CEQAand
Climate Change
Appendix C
Appendix C
Rule and Regulation Summary
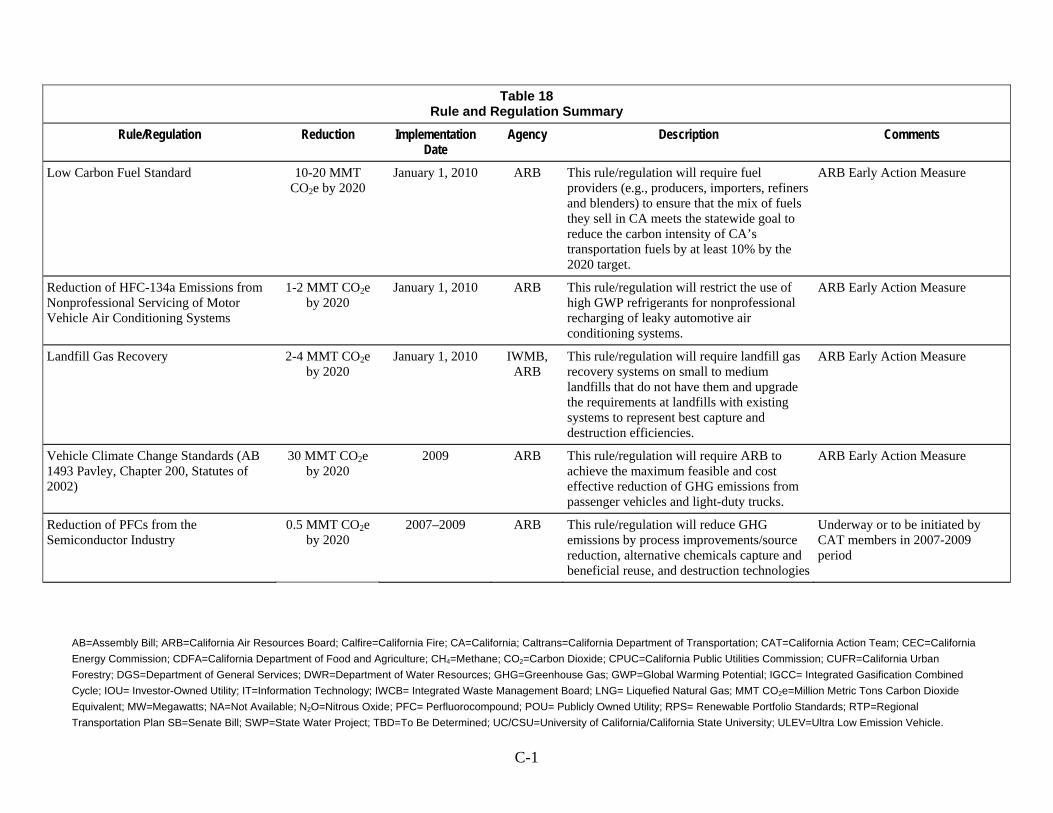
AB=Assembly Bill; ARB=California Air Resources Board; Calfire=California Fire; CA=California; Caltrans=California Department of Transportation; CAT=California Action Team; CEC=California
Energy Commission; CDFA=California Department of Food and Agriculture; CH4=Methane; CO2=Carbon Dioxide; CPUC=California Public Utilities Commission; CUFR=California Urban
Forestry; DGS=Department of General Services; DWR=Department of Water Resources; GHG=Greenhouse Gas; GWP=Global Warming Potential; IGCC= Integrated Gasification Combined
Cycle; IOU= Investor-Owned Utility; IT=Information Technology; IWCB= Integrated Waste Management Board; LNG= Liquefied Natural Gas; MMT CO2e=Million Metric Tons Carbon Dioxide
Equivalent; MW=Megawatts; NA=Not Available; N2O=Nitrous Oxide; PFC= Perfluorocompound; POU= Publicly Owned Utility; RPS= Renewable Portfolio Standards; RTP=Regional
Transportation Plan SB=Senate Bill; SWP=State Water Project; TBD=To Be Determined; UC/CSU=University of California/California State University; ULEV=Ultra Low Emission Vehicle.
C-1
Table 18
Rule and Regulation Summary Rule/Regulation Reduction Implementation
Date Agency Description Comments
Low Carbon Fuel Standard 10-20 MMT CO2e by 2020
January 1, 2010 ARB This rule/regulation will require fuel providers (e.g., producers, importers, refiners and blenders) to ensure that the mix of fuels they sell in CA meets the statewide goal to reduce the carbon intensity of CA’s transportation fuels by at least 10% by the 2020 target.
ARB Early Action Measure
Reduction of HFC-134a Emissions from Nonprofessional Servicing of Motor Vehicle Air Conditioning Systems
1-2 MMT CO2e by 2020
January 1, 2010 ARB This rule/regulation will restrict the use of high GWP refrigerants for nonprofessional recharging of leaky automotive air conditioning systems.
ARB Early Action Measure
Landfill Gas Recovery 2-4 MMT CO2e by 2020
January 1, 2010 IWMB, ARB
This rule/regulation will require landfill gas recovery systems on small to medium landfills that do not have them and upgrade the requirements at landfills with existing systems to represent best capture and destruction efficiencies.
ARB Early Action Measure
Vehicle Climate Change Standards (AB 1493 Pavley, Chapter 200, Statutes of 2002)
30 MMT CO2e by 2020
2009 ARB This rule/regulation will require ARB to achieve the maximum feasible and cost effective reduction of GHG emissions from passenger vehicles and light-duty trucks.
ARB Early Action Measure
Reduction of PFCs from the Semiconductor Industry
0.5 MMT CO2e by 2020
2007–2009 ARB This rule/regulation will reduce GHG emissions by process improvements/source reduction, alternative chemicals capture and beneficial reuse, and destruction technologies
Underway or to be initiated by CAT members in 2007-2009 period
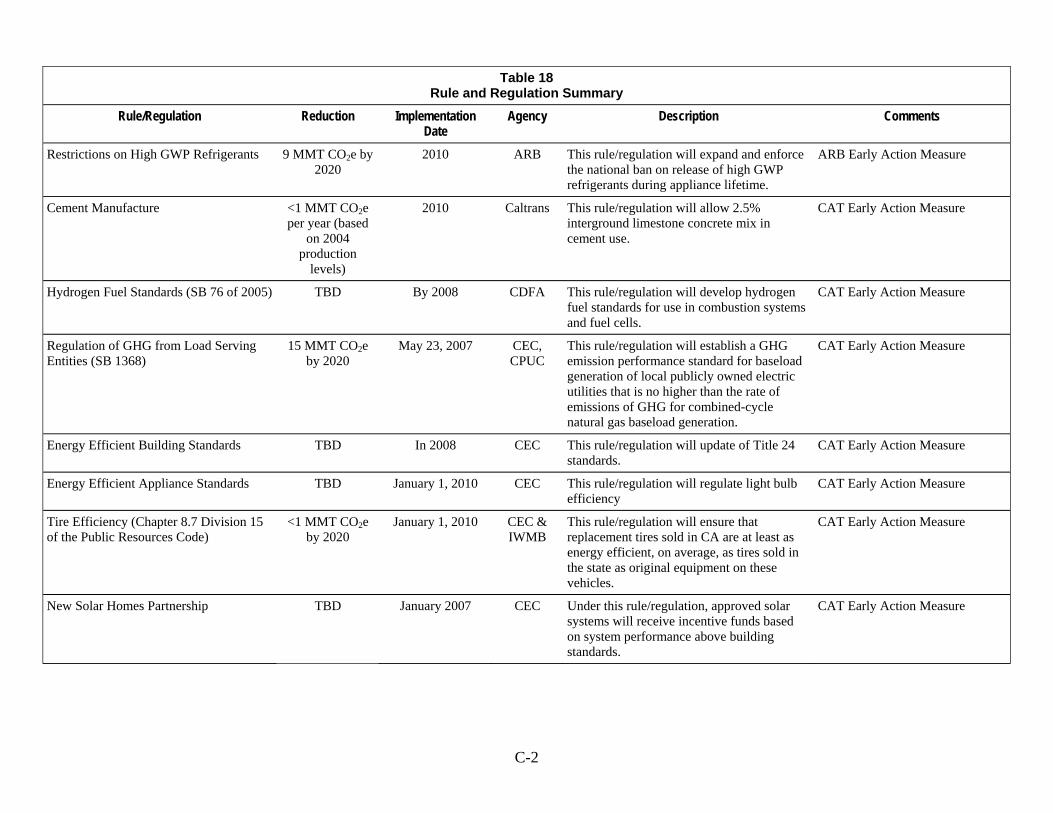
C-2
Table 18 Rule and Regulation Summary
Rule/Regulation Reduction Implementation Date
Agency Description Comments
Restrictions on High GWP Refrigerants 9 MMT CO2e by 2020
2010 ARB This rule/regulation will expand and enforce the national ban on release of high GWP refrigerants during appliance lifetime.
ARB Early Action Measure
Cement Manufacture <1 MMT CO2e per year (based
on 2004 production
levels)
2010 Caltrans This rule/regulation will allow 2.5% interground limestone concrete mix in cement use.
CAT Early Action Measure
Hydrogen Fuel Standards (SB 76 of 2005) TBD By 2008 CDFA This rule/regulation will develop hydrogen fuel standards for use in combustion systems and fuel cells.
CAT Early Action Measure
Regulation of GHG from Load Serving Entities (SB 1368)
15 MMT CO2e by 2020
May 23, 2007 CEC, CPUC
This rule/regulation will establish a GHG emission performance standard for baseload generation of local publicly owned electric utilities that is no higher than the rate of emissions of GHG for combined-cycle natural gas baseload generation.
CAT Early Action Measure
Energy Efficient Building Standards TBD In 2008 CEC This rule/regulation will update of Title 24 standards.
CAT Early Action Measure
Energy Efficient Appliance Standards TBD January 1, 2010 CEC This rule/regulation will regulate light bulb efficiency
CAT Early Action Measure
Tire Efficiency (Chapter 8.7 Division 15 of the Public Resources Code)
<1 MMT CO2e by 2020
January 1, 2010 CEC & IWMB
This rule/regulation will ensure that replacement tires sold in CA are at least as energy efficient, on average, as tires sold in the state as original equipment on these vehicles.
CAT Early Action Measure
New Solar Homes Partnership TBD January 2007 CEC Under this rule/regulation, approved solar systems will receive incentive funds based on system performance above building standards.
CAT Early Action Measure
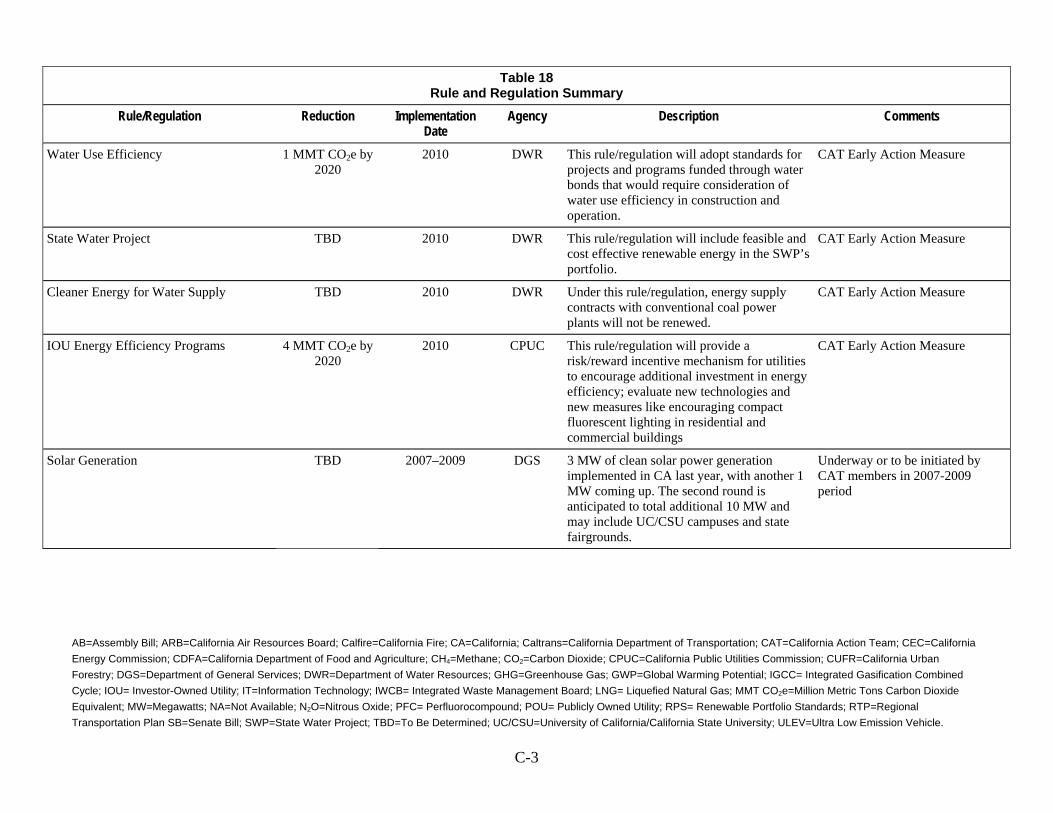
AB=Assembly Bill; ARB=California Air Resources Board; Calfire=California Fire; CA=California; Caltrans=California Department of Transportation; CAT=California Action Team; CEC=California
Energy Commission; CDFA=California Department of Food and Agriculture; CH4=Methane; CO2=Carbon Dioxide; CPUC=California Public Utilities Commission; CUFR=California Urban
Forestry; DGS=Department of General Services; DWR=Department of Water Resources; GHG=Greenhouse Gas; GWP=Global Warming Potential; IGCC= Integrated Gasification Combined
Cycle; IOU= Investor-Owned Utility; IT=Information Technology; IWCB= Integrated Waste Management Board; LNG= Liquefied Natural Gas; MMT CO2e=Million Metric Tons Carbon Dioxide
Equivalent; MW=Megawatts; NA=Not Available; N2O=Nitrous Oxide; PFC= Perfluorocompound; POU= Publicly Owned Utility; RPS= Renewable Portfolio Standards; RTP=Regional
Transportation Plan SB=Senate Bill; SWP=State Water Project; TBD=To Be Determined; UC/CSU=University of California/California State University; ULEV=Ultra Low Emission Vehicle.
C-3
Table 18 Rule and Regulation Summary
Rule/Regulation Reduction Implementation Date
Agency Description Comments
Water Use Efficiency 1 MMT CO2e by 2020
2010 DWR This rule/regulation will adopt standards for projects and programs funded through water bonds that would require consideration of water use efficiency in construction and operation.
CAT Early Action Measure
State Water Project TBD 2010 DWR This rule/regulation will include feasible and cost effective renewable energy in the SWP’s portfolio.
CAT Early Action Measure
Cleaner Energy for Water Supply TBD 2010 DWR Under this rule/regulation, energy supply contracts with conventional coal power plants will not be renewed.
CAT Early Action Measure
IOU Energy Efficiency Programs 4 MMT CO2e by 2020
2010 CPUC This rule/regulation will provide a risk/reward incentive mechanism for utilities to encourage additional investment in energy efficiency; evaluate new technologies and new measures like encouraging compact fluorescent lighting in residential and commercial buildings
CAT Early Action Measure
Solar Generation TBD 2007–2009 DGS 3 MW of clean solar power generation implemented in CA last year, with another 1 MW coming up. The second round is anticipated to total additional 10 MW and may include UC/CSU campuses and state fairgrounds.
Underway or to be initiated by CAT members in 2007-2009 period
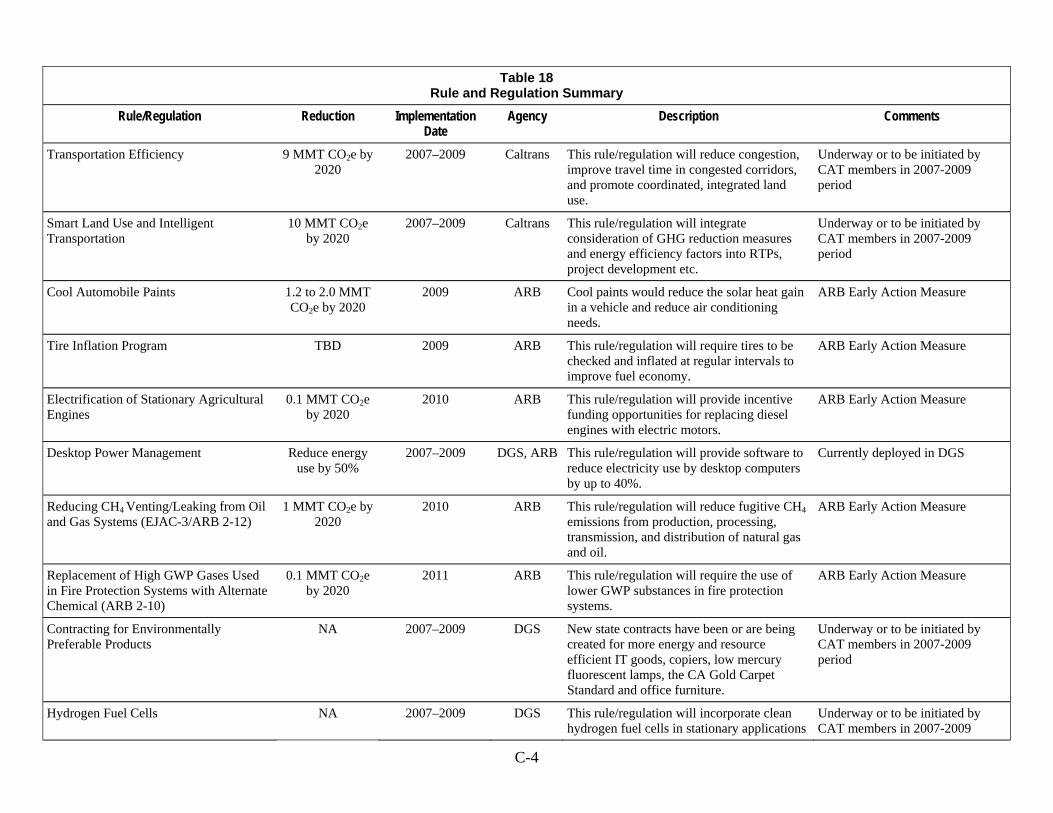
C-4
Table 18 Rule and Regulation Summary
Rule/Regulation Reduction Implementation Date
Agency Description Comments
Transportation Efficiency 9 MMT CO2e by 2020
2007–2009 Caltrans This rule/regulation will reduce congestion, improve travel time in congested corridors, and promote coordinated, integrated land use.
Underway or to be initiated by CAT members in 2007-2009 period
Smart Land Use and Intelligent Transportation
10 MMT CO2e by 2020
2007–2009 Caltrans This rule/regulation will integrate consideration of GHG reduction measures and energy efficiency factors into RTPs, project development etc.
Underway or to be initiated by CAT members in 2007-2009 period
Cool Automobile Paints 1.2 to 2.0 MMT CO2e by 2020
2009 ARB Cool paints would reduce the solar heat gain in a vehicle and reduce air conditioning needs.
ARB Early Action Measure
Tire Inflation Program TBD 2009 ARB This rule/regulation will require tires to be checked and inflated at regular intervals to improve fuel economy.
ARB Early Action Measure
Electrification of Stationary Agricultural Engines
0.1 MMT CO2e by 2020
2010 ARB This rule/regulation will provide incentive funding opportunities for replacing diesel engines with electric motors.
ARB Early Action Measure
Desktop Power Management Reduce energy use by 50%
2007–2009 DGS, ARB This rule/regulation will provide software to reduce electricity use by desktop computers by up to 40%.
Currently deployed in DGS
Reducing CH4 Venting/Leaking from Oil and Gas Systems (EJAC-3/ARB 2-12)
1 MMT CO2e by 2020
2010 ARB This rule/regulation will reduce fugitive CH4 emissions from production, processing, transmission, and distribution of natural gas and oil.
ARB Early Action Measure
Replacement of High GWP Gases Used in Fire Protection Systems with Alternate Chemical (ARB 2-10)
0.1 MMT CO2e by 2020
2011 ARB This rule/regulation will require the use of lower GWP substances in fire protection systems.
ARB Early Action Measure
Contracting for Environmentally Preferable Products
NA 2007–2009 DGS New state contracts have been or are being created for more energy and resource efficient IT goods, copiers, low mercury fluorescent lamps, the CA Gold Carpet Standard and office furniture.
Underway or to be initiated by CAT members in 2007-2009 period
Hydrogen Fuel Cells NA 2007–2009 DGS This rule/regulation will incorporate clean hydrogen fuel cells in stationary applications
Underway or to be initiated by CAT members in 2007-2009
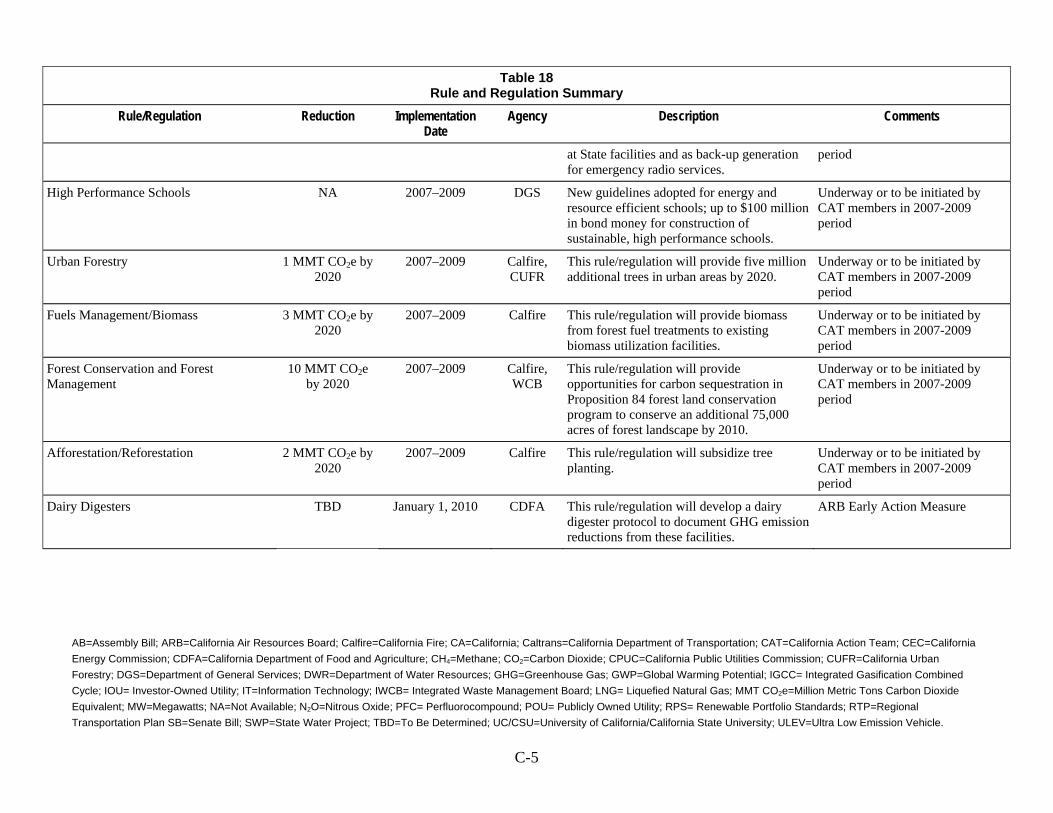
AB=Assembly Bill; ARB=California Air Resources Board; Calfire=California Fire; CA=California; Caltrans=California Department of Transportation; CAT=California Action Team; CEC=California
Energy Commission; CDFA=California Department of Food and Agriculture; CH4=Methane; CO2=Carbon Dioxide; CPUC=California Public Utilities Commission; CUFR=California Urban
Forestry; DGS=Department of General Services; DWR=Department of Water Resources; GHG=Greenhouse Gas; GWP=Global Warming Potential; IGCC= Integrated Gasification Combined
Cycle; IOU= Investor-Owned Utility; IT=Information Technology; IWCB= Integrated Waste Management Board; LNG= Liquefied Natural Gas; MMT CO2e=Million Metric Tons Carbon Dioxide
Equivalent; MW=Megawatts; NA=Not Available; N2O=Nitrous Oxide; PFC= Perfluorocompound; POU= Publicly Owned Utility; RPS= Renewable Portfolio Standards; RTP=Regional
Transportation Plan SB=Senate Bill; SWP=State Water Project; TBD=To Be Determined; UC/CSU=University of California/California State University; ULEV=Ultra Low Emission Vehicle.
C-5
Table 18 Rule and Regulation Summary
Rule/Regulation Reduction Implementation Date
Agency Description Comments
at State facilities and as back-up generation for emergency radio services.
period
High Performance Schools NA 2007–2009 DGS New guidelines adopted for energy and resource efficient schools; up to $100 million in bond money for construction of sustainable, high performance schools.
Underway or to be initiated by CAT members in 2007-2009 period
Urban Forestry 1 MMT CO2e by 2020
2007–2009 Calfire, CUFR
This rule/regulation will provide five million additional trees in urban areas by 2020.
Underway or to be initiated by CAT members in 2007-2009 period
Fuels Management/Biomass 3 MMT CO2e by 2020
2007–2009 Calfire This rule/regulation will provide biomass from forest fuel treatments to existing biomass utilization facilities.
Underway or to be initiated by CAT members in 2007-2009 period
Forest Conservation and Forest Management
10 MMT CO2e by 2020
2007–2009 Calfire, WCB
This rule/regulation will provide opportunities for carbon sequestration in Proposition 84 forest land conservation program to conserve an additional 75,000 acres of forest landscape by 2010.
Underway or to be initiated by CAT members in 2007-2009 period
Afforestation/Reforestation 2 MMT CO2e by 2020
2007–2009 Calfire This rule/regulation will subsidize tree planting.
Underway or to be initiated by CAT members in 2007-2009 period
Dairy Digesters TBD January 1, 2010 CDFA This rule/regulation will develop a dairy digester protocol to document GHG emission reductions from these facilities.
ARB Early Action Measure
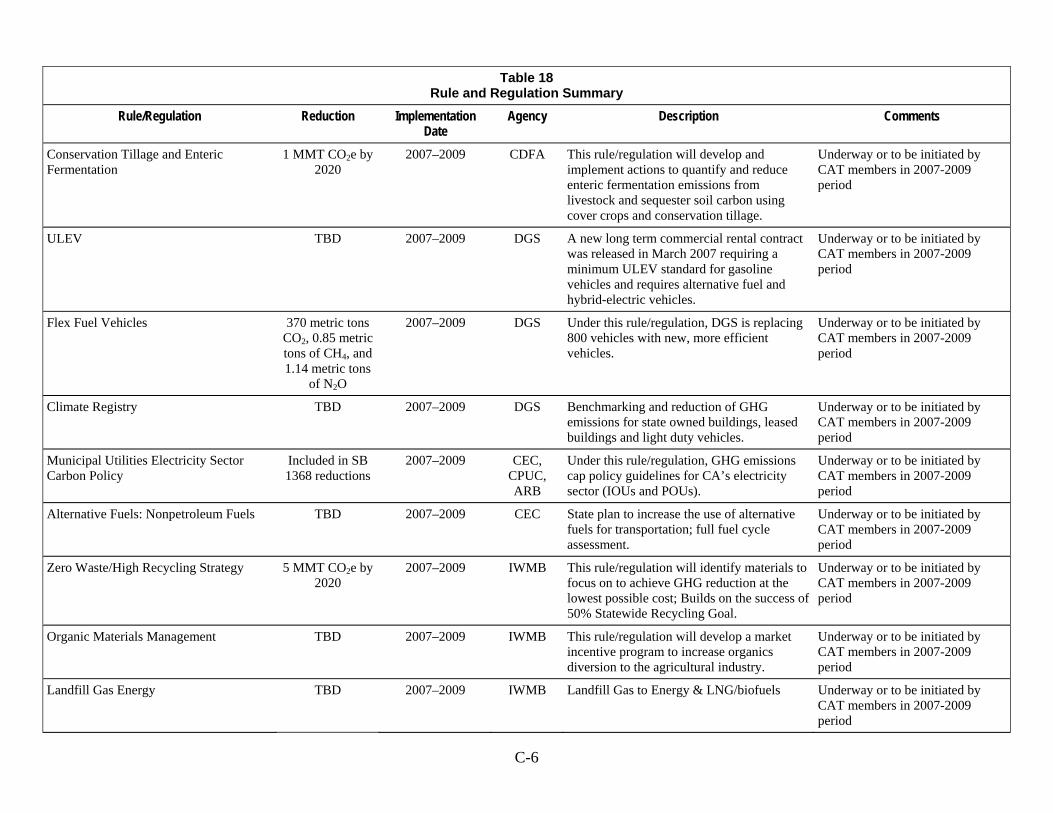
C-6
Table 18 Rule and Regulation Summary
Rule/Regulation Reduction Implementation Date
Agency Description Comments
Conservation Tillage and Enteric Fermentation
1 MMT CO2e by 2020
2007–2009 CDFA This rule/regulation will develop and implement actions to quantify and reduce enteric fermentation emissions from livestock and sequester soil carbon using cover crops and conservation tillage.
Underway or to be initiated by CAT members in 2007-2009 period
ULEV TBD 2007–2009 DGS A new long term commercial rental contract was released in March 2007 requiring a minimum ULEV standard for gasoline vehicles and requires alternative fuel and hybrid-electric vehicles.
Underway or to be initiated by CAT members in 2007-2009 period
Flex Fuel Vehicles 370 metric tons CO2, 0.85 metric tons of CH4, and 1.14 metric tons
of N2O
2007–2009 DGS Under this rule/regulation, DGS is replacing 800 vehicles with new, more efficient vehicles.
Underway or to be initiated by CAT members in 2007-2009 period
Climate Registry TBD 2007–2009 DGS Benchmarking and reduction of GHG emissions for state owned buildings, leased buildings and light duty vehicles.
Underway or to be initiated by CAT members in 2007-2009 period
Municipal Utilities Electricity Sector Carbon Policy
Included in SB 1368 reductions
2007–2009 CEC, CPUC, ARB
Under this rule/regulation, GHG emissions cap policy guidelines for CA’s electricity sector (IOUs and POUs).
Underway or to be initiated by CAT members in 2007-2009 period
Alternative Fuels: Nonpetroleum Fuels TBD 2007–2009 CEC State plan to increase the use of alternative fuels for transportation; full fuel cycle assessment.
Underway or to be initiated by CAT members in 2007-2009 period
Zero Waste/High Recycling Strategy 5 MMT CO2e by 2020
2007–2009 IWMB This rule/regulation will identify materials to focus on to achieve GHG reduction at the lowest possible cost; Builds on the success of 50% Statewide Recycling Goal.
Underway or to be initiated by CAT members in 2007-2009 period
Organic Materials Management TBD 2007–2009 IWMB This rule/regulation will develop a market incentive program to increase organics diversion to the agricultural industry.
Underway or to be initiated by CAT members in 2007-2009 period
Landfill Gas Energy TBD 2007–2009 IWMB Landfill Gas to Energy & LNG/biofuels Underway or to be initiated by CAT members in 2007-2009 period
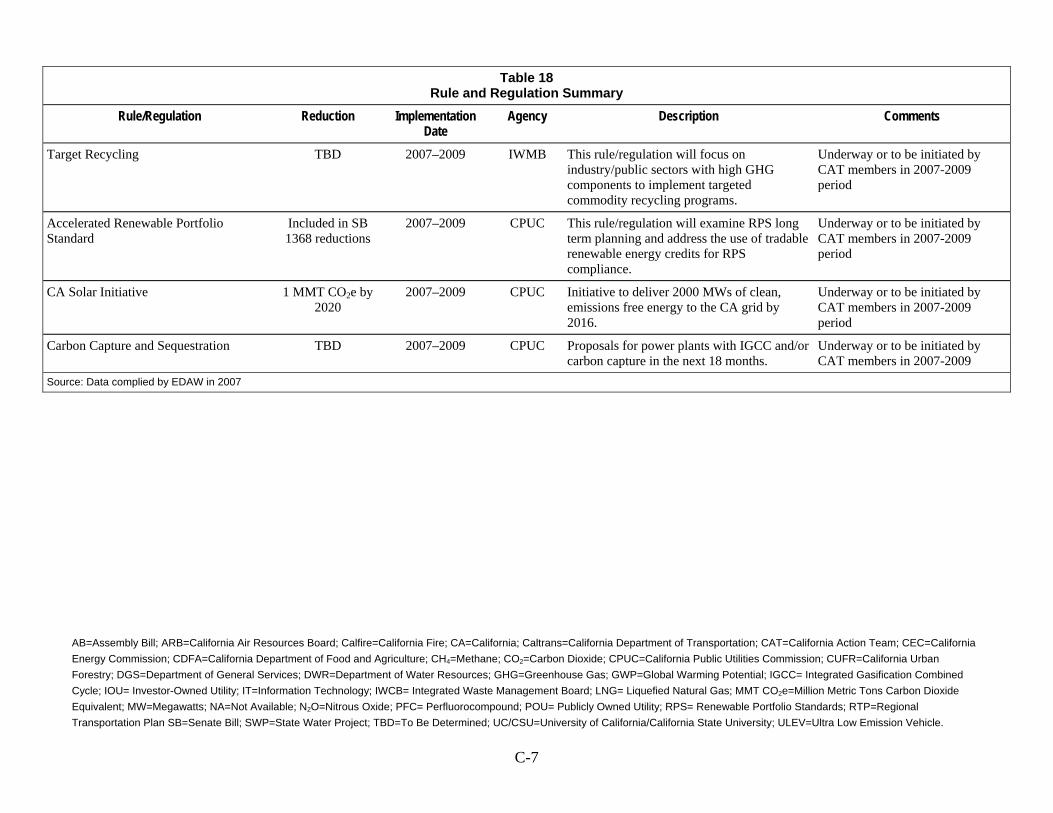
AB=Assembly Bill; ARB=California Air Resources Board; Calfire=California Fire; CA=California; Caltrans=California Department of Transportation; CAT=California Action Team; CEC=California
Energy Commission; CDFA=California Department of Food and Agriculture; CH4=Methane; CO2=Carbon Dioxide; CPUC=California Public Utilities Commission; CUFR=California Urban
Forestry; DGS=Department of General Services; DWR=Department of Water Resources; GHG=Greenhouse Gas; GWP=Global Warming Potential; IGCC= Integrated Gasification Combined
Cycle; IOU= Investor-Owned Utility; IT=Information Technology; IWCB= Integrated Waste Management Board; LNG= Liquefied Natural Gas; MMT CO2e=Million Metric Tons Carbon Dioxide
Equivalent; MW=Megawatts; NA=Not Available; N2O=Nitrous Oxide; PFC= Perfluorocompound; POU= Publicly Owned Utility; RPS= Renewable Portfolio Standards; RTP=Regional
Transportation Plan SB=Senate Bill; SWP=State Water Project; TBD=To Be Determined; UC/CSU=University of California/California State University; ULEV=Ultra Low Emission Vehicle.
C-7
Table 18 Rule and Regulation Summary
Rule/Regulation Reduction Implementation Date
Agency Description Comments
Target Recycling TBD 2007–2009 IWMB This rule/regulation will focus on industry/public sectors with high GHG components to implement targeted commodity recycling programs.
Underway or to be initiated by CAT members in 2007-2009 period
Accelerated Renewable Portfolio Standard
Included in SB 1368 reductions
2007–2009 CPUC This rule/regulation will examine RPS long term planning and address the use of tradable renewable energy credits for RPS compliance.
Underway or to be initiated by CAT members in 2007-2009 period
CA Solar Initiative 1 MMT CO2e by 2020
2007–2009 CPUC Initiative to deliver 2000 MWs of clean, emissions free energy to the CA grid by 2016.
Underway or to be initiated by CAT members in 2007-2009 period
Carbon Capture and Sequestration TBD 2007–2009 CPUC Proposals for power plants with IGCC and/or carbon capture in the next 18 months.
Underway or to be initiated by CAT members in 2007-2009
Source: Data complied by EDAW in 2007

Association of Environmental Professionals 2009 CEQA Guidelines Appendices
244
CEQA APPENDIX G: ENVIRONMENTAL CHECKLIST FORM
Association of Environmental Professionals 2009 CEQA Guidelines Appendices
245
Association of Environmental Professionals 2009 CEQA Guidelines Appendices
246

Association of Environmental Professionals 2009 CEQA Guidelines Appendices
247
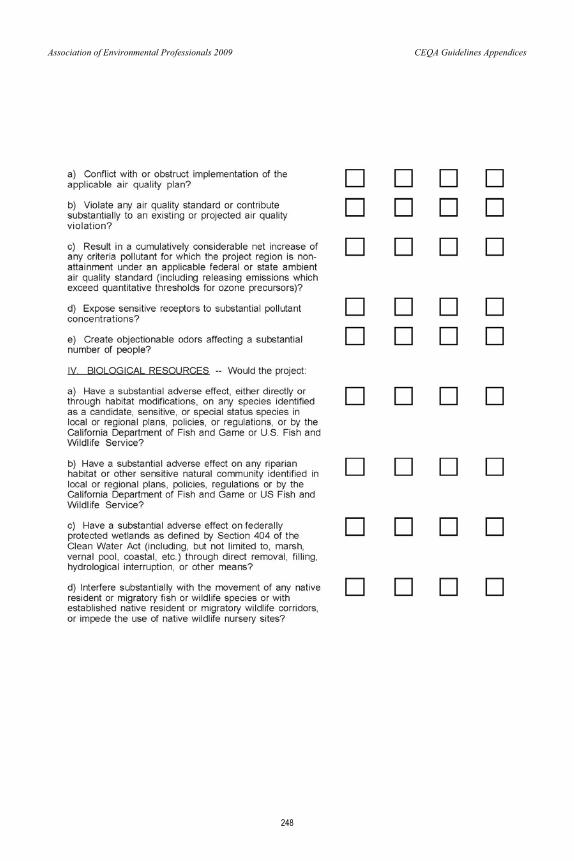
Association of Environmental Professionals 2009 CEQA Guidelines Appendices
248
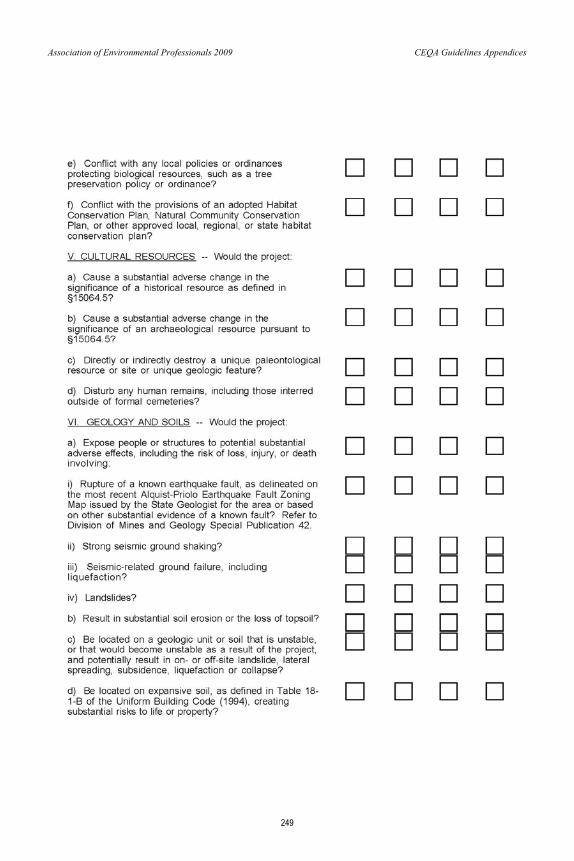
Association of Environmental Professionals 2009 CEQA Guidelines Appendices
249

Association of Environmental Professionals 2009 CEQA Guidelines Appendices
250

Association of Environmental Professionals 2009 CEQA Guidelines Appendices
251
Association of Environmental Professionals 2009 CEQA Guidelines Appendices
252
Association of Environmental Professionals 2009 CEQA Guidelines Appendices
253
Association of Environmental Professionals 2009 CEQA Guidelines Appendices
254
Association of Environmental Professionals 2009 CEQA Guidelines Appendices
255

Association of Environmental Professionals 2009 CEQA Guidelines Appendices
256
CEQA APPENDIX H:ENVIRONMENTAL INFORMATION FORM
4,8 Greenhouse Gas Emissions
4,8 GREENHOUSE GAS EMISSIONS
This section evaluates the greenhouse gas em¡ssions (GHG) impacts of the proposed Plan. Theinformation presented was compiled from multiple sources, including the Energy Policy lnitiativesCenter (EPIC) at the University of San Diego School of Law, A related topic, the impacts of increasingGHG emissions on global climate change, is discussed in Appendix F of the ElR.
4.8.1 EXTST|NG CONDTTTONS
California law defines GHGs as any of the following compounds: CO2, CHa, N2O, hydrofluorocarbons(HFCs), perfluorocarbons (PFCs), and sulfur hexafluorlde {SF6) (H&SC Section 38505(e)). CO2, followed byCH¿ and NzO, is the most common GHG.
Global warming potential {GWP) is a concept developed to compare the ability of each GHG to trap heatin the atmosphere relative to another gas; the GWP is based on several factors, including the relativeeffectiveness of a gas to absorb infrared radiation and length of time that the gas remains in theatmosphere ("atmospheric lifetime"). The GWP of each gas is measured relative to CO2, the mostabundant GHG. GHGs with lower emissions rates than CO2 may still contribute to climate changebecause they are more effective at absorbing outgoing infrared radiation than COz. When accounting forGHGs, emissions are expressed in terms of COz equivalents (COae). The concept of COze is used toaccount for the different GWP of GHGs to absorb infrared radiation. The reference gas for GWP is COz;
therefore, COz has a GWP of 1. The other main GHGs that have been attributed to human activityinclude CH+, which has a GWP of 2L, and NzO, which has a GWP of 31.0,
Sources of COz include combustion of fossil fuels (coal, oil, natural gas, gasoline, and wood), CHq is themain component of natural gas and also arises naturally from anaerobic decay of organic matter,Sources of NzO include combustion of fossil fuels and industrial processes such as nylon production andproduction of nitric acid. Other GHGs are present in trace amounts in the atmosphere and are generatedfrom various industrial oi other uses.
4.8.1.1 EXISTING GHG EMISSIONS
GlobalGHG Emissions
The World Resources lnst¡tute (WRl 2014) estimated that worldwide emissions in 2011were 43,8 billionmetric tons (MT) CO2e, of-which the United States contributed the greatest percentage after China.Table 4,8-L shows the top L0 emitters by country, which contribute 63 percent of global emissions,When accounting for GHGs, emissions are typically quantified in MT or millions of metric tons (MMT)and are shown as MMT COze.
San Diego Forward: The Regional PlanProgram Environmental lmpact Report
Page 4,8-1
4.8 Greenhouse Gas Emissions
Table 4.8'1Top 10 GHG-Emltting Countries, 2011
PercentMMT CO2e in
20tLrCountry or Area2410,552China156,550United States62,486lndia52,374Russia31,307Japan3L,L3TBrazil2883Germany283slndonesia27t6Canada27L6lran
Source: WRI 2014
California GHG Emissions
ln 2oL2,california accounted for approxirnately seven percent of u.S. emissions. The State of California
GHG lnventory, prepared by ARB, identified and quantified statewide GHG emissions. The inventory
includes estimâtes for CO2, CH¿, NaO, SFo, HFCs, and PFCs, and is summarized in Table 4,8-2 (ARB 201aa)'
The inventory is divided into àight broad categories of emissions: Agriculture, Commercial, Elecilicity
Generation, lndustrial, Residential, Transportation, Recycling and Waste, and High GWP Gases'
Transportaiion was the sector with the largest percentage of GHG emissions (36 percent), followed by
electricity generation (21 percent), and industrial sources (19 percent), The remaining sectors each
accounted for less than 10 percent of overall emissions.
Table 4.8-2
State of California Greenhouse Gas Emlsslons by Sector - 2012
Pêrcent of Total2012 Emlssions
Totàl 2012Emlsslons
(MMTCOre)Sector
8%37.86culture and Fo
3%14.20Commercial2L%95,09Electricity Generationt9To89.16lnd ustrial6%28.09Residential36%167.38Transportation2%8.49Recvcling and Waste4%18.41Hieh GWP Gases
L00%,4s8.58TotalSource: ARB 2014a
San Diego Region GHG Emissions
Regional GHG emissions for existing conditions (2012) are calculated based on the current GHG
inventory. The inventory is based on existing sources and activity within the region. GHG emissions are
divided into 16 categories. Calculations and assumptions are described in Appendix G-L to the EIR' Total
6HG emissions ¡n the San Diego region as of 2012 are over 35 MMT COze as shown in Table 4'B-3.
San Dicgo Forward: Tho RegionalPlan
Program Environmental I mpact Report
Page 4.8-2
4.8 Greenhouse Gas Emissions
Table 4.8-3Total Greenhouse Gas Emissions in the San Diego Region, 2012
Source: Appendix G-1 to the ElR,
4,8,L.2 CLIMATE CHANGE
A related topic, the impacts of increasing GHG emissions on climate change, is discussed in Appendix F
to the ElR. As diseussed in Appendix F, during the timeframe of the proposed Plan, climate change
effects likely to exacerbate the proposed Plan's impacts on selected resource areas include, but are notlimited to:
o Higher annual average temperaturer More days of extreme high temperatureso Longer and more humid heat waves
r More ¡ntense and frequent droughtr lncreased evaporation from soil, surface waters
o More frequent, severe wildfireso Sea level rise
r Less frequent, more intense rainstorms, more frequent watershed flood events
o More frequent and severe coastal floodingr Spreading of pests and vector-borne diseases
ln general, the effects listed above would increase between 2020 and 2050,
Annual Emisslons(MMTCO"el
Percentage ofAnnual Emlsslons
Sector
On-Road Transportation 15,76 43,7%
Electricity 7.9V 22.Lo/"
Natural Gas 2.84 7.9%
Solid Waste 1,75 4.8%
Other Fuels r,64 4.6%
lnd ustrial 1,43 4,0%
Aviation r.37 3.8%
0.92 2.6%Off-Road Equipment and Vehicles
Wildfire 0.81 2.2%
t.8%Other - Thermal Cogeneration 0,640,52 L.4%Water Supply and Conveyance
Wastewater 0.16 0.4%
Rail 0.11. 03%Agriculture 0.08 0.2%
0.05 0.t%Marine Vessels (excluding pleasure craft)Development + Sequestrat¡on -0.6s n/a
100%Total' 35.4
San Diego Forward: The Regional Plan
Program Environmental lmpact Report
Page 4.8-3

4.8 Greenhouse Gas Emissions
4,8,2 REGULATORYSETTING
4,8,2.T FEDERAL LAWS, REGULATIONS, PI.ANS, AND POLIC¡ES
Energy Poticy and Conservat¡on Action of 1975 and Corporate Average Fuel Standards
The Energy Policy and Conservation Act of L975142 USC Section 6201 [1975])establishes fuel economy
standards for on-road motor vehicles sold in the United States'
Compliance with federal fuel economy standards is determined through the Corporate Average Fuel
Economy (CAFE) program on the basis of each manufacturer's average fuel economy for the portion of
iti vehicles produced for sale in the United States.
On April L,2OIO, USDOT and USEPA established new federal rules that set the first-ever national GHG
emissions standards and significantly increased the fuel economy of all new passenger cars and light
trucks sold in the United States. The standards set a requirement to meet an average fuel economy of
34.1 miles per gallon by 2016. ln August 2012, the federal government adopted the second rule that
increases fuel economy for the fleet of passenger cars, light-duty trucks, and medium-duty passenger
vehicles for model years,2017 to 2025 to average fuel economy of 54.5 miles per gallon by 2025.
Because NHTSA cannot set standards beyond model year 202L due to statutory obligations and the
rules' long timeframe, a mid-term evaluation is included in the rule. Standards for model years 2022
through 2025 have not been formally adopted by NHTSA. ln August 2011, NHTSA and USEPA released
medium- and heavv-duty vehicle standards for model years 2014 to 2018. Tighter standards for these
vehicles for model years after 2018 are expected to be developed and issued by March 2016.
Energy Policy Act of 1992
The Energy Policy Act oI 1992 (40 USC Section 13201 [19921) (ËPAct] was passed to reduce the country's
dependence on foreign petroleum and improve air quality. EPAct includes several parts intended to
build an inventory of alternative fuel vehicles (AFVs) in large, centrally fueled fleets in metropolitan
areas. EPAct requires certain government and private fleets to purchase light-duty AFVs' Federal tax
deductions were created for businesses and individuals to cover the incremental cost of AFVs' EPAct
also establlshed the Clean Cities Program. The primary goal of the Program is to cut petroleum use in
the United States by 2.5 billion gallons per year by 2020 with the following three strategies:
¡ Replace petroleum with alternative and renewable fuels,
r Reduce petroleum consumption through smarter driving practices and fuel economy
improvements, and
r Ëliminate petroleum use through idle reduction and other fuel-saving technologies and
practices.
As part of the federal Clean Cities Program, the San Diego Regional Clean Cities Coalition works with
vehicle fleets, fuel providers, community leaders, and other stakeholders to reduce petroleum use in
transportation in the San Diego region (San Diego Regional Clean Cities Coalition 2014).
San Diego Foruard:The Regional Plan
Program Environmental lmpact Report
Page 4.8-4
4.8 Greenhouse Gas Emissions
Energy Policy Act of 2005
The EPAct of 2005 (42 USC Section 15801 [2005]) includes several requirements that support the use ofalternatively fueled vehicles, including requirements for federal fleets and expansion of compllance
options under EPAct 1992 by allowing fleets to choose a petroleum reduction path that achieves
petroleum reductions equivalent to AFVs running on alternative fuels 100 percent of the time, The
EPAct of 2005 funds research programs for AFVs and provides tax incentives for purchase of AFVs, lt also
provides for renewed and expanded tax credits for electricity generated by qualified energy sources,
such as landfill gas; provides bond financing, tax incentives, grants, and loan guarantees for a clean
renewable energy and rural community electrification; and establishes a federal purchase requirement
for renewable energy,
Energy lndependence and Security Act of 2007
The Energy lndependence and Security Act of 2007 (EISA) (42 USC Section t738t [2007]) includes
provisions to increase the supply of renewable alternative fuel sources by settlng a mandatory
Renewable Fuel Standard, which requires transportation fuel sold in the United States ts contain a
minimum of 36 billion gallons of renewable fuels annually by 2022. EISA includes grant programs to
encourage the development of cellulosic biofuels, plug-in hybrid electric vehicles, and other emerging
electric vehicle technologies. EISA codifies into law the energy reduction goals for federal agencies put
forth in Executive Order l-3423 (USEPA 2007l¡, and creates new requirements related to Corporate
Average Fuel Economy Standards, the Renewable Fuel Standard, and efficiency standards for lighting
and appliances, The law is projected to reduce GHG emissions by 9 percent from 2005 levels by 2030
(DOE 2014).
Clean Air Act
USEPA began regulating GHGs under the Clean Air Act (CAA) (42 USC Section 7401. et seq. [1970]) in
2011. USEPA's GHG regulations include regulations governing transportation and mobile sources,
renewable fuels, carbon pollution standards for existing power plants, the GHG tailoring rule governing
new and existing industrial facilities, and GHG reporting requirements. Standards for mobile sources
have been established pursuant to Section 202 of the CAA, and GHGs from stationary sources are
cu rrently controlled under the authority of Part C of Title I of the act'
ln 201"3, USEPA issued proposed regulations to cut carbon pollution from new power plants. ln 2014,
USEPA proposed a plan to cut carbon pollution from existing or modlfied power plants. The proposed
rule includes state-specific rate-based goals for COz emissions from the power sector, as well as
guidelines for states to follow in developing plans to achieve state-specific carbon reduction goals.
Nationwide, by 2030, this rule would achieve COz emission reductions from the power sector of
approximately 30 percent from CO2 emission levels in 2005 (USEPA 20t4al. USEPA anticipates issuing a
final rule on existing power plants and carbon pollution standards for new, modified, and reconstructedpower plants by the summer of 2015 (USEPA 2015).
San Diego Forward: The Regional Plan
Program Environmental I mpact Report
Page 4,8-5
4.8 Greenhouse Gas Emissions
Federal Highway Administration/Federal Transit Administration
The Federal Transit Administration (FTA) works with public transportation providers and other key
stakeholders to implement strateg¡es that reduce GHG emissions from the transportation sector' FTA
provides funding to support public transportation projects and provides technical assistance, research,
and policy development on alternative fuels, high fuel efficiency vehicles, climate change mitigation and
adaptation in the transportation sector. ln cooperation with the FTA, the USEPA has developed
information regarding clean passenger vehicles (USEPA 2014b)'
The Federal Highway Administratlon (FHWA) has conducted climate change adaptation and resilience
case studies and Bilot projects throughout the country to test a climate change vulnerability assessment
model. The FHWA conceptual model guided transportation agencies through the process of collecting
and integrating climate and asset data in order to identify critical vulnerabilities. FHWA used the pilot
projects to adopt its Climate Change & Extreme Weather Vulnerability Assessment Framework (FHWA
2015a). FHWA has also conducted a number of case studies to assess various climate adaptation
strategies, including the Flood Levee System lmprovements study in Washington, DC (FHWA 2015b); the
Surfers Point Managed Shoreline Retreat Project in Ventura, California (FHWA 2015c); and Climate
Change Adaptation Strategies for the New York State Departtnent of Transportation (Columbia
University Earth lnstitute 2011).
Executive Order 13514
On October 5, 2009, the President signed Executive Order 13514, Federal Leadership in Environmental,
Energy, and Economic Performance (3 CFR 13514). The Executive Order set sustainability goals forfederal agencies and focuses on making improvements in their environmental, energy, and economic
performance, The Executive Order required federalagencies to submit a2O2O GHG pollution reduction
target within 90 days, and to increase energy efficiency, reduce fleet petroleum consumption, conserve
water, reduce waste, support sustainable communities, and leverage federal purchasing power topromote environmentally responsible products and technologies.
The Executive Order requires agencies to measure, manage, and reduce GHG emissions toward agency-
defined targets. lt describes a process by which agency goals will be set and reported to the President by
the Chair of Council on Environmental Quality (CEQ). The Executive Order requires agencies to meet a
number of energy, water, and waste reduction targets, including:
. 30 percent reduction in vehicle fleet petroleum use by 2020;
e 26 percent improvement in water efficiency bV 2020;
. 50 percent recycling and waste diversion by 2015;
o 95 percent of all applicable contracts will meet sustainability requirements;
. lmplementation of the 2030 net-zero-energy building requirement;
. lmplementation of the stormwater provisions of the Energy lndependence and Security Act of2007, section 438; and
r Development of guidance for sustainable federal building locations in alignment with the
Livability Principles put forward by the Department of Housing and Urban Development, DOT,
and USEPA.
San Diego Forward: The Regional Plan
Program Environmental lmpact Report
Page 4.8-6

4,8 Greenhouse Gas Emissions
Executive Order 13693
On March L9,2015, the President signed Executive Order 13693, Planning for Federal Sustainability in
the Next Decade, The Executive Order sets a goal of reducing Federal agency GHG emisslons by 40
percent over the next decade, The Executive Order sets agency GHG reduction targets and sustainabilitygoals, including:
Percentage reduction targets must be proposed by each Federal agency, including FHWA, FTA,
and FRA, for agency-wide GHG emissions reductions by the end of fiscal year 2025 relative to a
fiscal year 2008 baseline.
a
a Sustainability goals for each Federal agency, including
o Promoting building energy conservation, efficiency, and management;o Requiring the use of renewable and alternative energy for electric and thermal energy in
Federal buildings by up to 25 percent by fiscal year 2025;
o Requiring the use of renewable and alternative energy for total building energy
consumption in Federal buildings by up to 30 percent by fiscal year 2025;
o lmproving Federal agency water efficiency and management to reduce waterconsumption by 36 percent by fiscal year 2025;
o lmproving Federal agency vehicle fleet efficiency and management to reduce GHG
emissions by 30 percent by fiscal year 2025;
o Promoting sustainable acquisition and procurement practices; and
o Advancing waste prevention and pollution prevention by diverting at least 50 percent ofnon-hazardous solid waste.
Off-road Vehicle and Equipment Regulations
Federal regulations that govern off-road vehicles such as locomotives, heavy equipment, etc. are
discusied in Section 4,3, Air Quality, These regulations would alss result in reductions in GHG emlssions,
and are summarized below.
Locomotive Engine Emission Standards: USEPA has adopted locomotive engine exhaust emission
standards (40 CFR Part 1033 et seq.) that apply to llne haul and switching locomotives wlth total rated
horsepower of 750 kilowatts (1006 horsepower Ihp]) or greater. These emission standards apply tohydrocarbons, NO¡, particulate matter, and CO, and would also reduce emissions of GHG through
requiring more efficient locomotive engines.
Non-Road Compression-lgnition Engine Emission Standards: USEPA has also adopted emission
standards for compression-ignition engines that apply to engines with a total rated horsepower of 11 hp
to engines with a rating greater than 1207 hp (a0 CFR Part 89.tt2; Part 1039.101; Part 1039.102). These
emission siandards apply to hydrocarbons, NO¡, particulate matter, and CO, and would also reduce
emissions of GHG through requiring more efficient non-road engines.
San Diego Forward: The Regional Plan
Program Environmental lmpact Report
Page 4,8-7
4.8 Greenhouse Gas Emissions
4.8.2.2 STATE LAWS, REGULATIONS, PLANS, AND POLICIES
Executive Order 5-3-05
Executive Order 5-3-05, among other things, establlshed the following 6HG emission reduction goals forCalifornia: reductlon to 2000 levels by 2010; to 199û levels by 2020; and to 80 percent below 1990 levels
by 2050.
Executive Order B-16-12
Executive Order 8-16-12 orders State ent¡t¡es under the direction of the Governor including ARB, the
Energy Commiss¡on, and Public Utilities Commission to support the rapid commercialization of zero
emission vehicles. lt directs these entities to achieve various benchmarks related to zero emission
vehicles, including:
¡ lnfrastructure to support up to one million zero emission vehicles by 2020,
¡ Widespread use of zero emission vehicles for public transportation and freight transport by
?o20,¡ Over 1.5 million zero emission vehicles on California roads by 2025,
o Annual displacement of at least 1.5 billion gallons of petroleum fuels by 2025, and
It also sets a state GHG emissions reduction target for the transportation sector of B0 percent below
1990 levels by 2050,
Executive Order B-30-15
Executive Order 8-30-15, among other things, establishes a new interim statewide greenhouse gas
emisslon reductlon target to rcduce greenhouse gas emissions to 40 percent below 1990 levels by 2030
in order to ensure California meets its target of reducing greenhouse gas emissions to 80 percent below
1990 levels by 2050.
It further orders that all state agencies with jurisdiction over sources of greenhouse gas emissions to
implement measures, pursuant to statutory authority, to achieve reductions of greenhouse gas
emissions to meet the 2030 and 2050 greenhouse gas emissions reductions targets. lt also directs ARB
to update the Climate Change Scoping Plan to express the 2030 target in terms of million metric tons ofcarbon dioxide equivalent (MMTCO2e). Finally, it requires the Natural Resources Agency to update the
state's climate adaptation strategy, Safeguarding California, every three years, and to ensure that its
provisions are fully implemented.
California GlobalWarming Solutions Act and Climate Change Scoping Plan
The California Global Warming Solutions Act of 2006, widely known as AB 32 (Assembly Bill 32, Chapter
488, Statutes of 2006), requires ARB to develop and enforce regulations for reporting, verifying, and
reducing statewide GHG emissions. The heart of the legislation is the requirement that statewide GHG
emissions be reduced to 1990 levels by 2020. The Legislature also intended that that the statewide GHG
emissions limit continue in existence and be used to maintain and continue reductions in emissions ofgreenhouse gases beyond 2020 (Health and Safety Code Section 3855X(b)). The law requires ARB toadopt rules and regulations in an open public process to achieve the maximum technologically feasible
and cost-effective GHG reductions.
San Diego Forward: The Regional Plan
Program Environmental lmpact Report
Page 4.8-B
4.8 Greenhouse Gas Emissions
AB 32 requires that ARB develop a Climate Change Scoping Plan (Scoping Plan) consisting of the main
strategies Callfornia will implement to reduce statewide GHG emlssions to 1990 levels by 2020. lt must
be updated every five years. ARB approved the initial Scoping Plan in 2008 (ARB 2008), The Scoping Plan
functions as a roadmap for ARB's plans to achieve GHG reductions in California.
ARB approved the first update to the Scoping Plan in 2014 (ARB 201.4b1. The update defines ARB's
climate change priorit¡es for the next five years. The update describes progress made to meet the near-
term objectives of AB 32 and defines California's climate change priorities and activities for the next
several years. The update concludes that California is on track to meet the 2O2O GHG limit and is weilpositioned to maintain and continue reductions beyond 2020. A support document for the updateincludes ARB's estimates for the statewide GHG reductions to be achieved by a number of measures in
order reach the AB 32 emissions level by 2020, as summarized in Table 4.8-4, Of the over 55 MMTCO2e
in reductions needed to meet the statewide 2020 emissions target, ARB estimates that 3.0 MMTCO2e
(5.5 percent) of the reductions will come from statewide implementation of the SB 375 targets (the
initial Scoping Plan estimated a 5 MMTCO2e reduction.)
Table 4.8-4
ARB Scoping Plan Update: Meeting the Statew¡d e 2020 Emissions Target
2020 {MMTCO2e}Category509AB 32 Baselin e 2020 Forecast Emissions (2020 BAU)
55.2Expected Reductions from Sector-Based Measures22.9Tronsportation3,1Advanced Clean Cars
L5.2Low Carbon Fuel Standard3,0Regional Targets (SB 375)0,6Tire Pressure Programo.2Ship Electrification0.9Heavy Duty Aerodynamics
2s.0Electrlcity qnd Natural Gas12.2Energy Efficiency and Conservation0,1Solar Hot Water11,5Renewab le Electricity Standa rd (2O%-33%l
1.1Million Solar Roofs5,4Hìgh Globøl Warming Potentiol (GwP) 6osest,8Wøste
23.0Cap-and-Trade Reductions4312020 Limit
Source: ARB 2014b
The update identifies eight key focus areas comprising the major areas of California's economy and
recommendations for developing addltional requirements to meet the 2050 goals expressed in
Executive Order 5-3-05. The update frames activities and issues facing the State as it develops an
integrated framework for achieving both air quality and climate goals in California beyond 2020. While
the update discusses setting a mid-term target between 2020 and 2050, ¡t does not recommend any
numeric post-2020 targets, nor does it recommend a specific plan or specific actions showing how the
state would meet the 2050 Executive Order goal.
San Diego Forward: The Regional Plan
Program Environmental lmpact Report
Page 4,8-9
4.8 Greenhouse Gas Emissions
Cap-and-Trade Program
ARB adopted its Cap-and-Trade Regulation (17 CCR 95802 et seq.) in 2012 as one of the strategies to
achieve the 2020 target established by AB 32, Under cap-and-trade, an overall limit on GHG emissions
from capped sectors has been established and facilities subject to the cap are able to trade permits
(allowances) to emit GHGs. The cap will decline approximately 3 percent each year beginning in 2013,
The first auction of atlowances occurred in 2013. ARB estimates reductions from the Cap-and-Trade
regulation will amount to 23 MMT COze in 2020 (ARB 2014b)'
REGIONAL TRANSPORTATION PLANN ING
Senate B¡ll 375 (Chapter 728, Statutes of 2008)
SB 375 provides for a planning process to coordinate land use planning and RTPs to help California meet
the GHG reductions established in AB 32, SB 375 requires RTPs prepared by MPOs, including SANDAG, to
incorporate an SCS in their RTPs that dernonstrates how the region would achieve GHG emission
reduction targets set by ARB.
SB 375 has three major components: (1) using the regional transportation planning process to achieve
reductions in GHG emissions from passenger vehicles consistent with AB 32's goals; (2) offering
incentives under CEQA to encourage projects that are consistent with a regional plan that achieves GHG
emission reductions; and (3) coordinating the regional housing need allocation process with the regional
transportation planning process while maintaining local authority over land use decisions.
On September 23,20!0, ARB adopted regional targets for major MPOs. SANDAG's current targets are
per capita CO2 emission reductions from passenger vehicles of 7 percent by 2020 and L3 percent by
2035 relative to 2005 levels. SANDAG adopted the 2050 RTP/SCS to comply with SB 375 in 2011. ARB
reviewed the adopted RTP/SCS and determined that, if implemented, it would achieve the reduction
targets for the San Diego region in compliance with the law. ARB is required to update the SB 375 GHG
emissions reduction targets at least every 8 years and is currently working on updates to the targets. As
of October 2014, ARB is planning to update the 2035 targets for specified agencies including SANDAG in
late 2015, but make these targets effective for their SCSs starting in 2019 (ARB 201ae)
2010 California Transportation Commission RTP Guidelines
The California Transportation Commission is authorized under statute (California Government Code
Section 145221to prescribe areas for analysis and evaluation by regional transportatiôn agencies and
guidelines for the preparat¡on of RTPs. The Commission, in consultation with Caltrans and ARB, is also
required to maintain guidelines fortraveldemand models used in the development of RTPs by MPOs.
On April 7, 2A!0, the Commission adopted revisions to the RTP Guidelines (California Transportation
Commission 2010). The 2010 update to the guidelines reflects revisions to address the planning
requirements of SB 375 and other planning practices. ln addition to addressing SB 375, the guidelines
set forth a uniform transportat¡on planning framework throughout the state that identifies state and
federal reguirements for the development of RTPs, The updated guidelines recognize that the reduction
of GHG emissions is a key priority in the transportation planning process.
San Diego Forward: The Regional Plan
Program Environmental lmpact Report
Page 4.8-'10
4.8 Greenhouse Gas Emissions
Caltrans Climate Action Program
ln December 2006, the California Department of Transportation Business, Transportation, and Housing
Agency issued a Climate Action Program (Caltrans 2010). The goal of the Climate Action Program is topromote clean and energy-efficient transportation, and provide guidance for mainstreaming energy and
climate change issues into business operations. The Climate Action Program seeks to reduce GHG
emissions from transportation through system improvements, lowered congestion, and utilization ofintelligent transportation systems; and also seeks to reduce GHG emissions from land use sources by
increasing efficiency of facilities, fleets, and equipment through reduction measures and technology,Caltrans has issued a report summarizing its activities to address climate change in 2013 (Caltrans 2013).
VEHICLE EFFICIENCY AND TRANSPORTATION FUELS
Executive Order 5-01-07 (Low €arbon Fuel Standard)
Executive Order 5-01-07 (17 CCR 95480 et seq.) requires the state to achieve a 10 pêrcent or greater
reduction by 2020 in the average fuel carbon intensity for transportation fuels in California regulated by
ARB. ARB identified the Low Carbon Fuel Standard (LCFS) as a discrete early action item under AB 32,
and the final ARB resolution (No. 09-31) adopting the LCFS was issued on April 23,2009. ARB is currentlyconsidering amendments to the LCFS and plans to consider re-adoption of the LCFS in 201"5,
California Advanced Clean CarslTero Emission Vehicle Program
Assembly Bill (AB) 1493 (Chapter 2OO, Statutes of 2002), also known as the Pavley regulations, required
ARB to adopt regulations by January 1, 2005, that would result in the achievement of the "maximum
feasible" reduction in GHG emissions from vehicles used in the state primarily for noncommercial,
personal transportation.
ln January 2012, ARB approved a new emissions-control program for model years 2017 through 2025.
The program combines the control of smog, soot, and global warming gases and requirements forgreater numbers of zero-emission vehicles into a single package of standards called Advanced Clean Cars
(13 CCR 1962.1 and 1962.21. The Advanced Clean Cars requirements include new GHG standards formodel year 2O!7 to 2025 vehicles. ARB anticipates that the new standards will reduce motor vehicle
GHG emissions by 34 percent in 2025 (ARB 2014c).
The Advanced Clean Cars Program also includes the LEV lll amendments to the LEV regulations (13 CCR
1,900 et seq.), Zero Emission Vehicle Program and the Clean Fuels Outlet Regulation, The Zero Emlssion
Vehicle Program is designed to achieve California's long-term emission reduction goals by requiring
manufacturers to offer for sale specific numbers of the very cleanest cars available, These zero-emission
vehicles, which include battery electric, fuel cell, and plug-in hybrid electric vehicles, are just beginning
to enter the marketplace. They are expected to be fully commercial by 2020. Most vehicle
manufacturers agree that providing a selection of these technologies will be necessary to meet climate
goals by 2050 (ARB 2014d). The Clean Fuels Outlet regulation ensures that fuels such as electricity and
hydrogen are available to meet the fueling needs of the new advanced technology vehicles as they come
to market.
San Diego Forward: The Regional Plan
Program Environmental lmpact Report
Page 4.8-11
4.8 Greenhouse Gas Emissions
Heavy-Duty Vehicle Greenhouse Gas Emission Reduction Regulation
The Heavy-Duty Vehicle Greenhouse Gas Emission Reduction Regulation (17 CCR Sections 95300 et seq.)
reduces GHG emissions by improving the fuel efficiency of heavy-duty tractors that pull 53-foot or
longer box-type trailers. Fuel efficlency is improved through improvements in tractor and trailer
aerodynamics and the use of low rolling resistance tires. ARB expects the regulatlon to reduce statewide
GHG emissions by approximately 0.7 million metric tons CO2e by 2020. The tractors and trailers subject
to this regulation must use U.S. Envirsnmental Protection Agency SmartWaysM certified tractors and
trailers, or retrofit their existing fleet with SmartWay verified technologies
Tire Pressure Regulatlon
On September 1, 2010, the Tire Pressure Regulation (17 CCR Section 95550) took effect. The purpose of
this regulation ls to reduce GHG emissions from vehicles operating with under inflated tires by inflating
them to the recommended tire pressure rating. The regulation applies to vehicles with a gross vehicle
weight rating (GVWR)of 10,000 pounds or less.
ENERGY USE AND GENERATION
Renewable Portfolio Standard
California law (SB X1-2, Statutes of 2011) requires retail suppliers of electricity to procure at least 33
percent of annual retail sales from eligible renewable energy sources by 2020.
T¡tle 24 Energy Standards
Energy Conservation Standards for new residential and nonresidential buildings were first adopted by
the CEC in June 1977 and were most recently revised in 2013 (Title 24, Part 6 of the California Code of
Regulations [Title 241). Title 24 governs energy consumed by commercial and residential buildings in
California. This includes the heating, ventilation, and air conditioning (HVAC) system; water heating; and
some fixed lighting. Nonbuilding energy use, or "plug-in" energy use, is not covered by Title 24. The
standards are updated periodically to allow for consideration and possible incorporation of new energy
efficiency technologies and methods. California's Building Energy Efficiency Standards are updated on an
approximate 3-year cycle. The most recent update was in 2013. The 2013 Title 24 standards went into
effect July !, 20L4, and improve on the 2008 Title 24 standards, The CEC estimates that the 2013
Standards are 25 percent more energy-efficient than the previous standards for residential construction
and 30 percent more efficient for nonresidential construction (CEC 2014a, 2014b).
Appliance Efficiency Regulations
California's 2009 Appliance Efficiency Regulations (20 CCR 1601-1608) were adopted by the CEC on
December 3, 2008, and approved by the California Office of Administrative Law on July 10, 2009. The
regulations include standards for both federally regulated appllances and nonfederally regulated
appllanees,
San Diego Forward:The Regional Plan
Program Environmental lmpact Report
Page 4,8-12
4,8 Greenhouse Gas Emissions
Green Building Standards
The 2013 California Green Building Standards Code (24 CCR Part 11 [CALGREEN]) took effect January 1,
2014, These comprehensive regulations will achieve major reductions in GHG emisslons, energy
consumption, and water use. CALGREËN will require that every new building constructed in California
reduce water consumption by 20 percent, divert 50 percent of construction waste from landfills, and
install low-pollutant-emitting materials. They also require separate water meters for nonresidential
buildings' indoor and outdoor water use, with a requirement for moisture-sensing irrigation systems forlarger landscape projects and mandatory inspections of energy systems (e.9., heat furnace, air
conditioner, and mechanical equipment) for nonresidential buildings larger than 10,000 square feet toensure that all are working at their maximum capacity and according to their design efficiencies. ARB
estimates that the mandatory provisions will reduce GHG emissions from buildings by approximately 3
MMT COze in 2020 in comparison with GHG emissions without implementation of the Green Buildlng
Standards (ARB 2014e).
Energy Efficiency in Existing Buildings
Assembly B¡ll 758 (Chapter 470, Statutes of 2009) requires the CEC to develop and implement a
comprehensive energy efficlency plan for all of California's existing buildings. ln 201.5, the CEC released
the Draft Existing Buildings Energy Efficiency Action Plan, which provides a ten-year blueprint forreducing energy consumption in all existing buildings in the single-family, multi-family, commercial and
public buildings sectors. The goal of the plan is to double energy savings in California's buildings, which
is equivalent to a 17 percent reduction in statewide building energy use in 2030 compared to projected
levels of usage. AB 758 complements the existing energy efficiency programs implemented by
California's investor-owned utilities (lOUs) that target both residential and non-residential sectors,
Performance Standard for Baseload Power Generation
SB 1368 (Chapter 598, Statutes of 2006) required the California Public Utilities Commission (PUC) toestablish a GHG emissions performance standard for "baseload" generatlon from lnvestor-owned
utilities of 1,100 lbs COzlMWh, The CEC established a similar standard for local publicly owned utilities,
All electricity provided to California, including imported electricity, must be generated from plants thatmeet or exceed this standard.
Senate Bilt 1 (Chapter 132, Statutes of 2006)
The California Solar lnitiative (Senate Bill 1, Chapter 132, Statutes of 2006), also known as the "Million
Solar Roofs" legislatlon, set a goal of installlng 3,000 megawatts of new solar capaclty by 2017'
Off-road Vehicle and Equipment Regulations
State regulations that govern off-road vehicles such as locomotives and heavy equipment are discussed
in Section 4,3, Air Quality. These regulat¡ons also result in reductions in GHG emissions, and include the
following standards.
San Diego Forward: The Regional Plan
Program Environmental lmpact Report
Page 4,8-13
4,8 Greenhouse Gas Emissions
Small Offroad Engine Exhaust Emission Standardsr The ARB has adopted regulations (13 CCR Sections
2400 et seq,) to control emissions from small off-road engines such as lawn, garden and other
maintenance utility equipment. The rules affect engines less than 25 horsepower and regulate
emisslons of hydrocarbons, NOx, and CO. The emission standards also reduce GHGs by
requiring more efficient engines.
Offroad Compression-lgnition Diesel Engine Exhaust Emission Standards: The ARB has adopted
regulations (13 CCR Sections 2400 et seq.) to control emissions from off-road compression-ignition
diesel engines found in a wide variety of off-road applications such as farming, construction, and
lndustrial. The regulations require off-road engines to meet emission standards for hydrocarbons, NOx,
CO and PM in "Tiers", which require engines to meet increasingly stringent emission levels. The
regulations also reduce GHG emissions by requiring more efficient engines.
SOLID WASTE AND WATER
Solid Waste Diverslon
AB 341 (Chapter 476, Statutes of 2011) set a goal that 75 percent of the solid waste generated be
reduced, recycled or composted by 2020.
Landfill Methane Control Measure
The Landfill Methane Control Measure (17 CCR Sections 95460 et seq.) reduces emissions of methane
from municipal solid waste (MSW) landfills. The regulation became effectlve June 17, 2010 and requires
owners and operators of uncontrolled MSW landfills to install gas collection and eontrol systems, and
requires existing and newly installed gas and control systems to operate in an optimal manner.
Water Conservation
State water conservation legislation and regulations are reviewed in Section 4.16 Water Supply
I{IGH GLOBAL WARMING POTENTIAL GASES
Refrigerant Management Program
ARB's Refrigerant Management Program (17 CCR Sections 95380 et seq.) works to reduce the release ofcurrently use high-global warming potentlal (GWP) gases. The Program requires facllities with
refrigeration systems to inspect and repair leaks, maintain service records, and in sorfle cases report
refrlgerant use.
Motor Vehlcle Air-Cond¡t¡onlng
tn January 2009, ARB approved the mobile air conditioning regulation (L7 CCR Sections 95360 et seq.) toreduce emissions associated with the use of small container of automotive refrigerant. The regulation
applies to the sale, use, and disposal of small contalner with a GWP greater than 150.
San Fonruard: Tho Regional Plan
Program Environmental lmpact Report
Page 4.8-14
4.8 Greenhouse Gas Emissions
Consumer Products Regulation
Limiting the use of high GWP compounds in consumer products is part of ARB's larger Consumer
Products Program. ln 2009, ARB approved amendmeRts to the €onsumer Products Regulatlon toprohibit the use of compounds with GWP values greater than 150. (ARB Resolution 09-51.)
Sulfur Hexafluoride Leak Reduction and Recycling
Sulfur hexafluoride (SFs) is a potent greenhouse gas, with a global warming potential (GWP) of 23,900,
the hlghest identified by the lntergovernmental Panel on Cllmate Change, ARB approved sulfur
hexafluoride reductions from non-electric and non-semiconductor applications as an early action
measure, Accordingly, ARB approved the Regulation for Reducing Sulfur Hexafluoride Emissions (17 CCR
Sections 95340 et eq.) in February 2009 to reduce sulfur hexafluoride emissions from other uses
including magnesium die-casting, fume vent hood testing, tracer gas use, and other niche uses'
4.8.2.3 REGIONAL AND LOCAL LAWS, REGULATIONS, PLANS, AND POLICIES
SANDAG Climate Action StrategY
tn 201"0, SANDAG published a Climate Action Strategy (Strategy) that was prepared under a partnership
w¡th rhe CEC (SANDAG 2O1O). The Strategy is a guidance document and not a binding plan. The Strategy
serves as a guide to help policymakers address climate change as they make decisions to meet the needs
of our growing population, maintain and enhance our quality of life, and promote economic stability' As
stated in the Strategy introduction, the policy measures contained in the Strategy are intended to be a
list of potential options (tools in the toolbox) for conslderation as SANDAG and local governments
update their various plans. The policy measures are not requirements for SANDAG, local governments,
or any other entity.
The Strategy identifies goals, objectives, and policy measures in the areas of transportation, land use,
buildings, and energy use. Also addressed are measures and resourees to help local governments reduce
emissions from their operations and in their communities. The policy measures contained in this
document are intended to be a list of potential options to reduce GHG emissions, Because local
governments have greater control over sóme categories of GHG emission sources, the Strategy
emphasizes those areas where the greatest impact can be made at the local and regional level. These
areas include land use patterns, transportation infrastructure, and related public investment; building
construction and energy use; and local government operations.
Within the three areas, goals, objectives, and policy measures are included in the Strategy to further
describe how GHG emissions reduct¡ons could be achleved, The goals identifled in the Strategy include
the following:
Transportation Sector
o Reduce total miles of vehicle travelr Minimize GHG emissions when vehicles are used
o Support increased use of low carbon alternative fuels
. Protect transportation infrastructure from climate change impacts
San Diego Forward: The Regional Plan
Program Environmental lmpact Report
Page 4,8-15
4,8 Greenhouse Gas Emissions
Çlean Energv and Efflcient B.uildinns
r Reduce energy use in residential and commercial buildings
o lncrease use of renewable energyr Reduce water-related energy use and GHGs
. Protect energy infrastructure from climate change impacts
SAN ÞAG a nd Lo-cal GovernmeQt Operations.
Ò SANDAG and localgovernments lead by example
SANDAG Regional Energy Strategy
SANDAG has adopted a Regional Energy Strategy (RES), which serves as the energy policy blueprint for
the region through 2050 (SANDAG 2009b). The RES addresses some of the goals identified in the 2014
Scoping Plan Update. lt establishes long-term goals in 11 topic areas lncluding energy efficiency,
renewable energy, distributed generation, transportation fuels, land use arìd transportat¡on planning,
border energy issues, and the green economy. ln 20L4, a technical update of the RES was completed toinform development of the proposed Plan (SANDAG 2014). This technical update demonstratesprogress toward attaining the RES goals, updates existing conditions and future projections data, and
recommends priorities for the region. The RES goals include the following:
. Energy Effleiency and €onservation - Reduce per eapita electricity consumption by 20 percent
by 2030 in order to keep total electricity consumption flat.
o Renewable Energy - Support the development of renewable energy resources to meet a 33
percent renewable portfolio standard (RPS) bV 2020 and exceed 33 percent beyond 2020,
r Distributed Generation - lncrease the total amount of clean distributed generation (renewable
and nonrenewable) to reduce peak demand and diversify electricity resources in the region.
o Energy and Water - Reduce water-related energy use.
r Peak Demand - lmplement cost-effective steps and ineentives to utilize demand response and
energy efflciency measures to reduce peak demand.
. Smart Energy - Modernire the electricity grid with srnart meters, smart end-use devices, and
interactive communication technologies.
r Natural Gas Power Plants - lncrease overall efficiency of electricity production and supportreplacement of inefficient power plants consistent with California's preferred loading order.
r Transportation Fuels - Substantially increase the deployment of alternative transportation fuels
and vehicles.
r Land Use and Transportation Planning - Reduce the energy demand of the built environmentthrough changes in land use and transportation planning.
. EnÊrgy and Borders * lntegrate cnergy eonslderations into existlng and future collaboratlveborder initlatives.
o Clean Energy Economy - Collaborate with workforce entities, employers, technical and
vocational schosls, and labor unions to ident¡fy and expand local job placement meehanisms in
the Clean Energy Sector,
San Diego Forward: The Regional Plan
Program Envlronmantal lmpact Report
Page 4,8-16
4,8 Greenhouse Gas Emissions
Regional Alternative Fuel Planning
On-road transportation represents approximately 44.5 percent of the region's GHG emissions and, as
such, the proposed Plan and RES both call for SANDAG to undertake coordinated planning for electric
vehicle charging and alternative fueling infrastructure in the region.
lnfrastructure needs were identified in a 2009 assessment of how to accelerate deployment of
alternative fuel vehicles in and around San Diego entitled the Regional Alternative Fuels, Vehicles and
lnfrastructure Report (SANDAG 2009a), The report recommended public-private partnerships and
collaborative approaches to infrastructure planning and increasing alternative fuels in fleets. lts findings
were incorporated into the regional energy and climate strategies.
5an Diego Regional Plug-ln Electric Vehicle Readiness Plan
ln 2OL2, SANDAG established the San Diego Regional Electric Vehicle lnfrastructure Working Group
(REVI) as part of a CEC grant to perform reglonal Plug-ln Electric Vehicle (PEV) readiness planning. The
REVI completed the San Diego Regional Plug-in Electric Vehicle Readiness Plan, which was accepted by
the SANDAG Board in January 2014. As part of another CEC grant, SANDAG will build on the success of
the REVI and undertake regional readiness planning for all alternative fuels in partnership with the San
Diego Regional Clean Cities Coalition. A regional alternative fuels coordinating council will be established
to advise on regionalalternative fuelinfrastructure needs, barriers, and solutions,
SANDAG Energy Roadmap Program for Local Governments
The Energy Roadmap Program is a collaboration between SANDAG and San Diego Gas & Electric
(SDG&E). tt ts funded primarily by California utility customers under the auspices of the PUC.
Transportation components of the program are funded by SANDAG. The roadmap program was
developed with the help of the Energy Working Group and three pioneering cities: Carlsbad, Poway, and
Solana Beach, These cities served as early pilots in energy management planning, which became the
roadmap program in 2010. All cities within the San Diego region are now participating in the program.
The SANDAG Energy Roadmap Program provides free energy assessments and energy management
plans, or "energy roadmaps," to SANDAG member agencies. Each energy roadmap provides a
framework for a local government to reduce energy use in municipal operations and in the community,
and can result in economic savings and environmental benefits. Within the energy roadmap are eight
general categories:
1, Saving Energy in City Buildings and Facilities
2. Demonstrating Emerging EnergyTechnologies3. Greening the City Vehicle Fleet
4. Developing Employee Knowledge of Energy Efficiency
5. Promoting Commuter Benefits to City Employees
6. Leveraging Planning and Development Authority7. Marketing Energy Programs to Local Residents and Businesses
8. Supporting Green Jobs and Workforce Training
Upon receiving their energy roadmap, SANDAG assists municipalities in developing projects and/orprograms presented in the eight general categories'
San Diego Fon¡rard: The Regional Plan
Program Environmental lmpact Repoñ
Page 4.8-17
4.8 Greenhouse Gas Emissions
Local Greenhouse Gas lnventories and Climate Action Plans
ln the 5an Diego region, all 19 jurisdictions (18 cities and County of San Diego) have completed a GHG
inventory covering both government operations and the community as a whole, many prepared as part
of the San Diego Foundation's Climate lnitiative (City of Carlsbad 2011, City of Chula Vista 2006, City ofChula Vista 2O!3a, City of Del Mar 2011, City of ElCajon 2011, City of Encinitas 20ILb, City of Escondido
2011, City of lmperial Beach 2011, City of La Mesa 2011, City of National City 2009, City of Oceanside
20L1, City of Poway 2011, City of San Marcos 2013b, City of Santee 2011, City of Solana Beach 2011,
County of San Diego 2011). ln addition, the Border Environment Cooperation Commission (BECC) has
worked with the Center for Climate Strategies to complete GHG inventories for all six Mexican border
states. Each inventory identifies emissions sources, and sets a baseline for evaluating reductions.
More than half of the local jurisdictions in the San Diego region, representing over 75 percent of the
region's population, are developing or have adopted a climate action plan (CAP) (City of Chula Vista
2000,2008,2013b; City of Encinitas 2AtLa; City of Escondido 2013; City of National City 2011; City of
San Diego 2005; City of San Marcos 2013a; County of San Diego 20121; City of V¡sta 2012), A CAP
typically includes specific measures or actions to reduce GHG emisslons toward an identified target, and
offers streamlining opportunities for future development projects under CEQA. Table 4,8-5 summarizes
each jurisdiction's climate planning efforts. ln addition to the effsrts of the 18 cities and the County of
San Diego, the Port of San Diego and the San Diego County Water Authority have developed GHG
inventories and CAPs,
Table 4.8-5Status of Climate Action Planning
Developing% of 2OL2 Reglonal
Populatlonvv 2008Chula Vista 7.9
n/a1.9 v 20tLEncinitas2013 n/a4.6 VEscondido
v 20II n/a1.9National Cityvv 20055an Dieeo 42.0
nla V15.8 VCountv of San Diego (unincorporated)v 20L2 n/a3,0Vista
n/a2,7 v 2013San Marcosn/a V3.4 vCarlsbad
v n/a v0.1DelMarv1.9 v nlaLa Mesa
n/a vr.7 vSanteev n/a0.4Solana EeachV n/a nla0,7Coronado
n/a3.2 v nlaEl Caionnla n/a0.8 Vlmperial Beach
v n/a n/aLemon Grove 0.8n/a5.4 v n/aOceanside
nla nla1.5 VPoway
Source: ARB 2014b
l The County of San Diego rescinded its Climate Action Plan in April 2015 and is currently preparing a new plan
San Diago Forward: The Regional Plan
Program Environmental lmpact Repoü
Page 4.8-18
4.8 Greenhouse Gas Emissions
4.8.3 SIGNIFICANCE CRITERIA
Appendix G of the CEQA Guidelines and Guidelines Section 15064,4 provide criteria for evaluating the
significance of a project's environmental impacts on GHGs. Unless otherwise noted, the slgnificance
criteria specifically developed for this EIR are based on the checklist guestions in Appendix G and
Guidelines Section 15064.4. ln some cases, SANDAG has combined checklist questions, edited theirwording, or changed their location in the document in an effort to develop significance criteria that
reflect the programmatic level of analysis in this EIR and the unique nature of the proposed Plan'
Appendix G addresses GHGs under Greenhouse Gases (Vll, (a) and (b)). The criteria below build on the
Appendix G questions and Guidelines Section 15CI64.4 to analyze the impact of the proposed Plan in
relation to the GHG targets established by AB 32, Executive Order B-30-1"5, Executive Order 5-3-05, SB
375, and local climate action plans. For the purposes of this ElR, implementation of the proposed Plan
would have a significant GHG impact if it would:
GHG-1 Directly or indirectly result in an increase in GHG emissions compared to existing conditions
(2012).
GHG-2 Conflict with AB 32, SANDAG Climate Action Strategy, or LocalClimate Action Plans"
GHG-3 Conflict with SB 375 GHG emission reduction targets.
GHG-4 Be inconsistent with the State's ability to achieve the Executive Order B-30-1.5 and S-3-05
goals of reducing California's GHG emissions to 40 percent below 1990 levels by 2030 and 80
percent below 1990levels by 2050.
When setting the above thresholds, SANDAG also considered the following factors listed in CEQA
Guidelines Section 15064.4:
Whether the project may increase or decrease GHG emissions compared to the existing
environmental setting (lmpacts GHG-1 and GHG'4)
Whether GHG emissions exceed a threshold of significance that the lead agency determines
applies to the project (lmpacts GHG-1 through CHG'4)
The extent to whlch the project complies with requirements adopted to implement certain
specified plans for the reduction of GHG emissions (lmpacts GHG-z and GHG-3)
San Diego Forward: The Regional Plan
Program Environmental lmpact Report
a
a
Page 4,8-19
4,8 Greenhouse Gas Emissions
4.8.4 ËNVIRONMENTAL IMPACTS AND MITIGATION MEASURES
GHG.X DIRECTLY OR INDIRECTLY RESUTT IN AN INCREASE IN GHG EMISSIONS COMPARED
TO EXISTING COND¡TIONS (2012¡.
ANALYSIS METHODOLOGY
GHG emission projections are based on the proposed Plan, including forecasted regional growth and
land use change and planned transportation network improvements and programs. The inventory also
accóunts for the Renewable Portfolio Standard that requires retail suppliers of electricity to increase
renewable energy resources to 33 percent by 2020. The inventory also includes implementationprograms such as Title 24 building standards, water conservation programs, solid waste diversion
programs, and other regulatory requirements and programs designed to reduee GHG emissions, The
GHG emissions inventory and supporting assumptions are included as EIR Appendix G-1.
It should be noted that the current GHG inventory shows lower projected GHG emissions than the
inventory presented in the 2050 RTP/SCS Environmental lmpact Report (SANDAC 2011) for several
reasons. The original inventory was prepared in 2011 and took into account information on the
regulatory environment and technology that was available at the time, The original inventory was based
on "business as usual" eonditions as of 2010. The current inventory is not based on business as usual
emissions, but takes into aceount ¡mplementation of currently adopted regulations, programs, and
policies that will lead to reductions in GHG emissions. As stated above, the current inventory is based on
the Series 13 Regional Growth Forecast, which has slightly lower population projections than the 2050
RTP/SCS. The inventory accounts for additional certainty regarding the regulatory environment,
including future projections for renewable energy, building energy efficiency, water conservation
programs, and solid waste diversion. The current inventory for on-road vehicles is also based on the
ARB's EMFAC2O14 model, which is thê most recent update to the state's mobile source emissions
inventory tool. The model accounts for programs that will lead to further reductions from on-road
vehicles, including the ARB's Advanced Clean Cars Program.
It should also be noted that, while the current inventory takes into account regulations, programs, and
policies that are in place at this time, there is substantial uncertainty in projecting emissions for future
horizon years, especially for 2050; in general, the uncertainty in future emissions increases from 2020 to2050. The inventory projects emissions based on reasonable assumptions regarding future conditions;
however, it does not account for future regulatory initiatives, technologies, or market drivers that may
affect GHG emissions in the future over the next 35 years. For example, even though further reductions
may be achieved through future legislation or regulations, the Renewable Portfolio Standard for
renewable electr¡city generat¡on does not set targets beyond 2020, and the ARB Advanced Clear Cars
Program does not address passenger vehicles beyond the 2025 model year. The following analysis is
therefore considered conservative and may overstate actual GHG emission trends in future years.
For the purpose of evaluating impacts under lmpact GHG-l, because regional growth and land use
change and the transportation network together ¡mpact overall GHG emissions, the impact assessment
includes both regional growth and land use change and the transportation network improvements.
Emission calculations are provided ln Appendix G-1 to the ElR.
San Diego Fcn¡rard: The Regional Plan
Program Environmental lmpact Report
Page 4,8-20
4.8 Greenhouse Gas Emissions
Regionøl Greenhouse Gos Emissions Methodology
GHG emissions from the proposed Plan are calculated based on standard approaches for estimating
GHG emissions that are documented in Appendlx G-l to the ElR. To the extent possible, the inventory
followed the ICLEI U,S, Community Protocol2 methods for the following emissions categories:
. On-roadtransportationo Electricity and natural gas
r Water consumptiono Solid waste¡ Wastewaterr CivilAviation
The remaining categories were calculated based on California Air Resources Board methods and
methods based on San Diego region data:
o Other Fuelsr Cogenerationr lnd ustria I
¡ Off-Roadr Land Use and Wildfires¡ Railo Agriculturer Marine Vessels
Construction emissions include emissions from off-road equipment that are part of the emission
inventory under the off-road category, and vehicles that are part of the on'road transportation category.
ln addition, indirect GHG emissions from operation of the Trolley are included under electricity use' GHG
emission reductions are also projected for development and sequestration,
GHG emissions associated with operation of planned transportation network improvements and
programs are calculated using estimated total VMT under the proposed Plan, using ARB's EMFAC2014
model, which represents ARB's current understanding of motor vehicle travel activities and theirassociated emission levels. lt represents ARB's current understanding of how vehicles travel and how
much they pollute, Emissions are estimated for 2012 (baseline), 2A20, 2035, and 2050. EMFAC2014
includes the latest data on California's car and truck fleets and accounts for emissions reductions due toimplementation of statewide vehicular regulations, including on-road diesel fleet rules, Advanced Clean
Car Standards, zero emission vehlcle regulations, and the SmartwaylPhase I Heavy Duty Vehicle
Greenhouse Gas Regulation. The model also includes updates to truck emission factors based on the
latest surveillance data (ARB 201.4f).
During the timeframe of the proposed Plan, climate change effects that are likely to exacerbate theproposed Plan's greenhouse gas emissions impacts include but are not llrnited to lncreases in
temperatures and frequency, duration, and intensity of heatwaves, and increased frequency and
intensity of wildfires, ln general, these climate change effects would increase between 2020 and 2050.
Climate change effects are discussed in more detail in Appendix F to the ElR.
' U,S. Community Protocol for Accounting and Reporting of Greenhouse Gas Emissions (2013) available at
http://www, icl eiusa,org/tools/ghg-protocol/commu nity-protocol,
San Diego Forward: The Regional Plan
Program Environmental lmpact Report
Page 4,8-21
4.8 Greenhouse Gas Emissions
2020
Regional Growth and Ldnd Use Change ond Transportotîon Network lmprovements dndProgrdms
From 2012 to 2020, the region is forecasted to increase by 292,292 people; 83,874 housing units; and
118,535 jobs, Under implementation of the proposed Plan, totalGHG emissions in the San Diego region
are projected to be approximately 28.8 MMT CO2e in 2020, or about 19 percent lower than GHG
emissions in20t2 (Table 4.8-6).
While population and development in the region is increasing in 2020 relative lo 2012, GHG emissions
are projected to deøease due to regulations and programs implemented on the state and regional
levels to reduce emissions of GHGs. These programs include implementation of the RPS, Advanced Clean
Cars regulations, the Low Carbon Fuel Standard, Cap-and-Trade program, energy efficiency standards forbuildings, continued growth in solar photovoltaic installations, water conservation measures, solid
waste diversion, refrigerant programs, and emission standards for off-road equipment. ln addition, the
SCS land use pattern and transportation network improvements and programs play art important role by
decreasing per capita vehicle miles traveled. The decrease in per capita VMT is attributable to a number
of factors considered in the proposed Plan's transportation modeling: proposed Plan investments in
transit and managed lanes; TDM programs such as carpooling, vanpooling, mobility hubs, and
teleworking; and demographic (e.g., aging population) and economic e.g., fuel prices factors.
Table 4.8-5
Total Greenhouse Gas Emissions in the San Diego Region,2OL2to 2O20
2020 (Annual MMTCO2e)2012 {Annual MMTCO2e}GHG Emlssions Categoryt3.72On-Road Transportation rs.76
7.97 6.41Electricitv2.792.84Natural Gas0.84Solid Waste L.75
1.64 L.64Other Fuels
]'43 1,45lndustrial1.52Aviation r.37
0.92 0,95Off-Road Equipment and Vehicles0,810.81Wlldfire0.65ôther - thermal Cogeneration 0.64
0.s2 0.57Water Supply and Conveyance0.120.16Wastewater0.15Rail 0,11
0,08 0.06Agriculture0.05 0.05Marine Vessels (excluding pleasure craft)
-0.62Develooment + Seouestration -0.65-1.39Low Carbon Fuel Standard nla
nla -0,50Cap-and-Traden/a -0.43High GWP Gases
35.4 28.8Total
% lncrease (Deerease! from 2012 to 2020 (18.6%)
Source: Appendix G-l to the EIR
San Diego Forward: The Regional Plañ
Program Environmental lmpact Report
Pagìe 4.8-22

4,8 Greenhouse Gas Emissions
2020 Conclusíon
As shown in Table 4,8-6, implementation of the proposed Plan would result in a less than significant
impact because the proposed Plan would not directly or indirectly result in an increase in GHG emissions
compared to existing conditions. Therefore, this impact (GHG-1) in the year 2020 is less than significant.
2035
Regionol Growth and Lond lJse Chonge and Trønsportatîon Network Improvements ønd
Programs
From 2012 to 2035, the region is forecasted to increase by 710,269 people, 230,220 housing units, and
3J"9,025 jobs. Uncler the proposed Plan, total GHG emissions fsr the region in 2035 are projected to be
approximately 25,5 MMT COze, or 28 percent lower than GHG emissions ln 2O!2 (Table 4.8'7l,.
While population in the region is increasing in 2035 relative to 20t2, GHG emissions are projected todecrease due to regulations and programs implemented on the state and regional levels to reduce
emissions of GHGs. These programs include implementation of the RPS, Advanced Clean Cars
regulations, the Low Carbon Fuel Standard, Cap-and-Trade program, energy efficiency standards forbuildings, continued growth in solar photovoltaic installations, water conservation measures, solid
waste diversion, refrigerant programs, and emission standards for off-road equipment' ln addition, the
SCS land use pattern and transportation network improvements and programs play an important role by
decreasing per capita vehicle miles traveled. The decrease in per capita VMT is attributable to a number
of factors considered in the proposed Plan's transportation modeling: proposed Plan investments in
transit and managed lanes; TDM programs such as carpooling, vanpooling, mobility hubs, and
teleworking; and demographic (e,g., aging population) and economic e,g,, fuel prices factors.
Table 4.8-7Total Greenhouse Gas Emisslons in the San Diego Region, 2012 to 2035
Source: Appendix G-1 to the IR
2035 (Annual MMTCOTe)2012 (AnnualMMTCOze)Cateeory9,68t5,76On-Road Transportation5.057.97Electric¡ty
2.84 2.73Natural Gas0,93r.75Solid Waste1.661,64Other Fuels1,49r.43lndustria I
1,.727,37Aviationt.470,92Off-Road0.810.81Wildfire0.710.64Other - Thermal Cogen0.630.52Water
0,16 0,15Wastewater0.230,11Ra il0,030.08Agriculture0.050.05Marine Vessels (excluding pleasure craft)-0.56-0,6sDevelopment + Sequestratlon-1,39n/aLow Carbon Fuel Standard-0,50nlaCap-a nd-Trade-0.43n/aH¡gh GWP Gases
35.4 25.5Total128.0o/ol% lncrease (Decrease) from 2012 to 2035
San Diego Forward: The Regional Plan
Program Environmental lmpact Report
Page 4,8-23
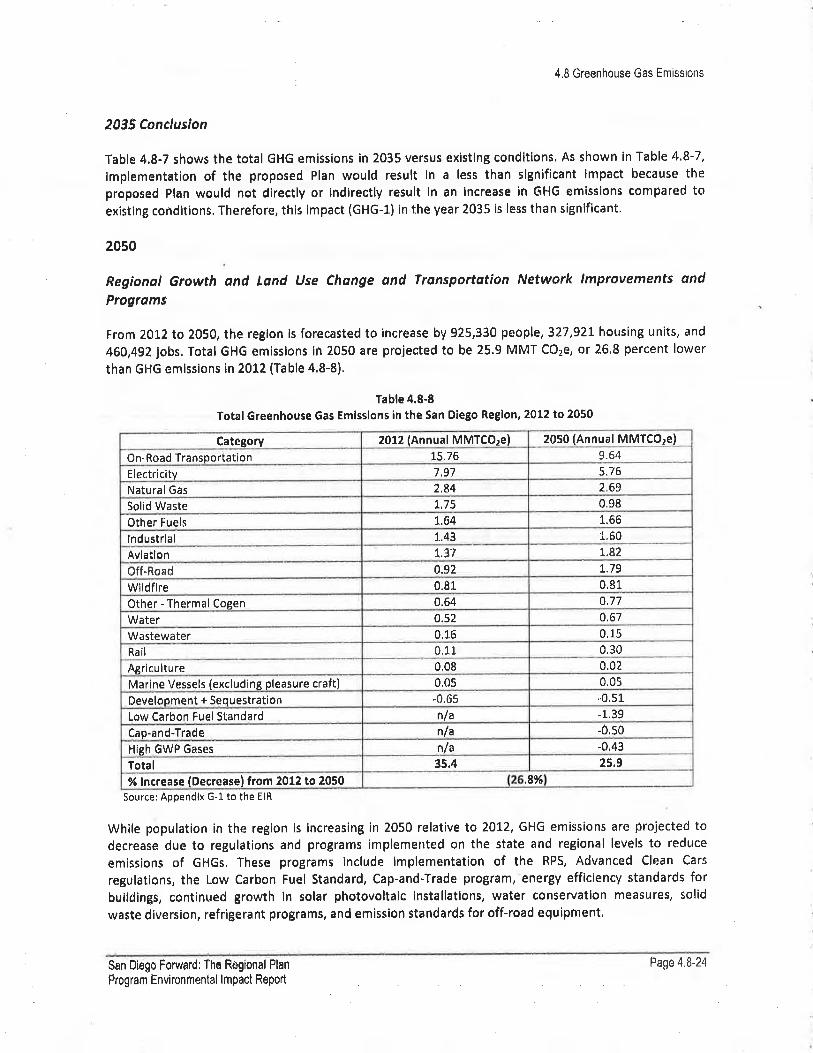
4.8 Greenhouse Gas Emissions
2035 ConclusÍon
Table 4,8-7 shows the total GHG emissions in 2035 versus existlng conditions. As shown in Table 4'8-7,
implementation of the proposed Plan would result ln a less than significant impact because the
proposed Plan would not directly or indirectly result in an increase in 6HG emissions compared to
existing conditions, Therefore, this impact (GHG-1) in the year 2Û35 is less than significant.
2050
Regional Growth and Land tJse Chdnge and Transportation Network lmprovements ond
Programs
From 2012 to 2050, the region is forecasted to inerease by 925,330 people, 327,92t housing units, and
461,4g2jobs. Total GHG emissions in 2050 are projected to be 25.9 MMT CO¿ê, or 26.8 percent lower
than GHG emissÍons in 2012 (Table 4.8'8).
Table 4.8-8
Total Greenhouse Gas Emissions in the San Diego Region, 2012 to 2050
2050 {Annual MMTCOue)2012 (Annual MMTCO2e)Category9.6415.76On-Road Transportation5.167,97Electricity
2.84 2.69Natural Gas0.981.75Solid Waste1.661,64Other Fuels1,601,43lndustrialL,821,37AviationL.790.92ðff"Road0.810.81Wildfire
0.64 0,77Other - Thermal Coeen0.670.52Water0.150,16Wastewater
CI.11 0.30Rail0.020,08AÊrieulture0.050.0sMarine Vessels (excluding pleasure craft)
-0.65 -0.51Development + Sequestration-1.39nlaLow Carbon Fuel Standard-Ô,s0n/aCap-and-Trade
nla -0,43Hieh GWP Gases25.935.4Total
.8%% lncrease {Decrease) from 2012 to 2050Source: Appendix G-1 to the EIR
While population in the region is increasing in 2050 relative to 2012, GHG emissions are projected todecrease due to regulations and programs implemented on the state and regional levels to reduce
emissions of GHGs. These programs include implementation of the RPS, Advanced Clean Cars
regulations, the Low Carbon Fuel Standard, Cap-and-Trade program, energy efficiency standards for
buildings, continued growth in solar photovoltaic installations, water conservation measures, solid
waste diversion, refrigerant programs, and emission standards for off-road equipment.
San Diego Fon¡'rard: Tho Regional Plan
Program Environnrental lmpaet Report
Page 4,8-24

4,8 Greenhouse Gas Emissions
ln addition, the SCS land use pattern and transportation network improvements and programs play an
important role by decreaslng per capita vehiele miles traveled. The derease in per capita VMT is
attributable to a number of factors considered in the proposed Plan's transportation modeling:
proposed Plan investments in transit and managed lanes; TDM programs such as carpooling, vanpooling,
mobility hubs, and teleworking; and demographic (e,g., aging population) and economic e.9,, fuel prices
factors.
2050 Canclusion
As shown in Tab!e 4.8-8, implementation of the proposed Plan would result in a less than significant
impact because the proposed Plan would not dlrectly or lndirectly result in an lncreage ln GHG emlssions
compared to existing eonditions. Therefore, thls impact (CHG-l) in the year 2050 is less than significant.
cHG-2 CONFLTCT W|TH AB 32, SANDAG CLTMATE ACTION STRATEGY, OR LOCAL CLIMATE
ACTION PLANS.
ANALYSIS METHODOLOGY
The analysis evaluates any conflicts of the proposed Plan with AB 32, SANDAG's Climate Action Strategy,
and adopted local Climate Action Plans.
The AB 32 analysis evaluates whether the proposed Plan would conflict with the State's ability to
achieve the AB 32 target of reducing statewide GHG emissions to the 1990 levels by 2020. ln addition to
establishing a statewide emissions limit to be achieved by 2020, AB 32 also includes a provision stating
the ¡ntent of the Legislature that the statewide GHG emissions limit continue in existence and be used to
maintain and continue reductions in GHG emissions beyond 2020 (HSC Section 38551[b])' Statewide
goals for GHG emissions reductions beyond 2020 have since been expressed in Governor's Executive
Orders, including goals of 40 percent below 1990 levels by 2030 (EO-B-30-15) and goals of 80 percent
below 1990 levels by 2050 (EO-S-3-05), which are evaluated in lmpact GHG-4. Therefore, the AB 32
analysis in lmpact GHG-2 analysis focuses on whether the region would achieve a regional reference
point based on the 2020 target,
The 1990 GHG emissions in the San Diego region was 29 MMT COze (see Appendix G-1 to the EIR).3 The
analysis cornpares 2O2O GHG emissions under the proposed Plan to the region's 1990 levels' Note that
there is no requirement that the SANDAG region's emissions be reduced by the same percenlage
("equal share") as the statewide perceRtage in order for the State to achieve the AB 32 target. The
impacts of the proposed Plan are nevertheless considered significant if the region's total emissions in
2020 exceed the 1990 reference point of 29 MMT COze'
For purposes of evaluating impacts under lmpact GHG-2, because the AB 32 target includes both
regional growth and land use change and the transportat¡on network, the analysis has not been
separated into two categories, The impact assessment includes both regional growth and land use
change and planned transportat¡on network improvements and programs.
t The 1990 GHG emissions estimate of 25 MMT CO2e in the 2050 RTP/SCS FEIR was based on EMFAC2011
emissions data for vehicles for the region, The 1990 GHG emissions estimate has been updated to utilize the
EMFAC2014 model, as well as other updated information,
San Diego Fon¡¡ard: The Regional Plan
Program Environmental lmpact Repoñ
Page 4,8-25
4.8 Greenhouse Gas Emissions
Emissions calculations are provided in Appendix G-1 to the ElR. The AB 32 analysis also evaluates the
proposed Plan for any conflicts with applicable recommendations for achieving GHG reductions in the
ARB's Scoping Plan Update "transportation focus area".
The other components of lmpact GHG-2 evaluate the proposed Plan for any conflicts with SANDAG's
Climate Action Strategy (Strategy) goals, objectives, and policy measures for GHG reductions, and local
climate action plan policies for GHG reductions. The analysis of the Strategy and local climate actions
plans is provided tor 2A20,2035, and 2050. For the purpose of evaluating impacts under lmpact GHG-2,
because the Climate Action Strategy and local climate action plans establish goals, objectives, and policy
measures for both regional growth and land use change and the trãnsportat¡on network improvements,
the analysis of conflicts with SANDAG's Climate Action Sftategy and local climate action plans has not
been separated into the two categories. The impact assessmant includes both regional growth and land
use change and the transportation network improvements.
During the timeframe of the proposed Plan, climate change effects that are likely to exacerbate the
proposed Plan's greenhouse gas emissions impacts iñclude but are not limited to increases in
temperatures and frequency, duration, and intensity of heatwaves (which could lead to increases in
GHG emissions from local fossil fuel-fired power plants to meet electricity demands); and wildfires
(whieh release GHG emissions), ln general, these climate change effeets would lncrease between 2020
and 2050. Climate change effects are discussed in more detail in Appendix F.
202t
Regional Grawth and Land lJse Change and Transportation Network lmprovements and
Programs
As dlscussed under lmpact GHG-I, under implementation of the proposed Plan, total GHG emissions for
the San Diego region in2Q20 are projected to be approximately 28.8 MMT CO¿e. To be in line with its"equal share" of the state emissions reduction target set forth in AB 32, regional GHG emissions would
need to decrease to 29 MMT COee by 2020. Therefore, the proposed Plan would not conflict with the AB
32 target of reducing statewide emissions to 1990 levels by 2020.
ln addition, the proposed Plan would not conflict with applicable recommendations in the ARB's Scoping
Plan Update for the Transportation focus area. The 2014 Scoping Plan Update identified several
recommended aetions within the Transportation sector to achieve future GHG reductions, with the
recommendations primarily focused on achieving major technological and regulatory changes in order
to reduce GHG emissions from all types of vehicles and transportation fuels, including more efficient
vehicles, low-carbon fuels like electricity and hydrogen, ând supporting infrastructure. The Update also
identified the following applicable recommendations for transportation:
Caltrans and regional transportation agencies will increase irìvestment in expanded transit and
rail services, active transportation, and other VMT-reduction strategies in their next regional
transportation plans.
ARB, Caltrans, the Strategic Growth Council, and the Department of Housing and Community
Þevelopment, along with other State, loeal and regional agencies, will coordinate planning and
suppert to ensure that the expected GHG emisclon reductions from approved SCS are achieved
ôr excaeded.
San Diago Forward: Tha RegionalPlanProgram Environmental I mpact Report
a
a
Page 4.8-2ô

4,8 Greenhouse Gas Emissions
The proposed Plan would not conflict with the recommendation to increase investment in expanded
transit and rail servlces, active transportation, and other VMT-reduction strategles in their regional
transportation plans. From 2012 lo2020,the proposed Plan includes increased investment in transit and
rail services, active transportation, and other VMT-reduetion strategies including double-tracking along
the LOSSAN rail corridor, increases in COASTER frequencies, completion of the Mid-Coast Trolley
Extension from Old Town to University City, the South Bay Rapld Bus from the Otay Mesa ITC to
Downtown San Diego, Rapid Bus Route 905 from lris to the Otay Mesa POE, increases in local bus service
frequencies, express bus routes to SDIA and Tijuana lnternatlonal Airport, a San Marcos shuttle, and
construction of twotransit-only lanes on SR 15 between l-805 and l-8. By2A20, the proposed Plan also
includes investments in approximately 24 regional active transportation projects. Additional major
transportation network improvements would include new Managed Lanes along l-5 from Manchester
Avenue to SR 78 and l-805 from Carroll Canyon Road to SR 52, new toll lanes on SR 11 to the Otay Mesa
POE, new general purpose lanes along a port¡on of SR 76, and a new freeway connector at SR 1.1 and SR
905. By 2020, these improvements would decrease average daily VMT per caplta from 25.2 in 2012 to24.7 in 2020. Also, the proposed Plan's SCS exceeds the regional SB 375 GHG reduction targets, as
shown in lmpact GHG-3
Based on the above analysis, the proposed plan would not conflict with the AB 32 target of reducing
statewide emissions to 1.990 levels by 2020 ar with the recommendations of the Scoping Plan Update.
This impact is less than significant,
SANDAG Climate Action Strateev
The Climate Action Strategy is a guide for SANDAG on climate change policy (SANDAG 2010). The
Climate Action Strategy identifles a range of potentlal policy measures for conslderation ln long-term
planning documents such as the proposed Plan. The Strategy helps SANDAG identify land use,
transportat¡on, and related policy measures and investments that reduce GHG emissions from
transportat¡on and land use.
The Climate Action Strategy includes nine goals designed to address the impacts of GHG emissions and
climate change in the region. The Strategy's goals lnclude flve speciflc goals relating to regional growth
and land use change: Goals 5, 6,7, 8, and 9. These goals have informed the development of theproposed Plan's policies relative to regional growth and land use change. Accordingly, the proposed Plan
would not conflict with the Climate Action Strategy. The proposed Plan's programs and strategies are
designed to be consistent with Cllmate Action Strategy goals and objectlves, and would support thelrimplementation. The proposed Plan therefore contributes to achieving the goals of the Strategy'
Table 4.8-9 presents the Climate Action Strategy goals and objectives that cover regional growth and
land use change and transportation network improvements and programs, and an analysis of whetherproposed Plan features would conflict with any of the goals and objectives'
San Diego Forward: The Regional Plan
Program Environmental lmpact Report
Page 4.8-27
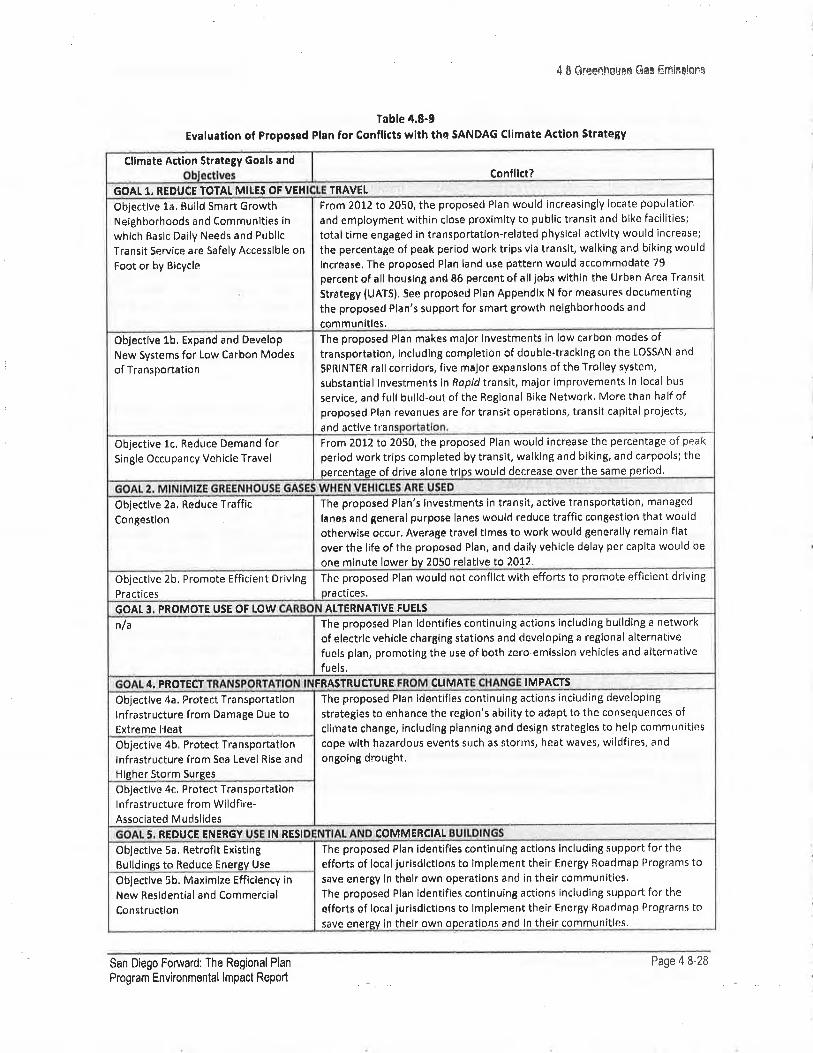
4,8 6reenhcu*B Qe3 €fiÌicBiÊn*
Table 4.8-9
Evaluatlon of Propored Plan for Gonflicts with the $ANÞAG Climate Actisn Strategy
60AT 1, REDUCE TOTAL MIIES OF VET{ TRAVEIFrom 2012 to 2050, the proposed Plan would increasingly locate popu
and employment within close proximity to public transit and bike facilities;
total time engaged in transportation-related physical activlty would increase;
the percentage of peak period work trips via transit, walking and biking would
lncrease. The proposed Plan land uãe pattern would accommodate 79
p€rËent of all housing and 86 percent of all Jabr within lhe [Jrben Area Transit
Strategy (UATS). See proposed Plan Appendix N for measures documentíng
the proposed Plan's support for smart growth neighborhoods and
communities.
lation
Confllct?Cllmate Action Strategy Goals and
Objcctive 1a, Build Smart GrowthNeighborhoods and Communities in
which Basic Daily Needs and Public
Transit Service are Safely Accessible on
Foot or by Bicycle
The proposed Plan makes major investments in low carbon modes oftransportãtion, including completion of double'tracking on the LOSSAN and
SPRINTER rail corridors, five maJor expanslons of the Trolley system,
substantial lnvestments in Rapid transit, major improvements in local bus
serviee, and full build-out of the Regional Bike Network' More than half ofproposed Plan ievenues are for transit operations, transit capital projects,
and active tran
Objective lb, Expand and DeveloP
New systems for Low Carbon Modes
of Transportation
Fram20t2 to 2050, the proposed Plan would inrease the percentage
period work trips completed by transit, walking and biking, and carpools; the
Þercentage of drive alone trips would decrease over the same period,
of peakObjective 1c. Reduce Demand forSingle Occupancy Vehicle Travel
The proposed Plan's investments in transit, active transportation, maRaged
lanes and general purpose lanes would reduce traffic congestion that would
otherwise occur. Avêrage travel tlmes to work would 6enerally remain flat
over the life of the proposed Plan, and daily vehicle delay per caplta would be
one minutè lower by 2050 relatlve to 2012.
Õbjective 2a, Reduce Trafficeongestlon
GOAL 3. PROMOTE USE OF tOW AITERNATIVE FUETS
Objective 2b, Promote Efficient DrivingPra ctices
Objectlve 4a. Protect Transportationlnfrastructure from Damage Due toExtreme Heat
n/a
4. PROTECT
Plan would not conflict with efforts to promote efficient driving
The proposed Plan identifies cont¡nu¡nB actions including building a network
of electric vehlcle charging stations and developing a regional alternativefuels plan, promoting the use of both zero-emíssion vehicles and alternativefuels.
The proposed
ractices,
FRASTRUCTURE IMPACTSCt¡MA
Objective 4b. Protect lra nsportationlnfrastrueture from Sea Level Rise andHigher Storm Surges
The proposed Plan identifies continuing act¡ons including developing
strategies to enhance the region's ability to adapt to the consee¡uences ofcllmate change, includlng planning and design strategies to help communitiescope wlth ha¿ardous events such as gtorms, heat waves, wildfires, and
ongoing drought.
Objective 4e. Protect lransportatlonI nfrâstructure f rom Wildfire-Associated Mudslides
5. REDUCE ENERGY IN ßESI COMMERCIAI.
Objective 5a. Retrofit Ex¡sting
Buildings to Reduc€ Energy Use
Objective 5b, Maximize Effieiency in
New Residentiai and Commereialeonstruction
The proposed Plan identifies eontinuing actions including support for theefforts of localjurisdlctlons to implement their Energy Roadmap Programs tosave energy in thelr own operations and in their communities.The proposed Plan identifies continu¡ng actions includlng support for theeffort¡ of loealjurisdictians to lmplement their Energy Roadmap Programs to
sôve energy in thelr own operations and ln the¡r communitles,
San Ðiego Forward: The Regional Plan
Program Environmental lmpact Report
Page 4,8'28
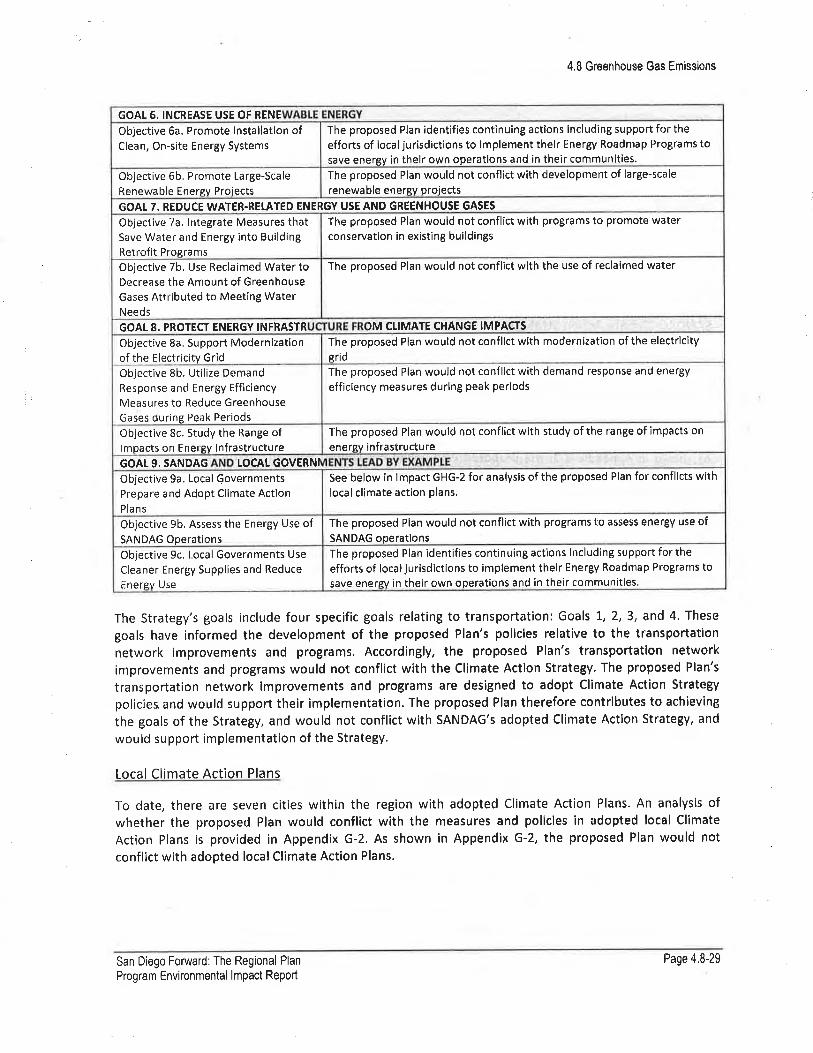
GOAL 6. INCRËASE USE OF RENE
Objective 6a, Promote lnstallation ofClean, On-site Energy Systems
The proposed Plan identifies continuing actions including support for the
efforts of localjurisdictions to implement their Energy Roadmap Programs to
save energy in their own opera tions and in their communities,
The proposed Plan would not conflict with development of large-scale
renewa ble enersv proiectsObjective 6b. Promote Large-Scale
Renewable Energv Proiects
GOAL 7. REDUCE WATER.RELATED ENERGY USE AND GREENHOUSE GASES
The proposed Plan would not conflict with programs to promote waterconservat¡on in existing buildings
Objective 7a, lntegrate Measures thatSave Water and Energy into BuildingRetrofit Programs
The proposed Plan would not conflict with the use of reclaimed waterObjective 7b. Use Reclaimed Water toDecrease the Amount of GreenhouseGases Attributed to Meeting WaterNeeds
)M CLIMATE CIIANGE IMPACÍSGOAL 8. PROTECT ENERGY INFRASTR
The proposed Plan would not conflict with modern¡zation of the electriclty
sridObjective 8a. Support Modern¡zationof the Electricity Grid
The proposed Plan would not conflict with demand response and energy
efficiency measures during peak periodsObjective 8b. Utilize Demand
Response and Energy EfficiencyMeasures to Reduce GreenhouseGases during Peak Periods
The proposed Plan would not conflict with study of the range of impacts on
energv infrastructureObjective 8c, Study the Range oflmpacts on Energv lnfrastructure
See below in lmpact GHG-2 for analysis of the proposed Plan for confllcts withlocal climate act¡on plans.
GOAL 9. SANDAG LOCAT GOVERNI
Objective 9a, Local GovernmentsPrepare and Adopt Climate ActionPla ns
The proposed Plan would not conflict with programs to assess energy use ofSANDAG operations
Objective 9b, Assess the Energy Use ofSANDAG Operations
The proposed Plan identifies continuing actions including support for the
efforts of localjurisdictions to implement their Energy Roadmap Programs to
save energv in their own operations and in their communities'
Objective 9c, Local Governments Use
Cleaner Energy Supplies and Reduce
Enersv Use
4,8 Greenhouse Gas Emissions
The Strategy's goals include four specific goals relatlng to transportation: Goals 1, 2, 3, and 4, These
goals have informed the development of the proposed Plan's policles relative to the transportation
network improvements and programs. Accordingly, the proposed Plan's transportation network
improvements and programs would not conflict with the Climate Action Strategy. The proposed Plan's
transportation network improvements and programs are designed to adopt Climate Action Strategy
policies and would support their implementation. The proposed Plan therefore contributes to achieving
the goals of the Strategy, and would not conflict with SANDAG's adopted Climate Action Strategy, and
would support implementation of the Strategy.
Local Climate Action Plans
To date, there are seven cities within the region w¡th adopted Climate Action Plans. An analysis ofwhether the proposed Plan would conflict with the measures and policies in adopted local Climate
Action Plans is provided in Appendix G-2. As shown in Appendix G-2, the proposed Plan would not
conflict with adopted local Climate Action Plans.
San Diego Fonrvard: The Regional Plan
Program Environmental lmpact Report
Page 4.8-29
4,8 Greenhouse Gas Emissions
2020 Conclusíon
lmplementation of regional growth and land use change and transportation network improvements and
programs under the proposed Plan would not confllct with AB 32, the SANDAG elimate Action Strategy,
or adopted local Climate Action Plans. Therefore, this impact (6HG-2) in the year 2020 is less than
significant.
2035
Regíonal Grawth and Land use Chonge dnd Transportdt¡on Network lmprovements dnd
Programs
SANDAG Climate Action Stratesv
As shown in Table 4.8-9, the proposed Plan would not confllct wlth SANDAG's Climate Action Strâtegy
goats and objectives related to land use or transportation. By 2035, the proposed Plan would continue
to be consistent with the Climate Action Strategy.
Local Climate Action Plans
As shown in ApBendix G-2, the proposed Plan would not eonflict with adopted local Climate Action
Plans, By 2035 the proposed Plan would continue to support the measures and policies within adopted
local Climate Actlon Plans,
2035 Cancluslon
lmplementatlon of regional growth and land use change and transportation network improvements and
programs under the proposed Plan would not conflict with AB 32, the SANDAG Climate Action Strategy,
or adopted local Cllmate Action Plans. Therefore, this impact (GHG-2) in the year 2035 is less than
significant,
2050
Regíonal Growth and Land IJse Change and Transportation Network lmprovements andPrograms
SANDAG Climate Action Stratesv
As shown in Table 4.8-9, the proposed Plan would not conflict with SANDAG's Climate Action Strategygoals ahd objectives related to land use and transportation. By 2050, the proposed Plan would continue
to be consistent w¡th the Climate Action Strategy,
Loca-l Climate Action Plans
As shown in Appendix G-2, the proposed Plan would not csnflict with adopted local Climate Action
Plans. Whlle most local adopted Climate Action Plans do not set speeific policies that extend to 2050,
because the proposßd Plan is con¡i¡tent with the current plans and polieles tô reduce 6HG emissions,
the proposed Plan would continue to support the goals of loeal Climate Actiôn Plans in 2050,
San Diego Forward: The Regional Plan
Program Environmental lmpact Report
Page 4,8-30
4,8 Greenhouse Gas Emissions
2050 Conclusíon
lmplementation of regionalgrowth and land use change and transportation network improvements and
programs under the proposed Plan would not conflict with AB 32, the SANDAG Climate Actlon Strategy,
or adopted local Climate Act¡on Plans. Therefore, this impact (GHC-2) in the year 2050 is less than
significant,
GHG.3 CONFLICT WITH SB 375 EMISSION REDUCTION TARGETS
ANALYSIS METHODOLOGY
The analysis evaluates whether the proposed Plan would conflict with SB 375 GHG emission reduction
targets. SB 375 required ARB to develop regional GHG emisslon reduction targets cornpared to 2005
emissions, for passenger vehicles for 2020 and 2035, The targets established for SANDAG by ARB are toreduce per capita CO2 emissions 7 percent below 2005 levels by 2020 and 13 percent below 2005
levels by 2035 (ARB 201L). ARB has not developed any post-2035 targets (ARB 201aC). The SB 375
technical methodology for estimating GHG emissions is included in Appendix G-3 to the EIR' Because SB
375 does not require 2050 GHG emissions reduction targets, the EIR does not present a 2050 analysis
of conflicts with SB 375.
For the purpose of evaluating impacts under lmpact GHG-3, because the SB 375 targets include both
regional growth and land use change and the transportation network improvements, the analysls ofconflicts with SB 375 emission reduction targets has not been separated into the two categories. The
impact assessment includes both regional growth and land use change and the transportation network
improvements,
2020
Regional Growth and Lond lJse Change and Transportation Network lmprovements sndPrograms
ARB requires SANDAG to reduce per capita CO2 emissions from passenger cars and light'duty trucks 7percent below 2005 levels by 2020. Per capita emissions from passenger cars and light-duty trucks were
26,0 lbs COz/person/day in 2005. Underimplementation of the proposed Plan, GHG emissionswould be
reduced to 21,4 lbs COz/person/day in 2020, an 18 percent reduction from 2005 levels' The GHG
emissions reductions under the proposed Plan would exceed the ARB target of a 7 percent reduction by
2020 (Table 4,8-10). Therefore, implementation of reglonal growth and land use change and
transportation network improvements and programs would not conflict with SB 375 GHG emission
reduction targets. This impact is less than significant impact'
Table 4.8-10
SB 375 GHG Reduction Targets and GHG Emissions under the Proposed Plan, 2020
lbs CO2 per personper day,2020
21.4Per Ca Emissions under the Plan-18o/oPercent Reductions under the Plan-7%ARB Ta
Source: Appendix G-3 to the EIR
Note: Average weekday per capita CO2 reductions for passenger cars and light-duty trucks
from 2005 level of 26.0 pounds per person per day.
San Diego Forward: The Regional Plan
Program Environmental lmpact Report
Page 4,8-31
4.8 Greenhouse Gas Emissions
2020 Concluslon
lmplementatlon of the proposed Plan wsuld not conflict with SB 375 emission reduction targets for
2020. Therefore, this impact (GHG-3) in the year 2020 is less than significant.
2035
Reglonal Growth and Land use Change and Transportation Network lmprovements ond
Programs
ARB requires SANDAG to reduce per capita COl emissions from passenger cars and light-duty trucks 13
percent below 2005 levels by 2035. Under implementation of the proposed Plan, GHG emissions would
be reduced to 19.8 lbs COz/person/da1, a 24 percent reduction from 2005 levels. The GHG emissions
reductions under the proposed Plan would exceed the ARB target of a 13 percent reduction by 2035
(Table 4.S-11). Therefore, implementation of the regional growth and land use change and
transportation network improvements and programs would not conflict with SB 375 GHG emission
reduction targets. This impact is less than significant impact.
Table 4.8-t ¡,
SB 375 GHG Reduction Targets and GHG Emissions under the Proposed Plan,2035
lbs COr per person per
day,2035
19.8Per Capita Emission¡ under the proposed Plan
-24%Percent Reductions under the proposed Plan
-L3%ARB Target
Sourcer Appendix G-3 to the EIR
Note: Average weekday per capita CO2 reductlons for passenger cars and light-duty trucks
from 2005 level of 26.0 pounds per person per day.
2035 Conclusían
lmplementat¡on of the proposed Plan would not conflict with SB 375 emission reduction targets for
2035. Therefore, this impact (CHG-3) in the year 2035 is less than signifieant.
San Diego Fonruard: The Regional Plan
Program Ënvironmental I mpact Report
Page 4,8-32
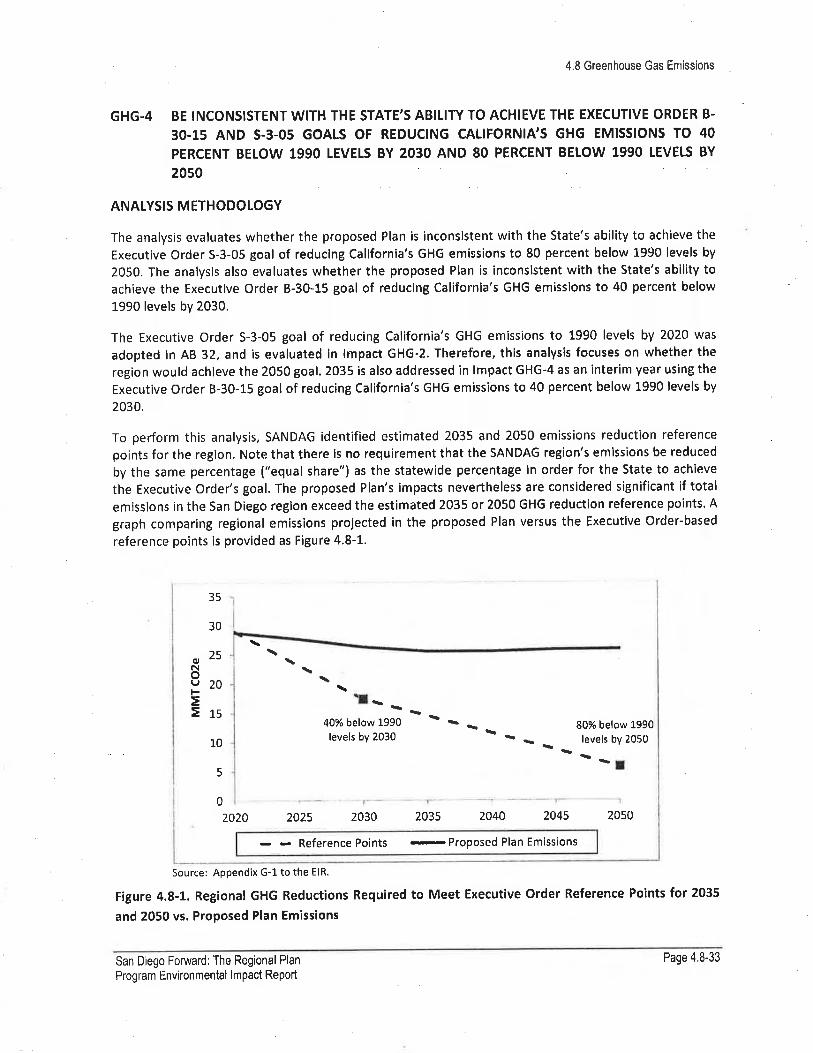
4.8 Greenhouse Gas Emissions
GHG-4 BE INCONSISTENT W¡TH THE STATE,S ABILITY TO ACHIEVE THE EXECUTIVE ORDER B.
30.15 AND 5.3.05 GOALS OF REDUCING CALIFORNIA,S 6HG EMISSIONS TO 40
PERCENT BELOW 1990 LEVETS BY 2O3O AND 80 PERCENT BELOW 1990 LEVELS BY
2050
ANALYSIS METHODOLOGY
The analysis evaluates whether the proposed Plan is inconsistent with the State's ability to achieve the
Executive Order 5-3-05 goal of reduclng Callfornia's GHG emissions to 80 percent below 1990 levels by
2050. The analysis also evaluates whether the proposed Plan is inconsistent with the State's abllity toachieve the Execut¡ve Order B-30-15 goal of reducing California's GHG emissions to 40 percent below
1990 levels by 2030,
The Executive Order 5-3-05 goal of reducing California's GHG emissions to 1990 levels by 2020 was
adopted in AB 32, and is evaluated in lmpact GHG-2. Therefore, this analysls focuses on whether the
region would achieve the 2050 goal. 2035 is also addressed in lmpact GHG-4 as an interim year using the
Executive Order 8-30-15 goal of reducing California's GHG emissions to 40 percent below 1990 levels by
2030,
To perform this analysis, SANDAG identified estimated 2035 and 2050 emissions reduction reference
points for the region. Note that there ls no requirement that the SANDAG region's emissions be reduced
by the same percentage ("equal share") as the statewide percentage in order for the State to achieve
the Executive Order's goal. The proposed Plan's impacts nevertheless are considered significant if total
emissions in the San Diego region exceed the estimated 2035 or 2050 GHG reduction reference points. A
graph comparing regional emissions projected in the proposed Plan versus the Executive Order-based
reference points is provided as Figure 4'8-1'
\ I- ì
\\\\
35
30
,25Noe20EE1s
10
40% below 1990
levels by 2030-¡
I s 5
80% below 1990
levels by 2050
-I5
0 -1
2020 2025 2030 2035 2040 2045 2050
- - Reference Points
-
Proposed Plan Emissions
Source: Appendix G-1 to the ElR.
Figure 4.8-1. Regional GHG Reductions Required to Meet Executive Order Reference Points for 2035
and 2050 vs. Proposed Plan Emissions
San Diego Forward: The Regional Plan
Program Environmental lmpact Reporl
Page 4,8-33

4.8 Greenhouse Gas Emissions
SANDAG identified the 2050 reference point by applying an 80 percent reduction to the San Diego
region's 1990 emissions level. The 40 percent reduction was applied to the region's 1990 emissions level
to identify a 2030 reference point, which was then used to develop a 2035 reference point by using a
straight line trajectory from the 2030 goalto the 2050 goal.
As described in lmpact GHG-2, the San Diego region's 1990 GFIG emissions totaled 29 MMT CO¿e (see
Appendix G-l to the EIR). By applying the methodology described above, the 2035 reference point was
identified as 14,5 MMT CO2e, and the 2050 reference point was identified as 5.8 MMT COze.
For the purpose of evaluating impacts under lmpact GHG-4, because the Executive Order goals include
both regional growth and land use change and the transportation network, the analysis has not been
separated lnto the two categories. The impact assessment includes both regional growth and land use
change and the transportation network. Êmission calculations are provided in Appendix G-1.
During the timeframe of the proposed Plan, climate change effects that are likely to exacerbate theproposed Plan's greenhouse gas emissions irnpacts include but are not limited to increases in
temperatures and frequency, duration, and intensity of heatwaves (which could lead to increases in
GHG emissions from local fossil fuel-fired power plants to meet electricity demands); and wildfires(which release GHG emissions of criteria pollutants. ln general, these climate change effects would
inrease between 2020 and 2050. Climate change effects are discussed in more detail in Appendix F.
2035
Regíonal Growth and Land lJse Chdnge and Transportdtíon Network lmprovements and
Pragrams
As discussed under lmpact GHG-l, under implementation of the proposed Plan, totalGHG emissions forthe San Diego region in 2035 are projected to be approximately 25,5 MMT COze, or 28 percent lower
than GHG emissions in 2012 (Table 4,8-7ll, To be in line with its "equal share" ôf the state emissions
reduction goals set forth in Executive Orders 5-3-05 and 8-30-15, regional GHG ernissions would need todecrease to L4.5 MMT COze by 2035.
Figure 4.8-1 shows a projection of "egual share" reductions for the San Diego region, compared toestimated proposed Plan emissions. ln addition, Figure 4.8-2 compares the Executive Order-based 2035
reference point for the region with projected GHG emission under the proposed Plan. This is a
signlficant impact.
San tiego ForuardrThe Regional Flan
Program Environmental lmpact Report
Page 4,8-34
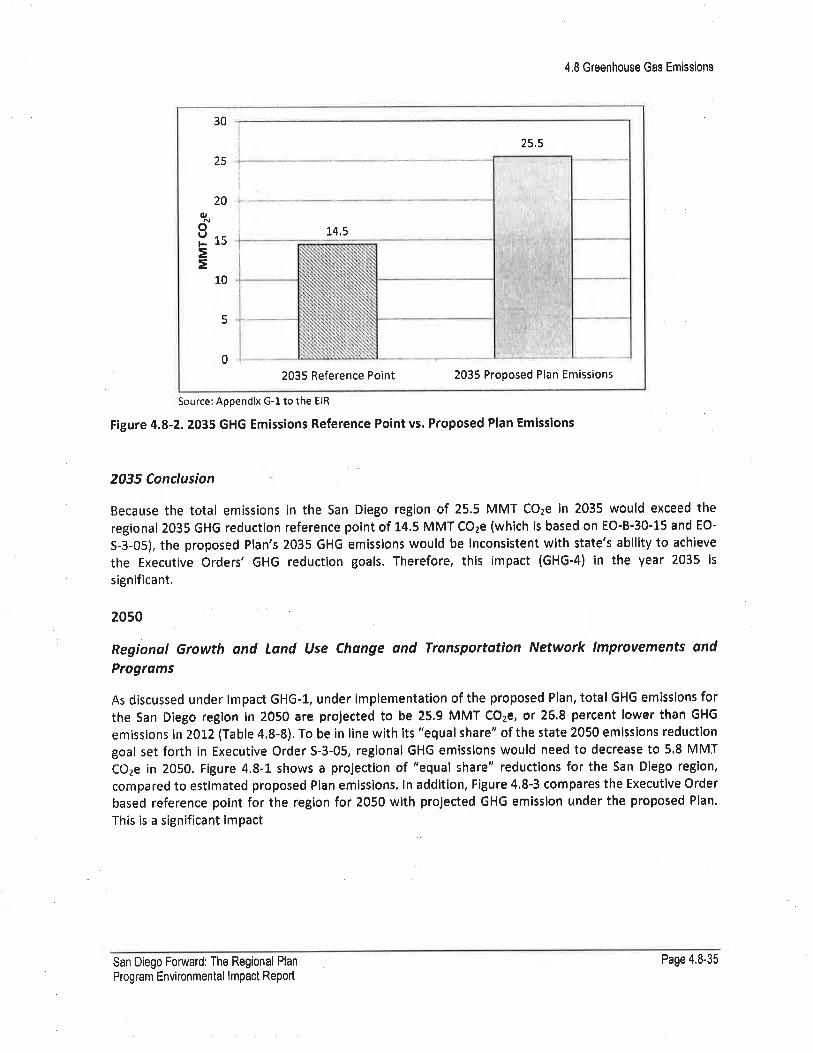
4,8 Greenhouse Gas Emissions
30
25
20o
doErs=E
10
5
0
2035 Reference Point 2035 Proposed Plan Emissions
25,5
14.5
Source: Appendix G-l to the EIR
Figure 4.8-2. 2035 GHG Emissions Reference Point vs. Proposed Plan Emissions
2035 Conclusion
Because the total emissions in the San Diego region of 25.5 MMT COze in 2035 would exceed the
regional 2035 GHG reductlon reference point of 14,5 MMT CO¿e (which is based on EO-B-30-15 and EO-
5-3-05), the proposed Plan's 2035 GHG emissions would be lnconsistent with state's ability to achieve
the Executive Orders' GHG reduction goals. Therefore, this impact (GHG-4) in the year 2035 is
significa nt,
2050
RegÍonal Growth ond Ldnd lJse Chonge ond Transportatíon Network lmprovements qnd
Programs
As discussed under lmpact GHG-l, under implementat¡on of the proposed Plan, total GHG emissions for
the San Diego region in 2050 are proJected to be 25.9 MMT COzê, or 26.8 percent lower than GHG
emissions in 20L2 (Table 4.8-8). To be in line with its "equal share" of the state 2050 emlsslons reduction
goal set forth in Executive Order 5-3-05, regional GHG emissions would need to decrease to 5,8 MMÏCOze in 2050. Figure 4.8-1 shows a projection of "equal share" reductions for the San Diego region,
compared to estimated proposed Plan emissions. ln addition, Figure 4.8-3 compares the Executlve Order
based reference point for the region for 2050 with projected GHG emisslon under the proposed Plan'
This is a significant impact
San Diego Forward: The Regional Plan
Program Environmental lmpact Report
Page 4,8-35
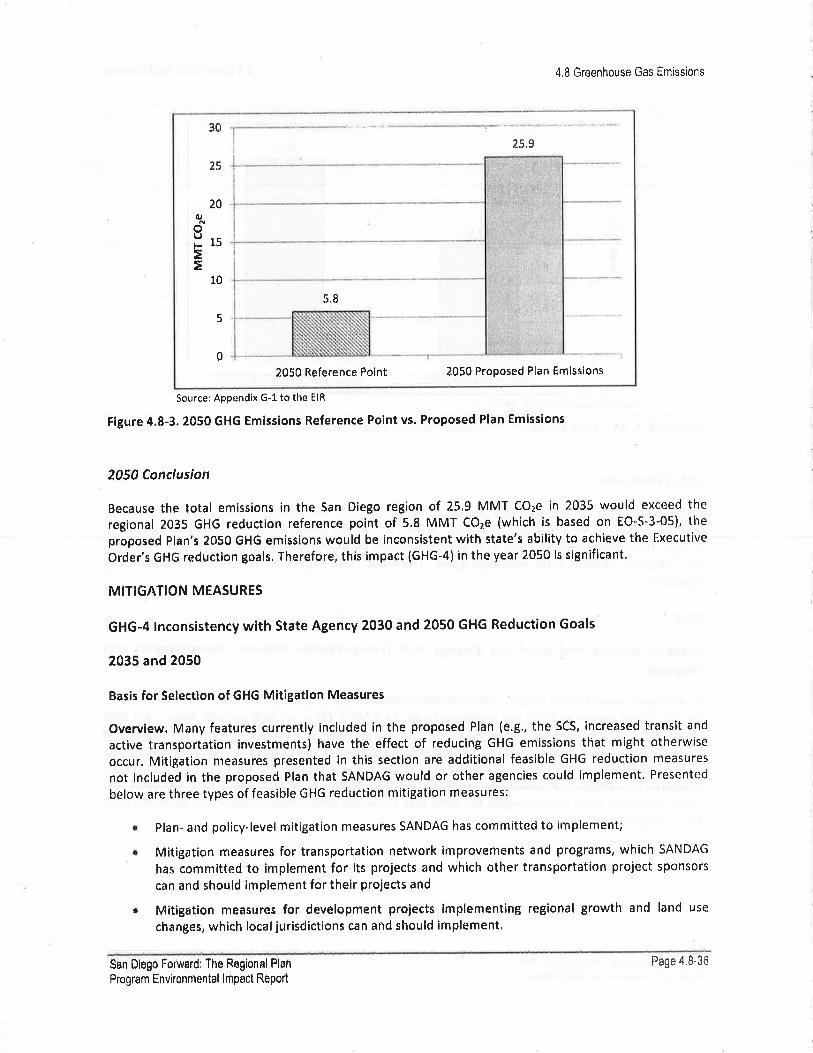
4.8 Greenhouse Gas Ernissions
36
25
25,9
2Ao
NoItsEã
10
5.8
5
0
2050 Reference Polnt 2050 Proposed Plan Emissions
Source: Appendix G-1 to the EIR
Figure 4.8-3. 2050 GHG Emissions Reference Point vs. Proposed Plan Emissions
2050 ConclusÍon
Because the total emissions in the San Diego region of 25,9 MMT COre in 2035 would exceed the
regional 2035 GHG reduction reference point of 5.8 MMT COle {which is based on EO-S-3-05), the
proposed Plan's 2050 GHG emissisns would be inconsistent wlth state's ability to ae hieve the Executive
Order's GHG reduction goals. Therefore, this impact (GHG-4) in the year 2050 is signlficant.
MITIGATION MEASURES
GHG-4 lnconsistency with State Agency 2Û30 arìd 2050 Gl-lG Reduction Goals
2035 and 205t
Basis for Selection of GHG Mitigation Measures
Overview. Many features currently included in the proposed Plan (e.g., the SCS, increased translt and
active transportation investments) have the effect of reducing GHG emissions that might otherwise
occur. Mitigation nreasures presented in this section are additional feasible GHG reduction measures
not included in the proposed Plan that SANDAG would or other agencies eould implement. Presented
below are three types of feasible GHG reduction mitigation measures:
Plan- and policy-level mitigation measures SANDAG has committed to implement;
Mitigation rileasures for transportation network improvements and programs, which SANDAG
has committed to implement for its projects and which other tfansportation project sponsors
can and should implement for their projects and
Mitigation measures for development projects lmplementing regional growth and land use
changes, which localjurisdictions can aRd should implement.
San Diego Fon¡¿ard: the Regionsl Plan
Program Environmental lmpact Repod
a
a
Page 4.8-36
4.8 Greenhouee Gss Emicslone
While SANDAG has the authority to implement the mitigation measures it has committed to, it has no
legal authority to require other transportation project sponsors or local jurisdlctions to implementmitigation measures for specific projects for which they have responslbility and jurisdiction. As explained
in Section 4.0, mitigation can include measures that are within the responsibility and jurisdiction ofanother public agency, SANDAG in its CEQA findings may find that those measures assigned to other
agencies can and should be adopted by those other agencies (CEQA Guidelines Section 1509l(a)(2)),
Other potential mitigation measures to reduce GHG emissions are included as components of theproject alternatives in Chapter 6.0, rather than as individual mltlgatlon measures in this section,a These
include still more compact land use patterns, accelerated and increased translt investments, reduced or
no highway investments, and policies to reduce transit fares, increase parking prices, and establish road
user fees.
Achieving the EO-5-3-05 GHG Reduction Goal. The state currently has no plan (e.g., analogous to the AB
32 Scoping Plan) for achieving the EO-B-30-15 and ËO-S-3-05 GHG reduction goals, However, recent
studies have shown that achieving these goals, whether statewide or within the San Diego region, would
require major changes in clean technologies utilization, markets, and state and federal regulations,
For example, a recent study (Greenblatt 20L5) presented an aggressive set of 49 policies intended to
achieve the statewide 2050 goal, though implementing all these policles still fell short of the goal. These
policies included major increases in energy efficiency, reduced GHG intensities of both fuel and
electricity, and a shíft away from direct fuel combustion and toward electricity, particularly in
transportation. For example, the most aggressive scenario, Scenario 3, included policies such as
increasing the average fleet gasoline efficiency to 54 MPG, doubled high-speed rail deployment,
replacing all natural gas use in buildings with electric heat pumps by 2050, 50% residential zero net
energy retrofits by 2030, adding 2.2 GW nuclear power capacity by 2050, and building 8 carbon capture
and sequestration (CCS)facilities at power plants.
Similarly, Greenblatt and Long l20l2l in an older study found that achieving the 2050 EO goal would
likely require maximizlng efflciency in all economlc sectors, elecffiflcation of much of the transportation
sector and many stationary uses of heat, a doubling of electricity production with nearly zero emissions,
and development of low-carbon fuels. They concluded that achieving the EO goal would require a
combination of strateg¡es; although some are available now, they conclude others would require
substantial research and development to realize. These include electricity load balancing, substantially
increasing biomass fuel supply, and making CCS 100% effective and economicalto implement on a large
sca le,
Achieving the EO 8-30-15 GHG Reduction Goal. A recent study commissioned by state agencies focused
on scenarlos for deep reductlons in GHG emissions in 2030. (Energy+Environmental Eeonomics
2015).The study found that up to 38% reductions in GHG emissions (close to the EO 8-30-15 goal of
ao%l by 2030 could be achieved with "significant progress" in energy efficiency, switching to low carbon
fuel sources, producing lower ca.rbon electricity and fuels, and reducing non-energy GHGs. "significantprogress" included measures such as doubled energy efficiency in buildings by 2030, 50%'60% oÍ
electricity sales from renewable energy by 2030, and rapid penetrat¡on of near-zero and zero-emissions
vehicles,
a Alternatives and mitigation measures are two alternative means for avoiding or reducing a project's significant
environmental impacts, See CEQA Guidelines Section 15002(h).
San Diego Forward: The Regional Plan
Program Environmental lmpact Report
Page 4.8-37
4,8 Greenhouse Gas Emissions
The study noted that scenarios implementing these measures would rely on existing technologies, and
were consistent with a continuation óf current lifestyles and economic growth. The pace of emissions
reductions would, however, require that key low-carbon technologies be commercialized, produced at
scale, and achieve broad market adoption in the next L0-15 years,
RegionalScenarios. The GHG inventory prepared forthe proposed Plan (Appendix G-1) analysis is based
on irnplementation of current regulations, policies, and programs. An alternative scenario ("scenario 3")
for the San Diego region is presented in Appendix G-4. lt assumes major changes in the technologies,
markets, and state and federal regulations, For example, strategies included a move loward 100 percent
renewable electricity, 100 percent zero emission vehicle passenger fleet, and 90 percent landfill waste
diversion. With implementation of these measures, regional emissions would be reduced lo 77% below
1990 emissions, but would still fall short of the 80% below 1990 emissions reference point based on EÔ-
5-3-05. ln this scenario, electricity and passenger vehicles contribute zero emissions; emissions remain
primarily from industrial sources, natural gas, aviation, and ôff-road fuel use.
Foeusing on the transportat¡on sector, Chapter 2 of the proposed Plan includes scenarios for how
statewide GHG emissions specifically from the ffansportation sector could be reduced by 80% below
1990 levels.s Scenarios developed under the ARB Vision Program and the Draft California Transportationplan (CTP) envision how this goal might be achieved statewide given an aggressive set of strategies
requiring major VMT reduction, as well as improvements in vehicle and fuel technologies. For example,
the Draft CTP's VMT reductisn strategies include a 75% inrease in auto operating costs, and doubling of
all transit services and speeds.
Using the ARB Vision and Draft CTP frameworks, Chapter 2 of the proposed Plan discusses scenarios for
the SANDAG region showing how an 80% reduetion in mass GHG emissions from passenger vehicles
might be met by highly aggressive implementation of ZEV penetration and VMT reduction measures.
See Figure 4,8-4, Achieving these additional emission reductions would require major changes in clean
technologles utilization, markets, and state and federal policies and regulations. The proposed Plan does
set forth ambltious but currently feasible TSM, electric vehicle, and other programs that can be
implemented now and in the future aligned with the 2050 GHG reduction scenarios in the various
studles dlscu¡sed absve.
s Looking Past ao35-Possible Pathways for Additional Greenhouse 6as Emissions Reductions, This section and
associated appendix information are hereby incorporated by reference intó the ElR.
Sen Diego Fon¡vard: The Regional Plan
Program Environmental lmpact Report
Page 4.8-38

4.8 Greenhouse Gas Emi¡sions
Total Projected Carbon Díoxide Emissions from Cars andLight-Duty Trucks for the San Diego Region
1990 CO: Ërnissíons(AB 32)
B0Yo below 1990 ievelsCO2 [missions Goal
2420
rtol\,
&
=H
.9,9Euû,!qX,9oo
!tü
ocoÞåúfloq!g{,{
45,000
40,000
3s,000
30,000
25,000
20,000
15,000
10,000
5,000
i
i.i
I
i
I \\
-Jìh- rkb
à01 2 2035
-Emissio¡rs
before current ARB Policy iPavley + LCSF)
mEmissions wtth current ARg Poliry (Påvley + LCFS)
+ 25 parcent Uero Ëmission FleeWMT reduclions
¿050
50 percent zero EmisJion75 percent Zero Erníssion
Fleevr/MTfle€WMr
rådurtiônsreductíon5
Source: SANDAG 2015
Figure 4.8-4, Total Projected Carbon Dioxide Emissions from Cars and Light Duty Trucks for the San
Diego Region.
Conclusion. Full implementation of many of the measures that could result in a 40% reduction of GHG
emissions by 2030 and an 80% reduetlon of GHG emissions by 2050 in the San Diego region would
require major changes in clean technologies utilization, markets, and state and federal policies and
regulations, The following mitigation measures would help reduce regional GHG emissions through
reducing VMT, increasing use of alternative fuels, and other measures; they would reduce inconsisteney
of the propose Plan's GHG emissions with the state's ability to achieve the EO B -30-15 and E0-5-3-05
GHG reduction goals. However, full implementation of changes required to achieve the Executive
Orders' goals is beyond SANDAG's or local agencies' current ability to implement.
GHG-4A Allocate Competitive Grant Funding to Projects that Reduce GHG Emissions (SANDAG)
SANDAG shall revise the IrønsNet Smart Growth lncentive and Active Transportation Grant Programs in
the following ways to achieve GHG reductions:
a Adopt new or revised grant criteria to give greater weight to a project's ability to directly reduce
GHG emissions. Criteria include, but are not limited to, awarding points to projects that directly
implement local climate action plans that reduce GHG emissions, or that directly implement
parking strategies that reduce GHG emissions.
San Diego Forward: The Regional Plan
Program Environmental lmpact Report
Page 4.8-39
4,å Greenhaueø Bac Ëmiaaions
o Require locally adopted CAPs and complete streets policies as prerequisites to be eliglble forgrant funding.
¡ lf a local jurisdiction does not have an adopted CAP or complete streets policy, SANDAG shall
make available competitive funding through the grant programs for preparation of a CAP and/or
complete streets policy.
r ln addition to grant funding, SANDAG shall provide technical assistance to localjurisdictions for
the preparation of CAPs as desribed in GHG-48.
¡ These changes shall be adopted and effective for the fourth cycle of funding for both progrâms,
which is expected to be released in December 2016.
GHG-48 Adopt a Regional Mobility Hub Strategy to Reduce GHG Emlssions (SANDAG)
Mobility hubs are places of connectivity, where different modes of transportation-walking, biking,
ridesharing, and transit-come together to connect people to their Jobs, school, shopping, errands,
recreation, and back home; they reduce GHG emissions through reducing VMT and increasing transit
use and altcrnative transportation, To implement mobility hub concepts outlined ln the proposed Plan,
SANDAG shall adopt a Mobility Hub Strategy no later than 20X7 that includes:
3.. ldentification of mobility hub features and infrastructure requirements
l, Selecgon of 20 mobility hub loeations that allgn with the smart growth place types identified in
the Smart 6rowth Coneept Map. Three mobllity hubs wlll be implemented by 2020, and 17 will
be implemented by 2035.
3. Estâbllshment of first mile/last mile transportation networks for each candidate mobility hub
site based on travel pattcrns, access catchment areas, and adjacent land uses
4. Development of design guidelines for each candidate mobility hub site
5. Recommendation of specific mobility hub improvements and preparation of conceptual
designs and capital cost estimates for each candidate mobility hub site
6. Strategies for lmplementation, including the potential for public-private partnerships and a
phasing strategy
GHG-4C Fund Electrlc Vehicle Charging lnfrastructure (SANDAG)
To implement the proposed Plan action calling for building a network of electric vehicle chargers topromote the use of electric vehicles, SANDAG shall set aside approximately $30 m¡ll¡on of Congestion
Management and Air Quality (CMAQ lmprovement Program funds expected between 2020 and 2050
(approximately $1 million annually) to fund the installation of publicly available electric vehicle charging
infrastructure, lncreasing the number of publicly available electric vehicle eharging points would reduce
GHG emissions by extending the electric range of plug-in hybrid electric vehicles that would replace
gasoline-powered internal combustion engines. The funding would be provided is an incentive for
installatlon of Level 1 and Level 2 electric vehicle chargers in publicly accessible locations throughout the
region. Level 1 charging {similar to a standard walt outlet) adds about 2 to 5 miles of range to an electric
vehicle per hour of charging time while Level 2 (240 V circuit) adds about 10 to 20 miles of range per
hour of charglng tlme. A detailed program will be developed and presented to the SANDAG Board of
Directors before the adoptlon of the next Plan update with funding becoming available by 2020.
San Diego Fonivard: The Regional Plan
Program Environmental lmpact Report
Page 4.8-40
4,8 Greenhouse Gas Emissions
Available funding will be leveraged to install up to 36,000 EV chargers by 2035 and an additional 44,000
chargers by 2050. This expanded charging network would reduce emlssions by an estlmated 390,000 lbs
COz by 2035 and 455,000 lbs COz by 2050 through the extended range of plug-in hybrid electric vehicles.
GHc-4D Adopt a Plan for Transportat¡on Fuels that Reduce GHG Emissions (SANDAG)
SANDAG shall adopt a regional readiness plan for the deployment of infrastructure for all alternative
fuels by 2016, The plan will identify barriers to developing alternative fuel infrastructure, and inelude
recommendations and resources for stakeholders to overcome these barriers. The plan will build on theregional readiness plan for plug-in electric vehicles accepted by the Board in 2014, This plan willcontribute to reductions in GHGs through developing recommendations for facilitating access toalternative fuels, which will reduce emissions from vehicles..
Also, SANDAG has received a notice of proposed award from CEC for additional funding to implementthe PEV Readiness Plan over 2 years, SANDAG shall provide technical asslstance to local government
staff, contractors, and property managers on permitting, inspection, and installation for EV charging and
general PEV awareness activities. This funding is included in the Fiscal Year L6 budget,
GHG-4E Assist in the Preparation of Climate Action Plans and Other Measures to Reduce GHG
Emissions (SANDAG)
SANDAG shall assist local governments in the preparation of CAPs, and other policies/measures toreduce GHG emlsslons. SANDAG shall assist loeal governments in identlfylng all feasible measures to
reduce GHG emission to 1990 levels by 2020, and achieve further reductions beyond 2020 consistent
with adopted regional or local GHG reduction targets. Specific forms of SANDAG assistance include, butare not limited to:
Assisting its member agencies in obtaining funding for, directly funding, updating and
implementing CAPs and other cllmate strategies through eontinued implementation of theSANDAG Energy Roadmap Program,
Providing funding and energy planning assistance to local governments to implement projects
that save energy and reduce energy-related GHG emissions.
As described in GHG-44, for localjurisdictions that do not have an adopted CAP, SANDAG shall
make available competitive funding through the grant progrâms for preparation of a CAP.
GHG-4F lmplement Measures to Reduce GHG Emissions from Transportation Projects (SANDAGI
During the planning, design, project-level CEQA review, construction, and operation of transportation
network improvements, SANDAG shall implement measures to reduce GHG emisslons, lncluding but not
limited to, applicable transportation project measures on the Attorney General's list of project specific
measures (California Attorney General's Office 2010), as well as the CAPCOA reference, Quantifying
Greenhouse Gas Mitigation Measures (CAPCOA 2010). These include, but are not limited to, the
following:
San Diego Forward: The Regional Plan
Program Environmental lmpact Report
a
a
t
Page 4,8-41
4,8 Greenhouse Gas Emissions
lmplement construction measures through construction bid specifications, including the
following topics:
o Use energy and fuel efficient vehicles and equipment;
o Use alternative fuelvehicles and equipment;
ô use lighting systems that are energy efficient, including LED technology;
o Use llghter-colored pavement, binding agents that are less GHG-intensive than Portland
cement, and less-GHG intensive asphalt pavements; and
o Recycle construction debris.
tnstall efficient lighting (including LEDs) for traffic, street, and other outdoor lighting,
lncorporate infrastructure electrification into project design (e.g., electrie vehicle charging)'
lncorporate elecr¡c vehicle supply equipment (EVSE) into projects that include commuter
parking areas.
Design measures to reduce GHG emissions from solid waste management through encouraging
solid waste recycling and reuse.
Þesign measures to reduce energy consumption and increase use of renewable energy, such as
solar-powered toll booths and other facilities, including those listed in Mitigation Measures EN-
2A and EN-3C.
Design measures to reduce water consumption, such as drought-resistant landscaping, smart
irrigation systems, and other measures including those listed in Mitigation Measure WS-14'
Construct buildings to Leadership in Energy and Ënvironmental Design (LEED) certified standards
or equivalent standards.
Funding for those measures that SANDAG selects would be included in individual project budgets.
GHG-4G lmplement Measures to Reduce GHG Emissions from Transportation Projects (Other
Transportation Project Sponsors)
During the planning, design, project-level CEOA review, construction, and operation of transportation
network improvements, othér transportâtlon project $ponsors ean and should lmplement measures tc
reduce GHG emissions, including, but not limited to, those described in Mitigation Measure GHG-4F.
GHG-4H lmplement Measure¡ to Reduce GHG Emissions from Development Projects (Local
Governments!
During the planning, design, project-level CEQA review, construction, and operation of development
projects, the County of San Diego and cities can and should implement measures to reduce GHG
emisslons, includlng but not limited to, appllcable land use measures on the Attorney General's list ofproject specific measures (California Attorney General's Office 2010), as well as the CAPCOA reference,
Quantifying Greenhouse Gas Mltigation Measures (CAPCOA 2010). These measures include, but are not
llmited to, the followlng;
San Diego Forward: The Regional Plan
Program Environmental lmpact Report
a
a
a
a
a
a
a
a
Page 4.8-42
a
a
4,8 Greenhsuse Gas Emissions
Construction measures, including those listed in Mitigation Measure GHG-4F,
Measures that reduce VMT by lncreasing transit use, carpoollng, blke-share and car-shareprograms, and active transportation, including:
o Building or funding a major transit stop within or near development, in coordinationwith transit agencies;
o Developing car-sharing and bike-sharing programs;
o Providing transit incentives, including transit passes for MTS/NCÍD buses and trolleys;
o Consistent with the Regional Bicycle Plan, incorporating bicycle and pedestrian facilitiesinto project designs, maintaining these facilities, and providing amenities incentivizingtheir use; and planning for and building local bieycle projects that connect with theregional network;
o lmplementing complete streets consistent with the SANDAG Regional Complete Streets
Policy, including adopting local complete streets policies;
o lmplementing mobility hubs consistent with the Regional Mobility Hub Strategy;
o lmproving trans¡t access to bus and trolley routes by incentives for construction oftransit facilities within developments, and/or providing dedicated shuttle service totrolley and transit stations; and
o lmplementing employer trip reduction measures to'reduce employee trips and VMTsuch as vanpool and carpool programs, providing end-of-trip facilitles, and
telecom muting programs.
Measures that reduce VMT through parking strategies based on the SANDAG Regional Parking
Management Toolbox, ineluding:
o Parking pricing strategies consistent with the Toolbox;
o Reduced minimum parking requirements;
o Residential parking permit programs;
o Designate a percentage of parking spaces for ride-sharing vehicles or high-occupancy
vehicles, and provide adequate passenger loading and unloading for those vehicles;
o Provide adequate bicycle parking;
o Other strategies in the SANDAG Regional Parking Management Toolbox
Measures that reduce VMT through Transportation Systems Management (TSM), including
measures included in proposed Plan Appendix E.
Land use siting and design measures that reduce GHG emissions, including:
o Developing on infill and brownfields sites;
o Building high density and mixed use developments near transit; and
o Retaining on-site mature trees and vegetation.
Measures that increase vehicle efficiency or reduce the carbon content of fuels, including
constructing electric vehicle charging stations or nelghborhood electric vehicle networksconsistent with SANDAG's regional readiness planning for alternative fuels.
a
a
a
a
San Diego Forward: The Regional Plan
Program Environmental lmpact Report
Page 4.8-43
4.8 Greenhouse Gas Emissions
Measures to reduce GHG emissions from solid waste management through encouraging solid
waste recycling and reuse'
Measures to reduce energy consumption and increase use of renewable energy, including those
listed in Mitigation Measures EN-2A and EN-3C'
Measures to reduce water consumption, including those listed in Mitigation Measure WS-XX.
M¡t¡gatlon Mea¡ures AQ4A, AQ4B, and AQ-4C would also reduce emissions of GHGs by reducing
overall pollutant emisslons from equipment and vehicles. These measures include:
r Mitigation Measure Aq-44. Reduce Localized Particulate and/orTAC Emissions'
o Mitigation Measure Aû-48. Reduce diesel emissions during construction from off-road
equipment.
¡ Mitigation Measure AQ-4C. Reduce diesel emissions during construction from on-road vehicles.
Mitigation Measures EN-38 would also reduce emissions of GHGs by reducing conventional energy use
and therefore reducing emissions associated with combustion of fossil fuels used in conventional power
plants.
Mitlgation Measure WS-14 would increase water conservation, and thereby reduce GHG emissions
assoclated with water supply conveyance, storage, treatment, and distribution.
SIG NIFICANCE ATTER MITIGATION
2035 and 2050
lmplementation of Mitigation Measures GHG-44 through Gl'lG-4H, as well as Mitigation Measures AQ-
4A, Ae-48, AQ-4C, EN-38 and WS-14, would reduce GHG emissions. The effectiveness of a number of
the project-specific measures in reducing GHG emissions has been quantified by CAPCOA (2010). Based
on the studies cited in the introduction to the mitigation section, however, even full implementation of
all identified mitigation measures would not be sufficient to reduce the proposed Plan's GHG emissions
below the regional 2030 and 2050 GHG reduction reference points based on EO B- 30-15 and E0-S-3-05.
Because the proposed Plan's 2035 GHG emissions would remain inconsistent with state's current ability
to achieve the Executive Orders'GHG reduction goals, this impact (lmpact GHG-4) remains significant
and unavoidable.
San Diego Forward:The Regional Plan
Program Environmental lmpact Reporl
a
a
a
Page 4,8-44