Radiative forcings for 28 potential Archean greenhouse gases
23
Clim. Past, 10, 1779–1801, 2014 www.clim-past.net/10/1779/2014/ doi:10.5194/cp-10-1779-2014 © Author(s) 2014. CC Attribution 3.0 License. Radiative forcings for 28 potential Archean greenhouse gases B. Byrne 1,* and C. Goldblatt 1 1 School of Earth and Ocean Sciences, University of Victoria, Victoria, BC, Canada * now at: Department of Physics, University of Toronto, Toronto, Ontario, Canada Correspondence to: B. Byrne ([email protected]) Received: 2 April 2014 – Published in Clim. Past Discuss.: 12 May 2014 Revised: 14 August 2014 – Accepted: 22 August 2014 – Published: 1 October 2014 Abstract. Despite reduced insolation in the late Archean, ev- idence suggests a warm climate which was likely sustained by a stronger greenhouse effect, the so-called faint young sun problem (FYSP). CO 2 and CH 4 are generally thought to be the mainstays of this enhanced greenhouse, though many other gases have been proposed. We present high accuracy radiative forcings for CO 2 , CH 4 , and 26 other gases, per- forming the radiative transfer calculations at line-by-line res- olution and using HITRAN 2012 line data for background pressures of 0.5, 1, and 2 bar of atmospheric N 2 . For CO 2 to resolve the FYSP alone at 2.8 Gyr BP (80 % of present solar luminosity), 0.32 bar is needed with 0.5 bar of atmospheric N 2 , 0.20 bar with 1 bar of atmospheric N 2 , or 0.11 bar with 2 bar of atmospheric N 2 . For CH 4 , we find that near-infrared absorption is much stronger than previously thought, arising from updates to the HITRAN database. CH 4 radiative forcing peaks at 10.3, 9, or 8.3 W m -2 for background pressures of 0.5, 1, or 2 bar, likely limiting the utility of CH 4 for warming the Archean. For the other 26 HITRAN gases, radiative forc- ings of up to a few to 10Wm -2 are obtained from concen- trations of 0.1–1 ppmv for many gases. For the 20 strongest gases, we calculate the reduction in radiative forcing due to overlap. We also tabulate the modern sources, sinks, concen- trations, and lifetimes of these gases and summaries the lit- erature on Archean sources and concentrations. We recom- mend the forcings provided here be used both as a first refer- ence for which gases are likely good greenhouse gases, and as a standard set of calculations for validation of radiative forcing calculations for the Archean. 1 Introduction The standard stellar model predicts that the luminosity of a star increases over its main-sequence lifetime (Gough, 1981). Therefore, the sun is 30 % brighter now than it was when the solar system formed. Despite a dimmer sun during the Archean (3.8–2.5 Gyr BP), geologic evidence suggests surface temperatures similar to today (Donn et al., 1965): this apparent paradox is known as the faint young sun prob- lem (FYSP). To reconcile this, Earth must have had a lower albedo and/or a stronger greenhouse effect in the past. In this work we focus on a stronger greenhouse effect, which is thought to be the primary cause of the warming (Goldblatt and Zahnle, 2011b; Wolf and Toon, 2013). We focus on the late Archean with a solar constant of 0.8 S 0 , resulting in an reduction of ≈ 50 W m -2 of insolation. NH 3 was proposed as a solution to the FYSP soon af- ter the problem was posed (Sagan and Mullen, 1972). NH 3 is a strong greenhouse gas and concentrations of 10 ppmv could have warmed the Archean surface by 12–15 K (Kuhn and Atreya, 1979). At the time NH 3 was proposed as a solu- tion, it was thought that the early Earth was strongly reduc- ing such that NH 3 could have built up to significant atmo- spheric concentrations. However, the Archean atmosphere is now thought to have been only mildly reducing. NH 3 would likely have photo-dissociated rapidly without UV protection (Kuhn and Atreya, 1979; Kasting, 1982). Furthermore, NH 3 is highly soluble and would have been susceptible to rain-out. Therefore, sustaining atmospheric concentrations of NH 3 at which there is significant absorption may not be as easy as originally thought. Considering the destruction of NH 3 by photolysis, Kasting (1982) found that concentrations as high as 10 ppbv could plausibly be attained by biotic sources. If NH 3 were shielded from UV radiation (by a possible organic Published by Copernicus Publications on behalf of the European Geosciences Union.
-
Upload
khangminh22 -
Category
Documents
-
view
3 -
download
0
Transcript of Radiative forcings for 28 potential Archean greenhouse gases

Clim Past 10 1779ndash1801 2014wwwclim-pastnet1017792014doi105194cp-10-1779-2014copy Author(s) 2014 CC Attribution 30 License
Radiative forcings for 28 potential Archean greenhouse gases
B Byrne1 and C Goldblatt1
1School of Earth and Ocean Sciences University of Victoria Victoria BC Canada now at Department of Physics University of Toronto Toronto Ontario Canada
Correspondence toB Byrne (bbyrnephysicsutorontoca)
Received 2 April 2014 ndash Published in Clim Past Discuss 12 May 2014Revised 14 August 2014 ndash Accepted 22 August 2014 ndash Published 1 October 2014
Abstract Despite reduced insolation in the late Archean ev-idence suggests a warm climate which was likely sustainedby a stronger greenhouse effect the so-called faint youngsun problem (FYSP) CO2 and CH4 are generally thought tobe the mainstays of this enhanced greenhouse though manyother gases have been proposed We present high accuracyradiative forcings for CO2 CH4 and 26 other gases per-forming the radiative transfer calculations at line-by-line res-olution and using HITRAN 2012 line data for backgroundpressures of 05 1 and 2 bar of atmospheric N2 For CO2 toresolve the FYSP alone at 28 Gyr BP (80 of present solarluminosity) 032 bar is needed with 05 bar of atmosphericN2 020 bar with 1 bar of atmospheric N2 or 011 bar with2 bar of atmospheric N2 For CH4 we find that near-infraredabsorption is much stronger than previously thought arisingfrom updates to the HITRAN database CH4 radiative forcingpeaks at 103 9 or 83 W mminus2 for background pressures of05 1 or 2 bar likely limiting the utility of CH4 for warmingthe Archean For the other 26 HITRAN gases radiative forc-ings of up to a few to 10 W mminus2 are obtained from concen-trations of 01ndash1 ppmv for many gases For the 20 strongestgases we calculate the reduction in radiative forcing due tooverlap We also tabulate the modern sources sinks concen-trations and lifetimes of these gases and summaries the lit-erature on Archean sources and concentrations We recom-mend the forcings provided here be used both as a first refer-ence for which gases are likely good greenhouse gases andas a standard set of calculations for validation of radiativeforcing calculations for the Archean
1 Introduction
The standard stellar model predicts that the luminosity ofa star increases over its main-sequence lifetime (Gough1981) Therefore the sun is 30 brighter now than it waswhen the solar system formed Despite a dimmer sun duringthe Archean (38ndash25 Gyr BP) geologic evidence suggestssurface temperatures similar to today (Donn et al 1965)this apparent paradox is known as the faint young sun prob-lem (FYSP) To reconcile this Earth must have had a loweralbedo andor a stronger greenhouse effect in the past Inthis work we focus on a stronger greenhouse effect whichis thought to be the primary cause of the warming (Goldblattand Zahnle 2011b Wolf and Toon 2013) We focus on thelate Archean with a solar constant of 08S0 resulting in anreduction ofasymp 50 W mminus2 of insolation
NH3 was proposed as a solution to the FYSP soon af-ter the problem was posed (Sagan and Mullen 1972) NH3is a strong greenhouse gas and concentrations of 10 ppmvcould have warmed the Archean surface by 12ndash15 K (Kuhnand Atreya 1979) At the time NH3 was proposed as a solu-tion it was thought that the early Earth was strongly reduc-ing such that NH3 could have built up to significant atmo-spheric concentrations However the Archean atmosphere isnow thought to have been only mildly reducing NH3 wouldlikely have photo-dissociated rapidly without UV protection(Kuhn and Atreya 1979 Kasting 1982) Furthermore NH3is highly soluble and would have been susceptible to rain-outTherefore sustaining atmospheric concentrations of NH3 atwhich there is significant absorption may not be as easy asoriginally thought Considering the destruction of NH3 byphotolysisKasting(1982) found that concentrations as highas 10 ppbv could plausibly be attained by biotic sources IfNH3 were shielded from UV radiation (by a possible organic
Published by Copernicus Publications on behalf of the European Geosciences Union
1780 B Byrne and C Goldblatt Archean radiative forcings
haze layer) larger concentrations could be sustained thoughconcentrations above 1 ppbv seem unlikely (Pavlov et al2000)
The most obvious resolution to the FYSP would be higherCO2 partial pressures It is believed that the inorganic car-bon cycle provides a strong feedback mechanism whichregulates the Earthrsquos temperature over geologic timescales(Walker et al 1981) The rate of silicate weathering (asink of atmospheric CO2) is a function of surface temper-ature which depends on the carbon dioxide partial pressurethrough the greenhouse effect Therefore reduced insola-tion requires higher atmospheric CO2 concentrations to reg-ulate the surface temperature and balance the sources (vol-canoes) and sinks of atmospheric CO2 However geologi-cal constraints have been proposed which limit atmosphericCO2 to levels below those required to keep the early Earthwarm (Sheldon 2006 Driese et al 2011) Sheldon(2006)used a model based on the mass balance of weathering pa-leosols and found CO2 partial pressures between 00028 and0026 bar at 22 Gyr agoDriese et al(2011) use the samemethod and find CO2 partial pressures between 0003 and002 bar at 269 Gyr ago However these constraints are notuniformly accepted (Kasting 2013)
Other greenhouse gases likely played an important role inthe early Earthrsquos energy budget Most of the focus has beenapplied to CH4 as there are good reasons to expect higherconcentrations during the Archean (Zahnle 1986 Kiehl andDickinson 1987 Pavlov et al 2000 Haqq-Misra et al2008 Wolf and Toon 2013) The Archean atmosphere wasnearly anoxic with very low levels of O2 which would haveincreased the photochemical lifetime of methane from 10ndash12 yr today to 1000ndash10 000 yr (Kasting 2005) The concen-tration of methane in the Archean is not well constrainedbutKasting(2005) suggests that 1ndash10 ppmv could have beensustained from abiotic sources and up to 1000 ppmv couldhave been sustained by methanogens Redox balance modelssuggest concentrationsasymp 100 ppmv (Goldblatt et al 2006)Recent GCM studies have found that reasonably warm cli-mates can be sustained within the bounds of the CO2 con-straints if the greenhouse is supplemented with elevated CH4concentrations (Wolf and Toon 2013 Charnay et al 2013)Wolf and Toon(2013) found modern-day surface tempera-ture with 002 bar of CO2 and 1000 ppmv of CH4 with 80 of present solar luminosity
Other potential greenhouse gases which have been exam-ined include hydrocarbons (Haqq-Misra et al 2008) N2O(Buick 2007 Roberson et al 2011) and OCS (Ueno et al2009 Hattori et al 2011) C2H6 has been suggested to havebeen radiatively important in the Archean because it can formin significant concentrations from the photolysis of CH4 athigh partial pressures (Haqq-Misra et al 2008) Haqq-Misraet al (2008) found that 1 ppmv of C2H6 could increase thesurface temp byasymp 3 K and 10 ppmv byasymp 10 K HoweverC2H6 is formed along with other organic compounds whichform an organic haze This organic haze is thought to pro-
vide a strong anti-greenhouse effect which limits the utilityof C2H6 to warm the climate when produced in this manner
Elevated OCS concentrations were proposed byUenoet al (2009) to explain the negative133S observed in theArchean sulfate deposits HoweverHattori et al(2011) re-port measurements of ultraviolet OCS absorption cross sec-tions and find that OCS photolysis does not cause large massindependent fractionation in133S and is therefore not thesource of the signatures seen in the geologic record
Buick (2007) proposed that large amounts of N2O couldhave been produced in the Proterozoic due to bacterial deni-trification in copper depleted water because copper is neededin the enzymatic production of N2 from N2O (which is thelast step of denitrification)Roberson et al(2011) found thatincreasing N2O from 03 ppmv to 30 ppmv warms surfacetemperatures byasymp 8 K HoweverRoberson et al(2011) alsoshowed that N2O would be rapidly photo-dissociated if O2levels were lower than 01 PAL and that N2O was unlikelyto have been produced at radiatively important levels at O2levels below this
Examining the Archean greenhouse involves calculatingthe radiative effects of greenhouse gases over concentrationranges never before examined Typically one-time calcula-tions are performed with no standard set of radiative forc-ings available for comparison The absence of a standard setof forcings has led to errors going undetected For examplethe warming exerted by CH4 was significantly overestimatedby Pavlov et al(2000) due to an error in the numbering ofspectral intervals (Haqq-Misra et al 2008) which went un-detected for several years
In previous work greenhouse gas warming has typicallybeen quantified in terms of the equilibrium surface tem-perature achieved by running a one-dimensional Radiative-Convective Model (RCM) This metric is sensitive to howclimate feedbacks are parametrised in the model and to im-posed boundary conditions (eg background greenhouse gasconcentrations) This makes comparisons between studiesand greenhouse gases difficult It is desirable to documentthe strengths and relative efficiencies of different greenhousegases at warming the Archean climate However this is nearimpossible using the literature presently available
In this study we use radiative forcing to quantify changesin the energy budget from changes in greenhouse gas con-centrations for a wide variety of greenhouse gases We defineradiative forcing as the change in the net flux of radiation atthe tropopause due to a change in greenhouse gas concentra-tion with no climate feedbacks The great utility of radiativeforcing is that to first order it can be related through a linearrelationship to global mean temperature change at the sur-face (Hansen et al 2005) It therefore provides a simple andinformative metric for understanding perturbations to the en-ergy budget Furthermore since radiative forcing is indepen-dent of climate response we get general results which are notaffected by uncertainties in the climate response Radiative
Clim Past 10 1779ndash1801 2014 wwwclim-pastnet1017792014
B Byrne and C Goldblatt Archean radiative forcings 1781
forcing has been used extensively to study anthropogenic cli-mate change (IPCC 2013)
Imposed model boundary conditions significantly affectthe warming provided by a greenhouse gas Boundary con-ditions that typically vary between studies include atmo-spheric pressure CO2 concentrations and CH4 concentra-tions The discrepancies in boundary conditions betweenstudies develop from the poorly constrained climatology ofthe early Earth In this work we examine the sensitivity ofradiative forcings to variable boundary conditions
The atmospheric pressure of the Archean is poorly con-strained but there are good theoretical arguments to think itwas different from today For one the atmosphere is 21 O2by volume today whereas there was very little oxygen in theArchean atmosphere Furthermore there are strong theoreti-cal arguments that suggest that the atmospheric nitrogen in-ventory was different large nitrogen inventories exist in themantle and continents which are not primordial and musthave ultimately come from the atmosphere (Goldblatt et al2009 Johnson and Goldblatt 2014) Constraints on the pres-sure range have recently been proposed from raindrop im-prints (Som et al 2012) ndash though this has been challenged(Kavanagh and Goldblatt 2013) and from noble gas system-atics (07ndash11 barMarty et al 2013)
Atmospheric pressure affects the energy budget in twoways (1) Increasing pressure increases the moist adiabaticlapse rate The moist adiabatic lapse rate is a function ofthe saturation mixing ratio of water vapour The saturationvapour pressure is independent of pressure Increasing pres-sure means there is more dry air to absorb the latent heatreleased by condensation making the moist adiabatic lapserate larger (closer to the dry adiabatic lapse rate) (2) Asthe pressure increases collisions between molecules becomemore frequent This results in a broadening of the absorptionlines over a larger frequency range This phenomena is calledpressure broadening and generally causes more absorption(Goody and Yung 1995)
Changes to the concentrations of CO2 and CH4 will af-fect the strength of other greenhouse gases When multiplegases absorb radiation at the same frequencies the total ab-sorption is less than the sum of the absorption that each gascontributes in isolation This difference is known as overlapIt occurs because the absorption is distributed between thegases so in effect there is less radiation available for eachgas to absorb
In this paper we present calculations of radiative forcingsfor CO2 CH4 and 26 other gases contained in the HIgh-resolution TRANsmission (HITRAN) molecular databasefor atmospheres with 05 bar 1 bar and 2 bar of N2 We aimto provide a complete set of radiative forcing and overlapcalculations which can be used as a standard for compar-isons We provide CO2 and CH4 radiative forcings over largeranges in concentration and compare our results with calcu-lations in the literature For the other 26 HITRAN gases theHITRAN absorption data is compared with measured cross
sections and discrepancies are documented Radiative forc-ings are calculated over a concentrations range of 10 ppbv to10 ppmv The sensitivities of the radiative forcings to atmo-spheric pressure and overlapping absorption with other gasesare examined and our results are compared with results fromthe literature
This paper is organised as follows In Sect 2 we describeour general methods evaluation of the spectral data and theatmospheric profile we use In Sect 3 we examine the ra-diative forcings due to CO2 and CH4 and examine how ourresults compare with previous calculations In Sect 4 weprovide radiative forcings for 26 other gases from the HI-TRAN database and examine the sensitivity of these resultsto atmospheric parameters
2 Methods
21 Overview
We calculate absorption cross sections from HITRAN lineparameters and compare our results with measured crosssections We develop a single-column atmospheric profilebased on constraints of the Archean atmosphere With thisprofile we perform radiative forcing calculations for CO2CH4 and 26 other HITRAN gases Gas amounts are givenin abundancesa relative to the modern atmosphere (1 barmolecular weight of 2897 g molesminus1 total moles (n0) ofasymp 18times1020) Thusa = ngasn0 As an example an abun-dance of 1 for CO2 contains the same number of moles as themodern atmosphere but would give a surface pressure largerthan 1 bar because of the higher molecular weight For ourexperiments we add gas abundances to background N2 par-tial pressure increasing the atmospheric pressure
22 Spectra
Line parameters are taken from the HITRAN 2012 database(Rothman et al 2013) We use the LBLABC code writtenby David Crisp to calculate cross sections from the line dateLine parameters have a significant advantage over measuredabsorption cross sections in that absorption can be calcu-lated explicitly as a function of temperature and pressureThe strength of absorption lines is a function of temperatureand shape is a function of pressure Neglecting these depen-dencies can result in significant errors in radiative transfercalculations
There are however some limitations to using HITRANdataRothman et al(2009) explains that the number of tran-sitions included in the database is limited by (1) a reason-able minimum cutoff in absorption intensity (based on thesensitivity of instruments that observe absorption over ex-treme terrestrial atmospheric path lengths) (2) lack of suf-ficient experimental data or (3) lack of calculated transi-tions The molecules for which data are included in the line-by-line portion of HITRAN are mostly composed of small
wwwclim-pastnet1017792014 Clim Past 10 1779ndash1801 2014
1782 B Byrne and C Goldblatt Archean radiative forcings
Figure 1 Absorption cross sections Absorption cross sections of(a) H2O CO2 and CH4 and(b) potential early Earth trace gases Crosssections are calculated from HITRAN line data (red) and measured from the PNNL database (blue) at 1013 hPa and 278 K The gases areordered from strongest to weakest based on the analysis in Sect33(Fig 10) in columns from top left to bottom right Coloured shaded areasshow wavenumbers at which absorption is strongest for H2O (blue) CO2 (green) and CH4 (red) The green curve shows the shape of theblackbody emissions from a 289 K blackbody
numbers of atoms and have low molecular weights Largepolyatomic molecules have many normal modes of vibrationand have fundamentals at very low wavenumbers (Rothmanet al 2009) This makes it difficult to experimentally isolateindividual lines of large molecules so that a complete set ofline parameters for these molecules is impossible to obtain
Computed cross sections are compared to measured crosssections from the Pacific Northwest National Laboratory(PNNL) database (Sharpe et al 2004) for the strongest
HITRAN gases (Fig1) Where differences exist it is notstraight forward to say which is in error (for example po-tential problems with measurements include contaminationof samples) Hence we simply note any discrepancy and doour best to note the consequences of these The largest abun-dance of the trace gases examined in this work is 10minus5 atthis abundance only absorption cross section greater thanasymp 5times 10minus21 cm2 absorb strongly over the depth of the at-mosphere
Clim Past 10 1779ndash1801 2014 wwwclim-pastnet1017792014
B Byrne and C Goldblatt Archean radiative forcings 1783
The similarities and differences between the cross sectionsfor each gas are
ndash CH3OH the HITRAN line data covers the range of975ndash1075 cmminus1 In that range the HITRAN cross sec-tions are an order of magnitude larger than the PNNLcross sections Therefore the PNNL data suggests theabundances should be an order of magnitude larger toobtain the same forcings as the HITRAN data PNNLcross sections indicate that there is missing HITRANline data over the range 1075ndash1575 cmminus1 with peaksof asymp 5times 10minus20cm2 which would be optically thick forabundancesge 10minus6 There is also missing HITRANdata at 550ndash750 cmminus1 with peaks ofasymp 5times 10minus21cm2which would be optically thick for abundancesge 10minus5
ndash HNO3 the HITRAN data covers the range of 550ndash950 cmminus1 1150ndash1400 cmminus1 and 1650ndash1750 cmminus1Over this range HITRAN and PNNL data agree wellexcept between 725 and 825 cmminus1 where the PNNLcross sections are larger (relevant for abundances ofge
5times10minus7) PNNL cross sections indicate that there is sig-nificant missing HITRAN line data in the ranges 1000ndash1150 cmminus1 1400ndash1650 cmminus1 and 1750ndash2000 cmminus1which would be optically thick for abundancesge 5times
10minus6
ndash COF2 the HITRAN cross sections cover the range of725ndash825 cmminus1 950ndash1000 cmminus1 1175ndash1300 cmminus1 and1850ndash2000 cmminus1 The PNNL and HITRAN cross sec-tions agree over this range HITRAN is missing bandsaround 650 and 1600 cmminus1 with peaks ofasymp 10minus20cm2which would be optically thick for abundancesge 5times
10minus6 Additionally wings of 950ndash1000 cmminus1 1175ndash1300 cmminus1 and 1850ndash2000 cmminus1 bands appear missingin HITRAN relevant at similar abundances
ndash H2O2 above 500 cmminus1 the HITRAN and PNNL crosssections cover the same wavenumber range Over thisrange HITRAN cross sections are about twice the valueof the PNNL cross sections Therefore the PNNL datasuggests the abundances should be about twice those ofthe HITRAN data to obtain the same forcings
ndash CH3Br HITRAN cross sections are over an order ofmagnitude greater than the PNNL cross sections There-fore the PNNL data suggests the abundances shouldbeasymp 13 times those of the HITRAN data to obtain thesame forcings The PNNL cross sections indicate miss-ing HITRAN line data over the range of 575ndash650 cmminus1
with peaks ofasymp 10minus20cm2 which would be opticallythick for abundancesge 5times 10minus6
ndash SO2 the HITRAN and PNNL cross sections agree wellexcept between 550 and 550 cmminus1 where HITRANcross sections are larger with peaks ofasymp 5times10minus20cm2which would be optically thick for abundancesge 10minus7
ndash NH3 the HITRAN and PNNL cross sections agree well
ndash O3 there is no PNNL data for this gas
ndash C2H2 the HITRAN and PNNL cross sections agreewell
ndash HCOOH the HITRAN data between 1000ndash1200 and1725ndash1875 cmminus1 agrees with the PNNL data ThePNNL cross sections indicate missing line data over therange 550ndash1000 cmminus1 with peaks ofasymp 5times 10minus19cm2which would be optically thick for abundancesge 10minus8and 1200ndash1725 cmminus1 and 1875ndash2000 cmminus1 with peaksof asymp 5times 10minus20cm2 which would be optically thick forabundancesge 10minus7
ndash CH3Cl The HITRAN and PNNL cross sections agreewell PNNL cross sections indicate missing line dataaround 600 cmminus1
ndash HCN the HITRAN and PNNL cross sections agreewell
ndash PH3 the HITRAN and PNNL cross sections agree well
ndash C2H4 the HITRAN data is about an order of magnitudeless than PNNL Therefore the PNNL data suggests theabundances should be an order of magnitude less to ob-tain the same forcings as the HITRAN data
ndash OCS the HITRAN and PNNL cross sections agreewell
ndash HOCl there is no PNNL data for this gas
ndash N2O the HITRAN and PNNL cross sections agree well
ndash NO2 the HITRAN and PNNL cross sections agree wellin the range 1550ndash1650 cmminus1 The PNNL cross sec-tions are up to an order of magnitude larger than HI-TRAN for cross sections in the range 650ndash850 cmminus1
and around 1400 cmminus1 PNNL cross sections indicatemissing line data over the ranges 850ndash1100 cmminus1 and1650ndash2000 cmminus1 with peaks ofasymp 10minus19cm2 whichwould be optically thick for abundancesge 5times 10minus7
ndash C2H6 the HITRAN and PNNL cross sections agreewell
ndash HO2 there is no PNNL data for this gas
ndash ClO there is no PNNL data for this gas
ndash OH there is no PNNL data for this gas
ndash HF the HITRAN and PNNL data do not overlap TheHITRAN data is available below 500 cmminus1 and PNNLdata is available aboveasymp 900 cmminus1
wwwclim-pastnet1017792014 Clim Past 10 1779ndash1801 2014
1784 B Byrne and C Goldblatt Archean radiative forcings
ndash H2S the HITRAN and PNNL cross sections agree wellin the range 1100ndash1400 cmminus1 There is no PNNL datafor the absorption feature at wavenumbers less that400 cmminus1
ndash H2CO the HITRAN and PNNL cross sections agreewell for the absorption band in the range 1600ndash1850 cmminus1 The HITRAN data is missing the absorp-tion band over the wavenumber range 1000ndash1550 cmminus1
with peaks ofasymp 10minus20cm2 which would be opticallythick for abundancesge 5times 10minus6
ndash HCl there are no optically thick absorption featuresover the wavenumbers where PNNL data exists
The spectral data described above only covers the ther-mal spectrum HITRAN line parameters are not available forthe solar spectrum (other than CO2 CH4 H2O and O3) Weare unaware of any absorption data for these gases in the so-lar spectrum If these gases are strong absorbers in the solarspectrum (eg O3) the radiative forcing calculations could besignificantly affected Very strong heating in the stratospherewould cause dramatic differences in the stratospheric struc-ture which would significantly affect the radiative forcing
23 Atmospheric profile
We perform our calculations for a single-column atmospherePerforming radiative forcing calculations for a single profilerather than multiple profiles representing the meridional vari-ation in the Earthrsquos climatology introduces only small errors(Myhre and Stordal 1997 Freckleton et al 1998 Byrne andGoldblatt 2014)
The tropospheric temperature structure is dictated largelyby convection We approximate the tropospheric tempera-ture structure with the pseudo-adiabatic lapse rate The lapserate is dependent on both pressure and temperature Thereis a large range of uncertainty in the surface temperatures ofthe Archean we take the surface temperature to be the globaland annual mean (GAM) temperature on the modern Earth(289 K) We chose this temperature for two reasons (1) Itmakes comparisons with the modern Earth straight forwardand (2) glaciations appear rare in the Archean (Young 1991)thus it is expected that surface temperatures were likely aswarm as today for much of the Archean Therefore modern-day surface temperatures are a reasonable assumption for ourprofile
We calculate three atmospheric profiles for N2 inventoriesof 05 bar 1 bar and 2 bar Atmospheric pressure varies withthe addition of CO2 and CH4 We use the GAM relative hu-midity from Modern Era Retrospective-analysis for Researchand Applications reanalysis data products (Rienecker et al2011) over the period 1979 to 2011
In contrast to the troposphere the stratosphere (taken tobe from the tropopause to the top of the atmosphere) is nearradiative equilibrium The stratospheric temperature struc-ture is therefore sensitive to the abundances of radiatively
Pressure (bar)
Altitude (
km
)
0 1 20
5
10
15
20
25
008 016H
2O (ppv)
210 250 290
Temperature (K)
Figure 2 Atmospheric profiles Pressure temperature and watervapour structure of atmospheres with 05 bar (blue) 1 bar (red) and2 bar (green) of N2 The modern atmosphere is also shown (dotted)The water vapour abundances are scaled to an atmosphere with 1bar of N2
active gases For a grey gas an optically thin stratosphereheated by upwelling radiation will be isothermal at the atmo-spheric skin temperature (T = (I (1minus α)8σ)14
asymp 203K
Pierrehumbert 2010) We take this to be the case in ourcalculations In reality non-grey gases can give a warmeror cooler stratosphere depending on the spectral positioningof the absorption lines Furthermore the stratosphere wouldnot have been optically thin as CO2 (and possibly othergases) were likely optically thick for some wavelengthswhich would have cooled the stratosphere Other gases suchas CH4 may have significantly warmed the stratosphere byabsorbing solar radiation However the abundances of thesegases are poorly constrained Since there is no convincingreason to choose any particular profile we keep the strato-sphere at the skin temperature for simplicity The atmo-spheric profiles are shown in Fig2 We take the tropopauseas the atmospheric level at which the pseudoadiabatic lapserate reaches the skin temperature Sensitivity tests were per-formed to examine the sensitivity of radiative forcing to thetemperature and water vapour structure We find that differ-ences in radiative forcing are generally small (le 10 Ap-pendixA)
In this study we explicitly include clouds in our radia-tive transfer calculations FollowingKasting et al(1984)many RCMs used to study the Archean climate have omittedclouds and adjusted the surface albedo such that the mod-ern surface temperatures can be achieved with the current at-mospheric composition and insolationGoldblatt and Zahnle(2011b) showed that neglecting the effects of clouds on long-wave radiation can lead to significant over-estimates of radia-tive forcings as clouds absorb longwave radiation strongly
Clim Past 10 1779ndash1801 2014 wwwclim-pastnet1017792014
B Byrne and C Goldblatt Archean radiative forcings 1785
and with weak spectral dependence Clouds act as a new sur-face of emission to the top of the atmosphere and thereforethe impact on the energy budget of molecular absorption be-tween clouds and the surface is greatly reduced We takeour cloud climatology as cloud fractions and optical depthsfrom the International Satellite Cloud Climatology ProjectD2 data set averaging from January 1990 to December 1992This period is used byRossow et al(2005) and was chosenso that we could compare cloud fractions We assume ran-dom overlap and average by area to estimate cloud fractionsThe clouds were placed at 226 K for high clouds 267 K formiddle clouds and 280 K for low clouds this correspondsto the average temperature levels of clouds on the modernEarth Cloud properties are taken fromByrne and Goldblatt(2014) The cloud climatology of the Archean atmosphereis highly uncertain Recent GCM studies have found thatthere may have been less cloud cover due to less surfaceheating from reduced insolation (Charnay et al 2013 Wolfand Toon 2013) Other studies have suggested other mecha-nisms which could have caused significant changes in cloudcover during the Archean (Rondanelli and Lindzen 2010Rosing et al 2010 Shaviv 2003) although theoretical prob-lems have been found with all of these studies (Goldblatt andZahnle 2011b a) Nevertheless given the large uncertain-ties in the cloud climatology in the Archean the most straightforward assumption is to assume modern climatology eventhough there were likely differences in the cloud climatol-ogy Furthermore the goal of this study is to examine green-house forcings and not cloud forcings Therefore we want tocapture the longwave effects of clouds to a first order degreeDifferences in cloud climatology have only secondary effectson the results given here
Atmospheric profiles are provided as supplementary ma-terial
24 Radiative forcing calculations
We use the Spectral Mapping for Atmospheric RadiativeTransfer (SMART) code written by David Crisp (Meadowsand Crisp 1996) for our radiative transfer calculations Thiscode works at line-by-line resolution but uses a spectral map-ping algorithm to treat different wavenumber regions withsimilar optical properties together giving significant savingsin computational cost We evaluate the radiative transfer inthe range 50ndash100 000 cmminus1 (01ndash200 microm) as a combined so-lar and thermal calculation
Radiative forcing is calculated by performing radiativetransfer calculations on atmospheric profiles with perturbedand unperturbed greenhouse gas abundances and taking thedifference in net flux of radiation at the tropopause We as-sume the gases examined here are well-mixed
Ra
dia
tive
Fo
rcin
g (
Wm
minus2)
Abundance (nCO2
n0)
Modern Surface Temperatures
10minus6
10minus5
10minus4
10minus3
10minus2
10minus1
100
minus20
0
20
40
60
80
100
120
Figure 3 CO2 radiative forcings Radiative forcing as a function ofCO2 abundance relative to pre-industrial CO2 (1 bar N2) Coloursare for atmospheres with 05 bar 1 bar and 2 bar of N2 Solid linesare calculated with CIA and dashed lines are calculated withoutCIA The shaded region shows the range of CO2 for the early Earth(0003ndash002 barDriese et al 2011) The vertical dashed blue andbrown lines give the pre-industrial and early Earth best guess (10minus2)abundances of CO2
3 Results and discussion
31 CO2
We calculate CO2 radiative forcings up to an abundance of1 (Fig 3) At 10minus2 consistent with paleosol constraintsthe radiative forcings are 35 W mminus2 (2 bar N2) 26 W mminus2
(1 bar N2) and 15 W mminus2 (05 bar N2) which is consider-ably short of the forcing required to solve the FYSP con-sistent with previous work The CO2 forcings given here ac-count for changes in the atmospheric structure due to changesin the N2 inventory and thus are non-zero at pre-industrialCO2 for 05 bar and 2 bar of N2 This results in forcingsof about 10 W mminus2 (2 bar) andminus9 W mminus2 (05 bar) at pre-industrial CO2 abundances (seeGoldblatt et al 2009 fora detailed physical description) At very high CO2 abun-dances (gt 01) CO2 becomes a significant fraction of theatmosphere This complicates radiative forcing calculationsby (1) changing the atmospheric structure (2) shortwave ab-sorptionscattering and (3) uncertainties in the parametrisa-tion of continuum absorption These need careful considera-tion in studies of very high atmospheric CO2 so we describethese factors in detail
1 Large increases in CO2 increase the atmospheric pres-sure and therefore also increase the atmospheric lapserate The increase in lapse rate results in a tropospherewhich cools quickly with height resulting in a reductionto the emission temperature relative to an atmosphere
wwwclim-pastnet1017792014 Clim Past 10 1779ndash1801 2014
1786 B Byrne and C Goldblatt Archean radiative forcings
04 KWm
minus2
12
KW
mminus2
08
KWmminus2
Su
rfa
ce
Te
mp
era
ture
( degC
)
Abundance (nCO2
n0)
10minus4
10minus3
10minus2
10minus1
minus20
minus15
minus10
minus5
0
5
10
15
20
25
Figure 4 Surface temperature as a function of CO2 abundance for08S0 Temperatures are calculated from radiative forcings assum-ing climate sensitivity parameters of 04 K W mminus2 (dashed black)08 K W mminus2 (solid black) and 12 K W mminus2 (dashed black) anda surface temperature of 289 K at 020 bar of CO2 (when our modelis in energy balance) The results ofWolf and Toon(2013) (blue)Haqq-Misra et al(2008) (green)Charnay et al(2013) (red)vonParis et al(2008) (cyan) andKienert et al(2012) (magenta) arealso shown
Abundance (nCH4
n0)
Ra
dia
tive
Fo
rcin
g (
Wm
minus2)
10minus6
10minus5
10minus4
10minus3
10minus2
0
5
10
15
20
25
30
Figure 5Radiative forcing for CH4 Radiative forcing as a functionof CH4 for atmospheres with 05 bar (blue) 1 bar (red) and 2 bar(green) of N2 Dashed curves show the longwave forcing Shadedregion shows the range of CH4 for the early Earth that could be sus-tained by abiotic (dark) and biotic (light) sources (Kasting 2005)The vertical dashed blue and brown lines give the pre-industrial andearly Earth best guess (100 ppmvGoldblatt et al 2006) abundancesof CH4
10minus23
10minus22
10minus21
10minus20
10minus19
10minus18 CO
2CO
2
10minus23
10minus22
10minus21
10minus20
10minus19
10minus18 CH
4CH
4
10minus23
10minus22
10minus21
10minus20
10minus19
10minus18 H
2OH
2OA
bsorp
tion C
rossS
ection (
cm
2)
Bν
wavenumber (cmminus1
) rarr
0 5000 10000 15000 20000 25000 30000
a
b
2 1 067 05 04 033
larr wavelength (microm)
infin
Figure 6Solar absorption cross sections(a)Emission spectrum foran object of 5777 K (effective emitting temperature of modern Sun)(b) Absorption cross sections of CO2 CH4 and H2O calculatedfrom line data Grey shading shows were there is no HITRAN linedata Shaded and dashed lines show absorption cross sections ofunity optical depth for abundances given in figures3 and5 Solidblack line shows the absorption cross sections of unity optical depthfor H2O
with a lower lapse rate Increased atmospheric pressurealso results in the broadening of absorption lines for allof the radiatively active gases Emissions from colderhigher pressure layers increases radiative forcing
2 Shortwave radiation is also affected by very high CO2abundances The shortwave forcing isminus2 W mminus2 at001minus4 W mminus2 at 01 andminus18 W mminus2 at 1 There aretwo separate reasons for this The smaller affect is ab-sorption of shortwave radiation by CO2 which primarilyaffects wavenumbers less thanasymp 10 000 cmminus1 (Fig 6)The most important effect (CO2 gt 01) is increasedRayleigh scattering due to the increase in the size of theatmosphere This primarily affects wavenumbers largerthanasymp 10 000 cmminus1 and is the primary reason for thelarge difference in insolations through the tropopausefor abundances between 01 and 1 of CO2
3 There is significant uncertainty in the CO2 spectra atvery high abundances This is primarily due to ab-sorption that varies smoothly with wavenumber thatcannot be accounted for by nearby absorption linesThis absorption is termed continuum absorption and iscaused by the far wings of strong lines and collision in-duced absorption (CIA) (Halevy et al 2009) Halevyet al(2009) show that different parametrisations of lineand continuum absorption in different radiative transfer
Clim Past 10 1779ndash1801 2014 wwwclim-pastnet1017792014
B Byrne and C Goldblatt Archean radiative forcings 1787
0
10
20
30a
minus20minus15minus10
minus5
Forc
ing (
Wm
minus2)
b
10minus6
10minus5
10minus4
10minus3
10minus2
0
5
10
15
Abundance (ngas
n0)
c
Figure 7 CH4 forcings using HITRAN 2000 and 2012 spectraldata(a) longwave(b) shortwave and(c) combined longwave andshortwave radiative forcings using HITRAN 2000 (blue) and 2012(red) spectral data
models can lead to large differences in outgoing long-wave radiation at high CO2 abundances SMART treatsthe continuum by using aχ factor to reduce the opacityof the Voight line shape out to 1000 cmminus1 from the linecentre to match the background absorption We add tothis CIA absorption which has been updated with recentresults ofWordsworth et al(2010) We believe that ourradiative transfer runs are as accurate as possible giventhe poor understanding of continuum absorption
It is worthwhile comparing our calculated radiative forc-ings with previous results In most studies the greenhousewarming from a perturbation in greenhouse gas abundanceis quantified as a change of the GAM surface tempera-ture We convert our radiative forcings to surface temper-atures for comparison This is achieved using climate sen-sitivity Assuming the climate sensitivity to be in the range15ndash45 W mminus2 (medium confidence rangeIPCC 2013) fora doubling of atmospheric CO2 and the radiative forcing fora doubling of CO2 to be 37 Wmminus2 we find a range of cli-mate sensitivity parameters of 04ndash12 K W mminus2 with a bestguess of 08 K W mminus2 We take the CO2 abundance whichgives energy balance at the tropopause (020 bar abundanceof 013) to be the abundance that gives a surface temperatureof 289 K
The calculated temperature curves are plotted with the re-sults of previous studies (Fig4) For all of the studies sur-face temperatures were calculated for 08S0 However therewere differences in the atmospheric pressurevon Paris et al(2008) andKienert et al(2012) have 077 bar and 08 bar ofN2 respectively whileHaqq-Misra et al(2008) Wolf andToon(2013) andCharnay et al(2013) hold the surface pres-sure at 1 bar and remove N2 to add CO2
Model climate sensitivities can be grouped by the type ofclimate model used Simple 1-D RCMs (Haqq-Misra et al
0
5
10
15
Flu
x (
mW
mminus
2 c
m) HITRAN 2012
2000 5000 7500 10000 120000
5
10
Flu
x (
mW
mminus
2 c
m)
wavenumber (cmminus1
) rarr
HITRAN 2000
5 2 133 1 0833
larr wavelength (microm)
Figure 8 Downward shortwave flux Insolation at the top of theatmosphere (black) and surface for CH4 abundances 10minus6 (blue)10minus4 (red) and 10minus2 (green) using HITRAN 2012 (top) and HI-TRAN 2000 (bottom) line data
2008 von Paris et al 2008) have the lowest climate sensitivi-ties (1ndash4 K) The 3-D models had higher climate sensitivitiesbut the sensitivities were also more variable between mod-elsKienert et al(2012) use a model with a fully dynamicocean but a statistical dynamical atmosphere The sea-icealbedo feedback makes the climate highly sensitive to CO2abundance and has the largest climate sensitivity (asymp 185 K)Charnay et al(2013) andWolf and Toon(2013) use mod-els with fully dynamic atmosphere but with simpler oceansThey generally have climate sensitivities between 25 and45 K butWolf and Toon(2013) find higher climate sensitivi-ties (7ndash11 K) for CO2 concentrations of 10 000ndash30 000 ppmvdue to changes in surface albedo (sea-ice extent) The cli-mate sensitivities are larger for the 3-D models comparedto the RCMs primarily because of the ice-albedo feedbackVariations in climate sensitivity parameters mask variationsin radiative forcings
The amount of CO2 required to reach modern-day sur-face temperatures is variable between modelsCharnay et al(2013) andWolf and Toon(2013) require the least CO2 tosustain modern surface temperatures (006ndash007 bar abun-dance of 004ndash046) primarily because there are less clouds(low and high) the net effect of which is a decrease in albedoThe cloud feedback in these models works as follows the re-duced insolation results in less surface heating which resultsin less evaporation and less cloud formation The RCM stud-ies require CO2 abundance very close to our results (01ndash02 bar abundance of 0066ndash013) especially consideringdifferences in atmospheric pressureKienert et al(2012) re-quires very high CO2 abundances (asymp 04 bar abundance of026) to prevent runaway glaciation because of the high sen-sitivity of the ice-albedo feedback in this model
32 CH4
We calculate CH4 radiative forcings up to 10minus2 (Fig 5)At abundances greater than 10minus4 we find considerableshortwave absorption For an atmosphere with 1 bar of N2
wwwclim-pastnet1017792014 Clim Past 10 1779ndash1801 2014
1788 B Byrne and C Goldblatt Archean radiative forcings
04 KWmminus2
12 KWmminus2
08 KWm minus2
Su
rfa
ce
Te
mp
era
ture
( degC
)
Abundance (nCH4
n0)
10minus5
10minus4
10minus3
10minus2
minus5
0
5
10
15
20
Figure 9 Surface temperature as a function of CH4 abundancefor 08S0 Temperatures are calculated from radiative forcings as-suming a surface temperature of 271 K for 0 ppmv of CH4 andclimate sensitivity parameters of 04 K W mminus2 (dashed black)08 K W mminus2 (solid black) and 12 K W mminus2 (dashed black) anda background CO2 abundance of 10minus2 Dashed-Dotted black lineshows the longwave radiative forcing The results ofWolf andToon(2013) (blue)Haqq-Misra et al(2008) (green)Pavlov et al(2000) (turquoise) andKiehl and Dickinson(1987) (grey) are alsoplotted Temperatures forKiehl and Dickinson(1987) are foundfrom radiative forcings assuming a climate sensitivity parameter of081 K W mminus2 and a surface temperature of 271 K for 0 ppmv ofCH4
the shortwave radiative forcing isasymp 14Wmminus2 at 10minus4 asymp
67Wmminus2 at 10minus3 andasymp 20Wmminus2 at 10minus2 This absorp-tion occurs primarily at wavenumbers less than 11 502 cmminus1
where HITRAN data is available (Fig6) We find much moreshortwave absorption here than in studies from Jim Kast-ingrsquos group (Pavlov et al 2000 Haqq-Misra et al 2008)which also parametrise solar absorption The reason for thisdiscrepancy is likely due to improvements in the spectro-scopic data We repeated our radiative forcing calculationsusing HITRAN 2000 line parameters and found only minordifferences in the longwave absorption but much less absorp-tion at solar wavelengths (Fig7) Figure8 shows the solarabsorption by CH4 using spectra from the 2000 and 2012editions of HITRAN There is a significant increase in short-wave absorption between 5500 and 9000 cmminus1 and around11 000 cmminus1
Very strong shortwave absorption would have a significanteffect on the temperature structure of the stratosphere Strongabsorption would lead to strong stratospheric warming whichwould limit the usefulness of our results Nevertheless ourcalculations indicate that at 10minus4 of CH4 the combined ther-mal and solar radiative forcings are 76 W mminus2 (2 bar of N2)72 W mminus2 (1 bar of N2) and 62 W mminus2 (05 bar of N2) and
the thermal radiative forcings are 98 W mminus2 (2 bar of N2)86 W mminus2 (1 bar of N2) and 68 W mminus2 (05 bar of N2)Therefore excluding the effects of overlap (which are mini-mal Byrne and Goldblatt 2014) the combined thermal andsolar radiative forcing due to 10minus3 of CO2 and 10minus4 of CH4are 426 W mminus2 (2 bar of N2) 332 W mminus2 (1 bar of N2)and 212 W mminus2 (05 bar of N2) significantly short of theforcings needed to sustain modern surface temperatures Itshould be noted that strong solar absorption makes the pre-cise radiative forcing highly sensitive to the position of thetropopause because this is the altitude at which most of theshortwave absorption is occurring Therefore small changesin the position of the tropopause result in large changes inthe shortwave forcing The surface temperature response tothis forcing is less straight forward and the linearity be-tween forcing and surface temperature change may break-down (Hansen et al 2005)
These calculations do not consider the products of atmo-spheric chemistry Numerous studies have found that highCH4 CO2 ratios lead to the formation of organic haze inlow O2 atmospheres which exerts an anti-greenhouse ef-fect (Kasting et al 1983 Zahnle 1986 Pavlov et al 2000Haqq-Misra et al 2008) Organic haze has been predictedby photochemical modelling at CH4 CO2 ratios larger than1 (Zahnle 1986) and laboratory experiments have found thatorganic haze could form at CH4 CO2 ratios as low as 02ndash03 (Trainer et al 2004 2006)
As with CO2 we compare our CH4 radiative forcings tovalues given in literature (Fig9) Temperatures are calcu-lated from radiative forcings assuming a surface temperatureof 271 K for an abundance of 0 and climate sensitivity pa-rameters of 04 K W mminus2 08 K W mminus2 and 12 K W mminus2and a background CO2 abundance of 10minus2 Due to absorp-tion of shortwave radiation our calculated surface tempera-tures decrease for abundances above 10minus3 Assuming a linearrelationship between forcing and climate response is likelya poor assumption given strong atmospheric solar absorptionResults fromPavlov et al(2000) are included even thoughthey are known to be erroneous as an illustration of the utilityof these comparisons All other studies give similar surfacetemperatures However these studies lack the strong solarabsorption from the HITRAN 2012 databaseHaqq-Misraet al (2008) shortwave radiative transfer is parametrisedfrom data which pre-dates HITRAN 2000 andWolf andToon(2013) only include CH4 absorption below 4650 cmminus1where changes to the spectra are not significant
33 Trace gases
The chemical cycles of several other greenhouse gases havebeen studied in the Archean It has been hypothesized thathigher atmospheric abundances could have been sustainedmaking these gases important for the planetary energy bud-get High abundances of NH3 (Sagan and Mullen 1972)C2H6 (Haqq-Misra et al 2008) N2O (Buick 2007) and
Clim Past 10 1779ndash1801 2014 wwwclim-pastnet1017792014
B Byrne and C Goldblatt Archean radiative forcings 1789
Figure 10Spectral absorption of blackbody emissions(a) Emission intensity from a blackbody of 289 K(b) Product of emission intensityand absorption cross sections for gases from the HITRAN 2012 database Gases are ordered by decreasing spectrum integrated absorptionstrength from top to bottom Grey indicates wavenumbers where no absorption data is available Absorption coefficients were calculated at500 hPa and 260 K
OCS (Ueno et al 2009) have all been proposed in theArchean There are many other greenhouse gases in the HI-TRAN database that have not been studied whether thesegases could have been sustained at radiatively importantabundances is beyond the scope of this paper We reviewthe sources concentrations and lifetimes from the strongestgases in Table1 (modern Earth) We also provide a review ofthe relevant literature on these gases in the Archean Here wequantify the warming these gases could have provided in theArchean motivated by future proposals of these as warmingagents
331 Radiative forcings
We produce a first order estimate of the relative absorptionstrength of the HITRAN gases by taking the product of theirradiance produced by a blackbody of 289 K and the absorp-tion cross sections to get the absorption per molecule of a gas
when saturated with radiation (Fig10) Using this metricH2O ranks as the 11th strongest greenhouse gas and CO2and CH4 rank 16th and 27th respectively This demonstratesthat many of the HITRAN gases are strong greenhouse gasesand that it is conceivable that low abundances of these gasescould have a significant effect on the energy budget
We calculate the radiative forcings for the HITRAN gaseswhich produce forcings greater than 1 W mminus2 over the abun-dances of 10minus8 to 10minus5 (Fig 11) assuming the gases arewell mixed The radiative forcings are calculated in an atmo-sphere which contains only H2O and N2 Many of the gasesreach forcings greater than 10 Wmminus2 at abundances less than10minus6
We give rough estimates of the expected radiative forc-ings assuming the PNNL cross sections are correct for gasesfor which the HITRAN and PNNL cross sections disagreeWe have made approximate corrections to the forcings as
wwwclim-pastnet1017792014 Clim Past 10 1779ndash1801 2014
1790 B Byrne and C Goldblatt Archean radiative forcings
Table 1Global atmospheric budget of 20 strongest HITRAN gases The sources sinks lifetimes and concentrations of these gases are givenfor the modern atmosphere Relevant literature for the Archean is reviewed
Gas ModernF = flux (moles yrminus1)x = abundance (ngasn0)τ = atmospheric lifetime
Modern natural sources and sinks Notes for Archean
CH3OH(methanol)
F = 23times1012ndash15times1013
[12]
x = 10minus9ndash10minus8
(boundary layer)10minus10ndash10minus9
(free troposphere)[1]
τ = 5ndash12 days[1]
Largest known sources are plant growthand decay (chemical and enzymaticdemethylation of methoxy groups)[1]The ocean biosphere may also be a sig-nificant source[2] The main sink isoxidation by OH[1] although deposi-tion [1] and possibly ocean uptake[2]
are important
Photolysis of H2O in the presenceof CO leads to the production ofCH3OH [3] Atmospheric modellingsuggests this could have produced sur-face abundances ofasymp 2times10minus13 in theArchean [4] Methanotrophs producemethanol as an intermediate productwhich is then oxidised via formalde-hyde and formate to carbon dioxidehowever it has been found that highlevels of CO2 can partially inhibitmethanol oxidation[5]
HNO3(nitric acid)
F = unknownx = variableτ = 26 h[6]
Major sources are denitrification andlightning [6] Lightning strikes pro-duced NO from O2 and N2 which isoxidised to NO2 and then to HNO3Major sinks are deposition and dilu-tion [6]
Early Earth volcanism may have pro-duced asymp 109ndash1010 mol yrminus1 of fixednitrogen compared toasymp 109 mol yrminus1
today[7] Without atmospheric O2 thenitrogen fixation efficiency of lightningis significantly reduced compared to to-day[8] Although it has also been sug-gested that nitrogen fixation by vol-canic lightning could have produced33times1010ndash33times1011 mol yrminus1 of NO(4 Gyr Ago) [9] However in re-duced atmospheres NO reacts to formHNO (K Zahnle private communica-tion 2014)
COF2(carbonylfluoride)
F = unknownx = 10minus10ndash10minus9
(mid-atmosphere)[10]lt 10minus10 (troposphere)[10]τ =asymp 38 yr [10]
Produced in the stratosphere from pho-tolysis of chlorofluorocarbons[11]
The vast majority of atmospheric flu-orine emissions come in the form ofman-made emissions[10]
H2O2(hydrogenperoxide)
F = unknownx = 10minus10ndash10minus9
[12]τ = a few days[12]
No significant direct emissions havebeen found Formed by bimolecular andtermolecular recombination of HO2 andradicals during the day time[13] Sinksinclude washout dry deposition pho-tolysis and reactions with OH[13]
H2O photolysis produces H2O2 Ithas been estimated that this processcould produce tropospheric abundancesof le 17times10minus15
[14] During intenseglaciation higher abundances ofasymp10minus10 may have been sustained by H2Ophotolysis[15]
CH3Br(methyl bromide)(bromomethane)
F = 1times109[16]
x =asymp 5times10minus12
(pre-industrial)[17]τ = 08 yr[16]
Major natural sources are oceansfreshwater wetlands and coastal saltmarshes though other sources may beimportant [16] Major sinks includeoceans oxidation by OH photolysisand soil microbial uptake[16]
Early Earth volcanism may have pro-duced greater fluxes of bromine thantoday (108-109 mol yrminus1 of Br [17])Siberian trap volcanism may have pro-duced large CH3Br fluxes (2times1010ndash53times1010 molyear)[18]
Clim Past 10 1779ndash1801 2014 wwwclim-pastnet1017792014
B Byrne and C Goldblatt Archean radiative forcings 1791
Table 1Continued
SO2(sulfurdioxide)
F = 12times1012[19]
x = variableτ = 8ndash78 h[20]
Major sources are dimethyl sulfide(DMS) related (75 ) and from volca-noes (25 )[19] Major sinks are OHdry deposition aerosol scavenging andconversion to H2SO4
Emergence of continents and sub-aerial volcanism may have resulted inmuch increased SO2 emissions in thelate Archean compared to the earlyArchean [21] Estimates of SO2 re-leased by Archean volcanism are ashigh asasymp 3times1012mol yrminus1
[22] Mod-elling results suggest thatasymp 10minus10 ofSO2 could have existed in the Archeanatmosphere if volcanism emittedasymp1times1012mol yrminus1
[23] It has beensuggested that SO2 abundances musthave remained relatively low duringthe Earthrsquos history as high abundanceswould have inhibited calcium carbonateprecipitation[24]
NH3(ammonia)
F = 13times1012[6]
54times1012[25]
x = 67times10minus10
(combined NH3 andNH4) [6]
τ = 1ndash5 days[26]
Sources are through biological fixa-tion [6] Specific sources are domesti-cated animals (asymp 43) sea surface (asymp
17) undisturbed soils (asymp 13) fer-tilisers (asymp 12) biomass burning (asymp
7) and others (asymp 8) [25] Deposi-tion is the largest sink[6] Specific sinksare wet deposition on land (asymp 53)wet deposition on sea surface (asymp 28)dry deposition on land (asymp 18) and re-action with OH (asymp 2) [25]
NH3 could have been generated byhydrolysis of HCN in the strato-sphere[27] Although even with UVshielding by an organic haze abun-dances greater than seem 10minus9 un-likely [28] Large biological flux wouldbe possible in absence of nitrificationSee Sect 1
O3(ozone)
F = not emitted directlyx = 10minus9ndash10minus8 (troposphere)[29]asymp 10minus5 (stratosphere)[30]τ = 22 days (troposphere)
Chapman cycle stratospheric O3 is pro-duced by O2 photochemistry and is de-stroyed by reactions with atomic oxy-gen[30]
With very low atmospheric O2 abun-dances O3 abundances would be neg-ligible [31]
C2H2(acetylene)
F = 1times1011[32]
25times1011[33]
x = 10minus12ndash10minus9[33]
τ = 2 weeks[33]
Anthropogenic sources dominatebiomass burning natural gas loss andbiofuel consumption Oxidation by OHis a major sink
Methane photochemistry may have sus-tained tropospheric abundances ofasymp
2times10minus14 in the Archean (for CH4 andCO2 abundances of 10minus3) [34]
HCOOH(formic acid)
F = 12times1012[35]
x = 3times10minus11ndash5times10minus9
(rural) [35]τ = 1ndash10 days[35]
Major natural sources are biomassburning soil vegetation as well assecondary production from gas-phaseand aqueous photochemistry[35] Verysoluble and the major sink is thoughtto be deposition Relatively long-livedwith respect to oxidation by OH (25days)[35]
wwwclim-pastnet1017792014 Clim Past 10 1779ndash1801 2014
1792 B Byrne and C Goldblatt Archean radiative forcings
Table 1Continued
CH3Cl(methylchloride)(chloromethane)
F = 72times1010ndash92times1010
[16]x = 45times10minus10
[36]τ = 1 year
Natural sources are biomass burningand oceans[16] a mechanism to pro-duce CH3Cl through the photochemi-cal reaction of dissolved organic mat-ter in saline waters has also been re-ported [37] Major sinks include oxi-dation by OH reaction with chlorineradicals uptake by oceans and soilsand loss to the stratosphere (for tropo-spheric CH3Cl) [16]
Early Earth volcanism may have pro-duced greater fluxes of chlorine thantoday (108ndash1010mol yrminus1 of Cl [17])Siberian trap volcanism may have pro-duced large CH3Cl fluxes (2times1012ndash55times1012 mol yrminus1) [18] CH3Cl hasbeen found to correlate very well withmethane during the holocene (11ndash0 kyrBP) and appears to correlate during thelast glacial period (50ndash30 kyr BP)[38]
HCN(hydrogencyanide)
F = 56times1010ndash13times1011
[39]x =asymp 2times10minus10
[40]τ = 53 months(troposphere)[40]
Biomass burning is a majorsource[39] Ocean uptake oxidation byOH photolysis and scavenging by pre-cipitation are major sinks
Upper atmospheric chemistry betweenCH4 photolysis products and atomicnitrogen may have produced elevatedabundances in the Archean[2741]Perhaps sustaining tropospheric abun-dances of 10minus8ndash10minus7 and higher abun-dances in the stratosphere[41] HCNcould be produced by lightning ina reduced atmosphere withpCH4 ge
pCO2 (K Zahnle private communica-tion 2014)
PH3(phosphine)
F = unknownx =lt 10minus13 (freetroposphere)[42]τ = 28 h[43]
Possible sources are lightning and mi-crobes[44] The main sink is reactionwith OH producing phosphate whichreturns to the surface in rain[43]
Simulated lightning in a methane modelatmosphere has been shown to reducephosphate to PH3 [44] Production ofphosphine from posphate may also beproduced via tectonic forces and pro-cessing of rocks[45]
C2H4(Ethylene)
F = 3times1010
x = 10minus11ndash10minus8[46]
τ = a few days[46]
Major sources are plants and microor-ganisms Destroyed by OH (asymp 90)and O3(asymp 10) [46]
Methane photochemistry may have sus-tained tropospheric abundances ofasymp
2times10minus13 in the Archean (for CH4 andCO2 abundances of 10minus3) [34]
OCS(Carbonyl sul-fide)
F = 1times109-33times1010
[47]x = 5times10minus10
[47]τ = 15ndash3 yr [47]43 yr[48]
Major sources are oceanic emissionsoxidation of oceanic CS2 and DMSand biomass burning Major sinks areuptake by vegetation and soils and OHoxidation OCS is oxidised in the strato-sphere to form sulfate particles whichinfluence the radiative budget[47]
Abundances of 5times10minus6 have been sug-gested in the Archean[49] Howeverother have found that abundances above10minus8 appear unlikely due to rapid OCSphotolysis[50] [23] See Sect 1
HOCl(hypochlorousacid)
F = unknownx = 5times10minus12ndash17times10minus10
[51]τ = days
Cl can form HOCl via gas phase reac-tions[21]
Early Earth volcanism may have pro-duced greater fluxes of chlorine than to-day (108ndash1010mol yrminus1 of Cl [17])
N2O(nitrous oxide)
F = 86times1011[52]
x = 27times10minus7[53]
τ = 131 yr[53]
Produced as an intermediate productof both nitrification and denitrifica-tion [52] Primary natural sources areupland soils and riparian areas oceansestuaries and rivers[52] Destroyed bychemical reactions in the upper atmo-sphere
It has been proposed that large amountsof N2O could have been produced inthe Proterozoic due to bacterial denitri-fication in copper depleted water[54]However it has been shown that N2Owould be rapidly photo-dissociated ifO2 levels were lower than 01 PAL[55]
Clim Past 10 1779ndash1801 2014 wwwclim-pastnet1017792014
B Byrne and C Goldblatt Archean radiative forcings 1793
Table 1Continued
NO2(nitrogendioxide)
F = 7times1011-36times1012
[56]x = 3times10minus10 (NONO2and NO3) [6]
τ = 27 h[56]
Lightning biomass burning and soilsare main sources[57] Lightning strikesproduced NO from O2 and N2 whichis oxidised to NO2 a major sink is drydeposition[6]
Early Earth volcanism may have pro-duced asymp 109ndash1010 mol yrminus1 of fixednitrogen compared toasymp 109 mol yrminus1
today[7] Without O2 the nitrogen fix-ation efficiency of lightning is signifi-cantly reduced compared to today[8]Although it has also been suggestedthat nitrogen fixation by volcanic light-ning could have produced 33times1010ndash33times1011 mol yrminus1 of NO (4 GyrAgo) [9] However in reduced atmo-spheres NO reacts to form HNO (KZahnle private communication 2014)
C2H6(ethane)
F = 20times1011[32]
x = 10minus10ndash5times10minus9[58]
τ = 2 months[58]
Anthropogenic sources dominatebiomass burning natural gas loss andbiofuel consumption Oxidation by OHis a major sink
Methane photochemistry may have sus-tained tropospheric abundances ofasymp
5times10minus6 in the Archean (for CH4 andCO2 abundances of 10minus3) [34] SeeSect 1
[1] Jacob et al(2005) and references within[2] Millet et al (2008) [3] Bar-Nun and Chang(1983) [4] Wen et al(1989) [5] Xin et al (2004) [6] Ussiri and Lal(2012)[7] Mather et al(2004) [8] Navarro-Gonzalez et al(2001) [9] Navarro-Gonzalez et al(1998) [10] Harrison et al(2014) [11] Duchatelet et al(2009) [12] Allen et al(2013) [13] Hua et al(2008) [14] Haqq-Misra et al(2011) [15] Liang et al(2006) [16] WMO (2011) [17] Martin et al(2007) [18] Svensen et al(2009) [19] Smithet al(2001) [20] Lee et al(2011) [21] Gaillard et al(2011) [22] Zahnle et al(2006) [23] Zerkle et al(2012) [24] Halevy et al(2009) [25] Schlesinger and Hartley(1992) [26] Warneck(1988) [27] Zahnle(1986) [28] Pavlov et al(2001) [29] Fishman and Crutzen(1978) [30] Johnston(1975) [31] Kasting and Donahue(1980)[32] Abad et al(2011) [33] Xiao et al(2007) [34] Haqq-Misra et al(2008) [35] Chebbi and Carlier(1996) [36] Williams et al(2007) [37] Moore(2008) [38] Verhulstet al(2013) [39] Zeng et al(2012) [40] Li et al (2003) [41] Tian et al(2011) [42] Glindemann et al(2003) [43] Morton and Edwards(2005) [44] Glindemann et al(2004) [45] Glindemann et al(2005) [46] Sawada and Totsuka(1986) [47] Kettle et al (2002) andMontzka et al(2007) [48] Chin and Davis(1995) [49] Ueno et al(2009) [50] Domagal-Goldman et al(2011) [51] Lawler et al(2011) [52] USEPA(2010) [53] IPCC(2013) [54] Buick (2007) [55] Roberson et al(2011) [56] Leueet al(2001) [57] Lee et al(1997) [58] Xiao et al(2008)
follows For some gases the shape of the absorption crosssections were the same but the magnitude was offset Forthese gases we adjust the abundances required for a givenforcing this was done for CH3OH (x10) CH3Br (x13) C2H4(x01) and H2O2 (x2) Missing spectra was compensated forby adding the radiative forcings from other gases that hadsimilar spectra For CH3OH the C2H4 forcings were addedFor HCOOH we added the HCN forcing For NO2 we addedthe HOCl forcing For H2CO we added the PH3 forcing fora given abundance scaled up an order of magnitude
There are significant differences in radiative forcing due todifferent N2 inventories The differences in radiative forcingdue to differences in atmospheric pressure varies from gas togas Generally the differences in forcing due to differencesin atmospheric structure are similar but the differences dueto pressure broadening are more variable Broadening is mosteffective for gases which have broad absorption features withhighly variable cross sections because the broadening of thelines covers areas with weak absorption Such gases includeNH3 HCN C2H2 and PH3 At 5times10minus6 55ndash60 percent ofthe difference in radiative forcing between atmospheres canbe attributed to pressure broadening for these gases Whereas NO2 and HOCl which have strong but narrow absorptionfeatures show the least difference in forcing due to pressurebroadening (20ndash23 )
332 Overlap
Here we examine the reduction in radiative forcing due tooverlap for gases which reach radiative forcings of 10 W mminus2
at abundances less than 10minus5 The abundances of CO2 andCH4 are expected to be quite high in the Archean Tracegases which have absorption bands coincident with the ab-sorption bands of CO2 and CH4 will be much less effectiveat warming the Archean atmosphere
We examine the effect of overlap on radiative forcing bylooking at several cases with varying abundances of CO2CH4 (Fig 12) and other trace gases (Fig13) The magni-tude of overlap can vary substantially between the gases inquestion For the majority of gases overlap with CO2 is thelargest The reduction in forcing is generally between 10 and30 but can be as high as 86 The reduction in forcing arelargest for HCN (86 ) C2H2 (78 ) CH3Cl (71 ) NO2(52 ) and N2O (33 ) all with 10minus2 of CO2 All of thesegases have significant absorption bands in the 550ndash850 cmminus1
wavenumber region where CO2 absorbs the strongest Ofparticular interest is N2O which has previously been pro-posed to have built up to significant abundances on the earlyEarth (Buick 2007) C2H2 could also have been producedby a hypothetical early Earth haze although previous studieshave found that it would not build up to radiatively importantabundances (Haqq-Misra et al 2008)
wwwclim-pastnet1017792014 Clim Past 10 1779ndash1801 2014
1794 B Byrne and C Goldblatt Archean radiative forcings
CH3OH
0
5
10
15
20
HNO3
0
5
10
15
H2O
2
0
5
10
15
COF2
0
5
10
15
SO2
0
5
10
15
NH3
0
5
10
15
CH3Cl
C2H
2
Radia
tive F
orc
ing (
Wm
minus2)
0
5
10
15
HCOOH
PH3
OCS
HCN
C2H
6
0
5
10
HOCl
NO2
CH3Br
0
5
10
15C
2H
4
N2OO
3
0
5
10
15
HF
HO2
0
5
H2CO
HCl
Abundance (ngas
n0)
10minus8
10minus7
10minus6
10minus5
H2S
ClO
0
5
OH
Abundance (ngas
n0)
Radia
tive F
orc
ing (
Wm
minus2)
10minus8
10minus7
10minus6
10minus5
0
5
Figure 11 Trace gas radiative forcings All sky radiative forcings for potential early Earth trace gases colours are as in Fig 2 Gases areordered by the abundance required to get a radiative forcing of 10 W mminus2 Shading indicates abundances where computed cross sectionsfrom HITRAN data were in poor agreement with the PNNL data The colours indicate areas where HITRAN data underestimates (blue)overestimates (red) or both at different frequencies (purple) Grey shading indicates where no PNNL data was available Vertical black linesshow the abundance at which the radiative forcing is 10 W mminus2 for a 1 bar atmosphere Dotted red lines give rough estimates of the radiativeforcing accounting for incorrect spectral data Abundances are scaled to an atmosphere with 1 bar of N2
The reduction in forcing due to CH4 is generally less than20 but can be as high as 37 The reductions in forcingare largest for HOCl (33 ) N2O (32 ) COF2 (25 ) andH2O2 (21 ) all with 10minus4 of CH4 All of which have ab-sorption bands in 1200ndash1350 cmminus1 As with CO2 the radia-
tive forcing from N2O is significantly reduced due to overlapwith CH4 suggesting that N2O is not a good candidate toproduce significant warming on early Earth except at veryhigh abundances
Clim Past 10 1779ndash1801 2014 wwwclim-pastnet1017792014
B Byrne and C Goldblatt Archean radiative forcings 1795
Reduction in Radiative Forcing (Wmminus2
)
CH
3O
H
HN
O3
CO
F2
CH
3B
r
HC
OO
H
SO
2
C2H
2
NO
2
NH
3
OC
S
H2O
2
N2O
HC
N
PH
3
HO
Cl
CH
3C
l
C2H
4
C2H
6
CO2 (ppmv) CH
4 (ppmv)
07
0
07
100
0
100
0
280
280
0
10000
10000
minus12
minus12
minus06
minus13
minus07
minus20
minus25
minus15
minus40
minus19
minus08
minus27
minus08
minus09
minus12
minus17
minus44
minus44
minus78
minus82
minus29
minus29
minus52
minus53
minus11
minus12
minus07
minus07
minus05
minus21
minus05
minus26
minus05
minus12
minus17
minus32
minus33
minus65
minus57
minus57
minus86
minus86
minus14
minus17
minus33
minus33
minus36
minus36
minus71
minus74
minus10
minus10
minus10
minus10
minus7 minus6 minus5 minus4 minus3 minus2 minus1 0
Figure 12Overlap with CO2 and CH4 Reduction in radiative forcing due to overlapping absorption Trace gas abundances are held at theabundances which gives a 10 W mminus2 radiative forcing for an atmosphere with 1 bar of N2
Reductio
n in
Radia
tive F
orc
ing (W
mminus
2)
N2O
SO2
NO2
NH3
HNO3
OCS
HOCl
HCN
CH3Cl
H2O
2
C2H
2
C2H
6
PH3
COF2
HCOOH
C2H
4
CH3OH
CH3Br
N2O
SO
2
NO
2
NH
3
HN
O3
OC
S
HO
Cl
HC
N
CH
3C
l
H2O
2
C2H
2
C2H
6
PH
3
CO
F2
HC
OO
H
C2H
4
CH
3O
H
CH
3B
r
minus06
minus08
minus16
minus16
minus10
minus15
minus06
minus06
minus10
minus21
minus17
minus21
minus15
minus05
minus10
minus10
minus14
minus08
minus11
minus17
minus15
minus14
minus08
minus11
minus09
minus10
minus13
minus10
minus11
minus22
minus10
minus06
minus17
minus16
minus24
minus05
minus37
minus21
minus30
minus30
minus17
minus30
minus31
minus05
minus11
minus16
minus24
minus14
minus07
minus21
minus30
minus31
minus15
minus10
minus09
minus22
minus06
minus14
minus10
minus05
minus05
minus08
minus28
minus14
minus30
minus11
minus10
minus05
minus08
minus37
minus14
minus08
minus15
minus14
minus10
minus11
minus28
minus13
minus17
minus10
minus06
minus14
minus15
minus19
minus26
minus15
minus17
minus11
minus30
minus13
minus19
minus12
minus15
minus14
minus13
minus07
minus11
minus14
minus26
minus12
minus35
minus3
minus25
minus2
minus15
minus1
minus05
0
Figure 13 Trace gas overlap Reduction in radiative forcing due to overlapping absorption Gas abundances are held at values which givea 10 W mminus2 radiative forcing for an atmosphere with 1 bar of N2
We calculate the reduction in radiative forcing due to over-lap between trace gases (Fig13) There is a large amount ofoverlap between C2H2 CH3Cl and HCN resulting in a re-duction in radiative forcing ofasymp 30 All three gases havetheir strongest absorption bands in the region 700ndash850 cmminus1
and have a secondary absorption band in the region 1250ndash1500 cmminus1 which are on the edges of the water vapour win-dow All three gases have significant overlap with CO2 for
an atmosphere with 10minus2 of CO2 the reductions in forcingaregt 70
Other traces gases with significant overlap are COF2and HOCl (37 ) due to coincident absorption bands atasymp 1250cmminus1 and CH3OH and PH3 (30 ) due to coincidentabsorption aroundasymp 1000cmminus1
Other background absorption could have been presentwhich would have had overlapping absorption with thesegasesWordsworth and Pierrehumbert(2013) have proposed
wwwclim-pastnet1017792014 Clim Past 10 1779ndash1801 2014
1796 B Byrne and C Goldblatt Archean radiative forcings
C2H
6
Fi (
Wm
minus2)
0
5
10
15
NH3
Fi (
Wm
minus2)
0
10
20
30
40
N2O
Fi (
Wm
minus2)
Abundance (ngas
n0)
10minus8
10minus7
10minus6
10minus5
0
5
10
15
Figure 14 Calculated Radiative forcings and inferred radiativeforcings from literature Literature radiative forcings are inferredfrom temperature changes reported byHaqq-Misra et al(2008)(C2H6) Kuhn and Atreya(1979) (NH3) andRoberson et al(2011)(N2O) Radiative forcings are calculated assuming a range of cli-mate sensitivity parameters of 04 to 12 K(Wmminus2)minus1 with a bestguess of 08 K(Wmminus2)minus1
that elevated N2 and H2 levels may have been present inthe Archean which would have resulted in significant N2ndashH2 CIA across much of the infrared spectrum including thewater vapour window Overlap between N2ndashH2 absorptionand the gases examined here would likely be significant asmany of these gases have significant absorption in the watervapour window However performing these overlap calcula-tions is beyond the scope of this work
333 Comparison between our results and previouscalculations
We compare inferred radiative forcings from prior work toours using the same method as for CO2 and CH4 (Fig 14)
Inferred C2H6 radiative forcings fromHaqq-Misra et al(2008) for a 1 bar atmosphere agree well with our resultsInferred NH3 from Kuhn and Atreya(1979) for a 078 baratmosphere agree well with our results although our resultssuggest that the results ofKuhn and Atreya(1979) are onthe lower end of possible temperature changes Inferred N2O
from Roberson et al(2011) for a 1 bar atmosphere agreewell with our resultsRoberson et al(2011) perform ra-diative forcing calculations with CO2 and CH4 abundancesof 320 ppmv and 16 ppmv respectively Due to overlap thisforcing is likely reduced byasymp 50 with early Earth CO2 andCH4 abundances of 10minus2 and 10minus4 respectivelyUeno et al(2009) give a rough estimate of the radiative forcing due to10 ppmv of OCS to be 60 W mminus2 In this work we find theforcing to be much less than this (asymp 20Wmminus2)
4 Conclusions
Using the SMART radiative transfer model and HITRANline data we have calculated radiative forcings for CO2CH4 and 26 other HITRAN greenhouse gases on a hypo-thetical early Earth atmosphere These forcings are availableat several background pressures and we account for overlapbetween gases We recommend the forcings provided here beused both as a first reference for which gases are likely goodgreenhouse gases and as a standard set of calculations forvalidation of radiative forcing calculations for the ArcheanModel output are available as Supplement for this purposeMany of these gases can produce significant radiative forc-ings at low abundances Whether any of these gases couldhave been sustained at radiatively important abundances dur-ing the Archean requires study with geochemical and atmo-spheric chemistry models
Comparing our calculated forcings with previous workwe find that CO2 radiative forcings are consistent but finda stronger shortwave absorption by CH4 than previouslyrecorded This is primarily due to updates to the HITRANdatabase at wavenumbers less than 11 502 cmminus1 This newresult suggests an upper limit to the warming CH4 could haveprovided of about 10 W mminus2 at 5times10minus4ndash10minus3 Amongst thetrace gases we find that the forcing from N2O was likelyoverestimated byRoberson et al(2011) due to underesti-mated overlap with CO2 and CH4 and that the radiativeforcing from OCS was greatly overestimated byUeno et al(2009)
Clim Past 10 1779ndash1801 2014 wwwclim-pastnet1017792014
B Byrne and C Goldblatt Archean radiative forcings 1797
Appendix A Sensitivity
FigureA1 shows the fluxes radiative forcings and percent-age difference in radiative forcings for various possible GAMtemperature and water vapour profiles for the early EarthThe effect on radiative forcing calculations from varyingthe stratospheric temperature from 170 to 210 K while thetropopause temperature is kept constant are very small (lt
3 ) Varying the tropopause temperature between 170 and210 K results in larger differences in radiative forcing (lt
10 ) Changing the relative humidity effects radiative forc-ing by less than 5 Radiative forcing calculations are sensi-tive to surface temperature Increasing or decreasing a 290 Ksurface temperature by 10 K results in differences in radia-tive forcing of le 12 However the difference in forcingbetween 270 and 290 K is much larger (12ndash25 )
Figure A1 Sensitivity study Columns from left to right Temperature structure H2O structure Net flux of radiation at tropopause radiativeforcing and percentage difference in radiative forcing Solid dashed and dashed-dotted curves represent different tropopause positionsVertical dotted red line shows the atmospheric skin temperature (203 K)
wwwclim-pastnet1017792014 Clim Past 10 1779ndash1801 2014
1798 B Byrne and C Goldblatt Archean radiative forcings
The Supplement related to this article is available onlineat doi105194cp-10-1779-2014-supplement
AcknowledgementsWe thank Ty Robinson for help with SMARTand discussions of the theory behind it Financial support wasreceived from the Natural Sciences and Engineering ResearchCouncil of Canada (NSERC) CREATE Training Program inInterdisciplinary Climate Science at the University of Victoria(UVic) a University of Victoria graduate fellowship to BBand NSERC Discovery grant to CG This research has beenenabled by the use of computing resources provided by West-Grid and ComputeCalcul Canada We would also like to thankAndrew MacDougall for helpful comments on an earlier draftof the manuscript and Kevin Zahnle for sharing is insights andreviewing the information in Table 1 We thank Jim Kasting and ananonymous reviewer for comments which improved the manuscript
Edited by Y Godderis
References
Abad G G Allen N D C Bernath P F Boone C D McLeodS D Manney G L Toon G C Carouge C Wang YWu S Barkley M P Palmer P I Xiao Y and Fu T MEthane ethyne and carbon monoxide abundances in the up-per troposphere and lower stratosphere from ACE and GEOS-Chem a comparison study Atmos Chem Phys 11 9927ndash9941doi105194acp-11-9927-2011 2011
Allen N D C Abad G G Bernath P F and Boone C D Satel-lite observations of the global distribution of hydrogen peroxide(H2O2) from ACE J Quant Spectrosc Radiat Transfer 11566ndash77 doi101016jjqsrt201209008 2013
Bar-Nun A and Chang S Photochemical reactions of water andcarbon-monoxide in Earthrsquos primitive atmosphere J GeophysRes-Oc Atm 88 6662ndash6672 doi101029JC088iC11p066621983
Buick R Did the Proterozoic ldquoCanfield Oceanrdquo cause a laughinggas greenhouse Geobiology 5 97ndash100 doi101111j1472-4669200700110x 2007
Byrne B and Goldblatt C Radiative forcing at high concentra-tions of well-mixed greenhouse gases Geophys Res Lett 41152ndash160 doi1010022013GL058456 2014
Charnay B Forget F Wordsworth R Leconte J Millour ECodron F and Spiga A Exploring the faint young Sunproblem and the possible climates of the Archean Earthwith a 3-D GCM J Geophys Res-Atmos 118 10414doi101002jgrd50808 2013
Chebbi A and Carlier P Carboxylic acids in the troposphereoccurrence sources and sinks a review Atmos Environ 304233ndash4249 doi1010161352-2310(96)00102-1 1996
Chin M and Davis D A reanalysis of carbonyl sulfide as a sourceof stratospheric background sulfur aerosol J Geophys Res-Atmos 100 8993ndash9005 doi10102995JD00275 1995
Domagal-Goldman S D Meadows V S Claire M W and Kast-ing J F Using biogenic sulfur gases as remotely detectable
biosignatures on anoxic planets Astrobiology 11 419ndash441doi101089ast20100509 2011
Donn W L Donn B D and Valentine W G On theearly history of the Earth Geol Soc Am Bull 76 287ndash306 doi1011300016-7606(1965)76[287OTEHOT]20CO21965
Driese S G Jirsa M A Ren M Brantley S L Shel-don N D Parker D and Schmitz M Neoarchean pa-leoweathering of tonalite and metabasalt implications forreconstructions of 269 Gyr early terrestrial ecosystems andpaleoatmospheric chemistry Precambrian Res 189 1ndash17doi101016jprecamres201104003 2011
Duchatelet P Mahieu E Ruhnke R Feng W Chipperfield MDemoulin P Bernath P Boone C D Walker K A ServaisC and Flock O An approach to retrieve information on the car-bonyl fluoride (COF2) vertical distributions above Jungfraujochby FTIR multi-spectrum multi-window fitting Atmos ChemPhys 9 9027ndash9042 doi105194acp-9-9027-2009 2009
Feulner G The faint young sun problem Rev Geophys 50RG2006 doi1010292011RG000375 2012
Fishman J and Crutzen P Origin of ozone in the troposphereNature 274 855ndash858 doi101038274855a0 1978
Freckleton R Highwood E Shine K Wild O Law K andSanderson M Greenhouse gas radiative forcing Effects ofaveraging and inhomogeneities in trace gas distribution Q JRoy Meteorol Soc 124 2099ndash2127 doi101256smsqj550131998
Gaillard F Scaillet B and Arndt N T Atmospheric oxygenationcaused by a change in volcanic degassing pressure Nature 478229ndashU112 doi101038Nature10460 2011
Glindemann D Edwards M and Kuschk P Phosphine gasin the upper troposphere Atmos Environ 372429ndash2433doi101016S1352-2310(03)00202-4 2003
Glindemann D Edwards M and Schrems O Phosphineand methylphosphine production by simulated lightning -a study for the volatile phosphorus cycle and cloud forma-tion in the earth atmosphere Atmos Environ 386867ndash6874doi101016jatmosenv200409002 2004
Glindemann D Edwards M and Morgenstern P Phosphinefrom rocks Mechanically driven phosphate reduction EnvironSci Policy 39 8295ndash8299 doi101021es050682w 2005
Goldblatt C and Zahnle K J Faint young Sun paradox remainsNature 474 E3ndashE4 doi101038nature09961 2011a
Goldblatt C and Zahnle K J Clouds and the Faint Young SunParadox Clim Past 7 203ndash220 doi105194cp-7-203-20112011b
Goldblatt C Lenton T M and Watson A J Bistability of atmo-spheric oxygen and the Great Oxidation Nature 443 683ndash686doi101038nature05169 2006
Goldblatt C Claire M W Lenton T M Matthews A JWatson A J and Zahnle K J Nitrogen-enhanced green-house warming on early Earth Nat Geosci 2 891ndash896doi101038ngeo692 2009
Goody R and Yung Y Atmospheric Radiation Theoretical BasisOxford University Press New York USA 1995
Gough D Solar interior structure and luminoscity variations SolPhys 74 21ndash34 doi101007BF00151270 1981
Clim Past 10 1779ndash1801 2014 wwwclim-pastnet1017792014
B Byrne and C Goldblatt Archean radiative forcings 1799
Halevy I Pierrehumbert R T and Schrag D P Radiative trans-fer in CO2-rich paleoatmospheres J Geophys Res-Atmos114 D18112 doi1010292009JD011915 2009
Halevy I and Schrag D P Sulfur dioxide inhibits calcium car-bonate precipitation Implications for early Mars and Earth Geo-phys Res Lett 36 doi1010292009GL040792 2009
Hansen J Sato M Ruedy R Nazarenko L Lacis ASchmidt G Russell G Aleinov I Bauer M Bauer SBell N Cairns B Canuto V Chandler M Cheng YDel Genio A Faluvegi G Fleming E Friend A Hall TJackman C Kelley M Kiang N Koch D Lean JLerner J Lo K Menon S Miller R Minnis P Novakov TOinas V Perlwitz J Perlwitz J Rind D Romanou AShindell D Stone P Sun S Tausnev N Thresher DWielicki B Wong T Yao M and Zhang S Efficacyof climate forcings J Geophys Res-Atmos 110 D18104doi1010292005JD005776 2005
Haqq-Misra J D Domagal-Goldman S D Kasting P Jand Kasting J F A revised hazy methane green-house for the archean earth Astrobiology 8 1127ndash1137doi101089ast20070197 2008
Haqq-Misra J Kasting J F and Lee S Availability of O2 andH2O2 on Pre-Photosynthetic Earth Astrobiology 11 293ndash302doi101089ast20100572 2011
Harrison J J Chipperfield M P Dudhia A Cai S DhomseS Boone C D and Bernath P F Satellite observationsof stratospheric carbonyl fluoride Atmospheric Chemistry andPhysics Discussions 14 18 127ndash18 180 doi105194acpd-14-18127-2014 2014
Hattori S Danielache S O Johnson M S Schmidt J A Kjaer-gaard H G Toyoda S Ueno Y and Yoshida N Ultravio-let absorption cross sections of carbonyl sulfide isotopologuesOC32S OC33S OC34S and O13CS isotopic fractionation inphotolysis and atmospheric implications Atmos Chem Phys11 10293ndash10303 doi105194acp-11-10293-2011 2011
Hua W Chen Z M Jie C Y Kondo Y Hofzumahaus ATakegawa N Chang C C Lu K D Miyazaki Y Kita KWang H L Zhang Y H and Hu M Atmospheric hydrogenperoxide and organic hydroperoxides during PRIDE-PRDrsquo06China their abundance formation mechanism and contributionto secondary aerosols Atmos Chem Phys 8 6755ndash6773 2008
IPCC Climate Change 2013 The Scientific Basis Contribution ofWorking Group I to the Fifth Assessment Report of the Inter-governmental Panel on Climate Change Cambridge UniversityPress Cambridge UK and New York NY USA 2013
Jacob D Field B Li Q Blake D de Gouw J Warneke CHansel A Wisthaler A Singh H and Guenther A Globalbudget of methanol Constraints from atmospheric observationsJ Geophys Res-Atmos 110 doi1010292004JD0051722005
Johnson B and Goldblatt C The Nitrogen Budget of Earth Earth-Sci Rev in review 2014
Johnston H Global ozone balance in natural stratosphere RevGeophys 13 637ndash649 doi101029RG013i005p00637 1975
Kasting J and Donahue T The evolution of atmo-spheric ozone J Geophys Res-Oc 85 3255ndash3263doi101029JC085iC06p03255 1980
Kasting J F Stability of ammonia in the primitive terres-trial atmosphere J Geophys Res-Oc Atm 87 3091ndash3098doi101029JC087iC04p03091 1982
Kasting J F Zahnle K J and Walker J C G (1983) Photo-chemistry of methane in Earthrsquos early atmosphere PrecambrianRes 20 121ndash148 doi1010160301-9268(83)90069-4 1983
Kasting J F Methane and climate during the Pre-cambrian era Precambrian Res 137 119ndash129doi101016jprecamres200503002 2005
Kasting J F How was early earth kept warm Science 339 44ndash45 doi101126science1232662 2013
Kasting J F Pollack J and Crisp D Effects of highCO2 levels on surface-temperature and atmospheric oxidation-state of the early Earth J Atmos Chem 1 403ndash428doi101007BF00053803 1984
Kavanagh L and Goldblatt C The Som Palaeobarometry Methoda critical analysis presented at 2012 Fall Meeting 3ndash7 Decem-ber AGU San Francisco California abstract P21B-1719 2013
Kettle A J and Kuhn U and von Hobe M and Kesselmeier Jand Andreae M O Global budget of atmospheric car-bonyl sulfide Temporal and spatial variations of the domi-nant sources and sinks J Geophys Res-Atmos 107 1ndash16doi1010292002JD002187 2002
Kiehl J and Dickinson R A study of the radiative effectsof enhanced atmospheric CO2 and CH4 on early Earth sur-face temperatures J Geophys Res-Atmos 92 2991ndash2998doi101029JD092iD03p02991 1987
Kienert H Feulner G and Petoukhov V Faint young Sun prob-lem more severe due to ice-albedo feedback and higher rota-tion rate of the early Earth Geophys Res Lett 39 L23710doi1010292012GL054381 2012
Kuhn W and Atreya S Ammonia photolysis and the greenhouseeffect in the primordial atmosphere of the Earth Icarus 37 207ndash213 doi1010160019-1035(79)90126-X 1979
Lawler M J Sander R Carpenter L J Lee J D von GlasowR Sommariva R and Saltzman E S HOCl and Cl2 ob-servations in marine air Atmos Chem Phys 11 7617ndash7628doi105194acp-11-7617-2011 2011
Lee D Kohler I Grobler E Rohrer F Sausen R GallardoK-lenner L Olivier J Dentener F and Bouwman A Estima-tions of global NOx emissions and their uncertainties AtmosEnviron 31 1735ndash1749 doi101016S1352-2310(96)00327-51997
Lee C Martin R V van Donkelaar A Lee H DickersonR R Hains J C Krotkov N Richter A Vinnikov K andSchwab J J SO2 emissions and lifetimes Estimates from in-verse modeling using in situ and global space-based (SCIA-MACHY and OMI) observations J Geophys Res-Atmos 116doi1010292010JD014758 2011
Leue C Wenig M Wagner T Klimm O Platt U and JahneB Quantitative analysis of NOx emissions from Global OzoneMonitoring Experiment satellite image sequences J GeophysRes-Atmos 106 5493ndash5505 doi1010292000JD900572 2ndAGU Chapman Conference on Water Vapor in the Climate Sys-tem POTOMAC MD OCT 12-15 1999 2001
Li Q Jacob D Yantosca R Heald C Singh H Koike MZhao Y Sachse G and Streets D A global three-dimensionalmodel analysis of the atmospheric budgets of HCN and CH3CN
wwwclim-pastnet1017792014 Clim Past 10 1779ndash1801 2014
1800 B Byrne and C Goldblatt Archean radiative forcings
Constraints from aircraft and ground measurements J GeophysRes-Atmos 108 doi1010292002JD003075 2003
Liang M-C Hartman H Kopp R E Kirschvink J L andYung Y L Production of hydrogen peroxide in the atmo-sphere of a Snowball Earth and the origin of oxygenic pho-tosynthesis P Natl Acad Sci USA 103 18 896ndash18 899doi101073pnas0608839103 2006
Martin R S Mather T A and Pyle D M Volcanic emissionsand the early Earth atmosphere Geochim Cosmochim Ac 713673ndash3685 doi101016jgca200704035 2007
Mather T Pyle D and Allen A Volcanic source for fixed ni-trogen in the early Earthrsquos atmosphere Geology 32 905ndash908doi101130G206791 2004
Marty B Zimmermann L Pujol M Burgess R andPhilippot P Nitrogen isotopic composition and den-sity of the archean atmosphere Science 342 101ndash104doi101126Science1240971 2013
Meadows V and Crisp D Ground-based near-infrared observa-tions of the Venus nightside the thermal structure and waterabundance near the surface J Geophys Res-Planet 101 4595ndash4622 doi10102995JE03567 1996
Millet D B Jacob D J Custer T G de Gouw J A GoldsteinA H Karl T Singh H B Sive B C Talbot R W WarnekeC and Williams J New constraints on terrestrial and oceanicsources of atmospheric methanol Atmos Chem Phys 8 6887ndash6905 doi105194acp-8-6887-2008 2008
Montzka S A Calvert P Hall B D Elkins J W ConwayT J Tans P P and Sweeney C On the global distributionseasonality and budget of atmospheric carbonyl sulfide (COS)and some similarities to CO2 J Geophys Res-Atmos 112doi1010292006JD007665 2007
Morton S and Edwards M Reduced phosphorus compoundsin the environment Crit Rev Env Sci Tec 35 333ndash364doi10108010643380590944978 2005
Moore R M A photochemical source of methyl chloridein saline waters Environ Sci Technol 42 1933ndash1937doi101021es071920I 2008
Myhre G and Stordal F Role of spatial and temporal variations inthe computation of radiative forcing and GWP J Geophys Res102 11181ndash11200 doi10102997JD00148 1997
Navarro-Gonzalez R Molina M and Molina L Nitrogen fixa-tion by volcanic lightning in the early Earth Geophys Res Lett25 3123ndash3126 doi10102998GL02423 1998
Navarro-Gonzalez R McKay C and Mvondo D A possible ni-trogen crisis for Archaean life due to reduced nitrogen fixationby lightning Nature 412 61ndash64 doi10103835083537 2001
Pavlov A Kasting J Brown L Rages K and Freed-man R Greenhouse warming by CH4 in the atmosphereof early Earth J Geophys Res-Planet 105 11981ndash11990doi1010291999JE001134 2000
Pavlov A Brown L and Kasting J UV shielding of NH3 and O-2 by organic hazes in the Archean atmosphere J Geophys Red-Planet 106 23267ndash23287 doi1010292000JE001448 2001
Pierrehumbert R Principles of Planetary Climate CambridgeUniv Press New York 2010
Rienecker M M Suarez M J Gelaro R Todling R Bacmeis-ter J Liu E Bosilovich M G Schubert S D Takacs LKim G-K Bloom S Chen J Collins D Conaty ADa Silva A Gu W Joiner J Koster R D Lucchesi R
Molod A Owens T Pawson S Pegion P Redder C R Re-ichle R Robertson F R Ruddick A G Sienkiewicz M andWoollen J MERRA NASArsquos Modern-Era Retrospective Anal-ysis for Research and Applications J Climate 24 3624ndash3648doi101175JCLI-D-11-000151 2011
Roberson A L Roadt J Halevy I and Kasting J F Green-house warming by nitrous oxide and methane in the Pro-terozoic Eon Geobiology 9 313ndash320 doi101111j1472-4669201100286x 2011
Rondanelli R and Lindzen R S Can thin cirrus clouds in thetropics provide a solution to the faint young Sun paradox JGeophys Res 115 D02108 doi1010292009JD012050 2010
Rosing M T Bird D K Sleep N H and Bjerrum C J Noclimate paradox under the faint early Sun Nature 464 744ndash747doi101038nature08955 2010
Rossow W Zhang Y and Wang J A statistical model of cloudvertical structure based on reconciling cloud layer amounts in-ferred from satellites and radiosonde humidity profiles J Cli-mate 18 3587ndash3605 doi101175JCLI34791 2005
Rothman L S Gordon I E Barbe A Benner D CBernath P E Birk M Boudon V Brown L R Campar-gue A Champion J P Chance K Coudert L H Dana VDevi V M Fally S Flaud J M Gamache R R Gold-man A Jacquemart D Kleiner I Lacome N Lafferty W JMandin J Y Massie S T Mikhailenko S N Miller C EMoazzen-Ahmadi N Naumenko O V Nikitin A V Or-phal J Perevalov V I Perrin A Predoi-Cross A Rins-land C P Rotger M Simeckova M Smith M A HSung K Tashkun S A Tennyson J Toth R A Van-daele A C and Vander Auwera J The HITRAN 2008 molec-ular spectroscopic database J Quant Spectrosc Ra 110 533ndash572 doi101016jjqsrt200902013 2009
Rothman L S Gordon I E Babikov Y Barbe A Ben-ner D C Bernath P F Birk M Bizzocchi L Boudon VBrown L R Campargue A Chance K Cohen E A Coud-ert L H Devi V M Drouin B J Fayt A Flaud J MGamache R R Harrison J J Hartmann J M Hill CHodges J T Jacquemart D Jolly A Lamouroux JLe Roy R J Li G Long D A Lyulin O M Mackie C JMassie S T Mikhailenko S Mueller H S P Nau-menko O V Nikitin A V Orphal J Perevalov V Per-rin A Polovtseva E R Richard C Smith M A HStarikova E Sung K Tashkun S Tennyson J Toon G CTyuterev V G and Wagner G The HITRAN2012 molecu-lar spectroscopic database J Quant Spectrosc Ra 130 4ndash50doi101016jjqsrt201307002 2013
Sagan C and Chyba C The early faint sun paradox Organicshielding of ultraviolet-labile greenhouse gases Science 2761217ndash1221 doi101126Science27653161217 1997
Sagan C and Mullen G Earth and Mars ndash evolution of at-mospheres and surface temperatures Science 177 52ndash56doi101126Science177404352 1972
Saikawa E Schlosser C A and Prinn R G Global modelingof soil nitrous oxide emissions from natural processes GlobalBiogeochem Cy 27 972ndash989 doi101002gbc20087 2013
Saltzman E S Aydin M Tatum C and Williams M B2000-year record of atmospheric methyl bromide froma South Pole ice core J Geophys Res-Atmos 113doi1010292007JD008919 2008
Clim Past 10 1779ndash1801 2014 wwwclim-pastnet1017792014
B Byrne and C Goldblatt Archean radiative forcings 1801
Sawada S and Totsuka T Natural and anthropogenic sourcesand fate of atmospheric ethylene Atmos Environ 20 821ndash832doi1010160004-6981(86)90266-0 1986
Schlesinger W H and Hartley A E A global budgetfor atmospheric ammonia Biogeochemistry 15 191-211doi101007BF00002936 1992
Sharpe S Johnson T Sams R Chu P Rhoderick Gand Johnson P Gas-phase databases for quantitativeinfrared spectroscopy Appl Spectrosc 58 1452ndash1461doi1013660003702042641281 2004
Shaviv N Toward a solution to the early faint Sun paradox a lowercosmic ray flux from a stronger solar wind J Geophys Res-Space 108 1437 doi1010292003JA009997 2003
Sheldon N Precambrian paleosols and atmosphericCO2 levels Precambrian Res 147 148ndash155doi101016jprecamres200602004 2006
Smith S Pitcher H and Wigley T Global and regional anthro-pogenic sulfur dioxide emissions Global Planet Change 29 99ndash119 doi101016S0921-8181(00)00057-6 2001
Som S M Catling D C Harnmeijer J P Polivka P M andBuick R Air density 27 billion years ago limited to less thantwice modern levels by fossil raindrop imprints Nature 484359ndash362 doi101038nature10890 2012
Svensen H Planke S Polozov A G Schmidbauer N CorfuF Podladchikov Y Y and Jamtveit B Siberian gas ventingand the end-Permian environmental crisis Earth Planet Sc Lett277 490ndash500 doi101016jepsl200811015 2009
Tian F Kasting J F and Zahnle K Revisiting HCN formation inEarthrsquos early atmosphere Earth Planet Sc Lett 308 417ndash423doi101016jepsl201106011 2011
Trainer M G Pavlov A A Curtis D B McKay C PWorsnop D R Delia A E Toohey D W Toon O Band Tolbert M A Haze aerosols in the atmosphere ofearly Earth Manna from Heaven Astrobiology 4 409ndash419doi101089ast20044409 2004
Trainer M G Pavlov A A DeWitt H L Jimenez J L McKayC P Toon O B and Tolbert M A Organic haze on Titan andthe early Earth P Natl Acad Sci USA 103 18 035ndash18 042doi101073pnas0608561103 2006
Ueno Y Johnson M S Danielache S O Eskebjerg CPandey A and Yoshida N Geological sulfur isotopes indi-cate elevated OCS in the Archean atmosphere solving faintyoung sun paradox P Natl Acad Sci USA 106 14784ndash14789doi101073pnas0903518106 2009
United States Environmental Protection Agency (USEPA)Methane and Nitrous Oxide Emissions From Nat-ural Sources (EPA 430-R-10-001) Retrieved fromhttpwwwepagovoutreachpdfsMethane-and-Nitrous-Oxide-Emissions-From-Natural-Sourcespdf 2010
Ussiri D and Lal R Soil emission of nitrous oxide and its mitiga-tion Springer 2012
Verhulst K R Aydin M and Saltzman E S Methylchloride variability in the Taylor Dome ice core duringthe Holocene J Geophys Res-Atmos 118 12 218ndash12 228doi1010022013JD020197 2013
von Paris P Rauer H Grenfell J L Patzer B Hedelt PStracke B Trautmann T and Schreier F Warming the earlyearth ndash CO2 reconsidered Planet Space Sci 56 1244ndash1259doi101016jpss200804008 2008
Walker J Hays P and Kasting J A negative feedbackmechanism for the longterm stabilization of Earthrsquos sur-face temperature J Geophys Res-Oceans 86 9776ndash9782doi101029JC086iC10p09776 1981
Warneck P Chemistry of the Natural Atmosphere pp 426ndash441Academic San Diego Calif 1988
Wen J Pinto J and Yung Y Photochemistry of CO and H2O -Analysis of laboratory experiments and application to the prebi-otic Earthrsquos atmosphere J Geophys Res-Atmos 94 14 957ndash14 970 doi101029JD094iD12p14957 1989
Williams M B Aydin M Tatum C and Saltzman E S A 2000year atmospheric history of methyl chloride from a South Poleice core Evidence for climate-controlled variability GeophysRes Lett 34 doi1010292006GL029142 2007
WMO (World Meteorological Organization) Scientific Assessmentof Ozone Depletion 2010 Global Ozone Research and Monitor-ing Project-Report No 52 WMO Geneva Switzerland 2011
Wolf E T and Toon O B Hospitable archean climates simu-lated by a general circulation model Astrobiology 13 656ndash673doi101089ast20120936 2013
Wordsworth R Forget F and Eymet V Infrared collision-induced and far-line absorption in dense CO2 atmospheresIcarus 210 992ndash997 doi101016jIcarus201006010 2010
Wordsworth R and Pierrehumbert R Hydrogen-nitrogen green-house warming in Earthrsquos early atmosphere Science 339 64ndash67 doi101126science1225759 2013
Xiao Y Jacob D J and Turquety S Atmospheric acetylene andits relationship with CO as an indicator of air mass age J Geo-phys Res-Atmos 112 doi1010292006JD008268 2007
Xiao Y Logan J A Jacob D J Hudman R C Yan-tosca R and Blake D R Global budget of ethane and re-gional constraints on US sources J Geophys Res-Atmos 113doi1010292007JD009415 2008
Xin J Cui J Niu J Hua S Xia C Li S and ZhuL Production of methanol from methane by methan-otrophic bacteria Biocatal Biotransfor 22 225ndash229doi10108010242420412331283305 2004
Young G The geologic record of glaciation ndash relevance to the cli-matic history of Earth Geosci Can 18 100ndash108 1991
Zahnle K Photochemistry of methane and the formation of hydro-cyanic acid (HCN) in the earthrsquos early atmosphere J GeophysRes 91 2819ndash2834 doi101029JD091iD02p02819 1986
Zahnle K Claire M and Catling D The loss of mass-independent fractionation in sulfur due to a Palaeoprotero-zoic collapse of atmospheric methane Geobiology 4 271ndash283doi101111j1472-4669200600085x 2006
Zeng G Wood S W Morgenstern O Jones N B Robinson Jand Smale D Trends and variations in CO C2H6 and HCN inthe Southern Hemisphere point to the declining anthropogenicemissions of CO and C2H6 Atmos Chem Phys 12 7543ndash7555 doi105194acp-12-7543-2012 2012
Zerkle A L Claire M Domagal-Goldman S D Far-quhar J and Poulton S W A bistable organic-rich atmo-sphere on the Neoarchaean Earth Nat Geosci 5 359ndash363doi101038NGEO1425 2012
wwwclim-pastnet1017792014 Clim Past 10 1779ndash1801 2014
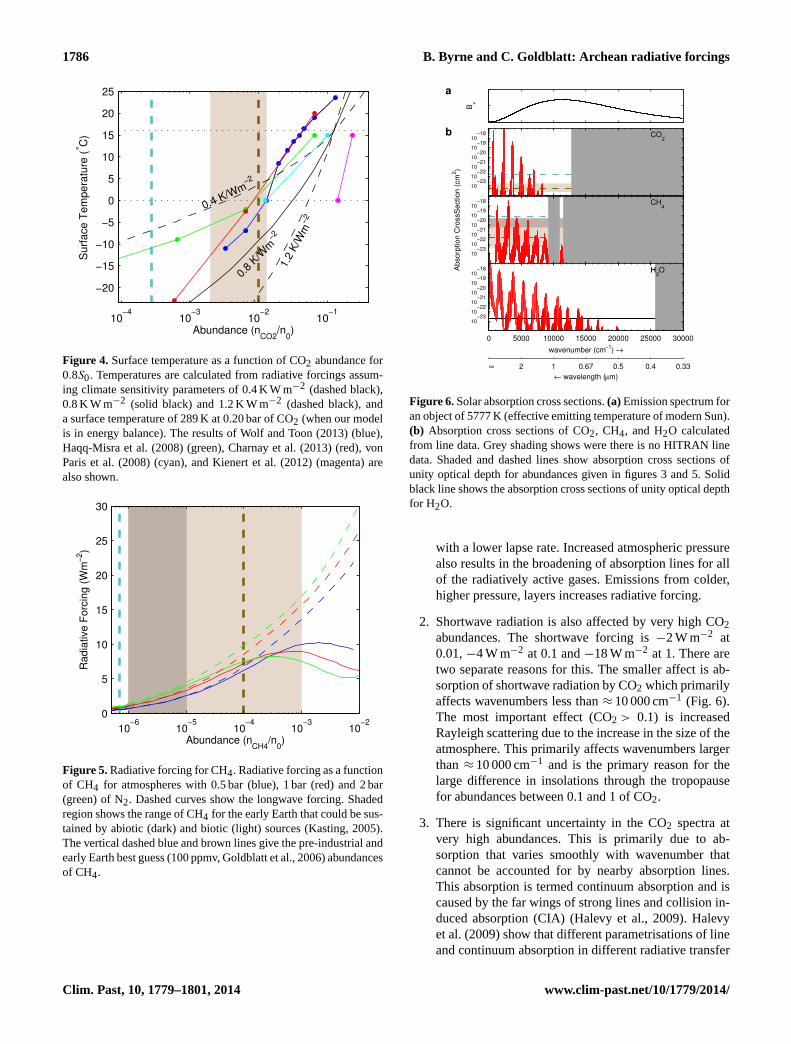