The Archean of the Baltic Shield: Geology, Geochronology, and Geodynamic settings
Upload
khangminh22Category
view
1download
0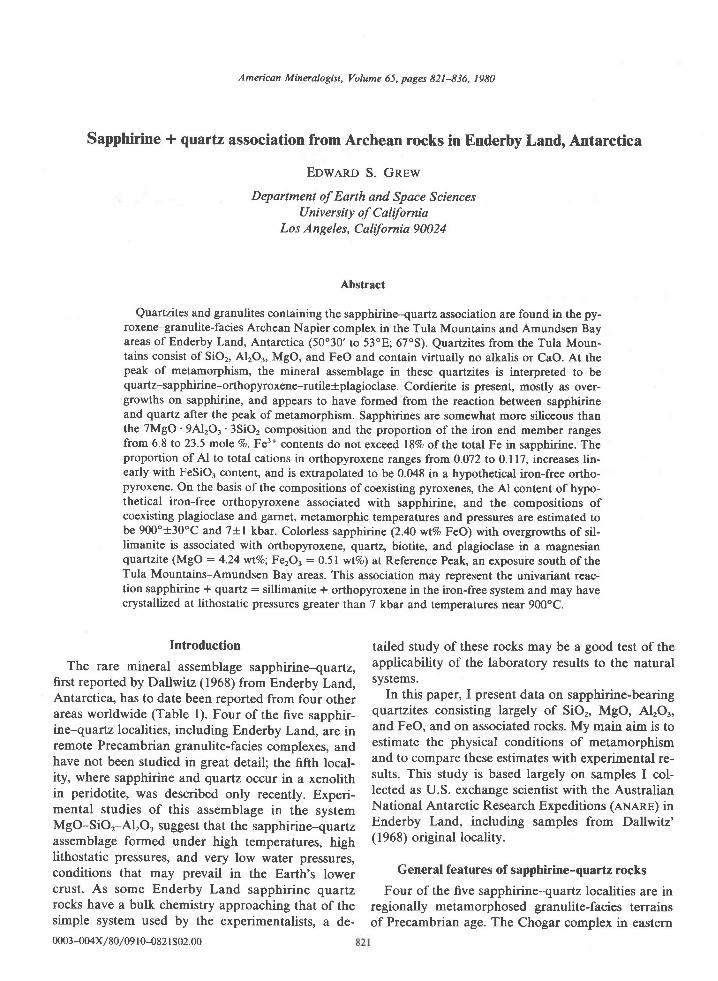
American Mineralogist, Volume 65, pages 821-836, 1980
Sapphirine * quartz association from Archean rocks in Enderby Land, Antarctica
EDwARD S. Gnpw
Department of Earth and Space SciencesU niv er sit y of C alifu rnia
Los Angeles, California 90024
Abstract
Quartzites and granulites containing the sapphirine-quartz association are found in the py-roxene-granulite-facies Archean Napier complex in the Tula Mountains and Amundsen Bayareas of Enderby Land, Antarctica (50'30' to 53'E; 67"5). Quartzites from the Tula Moun-tains consist of SiOr, AlrOr, MgO, and FeO and contain virtually no alkalis or CaO. At thepeak of metamorphism, the mineral assemblage in these quartzites is interpreted to bequartz-sapphirine-orthopyroxene-rutile+plagioclase. Cordierite is present, mostly as over-growths on sapphirine, and appears to have formed from the reaction between sapphirineand quartz after the peak of metamorphism. Sapphirines are somewhat more siliceous thanthe TMgO ' 9AlrO3 . 3SiO, composition and the proportion of the iron end member rangesfrom 6.8 to 23.5 mole Vo. Fe3+ contents do not exceed lSVo of the total Fe in sapphirine. Theproportion of Al to total cations in orthopyroxene ranges from 0.072 to 0.117, increases lin-early with FeSiO3 content, and is extrapolated to be 0.048 in a hypothetical iron-free ortho-pyroxene. On the basis of the compositions of coexisting pyroxenes, the Al content of hypo-thetical iron-free orthopyroxene associated with sapphirine, and the compositions ofcoexisting plagioclase and garnet, metamorphic temperatures and pressures are estimated tobe 900'a30'C and 7+l kbar. Colorless sapphirine (2.40wtVo FeO) with overgrowths of sil-limanite is associated with orthopyroxene, q\aftt, biotite, and plagioclase in a magnesianquartzite (MgO : 4.24 wt%o; Fe2O, : O.5l wtVo) at Reference Peak, an exposuie south of theTula Mountains-Amundsen Bay areas. This association may represent the univariant reac-tion sapphirine + quartz : sillimanite + orthopyroxene in the iron-free system and may havecrystallized at lithostatic pressures greater than 7 kbar and temperatures near 90ooc.
Introduction
The rare mineral assemblage sapphirine-quartz,first reported by Dallwitz (1968) from Enderby Land,Antarctica, has to date been reported from four otherareas worldwide (Table l). Four of the five sapphir-ine-quartz localities, including Enderby Land, are inremote Precambrian granulite-facies complexes, andhave not been studied in great detail; the fifth local-ity, where sapphirine and quartz occur in a xenolithin peridotite, was described only recently. Experi-mental studies of this assemblage in the systemMgO-SiOr-AlrO, suggest that the sapphirine-quartzassemblage formed under high temperatures, highlithostatic pressures, and very low water pressures,conditions that may prevail in the Earth's lowercrust. As some Enderby Land sapphirine-quartzrocks have a bulk chemistry approaching that of thesimple system used by the experimentalists, a de-
tailed study of these rocks may be a good test of theapplicability of the laboratory results to the naturalsystems.
In this paper, I present data on sapphirine-bearingquartzites consisting largely of SiOr, MgO, AlrOr,and FeO, and on associated rocks. My main airn is toestimate the physical conditions of metamorphismand to compare these estimates with experimental re-sults. This study is based largely on samples I col-lected as U.S. exchange scientist with the AustralianNational Antarctic Research Expeditions (axnnn) inEnderby Land, including samples from Dallwitz'( I 968) original locality.
General features of sapphirine-quartz rocks
Four of the five sapphirine-quartz locatties are inregionally metamorphosed granulite-facies terrainsof Precambrian age. The Chogar complex in eastern
0003-004x/80/09 l 0-082 I $02.00
GREIV: SAPPHIRINE + QUARTZ ASSOCIATION
Table L Reported occurrences of sapphirine-quartz associations
L o c a l l t Y
F n ^ 6 r h r r T r h d A n t r n . t l . a
C o r t l a n d t C o n p l e x ,P e e k s k i f l , N e w Y o r k
R e d W i n e M o u n t a i n s - W i l s o n L a k ea r e a , L a b r a d o r
L a b w o r H i 1 1 s , U g a n d a
C h o g a r C o m p l e x , e a s t e r n S i b e r l a
M a l n R e f e r e n c e s
D a l l w l t z ( 1 9 6 8 )G r e w ( 1 9 7 9 a , b )S h e r a t o n e t a 1 . ( l 9 o u )
c a p o r u s c i - a n d M o r s e ( 1 9 7 8 )
L e o n g a n d M o o r e ( 1 9 7 2 )B o u r n e ( 1 9 7 8 )M o r s e a n d T a l t e y ( 1 9 7 1 )
N l x o n e t a l . ( 1 9 7 3 )
K a r s a k o v e t a 1 . ( 1 9 7 5 )
Siberia, USSR (Karsakov et al.,1975), Napier com-plex in Enderby Land (Grew and Manton, 1979;Sheraton et al., 1980), and Watian suite in the Lab-wor Hills, Uganda (Clifford, 1974) were metamor-phosed during the Archean [2500 million years (m.y.)or olderl. By contrast, the Cortlandt complex is Or-dovician (Dallmeyer, 1975). Here sapphirine andquartz occur in a hornfels xenoHth and may haveformed by reaction of the xenoliths with the enclos-ing olivine-rich magma under high oxygen fugacities(Barker, 1964; Caporuscio and Morse, 1978). How-ever, temperature and lithostatic pressure may nothave differed greatly from the granulite-facies condi-tions under which sapphirine and quartz were stabi-lized at the other localities.
The association sillimanite-orthopyroxene is char-acteristic of all the occurrences. It is commonly foundin the same rock as sapphirine and quartz, typicallyas a breakdown product of this assemblage---e.9.,Labrador (Chatterj ee and Schreye r, 197 2), Cortlandtcomplex, New York (Caporuscio and Morse, 1978),and Chogar complex (Karsakov et al., 1975). Theconverse is not true, as sapphirine-quartz is notfound in some sillimanite-orthopyroxene terrains(e.g., Chinner and Sweatman, 1968; Dougan, 1974).In the Strangway Ranges, Australia, sapphirine andquaftz occur in the same rock, but not in direct con-tact (Woodford and Wilson, 1976).
The sapphirine-quartz rocks seem to differ fromaverage metamorphosed pelitic rocks in having ahigher Fe'*/Fe'* ratio or MglFe ratio. High Fe'*/Fe2* ratios for the host rocks from Wilson Lake. Lab-wor Hills, and Cortlandt complex are indicated byrelatively high FerO, contents of 1.2 to 1.7 weightpercent in associated sillimanite (Caporuscio andMorse, 1978; Grew, 1980), high Fe'*/Fe'* ratio insapphirine (Merlino, 1973; Caporuscio and Morse,1978; Sahama et al.,1974), and presence of hematite.There is little evidence for a high Fe'*/Fe'* ratio inthe Chogar complex rocks, as no hematite is reported
by Karsakov et al. (1975} nor is there any evidencefor it in the Napier complex rocks, which haveabove-average Mg/Fe ratios (see below).
Geologicat framework of the sapphirine-quartz rocks
The sapphirine-quartz association is found in theTula Mountains and south to Amundsen Bay inwestern Enderby Land (Fig. l), which is underlainby a Precambrian granulite-facies terrain mapped byKamenev (1972) as the Napier zone. This zone, ormetamorphic complex, is a highly deformed se-quence of gneisses and granulites composed largelyof quartz, feldspar, pyroxene, and garnet. Theserocks can be grouped into four broad types: (l)charnockite and enderbite, (2) pyroxene granulite,(3) garnetiferous rocks, and (4) aluminous and si-liceous rocks (Ravich and Kamenev,1915; Kamenev,1975; Grew, 1978; Sheraton et al., 1980). The sap-phirine-quartz association occurs in the last group ofrocks. These rocks constitute no more than 5 percentof exposed rock and form well-layered sequences ofgranulites, quartzites, and gneisses. Garnet, sillima-nite, biotite, cordierite, spinel (and rare corundum),sapphirine, orthopyroxene, osumilite, and graphiteare characteristic of these sequences.
PetrograPhY
Rocks containing the sapphirine-qtaftz associa-tion range from quartzites with scattered grains ofsapphirine and orthopyroxene to aluminous gran-ulites characterized by complex textures and sym-plectitic intergrowths (see also Dallwitz, 1968; Ellis etal.,1980; Sheraton et al., l98O).
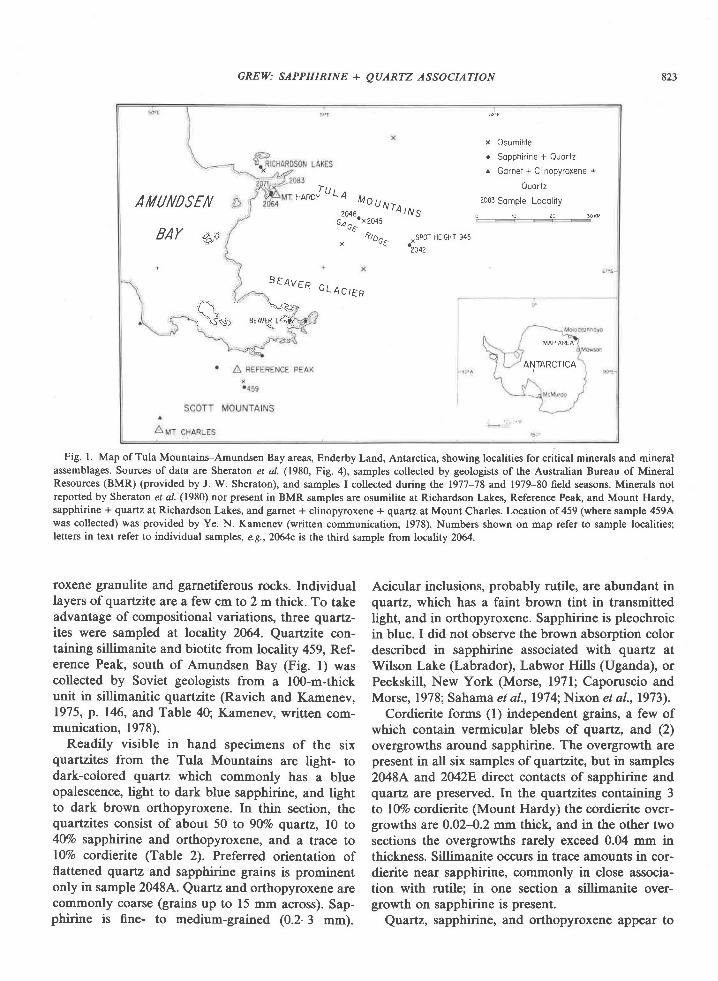
This paper conoerns seven samples of quartzite, sixof which contain sapphirine, orthopyroxene, cordier-ite, rutile, and minor plagioclase, and the seventh sil-limanite and biotite as well (Table 2). Six of thequartzites I collected in January 1978 from four lo-calities in the Tula Mountains: 2064 and 2071 onMount Hardy, 2048 on Gage Ridge , and 2042 atSpot Height 945 (Fig. l). The rocks sampled at 2064and at 2071 appear to be from the same layer offsetby a fault.
Spot Height 945 is Dallwitz' (1968) original local-ity. E[is et al. (1980) describe in detail sapphirine-quartz-osumilite granulites from this locality. J. W.Sheraton and his colleagues discovered the sapphir-ine-quartz association at Mount Hardy and GageRidge and provided me the information needed tofind these localities in the field.
The sapphirine-bearing layers consist of granuliteand quartzite 1.5 to 6 m thick that alternate with py-
GREW: SAPPHIRINE + QUARTZ ASSOCIATION
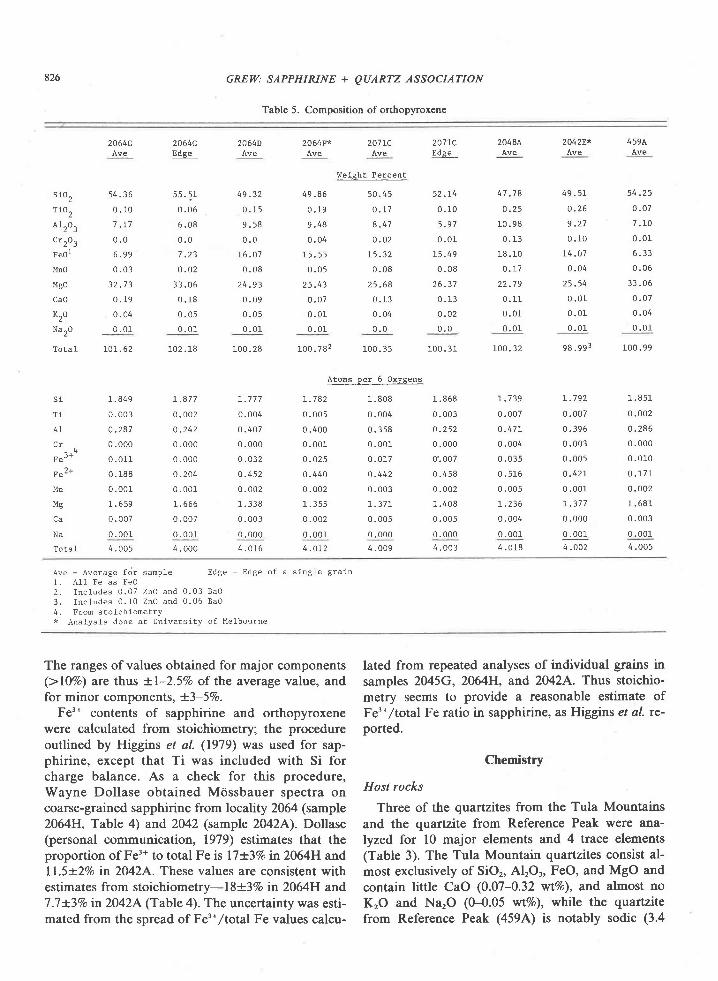
Fig. l. Map of Tula Mountains-Amundsen Bay areas, Enderby Land, Antarctica, showing localities for critical minerals and mineralassemblages. Sources of data are Sheraton et al. (1980, Fig. 4), samples collected by geologists of the Australian Bureau of MineralResources (BMR) (provided by J. W. Sheraton), and samples I collected during the 197'l-78 and 1979-80 field seasons. Minerals notreported by Sheraton et al. (198O) nor present in BMR samples are osumilite at Richardson Lakes, Reference Peak, and Mount Hardy,sapphirine + quartz at Richardson Lakes, and garnet + clinopyroxene + quartz at Mount Charles. Location of459 (where sample 459Awas collected) was provided by Ye. N. Kamenev (written communication, 1978). Numbers shown on map refer to sample localities;letters in text refer to individual samples, e.g., 2064c is the third sample from locality 2064.
823
roxene granulite and garnetiferous rocks. Individuallayers ofquartzite are a few cm to 2 m thick. To takeadvantage of compositional variations, three quaftz-ites were sampled at locality 2064. Quartzite con-taining sillimanite and biotite from locality 459, Ref-erence Peak, south of Amundsen Bay (Fig. l) wascollected by Soviet geologists from a l00-m-thickunit in sillimanitic quartzite (Ravich and Kamenev,1975, p. 146, and Table 40; Kamenev, written com-munication, 1978).
Readily visible in hand specimens of the sixquartzites from the Tula Mountains are light- todark-colored quartz which commonly has a blueopalescence, light to dark blue sapphirine, and tightto dark brown orthopyroxene. In thin section, thequartzites consist of about 5O to 90Vo quartz, l0 to407o sapphirine and orthopyroxene, and a trace tol0%o cordieite (Table 2). Preferred orientation offlattened quartz and sapphirine grains is prominentonly in sample 2048A. Quartz and orthopyroxene arecommonly coarse (grains up to 15 mm across). Sap-phirine is fine- to medium-grained (0.2-3 mm).
Acicular inclusions, probably rutile, are abundant inquartz, which has a faint brown tint in transmittedlight, and in orthopyroxene. Sapphirine is pleochroicin blue. I did not observe the brown absorption colordescribed in sapphirine associated with quartz atWilson Lake (Labrador), Labwor Hills (Uganda), orPeekskill, New York (Morse, l97l; Caporuscio andMorse, 1978; Sahama et a1.,1974; Nixon et al.,1973).
Cordierite forms (l) independent grains, a few ofwhich contain vermicular blebs of quartz, and (2)overgrowths around sapphirine. The overgrowth arepresent in all six samples of quartzite, but in samples2M8A and 20428 direct contacts of sapphirine andquartz are preserved. In the quartzites containing 3to lD%o cordierite (Mount Hardy) the cordierite over-growths arc 0.02-0.2 mm thick, and in the other twosections the overgrowths rarely exceed 0.04 mm inthickness. Sillimanite occurs in trace amounts in cor-dierite near sapphirine, commonly in close associa-tion with rutile: in one section a sillimanite over-growth on sapphirine is present.
Quartz, sapphirine, and orthopyroxene appear to
Al,lUl/0St/1/
?Af ,%,a
,A '' '\,.tt
\\,,uo ur*tgt#
, o *o / ' ( A t , ^ .
, noo ' " u 'N 'A ,N . "a-;
- 'x2045- i n ^
, t 'One
.xsPor HEIGHT 945
2042
52E
x Osumiltte
o Sopphirine + Quortze Gornet + Clinopyroxene +
Quortz2083 Somple Locohly
0 ro 20 aoKM
B E A v p o ^ ._ , , U L A C / E R
MAP AREA
ANTARCTICA
GREIA: SAPPHIRINE + QUARTZ ASSOCIATION
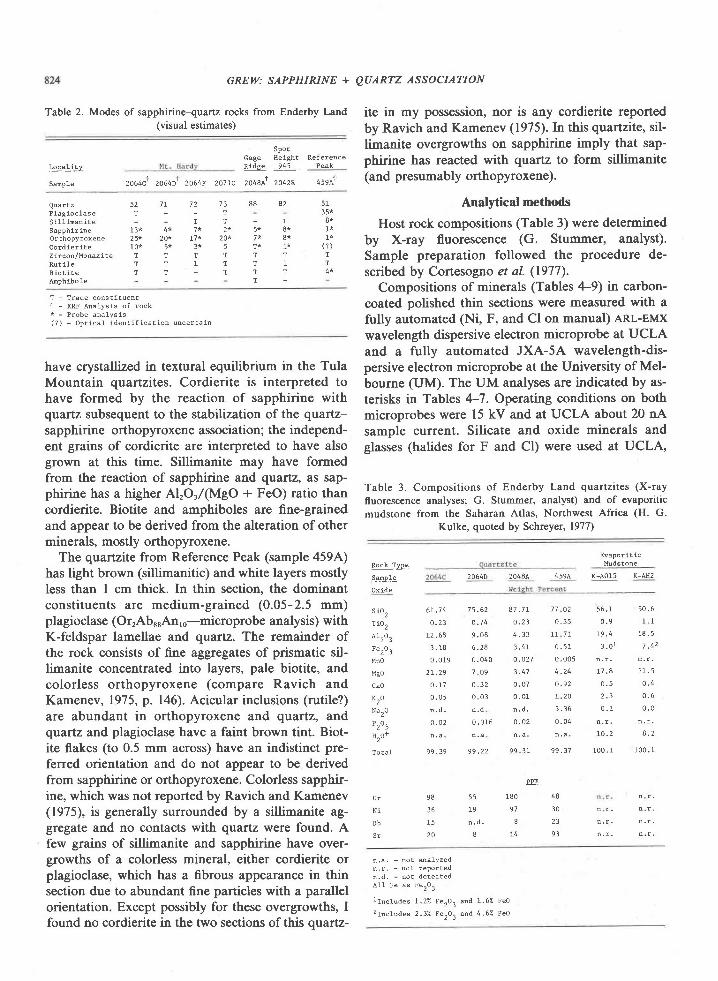
Table 2. Modes of sapphirine-quartz rocks from Enderby Land(visual estimates)
ite in my possession, nor is any cordierite reportedby Ravich and Kamenev (1975). In this quartzite, sil-limanite overgrowths on sapphirine imply that sap-phirine has reacted with quartz to form sillimanite(and presumably orthopyroxene).
Analytical methods
Host rock compositions (Table 3) were determinedby X-ray fluorescence (G. Stummer, analyst).Sample preparation followed the procedure de-scribed by Cortesogno et al. (1977).
Compositions of minerals (Tables 4-9) in carbon-coated polished thin sections were measured with afully automated (Ni, F, and Cl on manual) enr-euxwavelength dispersive electron microprobe at UCLAand a fully automated JXA-5A wavelength-dis-persive electron microprobe at the University of Mel-bourne (UM). The UM analyses are indicated by as-terisks in Tables 4-7. Operating conditions on bothmicroprobes were 15 kV and at UCLA about 20 nAsample current. Silicate and oxide minerals andglasses (halides for F and Cl) were used at UCLA,
Table 3. Compositions of Enderby Land quartzites (X-ray
fluorescence analyses; G. Stummer, analyst) and of evaporitic
mudstone from the Saharan Atlas, Northwest Africa (H. G.
Kulke, quoted by SchreYer, 1977)
Mudstone
K-AOIs K-AH2
S p o lGage HelghtRidge 945
Refe tence
P e a kLoca l i t y
Sanp le 2064C 2064n' 2064F 207rC ZO.,A{ ZO+Z' ,,sgnt
Quartz?lagioclaseSi l l lnaniteSapphir ineOr EhopyroxeneCordier i teZircon/MonaziteRuti leB i o t i t eAnph ibo le
T - T r a c e c o n s t i c u e n t' | - XRF Ana lys ts o f rock* - Probe ana lys is
( ? ) - O p r i c a l i d e n t i f i c a t i o n u n c e r t a i n
have crystallized in textural equilibrium in the TulaMountain quartzites. Cordierite is interpreted tohave formed by the reaction of sapphirine withquartz subsequent to the stabilization of the quartz-sapphirine-orthopyroxene association; the independ-ent grains of cordierite are interpreted to have alsogrown at this time. Sillimanite may have formedfrom the reaction of sapphirine and quartz, as sap-phirine has a higher Al,O,/(MgO + FeO) ratio thancordierite. Biotite and amphiboles are fine-grainedand appear to be derived from the alteration of otherminerals, mostly orthopyroxene.
The quartzite from Reference Peak (sample 459A)has light brown (sillimanitic) and white layers mostlyless than I cm thick. In thin section, the dominantconstituents are medium-grained (0.05-2.5 mm)plagioclase (OrrAb*.An,o-microprobe analysis) withK-feldspar lamellae and quartz. The remainder ofthe rock consists of fine aggregates of prismatic sil-limanite concentrated into layers, pale biotite, andcolorless orthopyroxene (compare Ravich andKamenev, 1975, p. 146). Acicular inclusions (rutile?)are abundant in orthopyroxene and quartz, andqvaftz and plagioclase have a faint brown tint. Biot-ite flakes (to 0.5 mm across) have an indistinct pre-ferred orientation and do not appear to be derivedfrom sapphirine or orthopyroxene. Colorless sapphir-ine, which was not reported by Ravich and Kamenev(1975), is generally surrounded by a sillimanite ag-gregate and no contacts with quartz were found. Afew grains of sillimanite and sapphirine have over-growths of a colorless mineral, either cordierite orplagioclase, which has a fibrous appearance in thinsection due to abundant fine particles with a parallelorientation. Except possibly for these overgrowths, Ifound no cordierite in the two sections of this qvaftz-
35*8*
1*( ? )TT
8 8 A 2
_ T
5* 8*7 * 8 *T* 1*T TT 1T TT _
5 2 7 7 7 2 7 3
T T1 3 * 4 * 7 * 2 *25* 20* 17* 20*10* 5* 3* 5
T T T TT T l T
Rock Tvpe
SampI e
0x ide
s i02
T i02
A1^O-
F e ^ O -
MnO
Mco
CaO
K 2 o
N a 2 0
H^o+
2064D 2048A 459A
T o t a l 9 9 . 3 9
7 5 . 6 2 8 7 , 7 1
o . 7 4 0 . 2 3
9 . 0 8 4 . 3 3
6 . 2 8 3 . 4 7
0 . 0 4 0 0 . 0 2 1
7 0 9 3 . 4 7
o . 3 2 0 . 0 7
0 . 0 3 0 . 0 1
n . d n . d ,
0 . 0 1 6 0 . 0 2
n . a f , . 4 .
o o ? l
5 6 . ) - 5 0 . 6
0 . 9 r . 1
1 9 . 4 1 8 . 5
3 , o l 7 . 4 2
1 7 . 8 2 1 . 5
0 . 5 0 . 4
2 . 3 0 . 6
0 . 1 0 . 0
1 0 . 2 4 . 2
r 0 0 . 1 1 0 0 . 1
n r ,
n . r .
61- .7 4
0 . 2 3
1 2 , 6 8
3 . r 8
0 . 0 1 9
2 7 . 2 9
o . 7 7
0 . 0 5
0 . 0 2
1 7 0 2
0 . 3 5
1 1 7 1
0 . 5 1
0 . 0 0 5
4 . 2 4
o . 9 2
r 2 0
3 . 3 6
0 . 0 4
n . a .
9 9 . 3 7
C r
N i
Rb
S r
9 8
3 6
2 0
PP!
5 5 r 8 0 4 8
1 8 9 7 3 0
n . d . I 2 3
8 1 4 9 3
n . a . - n o t a n a l y z e dn . r . - n o E r e p o r t e dn . d , - n o t d e t e c t e dA11 le as Ie2O3
I I n c l u d e s l . 2 Z l e 2 o 3 a D d l . 6 Z F e o
2 l n c t u d e s 2 . 3 2 F e 2 o 3 a n d 4 . 6 2 F e o
GREW: SAPPHIRINE + QUARTZ ASSOCIATION
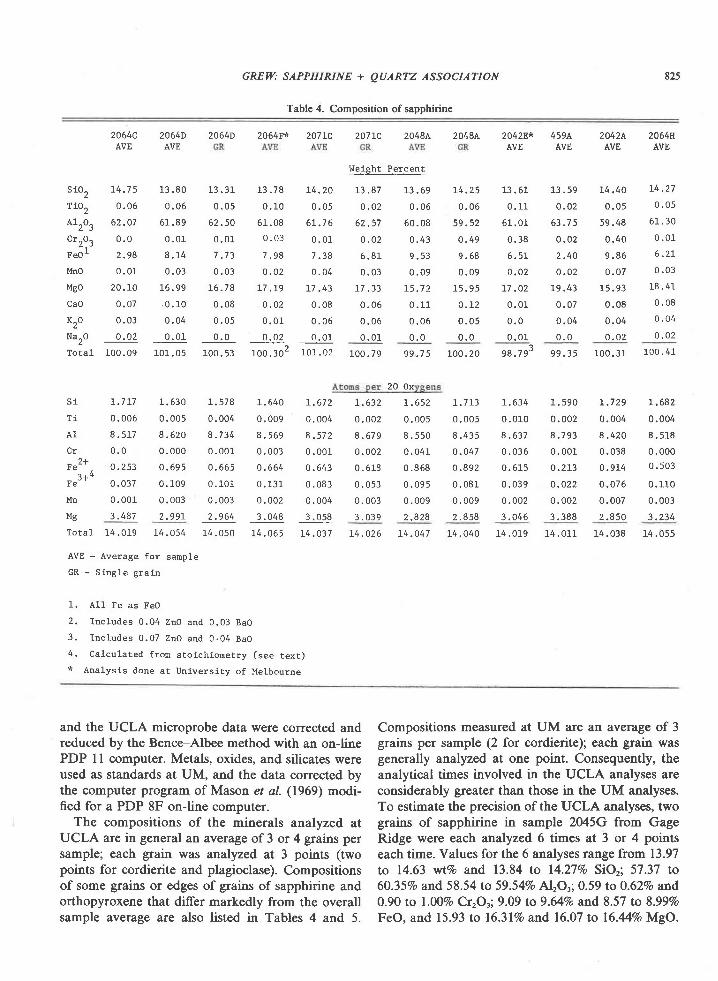
Table 4. Composition of sapphirine
2064c 2064D 2064D 2064F* 207LC 207rC 2048A 2048L 2042F* 459A 2042A 2064H
825
AVE AVE
s102 L4 .75 13 .80
T ro2 0 .06 0 ' 06
A12O3 62.O7 61.89
C r r O . 0 . 0 0 . 0 1
F e o ' 2 . 9 8 8 . 1 4
Mno 0 .01 0 .03
Mgo 20 .10 16 .99
C a O 0 . 0 7 . 0 . 1 0
K 2 o 0 . 0 3 0 ' 0 4
N a " o 0 . 0 2 0 . 0 1
To ta l I 00 .09 101 .05
s l I . 7 t 7 1 . 6 3 0
r i 0 . 0 0 6 0 . 0 0 5
A 1 8 . 5 1 7 8 . 6 2 0
C r 0 . 0 0 . 0 0 0)+
F . - , 0 , 2 5 3 0 . 5 9 5
F .3 * * o .037 o . r . o9
Mn 0 .001 0 .003
Ms 3 .487 2 .99 I
Total 14 .019 14 .054
AVE - Average for sample
GR - Single graln
AVE AVE AVE AVE
L3 . 31 13 . 78 L4 . 20
0 . 0 5 0 . 1 0 0 . 0 5
62 .50 61 .08 6L .76
0 . 0 1 - 0 . 0 3 0 . 0 1
7 . 7 3 7 . 9 8 7 . 3 8
0 . 0 3 0 . 0 2 0 . 0 4
1 6 . 7 8 L 7 . L 9 1 - 7 . 4 3
0 . 0 8 0 . 0 2 0 . 0 8
0 , 0 5 0 . 0 1 0 . 0 5
0 . 0 0 . 0 2 0 . 0 1
roo . 53 1oo .302 1o r . 02
Welght Percent
13 . 87 13 . 69 L4 . 25
0 . 0 2 0 . 0 6 0 . 0 6
6 2 . 5 7 6 0 . 0 8 5 9 . s 2
o . 0 2 0 . 4 3 0 . 4 9
6 . 8 1 9 . 5 3 9 . 6 8
0 . 0 3 0 . 0 9 0 . 0 9
1 7 . 3 3 1 5 . 7 2 1 5 . 9 5
0 . 0 6 0 . 1 1 0 . L 2
0 . 0 6 0 . 0 6 0 . 0 5
0 . 0 1 - 0 . 0 0 . 0
100 . 79 99 . 7 5 100 . 20
20 Ox
1 3 . 6 1 1 - 3 . 5 9
0 . 1 1 0 . 0 2
6 t . 01 63 .75
0 . 3 8 0 . 0 2
5 . 5 1 2 . 4 0
0 , 0 2 0 . 0 2
L7 .OZ 19. t+1
0 .01 . 0 . 07
0 . 0 0 . 0 4
0 . 0 1 0 . 0
98 .79 - 99 .35
r . 6 3 4 1 . 5 9 0
0 . 0 1 0 0 . 0 0 2
8 . 6 3 7 8 . 7 9 3
0 . 0 3 5 0 . 0 0 1
0 , 6 1 5 0 . 2 1 3
0 .039 0 .022
0 .002 0 .002
3 . 0 4 6 3 . 3 8 8
L4 ,0L9 L4 .0L1
14.40 L4.27
0 . 0 5 0 . 0 5
5 9 . 4 8 6 1 . 3 0
0 . 4 0 0 . 0 1
9 . 8 6 6 . 2 L
0 . 0 7 0 . 0 3
1 5 . 9 3 1 8 . 4 1
0 . 0 8 0 . 0 8
0 , 0 4 0 . 0 4
0 . 0 2 0 . 0 2
1 0 0 . 3 1 1 0 0 . 4 1
1 . 5 7 8 1 . 6 4 0 r , 6 7 2
0 . 0 0 4 0 . 0 0 9 0 . 0 0 4
8 . 7 3 4 8 . 5 6 9 8 . 5 7 2
0 . 0 0 r 0 . 0 0 3 0 . 0 0 1
0 . 665 0 . 664 0 . 643
0 . 1 0 1 0 . 1 3 1 0 . 0 8 3
0 . 0 0 3 0 . 0 0 2 0 . 0 0 4
2 . 964 3 . 048 3 . 058
14 . 050 L4 . 065 14 .O37
L . 6 3 2 t . 6 5 2
0 . 0 0 2 0 . 0 0 5
8 . 6 7 9 8 . 5 5 0
0 . 0 0 2 0 . 0 4 1
0 . 6 1 8 0 . 8 6 8
0 . 0 5 3 0 . 0 9 5
0 . 0 0 3 0 . 0 0 9
3 . 0 3 9 2 . 8 2 8
14.026 L4.047
L . 7 2 9 r . 6 8 2
0 .004 0 .004
8 . 4 2 0 8 . 5 1 8
0 ,038 0 .000
0 . 9 1 4 0 . 5 0 3
0 .076 0 .1 -10
0 .007 0 .003
2 . 8 5 0 3 . 2 3 4
L . 7 L 3
0 . 0 0 5
8 , 4 3 5
0 .047
0 .892
0 . 0 8 1
0 . 0 0 9
2 . 8 5 8
14 . 040 14 .038 14 .055
1. AL1 Fe as FeO
2. Inc ludes O.O4 Z tO and 0 .03 BaO
3. Inc ludes O.O7 ZnO and 0 .04 BaO
4. Ca lcu la ted f rom s to lch ionet ry (see tex t )
x Ana lys ls done a t Un ivers i ty o f Me lbourne
and the UCLA microprobe data were corrected andreduced by the Bence-Albee method with an on-linePDP I I computer. Metals, oxides, and silicates wereused as standards at UM, and the data corrected bythe computer program of Mason et al. (1969) modi-fied for a PDP 8F on-line computer.
The compositions of the minerals analyzed atUCLA are in general an average of 3 or 4 grains persample; each grain was analyzed at 3 points (twopoints for cordierite and plagioclase). Compositionsof some grains or edges of grains of sapphirine andorthopyroxene that differ markedly from the overallsample average are also listed in Tables 4 and 5.
Compositions measured at UM are an average of 3grains per sample (2 for cordierite); each grain wasgenerally an.alyzed at one point. Consequently, theanalytical tirnes involved in the UCLA analyses areconsiderably greater than those in the UM analyses.To estimate the precision of the UCLA analyses, twograins of sapphirine in sample 2M5G from GageRidge were eac}n analyzed 6 times at 3 or 4 pointseach time. Values for the 6 analyses range from 13.97to 14.63 'r,tt%o Lnd 13.84 to l4.27Vo SiOr; 57.37 to6O.357o and 58.54 to 59.54Vo Al'O,;0.59 to O.62Vo and0.90 to l.ODVo Cr,Or; 9.09 to 9.64Vo and 8.57 to 8.99VoFeO, and 15.93 to 16.3l%o and 16.07 to 16.44%o MgO.
826 GRETI: SAPPHIRINE + QUARTZ ASSOCIATION
Table 5. Composition of orthopyroxene
s 10^
A1^O"z )
C r ^ O "
FeoI
MnO
Mgo
CaO
K^0
Naro
Tota l
s i
T 1
C r
F"2+
Mn
Mg
Na
To ta l
2064cAve
l 4 - J b
0 . 1 0
7 . r 7
0 . 0
6 . 9 9
0 . 0 3
32 .73
0 . 1 9
0 . 0 4
0 . 01
toL.62
1 . 8 4 9
0 . 0 0 3
0 .287
0 .000
0 . 01 r
0 . 1 8 8
0 . 001
r . 6 5 9
0 . 0 0 7
0 . 0 0 1
4 . 005
2064cEdge
5 5 . 5 1
0 . 0 6
6 . 0 8
0 . 0
7 . 2 3
o . o 233 .060 . 1 8
0 . 0 5
0 . 01
102 . 18
L . 8 7 7
0 . 002
o . 2 4 2
0 . 000
0 . 000
o . 2 0 4
0 . 001
r . o o o
0 . 007
0 . 0 0 1
4 . 000
2064DAve
49 .32
0 . 1 5
9 . 58
0 . 0
16 . 07
0 . 0 8
2 4 . 9 3
0 . 09
0 . 05
0 . 0 1
100 .28
r . 7 7 7
0 .004
o . 4 0 7
0 . 000
0 , 0 3 2
o . 4 5 2
0 . 0 0 2
1 . 3 3 8
0 . 0 0 3
0 , 0004 . 0 1 6
4 9 . 8 6
0 . 1 9
9 . 4 8
0 . 0 4
1 5 . 5 5
0 . 0 5
25.43
0 . 0 7
0 . 0 1
0 , 0 1
LOO.782
1 . 7 8 2
0 . 005
0 . 400
0 . 0 0 1
0 . 0 2 5
0 . 4 4 0
0 . 002
1 . 3 5 5
0 . 002
0 . 00 r4 .0L2
5 0 . 4 5
0 . 1 7
I . 4 7
o . o 2
L5 .32
0 . 0 8
z ) . o o
0 . 1 3
0 . 0 4
0 . 0
100 .35
1 . 808
0 . 004
0 . 3 5 8
0 . 001
0 . 0 1 7
0 . 4 4 2
0 . 003
I . 3 7 1
0 . 0 0 5
0 , 0004 . 009
207Lc
52.t4
0 .1 .0
5 . 9 7
0 . 0 1
15 .49
0 . 0 8
26 .37
0 . 1 3
0 . 0 2
0 . 0
100 . 31
r . 858
0 . 0 0 3
0 . 2 5 2
0 . 000
0'.007
0 . 4 5 8
0 . 002
1 . 408
0 . 005
0 . 0004 . 003
2048AAve
4 7 . 1 8
o . 2 5
10 . 98
0 . 1 3
1 8 . 1 0
0 . 1 7
2 2 . 7 9
0 . 1 1
0 . 0 1
0 . 0 1
100 .32
r . 1 3 9
0 . 007
o . 4 7 7
0 . 0 0 4
0 . 0 3 5
0 . 5 1 6
0 . 0 0 5
1 .236
0 . 004
0 . 0014 . 018
2042E*Ave
49 .5L
o . 2 6
9 . 2 7
0 . 10
L4.O7
0 . 04
25.54
0 , 01
0 . 0 1
0 . 0 1
9 8 . 9 9 3
L . 7 9 2
0 . 007
0 . 396
0 . 003
0 . 00s
0 .42L
0 . 00 r
r . 3 7 7
0 . 000
0 . 0014 .o02
459AAve
54 .25
0 . 07
7 . 1 0
0 . 0 1
6 . 3 3
0 . 0 5
33 . 06
0 . 0 7
0 . 04
0 . 0 1
100 .99
1 . 85 r
0 . 002
0 . 2 8 6
0 . 000
0 . 010
0 . 1 7 1
0 .002
1 . 681
0 . 003
0 . 00 r4 . 0 0 5
2064F* 207LC
Ave Ave
lJelght Percent
Atons per 6 oxygens
A v e - A v e r a g e f o r s a n p l e
1 . A 1 1 F e a s F e O
E d g e - E d g e o f a s i n g l e g r a a n
2 . I n c l u d e s 0 . 0 7 Z n O a n d 0 . 0 3 B a O
3 . I n c l u d e s 0 . 1 0 Z n O a n d 0 . 0 6 B a O
4 . F r o m s t o i c h i o m e t r y* A n a l y s i s d o n e a t U n i v e r s i t y o f l 4 e l b o u r n e
The ranges of values obtained for major components(>lOVo) are thus +1-2.5Vo of the average value, andfor minor components, !3-5Vo.
Fe'* contents of sapphirine and orthopyroxenewere calculated from stoichiometry; the procedureoutlined by Higgins et al. (1979) was used for sap-phirine, except that Ti was included with Si forcharge balance. As a check for this procedure,Wayne Dollase obtained Mdssbauer spectra oncoarse-grained sapphirine from locality 2064 (sample2064H, Table 4) and 2042 (sample 2042A). Dollase(personal communication, 1979) estimates that theproportion of Fe3* to total Fe is 17 +3vo in 2064H andll.5-r2Eo in 2042A. These values are consistent withestimates from stoichiometry-l8i3%o in 2064H and7 ;l +3Vo in2O42A (Table 4). The uncertainty was esti-mated from the spread of Fe'*/total Fe values calcu-
lated from repeated analyses of individual grains insamples 2045G, 2064H, and 2042A. Thus stoichio-metry seems to provide a reasonable estimate ofFe'*,/total Fe ratio in sapphirine, as Higgins et al. rc-ported.
Chemistry
Host rocks
Three of the quartzites from the Tula Mountains
and the quartzite from Reference Peak were ana-lyzed for l0 major elements and 4 trace elements(Table 3). The Tula Mountain quartzites consist al-most exclusively of SiO2, Al2O3, FeO, and MgO and
contain little CaO (0.07-0.32 wt%o), and almost no
KrO and NarO (0-0.05 wt%o), while the quartzite
from Reference Peak (459A) is notably sodic (3.4
GR.EW: SAPPHIRINE + QUARTZ ASSOCIATION 827
2064c*
sio2 49.52
T i02 0 .02
A12O3 33 ,73
Cr ZO3 O .02
FeO 0 .95
MnO 0.03
MgO 12.83
CaO 0 .01
K20 0 .01
NarO 0 ,04
ZnO 0.09
BaO 0 .02
To la l 97 .24
Table 6. Composition of cordierite (Schreyer, 1977), or pelitic rocks that have lost alkalis
by removal of an anatectic melt (Nixon et al., 1973;
Lal et al., 1978).Schreyer's (1977) suggestion se€ms to be the most
r€asonable for the Endelby Land s'apphirine-quartzrocks. Analyses of two evaporitic mudstones from
northwest Africa (cited by Schreyer, 1977) are listed
in Table 3 for comparison. The similarity in compo-
sition between these sedimentary rocks and the sap-phirine-quartz rocks suggests that metasomatism or
removal of anatectic melt need not be invoked to ex-plain the'composition of the magnesian pelitic rocks;
sedimentary rocks of similar composition may very
well have existed.
Table 7. Composition of biotite in Sample 459A
2064D 2064F* 2048A
Weight Percent
49 .53
0 . 0 1
33 .64
0 . 0
1 . 3 7
0 . 0 4
1 1 . 5 6
0 . 0 9
0 . 0 5
0 . 1 6
2042E*
49 .93
0 . 03
3 3 . 2 9
0 . 0 4
2 . r 5
0 . 0 1
1 2 . 0 r
0 . 0
o . 0 2
0 , 03
0 . 1 6
0 . 0
50 . 93
0 . 0
3 4 . 2 5
0 . 0 2
2 . 6 2
0 . 0 3
L 2 . 2 4
0 . 0 8
0 . 0 5
0 . 0 3
50 .27
0 . 0 2
3 3 . r 5
0 . 0 1
2 , 5 3
0 . 0 4
12 . 05
0 . 0 1
0 . 01
0 . o 2
0 . 0 9
0 . 0 1
100 .23 98 .20 98 .45 97 . 65
4 L . 6 5
3 . 3 6
L 3 . 1 4
1 . 9 6
0 . 0 2
2 5 . 0 8
0 . 0 7
r o . 4 4
0 . 1 2
o . 2 5
3 . 9 8
0 . o 7
9 9 . O 4
G r a i n
1
4 2 . O 4
2 . 9 6
1 4 . 0 5
r . 7 9
0 . 0 2
2 5 . 3 2
0 . 0 6
1 0 . 4 5
0 . 1 4
0 . 2 2
4 . 1 2
0 . 0 7
9 9 . 4 8
G r a i n2
4 0 . 9 2
3 , 6 7
1 3 . 4 1
2 . 1 6
0 . 0 3
2 4 . 6 6
0 . 0 8
1 0 . 3 3
0 . 1 0
o . 2 9
3 . 1 7
0 . 0 8
9 t . 9 0
Atoms per 18 Oxygens
s i 4 . 9 8 7 5 . 0 0 9 5 . 0 4 6
T i 0 . 0 0 2 0 . 0 0 0 0 . 0 0 2
4 1 4 . 0 0 5 3 . 9 7 L 3 . 9 2 2
c r 0 .001 0 .001 0 .000
F e 0 . 0 8 0 0 . 2 1 5 O . 2 I 2
Mn 0 .002 0 .002 0 .003
M g L . 9 2 6 L , 7 9 3 1 . 8 0 3
C a 0 . 0 0 1 0 . 0 0 8 0 . 0 0 1
K 0 .001 0 .006 0 .00 r
Na 0 .007 0 .005 0 .004
To ta l 11 .012 11 .010 10 .994
W e i g h t P e r c e n t4 . 983 5 . 033
0 . 0 0 1 0 . 0 0 2
3 . 9 8 9 3 . 9 5 6
0 . 0 0 0 0 . 0 0 3
0 . 2 8 3 0 . 1 8 1
0 .003 0 .000
r . 7 3 3 1 . 8 0 4
0 . 0 1 0 0 . 0 0 0
0 . 0 0 6 0 . 0 0 2
0 . 0 3 2 0 . 0 0 6
1 l . 0 4 1 1 0 . 9 8 8
sio2
Tio2
Ar 203F e O
MnO
14gO
C a o
K2o
N a 2 O
B a O
F
c1
T o t a l lA11 Fe as Feo.
* Ana lys is done a t the Un ivers i ty o f Me lbourne.
wt%o\ and contains significant KrO and CaO. All fourquartzites are magnesian (Niggli mg ranges from0.67 to 0.95).
The high Mg/Fe ratios, near absence of alkalisand of CaO in six quartzites, and high Na/K ratio inthe seventh quartzite distinguishes these rocks fromcommon sedimentary rocks, and from most igneousrocks. Examples of metamorphic rocks with similarcompositions are a talc-yoderite schist (McKie,1959), whiteschists (Schreyer, 1977), and, sillimanite-orthopyroxene rocks (Chinner and Sweatman, 1968;Karsakov et al., 1915), Protoliths suggested for thesehigh Mg rocks low in alkalis are bentonitic sediments(McKie, 1959; Chinner and Sweatman, 1968), mag-nesian mudstones associated with evapori tes
l C o r r e c t e d f o r o x y g e n e q u l v a l e n t s o f h a l o g e n s
A11 Fe as FeO.
B a s e d o n 4 4 A n i o n i c C h a r g e s
F o s t e r . 1 9 6 0
S iT V
A 1 -
T o t a l. . V I
T i
F e
Mn
T o t a l
C a
K
N a
B a
T o t a l
5 . 7 7 6
2 . 2 2 4
8 . 000
0 .o22
0 . 350
0 .228
0 . 0 0 2
5 . 1 8 5
5 . 7 8 7
0 . 0 1 1
1 . 8 4 8
0 . 0 3 2
0 . 013
1 . 9 0 4
5 . 7 9 5
2 . 2 0 5
8 . 000
0 . 0 7 9
0 . 307
0 .207
0 . 002
5 . 203
s . 7 9 8
0 . 009
1 . 8 3 8
0 . 0 3 7
0 . 0 1 2
1 . 8 9 6
5 . 7 5 0
2 . 2 2 2
7 . 9 7 2
0 . 000
0 . 388
0 . 2 5 4
0 . 003
5 . 1 6 7
5 .8 r2
0 . 012
1 . 852
0 . 028
0 . 016
1 . 908
GREW: SAPPHIRINE + QUARTZ ASSOCIAT:ION
Sapphirine
Sapphirine analyzed in this study consists largelyof MgO, SiO2, Al2O3, and FeO; CrrO, is present inamounts greater than O.lVo in a few samples (Table4). Values obtained on other oxides range from 0 to0.l2Vo, but only the values for MnO and TiO, are be-lieved to be significant (cf. Higglrlrs et al., 1979).
Tula Mountain and Reference Peak sapphirinescontain little ferric iron (0.02-0.13 Fer* per 20 oxy-gens, or no more than l8Vo of total Fe) by com-parison with the Wilson Lake and Peekskill sapphir-ines, which contain 0.47 and 0.65 Fe3* per 20 oxygenor l-MVo of all the iron present (Higgins et al.,1979;Caporuscio and Morse, 1978).
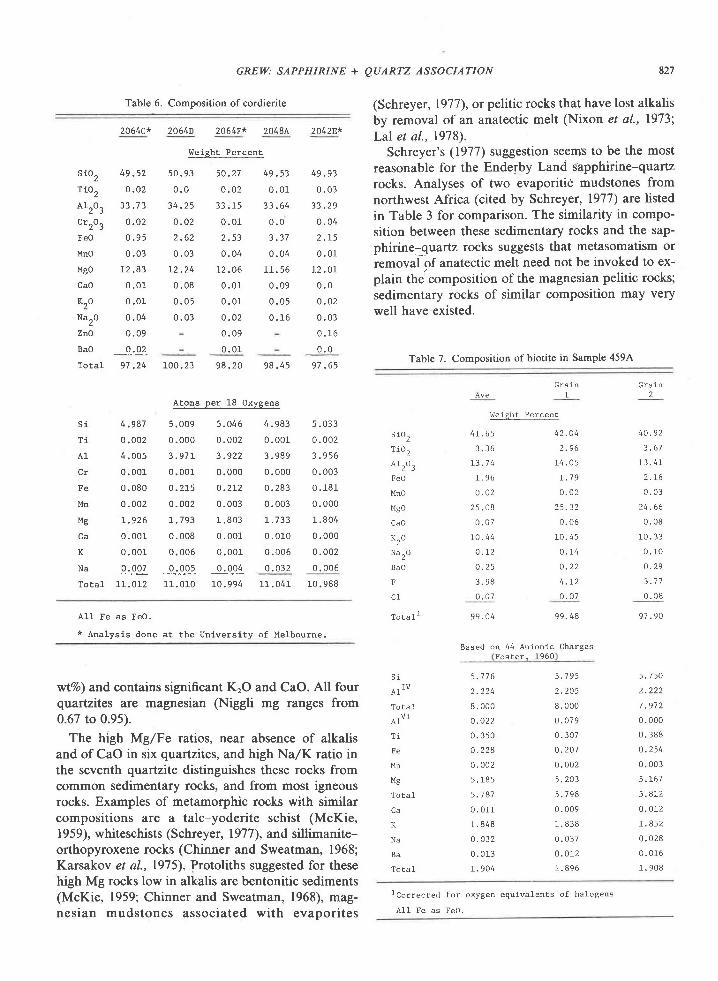
Except for samples 2064C and 4594, the relativeproportions of Si + Ti, Al * Cr f Fe'*, and Fe'* +Mg * Mn are nearly the same. The spread shown inFigure 2 of compositions for the five sapphirines isless than that for six repeated analyses of individualsapphirine grains in sample 2045G. Sapphirine insample 2064C is significantly more siliceous, and thatin sample 459,4, more aluminous, than the average ofthe other 5 sapphirines. The high Al content of sap-phirine in sample 459,4. may be related to its associa-tion with sillimanite.
Sapphirine in a given sample is relatively homoge-neous with respect to Mg/Fe ratio, and zoning wasnot detected. However, in some samples the composi-tion of one of the analyzed grains differs markedlyfrom the others in AVSi ratio (Table 4). The differ-ences appear to follow the substitution scheme Mg *Si : 2Al (Fig. 2) characteristic of many sapphirines(Schreyer and Abraham, 1975). CrrO, contents vary
sio2+Tio2 SAPPHIRINE C0MP0S|T|0N (mole 7,)
o 2064C + 20484I 2064D x2042Ev 2064F o 459Ar. 2071C er 100Mg/Mg*Fez+
Fig. 2. Composition of sapphirine from Enderby Land. Fe3*contents calculated from stoichiometry (Higgins et al.,1979\.
from grain to grain in some samples, e.9.,0.2 to 0.5wt%o in 2048A.
Orthopyroxene
By comparison with the metamorphic ortho-pyroxenes listed by Deer et al. (1978, p. 4147), theEnderby Land orthopyroxenes on the average con-tain more AlrO, (7-l I vrt%o) and less CaO (0.1-0.2Vo)and TiO, (0.1-0.3Vo\.
Orthopyroxene is homogeneous with respect toFe/Mg ratio in a given sample. In a few 5amples,grains are zoned in AlrO, content, which decreasesfrom core to edge (e.g.,2064C and2O7lC, Table 5); asimilar variation is reported by Chinner and Sweat-man (1968) in orthopyroxene associated with sillima-nite.
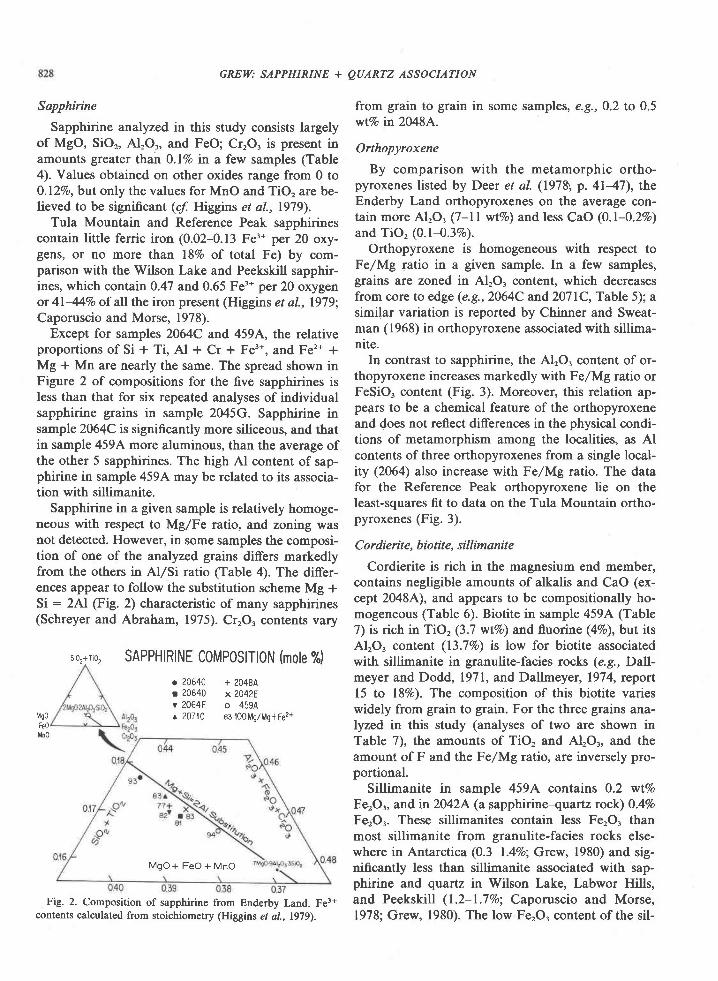
In contrast to sapphirine, the AlrO. content of or-thopyroxene increases markedly with Fe/Mg ratio orFeSiO, content (Fig. 3). Moreover, this relation ap-peArs to be a chemical t'eature of the orthopyroxeneand does not reflect differences in the physical condi-tions of metamorphism among the localities, as Alcontents of three orthopyroxenes from a single local-ity (206$ also increase with FelMg ratio. The datafor the Reference Peak orthopyroxene lie on theleast-squares fit to data on the Tula Mountain ortho-pyroxenes (Fig. 3).
C ordierite, bio tite, sillimanit e
Cordierite is rich in the magnesium end member,contains negligible amounts of alkalis and CaO (ex-cept 2048A), and appears to be compositionally ho-mogeneous (Table 6). Biotite in sample 459A (Table7) is rich in TiO, (3.7 wtVo) and fluorine (4%o),but itsAlrO. content (l3.7%o) is low for biotite associatedwith sillimanite in granulite-facies rocks (e.g., DalT-meyer and Dodd, 1971, and Dallrneyer, 1974, report15 to l8%o). The composition of this biotite varieswidely from grain to grain. For the three grains ana-lyzed in this study (analyses of two are shown inTable 7), the amounts of TiO, and Al2O3, and theamount of F and the FelMg ratio, are inversely pro-portional.
Sillimanite in sample 459,4' contains 0.2 wt%oFerOr, and in 2042A (a sapphirine-quartz rock) O.4VoFerOr. These sillimanites contain less FerO, thanmost sillimanite from granulite-facies rocks else-where in Antarctica (O.3-l.4Vo; Grew, 1980) and sig-nificantly less than sillimanite associated with sap-phirine and quartz in Wilson Lake, Labwor Hills,and Peekskill (1.2-l.7Eo; Caporuscio and Morse,1978; Grew, 1980). The low FerO, content of the sil-
MgoFe0Mn0
MgO+ FeO + MnO
GREW: SAPPHIRINE + QUARTZ ASSOCIATION 829
ldztilxot rtroTl-troazIkO
(
a
204842064F
0048 ASSEMBLAGEO SAP+OPX+QTZ (+ CORD)^ SAP+OPX+SIL+BIO+OTZ
01 02Fez+/ Fez+ * M goar Hop.,,RoxEN E
03
Fig. 3. Proportion ofAl to all cations in orthopyroxene (Al/allcations) associated with sapphirine as a function ofFe2*/(Fe2* + Mg)
ratio. Average composition of orthopyroxene (exclusive of edges of grains) indicated by symbol. Approximate range in a given sample
indicated by spread of values obtained on individual grains (generally 3 to 4 per sample). Line is a least squares fit of the average Al
contents in the 6 orthopyroxenes from quartzites (sample 459,4 not included).
limanite is consistent with the low Fe3*,/total Fe ratioestimated for the associated sapphirine.
Chemical relations among the minerals
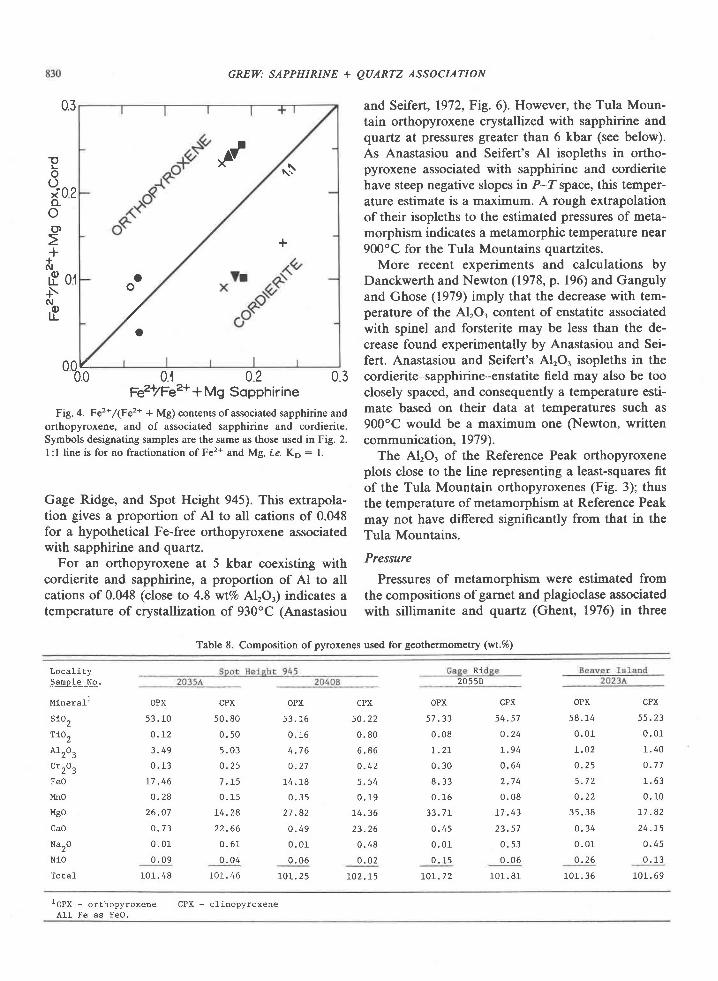
Data on Fe and Mg contents of coexisting sapphi-rine, cordierite, and orthopyroxene are summarizedin Figure 4. The proportion of the iron end members,Xr., increases sympathetically in each of the mineralsand with FelMg ratio in the host rock composition(Table 3). Moreover, X.. is greatest in orthopyroxeneand least in cordierite, a trend that is true for manyparageneses (e.9., Hensen,l97l; Higgins et al.,1979).The regular trends and chemical homogeneity ofthese minerals imply thaf sapphirine and ortho-pyroxene crystallized in equilibrium with respect toFe and Mg and that formation of cordierite also in-volved equilibration of Fe and Mg.
The proportion of Fe3* to total Fe appears to belower in orthopyroxene than in associated sapphi-rine, a relation also reported by Caporuscio andMorse (1978).
Physical conditions of metamorphism
Temperature
Temperatures at the peak of metamorphism, dur-ing which sapphirine + quartz was stable, were esti-mated from the compositions of coexisting pyroxenes
in associated mafic and ultramafic rocks, and from
the Al content of orthopyroxene in the Tula Moun-
tain quartzites.Four pairs of coexisting pyroxenes from Beaver Is-
land (Amundsen Bay), Gage Ridge, and Spot Height
945 were analyzed (Table 8). Estimated temperatures
range from 840-890"C from Wells' (1977) equation 5
and 890-l000oC from Wood and Banno's (1973)
equation 27. These values are minimums, as both py-
roxenes in each sample have exsolved lamellae of the
other pyroxene.Anastasiou and Seifert (1972) determined the
AlrO, contents of orthopyroxene coexisting with cor-
dierite and sapphirine in the system MgO-AlrOr-
SiO, at 900o and 1000'C at 5 kbar. In order to apply
their experimental data to the Tula Mountainsquartzite, we must first try to correct for the effect of
Fe'* on the Al content of orthopyroxene in the natu-
ral assemblages and then extrapolate Anastasiou and
Seifert's Al isopleths to the stability field of sapphir-
ine * quartz.The measured values of A1 in orthopyroxenes of
varying Fe/Mg ratios have been used to estimate the
Al content of a hypothetical Fe-free orthopyroxene
by extrapolation of a least-squares fit to Al contents
as a function of FelMg ratios (Fig. 3). It is assumed
that the temperature of crystallization did not differgreatly among the three localities (Mount Hardy,
oo
o
+f
+
$
GREW: SAPPHIRINE + QUARTZ ASSOCIATION
0.3
!L
ai0?ooo
++N
rfl ot+\N
I
00d60.'l 0.2 0.3
Fe*/Fea+ + Mg Sopphirine
FiE. 4. Fez* /(Fe2* + Mg; contents of associated sapphirine andorthopyroxene, and of associated sapphirine and cordierite.Symbols designating samples are the same as those used in Fig. 2.I :l line is for no fractionation of Fe2* and Mg, r'.e. Ko : 1.
Gage Ridge, and Spot Height 945). This extrapola-tion gives a proportion of Al to all cations of 0.048for a hypothetical Fe-free orthopyroxene associatedwith sapphirine and quartz.
For an orthopyroxene at 5 kbar coexisting withcordierite and sapphirine, a proportion of Al to allcations of 0.048 (close to 4.8 wt%o AlrOr) indicates atemperature of crystallization of 930'C (Anastasiou
and Seifert, 1972, Fig.6). However, the Tula Moun-tain orthopyroxene crystallized with sapphirine andquafiz at pressures greater than 6 kbar (see below).As Anastasiou and Seifert's Al isopleths in ortho-pyroxene associated with sapphirine and cordieritehave steep negative slopes in P-Z space, this temper-ature estimate is a maximum. A rough extrapolationof their isopleths to the estimated pressures of meta-morphism indicates a metamorphic temperature near900oC for the Tula Mountains quartzites.
More recent experiments and calculations byDanckwerth and Newton (1978, p. 196) and Gangulyand Ghose (1979) imply that the decrease with tem-perature of the AlrO, content of enstatite associatedwith spinel and forsterite may be less than the de-crease found experimentally by Anastasiou and Sei-fert. Anastasiou and Seifert's AlrO, isopleths in thecordierite-sapphirine-enstatite field may also be tooclosely spaced, and consequently a temperature esti-mate based on their data at temperatures such as900"C would be a maximum one (Newton, writtencommunication, 1979).
The AlrO, of the Reference Peak orthopyroxeneplots close to the line representing a least-squares fitof the Tula Mountain orthopyroxenes (Fig. 3); thusthe temperature of metamorphism at Reference Peakmay not have differed significantly from that in theTula Mountains.
Pressure
Pressures of metamorphism were estimated fromthe compositions of garnet and plagioclase associatedwith sillimanite and qvartz (Ghent, 1976) in three
Table 8. Composition of pyroxenes used for geothermometry (wt.7o)
Loca l iEySample No.
Minerall
sto2
Tio2
A1203
Cr2O3
FeO
MnO
Mco
Ca0
Na2O
Nio
Total
Ri205 5B
oPx
53 . 10
o . L 2
3 . 4 9
0 . 1 3
r t . c o
Q . 2 8
2 6 . 0 7
0 . 7 3
0 . 0 1
0 . 0 9
101 . 48
cPx
50 . 80
0 . s 0
5 . 0 3
0 . 2 5
0 . 15
14 .28
2 2 . 6 6
0 . 6 r
0 . 0 4
70L.46
0Px
) J . 1 0
0 . 16
4 . 7 6
o . 2 7
1 4 . 1 8
0 . 3 s
2 7 . 8 2
0 . 4 9
0 . 0 1
0 . 0 6
101 . 25
cPx
5 0 . 2 2
0 . 8 0
6 . 8 6
0 . 4 2
5 . 5 4
0 . 1 9
t 4 . 3 6
23 .26
0 . 4 8
o . o 2
r02 . 15
OPX
5 7 . 3 3
0 . 0 8
L . 2 L
0 . 3 0
8 . 3 3
0 . 1 6
33 .7 L
0 . 4 5
0 , 0 1
0 . 1 5
LOr.7 2
CPX
5 4 . 5 7
o . 2 4
L . 9 4
0 . 6 4
2 . 7 4
0 . 08
L 7 . 4 3
23 .57
0 . 5 3
0 . 0 6
101 . 81
OPX
58 . 14
0 . 0 l
L . O 2
o . 2 5
5 , 7 2
0 . 2 2
0 . 3 4
0 . 0 1
o . 2 5
101 . 36
cPx
55 .23
0 . 0 1
1 . 4 0
o . 7 7
1 . 6 3
0 . 10
L 7 . 8 2
z 4 . L )
0 . 4 5
0 . 1 3
101 . 69
CPX - c l inopyroxeneI _ - - -' u rx - o r tnopyroxeneAl1 Fe as FeO.
GREW: SAPPHIRINE + QUARTZ ASSOCIATION
Gt+5
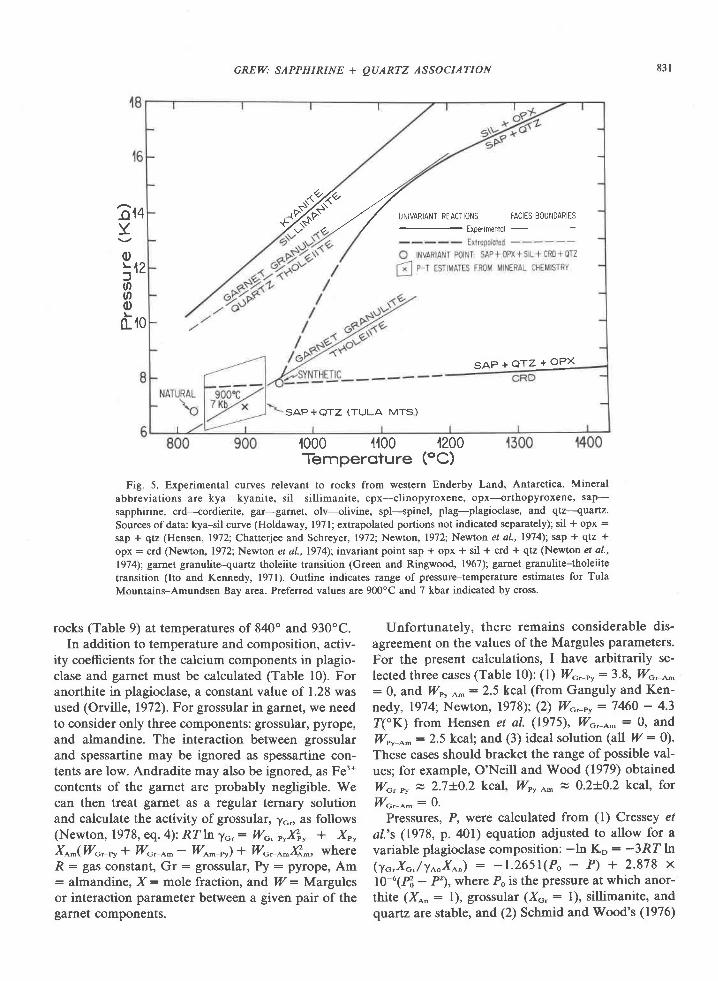
,1000 ,1,100 ,1200Temperoture (oC)
Fig. 5. Experimental curves relevant to rocks from western Enderby Land, Antarctica. Mineral
abbreviations are kya-kyanite, sil-sillimanite, cpx--clinopyroxene, opx-orthopyroxene, sap-
sapphirine, crd----cordierite, gar-garnet, olv----olivine, spl-spinel, plag-plagioclase, and qtz--nuaftz.
Sources ofdata: kya-sil curve (Holdaway, l97l; extrapolated portions not indicated separately); sil + opx :
sap + qtz (Hensen, 1912; Chatterjee and Schreyer, 1972; Newton, 1972; Newton et al., 1974); sap + qtz +
opx: crd (Newton, 1972; Newton et al., 1974); invariant point sap + opx + sil + crd + qtz (Newton er 4/.,
1974); garnet granulite-quartz tholeiite transition (Green and Ringwood, 1967); garnet granulite-thol€iite
transition (Ito and Kennedy, l97l). Outline indicates range of pressure-temperature estimates for Tula
Mountains-Amundsen Bay area. Preferred values are 900oC and 7 kbar indicated by cross.
831
o\42aaodm
rocks (Table 9) at temperatures of 840" and 930"C.In addition to temperature and composition, activ-
ity coefficients for the calcium components in plagio-clase and garnet must be calculated (Table l0). Foranorthite in plagioclase, a constant value of 1.28 wasused (Orville, 1972). For grossular in garnet, we needto consider only three components: grossular, pyrope,and almandine. The interaction between grossularand spessartine may be ignored as spessartine con-tents are low. Andradite may also be ignored, as Fe3*contents of the garnet are probably negligible. Wecan then treat garnet as a regular ternary solutionand calculate the activity of grossular, yc. ts follows(Newton, 1978, eq. 4): RIln y.,,: Wo, *Kr, + Xp,X^^(Wo, e, r
'lV'o, t^- We^ n) r Wo,_o^.(-, where
R - gas constant, Q1 : grossular, Py : pyrope, Am: almandina, X: mole fraction, and 7/: Margulesor interaction parameter between a given pair of thegarnet components.
Unfortunately, there remains considerable dis-agreement on the values of the Margules parameters.For the present calculations, I have arbitrarily se-lected three cases (Table l0): (l) W* ,":3.8, Wo, ̂ ^: 0, and Wr, o^:2.5 kcal (from Ganguly and Ken-nedy, 1974; Newton, 1978); (2) W<:, py : 7460 - 4.3f('K) from Henset et al. (1975), Wo*o^: 0' andW," o^ : 2.5 kcal; and (3) ideal solution (all W : 0).These cases should bracket the range ofpossible val-ues; for example, O'Neill and Wood (1979) obtainedWo, r, * 2.7+0.2 kcal, Wr, e- = 0.2+0.2 kcal, forW* n^ : O.
Pressures, P, were calculated from (l) Cressey etal.'s (1978, p. aOl) equation adjusted to allow for avariable plagioclase composition: -ln Ko : -3RT ln(yo,xo,/fo"xo") : -1.2651(Po - P) + 2.878 xrc-"(n - l2), where Po is the pressure at which anor-thite (X"" : l), grossular (Xo,: l), sillimanite, andquartz are stable, and (2) Schmid and Wood's (1976)
'?ll"''*"' FAcTES BouNDARTES
S A P + Q T 7 + O P X
SAP+OTZ (TULA MTS)
Local i ty
Samp 1eNunber
Mineral l
s i02
'tro 2
Atzo3
Fe0
MnO
Mco
Ca0
Na20
K20
Cr203
TotaI
832 GREW: SAPPHIRINE +
Table 9. Compositions of garnet and plagioclase associat€d withsillimanite and quartz (used for geobarometry) (wt.7o)
QUARTZ ASSOCIATION
under nearly anhydrous conditions (Newton, 1972).Moreover, the mineralogy of associated rocks in theTula Mountains is consistent with this interpretation;for example, the quartz-K-feldspar-orthopyroxeneassociation implies low water partial pressures givena lithostatic pressure of 7 kbar (Luth, 1967, p. 413).Additional evidence for low water partial pressures isthe widespread occurrence of calcic mesoperthite andthe limited extent of anatectic melting in quartzo-feldspathic rocks (Sheraton et al., 1980).
Comparison with experimental systems
Rocks rich in AlrO, and MgO
Experirnental results on the MgO-SiOr-AlrO, sys-tem (Newton, 1972; Hensen, 1972; Chatterjee andSchreyer, 1972; Newton et al., 1974), which are sum-marized in Figure 5, can be applied to the quartzites.The major difficulties in comparing the laboratorydata with natural assemblages are the effect of iron(Seifert, 1974, p. 196), and extrapolation ofthe reac-
Table 10. Calculation ofpressure from compositions ofcoexistinggarnet and plagioclase
Cmpos i t ion (no1e f rac t ion)
P lag ioc lase
0.364o . 5 4 60 . 5 1 3
c a g e R i q g e Mt. Hard
2045C 2083c 20838
Gar PIag Cat PIag Gar Plag
3 9 . 3 1 5 8 . 5 9 4 0 . 5 4 5 5 . 4 1 3 9 . 6 1 5 4 . 0 9
0 . 0 5 0 . 0 3 0 . 0 8 0 . 0 2 0 . 0 5 0 . 0 1
2 3 . 1 8 2 6 . I 4 2 2 . 8 5 2 9 . 3 0 2 2 . 7 6 2 8 . 3 4
2 5 . L 3 0 . 0 1 2 2 . 5 0 0 . 0 8 2 2 . 6 9 0 . 0 2
o . 4 4 0 . 0 0 . 4 2 0 . 0 1 0 . 4 2 0 . 0 r
1 , 2 . 5 5 0 . 0 t 4 . 5 7 0 , 0 1 3 . 5 4 0 . 0 1
1 . 0 0 7 . 7 t 1 . 3 9 1 1 . 5 6 L . 4 7 7 0 . 7 4
0 . 0 1 7 . L 5 0 . 0 1 5 . 1 8 0 . 0 4 5 , 5 2
0 . 0 4 0 . 4 3 0 . 0 6 O . 2 2 0 . 0 0 . 1 9
n . a . n . a . 0 . 0 8 0 . 0 0 . 0 6 0 . 0 r
l O L . 7 2 1 6 6 . 6 7 2 r O z . S l 1 0 1 . 8 3 1 0 0 . 6 3 9 8 . 9 3
t -G a r - g a r n e t ? I a g - p l a g l o c l a s e
A1I Ee as FeO
n . a . - n o t a n a l y z e d2 l n c l u d e s
B a o - 0 . 0 1 2
equation 7: ln Ko : 5123/T: - 16.02 + [(P -
l)0.65651/T. Goldsmith (1980) reports that Schmidand Wood's equation, which is based on the experi-mental work of Hays (1966), Newton (1966), andHariya and Kennedy (1968), is in good agreementwith his experimental redetermination of theAlrSiOr-grossular-anorthite-quartz reaction.
The calculated pressures are listed in Table 10. As-suming nonideal behavior in garnet (cases I and 2),pressures range from about 6.5 to 9 kbar at 930"C,and 6 to 8 kbar at 840"C, and for ideal behavior, 4.5to 6 kbar for these temperatures. The calculated pres-sure increases with the estimated value of the activitycoefficient of grossular.
Newton and Haselton (in press) calculated pres-sures of 6.9, 6.7, and 7.4 kbar for samples 2045C,2083C, and 2083E, respectively, using my composi-tional data (Table l0) and a new calibration of thegarnet-plagioclase-AlrSiOr-quartz geobarometer.
In summary, the temperature and pressure ofmetamorphism are estimated to be 840-1000"C and4.2-9.2 kbar. Preferred values are 900+30oC and 7+-lkbar. Sheraton et d/. (1980) report temperatures of900o to 950'C and pressures of 8 to l0 kbar based ondetailed studies at one locality in the Tula Moun-tains.
Partial pressure of water
Crystallization of the sapphirine + quartz associa-tion and its reaction to form sillimanite and ortho-pyroxene can be reproduced in the laboratory only
case L . (Adapted f ron cangu ly and Kennedy, 1974)
Component
samp 1e
2045C2083c2 0 8 3 E
0 . 5 1 0 6 0 . 4 5 4 40 . 4 4 4 t 0 . 5 r 2 30 . 4 6 1 8 0 . 4 9 1 r
Pressules
0 . 0 2 6 00 . 0 3 5 10 . 0 3 8 4
9 30 'c
2045C2 0 8 3 C2 0 8 3 E
Yc.
7 . 5 7 51 . 7 1 81 . 6 6 0
- 7 . 2 9 4 8 . 6 8 . 2- 1 . 3 5 7 8 . 5 8 . 1- 6 . 9 9 8 9 . 2 8 . 7
] n k P _ P -- - _ -D
KbY c . 1 n \
r . 6 3 4 - 7 . 7 8 47 . 7 9 5 - 7 . 2 2 01 . 7 2 9 - 6 . 8 7 4
p 1 , 2Kb
7 . 9 7 . 27 . 8 7 , l4 . 4 1 . 7
6 . 7 6 . 06 . 4 5 . 97 . O 6 . 5
5 . 2 4 , 74 . 6 4 . 25 . 4 4 . 9
case 2 . (Adapted f ron l {ensen e t a l . , 1975)
2 0 4 5 C 1 . 1 9 4 - 8 . L 2 1 7 . O 6 . 72 0 8 3 C r . 2 6 0 - 8 . 2 8 1 6 . 1 6 . 42 0 8 3 E r . 2 3 4 - 7 . 8 8 5 7 . 4 1 . 7
Case 3 . Idea l soLut lon in earne t
2045C 1 .0 -8 .6582083c r .0 -a .97 42083E 1 .0 -8 .517
6 . 0 s . 7 1 . 05 . 3 5 . 1 t . 06 . 2 5 . 9 1 . 0
1 . 3 0 7 - 7 . 4 5 4
1 . 3 9 8 - 7 , 9 6 4I . 3 6 3 - 7 . 5 8 9
- 8 . 6 5 8- 8 . 9 7 4
Hc.-P" tc.-or "*-",
kcal T"c
3 . 8 0 2 . 52 2 9 0 2 . 52 . 6 7 0 2 . 5
0 0 0
Case
I223
9 3 0 , 8 4 09 3 08 4 0
9 3 0 , 8 4 0
y - acl iv i ty coeff ic ienE; w - uargules paraneter
Cr - grossula!: h - alnandlne; Py - Pyrope*n - ( lc.Xc.)d..n"a/(ylrxh)f t"gro"r"" .
"h. . . x - mole fractron
1. cressey 9! 91 (1978) 2. Schnld and wood (1976)
GREIV: SAPPHIRINE + QUARTZ ASSOCIATION
tion curves from the high temperatures used in thelaboratory (mostly greater than 1000"C) to the lowertemperatures estimated for the natural assemblages.
In the case of iron, some of the Enderby Larid sap-phirine-quartz rocks are more magnesian than theexamples discussed by Seifert, and the shifts in thepositions of reaction curves due to FeO and FerO,may thus be relatively small compared to other am-biguities involved in applying experimental data toEnderby Land. Moreover, these shifts can be pre-dicted qualitatively. The fractionation of Fe2* andMg illustrated in Figure 4 implies that the sillima-nite-orthopyroxene field and sapphirine-quartz field(Fig. 5) expand to lower pressures in FeO-bearingrocks. The five-phase assemblage (sapphirine-sil-limanite-orthopyroxene-cordierite-quartz) in suchrocks is univariant and defines a P-T curve inferredto have a negative slope (Hensen, 1971, Fig. l). Con-sequently, the temperature cif the invariant point forthis five-phase assemblage in the MgO-SiOr-AlrO,system is a minimum for the sapphirine-quartz asso-ciation in FeO-bearing rocks. On the other hand,FerO. would expand the sapphirine-quartz field andshift the invariant point to lower temperatures, as theFe'* /Fe'* ratio of sapphirine is greater than those ofassociated orthopyroxene and cordierite (Caporuscioand Morse, 1978). The pressure of the five-phase as-semblage would be lower in natural systems contain-ing FeO or FerO, relative to the MgO-AlrO.-SiO,system, while the temperature may not differ greatly.
The problem of extrapolating experimental data togeologic temperatures is more serious. The five-phaseinvariant point has not been located experimentally.Newton et al. (1974) estimated its position at 950oCand 8 kbar by extrapolating (with the help of ther-mochemical calculations) the two experimentally de-termined univariant reactions (cordierite : sapphi-rine * quaftz * orthopyroxene, and sillimanite +orthopyroxels : quartz + sapphirine). If an allow-ance is made for possible differences in cation dis-order between synthetic and natural sapphirine, asindicated by calorimetric measurements (Charlu etal., 1975), the invariant point is shifted to 825"C(Newton et al., 1974). Only the 825oC estimate isconsistent with the temperatures of metamorphism inthe Tula Mountains calculated from mineral compo-sitions. This result could be interpreted as support forthe suggestions of Newton et al. and Charlu et al.that the thermochemical properties of synthetic sap-phirine differ considerably from those of natural sap-phirines (not to be confused with the triclinic andmonoclinic polytypes of sapphirine, S. Merlino,
1980). It could also signify that the curvature in thesillimanite + orthopyroxene : sapphirine + quartzreaction is less than that inferred by Newton e/ a/.,and consequently, the intercept of the two univariantcurves is at a temperature lower than 950"C.
The quartz-orthopyroxene-sillimanite (+spplti-rine) association in the Reference Peak quartzitemust have crystallized close to the univariant reac-tion involving these four minerals. As the temper-ature of crystallization at Reference Peak may havebeen similar to that for Tula Mountains, an increasein lithostatic pressure may be the cause of the changein mineralogi at Reference Peak. [n contrast, Morseand Talley (1971) attribute the replacement of sap-phirine-quartz by sillimanite-orthopyroxene to a de-creas€ in temperature at nearly constant pressure.
The cordierite overgrowths on sapphirine in theTula Mountain quartzites may be due to alterationfollowing the most intense metamorphic event, andpossibly reflect a decrease in both temperature andpressure. The reaction of sapphirine and quartz tocordierite probably occurs only under conditions oflow water partial pressure (Newton, 1972).
Mafic rocks
The association garnet-clinopyroxene-ortho-pyroxene-plagioclase+quartz has not been found inmafic rocks of the Tula Mountains, although it doesoccur on Amundsen Bay (Sheraton et al., 1980) andMt. Charles (Fig. l). Garnet and clinopyroxene atMount Charles occur together in both olivine-norma-tive and quartz-normative rocks having Niggli mgvalues of 0.3 to 0.5 (Grew, unpub. data). These rocksare thus more iron-rich than the materials used in theexperimental determination of the tholeiite-garnetgranulite transition (Fig. 5, from Green and Ring-wood, 1967; Ito and Kennedy, l97l). These experi-mentalists agree that decreasing Mg/Fe ratio de-creases the pressure of the first appearance of garnetin rocks of basaltic composition. The appearance ofthe garnet-clinopyroxene association at MountCharles would be possible under the conditions esti-mated for the sapphirine-quartz association (Fig. 5),particularly if metamorphic pressures were higher atMt. Charles than in the Tula Mountains, as Sheratonet al. (1980) suggest. An increase in pressure south-wards of the Tula Mountains is also indicated bydata on the Reference Peak quartzite.
Conclusion
The relatively rare assemblage sapphirine-quartzis exposed over a fairly large area in the Archean
834 GREW: SAPPHIRINE + QUARTZ ASSOCIATION
(2500 m.y.) Napier complex of western EnderbyLand. Textures and compositional relationships in-dicate that this association was in equilibrium at thepeak of metamorphism. On the basis of mineralchemistry, metamorphic temperatures and pressuresfor the crystallization of sapphirine-quartz are esti-mated to be 900+30oC and 7f I kbar. For the reac-tion of sapphirine and quartz to sillimanite and or-thopyroxene, pressures may have been somewhatgreater. Partial pressure of water during metamorph-ism was significantly less than lithostatic pressure.These pressure and temperature estimates are not en-tirely consistent with the development of sapphirine-quartz in Mg-Al-rich rocks as predicted from experi-mental results. This discrepancy could be explainedby differences in the degree ofcation disorder in syn-thetic and natural sapphirine (Newton et al., 1974;Charlu et al., 1975) or by inaccurate extrapolation togeologically reasonable temperatures of the experi-mentally derived reaction sapphirine * quartz : sil-limanite * orthopyroxene.
Metamorphic pressures of 6 to 8 kbar are equiva-lent to depths of burial of 2l to 28 km. Correspond-ing thermal gradients lie in the range 3OoC/km to44"C/km, with 37'Clkm the value based on the pre-ferred P-T estimate of 900"C and 7 kbar. These val-ues are comparable to the l8-35"C/km estimated forArchean granulites (Tarney and Windley, 1977;'Weaver et al., 1978) and to Lambert's (1976) sug-gested 36"C/km late Archean geotherm. However,the calculated pressure-temperature conditions can-not be unequivocally attributed to regional meta-morphism (see Lambert,19'76). Although no plutonicbodies have been reported from the area shown inFigure l, exposure is sufficiently poor that a plutonicrock may be present, but concealed by ice. Osumilite,normally a mineral of volcanic rocks, has been re-ported from granulite-facies contact aureoles ofanorthositic complexes in Labrador (Berg andWheeler, 1976) and in Norway (Maijer et al., 1977).Osumilite in the Tula Mountains (Fig. l) may also berelated to concealed anorthositic bodies at depth(Sheraton et al.,1980), and these authors report "thinanorthosite layers" at two localities in the TulaMountains. In addition, Sheraton et a/. (1980) notethat a negative modified free-air gravity anomalymapped by Wellman and Tingey (in press) roughlycorresponds to the outcrop area of the sapphirine-qaartz association and suggest that this anomaly maybe associated with anorthosite. One difficulty in ac-cepting a contact metamorphic origin of osumiliteand of the sapphirine-quartz association in Enderby
Land is their occurrence on a regional scale (Shera-
ton et al., 1980). Possibly the distribution of osumilite
and of the sapphirine-quartz association is not
strictly regional. The presence of these minerals over
alarge area could be attributed to the partial coalesc-ing of contact aureoles around small anorthosite bod-ies widely distributed throughout the Tula Moun-tains. An abundance of small anorthosite bodiescould also explain Wellrnan and Tingey's (in press)
gravity anomaly.
Acknowledgments
I thank the Antarctic Division of the Australian Department of
Science and the Environment for the invitation to participate in
the Australian National Antarctic Research Expeditions and for
logistic support in the field; J W. Sheraton, R. J. Tingey, I. F' Al-
lison, and L. A Offe for their assistance in planning and carrying
out my field program; J. W. Sheraton and Ye. N. Kamenev for
samples collected by Australian and Soviet geologists in Enderby
Land, and for unpublished field data and information on sample
locations; and J F. Lovering for use ofthe electron microprobe at
the University of Melbourne while I was there as a Senior Ful-
bright Scholar in 1978. G. Stummer performed the X-ray fluores-
cence analyses. This research was funded by NSF grant DPP 76-
80957 to UCLAThoughtful reviews of earlier versions of this manuscript by
F. Chayes, R. C. Newton, W. Schreyer, F. Seifert, and R. J. Tin-
gey have resulted in a substantial improvement, for which the au-
thor is very grateful.
References
Anastasiou, P. and F. Seifert (1972) Solid solubility of Al2O3 in
enstatite at high temperatures and l-5 kb water pressure. Con-
trib. Mineral. Petrol., 34, 2'72-28'7.
Barker, F. (1964) Reaction between mafic magmas and pelitic
schist. Cortlandt. New York. Am. J. Sci., 262,614-634.
Berg, J. H. and E. P. Wheeler (1976) Osumilite of deep-seated ori-
gin in the contact aureole of the anorthositic Nain complex,
Labrador. Am. Mineral., 6l, 29-37 .
Bourne, J. H. (1978) Metamorphism in the eastern and south-
western portions of the Grenville Province. In J. A. Fraser and
W. W. Heywood, Eds., Metamorphism in the Canadian Shield, p.
315-328. Geol. Surv. Canada Pap.78-10.
Caporuscio, F. A. and S. A. Morse (1978) Occurrence of sapphir-
ine plus quartz at Peekskill, New York. Am. J. Sci., 278, 1334-
1342.Charlu, T. V., R. C. Newton and O. J Kleppa (1975) Enthalpies
of formation at 970 K of compounds in the system MgO-
Al2O3-SiO2 from high temperature solution calorimetry. Geo-
chim. Cosmochim. Acta, 39, 1487-1497.
Chatterjee, N. D. and W. Schreyer (1972) The reaction enstatite""
+ sillimanite e sapphirine"" + quartz in the system MgO-
Al2O3-SiO2 Contib. Mineral. Petrcl., 36, 49-62.
Chinner. G. A. and T. R. Sweatman (1968) A former association
of enstatite and kyanite. Mineral. Mag., 36, 1052-1060.
Clifford, T N. (1974) Review of African granulites and related
rocks. Geol. Soc. Am. Spec. Pap. 156.
Cortesogno, L., W. G. Ernst, M. Galli, B. Messiga, G. M. Pede-
monte and G. B. Piccardo (1977) Chemical petrology of
GREW: SAPPHIRINE +
eclogitic lenses in serpentinite, Gruppo di Voltri, Ligurian Alps.
J. Geol.. 85.255-27'7.Cressey, G., R. Schmid and B. J. Wood (1978) Thermodynamic
properties of almandine-grossular garnet solid solutions. Con-
trib. Mineral. Petrol., 67, 397 4O4.
Dallmeyer, R. D. (1974) Metamorphic history of the northeastern
Reading Prong, New York and northern New Jersey. J. Petrol.,
I 5, 325-359.- ( 1975) ao Ar/3e Ar release spectra of biotite and hornblende
from the Cortlandt and Rosetown Plutons, New York, and their
regional implications. J. Geol., 83, 629-643.- and R. T. Dodd (1971) Distribution and significance of
cordierite in paragneisses of the Hudson Highlands, south-
eastern New York. Contrib. Mineral. Petrol., 33,289-308.
Dallwitz, W. B. (1968) Co-existing sapphirine and quartz in gran-
ulite from Enderby Land, Antarctica. Nature, 219,476-4'17.
Danckwerth, P. A. and R. C. Newton (1978) Experimental deter-
mination of the spinel peridotite to garnet peridotite reaction in
the system MgO-Al2O3-SiO2 in the range 900o-1100'C and
Al2O3 isopleths of enstatite in the spinel field Contrib. Mineral.
Petro l . ,66,189-201.Deer, W. A., R. A. Howie and J. Zussman (1978) Rock-Forming
Minerals, Vol. 2A, Single-Chain Silicates (second ed ). Wiley,
New York.
Dougan, T. W. (1974) Cordierite gneisses and associated lith-
ologies ofthe Guri area, northwest Guayana Shield, Venezuela.
Contrib. Mineral. Petrol., 46, 169-188.
Ellis, D. J., J. W. Sheraton, R. N. England and W. B. Dallwitz(1980) Osumilite-sapphirine-quartz granulites from Enderby
Land Antarctica-mineral assemblages and reactions. Contrib.
Mineral. Petrol., 72, 123-143.
Foster, M. D. (1960) Interpretation of the composition of tri-
octahedral micas. U. S. Geol. Surv. Prof. Pap. 354-8.
Ganguly, J. and S. Ghose (1979) Aluminous orthopyroxene: or-
der-disorder, thermodynamic properties, and petrologic impli-
cations. Contrib. M ineral. Petrol., 69, 375-385.- and G. C. Kennedy (1974) The energetics ofnatural garnet
solid solution. l. Mixing of the aluminosilicate end-members.
Contrib. Mineral. Petrol., 48, 137-148.
Ghent, E. D. (1976) Plagioclase-garnet-AlrSiOr-quartz: a poten-
tial geobarometer-geothermometet. Am. Mineral., 6 I, "l l{u_-7 14.
Goldsmith, J. R. (1980) The melting and breakdown reactions of
anorthite at high pressures and temperatvres. Am. Mineral., 65,
2'12-284.Green, D H and A. E. Ringwood (1967) An experimental investi-
gation of the gabbro to eclogite transforrnation and its petrolo-
gical applicatiots. Geochim. C osmochim. A cta, 3 l, 7 6'7 -8f3.
Grew, E. S. (1978) Petrologic study of the granulite-facies meta-
morphic rocks of Enderby Land, East Antarctica, with the Aus-
tralian National Antarctic Research Expedition (ANARE), 1977-'18.
Antarctic J., 13(4), 2-3.- (19'19^) Sapphirine + quartz from Archean rocks in En-
derby Land, East Antarctica (abstr.). Trans. Am. Geophys.
Union, 60,423.- (1979b) Reactions involving sapphirine and sillimanite *
orthopyroxene in quartz-bearing rocks of the 2.5 b.y. Napier
complex, Enderby Land, East Antarctica (abstr.). Geol. Soc.
Am. Abstracts with Programs, I 1, 435436.- (1980) Sillimanite and ilmenite from high-grade metamor-
phic rocks of Antarctica and other areas. "/. Petrol , 21,39-68.- and W I. Manton (1979) Archean rocks in Antarctica: 2.5-
billion-year uranium-lead ages of pegmatites in Enderby Land.
Science, 206,44t-445.
QUARTZ ASSOCIATION 835
Hariya, Y and G. C. Kennedy (1968) Equilibrium study of anor-
thite under high pressure and high temperature Am. J' Sci',
266, t93-203Hays, J F (1966) Lime-alumina-silica. Carnegie Inst. Wash- Year
Book. 65.234-239.Hensen, B J. (1971) Theoretical phase relations involving cordier-
ite and garnet in the system MgO-FeO-Al2O3-SiO2' Contrib.
Mineral. Petrol., 33, l9l-214.- (1972) Phase relations involving pyrope, enstatite"", and
sapphirine"" in the system MgO-Al2O3-SiO2. Carnegie Inst'
Wash. Year Book, 7I , 421421 .-, R. Schmid and B. J. Wood (1975) Activity-composition
relationships for pyrope-grossular garnet. Contrib. Mineral. Pe-
rro l . ,5 l , l6 l -166.
Higgins, J. B., P H. Ribbe and R. K. Herd (1979) Sapphirine l.
Crystal chemical contributions. Contrib. Mineral. Petrol-, 68,
349-356.Holdaway, M J. (1971) Stability of andalusite and the aluminum
silicate phase diagram Am. J. Sci , 271,9'l-l3l'
Ito, K. and G. C. Kennedy (1971) An experimental study of the
basalt-garnet granulite-eclogite transition' ln J. G. Heacock,
Ed., The Slructure and Physical Properlies of the Earth's Crust, p.
f13-fl4 Am. Geophys Union, Geophys Monogr- 14.
Kamenev, Ye. N ( 1972) Geological structure of Enderby Land. In
R. J. Adie, Ed, Antarctic Geology and Geophysics, p. 579-583.
Universitetsforlaget, Oslo- (19'15) Geologiya Zemli Enderbi [Geology of Enderby
L^ndl Antarktika Doklady Komissii, 14, 34-58. Nauka, Mos-
cow.Karsakov. L. P., V. I. Shuldiner and A. M. Lennikov (1975) Gran-
ulitovyy kompleks vostochnoy chasti Stanovoy Skladchatoy
Oblasti i Chogarskaya fatsiya glubinnosti IGranulite complex of
the eastern part of the Stanovoy Fold Province and the Chogar
facies of depthl Izvestiya Akad. Nar.rk SSSR, Ser. Geol. 1975(5)'
47 -61
Lal, R. K., D. Ackermand, F. Seifert and S. K. Haldar (1978)
Chemographic relationships in sapphirine-bearing rocks from
Sonapahar, Assam, India Contib. Mineral Petrol., 67, 169-187.
Lambert, R. St. J. (1976) Archean thermal regimes, crustal and
upper mantle temperatures, and a progressive evolutionary
model for the Earth. In B. F. Windley, Ed., The Early History of
the Earth, p. 363-373. Wiley, London.
Leong, K M. and J. M. Moore, Jr. (1972) Sapphirine-bearing
rocks from Wilson Lake, Labrador. Can. Mineral., I 1"177-79O.
Luth, W. C. (1967) Studies in the system KAlSiOa-Mg2SiOa-
SiO2-H2O: l, Inferred phase relations and petrologic appli-
cations. J. Petrol., 8,372416.
Maijer, C, J B. H. Jansen, J. Wevers and R. P. E. Poorter (1977)
Osumilite, a mineral new to Norway Contribution to the min-
eralogy of Norway, No. 63 Norsk Geol. Tidssk', 57, 187-188'
Mason, P. K, M. T. Frost and S J' B. Reed (1969) Computer pro-
gram for calculating corrections in quantitative X-ray micro-
analyses. Nat ional Phys. Lab. (Uni ted Kingdom) I -M.5.
Report 2.
McKie, D. (1959) Yoderite, a new hydrous magnesium iron alu-
minosilicate from Mautia Hill, Tanganyika Mineral. Mag., 32'
282-30'7.Merlino, S. (1973) Polymorphism in sapphirine. Contrib. Mineral.
Petro l . . 41,2j -29.- (1980) crystal structure of sapphirine-lTc Z. Kristallogt.,
151 .91 -100 .Morse, S. A. (1971) Reply. Earth Planet' Sci. Leu.' 12'35'1.--- and J. H. Talley (1971) Sapphirine reactions in deep-
836 GREW: SAPPHIRINE + QUARTZ ASSOCIATION
seated granulites near Wilson Lake, central Labrador, Canada.Earth Planet. Sci. Leu., 10,325-328
Newton, R. C. (1966) Some calc-silicate equilibrium relations.Am. J. Sci.. 264.204-222.
- (1972) An experimental determination of the high-pressurestability limits of magnesian cordierite under wet and dry condi-tions. "/. Geol., 80,398-420.
- (1978) Experimental and thermodynamic evidence for theoperation of high pressures in Archaean metamorphism. InB. F. Windley and S. M. Naqvi, Eds., lrchaean Geochemistry, p.221-240. Elsevier, Amsterdam
- and H T. Haselton (in press) Thermodynamics of the gar-net-plagioclase-AlrSiO5-quartz geobarometer. In R. C. New-ton, A. Navrotsky and B. J. Wood, Eds., Thermodynamics ofMinerals and Melts. Springer-Verlag.
T. V. Charlu and O. J. Kleppa (1974) A calorimetric in-vestigation of the stability of anhydrous magnesium cordieritewith application to granulite facies metamorphisp. Contrib.Mineral. Petrol.. 44. 295-311.
Nixon, P. H., A. J. Reedman and L. K. Burns (1973) Sapphirine-bearing granulites from Labwor, Uganda. Mineral. Mag., 39,420428.
Orville, P. M. (1972) Plagioclase cation exchange equilibria withaqueous chloride solution: results at 700oC and 2000 bars in thepresenc€ of quartz. Am. J. Sci., 272,234-2'12.
O'Neill, H. St. C. and B. J. Wood (1979) An experimental study of
Schreyer, W. (1977) Whiteschists: their compositions and pres-sure-temperature regimes based on experimental, field, and pet-rographic evidence. Tectonophysics, 4 3, 127 -144.
- and K. Abraham (1975) Peraluminous sapphirine as a me-tastable reaction product in kyanite-gedrite-talc schist from Sare Sang, Afghanistan. Mineral. Mag, 40, l7l-180.
Seifert, F. (1974) Stability ofsapphirine: a study ofthe aluminouspart of the system MgO-Al2Oj-SiO2-H2O. J. Geol., 82, 173-204.
Sheraton, J. W., L. A. Offe, R. J. Tingey and D. J. Ellis (1980) En-derby Land, Antarctica-an unusual Precambrian high-grademetamorphic terrain. "L Geol. Soc. Aust., 27, in press.
Tarney, J and B. F. Windley (1977) Chemistry, thermal gradientsand evolution of the lower continental crust. "/. Geol. Soc. Lon-don, 134,153-l'12.
Weaver, B. L., J. Tarney, B. F. Windley, E. B. Sugavanam andV. Venkata Rao (1978) Madras granuliles: geochemistry and P-T conditions of crystallisation. In B. F. Windley and S. M.Naqvi, Eds., Archaean Geochemistry, p. 177-2O4. Elsevier, Am-sterdam.
Wellman, P. and R. J. Tingey (in press) A gravity survey of En-derby and Kemp Lands, Antarctica. In C. Craddock,Ed., Ant-arctic Geoscience, University of Wisconsin Press, Madison, Wis-consln.
Wells, P R. A. (1977) Pyroxene thermometry in simple and com-plex systems. Contrib. Mineral. Petrol,62, 129-139.
Manuscript received, November 7, 1979;acceptedfor publication, May 7, 1980.
Fe-Mg partitioning between garnet and olivine and its calibra- Wood, B J. and S. Banno (1973) Garnet-orthopyroxene and or-tion as a geothermometer. Contrib. Mineral. Petrol., 70, 59-7O. thopyroxene-clinopyroxene relationships in simple and com-
Ravich, M. G. and E. N. Kamenev (1975) Crystalline Basement of plex systerns. Contrib. Mineral. Petrc\.,42, lO9-124.the Antarctic Platform. Wiley, New York. Woodford, P. J. and A. F. Wilson (1976) Sapphirine, hcigbomite,
Sahama, T. G., M. Lehtinen, and P. Rehtijiirvi (1974\ Properties kornerupine and surinamite from aluminous granulites, north-ofsapphirine. Ann. Acad. Sci. Fennicae Ser. A. III. Geol.-Geogr. eastern Strangways Range, central Australia. Neues Jahrb. Min-114. eral. Monatsh.. 15-35.
Schmid, R. and B. J. Wood (1976) Phase relationships in gran-ulitic metapelites from the lvrea-Verbano zone (northern ltaly).Contrib. Mineral. Petrol., 54, 255-279.
American Mineralogist, Volume 65, pages 837-851, 1980
Significance of hornblende in calc-alkaline andesites and basalts
A. T. ANDERSoN. JR.
Department af the Geophysical Sciences, The University of Chicago5734 South Ellis AvenueChicago, Illinois 60637
Abstract
Hornblende occurs in some andesitic and basaltic rocks of calc-alkaline affini1y, where it iscommonly associated with olivine. The texture, eruption history, and composition are inter-preted to indicate that hornblende commonly forms as a product of reaction between olivineand basaltic and andesitic liquids. The natural hornblendes probably formed within the crustat temperatures between 960o and 1080'C from liquids with less than about 6 weight percentHrO. The formation of hornblende from basaltic liquid within the crust has implications forevolution of continental crust, as well as for the origin of andesite and thermal conditions insubduction zones.
Introduction
Boettcher (1973) and others (Mueller, 1969; Hol-loway and Burnham, 1972; Green, 1972; Helz, 1976;Cawthorn and O'Hara, 1976; Allen and Boettcher,1978) argue that amphibole plays an important rolein governing the compositions of calc-alkaline ande-sites. The mechanisms whereby amphibole suppos-edly exerts its role are not clear. Is it left behind in acrystallins residue-where is it: in the crust or in themantle? Does amphibole crystallize and separatefrom a parental liquid-what are the compositionand temperature of the parental liquid? Does amphi-bole crystallize from a derivative liquid which mixeswith a parental liquid to yield andesite? Amphiboleoccurs in some calc-alkaline volcanic and plutonicrocks with basaltic and andesitic bulk compositions,but the significance of such occurrences is uncertainwithout textural evidence of how it got there: is theamphibole a primary igneous mineral or a product ofalteration? If igneous, over what interval of crystalli-zation did it form, and was the composition of theliquid in that interval andesitic, dacitic, or basaltic? Ifamphibole can be shown to have actually formedfrom a fiquid with a certain composition, what doesthat portend for the concentration of HrO in and thetemperature of the liquid? My aim is to help pointthe way to answers to some of the above questions bycritically sxxmining evidence on the growth of am-phibole from basaltic and andesitic liquids, both ex-
Definitions
In using the word liquid, I mean to refer to a singlestate of matter (a homogeneous liquid phase). It is vi-tal to distinguish between the composition of a liquid(generally a residual liquid) and the composition ofthe bulk material. Petrographically a certain horn-blende may be associated with a particular residualliquid. Experimentally a certain bulk compositionmay crystallize hornblende at or below the liquidus.The residual liquid associated with hornblende willgenerally differ in composition from the bulk. Ther-modynamically the composition and temperature ofa certain liquid can remain constant as the propor-tions of crystals and liquid vary. To interpret a givenassociation of hornblende and liquid, the petrogra-pher must seek experimental conditions which yieldhornblende and liquid with compositions similar tothose observed. If analogy is drawn with a particularbulk composition (and liquidus hornblende) the im-plied pressure (and concentration of HrO in the liq-uid) is larger than if analogy is made with a residualliquid. The implications for temperature are complexand depend on the concentration of HrO in the liquidas well as on compositional features such as Fe/Mgand concentrations of alkalis.
Hornblende in experimental products
Experimental studies yielding hornblende in prod-ucts with either calc-alkaline bulk compositions orwith residual liquids having analogous compositionsperimental and natural.
0003-o04x/80/09 I 0-0837$02.00 83'l
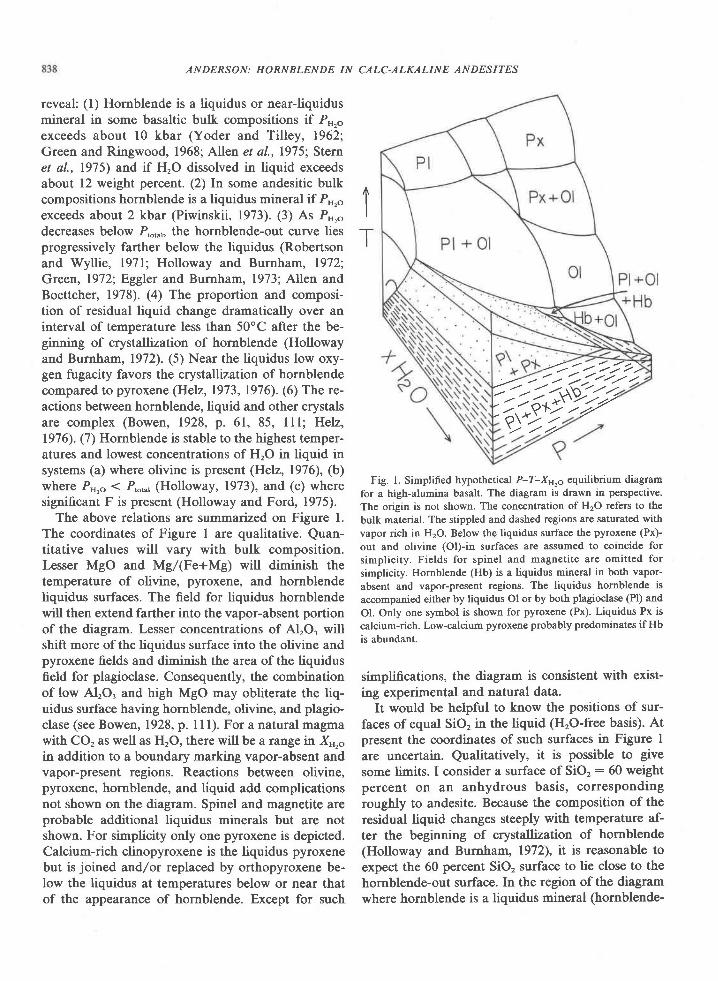
ANDERSON: HORNBLEN DE IN CA LC-A LKA LI N E A N DES ITES
reveal: (l) Hornblende is a liquidus or near-liquidusmineral in some basaltic bulk compositions if P",oexceeds about l0 kbar (Yoder and Tilley, 1962;Green and Ringwood, 1968; Allen et al., 19751' Sternet al., 1975) and if H,O dissolved in liquid exceedsabout 12 weight percent. (2) In some andesitic bulkcompositions hornblende is a liquidus mineral rf Pn,oexceeds about 2 kbar (Piwinskii, 1973). (3) As P",odecreases below P,o,u,, the hornblende-out curve liesprogressively farther below the liquidus (Robertsonand Wyllie, l97l; Holloway and Burnham, 1972;Green, 1972; Eggler and Burnham, 1973; Allen andBoettcher, 1978). (4) The proportion and composi-tion of residual liquid change dramatically over aninterval of temperature less than 50"C after the be-ginning of crystallization of hornblende (Hollowayand Burnham, 1972). (5) Near the liquidus low oxy-gen fugacity favors the crystallization of hornblendecompared to pyroxene (Helz, 1973, 1976). (6) The re-actions between hornblende, liquid and other crystalsare complex (Bowen, 1928, p. 61, 85, lll; Helz,1976). (7) Hornblende is stable to the highest temper-atures and lowest concentrations of HrO in liquid insystems (a) where olivine is present (Helz,1976), (b)where P,,o ( P,",", (Holloway, 1973), and (c) wheresignificant F is present (Holloway and Ford, 1975).
The above relations are summarized on Figure l.The coordinates of Figure I are qualitative. Quan-titative values will vary with bulk composition.Lesser MgO and Mg/(Fe+Mg) will diminish thetemperature of olivine, pyroxene, and hornblendeliquidus surfaces. The field for liquidus hornblendewill then extend farther into the vapor-absent portionof the diagram. Lesser concentrations of AlrO. willshift more of the liquidus surface into the olivine andpyroxene fields and diminish the area of the liquidusfield for plagioclase. Consequently, the combinationof low Al,O, and high MgO may obliterate the liq-uidus surface having hornblende, olivine, and plagio-clase (see Bowen, 1928, p. 1l l). For a natural magmawith CO, as well as HrO, there will be a range in X",oin addition to a boundary marking vapor-absent andvapor-present regions. Reactions between olivine,pyroxene, hornblende, and liquid add complicationsnot shown on the diagram. Spinel and magnetite areprobable additional liquidus minerals but are notshown. For simplicity only one pyroxene is depicted.Calcium-rich clinopyroxene is the liquidus pyroxenebut is joined atd/or replaced by orthopyroxene be-low the liquidus at temperatures below or near thatof the appearance of hornblende. Except for such
Fig. l. Simplified hypothetical P-T-XH2o equilibrium diagram
for a high-alumina basalt. The diagram is drawn in perspective.
The origin is not shown. The concentration of H2O refers to the
bulk material. The stippled and dashed regions are saturated with
vapor rich in H2O. Below the liquidus surface the pyroxene (Px)-
out and olivine (Ol)-in surfaces are assumed to coincide for
simplicity. Fields for spinel and magnetite are omitted for
simplicity. Hornblende (Hb) is a liquidus mineral in both vapor-
absent and vapor-present regions. The liquidus hornblende is
accompanied either by liquidus Ol or by both plagioclase (Pl) and
Ol. Only one symbol is shown for pyroxene (Px). Liquidus Px is
calcium-rich. Low-calcium pyroxen€ probably predominates if Hb
is abundant.
simplifications, the diagram is consistent with exist-ing experimental and natural data.
It would be helpful to know the positions of sur-faces of equal SiO, in the liquid (H,O-free basis). Atpresent the coordinates of such surfaces in Figure Iare uncertain. Qualitatively, it is possible to givesome limits. I consider a surface of SiO, : 60 weightpercent on an anhydrous basis, correspondingroughly to andesite. Because the composition of theresidual liquid changes steeply with temperature af-ter the beginning of crystallization of hornblende(Holloway and Burnhan, 1972), it is reasonable toexpect the 60 percent SiO, surface to lie close to thehornblende-out surface. In the region ofthe diagramwhere hornblende is a liquidus mineral (hornblende-
1T
f-t--ii:)
a\*> 2,,/ ./'//1:1a(ry2
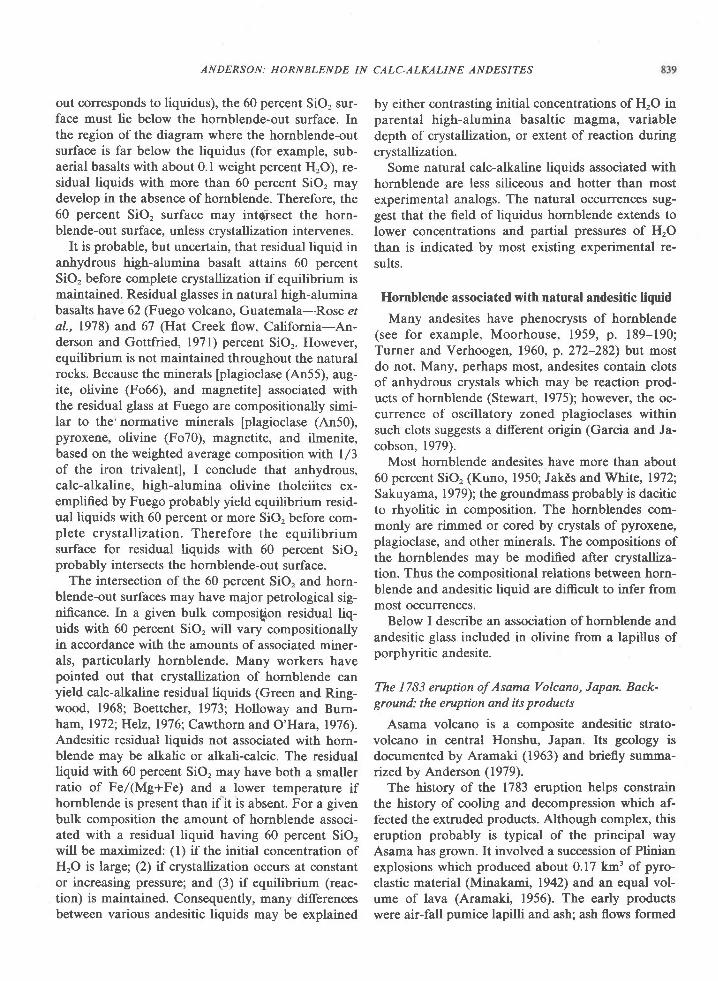
ANDERSON: HORNBLENDE IN CALC-ALKALINE ANDESITES
out corresponds to liquidus), the 60 perc€nt SiO, sur-face must lie below the hornblende-out surface. Inthe region ofthe diagram where the hornblende-outsurface is far below the liquidus (for example, sub-aerial basalts with about 0.1 weight percent HrO), re-sidual liquids with more than 60 percent SiO, maydevelop in the absence ofhornblende. Therefore, the60 percent SiO, surface may intqisect the horn-blende-out surface, unless crystallization intervenes.
It is probable, but uncertain, that residual liquid inanhydrous high-alumina basalt attains 60 percentSiO, before complete crystallization if equilibrium ismaintained. Residual glasses in natural high-aluminabasalts have 62 (Fuego volcano, Guatemala-Rose e/al., 1978) and 67 (Hat Creek flow, California-An-derson and Gottfried, 19'71) percent SiOr. However,equilibrium is not maintained throughout the naturalrocks. Because the minerals [plagioclase (An55), aug-ite, olivine (Fo66), and magnetitel associated withthe residual glass at Fuego are compositionally simi-lar to the'normative minerals [plagioclase (An50),pyroxene, olivine (Fo70), magnetite, and ilmenite,based on the weighted average composition with l/3of the iron trivalent], I conclude that anhydrous,calc-alkaline, high-alumina olivine tholeiites ex-emplified by Fuego probably yield equilibrium resid-ual liquids with 60 percent or more SiO, before com-plete crystallization. Therefore the equilibriumsurface for residual liquids with 60 percent SiO,probably intersects the hornblende-out surface.
The intersection of the 60 percent SiO, and horn-blende-out surfaces may have major petrological sig-nificance. In a given bulk composi$on residual liq-uids with 60 percent SiO, will vary compositionallyin accordance with the amounts of associated miner-als, particularly hornblende. Many workers havepointed out that crystallization of hornblende canyield calc-alkaline residual liquids (Green and Ring-wood, 1968; Boettcher, 1973; Holloway and Burn-ham, 197 2; Heh, 197 6; Cawthorn and O'Hara, 1 976).Andesitic residual liquids not associated with horn-blende may be alkalic or alkali-calcic. The residualliquid with 60 percent SiO, may have both a smallerratio of Fel(Mg+Fe) and a lower temperature ifhornblende is present than if it is absent. For a givenbulk composition the amount of hornblende associ-ated with a residual liquid having 60 percent SiO,will be maximized: (l) if the initial concentration ofHrO is large; (2) if crystallization occurs at constantor increasing pressure; and (3) if equilibrium (reac-tion) is maintained. Consequently, many differencesbetween various andesitic liquids may be explained
by either contrasting initial concentrations of HrO inparental high-alumina basaltic magma, variabledepth of crystallization, or extent of reaction duringcrystallization.
Some natural calc-alkahne liquids associated withhornblende are less siliceous and hotter than mostexperimental analogs. The natural occurrenees sug-gest that the field of liquidus hornblende extends tolower concentrations and partial pressures of HrOthan is indicated by most existing experimental re-sults.
Hornblende associated with natural andesitic liquid
Many andesites have phenocrysts of hornblende(see for example, Moorhouse, 1959, p. 189-190;Turner and Verhoogen, 1960, p.272-282) but mostdo not. Many, perhaps most, andesites contain clotsof anhydrous crystals which may be reaction prod-ucts of hornblende (Stewart, 1975); however, the oc-currence of oscillatory zoned plagioclases withinsuch clots suggests a different origin (Garcia and Ja-cobson, 1979).
Most hornblende andesites have more than about60 percent SiO, (Kuno, 1950; JakEs and White, 1972;Sakuyama, 1979); the groundmass probably is daciticto rhyolitic in composition. The hornblendes com-monly are rimmed or cored by crystals of pyroxene,plagioclase, and other minerals. The compositions ofthe hornblendes may be modffied after crystalliza-tion. Thus the compositional relations between horn-blende and andesitic liquid are difficult to infer frommost occurrences.
Below I describe an association ofhornblende andandesitic glass included in olivine from a lapillus ofporphyritic andesite.
The 1783 eruption of Asama Volcano, Japan. Back-ground: the eruption and its products
Asama volcano is a composite andesitic strato-volcano in central Honshu, Japan. Its geology isdocumented by Aramaki (1963) and briefly surnma-rued by Anderson (1979).
The history of the 1783 eruption helps constrainthe history of cooling and decompression which af-fected the extruded products. Although complex, thiseruption probably is typical of the principal wayAsama has grown. It involved a succession of Plinianexplosions which produced about 0.17 km3 of pyro-clastic material (Minakami, 1942) and an equal vol-ume of lava (Aramaki, 1956). The early productswere air-fall pumice lapilli and ash; ash flows formed
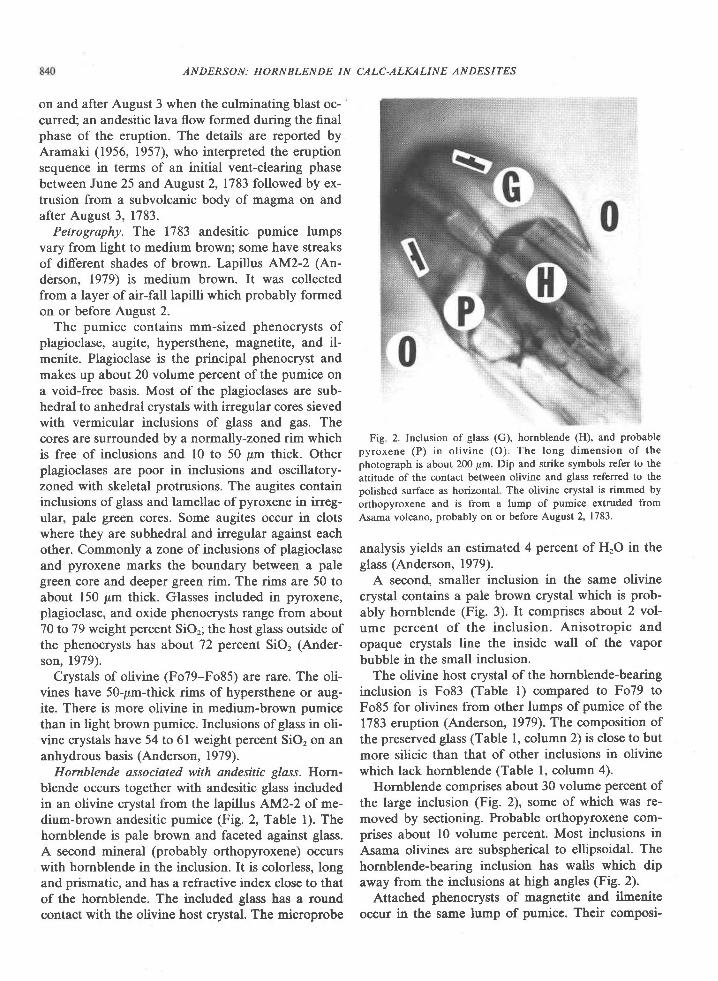
ANDERSON: HORNBLENDE IN CALC-ALKALINE ANDESITES
on and after August 3 when the culminating blast oc-curred; an andesitic lava flow formed during the finalphase of the eruption. The details are reported byAramaki (1956, 1957), who interpreted the eruptionsequence in terms of an initial vent-clearing phasebetween June 25 and August 2, 1783 followed b! ex-trusion from a subvolcanic body of magma on andafter August 3, 1783.
Petrography. The 1783 andesitic pumice lumpsvary from light to medium brown; some have streaksof different shades of brown. Lapillus AM2-2 (An-derson, 1979) is medium brown. It was collectedfrom a layer of air-fall lapilli which probably formedon or before August 2.
The pumice contains mm-sized phenocrysts ofplagioclase, augite, hypersthene, magnetite, and il-menite. Plagioclase is the principal phenocryst andmakes up about 20 volume percent of the pumice ona void-free basis. Most of the plagioclases are sub-hedral to anhedral crystals with irregular cores sievedwith vermicular inclusions of glass and gas. Thecores are surrounded by a normally-zoned rim whichis free of inclusions and l0 to 50 pm thick. Otherplagioclases are poor in inclusions and oscillatory-zoned with skeletal protrusions. The augites containinclusions of glass and lamellae of pyroxene in irreg-ular, pale green cores. Some augites occur in clotswhere they are subhedral and irregular against eachother. Commonly a zone of inclusions of plagioclaseand pyroxene marks the boundary between a palegreen core and deeper green rim. The rims are 50 toabout 150 pm thick. Glasses included in pyroxene,plagioclase, and oxide phenocrysts range from about70 to 79 weight percent SiOr; the host glass outside ofthe phenocrysts has abont 72 percent SiO, (Ander-son, 1979).
Crystals of olivine (Fo79-Fo85) are rare. The oli-vines have 5O-pm-thick rims of hypersthene or aug-ite. There is more olivine in medium-brown pumicethan in light brown pumice. Inclusions of glass in oli-vine crystals have 54 to 6l weight percent SiO, on ananhydrous basis (Anderson, 1979).
Hornblende associated with andesitic glass. Horn-blende occurs together with andesitic glass includedin an olivine crystal from the lapillus AM2-2 of me-dium-brown andesitic pumice (Fig. 2, Table 1). Thehornblende is pale brown and faceted against glass.A second mineral (probably orthopyroxene) occurswith hornblende in the inclusion. It is coloiless, longand prismatic, and has a refractive index close to thatof the hornblende. The included glass has a roundcontact with the otvine host crystal. The microprobe
Fig. 2. Inclusion of glass (G), hornblende (H), and probable
pyroxene (P) in o l iv ine (O) The long dimension of the
photograph is about 200 pm. Dip and strike symbols refer to the
attitude of the contact between olivine and glass referred to the
polished surface as horizontal The olivine crystal is rimmed by
orthopyroxene and is from a lump of pumice extruded from
Asama volcano, probably on or before August 2, 1783.
analysis yields an estimated 4 percent of HrO in theglass (Anderson, 1979).
A second, smaller inclusion in the same olivinecrystal contains a pale brown crystal which is prob-ably hornblende (Fig. 3). It comprises about 2 vol-ume percent of the inclusion. Anisotropic andopaque crystals line the inside wall of the vaporbubble in the small inclusion.
The otvine host crystal of the hornblende-bearinginclusion is Fo83 (Table l) compared to Fo79 toFo85 for olivines from other lumps of pumice of the1783 eruption (Anderson, 1979). The composition ofthe preserved glass (Table l, column 2) is close to butmore silicic than that of other inclusions in olivinewhich lack hornblende (Table l, column 4).
Hornblende comprises about 30 volume percent ofthe large inclusion (Fig. 2), some of which was re-moved by sectioning. Probable orthopyroxene com-prises about l0 volume percent. Most inclusions inAsama olivines are subspherical to ellipsoidal. Thehornblende-bearing inclusion has walls which dipaway from the inclusions at high angles (Fig. 2).
Attached phenocrysts of magnetite and ilmeniteoccur in the same lump of pumice. Their composi-
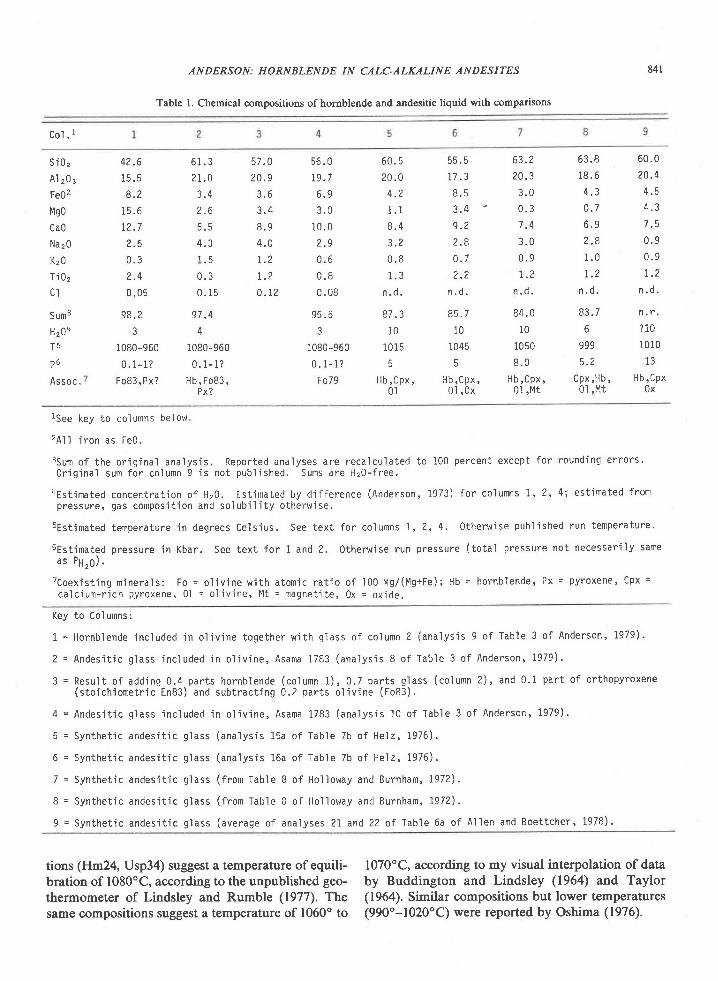
ANDERSON: HORNBLENDE IN CALC-ALKALINE ANDESITES
Table l. Chemical compositions of hornblende and andesitic liquid with comparisons
841
C o l . I
S i 0 z
A 1 2 0 3
Fe02
Mgo
Ca0
N a 2 0
Kz0
T i 0 2
C I
Sum3
H r 0 al 5
p 6
As soc .
4 ? . 6
8 . 2l q 6
12.7
L . d
n ?
2 . 4
0 . 0 5
98.2
3
1080-960
0 . 1 - 1 ?
F o 8 3 , P x ?
5 6 . 0
t9.7
6 . 9
3 . 0
1 0 . 0
2 . 9
0 . 6
0 . 8
0 . 0 8
9 5 . 5
3
1080-960n 1 - 1 ?
F o79
6 0 . 5
2 0 . 0
4 . 2
1 . 1
8 . 4
3 . 2
0 . 8
1 . 3
n . o .
e 7 . 3
i0
1 0 1 5
5
H b , C p x ,0 l
5 5 . 5
1 7 . 3
8 . 5
3 . 4
9 . 2
L . 6
0 . 7
2 . 2
n . o .
8 5 . 7
1 0
1045
5
H b , C p x ,01 ,0x
63.2
20.3
3 . 0
0 . 3
7 . 4
3 . 0
0 . 9
1 . 2
n . o .
8 4 . 0
10
1050
8 . 0
H b , C p x ,0 l ,Mt
6 1 . 3 5 7 . 0
2 t . 0 2 0 . 9
3 . 4 3 . 6
2 . 6 3 . 4
5 . 5 8 . 9
4 . 3 4 . 0
1 . 5 1 . 2
0 . 3 1 . 2
0 . 1 s 0 . I 2
9 7 . 4
4
1080-960
0 . 1 - l ?
H b , F o B 3 ,P x ?
6 3 . 8 6 0 . 0
1 8 . 6 2 0 . 4
4 . 3 4 . 5
0 . 7 4 . 3
6 . 9 7 . 5
2 . 8 0 . 9
1 . 0 0 . 9
t . 2 7 . 2
n . d . n . d .
8 3 . 7 n . r .
6 ? 1 0
999 1010
5 . 2 1 3
C p x , H b , H b , C p xO l , M t 0 x
rsee key to co lumns be low.
' A l I r r o n a s F e u .
35um o f the or ig ina l ana lys is . Repor ted ana lyses are reca lcu la ted to 100 percent except fo r round ing er ro rs .Or ig ina l sum fo r co lumn 9 is no t pub l i shed. Sums are Hz0- f ree .
4 E s t i m a t e d c o n c e n t r a t i o n o f H z 0 . E s t i m a t e d b y d i f f e r e n c e ( A n d e r s o n , 1 9 7 3 ) f o r c o l u m n s I , 2 , 4 ; e s t i m a t e d f r o mpressure , 9as compos i t ion and so lub i l i t y o therw ise .
s E s t i m a t e d t e m p e r a t u r e i n d e g r e e s C e l s i u s . S e e t e x t f o r c o l u m n s 1 , 2 , 4 . 0 t h e r w i s e p u b l i s h e d r u n t e m p e r a t u r e .
6Est imated pressure in Kbar . See tex t fo r 1 and 2 . o therw ise run pressure ( to ta l p ressure no t necessar i l y samea s P H " 0 / .
'Co. * i r t inq minera ls : Fo = o l i v ine w i th a tomic ra t io o f . l00
t lS / (Mg+Fe) ; t tU = hornb lende, Px = pyroxene, Cpx =
c a l c i u m - r i c h p y r o x e n e , 0 l = o l i v i n e , M t = m a g n e t i t e , 0 x = o x j d e .
Key to Co1 umns:
L = H o r n b l e n d e i n c l u d e d i n o l i v i n e t o g e t h e r w i t h g l a s s o f c o l u m n 2 ( a n a l y s i s 9 o f T a b l e 3 o f A n d e r s o n , 1 9 7 9 ) .
2 = A n d e s i t i c g l a s s i n c l u d e d i n o l i v i n e , A s a m a 1 7 8 3 ( a n a l y s i s 8 o f T a b . l e 3 o f A n d e r s o n , 1 9 7 9 ) '
3 = Resu l t o f add ing 0 .4 par ts hornb lende (co lumn 1) , 0 ,7 par ts g lass (co lumn 2) , and 0 .1 par t o f o r thopyroxene( s t o i c h i o m e t r i c E n 8 3 ) a n d s u b t r a c t i n g 0 . 2 p a r t s o l i v i n e ( F o B 3 ) .
4 = A n d e s i t i c a l a s s i n c l u d e d i n o l i v i n e , A s a m a 1 7 8 3 ( a n a l y s i s 1 0 o f T a b l e 3 o f A n d e r s o n , 1 9 7 9 ) .
5 = S y n t h e t i c a n d e s i t i c g l a s s ( a n a l y s i s 1 5 a o f T a b l e 7 b o f H e l z , 1 9 7 6 ) .
6 = S y n t h e t i c a n d e s i t i c g l a s s ( a n a l y s i s 1 6 a o f T a b l e 7 b o f H e l z , 1 9 7 6 ) .
7 = S y n t h e t i c a n d e s i t i c g l a s s ( f r o m T a b l e 8 o f H o l l o w a y a n d B u r n h a m , 1 9 7 2 ) .
8 = S y n t h e t i c a n d e s i t i c g l a s s ( f r o m T a b l e B o f H o l l o w a y a n d B u r n h a m , 1 9 7 2 ) .
9 = Synthe t ic andes i t i c A lass (average o f ana lyses 2 l and ?2 o f Tab le 6a o f A l len and Boet tcher , 1978) .
tions (Hm24, Usp34) suggest a temperature of equili-bration of 1080'C, according to the unpublished geo-thermometer of Lindsley and Rumble (1977). Thesame compositions suggest a temperature of 10600 to
1070"C, according to my visual interpolation of databy Buddington and Lindsley (1964) and Taylor(1964). Similar compositions but lower temperatures(990"-1020"C) were reported by Oshima (1976).
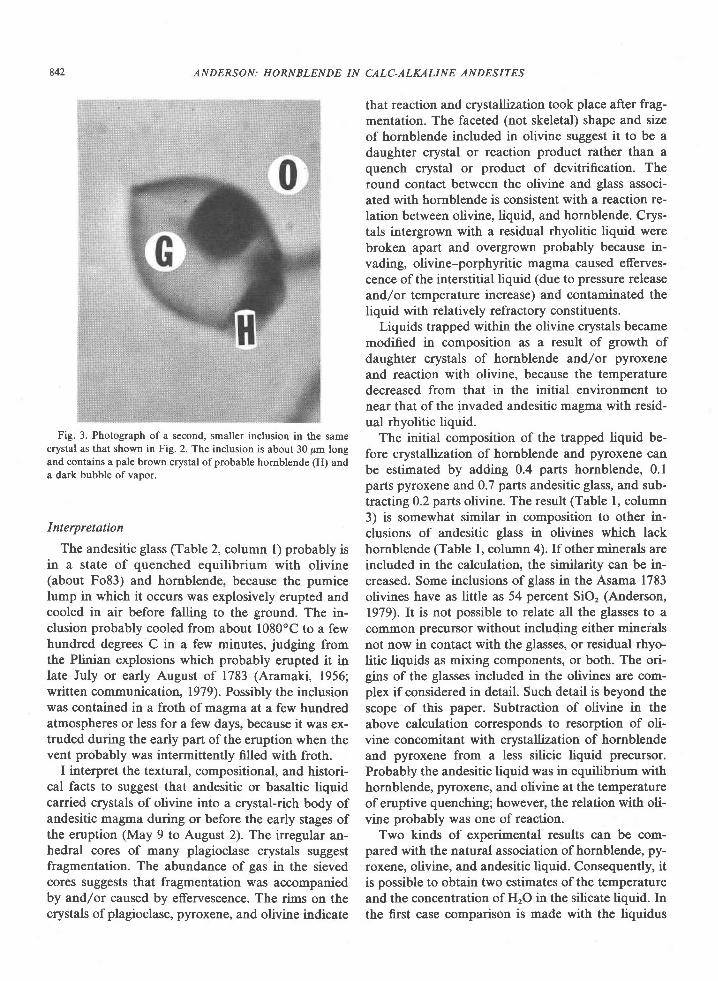
842
Fig. 3. Photograph of a second, smaller inclusion in the samecrystal as that shown in Fig. 2. The inclusion is about 30 pm longand contains a pale brown crystal of probable hornblende (H) anda dark bubble of vapor.
Interpretation
The andesitic glass (Table 2, column 1) probably isin a state of quenched equilibrium with olivine(about Fo83) and hornblende, because the pumicelump in which it occurs was explosively erupted andcooled in air before falling to the ground. The in-clusion probably cooled from about 1080'C to a fewhundred degrees C in a few minutes, judging fromthe Plinian explosions which probably erupted it inlate July or early August of 1783 (Aramaki, 1956;written communication, 1979). Possibly the inclusionwas contained in a froth of magma at a few hundredatmospheres or less for a few days, because it was ex-truded during the early part of the eruption when thevent probably was intermittently filled with froth.
I interpret the textural, compositional, and histori-cal facts to suggest that andesitic or basaltic liquidcarried crystals of olivine into a crystal-rich body ofandesitic magma during or before the early stages ofthe eruption (May 9 to August 2). The irregular an-hedral cores of many plagioclase crystals suggestfragmentation. The abundance of gas in the sievedcores suggests that fragmentation was accompaniedby and/or caused by effervescence. The rims on thecrystals of plagioclase, pyroxene, and olivine indicate
ANDERSON: HORNBLENDE IN CALC-ALKALINE ANDESITES
that reaction and crystallization took place after frag-mentation. The faceted (not skeletal) shape and sizeof hornblende included in olivine suggest it to be adaughter crystal or reaction product rather than aquench crystal or product of devitrification. Theround contact between the olivine and glass associ-ated with hornblende is consistent with a reaction re-lation between olivine, liquid, and hornblende. Crys-tals intergrown with a residual rhyolitic liquid werebroken apart and overgrown probably because in-vading, olivine-porphyritic magma caused efferves-cence of the interstitial liquid (due to pressure releaseand/or temperature increase) and contaminated theliquid with relatively refractory constituents.
Liquids trapped within the olivine crystals becamemodified in composition as a result of growth ofdaughter crystals of hornblende and/or pyroxeneand reaction with olivine, because the temperaturedecreased from that in the initial environment tonear that of the invaded andesitic magma with resid-ual rhyolitic liquid.
The initial composition of the trapped liquid be-fore crystallization of hornblende and pyroxene canbe estimated by adding 0.4 parts hornblende, 0.1parts pyroxene and 0.7 parts andesitic glass, and sub-tracting 0.2 parts olivine. The result (Table l, column3) is somewhat similar in composition to other in-clusions of andesitic glass in olivines which lackhornblende (Table l, column 4). If other minerals areincluded in the calculation, the similarity can be in-creased. Some inclusions of glass in the Asama 1783olivines have as little as 54 percent SiO, (Anderson,1979). lt is not possible to relate all the glasses to aconmon precursor without including either mineralsnot now in contact with the glasses, or residual rhyo-litic liquids as mixing components, or both. The ori-gins of the glasses included in the olivines are com-plex if considered in detail. Such detail is beyond thescope of this paper. Subtraction of olivine in theabove calculation corresponds to resorption of oli-vine concomitant with crystallization of hornblendeand pyroxene from a less silicic liquid precursor.Probably the andesitic liquid was in equilibrium withhornblende, pyroxene, and olivine at the temperatureof eruptive quenching; however, the relation with oli-vine probably was one of reaction.
Two kinds of experimental results can be com-pared with the natural association of hornblende, py-roxene, olivine, and andesitic liquid. Consequently, itis possible to obtain two estimates of the temperatureand the concentration of HrO in the silicate liquid. Inthe first case comparison is made with the liquidus
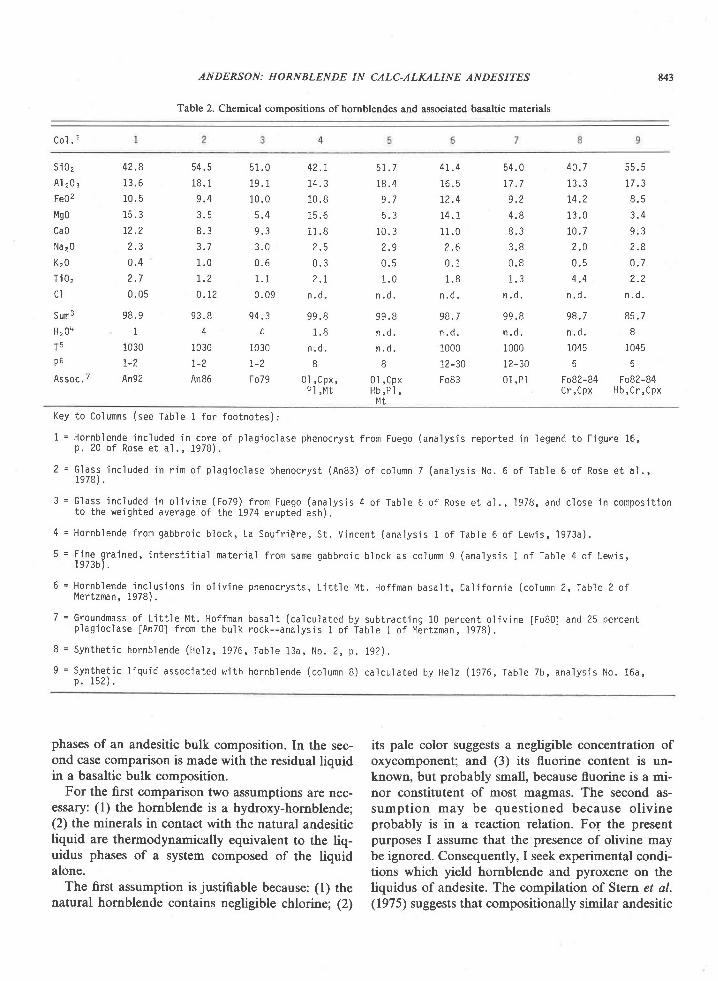
ANDERSON: HORNBLENDE IN CALC.ALKALINE ANDESITES
Table 2. Chemical compositions of hornblendes and associated basaltic materials
843
C o l . 1
s i02A l z 0 g
Fe02
Mgo
Ca0
Na20
K z 0
T i 0 2
c l
5Um"
Hr0q
T 5p 6
Assoc . 7
4 2 . 8
1 3 . 6
1 0 . 5
1 . 5 . J
12.22 ?
0 . 4
2 . 7
0 . 0 5
9 8 . 9
1
10301 '
An92
1 8 . 19 . 4
3 . 5
o . J
3 . 7
1 . 0
1 . 2
0 . 1 2
9 3 . 8
4
10 30r - a
An86
5 i . 0
1 9 . 1
1 0 . 0q 4
v . J
3 . 0
0 . 6
1 . 1
0 . 0 9
9 4 . 3
4
1030
I - 2F o79
4 2 . 1
1 4 . 3
i 0 . 8
1 5 . 6
1 1 . 82 . 5
0 . 32 ' l
n . d .
9 9 . 8
1 . 8
n . 0 .
8
0 l , C p x ,P I , M t
5 r . /
1 8 . 4q ' 1
1 0 . 32 A
0 . 5
1 . 0
n . o .
9 9 . 8
n , o .
n . o .
8
0 1 , C p xH b , P I ,Mt
41.4
1 6 . 5
12.4
1 4 . 1
1 1 . 0L . O
0 . 1
1 . 8
n . d .
98 .7
n . o .
1000
12-30
Fo83
5 4 . 0
1 7 . 7
9 . 2
4 . 8
8 . 3
3 . 8
0 . 8
n . o .
9 9 . 8
n . d .
1000
L2-30
O I , P I
40 .7 55 . 5
1 3 . 3 1 7 . 3
L 4 . 2 8 . 5
1 3 . 0 3 . 4
1 0 . 7 9 : 3
2 . 0 2 . 8
0 . 5 0 . 7
4 . 4 2 . 2
n . d . n . d .
9 8 . 7 8 5 . 7
n . d . 8
1045 1045
5 5
Fo82-84 Fo82-84C r , C p x H b , C r , C p x
Key to Co lumns (see Tab le 1 fo r foo tno tes) :
1 = Hornb lende inc luded in core o f p lag ioc lase phenocrys t f rom Fuego (ana lys is repor ted in Iegend to F igure 16 ,p . 2 0 o f R o s e e t a l . , 1 9 7 8 ) .
2 = G l a s s i n c l u d e d i n r i n o f p l a g i o c l a s e p h e n o c r y s t ( A n 8 3 ) o f c o l u m n 7 ( a n a l y s i s N o . 6 o f T a b l e 6 o f R o s e e t a l , ,1 9 7 8 ) .
3 = G l a s s j n c i u d e d i n o l i v i n e ( F o 7 9 ) f r o m F u e g o ( a n a l y s i s 4 o f T a b l e 6 o f R o s e e t a l . , . l 9 7 8 , a n d c l o s e i n c o m p o s i t i o nto the we igh ted average o f the 1974 erup ted ash) .
4 = H o r n b l e n d e f r o m g a b b r o i c b l o c k , L a S o u f r i E r e , S t . V i n c e n t ( a n a l y s i s 1 o f T a b l e 6 o f L e w i s , 1 9 7 3 a ) .
S = f ! lg g ra ined, in te rs t i t ia l mater ia l f rom same gabbro ic b lock as co lumn 9 (ana lys is 1 o f Tab le 4 o f Lewis ,I 9 7 3 b ) .
6 = H o r n b l e n d e i n c l u s i o n s i n o l i v i n e p h e n o c r y s t s , L i t t l e l Y t . H o f f m a n b a s a l t , C a l i f o r n i a ( c o l u m n 2 , T a b l e 2 o fMertzman, i978) .
7 = Groundmass o f L i t t le Mt . Hof fman basa l t (ca lcu la ted by subt rac t ing 10 percent o l i v ine IFo80] and 25 percentp lag ioc lase [An70] f rom the bu lk rock- -ana lys is 1 o f Tab le I o f l4er tzman, 1978) .
8 = S y n t h e t i c h o r n b l e n d e ( t i e l z , t g Z O , T a b l e 1 3 a , N o . 2 , p . 1 9 2 ) .
9 = S y n t h e t i c l i q u i d a s s o c i a t e d w i t h h o r n b l e n d e ( c o l u m n B ) c a l c u l a t e d b y H e l z ( 1 9 7 6 , T a b l e 7 b , a n a l y s i s N o . 1 6 a ,p , t 5 z ) .
phases of an andesitic bulk composition. In the sec-ond case comparison is made with the residual liquidin a basaltic bulk composition.
For the first comparison two assumptions are nec-essary: (l) the hornblende is a hydroxy-hornblende;(2) the minerals in contact with the natural andesiticliquid are thermodynamically equivalent to the liq-uidus phases of a system composed of the liquidalone.
The first assumption is justifiable because: (l) thenatural hornblende contains negligible chlorine; (2)
its pale color suggests a negligible concentration ofoxycomponent; and (3) its fluorine content is un-known, but probably small, because fluorine is a mi-nor constitutent of most magmas. The second as-sumption may be questioned because olivineprobably is in a reaction relation. For the presentpurposes I assume that the presence of olivine maybe ignored. Consequently, I seek experimental condi-tions which yield hornblende and pyroxene on theliquidus of andesite. The compilation of Stern et al.(1975) suggests that compositionally similar andesitic
ANDERSON: HORNBLENDE IN CALC-ALKALINE ANDESITES
liquids have hornblende and clinopyroxene on theliquidus if the temperature is below about 980oC andthe liquid contains more than about l0 weight per-cent HrO. The results of Allen and Boettcher (1978)on andesitic bulk compositions are consistent withthe above estimate: more than l0 weight percent H2Oin the liquid.
For the second comparison only one assumption isnec€ssary: the hornblende is a hydroxy-hornblende(ustffied above). I now seek experimental conditionswhich yield hornblende, pyroxene, and andesitic liq-uid in a reaction relation with olivine. Holloway andBurnham (1972) and Helz (1973, 1976) encounteredandesitic residual liquidus associated with horn-blende, pyroxene, and olivine (and in some casesmagnetite) at temperatures between about 1000 and1050'C and with about 6 to l0 weight percent HrOin the silicate liquid (Table l, columns 5-8). Allenand Boettcher (1978) found a comparable residualliquid (Table l, column 9, but no olivine). However,the compositions of residual liquids are difficult to es-tablish for experimental products. The detailed as-sessment by Helz (1976) suggests that the residualliquids at temperatures greater than about l0l5'C(at P",o : 5 kbar) are less siliceous than the naturalliquid. The results of Allen and Boettcher (1978) re-veal that the maximum temperature of hornblendestability increases from about 990o to l050oC as themole fraction of HrO in the gas decreases from I toabout 0.25, consistent with the findings of Holloway(19'73). At the mole fraction of 0.25 and a total pres-sure of l0 kbar, the partial pressure of HrO would beabout 2.5 kbar and there would be about 6 weightpercent HrO dissolved in the liquid. The Hawaiianbasalt investigated by Holloway and Burnham(1972), H.elz (1973, 1976) and Allen and Boettcher(1978) probably is neither appropriate nor optimalfor the generation of natural andesitic residual liq-uids because of its low concentrations of AlrO, andalkalis. Consequently, it is likely that high-aluminabasalt would yield andesitic residual liquids associ-ated with hornblende, pyroxene, and olivine at pres-sures less than 5 kbar and with P",o less than P,o.^, attemperatures greater than that found for Hawaiiantholeiite at 5 kbar : Pr,o: Ptor.r (namely, greaterthan about l0l5"C).
The above comparisons suggest that andesitic liq-uids and hornblende are stable to higher temper-atures and lesser concentrations of HrO in basalticbulk compositions than in andesitic bulk composi-tions. Probably the availability of olivine (or augite)
as a reactant is a principal cause ofthe greater stabil-ity of hornblende in basaltic systems. Other composi-tional differences [greater AlrO, (Bowen, 1928, p.lll), and alkalis (Cawthorn and O'Hara, 1976)l mayhelp stabilize hornblende, but they cannot be eval-uated quantitatively with published information. Insum, comparison of the natural andesitic liquid andassociated minerals with experimental products sug-gests that the natural liquid contained less than 6weight percent HtO and quenched from a temper-ature greater than l0l5'C.
Sekins et al. ll979l studied experimentally theAsama 1783 andesite. They found no hornblende onor near the liquidus, but did estimate that the resid-ual dacitic liquid (69-72 weight percent SiO,) of thisandesite contained 3.3 weight percent of HrO at960'C before extrusion.
Could the concentration and fugacity of H'O inthe included andesitic liquid exceed that of the sur-rounding residual dacitic liquid? Roedder's (1965)work reveals that olivines are strong enough at1200'C to contain excess pressures ofa few thousandatmospheres in an inclusion. However, a significantgradient of HrO fugacity from inclusion to rim ofcrystal would probably disappear by diffusion in afew days or weeks at temperatures near l000oc,judging from data on Fe, Mg, and O diffusivity inolivine (Buening and Buseck, 1973; Muehlenbachsand Kushiro , 197 5). The diffusion of HrO probably iscomparable to that of oxygen because of the similar-ity in size. The concentration of HrO (or OH-) in oli-vine probably is low in comparison to oxygen; con-sequently, the concentration gradient and diffusionof HrO in olivine may be small. Laboratory heatingexperiments on natural olivines with inclusions ofglass suggest that diffusive transfer of HrO is effectiveover tens of microns in a few hours at temperaturesabove l000oC (Anderson,1974). Probably both tem-perature and the fugacity of HrO in the trapped an-desitic liquid associated with hornblende are similarto those in the surrounding melt. Consequently, themost probable conditions for growth of the horn-blende from the trapped andesitic liquid are 1080"(Fe-Ti oxides) to 960oC and 100 atm (plausible pres-sure of froth in vent) to about 1000 atm of HrO pres-sure (Sekine et al., 1979).
In sum, the eruptive history, texture, and composi-tional relations of the hornblende-bearing inclusionsuggest that its glass represents an andesitic liquidquenched from a temperature of 1020+60"C and apartial pressure of HrO between about 100 and 1000
ANDERSON: HORNBLENDE IN CALC.ALKALINE ANDESITES
atm. The liquid was in equilibrium with hornblende,probably orthopyroxene, and olivine. The andesiticliquid probably contained a few percent HrO.
Hornblende associated with natural calc-alkalinebasaltic liquid
Observational data
Hornblendes associated with calc-alkaline basalticmaterial are known from La Soufridre, St. Vincent(Lewis, l973a,b), Fuego (Rose et al.,1978), and Med-icine Lake Volcano, California (Mertzman, 1978).Analyses of these hornblendes and related materialsare compared in Table 2. The compositions of thehornblendes are similar and have 13.6 to 16.5 weightpercent Al2O3, 2.3 to 2.6 weight percent NarO, and1.8 to 2.7 weight percent TiO, on an anhydrous basis.
Interpretation
It is uncertain whether any of these hornblendesare in a state of quenched equilibrium with basalticliquids, because the textural relationships are not de-finitive and because quenched basaltic matrix istermed andesite by some workers. A case-by-caseanalysis and interpretation is necessary.
Fuego volcano, Guatemala
The analyzed hornblende (Table 2, column l) is inthe anorthitic core (An92) of a plagioclase pheno-cryst (An92 to An80). The most closely associatedanalyzed glass (column 2, Table 2) is an inclusion inthe rim of the same crystal. The glass and the horn-blende are not in contact. The crystal is depicted inFigure 16 of Rose et al. (1978). The glass in theplagioclase is transitional in composition between ba-salt and andesite.
Rose et a/. suggested that the hornblende includedin the anorthitic core actually grew from a liquidwith a more basaltic composition than the inclusionof glass found within the rim of the plagioclase. Theirreasoning was as follows: many cores of anorthitefrom the same eruption contain inclusions of olivine.Subhedral crystals of anorthite (An92-90) are com-mon in olivine phenocrysts. The anorthitic cores ofthe plagioclase phenocrysts have round corners, com-prise a low proprotion of the total plagioclase, aresubequant and little zoned. Most of the Fuegoplagioclase is oscillatory zoned. The textures of theanorthite cores suggest that it is an early mineral toform in the Fuego magma. Some olivine phenocrystscontain inclusions of basaltic glass (51 percent SiOr)which are close to the weighted average composition
of the bulk rock extruded in the October eruption.The basaltic inclusions and bulk rock probably aresfunilar in composition to the parental liquid fromwhich the earliest crystals formed. The anorthiticcores and the included hornblende probably formodfrom a lquid with a composition near that of the ba-saltic glasses (Table 2, column 3).
The temperature of the parental basaltic liquidwas about 1030'C; it contained about 4 weight per-cent HrO (Rose et al., 1978). Subsequently, Harris(1979) has directly measured 1.6 to 3.2 weight per-cent of HrO in inclusions of glass in olivine pheno-crysts from Fuego. The lower concentration of 1.6weight percent HrO applies to parental liquid inFo77 olivine. AccordinEly, a revised estimate of1030150"C and 1.6 weight percent HrO is preferablefor the Fuego liquid which probably precipitated thehornblende.
La Soufriire, St. Vincent
Lewis's (1973a,b) descriptions show that vesicularand microcrystalline dark interstitial materialtouches hornblende as well as olivine, plagioclase,pyroxene, and magnetite in xenolirh 770. The inter-stitial material (termed scoria by Lewis) analyzed byhim is basaltic in composition (column 5, Table 2).Lewis (written communication, 1979) considers hisseparate to be a good one, little affected by productsof weathering and contaminating pieces of the crys-tals from the gabbro. His analyses show that inter-stitial scoria from different blocks differ in composi-tion, consistent with an indigenous origin of theinterstitial material. The most siliceous interstitialscoria comes from a block of gabbro lacking horn-blende but containing olivine, plagioclase, pyroxene,and magnetite. I would expect progressive solidi-fication to increase the number of minerals. s6lilizehornblende, and enrich the residual liquid in KrOand SiOr. Possibly the gabbro with the most siliceousinterstitial material originates from a lesser depth.Lewis's data suggest the crystallization of hornblendefrom basaltic liquid.
Liltle Mt. Hoffman, California
Olivine phenocrysts in a basaltic lava from a ventof Modoc Basalt (Powers, 1932) contain subround toirregular inclusions of hornblende (Mertzman, 197 8).Olivine phenocrysts in the scoria of the cinder con€(Little Mt. Hoffman) at the source of the flow haveround inclusions of devitrified glass, but no horn-blende (A. T. Anderson, unpublished data). Thecompositions of the hornblende and the groundmass
ANDERSON: HORNBLENDE IN CALC-ALEA,LINE ANDESITES
of the basalt are given in Table 2, columns 6 znd 7.Because the hornblende occurs included in olivine
phenocrysts in basaltic lava, Mertzman (1978) rea-sonably argued that the hornblende formed from ba-saltic liquid. The occurrence of hornblende includedin olivine together with andesitic glass (see Asama,above) suggests possible alternative interpretations:(l) the olivines with hornblende are xenocrysts de-rived from an andesitic environment, (2) the horn-blendes are daughter crystals which crystallized afterthe trapped melt attained an andesitic compositionby crystaltzing olivine. Mertzman's figures show thatthe hornblende is associated with microcrystallinematerial (probably formerly tiquid). Because of itsround shape and association with microcrystallinematerial, it is likely that the hornblende grew fromtrapped liquid after it had crystallized olivine.Growth of hornblende from supercooled liquid at apressure less than 1000 atmospheres is a third possi-bility. The composition of the liquid from which thehornblende in the Little Mt. Hoffman basalt fcrmedis uncertain. Mertzman (written communication,1979) notes that the 0.1 weight percent of K,O in theLittle Mt. Hoffman hornblendes suggests that the liq-uid from which they formed had less than about 0.5percent KrO. Possibly the groundmass of the LittleMt. Hoffman basalt is enriched in KrO by con-tamination (compare studies of East Sand Butte andcinder cone M39 of Anderson, 1976). Additionalwork on the Little Mt. Hoffman materials is rteededto evaluate the alternatives. I suggest that the liquidfrom which the hornblende grew was richeriin SiO,than is the bulk rock because of crystallization of oli-vine. Probably the liquid was similar in compositionto that of the calculated groundmass given as column7 of Table 2. The composition is that of a basaltic an-desite.
Mertzman (1978) extrapolated the results of Yoderand Tilley (1962) on the Warner high-alumina basaltto estimate that the hornblende initially formed atpressures greater than about 12 kbar. In my judge-ment Mertzman's apptcation and extrapolation ofYoder and Tilley's work is not justified, because thehornblende in question probably grew from a moresiliceous liquid with a greater Fel(Fe * Mg) ratiothan the Warner basalt.
Summary
Evidence for the crystallization of hornblendefrom natural calc-alkaline liquids at least as basic asbasaltic andesite (about 54 weight percent SiOr) iscompelling. The data of Rose et al. (1978) and Lewis
(1973a,b) on ejecta of Fuego and Soufriire volca-noes, respectively, suggest that hornblende growsstably from some high-alumina basalt liquids withabout 5l weight percent SiO, at temperatures near1030'C. The basaltic melts are comparatively rich inFe and poor in Mg and crystallize anorthitic plagio-clase (commonly greater than An85), olivine (Fo84to 66), and magnetite, as well as hornblende.
Experimental results (Helz, 1973, 1976) demon-strate the crystallization of hornblende at crustalpressures from basaltic andesite but not from basalticliquids. As argued above for andesitic liquids, thecrystallization of hornblende is fostered by greaterconcentrations of alumina and alkats and P,"o, >P",o probable for natural high-alumina basaltic liq-uids compared to the Hawaiian basalt studied byHelz. The Warner high-alumina basalt studied byYoder and Tilley (1962) has atypically greater MgO,MgO/(MgO + FeO), and low alkalis for basalticmembers of calc-alkaline magma series. Rose et a/.(1978) argued that the smaller MgO/MgO + FeO)ratio for Fuego high-alumina basalt would have theeffect of making its olivine liquidus temperatureabout 80oC less than that of the Warner basalt. Thedifference might permit liquidus hornblende for ba-salt with a concentration of about 5 percent HrO inthe liquid if PH,o : P,o,or. Experimental results are notconsistent with crystallization of hornblende fromsome natural high-alumina basaltic liquids with lessthan a few weight percent HrO.
. General discussion
The facts and interpretations outlined above sug-gest that hornblende crystallizes from andesitic andbasaltic liquids at crustal pressures. Most such horn-blende probably is a product of a reaction betweenliquid and olivine, as first suggested by Bowen (1928,p. 6l). The field and textural evidence of plutonicrocks is consistent with crustal formation of horn-blende by reaction between liquid and olivine(Miller, 1938; Best and Mercy, 1967; Lewis, 1973b,Ikeda, 1976;Walawender, 1976; Mullan and Bussell,1977). The l0o- to 106-year lifetimes of subduction-zone volcanoes (McBirney et al., 1974; Rose et al.,197 7 ; Mertzman, 197 7 ; McBirney, 1 978), the shorter-term variations in compositions of extruded products(Crandell and Mullineaux, 1973; Crandell et al.,1962; Newhall, 1979), and the I km' and smaller vol-umes of products of most individual eruptions, aswell as the larger volumes of rare caldera-formingeruptions (Smith, 1979), suggest that the roots of sub-duction zone volcanoes have thicknesses less than
ANDERSON: HORNBLENDE IN CALC-ALKALINE ANDESITES
about I km and solidify (and differentiate) on timescales appropriate for cold (crustal) environments.Geophysical models of Cenozoic island arcs suggestthey consist mostly of rock denser than andesite (forexample, see Grow, 1973). Gabbroic rocks, includinghornblende gabbro, have appropriate densities con-sistent with Kuno's (1968) model of a gabbroic crustin island arcs. Dominant hornblende gabbro in is-land arcs is particularly appealing because it canyield derivative magmas with the calcium-rich coresof plagioclase crystals, the isotopic ratios of stron-tium and lead, and the bulk compositions typical ofmany rocks in granodioritic batholiths (Piwinskii andWyllie, 1968; Faure and Powell, 1972; Doe, 1967;Wyllie, 1977).The basaltic and andesitic liquids fromwhich hornblende forms appear to contain 1.6i0.3(Harris, 1979) to 4t-2 wei5ht percent of HrO (Rose eral.,1978; Anderson, 1979). The temperature at whichhornblende forms in such liquids is probably be-tween 1080o and 960oC (see above).
Various factors probably contribute to the crystal-lization of hornblende from natural basaltic and an-desitic liquids with smaller concentrations of HrOthan the minimum of about 6 weight percent sug-gested by experinents (Yoder and Tilley, 1962; Hol-loway and Burnham, 1972; Green, 1972; Helz, 1973,1976; Stern et al.,1975; Allen and Boettcher, 1978):(l) olivine commonly is present as a reactant in natu-ral associations; (2) natural liquids have some CO, inaddition to HrO (Harris, 1979), consequently P^,o IP,"*,i (3) natural basaltic liquids associated with calc-alkaline magma series have greater concentrations ofalumina and alkalis than Hawaiian basalts used inexperiments; (4) natural calc-alkaline basaltic liquidshave smaller MgO/(MgO + FeO) and greater con-centrations of alkalis than the Warner basalt used inexperiments. All these differences probably enlargethe field of stability of hornblende beyond that foundin experiments. Reaction with olivine and other fac-tors probably foster the crystallization of hornblendein some natural basaltic and andesitic liquids withless than 6 weight percent of HrO, as suggested bythe natural occurrences described above.
Reaction between olivine and liquid yielding horn-blende acts to minimize the increase in Fel(Mg +Fe) ratio in derivative liquids. Two factors are signif-icant in minimizing the increase in Fel(Mg + Fe):(l) reaction between liquid and olivine; (2) crystalli-zation of a hornblende-bearing assemblage of miner-als in place of an equivalent anhydrous assemblage.
The effect of reaction was emphasized by Bowen(1928, p. 6l). With reaction magnesium-rich olivine
tends to buffer the Fel(Mg + Fe) ratio of crystalliz-ing minerals and residual liquid. Helz (1976) notedthat the Fel(MB * Fe) ratio of pyroxenes and resid-ual liquids decreases with crystallization in part ofthe range of solidification of hornblende, for ex-ample. Reaction with magnesium-rich minerals is aneffective mechanism which minimizes increases inthe Fel(Mg + Fe) ratio of residual liquids.
The influence on Fel(Mg + Fe) of the crystalliza-tion of a hornblende-bearing assemblage in place ofan equivalent anhydrous assemblage of minerals iscomplex and disputed (see Ringwood, 1974 and Al-len and Boettcher, 1978 for contrasting views). Whatis meant by "equivalent"? Consider the hornblende-out surface of Figure l. The mineralogy above thesurface and the composition of the liquid on the sur-face vary with P, T and X,,o. Many definitions of"equivalent" are possible. I adopt the following defi-nition because it seems consistent with most petrolo-gical discussions regarding the role of hornblende inthe formation of calc-alkaline rock series: on any sur-face marking identical bulk compositions of liquids,regions with different solids are equivalent.
For a given increment of crystallization how do theFel(Mg * Fe) ratios of residual liquids in two equiv-alent fields compare? For a given bulk composition(Hro-free), the liquidus surface is one (and possiblythe only) surface with identical compositions of liq-uids. Consider the difference between the Ol + Pland the Ol + Hb fields. I assume that the equilibriumcomposition of olivine on the liquidus is everywherethe same (Roeder and Emslie, 1970). In general theFel(Mg + Fe) of hornblende is greater than for asso-ciated olivine (Helz, 1973; Lewis, l973a,b). However,the effect on Fel(MB + Fe) of the residual liquid de-pends on the proportions of the crystallizing mineralsas well as on their compositions. The net iron enrich-ment caused by crystallization of Ol + Hb possibly isgreater than that for Ol + Pl. Probably the variationof Fel(Mg * Fe) of residual liquids with equilibriumcrystallization of equivalent hornblende-free andhornblende-bearing assemblages is complex, but notas large as the variations caused by fractional (as op-posed to equilibrium) crystallization. I agree, there-fore, with Cawthorn and O'Hara (1976) that theomission of iron from their experiments probably isnot crucial to an evaluation of the role of horn-blende. My emphasis is on reaction, however, ratherthan fractionation.
Minor increase in Fel(Mg + Fe) is a characteristicfeature of calc-alkaline magma series (Fenneg 1926;Kuno, 1950; Miyashiro, 1974). Consequently, the
ANDERSON: HORNBLENDE IN CALC-ALKALINE ANDESITES
spectrum of rock series found in subduction zone en-vironments (Peacock, l93l; Kuno, 1950, 1959) can berelated in part to variable reaction between olivineand liquid yielding hornblende: in general the morehornblende. the more calcic and the less iron-en-riched (less tholeiitic) the series. Many tholeiitic se-ries are calcic, however (for example Higashiyama,Isshiki, 1963) and have basaltic members with smallconcentrations of alkalis. The concentration of al-kalis in the parental liquid is important. Series lack-ing hornblende probably are tholeiitic or alkalic andtend to have groundmass pigeonite. Variable produc-tion of hornblende by reaction between liquid andolivine can help explain variable iron-enrichmentand lime-alkali index of manv subduction zonemagma series.
Implications
The probable crystallization of hornblende withinthe crust from subduction zone basaltic liquids withless than 6 weight percent HrO has implications for:(l) the genesis of andesite, (2) the temperature abovethe Benioff zone, (3) dehydration of subducted oce-anic crust, and (4) the origin of continental crust.
Genesis of andesite within the crust is implied bythe crustal formation of hornblende gabbro. As dis-cussed above, the Fel(Mg + Fe) ratio and calc-alkalic index for subduction zone magma series areexplicable according to crystallization of hornblendeby reaction between olivine and liquid. Although thestorage and release of HrO in and from hornblendein subducted oceanic crust may be important in ini-tiating subduction-zone magmatism, reactions be-tween hornblende and liquids in the Benioff zoneprobably have no direct influence on the character-istics of magma series in subduction zones (compareGreen and Ringwood, 1968; Green, 1972;'Boettcher,1973, with Stern et al., 1975; Cawthorn and O'Hara,1976; Allen and Boettcher, 1978).
Temperatures greater than about 1000"C are im-plied by basaltic liquids with less than about 6 weightpercent HrO. If subduction zone basaltic liquids orig-inate between the Benioff zone and the surface. thenthe temperature must be at least as high as l000oCsomewhere in the interval. Geophysical models ofsubduction zone processes generally yield lesser tem-peratures, particularly close to the relatively coldBenioff zone (compare Andrews and Sleep, 1974;Anderson et al., 1976, with Hasebe et al., l97O; Ito,1978). In order to be consistent with volcanologicaland geological data, geophysical models should yieldtemperatures in excess of l000oC in the magma path
between the Benioff zone and the volcanic front, ashas been emphasized by Hasebe et al. (197O).
Some of the HrO subducted as oceanic crust isprobably not returned to th€ surface by the out-gassing of parental basaltic liquids in subductionzones. There is an average ofabout I to 2 weight per-cent of mineralogically-bound HrO in the combinedoceanic crustal layers 2 (Melson et al., 1968; Hum-phris and Thompson, 1978) and 3 (Melson andThompson, l97l-Pnnz et al.,1976;lto, 1979; Ander-son et al., 1919). Parental basaltic liquids of sub-duction zones probably contain an average of about2 to 4 weight percent H'O (Eggler, 1972; Anderson,1973, 1979; but see also Marsh, 1976; Garcia et al.,1979; and Sekine et al., 1979, who estimate lowerconcentrations of HrO). The ratio of mass productionof crust in subduction zones (continental growth) tothat at oceanic ridges is about 0.2 (Anderson, 1974),based on the ratios of cross-sectional areas of Ceno-zoic oceanic island arcs (Murauchi et ul., 1968; Grow,1973) and the estimated cross-sectional areas of sub-ducted oceanic crust implied by late Cenozoic localrates of plate convergence (Chase, 1972). If all theHrO bound in subducted oceanic crust returns to thesurface by first entering into basaltic parental liquids,the expected concentration of HrO in the liquidsranges from 5 (l/0.2) to l0 (2/0.2) weight percent.The estimates of HrO actually present (2 to 4 per-cent) are uncertain, but are consistent with the notion(Anderson et al.,1979) that H'O is released from de-hydrating chlorite (the principal mineralogical resi-dence of HrO in oceanic crust) at too shallow a depth(Delany and Helgeson, 1978, but see Jsnkins, l!l!)to contribute to melting in subduction zones. TheHrO associated with the parental liquids of sub-duction zone magmas is similar in amount to theHrO supplied by amphiboles in the oceanic crust(Ito, 1979).
A complex origin of continental crust is implied byparental basaltic liquid and hornblende gabbro insubduction zones. A principal idea regarding the for-mation of continental crust involves the postulatedproduction and accretion of andesitic island arcs(Wilson, 1954, p.206), because average continentalcrust is andesitic in composition (Goldschmidt, 1933;Taylor, 1967). The chemical composition of the bulkand lower continental crust is uncertain and debated(see Taylor and Mclennan, 1979, and Tarney andWindley, 19'79 for contrasting views). If the bulk ofCenozoic island arcs is composed of hornblende gab-bro, then how can the andesitic composition of aver-age continental crust be explained? The implication
of dominant hornblende gabbro in island arcs is thatcontinental crust either was made diferently beforeCenozoic times or is further differentiated bv addi-tional processes.
Note added in proof
The following important article appeared after thispaper was accepted for publication: Ritchey, J. L.(1980) Divergent magmas at Crater Lake, Oregon:products of fractional crystallization and verticalzoning in a shallow, water-undersaturated chamber.J. Volcanol. Geothermal Res., 7,373-386.
AcknowledgmentsI thank P. J. Wyllie for helpful discussion and review of an early
version of this paper. C. Bacon (Menlo Park) provided a helpfulreview. I have benefited from rock samples and advice contributedby Shigeo Aramaki arid Naoki Onuma (Asama) and by W. I. Rose(Fuego). The work reported here was supported by NSF grantEAR76-15016 A0l .
References
Allen, J C. and A. L. Boettcher (1978) Amphiboles in andesiteand basalt: II. Stability as a function of P-T-1..,6-fo,. Am.Mineral., 63, lW4-1087.
--, and G. Marland (1975) Amphiboles in andesiteand basalt: I. Stability as a function of P-T-f o,. Am. Mineral.,60. 1069-1085.
Anderson, A. T. (1973) The before-eruption water content of somehigh-alumina magmas. Bull. Volcanol., 37, 53V552.
- (1974) Chlorine, sulfur, and water in magmas and oceans.Geol. Soc. Am. Bull., 85, 1485-1492.
- (1976) Magma mixing: petrological process and volcano-logical tool. J. Volcanol. Geotherm. Res., 1,3-33.
- (1979) Water in some hypersthenic magmas. J. Geot., g7,
509-53 l.- and D. Goufried (1971) Contrasting behavior of p, Ti and
Nb in a differentiated high-alumina olivine tholeiite and a calc-alkaline andesitic suite Geol. Soc. Am. Bull., 82,1929-1942.
--, D. M. Harris and E. Ito (1979) Toward geologic cycles forH2O, CO2, Cl and S. (abstr.). Int. Union Geodesy and GeophysicsAssembly, Canberra, Interdisciplinary Abstr., 26.
Anderson, R. N., S. Uyeda and A. Miyashiro (1976) Geophysicaland geochemical constraints at converging plate boundaries.Part I. Dehydration in the downgoing slab. Geophys. J. R. As-tron. Soc., 44, 333-357.
Andrews, D. J. and N. M. Sleep (1974) Numericat modelling oftectonic flow behind Island Arcs. Geophys. J. R. Astron. Soc., 38,237-25r.
Aramaki, S. (1956) The 1783 activity of Asama volcano, part l.Jap. J. Geol. Geogr.,27,189-229.
- (1957) The 1783 activity ofAsama volcano, part2 Jap. J.Geol. Geogr., 28, ll-33.
- (t963) Geology of Asama volcano. J. Fac. Sci. (Jniv To-kyo,14,229-443.
Best, M. G. and E. L. P. Mercy (1967) Composirion and crystalli-zation of mafic minerals in the Guadalupe igneous complex,California. Am. Minbral.. 52. 41647 4.
849
Boettcher, A. L. (1973) Volcanism and orogenic belts-the originof andesites. Tectonophysics, I 7, 223-240.
Bowen, N. L. (1928) The Evolution of the Igneous Roc&s. Dover,New York.
Buddington, A. F. and D. H. Lindsley (1964) Iron-titanium oxideminerals and synthetic equivalents. J. Petrol., 5,310-35'1.
Buening, D. K. and P. R. Buseck (1973) Fe-Mg lattice diffusion inolivine. "/. Geophys Res., 78, 6852-6862.
Cawthorn, R. G- and M. J. O'Hara (1976) Amphibole fractiona-tion in calc-alkaline magma genesis. Am. J. Sci., 276,309-329.
Chase, C. G. (1972) The N plate problem of plate tectonics.Geophys. J. Roy. Astron. Soc., 29, ll'l-122.
Crandell, D. W. and D. R. Mullineaux (1973) Pine Creek volcanicassemblage at Mount St. Helens, Washington. U.S. Geol. Sum.Bull., 1383A, l-23.
Recent age at Mount Rainier, Washhgton. U.S. Geol. Sum.Prof. Pap., 450-D, D64-D68.
Delany, J. M. and H. C. Helgeson (1978) Calculation of the ther-modynamic consequences of dehydration in subducting oceaniccrust to 100 kb and >800oC Am. J. Sci., 278,638-686.
Doe, B. R. (1967) The bearing of lead isotopes on the source ofgranitic magma. J. Petrol., & 5l-83.
Eggler, D. H. (1972\ Water-saturat€d and undersaturated meltingrelations in a Paricutin andesite and an estimate of water con-tent in the natural magma. Contrib. Mineral. Petrol., 34,261-27 t .
- and C. W. Burnham (1973) Crystauization and fractiona-tion trends in the system andesite-H2O-Co2-O2 at pressures tol0 Kb. Geol. Soc. Am. Bull., 84,2517-2532.
Faure, G. and J. L. Powell (1972) Strontium Isotope Geology.Springer-Verlag, Berlin.
Fenner, C. N. (1926) The Katmai magmatic province. J. Geol., 34,673-7',12.
Garcia, M. O and S. S. Jacobson (1979) Crystal clots, amphibolefractionation and the evolution of calc-alkaline magmas. Con-trib. Mineral. Petrol., 69, 319-327.
N W. K. Liu and D. W. Muenow (1979) Volatiles fromsubmarine volcanic rocks from the Mariana Island arc andtrough. Geochim. Cosmochim. Acta, 4 3, 305-3 12.
Goldschmidt, V. M. (1933) Grundlagen der quantitativen Geo-chemie. Fortschr. Mineral. Kristollogr. Pelrogr., 17, 112-156.
Green, T. H. (1972) Crystallization of calc-alkaline andesite undercontrolled high-pressure conditions. Contrib. Mineral. Petrol.,34. t5Ft66.
- and A. E. Ringwood (1968) Gehesis of the calc-alkaline ig-neous rock suite. Contilb. Mineral. Petrol., 18,105-162.
Grow, J. A. (1973) Crustal and upper mantle structure of the cen-tral Aleutian arc Geol. Soc. Am. Bull., 84,2169-2192.
Harris, D. M. (1979) Pre-eruption variations of H2O, S and Cl, ina subduction zone basalt (abstr.). EOS, 60,968.
Hasebe, R., N. Fujii and S. Uyeda (1970) Thermal processes un-der island arcs. Tectonophysics, 10,335-355.
Helz, R. T (1973) Phase relations of basalts in their melting rangeat PH2o:5 kb as a function ofoxygen fugacity. J. Petrol., 14,249-302.
- (1976) Phase relations of basalts in their melting ranges atPr,o : 5 kb. Part IL Melt compositions. J. Petrol., 17,139-193.
Holloway, J. R. (1973) The system pargasite-H2O-CO2: a modelfor melting of a hydrous mineral with a mixed volatile fluid. I.Experimental results to 8 kbar. Geochim. Cosmochim. Acta, 37,65 l'666.
ANDERSON: HORNBLENDE IN CALC-ALKALINE ANDESITES
850 ANDERSON: HORNBLENDE IN CALC-ALKALINE ANDESITES
- and C. W Burnham (1972) Melting relations of basalt with
equilibrium water pressure less than total pressure. J. Petrol.,
13. l -29.- and c E. Ford (1975) Fluid-absent melting ofthe fluoro-
hydroxy amphibole pargasite to 35 kilobars. Earth Planet. Sci.
Lett.. 25.4448Humphris, S. E. and G. Thompson (1978) Hydrothermal altera-
tion of oceanic basalts by seawater. Geochim. Cosmochim. Acta,
42, t07-126.Ikeda, Y. (1976) Petrology and mineralogy ofthe lritono basic in-
trusive rocks, central Abukuma plateau. J. Fac. Sci. Univ. To-
kyo, 19,229-251Isshiki, N. (1963) Petrology of Hachijo-jima volcano group, Seven
Izu Islands, Japan. J. Fac. Sci. Univ. Tokyo,15,91-134.
Ito, E. (1979) High-temperature alteration of oceanic gabbros
frorn the mid-Cayman rise (abstr.). Geol. Soc. Am. Abstracts
with Progrums, 11,449.Ito, K (1978) Ascending flow between the descending lithosphere
and the overlying asthenospherc. J. Geophys. Res.,83,262-268.
Jakds, P and A. J. R. White (1972) Hornblendes from calc-alka-.
line volcanic rocks of island arcs and continental margitts. Am.
Mineral.. 57.887-902.Jenkins, D. M. (1979) Experimental phase relations of chlorite-
and amphibole-bearing peridotites (abstr.). GeoI. Soc. Am. Ab-
stracts with Programs, 11,451.
Kuno, H. (1950) Petrology of Hakone volcano and the adjacent
areas, Japan. Geol. Soc. Am. Bull., 61,95'l-1020.- (1959) Origin ofCenozoic petrographic provinces ofJapan
and surrounding areas Bull. Volcanol., 20, j7-76.
- (1968) Origin of andesite and its bearing on the island arc
structure. Bull. Volcanol, 32, 14l-176.
Lewis, J F. (1973a) Mineralogy of ejected plutonic blocks of the
Soufridre volcano, St. Vincent: olivine, pyroxene, amphibole
and magnetite paragenesis. Contrib. Mineral. Petrol., 38, 197-
220.- (1973b) Petrology of ejected plutonic blocks of the Souf-
ridre volcano, St. Vincent, West Indies. J. Petrol., 14,8l-112.
Lindsley, D. H. and D. Rumble, III (1977) Therrnodynamic solu-
tion model for coexisting Ti-magnetite plus ilmenite (abstr.).
E O S , 5 8 , 5 1 9 .Marsh, B. D. (1976) Some Aleutian andesites: their nature and
source. ,/. Geol., 84,2746McBirney, A. R. (1978) Volcanic evolution of the Cascade range.
Am. Rev. Earth Planet. Sci.,6,437456.J. F. Sutter, H. R. Naslund, K. G. Sutton and C. M. White
(1974) Episodic volcanism in the central Oregon Cascade
Range. Geology, 2, 585-589.Melson, W. G. and G. Thompson (1971) Petrology of a transform
zone and adjacent ridge segments. R. Soc. Lond. Phil. Trans.,
268.423441.- and T. H. van Andel (1968) Volcanism and metamorphism
in the mid-Atlantic ridge, 22oN latitude. J. Geophys. Res., 73,
5925-5941.Mertzman, S. A., Jr. (1977) The petrology and geochemistry of the
Medicine Lake volcano, California. Contrib. Mineral. Petrol.,
62 .221 -247 .- (1978) A tschermakite-bearing high-alumina olivine tho-
leiite from the southern Cascades, California. Contrib. Mineral.
Petrol , 67,261-265.Miller, F S. (1938) Hornblendes and primary structures of the San
Marcos gabbro. Geol. Soc. Am. Bull.,49, l2l3-L232.
Minakami, T. (1942) On the distribution of volcanic ejecta (Part
2). The distribution of Mt. Asama pumice in 1783. Bull. Earthq.
Res. Inst.. 20.93-106.
Miyashiro, A. (1974) Volcanic rock series in island arcs and active
continental rnargins. Am. J. Sci., 274,321-355.
Moorhouse, W W. (1959) The Study of Rocks in Thin Section.
Harper and Row, New York.
Muehlenbachs, K. and I. Kushiro (1975) Measurements of oxygen
diffusion in silicates (abstr.). EoS, 56,459.
Mueller, R. F. (1969) Hydration, oxidation, and the origin of the
calc-alkali series. NlSl TN, D-5400, l-27.
Mullan, H. S. and M. A. Bussell (1977) The basic rock series in
batholithic associations. Geol. M ag., 1 1 4, 265-280.
Murauchi, S., N. Den, S Asano, H. Hotta, T. Yoshii, T' Asanuma,
K. Hagiwara, K. Ichikawa, T. Sato, W. J. Ludwig' J. I. Ewing'
N. T. Edgar and R. E. Houtz (1968) Crustal structure of the
Philippine Sea. J. Geophys. Res., 73,3143-fl'71.
Newhall, C. G. (1979) Temporal variation in the lavas of Mayon
volcano, Philippines. J. Volcanol. Geothermal. Res., 6, 6l-83.
Oshima, O. (1976) Fe-Ti oxide minerals of the 1973 eruption of
Asama volcano. Univ. Tokyo, Coll. of Gen' Educ., Sci. Pap.' 26'
39-50.Peacock, M. A. (1931) Classification of igneous rock series' "/.
Geol., 39,54-67.Piwinskii, A. (1973) Experimental studies of granitoids from the
central and southern Coast Ranges, California. Tschermaks
Mineral. Petrogr. Mitt., 20, 107-130.- and P. J. Wyllie (1968) Experimental studies of igneous
rock series: a zoned pluton in the Wallowa batholith, Oregon. .I.
Geol., 76,205-234.Powers, H. A. (1932) The lavas of the Modoc lava bed quadrangle,
California. Am. Mineral., 17, 253-293.
Prinz, M., K. Keil, J. A. Green, A. M. Reid, E' Bonatti and J.
Honnorez (1976) Ultramafic and mafic dredge samples from the
equatorial mid-Atlantic Ridge and fracture zone. J. Geophys.
Res., 81, 408'l-4103.Ringwood, A. E. (19'14) The petrological evolution of island arc
systems. Geol. Soc. Lond. J., 130, 183-2M.
Robertson, J. K. and P. J Wyllie (1971) Rock-water systems with
special reference to the water-deficient tegion. Am. J. Sci., 271,
252-277 -
Roedder, E. (1965) Liquid CO2 inclusions in olivine-bearing nod-
ules and phenocrysts frombasalts. Am. Mineral., 50,1746-1782.
Roeder, P. L. and R. F. Emslie (1970) Olivine-liquid equilibrium.
Contrib. Mineral. Petrol., 29, 2'l 5-289.
Rose, W I., Jr., A. T. Anderson, Jr., L. G. Woodruff and S. B'
Bonis (1978) The October 1974 basaltic tephra from Fuego vol-
cano: description and history of the magma body. "/. Volcanol.
Geotherm. Res., 4, 3-53.N. K. Grant, G. A. Hahn, I. M. Lange, J. L. Powell, J.
Easter and J. M. Degraf (1977) The evolution of Santa Maria
volcano, Guatemala. J. Geol., 85, 63-87.
Sakuyama, M. (1979) Lateral variations of H2O contents in Qua-ternary magmas of northeastern Japan. Earth Planet. Sci. Lett.,
43, t03-lrl.Sekine. T.. T. Katsura and S. Aramaki (1979) Water saturated
phase relations of some andesites with application to the estima-
tion of the initial temperature and water pressure at the time of
eruption. Geochim. Cosmochim. Acta, 43, 1367-1f76.
Smith, R L. (1979) Ash-flow magmatism. Geol. Soc. Am. Spec-
Pap., 180,5-27.Stern, C. R., W. L. Huang and P. J. Wyllie (1975) Basalt-ande-
site-rhyolite-H2O: crystallization intervals with excess H2O and
ANDERSON: HORNBLENDE IN CALC-ALKALINE ANDESITES 851
HrO-undersaturated liquidus surfaces to 35 kilobars, with im-plications for magma genesis. Earth Planet. Sci. Lett., 2g, lgg-196.
Stewart, D. C. (1975) Crystal clots in calc-alkaline andesites asbreakdown products of high-Al amphiboles. Contrib. Mineral.Petrol., 53,195-2A4.
Tarney, J. and B. F. Windley (1979) Continental growth, islatrdarc accretion and the nature of the lower crust-a reply to S. R.Taylor and S. M. Mcl-eonar.. Geol. Soc. Lond. J., 136,5Ol-504.
Taylor, R. W. (1964) Phase equilibria in the system FeO-FerO3-TiO2 at 1300"C. Am. Mineral.,49, 1016-1030.
Taylor, S. R. (1967) The origin and growth ofconrinents. Tectono-physics,4, 17-34.
- and S. M. Mclennan (1979) Discussion on ,.Chemistry,thermal gradients and evolution of the lower continental crust.In J. Tarney and B. F. Windley, Eds., Geol. Soc. Lond. J., 136,49't-500.
Turner, F. J. and J. Verhoogen (1960) Igneous and MelamorphicPetrology. McGraw-Hill, New York.
Walawender, M. J. (1976) Petrology and emplacement of the LosPinos pluton, southern California. Can. f. Earth Sci, 1J, 1288-1300.
Wilson, J. T. (1954) The development and structure of the crust.In G. P. Kuiper, Ed., The Earth as a Planet, p. 138-214. Univer-sity of Chicago Press, Chicago, Illinois.
Wyllie, P. J. (19'17) Crusral anatexis: an experimental review. Tec-tonophysics, 43, 4l-7 l.
Yoder, H. S. and C. E. Tilley (1962) Origin of basalt magmas: anexperimental study of natural and synthetic rock systems. ./.Petrol., 3, 342-532.
Manuscript received, October 27, 1979;acceptedfor publication, March 25, 1980.
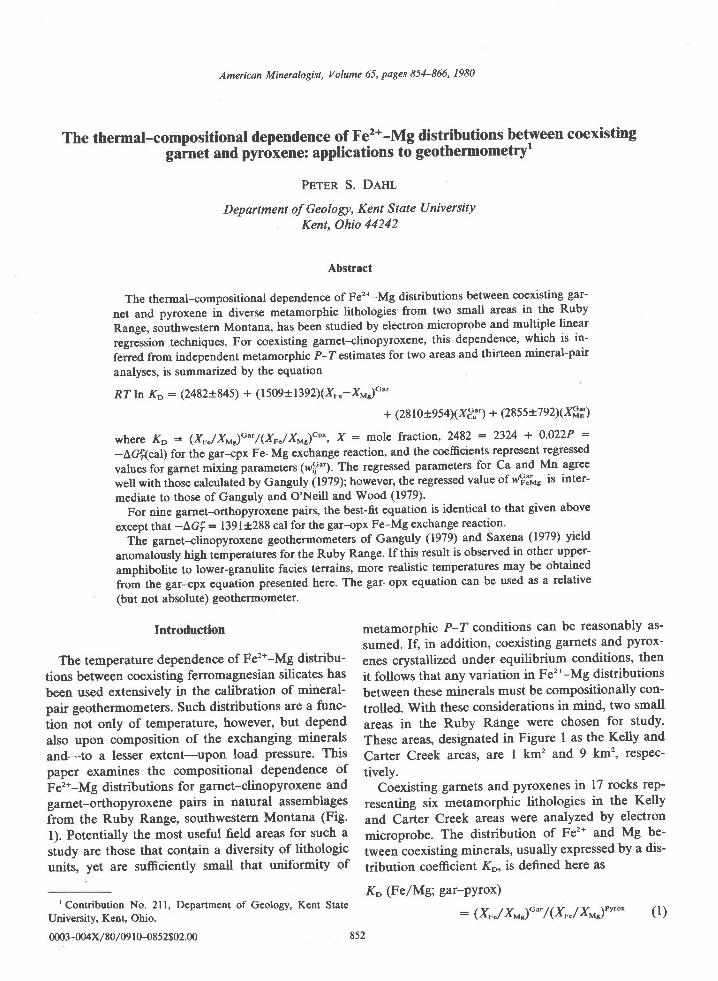
American Mineralogist, Volume 65, pages 854-866' 1980
The thermal-compositional dependence of Fe2+-Mg distributions between coexistinggarnet and pyr6xene: applications to- geothermometryr
PETER S. DAHI.
Department of Geology, Kent State UniversityKent, Ohio 44242
Abstract
The thermal-compositional dependence of Fe2*-Mg distributions between coexisting gar-
net and pyroxene in diverse metamorphic lithologies from two small areas in the Ruby
Range, southwestern Montana, has been studied by electron microprobe and multiple linear
regression techniques. For coexisting garnet-clinopyroxene, this dependence, which is in-
ferred from indepindent metamorphic P-Testimates for two areas and thirteen mineral-pair
analyses, is surnrnarized by the equation
Rf h KD : Q482!845) + (1509i1392)(X."-X'Jo"
+ (28 I 0t954)(X3."') + (28551792XX9T)
whereXo : (XFJXM)G* / (XF" /XME)Cq ' ,X :mo le f rac t i on ,2482 :2324+0 '022P :-AGPdcal) for ihe garJpx Fe-Mg .*ihuog. reaction, and the coefficients represent regressed
values for garnet mixing parameters (wf;'). The regressed parameters for Ca and Mn agree
well with those calculated by Ganguly (tglS); however, the regressed value of rvg:L, is inter-
mediate to those of Ganguly and O'Neill and Wood (1979)'
For nine garnet-orthopyroxene pairs, the best-fit equation is identical to that given above
except that -AGi: l39l+288 cal for the gar-opx Fe-Mg exchange reaction'
The garnet-clinopyroxene geothermometers of Ganguly (1979) and Saxena (1979) yield
anomalously high timperatures for the Ruby Range. If this result is observed in other upper-
amphibolite to iower-granulite facies terrains, more realistic temp€ratures may be obtained
from the gar-{px equation presented here. The gar-opx equation can be used as a relative
(but not absolute) geothermometer.
Introduction metamorphic P-T conditions can be reasonably as-
sumed. If, in addition, coexisting garnets and pyrox-
The temperature dependence of Fe'*-Mg distribu- enes crystallized under equilibrium conditions, then
tions between coexisting ferromagnesian silicates has it follows that any variation in Fe'*-Mg distributions
been used extensively in the calibration of mineral- between these minerals must be compositionally con-
pafu geothermometers. Such distributions are a func- trolled. With these considerations in mind, two small
iion not only of temperature, however, but depend areas in the Ruby Range were chosen for study.
also upon composition of the exchanging minerals These areas, designated in Figure I as the Kelly and
and-to a lesser extent-upon load pressuqe. This Carter Creek areas, ate I km2 and 9 km', respec-
paper examines the compositional dependence of tively.Fe,*-Mg distributions for garnet-clinopyroxene and Coexisting garnets and pyroxenes in l7 rocks rep-
garnet-orthopyroxene pairs in natural assemblages resenting six metamorphic lithologies in the Kelly
from the Ruby Range, southwestern Montana (Fig. and Carter Creek areas were analyzed by electron
l). Potentially the most useful field areas for such a microprobe. The distribution of Fe'* and Mg be-
study are those that contain a diversity of lithologic tween coexisling minerals, usually expressed by a dis-
units, yet are sufficiently small that uniformity of tribution coefficient Ko, is defined here as
K, (FelMg; gar-PYrox)
: (xr./ X_")o",/(Xo./x*")ry,"* (l)rContribution No. 2ll, Department of Geology, Kent State
Univenity, Kent, Ohio.
ON3-MX/BO/0910-0852$02.00 852
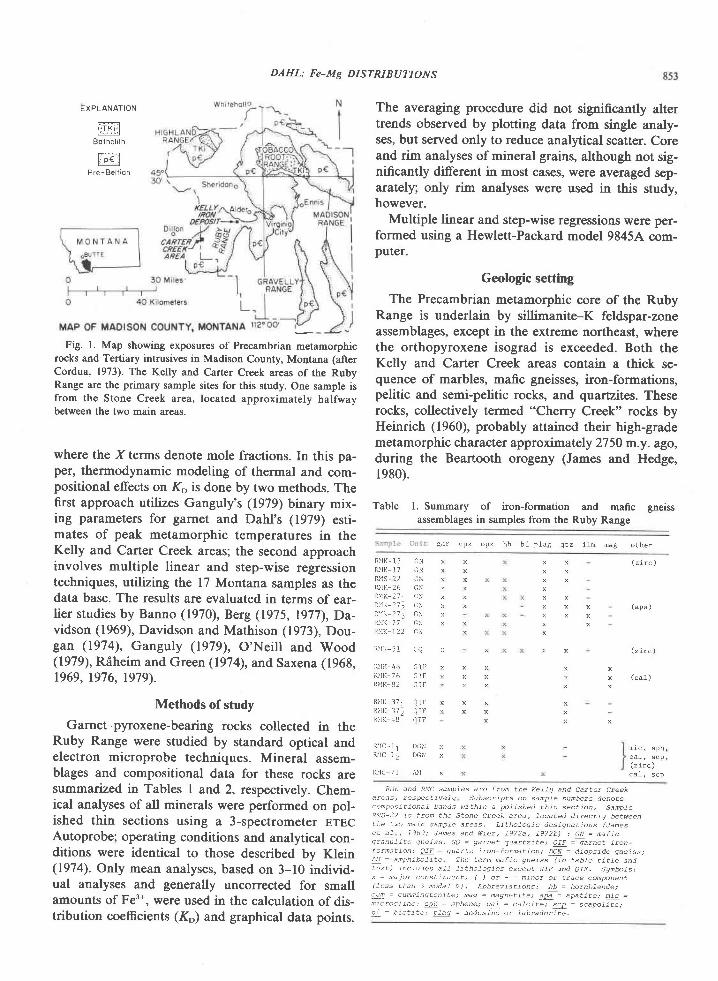
DAHL: Fe-Mg DISTRIBUTION S
EXPLANATION
reB o t h o l i l h
EPre - Be l t ion
Fig. l. Map showing exposures of Precambrian metamorphicrocks and Tertiary intrusives in Madison County, Monlana (afterCordua, 1973). The Kelly and Carter Creek arens of the RubyRange are the primary sample sites for this study. One sample isfrom the Stone Creek area, located approximately halfwaybetween the two main areas.
where the X terms denote mole fractions. In this pa-per, thermodynamic modeling of thermal and com-positional effects on KD is done by two methods. Thefirst approach utilizes Ganguly's (1979) binary mix-ing parameters for garnet and Dahl's (1979) esti-mates of peak metamorphic temperatures in theKelly and Carter Creek areas; the second approachinvolves multiple linear and step-wise regressiontechniques, utilizing the 17 Montana samples as thedata base. The results are evaluated in terms of ear-lier studies by Banno (1970), Berg (1975, 1977),Da-vidson (1969), Davidson and Mathison (1973), Dou-Ean (1974), Ganguly (1979), O'Neill and Wood(19'19), Riheim and Green (1974), and Saxena (1968,1969, 1976,1979).
Methods of study
Garnet-pyroxene-bearing rocks collected in theRuby Range were studied by standard optical andelectron microprobe techniques. Mineral assem-blages and compositional data for these rocks aresummarized in Tables I and 2, respectively. Chem-ical analyses of all minerals were performed on pol-ished thin sections using a 3-spectrometer ETECAutoprobe; operating conditions and analytical con-ditions were identical to those described by Klein(1974). Only mean analyses, based on 3-10 individ-ual analyses and generally uncorrected for smallamounts of Fe3t, were used in the calculation of dis-tribution coefficients (K") and graphical data points.
R I K - 1 3 C i lR\tK-t 7 Ct{Rl lS-22 CNrl \1r(-26 CNI U I K 2 7 1 c Ni i I K - 2 7 2 f r -R ) I K - 2 7 t C Nlr\K-77 Gl ir{} lK-122 CN
it l lK-51 cQ
ILIK_46 C IL]i . \ IK_76 CITR l { K - 8 2 C I f
RirK-371 f lu:n n ( - 3 7 2 Q t fR}IK-48 OII
r+lc-1t Da)iR\1C-12 DGr" x
rL{c 7t A}1
The averaging procedure did not significantly altertrends observed by plotting data from single analy-ses, but served only to reduce analytical scatter. Coreand rim analyses of mineral grains, although not sig-nificantly different in most cases, were averaged sep-arately; only rim analyses were used in this study,however.
Multiple linear and step-wise regressions were per-formed using a Hewlett-Packard model 9845A com-puter.
Geologic setting
The Precambrian metamorphic core of the RubyRange is underlain by sillimanite-K feldspar-zoneassemblages, except in the extreme northeast, wherethe orthopyroxene isograd is exceeded. Both theKelly and Carter Creek areas contain a thick se-quence of marbles, mafic gneisses, iron-formations,pelitic and semi-pelitic rocks, and quartzites. Theserocks, collectively termed "Cherry Creek" rocks byHeinrich (1960), probably attained 1[si1 high-grademetamorphic character approximately 2750 m.y. ago,during the Beartooth orogeny (James and Hedge,1980).
Table L Summary of iron-formation and mafic gneissassemblages in samples from the Ruby Range
g a r c p x o p x h b b i p 1 a 8 q r z i 1 m n a g o t h e r
x
x
X
x
xxxx
xx
x
xx
X
x x
Xx
K
xx
( a P a )
( c a l )x
X
x
x
xx
c a l , s c p ,( z i r c )
Ri l la a rK l RMC samples arc f ron the Ke l lg and Car te . Creekareas , rcspec t ive lq Subscr ip ts an sampfe nunbers . leno te
o n p a . t ' a n - l o J . J s v ! t h i n r p o l i s b e d L h i n s c . L ; o 1 . S a n p t lR l tS-22 is f ron the Stone Creek area , loca ted d i rec t lg be tweent h e t w o n a i n s a n p l a a r e a s . L i t h o f o g i c d e s i g n a t i o n s ( J a n e s
d i l , 1 9 6 9 ; J a m e s a n . l W i e r , 1 9 7 2 a , 1 9 7 2 b ) : G N = n a f i c.J ranu l i t c gne iss ; GQ = garnet qaar tz i te ; m = garnet i ron-f o r n a t j a n ; Q f ! = q u a r t z j r o n - f a r @ t i a n ; M = d i o p s i ( t c g n e i s s ;
M = anp l l jbo l j te The te rm naf jc qne jss ( jn tab fe t i t le andt . )x t ) inc lDdes a l l l i tha log ies except GIF and e IF . Sgnbofs :x = na jo r cans t r tucn t ; ( ) o r - = mjnar o r t race con lnnent( l cs -s t i ran 3 noda l 9 ; ) . Abbrev ia t ians : hb = hornb lende;
c_ ! ! = cunn ing tan i te ; naq = maqnet i te ; epa = apat j te ; n jc =
rn ic roc l ine ; sph = sphene. ; d = ca lc i te ; rcp = scapo l i te ;
b j : b lo t i t c ) PJ3- ! = anc les ine or fabradar i te .
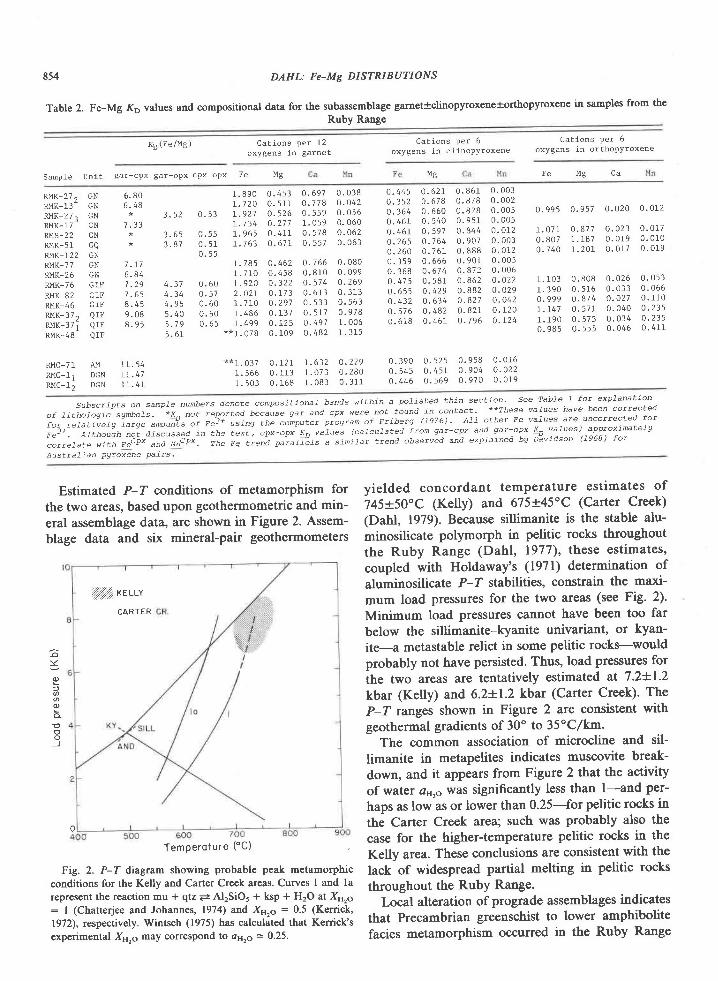
854 DAHL: Fe-Mg DISTRIBUTIONS
Table 2. Fe-Mg Kp values and compositional data for the subassemblage garnettclinopyroxenetorthopyroxene in samples from the
Ruby Range
KD (Fe/Mc) a ' r i ^ n c n a r l ?
oxygens in garne t
C a t i o n s p e r 6 C a t i o n s p e r 6
oxygens in cl lnopyroxene oxygens in orthopyroxene
S a n p l e U n i t g a r - c p x g a r - o p x c p x - o p x F e C aMgF eM g
RMK-27, GN 6 .80tuYK- l3 ' GN 6 .48RMK-2 7 j GNR M K - 1 7 - G N 7 . 3 3RMS-22 GN *
RMK-51 GQ *
RMK_I22 GNR M K . 7 7 G N 1 . I 7RMK-26 GN 6 .84R M K _ 7 6 G I F 7 . 2 9RMK-82 GIF 7 .65RMK-46 GIF 8 . 45RMK-37. QrF 9 .08RxK-37 i QrF 8 .95RMK-48 QIF
AM 11. 54DGN I I .47D G N 1 1 . 4 1
1 . 8 9 0r . 7 2 0
0 . 5 3 r . 9 2 7r . 7 3 4
0 . 5 5 1 . 9 6 50 . 5 1 r . 7 6 30 . 5 5
0 . 4 s 3 0 . 6 9 7 0 . 0 3 80 . 5 1 1 0 . 7 7 8 0 . 0 4 20 . 5 2 6 0 . 5 5 9 0 . 0 5 6o . 2 1 7 1 . 0 5 9 0 . 0 6 00 . 4 1 1 0 . 5 7 8 0 . 0 6 20 . 6 7 1 0 . 5 5 7 0 . 0 6 3
o . 4 6 2 0 . 7 6 6 0 . 0 8 00 . 4 5 8 0 . 8 1 0 0 . 0 9 9o . 3 2 2 0 , 5 7 4 0 . 2 6 90 . r 7 3 0 . 6 1 3 0 . 3 r 30 . 2 9 7 0 . 5 3 3 0 . 5 6 30 . r 3 7 0 . 5 1 7 0 . 9 7 8o . r 2 5 0 . 4 9 7 1 . 0 0 60 . 1 0 9 0 . 4 8 2 1 . 3 1 5
o . 4 4 5 0 . 6 2 ro . 3 5 2 0 . 6 7 80 . 3 6 4 0 . 6 6 00 . 4 6 1 0 . 5 4 00 . 4 6 r o . 5 9 7o . 2 6 5 0 . 7 6 40 . 2 6 0 0 . 7 6 10 . 3 5 9 0 . 6 6 60 . 3 6 8 0 . 6 7 40 . 4 7 5 0 . 5 8 1o . 6 5 5 0 . 4 2 90 . 4 3 2 0 . 6 3 4o . 5 7 6 0 . 4 8 20 . 6 1 8 0 . 4 6 1
0 . 8 6 1 0 . 0 0 30 . 8 7 8 0 . 0 0 20 . 8 2 8 0 . 0 0 50 . 9 5 1 0 . 0 0 50 . 8 4 4 0 . 0 1 20 . 9 0 7 0 . 0 0 30 . 8 8 8 0 . 0 1 20 . 9 0 1 0 , 0 0 50 . 8 7 2 0 . 0 0 6o . 8 6 2 0 . O 2 20 . 8 8 2 0 . 0 2 9o . 8 2 7 0 . 0 4 20 . 8 2 1 0 . 1 2 0o . 1 9 6 0 . r 2 4
0 . 9 9 5 0 . 9 5 7
1 . 0 7 1 0 . 8 7 i0 . 8 0 i 1 . 1 8 70 . 7 4 0 1 . 2 0 1
1 . 1 0 3 0 . 8 0 81 . 3 9 0 0 . 5 1 60 . 9 9 9 0 . 8 7 4r . L 4 7 0 . 5 7 11 . r 9 0 0 . 5 7 50 . 9 8 5 0 . 5 5 5
0 . 0 2 0 0 . 0 1 2
0 . 0 2 3 0 . 0 1 70 . 0 1 9 0 . 0 1 00 . 0 1 7 0 . 0 1 9
0 . 0 2 6 0 . 0 5 30 . 0 3 3 0 . 0 6 6o .027 0 .1100 . 0 4 0 0 . 2 3 50 . 0 3 4 0 . 2 3 50 . 0 4 6 0 . 4 1 1
3 . 5 2
3 . 6 53 . 8 7
1 . 7 8 51 . 7 1 0
4 . 3 7 0 . 6 0 1 . 9 2 04 . 3 4 0 . 5 7 2 . O 2 L4 . 9 6 0 . 6 0 1 . 7 1 05 . 4 0 0 . 5 0 1 . 4 8 65 . 7 9 0 . 6 5 1 . 4 9 95 . 6 r x x l . 0 7 8
R M C - 7 1
RMC-1 IRMC-12
x * 1 . 0 3 7 o . r 2 : - r . 6 3 2 0 . 2 2 9 0 . 3 9 01 . 5 6 6 0 . 1 1 3 1 . 0 7 3 0 . 2 8 0 0 . 5 4 51 . 5 0 3 0 . 1 6 8 1 . 0 8 3 0 ' 3 r 1 0 . 4 4 6
0 . 5 2 5 0 . 9 5 8 0 . 0 1 60 . 4 5 1 0 . 9 0 4 0 . o 2 20 . 5 6 9 0 . 9 7 0 0 . 0 1 9
subscripts on samp,Le numbers denote composit ionaf bands within a pof ished thin sect ion' see Tabfe f for expfanataon
of f i thoLogic sqmbols. *Ljnot rep^otted because gar and cpx were not faund in contact ' **These vaTues have been corrected
f o r . . r e f a t r v e f g - r u r g u u r c u i l s ; ; ; ; 5 1 - ; ; ; " ; - t i e . o ^ p u t " r p i o s r u ^ o f F r i b e t q ( f g 7 6 ) ' A l l o t h e t F e v a f o e s a r e u n c o r r e c t e d f o r
Fe'- . Atthough not discussed in xhe text, cpx-opx 5 va' tue-s (cafcafated f tom gar-cpx *1 z":-""1:-5-, ,Y1:\"^t) , ,y: :oximateTg
iZ',,;r"il"'Xiinn";38.':;"0"",:37.'.' ;iZ iZ'i',.i5 ,Z',2rfl,1,1"2'i"i-,";-,;;;- ";;;;";i- u,Z "*ptuln.a ns #uiason (1s68) torA u s t r a l i a n p V r o x e n e P a i r s .
!
)<
ofq
o
_)
Estimated P-T conditions of metamorphism forthe two areas, based upon geothermometric and min-eral assembla3e data, are shown in Figure 2. Assem-blage data and six mineral-pair geothermometers
TemPero tu re ( "C )
Fig. 2. P-T diagram showing probable peak metamorphic
conditions for the Kelly and Carter Creek areas. Curves I and la
repr€sent the reaction mu + qtz 2 AlrSiO5 + ksp + H2O at X"r6: I (Chatterjee and Johannes, 1974) and Xs,6 : 0.5 (Kerrick,
1972), respectively. Wintsch (1975) has calculated that Kerrick's
experimental Xgr6 ma] correspond lo asrs = 0.25.
yielded concordant temperature estimates of
745+50"C (Kelly) and 675+45oC (Carter Creek)(Dahl, 1979). Because sillimanite is the stable alu-minosilicate polymorph in pelitic rocks throughoutthe Ruby Range (Dahl, 197'7), these estimates,coupled with Holdaway's (1971) determination of
aluminosilicute P-T stabilities, constrain the maxi-
mum load pressures for the two areas (see Fig. 2).
Minimum load pressures cannot have been too farbelow the sillimanite-kyanite univariant, or kyan-ite-a metastable relict in some pelitic rocks-wouldprobably not have persisted. Thus, load pressures for
the two areas are tentatively estimated at 7.2t.1.2
kbar (Kelly) and 6.2+1.2 kbar (Carter Creek). The
P-T ranges shown in Figure 2 are consistent withgeothermal gradients of 30" to 35'Clkn.
The common association of microcline and sil-
limanite in metapelites indicates muscovite break-down, and it appears from Figure 2 that the activityof water as,e was significantly less than l-and per-
haps as low as or lower than 0.25-for pelitic rocks inthe Carter Creek area; such was probably also the
case for the higher-temperature pelitic rocks in the
Kelly area. These conclusions are consistent with the
lack of widespread partial melting in pelitic rocks
throughout the RubY Range.Local alteration of prograde assemblages indicates
that Precambrian greenschist to lower amphibolitefacies metamorphism occurred in the Ruby Range
N\s\ xellv
C A R T E R
o
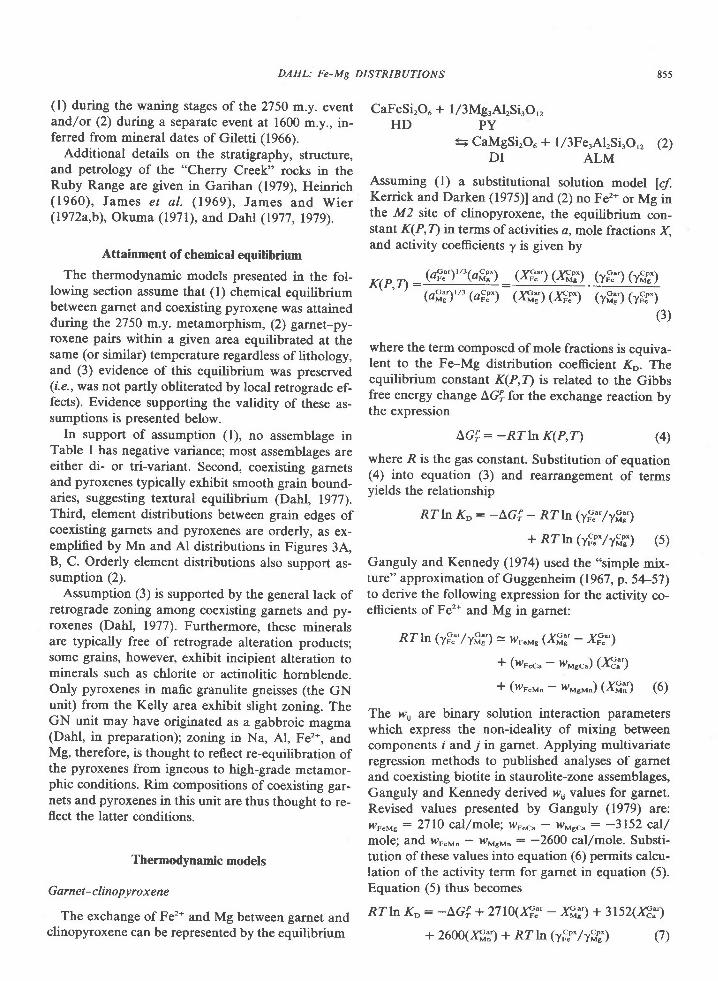
DAHL: Fe-Mg DISTRIBUTIONS 855
(l) during the waning stages of the 2750 m.y. eventand/ot (2) during a separate event at 1600 m.y., in-ferred from mineral dates of Giletti (1966).
Additional details on the stratigraphy, structure,and petrology of the "Cherry Creek" rocks in theRuby Range are given in Garihan (1979), Heinrich(1960), James et al . (1969), James and Wier(1972a,b), Okuma (1971), and Dahl (1977, 1979).
Attainment of chemical equilibrium
The thermodynamic models presented in the fol-lowing section assume that (l) chemical equilibriumbetween garnet and coexisting pyroxene was attainedduring the 2750 m.y. metamorphism, (2) garnet-py-roxene pairs within a given area equilibrated at thesame (or similar) temperature regardless of lithology,and (3) evidence of this equilibrium was preserved(r'.e., was not partly obliterated by local retrograde ef-fects). Evidence supporting the validity of these as-sumptions is presented below.
ln support of assumption (l), no assemblage inTable I has negative variance; most assemblages areeither di- or tri-variant. Second, coexisting garnetsand pyroxenes typically exhibit smooth grain bound-aries, suggesting textural equilibrium (Dahl, 1977).Third, element distributions between grain edges ofcoexisting garnets and pyroxenes are orderly, as ex-emplified by Mn and Al distributions in Figures 3,A,,B, C. Orderly element distributions also support as-sumption (2).
Assumption (3) is supported by the general lack ofretrograde zoning among coexisting garnets and py-roxenes (Dahl, 1977). Furthennore, these mineralsare typically free of retrograde alteration products;some grains, however, exhibit incipient alteration tominerals such as chlorite or actinolitic hornblende.Only pyroxenes in mafic granulite gneisses (the GNunit) from the Kelly area exhibit slight zoning. TheGN unit may have originated as a gabbroic magma(Dahl, in preparation); zoning in Na, Al, Fe2*, andMg, therefore, is thought to reflect re-equilibration ofthe pyroxenes from igneous to high-grade metamor-phic conditions. Rim compositions of coexisting gar-nets and pyroxenes in this unit are thus thought to re-flect the latter conditions.
Thermodynamic models
Garnet-clinopyroxene
The exchange of Fe2* and Mg between garnet andclinopyroxene can be represented by the equilibrium
CaFeSi,Ou + l/3MgrAl,Si3O,,HD PY
S CaMgSiOu+ l/3Fe,Al,Si3O,2 e\DI ALM
Assuming (l) a substitutional solution model [clKerrick and Darken (1975)l and (2) no Fe,* or Mg inthe M2 site of clinopyroxene, the equilibrium con-stant K(P,Z) in terms of activities a, mole fractions X.and activity coefficients y is given by
Ke.n_ (a,"."')'"(afio"*) _ (4"*) (xf,""). (y"?') (y9?)
' (ag',')'" (aFg") ()ffif) (xFD (ySD (yFt.)(3)
where the term composed of mole fractions is equiva-lent to the Fe-Mg distribution coeffi.cient Kr. Theequilibrium constant K(P,T') is related to the Gibbsfree energy change AGP. for the exchange reaction bythe expression
LGI: -Rrh K(P'T) (4)
where R is the gas constant. Substitution of equation(4) into equation (3) and rearrangement of termsyields the relationship
RZInI(D: -LG; - RZln (yq!'/yfr')
+ RZln (y3! /fifl) (5)
Ganguly and Kennedy (197\ used the "simple mix-ture" approximation of Guggenheim (1967, p. 5a-57)to derive the following expression for the activity co-efficients of Fe'* and Mg in garnet:
Rf lrl'QFfl/yffi') = w..., (Xff!'- X,".-)
* (P.... - w.r..) (XEi)
* (y..." - w.",J (XSi') (6)
The w' are binary solution interaction parameterswhich express the non-ideality of mixing betweencomponents i and j in garnet. Applying multivariateregression methods to published analyses of garnetand coexisting biotite in staurolite-zone assemblages,Ganguly and Kennedy derived w,, values for garnet.Revised values presented by Ganguly (1979) are:r,er..pre : 2710 cal/mole; wr".^ - w-rcu: -3152 cal/mole; and wr.r,r. - wr,revn : -2600 cal/mole. Substi-tution of these values into equation (6) permits calcu-lation of the activity term for garnet in equation (5).Equation (5) thus becomes
Rf h K" : -LGl + 2710(4:'- Xff!') + 3152()€.*)
+ 2600(x9T) + Rrh (y.'""./yg?) (7)
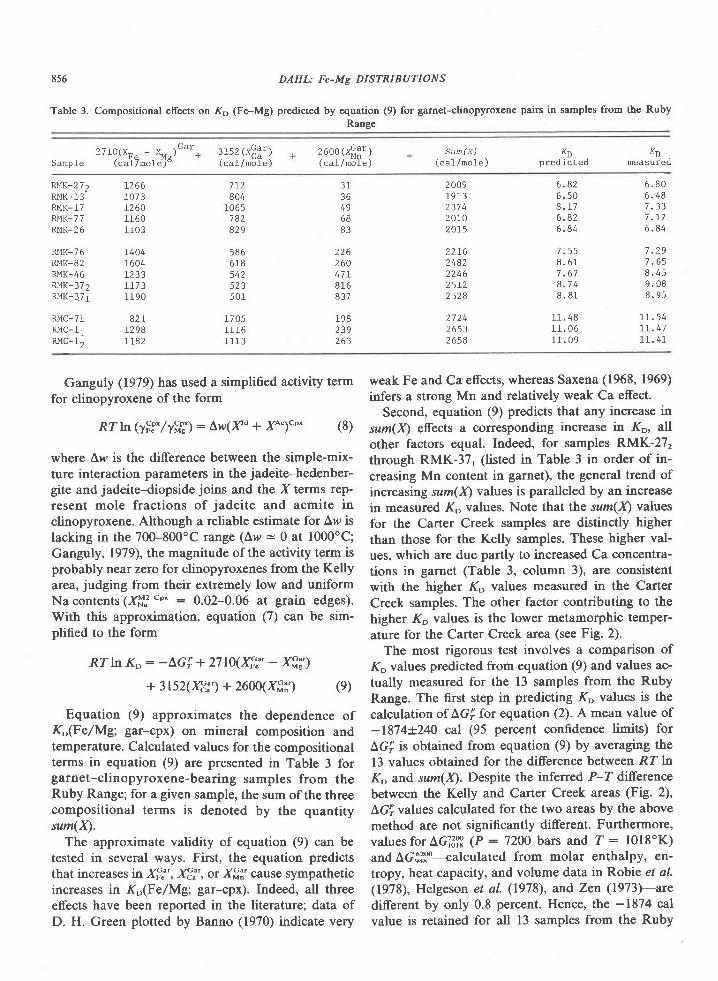
856 DAHL: Fe-Mg DISTRIBUTIONS
Table 3. Compositional effects on Kp (Fe-Mg) predicted by equation (9) for garnet-clinopyroxene pairs in samples from the Ruby
Range
Gar) ' l 1 i ( Y _ Y \' 'M- t +b a m p l e ( c a - L / m o l e r -
31s2 (x : : ' )(ca l /mo le )
2 6oo (x$:r )(ca l /mo le )
Sun (X)( c a l / m o r e J
KDpred ic ted
KDmeasured
RMK-2 72RMK-I3Rr'tK-17RMK- 7 7RMK-26
RMK-76RMK-82RMK-46RMK- 372RMK- 3,71
RMC- 71RMC-11RMC-12
L2661073t26011601103
t404\604L233l t 7 31190
82LL2981182
7 L 2804
r065782829
5866 r85425 2 3501
170511 16l113
200919 t 32 3 7 4201020L5
221624822 2 4 62 5 L 22528
26532658
6 . 8 26 . 5 08 . 1 76 . 8 26 . 8 4
7 . 5 58 . 6 17 . 6 78 . 7 48 . 8 r
1 r . 4 81 1 . 0 61 1 . 0 9
6 . 8 06 . 4 81 . 3 37 . J . 76 . 8 4
7 . 2 91 . 6 58 . 4 59 . 0 88 . 9 5
LI .54L I , 471 1 . 4 1
3136496883
1 9 82392 6 3
2 2 62 6 047 r816837
Ganguly (1979> has used a simplified activity termfor clinopyroxene ofthe form
Rrh (vF3./vS'?): Lw(xo * XA';cn. (8)
where Aw is the difference between the simple-mix-ture interaction parameters in the jadeite-hedenber-gite and jadeite-diopside joins and the X terms rep-resent mole fractions of jadeite and acmite inclinopyroxene. Although a reliable estimate for Aw islacking in the 700-800"C range (Aw = 0 at l000oC;Ganguly, 1979), the magnitude of the activity term isprobably near zero for clinopyroxenes from the Kellyarea, judging from their extremely low and uniformNa contents (XS"' 'o- : 0.02-0.06 at grain edges).With this approximation, equation (7) can be sim-plified to the form
R7 h KD : - LG+ + 27 lO(X,c.* - Xff:')
+ 3tsz(re:') + 2600(xfft') (e)
Equation (9) approximates the dependence ofK,(FelMg; gar-cpx) on mineral composition andtemperature. Calculated values for the compositionalterms in equation (9) are presented in Table 3 forgarnet-clinopyroxene-bearing samples from theRuby Range; for a given sample, the sum of the threecompositional terms is denoted by the quantitysum(X').
The approximate validity of equation (9) can betested in several ways. First, the equation predictsthat increases in Xf"u', X.o^"', or XSfi'cause sympatheticincreases in K"(FelMg; gar-cpx). Indeed, all threeeffects have been reported in the literature; data ofD. H. Green plotted by Banno (1970) indicate very
weak Fe and Ca effects, whereas Saxena (1968' 1969)infers a strong Mn and relatively weak Ca effect.
Second, equation (9) predicts that any increase insum(n effects a corresponding increase in Ko, allother factors equal. Indeed, for samples RMK-27,through RMK-37, (listed in Table 3 in order of in-creasing Mn content in garnet), the general trend ofincreasing sum(X) values is paralleled by an increasein measured Ko values. Note that the sum(X) valuesfor the Carter Creek samples are distinctly higherthan those for the Kelly samples. These higher val-ues, which are due partly to increased Ca concentra-tions in garnet (Table 3, column 3), are consistentwith the higher Ko values measured in the CarterCreek samples. The other factor contributing to thehigher Ko values is the lower metamorphic temper-ature for the Carter Creek area (see Fig. 2).
The most rigorous test involves a comparison ofrKo values predicted from equation (9) and values ac-tually measured for the 13 samples from the RubyRange. The first step in predicting Ko values is thecalculation of LGi for equation (2). A mean value of-1874=240 cal (95 percent confidence limits) forAGf is obtained from equation (9) by averaging the13 values obtained for the difference between RT lnKo and sum(X). Despite the inferred P-T differencebetween the Kelly and Carter Creek areas (Fig. 2),AG', values calculated for the two areas by the abovemethod are not significantly different. Furthermore,values for AGl"'?3 g : 72OO bars and Z : l0l8"K)and AGf.loo----calculated from molar enthalpy, en-tropy, heat capacity, and volume data in Robie et al.(1978), Helgeson et al. (1978), and Zen (1973)-aredifferent by only 0.8 percent. Hence, the -1874 calvalue is retained for all 13 samples from the Ruby

DAHL: Fe-Mg DISTRIBUTIONS 857
Range (Table 3). Inferred values for AG"n sum(n,and T can now be substituted into equation (9) topredict K".
1(" values predicted thereby are presented in Table3 for garnet-clinopyroxene-bearing mafic gneissesand iron-formations from the Ruby Range. Themodel appears to over-correct for the high Ca and Fecontents in samples RMK-17 and RMK-82, respec-tively, but for most other samples there is goodagreement between predicted and measured K" val-ues. Linear regression of predicted vs. measured Kovalues in Table 3 yields a line of slope 0.90 and a cor-relation coefficient (r) of 0.97. This level of correla-tion lends credence to Ganguly's (1979) mixing pa-rameters for garnet and to the temperature estimatesinferred for the Kelly and Carter Creek areas. Fur-thermore, it indicates-for the Montana clinopyrox-enes at least-that any clinopyroxene mixing termshave nearly constant, or negligible, value.
Although equation (9) closely defines the thermaland compositional dependence on Ko observed ingarnet-clinopyroxene pairs from the Ruby Range, itis possible to use the 13 Ruby Range samples them-selves as the data base for multiple linear regression.Accordingly, regression was performed by computeron 13 equations in the form of equation (9), whereRZ ln K, was chosen as the dependent variable, thethree X terms as the independent variables, and AG',as the regression constant. Regressed coefficients de-rived from the Ruby Range samples are included inTable 4; substitution of these values into equation (9)yields
Rrh /(D :2482 + 1509(XF.- - Xff;')+ 2810(x3n + 2855(xff:.) (10)
Measured Ko values and values predicted from equa-tion (10) are compared in Table 5. Linear regression(as before) yields a line slope of 0.89 (cl unity for aperfect model) and an r value of 0.97. This regressionis plotted in Figure 4.
In Table 4, the regressed coefficients and thermal-compositional data base of this study are comparedto data of Ganguly and Kennedy (1974), Ganguly(1979), and O'Neill and Wood (1979). Despite itsrelatively small size, the Montana data base com-prises a broader range of composition-particularlyfor X$"'-than that of Ganguly and Kennedy. Fur-thermore, analysis of variance indicates that equation(l0f-derived from the 13 Montana samples-ac-counts for 89 percent of the total variance in RZ lnKo actually observed in this data base, whereas simi-lar analysis (by this writer) of Ganguly and Ken-
nedy's (1974) model (data base of 30 samples) revealsa 55 percent accounting ofthe total variance they ob-served in RTln K". The remaining 45 percent of var-iance is probably explained bV (l) temperature dif-ferences among samples included in their data base,(2) the effects of variable Al'*, Fe2*, Fe3*, and Tio* inbiotite on KD [see Goldman and Albee (1977)], and(3) the analytical uncertainty in determining Fe'*and Fe3* concentrations in biotites. The Montanamodel, on the other hand, is based on samples fromtwo very small areas whose respective peak temper-atures were probably uniform (see Dahl, 1979). Also,points (2) and (3) above are much less of a problemfor the Montana clinopyroxenes, as they contain very.low
amounts of Na, Alt*, Fe3*, and Tia* (Dahl, 1977).Furthermore, mixing of Fe'* and Mg in the clinopy-roxenes is confined largely to a single site (M1), un-like in biotite. The remaining I I percent of variancein the Montana model may be explained by (l) ana-lytical error, (2) non-ideal mixing among Fe2*, Mg,Ca, and Mn in clinopyroxenes, and (3) small yet vari-able amounts of Fe3* among garnets. However, thesmall data base precludes meaningful considerationof more than the three independent variables.
The first three sets of interaction parameters leijgiven in Table 4 all correctly predict the effectsof X3l'and XSi' on Ko, but the relatively low valueof r?o.r, derived from the Montana data base sug-gests a lesser effect of XF""' on Ko than that predictedby Ganguly's (1979) revised model. Furthermore, thelow value and high uncertainty in w."r' relative tothe other q, computed from the Montana data base,indicate that variable Xoo"" has a lesser effect on Kothan comparable variations in )f;"" or XAX'. This con-clusion is supported by a stepwise linear regression ofRT ln I(D for the Montana data base. In this regres-sion, variation in XSf alone is found to explain 33percent of the variance observed in Rf h K"; XF'XIand XEi'together explain 82 percent ofthe variance,and all three variables together account for 89 per-cent of the total variance. This result indicates thatXfil'is the most important variable affecting Ko inthe Montana samples, whereas E? - XSr" is theleast important (of the three considered).
Data in Table 4 suggest that the value of w."r,may be temperature dependent. However, this obser-vation contradicts Ganguly and Kennedy (1974),who concluded on the basis of thermodynamic andcrystal-chemical reasoning that the w' for garnetshould be insensitive to temperature. For equilibra-tion temperatures greater than 675"C, I beteve thatonly wo"r" values significantly lower than 27lO cal/
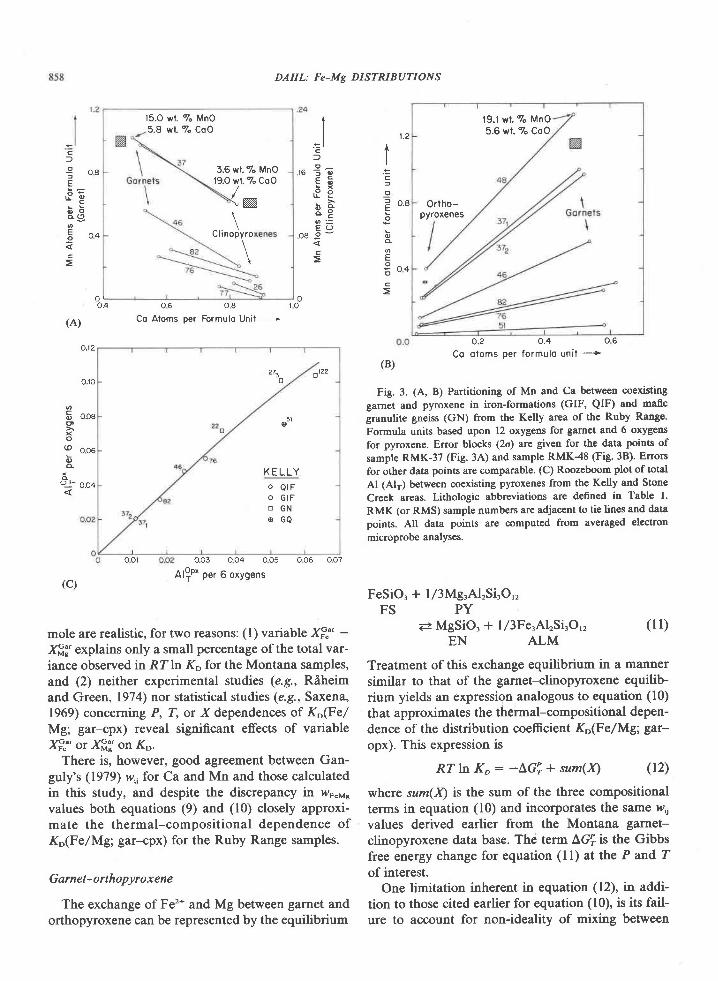
l5.O wt. 7o MnO5.8 wl. 7" CoO
3.6 w|.7" MnOl9.O wt.7" CoO
( *
cr i . ) yro
DAHL: Fe-Mg DISTRIBUTIONS
o LOA
o
(A)
o.12
o.lo
0 6 0 8
Co Afoms per Formulo Unit ------*
o.o3 004 005 006 0.o7
Al?e' per 6 oxygens
mole are realistic, for two reasons: (l) variable Xr":' -
Xff!'explains only a small percentage of the total var-
iance observed in RZtn K" for the Montana samples,and (2) neither experimental studies (e.g., Riheirtand Green, 1974) nor statistical studies (e.9., Saxena,1969) concerning P, T, or Xdependences of K"(Fe/Mg; gar-cpx) reveal significant effects of variableXr?'or Xff!'on K".
There is, however, good agreement between Gan-guly's (1979) wu for Ca and Mn and those calculatedin this study, and despite the discrepancy in wr.'"values both equations (9) and (10) closely approxi-mate the thermal-compositional dependence ofKD(FelMg; gar-cpx) for the Ruby Range samples.
Garnet-orthopyroxene
The exchange of Fe'* and Mg between garnet andorthopyroxene can be represented by the equilibrium
l9 . l wt .7" MnO5.6 wt. % CoO
Orlho-pyroxenes
o.2 0.4 0 6
Co oloms per formulo uni f +(B)
Fig. 3. (A, B) Partitioning of Mn and Ca between coexistinggarnet and pyroxene in iron-formations (GIF, QIF) and maficgranulite gneiss (GN) from the Kelly area of the Ruby Range.Formula units based upon 12 oxygem for garnet and 6 oxygensfor pyroxene. Error blocks (2a) ate given for the data points ofsample RMK-3? (Fig. 34) and sample RMK-48 (Fig. 3B). Errors
for other data points are comparable. (C) Roozeboom plot of totalAl (Alr) between coexisting pyroxenes from the Kclly and Stone
Creek areas. Lithologic abbreviations are defined in Table l.
RMK (or RMS) sample numbers are adjacent to tie lines and datapoints. All data points are computed from averaged electron
microprobe analyses.
FeSiO, + l/3MgrAl2Si3O,2FS PY
? MgSiO, + l/3Fe,Al,SirO,, ( l l )EN ALM
Treatment of this exchange equilibrium in a mannersimilar to that of the garnet-clinopyroxene equilib-rium yields an expression analogous to equation (10)that approximates the thermal-compositional depen-dence of the distribution coefficient K"(FelMg; gar-opx). This expression is
Rf h Ko: -LG", + sum(X) (r2)
where sum(n is the sum of the three compositionalterms in equation (10) and incorporates the same w',values derived earlier from the Montana garnet-clinopyroxene data base. The term AGt is the Gibbsfree energy change for equation (ll) at the P and Zof interest.
One limitation inherent in equation (12), in addi-tion to those cited earlier for equation (10), is its fail-ure to account for non-ideality of mixing between
l
) - -E
8E3.3
5 o oa=
o
6 o.oeo
o@ ooe@o
oi oo4
+III
- = l
l
. ^ 0 ^' o : 8C O
fEa =o E@ ' =
E ( Jn R o -
1 .2lII.=
: o.8E
o
o
I n ao - '
r o
o 0 1
(c)
27to
01?2
5lo
K E L L YO Q I FO G I FO G N
o c Q
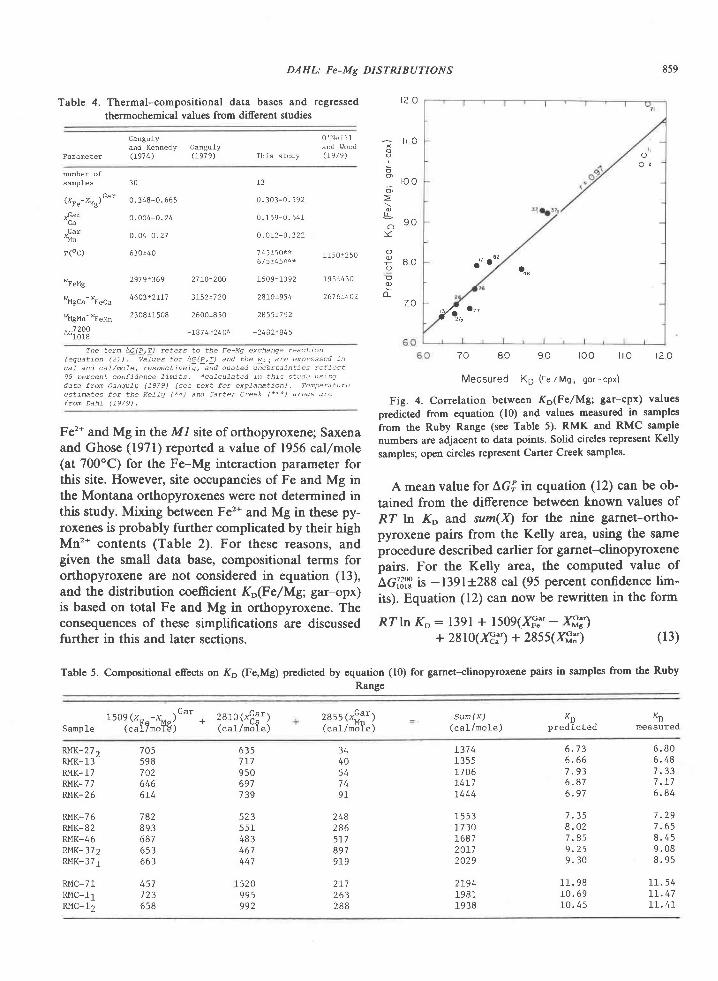
DAHL: Fe-Mg DISTRI BUTION S 859
Parameter
Table 4. Thermal-compositional data bases and regressed
thermochemical values from different studies
t 2 0
oO r z
. , , .oo"
fr,,.t"
70 80 90 r00 i lo
Meosured K9 (Fe / Mo ; gor - cpx)
Fig. 4. Correlation between rKo(FelMg; gar-cpx) values
predicted from equation (10) and values measured in samples
from the Ruby Range (see Table 5). RMK and RMC samplenumbers are adjacent to data points. Solid circles reprcsent Kelly
samples; open circles represent Carter Creek samples.
A mean value for AGf in equation (12) can be ob-tained from the difference between known values ofRZ ln Ko and sum(n for the nine garnet-ortho-pyroxene pairs from the Kelly area, using the sameprocedure described earter for garnet--clinopyroxenepairs. For the Kelly area, the computed value ofAcljffi is -1391+288 cal(95 perc€nt confidence lim-its). Equation (12) can now be rewritten in the form
RT h KD: l39l + 1509(XF." - Xf"'')+ 2810(.4.*) + 2855(Xffl)
Gangufyand Kennedy Ganguly( L 9 7 4 ) ( 1 9 7 9 )
0 ' N e i 1 Iand wood
T h l s s E u d y ( 1 9 1 9 )
! o
o- roo
L- q no - "
)<
oP e o
o
o_7 0
number of
\ " F e " M s /
.I:ar
wCar"Mn
? ( o c )
'ter'tg
"Mgcu-tFuc"
v5{gnn- /t et tn
^ -7 2OO'"1018
30
0 . 3 4 8 - 0 . 6 6 5
o.oo4-o .24
o . o 4 - 0 , 2 7
630r40
2919t369 27rO!2OO
4603!2117 3152!720
2308r1508 26001850
t3
0 . 3 0 3 - 0 . 5 9 2
0 . 1 5 9 - 0 . 5 4 1
o . o L 2 - o . 3 2 2
745150 ' t ' r 1150125067 514 5*x*
150911392 195!430
28),0!954 261 # 442
2855!7 92
-2482.345-IBJ 4\240'*
The te rm LG(P,T) re fe rs to the Fe-Mq exchange reac t ion
l F d t r a f : ^ n t ) l l V a l t t c q . a . \ t t P . T l a n o t t , a w d , ^ ^ x r ' , s s c d r t- - : l ? -' 1 . d d t , . t a d r ' . - A ' r a i F t , . ' . f l - ' c r
^ ^ - f i d a n ^ 6 t ; m t r c , - . t - , , t ) r F ; i - t h ; < < t t t . l
data f ton Ganqu lg (1979) (see tex t foL exp lanat ion) - Tcmpera turc
es t ina tes fo r the Kef fq ( * * ) and car te t c reek (+** ) a reas r rc
f r o n D a h f ( 1 9 7 9 ) .
Fe2* and Mg in the MI site of orthopyroxene; Saxenaand Ghose (1971) reported a value of 1956 callmole(at 700"C) for the Fe-Mg interaction parameter forthis site. However, site occupancies of Fe and Mg inthe Montana orthopyroxenes were not determined inthis study. Mixing between Fe2* and Mg in these py-roxenes is probably further complicated by their highMn2* contents (Table 2). For these reasons, andgiven the small data base, compositional terms fororthopyroxene are not considered in equation (13),and the distribution coemcient K"(FelMg; gar-opx)is based on total Fe and Mg in orthopyroxene. Theconsequences of these simplifications are discussedfurther in this and later sections.
t 2 O
(13)
Table 5. Compositional efects on Kp (Fe,Mg) predicted by equation (10) for garnet-clinopyroxene pairs in samples from the RubyRange
Sample "o?iilr;fue]""' * ?:ll)#i:]2 R 5 5 / Y G a r )( ca 1/niif e )
Sun(X)( c a 1 l m o l e )
"Dpred ic ted measured
RMK-2 7 2RMK-I3RrYK-17RMK_7 7RIIK-26
RMK- 7 6RMK-82Rr4K-46RIIK- 37 2RltK-371
RMC- 7 1RI1C-11RI{C-12
6357r1950691739
5 2 35514834614 4 7
t520995992
L31 41355L l 06L4L71444
1 5 5 317 30168 720 t l2029
2L9419811938
6 . 7 36 . 6 67 . 9 36 . 8 76 . 9 7
L J )
8 . 0 27 . 8 59 . 2 59 . 3 0
1 r . 9 8r 0 . 6 9r 0 . 4 5
6 . 8 06 . 4 87 . 3 37 . r 76 . 8 4
I . 2 97 . 6 58 . 4 59 . 0 88 . 9 5
1 1 . 5 4r1 .471 1 . 4 1
7055987C2646614
4577 2 3658
344054
9 l
7828 9 3681653663
2482865t78979t9
2 1 7263288
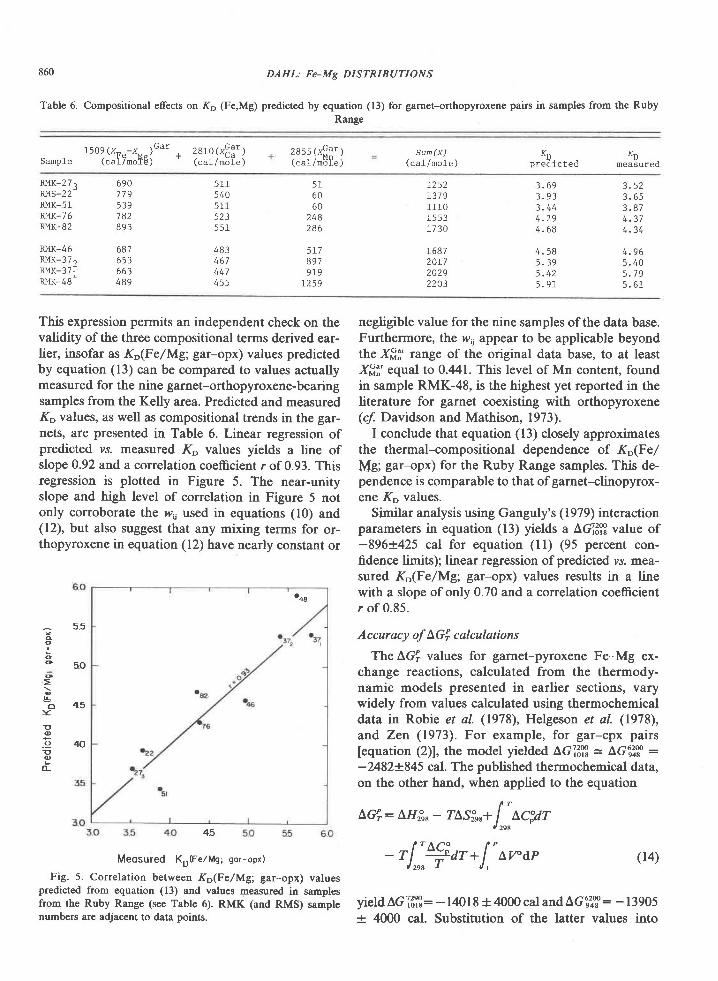
860 DAHL Fe-Mg DISTRIBUTIONS
Table 6. Compositional effects on Kp @e,Mg) predicted by equation (13) for garnet-orthopyroxene pairs in samples from the RubyRange
Sampre "o?lil7;fue]"'* i:ll)fEi:ll g s s l F a r r(c a1 /n?jT e )
Sum ( x)(ca_L/moIe . )
Knpred i c t ed measured
RMK-2 73RMS-22RMK-5IRMK_7 6RMK-82
RMK-46RMK-372RMK-371RMK-48
517897919
L259
1252137 911101 5 5 3r 1 3 0
L68720L720292203
3 . 6 93 . 9 33 . 4 44 . 2 94 . 6 8
4 . 5 8q ? o
5 . 9 1
3 . 5 23 . 6 53 . 8 74 . 3 74 . 3 4
4 . 9 65 . 4 05 . 7 95 . 6 1
6907 7 95397828 9 3
687653663489
51 r5405115235 5 1
483
4474 ) )
516060
248286
This expression permits an independent check on thevalidity of the three compositional terms derived ear-lier, insofar as K"(FelMg; gar-opx) values predictedby equation (13) can be compared to values actuallymeasured for the nine garnet-orthopyroxene-bearingsamples from the Kelly area. Predicted and measuredKo values, as well as compositional trends in the gar-nets, are presented in Table 6. Linear regression ofpredicted y.r. measured Ko values yields a line ofslope 0.92 and a correlation coefficient r of 0.93. Thisregression is plotted in Figure 5. The near-unityslope and high level of correlation in Figure 5 notonly corroborate the w,, used in equations (10) and(12), but also suggest that any mixing terms for or-thqpyroxene in equation (12) have nearly constant or
4.5
Meosured Ko(FelMg; gor-opx)
Fig. 5. Correlation between r(o(FelMg; gar-opx) valuespredicted from equation (13) and values mrcasured in samplesfrom the Ruby Range (see Table 6). RMK (and RMS) samplenumbers are adjacent to data points.
negligible value for the nine samples of the data base.Furthermore, the w,, appear to be applicable beyondthe X,fifi' range of the original data base, to at leastXSi' equal to 0.441. This level of Mn content, foundin sample RMK-48, is the highest yet reported in theliterature for garnet coexisting with orthopyroxene(cl Davidson and Mathison,1973).
I conclude that equation (13) closely approximatesthe thermal-compositional dependence of K"(Fe/fv{g; gar-opx) for the Ruby Range samples. This de-pendence is comparable to that of garnet-clinopyrox-ene Ko values.
Similar analysis using Ganguly's (1979) interactionparameters in equation (13) yields a Le,|T" value of-896+425 cal for equation (ll) (95 percent con-fidence limits); linear regression of predicted vs. mea-sured K"(Fe /Mg; garopx) values results in a linewith a slope of only 0.70 and a correlation coefficientr of 0.85.
Accuracy of AGi calculations
The AGi values for garnet-pyroxen€ Fe-Mg ex-change reactions, calculated from the thermody-namic models presented in earlier sections, varywidely from values calculated using thermochemicaldata in Robie el al. (1978), Helgeson et al. (1978),and Zen (1973). For example, for gar-cpx pairs[equation (2)], the model yielded AG1'"13 - AGW :-2482!845 cal. The published thermochemical data,on the other hand, when applied to the equation
AGP.: AHln"- ras&8+ l'rc:arI zse
- rl'#ar+t,'w"ar (14)
yeld AG]3?3 : - 140 I 8 + 4000 cal and LGX2H : - I 3905+ 4000 cal. Substitution of the latter values into
5.5oo
o'o s o0
L-6 4.5
Y
E@
_!l QEo
TL
'+e
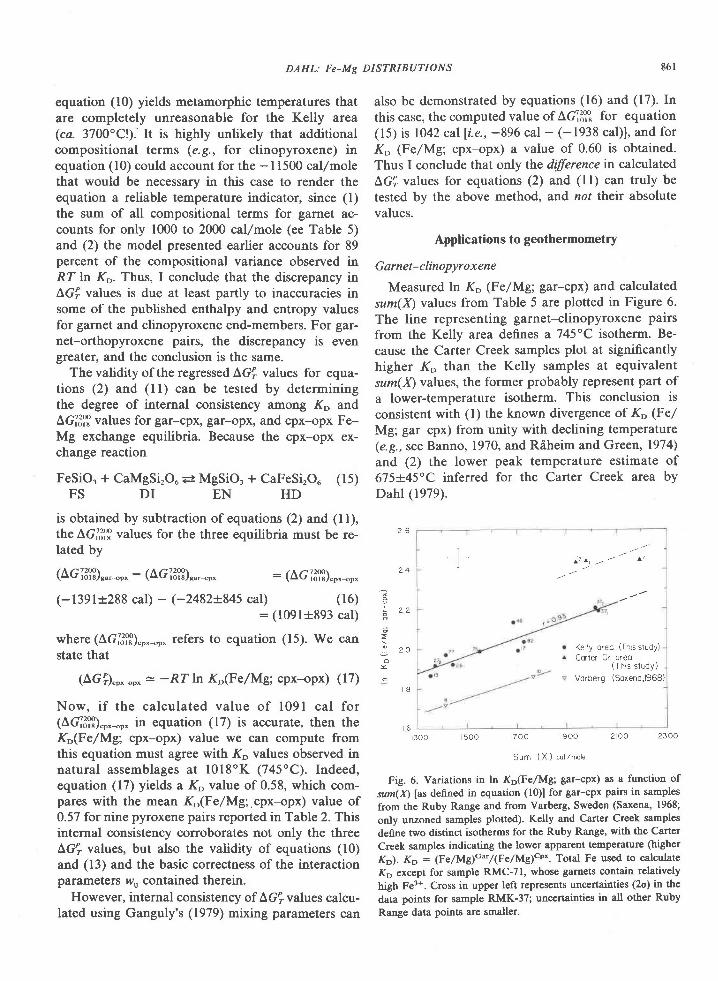
DAHL: Fe-Mg DI STRIBUTIONS
equation (10) yields metamorphic temperatures thatare completely unreasonable for the Kelly area(ca. 3700"C!).'It is highly unlikely that additionalcompositional terms (e.9., for clinopyroxene) inequation (10) coutd account for the -11500 callmolethat would be necessary in this case to render theequation a reliable temperature indicator, since (l)the sum of all compositional terms for garnet ac-counts for only 1000 to 2000 callmole (ee Table 5)and (2) the model presented earlier accounts for 89percent of the compositional variance observed inRf h Ko. Thus, I conclude that the discrepancy inAGf values is due at least partly to inaccuracies insome of the published enthalpy and entropy valuesfor garnet and clinopyroxene end-members. For gar-net-orthopyroxene pairs, the discrepancy is evengreater, and the conclusion is the same.
The validity of the regressed AGi values for equa-tions (2) and (ll) can be tested by determiningthe degree of internal consistency among K" andAGljl| values for gar-cpx, gar-opx, and cpx-opx Fe-Mg exchange equilibria. Because the cpx-opx ex-change reaction
FeSiO, + CaMgSirOu =: MgSiO. + CaFeSirO. (15)FS DI EN HD
is obtained by subtraction of equations (2) and (l l),the AGl"'ffi values for the three equilibria must be re-lated by
(ac13l3)*",_"", - (ac13i3)"..*", : (ac13l3).o^-o,
2 6
2 4
(-1391+288 cal) - (-2482+845 caI) (16): (1091*893 cal)
where (Aclo'ffi)"o^-o^ refers to equation (15). We canstate that
(AGa.p.-"- = -RT ln K"(FelMg; cpx-opx) (17)
Now, if the calculated value of l09l cal for(AG'1"'?3)""-*", in equation (17) is accurate, then theK"(Fe/Mg; cpx-opx) value we can compute fromthis equation must agree with Ko values observed innatural assemblages at lOl8oK (745'C). Indeed,equation (17) yields a Ko value of 0.58, which com-pares with the mean K,(FelMg;.cpx-opx) value of0.57 for nine pyroxene pairs reported in Table 2. Thisinternal consistency corroborates not only the threeAG", values, but also the validity of equations (10)and (13) and the basic correctness of the interactionparameters w' contained therein.
However, internal consistency of AG?values calcu-lated using Ganguly's (1979) mixing parameters can
t 6
also be demonstrated by equations (16) and (17). In
this case, the computed value of A4'"1? for equation(15) is lO42 calli.e., -896 cal - (-1938 cal)1, and for
KD (FelMC; cpx-opx) a value of 0.60 is obtained.Thus I conclude that only lhe dffirence in calculatedAG', values for equations (2) and (l l) can truly be
tested by the above method, and not their absolutevalues.
Applications to geothermometry
Garnet-clinopyroxene
Measured ln K" (FelMg; gar-cpx) and calculatedsum(X) values from Table 5 are plotted in Figure 6.
The line representing garnet-clinopyroxene pairs
from the Kelly area defines a 745oC isotherm. Be-
cause the Carter Creek samples plot at significantlyhigher Ko than the Kelly samples at equivalentsum(X) values, the former probably represent part of
a lower-temperature isotherm. This conclusion is
consistent with (l) the known divergence of K" (Fe/
Mg; gar-cpx) from unity with declining temperature(e.g., see Banno, 1970, and Riheim and Green, 1974)
and (2) the lower peak temperature estimate of
675-r45"C inferred for the Carter Creek area byDahl (1979).
861
; ^ ^
o
t 8
li r ^ - - a 7
Ke ly oreo (This study)Corter Cr oreo
(This study )Vorberg (Soxeno,1968)
1 3 0 0 5 0 0 1 7 0 0 1 9 0 0 2 0 0 2 3 0 0
S u m ( X ) c o 1 l m o l e
Fig. 6. Variations in ln (DGe/Mg; gar-cpx) as a function of
sum(X) las defined in equation (10)] for gar-cpx pain in samples
from the Ruby Range and from Varberg, Swedcn (Saxena' 1968;
only unzoned samples plotted). Kelly and Carter Creek samples
define two distinct isotherms for the Ruby Range, with the Carter
Creek samples indicating the lower apparent temperature OigherKo). Ko : (Fe/Mg)G"'/(FelMg)cp'. Total Fe used to calculate
KD except for samplc RMC-71, whose garnets contain relatively
high Fe3*. Cross in upper left repr€sents uncertainties (2o) in the
data points for sample RMK-37; uncertainties in all other Ruby
Range data points are smaller.
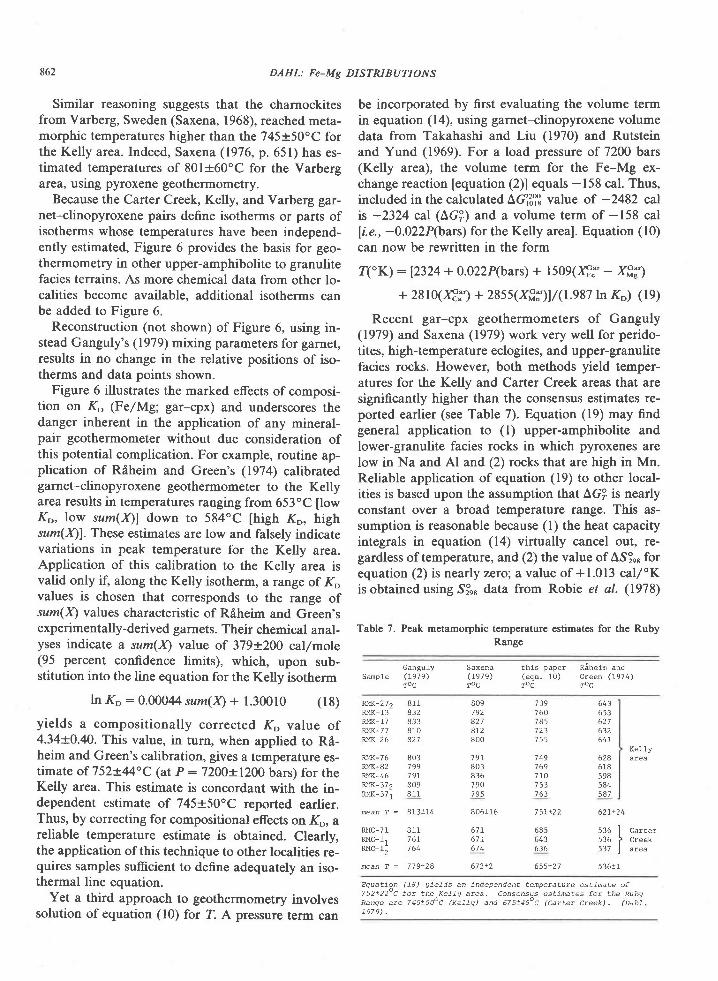
862 DAHL: Fe-Mg DISTRIBUTIONS
Similar reasoning suggests that the charnockitesfrom Varberg, Sweden (Saxena, 1968), reached meta-morphic temperatures higher than the 745+50'C forthe Kelly area. Indeed, Saxena (1976, p.651) has es-timated temperatures of 801+60"C for the Varbergarea, using pyroxene geothermometry.
Because the Carter Creek, Kelly, and Varberg gar-net-clinopyroxene pairs define isotherms or parts ofisotherms whose temperatures have been independ-ently estimated, Figure 6 provides the basis for geo-thermometry in other upper-amphibolite to granulitefacies terrains. As more chemical data from other lo-calities become available, additional isotherms canbe added to Figure 6.
Reconstruction (not shown) of Figure 6, using in-stead Ganguly's (1979) mixing parameters for garnet,results in no change in the relative positions of iso-therms and data points shown.
Figure 6 illustrates the marked efects of composi-tion on K" (FelMg; gar-cpx) and underscores thedanger inherent in the application of any mineral-pair geothermometer without due consideration ofthis potential complication. For example, routine ap-plication of Riheirn and Green's (1974) calibratedgarnet-clinopyroxene geothermometer to the Kellyarea results in temperatures ranging from 653"C [lowKo, low sum(X)l down to 584"C [high K", highsum(X)|. These estimates are low and falsely indicatevariations in peak temperature for the Kelly area.Application of this calibration to the Kelly area isvalid only if, along the Kelly isotherm, a range of Kovalues is chosen that corresponds to the range ofsum(X) values characteristic of Riheim and Green'sexperfunentally-derived garnets. Their chemical anal-yses indicate a sum(X) value of 379+200 callmole(95 percent confidence limits), which, upon sub-stitution into the line equation for the Kelly isotherm
ln K":0.000214 sum(X) + 1.30010 (18)
yields a compositionally corrected Ko value of4.34-rO.4O. This value, in turn, when applied to R6-heim and Green's calibration, gives a temperature es-timate of 752+44"C (at p:72001-l2OO bars) for theKelly area. This estimate is concordant with the in-dependent estimate of 745-r50oC reported earlier.Thus, by correcting for compositional effects on Ko, areliable temperature estimate is obtained. Clearly,the application of this technique to other localities re-quires samples sufficient to define adequately an iso-thermal line equation.
Yet a third approach to geothermometry involvessolution of equation (10) for 2- A pressure term can
be incorporated by first evaluating the volume termin equation (14), using garnet-clinopyroxene volumedata from Takahashi and Liu (1970) and Rutsteinand Yund (1969). For a load pressure of 7200 bars(Kelly area), the volume term for the Fe-Mg ex-change reaction [equation (2)] equals -158 cal. Thus,included in the calcutated AG13l3 value of -2482 calis -2324 cal (AG?) and a volume term of -158 calli.e., -0.022P(bars) for the Kelly areal. Equation (10)can now be rewritten in the form
z("K) : 12324 + 0.022P(bars) + 1509(X"c"- - X,9;)
+ 2810()€3') + 285s(xffX')l/(r.987 ln KD) (19)
Recent gar-cpx geothermometers of Ganguly(1979) and Saxena (1979) work very well for perido-tites, high-temperature eclogites, and upper-granulitefacies rocks. However, both methods yield temper-atures for the Kelly and Carter Creek areas that aresignificantly higher than the consensus estimates re-ported earlier (see Table 7). Equation (19) may findgeneral application to (l) upper-amphibolite andlower-granulite facies rocks in which pyroxenes arelow in Na and Al and (2) rocks that are high in Mn.Reliable application of equation (19) to other local-ities is based upon the assumption that AGi is nearlyconstant over a broad temperature range. This as-sumption is reasonable because (l) the heat capacityintegrals in equation (14) virtually cancel out, re-gardless of temperature, and (2) the value of AS!n. forequation (2) is nearly zero; a value of +1.013 cal/"Kis obtained using Sl* data from Robie el al. (1978)
Table 7. Peak metamorphic temperature estimates for the RubyRange
GangulySample (7919)
Toc
Saxena Ehis paper Rihein and( 1 9 7 9 ) ( e q n . 1 0 ) G r e e n ( 1 9 7 4 )Toc Toc Toc
RlfK-2 72RMK_13RMK_17RMK.7 7RMK_2 6
R}ft-76RMK.82Rl.lK-46RMK-3 72RXI(- 371
*"un y = glJ!1"4
RMC-7I 311RMC-1] 761Rr4C-1^ 764
nean T = 779!28
62I !24
530 I cu.t.t5 1 6 > a r a a l
) t I area
5 3 6 1 1
811832833810827
64365362163264r
6246185985845 8 7
7397607857 2 3755
7497 6 97ro7 5 37 6 3
8097928 2 7812800
79r8038367907 9 5
Ke1lyatea803
79979L809811
306116
67 ),6716 7 4
61 2 !2
7 5t!22
685643636
655!27
Equatio-n (18) gields an jndependent tenperature est inate of752!22-C for the^KeflV area. Consensus est inafes fot the RubqRange are Z45x5OuC (KeLlg) and 615t45oC (Carter Creek). (Dahl,1 9 7 9 ) .
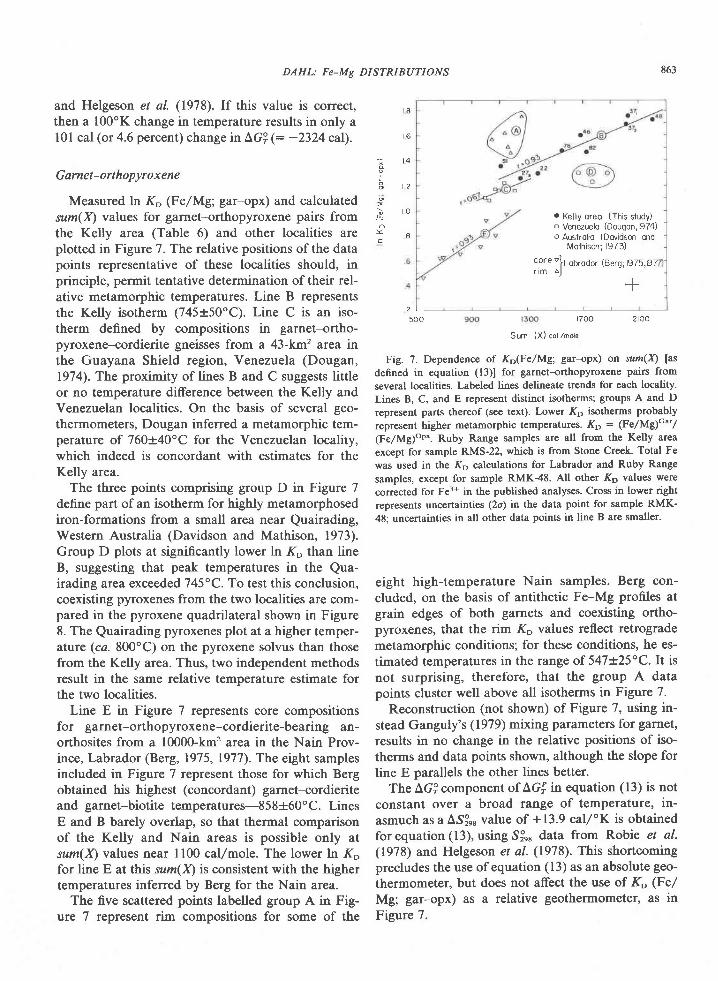
DAHL: Fe-Mg DISTRI BUI:IONS 863
and Helgesol et al. (1978). If this value is correct,then a 100"K change in temperature results in only al0l cal (or 4.6 percent) change in AGi (: -2324 cal).
Garnet-orthopyroxene
Measured ln K" (FelMg; gar-opx) and calculatedsum(X) values for garnet-orthopyroxene pairs fromthe Kelly area (Table 6) and other localities areplotted in Figure 7. The relative positions of the datapoints representative of these localities should, inprinciple, permit tentative determination of their rel-ative metamorphic temperatures. Line B representsthe Kelly isotherm (745i50'C). Line C is an iso-therm defined by compositions in garnet-ortho-pyroxene-cordierite gneisses from a 43-km' area inthe Guayana Shield region, Venezuela (Dougan,1974).The proximity of lines B and C suggests littleor no temperature difference between the Kelly andVenezuelan localities. On the basis of several geo-thermometers, Dougan inferred a metamorphic tem-perature of 760-r40"C for the Venezuelan locality,which indeed is concordant with estimates for theKelly area.
The three points comprising group D in Figure 7define part of an isotherm for highly metamorphosediron-formations from a small area near Quairading,Western Australia (Davidson and Mathison, 1973).Group D plots at significantly lower tn K" than lineB, suggesting that peak temperatures in the Qua-irading area exceeded745"C. To test this conclusion,coexisting pyroxenes from the two localities are com-pared in the pyroxene quadrilateral shown in Figure8. The Quairading pyroxenes plot at a higher temper-ature (ca.800"C) on the pyroxene solvus than thosefrom the Kelly area. Thus, two independent methodsresult in the same relative temperature estimate forthe two localities.
Line E in Figure 7 represents core compositionsfor garnet-orthopyroxene-cordierite-bearing an-orthosites from a 10000-km'z area in the Nain Prov-ince, Labrador (Berg, 1975,1977). The eight samplesincluded in Figure 7 represent those for which Bergobtained his highest (concordant) garnet-cordieriteand garnet-biotite temperatures-858+60"C. LinesE and B barely overlap, so that thermal comparisonof the Kelly and Nain areas is possible only atsum(X) values near ll00 callmole. The lower ln K"for line E at this sum(n is consistent with the highertemperatures inferred by Berg for the Nain area.
The five scattered points labelled group A in Fig-ure 7 represent rim compositions for some of the
o Kelly oreo (This study)o Venezuelo (Dougon,1974)o Austrolio (Dovidson ond
Mothison; 1973)
c.ore ;]Lobrodor (Berq; 1975,87r r m a l
+r700
S um (X) col umole
Fig. 7. Dependence of KD(Fe/Mc gar-opx) on nrn(X) [asdefined in equation (13)l for garnet-orthopyroxene pairs from
several localities. Labeled lines delineate trends for each locality.
Lines B, C, and E represent distinct isotherms; groups A and D
represent parts thereof (see text). Lower Kp isotherms probably
represent higher metamorphic temperatures. Kp : ge/l[l}G"'/
(FelMg)on*. Ruby Range samples are all from the Kelly area
except for sample RMS-22, which is from Stone Creek. Total Fe
was used in the Kp calculations for Labrador and Ruby Range
samples, except for sample RMK-48. All other Kp values were
corrected for Fe3* in the published analyses. Cross in lower right
represents uncertainties (2o) in the data point for sample RMK-
48; uncertainties in all other data points in line B are smaller'
eight high-temperature Nain samples. Berg con-
cluded, on the basis of antithetic Fe-Mg profiles atgrain edges of both garnets and coexisting ortho-pyroxenes, that the rim 1(" values reflect retrograde
metamorphic conditions; for these conditions, he es-
timated temperatures in the range of 547+25"C. lt isnot surprising, therefore, that the group A datapoints cluster well above all isotherms in Figure 7.
Reconstruction (not shown) of Figure 7, using in-
stead Ganguly's (1979) mixing parameters for garnet,
results in no change in the relative positions of iso-
therms and data points shown, although the slope forline E parallels the other lines better.
The AG?component of LGi in equation (13) is not
constant over a broad range of temperature, in-
asmuch as a AS!r, value of 1139 cal/"K is obtainedfor equation (13), using Sln, data from Robie el a/.(1978) and Helgeson et al. (1978). This shortcomingprecludes the use ofequation (13) as an absolute geo-
thermometer, but does not affect the use of K" (Fel
Mg; gar-opx) as a relative geothermometer, as in
Figure 7.
; l o
o- 8c
t a
t 6
500 2roo
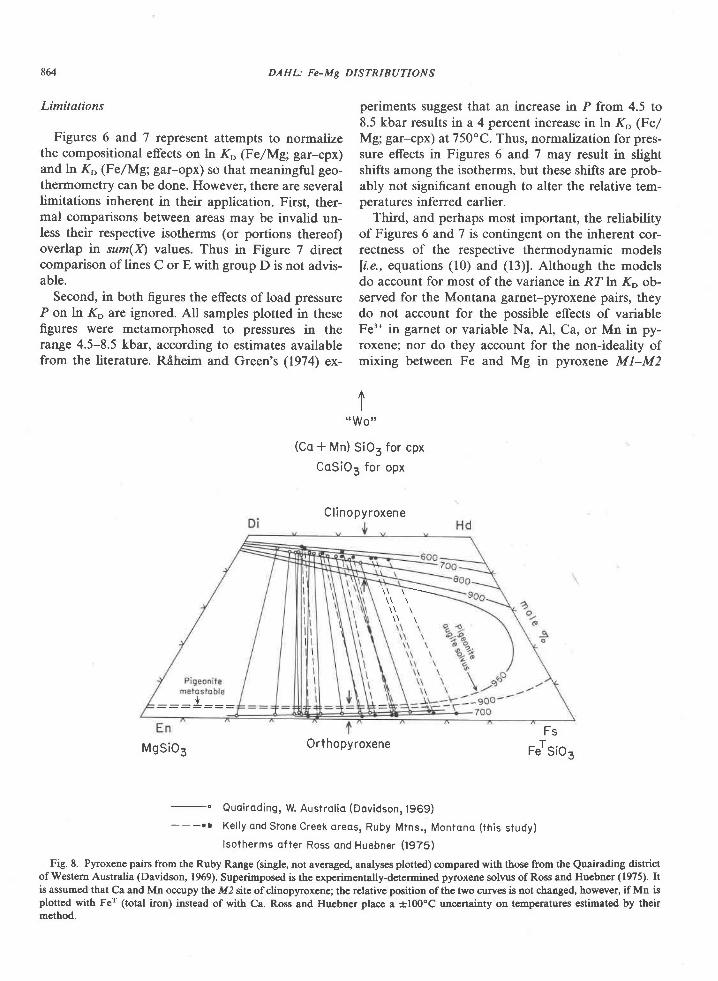
864
Limitations
Figures 6 and 7 represent attempts to normalizethe compositional effects on ln K" (FelMg; gar-cpx)and ln ,K" (FelMg; gar-opx) so that meaningful geo-thermometry can be done. However, there are severallimitations inherent in their application. First, ther-mal comparisons between areas may be invalid un-less their respective isotherms (or portions thereof)overlap in sum(X) values. Thus in Figure 7 directcomparison of lines C or E with group D is not advis-able.
Second, in both figures the effects ofload pressur€P on ln Ko are ignored. All samples plotted in thesefigures were metamorphosed to pressures in therange 4.5-8.5 kbar, according to estimates availablefrom the literature. Riheim and Green's (1974\ ex-
DAHL: Fe-Mg DISTRIBUTIONS
t, .Wort
(Co * Mn) SiO3 for cpx
CoSiO3 for opx
Cl inopyroxene
Orthopyroxene
periments suggest that an increase in P from 4.5 to8.5 kbar results in a 4 percent increase in ln K" (Fe/Mg; gar-cpx) at 750"C. Thus, normalization for pres-sure effects in Figures 6 and 7 may result in slightshifts among the isotherms, but these shifts are prob-ably not significant enough to alter the relative tem-peratures inferred earlier.
Third, and perhaps most important, the reliabilityofFigures 6 and7 is contingent on the inherent cor-rectness of the respective thermodynamic models
[i.e., equations (10) and (13)]. Although the modelsdo account for most of the variance in RZ ln K" ob-served for the Montana garnet-pyroxene pairs, theydo not account for the possible effects of variableFe'* in garnet or variable Na, Al, Ca, or Mn in py-roxene; nor do they account for the non-ideality ofmixing between Fe and Mg in pyroxene M1-M2
MgSiO3Fs
FeTsioa
Quoiroding, W. Austrol io (Dovidson, , |969)
- - - . r Ke l l y ond Stone Creek orecs , Ruby Mtns . , Montono ( th is s tudy)
lsotherms ofter Ross ond Huebner (. |975)
Fig. 8. Pyroxene pairs from the Ruby Range (single, not averaged, analyses plotted) compared with those from the Quairading districtof Western Australia (Davidson, 1969). Superimposed is the experimentally-determined pyroxene solvus of Ross and Huebner (1975). Itis assumed that Ca and Mn occupy the M2 site of clinopyroxene; the rclative position of the two curves is not changed, however, if Mn isplotted with Fer (total iron) instead of with Ca. Ross and Huebner place a *l00oC uncertainty on temperatures estimated by theirmethod.
\\ r .-.-.-
_-_-_-!:::
DAHL: Fe-Mg DISTRIBUTIONS 865
sites. These limitations can be removed only whenlarger data bases incorporating broad variations indiverse components are studied. Such data bases aremost likely to be found in highly metamorphosed ter-rains containing garnet-pyroxene pairs in diverselithologies.
Conclusions
The Ruby Range, southwestern Montana, hasbeen used as a natural laboratory to model the P-T-X dependences of garnet-pyroxene K" (FelMg) val-ues. The major conclusions of this study are summa-rized below.
(l) Petrographic and geothermometric data in-dicate that peak metamorphic P-Z conditions for theKelly and Carter Creek areas were 7.2+1.2 kbar,745+50oC and 6.2+1.2 kbar , 675+45oC, respec-tively.
(2) The excellent correlation between measuredgarnet-clinopyroxene Ko values and those predictedusing Ganguly's (1979) garnet mixing parameters(Table 3) supports the general validity of his parame-ters and confirms the temperature difference inferredbetween the Kelly and Carter Creek areas. The cor-relation also indicates that within a given area, Ear-net-pyroxene pairs in diverse lithologies last equilib-rated at the same or nearly the same temperature.
(3) Garnet-pyroxene K" (FelMg) values arehighly dependent on composition-particularly onXf,T and X33'. Meaningful geothermometry, there-fore, requires that such compositional effects betaken into account, such as is done in equations (9),(10), (13), (18), and (19), and in Figures 6 and7.
(4) Multiple linear regression of the Ruby Rangedata base in conjunction with known temperatures ofmetamorphism yields new and internally consistentvalues of A@l!1,[]!" for Fe'*-Mg exchange reactionsinvolving garnet-clinopyroxene [equ4fion (2)1, gar-net-orthopyroxene [equation (ll)], and clinopyrox-ene-orthopyroxene [equation (15)]. Because all threevalues are much closer to zero than values obtainedusing thermochemical data from Robie el al. (1978),Helgeson et al. (1978), and Zen (1973), they are morecompatible with the known dependences of K" val-ues on temperature.
The regression also yields new values for the gar-net mixing parameters (Table 4). These results cor-roborate those reported by Ganguly (1979), exceptthat the wo.r, inferred in my study is intermediate toGanguly's and O'Neill and Wood's (1979) values.This discrepancy may reflect a temperature depen-dence for this parameter.
(5) Equation (19) may be applied as a geother-mometer to upper-amphibolite and lower-granulitefacies rocks or to rocks high in Mn. Both Ganguly's(1979) and Saxena's (1979) garnet-clinopyroxenethermometers yield high temperatures for such rocks(Table 7), although they appear to work extremelywell for eclogites, peridotites, and upper-granulitefacies rocks.
(6) Larger data bases from the Ruby Range andother terrains are required in order to evaluate thepossible effects on Ko of components other thanthose considered in this study. Such components in-clude Fe'* in garnet and Na, Al, Ca, and Mn in py-roxene. Also, an accounting for the non-ideal mixingof Fe and Mg in pyroxene Ml-M2 sites is desired.Despite these omissions, the thermodynamic modelspresented in this paper explain up to 89 percent ofthe variance actually observed in K" (FelMg) valuesfor garnet-pyroxene-bearing mafic gneisses and iron-formations from the Ruby Range.
AcknowledgmentsPart of this work was included in a doctoral dissertation pre-
sented to Indiana University. I am most grateful to Dr. C. Klein,
Jr., for his support and advice during this investigation. Drs. R.G'
Craig, H.L. James, D.F. Palmer, D.G. Towell, and R.P. Wintsch
read earlier versions of the manuscript and made many helpful
suggestions. Special thanks are due to Drs. S.K. Saxena and J.M,
Ferry for their careful reviews, which greatly improved the quality
of the manuscript. I thank Mr. Kevin Zak for drafting, and Lynn
V. Dahl and Susan B Hoak for typing of the manuscript.
Field and laboratory support for this study were provided by
NSF grants DES-72-01665 and EAR-76-l1740 to Professor Klein.
The electron microprobe was obtained on NSF grant GA-37109 to
Professor Klein, with joint funds from the Indiana Univcrsity
Foundation.
References
Banno, S. (1970) Classification of eclogites in terms of physical
conditions of their origin. Pftys. Earth Planet. Interiors, 3, 405-
42r.Berg, J. H. (1975) Quantitative regional geobarometry of the
anorthositic Nain complex (abstr.). Int. Conf. Geothermometryand Geobarometry, The Pennsylvania State University, Univer-sity Park, Pennsylvania
- (1977) Regional geobarometry in the contact aureoles ofthe anorthositic Nain complex. J. Petrol. 18,399430.
Chatterjee, N. D. and W. Johannes (1974) Thermal stability andstandard thermodynamic properties of synthetic 2M1-mus-covite, KAl2Alsi3oro(oH)2. contrib. Mineral. Petrol., 48, 89-I 14 .
Cordua, W. S. (1973) Precambrian Geologlt of the Southern To-bacco Root Mountains, Madison Co., Montana. Ph.D. Thesis' In-diana University, Bloomington, Indiana.
Dahl, P. S. (1977) The Mineraloglt and Petrology of PrecambrianMetamorphic Rocks from the Ruby Mountains, Southwestern
866 DAHL: Fe-Mg DISTRIBUTIONS
Monlana. Ph.D. Thesis, Indiana University, Bloomington, In-diana.
- (1979) Comparative geothermometry based on major-ele-ment and oxygen isotope distributions in Precambrian meta-morphic rocks from southwestern Montana. Am. Mineral., 64,t280-1293.
Davidson, L. R. (1968) Variation in ferrous iron-magnesium dis-tribution coefficients of metamorphic pyroxcnes from Qua-irading, Western Australia. Contrib. Mineral. Petrol., 19, 239-259.
- ( 1969) Fe**-Mg** distribution in coexisting mctamorphicpyroxenes. Spec. Publ. Geol. Soc. Aust., 2,333-339.
- and C. I. Mathison (1973) Manganiferous orthopyroxenesand garnets from metamorphosed iron formations of the Qua-irading district, Westem Australia. Neues Jahrb. Mineral. Mon-atsh., 47-57.
Douga4 T. W. (1974) Cordierite gneisses and associated lirh-ologies of the Guri area, Northwest Guayana Shield, Vene-ntela. Contrib. Mineral. Petol.,46, 169-188.
Friberg, L. M. (1976) Petrology of a Metamorphic Sequence of Up-per-amphibolite Facies in the Central Tobacco Root Mountains,Southwestern Montana, Ph.D. Thesis, Indiana University,Bloomington, Indiana.
Ganguly, J. (1979) Garnet and clinopyroxene solid solutions, andgeothermometry based on Fe-Mg distribution coefficient. Geo-chim. Cosmochim. Acta, 43, 102l-1029.
- and G. C. Kennedy (1974) The energetics ofnatural garnetsolid solution. I. Mixing of the aluminosilicate end-members.Contrib. Mineral. Petrcl., 48, 137-148.
Garihan, J. M. (1979) Geology and structure of the central RubyRange, Madison County, Montana. Bull. Geol. Soc. Am., 90,695-788.
Giletti, B. J. (1966) Isotopic ages from southw€stern Montana. ./.Geophys. Res., 7 l, 40294036.
Goldman, D. S. and A. L. Albee (1977) Correlation of MglFe par-titioning between garnet and biotite with 180/160 partitioningbetween quartz and magnetite. Am. J. sci.,277,750-767.
Guggenheim, E. A. (1967) Thermodyumics. North-Holland, Am-sterdam.
Heinrich, E. W. (1960) Pre-Beltian geology of the Cherry Creekand Ruby Mountains areas, southwestern Montana. Mont. BunMines and Geol. Mem., J& 15-40.
Helgeson, H. C., J. M. Delany, H. W. Nesbitt and D. K. Bird(1978) Summary and critique of the thermodynamic properticsof rock-forming minerals. Am. J. Sci., 278-A, l-229.
Holdaway, M. J. (1971) Stability of andalusite and tle aluminumsilicate phase diagram. Am. J. Sci., 271,97-131.
James, H. L. and C. E. Hedge (1980) Age of the basement rocks ofsouthwest Montana. Geol. Soc. America Bull., Part 1,91,ll-15.
- and K. L. Wier (1972a) Geologic map of the Kelly iron de-posit. U.S. Geol. Surv. Misc. Field Studies Map MF-349.
- and - (1972b) Geologic map of the Carter Creek irondeposit. U.S. Geol. Sum. Field Studies Map MF-359.
and K. W. Shaw (1969) Map showing lithology ofPrecambrian rocks in the Christensen Ranch and adjacentquadrangles, Madison and Beaverhead Counties, Montana.U.S. Geol. Sum. Open-File Report.
Kerrick, D.M. (19'12) Experimental determilation of muscovite +quartz stability with P",o ( P,o,.r. Am. J. Sci., 272,946-959.
- and L. S. Darken (1975) Statistical thermodynamic modelsfor ideal oxide and silicate solid solutions, with application toplagioclase. Geochim. Cosmochim. Acta, 39, l43l-142.
Klein, C., Jr. (1974) Greenalite, stilpnomelane, rninnesotaite, cro-cidolite, and carbonates in a very lqw grade metamorphic Pre-cambrian iron-formation. Can. M ineral., I 2, 47 5498.
Okuma, A. F. (1971) Structure of the Southwestern Ruby RangeNear Dillon, Montana. Ph.D. Thesis, The Pennsylvania StateUniversity, University Park, Pennsylvania.
O'Neill, H. St.C. and B. J. Wood (1979) An experimental study ofFe-Mg partitioning between garnet and olivine and its calibra-tion as a geothermometer. Contrib. Mineral. Petrol., 70,59-70.
RAheim, A. and D. H. Green (1974) Experimental determinationof the temperature and pressure dependence of the Fe-Mg par-tition coefrcient for coexisting garnet and clinopyroxene. Caz-trib. Mineral. Petrol., 48, 179-203.
Robie, R. A., B. S. Hemingway and J. R. Fisher (1978) Thermody-namic properties of minerals and related substances at 298. 15 Kand I bar (105 pascals) pressure and at higher temperatures.U.S. Geol. Surv. Bull. 1452.
Ross, M. and J. S. Huebner (1975) A pyroxene geothermometerbased on composition-temperature rclationships of naturallyoccurring orthopyroxene, pigeonite, and augite (abstr.). Izr.Conf. Geolhermometry and Geobarometry, The PennsylvaniaState University, University Park, Pennsylvania.
Rutstein, M. S. and R. A. Yund (1969) Unit-cell parameters ofsynthetic diopside-hedenbergite solid solutions. Am. Mineral.,54,238-245.
Saxena, S. K. (1968) Distribution of iron and magnesium betweencoexisting garnet and clinopyroxene in rocks of varying meta-morphic grade. Am. Mineral., 53,2018-2424.
- (1969) Silicate solid solutions and geothermometry. 4. Sta-tistical study of chemical data on garnets and clinopyroxene.Contrib. Mineral. Petrol., 23, 140-156.
- (1976) Two-pyroxene geothermometer: a model with anapproximate solution. Am. Mineral., 61, 643452.
- (1979) Garnet-clinopyroxene geotli€nnometer. Contrib.Mineral. Petrol., 70, 229-235.
- and S. Ghose (1971) Mg2+-Fe2* order-disorder and thethermodynamics of the orthopyroxen€ crystalline solution. ;bn.Mineral., 56,532-559.
Takahashi, T. and L. G. Liu (1970) Compression of ferromagne-sian garnets and the effect ofsolid solutions on the bulk modu-Ils. J. Geophys. Res., 7 1, 57 57 -5766.
Wintsch, R. P. (1975) Solid-fluid equilibria in the systemKAlSi3Os-NaAlSi3O8-Al2SiO5-SiO2-H2O-HCl. J. Petrol., 16,57-79.
7.en, E-an (1973) Thermochemical parameterg of minerals fromoxygcn-buffered hydrothermal equilibrium data: method, appli-cation to annite and almandine. Contrib. Mineral. Petrol., 39,65-80.
Manuscript received, August 4, 1978;acceptedfor publication, March 14, 1980.
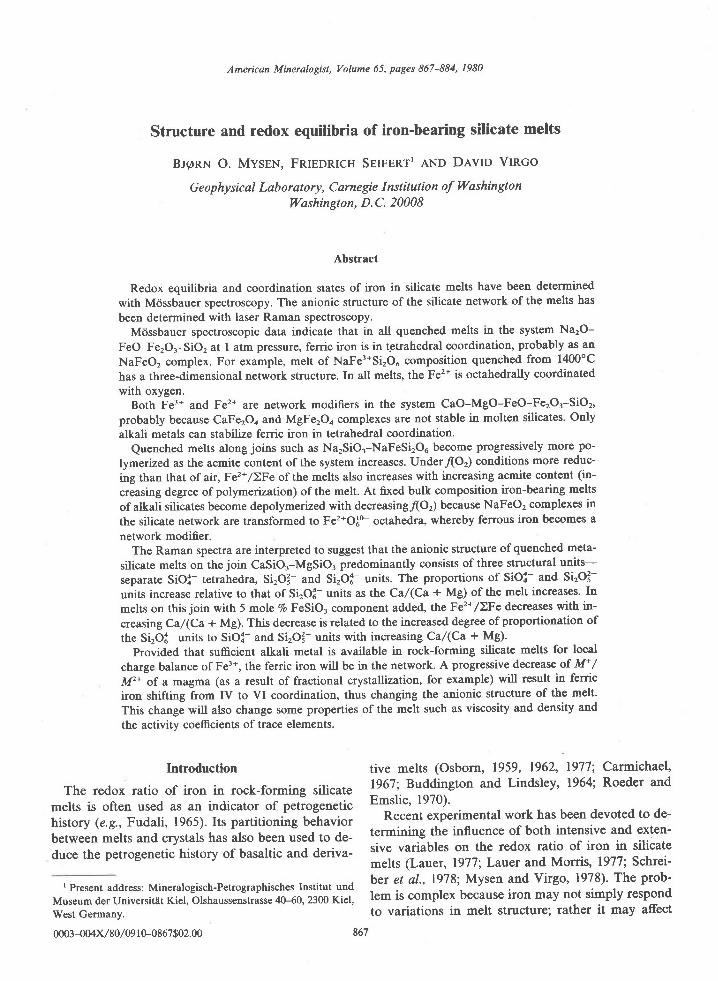
American Mineralogist, Volume 65, pages 867-884, 1980
Structure and redox equilibria of iron-bearing silicate melts
BrgnN O. MvsnN, Fnletntcn SEIFnRT' AND DAvID Vnco
G e op hy sic al Lab o r at o ry, C arne gi e I n stitut ion of Wa shin gt o n
Washington, D.C. 20008
Abstract
Redox equilibria and coordination states of iron in silicate melts have been determinedwith Mrissbauer spectroscopy. The anionic structure of the silicate network of the melts has
been determined with laser Raman spectroscopy.Mcissbauer spectroscopic data indicate that in all quenched melts in the system NazO-
FeO-FerOr-SiO, at I atm pressure, ferric iron is in tetrahedral coordination, probably as an
NaFeOz complex. For example, melt of NaFe3*SirOu composition quenched from 1400'C
has a three-dimensional network structure. In all melts, the Fe2* is octahedrally coordinatedwith oxygen.
Both Fe3* and Fe2* are network modifiers in the system CaO-MgO-FeO-FerO:-SiOz,probably because CaFerOo and MgFe2Oo complexes are not stable in molten silicates. Only
alkali metals can stabilize ferric iron in tetrahedral coordination.
Quenched melts along joins such as NarSiOr-NaFeSirOu become progressively more po-
lymerized as the acmite content of the system increases. Underl(Or) conditions more reduc-
ing than that of air, Fe2*/)Fe of the melts also increases with increasing acmite content (in-
creasing degree of polymerization) of the melt. At fxed bulk composition iron-bearing melts
of alkali silicates become depolymerized with decreasingl(O) because NaFeO2 complexes in
the silicate network are transformed to Fe2*O:o- octahedra, whereby ferrous iron becomes a
network modi-fier.The Raman spectra are interpreted to suggest that the anionic structure of quenched meta-
silicate melts on the join CaSiO3-MgSiO3 predominantly consists of three structural units-
separate Siox- tetrahedra, Sirol- and Sirof- units. The proportions of siox- and si'ol-
units increase relative to that of SirO?- units as the Ca/(Ca + Mg) of the melt increases. In
melts on this join with 5 mole 7o FeSiO3 component added, the Fez*/I,Fe decreases with in-
creasing Ca/(Ca + Mg).This decrease is related to the increased degree of proportionation of
the SirO:- units to SiOl- and SirOl- units with increasineCa/(Ca + MC).Provided that sufficient alkali metal is available in rock-forming silicate melts for local
charge balance of Fe3*, the ferric iron will be in the network. A progressive decrease of M* /Ivf, of a magma (as a result of fractional crystallization, for example) will result in ferric
iron shifting from IV to VI coordination, thus changing the anionic structure of the melt.
This change will also change some properties of the melt such as viscosity and density and
the activitv coeftcients of trace elements.
Introduction
The redox ratio of iron in rock-forming silicatemelts is often used as an indicator of petrogenetichistory (e.g., Fudali, 1965). Its partitioning behaviorbetween melts and crystals has also been used to de-duce the petrogenetic history of basaltic and deriva-
I Present address: Mineralogisch-Petrographisches Institut undMuseum der Universitlit Kiel, Olshaussenstrasse 4G-60, 2300 Kiel,West Gerrnany.
0003-004x/80/09 10-0867$02.00 867
tive melts (Osborn, 1959, 1962, 1977; Catmichael,1967; Buddington and Lindsley, 1964; Roeder andEmslie, 1970).
Recent experimental work has been devoted to de-termining the influence of both intensive and exten-sive variables on the redox ratio of iron in silicatemelts (Lauer,1977; Lauer and Morris, 1977; Schrei-bet et a1.,1978; Mysen and Virgo, 1978). The prob-lem is complex because iron may not simply respondto variations in melt structure; rather it may affect
MYSEN ET AL.: STRUCTURE OF SILICATE MELTS
the melt structure in important ways. Furthermore,the iron component in a melt can play a dual role be-cause Fe can be both tetrahedrally and octahedrallycoordinated. The structural role of iron is controlledby an involved interrelationship between degree ofpolymerization of the host, types of cations present,amount of iron present and its oxidation state (Waff,1977). ln an attempt to understand these problems, astudy of the anionic structure of quenched Fe-bear-ing silicate melts has been undertaken. In this reportthe structural role of iron as a function of oxygenfugacity and bulk composition of the melt is empha-sized.
Experimental techniques
Bulk compositions were chosen to determine therelations between redox states of iron and the ratio ofnonbridging to bridging oxygen in the melt (NBO/BO) and the effect of different modifying cations onthe structural role of ferric and ferrous iron. Such anefect is most conveniently studied in systems likeNa,O-FeO-Fe,O.-SiO,(Nnns) and CaO-MgO-FeO-FerOr-SiO, (crranns) because structural data onmelts in portions of these systems are already avail-able (Brawer and White, 1975, 1977; Etchepare,1972; Brown et al., 1918; Mysen and Virgo, 1978, inpreparation; Seifert et al., l979a,b; Mysen et al.,1979; Virgo et al., 1980). The NBO/BO varies as asystematic function of Na content of melts on thejoin NarO-SiOr, for example (Brawer and White,1975). It is also known that the anionic structure ofquenched metasilicate melts is similar for a larger va-riety of network-modifying cations (Brawer andWhite, 1975,1977; Verweij and Konijnendijk, 1976;Yirgo et al., l98O; Mysen et al., 1980).
The starting materials were prepared from spectro-scopically pure (Johnson and Matthey) SiOr, FerOr,MgO, CaCOr, and reagent grade NarCOr.
The mixtures, (10-30 mg) were held at 1400-1585"C as beads on the Pt-wire loops in air or in agas mixing furnace for time periods ranging from 6to l/2 hr, depending on the temperature of the ex-periment. Mysen and Virgo (1978) determined redoxratios of iron in melts on the join NaAlSirOu-NaFe3*SirO6 as a function of time at 1450"C, andfound that at that temperature a sample of about 50mg would equilibrate with the surrounding atmo-sphere in about l/2 hr. The present samples gener-ally are less viscous than those studied by Mysen andVirgo. It is likely, therefore, that>l/2 hr run dura-tions are sufficient to attain equilibrium.
The samples are quenched in air, mercury, or liq-
uid nitrogen to produce glasses of the appropriatecompositions. The compositions given here are nomi-nal values.
The M<issbauer spectroscopic techniques wereidentical with those of Mysen and Virgo (1978). Ex-cept for the magnetic spectra (see below), a maxi-mum of three lines were visually resolved when bothferric and ferrous iron were present in the quenchedglasses, and only up to three lines of Lorentzianshape were fitted to the spectra. The absence of anysplitting or even significant broadening of the low-velocity line indicates that the position of the low-velocity component of the ferric doublet closelymatches that of the low-velocity component of theferrous doublet, so that the sum of these two linescan be treated numerically as a single line. Furtherjustification for this procedure can be derived fromthe position of the low-velocity line in largely ferrousand completely ferric samples. For instance, in glassof acmite compogition the velocity changes from-0.132 mm/sec (relative to metallic iron) in the re-duced sample to -0.237 mm/sec in the oxidizedsample, a small change compared with the half-widthof these absorption lines (about 0.60 mm/sec).
The Fe'z*/)Fe values have been calculated fromthe area ratios ofthe ferrous and ferric doublets (seealso Mysen and Virgo, 1978). When only two lines(due to the ferrous doublet) can be observed, any de-viation of the Fe2*/)Fe value from I will be re-flected in the inequality of peak areas. An example ofthis effect is the relation between.,i(Or) and Fe2* /ZFe,as discussed further below. The Fe'*/)Fe is calcu-lated from the difference ofthe peak areas. The relia-bility of Fe3*,/)Fe of glasses determined with Mciss-bauer spectroscopy was discussed in some detail byMysen and Virgo (1978), who also reported com-parative studies using wet-chemical analysis as anadditional technique. Comparative studies g5ing wet-chemical and Mcissbausl lsshniques for determina-tion of Fe3*/)Fe were also conducted by Bancroftand Burns (1969) and Bancroft et al. (1969). In thosestudies, there generally was agreement between theresults with the two methods. Whenever dis-crepancies arose, the wet-chemical technique gavehigher Fe'*/)Fe. Replicate wet-chemical analysis ofsuch samples brought the results into agreement. Itshould be mentioned in this context that the wet-chemical techniques used are oxidation techniques.It is not surprising, therefore, that if there arediscrepancies, they tend to be on the side of too muchferric iron. Kurkjian (1970) used published redox ra-tios of iron-bearing glasses on the join NarO-SiOr-
FeO-FerO. based on wet-chemical analysis (where
no report on technique for wet-chemical analysis isgiven) and compared the results from those uncha-racterized samples with Mossbauer results obtained
by him on a new set of samples. In that study, results
with both higher and lower Fe'*/)Fe values were re-ported. lnasmuch as the samples used in that study
were not described appropriately, one cannot assessthe quality of either the wet-chemical or the Mdss-
bauer results. Therefore, the conclusions drawn byKurkjian (1970) are open to question.
The Raman spectra were taken on small chips ofquenched melts (- 0.5-1.0 mm cubes) that were free
of bubbles. The spectra were recorded with a Jobin-
Yvon optical system, holographic grating, doublemonochromator (HG25), and a photon-counting de-
tection system. The spectra were recorded at about 3
cm-',/sec. The iron-free samples were excited with
the 488.0 nm line of an Ar* laser, using a laser power
of 200-400 mW at the sample with a 90o scatteringgeometry. The iron-bearing samples were excitedwith the 647.1 nm line of the Kr* ion laser also oper-ated at 200-400 mW. Polarized spectra were ob-tained with the focused exciting beam parallel to thehorizontal spectrometer slit and with the electric vec-
tor of the exciting radiation in a vertical orientation.A sheet of polarizer disk in front of an optical scram-bler was used to record separately the parallel andperpendicular components of the scattered radiation.
As a matter of routine, replicate spectra from the
same chips, from different chips of the same experi-mental run product, and from replicate experimentalrun products were also taken.
Results and discussion
M'o s sb aue r sp e c tr o s c o p y
The hyperfine parameters calculated from theMdssbauer data on quenched melts in the systemNarO-FeO-FerO.-SiO, are shown in Table l.Spectra of crysta l l ine acmite, composi t ionNarFe'*SLO,, (Bowen et al., 1930) and a ferrous-
bearing akermanite (50 mole percent FeAk-50 rrolepercent Ak) were also taken (Table 2), in order todetermine the hyperfine parameters for ferric iron inoctahedral coordination and ferrous iron in tetrahe-dral coordination.
In all quenched melts on the join NarSiOr-NaFe'*SirO" (NS-Ac) in air, the absence of any ab-sorption peak at about 1.8 mm,/sec and the equal in-tensity and half-width of the two-component peaks
of the doublet indicate that more than 95 percent of
Table l. Hyperfine parameters of ferric iron of quenched melts on
the join Na2Si03-NaFe3+Si2O6 at 1400'C in air (mm/sec)
Compos i t ion1+
I s ( F e ' )?+
Q S ( F e - ' )
MYSEN ET AL.: STRUCT:URE OF SILICATE MELTS
NS85Ac15N S 7 5 A c 2 5NS50Ac50N S 2 5 A c 7 5Ac100
0 . 2 6 40 , 2 3 20 . 2 2 70 . 2 4 90 . 2 4 9
o . 8 4 7o . 8 3 20 . 7 3 20. 9060 . 9 7 L
ts1t,e3+1, isomer shift of Fe3+ telative to metaLTic
i ron . Qs(Fe3+) , quadrupoTe sp l - i t t ing o f Fer+ .
the iron is in the ferric state (Fig. l). In quenchedmelts with 6 mole percent or less Ac (NS94Ac6), anadditional line is observed at about 1.5 mm/sec (Fig.2) and the tail region of the envelope extends to atleast 7.5 mm,/sec. In spectra taken at 77K (Fig. 28)individual lines appear in this tail region, which con-stitutes a broadened magnetic sextet pattern superim-posed on a doublet. The magnetic splitting suppos-edly arises from long relaxation times of spin-spininteractions of Fe3* at these low iron concentrations(Bhargava et al., 1979).
The quenched melts on the join NS-Ac with morethan 6 mole percent acmite component but withNarO < SiOr, quenched in air, show similar features.We conclude, therefore, that all iron is in the ferricstate (within the detection lirnit, <95Vo) in the meltsin the system NarO-FerOr-SiO, when equilibrated inair.
The M<issbauer spectra of the melts in the systemNarO-FerO3-SiO, show a visually resolved doublet(Fig. l) with isomer shifts in the range between 0.23andO.26 mm,/sec and quadrupole splitting from 0.79to 0.97 mm/sec (Table l). These values compare withisomer shift values of 0.38-0.40 mm/sec and quad-rupole splitting of 0.30 mm/sec, respectively, for thetwo crystalline phases with Fe'* in octahedral coordi-nation (Fig. l; see also Table 2).
Only compositions with small amounts of sodiummetasilicate component have been investigated atlow oxygen fugacity because of excessive sodium lossfrom the depolymerized melts close to the NarSiO,composition (Seifert et al., 1979a). Even in the moreSi- and Fe-rich compositions some loss of sodium tothe COrlCO vapor phase of the furnace may havetaken place, and the compositions studied may there-fore not lie exactly on the join.
As the oxygen fugacity is lowered, the ferric dou-blet in the Mdssbauer spectra becomes asymmetric,and eventually a new line at -l.8mm/sec is ob-
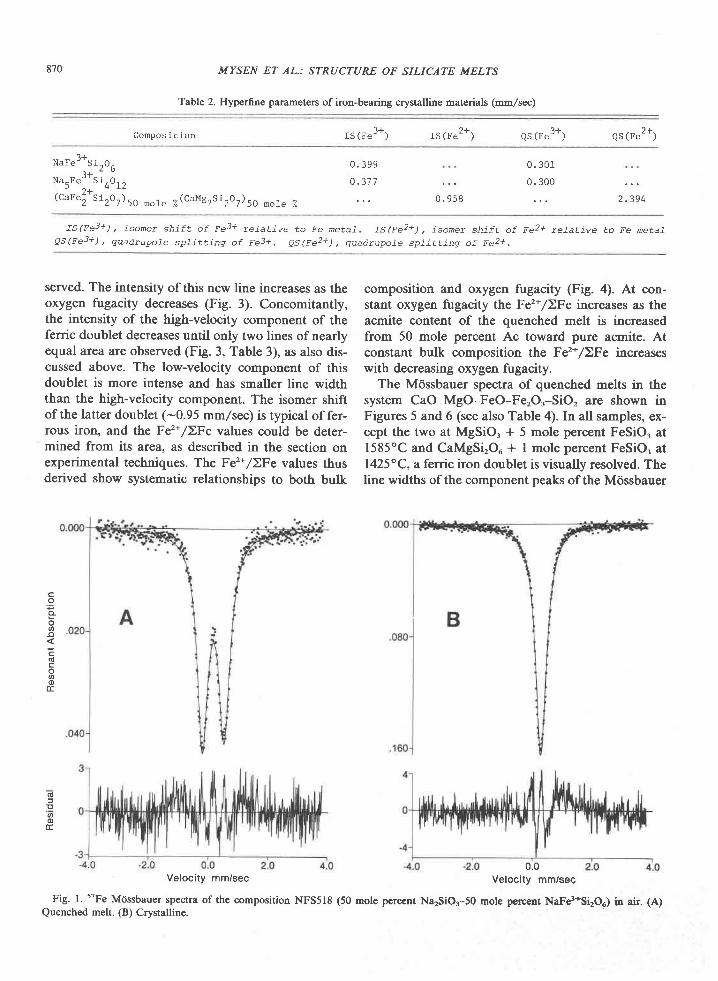
870 MYSEN ET AL.: STRUCT:URE OF SILICATE MELTS
Table 2. Hyperfine parameters of iron-bearing crystalline materials (mm/sec)
Compos i t ion?!
I S ( F e - ' ))+
I S ( F e - ' )
?I t +Q S ( F e -
' )
N a F e - S i - O ,n , Z o
Na.FeJ -s i , o , "- ) t
(caEei ' sizoz)so *or" y.(c^M]2sizoz)so mole %
0 . 3 9 9
0 . 3 7 7
0 . 9 5 8
0 . 3 0 1
0 . 3 0 0
2 . 3 9 4
rs (Fe3+) , i somer sh i f t o f Fe3+ re la t i ve to Fe meta f . rs (Fe2+) , i somer sh i f t o f Fe2+ re fa t i ve to Fe meta f
Q5(Fe3+) , quadrupoTe sp l i x t ing o f Fe3+. eS(Fe2+) , quac t rupoTe sp f i t t ing o f Fe2+.
served. The intensity of this new line increases as theoxygen fugacity decreases (Fig. 3). Concomitantly,the intensity of the high-velocity component of theferric doublet decreases until only two lines of nearlyequal area are observed (Fig. 3, Table 3), as also dis-cussed above. The low-velocity component of thisdoublet is more intense and has smaller line widththan the high-velocity component. The isomer shiftof the latter doublet (-0.95 mm/sec) is typical of fer-rous iron, and the Fe'*/)Fe values could be deter-mined from its area, as described in the section onexperimental techniques. The Fe'z*/)Fe values thusderived show systematic relationships to both bulk
composition and oxygen fugacity (Fig. a). At con-stant oxygen fugacity the Fe'z*/)Fe increases as theacmite content of the quenched melt is increasedfrom 50 mole percent Ac toward pure acmite. Atconstant bulk composition the Fe2*,/)Fe increaseswith decreasing oxygen fugacity.
The M0ssbauer spectra of quenched melts in thesystem CaO-MgO-FeO-FerOr-SiO, are shown inFigures 5 and 6 (see also Table 4). In all samples, ex-cept the two at MgSiO, * 5 mole percent FeSiO, at1585'C and CaMgSirOu + I mole percent FeSiO, at1425"C, a ferric iron doublet is visually resolved. Theline widths of the component peaks of the Mdssbauer
oo
(!cooq)
E
o
ooTT
Velocity mm/sec0.0
Velocity mm/sec
Fig. l. 57Fe Mtissbauer spectra of the composition NFS5I8 (50 mole perccnt Na2SiOr-50 mole percent NaFes+$i2O6) in air. (A)Quenched melt. (B) Crystalline.
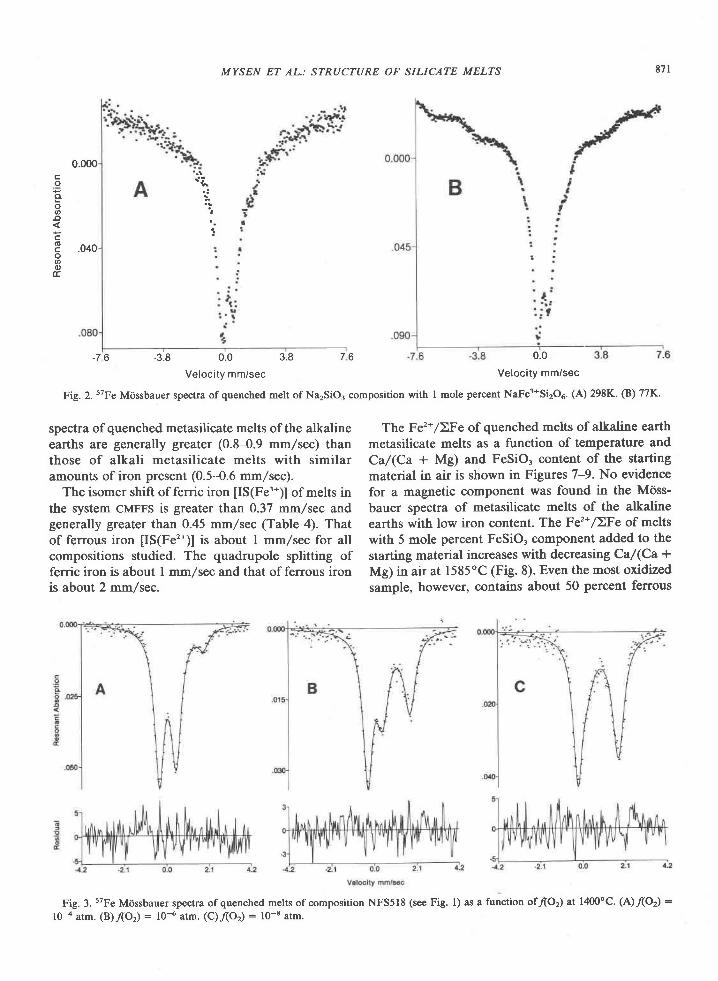
MYSEN ET AL.: STRUCTURE OF SILICATE MELTS 871
oCL
oo
3 .o+oooo(r
0.000
. :
a
a.
.3.8 0.0 3.8
Velocity mm/sec
spectra of quenched metasilicate melts of the alkalineearths are generally greater (0.8-0.9 mm/sec) thanthose of alkali metasilicate melts with similaramounts of iron present (0.5-0.6 mm/sec).
The isomer shift of ferric iron [IS(Fe3*)] of melts inthe system CMFFS is greater than 0.37 mm,/sec andgenerally greater than 0.45 mm,/sec (Table 4). Thatof ferrous iron [IS(Fe'?*)] is about I mm,/sec for allcompositions studied. The quadrupole splitting offerric iron is about I mm/sec and that of ferrous ironis about 2 mm/sec.
0.0
Velocity mm/sec
The Fe'z*/lFe of quenched melts of alkaline earthmetasilicate melts as a function of temperature andCa/(Ca + Mg) and FeSiO, content of the startingmaterial in air is shown in Figures 7-9. No evidencefor a magnetic component was found in the Mdss-bauer spectra of metasilicate melts of the alkalineearths with low iron content. The Fe'z*/)Fe of meltswith 5 mole percent FeSiO: component added to thestarting material increases with decreasng Ca/(Ca +Mg) in air at 1585oC (Fig. 8). Even the most oxidizedsample, however, contains about 50 percent ferrous
7 6. 7 6
Fig. 2. 57Fe Mcissbauer spectra of quenched melt of Na2SiO3 composition with I mole percent NaFe3*Si2O5. (A) 298K' (B) 77K.
Fig. 3. 5?Fe Mcissbauer spectra of quenched melts of composition NFS5I8 (see Fig. l) as a function of/(OJ at l400oC. (A)flOJ :
lO-a atm. (B)lor) : 10-6 atm. (c)./(or) : l0-8 atm.
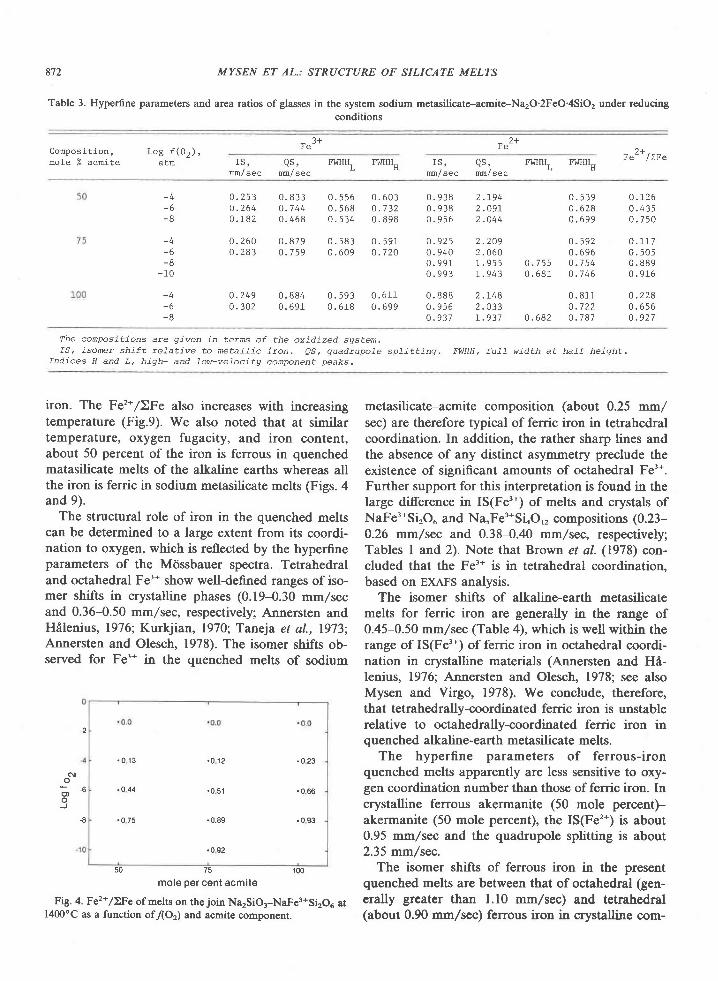
872 MYSEN ET AL.: STRUCTURE OF SILICATE MELTS
Table 3. Hyperfine parameters and area ratios of glasses in the system sodium metasilicate-acmite-Na2O'2Feo'4sio2 under reducing
condrtrons
?+r e
?+F e -
Compos i t ion ,mole Z acmite
L o g f ( 0 2 ) ,F e - / I F er s , Q S ,
m/sec m/secFWHHL FWHHH rs, QSI Fh'rrHl
m/ sec m/ secFhItH,,
n
- 4- 6- 8
- 6- 8
- 1 0
0 . 2 5 3 0 . 8 3 30 . 2 6 4 0 . 1 4 40 . 1 8 2 0 . 4 6 8
0 . 2 6 0 0 . 8 7 90 . 2 8 3 0 . 1 5 9
0 . 2 4 9 0 . 8 8 40 . 3 0 2 0 . 6 9 1
0 . 5 5 6 0 . 6 0 30 . 5 6 8 0 . 7 3 20 . s 3 4 0 . 8 9 8
0 . 5 8 3 0 . 5 9 10 . 6 0 9 0 . 1 2 0
0 . 5 9 3 0 . 6 1 10 . 6 1 8 0 . 6 9 9
0 . 9 3 8 2 . r 9 40 . 9 3 8 2 . 0 9 10 . 9 5 6 2 . 0 4 4
0 . 9 2 5 2 . 2 0 90 . 9 4 0 2 . 0 6 00 . 9 9 1 1 . 9 5 50 . 9 9 3 r . 9 4 J
0 . 8 8 8 2 . L 4 80 . 9 5 6 2 . 0 3 30 . 9 3 7 r . 9 3 7
0 . 5 3 9 0 . L 2 60 . 6 2 8 0 . 4 3 50 . 6 9 9 0 . 7 5 0
0 . 5 9 2 0 . l l 7o . 6 9 6 0 . 5 0 5
0 . 7 5 5 0 . 7 5 4 0 . 8 8 90 . 6 8 1 0 . 7 4 6 0 . 9 L 6
0 . 8 1 1 0 . 2 2 80 . 1 2 2 0 . 6 5 6
0 . 6 8 2 0 . 7 8 7 0 . 9 2 7
- 4- 6- 8
The conpositions are given in terms of the oxidized sgstem.IS , i somer sh i f t re la t i ve xo mexaTf ic i ron . Qs, quadrupoTe sp f i t t ing . FWHH, fu71 w id th a t ha l f he igh t .
Indices H and L, high- and 7ow-veTocitg conponent peaks.
iron. The Fe'?*/)Fe also increases with increasingtemperature (Fig.9). We also noted that at similartemperature, oxygen fugacity, and iron content,about 50 percent of the iron is ferrous in quenchedmatasilicate melts of the alkaline earths whereas allthe iron is ferric in sodium metasilicate melts (Figs. 4and 9).
The structural role of iron in the quenched meltscan be determined to a large extent from its coordi-nation to oxygen, which is reflected by the hyperfineparameters of the Mcissbauer spectra. Tetrahedraland octahedral Fe3* show well-defined ranges of iso-mer shifts in crystalline phases (0.19-0.30 mm/secand 0.36-0.50 mm/sec, respectively; Annersten andHdlenius, 1976; Kurkjian, 1970; Taneja et al., 1973;Annersten and Olesch, 1978). The isomer shifts ob-served for Fe3* in the quenched melts of sodium
. 0 1 3 . O 1 2 . O 2 3
, 0 4 4 . O S l . 0 6 6
.0 75 .0 .89 .0 93
.0 92
50 75 100
mole per cent acmite
Fig. 4. Fe2+,/)Fe of melts on the join Na2SiO3-NaFe3*Si2O5 atl400oC as a function offio2) and acmite componcnt.
metasilicate-acmite composition (about 0.25 mm/sec) are therefore typical of ferric iron in tetrahedralcoordination. In addition, the rather sharp lines andthe absence of any distinct asymmetry preclude theexistence of significant amounts of octahedral Fe'*.Further support for this interpretation is found in thelarge difference in IS(Fe3*) of melts and crystals ofNaFe3*SirO6 and Na5Fe'*StoO,, compositions (0.23-0.26 mm/sec and 0.38-0.40 mm,/sec, respectively;Tables I arrd 2). Note that Brown et al. (1978) con-cluded that the Fe3* is in tetrahedral coordination,based on EXAFS analysis.
The isomer shifts of alkaline-earth metasilicatemelts for ferric iron are generally in the range of0.45-0.50 mm/sec (Table 4), which is well within therange of IS(Fe3*) of ferric iron in octahedral coordi-nation in crystalline materials (Annersten and Hi-lenius, 1976; Annersten and Olesch, 1978; see alsoMysen and Virgo, 1978). We conclude, therefore,that tetrahedrally-coordinated ferric iron is unstablerelative to octahedrally-coordinated ferric iron inquenched alkaline-earth metasilicate melts.
The hyperfine parameters of ferrous-ironquenched melts apparently are less sensitive to oxy-gen coordination number than those of ferric iron. Incrystalline ferrous akermanite (50 mole percent)-akermanite (50 mole percent), the IS(Fe'z*) is about0.95 mm/sec and the quadrupole splitting is about2.35 mm/sec.
The isomer shifts of ferrous iron in the presentquenched melts are between that of octahedral (gen-erally greater than l.l0 mmlsec) and tetrahedral(about 0.90 mm/sec) ferrous iron in crystalline com-
-2
N
o) 'o
_9-8
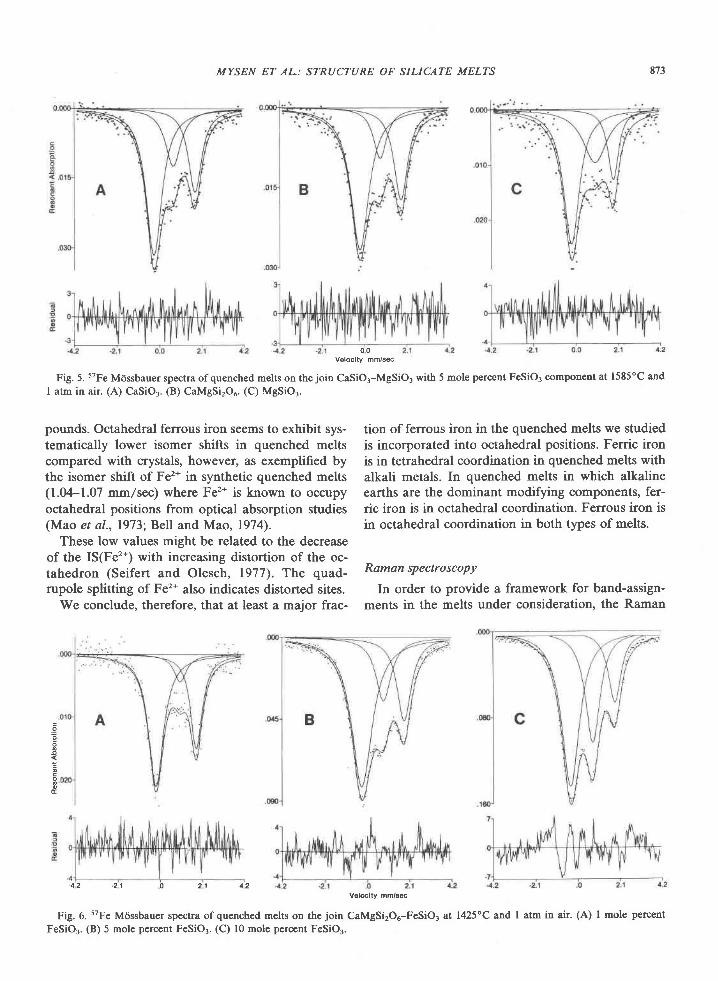
MYSEN ET AL; STRUCTURE OF SILICATE MELTS 873
Fig. 5. s?Fe M<issbauer spectra of quenched melts on the join CaSiOs-MgSiO, with 5 mole percent FeSiO3 component at l585oC and
I atm in air. (A) CaSiO3. (B) CaMeSizOu. (C) MgSiOr.
0 0Veloclty mm/sec
pounds. Octahedral ferrous iron seems to exhibit sys-tematically lower isomer shifts in quenched meltscompared with crystals, however, as exemplified bythe isomer shift of Fe'* in synthetic quenched melts(1.04-1.07 mm/sec) where Fe'* is known to occupyoctahedral positions from optical absorption studies(Mao et al., 19731' Bell and Mao, 1974).
These low values might be related to the decreaseof the IS(Fe'?*) with increasing distortion of the oc-tahedron (Seifert and Olesch, 1977). The quad-rupole splitting of Fe2* also indicates distorted sites.
We conclude, therefore, that at least a major frac-
tion of ferrous iron in the quenched melts we studiedis incorporated into octahedral positions. Ferric ironis in tetrahedral coordination in quenched melts with
alkali metals. In quenched melts in which alkalineearths are the dominant modifying components, fer-ric iron is in octahedral coordination. Ferrous iron isin octahedral coordination in both types of melts.
Raman spectroscopy
In order to provide a framework for band-assign-ments in the melts under consideration, the Raman
o
G
- 4 2 - 2 1 0 2 1 1 2
Fig.6.57Fe Mcissbauer spectra of quenched melts on the join CaMgSi2O5-FeSiO3 at 1425'C and I atm in air. (A) I mole percent
FeSiO3. @) 5 mole percent FeSiO3. (C) l0 mole percent FeSiO3.
Veloclty mm/9oc
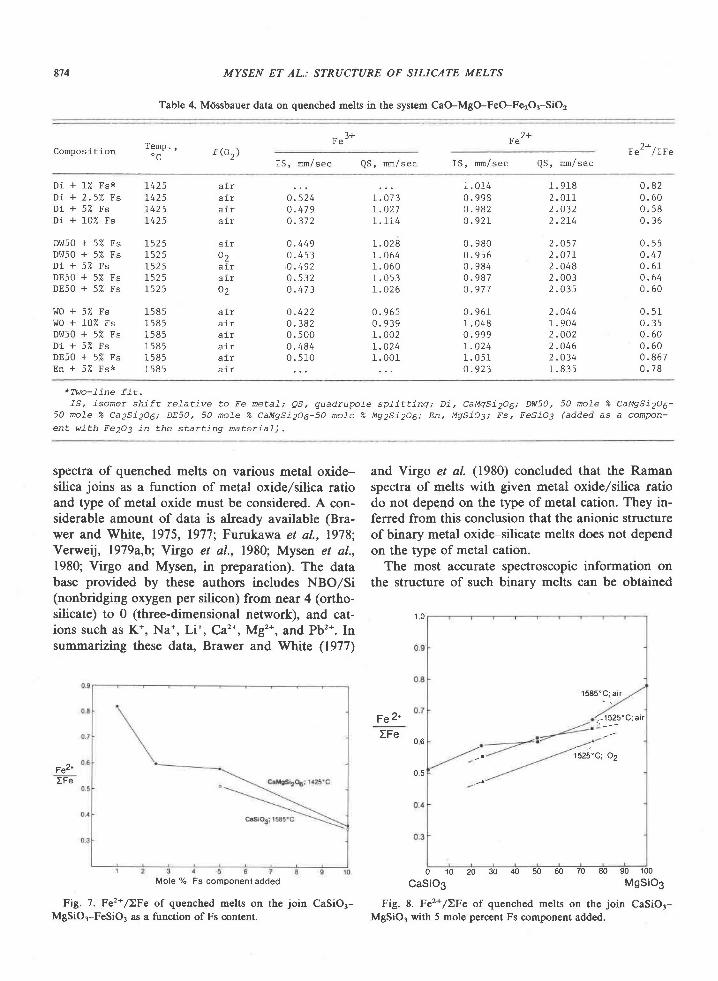
874 MYSEN ET AL.: ST,RUCTURE OF SILICATE MELTS
Table 4. Mcissbauer data on quenched melts in the system CaO-MgO-FeO-Fe2O3-SiO2
1+Fe -
2+f e
Compos i t ion t (o2) F e - / t F eI S , m / s e c Q S , m / s e c I S , m n / s e c Q S , m / s e c
Di + 12 FsxD i + 2 .57 . FsD i + 5 2 F sDi + 102 Fs
t425L425L q z )1 / , a <
a a r
a a r
o2
a r rO 2
aara i ra a r
a i raaraar
0 . 5 2 40 . 4 7 90 . 3 7 2
o . 4 4 90 . 4 5 30 . 4 9 20 . 5 3 20 . 4 7 3
o . 4 2 20 . 3 8 20 . 5 0 00 . 4 8 4o:
l io
1 . 0 7 3L . 0 2 1t . a a +
1 . 0 2 8t . 0 6 41 . 0 6 01 . 0 5 3r . 0 2 6
0 . 9 6 50 , 9 3 91 . 0 0 2t . 0 2 41 . 0 0 1
1 . 0 1 40 . 9 9 80 . 9 8 20 . 9 2 L
0 . 9 8 00 . 9 5 60 . 9 8 40 . 9 8 70 . 9 7 7
0 . 9 6 11 , 0 4 80 . 9 9 9L . 0 2 41 . 0 5 1o . 9 2 3
1 , 9 1 82 . 0 r 12 . 0 3 22 , 2 L 4
2 . 0 5 72 . 0 7 r2 . 0 4 82 . 0 0 32 . 0 3 5
2 . 0 4 4L . 9 0 42 . 0 0 22 . 0 4 62 . 0 3 41 . 8 3 5
0 , 8 20 . 5 00 . 5 80 . 3 6
0 . 5 5o . 4 70 . 6 10 . 6 40 . 6 0
0 . 5 10 . 3 50 . 6 00 . 6 00 . 8670 . 7 8
DW50 + 5% Fs 1525Dt{50 + 5% Fs 1525Di + 52 Fs 1,525DE50 + 5% Fs 1525DE50 + 52 Fs 1525
W0 + 5Z Fs 1585W0 + 102 Fs 1585Dhr50 + 52 Fs 1585D i + 5Z Fs 1585DE50 + 52 Fs 1585En * 5% Fs * 1585
*Two- l ine f i t .IS , i somer sh i f t re la t i ve to Fe ne ta l ; QS, quadrupoTe sp f i t t ing ; D i , CaMgSi2O6; Dw50, 50 moTe % CaMgSi2A6-
50 no l -e Z Ca2Si2O6, DE50, 50 moLe % CaMgSi2O6-5O mofe % Mg2Si2O6; En, MgSiO3; Fs , FeSiO3 (added as a compon-
ent w i th Fe2O3 in the s ta r t ing mater ia f ) ,
spectra of quenched melts on various metal oxide-silica joins as a function of metal oxide/silica ratioand type of metal oxide must be considered. A con-siderable amount of data is already available (Bra-wer and white, 1975, 1977; Furukawa et al., 1978;Verweij, l979a,b; Yhgo et al., 1980; Mysen et al.,1980; Virgo and Mysen, in preparation). The database provided by these authors includes NBO/Si(nonbridging oxygen per silicon) from near 4 (ortho-silicate) to 0 (three-dimensional network), and cat-ions such as K+, Na*, Li*, Ca2*,Mg'*, and Pb2*. Insummarizing these data, Brawer and white (1977\
Mole % Fs componentadded
Fig. 7. Fe2*/2Fe of quenched melts on the join CaSiOr-MgSiQ-FeSiQ as a function of Fs content.
and Virgo et al. (1980) concluded that the Ramanspectra of nelts with given metal oxide/sitca ratiodo not depend on the type of metal cation. They in-ferred from this conclusion that the anionic structureof binary metal oxide-silicate melts does not dependon the type of metal cation.
The most accurate spectroscopic information onthe structure of such binarv melts can be obtained
1 0
1585 'C: a i r
'<)!23'c;^t'
1525"Q; 02
F e 2 'EFe
Fezr:FE
0 6
0 5
0 1 0 2 0 3 0 4 0 5 0 6 0 7 0CaSi03
80 90 100
MgSi03
Fig. 8. Fe2*/lFe of quenched melts on the join CaSiO3-MgSiO3 with 5 mole percent Fs component added.
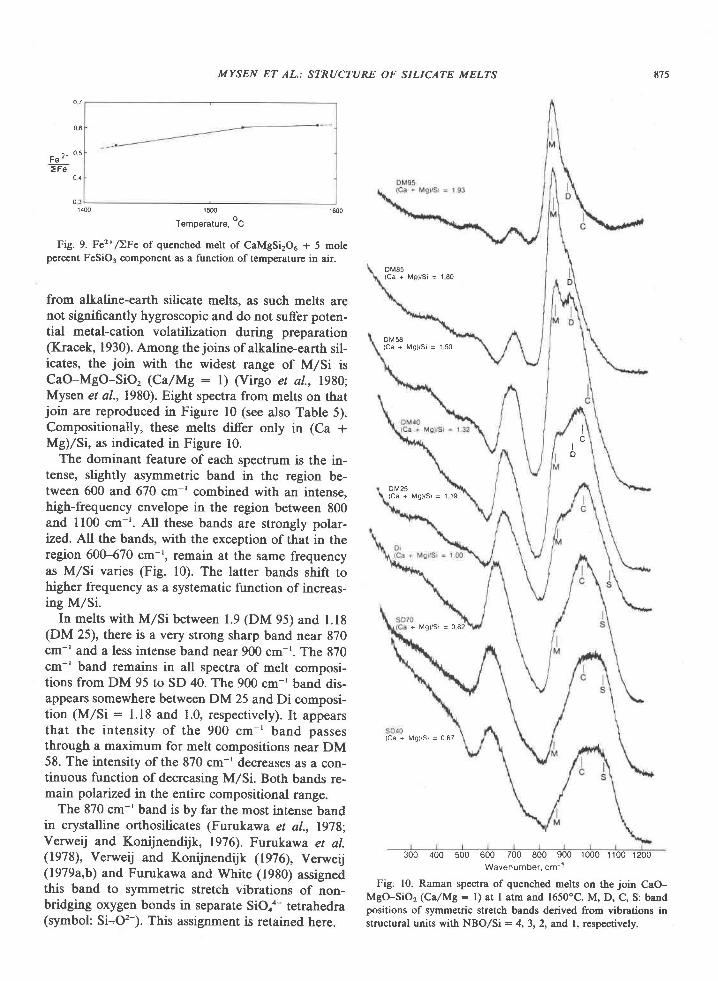
875
300 400 500 600 700 800 900 1000 1100 1200Wavenumber. cm-1
Fig. 10. Rarnan spectra of quenched melts on the join CaO-MgO-SiO, (Cz/Me: l) at I atm and l650oc. M, D, C, S: bandpositions of symmetric stretch bands dcrived from vibrations instructural units with NBO/Si : 4,3,2, and I, respectively.
MYSEN ET AL: STRUCTURE OF SILICATE MELTS
o 7
0 6
F " 2 * o '
: F E0 4
0 314m 1500 1600
Temperature, oC
Fig. 9. Fe2+/)Fe of quenched melt of CaMgSirO5 + 5 molepercent FeSiO3 component as a function of temperature in air.
from alkaline-earth silicate melts, as such melts ar€not significantly hygroscopic and do not suffer poten-tial metal-cation volatilization during preparation(Kracek, 1930). Among the joins of alkaline-earth sil-icates, the join with the widest range of M/Si isCaO-MgO-SiO, (CalMg : l) (Virgo et al., 1980;Mysen et al., 1980). Eight spectra from melts on thatjoin are reproduced in Figure l0 (see also Table 5).Compositionally, these melts differ only in (Ca +Mg)/Si, as indicated in Figure 10.
The dominant feature of each spectrum is the in-tense, slightly asymmetric band in the region be-tween 600 and 670 cm-' combined with an intense,high-frequency envelope in the region between 800and 1100 cm-r. All these bands are strongly polar-ized. All the bands, with the exception of that in theregion 600-670 cm-r, remain at the same frequencyas M/Si varies (Fig. l0). The latter bands shift tohigher frequency as a systematic function of increas-ing M/Si.
In melts with M/Si between 1.9 (DM 95) and l.18(DM 25), there is a very strong sharp band near 870cm-' and a less intense band near 900 cm-'. The 870cm-' band remains in all spectra of melt composi-tions from DM 95 to SD 40. The 900 cm-' band dis-appears somewhere between DM 25 and Di composi-tion (M/Si : l.l8 and 1.0, respectively). It appearsthat the intensity of the 900 cm-' band passesthrough a maximum for melt compositions near DM58. The intensity of the 870 cm-' decreases as a con-tinuous function of decreasing M/Si. Both bands re-main polarized in the entire compositional range.
The 870 cm-' band is by far the most intense bandin crystalline orthosilicates (Furukawa et al., 1978;Verweij and Konijnendijk, 1976). Furukawa et al.(1978), Verweij and Konijnendijk (1976), Verweij(1979a,b) and Furukawa and White (1980) assignedthis band to symmetric stretch vibrations of non-bridging oxygen bonds in separate Siooo- tetrahedra(symbol: Si-O'-). This assignment is retained here.
DM85( C a + M g Y S i = 1 8 0
DN458( C a + M g ) / S i = 1 5 0
I
l co
D M 2 5( C a + M g ) / S r = 1 1 9
+ M g ) / S , = 0 8 2
lca + [ ,19)/Sr = 067
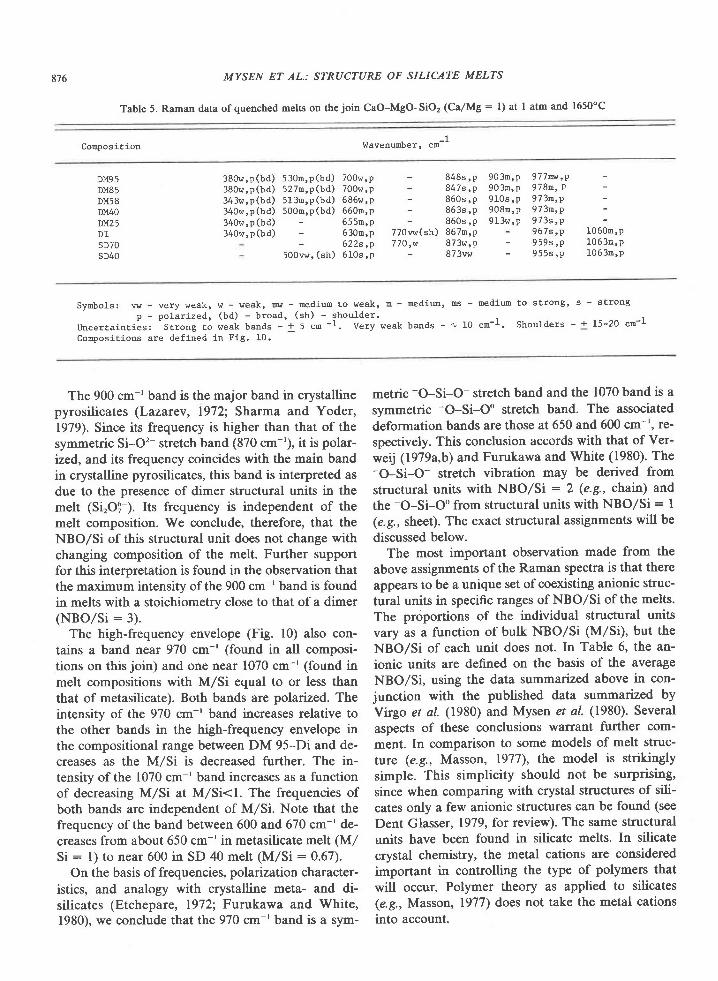
876 MYSEN ET AL.: STRUCTURE OF SILICATE MELTS
Table 5. Raman data of quenched melts on the join CaO-MgO-SiO 2 (Ca/Mg: l) at I atm and 1650"C
composition1
wavenurDber, cn
DM95DM85DM58D1140DM25D ISDTOSD4O
380w,p (bd)380w, p (bd)343w, p (bd)340w, p (bd)340w,p (bd)340w, p(bd)
530m,p (bd ) 700w ,p527m,p(bd) 700w,p513n ,p (bd ) 686w 'p500m,p (bd ) 660m 'p
- 655n ,P- 630n'P- 6 2 2 s , p
500w, (sh) 610s 'p
- 848s ,p- 8 4 7 s , p- 8 6 0 s , p- 863s ,p- 860s ,p
770vw(sh) 867n,P/ l u , w d / J w , P
- 873w
903n ,p 977w ,p903n,p 978n' P9 I0s ,p 973n 'p908n,p 973n,p9 l3w ,p 973s ' p
- 967s ,p 1060n 'P- 959s ,P 1063n 'P- 955s ' p 1063n 'P
S y n b o l s : v w - v e r y w e a k , w - w e a k , w - n e d i u m E o w e a k , m - n e d i u n , n s -
p - po la r ized , ( ta ; - b road, (sh) - shou lder .
Uncertainties: Strong to weak bands - t 5 cn -r. Very weak bands - t 10
Compos i t ions are de f ined tn F ig ' 10 .
nedlum to strong, s - strong
cm-1. Shoulders - + 15-20 cn-I
The 900 cm-t band is the major band in crystallinepyrosilicates (Lazarev, 1972; Sharma and Yoder,1979). Since its frequency is higher than that of thesymmetric Si-O'- stretch band (870
"--'), it is polar-
tzed, and its frequency coincides with the main bandin crystalline pyrosilicates, this band is interpreted asdue to the presence of dimer structural units in themelt (Si,Of-). Its frequency is independent of themelt composition. We conclude, therefore, that theNBO/Si of this structural unit does not change withchanging composition of the melt. Further supportfor this interpretation is found in the observation thatthe maximum intensity of the 900 cm-' band is foundin melts with a stoichiometry close to that of a dimer(NBo/S i :3 ) .
The high-frequency envelope (Fig. l0) also con-tains a band near 970 cm-' (found in all composi-tions on this join) and one near 1070 cm-' (found inmelt compositions with M/Si equal to or less thanthat of metasilicate). Both bands are polarized. Theintensity of the 970 cm-' band increases relative tothe other bands in the high-frequency envelope inthe compositional range between DM 95-Di and de-creases as the M/Si is decreased further. The in-tensity of the 1070 cm-' band increases as a functionof decreasing M/Si at M/Si<I. The frequencies ofboth bands are independent of M/Si. Note that thefrequency of the band between 600 and 670 cm-' de-creases from about 650 cm-' in metasilicate melt (M/Si : l) to near 600 in SD 40 melt (M/Si : 0.67).
On the basis of frequencies, polarization character-istics, and analogy with crystalline meta- and di-silicates (Etchepare, 1972; Furukawa and White,1980), we conclude that the 970 cm-' band is a sym-
metric -O-Si-O- stretch band and the 1070 band is asymmetric -O-Si-O" stretch band. The associateddeformation bands are those at 650 and 600 cm-', re-spectively. This conclusion accords with that of Ver-weij (19?9a,b) and Furukawa and White (1980). The-O-Si-O- stretch vibration may be derived fromstructural units with NBO/Si : 2 (e.g., chain) andthe -O-Si-Oo from structural units with NBO/Si: I(e.g., sheet). The exact structural assignments will bediscussed below.
The most important observation made from theabove assignments of the Raman spectra is that thereappears to be a unique set of coexisting anionic struc-tural units in specific ranges of NBO/Si of the melts.The proportions of the individual structural unitsvary as a function of bulk NBO/Si (M/Si), but theNBO/Si of each unit does not. In Table 6, the an-ionic units are defined on the basis of the averageNBO/Si, using the data summarized above in con-junction with the published data summarized byVirgo et a/. (1980) and Mysen et al. (1980). Severalaspects of these conclusions warrant further com-ment. In comparison to some models of melt struc-ture (e.g., Masson, 1977), the model is strikinglysimple. This simplicity should not be surprising,since when comparing with crystal structures of sili-cates only a few anionic structures can be found (seeDent Glasse r, 1979, for review). The same structuralunits have been found in silicate melts. In silicatecrystal chemistry, the metal cations are consideredimportant in controlling the type of polymers thatwill occur. Polymer theory as applied to silicates(e.g., Masson, 1977) does not take the metal cationsinto account.
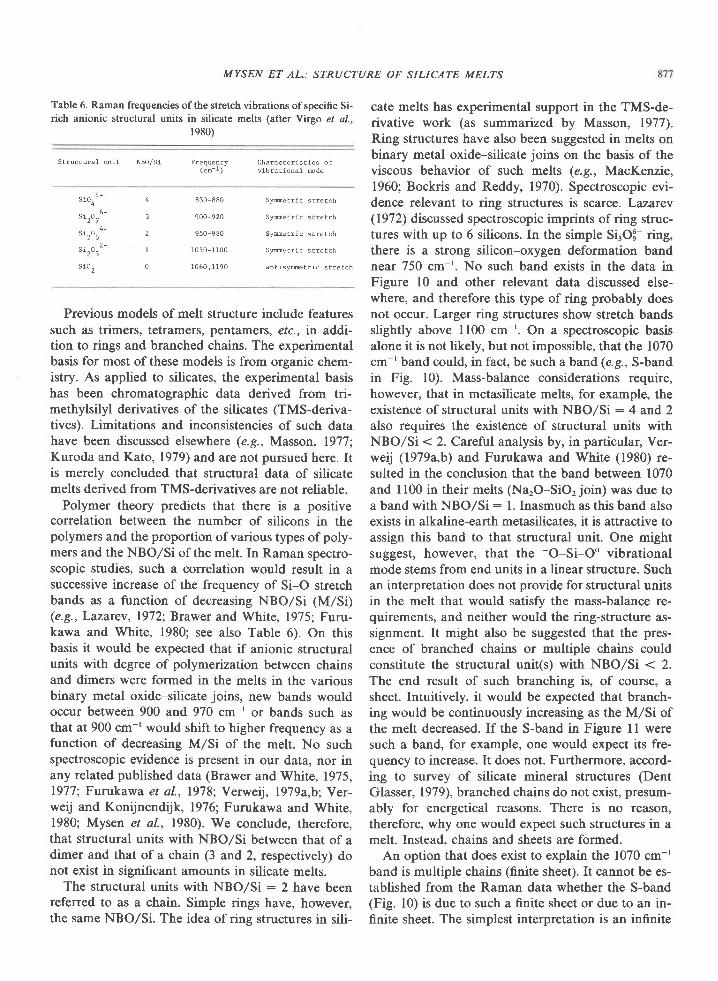
MYSEN ET AL.: STRUCTURE OF SILICATE MELTS
Table 6. Raman frequencies ofthe stretch vibrations ofspecific Si-rich anionic structural units in silicate melts (after Yirgo et al.,
1980)
S t r u c E u r a l u i t N B O / S I F r e q u e n c y C h a r a c c e r i s t i c s o t(cn- ] ) v ib ra t iona l mode
cate melts has experimental support in the TMS-de-rivative work (as summarized by Masson, 1977).Ring structures have also been suggested in melts onbinary metal oxide-silicate joins on the basis of theviscous behavior of such melts (e.9., MacKenzie,1960; Bockris and Reddy, 1970). Spectroscopic evi-dence relevant to ring structures is scarce. Lazarev(1972) discussed spectroscopic imprints of ring struc-tures with up to 6 silicons. In the simple Si.O!- ring,there is a strong silicon-oxygen deformation bandnear 750 cm-'. No such band exists in the data inFigure l0 and other relevant data discussed else-where, and therefore this type of ring probably doesnot occur. Larger ring structures show stretch bandsslightly above ll00 cm-'. On a spectroscopic basisalone it is not likely, but not impossible, that the 1070cm-' band could, in fact, be such a band (e.9., S-bandin Fig. 10). Mass-balance considerations require,however, that in metasilicate melts, for example, theexistence of structural units with NBO/Si : 4 and 2also requires the existence of structural units withNBO/Si < 2. Careful analysis by, in particular, Ver-weij (1979a,b) and Furukawa and White (1980) re-sulted in the conclusion that the band between 1070and I100 in their melts (Na,O-SiO, join) was due toa band with NBO/Si : l. Inasmuch as this band alsoexists in alkaline-earth metasilicates, it is attractive toassign this band to that structural unit. One mightsuggest, however, that the
-O-Si-Oo vibrationalmode stems from end units in a linear structure. Suchan interpretation does not provide for structural unitsin the melt that would satisfy the mass-balance re-quirements, and neither would the ring-structure as-signment. It might also be suggested that the pres-ence of branched chains or multiple chains couldconstitute the structural unit(s) with NBO/Si < 2.The end result of such branching is, of course, asheet. Intuitively, it would be expected that branch-ing would be continuously increasing as the M/Si ofthe melt decreased. If the S-band in Figure I I weresuch a band, for example, one would expect its fre-quency to increase. It does not. Furthermore, accord-ing to survey of silicate mineral structures (DentGlasser, 1979), branched chains do not exist, presum-ably for energetical reasons. There is no reason,therefore, why one would expect such structures in amelt. Instead, chains and sheets are formed.
An option that does exist to explain the 1070 cm-'band is multiple chains (finite sheet). It cannot be es-tablished from the Raman data whether the S-band(Fig. l0) is due to such a finite sheet or due to an in-finite sheet. The simplest interpretation is an infinite
sio4
Sizo z
t -s i ^ 0 _ -
s io2
850- 8 80
900-9 20
9 5 0 - 9 8 0
r050-1100
1 0 6 0 , 1 1 9 0
3
2
1
0
S y I @ E r i c s t r e t c h
S y m e t r i c s t r e t c h
S y m e E r i c s t r e r c h
S y m e E r i c s t r e t c h
a n t i s y m e ! r i c s t r e E c h
Previous models of melt structure include featuressuch as trimers, tetramers, pentamers, etc.,'n addi-tion to rings and branched chains. The experimentalbasis for most of these models is from organic chem-istry. As applied to silicates, the experimental basishas been chromatographic data derived from tri-methylsilyl derivatives of the silicates (TMS-deriva-tives). Limitations and inconsistencies of such datahave been discussed elsewhere (e.g., Masson, 1977;Kuroda and Kato, 1979) and are not pursued here. Itis merely concluded that structural data of silicatemelts derived from TMS-derivatives are not reliable.
Polymer theory predicts that there is a positivecorrelation between the number of silicons in thepolymers and the proportion of various types of poly-mers and the NBO/Si of the melt. In Raman spectro-scopic studies, such a correlation would result in asuccessive increase of the frequency of Si-O stretchbands as a function of decreasing NBO/Si (M/Si)(e.g., Lazarcv, 1972; Brawer and White, 1975; Furu-kawa and White, 1980; see also Table 6). On thisbasis it would be expected that if anionic structuralunits with degree of polymerization between chainsand dimers were formed in the melts in the variousbinary metal oxide-silicate joins, new bands wouldoccur betweeh 900 and 970 cm-r or bands such asthat at 900 cm-' would shift to higher frequency as afunction of decreasing M/Si of the melt. No suchspectroscopic evidence is present in our data, nor inany related published data (Brawer and White, 19i5,1977; Furukawa et al., 1978; Verweij, l979a,b; Yer-weij and Konijnendijk, 1976; Furukawa and White,1980; Mysen et al., 1980). We conclude, therefore,that structural units with NBO/Si between that of adimer and that of a chain (3 and 2, respectively) donot exist in significant amounts in silicate melts.
The structural units with NBO/Si : 2 have beenreferred to as a chain. Simple rings have, however,the same NBO/Si. The idea of ring structures in sili-
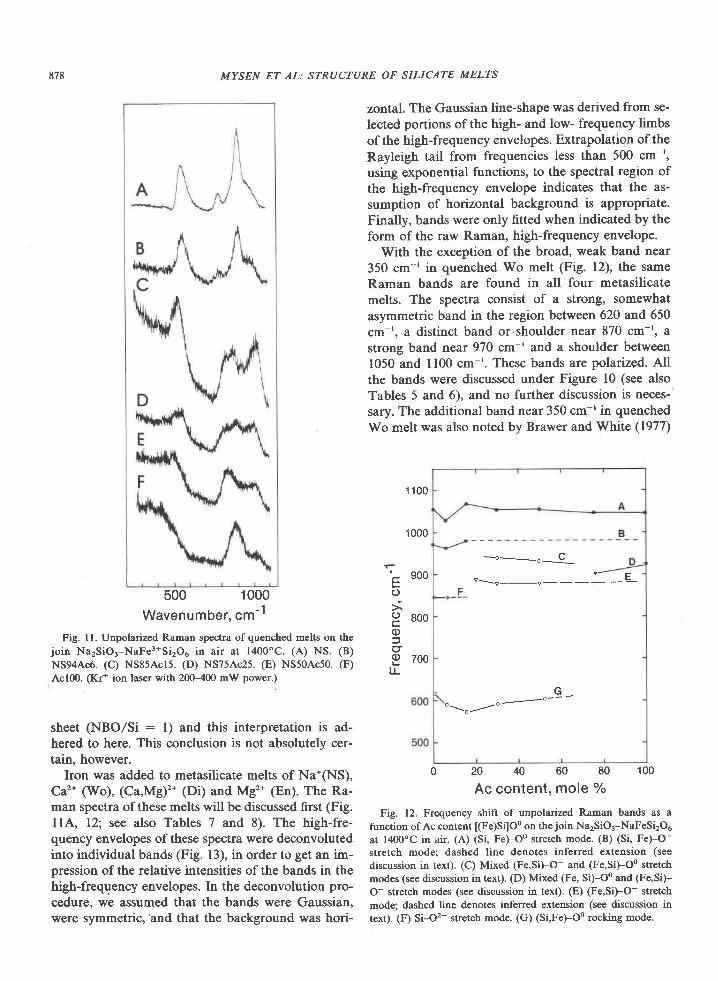
878
500 1000Wavenumb"r,
"t '1Fig. I l. Unpolarized Raman spectra of quenched melts on the
jo in Na2SiO3-NaFe3*Si2O6 in a i r at 1400"C. (A) NS. (B)
NS94Ac6. (C) NS85Acl5. (D) NS7sAc25. (E) NS50Ac50. (F)
Acl00. (Kr+ ion laser c.ith 20H00 mW power.)
sheet (NBO/Si : l) and this interpretation is ad-hered to here. This conclusion is not absolutely cer-tain, however.
Iron was added to metasilicate melts of Na*(NS),Ca'* (Wo), (Ca,Mg)'* (Di) and Mg'?* (En). The Ra-man spectra of these melts will be discussed first (Fig.llA, 121' see also Tables 7 and 8). The high-fre-quency envelopes of these spectra were deconvolutedinto individual bands (Fig. l3), in order to get an im-pression of the relative intensities of the bands in thehigh-frequency envelopes. In the deconvolution pro-cedure. we assumed that the bands were Gaussian.were symmetric,'and that the background was hori-
MYSEN ET AL: STRUCTURE OF SILICATE MELTS
zontal. The Gaussian line-shape was derived from se-lected portions of the high- and low- frequency limf5of the high-frequency envelopes. Extrapolation of theRayleigh tail from frequencies less than 500 cm-',using exponential functions, to the spectral region ofthe high-frequency envelope indicates that the as-sumption of horizontal background is appropriate.Finally, bands were only fitted when indicated by theform of the raw Raman, high-frequency envelope.
With the exception of the broad, weak band near350 cm-' in quenched Wo melt (Fig. l2), the sameRaman bands are found in all four metasilicatemelts. The spectra consist of a strong, somewhatasymmetric band in the region between 620 and 650cm-', a distinct band or,shoulder near 870 cm-', astrong band near 970 cm-' and a shoulder between1050 and ll00 cm-'. These bands are polarized. Allthe bands were discussed under Figure 10 (see alsoTables 5 and 6), and no further discussion is neces-sary. The additional band near 350 cm-' in quenchedWo melt was also noted by Brawer'and White (1977)
1 100
1000
- o - o C
F
G"-\"---'/-
0 20 40 60 80 100
Ac content, mole 70
Fig. t2. Frequency shift of unpolarized Raman bands as a
function of Ac content [(Fe)Si]Oo on the join Na2SiO3-NaFeSi2O5
at l400oC in air. (A) (Si, Fe)-Oo stretch mode. (B) (Si, Fe)r-O-
stretch mode; dashed line denotes inferred extension (see
discussion in text). (C) Mixed (Fe,Si)-O- and (Fe,Si)-Oo stretch
modes (see discussion in text). (D) Mixed (Fe, Si)-Oo and (Fe,Si)-
O- stretch modes (see discussion in text). (E) (Fe,Si)-O- stretch
mode; dashed line denotes inferred extension (see discussion in
text). (F) Si-O2- stretch mode. (G) (Si,Fe)-Oo rocking mode.
r '- 900E()j
! aooo=g
E 700Ll-
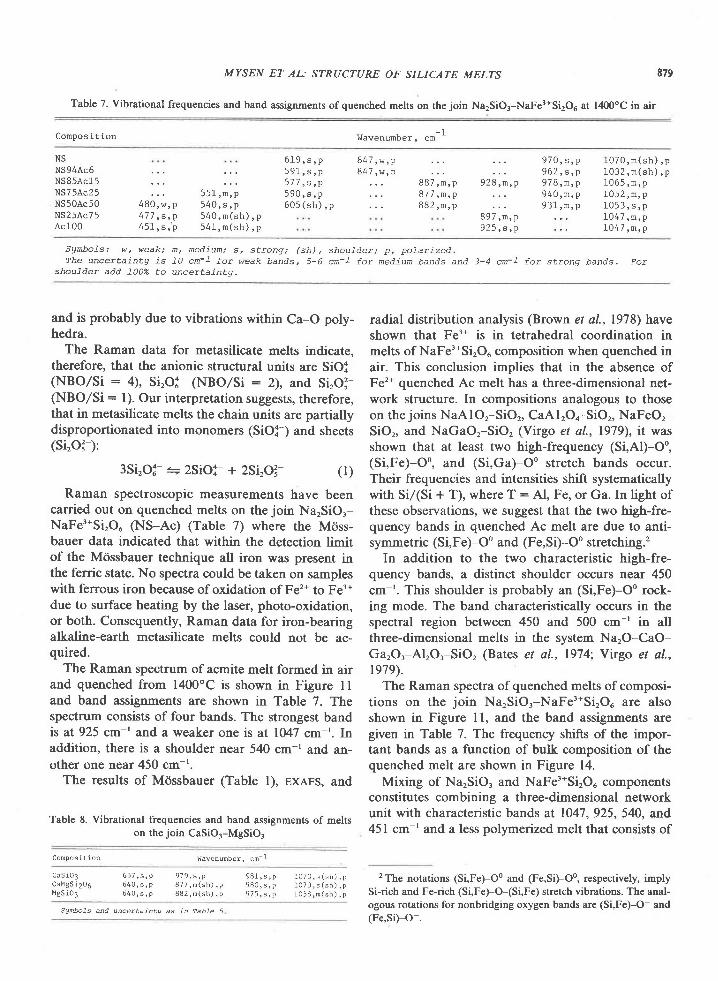
MYSEN ET AL: STRTICTURE OF SILICATE MELTS E79
Table 7. Vibrational frequencies and band assignments of quenched melts on the join Na2SiO3-NaFe3*Si2O6 at 1400'C in air
Compos l t ion i,Iavenumber, cm-l
NSNS94Ac6NS85Ac15NS75Ac25NS5OAc50NS25Ac75Ac100
8 8 7 , m , p
8 8 2 , m , p"4,.i,,8 9 7 , n , p9 2 5 , s , p
9 7 0 , s , p9 6 2 , s , p9 7 8 , m , p9 4 0 , n , pa ? l m n
: : :
1 0 7 0 , m ( s h ) , p1 0 3 2 , m ( s h ) , p1065 , m , p1 0 5 2 , m , p1 0 5 3 , s , p1 0 4 7 , n , p1 0 4 7 , m , p
: : : s s l , ; : ;4 8 0 , w , p 5 4 0 , s , p4 7 7 , s , p 5 4 0 , n ( s h ) , p4 5 1 , s , ' p 5 4 1 , n ( s h ) , p
6 1 9 , s , p 8 4 7 , w , p5 9 1 , s , p 8 4 7 , w , p5 7 7 , s , p5 9 0 , s , p605 ( sh ) , p
Sgnbo ls : w , weak; m, med ium; s , s t rong; (sh) , shou lder ; p , po far ized .The uncertaintq is t0 cm-f for weak bands, 5-6 cn-f for medium bands and 3-4 cn-f for strong bands- For
shouTder add 100% to uncer ta in tL t .
and is probably due to vibrations within Ca-O poly-hedra.
The Raman data for metasilicate melts indicate,therefore, that the anionic structural units are SiOf-(NBO/Si : 4), Si,Of- (NBO/Si : 2), and Si,O3-(NBO/Si : l). Our interpretation suggests, therefore,that in metasilicate melts the chain units are partiallydisproportionated into monomers (SiOX-) and sheets(Si,o3-):
3Si,O:- = 2SiO2- + 2Si,O?- (t)
Raman spectroscopic measurements have beencarried out on quenched melts on the join NarSiOr-NaFe3*SirOu (NS-Ac) (Table 7) where the M6ss-bauer data indicated that within the detection limitof the Mdssbauer technique all iron was present inthe ferric state. No spectra could be taken on sampleswith ferrous iron because of oxidation of Fe2* to Fe3*due to surface heating by the laser, photo-oxidation,or both. Consequently, Raman data for iron-bearingalkaline-earth metasilicate melts could not be ac-quired.
The Raman spectrum of acmite melt formed in airand quenched from 1400'C is shown in Figure I Iand band assignments are shown in Table 7. Thespectrum consists of four bands. The strongest bandis at 925 cm-' and a weaker one is at 1047 cm-'. Inaddition, there is a shoulder near 540 cm-' and an-other one near 450 cm-'.
The results of Mossbauer (Table l), rxars, and
Table 8. Vibrational frequencies and band assignments of meltson the join CaSiO3-MgSiO3
C o m p o s i t i o n Wavenumber , cm- l
radial distribution analysis (Brown et al., 1978) haveshown that Fe3* is in tetrahedral coordination inmelts of NaFe'*Si2Ou composition when quenched inair. This conclusion implies that in the absence ofFe'* quenched Ac melt has a three-dimensional net-work structure. In compositions analogous to thoseon the joins NaAlOr-SiOr, CaAlrOo-SiOr, NaFeOr-SiO,, and NaGaO,-SiO, (Virgo et al., 1979} it wasshown that at least two high-frequency (Si,Al)-Oo,(Si,Fe)-Oo, and (Si,Ga)-Oo stretch bands occur.Their frequencies and intensities shift systematicallywith Si/(Si + T), where T: Al, Fe, or Ga. In light ofthese observations, we suggest that the two high-fre-quency bands in quenched Ac melt are due to anti-symmetric (Si,Fe)-Oo and (Fe,Si)-Oo stretching.2
In addition to the two characteristic high-fre-quency bands, a distinct shoulder occurs near 450cm-r. This shoulder is probably an (Si,Fe)-Oo rock-ing mode. The band characteristically occurs in thespectral region between 450 and 500 cm-' in allthree-dimensional melts in the system NarO-CaO-GarOr-AlrO3-SiO, (Bates et al., 1974; Yirgo et al.,re7e).
The Raman spectra of quenched melts of composi-tions on the join NarSiOr-NaFe'*SirOu are alsoshown in Figure ll, and the band assignments aregiven in Table 7. The frequency shifts of the impor-tant bands as a function of bulk composition of thequenched melt are shown in Figure 14.
Mixing of NarSiO, and NaFe3*SirO. componentsconstitutes combining a three-dimensional networkunit with characteristic bands at 1047, 925, 540, and451 cm-' and a less polymerized melt that consists of
C a S i O 3CaMgS i2O6M g S i 0 j
2The notations (Si,Fe)-Oo and (Fe,Si)-Oo, respectively, implySi-rich and Fe-rich (Si,Fe)-O-(Si,Fe) stretch vibrations. The anal-ogous rotations for nonbridging oxygen bands are (Si,Fe)-O- and(Fe,Si)-O-.
6 3 7 , s , p 9 7 9 , s , p6 4 0 , s , p 8 7 7 , m ( s h ) , p6 4 0 , s , p 8 8 2 , m ( s h ) , p
9 8 1 , s , p 1 0 7 0 , s ( s h ) , p9 8 0 , s , p 1 0 7 0 , s ( s h ) , p9 7 5 , s , p 1 0 5 8 , m ( s h ) , p
Sgmbofs and uncer ta in tg as in Tabfe 5
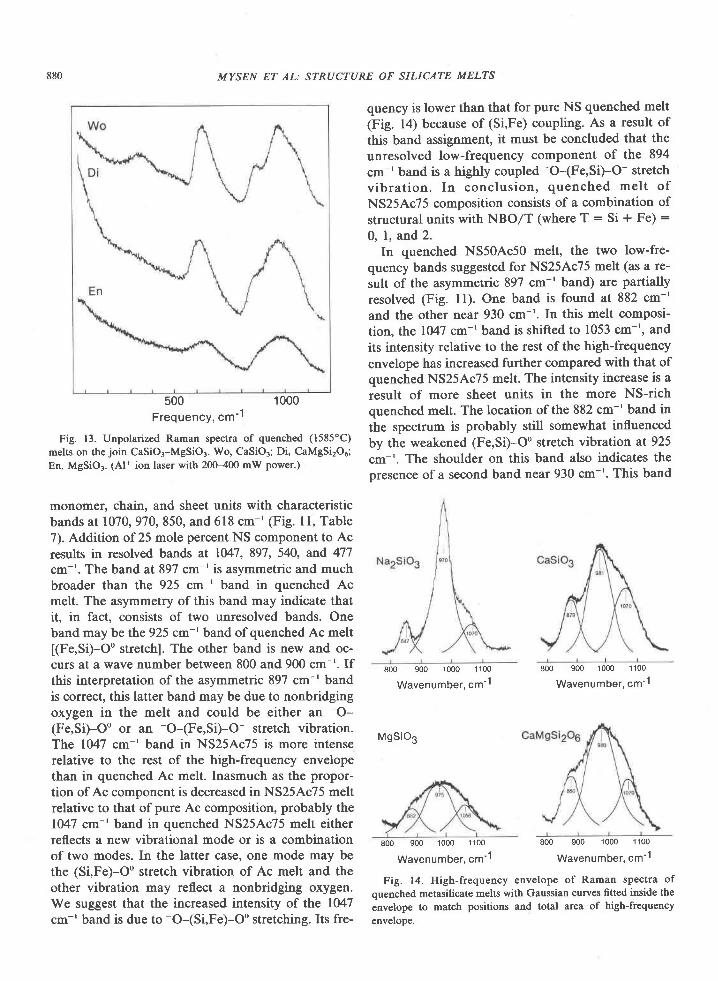
880 MYSEN ET AL: STRUCTURE OF SILICATE MELTS
500 1000Frequency, cm-1
Fig. 13. Unpolarized Raman spectra of quenched (1585"C)melts on the join CaSiO3-MgSiO3. Wo, CaSiO3; Di, CaMgSi2O6;En, MgSiO:. (Al+ ion laser with 200-400 mW power.)
monomer, chain, and sheet units with characteristic
bands at 10'70,970,850, and 618 cm-'(Fig. 11, Table7). Addition of 25 mole percent NS component to Acresults in resolved bands at lVl, 897, 540, and 477cm-'. The band at 897 cm-r is asymmetric and muchbroader than the 925 cm-' band in quenched Acmelt. The asymmetry of this band may indicate thatit. in fact. consists of two unresolved bands. Oneband may be the 925 cm-'band of quenched Ac melt[(Fe,Si)-Oo stretch]. The other band is new and oc-curs at a wave number between 800 and 900 cm-'. Ifthis interpretation of the asymmetric 897 cm-' bandis correct, this latter band may be due to nonbridgingoxygen in the melt and could be either an -O-
(Fe,Si)-Oo or an -O-(Fe,Si)-O- stretch vibration.The 1047 cm-' band in NS25Ac75 is more intenserelative to the rest of the high-frequency envelopethan in quenched Ac melt. lnasmuch as the propor-tion of Ac component is decreased in NS25Ac75 meltrelative to that of pure Ac composition, probably the1047 cm-' band in quenched NS25Ac75 melt eitherreflects a new vibrational mode or is a combinationof two modes. In the latter case, one mode may bethe (Si,Fe)-Oo stretch vibration of Ac melt and theother vibration may reflect a nonbridging oxygen.We suggest that the increased intensity of the 1047cm-' band is due to -O-(Si,Fe)-Oo stretching. Its fre-
Fig. 14. High-frequency envelope of Raman spectra of
quenched metasilicate melts with Gaussian curves fitted inside the
envelope to match positions and total area of high-frequency
envelope.
quency is lower than that for pure NS quenched melt
$ig. la) because of (Si,Fe) coupling. As a result ofthis band assignment, it must be concluded that theunresolved low-frequency component of the 894cm-' band is a highly coupled -O-(Fe,Si)-O- stretchvibrat ion. In conclusion, quenched melt ofNS25Ac75 composition consists of a combination ofstructural units with NBO/T (where T : Si + Fe) :
O, l, and 2.In quenched NS50Ac50 melt, the two low-fre-
quency bands suggested for NS25Ac75 melt (as a re-sult of the asymmetric 897 cm-' band) are partiallyresolved (Fig. I l). One band is found at 882 cm-'and the other near 930 cm-'. In this melt composi-tion, the 1047 cm-' band is shifted to 1053 cm-r, andits intensity relative to the rest of the high-frequencyenvelope has increased further compared with that ofquenched NS25Ac75 melt. The intensity increase is aresult of more sheet units in the more NS-richquenched melt. The location of the 882 cm-' band inthe spectrum is probably still somewhat influencedby the weakened (Fe,Si)-Oo stretch vibration at 925cm-'. The shoulder on this band also indicates thepresence of a second band near 930 cm-'. This band
Wavenumber, cm-1
MgSi03
800 900 1000 1100
Wavenumber, cm-1
800 900 1000 1 100
Wavenumber, cm'1
800 900 1000 1100
Wavenumber, cm'1
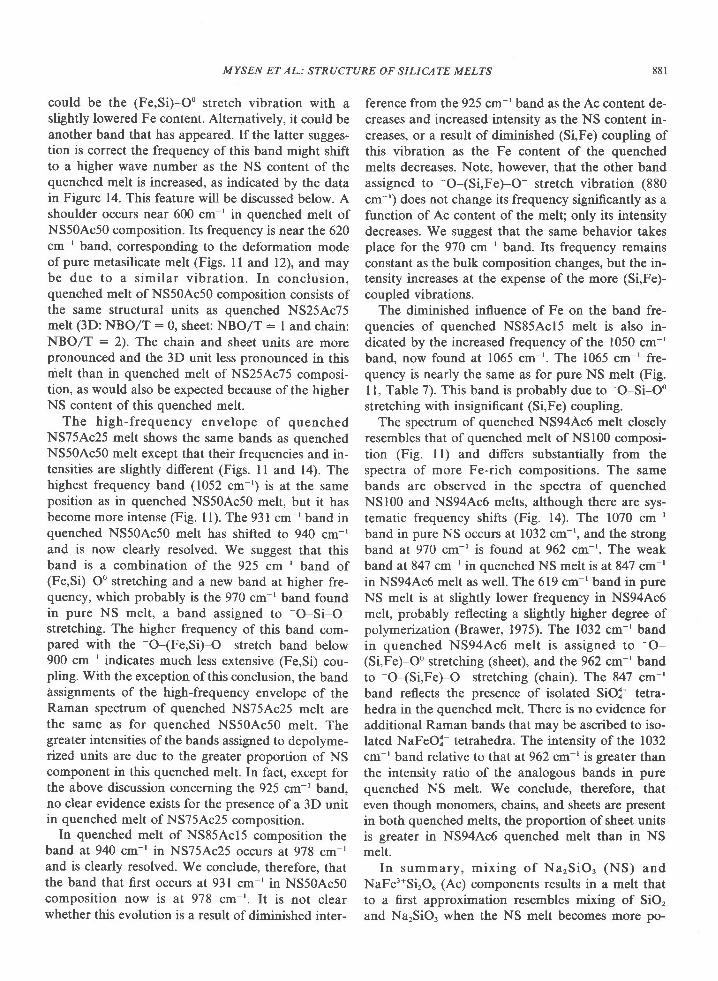
MYSEN ET AL.: STRUCTURE OF SILICATE MELTS 881
could be the (Fe,Si)-Oo stretch vibration with aslightly lowered Fe content. Alternatively, it could beanother band that has appeared. Ifthe latter sugges-tion is correct the frequency of this band might shiftto a higher wave number as the NS content of thequenched melt is increased, as indicated by the datain Figure 14. This feature will be discussed below. Ashoulder occurs near 600 cm-' in quenched melt ofNS50Ac50 composition. Its frequency is near the 620cm-r band, corresponding to the deformation modeof pure metasilicate melt (Figs. ll and l2), and maybe due to a similar vibration. In conclusion,quenched melt of NS50Ac50 composition consists ofthe same structural units as quenched NS25Ac75melt (3D: NBO/T:0, sheet: NBO/T: I and chain:NBO/T : 2). The chain and sheet units are morepronounced and the 3D unit less pronounced in thismelt than in quenched melt of NS25Ac75 composi-tion, as would also be expected because of the higherNS content of this quenched melt.
The high-frequency envelope of quenchedNS75Ac25 melt shows the same bands as quenchedNS50Ac50 melt except that their frequencies and in-tensities are slightly different (Figs. I I and l4). Thehighest frequency band (1052 cm-') is at the sameposition as in quenched NS50Ac50 melt, but it hasbecome more intense (Fig. I l). The 931 cm-' band inquenched NS50Ac50 melt has shifted to 940 cm-'and is now clearly resolved. We suggest that thisband is a combination of the 925 cm ' band of(Fe,Si)-Oo stretching and a new band at higher fre-quency, which probably is the 970 cm-' band foundin pure NS melt, a band assigned to
-O-Si-O-
stretching. The higher frequency of this band com-pared with the O-(Fe,Si)-O- stretch band below900 cm-' indicates much less extensive (Fe,Si) cou-pling. With the exception of this conclusion, the bandlrssignments of the high-frequency envelope of theRaman spectrum of quenched NS75Ac25 melt arethe same as for quenched NS50Ac50 melt. Thegreater intensities of the bands assigned to depolyme-rized units are due to the greater proportion of NScomponent in this quenched melt. In fact, except forthe above discussion concerning the 925 cm ' band,no clear evidence exists for the presence of a 3D unitin quenched melt of NS75Ac25 composition.
In quenched melt of NS85Acl5 composition theband at 940 cm-r in NS75Ac25 occurs at 978 cm-'and is clearly resolved. We conclude, therefore, thatthe band that first occurs at 931 cm-' in NS50Ac50composition now is at 978 cm-'. It is not clearwhether this evolution is a result of diminished inter-
ference from the 925 cm-'band as the Ac content de-creases and increased intensity as the NS content in-creases, or a result of diminished (Si,Fe) coupling ofthis vibration as the Fe content of the quenchedmelts decreases. Note, however, that the other bandassigned to -O-(Si,Fe)-O-
stretch vibration (880cm-') does not change its frequency significantly as afunction of Ac content of the melt; only its intensitydecreases. We suggest that the same behavior takesplace for the 970 cm-' band. Its frequency remainsconstant as the bulk composition changes, but the in-tensity increases at the expense of the more (Si,Fe)-coupled vibrations.
The dirninished influence of Fe on the band fre-quencies of quenched NS85Ac15 melt is also in-dicated by the increased frequency of the 1050 cm-'band, now found at 1065 cm-'. The 1065 cm-' fre-quency is nearly the same as for pure NS melt (Fig.I l, Table 7). This band is probably due to
-O-Si-Oo
stretching with insignificant (Si,Fe) coupling.The spectrum of quenched NS94Ac6 melt closely
resembles that of quenched melt of NSl00 composi-tion (Fig. ll) and differs substantially from thespectra of more Fe-rich compositions. The samebands are observed in the spectra of quenchedNSl00 and NS94Ac6 melts, although there are sys-tematic frequency shifts (Fig. l4). The 1070 cm-'band in pure NS occurs at 1032 cm-', and the strongband at 970 cm-' is found at 962 cm-'. The weakband at 847 cm ' in quenched NS melt is at 847 cm-'in NS94Ac6 melt as well. The 619 cm-'band in pureNS melt is at slightly lower frequency in NS94Ac6melt, probably reflecting a slightly higher degree ofpolymerization (Brawer, 1975). The 1032 cm-' bandin quenched NS94Ac6 melt is assigned to
-O-
(Si,Fe)-Oo stretching (sheet), and the 962 cm-' bandto
-O-(Si,Fe)-O stretching (chain). The 847 cm-'
band reflects the presence of isolated SiOX- tetra-hedra in the quenched melt. There is no evidence foradditional Raman bands that may be ascribed to iso-lated NaFeOX- tetrahedra. The intensity of the 1032cm-r band relative to that at962 cm-'is greater thanthe intensity ratio of the analogous bands in purequenched NS melt. We conclude, therefore, thateven though monomers, chains, and sheets are presentin both quenched melts, the proportion of sheet unitsis greater in NS94Ac6 quenched melt than in NSmelt.
In summary, mix ing of NarSiO, (NS) andNaFe'*SirOu (Ac) compon€nts results in a melt thatto a first approximation resembles mixing of SiO,and NarSiO, when the NS melt becomes more po-
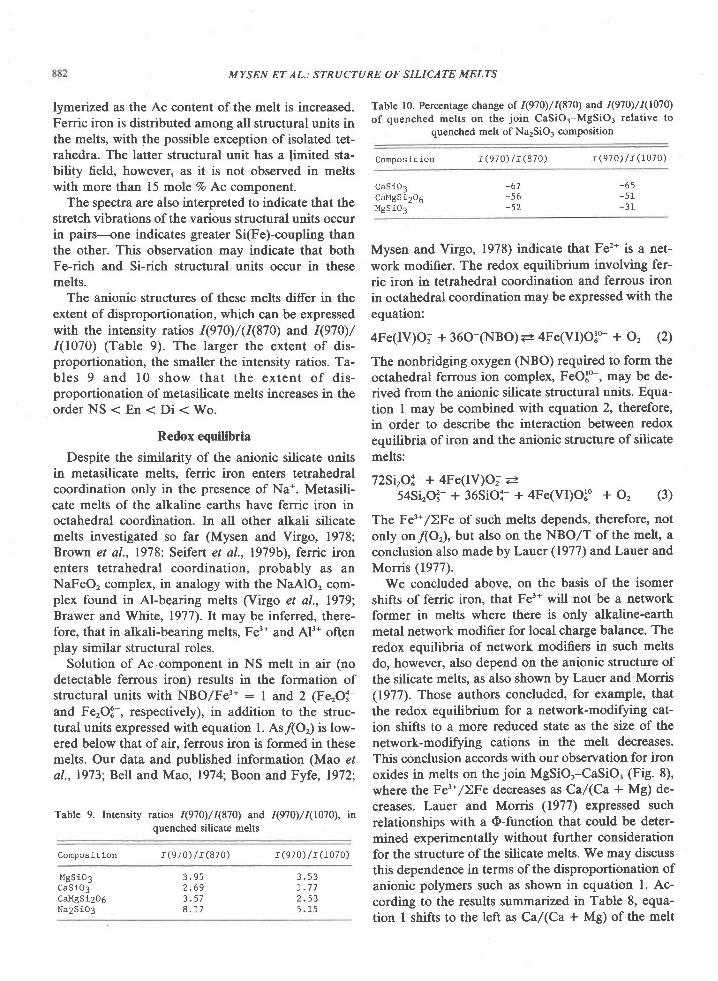
MYSEN ET AL.: STRUCTURE OF SILICATE MELTS
lymerized as the Ac content of the melt is increased.Ferric iron is distributed among all structural units inthe melts, with the possible exception of isolated tet-rahedra. The latter structural unit has a limited sta-bility field, however, as it is not observed in meltswith more than 15 mole 7o Ac component.
The spectra are also interpreted to indicate that thestretch vibrations of the various structural units occurin pairs-one indicates greater Si(Fe)-coupling thanthe other. This observation may indicate that bothFe-rich and Si-rich structural units occur in thesemelts.
The anionic structures of these melts differ in theextent of disproportionation, which can be expressedwith the intensity ratios (970)/(I(870) and I(910)//(1070) (Table 9). The larger the extent of dis-proportionation, the smaller the intensity ratios. Ta-bles 9 and l0 show that the extent of dis-proportionation of metasilicate melts increases in theorder NS < En < Di < Wo.
Redox equilibria
Despite the similarity of the anionic silicate unitsin metasilicate melts. ferric iron enters tetrahedralcoordination only in the presence of Na*. Metasili-cate melts of the alkaline earths have ferric iron inoctahedral coordination. In all other alkali silicatemelts investigated so far (Mysen and Virgo, 1978;Brown et al., 1978: Seifert et al., 1979b), ferric ironenters tetrahedral coordination, probably as anNaFeO, complex, in analogy with the NaAlO, com-plex found in Al-bearing melts (Virgo et al., 1979;Brawer and White, 1977). It may be inferred, there-fore, that in alkali-bearing melts, Fe3* and Al'* oftenplay similar structural roles.
Solution of Ac.component in NS melt in air (nodetcctable ferrous iron) results in the formation ofstructural units with NBO/Fe3* : I and 2 (FerO1-and FerO[-, respectively), in addition to the struc-tural units expressed with equation l. Asl(Or) is low-ered below that of air, ferrous iron is formed in thesemelts. Our data and published information (Mao etal.,1973; Bell and Mao,1974; Boon and Fyfe,19721'
Table 9. Intensity rutios I(970)/\870) and I(970)/I(1070), \nquenched silicate melts
Compos i t ion r ( 970 ) l r ( 870 ) r (97 o) / r (Lo7 o)
Table 10. Percentage change of I(970)/I(87O) and I(970)/I(IU0)of quenched melts on the join CaSiO3-MgSiO3 relative to
quenched melt of Na2SiO3 composition
Compos i t ion r (97o) / r (870) r(97o)/r(ro7o)
CaSiO3CaMgSi206MgSiO3
Mysen and Virgo, 1978) indicate that Fe'?* is a net-work modifier. The redox equilibrium involving fer-ric iron in tetrahedral coordination and ferrous ironin octahedral coordination may be expressed with theequation:
4Fe(IV)O; + 36O-(NBO)a 4Fe(VI)Olo- + O, (2)
The nonbridging oxygen (NBO) required to form theoctahedral ferrous ion complex, FeOlo-, may be de-rived from the anionic silicate structural units. Equa-tion I may be combined with equation 2, therefore,in order to describe the interaction between redoxequilibria of iron and the anionic structure of silicatemelts:
72Si,O2- + 4Fc(IV)O; e54Si,O3- + 36SiO1- + 4Fe(VI)Olo- * O, (3)
The Fe3*/)Fe of such melts depends, therefore, notonly on/(Or), but also on the NBO/T of the melt, aconclusion also made by Lauer (197'7) and Lauer andMorris (1977).
We concluded above, on the basis of the isomershifts of ferric iron, that Fe3* will not be a networkformer in melts where there is only alkaline-earthmetal network modifier for local charge balance. Theredox equilibria of network modifiers in such meltsdo, however, also depend on the anionic structure ofthe silicate melts, as also shown by Lauer and Morris(1977). Those authors concluded, for example, thatthe redox equilibrium for a network-modifying cat-ion shifts to a more reduced state as the size of thenetwork-modifying cations in the melt decreases.This conclusion accords with our observation for ironoxides in melts on the join MgSiO,-CaSiO, (Fig. 8),where the Fe3*/)Fe decreases asCa/(Ca + Mg) de-creases. Lauer and Morris (197'7) expressed suchrelationships with a O-function that could be deter-mined experimentally without further considerationfor the structure of the silicate melts. We may discussthis dependence in terms of the disproportionation ofanionic polymers such as shown in equation l Ac-cording to the results summarized in Table 8, equa-tion I shifts to the left as Ca/(Ca + Me) of the melt
- 67-56-52
-65
- J a
I"1gSio3CaSt03CaMgSi2O5Na2Si03
3 , 9 52 . 5 93 . 5 78 . l 7
3 . 5 3r . 7 7? 5 ?
5 . 1 5
MYSEN ET AL.: STRUCTURE OF SILICATE MELTS
decreases. Whether this is because both the monomerand the sheet unit are affected by the decreasing sizeof the cation or only one of these units are afectedcannot be ascertained from our data. Dent Glasser(1979') noted, however, that in silicate minerals thestability of highly polymerized silicate polymers islowered as the network modifer becomes smaller. Itis tempting to suggest, therefore, that similar rela-tionships may apply to melts.
The redox equilibrium in alkaline-earth metasit-cates can be expressed by combining equation I withone that describes the redox equilibrium of ironoxides as network modifiers.
2Fe(VI)Oi- + 2O-(NBO) s= 2Fe(VI)Olo- + O, (4)
to give:
8Si,Of- + 4Fe(VI)O3- s4SiOi + 6Si,O3- + 4Fe(VI)Olo- + O, (5)
Equation 5 shows that as the degree of proportion-ation of the metasilicate chains increases at constantf(Or), Fe'* /)Fe will increase.
The equihbrium constants from equations 3 and 5are:
K, : CnlFe(VI)Olo-/Fe(IV)Ot1y(O)
and
(6)
K,: ClFe(VI)Ol"-/Fe(VDo:-1y(o) (7)
where
c: [(si,o3-f(sioi).1/si,o:-). (8)Equations 6 and'l demonstrate that the redox ratio
of iron is much less sensitive to the extent of dis-proportionation when ferric iron is a network modi-fier than when it is a network former.
The value of C (eq. 8) for a given alkali metal oralkaline earth increases with increasing temperatureand with decreasing pressure (Mysen et al., 1980).Consequently, at constant f(Or), Fel* /)Fe will in-crease with increasing temperature and will decreasewith increasing pressure. The pressure and temper-ature dependence of the redox ratio is more pro-nounced in melts with ferric iron as a network formerthan in melts with ferric iron as a network modifier.The lOr) dependence of Fe3*/)Fe is the same re-gardless of whether ferric iron is an network formeror a network modifier.
Petrological applications
The above summary shows that changes of exten-sive and intensive variables affect physical and chemi-
cal properties of iron-bearing, rock-forrring silicatemelts because of the complex structural role of ironin the melts. Acidic melts such as andesite, dacite,and granite (rhyolite) will have a large excess of M*over M2* melt modifiers. As a result, variations of re-dox ratios of iron will alter the degree of polymeriza-tion of the melt and therefore the viscosity and cationdiffusion coefficients. It is expected, for example, thatincreasing flOr) will result in increasing viscosity ofthe melt. Cation diffusion coefficients in silica-rich,iron-bearing melt will most likely decrease with in-creasing oxygen fugacity. Notably, the experimentaldata (Seifert et al., 1979b) indicate that the activitycoefficients of the Fe3* and Fe2* complexes do notchange with oxygen fugacity. As a result, partitioncoefficients of ferrous and ferric iron between acidicmelts and minerals in equilibrium with the melt willnot be affected by the oxygen fugacity.
Physical properties of basaltic melts will be af-fected less by changing redox ration ofiron than sil-ica-rich melts because alteration of redox states re-sults in smaller changes of NBO/BO. It is notable,however, that as a result of fractional crystallizationof a basaltic melt to more silicic compositions, thephysical properties of the magma will graduallychange as the influence ofredox ratios ofiron on thedegree of polymerization of the melt increases withincreasing M* /IN.d'*.
AcknowledgementsCritical reviews by C. M. Scarfe, H. S. Yoder, Jr., H. S. Waff,
and G. Waychunas are appreciated. This research was partially
supported by NSF grant EAR-791l3l3 and partially by the Car-negie Institution of Washington.
References
Annersten, H. and U. Hilenius (1976) Ion distribution in pinkmuscovite: a discussion. Am. Mineral.,61, lM5-1050.
- and M. Olesch (1978) Distribution of ferrous and ferriciron in clintonite and the M<issbauer characteristics of ferriciron in tetrahedral coordination. Can. Mineral., 16,199-204.
Bancroft, G. M. and R. G. Burns (1969) Mrissbauer absorptionspectral study of alkali amphiboles. Mineral. Soc. Am. Spec.Pap . , 2 ,137 -151 .
P. G. L. Williarns and E. J. Essene (1969) Mcissbauerspectra of omphacite. Mineral Soc. Am. Spec. Pap., 2, 59-67.
Bates, J. B., R. W. Hendricks and L. B. Shaffer (1974) Neurron ir-radiation effects and structure of non-crystalline SiO2. J. Chem.Phys., 61,416341?6.
Bell, P. M. and H. K. Mao (1974) Crystal-field spectra of Fe2+ andFe3+ in synthetic basalt glass as a function of oxygen fugacity.Carnegie Inst. Wash. Year Book, 73,496497.
Bhargava, S. C., J. E. Knudsen and S. Mlrup (1979) Mdssbauerstudy of spin-spin relaxation of Fe3* ions in the presence ofother paramagnetic ions. J. Phys. Chem. Solids,40,45-53.
884 MYSEN ET AL.: STRUCT:URE OF SILICATE MELTS
Bockris, J. O'M. and A. K. N. Reddy (1910) Moden EIec-
trochemistry, Vol. l. Plerum Press, New York.
Bowen, N. L., J. F. Schairer and H. W. V. Willems (1930) The ter-
nary system Na2SiO3-Fe2O3-SiO2. Am. J. Sci., 20,405455.
Brawer, S. A. (1975) Theory ofthe vibrational spectra ofsome net-
work and molecular glasses. Pftys. Rev. 8., 11,31'13-3194.- and W. B. White (1975) Raman spectroscopic investigation
of the structure of silicate glasses. L The binary silicate glasses.
J. Chem. Phys., 63,2421-2432.- and - (1977) Raman spectroscopic study of the struc-
ture ofsilicate glasses. II. Soda-alkali earth-alumina ternary andquaternary glasses. ,/. Non-Cryst. Solids, 23,261-278.
Brown, G. E., K. D. Keefer and P. M. Fenn (1978) Extended X-
ray fine structure (ExAFs) study of iron-bearing silicate glass
(abstr.). Geol. Soc. Am. Abstracts with Programs, 10,373.
Buddington, A. F. and D. H. Lindsley (1964) Iron-titanium oxide
minerals and synthetic equivalents. J. Petrol., 5,310_357.
Carmichael, I. S. E. (1967) The iron-titanium oxides ofsalic vol-
canic rocks and their associated ferromagnesian silicates. Con-trib. Mineral. Petrol., 14,36-64.
Dent Glasser, L. S. (1979) Non-existent silicates. Z. Kristallogr.,149,29r-305.
Etchepare, J. (19'12) Study by Raman spectroscopy of crystallineand glassy diopside. In R. W. Douglas and B. Ellis, Eds.,
Amorphous Materials, p.337-346. Wiley, New York.
Fudali, R. F. (1965) Oxygen fugacity of basaltic and andesiticmagmas. Geochim. Cosmochim. Acta, 29, 1063-1075.
Furukawa, T. and W. B. White (1980) Raman spectroscopic inves-
tigation of the structure of silicate glasses. III. Alkali-silica-ger-
manates. J. Chem. Plrys., in press.
S. A. Brawer and W. B. White (1978) The structure of lead
silicate glasses determined by vibrational spectroscopy. "/. Md-
ter. Sci.,13,268-282.Kracek, F. C. (1930) The system sodium oxide-silica. J. Phys.
Chem., 34, 1583-1598.Kurkjian, C. R. (1970) Mdssbauer spectroscopy in inorganic
glasses. "/. Non-Cryst. Solids, 3,157-194.Kuroda, K. and C. Kato (1979) Trimethylsilylation of hemimor-
phite. ./. Nucl. Inorg. Chem.,41,94'l-951.
Lauer, H. Y. (1977) Effect of glass composition on major elementredox equilibria: Fe2+-Fe3+. Phys. Chem. Glasses, 18,49-52.
- and R. v. Morris (1977) Redox equilibria of multivalentions in silicate glasses. "I. Am. Ceram- Soc., 60,443451.
Lazarev, A. N. (1972) Vibrational Spectra and Structure of Sili-cdres. Consultants Bureau, New York.
MacKenzie, J. D. (Ed.) (196O) Modern Aspects of the VitreousS/41e. Butterworth's, Washington, D. C.
Mao, H. K., D Virgo and P. M. Bell (1973) Analytical study of theorange soil returned by the Apollo 17 astronauts. Carnegie Inst.Wash. Year Book, 72, 631-638.
Masson, C R. (1977) Anionic constitution of glass-forming melts.
J. Non-Cryst. Solids, 1, 142.Mysen, B. O. and D. Virgo (1978) Influence of pressure, temper-
ature and bulk composition on melt structures in the systemNaAlSi2O6-NaFe3+Si2Ou. Am. J. Sci., 278, 1307-1322.
- and F. Seifert (1979) Redox equilibria and meltstructure in the system CaO-MgO-FeO-Fe2O3-SiO2. CarnegieInst. Wash. Year Book,78,519-526.
- - and C. M. Scarfe (1980) Relations between anionic
structure and viscosity of silicate melts-a Raman spectroscopic
study at I atmosphere and at high ptessure. Ary. Mineral. 65,
690-710.Osborn, E. F. (1959) Role of oxygen pressure in the crystallization
and differentiation of basaltic magmas. Am. J. Sci., 257, 6W-g1.
- (1962) Reaction series for subalkaline igneous rocks based
on different oxygen pressure conditions. Am. Mineral',47,211-
226.- (19'7'l) Origin of calc-alkali magma series of Santorini vol-
cano type in light of recent experimental phase-equilibrium
studies. Proceedings of the International Congress on Thermal
Waters, Geothermal Energy and Vulcanism of the Meditenanean
Area, Athens, October 1976, 3,154-167.
Roeder, P. L. and R. F. Emslie (1970) Olivine-liquid equilibrium.
Contrib. M ineral. Petrol., 29, 27 5-289.
Schreiber, H. D., T. Thanyashiri, J. J. Lach and R. A. Legere
(1978) Redox equilibria of Ti, Cr and Eu in silicate melts: re-
duction potentials and mutual interactions. Phys. Chem. Glasses,
19, 126-140.Seifert, F. and M. Olesch (1977) Mdssbau€r spectroscopy of gran-
didierite, (Mg,Fe)Al3BSiOs. Am. Mineral., 62, 547 -553.
dium metasilicate melts in CO2 and CO atmospheres. Carnegie
Inst. Ilash. Year Book, 78,679._ and - (1979b) Melt structures and redox
equilibria in the system Na2O-FcO-Fe2O3-A1203-SiO2. Car-
negie Inst. Wash. Year Book,78,5l1-519'
Sharma, S. K. and H. S. Yoder (1979) Structural study of glasses
of akermannite, diopside and sodium melilite compositions by
Raman spectroscopy. Carnegie Inst. Wash. Year Book,78,526-
s32.Taneja, S. P., C. W. Kimball and J. C. Schaffer (1973) Mdssbauer
spectroscopy of amorphous semiconductors and glasses contain-
ing antimony, tin and iron: a review. Mbssbauet Efect Method-
ology, 8,4l-69Verweij, H. (1979a) Raman study of the structure of alkali gcr-
manosilicate glasses. I. Sodium and potassium metagermanosili-
cate glasses. J. Non-Cryst. Solids, 33,4l-53.- (1979b) Raman study of the structure of alkaligermanosili-
cate glasses. IL Lithium, sodium and potassium digermanosili-
cate glasses. J. Non-Cryst. Solids, 33,55-69.- and w. L. Konijnendijk (1976) Structural units in K2o-
PbO-SiO2 glasses by Raman spectroscopy."/. Am. Ceram. Soc.,
59, 5l'7-521.Virgo, D., B. O. Mysen and I. Kushiro (1980) Anionic constitution
of silicate melts quenched from I atm from Raman spectros-
copy: implications for the structure of igneous melts. Scrence, in
press.F. Seifert and B. O. Mysen (1979) Three-dimensional net-
work structures of mel ts in the systems CaAl2Oa-SiO2,
NaAlO2-SiO2, NaFeO2-SiO2 and NaGaO2-SiO2 at I atm. Car-
negie Inst. Wash. Year Book,78,506-511.
Wafl H. S. (1977) The structural role of ferric iron in silicate
melts. Can. Mineral.,15, 198-199.
Manuscript received, September 28, 1979;
acceptedfor publication, May 2, 1980.
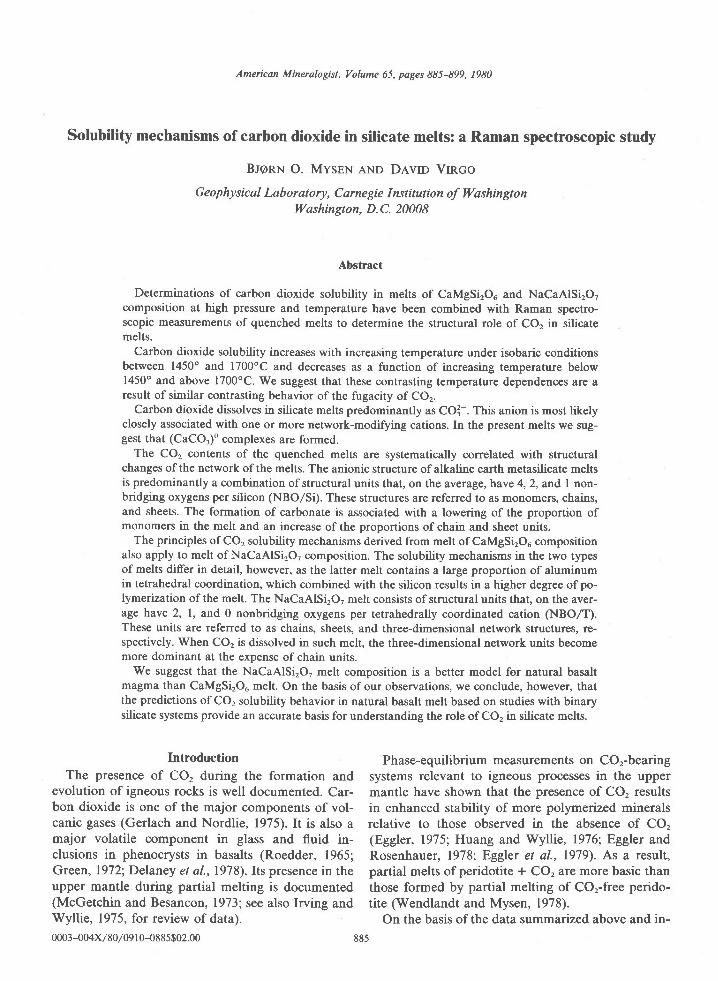
American Mineralogist, Volume 65, pages 885-899, 1980
Solubility mechanisms of carbon dioxide in silicate melts: a Raman spectroscopic study
BrgnN O. MysEN eNo Devn Vnco
Geophysical Laboratory, Carnegie I nstitution of WashingtonWashington, D.C. 20008
Abstract
Determinations of carbon dioxide solubility in melts of CaMgSirOu and NaCaAlSirO,composition at high pressure and temperature have been combined with Raman spectro-scopic measurements of quenched melts to determine the structural role of CO, in silicatemelts.
Carbon dioxide solubility increases with increasing temperature under isobaric conditionsbetween 1450o and 1700'C and decreases as a function of increasing temperature below1450" and above l700oC. We suggest that these contrasting temperature dependences are aresult of similar contrasting behavior of the fugacity of COr.
Carbon dioxide dissolves in silicate melts predominantly as CO3-. This anion is most likelyclosely associated with one or more network-modifying cations. In the present melts we sug-gest that (CaCO3)o complexes are formed.
The CO, contents of the quenched melts are systematically correlated with structuralchanges of the network of the melts. The anionic structure of alkaline earth metasilicate meltsis predominantly a combination of structural units that, on the average, have 4, 2, and I non-bridging oxygens per silicon (NBO/Si). These structures are referred to as monomers, chains,and sheets. The formation of carbonate is associated with a lowering of the proportion ofmonomers in the melt and an increase of the proportions of chain and sheet units.
The principles of CO, solubility mechanisms derived from melt of CaMgSi2Ou compositionalso apply to melt of NaCaAlSirO, composition. The solubility mechanisms in the two typesof melts differ in detail, however, as the latter melt contains a large proportion of aluminumin tetrahedral coordination, which combined with the silicon results in a higher degree of po-lymerization of the melt. The NaCaAlSirO, melt consists of structural units that, on the aver-age have 2, l, and,0 nonbridging oxygens per tetrahedrally coordinated cation (NBO/T).These units are referred to as chains. sheets. and three-dimensional network structures. re-spectively. When CO, is dissolved in such melt, the three-dimensional network units becomemore dominant at the expense of chain units.
We suggest that the NaCaAlSirO, melt composition is a better model for natural basaltmagma than CaMgSirOu melt. On the basis of our observations, we conclude, however, thatthe predictions of CO2 solubility behavior in natural basalt melt based on studies with binarysilicate systems provide an accurate basis for understanding the role of CO, in silicate melts.
Introduction
The presence of CO, during the formation andevolution of igneous rocks is well documented. Car-bon dioxide is one of the major components of vol-canic gases (Gerlach and Nordlie, 1975).It is also amajor volatile component in glass and fluid in-clusions in phenocrysts in basalts (Roedder, 1965;Green, 1972;Delaney et a|.,1978). Its presence in theupper mantle during partial melting is documented(McGetchin and Besancon, 1973; see also lrving andWyllie, 1975, for review of data).
0003-004x/80/09 I 0-088s$02.00
Phase-equilibrium measurements on Cor-bearingsystems relevant to igneous processes in the uppermantle have shown that the presence of CO, resultsin enhanced stability of more polymerized mineralsrelative to those observed in the absence of CO,(Eggler, 1975; Huang and Wyllie, 1976; Eggler andRosenhauer, 1978; Eggler et al., 1979). As a result,partial melts of peridotite + CO, are more basic thanthose formed by partial melting of COr-free perido-tite (Wendlandt and Mysen, 1978).
On the basis of the data summarized above and in-
885
MYSEN AND VIRGO: CARBON
frared measurements of quenched, COr-saturated sil-icate melts (Mysen et al., 1976; Brey and Green,1976;Eggler et al.,1979), it has been suggested thatCO, is dissolved in silicate melts primarily as COI-.It has also been suggested that the silicate melt be-comes more polymerued as a result of the formationof this carbonate anion. The effect on the melt struc-ture of solution of CO, has not, however, been deter-mined. In order to determine the structural role ofCO, in rock-forming silicate melts under conditionsrelevant to magma formation and evolution, Ramanspectroscopy of silicate melts with and without CO,has been used in conjunction with solubility determi-nations on selected melt compositions.
Starting materials
Two melt compositions were chosen for CO, solu-bility studies (compositions: CaMgSirOu-Di melt,and NaCaAlSirOr-Sm melt). In addition, six COr-free compositions on the join CarSiOo-SiO2 werestudied in order to substantiate the band assignmentsin the Cor-bearing samples. This join was chosen be-cause of its chemical simplicity; only Sio* is in tet-rahedral coordination. The overall ratio of non-bridging oxygens to tetrahedral cation (NBO/T) is asimple function, therefore, of the CalSi (atomic) ra-tio. Furthermore, there are other published data onmelt compositions where Ca'* is substituted withother alkaline earth and alkali metal cations.
For the CO, solubility studies, Di melt was used, inpart because of the significant amount of availableexperimental data on Di-bearing systems and alsobecause no amphoteric oxides exist in Di melt. A di-rect correlation between dissolved carbonate anionsand their influence on the Si-O network may result.Sm melt was chosen because of the presence of alarge proportion of aluminum, which may act as botha network former and a network modifier. In vola-tile-free Sm melt, all Al is probably a part of the sili-cat€ network where Al exist as (CaAlrOo)o or as(NaAlOr)o complexes (Virgo et al., 1979). The possi-bility exists, therefore, that with the formation ofCO? anions as CaCO, or NarCO. a portion of thealuminate complexes may dissociate, as some of themodifying cations in the aluminate complexes areneeded to form carbonate complexes. As a result ofthis mechanism, some Al may no longer be in thenetwork, and the melt must depolymerize because ofdissolved COr.
Experimental technique
The starting materials were mixtures of Johnson-Matthey spectroscopically pure SiOr, AlrO., MgO,
DIOXIDE IN SILICATE MELTS
and CaCOr, and reagent grade NarCOr. All high-pressure experiments were conducted in solid-media,high-pressure apparatus (Boyd and England, 1960)using sealed Pt containers of 3 mm O.D. in a furnaceassembly of 0.5" diameter. Inasmuch as the furnaceparts must be kept dry to avoid formation of H, withthe resultant formation of reduced carbon species inthe experimental charges (Eggler et al., 1974), thefurnace parts were dried thoroughly prior to each ex-periment.
All experiments were carred out with the piston-out technique and with no pressure correction forfriction (Boyd and England, 1963). The uncertaintyof the pressure is about -rl kbar. Thermocoupleswere Pt-Pt90Rhl0 with no correction on the elec-
tromotive force for pressure. The uncertainty of thetemperature due to this simplification is 6"-l0oC, de-pending on the temperature (Mao et al., l97l).
Quenching rates were of the order of 250"C/sec.Selected high-pressure experiments had run dura-
tions up to I hour at l700oC. The thermocouple driftat such high temperatures depends, to a large extent,on the purity of the alumina thermocouple insulators(Mao et al., 197 l; Presnall et al., 1973). In the present
studies, McDanel grade 998 alumina was used in allexperiments. With this high-purity alumina, thethermocouple drift is about 10" per hour at 1700'C.
Inasmuch as the uncertainty of the temperature is al-ready about lO"C due to the largely unknown influ-ence of pressure of the emf, no further refinement ofthe temperature monitoring system was carried out.
High-pressure experiments of COr-free melts of Di
and Sm composition were carried out with glass
starting materials. The run durations were the same
as for the COr-bearing samples at the same temper-ature and pressure. The one-atm glasses werequenched after 30 minutes at 1500'C. All samples
were contained in Pt capsules (sealed).The six melt compositions on the join CarSiOo-
SiO, were prepared at l650oc in a vertical quench
furnace with molybdenum disilicide heating ele-ments. [n order to avoid contamination of the sam-ples by conventional quenching in water or mercury,
the samples were quenched in a Pt crucible standingin liquid nitrogen. The quenching rate with this tech-
nique is on the order of 500o,/sec over the first
1000'c.The CO, contents of the quenched melts were
measured with beta-track mapping (Mysen andSeitz, 1975), using carbon-14 as source ofthe beta ac-tivity. This activity was recorded on K-5 nuclearemulsions supplied by Ilford Co., England. The stan-
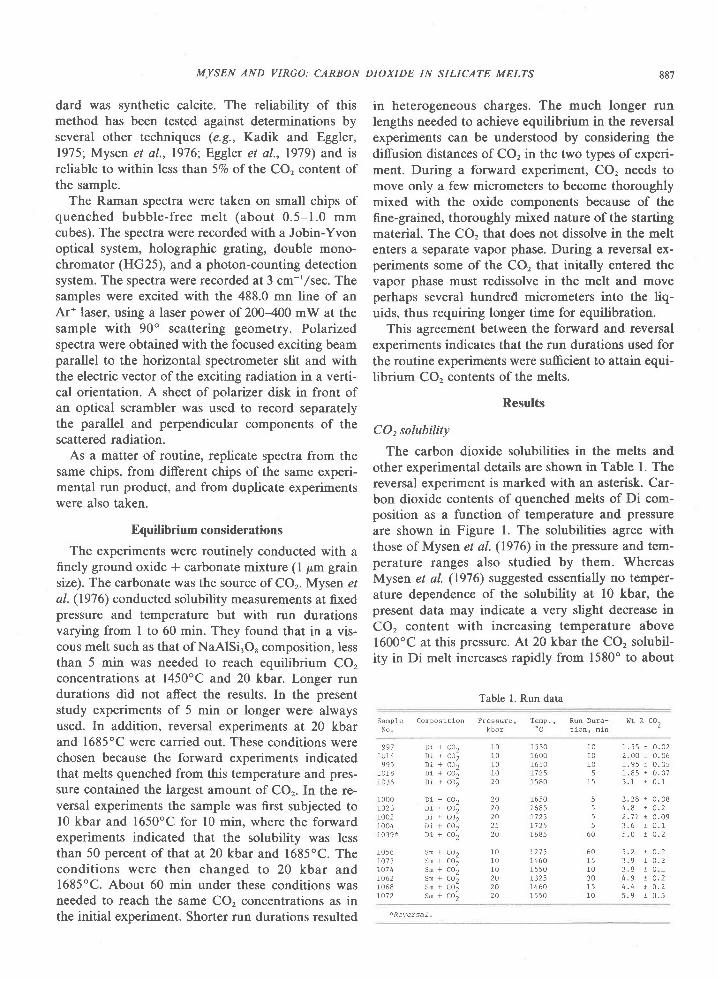
MISEN AND VIRGO: CARBON DIOXIDE IN SILICATE MELTS 887
dard was synthetic calcite. The reliability of thismethod has been tested against determinations byseveral other techniques (e.9., Kadik and Eggler,1975; Mysen et al., 1976; Eggler et al., 1979) and isreliable to within less than 5Vo of l}lre CO, content ofthe sample.
The Raman spectra were taken on small chips ofquenched bubble-free melt (about 0.5-1.0 mmcubes). The spectra were recorded with a Jobin-Yvonoptical system, holographic grating, double mono-chromator (HG25), and a photon-counting detectionsystem. The spectra were recorded aI 3 cm-'/sec. Thesamples were excited with the 488.0 mn line of anAr* laser, using a laser power of 200-400 mW at thesample with 90" scattering geometry. Polarizedspectra were obtained with the focused exciting beamparallel to the horizontal spectrometer slit and withthe electric vector ofthe exciting radiation in a verti-cal orientation. A sheet of polarizer disk in front ofan optical scrambler was used to record separatelythe parallel and perpendicular components of thescattered radiation.
As a matter of routine, replicate spectra from thesame chips, from different chips of the same experi-mental run product, and from duplicate experimentswere also taken.
Equilibrium considerations
The experiments were routinely conducted with afinely ground oxide * carbonate mixture (l pm grainsize). The carbonate was the source of COr. Mysen e/al. (1916) conducted solubility measurements at fixedpressure and temperature but with run durationsvarying from I to 60 min. They found that in a vis-cous melt such as that of NaAlSirO, composition, lessthan 5 min was needed to reach equilibrium CO,concentrations at l450oC and 20 kbar. Longer rundurations did not affect the results. In the presentstudy experiments of 5 min or longer were alwaysused. In addition, reversal experiments at 20 kbarand 1685'C were carried out. These conditions werechosen because the forward experiments indicatedthat melts quenched from this temperature and pres-sure contained the largest amount of COr. In the re-versal experiments the sample was first subjected tol0 kbar and l650oC for l0 min, where the forwardexperiments indicated that the solubility was lessthan 50 percent of that at 20 kbar and 1685"C. Theconditions were then changed to 20 kbar and1685"C. About 60 min under these conditions wasneeded to reach the same CO, concentrations as inthe initial experiment. Shorter run durations resulted
in heterogeneous charges. The much longer runlengths needed to achieve equilibrium in the reversalexperiments can be understood by considering thediffusion distances of CO, in the two types of experi-ment. During a forward experiment, CO, needs tomove only a few micrometers to become thoroughlymixed with the oxide components because of thefine-grained, thoroughly mixed nature of the startingmaterial. The CO, that does not dissolve in the meltenters a s€parate vapor phase. During a reversal ex-periments some of the CO, that initally entered thevapor phase must redissolve in the melt and moveperhaps several hundred micrometers into the liq-uids, thus requiring longer time for equilibration.
This agreement between the forward and reversalexperiments indicates that the run durations used forthe routine experiments were sufficient to attain equi-librium CO, contents of the melts.
Results
CO, solubility
The carbon dioxide solubilities in the melts andother experimental details are shown in Table l. Thereversal experiment is marked with an asterisk. Car-bon dioxide contents of quenched melts of Di com-position as a function of temperature and pressureare shown in Figure l. The solubilities agree withthose of Mysen et al. (1916) in the pressure and tem-perature ranges also studied by them. WhereasMysen et al. (1976) suggested essentially no temper-ature dependence of the solubility at 10 kbar, thepresent data may indicate a very slight decrease inCO, content with increasing temperature above1600"C at this pressure. At 20 kbar the CO, solubil-ity in Di melt increases rapidly from 1580" to about
Table l. Run data
C o n p o s i t i o n P r e s s u r e ,kbar
S a m p l e
N o
Temp., Run Dura- lJt Z C0,)' c t i o n , n - i n
t 01 0t 0t02 0
1000r02 3r002L 0 0 4L 0 l 9 *
9 9 71 0 1 4
9951 0 1 8l 0 l 6
1 0 5 6r o 7 3r a 7 47062r068r072
Di + co2Di + c02Di + c02Di + co2Di + co2
Di + co2Di + c02Di + c02Di + co2Di + c02
Sm t C02Sn + CO2Sn + C02Sm + CO2Sm + CO2Sm + CO2
1 . 5 5 i 0 . 0 22 0 0 1 0 . 0 61 . 9 5 1 0 . 0 51 . 8 5 1 0 . 0 73 . 1 1 0 . 1
3 . 3 8 i 0 . 0 84 . 8 ! 0 . 22 . 1 7 ! 0 . 0 93 . 6 1 0 . 15 . 0 t 0 . 2
5 . 2 ! 0 , 23 . 9 ! 0 . 23 . 8 1 0 14 . 9 ! 0 . 24 . 4 ! O . 25 . 9 1 0 . 3
155016001 6 5 01725r580
r6 50r685r725L7 25i685
101 01 0
51 5
5555
60
6 0151 03 01 5t0
2 02 02 02 52A
1 0l 01 02 02 02 0
1 2 1 51 4 6 01 5 5 0r3251 4 6 01 5 5 0
*Reversa l .
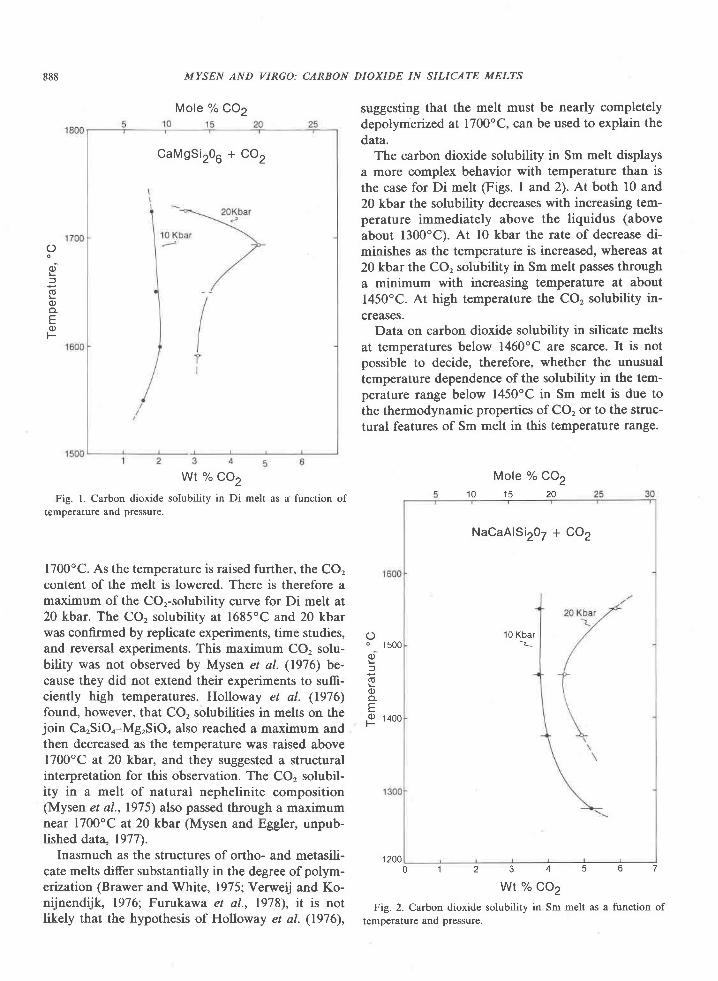
Mole % CO2
CaMgSirOU + CO2
888
wt % co2Fig. l. Carbon dioxide solubility in Di melt as a function of
temperature and pressure.
1700"C. As the temperature is raised further, the CO,content of the melt is lowered. There is therefore amaximum of the COr-solubility curve for Di melt at20 kbar. The CO, solubility at l685oC and 20 kbarwas confinned by reptcate experiments, time studies,and reversal experiments. This maximum CO, solu-bility was not observed by Mysen et al. (1976) be-cause they did not extend their experiments to suffi-ciently high temperatures. Holloway et al. (1976)found, however, that CO, solubilities in melts on thejoin CarSiOo-MgrSiOo also reached a maximum andthen decreased as the temperature was raised above1700"C at 20 kbar, and they suggested a structuralinterpretation for this observation. The CO, solubil-ity in a melt of natural nephelinite composition(Mysen et al., 1975) also passed through a maximumnear l700oC at 20 kbar (Mysen and Eggler, unpub-lished data, 1977).
Inasmuch as the structures of ortho- and netasili-cate melts differ substantially in the degree of polym-erization (Brawer and White, 1975; Verweij and Ko-nijnendijk, 1976; Furukawa et al., 1978), it is notlikely that the hypothesis of Holloway et al. (1976),
MYSEN AND VIRGO: CARBON DIOXIDE IN SILICATE MELTS
O
ot
(Uo
EO
F
suggesting that the melt must be nearly completelydepolymerized at l700oC, can be used to explain thedata.
The carbon dioxide solubility in Sm melt displaysa more complex behavior with temperature than isthe case for Di melt (Figs. I and 2). At both l0 and20 kbar the solubility decreases with increasing tem-perature immediately above the liquidus (aboveabout 1300oC). At l0 kbar the rate of decrease di-minishes as the temperature is increased, whereas at20 kbar the CO, solubility in Sm melt passes througha minimum with increasing temperature at about1450"C. At high temperature the CO, solubility in-creases.
Data on carbon dioxide solubility in silicate meltsat temperatures below 1460"C are scarce. It is notpossible to decide, therefore, whether the unusualtemperature dependence of the solubility in the tem-perature range below 1450'C in Sm melt is due tothe thermodynamic properties of CO, or to the struc-tural features of Sm melt in this temperature range.
Mole "/" CQ210 15 20
NaCaAlSi20T + CO2
10 Kbar
0 1 2 3 4 5 6 7
Wt % CO2
Fig. 2. Carbon dioxide solubility in Sm melt as a function of
temperature and pressure.
o 1500
(Uo
,o 1400
1 200
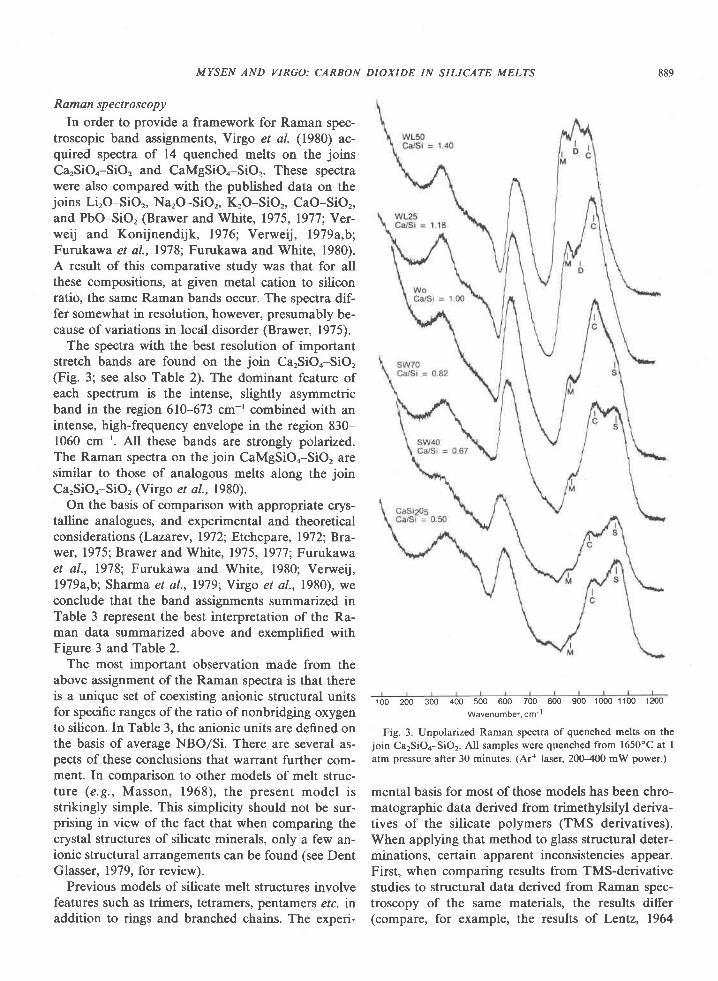
MYSEN AND VIRGO: CARBON
Raman spectroscopy
In order to provide a framework for Raman spec-troscopic band assignments, Virgo et al. (1980) ac-quired spectra of 14 quenched melts on the joins
CarSiOo-SiO, and CaMgSiOo-SiOr. These spectrawere also ssmpared with the published data on thejoins LirO-SiOr, NarO-SiOr, KrO-SiOr, CaO-SiOr,and PbO-SiO, (Brawer and White, 1975,1977;Yerweij and Konijnendijk, 1976; Verweij, l979a,b;Furukawa et al., 1978; Furukawa and White, 1980).A result of this comparative study was that for allthese compositions, at given metal cation to siliconratio, the same Raman bands occur. The spectra dif-fer somewhat in resolution, however, presumably be-cause of variations in local disorder (Brawer, 1975).
The spectra with the best resolution of importantstretch bands are found on the join CarSiOo-SiO,(Fig. 3; see also Table 2). The dominant feature ofeach spectrum is the intense, slightly asymmetricband in the region 610-673 cm-' combined with anintense, high-frequency envelope in the region 830-1060 cm-'. All these bands are strongly polarized.The Raman spectra on the join CaMgSiOo-SiO, aresimilar to those of analogous melts along the joinCarSiOo-SiO, (Virgo et al.,1980).
On the basis of comparison with appropriate crys-talline analogues, and experimental and theoreticalconsiderations (Lazarev, 1972; Etchepare, 1972; Bra-wer, 1975; Brawer and White, 1975, 1977: Furukawaet al., 1978; Furukawa and White, 1980; Verweij,l979a,b; Sharma et al.,1979; Virgo et a/., 1980), weconclude that the band assignments summarized inTable 3 represent the best interpretation of the Ra-man data summarized above and exemplified withFigure 3 and Table 2.
The most important observation made from theabove assignment of the Raman spectra is that thereis a unique set of coexisting anionic structural unitsfor specific ranges ofthe ratio ofnonbridging oxygento silicon. In Table 3, the anionic units are defined onthe basis of average NBO/Si. There are several as-pects of these conclusions that warrant further com-ment. [n comparison to other models of melt struc-ture (e.9., Masson, 1968), the present model isstrikingly simple. This simplicity should not be sur-prising in view of the fact that when comparing thecrystal structures of silicate minerals, only a few an-ionic structural arrangements can be found (see DentGlasser, 1979, for review).
Previous models of silicate melt structures involvefeatures such as trimers, tetramers, pentamers etc. inaddition to rings and branched chains. The experi-
DIOXIDE IN SILICATE MELT'S 889
1oo 200 300 o*;o:"",u;:",,10"1 t
too e00 1000 1100 1200
Fig. 3. Unpolarized Rarnan spectra of quenched melts on thejoin Ca2SiOa-SiO2. All samples were quenched from l650oC at I
atm pressure after 30 minutes. (Ar+ laser, 200-400 mW power.)
mental basis for most of those models has been chro-matographic data derived from trimethylsilyl deriva-tives of the silicate polymers (TMS derivatives).When applying that method to glass structural deter-minations, certain apparent inconsistencies appear.First, when comparing results from TMS-derivativestudies to structural data derived from Raman spec-troscopy of the sarne materials, the results di.fer(compare, for example, the results of Lentz, 1964
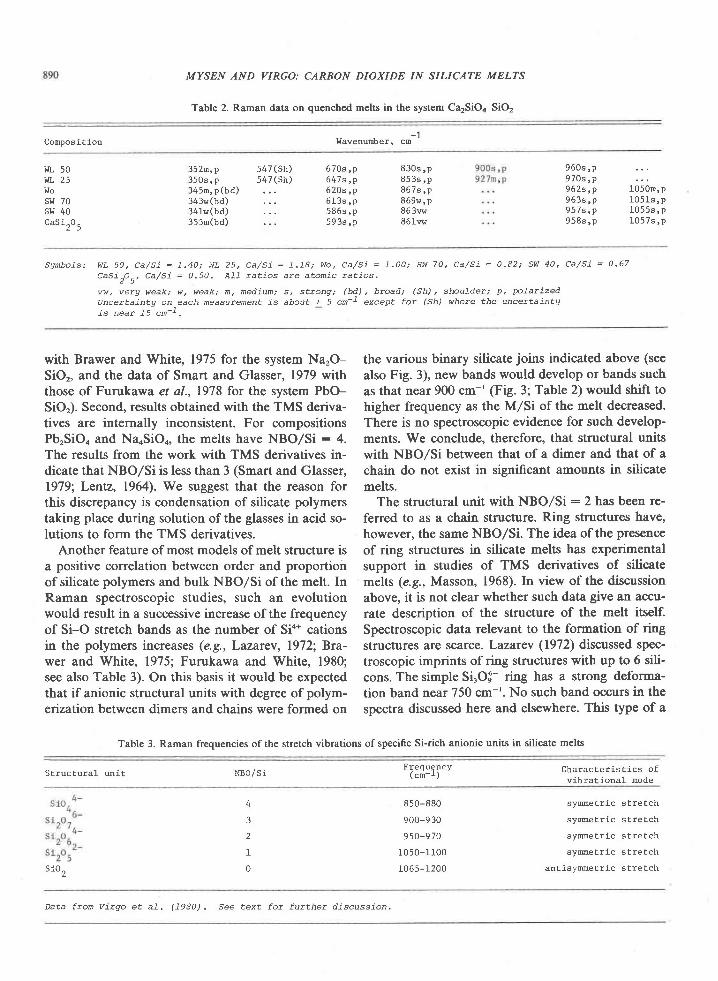
MYSEN AND VIRGO: CARBON DIOXIDE IN SILICATE MELTS
Table 2. Raman data on quenched melts in the system Ca2SiOa-SiO2
Compos i t lon wavenunDer, cm
I,JL 50lll. 25Wosi,I 70sl^l 40CaS i20
5
352n, p 547 (Sh)350s ,p 547 (Sh )345m, p (bd)343w (bd)34rw(bd)355n(bd)
96Os ,p9 7 0 s , p962s ,p 1050n ,p9 6 3 s , p 1 0 5 1 s , p9 5 7 s , p 1 0 5 5 s , p9 5 8 s , p 1 0 5 7 s , p
6 7 0 s , p6 4 7 s , p6 2 0 s , p613s , p5 8 6 s , p5 9 3 s , p
830s ,p8 5 3 s , p8 6 7 s , p869w, p863w86lw
Sgnbo ls : wL 50 , ca /s i = 1 .40 ; wL 25 , Ca/s i = 7 -18 ; wo, Ca/S i = 7 .O0; Sw 70, Ca/s i = O.82; Sw 40, ca /s i = 0 .67
cas i^o- , ca /s i = O.50. A l f ta t ios a re a tomic ra t ios .z )
vw, verg weak; w, weak; m, medium; s, strong; (bd), bToad; (Sh), shoulder; p, trDTarizedttn-arra;nrl1 nn each measurqent is about + 5 m-! except for (Sh) where the unceTXaintgis near L5 cm- t .
with Brawer and White, 1975 for the system NarO-SiOr, and the data of Smart and Glasser, 1979 withthose of Furukawa et al., 1978 for the system PbO-SiOr). Second, results obtained with the TMS deriva-tives are internally inconsistent. For compositionsPbrSiOo and NaoSiOo, the melts have NBO/Si : 4.The results from the work with TMS derivatives in-dicate that NBO/Si is less than 3 (Smart and Glasser,1979; Lentz, 1964). We suggest that the reason forthis discrepancy is condensation of silicate polymerstaking place during solution of the glasses in acid so-lutions to form the TMS derivatives.
Another feature of most models of melt structure isa positive correlation between order and proportionof silicate polymers and bulk NBO/Si of the melt. InRaman spectroscopic studies, such an evolutionwould result in a successive increase of the frequencyof Si-O stretch bands as the number of Si4* cationsin the polymers increases (e.g., Lazarcv, 1972; Bra-wer and white, 1975; Furukawa and white, 1980;see also Table 3). On this basis it would be expectedthat if anionic structural units with degree of polym-erization between dimers and chains were formed on
the various binary silicate joins indicated above (seealso Fig. 3), new bands would develop or bands suchas that near 900 cm-t (Fig. 3; Table 2) would shift tohigher frequency as the M/Si of the melt decreased.There is no spectroscopic evidence for such develop-ments. We conclude, therefore, that structural unitswith NBO/Si between that of a dimer and that of achain do not exist in significant amounts in silicatemelts.
The structural unit with NBO/Si : 2 has been re-ferred to as a chain structure. Ring structures have,however, the same NBO/Si. The idea of the presenceof ring structures in silicate melts has experimentalsupport in studies of TMS derivatives of silicatemelts (e.g., Masson, 1968). In view of the discussionabove, it is not clear whether such data give an accu-rate description of the structure of the melt itself.Spectroscopic data relevant to the formation of ringstructures are scarce. Lazarev (19'72) discussed spec-troscopic imprints of ring structures with up to 6 sili-cons. The simple SirOS- ring has a strong deforma-tion band near 750 cm-'. No such band occurs in thespectra discussed here and elsewhere. This type of a
Table 3. Raman frequencies of the stretch vibrations of specific Si-rich anionic units in silicate melts
Struc tura l un i t N B O / S iFrequency
( c n - r )CharacEer is t i cs o f
vibrational mode
sio2
4
3
2
I
0
850-880
900-9 30
950-970
1050-1100
1065-1200
symet r l -c s t re tch
symet r ic s t re tch
symet r ic s t re tch
symet r ic s t re tch
ant lsymet r ic s t re tch
Data f rom V i rgo e t a l . (7980) . See tex t fo r fu t ther d jscuss ion .
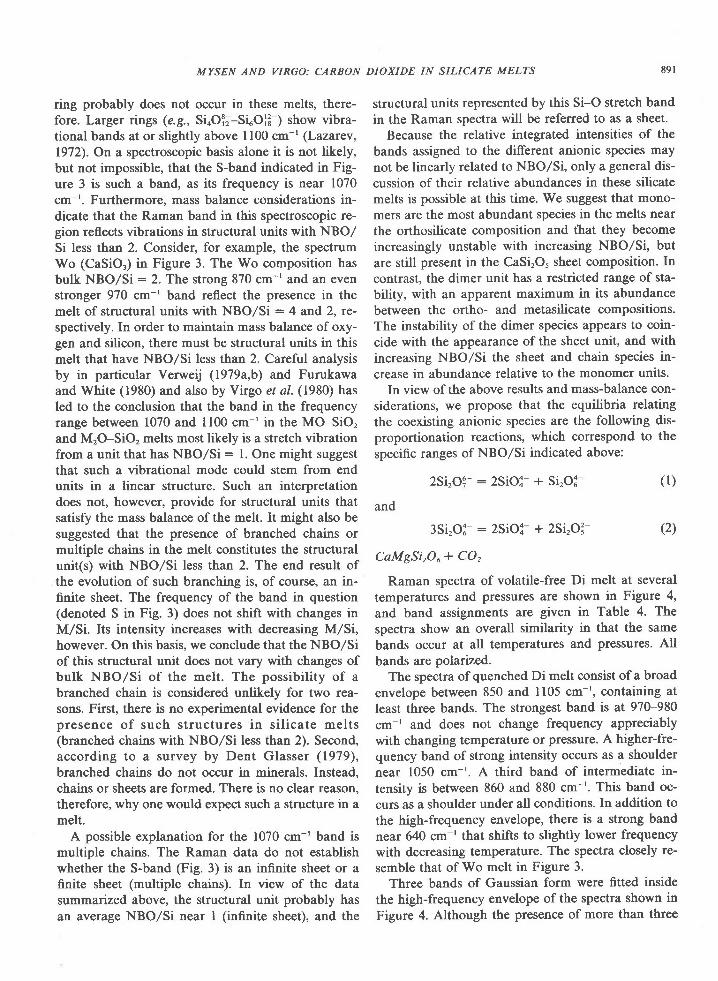
MYSEN AND VIRGO: CARBON DIOXIDE IN SILICATE MELTS 891
ring probably does not occur in these melts, there-fore. Larger rings (e.9., SLOi;-SLOI3-) show vibra-tional bands at or slightly above I100 cm-' (Lazarev,1972). On a spectroscopic basis alone it is not likely,but not impossible, that the S-band indicated in Fig-ure 3 is such a band, as its frequency is near 1070cm-r. Furtheflnore. mass balance considerations in-dicate that the Raman band in this spectroscopic re-gion reflects vibrations in structural units with NBO/Si less than 2. Consider, for example, the spectrumWo (CaSiO,) in Figure 3. The Wo composition hasbulk NBO/Si: 2. The strong 870 cm-' and an evenstronger 970 cm-' band reflect the presence in themelt of structural units with NBO/Si : 4 and 2, re-spectively. In order to maintain mass balance of oxy-gen and silicon, there must be structural units in thismelt that have NBO/Si less than 2. Careful analysisby in particular Verweij (1979a,b) and Furukawaand White (1980) and also by Virgo el a/. (1980) hasled to the conclusion that the band in the frequencyrange between 1070 and ll00 cm-'in the MO-SiO,and MrO-SiO, melts most likely is a stretch vibrationfrom a unit that has NBO/Si: l. One might suggestthat such a vibrational mode could stem from endunits in a linear structure. Such an interpretationdoes not, however, provide for structural units thatsatisfy the mass balance of the melt. It might also besuggested that the presence of branched chains ormultiple chains in the melt constitutes the structuralunit(s) with NBO/Si less than 2. The end result ofthe evolution of such branching is, of course, an in-finite sheet. The frequency of the band in question(denoted S in Fig. 3) does not shift with changes inM/Si. Its intensity increases with decreasing M/Si,however. On this basis, we conclude that the NBO/Siof this structural unit does not vary with changes ofbulk NBO/Si of the melt. The possibility of abranched chain is considered unlikely for two rea-sons. First, there is no experimental evidence for thepresence of such structures in si l icate melts(branched chains with NBO/Si less than 2). Second,according to a survey by Dent Glasser (1979),branched chains do not occur in minerals. Instead,chains or sheets are formed. There is no clear reason,therefore, why one would expect such a structure in amelt.
A possible explanation for the 1070 cm-' band ismultiple chains. The Raman data do not establishwhether the S-band (Fig. 3) is an infinite sheet or afinite sheet (multiple chains). In view of the datasummarized above, the structural unit probably hasan average NBO/Si near I (infinite sheet), and the
structural units represented by this Si-O stretch bandin the Raman spectra will be referred to as a sheet.
Because the relative integrated intensities of the
bands assigned to the different anionic species may
not be linearly related to NBO/Si, only a general dis-
cussion of their relative abundances in these silicatemelts is possible at this time. We suggest that mono-mers are the most abundant species in the melts near
the orthosilicate composition and that they becomeincreasingly unstable with increasing NBO/Si' but
are still present in the CaSirO, sheet composition. In
contrast, the dimer unit has a restricted range of sta-bility, with an apparent maximum in its abundancebetween the ortho- and metasilicate compositions.The instability of the dimer species appears to coin-
cide with the appearance of the sheet unit, and with
increasing NBO/Si the sheet and chain species in-
crease in abundance relative to the monomer units.In view of the above results and mass-balance con-
siderations, we propose that the equilibria relating
the coexisting anionic species are the following dis-proportionation reactions, which correspond to the
specific ranges of NBO/Si indicated above:
2Si ,Oi- :2SiOi + Si ,O:- ( l )
and
3Si,O:-:2SiOi + 2Si,O3- Q)
CaMgSi,Oo+ CO,
Raman spectra of volatile-free Di melt at several
temperatures and pressures are shown in Figure 4,
and band assignments are given in Table 4. The
spectra show an overall similarity in that the same
bands occur at all temperatures and pressures. All
bands are polarized.The spectra of quenched Di melt consist of a broad
envelope between 850 and ll05 cm-', containing at
least three bands. The strongest band is at 970-980
cm' and does not change frequency appreciably
with changing temperature or pressure. A higher-fre-quency band of strong intensity occurs as a shoulder
near 1050 cm-'. A third band of intermediate in-
tensity is between 860 and 880 cm-'. This band oc-
curs as a shoulder under all conditions. In addition to
the high-frequency envelope, there is a strong band
near 640 cm-' that shifts to slightly lower frequency
with decreasing temperature. The spectra closely re-
semble that of Wo melt in Figure 3.Three bands of Gaussian form were fitted inside
the high-frequency envelope of the spectra shown in
Figure 4. Although the presence of more than three
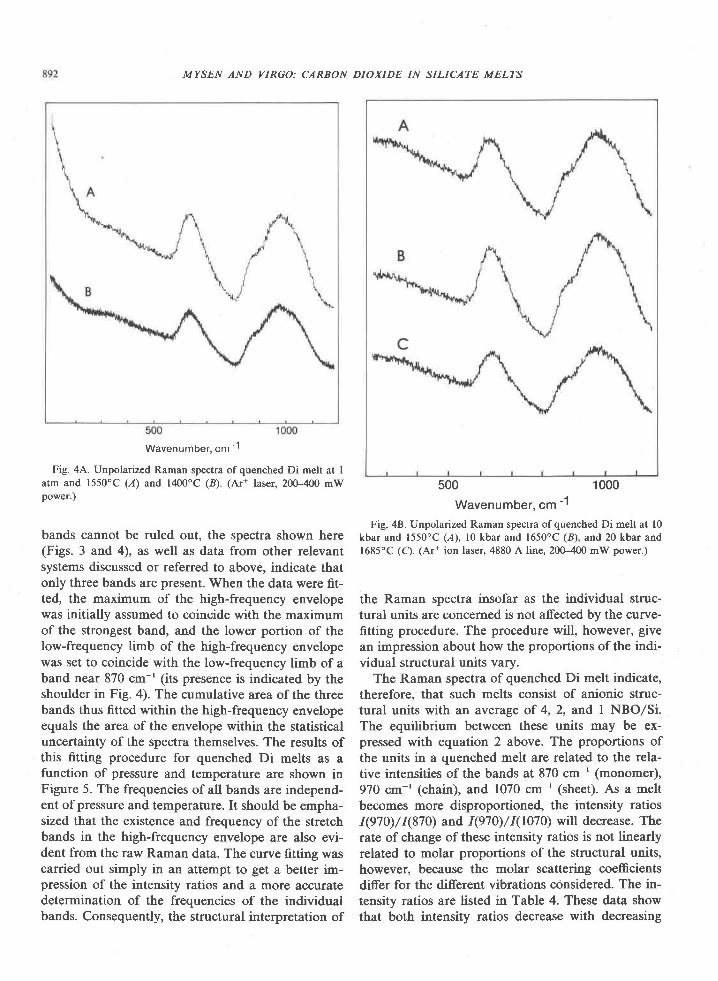
MYSEN AND VIRGO: CARBON DIOXIDE IN SILICATE MELTS
Wavenumber, cm'1
Fig. 4A. Unpolarized Raman spectra of quenched Di melt at Iatm and 1550"C (,4) and l400oC (B). (Ar+ laser, 200-400 mWpower.)
bands cannot be ruled out, the spectra shown here(Figs. 3 and 4), as well as data from other relevantsystems discussed or referred to above, indicate thatonly three bands are present. When the data were fit-ted, the maximum of the high-frequency envelopewas initially assumed to coincide with the maximumof the strongest band, and the lower portion of thelow-frequency fimb of the high-frequency envelopewas set to coincide with the low-frequency limb of aband near 870 cm-' (its presence is indicated by theshoulder in Fig. 4). The cumulative area of the threebands thus fitted within the high-frequency envelopeequals the area of the envelope within the statisticaluncertainty of the spectra themselves. The results ofthis fitting procedure for quenched Di melts as afunction of pressure and temperature are shown inFigure 5. The frequencies ofall bands are independ-ent of pressure and temperature. It should be empha-sized that the existence and frequency of the stretchbands in the high-frequency envelope are also evi-dent from the raw Raman data. The curve fitting wascarried out simply in an attempt to get a better im-pression of the intensity ratios and a more accuratedetermination of the frequencies of the individualbands. Consequently, the structural interpretation of
500 1000
Wavenumber, cm -1
Fig. 48. Unpolarized Raman spectra of quenched Di melt at l0kbar and 1550"C (l), l0 kbar and 1650'C (a), and 20 kbar and1685"C (C). (Ar+ ion laser, 4880 A line, 200-400 mW power.)
the Raman spectra insofar as the individual struc-
tural units are concerned is not affected by the curve-
fitting procedure. The procedure will, however, give
an impression about how the proportions of the indi-vidual structural units vary.
The Raman spectra of quenched Di melt indicate,therefore, that such melts consist of anionic struc-tural units with an average of 4, 2, and I NBO/Si.The equilibrium between these units may be ex-pressed with equation 2 above. The proportions ofthe units in a quenched melt are related to the rela-tive intensities of the bands at 870 cm-' (monomer),970 cm-' (chain), and 1070 cm-' (sheet). As a meltbecomes more disproportioned, the intensity ratiosI(970)/I(870) and (970)/I(r070) will decrease. Therate of change of these intensity ratios is not linearlyrelated to molar proportions of the structural units,however, because the molar scattering coefficientsdiffer for the different vibrations considered. The in-tensity ratios are listed in Table 4. These data showthat both intensity ratios decrease with decreasing
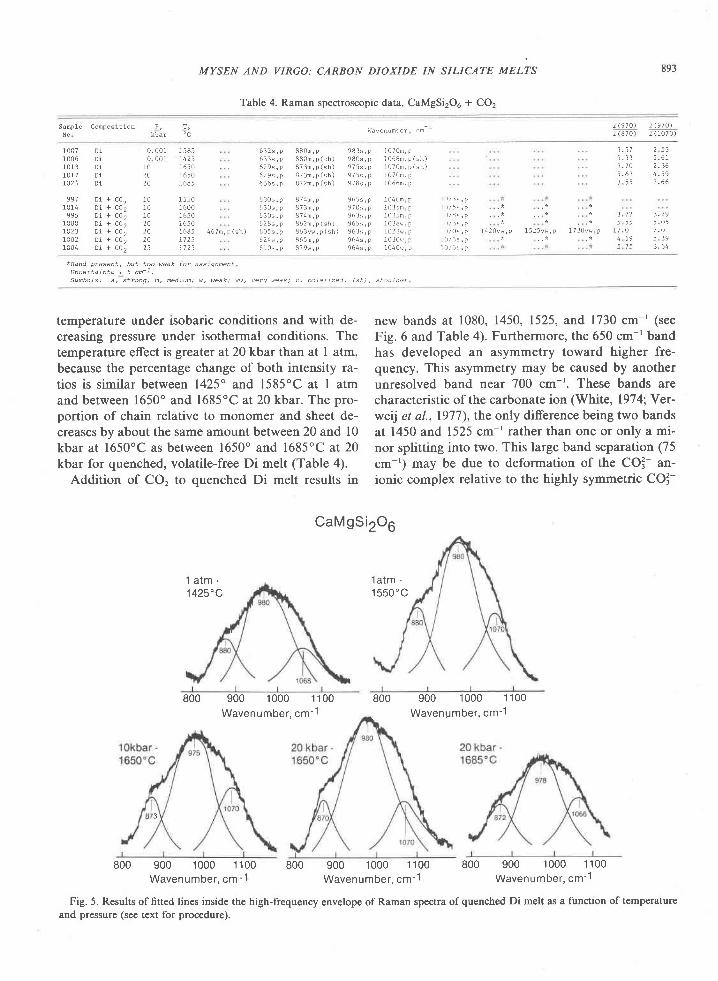
MYSEN AND VIRGO: CARBON DIOXIDE IN SILICATE MELTS
Table 4. Raman spectroscopic data, CaMgSi2Ou + CO,
. - ll i avenumoer , cn
893
Sanp le Conpos l t ion
N o
r ( 9 7 0 , 1 ( 9 7 0 )r ( 8 7 0 ) r ( 1 0 7 0 )
1 0 0 710061 0 1 31 0 r 7I O 2 4
997 Dl + C021014 Dl + C0'
9 9 5 D i + C 0 21 0 0 0 D i + c 0 21 0 2 3 D r + C 0 21 0 0 2 D i + c 0 21 0 0 4 D i + c 0 2
0 . 0 0 1 I 5 8 50 001 1425
1 0 1 6 5 02 0 1 6 5 02 0 I 6 8 5
I 0 7 0 n , p1 0 6 8 m , p ( s h )l 0 7 0 m , p ( s h )1 0 7 0 m , p1 0 6 6 m , p
3 . 5 7 2 5 3i . 3 l 5 . 6 13 - 7 A 2 . 3 65 . 6 3 4 . 5 93 5 5 2 . 6 6
D 1D iD tD 1D 1
6 l 2 s , p 8 8 0 m , p 9 8 l s , p6 3 l s , p 8 8 0 m , p ( , r h ) 9 8 0 s , p6 2 9 s , p 8 7 3 n , p ( s h ) 9 7 5 s , p6 2 9 s , p 8 7 3 n , p ( s h ) 9 7 5 s , p6 3 6 s , p 8 7 2 n , p ( s h ) 9 7 8 s , p
6 3 0 s , p t i 7 4 n , p 9 6 5 s , p6 l 0 s , p 8 7 3 n , p 9 7 0 s , p6 3 0 s , p 8 7 4 n , p 9 6 l s , p6 2 8 s , p 8 6 2 n , p ( s h ) 9 6 5 s , p6 0 5 s , p 8 6 l w , p ( s h ) 9 6 l s , p6 2 ( s , p 8 6 5 n , p 9 6 4 s , p6 1 0 s , r 8 7 9 v , p 9 6 4 s , p
1 0 4 0 m , p l 0 7 5 s , pI 0 3 5 n r , p 1 0 7 5 s , pl 0 l 5 m , p I 0 7 8 s , p1 0 3 8 w , p 1 0 7 l s , p1 0 2 J ! , p 1 0 7 0 s , p1 0 l o u , p l 0 7 3 s , p1 0 4 0 u , p 1 0 7 l s , t
l 4 2 o F i , p 1 5 2 5 v w , p 1 7 3 0 w , p
1 0 1 5 5 01 0 1 6 0 01 0 1 6 5 02 0 1 6 5 02 A 1 6 8 520 11252 5 1 1 2 5
4 6 7 n , p ( s h )
3 . 7 2 3 - 2 95 5 5 5 . 0 5
L 7 . 0 1 7 . 04 5 9 5 . 3 95 7 5 3 . 6 4
*Band present t bux too weak fa r ass lgnnent
Uncer ta in tU + 5 cn-L-
Sqtuo ls : s , s t rong; n , ned iun ; w, weak; vw, veLq qeak) p , po la t j zed i fsh) , -sh .u lder
temperature under isobaric conditions and with de-creasing pressure under isothermal conditions. Thetemperature effect is greater at 20 kbar than at I atm,because the percentage change of both intensity ra-tios is similar between 1425" and 1585"C at I atmand between 1650" and 1685"C at 20 kbar. The pro-portion of chain relative to monomer and sheet de-creases by about the same amount between 20 and l0kbar at 1650"C as between 1650" and 1685oC at 20kbar for quenched, volatile-free Di melt (Table 4).
Addition of CO, to quenched Di melt results in
new bands at 1080, 1450, 1525, and 1730 cm-' (seeFig. 6 and Table 4). Furthermore, the 650 cm-' bandhas developed an asymmetry toward higher fre-quency. This asymmetry may be caused by anotherunresolved band near 700 cm-'. These bands arecharacteristic of the carbonate ion (White, 19141'Yer-welj et al.,1977), the only difference being two bandsat 1450 and 1525 cm ' rather than one or only a mi-nor splitting into two. This large band separation (75
cm ') may be due to deformation of the CO3 an-ionic complex relative to the highly symmetric CO3-
CaMgSi206
800 900 1000 1100Wavenumber, cm-1
800
800 900 1000 1100Wavenumber, cm-1
900 1000 1 100Wavenumber, cm-1
800 900 1000 1100Wavenumber, cm -1
800 900 1000 1100Wavenumber, cm-1
Fig. 5. Results of fitted lines inside the high-frequency envelope of Raman spectra of quenched Di melt as a function of temperature
and pressure (see text for procedure).
1 a t m -1425'C
l a t m -1 5 5 0 ' c
3

MYSEN AND VIRGO: CARBON DIOXIDE IN SILICATE MELTS
lope three bands near 880,970, and 1070 cm-'can bediscerned in the raw Raman data (Fig. 6). The 1070cm-' C-O stretch band occurs at nearly the same fre-quency as the stretch band indicative of sheet struc-tural units in the COr-free melt (Tables 2-4). This isalso the frequency region where antisymmetricstretch bands from structural units with NBO/Si: 0are anticipated (Table 3). A three-dimensional arrayof SiO" tetrahedra also results in two deformationbands between 430 and 480 cm ' (e.9., Bates et al.,1974). Such bands do not occur in the present spectra(Fig. 6; see also Table 4). We conclude, therefore,that three-dimensional network units do not occur inDi melt with several wt. percent CO, in solution. [nview of the overall similarity of the Raman spectraresulting from vibrations in silicate tetrahedral com-plexes, it seems reasonable to assume that there is an-other Raman band near (perhaps at the same fre-quency as) the C-O stretch band at 1070 cm-r.
The data in Figure 6 (see also Tables I and 4)show that as the CO, content of the Di melt in-creases, the intensity of the band near 870 cm-' de-creases. Consequently, we conclude that the propor-tion of monomers in the melt structure decreasesrelative to the other structural units as the CO, con-tent of the melt increases.
As the CO, content of the melt is increased, thefrequency of the band near 650 cm-' shifts toward600 cm-'. This observation is interpreted to meanthat the proportion of structural units with NBO/Siless than 2 becomes more important relative to otherstructural units as the CO, content of the melt is in-creased.
NaCaAlSi,O,+CO,
Provided that Al is in tetrahedral coordination inSm melt, this melt has the same number of non-bridging oxygens per tetrahedrally coordinated oxy-gen as sodium trisilicate melt (NarSirOr). Accordingto available data (e.g., Taylor and Brown, 1979,Yirgo et al., 1979), Al is tetrahedrally coordinated insilicate melts provided that sufficient metal cationsare present to maintain a local charge of 4+ near thetetrahedral cation. This requirement will be referredto as local charge balance.
It has been shown (e.9., Virgo et al.,1979) that tet-rahedrally coordinated Al in a given structural unitresults in a downward shift of the frequency of theassociated stretch band that is positively correlatedwith the Si/(Si + Al) of the structural unit underconsideration. In addition to this effect, such Si(Al)coupling results in loss of spectroscopic resolution,
500 1000
Wavenumber, cm -1
Fig. 6. Unpolarized Raman spectra of Di + CO2 melts at l0kbar and 1650'C (l), 20 kbar and 1650' (8), 20 kbar and 1685"C(C), 20 kbar and l'l25oC (D), and 25 kbar and 1725"C (4. (Ar*ion laser, 4880 A line with 200-400 mW power.)
found in crystalline CaCOr, for example. There is noevidence in the Raman spectra to indicate the reasonfor such deformation.
The spectra reflecting the silicate anionic networkof COr-saturated, quenched Di melts resemble thoseof COr-free melts (Figs. 4-6). There are, however,systematic shifts of frequencies and intensity ratios asa function of CO?- of the quenched melts.
At l0 kbar the CO, solubility is about 2 wt. percent(9 mole percent CO]-), with only minor temperaturedependence. The 630 cm-' band (Si-O" bendingcharacteristic of SirOl- chains) remains near 630cm-' at l0 kbar pressure. In the high-frequency enve-
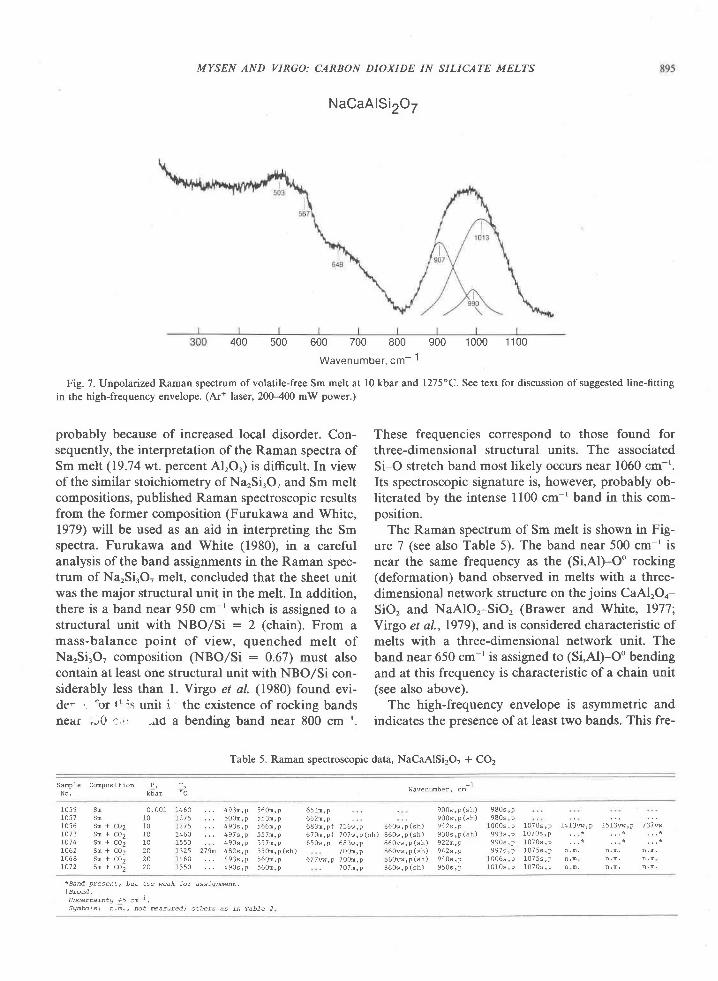
MYSEN AND VIRGO: CARBON DIOXIDE IN SILICATE MELTS
NaCaAlSi2OT
400 500 700 800 900 1000 1 100
Wavenumber . cm- 1
Fig. 7. Unpolarized Raman spectrum ofvolatile-free Sm melt at l0 kbar and l275oC. See text for discussion ofsuggested line-fitting
in the high-frequency envelope. (Ar* laser, 200-400 mW power.)
600
probably because of increased local disorder. Con-sequently, the interpretation of the Raman spectra ofSm melt (19.74 wt. percent Alror) is difficult. In viewof the similar stoichiometry of NarSi.O, and Sm meltcompositions, published Raman spectroscopic resultsfrom the former composition (Furukawa and White,1979) will be used as an aid in interpreting the Smspectra. Furukawa and White (1980), in a carefulanalysis of the band assignments in the Raman spec-trum of NarSirO, melt, concluded that the sheet unitwas the major structural unit in the melt. In addition,there is a band near 950 cm-' which is assigned to astructural unit with NBO/Si : 2 (chain). From amass-balance point of view, quenched melt ofNa,Si,O, composition (NBO/Si : 0.67) must alsocontain at least one structural unit with NBO/Si con-siderably less than l. Virgo et al. (1980) found evi-de- ,. "or tl-:.s unit i the existence of rocking bandsnear .v0 ':.'r -^ro a bending band near 800 cm-'.
These frequencies correspond to those found forthree-dimensional structural units. The associatedSi-O stretch band most likely occurs near 1060 cm-'.Its spectroscopic signature is, however, probably ob-literated by the intense 1100 cm ' band in this com-position.
The Raman spectrum of Sm melt is shown in Fig-ure 7 (see also Table 5). The band near 500 cm-' isnear the same frequency as the (Si,Al)-Oo rocking(deformation) band observed in melts with a three-dimensional network structure on the joins CaAlrOo-SiO, and NaAlOr-SiO, (Brawer and White, 1977;Yirgo et al., 1979), and is considered characteristic ofmelts with a three-dimensional network unit. Theband near 650 cm-' is assigned to (Si,Al)-Oo bendingand at this frequency is characteristic of a chain unit(see also above).
The high-frequency envelope is asymmetric andindicates the presence of at least two bands. This fre-
Table 5. Raman spectroscopic data, NaCaAlSi2O? + CO2
Sanp le Compos i t ion
N o . k b a r ' c- 1
wavenunDel, cm
I 4 6 0L27 5L27 5I 4 6 0L 5 5 01325 279nI 4 6 0L 5 5 0
1 0 5 9 S n1 0 5 7 S m1056 Sn + C021 0 7 3 S n + C o 21074 Sm + Co21062 Sm + Co21068 Sm + C021012 Sm + Co2
0 . 0 0 1I Ot 01 01 02 02 02 A
9 8 0 s , p9 8 0 s , p
1 0 0 0 s , p9 9 3 s , p9 9 0 s , p9 9 7 s , p
1 0 0 6 s , pI 0 l o s , p
1 0 7 0 s , p1 0 7 0 s , p1 0 7 0 s , p1 0 7 5 s , pl 0 7 5 s , p1 0 7 0 s , p
4 9 3 m , p 5 6 0 m , p5 0 0 n , p 5 5 3 m , p4 9 3 s , p 5 6 6 n , p4 9 7 s , p 5 5 7 m , p4 9 0 s , p 5 5 7 n , p4 8 2 s , p 5 5 0 n , p ( s h )4 9 3 s , p 5 6 0 n , p4 9 0 s , p 5 6 0 m , p
1 4 1 3 w , p 1 5 1 3 w , p 1 7 3 7 w
n ' n '
6 5 1 n , p 9 0 0 w ' p ( s h )6 6 2 n , p 9 0 0 u , p ( s h )6 8 3 m , p + 7 1 6 u , p 8 6 0 w , p ( s h ) 9 1 2 s , p6 7 0 n , p i 7 0 7 w , p ( s h ) 8 6 0 w , p ( s h ) 9 3 0 s , p ( s h )6 5 0 v , p 6 8 3 w , p 8 6 0 w , p ( s h ) 9 2 2 m , p
7 0 0 n , p 8 6 0 w , p ( s h ) 9 4 2 s , p6 2 7 w , p 7 0 0 n , p 8 6 0 w , p ( s h ) 9 4 0 s , p
. 7 0 7 n , p 8 6 0 w , p ( s h ) 9 5 0 s , p
+Band p !esent , bu t too weak fo ! ass igmenE.
tBroad.
u n c e r E a a n E q + > c m ' .
Sg tuo ts : n -n . , no t reasuredt o t le rs as 1n rab le 2
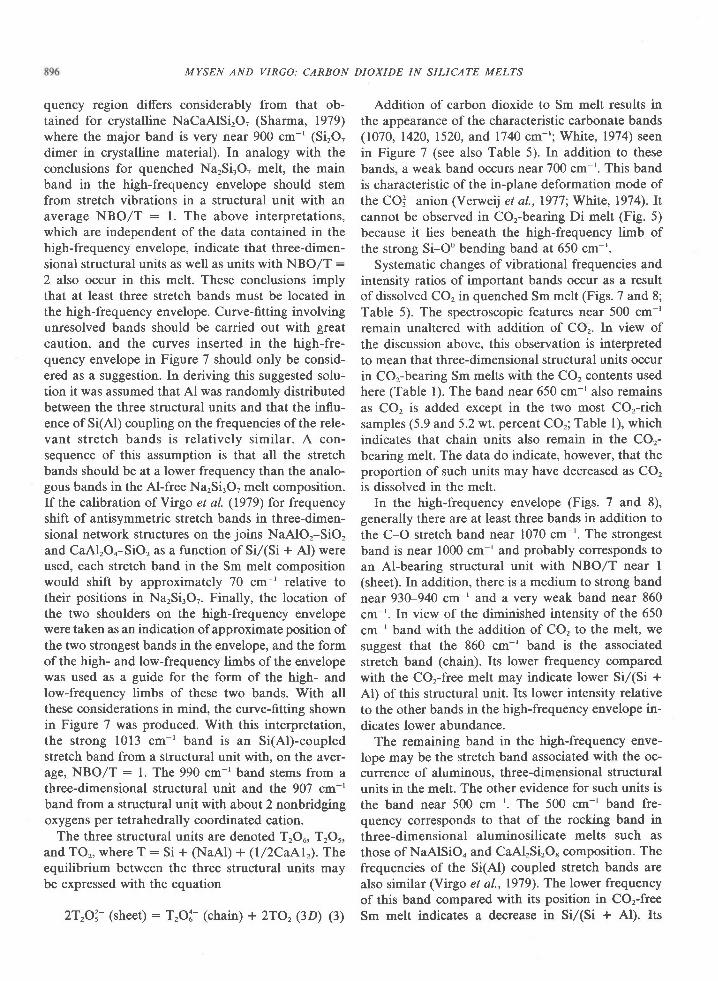
MYSEN AND VIRGO: CARBON DIOXIDE IN SILICATE MELTS
quency region differs considerably from that ob-tained for crystalline NaCaAlSirO, (Sharma, 1979)where the major band is very near 900 cm-' (SirO,dimer in crystalline material). In analogy with theconclusions for quenched NarSirO, melt, the mainband in the high-frequency envelope should stemfrom stretch vibrations in a structural unit with anaverage NBO/T : l. The above interpretations,which are independent of the data contained in thehigh-frequency envelope, indicate that three-dimen-sional structural units as well as units with NBO/T :
2 also occur in this melt. These conclusions implythat at least three stretch bands must be located inthe high-frequency envelope. Curve-fitting involvingunresolved bands should be carried out with greatcaution, and the curves inserted in the high-fre-quency envelope in Figure 7 should only be consid-ered as a suggestion. In deriving this suggested solu-tion it was assumed that Al was randomly distributedbetween the three structural units and that the influ-ence of Si(Al) coupling on the frequencies of the rele-vant stretch bands is relatively similar. A con-sequence of this assumption is that all the stretchbands should be at a lower frequency than the analo-gous bands in the Al-free NarSirO, melt composition.If the calibration of Virgo e/ al. (1979) for frequencyshift of antisymmetric stretch bands in three-dimen-sional network structures on the joins NaAlOr-SiO,and CaAlrOo-SiO, as a function of Si/(Si * Al) wereused, each stretch band in the Sm melt compositionwould shift by approximately 70 cm-' relative totheir positions in NarSirO,. Finally, the location ofthe two shoulders on the high-frequency envelopewere taken as an indication of approximate position ofthe two strongest bands in the envelope, and the formof the high- and low-frequency limbs of the envelopewas used as a guide for the form of the high- andlow-frequency limbs of these two bands. With allthese considerations in mind, the curve-fitting shownin Figure 7 was produced. With this interpretation,the strong l0l3 cm-' band is an Si(Al)-coupledstretch band from a structural unit with. on the aver-age, NBO/T : l. The 990 cm-'band stems from athree-dimensional structural unit and the 907 cm-'band from a structural unit with about 2 nonbridgingoxygens per tetrahedrally coordinated cation.
The three structural units are denoted TrOu, TrOr,and TO,, where T: Si + (NaAl) + (l/2CaAl,). Theequilibrium between the three structural units maybe expressed with the equation
zT,Oi- (sheet) : T,O1- (chain) + 2TO2 (3D) (3)
Addition of carbon dioxide to Sm melt results inthe appearance of the characteristic carbonate bands(1070,1420,1520, and 1740 cm-'; White, 1974) seenin Figure 7 (see also Table 5). In addition to thesebands. a weak band occurs near 700 cm-'. This bandis characteristic of the in-plane deformation mode ofthe CO3- anion (Verweij et a1.,1977; White, 1974).Itcannot be observed in COr-bearing Di melt (Fig. 5)because it lies beneath the high-frequency limb ofthe strong Si-Oo bending band at 650 cm-'.
Systematic changes of vibrational frequencies andintensity ratios of important bands occur as a resultof dissolved CO, in quenched Sm melt (Figs. 7 and 8;Table 5). The spectroscopic features near 500 cm-'remain unaltered with addition of CO,. In view ofthe discussion above, this observation is interpretedto mean that three-dimensional structural units occurin COr-bearing Sm melts with the CO, contents usedhere (Table l). The band near 650 cm-' also remainsas CO, is added except in the two most COrrichsamples (5.9 and 5.2 wt. percent COr; Table l), whichindicates that chain units also remain in the COr-bearing melt. The data do indicate, however, that theproportion of such units may have decreased as CO'is dissolved in the melt.
In the high-frequency envelope (Figs. 7 and 8),generally there are at least three bands in addition tothe C-O stretch band near 1070 cm-'. The strongestband is near 1000 cm-' and probably corresponds toan Al-bearing structural unit with NBO/T near I(sheet). In addition, there is a medium to strong bandnear 930-940 cm ' and a very weak band near 860cm-'. In view of the diminished intensity of the 650cm-' band with the addition of CO, to the melt, wesuggest that the 860 cm-' band is the associatedstretch band (chain). Its lower frequency comparedwith the COr-free melt may indicate lower Si/(Si +Al) of this structural unit. Its lower intensity relativeto the other bands in the high-frequency envelope in-
dicates lower abundance.The remaining band in the high-frequency enve-
lope may be the stretch band associated with the oc-currence of aluminous, three-dimensional structuralunits in the melt. The other evidence for such units isthe band near 500 cm-'. The 500 cm-' band fre-quency corresponds to that of the rocking band inthree-dimensional aluminosilicate melts such asthose of NaAlSiOo and CaAlrSirO* composition. Thefrequencies of the Si(Al) coupled stretch bands arealso similar (Virgo et al., 1979). The lower frequencyof this band compared with its position in CO'-freeSm melt indicates a decrease in Si/(Si + Al). Its
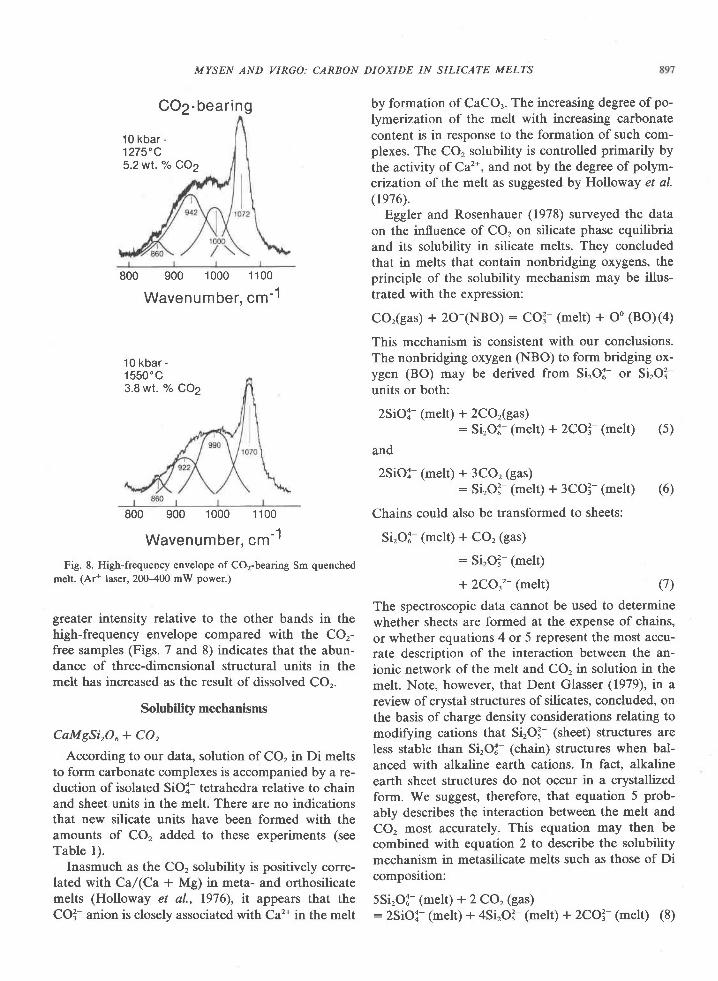
COZ-bearing
10 kbar -1275'C5.2wI.7" CO2
MYSEN AND VIRGO: CARBON DIOXIDE IN SILICATE MELTS
800 900 1000 1100
Wavenumber, cm-1
800 900 1000 1100
Wavenumber. cm-1
Fig. 8. High-frequency envelope of CO2-bearing Sm quenched
melt. (Ar* laser, 200-400 mW power.)
greater intensity relative to the other bands in thehigh-frequency envelope compared with the COr-free samples (Figs. 7 and 8) indicates that the abun-dance of three-dimensional structural units in themelt has increased as the result of dissolved COr.
Solubilitv mechanisms
CaMgSi,Oo+ CO,
According to our data, solution of CO, in Di meltsto form carbonate complexes is accompanied by a re-duction of isolatpd SiOX- tetrahedra relative to chainand sheet units in the melt. There are no indicationsthat new silicate units have been formed with theamounts of CO, added to these experiments (seeTable 1).
Inasmuch as the CO, solubility is positively corre-lated with Ca/(Ca + Mg) in meta- and orthosilicatemelts (Holloway et al., 1976), it appears that theCOr'- anion is closely associated with Ca'z* in the melt
by formation of CaCO.. The increasing degree of po-
lymerization of the melt with increasing carbonatecontent is in response to the formation of such com-plexes. The COz solubility is controlled primarily bythe activity of Ca'*, and not by the degree of polym-erization of the melt as suggested by Holloway et al.(r976).
Eggler and Rosenhauer (1978) surveyed the dataon the influence of CO, on silicate phase equilibriaand its solubility in silicate melts. They concludedthat in melts that contain nonbridging oxygens, theprinciple of the solubility mechanism may be illus-trated with the expression:
CO,(gas) + 2O-(NBO; : COi (melt) + Oo (BO)(4)
This mechanism is consistent with our conclusions.The nonbridging oxygen (NBO) to form bridging ox-ygen (BO) may be derived from Si,Ol- or Si,O3-units or both:
2SiO;- (melt) + 2CO,(gas): SLoi- (melt) + 2Co3- (melt) (5)
and
2SiOl- (melt) + 3CO, (gas): Si,o3- (melt) + 3col- (melt) (6)
Chains could also be transformed to sheets:
Si,Ol- (melt) + CO, (gas)
: Si,O? (melt)
+ 2CO32- (melt) (7)
The spectroscopic data cannot be used to determinewhether sheets are formed at the expense of chains,or whether equations 4 or 5 represent the most accu-rate description of the interaction between the an-ionic network of the melt and CO, in solution in themelt. Note, however, that Dent Glasser (1979), in areview of crystal structures of silicates, concluded, onthe basis of charge density considerations relating tomodifying cations that Si'O3- (sheet) structures areless stable than SirO?- (chain) structures when bal-anced with alkaline earth cations. In fact, alkalineearth sheet structures do not occur in a crystallizedform. We suggest, therefore, that equation 5 prob-ably describes the interaction between the melt andCO, most accurately. This equation may then becombined with equation 2 to describe the solubilitymechanism in metasilicate melts such as those of Dicomposition:
5Si,O:- (melt) + 2 CO, (gas): 2sioX- (melt) + 4si,o3- (melt) + 2co?- (melt) (8)
10 kbar -1550'C3.8 wt. % CO2
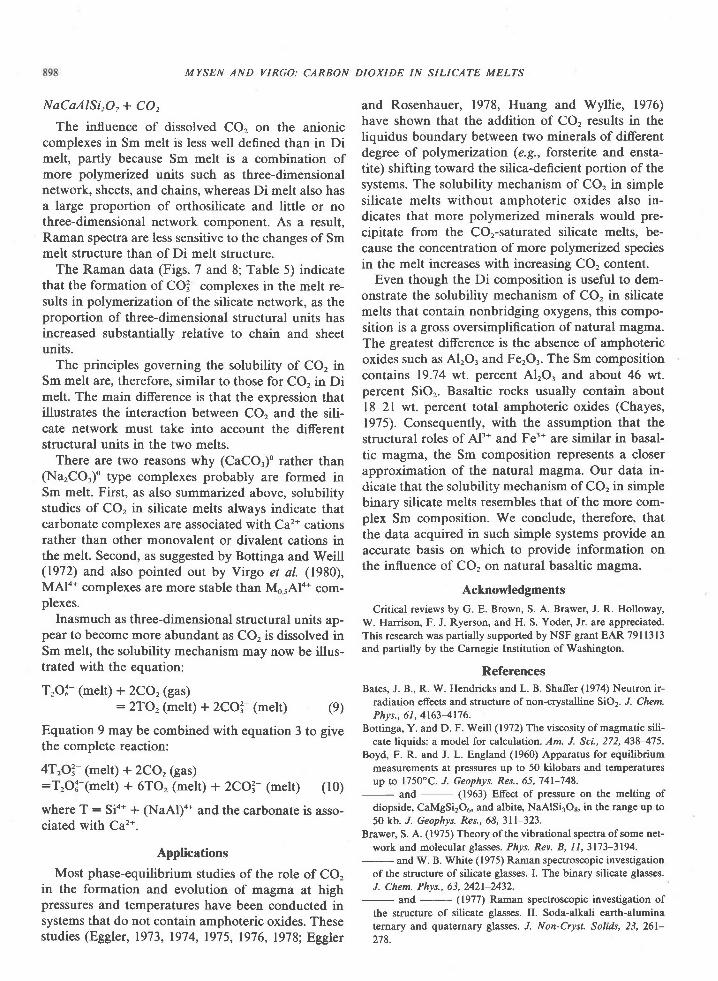
MYSEN AND VIRGO: CARBON DIOXIDE IN SILICATE MELTS
NaCaAlSirOT+ CO,
The influence of dissolved CO, on the anioniccomplexes in Sm melt is less well defined than in Dimelt, partly because Sm melt is a combination ofmore polymeized units such as three-dimensionalnetwork, sheets, and chains, whereas Di melt also hasa large proportion of orthosilicate and little or nothree-dimensional network component. As a result,Raman spectra are less sensitive to the changes of Smmelt structure than of Di melt structure.
The Raman data (Figs. 7 and 8; Table 5) indicatethat the formation of CO3- complexes in the melt re-sults in polymerization of the silicate network, as theproportion of three-dimensional structural units hasincreased substantially relative to chain and sheetumts.
The principles governing the solubility of CO, inSm melt are, therefore, similar to those for CO, in Dimelt. The main difference is that the expression thatillustrates the interaction between CO, and the sili-cate network must take into account the differentstructural units in the two melts.
There are two reasons why (CaCOr)0 rather than(NarCOr)o type complexes probably are formed inSm melt. First, as also summarized above, solubilitystudies of CO, in silicate melts always indicate thatcarbonate complexes are associated with Ca2* cationsrather than other monovalent or divalent cations inthe melt. Second, as suggested by Bottinga and Weill(1972) and also pointed out by Virgo e/ al. (1980),MAlo* complexes are more stable than MorAla* com-plexes.
Inasmuch as three-dimensional structural units ap-pear to become more abundant as CO, is dissolved inSm melt, the solubility mechanism may now be illus-trated with the equation:
T,Of- (melt) + 2CO, (gas):2To' (melt) + zCOi- (melt) (9)
Equation 9 may be combined with equation 3 to givethe complete reaction:
4T,O?- (melt) + 2CO, (gas):Tzo?-(melt) + 6T0, (melt) + 2Col- (melt) (10)
where T : Sio* + (NaAl)o* and the carbonate is asso-ciated with Ca'z*.
Applications
Most phase-equilibrium studies of the role of CO,in the formation and evolution of magma at highpressures and temperatures have been conducted insystems that do not contain amphoteric oxides. Thesestudies (Eggler, 19'73, 1974, 1975,1976,1978; Eggler
and Rosenhauer, 1978, Huang and Wyllie, 1976)have shown that the addition of CO, results in theliquidus boundary between two minerals of differentdegree of polymerization (e.9., forsterite and ensta-tite) shifting toward the silica-deficient portion of thesystems. The solubility mechanism of CO, in simplesilicate melts without amphoteric oxides also in-dicates that more polymerized minerals would pre-cipitate from the COr-saturated silicate melts, be-cause the concentration of more polymerized speciesin the melt increases with increasing CO, content.
Even though the Di composition is useful to dem-onstrate the solubility mechanism of CO, in silicatemelts that contain nonbridging oxygens, this compo-sition is a gross oversimplification of natural magma.The greatest difference is the absence of amphotericoxides such as AlrO, and FerOr. The Sm compositioncontains 19.74 wt. percent AlrO. and about 46 wt.percent SiOr. Basaltic rocks usually contain about18-21 wt. percent total amphoteric oxides (Chayes,1975). Consequently, with the assumption that thestructural roles of Al'* and Fe3* are similar in basal-tic magma, the Sm composition represents a closerapproximation of the natural magma. Our data in-dicate that the solubility mechanism of CO' in simplebinary silicate melts resembles that of the more com-plex Sm composition. We conclude, therefore, thatthe data acquired in such simple systems provide anaccurate basis on which to provide information onthe influence of CO, on natural basaltic magma.
Acknowledgments
Critical reviews by G. E. Brown, S. A. Brawer, J. R. Holloway,
W. Harrison, F. J. Ryerson, and H. S. Yoder, Jr. are appreciated.
This research was partially supported by NSF grant EAR 791 1313and partially by the Carnegie Institution of Washington.
ReferencesBates, J. B., R. W. Hendricks and L. B. Shaffer (1974) Neutron ir-
radiation efects and structure of non-crystalline SiO2. J. Chem.Phys., 6l, 41634176.
Bottinga, Y. and D. F. Weill (1972) The viscosity of magmatic sili-cate liquids: a model for calculation. Arn. J. Sci., 272,438475.
Boyd, F. R. and J. L. England (1960) Apparatus for equilibriummeasurements at pressures up to 50 kilobars and temperaturesup to 1750"C. J. Geophys. Res., 65,741-748.
- and - (1963) Effect of pr€ssure on the melting ofdiopside, CaMgSi2O5, and albite, NaAlSi3Os, in the range up to50 kb. "L Geophys. Res., 68,311-f23.
Brawer, S. A. (1975) Theory ofthe vibrational spectra ofsome net-work and molecular glasses. Pftys. Rev. B, 11,3173-3194.
- and W. B. White (1975) Raman spectroscopic investigationof the structure of silicate glasses. I. The binary silicate glasses.J. Chem. Phys., 63,2421-2432.
- and - (1977) Raman spectroscopic investigation ofthe structure of silicate glasses. II. Soda-alkali earth-aluminaternary and quaternary glasses. "I. Non-Cryst. Solids, 23,261-2',18.
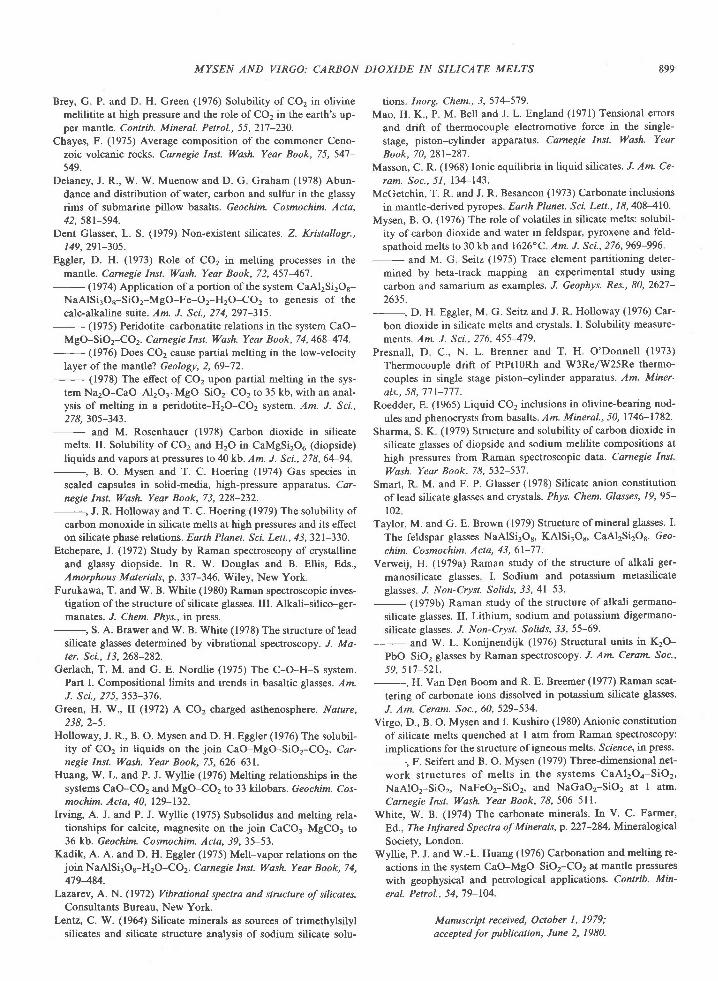
Brey, G. P. and D. H. Green (1976) Solubility of CO2 in olivinemelilitite at high pressure and the role of CO2 in the earth's up-per mantle. Contrib. Mineral. Petrol., 55,217-23O.
Chayes, F. (1975) Average composition of the commoner Ceno-
zoic volcanic rccks. Carnegie Inst. Wash. Year Book, 75, 547-549.
Delaney, J. R., W. W. Muenow and D. G Graham (1978) Abun-
dance and distribution of water, carbon and sulfur in the glassy
rims of submarine pillow basalts. Geochim. Cosmochim. Acta,42,58t-594.
Dent Glasser, L. S. (1979) Non-existent silicates. Z. Kristallogr.,
r49,29r-30s.Eggler, D. H. (1973) Role of CO2 in melting processes in the
mantle. Carnegie Inst. ll'ash. Year Book,72,457461 .- (19'14) Application of a portion of the system CaAl2Si2Os-
NaAlSi3Os-SiO2-MgO-Fe-O2-H2O-CO2 to genesis of the
calc-alkaline suite. Am. J. Sci., 274,297-315.- (1975) Peridotite-carbonatite relations in the system CaO-
MgG-SiOr-CO2. Caraegie Inst. Wash. Year Book, 74,4684'14.- (1976) Does CO2 cause partial melting in the low-velocity
layer of the mantle? Geologt, 2, 69-72.- (1978) The effect of CO2 upon partial rnelting in the sys-
tem Na2O-CaO-AlrOr-MgO-SiO2-CO2 to 35 kb, with an anal-ysis of melting in a peridotite-H2o-Co2 system. Am. J. Sci.,278,305-343.
_ and M. Rosenhauer (1978) Carbon dioxide in silicatemelts. IL Solubility of CO2 and H2O in CaMgSi2Ou (diopside)
liquids and vapors at pressures to 40 kb. Am. J. Sci., 278,64-94
sealed capsules in solid-media, high-pressure apparatus. Car-negie Inst. |l/ash. Year Book, 73,228-232.
J. R. Holloway and T. C. Hoering (1979) The solubility of
carbon monoxide in silicate melts at high pressures and its effecton silicate phase relations. Earth Planet. Sci. Lelt., 43,321-330.
Etchepare, J. (19'12) Study by Raman spectroscopy of crystallineand glassy diopside. In R. W. Douglas and B. Ellis, Eds.,Amorphous Materials, p. 337-346. Wiley, New York.
Furukawa, T. and W. B. White (1980) Raman spectroscopic inves-tigation of the structure of silicate glasses. III. Alkali-silico-ger-manates. J. Chem. Pftys., in press.
S. A. Brawer and W. B. White (1978) The structure of leadsilicate glasses determined by vibrational spectroscopy. "/. Ma-ter. Sci.,13,268-282.
Gerlach, T. M. and G. E. Nordlie (1975) The C-O-H-S system.Part I. Compositional limits and trends in basaltic glasses. lz.J. Sci., 275,35t-376.
Green, H. W., il (1972) A CO2 charged asthenosphere. Natzre,238,2-5.
Holloway, J. R., B. O. Mysen and D. H. Eggler (1976) The solubil-ity of CO2 in liquids on the join CaO-MgO-SiO2-CO2. Car-negie Inst. Wash. Year Book, 75,626-631.
Huang, W. L. and P. J. Wyllie (1976) Melting relationships in thesystems CaO-CO2 and MgG-CO2 to 33 kilobars. Geochim. Cos-mochim. Acta, 40, 129-132.
Irving, A. J. and P. J. Wyllie (1975) Subsolidus and melting rela-tionships for calcite, magnesite on the join CaCO3-MgCO, to36 kb. Geochim. Cosmochim. Acta, 39,35-53.
Kadik, A. A. and D. H. Eggler (1975) Melt-vapor relations on thejoin NaAlSi3Os-H2O-CO2. Carnegie Inst. Ilash. Year Book,74,479484.
Lazarev, A. N. (1972) Vibrational spectra and structure of silicates.Consultants Bureau, New York.
Lentz, C. W. (1964) Silicate minerals as sources of trimethylsilylsilicates and silicate structure analvsis of sodium silicate solu-
899
tions. Inorg. Chem, 3,574-5'19.
Mao, H. K., P. M. Bell and J. L. England (1971) Tensional errors
and drift of thermocouple electromotive force in the single-
stage, piston-cylinder apparatus. Carnegie Inst. Wash. Year
Book, 70,281-287.Masson, C. R. (1968) Ionic equilibria in liquid silicates. J. Am. Ce-
ram. Soc., 51,134-143.McGetchin, T. R. and J. R. Besancon (1973) Carbonate inclusions
in mantle-derived pyropes. Earth Planet. Sci. Lett', 18,408410.
Mysen, B. O. (1976) The role of volatiles in silicate melts: solubil-
ity ofcarbon dioxide and water in feldspar, pyroxene and feld-
spathoid melts to 30 kb and 1626"C Am. J. Sci.,276,969-996.- and M. G Seitz (1975) Trace element partitioning deter-
mined by beta-track mapping-an experimental study using
carbon and samarium as examples. J. Geophys. Res., 80,262"1-
2635.- D. H. Eggler, M G. Seitz and J. R. Holloway (1976) Car'
bon dioxide in silicate melts and crystals. L Solubility measure-
metnts. Am. J. Sci., 276,455479.
Presnall. D C., N. L. Brenner and T. H. O'Donnell (1973)
Thermocouple drift of PtPtl0Rh and W3Re/W25Re thermo-
couples in single stage piston-cylinder apparatus. Am. Miner-
als.. 58. 77 l-'177 .
Roedder, E. (1965) Liquid CO2 inclusions in olivine-bearing nod-
ules and phenocrysts from basalts. Am. Mineral., 50, 1746-1182.
Sharma, S. K (1979) Structure and solubility ofcarbon dioxide in
silicate glasses of diopside and sodium melilite compositions at
high pressures from Raman spectroscopic data. Camegie Inst.
V[/ash. Year Book, 78, 532-537.
Smart, R. M. and F. P. Glasser (1978) Silicate anion constitution
of lead silicate glasses and crystals. Phys. Chem. Glasses, 19, 95-
tozTaylor, M. and G. E. Brown (1979) Structure of mineral glasses' I.
The feldspar glasses NaAlSi3O8, KAlSi3O8, CaAl2Si2O6. Geo-
chim. Cosmochim. Acta, 43, 6l-'7'1.
Verweij, H. (1979a) Raman study of the structure of alkali ger-
manosilicate glasses I. Sodium and potassium metasilicate
glasses "/. Non-Cryst. Solids, 33,4l-53.- (19'l9b) Raman study of the structure of alkali germano-
silicate glasses. II. Lithium, sodium and potassium digermano-
silicate glasses. J. Non-Cryst. Solid.s, 33,55-69.- and w. L. Konijnenduk (1976) structural units in K2o-
PbO-SiO2 glasses by Raman spectroscopy. "/. Am. Ceram- Soc.,
59, 5l'l-521.H. Van Den Boom and R. E. Breemer (1977) Raman scat-
tering of carbonate ions dissolved in potassium silicate glasses'
J. Am. Ceram. Soc., 60,529-534.
Virgo, D., B. O. Mysen and I. Kushiro (1980) Anionic constitution
of silicate melts quenched at I atm from Raman spectroscopy:
implications for the structure of igneous melts. Science, in press.
F. Seifert and B. O. Mysen (1979) Three-dimensional net-
work structures of melts in the systems CaAl2Oa-SiO2'
NaAlO2-SiO2, NaFeO2-SiO2, and NaGaO2-SiO2 at I atm.
Carnegie Inst. Wash. Year Book,78,506-511.
White, W. B. (1974) The carbonate minerals. In V. C. Farmer,
Ed., The Infrared Spectra of Minerals, p' 227-284. Mineralogical
Society, London.Wyllie, P. J. and W.-L. Huang (1976) Carbonation and melting r€-
actions in the system CaO-MgO-SiO2-CO2at mantle pressures
with geophysical and petrological applications. Contrib. Min-
eral. Petrol., 54, 79-lM.
Manuscript received, October I, 1979;
accepted for publication, June 2, 1980.
MYSEN AND VIRGO: CARBON DIOXIDE IN SILICATE MELTS
American Mineralogist, Volume 65, pages 900-914, 1980
Solubility mechanisms of H2O in silicate melts at high pressures and temperatures:a Raman spectroscopic study
BroRN O. MvsrN, Devn Vnco. Wr,Noy J. HanrusoN AND CHRrsropsBR M. ScARFE'
Geophysical Laboratory, Carnegie I nstitution of WashingtonWashington, D.C. 20008
Abstract
Raman spectroscopy has been employed to determine the solubility mechanisms of HrO insilicate melts. In melts that have a threp-dimensional network structure (e.g., melts on the joinNarO-AlrOr-SiOr), water reacts with bridging oxygens to form two OH groups per brokenoxygen bond. At the same time some of the three-dimensional network is broken down tochain units, accompanied by the expulsion of Al3* from tetrahedral coordination. In meltsthat have nonbridging oxygen (NBO), water reacts with both nonbridging oxygen and net-work modifiers (e.9., Na*) to form Si-OH bonds and M(OH) or M(OH), complexes. The an-hydrous portion of the network becomes more polymerized.
The formation of chain units at the expense of three-dimensional network units in meltsimplies that the liquidus boundaries involving pyroxenes and silica minerals or feldspar min-erals shift to higher silica contents. Liquidus fields of silica minerals or feldspar minerals aredepressed relative to those of pyroxene minerals. This prediction is supported by publishedobservations of phase relations in hydrous basalt and andesite systems. Similar logic can beused to explain the formation of partial melts of andesitic bulk composition from hydrous pe-ridotite in the upper mantle.
We propose that trace-element crystal-liquid partition coefficients involving highly polym-erized melts will decrease with increasing water content because of the formation of the lesspolymerized chain units in the melt. Partition coefficients involving less polymerized melts(e.9., picrite and komatiite) may increase because the degree of polymerization of the melt isincreased as a result of dissolved water.
Introduction
Water is one of the most important volatiles inmagmas. The presence of HrO in the source region ofpartial melts in the upper mantle results in a moresilica-rich liquid than in its absence (e.g., Kushiro e/al.,1968; Kushiro, 1969,1972; Yoder, 1969). For thisreason, for example, water is required to produce an-desitic partial melts from peridotite (Kushiro er a/.,1972; Mysen and Boettche41975). Water in magmaalso affects crystallization paths. The liquidus fieldsof feldspars are depressed relative to those of pyrox-enes, and the liquidus fields of pyroxenes relative tothose of olivine'(Yoder, 1969, 1973; Eggler, 1972;Kushiro, 1972). Ttre redox equilibria of iron andhence the phase'equilibria of iron-bearing mineralsalso depend on the water content of magma (Osborn,1959).
I On leave from the University of Alberta, Edmonton, Canada.
0003-004x/80/09r0-o900$02.00 900
Physical properties of magma such as viscosity andelectrical conductivity are affected by water (Lebedevand Khitarov, 1964; Kushiro, 1978; Kushiro et al.,1976).lt has also been suggested that activity coeffi-cients of trace elements and therefore crystal-liquidpartition coefficients depend on the water content ofthe liquid (Drake and Holloway, 1977; Hart andDavis, 1978).
As.a result of the important petrological influenceof HrO in silicate melts, the solubility behavior ofHrO in a variety of melts and under a variety ofphysical conditions has been studied extensively(Goranson, l93l; Kennedy et al., 1962; Burnham,1974,1975; Burnham and Jahns, 1962; Burnham andDavis, 1971, 1974;' Hamilton et al., 1964; Eggler andRosenhauer, 1978). Solubility models of HrO in sili-cate melts based on solubility data and thermody-namic properties of hydrous melts have been pro-posed (Burnham, 197 4, 197 5).

Despite the importance of HrO in petrogeneticprocesses, data on the structural role of HrO in sili-cate melts are scarce. Orlova (1964) and Velde andKushiro (1976) determined that OH groups exist inhighly polymerized, water-bearing melts on the joinNaAlSiO.-SiO,. Hodges (1974) suggested that mo-lecular water may occur as well. Data on the struc-tural role of the OH groups in silicate melts are rare(Adams and Douglas, 1959). No data appear to existfor melts formed at both high temperature and highpressure. Such data are necessary to understand theinfluence of HrO on chemical and physical processesof magma formation and evolution. In the present re-port, Raman spectroscopy has been used to deter-mine (l) the chemical and structural forms of dis-solved water in silicate melts and (2) the interactionbetween water-bearing structural units and the re-maining anionic structure of silicate melts.
Experimental methods
The Raman spectra were acquired on small chips(-l mm) of quenched melts. A discussion of the ap-plication of such data to the structures of melts wasprovided by Mysen et al. (1980). The problem wasalso discussed by Taylor and Brown (1979) andSharma et al. (1978). They concluded that the struc-tural features of liquids that are discernible with Ra-man spectroscopy can be quenched at least with thequenching rates employed here (250'-500'C/sec).
An added complexity in the present experiments isthe mobility of H,O in silicate melts and the ten-dency of water-bearing melts not to form a glass. In-stead, minerals precipitate from the melt duringquenching. In melts with a three-dimensional net-work structure le.g., NaAlSirOu (Jd) and NaAlSi,O,(Ab) compositions in the present studyl it has beensuggested that liquids with up to about 5 wt. percentHrO can be quenched at high pressure (Burnham,1975). No more than about 5 wt. percent HrO wastherefore added to these melts. Whether HrO couldbe quenched in these melts was also assessed bymonitoring the intensity of the Si-OH and HOHstretch bands in the Raman spectra (see below).
Less is known about melts that are less polymeri-zed than those that have a three-dimensional net-work (NBO/T > 0).' In fact hydrous melts of meta-
'z NBO/T denotes nonbridging oxygen per tetrahedral cation.The tetrahedral cation can be Sia*, Ti4*, P5*, Al3*, and Fe3*.With Fe3* and Al3+, local charge balance is attained with an al-kali metal or an alkaline earth to form complexes such as MAIO2,MFeO2 and MAI2O4. MFe2Oa complexes are not stable in silicatemelts (Mysen et al., 1979a). The notation NBO/Si is used when T: Si .
MYSEN ET AL.: H20 IN SILICATE MELTS 901
silicate composition cannot even be quenched to aglass. Di- and trisilicate of sodium [NarSirO, (NS2)
and NarSi.O, (NS3)l can be quenched to clear,bubble-free glass at least with water contents up to 4-5 wt. percent. Inasmuch as the intensity of Ramanbands of Si-OH stretch vibrations of such melts in-creases with increasing HrO content of the quenchedmelt, we conclude that in these melts (NS2 and NS3)the HrO content can be quenched. Melts of NarSirO'and NarSi.O, composition were used, therefore, tostudy solubility mechanisms of HrO in silicate meltswith a significant number of nonbridging oxygens.
The starting materials for high-pressure experi-ments were glasses made at I atm. The glasses wereproduced from spectroscopically pure (Johnson andMatthey) SiO, and Al,O. and reagent-grade NarCO.(Fisher). Water was double-distilled HrO, added tothe samples with a microsyringe with 0.03 pl preci-
sion. Deuterium oxide (MSD isotope products, Can-ada) was 95 percent D,O and 5 percent HrO.
The samples were contained in sealed Pt capsulesof 2 or 3 mm O.D. In order to ensure that the desiredamount of water was in the charge during an experi-ment, the capsules were weighed before and afterwelding and again after l-2 hr at ll0oC. The accu-racy of the amount of water reported is 4-7 percent(depending on the concentration of HrO in the melt).
All experiments were carried out in solid-media,high-pressure apparatus (Boyd and England, 1960)
using the piston-out technique with a -4 percent cor-rection for friction (calibrated against the quartz-
coesite transition). The temperatures were measuredwith Pt-Pt90Rhl0 thermocouples. The uncertaintieswere +l kbar and +6o-l0oc (Eggler, 1977; Mao eta l . , l97 l ) .
The Raman spectra were taken on small chips ofquenched melt (about 0.5-1.0 mm cubes) free ofbubbles. The spectra were recorded with a Jobin-Yvon optical system, holographic grating, doublemonochromator (HG25) with a photon-counting de-tection system. The spectra were recorded at 3 cm-t /sec. The samples were excited with the 488.0 nm line
of an Ar* laser using laser power of 200-400 mW atthe sample with 90' scattering geometry. Polarized
spectra were obtained with the focused exciting beamparallel to the horizontal spectrometer slit and withthe electric vector ofthe exciting radiation in a verti-cal orientation. A sheet of polarizer disk in front of
an optical scrambler was used to record separatelythe parallel and perpendicular components of thescattered radiation.
Several of the high-frequency envelopes of the
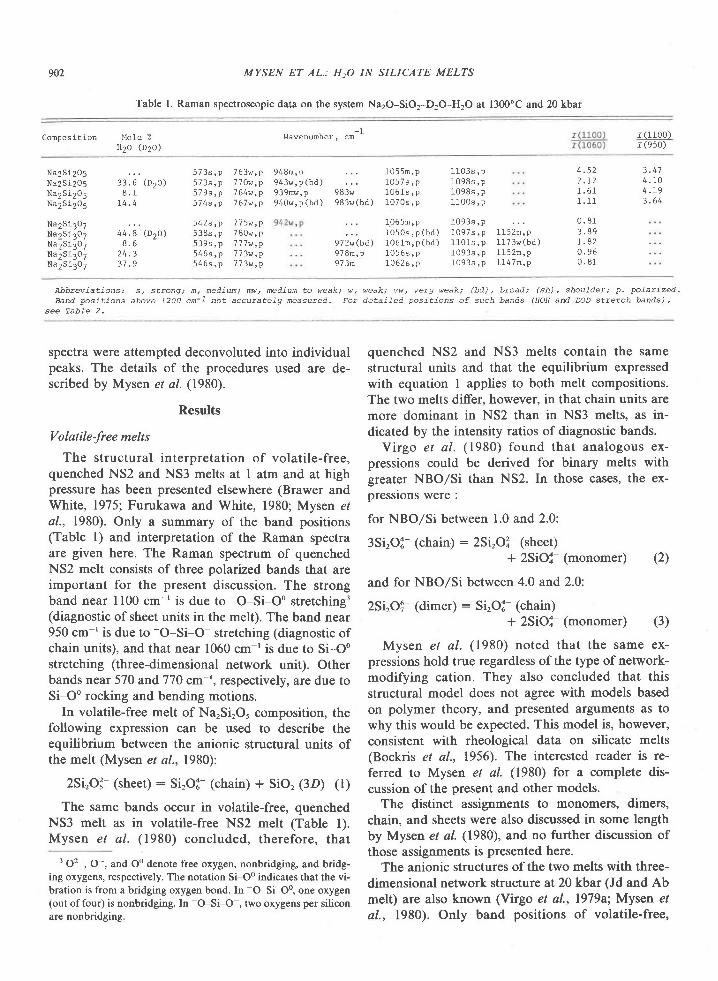
902 MYSEN ET AL.: H,O IN SILICAI|E MELTS
Table 1. Raman spectroscopic data on the syst€m Na2O-SiO,-D2O-H2O at 1300"C and 20 kbar
Composlt lon l lo le 7"H2o (D2o)
- lw a v e n u m D e r ! c m r ( 1100 )
r (9s0)
Na2 S i2O5Na2 S i205Na2Si2O5Na2Si2O5
Na2Si3O7Na2S i3O7Na2Si3O7Na2Si3O7Na2Si307
105 5m, p1 0 5 7 s , p1 0 6 1 s , p1 0 7 0 s , p
1 1 0 3 s , p1 0 9 8 s , p1098s , p1 1 0 0 s , p
2 . r 21 . 6 11 . 1 1
0 . 8 13 . 8 91 , . 8 2o . 9 60 . 8 1
3 . 4 74 . 1 04 . 1 93 . 6 4
3 3 . 6 ( D 2 o )8 . 1
1 4 . 4
4 4 . 8 ( D 2 O )8 . 6
2 4 . 33 7 . 9
5 7 3 s , p 7 6 3 w , p 9 4 8 m , p5 7 3 s , p 7 7 O w , p 9 4 3 w , p ( b d )5 7 9 s , p 7 6 4 w , p 9 3 9 w , p 9 8 3 w5 7 4 s , p 7 6 7 v , p 9 4 0 w , p ( b d ) 9 8 3 w ( b d )
5 4 2 s , p 7 7 5 w , p5 3 8 s , p 7 8 0 w , p5 3 9 s , p 7 7 7 w , p5 4 6 s , p 7 7 3 w , p5 4 6 s , p 7 7 3 w , p
1 0 6 5 n , p 1 0 9 3 s , p1 0 5 0 s , p ( b d ) 1 0 9 7 s ' p 1 1 5 2 n ' P
9 7 2 w ( b d . ) 1 0 6 l m , p ( b d ) 1 1 0 1 s ' p 1 1 7 3 w ( b d )9 7 8 n , p 1 0 5 6 s , p 1 0 9 3 s ' p 1 1 5 2 n , P9 7 3 n 1 0 6 2 s , p 1 0 9 3 s ' p 1 1 4 7 m , P
Abbreviat ions: s, strong; m,
Band posit ions above f2O0 cn-f
see TabJe 2.
medium; mw, medium to weak; w, weak; vwt verV weak; (bd) ' broad,
not accuratef ' l measuted. For detai fed posit ions of such bands
( s h ) , s h o u i d e r i p . p a l a t i z e d .
(HoH and DoD stretch bands) ,
spectra were attempted deconvoluted into individualpeaks. The details of the procedures used are de-scribed by Mysen et al. (1980).
Results
Volatile-free melts
The structural interpretation of volati le-free,quenched NS2 and NS3 melts at I atm and at highpressure has been presented elsewhere (Brawer andWhite, 1975; Furukawa and White, 1980; Mysen eial., l98O). Only a surnmary of the band positions(Table l) and interpretation of the Raman spectraare given here. The Raman spectrum of quenchedNS2 melt consists of three polarized bands that areimportant for the present discussion. The strongband near ll00 cm-' is due to
-O-Si-Oo stretching3
(diagnostic of sheet units in the melt). The band near950 cm-' is due to
-O-Si-O- stretching (diagnostic of
chain units), and that near 1060 cm I is due to Si-Oostretching (three-dimensional network unit). Otherbands near 570 and 770 cm-t, respectively, are due toSi-Oo rocking and bending motions.
In volatile-free melt of NarSirO, composition, thefollowing expression can be used to describe theequilibrium between the anionic structural units ofthe melt (Mysen et al.,1980):
2Si,O- (sheet) : Si,O:- (chain) + SiO, (3D) (l)
The same bands occur in volatile-free, quenchedNS3 melt as in volatile-free NS2 melt (Table l).Mysen et al. (1980) concluded, therefore, that
'O' , O-, and Oo denote free oxygen, nonbridging, and bridg-
ing oxygens, respectively. The notation Si-Oo indicates that the vi-bration is from a bridging oxygen bond. In
-O-Si-Oo, one oxygen
(out of four) is nonbridging. In -O-Si-O-,
two oxygens per siliconare nonbridging.
quenched NS2 and NS3 melts contain the samestructural units and that the equilibrium expressedwith equation I applies to both melt compositions.The two melts differ, however, in that chain units aremore dominant in NS2 than in NS3 melts, as in-dicated by the intensity ratios of diagnostic bands.
Virgo el a/. (1980) found that analogous ex-pressions could be derived for binary melts withgreater NBO/Si than NS2. In those cases, the ex-pressions were :
for NBO/Si between 1.0 and 2.0:
3Si,Oi (chain) : 2SLOI (sheet)+ 2SiOi- (monomer) (2)
and for NBO/Si between 4.0 and 2.0:
2Si,Oi- (dirner) : Si,O: (chain)+ 2SiOl- (monomer) (3)
Mysen et al. (1980) noted that the same ex-pressions hold true regardless of the type of network-modifying cation. They also concluded that thisstructural model does not agree with models basedon polymer theory, and presented arguments as towhy this would be expected. This model is, however,
consistent with rheological data on silicate melts(Bockris et al., 1956). The interested reader is re-
ferred to Mysen et al. (1980) for a complete dis-cussion of the present and other models.
The distinct assignments to monomers, dimers,chain, and sheets were also discussed in some lengthby Mysen et al. (1980), and no further discussion ofthose assignments is presented here.
The anionic structures of the two melts with three-dimensional network structure at20kbar (Jd and Abmelt) are also known (Virgo et al.,1979a; Mysen etal., l98O). Only band positions of volatile-free,
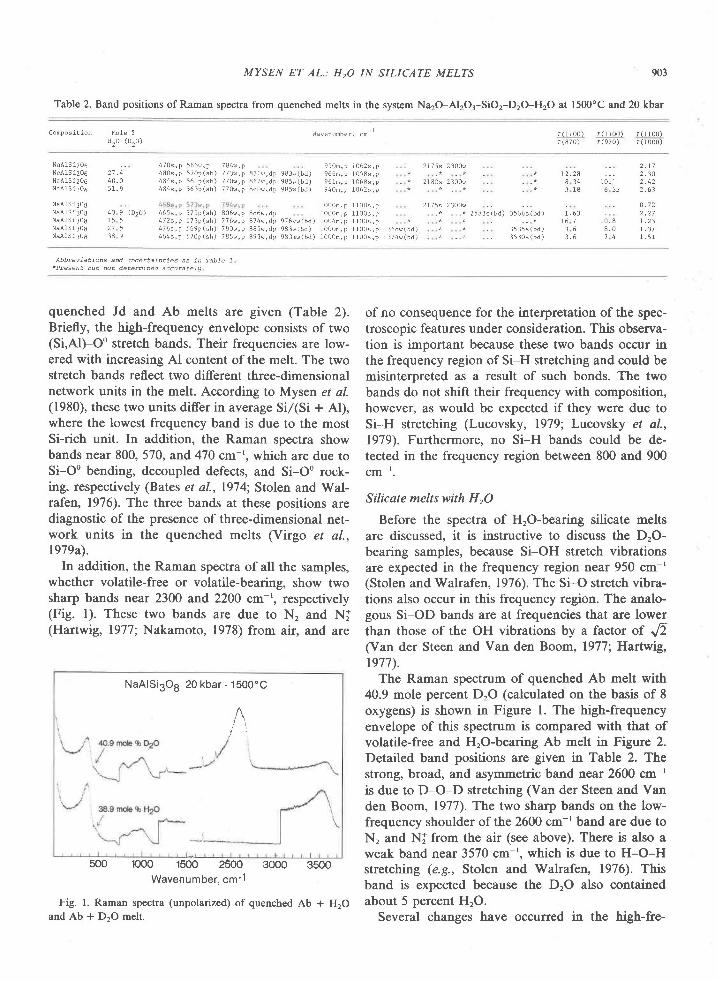
MYSEN ET AL.: H,O IN SILICATE MELTS
Table 2. Band positions of Raman spectra from quenched melts in the system Na2O-AI2O3-SiO2-D2O-H2O at l500oC and 20 kbar
903
Compos iE ion Mole %H 2 O ( D 2 o )
- lr ( 1 1 0 0 ) r ( 1 1 0 0 ) f ( 1 1 0 0 )r ( 8 7 0 ) r ( 9 7 0 ) r ( 1 0 0 0 )
NaAlS i2o6
N a A l S i 2 0 6 2 7 , 4
N a A 1 S i 2 O 6 4 0 . 0N a A l S 1 2 O 6 5 1 . 9
NaA1Si308
N a A r S i 3 o S 4 0 9 ( D 2 0 )
N a A l S i 3 O 8 t 5 5N a A 1 S 1 3 0 8 2 7 5NaAts1308 :18 9
. 2 - 1 72 . 3 0
1 0 . ' 2 . 4 26 3 ) 2 . 6 3
. 0 . 7 2- 2 . 2 7
1 0 . 8 7 . 2 38 . 0 r . 3 17 4 1 . 5 1
4 7 0 s , p 5 6 6 w , p 7 8 4 w , p 9 5 0 m , p t 0 6 2 s , p 2 1 7 5 s 2 1 0 0 v4 8 0 s , p 5 7 0 p ( s h ) 7 7 3 w , p 8 7 1 u , d p 9 8 l w ( b d ) 9 6 6 n , p r 0 5 8 s , p4 8 4 s , p 5 6 1 p ( s h ) 7 7 0 w , p 8 6 2 w , d p 9 8 5 w ( b d ) 9 6 1 m , p 1 0 6 8 s , p 2 1 8 0 s 2 3 0 0 w4 8 4 s , p 5 6 3 p ( s h ) 7 7 0 w , p 8 b J ' , d p 9 8 5 u ( b d ) 9 4 0 m , p 1 0 6 2 s , p
1 0 0 0 n , ! 1 t 0 0 s , p4 6 5 s , p s 7 9 p ( s h ) 8 0 6 w , p 8 8 6 u , d p 1 0 0 0 m , p L 1 0 0 s , p4 7 2 s ' p s 7 3 p ( s h ) 7 7 6 w , p 8 7 4 w , d p 9 7 6 w ( b d ) 1 0 0 4 n , f 1 l 0 0 s , p4 7 6 s , p 5 6 9 p ( s h ) 7 9 0 v , p 8 8 5 ! , d p 9 8 l w ( b d ) 1 0 0 0 n , p r l 0 0 s , p l l 6 8 w ( b d )4 8 4 s , p 5 7 0 p ( s h ) 7 8 s w , p 8 9 3 w , d p 9 8 l m v ( b d ) 1 0 0 0 n , p r 1 0 0 s , p r l 7 4 w ( b d )
* 1 2 . 2 8. . * I 3 4
3 1 8
2 1 7 5 s 2 1 0 0 q. * * 2 5 8 3 s ( b d ) 3 s 6 6 s ( b d ) i . U ,
* 1 6 7. l 5 3 s s ( b d ) 3 6, . 3 5 3 0 s ( b d ) 3 , 6
Abbfewia t ions and Dncer ta in t ies as in Tab le l*Presenx bu t no t de tern iDed accDra te lg
quenched Jd and Ab melts are given (Table 2).Briefly, the high-frequency envelope consists of two(Si,Al)-Oo stretch bands. Their frequencies are low-ered with increasing Al content of the melt. The twostretch bands reflect two different three-dimensionalnetwork units in the melt. According to Mysen et a/.(1980), these two units differ in average Si/(Si + Al),where the lowest frequency band is due to the mostSi-rich unit. In addition, the Raman spectra showbands near 800, 570, and 470 cm-', which are due toSi-Oo bending, decoupled defects, and Si-Oo rock-ing, respectively (Bates et al., 1974; Stolen and Wal-rafen, 1976). The three bands at these positions arediagnostic of the presence of three-dimensional net-work units in the quenched melts (Virgo et al.,1979a).
In addition, the Raman spectra of all the samples,whether volatile-free or volatile-bearing, show twosharp bands near 2300 and 2200 cm ', respectively(Fig. l). These two bands are due to N, and N](Hartwig, 1977; Nakamoto, 1978) from air, and are
of no consequence for the interpretation of the spec-troscopic features under consideration. This observa-tion is important because these two bands occur inthe frequency region of Si-H stretching and could bemisinterpreted as a result of such bonds. The twobands do not shift their frequency with composition,however, as would be expected if they were due toSi-H stretching (Lucovsky, 1979; Lucovsky e/ a/.,1979). Furthennore, no Si-H bands could be de-tected in the frequency region between 800 and 900cm- ' .
Silicate melts with H,O
Before the spectra of HrO-bearing silicate meltsare discussed, it is instructive to discuss the DrO-bearing samples, because Si-OH stretch vibrationsare expected in the frequency region near 950 cm-'(Stolen and Walrafen,1976). The Si-O stretch vibra-tions also occur in this frequency region. The analo-gous Si-OD bands are at frequencies that are lowerthan those of the OH vibrations by a factor of rr/2(Van der Steen and Van den Boom, 1977; Hafiwig,r977).
The Raman spectrum of quenched Ab melt with40.9 mole percent DrO (calculated on the basis of 8oxygens) is shown in Figure l. The high-frequencyenvelope of this spectrum is compared with that ofvolatile-free and HrO-bearing Ab melt in Figure 2.Detailed band positions are given in Table 2. Thestrong, broad, and asymmetric band near 2600 cm-'is due to D-O-D stretching (Van der Steen and Vanden Boom, 1977). Tl;re two sharp bands on the low-frequency shoulder of the 2600 cm-' band are due toN, and Ni from the air (see above). There is also aweak band near 3570 cm-', which is due to H-O-Hstretching (e.9., Stolen and Walrafen, 1976). Thisband is expected because the DrO also containedabout 5 percent HrO.
Several changes have occurred in the high-fre-
NaAlSi3Og 20 kbar - 1500"C
500 1000 1500 2500 3000 3500Wavenumber, cm-1
Fig. l. Raman spectra (unpolarized) of quenched Ab + H2Oand Ab + D2O melt.
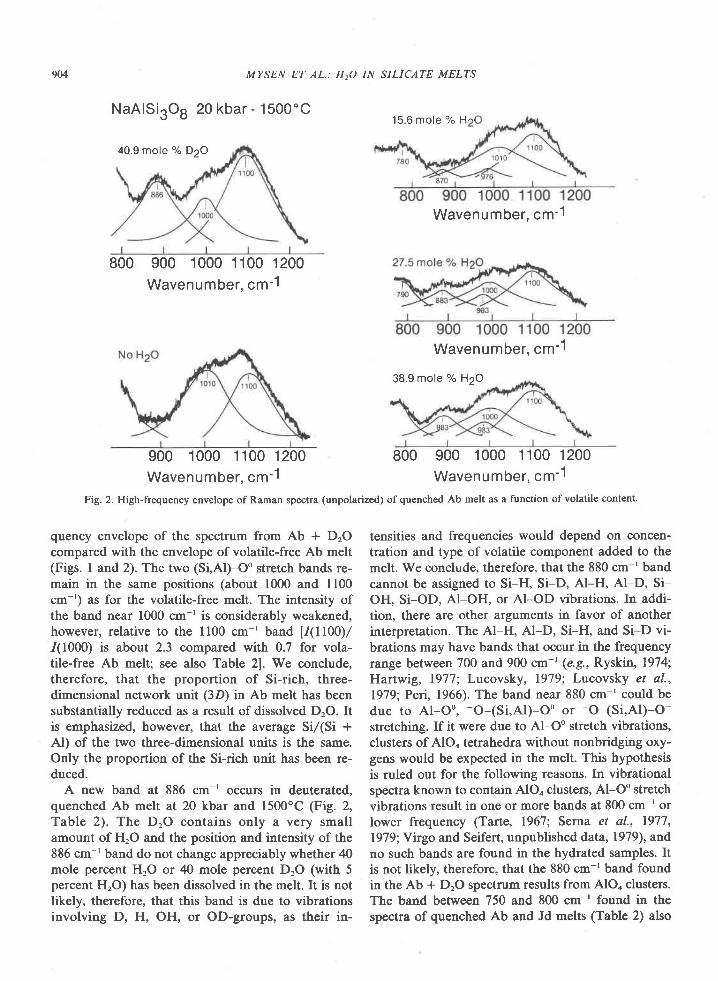
40.9 mole "/" D2O
9M MYSEN ET AL.: H20 IN SILICATE MELTS
NaAlSi3O6 20 kbar - 1500"C
800 900 1000 1100 1200Wavenumber. cm'1
900 1000 1100 1200Wavenumber, cm-1
quency envelope of the spectrum from Ab + DrOcompared with the envelope of volatile-free Ab melt(Figs. I and 2). The two (Si,Al)-Oo stretch bands re-main in the same positions (about 1000 and 1100cm-') as for the volatile-free melt. The intensity ofthe band near 1000 cm-' is considerably weakened,however, relative to the ll00 cm-' band [(1100)/(1000) is about 2.3 compared with 0.7 for vola-tile-free Ab melt; see also Table 21. We conclude,therefore, that the proportion of Si-rich, three-dimensional network unit (3D) in Ab melt has beensubstantially reduced as a result of dissolved DrO. Itis emphasized, however, that the average Si/(Si +Al) of the two three-dimensional units is the same.Only the proportion of the Si-rich unit has been re-duced.
A new band at 886 cm-' occurs in deuterated,quenched Ab melt at 20 kbar and 1500"C (Fig. 2,Table 2). The DrO contains only a very smallamount of HrO and the position and intensity of the886 cm-' band do not change appreciably whether 40mole percent HrO or 40 mole percent DrO (with 5percent HrO) has been dissolved in the melt. It is notlikely, therefore, that this band is due to vibrationsinvolving D, H, OH, or OD-groups, as their in-
800 900 1000 1100 1200Wavenumber. cm-1
tensities and frequencies would depend on concen-tration and type of volatile component added to themelt. We conclude, therefore, that the 880 cm-'bandcannot be assigned to Si-H, Si-D, Al-H, Al-D, Si-OH, Si-OD, AI-OH, or AI-OD vibrations. In addi-tion, there are other arguments in favor of anotherinterpretation. The Al-H, Al-D, Si-H, and Si-D vi-
brations may have bands that occur in the frequencyrange between 700 and 900 cm-' (e.g., Ryskin, 1974;Hartwig, 1977; Lucovsky, 1979; Lucovsky et al.,1979; Pei, 1966). The band near 880 cm-' could bedue to Al-Oo,
-O-(Si,Al)-Oo or -O-(Si,Al)-O-
stretching. If it were due to Al-Oo stretch vibrations,clusters of AlOn tetrahedra without nonbridging oxy-gens would be expected in the melt. This hypothesisis ruled out for the following reasons. In vibrationalspectra known to contain AlOo clusters, Al-Oo stretchvibrations result in one or more bands at 800 cm-' orlower frequency (Tarte, 19671' Serna e/ al., 19'17,1979; Virgo and Seifert, unpublished data,1979),andno such bands are found in the hydrated samples. Itis not likely, therefore, that the 880 cm-' band foundin the Ab + DrO spectrum results from AlOo clusters.The band between 750 and 800 cm-' found in thespectra of quenched Ab and Jd melts (Table 2) also
Fig. 2. High-frequency envelope of Raman spectra (unpolarized) of quenched Ab melt as a function of volatile content.
1 5 . 6 m o l e %
Wavenumber, cm-1
Wavenumber, cm'1
38.9 mole "/" H2O
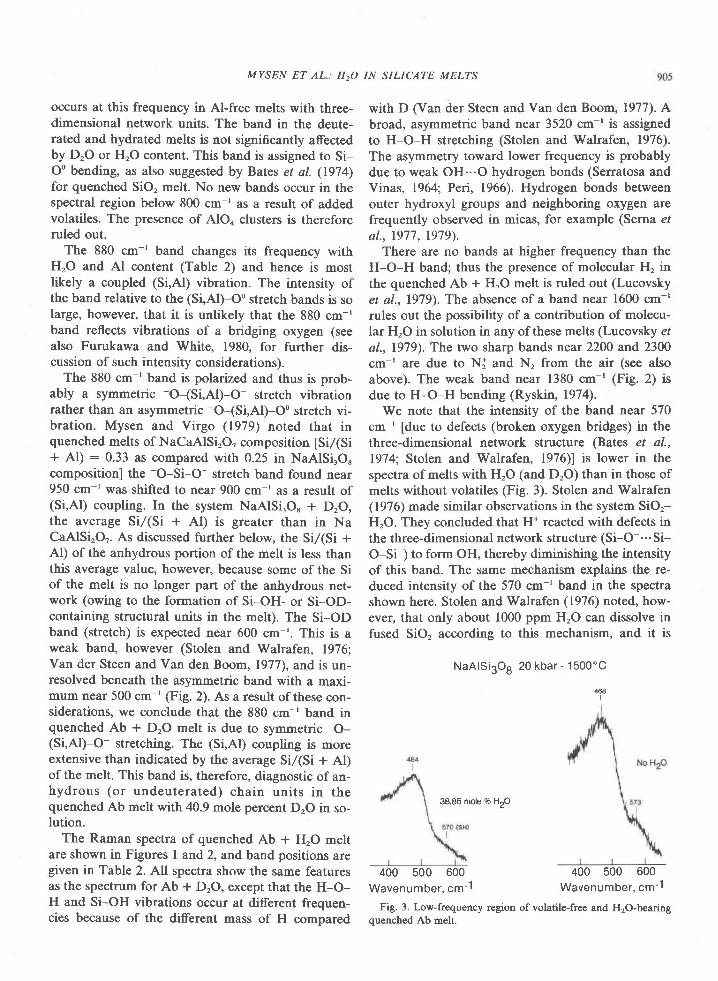
occurs at this frequency in Al-free melts with three-dimensional network units. The band in the deute-rated and hydrated melts is not significantly affectedby DrO or H.O content. This band is assigned to Si-Oo bending, as also suggested by Bates et al. (1974)for quenched SiO, melt. No new bands occur in thespectral region below 800 cm-' as a result of addedvolatiles. The presence of AlOo clusters is thereforeruled out.
The 880 cm-' band changes its frequency withHrO and Al content (Table 2) and hence is mostlikely a coupled (Si,Al) vibration. The intensity ofthe band relative to the (Si,Al)-Oo stretch bands is solarge, however, that it is unlikely that the 880 cm-'band reflects vibrations of a bridging oxygen (seealso Furukawa and White, 1980, for further dis-cussion of such intensity considerations).
The 880 cm-' band is polarized and thus is prob-ably a symmetric -O-(Si,AD-O- stretch vibrationrather than an asymmetric O-(Si,Al)-Oo stretch vi-bration. Mysen and Virgo (1979) noted that inquenched melts of NaCaAlSirO, composition tsi/(Si+ Al) : 0.33 as compared with 0.25 in NaAlSi.O,compositionl the -O-Si-O- stretch band found near950 cm-' was shifted to near 900 cm-' as a result of(Si,Al) coupling. In the system NaAlSi,O. + D2O,the average Si/(Si + AD is greater than in NaCaAlSirOr. As discussed further below, the Si/(Si +Al) of the anhydrous portion of the melt is less thanthis average value, however, because some of the Siof the melt is no longer part of the anhydrous net-work (owing to the formation of Si-OH- or Si-OD-containing structural units in the melt). The Si-ODband (stretch) is expected near 600 cm-'. This is aweak band, however (Stolen and Walrafen, 1976;Van der Steen and Van den Boom, 1977), and is un-resolved beneath the asymmetric band with a maxi-mum near 500 cm-' (Fig. 2). As a result of these con-siderations, we conclude that the 880 cm-' band inquenched Ab + DrO melt is due to symmetric -O-
(Si,Al)-O- stretching. The (Si,Al) coupling is moreextensive than indicated by the average Si/(Si + ADof the melt. This band is, therefore, diagnostic of an-hydrous (or undeuterated) chain units in thequenched Ab melt with 40.9 mole percent DrO in so-lution.
The Raman spectra of quenched Ab + HrO meltare shown in Figures I and 2, and band positions aregiven in Table 2. All spectra show the same featuresas the spectrum for Ab + D2O, except that the H-O-H and Si-OH vibrations occur at different frequen-cies because of the different mass of H compared
MYSEN ET AL.: H20 IN SILICATE MELTS
400 500 600Wavenumber, cm-1
with D (Van der Steen and Van den Boom, 1977). Abroad, asymmetric band near 3520 cm-' is assignedto H-O-H stretching (Stolen and Walrafe4 1976).The asymmetry toward lower frequency is probablydue to weak OH...O hydrogen bonds (Serratosa andVinas, 1964; Peri, 1966). Hydrogen bonds betweenouter hydroxyl groups and neighboring oxygen arefrequently observed in micas, for example (Serna elal., 1977, 1979).
There are no bands at higher frequency than theH-O-H band; thus the presence of molecular H' inthe quenched Ab + H,O melt is ruled out (Lucovskyet al., 1979). The absence of a band near 1600 cm-'rules out the possibility of a contribution of molecu-lar HrO in solution in any of these melts (Lucovsky etal., 1979). The two sharp bands near 22OO and 2300cm ' are due to Nf and N, from the air (see alsoabove). The weak band near 1380 cm-' (Fig. 2) isdue to H-O-H bending (Ryskin, 1974).
We note that the intensity of the band near 570cm-' [due to defects (broken oxygen bridges) in thethree-dimensional network structure (Bates et al.,1974; Stolen and Walrafen, 1976)l is lower in thespectra of melts with HrO (and DrO) than in those ofmelts without volatiles (Fig. 3). Stolen and Walrafen(1976) made similar observations in the system SiOr-HrO. They concluded that H* reacted with defects inthe three-dimensional network structure (Si-O- "'Si-O-Si) to form OH, thereby diminishing the intensityof this band. The same mechanism explains the re-duced intensity of the 570 cm-' band in the spectrashown here. Stolen and Walrafen(1976) noted, how-ever, that only about 1000 ppm HrO can dissolve infused SiO, according to this mechanism, and it is
NaAlSi3O6 20 kbar - 1500"C
468
38.85 mole % H2O
400 500 600Wavenumber, cm-1
Fig. 3. Low-frequency region of volatile-free and H2O-bearingquenched Ab melt.
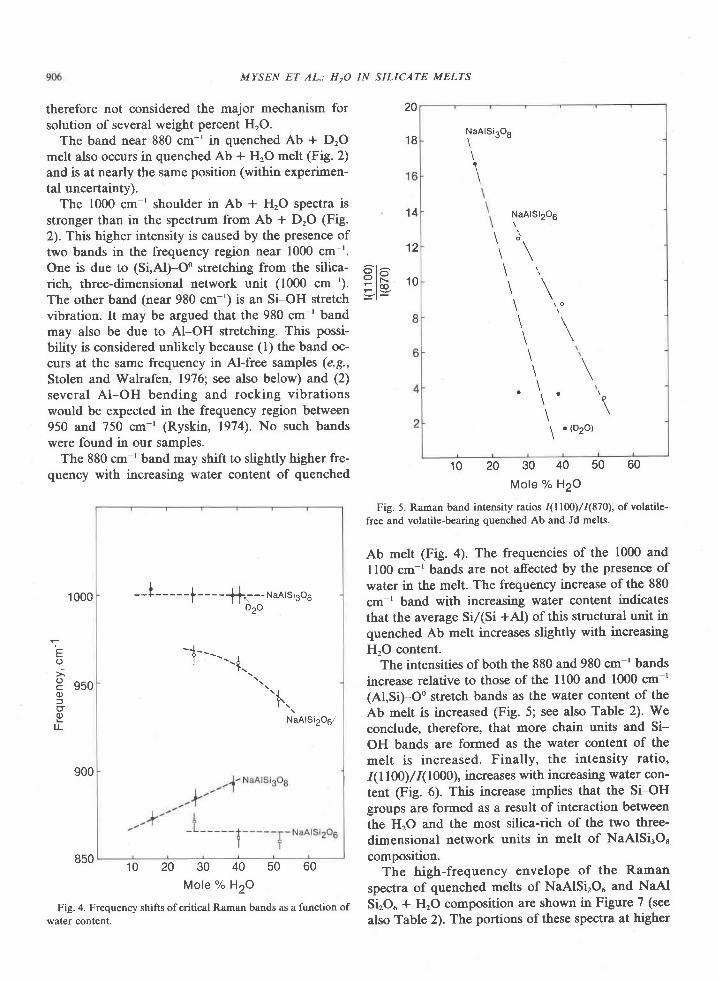
MYSEN ET AL.: H,O IN SILICATE MELTS
therefore not considered the major mechanism forsolution of several weight percent HrO.
The band near 880 cm-' in quenched Ab + DrOmelt also occurs in quenched Ab + HrO melt (Fig. 2)and is at nearly the same position (within experimen-tal uncertainty).
The 1000 cm-' shoulder in Ab + HrO spectra isstronger than in the spectrum from Ab + DrO (Fig.2). This higher intensity is caused by the presence oftwo bands in the frequency region near 1000 cm-'.One is due to (Si,Al)-Oo stretching from the silica-rich. three-dimensional network unit (1000 cm-').The other band (near 980 cm-') is an Si-OH stretchvibration. It may be argued that the 980 cm-' bandmay also be due to AI-OH stretching. This possi-bility is considered unlikely because (l) the band oc-curs at the same frequency in Al-free samples (e.9.,Stolen and Walrafen, 1976; see also below) and (2)several AI-OH bending and rocking vibrationswould be expected in the frequency region between950 and 750 cm-' (Ryskin, 1974). No such bandswere found in our samples.
The 880 cm-' band may shift to slightly higher fre-quency with increasing water content of quenched
NaAlSi3OB
1
NaAlSi206
\ i ,
\ , \\
t ro
\ \\ \\\
\ r t e
\ \1
o (D2o)
10 20 30 40 50 60
Mole % H2O
Flg. 5. Raman band intensity ratios /(l100)/(870), of volatile-free and volatile-bearing quenched Ab and Jd melts.
Ab melt (Fig. a). The frequencies of the 1000 andll00 cm-' bands are not afected by the presence ofwater in the melt. The frequency increase of the 880cm-' band with increasing water content indicatesthat the average Si/(Si +AD of this structural unit inquenched Ab melt increases slightly with increasingHrO content.
The intensities of both the 880 and 980 cm-' bandsincrease relative to those of the ll00 and 1000 cm-'(Al,Si)-Oo stretch bands as the water content of theAb melt is increased (Fie. 5; see also Table 2). Weconclude, therefore, that more chain units and Si-OH bands are formed as the water content of themelt is increased. Finally, the intensity ratio,(l100)/(1000), increases with increasing water con-tent (Fig. 6). This increase inplies that the Si-OHgroups are formed as a result of interaction betweenthe HrO and the most silica-rich of the two three-dimensional network units in melt of NaAlSirO.composition.
The high-frequency envelope of the Ramanspectra of quenched melts of NaAlSi'O" and NaAlSirOu + HrO composition are shown in Figure 7 (seealso Table 2). The portions of these spectra at higher
3lE
20
1 8
1 4
1 2
1 0
T
oj
P gsoo
q)
LL
1000
850 10 20 30 40 50 60Mole % H2O
Fig. 4. Frequency shifts of critical Raman bands as a function of
water content.
-- l-----1- +L;NaArsi3og
\ l
NaAlSi206z'
900
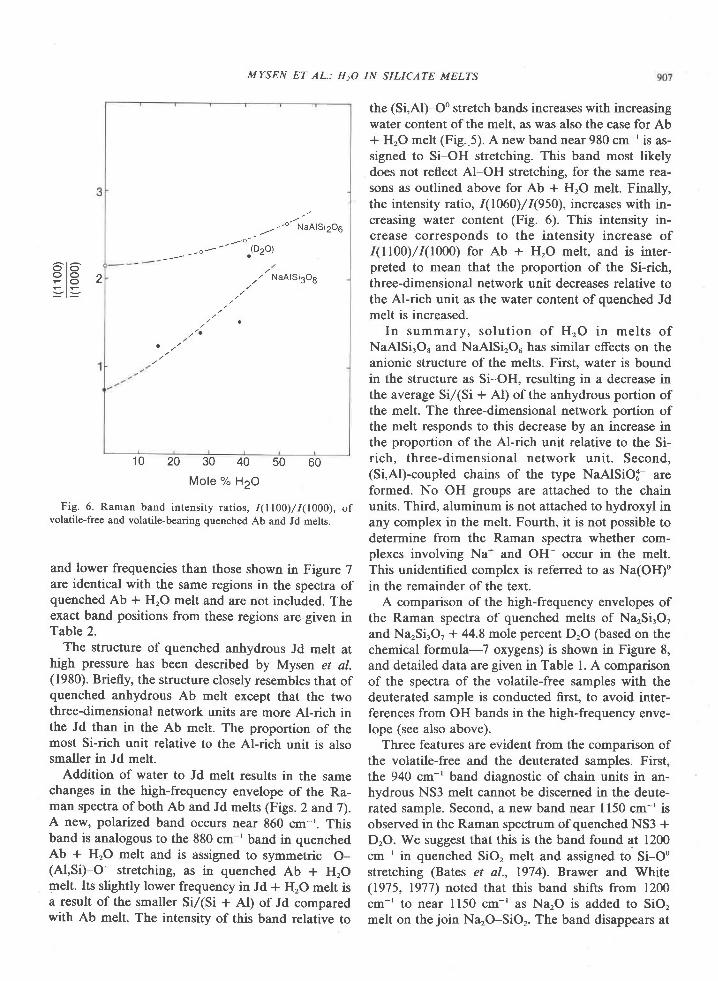
MYSEN ET AL.: H2O IN SILICATE MELTS
O I O .- l O .r l F
. - o /
-o- " (DrO), - ' a
-
/ / NaAlS i3OS
10 20 30 40 50 60
Mole "/" H2O
Fig. 6. Raman band intensity ratios, 1(1100)/1(1000), ofvolatile-free and volatile-bearing quenched Ab and Jd melts.
and lower frequencies than those shown in Figure 7are identical with the same regions in the spectra ofquenched Ab + HrO melt and are not included. Theexact band positions from these regions are given inTable 2.
The structure of quenched anhydrous Jd melt athigh pressure has been described by Mysen et al.(1980). Briefly, the structure closely resembles that ofquenched anhydrous Ab melt except that the twothree-dimensional network units are more Al-rich inthe Jd than in the Ab melt. The proportion of themost Si-rich unit relative to the Al-rich unit is alsosmaller in Jd melt.
Addition of water to Jd melt results in the samechanges in the high-frequency envelope of the Ra-man spectra of both Ab and Jd melts (Figs. 2 and 7).A new, polarized band occurs near 860 cm-'. Thisband is analogous to the 880 cm-' band in quenchedAb + HrO melt and is assigned to symmetric -O-
(Al,Si)-O- stretching, as in quenched Ab + HrOmelt. Its slightly lower frequency in Jd + HrO melt isa result of the smaller Si/(Si + Al) of Jd comparedwith Ab melt. The intensity of this band relative to
the (Si,Al)-Oo stretch bands increases with increasingwater content of the melt, as was also the case for Ab+ HrO melt (Fig. 5). A new band near 980 cm-' is as-signed to Si-OH stretching. This band most likelydoes not reflect AI-OH stretching, for the same rea-sons as outlined above for Ab + HrO melt. Finally,the intensity ratio, (1060)/I(950), increases with in-creasing water content (Fig. 6). This intensity in-crease corresponds to the intensity increase of(1100)/(1000) for Ab + H,O melt, and is inter-preted to mean that the proportion of the Si-rich,three-dimensional network unit decreases relative tothe Al-rich unit as the water content of quenched Jdmelt is increased.
In summary, so lut ion of HrO in mel ts ofNaAlSi,O, and NaAlSirOu has similar effects on theanionic structure of the melts. First, water is boundin the structure as Si-OH, resulting in a decrease inthe average Si/(Si + Al) of the anhydrous portion ofthe melt. The three-dimensional network portion ofthe melt responds to this decrease by an increase inthe proportion of the Al-rich unit relative to the Si-rich, three-dimensional network unit. Second,(Si,Al)-coupled chains of the type NaAlSiOf- areformed. No OH groups are attached to the chainunits. Third, aluminum is not attached to hydroxyl inany complex in the melt. Fourth, it is not possible todetermine from the Raman spectra whether com-plexes involving Na* and OH- occur in the melt.This unidentified complex is referred to as Na(OH)oin the remainder of the text.
A comparison of the high-frequency envelopes ofthe Raman spectra of quenched melts of NarSirO,and Na,Si.O j + 44.8 mole percent DrO (based on thechemical formula-7 oxygens) is shown in Figure 8,and detailed data are given in Table l. A comparisonof the spectra of the volatile-free samples with thedeuterated sample is conducted first, to avoid inter-ferences from OH bands in the high-frequency enve-lope (see also above).
Three features are evident from the comparison ofthe volatile-free and the deuterated samples. First,the 940 cm-' band diagnostic of chain units in an-hydrous NS3 melt cannot be discerned in the deute-rated sample. Second, a new band near I150 cm-' isobserved in the Raman spectrum of quenched NS3 +DrO. We suggest that this is the band found at 1200cm-' in quenched SiO, melt and assigned to Si-O0stretching (Bates et al., 1974). Brawer and White(1975, 1977) noted that this band shifts from 1200cm- ' to near l l50 cm- 'as Na2O is added to SiO,melt on the join NarO-SiOr. The band disappears at
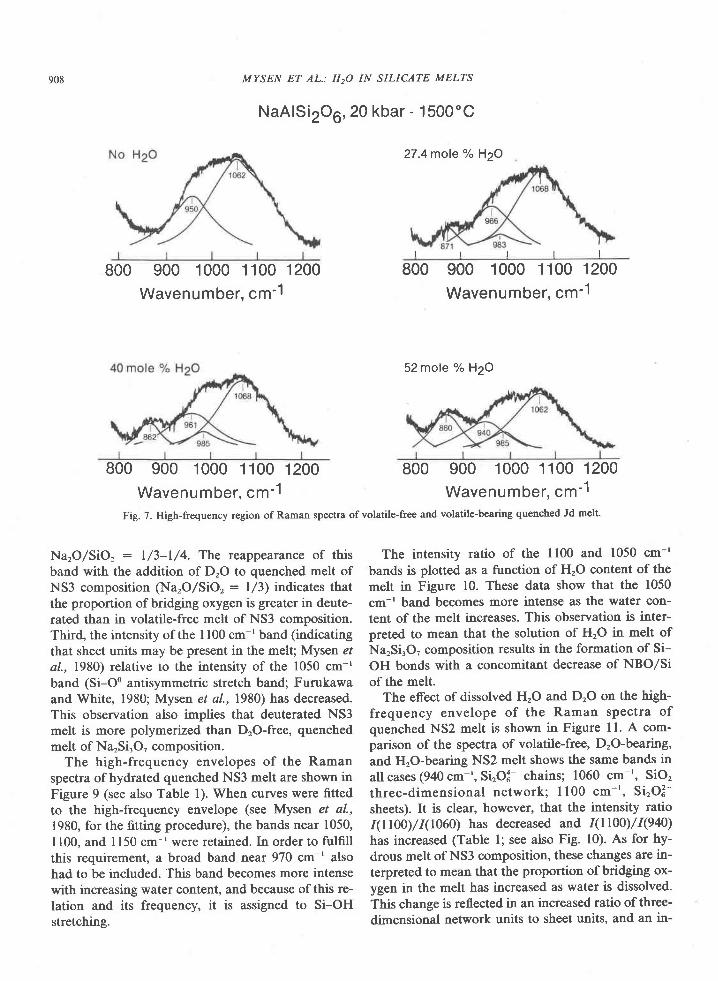
908 MYSEN ET AL.: H2O IN SILICATE MELTS
NaAlSi2O6,20 kbar - 1500 'C
800 900 1000 1100 1200Wavenumber. cm'1
800 900 1000 1100 1200Wavenumber. cm-1
NarO/SiO, : l/3-l/4. The reappearance of thisband with the addition of DrO to quenched melt ofNS3 composition (Na'O/SiO, : l/3) indicates thatthe proportion ofbridging oxygen is greater in deute-rated than in volatile-free melt of NS3 composition.Third, the intensity of the I100 cm-' band (indicatingthat sheet units may be present in the melt; Mysen elal., 1980) relative to the intensity of the 1050 cm-'band (Si-O" antisymmetric stretch band; Furukawaand White, 1980; Mysen et al., l98O) has decreased.This observation also implies that deuterated NS3melt is more polymeiued than DrO-free, quenchedmelt of NarSirO, composition.
The high-frequency envelopes of the Ramanspectra of hydrated quenched NS3 melt are shown in
Figure 9 (see also Table 1). When curves were fittedto the high-frequency envelope (see Mysen e/ a/.,1980, for the fitting procedure), the bands near 1050,
1100, and I150 cm-' were retained. In order to fulfill
this requirement, a broad band near 970 cm-' alsohad to be included. This band becomes more intensewith increasing water content, and because of this re-
lation and its frequency, it is assigned to Si-OHstretching.
800 900 1000 1100 1200Wavenumber. cm-1
52 mof e "/" H2O
800 900 1000 1100 1200Wavenumber. cm-1
The intensity ratio of the ll00 and 1050 cm-'bands is plotted as a function of HrO content of themelt in Frgure 10. These data show that the 1050cm-' band becomes more intense as the water con-tent of the melt increases. This observation is inter-preted to mean that the solution of HrO in melt ofNarSi.O, composition results in the formation of Si-OH bonds with a concomitant decrease of NBO/Siof the melt.
The effect of dissolved HrO and DrO on the high-frequency envelope of the Raman spectra ofquenched NS2 melt is shown in Figure ll. A com-parison of the spectra of volatile-free, D'O-bearing,and HrO-bearing NS2 melt shows the same bands inall cases (940 cm-', SirO:- chains; 1060 cm-', SiO,three-dimensional network; l l00 cm-' , SirOS-sheets). It is clear, however, that the intensity ratio(1100)/(1060) has decreased and (1100)/I(940)has increased (Table l; see also Fig. l0). As for hy-drous melt of NS3 composition, these changes are in-terpreted to mean that the proportion of bridging ox-ygen in the melt has increased as water is dissolved.This change is reflected in an increased ratio of three-dinensional network units to sheet units, and an in-
Fig. 7. High-frequency region of Raman spectra of volatile-free and volatile-bearing quenched Jd melt.
27.4 mole % H2O
r t r l l
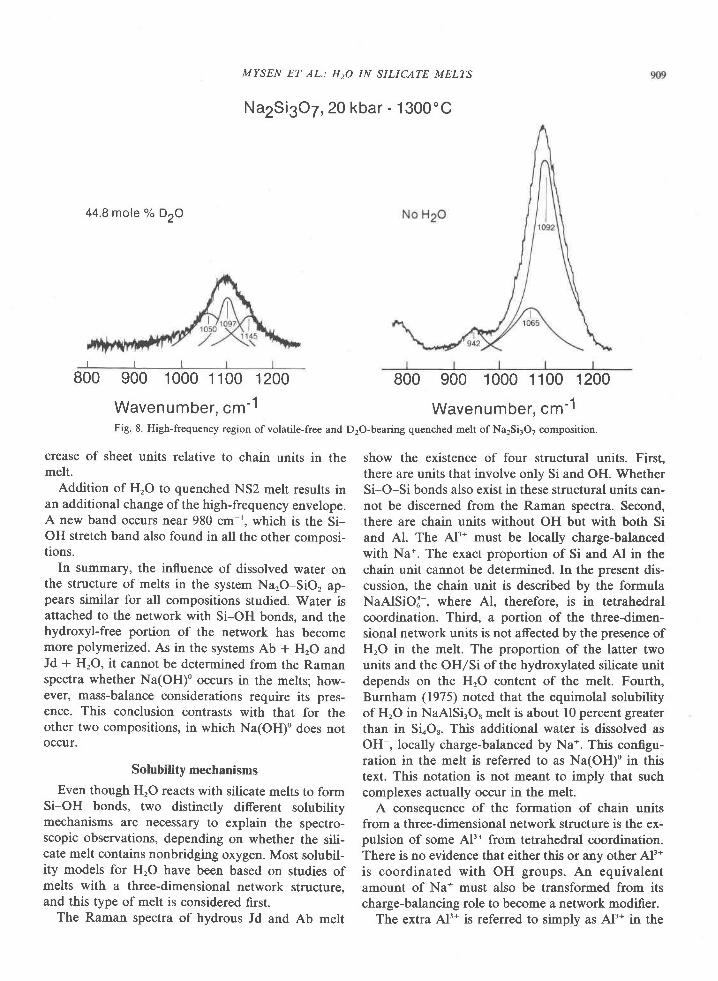
MYSEN ET AL.: H20 IN SILICATE MELTS
Na2Si3O7, 20 kbar - 1 300"C
44.8 mole % DzO
l t l
800 900 1000 1100 1200
Wavenumber. cm-1
crease of sheet units relative to chain units in themelt.
Addition of HrO to quenched NS2 melt results inan additional change ofthe high-frequency envelope.A new band occurs near 980 cm-r, which is the Si-OH stretch band also found in all the other composi-trons.
In summary, the influence of dissolved water onthe structure of melts in the system NarO-SiO, ap-pears similar for all compositions studied. Water isattached to the network with Si-OH bonds. and thehydroxyl-free portion of the network has becomemore polymerized. As in the systems Ab * HrO andJd + HrO, it cannot be determined from the Ramanspectra whether Na(OH)0 occurs in the melts; how-ever, mass-balance considerations require its pres-ence. This conclusion contrasts with that for theother two compositions, in which Na(OH)o does notoccur.
Solubility mechanisms
Even though HrO reacts with silicate melts to formSi-OH bonds, two distinctly different solubilitymechanisms are necessary to explain the spectro-scopic observations, depending on whether the sili-cate melt contains nonbridging oxygen. Most solubil-ity models for HrO have been based on studies ofmelts with a three-dimensional network structure,and this type of melt is considered first.
The Raman spectra of hydrous Jd and Ab melt
800 900 1000 1100 1200
Wavenumber. cm-1
show the existence of four structural units. First.there are units that involve only Si and OH. WhetherSi-O-Si bonds also exist in these structural units can-not be discerned from the Raman spectra. Second,there are chain units without OH but with both Siand Al. The Al'* must be locally charge-balancedwith Na*. The exact proportion of Si and Al in thechain unit cannot be determined. In the present dis-cussion, the chain unit is described by the formulaNaAlSiO|-, where Al, therefore, is in tetrahedralcoordination. Third, a portion of the three-dimen-sional network units is not affected by the presence ofHrO in the melt. The proportion of the latter twounits and the OH/Si of the hydroxylated silicate unitdepends on the HrO content of the melt. Fourth,Burnham (1975) noted that the equimolal solubilityof HrO in NaAlSi.O. melt is about l0 percent greaterthan in SLO,. This additional water is dissolved asOH-, locally charge-balanced by Na*. This configu-ration in the melt is referred to as Na(OH)o in thistext. This notation is not meant to imply that suchcomplexes actually occur in the melt.
A consequence of the formation of chain unitsfrom a three-dimensional network structure is the ex-pulsion of some Al3* from tetrahedral coordination.There is no evidence that either this or any other Al3*is coordinated with OH groups. An equivalentamount of Na* must also be transformed from itscharge-balancing role to become a network modifier.
The extra Al3* is referred to simply as Al't in the
Fig. 8. High-frequency region of volatile-free and D2O-bearing quenched melt of Na2SirOT composition.
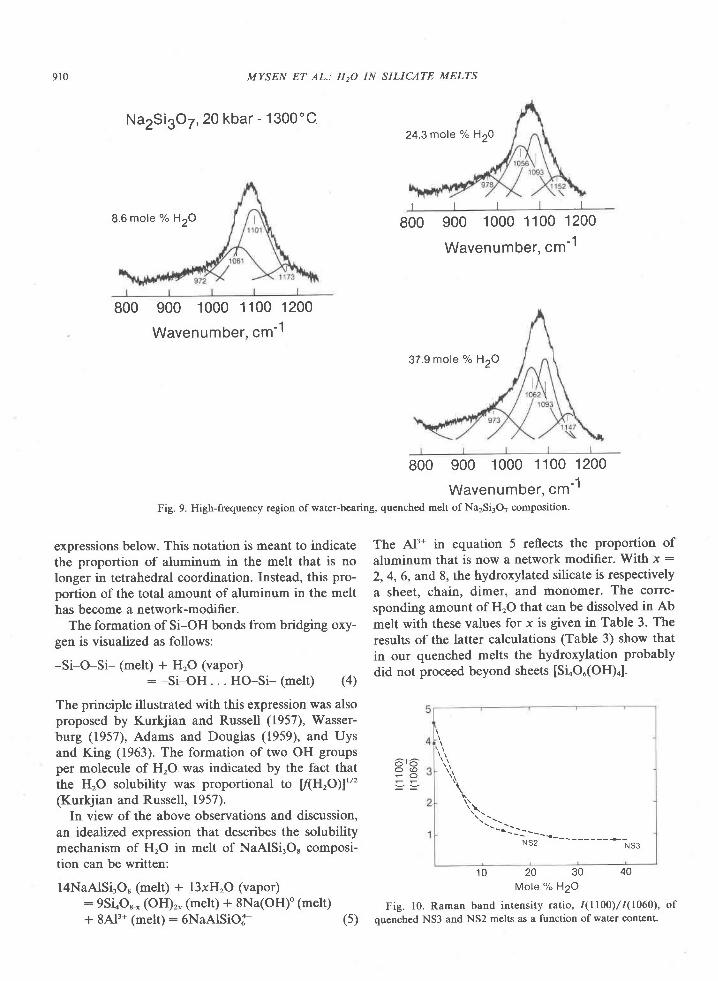
910 MYSEN ET AL.: H2O IN SILICATE MELTS
Na2Si3O7,20 kbar - 1300"C
800 900 1000 1100 1200
Wavenumber. cm-1
expressions below. This notation is meant to indicatethe proportion of aluminum in the melt that is nolonger in tetrahedral coordination. Instead, this pro-portion of the total amount of aluminum in the melthas become a network-modifier.
The formation of Si-OH bonds from bridging oxy-gen is visualized as follows:
-Si-O-Si- (melt) + H,O (vapor): -Si-OH.. . HO-Si- (melt) (4)
The principle illustrated with this expression was alsoproposed by Kurkjian and Russell (1957), Wasser-burg (1957), Adams and Douglas (1959), and Uysand King (1963). The formation of two OH groupsper molecule of HrO was indicated by the fact thatthe HrO solubility was proportional to [(HrO)]"'(Kurkjian and Russell, 1957).
In view of the above observations and discussion,an idealized expression that describes the solubilitymechanism of HrO in melt of NaAlSi.O. composi-tion can be written:
l4NaAlSi,O, (melt) + l3xH,O (vapor):9SLO,. (OH),. (melt) + 8Na(OH)'(melt)+ 8Al3* (melt;:6NaAlSiO.a- (5)
t t l l
800 900 1000 1100 1200
Wavenumber, cm-1
The Al'* in equation 5 reflects the proportion of
aluminum that is now a network modifier. With x :
2,4,6, and 8, the hydroxylated silicate is respectively
a sheet, chain, dimer, and monomer. The corre-
sponding amount of HrO that can be dissolved in Ab
melt with these values for x is given in Table 3. The
results of the latter calculations (Table 3) show that
in our quenched melts the hydroxylation probably
did not proceed beyond sheets [Si.Ou(OH).].
800 900 1000 1100 1200
Wavenumber, cm-1Fig. 9. High-frequency region of water-bearing, quenched melt of Na2Si3O7 composition.
o ( o; l == t =
'i.
's.__.__::____
N52 --- - - - - - - - . - - r r rss
10 20 30 40Mole % H2O
Fig. 10. Raman band intensity rat io, 1(1100)/1(1060), ofquenched NS3 and NS2 melts as a function of water content.
24.3 mole "k H20
8.6 mole % H2O
37.9 mole % H2O
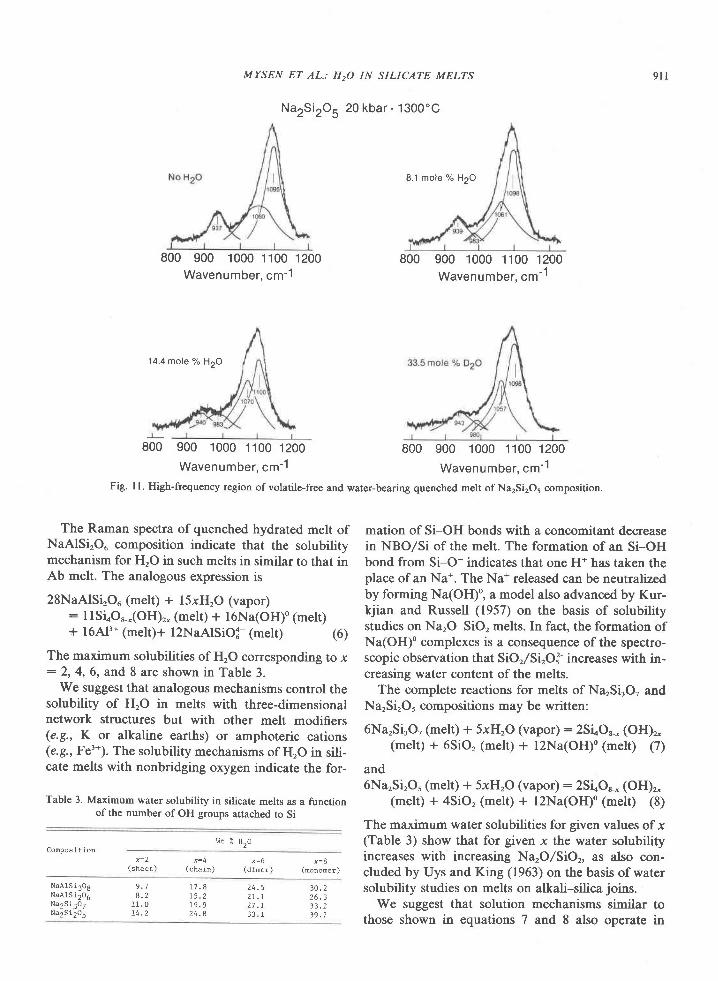
800 900 1000 1100 1200Wavenumbel, cp-1
900 1000 1100 1200Wavenumber, cm-1
The Raman spectra of quenched hydrated melt ofNaAlSirOu composition indicate that the solubilitymechanism for HrO in such melts in similar to that inAb melt. The analogous expression is
28NaAlSi,Ou (melt) + l5xH,O (vapor): I lSLO,,(OH),- (melt) + l6Na(OH)' (melt)+ 16A13* (melt)+ l2NaAlSiOi- (melt) (6)
The maximum solubilities of HrO corresponding to x: 2, 4,6, and 8 are shown in Table 3.
We suggest that analogous mechanisms control thesolubility of H.O in melts with three-dimensionalnetwork structures but with other melt modifiers(e.9., K or alkaline earths) or amphoteric cations(e.9., Fe'*). The solubility mechanisms of HrO in sili-cate melts with nonbridging oxygen indicate the for-
Table 3. Maximum water solubility in silicate melts as a functionof the nurnber of OH groups attached to Si
t^]L "l Hzo
MYSEN ET AL.: H20 IN SILICATE MELTS
Na2Si2OU 20 kbar - 1300'C
( d i n e r )
800 900 1000 1100 1200Wavenumber. cr-1
800 900 1000 1100 1200
Wavenumber, cm'1
mation of Si-OH bonds with a concomitant decreasein NBO/Si of the melt. The formation of an Si-OHbond from Si-O- indicates that one H* has taken theplace of an Na*. The Na* released can be neutralizedby forming Na(OH)o, a model also advanced by Kur-kjian and Russell (1957) on the basis of solubilitystudies on NarO-SiO2 melts. In fact, the formation ofNa(OH)O complexes is a consequence of the spectro-scopic observation that SiOr/SirO,'- increases with in-creasing water content of the melts.
The complete reactions for melts of NarSirO, andNarSirO, compositions may be written:
6Na,Si,O, (melt) + 5xH,O (vapor):2SLO,-" (OH)r,(melt) + 6Sio, (melt) + l2Na(oH)o (melt) (7')
and6Na,Si,O, (melt) + 5xH,O (vapor):2SLO.-. (OH)r,
(melt) + 4SiO, (melt) + l2Na(OH)" (melt) (8)
The maximum water solubilities for given values of x(Table 3) show that for given x the water solubilityincreases with increasing NarO/SiOr, as also con-cluded by Uys and King (1963) on the basis of watersolubility studies on melts on alkali-silica joins.
We suggest that solution mechanisms similarthose shown in equations 7 and 8 also oparate
9 l l
--l-
800
Fig. ll. High-frequency region of volatile-free and water-bearing quenched melt of Na2Si2O, composition.
C o m p o s l t i o n
( s h e e t ) (cha in ) (monomet , )
NaAtSi308NaAlSl2O6N a 2 S i 3 0 7N a 2 S i 2 0 5
8 . 21 1 . 01 4 . 2
1 7 . 81 5 . 21 9 . 92 4 . 4
3 0 . 22 6 . 33 3 . 23 9 . 7
2 4 . 5
33 . rtoin
8.1 mole % H2O
'14.4 mole "/" H2O

9t2 MYSEN ET AL.: H2O
metasilicate melts. In those melts. chain units are thepredominant units, and the hydroxylated units canbe no more polymerized than that.
In summary, the Raman spectra of quenched hy-
drated melts with a three-dimensional network struc-ture show that nonbridging oxygens are formed in
addition to hydroxylated silicate units. In melts withnonbridging oxygen, the Raman spectra show an in-
crease in the degree of polymerization of the net-work. Water is bonded in the structure as both Si-
OH and complexes of the type M(OH)., where M is amodifying cation.
Applications
Water affects the melting relations of silicate min-
eral assemblages. Kushiro (1969) has shown, for ex-ample, that in the system CaO-MgO-SiOr-HrO thepyroxene-silicate mineral liquidus boundary shiftssignificantly toward the silica-rich portion of the sys-tem with the addition of HrO. This observation is un-derstandable in the light of the solubility mecha-nisms for water in highly polymerized melts whereX(T,O")/(XTOr) increases as a function of increasingwater content of the melt.o If it is assumed that therelative changes of concentration of the structuralunits in the melt can be approximated with the rela-tive changes of their activities (activity coefficient ra-tios are constant), the stability field of the most silica-rich mineral is reduced simply because X(TOr)/
tX(TOt + X(T,O6)] has decreased.The plagioclase stability field shrinks at the ex-
pense of pyroxene stability fields as HrO is added tonatural and synthetic andesite systems (e.g., Kushiro,1972; Eggler, 1972). These changes can also be di-rectly related to the increased importance of TrOuunits in the melts with increasing water content.
Partial melts from hydrous peridotite in the uppermantle are more siliceous than those from anhydrousperidotite (e.9., Kushiro et al., 1972; Mysen andBoettcher, 1975). Carmichael et al. (1974) explainedsuch observations by stating that the activity of silicain the hydrous partial melts is lower than in the an-hydrous partial melts. The reason for this lowering ofsilica activity is the lowering of X(TO')/[X(TO,) +X(TrOJl as water is added to the system.
Melt structure (bulk composition) aflects crystal-liquid partition coefficients (Watson, 1976, 1977;Hart and Davis, 1978; Mysen et al.,1979c). The most
a The notations X(TOr), X(TrO5) and X(T2O6), respectively, de-note proportions of melt units with a three-dimensional network,sheet, and chain structure. The T cation can be Sia*, Ti4*, P5*,(NaAl)a*, (thCaAl)a*, and (NaFe)a+.
IN SILICATE MELTS
important feature of the melt structure affecting the
partition coefficients is the ratio of nonbridging to
bridging oxygen in the melt. The crystal-liquid parti-
tion coefficients of both transition metals and rare
earth elements decrease with increasing NBO/T of
the melt (Mysen et al., 1979c). Solution of HrO in
highly polymerized melts (e.g., basalt, andesite and
granite) results in an increase of NBO/T. We sug-
gest, therefore, that crystal-liquid partition coeffi.-
cients will decrease with increasing water content. In
melts with a large value of NBO/T (e.g., picite,
komatiite, and basanite), it is likely that solution of
HrO results in decreased NBO/T. In such cases' the
relevant crystal-liquid partition coefficients (e.g., Ni
between olivine and melt) will increase with increas-
ing water content of the melt.Iron is likely to play a similar role in silicate melts
to aluminum (Seifert et al.,1979). That is, in hydrous
basaltic melts some ferric iron is a network modifier
and some is a network former. The proportion of fer-
ric iron in tetrahedral coordination will depend on
the water content of the melt. The activity of ferric
iron complexed in octahedral coordination in melts is
greater than when ferric iron is in tetrahedral coordi-
nation (Seifert et al.,1979; Mysen et al.,1979b). Con-
sequently, the stability fields of iron oxides on the
liquidi of hydrous basalt differ from those of an-
hydrous basaltic melts not only because water affects
the fugacity of hydrogen (e.g., Osborn, 1959), but
also because it affects the structural role of ferric iron
in the melt.Physical properties of sitcate melts (e.g., electrical
conductivity and viscosity) depend on their water
content (Lebedev and Khitarov, 19641, Shaw, 1963;
Kushiro, 1978; Kushito et al., 1976). In anhydrous
melts of basaltic and more acidic composition, NBO/
T is less than I (Bottinga and Weill, 1972; Scafie et
al., 1979; Mysen et al., 1979a). In such melts, the flow
units during viscous flow are SiOr-rich' three-dimen-
sional clusters (Mysen et al., 1979a)' The clusters are
bonded with T-O bonds, where the T cation is tet-
rahedrally coordinated Al3*, Tin*, and Fe3*. The vis-
cosity of such melts depends on the strength of the
T-O bond (e.g.,Taylor and Rindone, 1970). In melts
with NBO/T > l, the flow units are isolated SiOo tet-
rahedra and modifying cations (e.g., Bockris et al',
1955). The viscosity of such melts depends on the
number of oxygen bridges that must be broken to
form the flow units. Furthermore, only a portion of
the melt participates in the viscous flow at any given
time. In this case, the viscosity of a melt with a sheet
structure, for example, is greater than that of one
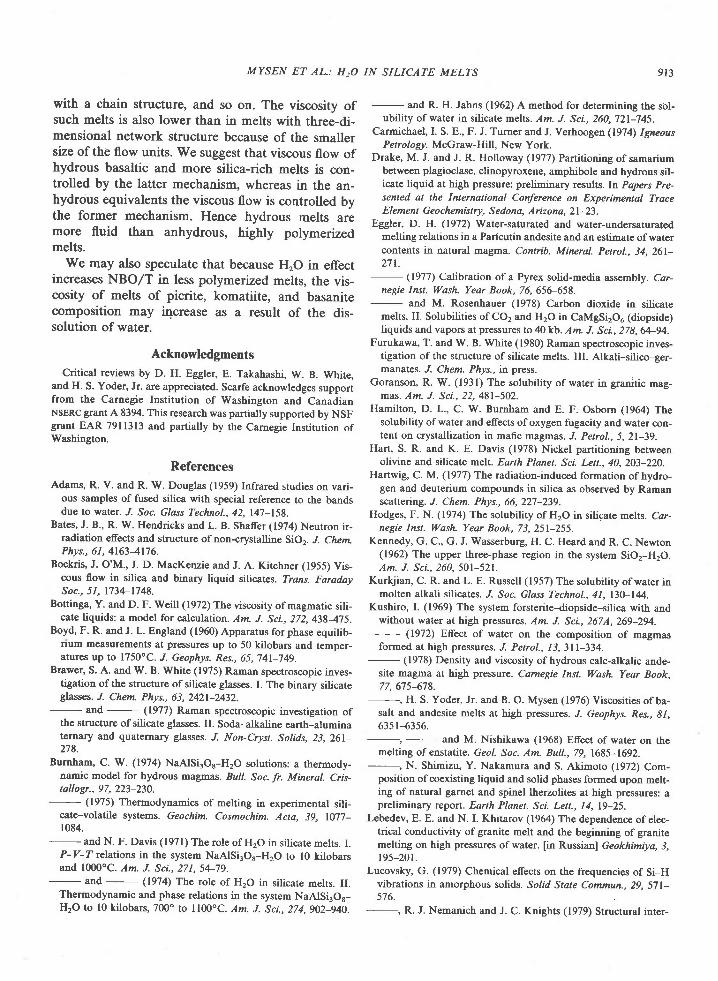
MYSEN ET AL.: H20 IN SILICATE MELTS 913
with a chain structure, and so on. The viscosity ofsuch melts is also lower than in melts with three-di-mensional network structure because of the smallersize of the flow units. We suggest that viscous flow ofhydrous basaltic and more silica-rich melts is con-trolled by the latter mechanism, whereas in the an-hydrous equivalents the viscous flow is controlled bythe former mechanism. Hence hydrous melts aremore fluid than anhydrous, highly polymerizedmelts.
We may also speculate that because HrO in effectincreases NBO/T in less polymerized melts, the vis-cosity of melts of picrite, komatiite, and basanitecomposition may increase as a result of the dis-solution of water.
AcknowledgmentsCritical reviews by D. H. Eggler, E. Takahashi, W. B. White,
and H. S. Yoder, Jr. are appreciated. Scarfe acknowledges supportfrom the Carnegie Institution of Washington and CanadianNSERc grant A 8394. This research was partially supported by NSFgrant EAR 79ll3l3 and partially by the Carnegie Institution ofWashington.
References
Adams, R. V. and R. W. Douglas (1959) Infrared studies on vari-ous samples of fused silica with special reference to the bandsdue to water. J. Soc. Glass Technol.,42,147-158.
Bates, J. B., R. W. Hendricks and L. B. Shafer (1974) Neutron ir-radiation effects and stnrcture of non-crystalline SiO2. J. Chem.Phys., 61, 41634176.
Bockris, J. O'M., J. D. MacKenzie and J. A. Kitchner (1955) Vis-cous flow in silica and binary liquid silicates. Trans. FaradaySoc., 51, 1734-1748.
3611inga, Y. and D. F. Weill (1972) The viscosity of magmatic sili-cate liquids: a model for calculation. Am. I. Sci., 272,4384l-5.
Boyd, F. R. and J. L. England (1960) Apparatus for phase equilib-num measurements at pressures up to 50 kilobars and temper-atures up to l750oc. J. Geophys. Res.,65,'l4l-749.
Brawer, S. A. and W. B. White (19?5) Raman spectroscopic inves-tigation ofthe structure ofsilicate glasses. L The binary silicateglasses.,/. Chem. Phys., 63, 2421-2432.
- and - (1977) Raman spectroscopic investigation ofthe structure of silicate glasses. IL Soda-alkatne eanh-aluminatemary and quaternary glasses. ,/. Non-Cryst. Solids, 23, 261-278.
Burnham, C. W. (1974) NaAlSirOs-HrO solutions: a thermody-namic model for hydrous magmas. Bull. Soc. fr. Mineral. Cris-tallogr., 97,223-230.
- (1975) Thermodynamics of melting in experimental sili-cate-volatile systems. Geochim. Cosmochim. Acta, 39, 107'l-t084.
- and N. F. Davis (1971) The role of H2O in silicate melts. I.P-V-T relations in the system NaAlSi3Or-H2O to l0 kilobarsand l000oC. Am. J. Sci., 271,54-'19.
- and - (1974) The role of H2O in silicate melts. ILThermodynamic and phase relations in the system NaAlSi3O6-H2O to l0 kilobars, 700o to I 100"C. Am. J. Sci., 274, 902-940.
- and R. H. Jahns (1962) A method for determining the sol-ubility of water in silicate melts. Am. J. ScL, 260,721-745.
Carmichael, L S. E., F. J. Turner and J. Verhoogen (1914) IgneousPetrologlt. McGraw-Hill, New York.
Drake, M. J. and J. R. Holloway (1977) Partitioning of samariumbetween plagioclase, clinopyroxene, amphibole and hydrous sil-icate liquid at high pressure: preliminary results. In Papers Pre-sented at the International Conference on Experimental TraceElement Geochemistry, Sedona, Arizona, 2l-23.
Eggler, D. H. (1972) Watef-saturated and water-undersaturatedmelting relations in a Paricutin andesite and an estimate of watercontents in natural magma. Contrib. Mineral. Petrol., 34, 261-271.
- (1977) Calibration of a Pyrex solid-media assembly. Car-negie Inst. Wash. Year Book,76,656-658.
- and M. Rosenhauer (1978) Carbon dioxide in silicatemelts. II. Solubilities of CO2 and HrO in CaMgSi2O6 (diopside)liquids and vapors at pressures to 40 kb. Am. J. Sci., 278,64-94.
Furukawa, T. and W. B. White (1980) Raman spectroscopic inves-tigation of the structure of silicate mel6. IIL Alkali-silico-ger-manates. J. Chem. Pftys., in press.
Goranson, R. W. (1931) The solubility of warer in granitic mag-mas. Am. J. Sci., 22,481-502.
Hamilton, D. L., C. W. Burnham and E. F. Osborn (1964) Thesolubility ofwater and efects ofoxygen fugacity and water con-tent on crystallization in mafic magmas. J. Petrol., 5,21-39.
Hart, S. R. and K. E. Davis (1978) Nickel partitioning betweenolivine and silicate melt. Earth Planet. Sci. Lett.,40,203-220.
Hartwig, C. M. (19'17) The radiation-induced formation of hydro-gen and deuterium compounds in silica as observed by Rarnanscattering. J. Chem. Phys., 66, 227-239.
Hodges, F. N. (1974) The solubility of H2O in silicare melts. Car-negie Inst. Wash. Year Book, 73,251-255.
Kennedy, G. C., G. J. Wasserburg, H. C. Heard and R. C. Newton(1962) The upper three-phase region in the system SiO2-H2O.Am. J. Sci., 260,501-521.
Kurkjian, C. R. and L. E. Russell (1957) The solubility of water inmolten alkali silicates. J. Soc. Glass Technol.,4I, l3O-144.
Kushiro, I. (1969) The system forsterite-diopside-silica with andwithout water at high pressures. Am. J. Sci., 267A,269-294.
- (1972) Effect of water on the composition of magmasformed at high pressures. J. Petrol., I3,3ll-334.
- (1978) Density and viscosity ofhydrous calc-alkalic ande-site magma at high pressure. Carnegie Inst. Wash. Year Book,77,675-678.
H. S. Yoder, Jr. and B. O. Mysen (1976) Viscosities of ba-salt and andesite melts at high pressures. J. Geophys. Res., 81,635 l -6356.
melting of enstatite. Geol. Soc. Am. Bull.,79, L685-1692.--, N. Shimizu, Y. Nakamura and S. Akimoto (1972) Com-
position of coexisting liquid and solid phases formed upon melt-ing of natural garnet and spinel lherzolites at high pressures: apreliminary report. Earth Planet. Sci. Leu., 14, 19-25.
Lebedev, E. E. and N. I. Khitarov (1964) The dependence ofelec-trical conductivity of granite melt and the beginning of granitemelting on high pressures of water. [in Russiari] Geokhimiya, 3,t95-20t.
Lucovsky, G. (1979) Chemical effects on the frequencies of Si-Hvibrations in amorphous solids. So/id State Commun., 29, 571-5't6.
9t4 MYSEN ET AL.: H2O IN SILICATE MELTS
pretation of the vibrational spectra of a-Si: H alloys. Pftys. Rev.
B.19.2064-2073.Mao, H. K., P. M. Bell and J. L. England (1971) Tensional errors
and drift of thermocouple electromotive force in the single-
stage, piston-cylinder apparatus. Carnegie Inst. Wash. Year
Book, 70, 281-287 .
Mysen, B. O. and A. L. Boettcher (1975) Melting of a hydrous
ihantle. II. Geochemistry of crystals and liquids formed by ana-
texis of mantle peridotite at high pressures and high temper-
atures as a function of controlled activities of water, hydrogen
and carbon dioxide. J. Petol., 16,549-590.
D. Virgo and C. M. Scarfe (1980) Relations b€tween the
anionic structure and viscosity of silicate melts: a Raman spec-
troscopic study at I atmosphere and at high pressure. Am. Min'
eral., 65,690-710.- and F. Seifert (1979a) Melt structures and redox
equilibria in the system CaO-MgO-FeO-Fe2O3-SiO2. Carnegie
Inst. lUash. Year Book, 78, 519-526._ and - (1979b) Influence of melt structure on
element partitioning between olivine and melt and between
clinopyroxene and melt at I atm Carnegie list. Wash. Year
Book, 78, 542-547.Nakamoto, K. (1978) Infrared and Raman Spectra of Inorganic
and Coordination Compounds,3d ed. Wiley, New York'
Orlova, G. P. (1964) The solubility of water in albite melts. 1nt.
Geol. Rev., 6,254-258.
Osborn, E. F. (t959) The role ofoxygen pressure in the crystalliza-
tion and differentiation of basaltic magma. Am. J. Sci., 257,
609447.Peri, J. B. (1966) Infrared study of OH and NH2 groups on the
surface of dry silica aerogel. J. Phys. Chem., 70,2937-2945.
Ryskin, Ya. I. (1974) The vibrations of protons in minerals: hy-
droxyl, water and ammonium. In V. C. Farmer, Ed., The In-
frared Spectra of Minerals, p. 137-183. Mineralogical Society,
London.Scarfe, C. M., B. O. Mysen and D. Virgo (1979) Changes in viscos-
ity and density of melts of sodium disilicate, sodium metasili-
cate and diopside composition with pressure' Carnegie Inst.
Wash. Year Book, 78, 547-551.
Seifert, F., D. Virgo and B. O. Mysen (1979) Melt structures and
redox equilibria in the system Na2O-FeO-Fe2O3-Al2O3-SiO2.
Carnegie Inst. llash. Year Rook,78,5ll-519.
Serna. C. J.. B. D. Velde and J. L. White (1977) Infrared evidence
of order-disorder in amesites. Am. Mineral., 62,296-303.
J. L. White and B. D. Velde (1979) The effect of alurni-
num on the infrared spectra of trioctahedral minerals. Mineral-
Mag., 43, 14l-148.Serratosa, J. M. and J. M. Vinas (1964) Infrared investigations of
the OH-band in chlorites. Nature, 202,999.
Sharma, S. K., D. Virgo and B. O. Mysen (1978) Structure of
glasses and melts of Na2O'xSiO2 (x : 1' 2' 3) composition
from Raman spectroscopy. Carnegie Inst. Wash. Year Book, 77,
6/;9452.Shaw, H. R. (1963) Obsidian-H2O viscosities at 1000 and 20ff)
bars in the temperature range 700" to 900oC. J' Geophys. Res.'
68,6337-6343.Stolen, R. H. and G. E. Walrafen (1976) Water and its relation to
broken bond defects in fused silica. J- Chem. Phys.' 64' 2623-
2631.Tarte, P. (1967) Infrared spectra ofinorganic aluminates and char-
acteristic vibrational frequencies of AlOa tetrahedra and A106
octahedra. Spectrochim. Acta, 2 3A, 2127 -2143.
Taylor, M. and G. E. Brown (1979) Structure of mineral glasses. I'
The feldspar glasses NaAlSi3O8, KAlSi3O8, CaAl2Si2Os. Geo-
chim. Cosmochim. Acta, 43, 6l-77 -Taylor, T. D. and G. E. Rindone (1970) Properties of soda alu-
minosilicate glasses. V. Low-temperature viscosities. J. Am- Ce-
ram. Soc., 53,692-695.Uys, J. M. and T. B. King (1963) The effect of basicity on the solu-
bility of water in silicate melts. Trans. Metall. Soc. AIME' 227'
492-500.Van der Steen, G. H. A. M. and H. Van den Boom (1977) Raman
study ofhydrogen-containing vitreous silica. "L Non'Cryst' Sol'
ids, 23,279-286.Velde, B. D. and I. Kushiro (1976) Infrared spectra ofhigh-pres-
sure quenched silicate liquids. Carnegie Inst. Wash. Year Book,
75.618-621.Virgo, D., B. O. Mysen and F. Seifert (1979a) Structures of
quenched melts in the system NaAlSiOa-CaMgSi2O6-Mg2SiOa-SiO2 at I atm. Carnegie Inst. Wash. Year Book, 78,
502-506.F. Seifert and B. O. Mysen (1979b) Three-dimensional
network structures of glasses in the systems CaAl2O4-SiO2'
NaAlO2-SiO2, NaFeO2-SiO2, and NaGaO2-SiO2 at I atm'
Carnegie Inst. Vlrash. Year Book,7& 506-511.Wasserburg, G. J. (1957) The efects of H2O in silicate systems. J.
Geol.,65, 15-23.Watson, E. B. (1976) Two-liquid partition coeffcients: experimen-
tal data and geochemical implications. Contib. Mineral. Petrol',
56. tl9-134.- (lg7':.) Partitioning of manganese between forsterite and
silicate tiquid. Geochim. Cosmochim. Acta' 4I' 1363-1374'
Yoder, H. S., Jr. (1969) Calc-alkalic andesites: experimental data
bearing on the origin of their assumed characteristics' In A' R'
McBirney, Ed., Proceedings of the Andesite Conference, Oreg'
Dep. Geol. Miner. Ind' Bull.,65,'17-89.- (1973) Contemporaneous basaltic and rhyolitic magmas.
Am. Mineral., 5& 153-171'Manuscript received, Octobet 9' 1979;
acceptedfor publication, May 28' 1980.
Experimental evidence at high pressure for potassic metasomatism in the mantle of theEarthl
American Mineralogist, Volume 65, pages 915-919, 1980
I. D. RyancHrKov
Institute of Geology of Ore Deposits35 Staromonetny
Moscow, I 090 I 7, U.,S. S.R.
AND A. L. BOPTTCTTBN
Institute of Geophysics and Planetary Physicsand Department of Earth and Space Sciences
University of Caltfornia, Los AngelesLos Angeles, California 90024
Abstract
To assess the concentration of potassium in aqueous fluids as a model for metasomatism ofthe mantle of the Earth, we experimentally determined the solubility of potassium in anaqueous vapor in equilibrium with phlogopite and other phases to pressures of 30 kbar atI100'C. The concentration of potassium (in grams of KrO per 100 g HrO) is 4 at I I kbat,7 at20 kbar, and25 at 30 kbar. Such values are sufficient to transfer from the interior ofthe Earthall of the KrO to the continental crust during formation of the hydrosphere by outgassing.However, it is likely that most of this transport was by silicate-rich liquids.
Introduction
A number of investigators have suggested that pri-mary alkaline magmas and particularly highly potas-sic melts are formed by partial melting of mantle ma-terial that was previously enriched in potassium andother components by precursory metasomatic proc-esses (Sobolev, 19771, Ryabchikov and Green, 1979;Lloyd and Bailey, 1975; Boettcher and O'Neil, 1980).The present work was designed to provide a quan-titative check on the possibility of such processes byexperimentally measuring KrO concentrations inaqueous vapors in equilibrium with phlogopite-bear-ing mineral assemblages typical of the mantle at highpressures and temperatures.
Earlier studies (Wendlandt. 1977:. Yoder andKushiro, 1969) revealed that subsolidus experimentsat 20 kbar for the composition joins phlogopite-Hroand phlogopite-Hro-CO, quenched to an assem-blage containing phlogopite plus forsterite. Thisdemonstrates that incongruent solubility of phlogo-
'Institute of Geophysics and PlanetaryNo. 1916.
0003-004x/80/09 l 0-09 r 5$02.00
pite in an aqueous vapor under these conditions issignificant and that KrO and AlrO, dissolve in the va-por in excess of that in phlogopite composition. Inthis work we extended the investigation of phlogo-pite-containing joins to higher HrO concentrationsand determined the HrO contents at various pres-sures where phlogopite became unstable, dissolvingentirely in the vapor, enabling us to determine KrOcontents of fluids in equilibrium with phlogopite, oli-vine, and some other phases typical of mantle assem-blages.
Experimental procedures
Starting materials
A mixture of oxides of anhydrous phlogopite com-position was prepared by sintering and partial melt-ing at about I100"C. Fired gels of pyrope and forste-r i te composit ions were added to anhydrousphlogopite powder for some of our experiments.
Experiments were perfonned in sealed platinumcapsules on mixtures of known proportions of silicatecomponents and water.
Physics Contribution
9 1 5

9 1 6 RYABCHIKOV AND BOETTCHER: POTASSIC METASOMATISM
Apparatus
All the experiments were in piston-cylinder appa-ratus similar to that described by Boyd and England(1960). The experimental method was described ear-lier (Allen and Boettcher, 1978).
Identification
After sealing, the capsules were folded in such away that the starting mixtures were contained in onehalf of each of the capsules. During the run, how-ever, the second half of each capsule was filled withvapor phase, which precipitated quench materialduring fast isobaric cooling at the end of an experi-ment (see Fig. l). Comparison of the material fromboth halves of the capsules was very useful for thedistinction of primary and quench phlogopite crys-tals.
The nature of quench material changed consid-erably with pressure. Between l0 and 14 kbar, it wasmainly an amorphous, glass-like phase formingspheres, rods, and coatings on primary crystals (Fig.2). At these pressures, quench phlogopite occurred inminor amounts as small (<5 pm), thin flakes.
At 20 kbar the proportion of quench phlogopitewas noticeably greater, forming large (>20 pm), thin
Fig. I Photomicrographs of products of run 33; (a) quench
vapor in folded part of capsule, (b) forsterite + quench vapor in
main part of capsule. Bars are 100 pm.
Fig. 2. Photomicrograph of quench vapor in products of run 26.Bar is 100 trrm.
plates with uneven extinction and some skeletal mor-
phology. The spheres of amorphous material weretypically situated along the growth figures of quenchphlogopite. At 30 kbar, large (700 trrm), euhedral (butthin) phtogopite plates were part of the quench mate-rial and were overgrown by irregular aggregates ofphlogopite and amorphous material (Fig. 2). Primaryphlogopites at all pressures were euhedral, relativelythick crystals (Fig. 3).
Olivines occurred in all our run products. Theywere typically euhedral, tabular grains whose aver-age size increased with increasing pressure, rangingfrom l0 pm at l0 kbar to 500x150 pm at 30 kbar.Some olivines contained fluid inclusions.
The run products for the join phlogopite-pyrope-water contained orthopyroxene and spinel in addi-tion to phlogopite and olivine.
Experimental results
The results of our experiments are summarized inTable l. Their interpretation is based on the follow-ing reasoning. In the runs in which the products didnot include primary phlogopite, all the KzO was in-corporated into the fluid phase, inasmuch as the co-
Fig. 3. Photomicrograph of thin plates of quench phlogopite
and other quench products in run 24. Bar is 200 pm.
(b)
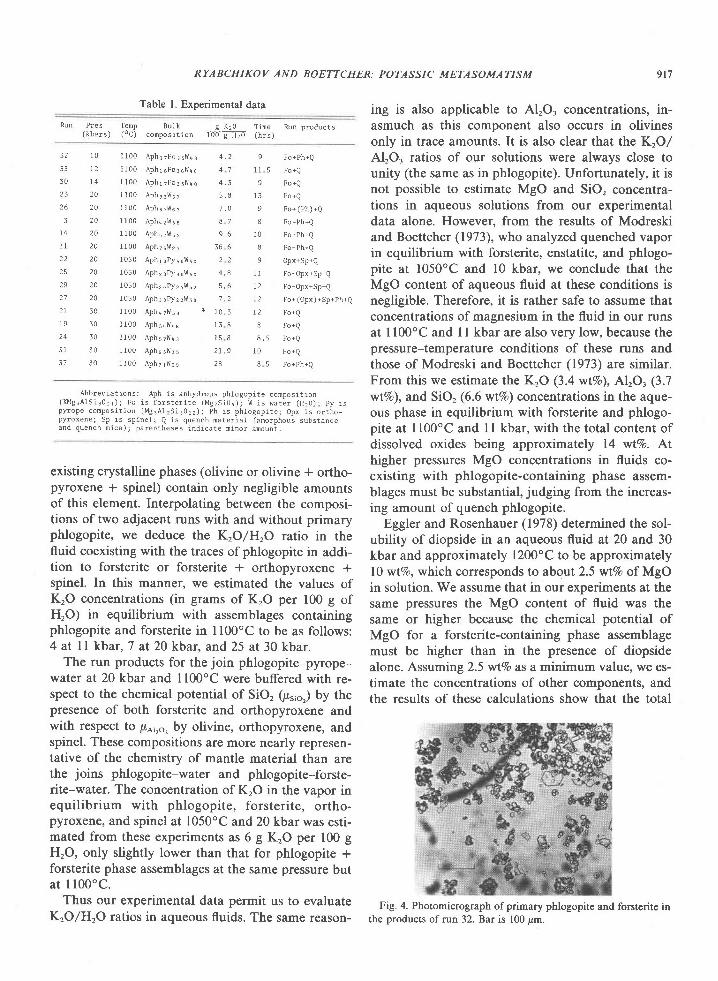
RYABCHIKOV AND BOETTCHER: POTASSIC METASOMATISM 917
3 2 1 0
3 3 1 2
3 0 1 4
2 6 2 0
3 2 0
1 4 2 0
l t 2 0
2 2 2 0
25 20
2 9 2 0
27 20
21 30
1 9 3 0
2 4 3 0
3 1 3 0
3 7 3 0
Table l. Experimental data
Run fres T:rp Bulk g K20 Tine Run products
(kbars) (oC) conposit ion T0O-g-Hzd (hrs)
1 1 0 0 A p h l T F o 3 5 l t l q e 4 - 2
1 1 0 0 A p h l 6 F o 3 5 l t J u u 4 7
1 1 0 0 A p h r r F o g s W r e 4 . 3
I l 0 0 A p h 3 3 W 6 7 5 . 8
1 1 0 0 A p h 3 7 W 5 3 7 - 0
1 1 0 0 A p h r z W s s 8 7
1 1 0 0 A p h q r l { s s 9 . 6
1 1 0 0 A p h 7 5 W 2 q 3 6 6
1 0 5 0 A p h l 6 P y q o W t o 2 2
1 0 5 0 A p h r o P y s o l \ J s o 4 . 8
1 0 5 0 A p h 2 a P y 2 q W s z 5 . 6
1 0 5 0 A p h : e P y z o | l l s o 7 . 2
1 1 0 0 A p h a T l { s 3 { 1 0 . 3
1 1 0 0 A p h 5 q W q 5 1 3 8
1 1 0 0 A p h s T W q 3 1 5 8
1 1 0 0 A p h 6 s l 4 3 s 2 l , 9
1 1 0 0 A p h z r W z g 2 8
ing is also applicable to AlrO, concentrations, in-asmuch as this component also occurs in olivinesonly in trace amounts. It is also clear that the KrOlAlrO. ratios of our solutions were always close tounity (the same as in phlogopite). Unfortunately, it isnot possible to estimate MgO and SiO, concentra-tions in aqueous solutions from our experimentaldata alone. However, from the results of Modreskiand Boettcher (1973), who analyzed quenched vaporin equilibrium with forsterite, enstatite, and phlogo-pite at 1050"C and l0 kbar, we conclude that theMgO content of aqueous fluid at these conditions isnegligible. Therefore, it is rather safe to assume thatconcentrations of magnesium in the fluid in our runsat I 100"C and I I kbar are also very low, because thepressure-temperature conditions of these runs andthose of Modreski and Boettcher (1973) are similar.From this we estimate the KrO (3.4 wt%o), AlrO3 (3.7wtVo), and SiO, (6.6 wtTo) concentrations in the aque-ous phase in equilibrium with forsterite and phlogo-pite at I100"C and I I kbar, with the total content ofdissolved oxides being approximately 14 wt%o. Athigher pressures MgO concentrations in fluids co-existing with phlogopite-containing phase assem-blages must be substantial, judging from the increas-ing amount of quench phlogopite.
Eggler and Rosenhauer (1978) determined the sol-ubility of diopside in an aqueous fluid at 20 and 30kbar and approximately 1200'C to be approximatelyl0 wtVo, which corresponds to about 2.5 wt%o of MgOin solution. We assume that in our experiments at thesame pressures the MgO content of fluid was thesame or higher because the chemical potential ofMgO for a forsterite-containing phase assemblagemust be higher than in the presence of diopsidealone. Assuming2.5 wt%o as a minimum value, we es-timate the concentrations of other components, andthe results of these calculations show that the total
Fig. 4. Photomicrograph of primary phlogopite and forsterite inthe products of run 32. Bar is 100 pm.
9 F o + P h + Q
1 1 5 r o * Q
9 Fo+Q
1 5 F o + q
9 Fo+ (Ph) +Q
8 F o + P h + Q
1 0 F o + P h + Q
8 Fo+Ph+Q
9 Opx+Sp+Q
11 Fo+opx+Sp+Q
).2 Fo+opx+Sp+Q
1 2 F o + ( o p x ) + S p + P h + Q
1 2 F o + Q
8 F o + Q
8 . s F o + Q
1 0 F o + q
8 5 F o + P h + Q
Abbreviat ions: Aph is anhydrous phlogopite conposit ion( l o , l g i A 1 S i 3 0 r r ) ; F o i s f o r s t e r i t e ( M g r s i 0 q . ) ; l { i s w a t e r ( H : 0 ) ; p y i sp l T o p e c o n p o s i t i o n ( M g 3 A 1 2 S i 3 0 r 2 ) ; P h i s p h l o g o p i t e ; o p x i s o r t h o -pyroxene; Sp is spinel; Q is quench nater ial (anorphous substancea n d q u e n c h n i c a ) ; p a r e n t h e s e s i n d i c a t e n i n o t a n o u n t .
existing crystalline phases (olivine or olivine * ortho-pyroxene * spinel) contain only negligible amountsof this element. Interpolating between the composi-tions of two adjacent runs with and without primaryphlogopite, we deduce the K,O/HrO ratio in thefluid coexisting with the traces of phlogopite in addi-tion to forsterite or forsterite * orthopyroxene +spinel. In this manner, we estimated the values ofKrO concentrations (in grams of KrO per 100 g ofHrO) in equilibrium with assemblages containingphlogopite and forsterite in ll00'C to be as follows:4 at ll kbar,7 at 20 kbar, and25 at 30 kbar.
The run products for thejoin phlogopite-pyrope-water at 20 kbar and I100'C were buffered with re-spect to the chemical potential of SiO, (F.,o,) by thepresence of both forsterite and orthopyroxene andwith respect to ftrer,o. by olivine, orthopyroxene, andspinel. These compositions are more nearly represen-tative of the chemistry of mantle material than arethe joins phlogopite-water and phlogopite-forste-rite-water. The concentration of KrO in the vapor inequil ibrium with phlogopite, forsterite, ortho-pyroxene, and spinel at 1050'C and 20 kbar was esti-mated from these experiments as 6 g KrO per 100 gHrO, only slightly lower than that for phlogopite +forsterite phase assemblages at the same pressure butat l l00"C.
Thus our experimental data permit us to evaluateKrO/HrO ratios in aqueous fluids. The same reason-
9 1 8 RYABCHIKOV AND BOETTCHER: POTASSIC METASOMATISM
contents of disSolved silicate components in aqueousfluids in equilibrium with phlogopite and forsterite atll00"C and pressures of20 and 30 kbar are about 25wIVo and 5O wt%o, respectively. It is clear that at 30kbar fluids in equilibrium with phlogopite-contain-ing phase assemblages are near critical conditions.
Table 2 illustrates that the proportion of solute inthe vapor is a function of pressure, ranging fromabout 14 wt%o at ll kbar to about 55 wt%o at 30 kbar.At 30 kbar, our vapors contain approximately 25 wtVodissolved solids. This is about twice the value for thesolubility of diopside in a vapor containing 95 wt%oHrO and 5 wtVo COr, determined by Eggler (1975).Experiments by Nakamura and Kushiro (1974) at 15kbar reveal that aqueous vapor coexisting with for-sterite and enstatite dissolves about 18 wt%o SiO, at1280"C and 22 wtVo SiO, at l3l0'C; the vapor co-existing with only enstatite contains up to 40 wt%oSiO, at 1280"C and 15 kbar.
Petrological applications
Our experimental data were obtained for composi-tions with HrO as the only volatile component. How-ever, vapors in the mantle contain other volatile spe-cies, and experiments have shown that addition ofcomponents such as CO, and H, that lower the fu-gacity of HrO will reduce the solubility of silicates inan aqueous vapor (for example, Shettel, 1973; Naka-mura, 1974). Comparison of P-Z coordinates forcontinental shield geotherms with the positions of va-por-phase isopleths for divariant assemblages corre-sponding to the following reactions (in the presence
of HrO and COr) shows that under these conditionsH'O/CO, values in vapors are high, particularly atdepths below those of the stability of amphibole:
2Fo * Di + 2CO2: Do * 4En;Fo * COr: Mc * En
(Newton and Sharp, 1975; Eggler, 1977; Wyll ie,r979)
Our results show that under these conditions fluidsmay be very effi.cient agents for transporting KrO.For example, temperatures of about 1050"C arereached under continental shields at depths of about130 km corresponding to pressures of 40 kbar, frortthe geotherm of Clark and Ringwood (1964). Extra-polation ofour results to l050oC and 40 kbar clearlyshows that the vapors in equilibrium with phlogopitewould contain in excess of 30 g KrO per 100 g ofHrO. If we accept l0 g KrO/100 g HrO as a con-servative estimate. and if we assume that all the wa-ter in the present hydrosphere was transferred from
the deep levels of the mantle of the Earth, then vapor
could have transported 1.4' 1021 g of KrO, which is
approximately the amount in the continental crust.
However, the shield geotherm intersects the perido-
tite-HrO solidus at about 100 km, and it is more
likely that much of the KrO was transported in a sili-
cate liquid.It may be noted that the high mobility of KrO-rich
fluids under conditions of continental shield geo-
therms is consistent with the fact that only on conti-nents do we find evidence for enrichment of mantle-
derived magmatic rocks that commonly bring to the
surface xenoliths of phlogopite-bearing ultramafic
rocks. Under the higher temperature conditions of
the deep oceanic lithosphere, vapor may have ahigher value of CO'/HrO if carbonates are unstable(Eggler, 1978). Mysen et al. (1978) have experimen-
tally investigated the mobility of H,O in peridotite
under mantle conditions. These preliminary results
do suggest that the rate of migration of H'O-rich
fluids is sufficiently rapid to permit mobilization of
KrO and other components. However, high mobility
of KrO in aqueous fluids is necessary but not suf-
ficient for intensive mantle metasomatism' There
must also exist certain mechanisms for fixation of
dissolved KrO. One obvious method to precipitate
KrO is to decrease the pressure and temperature of
the ascending vapor. The change in the COr/HrO ra-
tio of the vapor during ascent (Wyllie, 1979) would
also affect the solubility of KrO and other solutes.
Crystallization of amphiboles at depths of about 60
km would certainly increase CO,/H2O, and the KrO,
Al2O3, and other components previously dissolved in
the fluid would take part in metasomatic reactions.
Some KrO is fixed in the upper levpls of the mantle
at depths of about 50 km, as evidenced by metaso-
matism of lherzolite xenoliths in alkali basalts (Boett-
cher and O'Neil, 1980; Stewart and Boettchet, 1977;
Wilshire et al., 1980). However, the abundance ofphlogopite in kimberlites and in xenoliths in kimber-
lites suggests that considerable amounts of KrO re-
side at depths greater than 50 km.
Acknowledgments
This research was supported by NSF grant EAR78-16413 toALB. Chris West and Dave Klimberg provided valuable technical
assistance in the laboratory; Harriett Arnoff typed the manuscript.
The reviews by D. H. Eggler and B. O. Mysen are appreciated.
References
Allen, J. C. and A. L. Boettcher (1978) Amphiboles in andesitpsand basalt: II. Stability as a function of P-T-fr,o-fo,. An.
M ineral., 63, 107 4-1087.
RYABCHIKOV AND BOETTCHEK POTASSIC METASOMATISM 919
Boettcher, A. L. and J. R. O'Neil (1980) Stable isotope, chemical,and petrographic studies of high-pressure amphiboles andmicas: evidence for metasomatism in the mantle source regionsof alkali basalts and kimberlites. Am. J. Sci., in press.
Boyd, F. R. and J. L. England (1960) Apparatus for phase-equilib-rium measurements at pressures up to 50 kilobars and temper-atures up to 1750'C. J. Geophys. Res, 65,741-'148.
Clark, S. P. and A. E. Ringwood (1964) Density distribution andconstitution ofthe mantle. Rev. Geophys., 2,35-88-
Eggler, D. H. (1975) CO2 as a volatile component of the mantle:the system Mg2SiO.-SiO2-H2O-CO2. In L. H. Ahrens e/ a/.,Eds., Pftysr'cs and Chemistry of the Earth, I p. 869-881. per-gamon Press, New York.
- (1977) The principle ofthe zone ofinvariant vapor compo-sition: an example in the system CaO-MgO-SiO2-CO2-H2Oand implications for the mantle-solidus. Carnegie Inst. Wash.Year Book, 76,428435.
- (1978) Stability of dolomite in a hydrous manrle, with im-plications for the mantle solidus. Geolog7, 6,3974CfJ.
- and M. Rosenhauer (1978) Carbon dioxide in silicatemelts: II. Solubilities of CO2 and HrO in CaMgSirOu (diopside)liquids and vapors at pressures to 40 kb. Am. J. Sci., 278,64-94.
Lloyd, F. E. and D. K. Bailey (1975) Light element merasomatismof the continental mantle: the evidence and the consequenc€s.In L. H. Ahrens et aL, Eds., Physics and Chemistry of the Earth,9, p. 389-416. Pergamon Press, New York.
Modreski, P. J. and A. L. Boettcher (1973) Phase relationships ofphlogopite in the system KrO-MgO-CaO-AlrO3-SiOr-HrO to35 kilobars: a better model for micas in the interior of the Earth.Am. l. Sci., 273,385414,
Mysen, B. O., I. Kushiro and T. Fujii (1978) Preliminary experi-mental data bearing on the mobility of H2O in crystalline uppermanrle. Camegie Inst. Il'ash. Year Book, 77,791-797.
Nakamura, Y. (1974) The system SiO2-H2O-H2 at 15 kbar. Car-negie Inst. l[/ash. Year Book, 73,259-263.
- and I. Kushiro (1974) Composition of the gas phase inMg2SiOa-SiO2-HrO at 15 kbar. Carnegie Inst. Wash. YearBook, 73,255-258.
Newton, R. C. and W. E. Sharp (1975) Stability of forsterite +CO2 and its bearing on the role of CO2 in the mantle. EarthPlanet. Sci. Lett., 26,239-243.
Ryabchikov, I. D. and D. H. Green (1979) A study of the origin ofpotassic magmas. Contrib. Mineral. Petrol., \n ptess.
Shettel, D. L. (t973) Solubility of quartz in HrO-CO2 fluids at 5kb and 500'-900"C. EOS, 54,480.
Sobolev, N. V. (1977) Deep-seated inclusions in kimberlites andthe problem of the composition of the upper mattle. Am.Geophys. Unloz, Washington, D. C.
Stewart, D. C. and A. L. Boettcher (1977) Chemical gradients inmantle xenoliths (abstr.). Geol. Soe. Am. Abstracts wilh Pro-grams,9, ll9l-1192.
Wendlandt, R. F (1977) The system K2O-MgO-AI2O3-SiO2-H2O-CO2: stability of phlogopite as a function of vapor compo-sition and high pressures and temperatures. Carnegie Inst.Wash. Year Book, 76,441-448.
Wilshire, H. G., J. E. N. Pike, C. E. Meyer and E. C. Schwarzman(1980) Kaersutite veins in lherzolite xenoliths, Dish Hill andDeadman Lake, California. Am. J. Scrl, in press.
Wyllie, P. J. (1979) Magmas and volatile components. Am. Min-eral., 64,469-500.
Yoder, H. S., Jr. and I. Kushiro (1969) Melting of a hydrousphase: phlogopite. Am. J. Sci., 267-A,558-582.
Manuscript received, June 26, 1979;acceptedfor publication, March 3, 1980.

American Mineralogist, Volume 65, pages 920-930, 1980
Structure and elastic properties of quartz at pressure
LoUISE LnvrcN', CHenrBs T. PREwIr"r AND DoNALD J. WEIDNER
Department of Earth and Space SciencesState University of New York
Stony Brook, New York 11794
Abstract
Unit cells and crystal structures were determined on a single crystal of quartz at seven pres-
sures from I atm to 61.4 kbar. Unit-cell parameters are a:4'916(l) and c : 5.a054(4)A at Iatm, and a: 4.7O22(3) and c : 5.2561Q)A at 61.4 kbar. Structural changes observed overthis pressure range include a decrease in the Si-O-Si angle ftom 143.73(7)" to 134.2(l)"' adecrease in the average Si-O bond distance from 1.6092(7) to 1.605(l)A, and an increase indistortion ofthe silicate tetrahedron. Several O-O distances show very large changes (ll7a)that can be related to the unit-cell-edge compression. As pressure is increased, the geometry
of the SiO, (quartz) structure approaches that of the low-pressure GeO, (quartz) structure.The structural changes that take place with increased temperature are not the inverses of
those that occur with increased pressure; changes in the Si-O-Si angle and the tetrahedral tiltangle control thermal expansion, whereas smaller changes in the Si-O-Si angle and tetrahe-dral distortion control isothermal compression.
By constraining the zero-pressure bulk modulus to be equal to that calculated from acous-tic data [K, : 0.371(2) Mbar], the pressure derivative of the bulk modulus at Tnro pressure
tKi : 6.2(l)l has been calculated by fitting the P-V data to a Birch-Murnaghan equation ofstate. The anomalously low value of Poisson's ratio in quartz can be explai-ned by the low ra-tio of the off-diagonal shear moduli to the pure-shear moduli. This small ratio reflects the eas-ily expandin! or contracting spirals of tetrahedra that behave like coiled springs.
Introduction
The literature on the crystal structure and com-pressibility of quartz leaves many questions about itschanges with pressure. As high-pressure structuralreflnements have not been as precise as those per-formed under ambient conditions, these studies re-port large changes (e.g., the Si-O-Si interbondangle); however, subtle ones have not been pre-viously resolvable. Recent experimental develop-ments in our laboratory offer the potential of provid-ing improved resolution in high-pressure structuraldata.
The crystal structure of quartz at room temper-ature and pressure has been refined many times(Young and Post, 1962; Smith and Alexander, 1963;Zachariasen and Plettinger, 1965; Le Page and Don-nay, 1976; Jorgensen, 1978; d'Amour et al., 1979),
rPresent address: Division of Geological and Planetary Sci-
ences, California Institute of Technology, Pasadena" California
9rr25.
with the Young and Post and the Smith and Alexan-der papers reporting the first quality refinements ofpositional parameters and thermal ellipsoids. Zach-ariasen and Plettinger improved upon these studiesby applying a secondary-extinction correction totheir refinement. The Le Page and Donnay refine-ment again improved the R value; however, no cor-rections for crystal X-ray absorption or extinctionwere made. Both Jorgensen and d'Amour et al. col-lected intensity data for room-pressure structural re-finements with crystals already loaded in high-pres-sure cells; these refinements are of lower precisionthan the others.
Static-compressibility studies on quartz w€re firstcarried out by Adams and Williamson (1923) andBridgman (1925; 1928), and then greatly improvedby Bridgman (1948a,b; 1949) and others (McWhan,196'l;Yaidya et al.,1973; Olinger and Halleck,1976;Jorgensen, 1978; d'Amout et al., 1979). McWhanmeasured the compression of qtaftz in a modifiedBridgman-anvil apparatus with Guinier geometry
0003-004x/80/09 I 0-0920$02.00 920
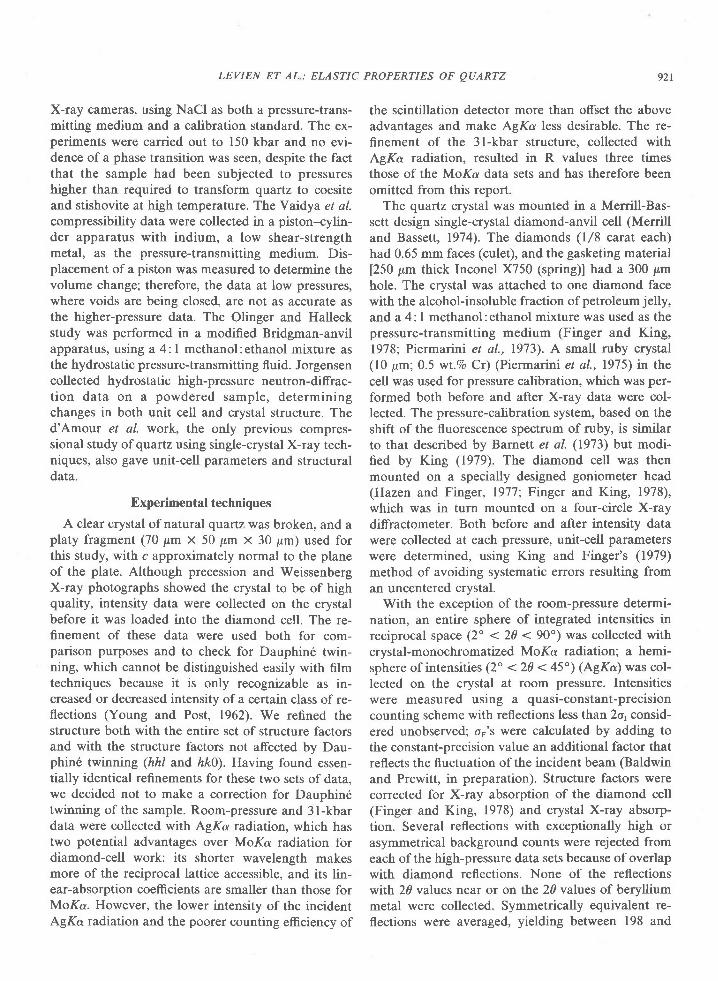
LEVIEN ET AL: ELASTIC PROPERTIES OF OUARTZ 92r
X-ray cameras, using NaCl as both a pressure-trans-mitting medium and a calibration standard. The ex-periments were carried out to 150 kbar and no evi-dence of a phase transition was seen, despite the factthat the sample had been subjected to pressureshigher than required to transform quartz to coesiteand stishovite at high temperature. The Yaidya et al.compressibility data were collected in a piston-cylin-der apparatus with indium, a low shear-strengthmetal, as the pressure-transmitting medium. Dis-placement of a piston was measured to determine thevolume change; therefore, the data at low pressures,where voids are being closed, are not as accurate asthe higher-pressure data. The Olinger and Halleckstudy was performed in a modified Bridgman-anvilapparatus, using a 4: I methanol:ethanol mixture asthe hydrostatic pressure-transmitting fluid. Jorgensencollected hydrostatic high-pressure neutron-diffrac-tion data on a powdered sample, determiningchanges in both unit cell and crystal structure. Thed'Amour et al. work, the only previous compres-sional study of quartz using single-crystal X-ray tech-niques, also gave unit-cell parameters and structuraldata.
Experimental techniques
A clear crystal of natural quartz was broken, and aplaty fragment (70 trrm x 50 pm x 30 pm) used forthis study, with c approximately normal to the planeof the plate. Although precession and WeissenbergX-ray photographs showed the crystal to be of highquality, intensity data were collected on the crystalbefore it was loaded into the diamond cell. The re-finement of these data were used both for com-parison purposes and to check for Dauphin6 twin-ning, which cannot be distinguished easily with filmtechniques because it is only recognizable as in-creased or decreased intensity ofa certain class of re-flections (Young and Post, 1962). We refined thestructure both with the entire set of structure factorsand with the structure factors not affected by Dau-phin6 twinning (hhl and hkD). Having found essen-tially identical refinements for these two sets of data,we decided not to make a correction for Dauphinetwinning of the sample. Room-pressure and 3l-kbardata were collected with AgrKa radiation, which hastwo potential advantages over MoKa radiation fordiamond-cell work: its shorter wavelength makesmore of the reciprocal lattice accessible, and its lin-ear-absorption coefficients are smaller than those forMoKa. However, the lower intensity of the incidentAgKa radiation and the poorer counting efficiency of
the scintillation detector more than offset the aboveadvantages and make AgKa less desirable. The re-finement of the 3l-kbar structure, collected withAgKc radiation, resulted in R values three timesthose of the MoKa data sets and has therefore beenomitted from this report.
The quartz crystal was mounted in a Merrill-Bas-sett design single-crystal diamond-anvil cell (Merrilland Bassett, 1974). The diamonds (l/8 carat each)had 0.65 mm faces (culet), and the gasketing material
[250 pm thick Inconel X750 (spring)] had a 300 pmhole. The crystal was attached to one diamond facewith the alcohol-insoluble fraction of petroleum jelly,
and a 4: I methanol: ethanol mixture was used as thepressure-transmitting medium (Finger and King,1978; Piermaini et al., 1973). A small ruby crystal(10 pm; 0.5 wt.Vo Cr) (Piermaini et al., 1975) in thecell was used for pressure calibration, which was per-formed both before and after X-ray data were col-lected. The pressure-calibration system, based on theshift of the fluorescence spectrum of ruby, is similarto that described by Barnett et al. (1973) but modi-fied by King (1979). The diamond cell was thenmounted on a specially designed goniometer head(Hazen and Finger, 1977; Firyer and King, 1978),which was in turn mounted on a four-circle X-raydiffractometer. Both before and after intensity datawere collected at each pressure, unit-cell parameterswere determined, using King and Finger's (1979)method of avoiding systematic errors resulting froman uncentered crystal.
With the exception of the room-pressure determi-nation, an entire sphere of integrated intensities inreciprocal space (2o < 20 < 90") was collected withcrystal-monochromatized MoKa radiation; a hemi-sphere of intensities (2" < 20 < 45') (AgKc) was col-lected on the crystal at room pressure. Intensitieswere measured using a quasi-constant-precisioncounting scheme with reflections less than2o, consid-ered unobserved; oo's were calculated by adding tothe constant-precision value an additional factor thatreflects the fluctuation of the incident beam (Baldwin
and Prewitt, in preparation). Structure factors werecorrected for X-ray absorption of the diamond cell(Finger and King, 1978) and crystal X-ray absorp-tion. Several reflections with exceptionally high orasymmetrical background counts were rejected fromeach ofthe high-pressure data sets because of overlapwith diamond reflections. None of the reflectionswith 20 values near or on the 2d values of berylliummetal were collected. Symmetrically equivalent re-flections were averaged, yielding between 198 and
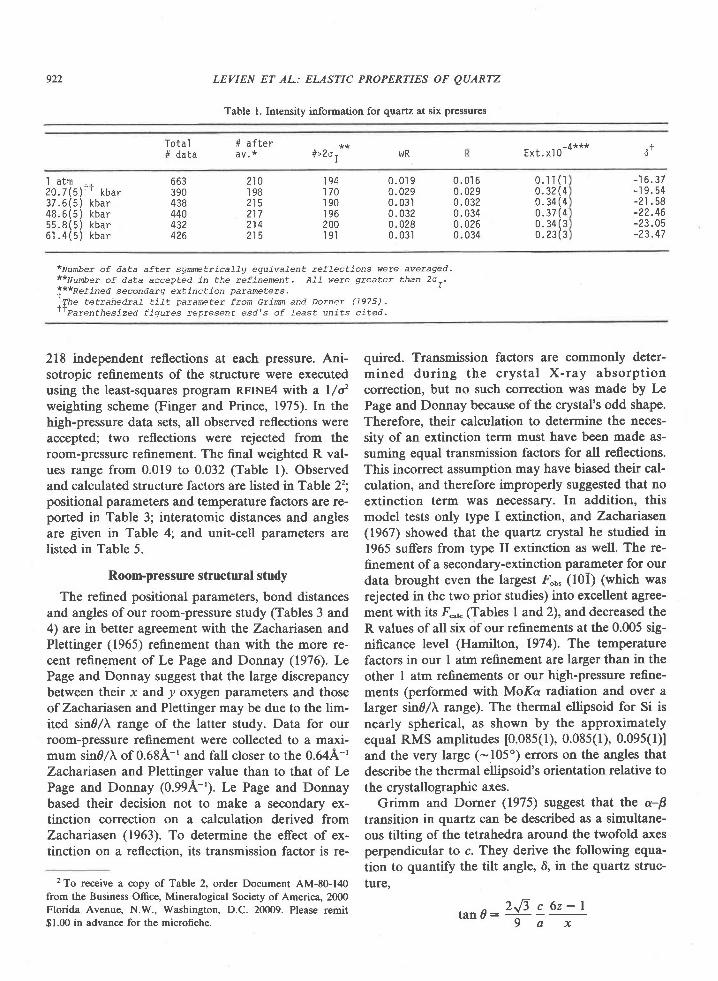
922 LEVIEN ET AL.: ELASTIC PROPERTIES OF QUARTZ
Table l. Intensity information for quartz at six pressures
Tota l# da ta
# after# r2o t wR Ext. xl o-4*** 6 f
'I atm
2 0 . 7 ( 5 ) r I k b a r3 7 . 6 ( 5 ) k b a r4 8 . 6 ( 5 ) k b a r5 5 . 8 ( 5 ) k b a r6 1 . 4 ( 5 ) k b a r
663390438440432426
210'I
AA
215217214215
1941 7 0'I 90
1 9 6200t 9 l
0 . 0 1 90.0290. 0310. 0320. 0280. 031
0 . 0 i 60.0290. 0320. 0340.0260. 034
0. r r ( r0 . 3 2 ( 40 . 3 4 ( 40 . 3 7 ( 40 . 3 4 ( 3o . 2 3 ( 3
-1 6 . 37- t 9 . 5 4-21 .58-22 .46-23 .05-23 .47
*Number of data af tet s7rctricaTTg equivalent ref Tections were averaged -**Number of data accepted in the refinerent. A77 were greater than 2o.-
!**Ref ined secondar7 ext inct ion parameter s.',The
tetrahedral t iLt pararetet from Grim and Dorner (1975).
"Parenthesized fiqures represent esd's of Teast units cited.
218 independent reflections at each pressure. Ani-sotropic refinements of the structure were executedusing the least-squares program RFINE4 witlt^ a l/dweighting scheme (Finger and Prince, 1975). In thehigh-pressure data sets, all observed reflections wereaccepted; two reflections were rejected from theroom-pressure refinement. The final weighted R val-ues range from 0.019 to 0.032 (Table l). Observedand calculated structure factors are listed in Table 2';positional parameters and temperature factors are re-ported in Table 3; interatomic distances and anglesare given in Table 4; and unit-cell parameters arelisted in Table 5.
Room-pressure structural study
The refined positional parameters, bond distancesand angles of our room-pressure study (Tables 3 and4) are in better agreement with the Zachaiasen andPlettinger (1965) refinement than with the more re-cent refinement of Le Page and Donnay (1976). LePage and Donnay suggest that the large discrepancybetween their x and y oxygen parameters and thoseof Zachariasen and Plettinger may be due to the lim-ited sindltr range of the latter study. Data for ourroom-pressure refinement were collected to a maxi-mum sin0ll of 0.684-' and fall closer to the 0.64A-'Zachaiasen and Plettinger value than to that of LePage and Donnay (0.99A-'). Le Page and Donnaybased their decision not to make a secondary ex-tinction correction on a calculation derived fromZachaiasen (1963). To determine the effect of ex-tinction on a reflection. its transmission factor is re-
2To receive a copy of Table 2, order Document AM-8Glzt0from the Business Office, Mineralogical Society of America, 2000Florida Avenue, N.W., Washington, D.C. 20009. Please remit$1.00 in advance for the microfiche.
quired. Transmission factors are commonly deter-mined during the crystal X-ray absorpt ioncorrection, but no such correction was made by LePage and Donnay because of the crystal's odd shape.Therefore, their calculation to determine the neces-sity of an extinction term must have been made as-suming equal transmission factors for all reflections.This incorrect assumption may have biased their cal-culation, and therefore improperly suggested that noextinction term was necessary. In addition, thismodel tests only type I extinction, and Zachariasen(1967) showed that the qvaftz crystal he studied in1965 suffers from type II extinction as well. The re-finement of a secondary-extinction parameter for ourdata brought even the largest 4b" (l0l) (which wasrejected in the two prior studies) into excellent agree-ment with its,(*," (Tables I and2), and decreased theR values of all six of our refinements at the 0.005 sig-nificance level (Hamilton, 1974). The temperaturefactors in our I atm reflnement are larger than in theother I atm refinements or our high-pressure refine-ments (performed with MoKa radiation and over alarger sindltr range). The thermal ellipsoid for Si isnearly spherical, as shown by the approximatelyequal RMS amplitudes [0.085(l), 0.085(l), 0.095(l)]and the very large (-105') errors on the angles thatdescribe the thermal ellipsoid's orientation relative tothe crystallographic axes.
Grimm and Dorner (1975) suggest that the c-Btransition in quartz can be described as a simultane-ous tilting of the tetrahedra around the twofold axesperpendicular to c. They derive the following equa-tion to quantify the tilt angle, 6, in the quartz struc-ture,
tano:* :T
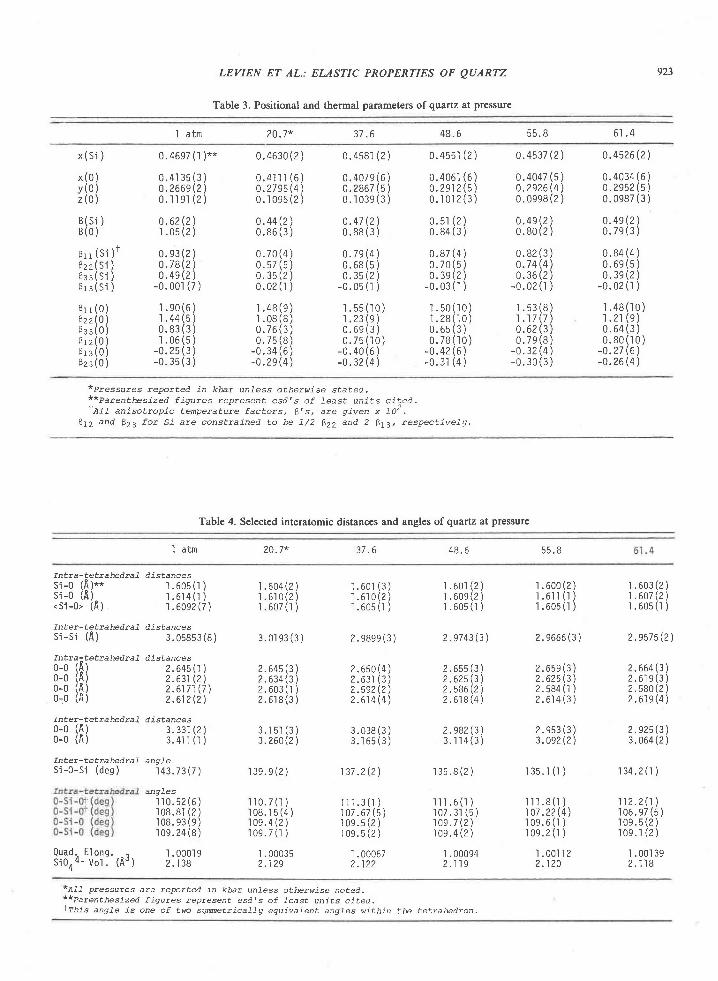
LEVIEN ET AL.: ELASTIC PROPERTIES OF QUARTZ
Table 3. Positional and thermal parameters ofquartz at pressure
92f
I atm 20.7* J / . O 48.6 5 5 . 8 6 t . 4
x ( 0 )y ( 0 )z ( 0 )
x ( s i ) 0 . 4 6 3 0 ( 2 )
0 . 4 i l r ( 6 )0 . 2 7 e 5 ( 4 )0 . 1 0 e 5 ( 2 )
0 . 4 4 ( 2 )0 . 8 6 ( 3 )
o . 458r (2 )
0 . 4 0 7 9 ( 6 )0 . 2 8 6 7 ( 5 )0 . 1 0 3 9 ( 3 )
0 . 4 7 ( ? )0 . 8 8 ( 3 )
0 . 7 e ( 4 )0 . 6 8 ( 5 )0 . 3 5 ( 2 )
- 0 . 0 5 ( r )
r . 5 5 ( r o )r . 2 3 ( s )o . 6 e ( 3 )0 . 7 s ( r 0 )
-0 . 4o (6 )-0 . 32 (4 )
0 .455 r (2 )
0 .4061 (6 )0 . 2 e 1 2 ( 5 )o . r o r 2 ( 3 )
o . 5 r ( 2 )0 . 8 4 ( 3 )
0 . 8 7 ( 4 )o . 7 o ( 5 )o . 3 e ( 2 )
- 0 . 0 3 ( r )
r . 5 0 ( r 0 )1 . 2 8 ( r o )0 . 6 5 ( 3 )0 . 7 8 ( r o )
-0.42 (6)-0 .3 r (4 )
0 . 4 5 3 7 ( 2 )
0 . 4 0 4 7 ( 5 )0 . 2 e 2 6 ( 4 )o. oees (2 )
0 . 4 e ( 2 )o . 8 0 ( 2 )
0 . 8 2 ( 3 )0 . 7 4 ( 4 )0 . 3 6 ( 2 )
- 0 . 0 2 ( r )
r . s 3 ( 8 )r . r 7 ( 7 )0 . 6 2 ( 3 )o . 7 e ( 8 )
-0 . 32 (4 )- 0 . 3 0 ( 3 )
0.4526(2)
0 .4034 (6 )o.2952(5)0 .0e87 (3 )
o . 4 e ( 2 )0 . 7 e ( 3 )
0 . 8 4 ( 4 )0 . 6 e ( 5 )o . 3 e ( 2 )
- 0 . 0 2 ( r )
r . 4 8 ( r o )r . 2 r ( e )0 . 6 4 ( 3 )0 . 8 0 ( r 0 )
-0.27 (6)-0 .26 (4 )
B (s i )B ( 0 )
s r r ( S i ) 'B z z ( s i )B a : ( S i )B r 3 ( s i )
B r r ( o )Bzz (0 )B a : ( o )B r z ( 0 )B r s ( 0 )Bzs (0 )
0 .4697 ( t ) * *
0 . 4 r 3 5 ( 3 )o.266e (2)0 . 1 ' t 9 t ( 2 )
0 . 6 2 ( 2 )r . 0 5 ( 2 )
0 . 9 3 ( 2 )o . i 8 ( 2 )0 . 4 e ( 2 )
- 0 . 0 0 r ( 7 )' r . eo (6 )r . 4 4 ( 5 )0 . 8 3 ( 3 )r . 0 6 ( 5 )
- 0 . 2 s ( 3 )- 0 . 3 5 ( 3 )
o . 7 o ( 4 )0 . 5 7 ( 5 )0 . 3 5 ( 2 )o . 0 2 ( r )
1 . 4 8 ( e )1 . 0 8 ( 8 )0 . 7 6 ( 3 )0 . 7 5 ( B )
- 0 . 3 4 ( 6 )-0 .2e (4 )
xPressures repotted in kbar unless otberwjse stated.* *Paten thes ized f igu tes rep tesent esd 's o f - leas t un i ts c j ted .JAfL an iso t rop ic tZnpera ture fac to rs , B 's , a re g iven x J02.
812 and 823 fo r S i a re cons t ra ined xo be 1 /2 822 and 2 $13, respec t ive lg .
Table 4. Selected interatomic distances and angles of quartz at pressure
I atm 20.7* 7 t , o 4 8 . 6 5 5 . 8
r . 6 0 r ( 3 )r . 6 r o ( 2 )r . 605 ( r )
Intra-tetzahedtaTsi -0 ( [1**s i -0 (A).S i - 0> (A )
d is tancesr . 6 0 5 ( r )r . 6 1 4 ( r )1 . 6 0 e 2 ( 7 )
dlstances3. 0s853 (8 )
distances2. 64s ( r )2 . 6 3 1 ( 2 )2 . 6 1 7 1 ( 7 )2 .612(2)
distances3. 33r (2 )3.4 i l ( t )
angTer 4 3 . 7 3 ( 7 )
anglesi l 0 . s2 (6 )r08 .8 r (2 )r 0 8 . e 3 ( e )r0e .24 (B )
. l . 000 ]92 . 1 3 8
r . 6 0 4 ( 2 )r . 6 1 0 ( 2 )r . 6 0 7 ( r )
3 . 0 r 9 3 ( 3 )
2. 645 (3 )2 . 634 (3 )2 . 6 0 3 ( r )2 . 6 r 8 ( 3 )
3 . 1 5 1 ( 3 )7 , A n ' l z \
l 3 e . e ( 2 )
r r 0 . 7 ( r )r 0 8 . r 5 ( 4 )r 0e .4 (2 )r o e . 7 ( r )
I .000352 .129
r . 6 0 r ( 2 )r . 6 o e ( 2 )r . 6 0 5 ( r )
2 . e 7 4 3 ( 3 )
2 . 6 5 5 ( 3 )z . o z 3 \ J lz . J 6 O \ Z l2.618(4)
2 .982(3)3 . i l 4 ( 3 )
r 3 5 . 8 ( 2 )
i l r . 6 ( r )r 0 7 . 3 r ( 5 )1 0 9 . 7 ( 2 )I 0 e . 4 ( 2 )
I . 000942 . 1 1 9
I .600 (2 )r .6 ' i l ( r )1 . 6 0 5 ( r )
z . v o o o \ J i
r . 6 0 3 ( 2 )1 . 6 0 7 ( 2 )r .60s (r )
2 Ac,7r , ( ) \
2 . 6 6 4 ( 3 )2 . 6 r e ( 3 )2 C R ( 2 \
2 . 6 1 9 ( 4 )
2 . e 2 5 ( 3 )3 . 0 6 4 ( 2 )
r 3 4 . 2 ( r )
1 1 2 . 2 ( 1 )r 0 6 . s 7 ( 5 )1 0 e . 5 ( 2 )r 0 e . r ( 2 )
I .00 ] 392 . i l 8
Inter-tetrahedtaJsi -s i (A)
Intrait\etrahedraJu-v \1 , /0-0 (A)0-0 (A)o-o (A)
Intet-tetrahedraJ0-0 (A)0-0 (A)
Intet- tetxahedral
si -0-si (deg )
Q u a d . E l o n q .s i 044 - \ / o l - (A r )
2 . e 8 e e ( 3 )
2 . 6 5 0 ( 4 )2 . 6 3 r ( 3 )2 c a 2 ( 2 \2 . 6 1 4 ( 4 )
3 . 0 3 8 ( 3 )3 . 1 6 5 ( 3 )
1 3 7 . 2 ( 2 )
i l r . 3 ( r )r 0 7 . 6 7 ( 5 )r 0 e . 5 ( 2 )r 0 9 . s ( 2 )
I . 000672 . 1 2 2
i l r . 8 0 )1 0 7 . 2 2 ( 4 )r o e . 6 ( r )1 0 e . 2 ( r )
' l . 0 0 1 1 2
2 . 1 2 0
2 . 6 5 e ( 3 )2 . 6 2 5 ( 3 )2 . s 8 4 ( 1 )2 . 6 1 4 ( 3 )
2 . e 5 3 ( 3 )1 i o r ( 2 \
1 3 5 . 1 ( t )
XAJJ, ptessutes ate retrDrted in kbar unless othetwise noted.**Parent.hesized f igures represent esdts of feast uni ts ci ted.lThis angle is one of Xwo sgwetr icalJg equivaTent angTes within the tetrahed\on.
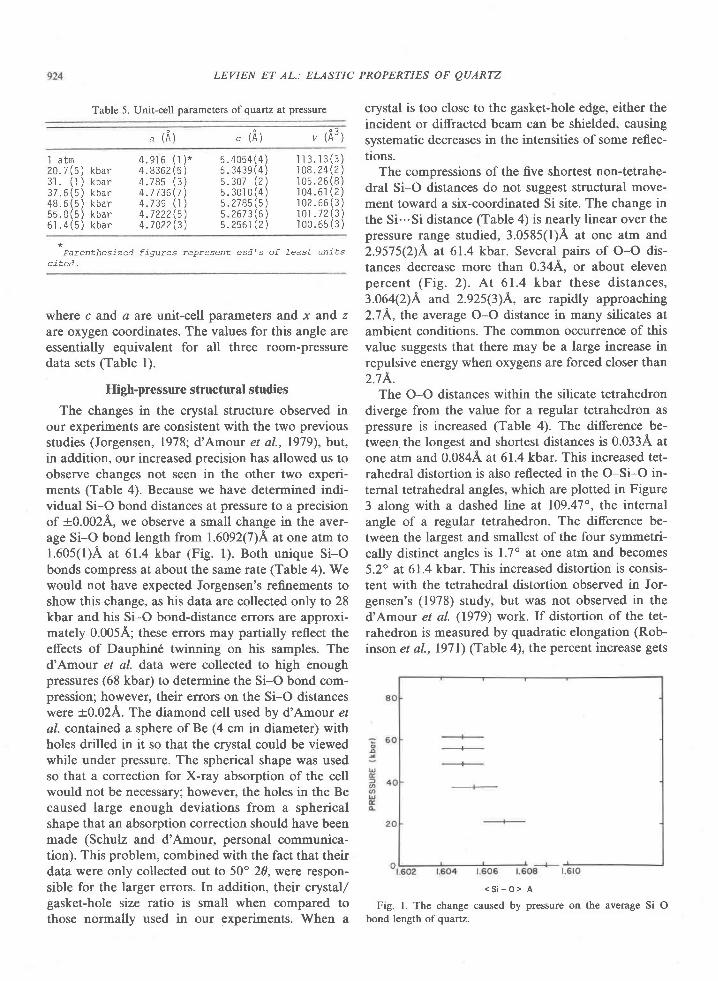
LEVIEN ET AL.: ELASTIC PROPERTIES OF OUARTZ
Table 5. Unit-cell parameters of quartz at pressur€ crystal is too close to the gasket-hole edge, either theincident or diffracted beam can be shielded, causingsystematic decreases in the intensities of some reflec-trons.
The compressions of the five shortest non-tetrahe-dral Si-O distances do not suggest structural move-ment toward a six-coordinated Si site. The change inthe Si...Si distance (Table 4) is nearly linear over thepressure range studied, 3.0585(l)A at one atm and2.9575Q)A at 61.4 kbar. Several pairs of O-O dis-tances decrease more than 0.344, or about elevenpercent (Fig. 2). At 61.4 kbar these distances,3.064(2)A and 2.925(3)A. are rapidly approaching2.7 A, ttre average O-O distance in many silicates atambient conditions. The common occurrence of thisvalue suggests that there may be a large increase inrepulsive energy when oxygens are forced closer than2.74.
The O-O distances within the silicate tetrahedrondiverge from the value for a regular tetrahedron aspressure is increased (Table 4). The difference be-tween. the longest and shortest distances is 0.033A atone atm and 0.084A aI6l.4 kbar. This increased tet-rahedral distortion is also reflected in the O-Si-O in-ternal tetrahedral angles, which are plotted in Figure3 along with a dashed line at 109.47", the internalangle of a regular tetrahedron. The difference be-tween the largest and smallest of the four symmetri-cally distinct angles is l.7o at one atm and becomes5.2" at 61.4 kbar. This increased distortion is consis-tent with the tetrahedral distortion observed in Jor-gensen's (1978) study, but was not observed in thed'Amour et al. (1919) work. If distortion of the tet-rahedron is measured by quadratic elongation (Rob-
inson et al., l97l) (Table 4), the percent increase gets
< s i - o > A
Fig. l. The change caused by pressure on the average Si-Obond length ofquartz.
u ( A )"
( A ) v ( A " )
I a tm2 0 . 7 ( 5 ) k b a r3 l . ( 1 ) k b a r3 7 . 6 ( 5 ) k b a r4 8 . 6 ( 5 ) k b a r5 5 . 8 ( 5 ) k b a r6 . l . 4 ( 5 ) k b a r
4 . 9 1 6 ( t ) "4 . 8 3 6 2 ( 5 )4 . 7 8 5 ( 3 )4 . 7 7 3 6 ( 7 )4 . 7 3 e ( 1 )r 7 2 2 2 ( c \4 . 7 0 2 2 ( 3 )
5 . 4 0 5 4 ( 4 )s . 3 4 3 e ( 4 )5 . 3 0 7 ( 2 )5 . 3 0 1 0 ( 4 )5 . 2 7 8 5 ( 5 )5 . 2 6 7 3 ( 6 )5 . 2 5 6 1 ( 2 )
' r 1 3 . 1 3 ( 3 )108 .24 (2 )1 0 s . 2 6 ( 8 )r 0 4 . 6 r ( 2 )r 0 2 . 6 6 ( 3 )r o r . 7 2 ( 3 )l o o . 6 5 ( 3 )
p A r a n f h a c i z q d f i n t t r e < r a n r a < a n f a c , 1 ' < o r t e a s t u n i t s
c i ted .
where c and a are unit-cell parameters and x and zare oxygen coordinates. The values for this angle areessentially equivalent for all three room-pressuredata sets (Table l).
High-pressure structural studies
The changes in the crystal structure observed inour experiments are consistent with the two previousstudies (Jorgensen, 1978; d'Amoar et al., 1979), but,in addition, our increased precision has allowed us toobserve changes not seen in the other two experi-ments (Table 4). Because we have determined indi-vidual Si-O bond distances at pressure to a precisionof -r0.002A, we observe a small change in the aver-age Si-O bond length from 1.6092Q)A at one atm to1.605(l)A at 61.4 kbar (Fig. l). Both unique Si-Obonds compress at about the same rate (Table 4). Wewould not have expected Jorgensen's refinements toshow this change, as his data are collected only to 28kbar and his Si-O bond-distance errors are approxi-mately 0.0054 these errors may partially reflect theeffects of Dauphin6 twinning on his samples. Thed'Amour et al. data were collected to high enoughpressures (68 kbar) to determine the Si-O bond com-pression; however, their errors on the Si-O distanceswere -r0.02A. The diamond cell used by d'Amour eta/. contained a sphere of Be (4 cm in diameter) withholes drilled in it so that the crystal could be viewedwhile under pressure. The spherical shape was usedso that a correction for X-ray absorption of the cellwould not be necessary; however, the holes in the Becaused large enough deviations from a sphericalshape that an absorption correction should have beenmade (Schulz and d'Amour, personal comrnunica-tion). This problem, combined with the fact that theirdata were only collected out to 50" 20, were respon-sible for the larger errors. In addition, their crystal/gasket-hole size ratio is small when compared tothose normally used in our experiments. When a

LEVIEN ET AL.: ELASTIC PROPERTIES OF QUARTZ
3 4 t i ( 1 )
OX-3 331(2) -
5 t
3 064 12)
(,
S I
L
o-oI
lrJ. , ( r- , =
.nU'trJEc
OUFBTZ 1 BTI l O U F I B T Z 6 1 . 1 I K B F B
Fig. 2. The effect of pressure on the cavities in the quartzstructur€. The Si-O-Si angle compresses from 143.'13" at I atm to134.2" at 61.4 kbar. The shonening of two long O-O interatomicdistances shown in this figure appears to be partially responsiblefor the differenc-e in compressibilities along the a and ccrystallographic directions.
larger at higher pressures (Fig. 4), r'.e., more dis-tortion takes place between 50 and 60 kbar than be-tween I atm and l0 kbar. Because a regular tetrahe-dron occupies the greatest volume for anytetrahedron of that averag€ size, as it distorts its vol-ume must decrease. Our experiments were not pre-cise enough to show the change in volume due to dis-tortion (Table 4), but we would predict that at higherpressure this volume change would become signifi-cant. The structural element responsible for theanomalously high compressibility of quartz is the Si-O-Si interbond angle, which decreases non-linearlyby ten degrees over the pressure range from I atm to6l kbar (Figs. 2 and 5). At higher pressures the Si-O-Si angle is responsible for less volume compres-sion; however, the atomic rearrangement that causes
rooo I ooo4 | oooS I ool2 l .0016
QUADRATIC ELONGATION
Fig. 4. Increase in tetrahedral distortion with pressure as
indicated by quadratic elongation. The curvature of the data
indicates that the amount ofdistortion per kbar is greater at higher
prssures than at Iower pressures
the tetrahedron to distort gradually accounts formore compresslon.
Finally, there is no significant change in the equiv-alent isotropic temperature factor or orientation ofthe thermal ellipsoid of Si with pressure; there maybe a small decrease in the size of the thermal ellip-soid of O (Table 3). The temperature factor for Sidoes become more anisotropic as pressure is in-creased (in our lowest-pressure run), which is consis-tent with the increased distortion of the tetrahedron.
Unit-cell and elasticity data
Pressure-volume data for quartz (McWhan, 1967;Vaidya et al., 1973; Olinger and Halleck,1976; Jor-
oE
UEfo@UG,o
O - S i - O A N G L E ( d r g )
Fig. 3. The pressure dependence of the four unique internaltetrahedral angles (O-Si-O).
- r52 t34 136 t38 r40 t42 t44
S i -O -S i ANGLE (dca )
Fig. 5. The pressure dependence of the flexible Si-O-Si angle.The curvature of the data indicates a tapering otr of the change inthis angle as pressure is increased.
I ooo I ooo4
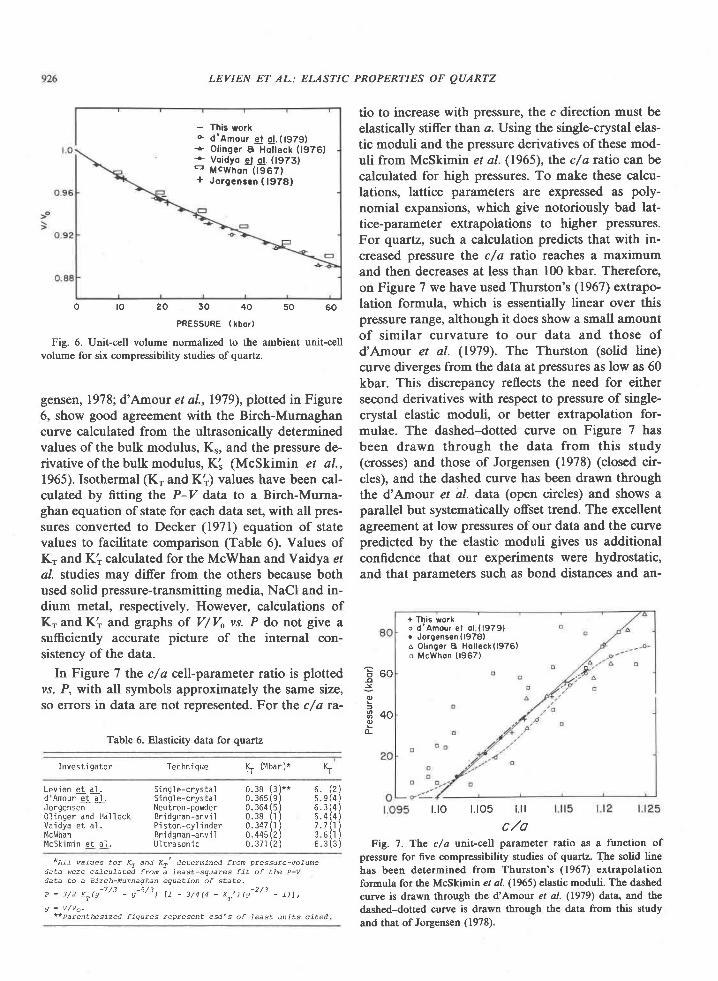
LEVIEN ET AL.: ELASTIC PROPERTIES OF QUARTZ
- This work+ d 'Amour et g l . ( t979)+ Ol inger I Hol leck ( t976)+ Voidyo d s!. (tg7g)q
McWhon (1967 )+ Jorgcnscn ( 1978)
o r o ? o 3 0 4 0 5 0 6 0
PRESSURE ( rbor)
Fig. 6. Unit-cell volume normalized to the ambient unit-cellvolume for six compressibility studies of quartz.
gensen, 1978; d'Amour et a1.,1979), plotted in Figure6, show good agreement with the Birch-Murnaghancurve calculated from the ultrasonically determinedvalues of the bulk modulus, K., and the pressure de-rivative of the buft modulus, K', (McSkimin et al.,1965). Isothermal (Kr and K;) values have been cal-culated by fitting the P-V data to a Birch-Murna-ghan equation of state for each data set, with all pres-sures converted to Decker (1971) equation of statevalues to facilitate comparison (Table 6). Values ofK-. and K'' calculated for the McWhan and Vaidya eta/. studies may differ from the others because bothused solid pressure-transmitting media, NaCl and in-dium metal, respectively. However, calculations ofKrandK', and graphs of V/Vo vs. P do not give asufficiently accurate picture of the internal con-sistency of the data.
In Figure 7 the c/a cell-parameter ratio is plottedvs. P, with all symbols approximately the same size,so errors in data are not represented. For the c/a ra-
Table 6. Elasticity data for quartz
l nves t i ga tor Techn i que q (Mbar)* \Lev ien qL qL . S ing le -c rys ta ld 'Amour q l l qL . S ing le -c rys ta lJorgensen Neutron-powder0 l i n g e r a n d H a l l e c k B r i d g m a n - a n v i lV a i d y a e t a ] . P i s t o n - c y l i n d e rMcUhan Br idgman-anv i lM c s k i m i n e t a l . U l t r a s o n i c
*Afl values fot KT and K? determineal from pressote-vofume
Uata were cafcufated f ton a feast-squates f i t of the P-Vdata to a Birch-Murnaghan equaXion of 6Xate.
- 7 / 1 - a / 1 - 2 / 1e = 3 / 2 K r ( g ' - t t - ' - )
l l - 3 / 4 ( 4 - K r ' ) ( u - ' - - 1 ) 1 ,
**Patenthesized f igures teptesent esd's of feast uni ts ci ted.
tio to increase with pressure, the c direction must beelastically stiffer than c. Using the single-crystal elas-tic moduli and the pressure derivatives of these mod-uli from McSkimin et al. (1965), the c/a ratio can becalculated for high pressures. To make these calcu-lations, lattice parameters are expressed as poly-nomial expansions, which give notoriously bad lat-tice-parameter extrapolations to higher pressures.For quartz, such a calculation predicts that with in-creased pressure the c/a ratio reaches a maximumand then decreases at less than 100 kbar. Therefore,on Figure 7 we have used Thurston's (1967) extrapo-lation formula, which is essentially linear over thispressure rrng€, although it does show a small amountof similar curvature to our data and those ofd'Arnour et al. (1979). The Thurston (solid line)curve diverges from the data at pressure.s as low as 60kbar. This discrepancy reflects the need for eithersecond derivatives with respect to pressure of single-crystal elastic modut, or better extrapolation for-mulae. The dashed-dotted curve on Figure 7 hasbeen drawn through the data from this study(crosses) and those of Jorgensen (1978) (closed cir-cles), and the dashed curve has been drawn throughthe d'Amour et al. data (open circles) and shows aparallel but systematically offset trend. The excellentagreement at low pressures of our data and the curvepredicted by the elastic moduli gives us additionalconfidence that our experiments were hydrostatic,and that parameters such as bond distances and an-
t . t os t . t l
c/aFig. 7. The c/a rnit-cell parameter ratio as a function of
pressure for five compressibility studies of quartz. The solid linehas been determined from Thurston's (1967) extrapolationfonnula for the McSkimn et al. (1965) elastic moduli. The dashedcuwe is drawn through the d'Amour et al. (1979) data, and thedashed-dotted curve is drawn through the data from this studyand that ofJorgensen (1978).
8 6 0o
of
3 4 0o(L
t . to
0 .38 (3 ) * * 6 . ( 2 )0 . 3 6 s ( s ) 5 . e ( 4 )0 . 3 6 4 ( 5 ) 6 . 3 ( 4 )0 . 3 8 ( t ) 5 . 4 ( 4 )0 . 3 4 7 ( r ) 7 . 7 ( 1 )0 . 4 4 s ( 2 ) 3 . 6 ( r )0 . 3 7 1 ( 2 ) 6 . 3 ( 3 )
+ This worko d 'Amour e l o l (19?9). Jorgensen(1978)a Ol inger A Ho l leck(1976)o McWhon (1967)
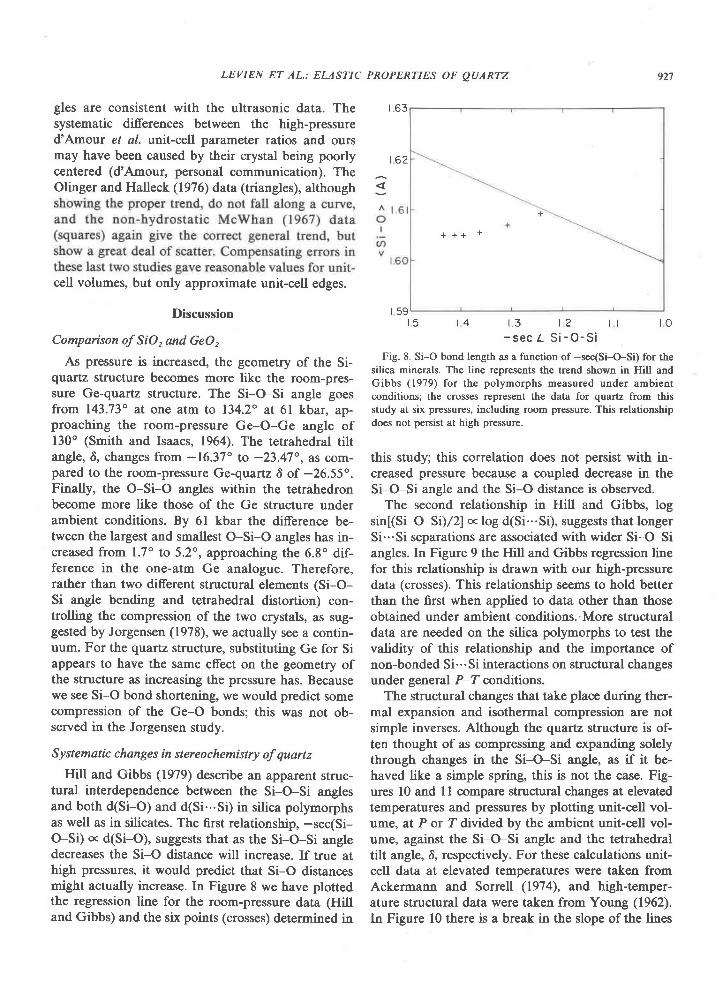
LEVIEN ET AL.: ELASTIC PROPERTIES OF QUARTZ
gles are consistent with the ultrasonic data. The | 63systematic differences between the high-pressured'Amour et al. unit-cnll parameter ratios and oursmay have been caused by their crystal being poorly | 62centered (d'Amour, personal communication). TheOlinger and Halleck (1976) data (triangles), although 3
cell volumes, but only approximate unit-cell edges.
+ + + ?
927
Discussion
Comparison of SiO, and GeO,
As pressure is increased, the geometry of the Si-quartz structure becomes more like the room-pres-sure Ge-quartz structure. The Si-O-Si angle goesfrom 143.73o at one atm to 134.2" at 6l kbar, ap-proaching the room-pressure Ge-O-Ge angle of130' (Smith and Isaacs, 1964). The tetrahedral tiltangle, 6, changes from -16.37" to -23.47", as com-pared to the room-pressure Ge-quartz 6 of -26.55'.Finally, the O-Si-O angles within the tetrahedronbecome more like those of the Ge structure underambient conditions. By 6l kbar the difference be-tween the largest and smallest O-Si-O angles has in-creased from 1.7" to 5.2", approaching the 6.8" dif-ference in the one-atm Ge analogue. Therefore,rather than two different structural elements (Si-O-Si angle bending and tetrahedral distortion) con-tlslling the compression of the two crystals, as sug-gested by Jorgensen (1978), we actually see a contin-uum. For the quartz structure, substituting Ge for Siappears to have the same effect on the geometry ofthe structure as increasing the pressure has. Becausewe see Si-O bond shortening, we would predict somecompression of the Ge-O bonds; this was not ob-served in the Jorgensen study.
Systematic changes in stereochemistry of quartz
Hill and Gibbs (1979) describe an apparent struc-tural interdependence between the Si-O-Si anglesand both d(Si-O) and d(Si...Si) in silica polymorphsas well as in silicates. The flrst relation5hiF, -sec(Si-O-Si) c d(Si-O), suggests that as the Si-O-Si angledecreases the Si-O distance will increase. If true athigh pressures, it would predict that Si-O distancesmight actually increase. In Figure 8 we have plottedthe regression line for the room-pressure data (Hilland Gibbs) and the six points (crosses) determined in
t 5 t 4 t 3 1 2 | t o- sec L s i -o -s i
Fig. 8. Si-O bond length as a function of-sec(Si-O-Si) for thesilica minerals. The line represents the trend shown in Hill andGibbs (1979) for the polymorphs measured under ambientconditions; the crosses represent the data for quartz from thisstudy at six pressures, including room pressure. This relationshipdoes not persist at high pressure.
this study this correlation does not persist with in-creased pressure because a coupled decrease in theSi-O-Si angle and the Si-O distance is observed.
The second relationship in Hill and Gibbs, logsin[(Si-O-Si)/2ln log d(Si...Si), suggests that longerSi...Si separations are associated with wider Si-O-Siangles. In Figure 9 the Hill and Gibbs regression linefor this relationship is drawn with our high-pressuredata (crosses). This relationship seems to hold betterthan the first when applied to data other than thoseobtained under ambient conditions..More structuraldata are needed on the silica polymorphs to test thevalidity of this relationship and the importance ofnon-bonded Si...Si interactions on structural changesunder general P-T conditions.
The structural changes that take place during ther-mal expansion and isothermal compression are notsimple inverses. Although the quartz structure is of-ten thought of as compressing and expanding solelythrough changes in the Si-O-Si angle, as if it be-haved like a simple spring, this is not the casc. Fig-ures l0 and I I compare structural changes at elevatedtemperatures and pressures by plotting unit-cell vol-ume, at P or T divided by the ambient unit-cell vol-ume, against the Si-O-Si angle and the tetrahedraltilt angle, 6, respectively. For these calculations unit-cell data at elevated temperatures were taken fromAckermann and Sorrell (1974), and high-temper-ature structural dzta were taken from Young (1962).ln Figure l0 there is a break in the slope of the lines
r 5 9
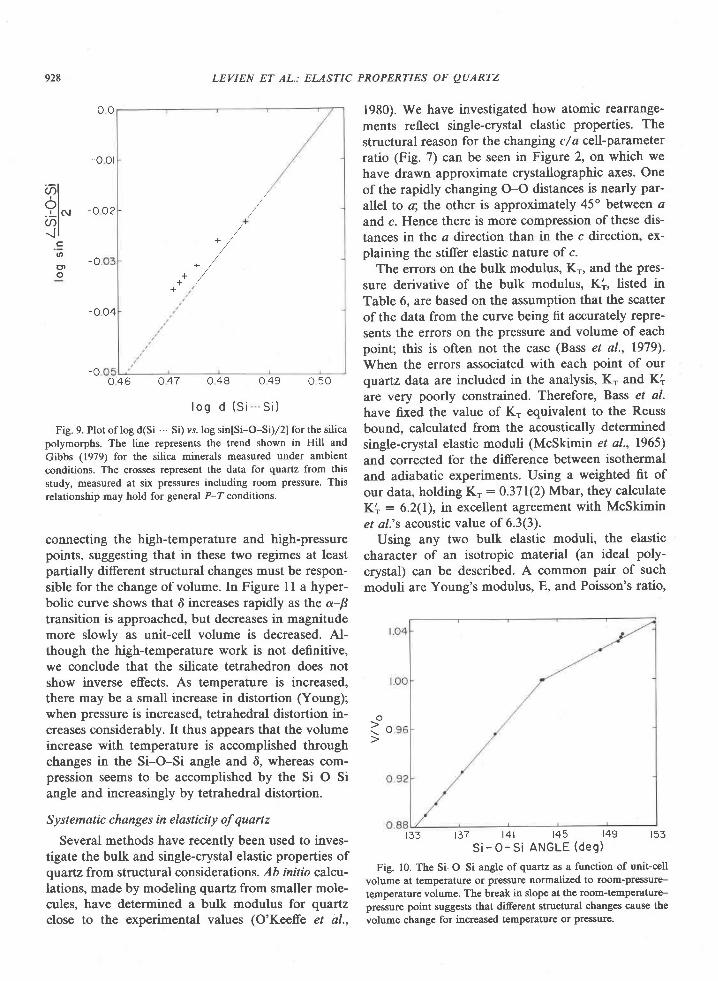
928 LEVIEN ET AL.: ELASTIC PROPERTIES OF QUARTZ
oo
-o o l
-o 02
+T
f
/
1980). We have investigated how atomic rearrange-ments reflect single-crystal elastic propefties. Thestructural reason for the changing c/a cell'parameterratio (Fig. 7) can be seen in Figure 2, on which wehave drawn approximate crystallographic axes. Oneof the rapidly changing O-O distances is nearly par-allel to a; the other is approximately 45o between aand c. Hence there is more compression of these dis-tances in the a direction than in the c direction, ex-plaining the stiffer elastic nature of c.
The errors on the bulk modulus, K', and the pres-sure derivative of the bulk modulus, Ki, listed inTable 6, are based on the assumption that the scatterofthe data from the curve being fit accurately repre-sents the errors on the pressure and volume of eachpoint; this is often not the case (Bass et al., 1979).When the errors associated with each point of ourquartz data are included in the analysis, K' and Kiare very poorly constrained. Therefore, Bass et al.have fixed the value of K' equivalent to the Reussbound, calculated from the acoustically determinedsingle-crystal elastic moduli (McSkimin et al., 1965)and corrected for the difference between isothermaland adiabatic experiments. Using a weighted fit ofour data, holding K': 0.371(2) Mbar, they calculateKi : 6.2(l), in excellent agreement with McSkiminet al.'s acoustic value of 6.3(3).
Using any two bulk elastic moduli, the elasticcharacter of an isotropic material (an ideal poly-crystal) can be described. A common pair of suchmoduli are Young's modulus, E, and Poisson's ratio'
133 137 l4 l 145 r49 t53S i - O - S i A N G L E ( d e g )
Fig. 10. The Si-O-Si angle of quartz as a function of unit-cellvolume at temperatur€ or pressure normalized to room-pressure-temperature volume. The break in slope at the room-temperature-pressure point suggests that different structural changes cause thevolume change for increased temperature or pressure.
?lol.l-lc\l
3l;Ctro
-o
-o 04
0 4 6 0 4 7 0 4 8 0 4 9 0 5 0
l o g d ( S i S i )
Fig. 9. Plot of log d(Si ... Si) vs. log sin[Si-O-SD/2] for the silica
polymorphs. The line represents the trend shown in Hill and
Gibbs (1979) for the silica minerals measured under ambient
conditions. The crosses represent the data for quartz from this
study, measured at six pressures including room pressure. This
relationship may hold for general P-Zconditions.
connecting the high-temperature and high-pressurepoints, suggesting that in these two regimes at leastpartially different structural changes must be respon-sible for the change of volume. In Figure I I a hyper-bolic curve shows that 6 increases rapidly as the c-Btransition is approached, but decreases in magnitudemore slowly as unit-cell volume is decreased. Al-though the high-temperature work is not definitive,we conclude that the silicate tetrahedron does notshow inverse effects. As temperature is increased,there may be a small increase in distortion (Young);when pressure is increased, tetrahedral distortion in-creases considerably. [t thus appears that the volumeincrease with temperature is accomplished throughchanges in the Si-O-Si angle and 6, whereas com-pression seems to be accomplished by the Si-O-Siangle and increasingly by tetrahedral distortion.
Systematic changes in elasticity of quartz
Several methods have recently been used to inves-tigate the bulk and single-crystal elastic properties ofqvartz from structural considerations. lb initio calcu-lations, made by modeling qtartz from smaller mole-cules, have determined a bulk modulus for quartzclose to the experimental values (O'Keeffe et al.,
o> ^
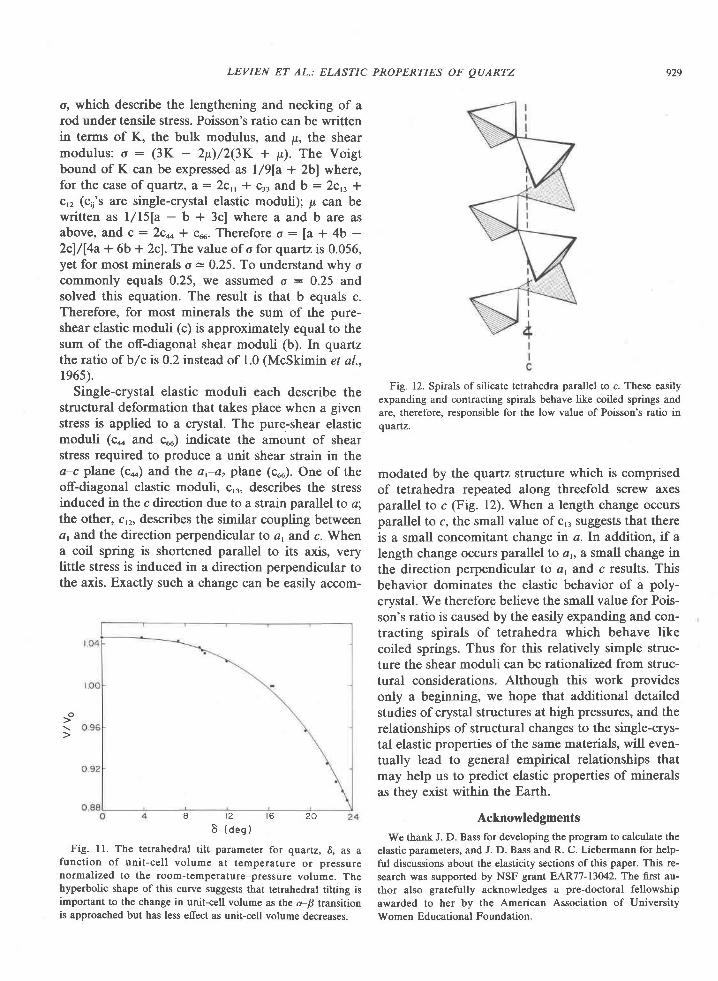
o, which describe the lengthening and necking of arod under tensile stress. Poisson's ratio can be writtenin terms of K, the bulk modulus, and p, the shearmodulus: o : (3K - 2p,)/2(3K + p). The Voigtbound of K can be expressed as l/9la + 2bl where,for the case of quartz, a : 2c,, + ca3 and b : 2cr, Ic,, (cu's are single-crystal elastic moduli); p can bewritten as l/llla - b + 3cl where a and b are asabove, and c : 2c* * cuu. Therefore o: [a + 4b -2cl/l4a + 6b + 2cl. The value of o for quartz is 0.056,yet for most minerals o = 0.25. To understand why ocommonly equals 0.25, we assumed o : 0.25 andsolved this equation. The result is that b equals c.Therefore, for most minerals the sum of the pure-shear elastic moduli (c) is approximately equal to thesum of the off-diagonal shear moduli (b). In quaftzthe ratio of b/c is 0.2 instead of 1.0 (McSkimin et al.,1965).
Single-crystal elastic moduli each describe thestructural deformation that takes place when a givenstress is applied to a crystal. The pure-shear elasticmoduli (c* and cuu) indicate the amount of shearstress required to produce a unit shear strain in thea-c plane (c*) and thLe a,-a2 plane (cuu). One of theoff-diagonal elastic moduli, c,r, describes the stressinduced in the c direction due to a strain parallel to a;the other, c,r, describes the similar coupling betweena, arrd the direction perpendicular to a, and c. Whena coil spring is shortened parallel to its axis, verylittle stress is induced in a direction perpendicular tothe axis. Exactly such a change can be easily accom-
Fig. ll. Th€ tetrahedral tilt parameter for quartz,6, as afunction of unit-cell volume at temperature or pressurenormalized to the room-temperature-pressure volume. Thehyperbolic shape of this curve suggests that tetrahedral tilting isimportant to the change in unit-cell volume as the c-F transitionis approached but has less effect as unit-cell volume decreases.
929
Fig. 12. Spirals of silicate tetrahedra parallel to c. These easily
expanding and contracting spirals behave like coiled springs andare, therefore, responsible for the low value of Poisson's ratio inquartz.
modated by the quartz structure which is comprisedof tetrahedra repeated along threefold screw axesparallel to c (Fig. l2). When a length change occursparallel to c, the small value of cr3 suggests that thereis a small concomitant change in a. In addition, if alength change occurs parallel to ab L small change inthe direction perpendicular to at and c results. Thisbehavior dominates the elastic behavior of a poly-
crysta[. We therefore believe the small value for Pois-son's ratio is caused by the easily expanding and con-tracting spirals of tetrahedra which behave likecoiled springs. Thus for this relatively simple struc-ture the shear moduli can be rationalized from struc-tural considerations. Although this work providesonly a beginning, we hope that additional detailedstudies of crystal structures at high pressures, and therelationships of structural changes to the single-crys-tal elastic properties of the same materials, will even-tually lead to general empirical relationships thatmay help us to predict elastic properties of mineralsas they exist within the Earth.
Acknowledgments
We thank J. D. Bass for developing the program to calculate the
elastic parameters, and J. D. Bass and R. C. Liebermann for help-
ful discussions about the elasticity sections of this paper. This re-
search was supported by NSF grant EAR77-11O42. The first au-
thor also gratefully acknowledges a pre-doctoral fellowship
awarded to her by the American Association of University'Women
Educational Foundation.
LEVIEN ET AL.: ELASTIC PROPERTIES OF QUARTZ
o
a t 2 t 6 2 0
8 ( d e s )
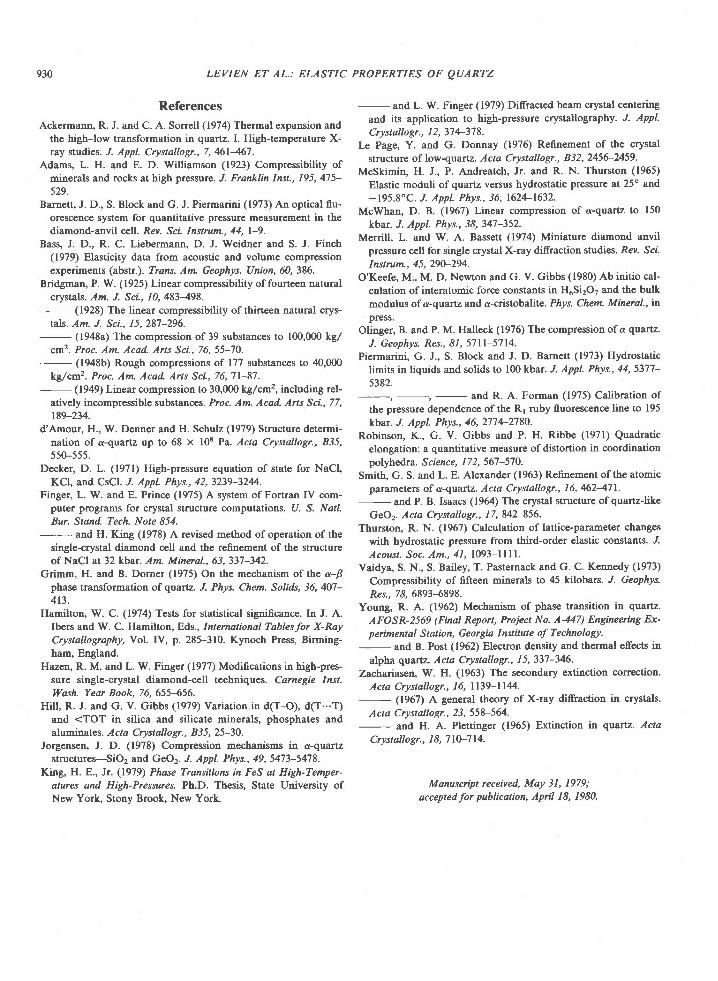
930 LEVIEN ET AL.: ELASTIC PROPERTIES OF QUARTZ
References
Ackermann, R. J. and C. A. Sorrell (1974) Thermal expansion andthe high-low transformation in quartz. I. High-temperature X-ray studies. J. Appl. Crystallogr., 7,461467.
Adams, L. H. and E. D. Williamson (1923) Compressibility ofminerals and rocks at high pressure. J. Franklin Inst., 195,475-529.
Barnett, J. D., S. Block and G. J. Piermarini (1973) An optical flu-orescen@ system for quantitative pressure measurement in thediamond-anvil cell. Rev. Sci Instrum.,44, l-9.
Bass, J. D., R. C. Liebermann, D. J. Weidner and S. J. Finch(1979) Elasticity data from acoustic and volume compressionexperiments (abstr.). Trans. Am. Geophys. Union, 60,386.
Bridgman, P. W. (1925) Linear compressibility of fourteen naturalcrystals. Am. J. Sci., 10,483498.
- (1928) The linear compressibility of thirteen natural crys-tals. Am. J. Sci., 15,287-296.
- (1948a) The compression of 39 substances to 100,000 kg,/cm2. Proc. Am. Acad. Arts Sci.,76, 55-70.
- (1948b) Rough compressions of 177 substances to 40,000kg/cm2. Proc. Am. Acad. Arts Sci., 76,71-87.
- (1949) Linear compression to 30,000 kglcm2, including rel-atively incompressible substances. Proc. Am. Acad. Arts Sci.,77,189-234.
d'Amour, H., W. Denner and H. Schulz (1979) Structure determi-nation of d-quartz up to 68 x 108 Pa. Acla Crystallogr., B35,550-555.
Decker, D. L. (1971) High-pressure equation of state for NaCl,KCl, and CsCl. .L Appl. Phys., 42,3219-3244.
Finger, L. W. and E. Princc (1975) A system of Fortran IV com-puter programs for crystal structure computations. U. S. Natl.Bur. Stand. Tech. Note 854.
- and H. King (1978) A revised method of operation of thesingle-crystal diamond cell and the refinement of the structureof NaCl at 32 kbar. Am. Mineral., 63,337-342.
Grimrn, H. and B. Domer (1975) On the mechanism of the a-Bphase transformation of quartz. J. Phys. Chem. Solids, 36,4O7-4t3.
Hamilton, W. C. (1974) Tests for statistical significance. In J. A.Ibers and W. C. Hamilton, Eds., International Tables for X-RayCrystallography, Vol. IV, p. 285-310. Kynoch Press, Birming-ham, England.
Hazen, R. M. and L. W. Finger (1977) Modificalisns in high-pres-sure single-crystal diamond-cell techniques. Carnegie Inst.Wash. Year Book, 76, 655-656.
HiU, R. J. and G. V. Gibbs (1979) Variation in d(T-O), d(T...T)and <TOT in silica and silicate minerals, phosphates andaluminates. Acta Crystallogr., 835, 25-30.
Jorgensen, J. D. (1978) Compression mechanisms in a-quartzstructures-SiO2 and GeO2. J. Appl. Phys.,49,5473-5478.
King, H. E., Jr. (1979) Phase Transitions in FeS at High-Temper-atures and High-Pressures. Ph.D. Thesis, State University ofNew York, Stony Brook, New York.
- and L. W. Finger (1979) Diffracted beam crystal centeringand its application to high-pressure crystallography. J. Appl.Crystallogr., I 2, 3'1 4-37 8.
Le Page, Y. and G. Donnay (1976) Refinement of the crystalstructure of low-quartz. A cta Crystallogr., 8 3 2, 2456-2459.
McSkimin, H. J., P. Andreatclr, Jr. and R. N. Thurston (1965)Elastic moduli of quartz versus hydrostatic pressure at 25" and-195.8'C. J. Appl. Phys., 36, 1624-1632.
McWhan, D. B. (1967) Linear compression of a-quartz to 150kbar. "/. Appl. Phys., 38,34'l-352.
Merrill, L. and W. A. Bassett (1974) Miniature diamond anvilpressure cell for single crystal X-ray diffraction studies. Rev. ̂ SciInstrum., 45,290-294.
O'Keefe. M.. M. D. Newton and G. V. Gibbs (1980) Ab initio cal-culation of interatomic force constants in H6Si2O7 and the bulkmodulus of a-quartz and a-cristobalite. Phys. Chem. Mineral., inpress.
Olinger, B. and P. M. Halleck (1976) The compression of d quartz.J. Geophys. Res., 81, 57 ll-5'l 14.
Piermarini, G. J., S. Block and J. D. Barnett (1973) Hydrostaticlimits in liquids and solids to 100 kbar. J. Appl. Phys.,44,5377-5382.
- and R. A. Forman (1975) Calibration ofthe pressure dependence ofthe Rr ruby fluorescence line to 195kbar. J. Appl. Phys., 46,277+2780.
Robinson, K., G. V. Gibbs and P. H. Ribbe (1971) Quadraticelongation: a quantitative m€asure of distortion in coordinationpolyhedra. Science, 172, 567-570.
Smith, G. S. and L. E. Alexander (1963) Refinement of the atomicparamet€rs of a-quartz. Acta Crystallogr., 16,462471.
- and P. B. Isaacs (1964) The crystal structure ofquartzJikeGeO2. Acta Crystallogr., 1 7, 842-856.
Thurston, R. N. (1967) Calculation of lattic€-parameter changeswith hydrostatic pr€ssure from third-order elastic constants. "LAcoust. Soc. Am.,41, 1093-l l l l .
Vaidya, S. N., S. Bailey, T. Pasternack and G. C. Kennedy (1973)Compressibility of fifteen minerals to 45 kilobars. J. Geophys.Res., 78,6893-6898.
Young, R. A. (1962) Mechanism of phase transition in quartz.AFOSR-2569 (Final Report, Project No. A-447) Engineering Ex-pertmental Station, Georgia Institute of Technology.
- and B. Post (1962) Electron density and thermal effects inalpha quartz. Acta Crystallogr., I 5, 33'l -346.
Zachariasen, W. H. (1963) The secondary extinction corection.Acta Crystallogr., 16, 1139-1144.
- (1967\ A general theory of X-ray diffraction in crystals.Acta Crystdllogr., 2 3, 558-564.
- and H. A. Plettinger (1965) Extinction in q\aftz. ActaCrystallogr., I 8, 7 l0-7 14.
Monuscript received, May 31, 1979;
accepted for publkation, April 18, 1980.
American Mineralogist, Volume 65, pages 931-935, 1980
The crystal structure of klebelsbergite' Sb4O4(OH)rSOo
SIlvto MnNcHBrrr AND CESARE SABELLI
CNR, Istituto di Mineralogia dell'UniversitdVia La Pira 4,50121 Firenze,Italy
Abstract
Klebelsbergite is an antimony sulfate found at Felscibdnia, Hungary, and recently at Per-eta, Tuscany, Italy. Crystal data are: a: 5.766(2), b: 11.274(2), c : 14.887(DA; space groupPca2r; Z: 4. The atomic positions were determined by direct methods and refined by least-squares calculations to an R index of 0.045 for I I I I observed reflections'
The basic structural units are the SbuI-O polyhedra and the SO4 tetrahedron. Antimonypolyhedra show, as usual, intermediate features between the SbO3E tetrahedron and the
SbOnE trigonal bipyramid, where E indicates the unshared lone pair of electrons. These poly-
hedra are connected to each other by edge sharing to form Sb-O sheets parallel to (001). Ad-jacent sheets are linked together by SOo tetrahedra and, indirectly, by H-bonds. flking intoaccount anions and lone pairs, the volume occupied by each anion is similar to that found inclose-packed structures. A marked pseudosymmetry (towards the centric group Pcan) is pres-
ent in the Sb-O sheet.
Introduction
Klebelsbergite from Felsobdnia, Hungary, wasfirst described by Zsivny (1929); however, the firstcomplete description of the mineral is by Nakai andAppleman (1980). A second occurrence of klebels-bergite, at Pereta mine (Tuscany, Italy), is reportedby Cipriani et al. (1980a). A synthetic compoundequivalent to klebelsbergite was prepared by Nakaiand Appleman by boiling SbrO, with sulfuric acid.The same compound was also obtained by research-ers of the Laboratoire de Chimie-Physique, Besan-gon, France (Douglade, personal communication).
In recent years several Sb'*-O compounds havebeen structurally studied and much attention hasbeen directed towards the stereochemistry of ele-ments with one unshared electron pair. Our workwas undertaken in order to contribute to the crystal-chemistry knowledge of these compounds. Anotherquestion was the full knowledge of the chemicalcomposition of klebelsbergite and if the true crystal-chemical formula was SboO.(OH)rSOo orsboo,son.Hro.
Experimental
For our study a small (approx. 0.1 x 0.1 x 0.5 mm)colorless crystal was chosen from a sample we col-lected at Pereta. Crystal data arc: a: 5.766(2), b :
0003-004x/80/09 l 0-093 l $02.0o
11.274(2), c : 14.887 (2)L, V : 967.7 A3 Z : 4, D^ :
4.67 g cm-', formula weight 681.1. The space group'
determined from the extinctions, is Pcam ot Pca2r.The latter is the correct one on the basis of the struc-ture determination.
Intensities were collected with a Philips PW 1100four-circle computer-controlled di-ffractometer (Cen-
tro di Cristallografia Strutturale del C.N.R., Pavia,
Italy), with MoKa radiation and the c.r-2d scan tech-nique. A total of 1469 independent reflections, in therange 2 < 0 < 30o were measured; only llll wereconsidered to be actually observed according to thecriterion F" ) 5o (F"). Intensities were corrected forLorentz-polarization effects; an absorption correctionwas carried out on the basis of the semiempiricalmethod proposed by North et al- (1968).
Structure determination and refinement
As statistical tests did not give a clear indication onthe absence of the symrnetry center, the first attemptsto solve the crystal structure of klebelsbergite wereperformed in the centric space group Pcam, whichwas later found to be incorrect. Other difficultieswere presented by the incomplete knowledge of thechemical composition. The structure was solved bydirect methods, using MULTAN (Main et al., 1974).However, many successive three-dimensional Fou-
931
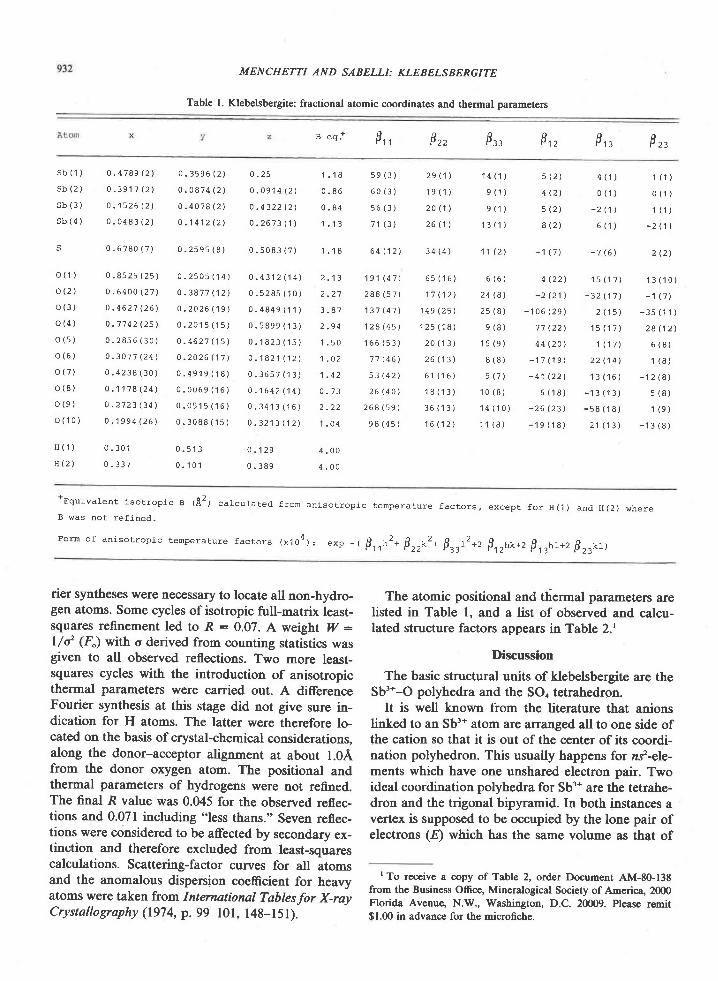
MENCHETTI AND SABELLI: KLEBELSBERGITE
Table l. Klebelsbergite: fractional atomic coordinates and thermal parameters
F',. oP z z 8,, F,, F, , F, ,
s b ( 1 ) 0 . 4 7 8 9 ( 2 )
s b ( 2 ) o . 3 9 ' t 7 ( 2 )
s b ( 3 ) 0 . 1 5 2 6 ( 2 )
s b ( 4 ) 0 . 0 4 8 3 ( 2 )
s 0 . 6 7 8 0 ( 7 )
o ( 1 ) 0 . 8 s 2 s ( 2 5 )
o ( 2 1 0 . 6 4 0 0 ( 2 ' 1 )
o ( 3 ) 0 . 4 6 2 7 ( 2 6 )
o ( 4 ) o . 7 7 4 2 ( 2 5 )
o ( 5 ) 0 . 2 8 5 6 ( 3 0 )
o ( 6 ) 0 . 3 0 7 1 ( 2 4 )
o ( 7 ) 0 . 4 2 3 8 ( 3 0 )
o ( 8 ) 0 . 1 ' 1 7 8 ( 2 4 )
o ( 9 ) 0 . 2 7 2 3 ( 3 4 )
o ( 1 0 ) 0 . 1 9 9 4 ( 2 6 )
H ( 1 ) 0 . 3 0 1
H ( 2 ) 0 . 3 3 7
0 . 3 s 9 6 ( 2 )
0 . 0 8 7 4 ( 2 )
0 . 4 o 7 8 ( 2 )
0 . 1 4 1 2 ( 2 )
0 . 2 s 9 s ( 8 )
0 . 2 s 0 5 ( 1 4 )
0 . 3 8 7 7 ( 1 2 )
o . 2 0 2 6 ( ' , t 9 1
0 . 2 0 1 5 ( ' l s )
0 . 4 6 2 ' 1 ( 1 5 )
o .2026 ( ' , t 7 )
0 . 4 9 1 9 ( 1 8 )
0 . 0 0 6 9 ( 1 6 )
0 . 0 5 1 s ( 1 6 )
0 . 3 0 8 8 ( 1 5 )
0 . 5 1 3
0 . 1 0 1
o . 2 5 1 . ' l I
o . 0 9 1 4 ( 2 ) 0 . 8 6
o . 4 3 2 2 1 2 ) 0 . 8 4
o . 2 6 7 3 ( 1 ) 1 . 1 3
0 . s 0 8 3 ( 7 ) 1 . 1 8
o . 4 3 1 2 ( 1 4 ) 2 . 1 3
0 . s 2 8 5 ( 1 0 ) 2 . 2 7
o - 4 8 4 9 ( 1 1 ) 3 . 8 7
0 . 5 8 9 9 ( 1 3 ) 2 . 9 4
0 . 1 8 2 3 ( 1 s ) 1 . 5 0
o . 1 8 2 1 ( 1 2 ) 1 . 0 2
0 . 3 6 5 7 ( 1 3 ) 1 . 4 2
o . ' t 6 4 2 ( 1 4 ) 0 . 7 3
0 . 3 4 1 3 ( 1 6 ) 2 . 2 2
0 . 3 2 1 3 ( 1 2 t 1 . O 4
o . 1 2 9
0 . 3 8 9
4 . 0 0
4 . 0 0
s 9 ( 3 ) 2 9 ( 1 t
6 0 ( 3 ) 1 e ( 1 )
s 6 ( 3 ) 2 0 ( 1 )
7 ' t ( 3 ) 2 6 ( 1 )
6 4 ( ' t 2 ) 3 4 ( 4 )
1 9 1 ( 4 7 ) 6 s ( 1 6 )
2 8 8 ( 5 7 ] . 1 ' t ( 1 2 )
' t 3 7 ( 4 7 \ 1 4 9 ( 2 5 )
' t 2 8 ( 4 5 ) 1 2 s ( 1 8 )
1 6 6 ( s 3 ) 2 0 ( 1 3 )
7 7 ( 4 6 ) 2 6 ( 1 3 )
5 3 ( 4 2 J 6 1 ( ' t 6 l
2 6 ( 4 0 ' t 1 8 ( 1 3 )
2 6 8 ( 5 9 ) 3 6 ( ' l 3 )
9 8 ( 4 s ) 1 6 ( 1 2 1
1 4 ( 1 ) 5 ( 2 ) 4 ( 1 ) 1 ( 1 )
e ( 1 ) 4 ( 2 ) 0 ( 1 ) 0 ( 1 )
e ( 1 ) 5 ( 2 , - 2 ( 1 ) 1 ( 1 )
1 3 ( 1 ) 8 ( 2 ) 6 ( 1 ) - 2 ( 1 1
1 1 ( 2 ' , , - ' t ( 7 ) - 7 ( 6 )
6 ( 6 ) 4 ( 2 2 ) ' t s ( ' 1 7 )
2 4 ( 8 ) - 2 ( 2 1 ) _ 3 2 ( 1 7 )
2 s ( 8 ) - ' t o 6 ( 2 9 ) 2 ( 1 s )
e ( 8 ) 7 7 ( 2 2 ) 1 s ( 1 7 )
1 5 ( 9 ) 4 4 ( 2 0 \ ' t ( 1 7 )
8 ( 8 ) - 1 7 ( 1 e J 2 2 ( 1 4 )
5 ( 7 ) - 4 1 ( 2 2 ) ' t 3 ( 1 6 )
1 0 ( 8 ) 6 ( 1 8 ) - 1 3 ( 1 3 )
1 4 ( 1 0 ) - 2 6 ( 2 3 ) - s 8 ( 1 8 )
1 1 ( 8 ) - 1 9 ( 1 8 ) 2 1 ( 1 3 )
2 ( 2 )
1 3 ( 1 0 )
- ' t ( -1 )
- 3 s ( 1 1 )
2 8 ( 1 2 )
6 ( 8 )
1 ( 8 )
- 1 2 ( 8 )
5 ( 8 )
1 ( 9 )
- 1 3 ( 8 )
+Equ lva len t i so t rop ic g (82) ca tcu ta ted f ron an iso t rop ic tempera ture fac to rs , except fo r H( .1 ) and H(2) where
B was no t re f ined.
Form o f an iso t rop ic tempera ture fac to rs (x104; ; " *p
_ ( 0 r . ,n2* F . r r * r * Fr r r t * , F r rnn* , B , ran t *z Br ru t l
rier syntheses were necessary to locate all non-hydro-gen atoms. Some cycles of isotropic full-matrix least-squares refinement led to R : 0.07. A weight }'/:l/C (F"\ with o derived from counting statistics wasgiven to all observed reflections. Two more least-squares cycles with the introduction of anisotropicthermal parameters were carried out. A differenceFourier synthesis at this stage did not give sure in-dication for H atoms. The latter were therefore lo-cated on the basis of crystal-chemical considerations.along the donor-acceptor alignment at about l.0Afrom the donor oxygen atom. The positional andthermal parameters of hydrogens were not refined.The final R value was 0.045 for the observed reflec-tions and 0.071 including "less thans." Seven reflec-tions were considered to be affected by secondary ex-tinction and therefore excluded from least-squarescalculations. Scattering-factor curves for all atomsand the anomalous dispersion coeffi.cient for heavyatoms were taken from International Tablesfor X-rayCrystallography (1974, p. 99-101, 148-15l).
The atomic positional and thermal parameters arelisted in Table l, and a list of observed and calcu-lated structure factors appears in Table 2.'
Discussion
The basic structural units of klebelsbergite are theSb3*-O polyhedra and the SOo tetrahedron.
It is well known from the literature that anionslinked to an Sb3* atom are arranged all to one side ofthe cation so that it is out ofthe center ofits coordi-nation polyhedron. This usually happens for zf-ele-ments which have one unshared electron pair. Twoideal coordination polyhedra for Sb'* are the tetrahe-dron and the trigonal bipyramid. In both i.stances avertex is supposed to be occupied by the lone pair ofelectrons (E) which has the same volume as that of
I To receive a copy of Table 2, order Document AM-80-138from thc Business Office, Mineralogical Society of Anerica" 2000Florida Avenue, N.W., Washington, D.C. 20009. Please remit$1.00 in advance for the microfiche.

MENCHETTI AND SABELLI: KLEBELSBERGITE 933
an anion (Galy et al., 1975). Taking into consid-eration anions and lone pairs, the structures of manyoxides and fluorides of n.f-elements can be consid-ered as close packed. In the SbO3E model (tetrahe-dron) there are three strong Sb-O bonds with dis-tances of 2.0A. In the Sboo.E model (trigonalbipyramid) there are two equatorial and two axialSb-O bonds. According to Galy et al. (1975) the the-oretical distances arc 2.0 and 2.27 A respectively,while the corresponding theoretical angles are 92.2and l5l.5o. According to the same authors it is alsopossible to calculate the theoretical position of thecenter of the lone pair E, which should be approxi-mately l.lA distant from the Sb atom.
Bovin (1976) has collected the experimental Sb-Odistances found in 28 compounds; the analysis ofthese values and of others found in subsequentlysolved structures shows that the experimentallyfound polyhedra show intermediate features betweenthe tetrahedron and the trigonal bipyramid. Indeedonly a slight displacement of the Sb atom out of theequatorial plane of the trigonal bipyramid is neces-sary to change four- to three-coordination.
Selected interatomic distances and angles in kle-belsbergite are reported in Table 3. As also shown inFigure l, each of the four independent Sb atoms isbound to four O atoms with distances ranging from1.90 to 2.484. The four polyhedra have very similarSb-O mean distances (from 2.10 to 2.144), and allexhibit arrangements intermediate between theSbO,E and SbOoE models. However, the Sb(3) poly-hedron resembles more a distorted tetrahedron thana trigonal bipyramid, while the contrary happens forthe other three polyhedra. Two of the shortest dis-tances (1.90 and l.9SA) are related to the hydroxyloxygens O(5) and O(9) which are linked to only oneSb atom. Within the upper limit of 3.0A there arefew other Sb-O distances. not so far taken into con-sideration: however, they are very long and likely re-fer to very weak bonds.
The Sb-O polyhedra are tightly connected to eachother by edge sharing so as to form layers parallel to(001). The values of the Sb-Sb distances betweencontacting polyhedra, 3.5A or less, are similar tothose found in other structures, e.g. rn Sb.Or(SOo),(Bovin, 1976). In the unit cell there are two parallelSb-O sheets connected by means of SOo tetrahedra,and indirectly by means of H-bonds. Oxygens be-longing to the SOo group are of two kinds: O(l) andO(4) are linked also to an Sb atom, while O(2) andO(3) are acceptors of a H-bond. Consequently, S-O(l) and S-O(4) distances should be longer than S-
Table 3. Klebelsbergite: selected interatomic distances (A) andarigles (')
s b ( 1 )
s b ( 1 ) - o ( 5 ) 1 . 9 0 ( 2 )s b ( 1 ) - o ( 6 ) 2 . 2 6 ( 2 )s b ( 1 ) - - o ( 7 ) 2 . 3 0 ( 2 )s b ( 1 ) - o ( 1 0 ) 2 . 0 1 ( 2 )
a v e r a g e 2 . 1 2s b ( 1 ) - o ( s , 7 ) 2 . 8 6 Q ) '
o ( s ) - o ( 6 ) 2 . 9 4 ( 3 )o ( s ) - o ( 7 ) 2 . 8 6 ( 3 )o ( 5 ) - o ( 1 0 ) 2 . 1 5 \ 3 )o ( 6 ) - o ( 7 ) 4 . 3 1 ( 3 )o ( 6 ) - o ( 1 0 ) 2 . 4 1 1 3 Jo ( 7 ) - o ( 1 0 ) 2 . 5 2 ( 3 )
o ( s ) - s b ( 1 ) - o ( 6 ) , 8 9 . 2 ( ' 7 )o ( 5 ) - s b ( 1 ) - o ( 7 ) 8 s . 4 ( 8 )o ( 5 ) - s b ( 1 ) - o ( 1 0 ) 8 9 . 1 ( 7 )
o ( 6 ) - s b ( 1 ) - o ( 7 ) 1 4 1 . 3 ( 6 )o ( 6 ) - s b ( 1 ) - o ( 1 0 )
' 7 o . 4 \ 6 )
o ( 7 ) - s b ( 1 ) - o ( 1 0 ) ' 7 1 . 2 1 ' 7 )
s b ( 2 )
s b ( 2 ) - o ( 6 ) 1 . 9 4 ( 2 )
s b ( 2 ) - o ( 8 ) 2 . 1 2 ( 2 )s b ( 2 ) - o ( 4 , 5 ) 2 . 3 2 \ 2 )s b ( 2 ) - o ( 8 , 8 ) 2 . 0 0 1 2 )
a v e r a g e 2 . 1 os b ( 2 ) - o ( 3 , 6 ) 2 . 8 9 ( 2 J '
o ( 6 ) - o ( 8 ) 2 . 4 8 ( 3 )o ( 6 ) - o ( 4 , 5 ) 2 . 1 1 1 2 )o ( 6 ) . . o ( 8 , 8 ) 2 . 9 ' 1 1 2 )o ( 8 ) - o ( 4 , 5 ) 4 . 2 8 ( 3 1o ( 8 ) - o ( 8 , 8 ) 2 . 8 9 ( 2 )
o ( 4 , s ) - o ( 8 , 8 ) 2 . 6 7 \ 3 )
o ( 6 ) . . s b ( 2 ) - o ( 8 ) 1 5 ' 2 ( ' 7 )
o ( 6 ) - s b ( 2 ) - o ( 4 , 5 ) 8 0 . 9 ( 6 )o ( 6 ) - S b ( 2 ) - o ( 8 , 8 ) 9 8 . 1 ( 8 )o ( 8 ) - s b ( 2 ) - o ( 4 , s ) 1 4 9 . 6 ( 7 )o ( 8 ) - s b ( 2 ) - o ( 8 , 8 ) 8 8 . 9 ( 7 )
o ( 4 , s ) - s b ( 2 ) - o ( 8 , 8 ) ' 1 6 . 0 ( 6 )
Hydroxy I s
o ( s ) - o ( 2 , 3 ) 2 . 8 8 ( 3 )o ( s ) - H ( 1 ) 0 . 9 8H ( 1 ) . . . o ( 2 , 3 ) 1 . 9 0
o ( 9 ) - o ( 3 ) 2 . 9 5 1 3 )o ( 9 ) - H ( 2 ) 0 . 9 8H ( 2 ) . . . o ( 3 ) 1 . 9 ' 7
Cat ion-ca t ion d is tances( < 3 . 8 E )
s b ( 1 ) - s b ( 3 ) 3 . 3 5 ( 2 )s b ( 1 ) - s b ( 4 ) 3 - 5 1 1 2 )s b ( 2 ) - s b ( 4 ) 3 . 3 4 ( 3 )s b ( 2 ) - s b ( 2 , 8 ) 3 . 4 9 ( 3 )s b ( 2 ) - s b ( 4 , 8 ) 3 . 7 8 ( 3 )s b ( 3 ) - s b ( 3 , 7 ) 3 . 5 6 ( 2 )
s - s b ( 2 , 4 ) 3 . 3 8 ( 2 )s - s b ( 3 , ' 1 ) 3 . 4 0 ( 2 )s - S b ( 3 ) 3 . 6 4 ( 2 )
s b ( 3 )
s b ( 3 ) - o ( 7 ) 2 . 0 8 \ 2 )s b ( 3 ) - o ( 1 o ) 2 . O 1 1 2 )s b ( 3 ) - o ( 1 , 2 ) 2 . 4 4 1 2 )s b ( 3 ) - o ( 7 , 9 ) 2 . o o ( 2 )
average 2 .1 4s b ( 3 ) - o ( 2 , 9 ) 2 . 7 2 ( l '
o ( 7 ) - o ( 1 0 ) 2 . s 2 \ 3 )o l ' 7 ) - o ( , 2 ' ) 4 . 3 8 ( 3 )
o ( 7 ) - o { ? , 9 ) 2 . 8 9 ( 2 Jo ( ' 1 0 ) - o ( 1 , 2 ) 2 , 6 7 1 2 )o ( 1 0 ) - o ( 7 , 9 ) 2 . 8 3 ( 3 )o ( 1 , 2 ) - o ( 7 , 9 ) 3 . 0 9 ( 2 )
o ( 7 ) - s b ( 3 ) - o ( 1 0 ) ' 7 6 ' 2 ( 1 )
o ( 7 ) - s b ( 3 ) - o ( 1 , 2 ) ' 1 4 8 . 1 ( 7 )o ( 7 ) - s b ( 3 ) - o ( 7 , 9 ) 9 0 . 2 ( 7 )
o ( 1 0 ) - s b ( 3 ) - o ( 1 , 2 ) 1 2 , 0 ( 6 )o ( 1 0 ) - s b ( 3 ) - o ( 7 , 9 ) 8 9 . 8 ( 7 )o ( 1 , 2 ) - s b ( 3 ) - O ( ? , 9 ) 8 6 . 6 ( 7 )
s b ( 4 )
s b ( 4 ) - . o ( 6 ) 2 . 0 8 ( 2 )s b ( 4 ) - o ( 8 ) 2 . 1 9 ( 2 )s b ( 4 ) - o ( 9 ) 1 . 9 8 ( 2 Js b ( 4 ) - o ( 1 0 ) 2 . 2 3 1 2 )
a v e r a g e 2 . ' 1 2s b ( 4 ) - o ( 1 , 2 ) 2 - 9 6 ( 2 ) 's b ( 4 ) . . o ( 9 , 1 0 ) 2 . 9 1 ( 2 ) '
o ( 6 ) - o ( 8 ) 2 . 4 8 { 3 )o ( 6 ) - o ( 9 ) 2 . 9 3 ( 3 )o ( 6 ) - o ( 1 0 ) 2 . 4 ' 1 ( 3 J
o ( 8 ) - o ( 9 ) 2 . 8 3 ( 3 )o ( 8 ) - o ( 1 0 ) 4 . 1 6 ( 3 )o ( 9 ) - o ( 1 0 ) 2 . 9 5 1 2 )
o ( 6 ) - s b ( 4 ) - o ( 8 ) 7 0 . 8 ( 7 )o ( 6 ) - s b ( 4 ) - o ( 9 ) 9 2 . 3 ( 8 )o ( 6 ) - s b ( 4 ) - o ( 1 o ) ? 0 . 0 ( ? )
o ( 8 ) - s b ( 4 ) - o ( 9 ) 8 5 . 2 ( 8 )o ( 8 ) - s b ( 4 ) - o ( ' 1 0 ) 1 4 0 . 0 ( 6 )o ( 9 ) - s b ( 4 ) - o ( ' 1 0 ) 8 8 . 7 { 7 )
S
s - o ( l ) 1 . 5 3 ( 2 )s - o ( 2 ) 1 . 4 9 1 2 )s - o ( 3 ) 1 . 4 4 ( 2 )s - - o ( 4 ) 1 , 4 9 ( 2 1
average '1 .49
o ( 1 ) - o ( 2 ) 2 . 4 5 ( 2 )o ( 1 ) . . o ( 3 ) 2 . 4 5 ( 2 )
o ( 1 ) - o ( 4 ) 2 , 4 1 ( 3 ' )o ( 2 ) - o ( 3 ) 2 . 4 1 \ 2 )o ( 2 ) . - o ( 4 ) 2 . 4 2 1 2 )o ( 3 ) . . o ( 4 ) 2 . 3 8 1 2 )
o ( 1 ) - s - o ( 2 ) 1 0 8 . 2 ( 9 )o ( ' 1 ) - s - o ( 3 ) 1 1 0 . 9 ( 9 )o ( 1 ) - s - o ( 4 ) 1 0 e . 8 ( 9 )o ( 2 ) - s - o ( 3 ) 1 1 0 . 7 ( 9 )o ( 2 ) - s - o ( 4 ) 1 0 8 . 4 ( 9 )o ( 3 ) - s - o ( 4 ) 1 0 8 . 8 ( 9 )
The equ iva len t pos i t ions ( re fe r red to Tab le 1 ) a re des i -
gnated by the recond nur.ber in Parentheses and are (1) =
i r * , y , " , 1 2 ) = - 1 + x , y , z t ( 3 ) = 1 - x , 1 - y , - 1 / 2 + z i 1 4 ) = 3 / 2 - x ' y " l / 2+ z j ( 5 ) = 3 / 2 - x , y , - 1 / 2 + z i r c l = 1 / 2 - a J ' - 1 / 2 + 2 , l ' 7 ) = 1 / 2 + * . 1 ' y '
z t ( 8 ) = 1 / 2 + x , - y , z i 1 9 ) = - 1 / 2 + x ' 1 - y , 2 , ( 0 ) = - 1 / 2 + x , - y ' z '
'Larges t sb-o d ls tances (<3 R) '
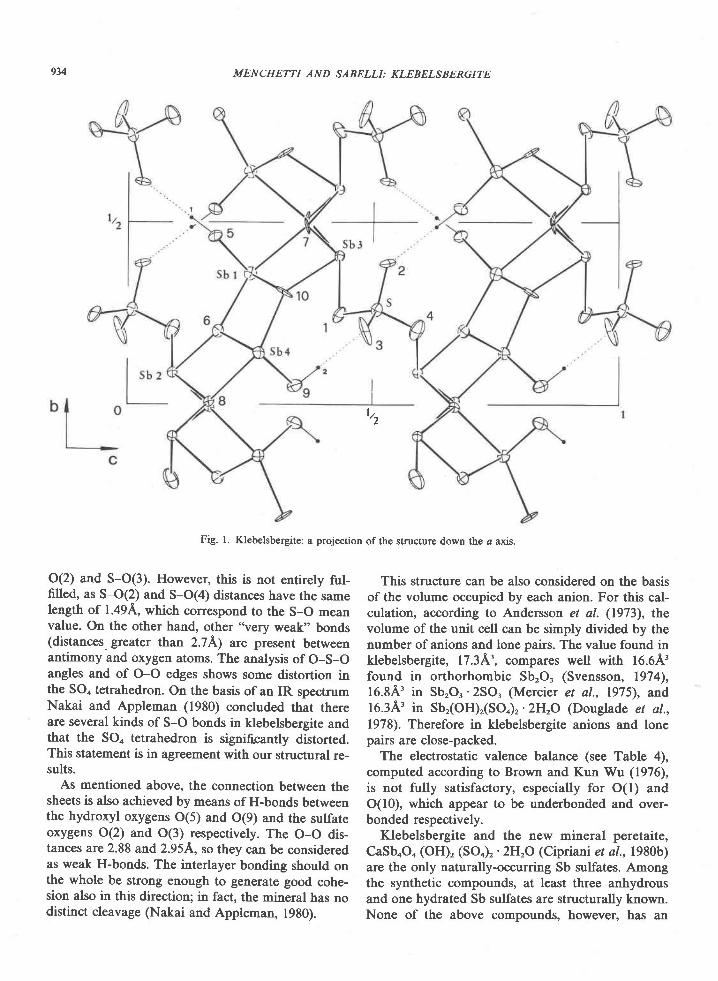
934 MENCHETTI AND SABELLI: KLEBELSBERGITE
tr,
Fig. l. Klebelsbergite: a projection of the structure down the a axis.
O(2) and S-O(3). However, this is not entirely ful-filled, as S-O(2) and S-O(4) distances have the samelength of 1.49A, which correspond to the S-O meanvalue. On the other hand, other "very weak" bonds(distances. greater than 2.7A) are present betweenantirrony and oxygen atoms. The analysis of O-S-Oangles and of O-O edges shows some distortion inthe SOo tetrahedron. On the basis of an IR spectrumNakai and Appleman (1980) concluded that thereare several kinds of S-O bonds in klebelsbergite andthat the SOo tetrahedron is significantly distorted.This statement is in agreement with our structural re-sults.
As mentioned above, the connection between thesheets is also achieved by means of H-bonds betweenthe hydroxyl oxygens O(5) and O(9) and the sulfateoxygens O(2) and O(3) respectively. The O-O dis-tances are 2.88 and2.95A, so they can be consideredas weak H-bonds. The interlayer bonding should onthe whole be strong enough to generate good cohe-sion also in this direction; in fact, the mineral has nodistinct cleavage (Nakai and Appleman, 1980).
This structure can be also considered on the basisof the volume occupied by each anion. For this cal-culation, according to Andersson et al. (1973), thevolume of the unit cell can be simply divided by thenumber of anions and lone pairs. The value found inklebelsbergite, 17.3A', compares well with 16.6A'found in orthorhombic SbrO, (Svensson, 1974\,16.843 in Sb,O3.2SO, (Mercier et al., 1975), and16.34', in sb,(oH),(soo), .2H,o (D0uglade et al.,1978). Therefore in klebelsbergite anions and lonepairs are close-packed,
The electrostatic valence balance (see Table 4),computed according to Brown and Kun Wu (1976),is not fully satisfactory, especially for O(l) andO(10), which appear to be underbonded and over-bonded respectively.
Klebelsbergite and the new mineral peretaite,CaSboOo (OH), (SO4)z' 2H2O (Cipriani et al., 1980b)are the only naturally-occurring Sb sulfates. Amongthe synthetic compounds, at least three anhydrousand one hydrated Sb sulfates are structurally known.None of the above compounds, however, has an
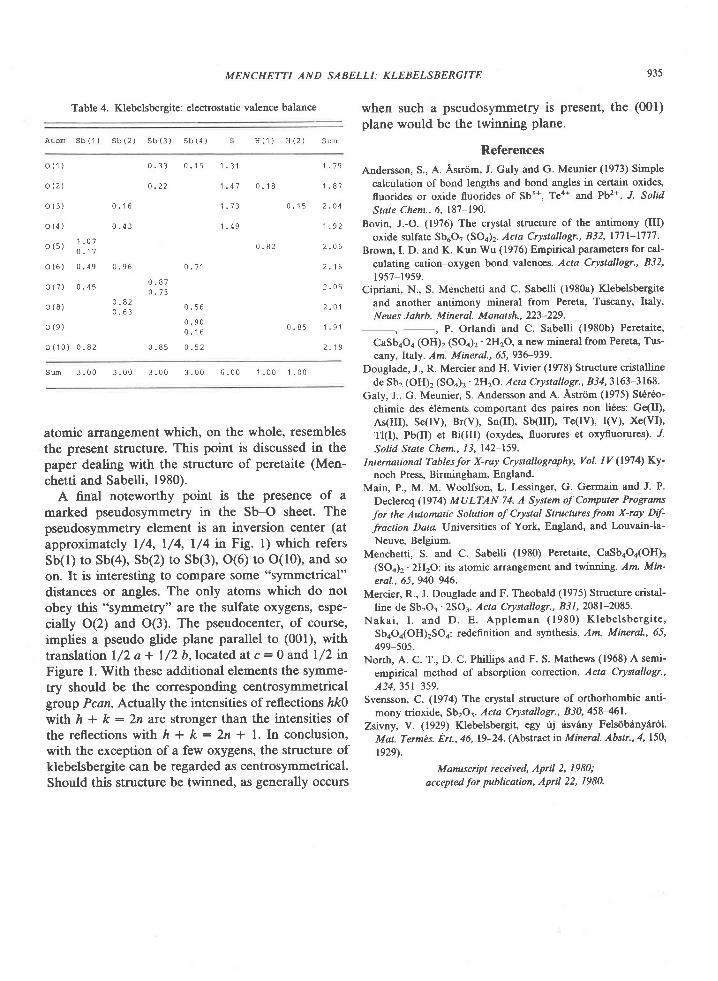
MENCHETTI AND SABELLI: KLEBELSBERGITE 935
(001)
o ( 1 )
o ( 2 )
o ( 3 )
o ( 4 )
^ / ( \ 1 ' o ' 1o - 1 ' 7
o ( 6 ) 0 . 4 9 0 . 9 6
o ( 7 ) 0 . 4 s
o ( 8 ) : ' : i
o ( 9 )
o ( 1 0 ) 0 . 8 2
0 . 3 3 0 . 1 5
o . 2 2
0 . 1 5
0 . 4 3
r . 3 1
1 . 4 ' 7 0 . 1 8
1 . 7 3
1 . 4 9
o . 8 2
1 . ' 7 9
1 . 8 ' 7
0 . 1 5 2 . 0 4
1 . 9 2
2 . 4 6
2 . 1 6
2 . 0 5
2 . 4 1
0 . 8 5 1 . 9 1
2 - 1 9
Table 4. Klebelsbergite: electrostatic valence balance
A t o m s b ( 1 ) s b ( 2 ) S b ( 3 ) S b ( 4 ) H ( 1 ) H ( 2 ) S u m
when such a pseudosymmetry is present, theplane would be the twinning plane.
References
Andersson, S., A. Astr<im, J. Galy and G. Meunier (1973) Simple
calculation of bond lengths and bond angles in certain oxides,
fluorides or oxide fluorides of Sb3*, Tea+ and Pb2+. J. Solid
State Chem., 6, 187-190.
Bovin, J.-0. (1976) The crystal structure of the antimony (III)
oxide sulfate Sb6O? (SO4)2. Acta Crystallogr., 832, 177l-1777.
Brown, I. D. and K. Kun Wu (1976) Empirical parameters for cal-
culating cation-oxygen bond valences. Acta Crystallogr., 832,
1957-1959.Cipriani, N., S. Menchetti and C. Sabelli (1980a) Klebelsbergite
and another antimony mineral from Pereta, Tuscany, Italy.
N eues Jahrb. M ineral. Monatsh., 223-229.
P. Orlandi and C. Sabelli (1980b) Peretaite,
CaSboOa (OH), (SO1), '2H2O, a new mineral from Pereta, Tus-
cany, Italy. Am. Mineral., 65, 936-939.
Douglade, J., R. Mercier and H. Vivier (1978) Structure cristalline
de Sb2 (OH)2 (SOo)z' 2H2O. Acta Crystallogr.,834,3163-3168.
Galy, J., G. Meunier, S. Andersson and A. Astrdm (1975) St6r6o-
chimie des 6l€ments comportant des paires non li6es: Ge(II)'
As(III), Se(IV), Br(v), Sn(II), Sb(III), Te(Iv), I(v), xe(vl),
T(I), Pb(II) et Bi(IID (oxydes, fluorures et oxyfluorures). J.
Solid State Chem., 13, 142-159.
International Tables for X-ray Crystallography, Vol. IV (197\ Ky-
noch Press, Birmingham, England.
Main, P., M. M. Woolfson, L. Lessinger, G. Germain and J. P.
Declercq (1974) MULTAN 74. A System of Computer Programs
for the Automatic Solution of Crystal Slructures from X'ray Dif-
fraction Data. Ilrrivercities of York, England, and Louvain-Ia-
Neuve, Belgium.
Menchetti, S. and C. Sabelli (1980) Per€taite, CaSb+O+(OH)z
(SOo)2. 2HrO: its atomic arrangement and twinning. Am. Min'
eral., 65,94U946.
Mercier, R., J. Douglade and F. Theobald (1975) Structure cristal-
line de Sb2O3 '2503. Acta Crystallogr., 831,2081-2085.
Naka i , I . and D . E . App leman (1980 ) K lebe l sbe rg i t e '
Sb4O4(OH)2SOa: redefinition and synthesis. Am. Mineral., 65,
499-505.North, A. C. T., D. C. Philiips and F. S. Mathews (1968) A semi-
empirical method of absorption corection. Acta Crystallogr.'
A24,35r-3s9.Svensson, C. (1974) The crystal structure of orthorhombic anti-
mony trioxide, Sb2O3. Acta Crystallogr., 830,458461-Zsivny, V. (1929) Klebelsbergit, egy tj 6sv6ny Felxib6ny6r6l.
Mat. Termbs. Ert., U,19-24. (Abstract in Mineral' Abstr.,4, 150,t92e).
Manuscript received, APril 2, 1980;acceptedfor publication, April 22, 1980.
o . ' 7 1
0 . 8 7o . 1 3
0 . 5 6
0 . 9 00 . 1 6
0 . 8 5 0 . 5 2
s u m 3 . 0 0 3 . 0 0 3 . 0 0 3 . 0 0 6 . 0 0 1 . 0 0 1 . 0 0
atomic arrangement which, on the whole, r€semblesthe present structure. This point is discussed in thepaper dealing with the structure of peretaite (Men-chetti and Sabelli, 1980).
A final noteworthy point is the presence of amarked pseudosymmetry in the Sb-O sheet. Thepseudosymmetry element is an inversion center (atapproximately l/4, l/4, l/4 in Fig. l) which refersSb(l) to Sb(4), Sb(2) to Sb(3), 0(6) to O(10), and soon. It is interesting to compare some "symmetrical"distances or angles. The only atoms which do notobey this "s1mmetry" are the sulfate oxygens, espe-cially O(2) and O(3). The pseudocenter, of course,implies a pseudo glide plane parallel to (001), withtranslation l/2 a + l/2 b,located at c: O and l/2 rnFigure l. With these additional elements the symme-try should be the corresponding centrosyrnmetricalgrorrp Pcan. Actually the intensities of reflections ftkOwith ft + k : 2n arc stronger than the intensities ofthe reflections with h + k : 2n r l. In conclusion,with the exception of a few oxygens, the structure ofklebelsbergite can be regarded as centrosyrnmetrical.Should this structure be twinned, as generally occurs
American Mineralogist, Volume 65, pages 936-939, 1980
Peretaiteo CaSboOu (OH)r(SO 4)2. 2}I2O, a new mineral from Pereta, Tuscany, Italy
NIcoLA Crpnntt. Snvro MENcHETTI
I stituto di Mineralogia dell' UniversitdVia La Pira 4, 50121 Firenze, Italy
Pnoro Onr-eNot
Istituto di Mineralogia e Petrografia dell'UniversitdVia S. Maria 53, 56100 Pisa,Italy
AND CESARE SABELLI
CNR Centro di Studio per la Mineralogia e le Geochimica dei sedimentiI stituto di Mineralo gia dell' Univ ersitd
Via La Pira 4, 50121 Firenze,Italy
Abstract
Peretaite, a new calcium and antimony sulfate mineral, occurs as aggregates of colorlesstabular crystals in the antimony-bearing vein at Pereta, Tuscany, Italy. It is monoclinic, spacegtoup C2/c, with a: 24.641, D : 5.598, c: 10.180A, B:95.95". The calculated density is4.06 g cm-3. The cleavage {100} is perfect. Crystals are always twinned (100). Peretaite is bi-axial (+) with mean refractive index 1.841. The five strongest lines in the X-ray diffractionpattern are (d rn A, t, tttc4: 12.19 100 2oo;6.12 21 400;3.10 24 512;3.06 67 8Cf/;2.451 3l l0.OO.On the basis of the wet-chemical analysis, the IR spectroscopy, the TGA spectrum, and espe-cially the structure determination, the chemical formula is CaSboO+(OH)r(SO4), '2H2Q.
Introduction
In a paper dealing with a new find of klebelsber-gite (Cipriani et al., 1980), some of us pointed outthat a new mineral is present among the accessoryminerals of the antimony-bearing vein at Pereta,Tuscany, ttaly. Further study fully confirmed thethesis.
The new species, CaSboOo(OH)r(SOo)r.2HrO, isnamed peretaite for the locality. Both the mineraland the name have been approved by the Commis-sion on New Minerals and Mineral Names, IMA.Type specimens are deposited in the mineralogicalmuseums of Florence University (regional collection,#164/l) and Pisa University.
columnar stibnite. Crystals of peretaite associatedwith acicular crystals of klebelsbergite afe shown inFigure l Other associated minerals are stibnite,qrrartz, calcite, pyrite, valentinite, kermesite, sulfur,and gypsum. Aggregates of klebelsbergite crystalsand rarely of peretaite are often red from in-crustations of valentinite. Unlike klebelsbergite,which was found rather abundantly in the fissures ofthe stibnite veinlets, peretaite occurs closer to theboundary with limestones. The mineral, as well asklebelsbergite, has apparently been formed by the ac-tion of sulfuric acid on stibnite; the source of the cal-cium in peretaite is likely the limestone of the coun-trv rock.
Occurrence and paragenesis Chemistry
The environment where peretaite was found has Preliminary qualitative analyses of peretaite werebeen described by Cipriani et al. (1980). Peretaite oc- made with an oRTEC X-ray microanalyzer and ancurs, in small quantities, as aggregates of tabular ARL sEMe electron microprobe. However, since thecrystals in the geodes of a deeply silicified limestone crystals decompose under the electron beam, micro-from "Calcare Cavernoso," and also in the cavities of probe results were considered not reliable for a quan-w3-wx/80/0910-0936$02.00 936
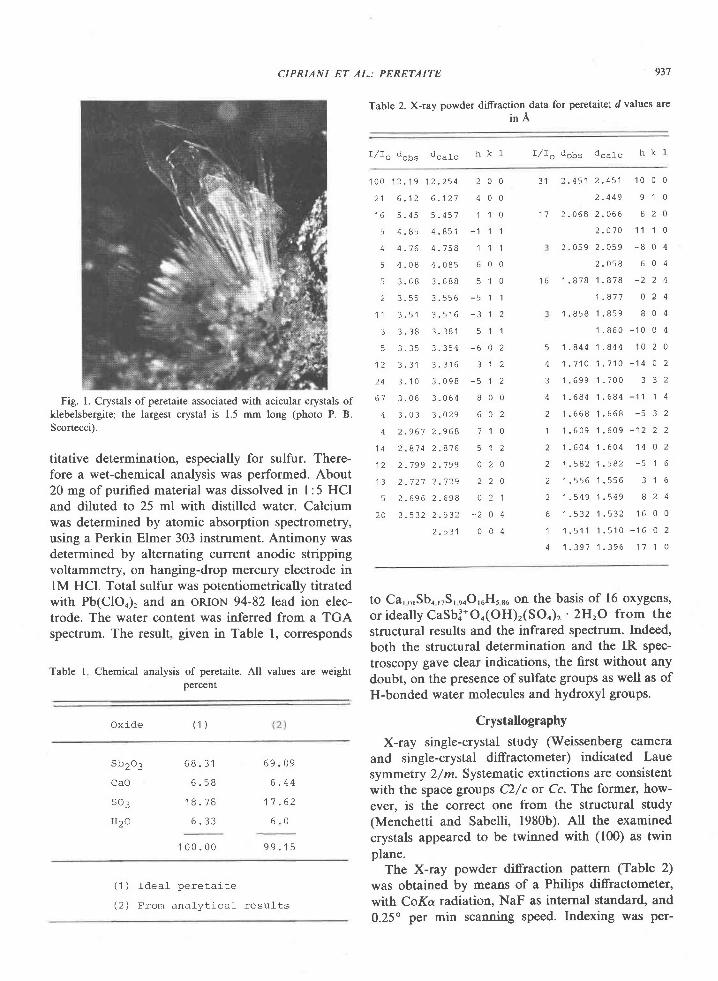
CIPRIANI ET AL.: PERETAITE 937
Table 2. X-ray powder diffraction-data for peretaite; d values are
i n A
r / 1 o d o b s d c a l c h k l I , / I o d e S s d c a l c h k I
1 0 0 1 2 . 1 9 1 2 . 2 5 4
2 1 6 . 1 2 6 . 1 2 1
1 6 5 . 4 5 5 - 4 5 1
s 4 . 8 5 4 . 8 5 1
4 4 . - 1 6 4 . 7 5 8
5 4 . 0 8 4 . 0 8 5
5 3 . 6 8 3 . 6 8 8
2 3 . 5 5 3 . 5 5 6
1 1 3 . 5 1 3 . 5 1 6
3 3 . 3 8 3 . 3 8 1
5 3 . 3 5 3 . 3 5 4
' t 2 3 . 3 1 3 . 3 1 6
2 4 3 . 1 0 3 . 0 9 8
6 7 3 . 0 6 3 . 0 6 4
4 3 . 0 3 3 . O 2 9
4 2 . 9 6 7 2 . 9 6 8
1 4 2 . 8 1 4 2 . 8 7 6
1 2 2 . 7 9 9 2 . 7 9 9
1 3 2 . 7 2 7 2 . 1 2 9
5 2 . 6 9 6 2 . 6 9 8
2 0 2 . 5 3 2 2 . 5 3 2
2 0 0
4 0 0
1 1 0
- 1 1 ' l
1 1 1
6 0 0
5 1 0
- 5 1 1
5 1 1
- 6 0 2
3 1 2
8 0 0
6 0 2
7 1 0
5 1 2
0 2 0
2 2 0
o 2 1
- 2 0 4
0 0 4
3 1 2 . 4 5 1 2 . 4 5 1 1 0 0 0
2 . 4 4 9 9 1 0
2 . 0 6 8 2 . 0 6 6 8 2 0
2 . 0 1 0 1 1 1 0
2 . 0 5 9 2 . 0 5 9 - 8 0 4
2 . 0 5 8 6 0 4
1 . 8 7 8 1 . 8 7 8 - 2 2 4
1 . 8 1 7 0 2 4
1 . 8 5 8 1 . 8 5 9 8 0 4
1 . 8 6 0 - 1 0 0 4
1 . 8 4 4 1 . 8 4 4 1 0 2 0
1 . 1 1 0 1 . 7 1 0 - 1 4 0 2
1 . 6 9 9 ' t . 7 0 0 3 3 2
1 . 6 8 4 1 . 6 8 4 - 1 1 ' l 4
1 . 6 6 8 1 . 6 6 8 - s 3 2
1 . 6 0 9 1 . 6 0 9 - 1 2 2 2
1 . 6 0 4 1 . 6 0 4 1 4 0 2
1 . 5 8 2 ' 1 . 5 8 2 - 5 1 6
1 . 5 5 6 1 . 5 5 6 3 1 6
1 . 5 4 9 1 . 5 4 9 8 2 4
1 . 5 3 2 1 . 5 3 2 1 6 0 0
1 . 5 1 1 1 . 5 ' t O - 1 6 0 2
1 . 3 9 7 1 . 3 9 6 1 7 1 0
1 1
1 6
Fig. l. Crystals of peretaite associated with acicular crystals ofklebelsbergite; the largest crystal is 1.5 mm long (photo P. B.Scortecci).
titative determination, especially for sulfur. There-fore a wet-chemical analysis was perfoflned. About20 mg of purified material was dissolved in I :5 HCIand diluted to 25 ml with distilled water. Calciumwas determined by atomic absorption spectrometry,using a Perkin Elmer 303 instrument. Antimony wasdetermined by alternating current anodic strippingvoltammetry, on hanging-drop mercury electrode inlM HCl. Total sulfur was potentiometrically titratedwith Pb(ClOo), and an oRIoN 94-82lead ion elec-trode. The water content was inferred from a TGAspectrum. The result, given in Table l, corresponds
Table I Chemical analysis of peretaite. All values are weightpercent
O x i d e ( 1 )
z - ) 3 1
to Ca, o,Sbo,rS' roO,uHr 86 on the basis of 16 oxygens,
or ideally CaSbi*O.(OH),(SO,), ' 2H,O from the
structural results and the infrared spectrum. Indeed,
both the structural determination and the IR spec-
troscopy gave clear indications, the first without any
doubt, on the presence ofsulfate groups as well as of
H-bonded water molecules and hydroxyl groups.
CrystallograPhy
X-ray single-crystal study (Weissenberg camera
and single-crystal diffractometer) indicated Laue
symmetry 2/m. Systematic extinctions are consistent
with the space groups A/c or Cc. The former, how-
ever, is the correct one from the structural study(Menchetti and Sabelli, 1980b). All the examined
crystals appeared to be twinned with (100) as twin
plane.The X-ray powder diffraction pattern (Table 2)
was obtained by means of a Philips diffractometer,
with CoKc radiation, NaF as internal standard, and
0.25o per min scanning speed. Indexing was per-
5
A
3
A
2
1
2
2
2
2
6
1
4
s b 2 o 3
CaO
so3
Hzo
6 8 . 3 1
6 . 5 8
1 8 . 7 8
6 . 3 3
6 9 . 0 9
6 . 4 4
1 7 . 6 2
6 . 0
9 9 . 1 5' l 0 0 . 0 0
( 1 )
( 2 )
T d o ^ l n a r o + : i t a
F r o m a n a l v f i c a l r e s u l t s
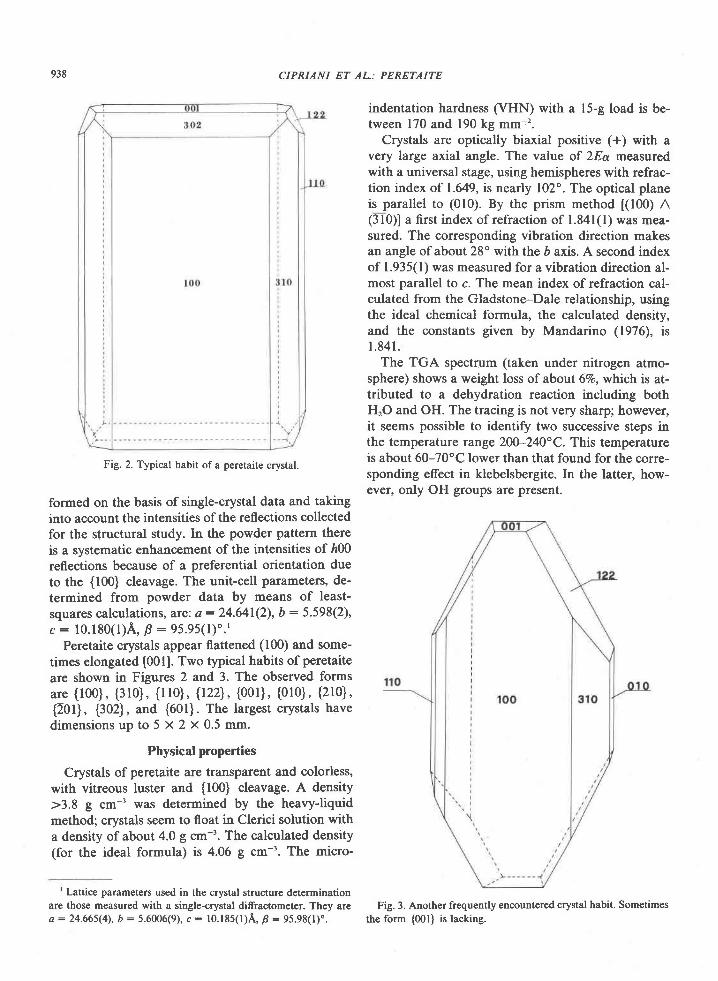
938 CIPRIANI ET AL.: PERETAITE
Fig. 2. Typical habit of a peretaite crystal.
formed on the basis of single-crystal data and takinginto account the intensities of the reflections collectedfor the structural study. In the powder pattern thereis a systematic enhancement of the intensities of ft00reflections because of a preferential orientation dueto the {100} cleavage. The unit-cell parameters, de-termined from powder data by means of least-squares calculations, are; a:24.641(2\, b : 5.598(2),c : 10.180(l)A, F : 95.95(l) ' . ' ,
Peretaite crystals appear flattened (100) and some-times elongated [001]. Two typical habits of peretaiteare shown in Figures 2 and 3. The observed formsare {100}, [310], fl10] , {r22}, {00U, {010} , QrO] ,{20U, {302}, and {601}. The largest crystals havedimensions up to 5 x 2 x 0.5 mm.
Physical properties
Crystals of peretaite are transparent and colorless,with vitreous luster and [l00] cleavage. A density>3.8 g cm-' was determined by the heavy-liquidmethod; crystals seem to float in Clerici solution witha density of about 4.0 g cm-3. The calculated density(for the ideal formula) is 4.06 g cm-'. The micro-
I Lattice parameters used in the crystal structure determinationare those measured with a single-crystal diffractometer. They area : 24.66s(4), 6 : 5.6006(9), c : 10. 185(l)A, F : 9s.98(l)'.
indentation hardness (VHN) with a l5-g load is be-tween 170 and 190 kg mm-'.
Crystals are optically biaxial positive (+) with avery large axial angle. The value of 2Ea measuredwith a universal stage, using hemispheres with refrac-tion index of 1.649, is nearly 102". The optical planeis parallel to (010). By the prism method [(100) n(310)la first index of refraction of 1.841(l) was mea-sured. The corresponding vibration direction makesan angle of about 28" with the 6 axis. A second indexof 1.935(1) was measured for a vibration direction al-most parallel to c. The mean index of refraction cal-culated from the Gladstone-Dale relationship, usingthe ideal chemical formula, the calculated density,and the constants given by Mandarino (1976), is1 .841.
The TGA spectrum (taken under nitrogen atmo-sphere) shows a weight loss of about 67o, which is at-tributed to a dehydration reaction including bothHrO and OH. The tracing is not very sharp; however,it seems possible to identify two successive steps inthe temperature range 2W-240"C. This temperatureis about 60-70'C lower than that found for the corre-sponding effect in klebelsbergite. In the latter, how-ever, only OH groups are present.
Fig. 3. Another frequently encountered crystal habit. Sometimesthe fqrm {001) is lacking.

N
zoo2=ozEF
CIPRIANI ET AL.: PERETAITE
W A V E L E N G T H ( P M )
2 0 0 0 1 8 0 0 1 6 0 0 1 4 0 0 1 2 0 0 1 0 0 0
F R E A U E N C Y ( C M - 1 )
Fig. 4. Infrared absorption spectrum ofperetait€.
The infrared spectrum was obtained from a potas-sium bromide disc containing peretaite. The pelletwas heated at l20oC for two hours. The spectrum,taken from 4000 to 400 cm-', is shown in Figure 4.The sharp absorption at 3310 cm-' due to the O-Hstretching mode supports the presence of hydroxylgroups, with H-bonds stronger than that of klebels-bergite, which has the same peak at 3435 cm-'. Theoccurrence ofa very broad band, ranging from 3500to 2500 cm-' with a maximum at about 3000 cm-',and of a weak band at 1640 cm-', indicates the pres-ence of water of hydration with strong H-bonds. Inklebelsbergite the corresponding peaks are absent: inthe structure of this mineral there are no water mole-cules (Menchetti and Sabelli, 1980a). Of the SOI-stretching vibrations, v., vr, and rr4 were observed, atfrequencies slightly different from klebelsbergite.The presence of z, (at 975 cm-') shows that the sul-fate tetrahedron is distorted. In addition rrr appears asa single peak and z, shows fewer structures than inklebelsbergite: this may be due to the presence of the
inversion center in the structure of peretaite and tomore strict selection rules.
AcknowledgmentsWe thank the sAMIN SpA Company (F. Principato) for sam-
pling permission, G. Sbrana and V. Schettino for obtaining andinterpreting the infrared spectrum, and A. Bencini, P. Cellini Le-gittimo, and G. Piccardi for the chemical analysis.
ReferencesCipriani, N., S. Menchetti and C. Sabelli (1980) Klebelsbergite
and another antimony mineral from Pereta, Tuscany, Italy.Neues Jahrb. Mineral. Monatsh.. 223-229.
Mandarino, J. A. (1976) The Gladstone-Dale relationship-PanI. Derivation of new constanrs. Can. Mineral., 14, 498-502.
Menchetti, S. and C. Sabelli (1980a) The crystal structure of kle-belsbcrgite, Sb4O4 (OH)2SOa. Am. Mineral., 65,931-935.
and _ ( 1980b) pereraite, CaSb+Oa(OH)z(SOa)2.2H2O: its atomic arrangement and twinning. Am. Min-eral., 65,940-946.
Manuscript received, April 2, 1980;accepted for publication, April 22, 1980.
American Mineralogist, Volume 65, pages 940-946, 1980
Peretaite, CaSbnOo(OH)2(SO4)2 '2HrOz its atomic arrangement and twinning
Su-vro MeNcnrrrr aNo CnseRn SenBLt t
CNR, Istituto di Mineralogia dell'UniversitdVia La Pira 4, 50121 Firenze, Italy
Abstract
Peretaite, CaSboOn(OHL(SOn), '2H2O, crystallizes in the monoclinic space group C2/c,with a: 24.665, b: 5.6006, c: 10.185A, F:95.98'. The structure was determined by Pat-terson and direct methods and refned by least-squares tecbnique to a final R index of 0.037.The dominant structural feature is the arrangement of the two independent Sb polyhedrainto sheets parallel to (100). The Ca ion is coordinated by six O and two HrO in a square anti-prism. These polyhedra are edge- 414 e6ms1-linked to SO4 groups into chains which run par-allel to the Sb-O sheets. The hydroxyl groups form hydrogen bonds between Sb-O sheetsand Ca-S chains; these bonds provide for the three-dimensional cohesion of the structure. Aninterpretation of twinning with (100) as twin plane is given.
Introduction
Peretaite is a new sulfate of antimony and calciumfound at Pereta, Tuscany, Italy. Its chemical formula,CaSboOo(OH)r(SOo),' 2I{2O, and other mineralogicaldata have been reported in the preceding article(Cipriani et al.,1980). It occurs ai aggregates oftabu-lar crystals, associated with quartz, pyrite, calcite,sulfur, gypsum, and other antimony minerals, stib-nite, valentinite, kermesite, and klebelsbergite. Kle-belsbergite and peretaite are the only tws Sb sulfateminerals so far known.
This study was undertaken to solve the crystalstnicture of peretaite and to investigate its possiblecrystal-chemical relationships with the structures ofklebelsbergite (Menchetti and Sabelli, 1980) and ofother synthetic Sb sulfates such as the anhydrousSbrO. '2SO. (Merciet et al . , 1975), SbrO. '3SO,(Mercier et al.,1976), SbuO,(SO4), (Bovin, 1976), andthe hydrate Sb,(OH),(SO')2.zH,O (Dolglade et al.,1978).
Experimental
For the X-ray structure analysis a small tabularcrystal (approx. 0.1 X 0.4 x 0.2 mm) was taken froman original sample of peretaite. Monoclinic symme-try and possible space groups C2/c and Cc were de-termined by Weissenberg photographs. The centro-symmetric space group C2/c was chosen for thestructure determination and was subsequently foundto be correct. The unit-cell dimensions, determined
0oo3-004x/80/09 l 0-0940$02.00
from 25 high-angle reflections measured on a four-circle automatic diffractometer, ate a : 24.665(4),b : 5 .6006(9) , c : 10.185( l )A, B : 95.98( l ) ' .
T[re sample used for intensity data collection andall other crystals tested for X-ray work were found tobe twinned. Figure I reports the reflection popu-
lation due to the whole twinned crystal and referred
to reciprocal lattice levels with k : 2n (levels with k: 2n*l can be represented by a similar scheme withft-odd lattice points occupied instead of ft-even ones).One can readily see that overlapping of points fromthe two individuals takes place only in the latticerows with I : 4n. From the intensities of 363 pairs ofwell-separated reflections (with I : 4n + 2) the rela-
tive volumes of the two members of the twin wereeasily computed. The knowledge of the volume ratio
so determined (A/B : 3.55i0.02) allowed the com-posite intensities of the overlapped reflections to besubdivided into the intensities of A and B individ-
uals, by solving the following equations:
I^r,: ltu, * lP,o,,
lo'*'r: lf 'o'r+I"ro,
where I is the observed intensity of the twinned crys-tal and [" and IB are the intensities of the two super-imposed reflections; h,k,l are the Miller indices of re-flections belonging to the A individual and h' : -(h
+ t), k' : k, Il : / those of overlapped reflections ofthe B individual of the twin. In conclusion, accordingto Friedel's (1926) notation, the crystals of peretaite
940
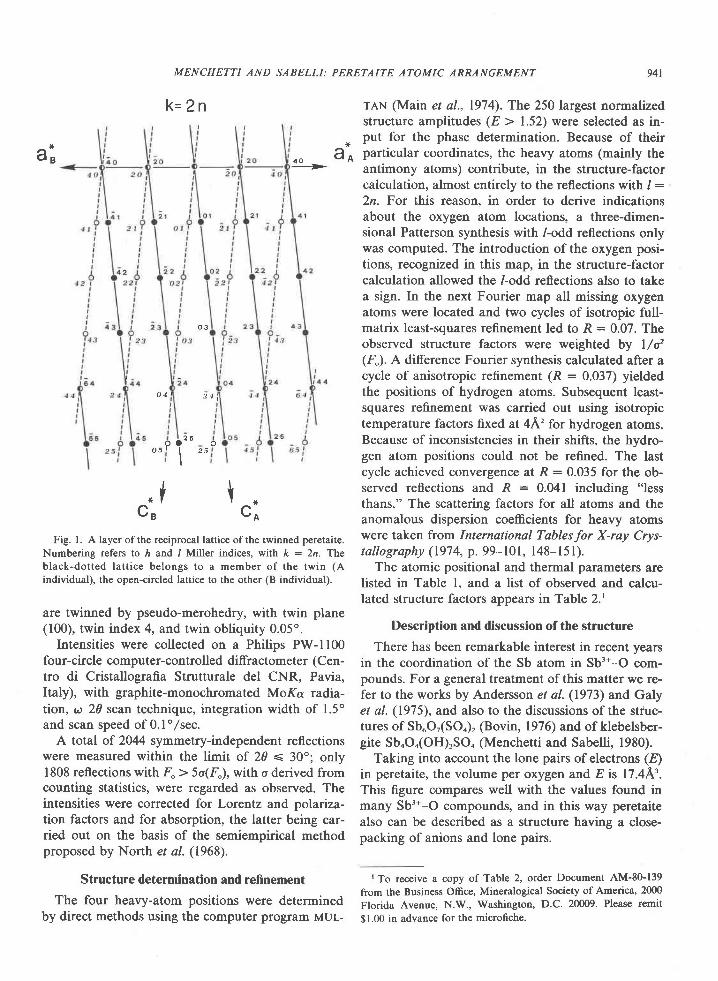
MENCHETTI AND SABELLI: PERETAITE ATOMIC ARRANGEMENT
k= 2n
941
a;
l l*l t *
C B C o
Fig. l. A layer ofthe reciprocal lattice ofthe twinned peretaite.
Numbering refers to h and I Miller indices, with ft : 2n. Theblack-dot ted lat t ice belongs to a memb€r of the twin (A
individual), the open-circled lattice to the other (B individual).
are twinned by pseudo-merohedry, with twin plane(100), twin index 4, and twin obliquity 0.05'.
Intensities were collected on a Philips PW-1100four-circle computer-controlled diffractometer (Cen-tro di Cristallografia Strutturale del CNR, Pavia,Italy), with graphite-monochromated MoKa radia-tion, a-20 scan technique, integration width of 1.5"and scan speed of 0.1",/sec.
A total of 2044 symmetry-independent reflectionswere measured within the limit of 20 < 30o; only1808 reflections with F" > 5o(F"), with o derived fromcounting statistics, were regarded as observed. Theintensities were corrected for Lorentz and polariza-tion factors and for absorption, the latter being car-ried out on the basis of the semiempirical methodproposed by North et al. (1968).
Structure determination and refinement
The four heavy-atom positions were determinedby direct methods using the computer program MUL-
reN (Main et al., 1974). The 250 largest normalizedstructure amplitudes (E > 1.52) were selected as in-put for the phase determination. Because of theirparticular coordinates, the heavy atoms (mainly theantimony atoms) contribute, in the structure-factorcalculation, almost entirely to the reflections with / :2n. For this reason, in order to derive indicationsabout the oxygen atom locations, a three-dimen-sional Patterson synthesis with /-odd reflections onlywas computed. The introduction of the oxygen posi-tions, recognized in this map, in the structure-factorcalculation allowed the /-odd reflections also to takea sign. In the next Fourier map all missing oxygenatoms were located and two cycles of isotropic full-matrix least-squares refinement led to R : 0.07. Theobserved structure factors were weighted by l/&(F"). A difference Fourier synthesis calculated after acycle of anisotropic refinement (R : 0.037) yieldedthe positions of hydrogen atoms. Subsequent least-squares refinement was carried out using isotropictemperature factors fixed at 4A'for hydrogen atoms.Because of inconsistencies in their shifts, the hydro-gen atom positions could not be refined. The lastcycle achieved convergence at R : 0.035 for the ob-served reflections and R : 0.041 including "lessthans." The scattering factors for all atoms and theanomalous dispersion coefficients for heavy atomswere taken from International Tables for X-ray Cry*tallography (197 4, p. 99-101, 148-15 l).
The atomic positional and thermal parameters arelisted in Table I, and a list of observed and calcu-lated structure factors appears in Table 2.'
Description and discussion of the structure
There has been remarkable interest in recent yearsin the coordination of the Sb atom in Sb'*-O com-pounds. For a general treatment of this matter we re-fer to the works by Andersson et al. (1973) and Galyet al. (1975), and also to the discussions of the struc-tures of SbuO?(SO4), (Bovin, 1976) and of klebelsber-gite Sb4O4(OH),SO. (Menchetti and Sabelli, 1980).
Taking into account the lone pairs of electrons (,E")in peretaite, the volume per oxygen and E is 17.4A'.This figure compares well with the values found inmany Sb3*-O compounds, and in this way peretaitealso can be described as a structure having a close-packing of anions and lone pairs.
tTo receive a copy of Table 2, order Document AM-80-139from the Business Office, Mineralogical Society of America, 2000Florida Avenue, N.W., Washington, D.C. 20009. Please remit
$1.00 in advance for the microfiche.
Jf
4 0 a A-|>
o 3
o 4
I
2
2 5
2 5
4 :
\
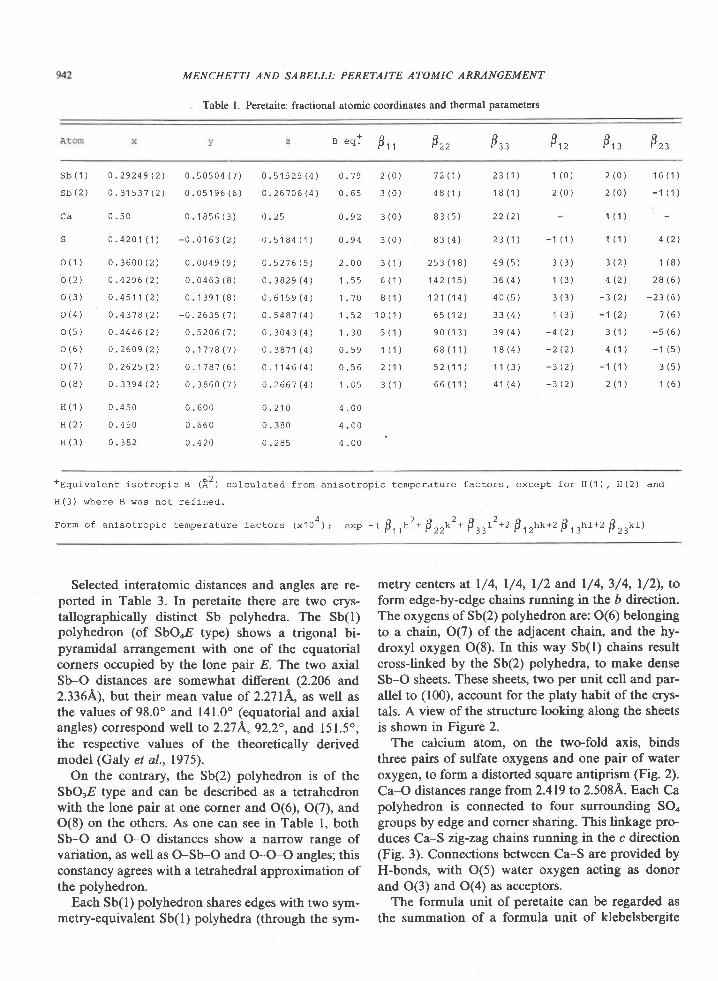
MENCHETTI AND SABELLI: PERETAITE ATOMIC ARRANGEMENT
Table l. Peretaite: fractional atomic coordinates and thermal par:rmeters
n e q l 0 , ,oP z z F,, F,, 9, , F^
s b ( 1 ) 0 . 2 9 2 4 9 1 2 )
s b ( 2 ) 0 . 3 1 s 3 7 ( 2 )
C a 0 . 5 0
s 0 . 4 2 0 1 ( 1 )
o ( 1 ) 0 . 3 6 0 0 ( 2 )
o ( 2 ) 0 . 4 2 9 6 ( 2 )
o ( 3 ) 0 . 4 5 1 1 ( 2 )
o ( 4 ) 0 . 4 3 7 8 ( 2 )
o ( s ) o . 4 4 4 6 ( 2 )
o ( 6 ) o . 2 6 0 9 ( 2 )
o ( 7 ) 0 . 2 6 2 5 ( 2 1
o ( 8 ) 0 . 3 3 9 4 ( 2 )
H ( 1 ) 0 . 4 5 0
H ( 2 ) 0 . 4 5 0
H ( 3 ) 0 . 3 8 2
0 . 5 0 s 0 4 ( 7 )
0 . 0 5 1 9 6 ( 6 )
0 . 1 8 5 6 ( 3 )
- 0 . 0 1 6 3 ( 2 )
0 . 0 0 4 9 ( 9 )
0 . 0 4 6 3 ( 8 )
0 . 1 3 9 1 ( 8 )
- 0 . 2 6 3 5 ( 7 )
0 . s 2 0 6 ( 7 )
0 . 1 7 7 8 ( 7 '
0 . 1 7 8 7 ( 6 )
0 . 3 8 6 0 ( 7 )
0 . 6 0 0
0 . 6 6 0
o . 4 2 0
0 . 5 1 5 2 5 ( 4 )
o . 2 6 7 0 6 ( 4 )
0 . 2 5
0 . s 1 8 4 ( ' l )
0 . 5 2 7 6 ( 5 )
0 . 3 8 2 9 ( 4 )
0 . 6 1 5 9 ( 4 )
0 . 5 4 8 7 ( 4 )
0 . 3 0 4 3 ( 4 )
0 . 3 8 7 1 ( 4 )
0 . 1 1 4 6 ( 4 )
0 . 2 6 6 7 ( 4 )
0 . 2 1 0
0 . 3 8 0
0 . 2 8 5
0 . 7 9 2 ( O )
0 . 6 s 3 ( 0 )
0 . 9 2 3 ( 0 )
o . 9 4 3 ( 0 )
2 . 0 0 3 ( 1 )
1 . 5 s 6 ( 1 )
1 . 7 0 8 ( 1 )' t . 5 2 1 0 ( 1 )' r . 3 0 5 ( 1 )
0 . s 9 1 ( 1 )
0 . s 6 2 ( 1 )
1 . 0 5 3 ( 1 )
4 . 0 0
4 . 0 0
4 . 0 0
2 ( 0 ) 1 6 ( 1 )
2 ( 0 ' t - 1 ( 1 )
1 ( 1 )
1 ( 1 ) 4 ( 2 )
3 ( 2 ) 1 ( 8 )
4 ( 2 ) 2 8 ( 6 )
- 3 ( 2 ) : 2 3 ( 6 )
- ' t ( 2 ) 7 ( 6 )
3 ( 1 ) - s ( 6 )
4 ( ' t t - 1 ( 5 )
- 1 ( 1 ) 3 ( s )
2 ( 1 ) 1 ( 6 )
7 2 ( 1 \
4 8 ( 1 )
8 3 ( 5 )
8 3 ( 4 )
2 5 3 ( 1 8 )
1 4 2 ( 1 5 )
1 2 1 ( 1 4 )
6 5 ( 1 2 )
9 0 ( 1 3 )
6 8 ( 1 1 )
5 2 ( 1 1 )
6 6 ( 1 1 )
23 ( ' , t )
1 8 ( 1 )
2 2 ( 2 1
2 3 ( 1 )
4 9 ( 5 )
3 6 ( 4 )
4 0 ( s )
3 3 ( 4 )
3 9 ( 4 )
1 8 ( 4 )
1 1 ( 3 )
4 1 ( 4 )
1 ( 0 )
2 ( 0 )
- 1 ( 1 )
3 ( 3 )
1 ( 3 )
3 ( 3 )
1 ( 3 )
- 4 ( 2 )
- 2 ( 2 )
- 3 ( 2 )
- 3 ( 2 1
+ E q u i v a l e n t i s o t r o p i c e ( E z ) c a l c u l a t e d f r o m a n i s o t r o p i c t e m p e r a t u r e f a c t o r s , e x c e p t f o r H ( 1 ) , H ( 2 ) a n d
H ( 3 ) w h e r e B w a s n o t r e f i n e d .
Form o f an j -so t rop ic tempera ture fac to rs (x104) : exp - ( 9 , , rn ' * F r ru ' * F r r r ' * t 9 , r rno* , B , r rn t+z 0r rn t )
Selected interatomic distances and angles are re-ported in Table 3. In peretaite there are two crys-tallographically distinct Sb polyhedra. The Sb(l)polyhedron (of SbOoE type) shows a trigonal bi-pyramidal arrangement with one of the equatorialcorners occupied by the lone pair E. The two axialSb-O distances are somewhat different (2.206 and2.3364), but their mean value of 2.271A, as well asthe values of 98.0" and 141.0" (equatorial and axialangles) correspond well to 2.274,92.2", and 15l.5o,ihe respective values of the theoretically derivedmodel (Galy et al.,1975).
On the contrary, the Sb(2) polyhedron is of theSbOrE type and can be described as a tetrahedronwith the lone pair at one corner and 0(6), O(7), andO(8) on the others. As one can see in Table l, bothSb-O and O-O distances show a narrow range ofvariation, as well as O-Sb-O and O-O-O angles; thisconstancy agrees with a tetrahedral approximation ofthe polyhedron.
Each Sb(l) polyhedron shares edges with two sym-metry-equivalent Sb(l) polyhedra (through the sym-
metry centers at l/4, l/4, l/2 and l/4,3/4, l/2), toform edge-by-edge chains running in the b direction.The oxygens ofSb(2) polyhedron are: 0(6) belongingto a chain, O(7) of the adjacent chain, and the hy-droxyl oxygen O(8). In this way Sb(l) chains resultcross-linked by the Sb(2) polyhedra, to make denseSb-O sheets. These sheets, two per unit cell and par-allel to (100), account for the platy habit ofthe crys-tals. A view of the structure looking along the sheetsis shown in Figure 2.
The calcium atom, on the two-fold axis, bindsthree pairs of sulfate oxygens and one pair of wateroxygen, to form a distorted square antiprism (Fig. 2).Ca-O distances range from2.419 to 2.508A. Each Capolyhedron is connected to four surrounding SO4groups by edge and corner sharing. This linkage pro-duces Ca-S zig-zag chains running in the c direction(Fig. 3). Connections between Ca-S are provided byH-bonds, with O(5) water oxygen acting as donorand O(3) and O(4) as acceptors.
The formula unit of peretaite can be regarded asthe summation of a formula unit of klebelsbergite
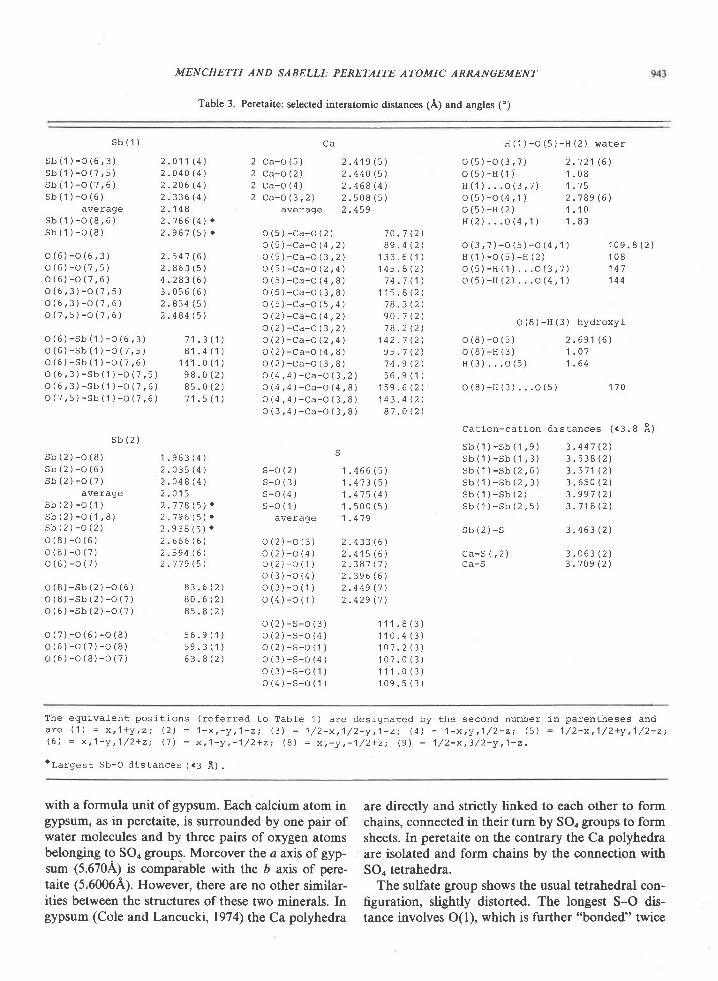
MENCHETTI AND SABELLI: PERETAITE ATOMIC ARRANGEMENT
Table 3 Peretaite: selected interatomic distances (A) and angles (o)
S b ( 1 ) c a H ( 1 ) - o ( 5 ) - H ( 2 ) w a r e r
s b ( ' 1 ) - o ( 6 , 3 ) 2 . 0 1 1 ( 4 ) 2 C a - o ( 5 ) 2 . 4 1 9 ( 5 ) o ( 5 ) - o ( 3 , 7 ) 2 . 7 2 1 ( 6 )s b ( 1 ) - o ( 7 , s ) 2 . 0 4 0 ( 4 ) 2 c a - o ( 2 ) 2 . 4 4 0 ( 5 ) o ( s ) - H ( 1 i 1 . 0 8s b ( 1 ) - o ( 7 , 6 ) 2 . 2 0 6 ( 4 ) 2 c a - o ( 4 ) 2 . 4 6 8 ( 4 ) H ( 1 ) . . . o ( 3 , 7 ) 1 . 7 5s b ( 1 ) - o ( 6 ) 2 . 3 3 6 ( 4 \ 2 c a - o ( 3 , 2 ) 2 . 5 0 8 ( s ) o ( 5 ) - o ( 4 , 1 ) 2 . 7 8 9 ( 6 1
a v e r a g e 2 . 1 4 8 a v e r a g e 2 . 4 5 9 O ( 5 ) - H ( 2 ) ' 1 . 1 0
s b ( 1 ) - o ( 8 , 6 ) 2 . 7 6 6 ( 4 ) . H ( 2 ) . . . o ( 4 , 1 ) 1 . 8 3s b ( 1 ) - o ( 8 ) 2 . 9 6 7 ( 5 ) o o ( s ) - c a - o ( 2 ) 7 0 . 7 ( 2 \
o ( s ) - c a - o ( 4 , 2 ) 8 9 . 4 ( 2 ) o ( 3 , 7 ) - - o ( 5 ) - o ( 4 , 1 ) 1 0 9 . 8 ( 2 )o ( 6 ) - o ( 6 ' 3 ) 2 . 5 4 7 ( 6 ) o ( 5 ) - c a - o ( 3 , 2 ) 1 3 3 . 6 ( 1 ) H ( 1 ) - o ( s ) - H ( 2 ) 1 0 8o ( 6 ) - o ( 7 , 5 ) 2 . 8 6 3 ( s ) o ( 5 ) - c a - o ( 2 , 4 ) 1 4 5 . 8 ( 2 ) o ( 5 ) - H ( 1 ) . . . o ( 3 . 7 ) 1 4 7o ( 6 ) - o ( 7 , 6 ) 4 . 2 8 3 ( 6 ) o ( s ) - c a - o ( 4 , 8 ) 1 4 . 7 ( 1 ) o ( 5 ) - H ( 2 ) . . . o ( 4 , l t 1 4 4o ( 6 , 3 ) - o ( 7 , 5 ) 3 . 0 s 6 ( 6 ) o ( 5 ) - c a - o ( 3 , 8 ) 1 1 5 . 8 ( 2 )o ( 6 ' 3 ) - o ( 7 , 6 ) 2 . 8 5 4 ( 5 ) o ( 5 ) - c a - o ( 5 , 4 ) 7 8 . 3 ( 2 )o ( 7 , s ) - o ( 7 , 6 ) 2 . 4 8 4 ( 5 ) o ( 2 ) - c a - o ( 4 , 2 1 9 0 . 1 ( 2 )
o ( 2 ) - c a - o ( 3 ' 2 ) 7 8 . 2 ( 2 ) o ( 8 ) - H ( 3 ) h v d r o x v r
o ( 6 ) - s b ( 1 ) - o ( 6 ' 3 ) 7 1 . 3 ( 1 ) o ( 2 ) - c a - o ( 2 , 4 t 1 4 2 . 7 ( 2 ) o ( 8 ) - o ( s ) 2 . 6 9 1 ( 6 )o ( 6 ) - s b ( 1 ) - o ( 7 , 5 ) 8 1 . 4 ( 1 ) o ( 2 ) - c a - o ( 4 , 8 ) e 5 . 7 ( 2 ) o ( 8 ) - H ( 3 ) 1 . 0 7o ( 6 ) - s b ( 1 ) - o ( 7 . 6 ) 1 4 1 . 0 ( 1 ) o ( 2 ) - c a - o ( 3 , 8 ) 7 4 . e ( 2 ) H ( 3 ) . . . o ( s ) 1 . 6 4o ( 6 ' 3 ) - s b ( 1 ) - o ( 7 , 5 ) 9 8 . 0 ( 2 ) o ( 4 , 4 ) - c a - o ( 3 , 2 ) s 6 . e ( 1 )o ( 6 ' 3 ) - s b ( 1 ) - o ( 7 , 6 ) 8 5 . 0 ( 2 ) o ( 4 , 4 ) - c a - o ( 4 . 8 ) 1 5 9 . 6 ( 2 ) o ( 8 ) - H ( 3 ) . . . o ( s ) 1 7 0o ( 7 ' s ) - s b ( 1 l , - o ( 7 , 6 ) 7 1 . 5 ( 1 ) o ( 4 , 4 ) - c a - o ( 3 , 8 ) 1 4 3 . 4 ( 2 )
o ( 3 , 4 ) - c a - o ( 3 , 8 ) 8 7 . 0 ( 2 )
Ca t i on -ca t i on d i s t ances (<3 .8 A )s b ( 2 )
sb(2)-o(8) 1.s63(D s Si l l l : : i l l ;3 ] : . i \ l i t is b ( 2 ) - 0 ( 6 ) 2 . 0 3 5 ( 4 ) s - o ( 2 ) 1 . 4 6 6 ( 5 ) s b ( 1 ) - s b ( 2 , 6 ) 3 . 5 - 1 1 ( 2 \s b ( 2 ) - o ( 7 ) 2 . o 4 8 ( 4 ) s - o ( 3 ) 1 . 4 - 7 3 ( 5 ) s b ( 1 ) - s b ( 2 , 3 ) 3 . 6 s 0 ( 2 )
a v e r a g e 2 . 0 1 5 s - o ( 4 ) 1 . 4 7 5 ( 4 ) s b ( 1 ) - s b ( 2 ) 3 . 9 9 7 ( 2 )s b ( 2 ) - o ( 1 ) 2 . 7 7 8 ( 5 ) . s - o ( 1 ) 1 . 5 0 0 ( 5 ) s b ( 1 ) - s b ( 2 , 5 ) 3 . 7 1 8 ( 2 )S b ( 2 ) - O ( 1 , 8 ) 2 . 7 9 6 ( 5 ) . a v e r a s e 1 . 4 7 9s b ( 2 ) - o ( 2 ) 2 . 9 3 8 ( s ) o s b ( 2 ) - s 3 . 4 6 3 ( 2 \o ( 8 ) - o ( 6 ) 2 . 6 6 6 ( 6 ) o ( 2 ) - o ( 3 ) 2 . 4 3 3 ( 6 )o ( 8 ) - o ( 7 ) 2 . s 9 4 ( 6 ) o ( 2 ) - o ( 4 ) 2 . 4 1 5 ( 6 ) c a - s ( , 2 ) 3 . 0 6 3 ( 2 )0 ( 6 ) - 0 ( 7 ) 2 . 7 7 9 ( s ) o ( 2 ) - o ( 1 ) 2 . 3 8 1 ( 7 ) c a - s 3 . 1 0 9 ( 2 )
o ( 3 ) - o ( 4 ) 2 . 3 e 6 ( 6 )o ( 8 ) - s b ( 2 ) - o ( 6 ) 8 3 . 6 ( 2 ) o ( 3 ) - o ( 1 ) 2 . 4 4 9 ( 7 )o ( 8 ) - s b ( 2 ) - o ( 7 ) 8 0 . 6 ( 2 ) o ( 4 ) - o ( 1 ) 2 . 4 2 9 ( 7 )o ( 6 ) - s b ( 2 ) - o ( 7 ) 8 s . 8 ( 2 )
o ( 2 ) - s - o ( 3 ) 1 1 1 . 8 ( 3 )o ( 7 ) - o ( 6 ) - o ( 8 ) 5 6 . 9 ( 1 ) o ( 2 ) - s - o ( 4 ) 1 1 0 . 4 ( 3 )o ( 6 ) - o ( 7 ) - o ( 8 ) s 9 . 3 ( 1 ) o ( 2 ) - s - o ( 1 ) 1 0 7 . 2 ( 3 )o ( 6 ) - o ( 8 ) - o ( 7 ) 6 3 . 8 ( 2 ) o ( 3 ) - s - o ( 4 ) 1 0 ? . 0 ( 3 )
o ( 3 ) - s - o ( 1 ) 1 1 1 . 0 ( 3 )o ( 4 ) - s - o ( 1 ) 1 0 9 . s ( 3 )
The equivalent posi t ions (referred to TabIe 1 ) are designated by the second number in parentheses anda r e ( ' 1 ) = x , 1 + y , z ; ( 2 ) = 1 - x , - y , 1 - z ; ( 3 ) = 1 / 2 - x , 1 / 2 - y , 1 - z ; ( 4 ) = 1 - x , y , 1 / 2 - 2 , ( 5 1 = 1 / 2 - x , 1 / 2 + y , 1 / 2 - z i( 6 ) = x , 1 - y , 1 / 2 + z ; ( 7 \ = x , 1 - y , - 1 / 2 + z ; ( 8 ) = x , - y , - 1 / 2 + z ; ( 9 ) = 1 / 2 - x , 3 / 2 - y , 1 - 2 .
' L a r g e s t S b - O d i s t a n c e s ( . 3 A ) .
with a formula unit of gypsum. Each calcium atom in are directly and strictly linked to each other to formgypsum, as in peretaite, is surrounded by one pair of chains, connected in their turn by SOo groups to formwater molecules and by three pairs of oxygen atoms sheets. In peretaite on the contrary the Ca polyhedrabelonging to SOo groups. Moreover the a axis of gyp- are isolated and form chains by the connection withsum (5.6704) is comparable with the D axis of pere- SOo tetrahedra.taite (5.6006A;. However, there are no other similar- The sulfate group shows the usual tetrahedral con-ities between the structures of these two minerals. In figuration, slightly distorted. The longest S-O dis-gypsum (Cole and Lancucki, 1974) the Ca polyhedra tance involves O(l), which is further "bonded" twice
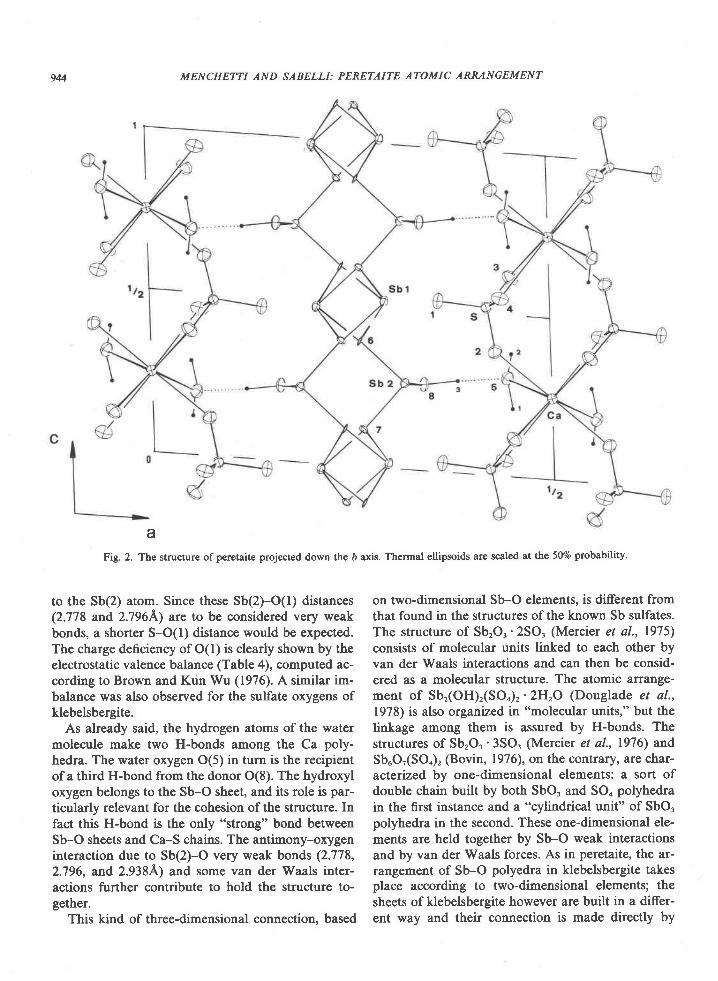
944 MENCHETTI AND SABELLI: PERETAITE ATOMIC ARRANGEMENT
aFig. 2. The structure of peretaite projected down the b axis. Therrnal ellipsoids are scaled al the 5Wo probability.
to the Sb(2) atom. Since these Sb(2)-O(l) distances(2.778 and 2.7964) are to be considered very weakbonds, a shorter S-O(l) distance would be expected.The charge deficiency of O(l) is clearly shown by theelectrostatic valence balance (Table 4), computed ac-cording to Brown and Kun Wu (1976). A similar im-balance was also observed for the sulfate oxygens ofklebelsbergite.
As already said, the hydrogen atoms of the watermolecule make two H-bonds among the Ca poly-hedra. The water oxygen O(5) in turn is the recipientof a third H-bond from the donor O(8). The hydroxyloxygen belongs to the Sb-O sheet, and its role is par-ticularly relevant for the cohesion of the structure. Infact this H-bond is the only "strong" bond betweenSb-O sheets and Ca-S chains. The antimony-oxygeninteraction due to Sb(2)-O very weak bonds (2.778,2.796, and 2.938A) and some van der Waals inter-actions further contribute to hold the structure to-gether.
This kind of three-dimensional connection. based
on two-dimensional Sb-O elements, is different fromthat found in the structures of the known Sb sulfates.The structure of SbrOr'2SO' (Mercier et al., 1975)consists of molecular units linked to each other byvan der Waals interactions and can then be consid-ered as a molecular structure. The atomic arrange-ment of Sbr(OH),(SOo),'2H"O (Douglade et al.,1978) is also organized in "molecular units," but thelinkage among them is assured by H-bonds. Thestructures of SbzO,'3SO, (Mercier et al., 1976) andSbuOr(SOn), (Bovin, 1976), on the contrary, are char-acterized by one-dimensional elements: a sort ofdouble chain built by both SbO, and SOo polyhedrain the first instance and a "cylindrical unit" of SbO,polyhedra in the second. These one-dimensional ele-ments are held together by Sb-O weak interactionsand by van der Waals forces. As in peretaite, the ar-rangement of Sb-O polyedra in klebelsbergite takesplace according to two-dimensional elements; thesheets of klebelsbergite however are built in a differ-ent way and their connection is made directly by

MENCHETTI AND SABELLI: PERETAITE ATOMIC ARMNGEMENT 945
I
Fig. 3. A projection ofperetaite down the a axis. Zig-zag Ca-Schains running in the c direction are shown.
means of SO4 groups. In addition to the above sul-
fates, many other Sb synthetic compounds are struc-
turally known. Some of these, such as the chlorideoxide SboOrCl, (Siirnstrand, 1978), show Sb'*-Opolyhedra arranged in two-dimensional nets, as inthe peretaite and klebelsbergite structures.
Table 4. Peretaite: electrostatic valence balance
A t o m S b ( 1 ) S b ( 2 ) C a t n ( t ) H ( 2 \ H ( 3 ) S u n
I ,' oo,Fig. 4. A view oftwinned peretaite: the A and B individuals of
th€ twin are drawn with solid and dashed lines respectively. Thc
unit cells are also outlined.
As concerns the change of the atomic arrangementresponsible for the twinning, it seems clear that the(100) twin plane pre-exists as a "pseudo" symmetryoperator in the Sb-O sheet, owing to the particularcoordinates of atoms involved. These "rigid" struc-tural slabs of an individual of the twin are practicallyinterchangeable with those of its mate. As Figure 4illustrates, the real change in the atomic arrangementtakes place in the "soft" part of the structure, startingfrom the SOo tetrahedron and affecting mainly theCa polyhedra.
References
Andersson, S., A. Astrcim, J. GaIy and G. Meunier (1973) Simplecalculation of bond lengths and bond angles in certain oxides,fluorides or oxide fluorides of Sb3*, Tea* and Pbz*. t. SolidState Chem.,4 187-190.
Bovin, J.-O. (1976) The crystal structure of the antimony (IIDoxide sulfate Sb6O7(SO4)2. Acta Crystallogr., 832, l77l-l'177.
Brown, I. D. and K. Kun Wu (1976) Empirical parameters for cal-culating cation-oxygen bond valences. Acta Crystallogr., 832,1957-r9s9.
o (1) 3:?3 1 . 4 0
1 . 5 6
1 - 5 2 0 . 2 2
1 . 5 2 0 . 2 0
1 . 7 9
1 . 9 6
1 . 9 1
0 . 7 8 0 . 8 0 0 . 2 3 2 . O 8
o ( 2 )
o ( 3 )
o ( 4 )
o ( s )
0 . 1 5 0 . 2 6
o . 2 2
o . 2 5
o . 2 7
o R qo ( 6 ) ; ' . ; ; 0 . 7 8
o ( 7 ) : ' : 9 o . i 6u - ) b
o(8) Z ' .1 : o .e2
2 . O 6
2 . 1 2
0 . 7 1 2 . 0 5
3 . 0 0 1 . 0 0 6 . 0 0 1 . 0 0 ' l . 0 0 1 . 0 0(x2)
Sum 3 . 0 0
MENCHETTI AND SABELLI: PERETAITE ATOMIC ARRANGEMENT
Cipriani, N., S. Menchetti, P. Orlandi and C. Sabelli (1980) Pere- for the Automatic Solution of Cryslal Structuresfrom X-ray Dif'
taite, CaSb4O4(OH)r(SO4)2 - 2H2O, a new mineral from Pere- fraction Data. Univercities of York, England, and Louvain-la-
ta, Tuscany, ltaly. Am. Mineral., 65,936-939. Neuve, Belgium.
Cole, W. F. and C. J. Lancucki (1974) A refinement of rhe crystal Menchetti, S. and C. Sabelli (1980) The crystal structure of kle-
structure of gypsum CaSOo . 2H2O. Acta Crystallogr., 830,921- belsbergite, Sb4O4(OH)rSOa. Am. Mineral., 65,931-935.
929. Mercier, R., J. Douglade and J. Bernard (1976) Structure cristal-
Douglade, J., R. Mercier and H. Vivier (1978) Structure cristalline line de Sb2O3 '3503. Acta Crystallogr., 832,278'l-2791.
de Sbr(OH)r(SO)2.2IJ2O. Acta Crystallogr.,834,3163-f168. -, - and F. Theobald (1975) Structure cristalline de
Friedel, G. (1926) Legons de Cristallographie. Berger-Levrault, Sb2O3'2SO3.ActaCrystallogr.,B3I,2O8l-2O85.
Paris. North, A. C. T., D. C. Phillips and F. S. Mathews (1968) A semi-
Galy, J., G. Meunier, S. Andersson and A. Astnim (1975) St€r€o- empirical method of absorption correction. Acta Crystallogr.,
chimie des 6l6ments comportant des paires non liees: Ge(II), A24,351-f59.
As(III), Se(IV), Br(V), Sn(II), Sb(IIf, Te(IV), I(Y), Xe(VI), Siirnstrand, C. (1978) The crystal structure of antimony (III) chlo-
T(I), Pb(II) et Bi(ID (oxydes, fluorures et oxyfluorures).,I. rideoxidesb4osCl2. ActaCrystallogr.,B34,2q2-2407.
Solid State Chem., 13, 142-159.International Tablesfor X-ray Crystallography, Vol IV (1974) Ky-
noch Press, Birmingham, England.Main, P., M. M. Woolfson, L. Lessinger, G. Germain and J. P. Manuscript received, April 2, 1980;
Declercq (1974) MULTAN 74. A System of Computer Programs accepted for publication, April 22, 1980.
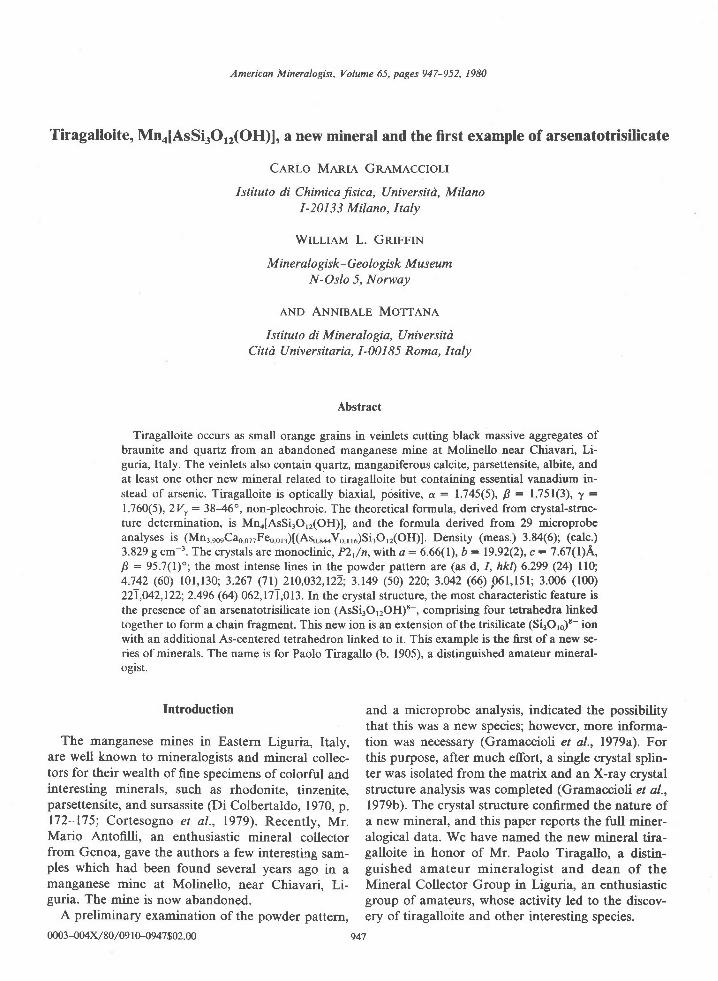
American Mineralogist, Volume 65, pages 947-952, 1980
Tiragalloite, Mnn[AsSi3Or2(OH)], a new mineral and the first example of arsenatotrisilicate
Cenro MaRre GReuRcctoLr
Istituto di Chimicafuica; Universitd, MilanoI-20133 Milano,Italy
Wrrlrau L. Gnrrrn
M iner al o gis k - G e o I o gis k M u s eumN-Oslo 5, Norway
AND ANNIBALE MOTTANA
I stituto di Mineralo gia, UniversitdCittd Universitaria, I-001 85 Roma, Italy
Abstract
Tiragalloite occurs as small orange grains in veinlets cutting black massive aggregates ofbraunite and quartz from an abandoned manganese mine at Molinello near Chiavari, Li-guria, Italy. The veinlets also contain quartz, manganiferous calcite, parsettensite, albite, andat least one other new mineral related to tiragalloite but containing essential vanadium in-stead of arsenic. Tiragalloite is optically biaxial, positive, a : 1.745(5), B : 1.751(3), t :1.760(5), 2V,: 3946", non-pleochroic. The theoretical formula, derived from crystal-struc-ture determination, is Mn [AsSi.O,r(OH)], and the formula derived from 29 microprobeanalyses is (MnrrorCaootrFeoo,r)[(AsossVo,6)Si]Or2(OH)1. Density (meas.) 3.84(6); (calc.)3.829 gcm-3. The crystals are monoclinic, Y),/n, with a : 6.66(l), b : 19.92(2), c : 7.670)4,B:95.7(l)"; the most intense lines in the powder pattern are (as d, I, hkl) 6.299 Q\ ll0;4.742 (60) l0l, l30; 3.267 (7r) 2tD,032,t22:3.149 (50) 220;3.M2 (66) p6l,l5l; 3.006 (100)221,042,122:2.496 (64) 062.17I,013. In the crystal structure, the most characteristic feature isthe presence of an arsenatotrisilicate ion (AsSirO,rOH)t-, comprising four tetrahedra linkedtogether to form a chain fragment. This new ion is an extension of the trisilicate (SirOto)E- ionwith an additional As-centered tetrahedron linked to it. This example is the fust of a new se-ries of minerals. The name is for Paolo Tiragallo (b. 1905), a distinguished amateur mineral-ogist.
Introduction
The manganese mines in Eastern Liguria, Italy,are well known to mineralogists and mineral collec-tors for their wealth of fine specimens of colorful andinteresting minerals, such as rhodonite, tinzenite,parsettensite, and sursassite (Di Colbertaldo, 1970, p.172-175; Cortesogno et al., 1979). Recently, Mr.Mario Antofilli, an enthusiastic mineral collectorfrom Genoa, gave the authors a few interesting sam-ples which had been found several years ago in amanganese mine at Molinello, near Chiavari, Li-guria. The mine is now abandoned.
A preliminary examination of the powder pattern,
o003-w4x / 80 / 09 l 0-0947$02.00
and a microprobe analysis, indicated the possibilitythat this was a new species; however, more informa-tion was necessary (Gramaccioli et al., 1979a). Forthis purpose, after much effort, a single crystal splin-ter was isolated from the matrix and an X-ray crystalstructure analysis was completed (Gramaccioh et al.,1979b). The crystal structure confirmed the nature ofa new mineral, and this paper reports the full miner-alogical data. We have named the new mineral tira-galloite in honor of Mr. Paolo Tiragallo, a distin-guished amateur mineralogist and dean of theMineral Collector Group in Liguria, an enthusiasticgroup of amateurs, whose activity led to the discov-ery of tiragalloite and other interesting species.
947
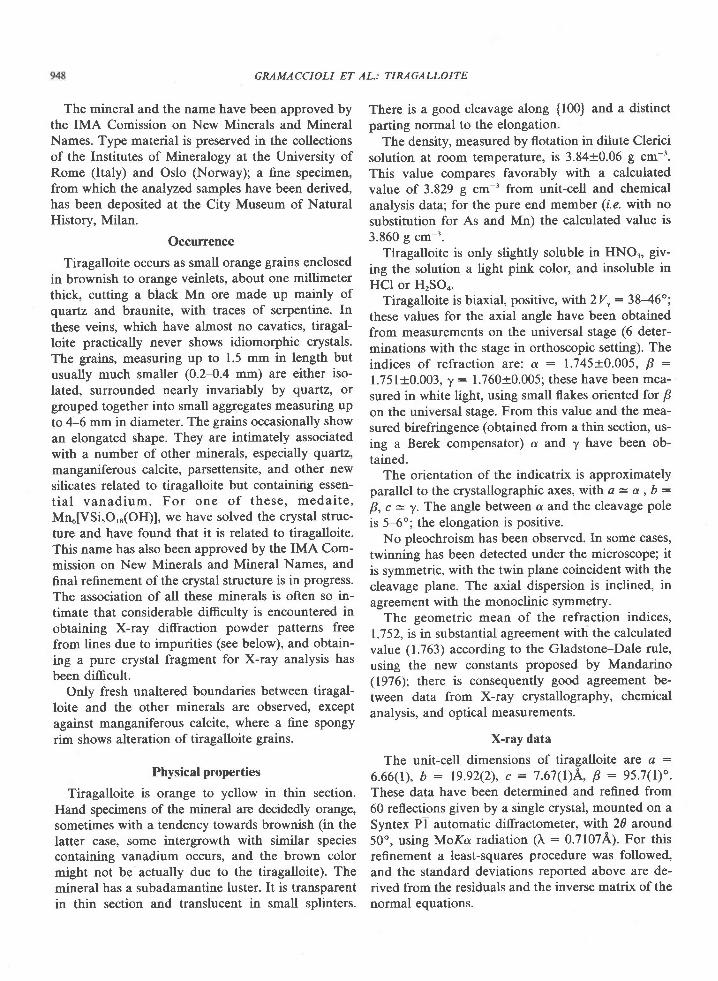
GRAMACCIOLI ET AL.: TIRAGALLOITE
The mineral and the name have been approved bythe IMA Comission on New Minerals and MineralNames. Type material is preserved in the collectionsof the lnstitutes of Mineralogy at the University ofRome (Italy) and Oslo (Norway); a fine specimen,from which the analyzed 5amples have been derived,has been deposited at the City Museum of NaturalHistory, Milan.
Occurrence
Tiragalloite occurs as small orange grains enclosedin brownish to orange veinlets, about one millimeterthick, cutting a black Mn ore made up mainly ofqnartz and braunite, with traces of serpentine. In
these veins, which have almost no cavaties, tiragal-loite practically never shows idiomorphic crystals.The grains, measuring up to 1.5 mm in length but
usually much smaller (0.2-0.4 mm) are either iso-
lated, surrounded nearly invariably by quartz, orgrouped together into small aggregates measuring upto 4-6 mm in diameter. The grains occasionally show
an elongated shape. They are intimately associatedwith a number of other minerals, especially qvartz,
manganiferous calcite, parsettensite, and other new
silicates related to tiragalloite but containing essen-t ia l vanadium. For one of these, medai te,Mnu[VSi,O,r(OH)], we have solved the crystal struc-ture and have found that it is related to tiragalloite.This name has also been approved by the IMA Com-mission on New Minerals and Mineral Names, andfinal refinement of the crystal structure is in progress.The association of all these minerals is often so in-timate that considerable difficulty is encountered inobtaining X-ray diffraction powder patterns freefrom lines due to impurities (see below), and obtain-ing a pure crystal fragment for X-ray analysis hasbeen difficult.
Only fresh unaltered boundaries between tiragal-loite and the other minerals are observed, exceptagainst manganiferous calcite, where a fine spongyrim shows alteration of tiragalloite grains.
Physical properties
Tiragalloite is orange to yellow in thin section.Hand specimens of the mineral are decidedly orange,sometimes with a tendency towards brownish (in thelatter case, some intergrowth with similar speciescontaining vanadium occurs, and the brown colormight not be actually due to the tiragalloite). Themineral has a subadamantine luster. It is transparentin thin section and translucent in small splinters.
There is a good cleavage along {100} and a distinctparting normal to the elongation.
The density, measured by flotation in dilute Clericisolution at room temperature, is 3.84+0.06 g cm-'.This value compares favorably with a calculatedvalue of 3.829 g cm-' from unit-cell and chemicalanalysis data; for the pure end member (1.e. with no
substitution for As and Mn) the calculated value is3.860 g cm-'.
Tlragalloite is only slightly soluble in HNOr, giv-
ing the solution a light pink color, and insoluble inHCI or HrSOo.
Tiragalloite is biaxial, positive, with2V,: 38-46";these values for the axial angle have been obtainedfrom measurements on the universal stage (6 deter-minations with the stage in orthoscopic setting). Theindices of refraction are: o. : 1.745=0.005, B :
1.751i0.003, y : 1.760t0.005; these have been mea-
sured in white light, using small flakes oriented for Bon the universal stage. From this value and the mea-sured birefringence (obtained from a thin section, us-ing a Berek compensator) a and y have been ob-tained.
The orientation of the indicatrix is approximatelyparallel to the crystallographic axes, with a = a , b :
B, c = y. The angle between a and the cleavage pole
is 5-6"; the elongation is positive.No pleochroism has been observed. In some cases,
twinning has been detected under the microscope; itis symmetric, with the twin plane coincident with thecleavage plane. The axial dispersion is inclined, in
agreement with the monoclinic symmetry.The geometric mean of the refraction indices,
1.7 52, is in substantial agreement with the calculatedvalue (1.763) according to the Gladstone-Dale rule,using the new constants proposed by Mandarino(1976); there is consequently good agreement be-tween data from X-ray crystallography, chemicalanalysis, and optical measurements.
X-ray data
The unit-cell dimensions of tiragalloite arc a :
6.66(l), b : 19.92(2), c : 7.67Q)4, B : 95.7(l) '.These data have been determined and refined from
60 reflections given by a single crystal, mounted on aSyntex PT automatic diffractometer, with 20 around50", using MoKa radiation (I : 0.71074). For thisrefinement a least-squares procedure was followed,and the standard deviations reported above are de-rived from the residuals and the inverse matrix of thenormal equations.
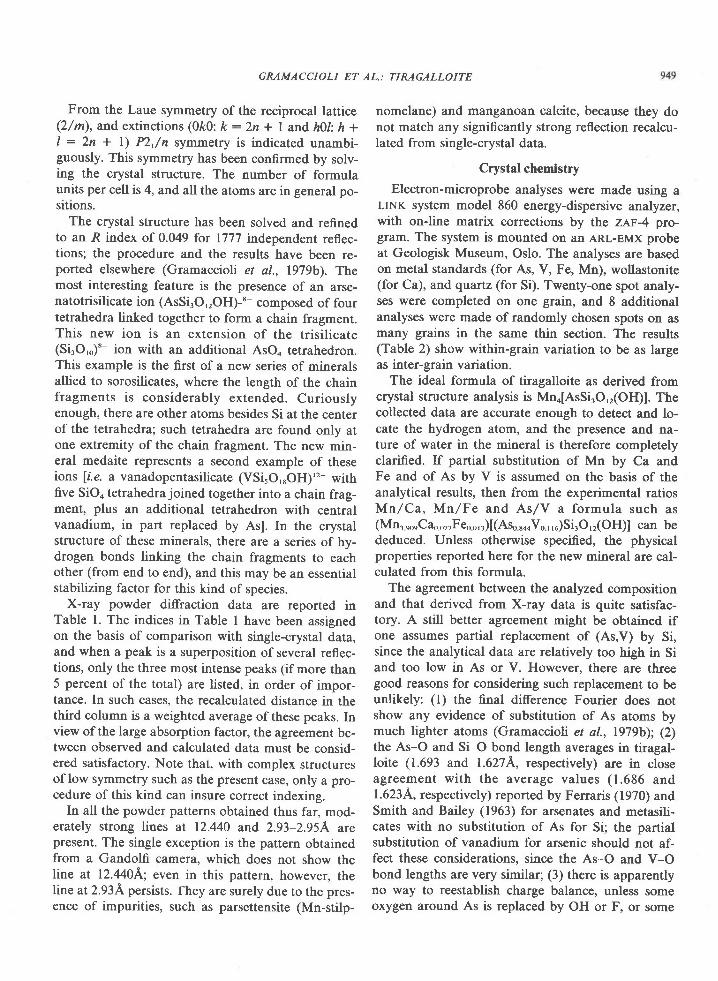
GMMACCIOLI ET AL,: TIRAGALLOITE
From the Laue symmetry of the reciprocal lattice(2/m), and extinctions (0k0: k : 2n + I and hDl: h +I : 2n + l) YZ,/n symmetry is indicated unambi-guously. This symmetry has been confirmed by solv-ing the crystal structure. The number of formulaunits per cell is 4, and all the atoms are in general po-sltlons.
The crystal structure has been solved and refinedto an R index of 0.049 for 1777 independent reflec-tions; the procedure and the results have been re-ported elsewhere (Gramaccioli et al., 1979b). Themost interesting feature is the presence of an arse-natotrisilicate ion (AsSi.O,rOH)-'- composed of fourtetrahedra linked together to form a chain fragment.This new ion is an extension of the trisi l icate(Si.O,o)'- ion with an additional AsOo tetrahedron.This example is the first of a new series of mineralsallied to sorosilicates, where the length of the chainfragments is considerably extended. Curiouslyenough, there are other atoms besides Si at the centerof the tetrahedra; such tetrahedra are found only atone extremity of the chain fragment. The new min-eral medaite represents a second example of theseions [r.e. a vanadopentasilicate (VSi,O,sOH)'r- withfive SiOo tetrahedra joined together into a chain frag-ment, plus an additional tetrahedron with centralvanadium, in part replaced by Asl. In the crystalstructure of these minerals, there are a series of hy-drogen bonds linking the chain fragments to eachother (from end to end), and this may be an essentialstabilizing factor for this kind of species.
X-ray powder diffraction data are reported inTable l. The indices in Table I have been assignedon the basis of comparison with single-crystal data,and when a peak is a superposition of several reflec-tions, only the three most intense peaks (if more than5 percent of the total) are listed, in order of impor-tance. In such cases, the recalculated distance in thethird column is a weighted average of these peaks. Inview of the large absorption factor, the agreement be-tween observed and calculated data must be consid-ered satisfactory. Note that, with complex structuresof low symmetry such as the present case, only a pro-cedure of this kind can insure correct indexing.
In all the powder patterns obtained thus far, mod-erately strong lines at 12.440 and 2.93-2.95A arepresent. The single exception is the pattern obtainedfrom a Gandolfi camera, which does not show theline at 12.440L; even in this pattern, however, theline at 2.93A persists. Ihey are surely due to the pres-ence of impurities, such as parsettensite (Mn-stilp-
nomelane) and manganoan calcite, because they donot match any significantly strong reflection recalcu-lated from single-crystal data.
Crystal chemistry
Electron-microprobe analyses were made using aLINK system model 860 energy-dispersive analyzer,with on-line matrix corrections by the zAF-4 pro-gram. The system is mounted on an ARL-EMX probeat Geologisk Museum, Oslo. The analyses are basedon metal standards (for As, V, Fe, Mn), wollastonite(for Ca), and quartz (for Si). Twenty-one spot analy-ses were completed on one grain, and 8 additionalanalyses were made of randomly chosen spots on asmany grains in the same thin section. The results(Table 2) show within-grain variation to be as largeas inter-grain variation.
The ideal formula of tiragalloite as derived fromcrystal structure analysis is Mn [AsSirO,dOH)]. Thecollected data are accurate enough to detect and 1o-cate the hydrogen atom, and the presence and na-ture of water in the mineral is therefore completelyclarified. If partial substitution of Mn by Ca andFe and of As by V is assumed on the basis of theanalytical results, then from the experimental ratiosMn/Ca, Mn/Fe and As/V a formula such as(Mn,
"orCao orrFeo o,r)[(Aso 844Vo,,5)Si3O,r(OH)] can be
deduced. Unless otherwise specified, the physicalproperties reported here for the new mineral are cal-culated from this formula.
The agreement between the analyzed compositionand that derived from X-ray data is quite satisfac-tory. A still better agreement might be obtained ifone assumes partial replacement of (As,V) by Si,since the analytical data arc relatively too high in Siand too low in As or V. However, there are threegood reasons for considering such replacement to beunlikely: (l) the final difference Fourier does notshow any evidence of substitution of As atoms bymuch lighter atoms (Gramaccioli et al., 1979b); (2)the As-O and Si-O bond length averages in tiragal-loite (1.693 and 1.6274, respectively) are in closeagreement with the average values (1.686 and1.6234, respectively) reported by Ferraris (1970) andSmith and Bailey (1963) for arsenates and metasili-cates with no substitution of As for Si; the partialsubstitution of vanadium for arsenic should not af-fect these considerations, since the As-O and V-Obond lengths are very similar; (3) there is apparentlyno way to reestablish charge balance, unless someoxygen around As is replaced by OH or F, or some
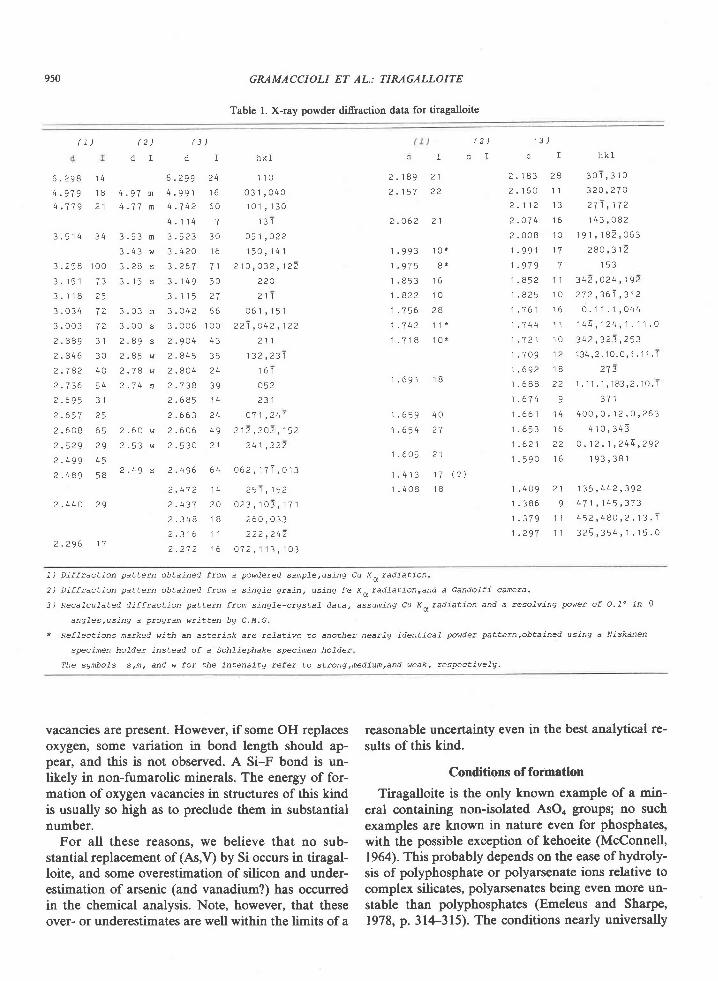
950 GRAMACCIOLI ET AL.: TIRAGALLOITE
Table l. X-ray powder diffraction data for tiragalloite
( 1 ) ( 2 ) ( j )
d I d I
6 . 2 9 9 2 4
4 . 9 7 n 4 . 9 9 1 1 6
4 . 7 7 n 4 . 7 4 2 6 0
4 , 1 1 4 7
3 . 5 3 m 3 . 5 2 3 3 0
3 . 4 3 w 3 . 4 2 O 1 6
3 . 2 8 s 3 . 2 6 7 7 1
3 . 1 5 s 3 . 1 4 9 5 0
J . r l ) 1 l
J . U J m J . V + Z O O
3 . O O s 3 . 0 0 6 1 o 0
2 . 8 9 s 2 . 9 O 4 4 3
2 . 8 5 w 2 . 8 4 5 3 5
2 . 7 8 w 2 . 8 O 4 2 4) 7 L < ) A 1 A ? O
2 . 6 8 5 1 4
? . 6 6 3 2 4
2 . 6 a w 2 . 6 A 6 4 9
2 . 5 3 w 2 . 5 3 4 2 1
2 . 4 9 s 2 . 4 9 6 6 4
h k 1
1 ' , I 0
0 3 1 , 0 4 0' 1 O 1 , 1 3 0
t J I
0 5 1 , O 2 2
1 5 0 , 1 4 1^ . ^ ^ ^ ^ . ^ Az t v r u J z , t a z
2 2 0
2 1 1
0 6 1 t 1 5 1
2 2 1 , A 4 2 , 1 2 2
1 3 2 , 2 3 1
t o I
o52
2 3 1
4 7 1 , 2 4 1
2 1 2 , 2 4 2 , 1 5 2
2 t 1 , 2 2 2
0 6 2 , 1 7 T , 0 1 3
2 5 1 , 1 5 2
0 2 3 , 1 0 3 , 1 7 1
2 6 O , O 3 3
2 2 2 , 2 4 2
o 7 2 , 1 1 3 , 1 4 3
( 2 ) ( 3 )
d L 0 r
2 , 1 8 3 2 a
2 . 1 6 0 1 1
2 . 1 1 2 1 3
2 . 0 7 4 1 6
2 . 008 ' , ] 0
1 . 9 9 1 1 7
1 . 9 7 9 7
1 . 4 5 2 1 1
1 . 8 2 5 1 0
1 . 7 6 1 1 6
1 . 7 4 4 1 1
1 . 7 2 1 1 o
1 . 7 0 9 1 2
1 . 6 9 2 1 8
1 . 6 8 8 2 2
1 . 6 7 4 9
1 . 6 6 1 1 4
1 . 6 5 3 1 6
1 . 6 2 1 2 2
1 . 5 9 O 1 6
( ? )
1 . 4 0 9 2 1
1 . 3 8 6 9
1 . 3 7 9 1 1
1 . 297 ' , ] i
h k 1
3 0 1 , 3 1 03 2 O , 2 7 O
2 7 1 , 1 7 21 4 3 , O 8 2
1 9 1 , 1 8 2 , 0 6 3
2 8 O , 3 1 2
1 5 3
3 4 2 , 0 2 4 , 1 9 22 7 2 , 3 6 i , 3 1 2
0 . 1 1 . 1 , O 4 4
1 4 4 , 1 2 4 , 1 . 1 1 . 0
3 4 2 , 3 2 3 t 2 5 31 3 4 , 2 . 1 0 . 0 , i . 1 1 . 1
2 7 3' 1 . 1 ' 1 . 1 , 1 8 3 , 2 . 1 0 . ' , I
3 7 1
4 A O , O . 1 2 . O , 2 6 3
4 1 O , 3 q 3
o . 1 2 . 1 , 2 4 4 , 2 9 2
1 9 3 , 3 8 1
1 3 5 , 4 4 2 , 3 9 2
4 7 1 , 1 4 5 , 3 7 3
4 5 2 , 4 8 O , 2 . 1 3 . 1
3 2 5 , 3 5 4 , 1 . 1 5 . 0
o
2 . 1 8 9
2 . 1 5 7
2 . 0 6 2
1 . 9 9 3
1 . 9 1 5
1 . 8 5 3
1 . 8 2 2
| / ) o
1 . 7 4 2
1 . 7 1 8
1 . 6 9 1
1 . 6 5 9
1 . 6 5 4
1 . 6 0 5
1 . 4 1 3
2 1
1 0 *
8 *
1 6
1 0
2 8
1 1 *
1 0 *
1 8
4 0
2 7
2 1
1 7
t o
I
2 1
2 26 . 2 9 8 1 4q . 9 7 9 1 8q , 7 7 9 2 1
3 . 5 1 4 3 4
3 . 2 5 8 1 0 0
3 . 1 5 1 7 3
3 . 1 1 8 2 5
3 . O 3 4 7 2
3 . 0 0 3 7 2
2 . 8 8 9 3 1
2 . 8 4 6 3 0
2 . 7 8 2 4 0
2 . 7 3 6 5 4
2 . 6 9 5 3 1
2 . 6 5 7 2 5
2 . 6 0 8 6 52 q 2 0 2 0
, l o o L q
2 . 4 8 9 5 8
2 . 4 4 0 2 9
2 . 4 7 2 1 4
2 . 4 3 7 2 0
2 . 3 4 8 1 B
2 . 3 1 6 1 1
2 . 2 7 2 1 6
7 ) D i f f r a c t i o n p a t t e t n o b t a i n e d f r o m a p o w d e t e d s a n p l e , u s i n q c u K d r a d i a t i o n .
2) Dif f ract ion paxtern obxained fram a singfe grain, using Fe Koradiat ion,and a Gandolf i canera.
3 ) R e c a l . c u L a t e d d i f f r a c t i o n p a t t e r n f t o n s i n g L e - c r g s t a L d a t a , a s s u m i n g C u K ^ r a d i a t i o n a n d a r e s o T v i n g p a w e r o f O . 1 o i n 0
L ' i i t r a h h t l a M Ca t t 9 t c > t u r t t t g a P L v g L 4 L '
* Retfect ions narked with an aster isk are tefat ive to another nearLg ident icaT powdet paxtern,obtained using a Niskanen
specinen haTder instead of a Schf iephake specinen hofdel
T h e s g n b o l s s , n , a n d w f o r t h e i n t e n s i t v r e f e r t o s t r o n g , n e d i u n , a n d w e a k , r e s p e c t i v e l g ,
vacancies are present. However, if some OH replacesoxygen, some variation in bond length should ap-pear, and this is not observed. A Si-F bond is un-likely in non-fumarolic rrinerals. The energy of for-mation of oxygen vacancies in structures of this kindis usually so high as to preclude them in substantialnumber.
For all these reasons, we believe that no sub-stantial replacement of (As,V) by Si occurs in tiragal-loite, and some overestimation of silicon and under-estimation of arsenic (and vanadium?) has occurredin the chemical analysis. Note, however, that theseover- or underestimates are well within the limits of a
reasonable uncertainty even in the best analytical re-sults of this kind.
Conditions of formation
Tiragalloite is the only known example of a min-eral containing non-isolated AsOo groups; no suchexamples are known in nature even for phosphates,with the possible exception of kehoeite (McConnell,1964). This probably depends on the ease ofhydroly-sis of polyphosphate or polyarsenate ions relative tocomplex silicates, polyarsenates being even more un-stable than polyphosphates (Emeleus and Sharpe,1978, p.314-315). The conditions nearly universally
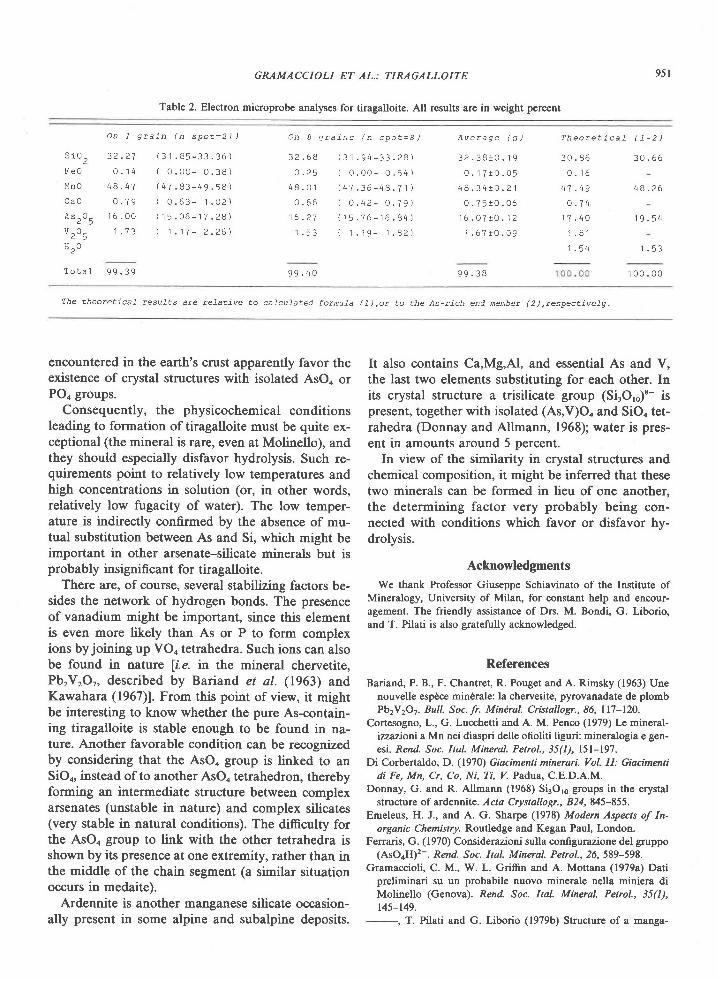
GRAMACCIOLI ET AL.: TIRAGALLOITE
Table 2. Electron microprobc analyses for tiragalloite. AII results are in weight percent
95r
O n I g r a i n ( n s p o t = 2 1 )
s i 0 2 3 2 . 2 7 ( 3 1 . 8 5 - 3 3 . 3 6 )
F e O o . 1 4 ( 0 . 0 0 - 0 . 3 8 )
M n o 4 8 . 4 7 ( 4 7 . 8 3 - 4 9 . 5 8 )
C a o O . 7 9 ( 0 . 6 3 - 1 . 0 2 )
A s 2 0 5 ' 1 6 . 0 o ( 1 5 . 0 6 - 1 7 . 2 8 )
v ^ 0 _ 1 . 7 3 ( 1 . 1 7 - 2 . 2 6 )
H e o
O n 8 g r a i n s / n s p o t = 8 )
3 2 . 6 A ( 3 1 . 9 4 - 3 3 . 2 8 )
o . 2 5 ( 0 . 0 0 - 0 . 5 4 )
4 8 . 0 1 ( 4 7 . 3 6 - 4 8 . 7 1 )
0 . 6 6 ( o . 4 2 - o . 1 9 )
1 6 . 2 7 t 1 5 . 7 6 - 1 6 . 8 4 )
1 . 5 3 { 1 . 1 9 - 1 . 8 2 )
T h a - r - f i - ' | / | - t )A v a r ) d a l ^ I
3 2 . 3 8 1 0 . 1 9
0 . 1 7 1 0 . 0 5
4 8 . 3 4 ! A . 2 1
0 . 7 5 1 0 . 0 6
1 6 . 0 7 l A . 1 2
1 . 6 7 ! 0 . 0 9
3 0 . 8 6
0 . ' 1 6
4 7 . 4 9
o . 7 4
1 7 . 4 0
1 . 8 1
1 . 5 4
3 0 . 6 6
4 8 . 2 6
1 9 . 5 4
1 . 5 3
T o t a l 9 9 . 3 9 9 9 . 4 0 9 9 . 3 8 I 0 0 . 0 0
T h e t h e o r e t ; c a . Z r e s u - Z t s a t e r e T a x i v e t a c a f c u f a t e d f o r m u l a ( 1 ) , a r t o x h e A s - t i c h e n d n e n b e t ( 2 ) , L e s p e c t i v e L g .
encountered in the earth's crust apparently favor theexistence of crystal structures with isolated AsOo orPOo groups.
Consequently, the physicochemical conditionsleading to formation of tiragalloite must be quite ex-ceptional (the mineral is rare, even at Molinello), andthey should especially disfavor hydrolysis. Such re-quirements point to relatively low temperatures andhigh concentrations in solution (or, in other words,relatively low fugacity of water). The low temper-ature is indirectly confirmed by the absence of mu-tual substitution between As and Si, which might beimportant in other arsenate-silicate minerals but isprobably insignificant for tiragalloite.
There are, of course, several stabilizing factors be-sides the network of hydrogen bonds. The presenceof vanadium might be important, since this elementis even more likely than As or P to form complexions by joining up VOn tetrahedra. Such ions can alsobe found in nature [le. in the mineral chervetite,Pb,V,O,, described by Bariand et al. (1963) andKawahara (1967). From this point of view, it mightbe interesting to know whether the pure As-contain-ing tiragalloite is stable enough to be found in na-ture. Another favorable condition can be recognizedby considering that the AsOo group is linked to anSiOo, instead of to another AsOo tetrahedron, therebyforming an intermediate structure between complexarsenates (unstable in nature) and complex silicates(very stable in natural conditions). The difficulty forthe AsOo group to link with the other tetrahedra isshown by its presence at one extremity, rather than inthe middle of the chain segment (a sirnilar situationoccurs in medaite).
Ardennite is another manganese silicate occasion-ally present in some alpine and subalpine deposits.
It also contains Ca,Mg,Al, and essential As and V,the last two elements substituting for each other. Inits crystal structure a trisilicate group (SirO,o)'- ispresent, together with isolated (As,V)Oo and SiOn tet-rahedra (Donnay and Allmann, 1968); water is pres-ent in amounts around 5 percent.
In view of the similarity in crystal structures andchemical composition, it might be inferred that thesetwo minerals can be formed in lieu of one another,the determining factor very probably being con-nected with conditions which favor or disfavor hv-drolysis.
AcknowledgmentsWe thank Professor Giuseppe Schiavinato of the Institute of
Mineralogy, University of Milan, for constant help and encour-agement. The friendly assistance of Drs. M. Bondi, G. Liborio,and T. Pilati is also gratefully acknowledged.
References
Bariand, P. B., F. Chantret, R. Pouget and A. Rirnsky (1963) Unenouvelle espdce min€rale: la chervetite, pyrovanadate de plombPb2V2O?. Bull. Soc. fr. MinCral. Cristallogr., 86, ll7-120.
Cortesogno, L., G. Lucchetti and A. M. Penco (1979) Le mineral-izzazioni a Mn nei diaspri delle ofioliti liguri: mineralogia e gen-esi. Rend. Soc. Ital. Mineral. Petrol., 35(I), l5l-197.
Di Corbertaldo, D. (1970) Giacimenti minerari. Vol. II: Giacimentidi Fe, Mn, Cr, Co, Ni, Ti, V. Padua, C.E.D.A.M.
Donnay, G. and R. Allmann (1968) Si3oro groups in the crystalstructure of ardennite. Acta Crystallogr., 824,845-855.
Emeleus, H. J., and A. G. Sharpe (1978\ Modern Aspects of In-organic Chemistry. Routledge and Kegan Paul, London.
Ferraris, G. (1970) Considerazioni sulla configurazione del gruppo(AsOrH)2-. Rend. Soc. Ital. Mineral. Petrol., 26,589-598.
Gramaccioli, C. M., W. L. Griffin and A. Mottana (1979a) Datipreliminari su un probabile nuovo minerale nella miniera diMolinello (Genova). Rend. Soc. Ital. Mineral. Petrol., 35(1),145-t49.
- T. Pilati and G. Liborio (1979b) Structure of a manga-
9s2 GRAMACCIOLI ET AL,: TIRAGALLOITE
nese(Il) ar.senatotrisilicate Mn lAsSi3Ol2(OH)l: the presence ofa new tetrapolyphosphate-like anion. Acta Crystallogr., Bj5,2287-229r.
Kawahara, A. (1967) La structure cristalline de la chervetite. BUJI.Soe. fr. MinCraI. Cristallogr., 90,279-284.
Mandarino, J. A. (1976) The Gladstone-Dale relationship. Pan I:derivation ofnew constants. Can. Mineral., 14,498-502.
McConnell, D. ( 1964) A zinc phosphate analogue of analciqe: ke-
hoeite. Mineral. Mag., 3 3, 799-803.
Smith, J. V. and S. W. Bailey (1963) Second review of Al-O and
Si-O tetrahedral distances. Acta Crystallogr., /4 801-811.
Manuscript received, February 27, 1980;acceptedfor publication, May 8, 1980.
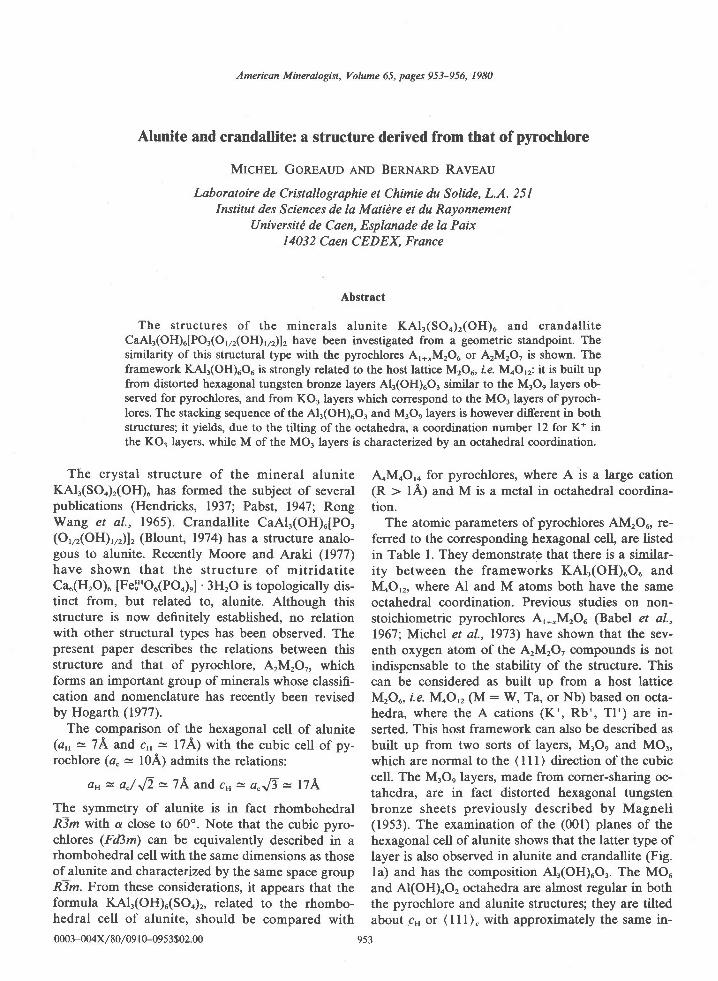
American Mineralogisl, Volume 65, pages 953-956, 1980
Alunite and crandallite: a structure derived from that of pyrochlore
MIcHEL Gonrauo AND BERNARD RAvEAU
Laboratoire de Cristallographie et Chimie du Solide, L.A. 251Institut des Sciences de la Matiire et du Rayonnement
Universiti de Caen, Esplanade de la Paix14032 Caen CEDEX, France
Abstract
The structures of the minerals alunite KAl3(S04)r(OH)6 and crandall iteCaAl3(OH)u[PO3(Or/r(OH)r,r)1, have been investigated from a geometric standpoint. Thesimilarity of this structural type with the pyrochlores A'*"M2O6 or A2M2O7 is shown. Theframework KAI3(OH)6O6 is strongly related to the host lattice M2O6, i.e. MoOr;- it is built upfrom distorted hexagonal tungsten bronze layers Al3(OH)uO, similar to the M3Oe layers ob-served for pyrochlores, and from KO, layers which correspond to the MO3 layers of pyroch-lores. The stacking sequence of the Alr(OH)uO, and M3Oe layers is however different in bothstructures; it yields, due to the tilting of the octahedra, a coordination number 12 for K* inthe KOr layers, while M of the MO, layers is characterized by an octahedral coordination.
The crystal structure of the mineral aluniteKAl3(SO4)r(OH)u has formed the subject of severalpublications (Hendricks, 1937; Pabst, 1947; RongWang et al., 1965). Crandallite CaAI.(OH).[PO,(O,/r(OH),/r)1, (Blount, 1974) has a structure analo-gous to alunite. Recently Moore and Araki (1977)have shown that the structure of mitridatiteCa.(H,O)u [Fef'Ou(PO.)n] .3H,O is topologically dis-tinct from, but related to, alunite. Although thisstructure is now definitely established, no relationwith other structural types has been observed. Thepresent paper describes the relations between thisstructure and that of pyrochlore, A2M2O7, whichforms an important group of minerals whose classifi-cation and nomenclature has recently been revisedby Hogarth (1977).
The comparison of the hexagonal cell of alunite(a, = 74. and cH = l7A) with the cubic cell of py-rochlore (a. = l0A) admits the relations:
ar= a"/J2 = 7A and cu= a"Jj = l7A
The symmetry of alunite is in fact rhombohedralRiz with d close to 60". Note that the cubic pyro-chlores (Fd3m) can be equivalently described in arhombohedral cell with the same dimensions as thoseof alunite and characterized by the same space groupRiz. From these considerations, it appears that theformula KAl3(OH)6(SOn)r, related to the rhombo-hedral cell of alunite, should be compared with0003-004x/80/09 I M953$02.00
&MoO,o for pyrochlores, where A is a large cation(R > lA) and M is a metal in octahedral coordina-tion.
The atomic parameters of pyrochlores AM2O., re-ferred to the corresponding hexagonal cell, are listedin Table 1. They demonstrate that there is a sinilar-ity between the frameworks KAlr(OH)uOu andMoO,r, where Al and M atoms both have the sameoctahedral coordination. Previous studies on non-stoichiometric pyrochlores Ar*,M2Ou (Babel et al.,1967; Michel et al., 1973) have shown that the sev-enth oxygen atom of the ArMrO, compounds is notindispensable to the stability of the structure. Thiscan be considered as built up from a host latticeMrOu, i.e. MoO,, (M : W, Ta, or Nb) based on octa-hedra, where the A cations (K*, Rb*, Tl*) are in-serted. This host framework can also be described asbuilt up from two sorts of layers, MrOn and MOr,which are normal to the ( I I I ) direction of the cubiccell. The MrO, layers, made from corner-sharing oc-tahedra, are in fact distorted hexagonal tungstenbronze sheets previously described by Magneli(1953). The examination of the (001) planes of thehexagonal cell of alunite shows that the latter type oflayer is also observed in alunite and crandallite (Fig.la) and has the composition Al3(OH)uOr. The MOuand Al(OH)oO, octahedra are almost regular in boththe pyrochlore and alunite structures; they are tiltedabout c" or (lll). with approximately the same in-
953
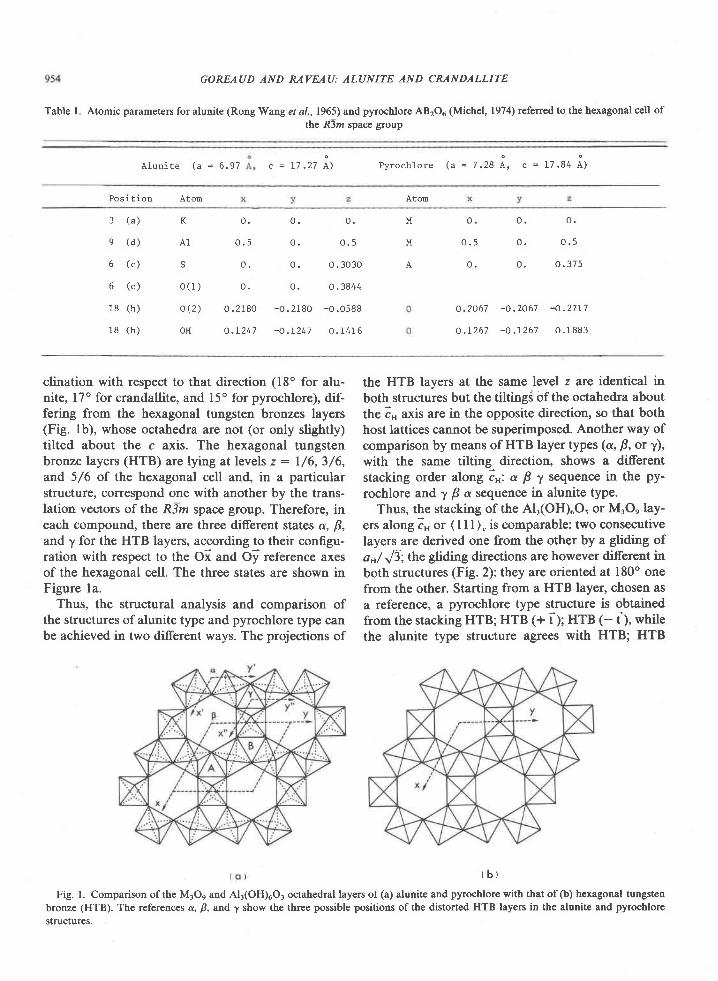
GOREAUD AND RAVEAU: ALUNITE AND CRANDALLITE
Table I Atomic parameters for alunite (Rong Wang et al., 1965) and pyrochlor€ AB2O5 (Michel, 1974) referred to the hexagonal cell of
the R3nr spac€ group
A l u n i t e ( a = 6 . 9 7 ^ - r f t ? l \ Pyroch lo re ( 6 = 7 . 28 A , c = 17 .84 A )
Po s i t ion Atom Atom
3 ( a )
e ( d )
6 ( c )
6 ( c )
1 8 ( h )
1 8 ( h )
K 0 . 0 .
A 1 0 . 5 0 .
s o . 0 .
0 . 0 . 0 ,
0 . 5 0 . o . 5
M
M
A
o .
0 . 5
o ( 1 ) o . o .
0 ( 2 ) 0 . 2 1 8 0 - 0 . 2 1 8 0
o H o . t 2 4 7 - O . r 2 4 l
0 . 3 0 3 0
0 . 3844
-o .0588
o . 1 4 1 6
o . o , 0 . 3 7 5
o .2067 -o .2067 -O .2717
o . t 2 6 t - o , t 2 6 7 0 . 1 8 8 3
clination with respect to that direction (l8o for alu-nite, l7o for crandallite, and 15" for pyrochlore), dif-fering from the hexagonal tungsten bronzes layers(Fig. lb), whose octahedra are not (or only slightly)tilted about the c axis. The hexagonal tungstenbronze layers (HTB) are lying at levels z : l/6,3/6,and 5/6 of the hexagonal cell and, in a particularstructure, correspond one with another by the trans-lation vectors of the R3z space group. Therefore, ineach compound, there are three different states a, B,and y for the HTB layers, according to their configu-ration with respect to the Oi and Of reference axesof the hexagonal cell. The three states are shown inFigure la.
Thus, the structural analysis and comparison ofthe structures of alunite type and pyrochlore type canbe achieved in two different ways. The projections of
the HTB layers at the same level z are identical inboth structures but the tilting$ of the octahedra aboutthe Z, axis are in the opposite direction, so that bothhost lattices cannot be superimposed. Another way ofcomparison by means of HTB layer types (a, B, or y);with the same tilting direction, shows a di-fferentstacking order along i.: a B y sequence in the py-rochlore and y B d sequence in alunite type.
Thus, the stacking of the Alr(OH)uO, or MrO" lay-ers along Z" or ( I I I ). is comparable: two consecutivelayers are derived one from the other by a gliding ofar/ Ji; the gliding directions are however different inboth structures (Fig. 2): they are oriented at l80o onefrom the other. Starting from a HTB layer, chosen asa reference, a pyrochlore type structure is obtainedfrom the stacking HTB; HTB (+ t); HTB 1- i;, whilethe alunite type structure agr€es with HTB; HTB
( b )
Fig. l. Comparison of the M3O" and AI3(OH)6O3 octahedral layers of (a) alunite and pyrochlore with that of (b) hexagonal tungsten
bronze (HTB). The references a, B, and 7 show the three possible positions of the distorted HTB layers in the alunite and pyrochlore
structures.
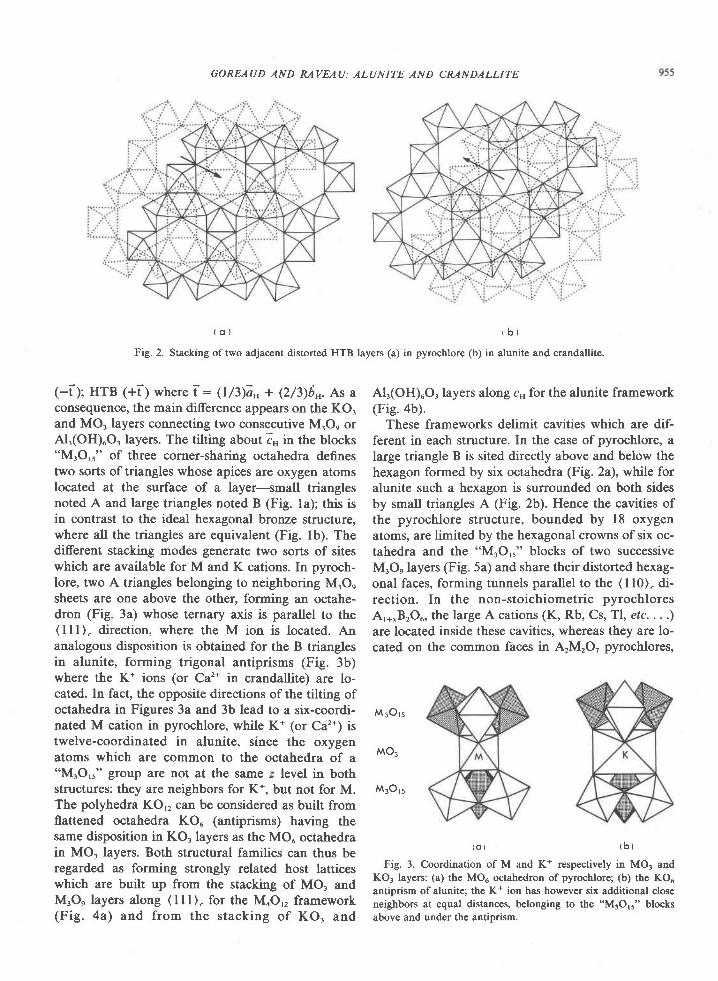
t o t
Fig. 2. Stacking of two adjacent distorted HTB
(-i); HTB (+l) where T: 0/l)i" + (2ft)6,. As aconsequence, the main difference appears on the KO.and MO, layers conaecting two consecutive MrO, orA13(OH)6O3 layers. The tilting about Z" in the blocks"M3O15" of three corner-sharing octahedra definestwo so(s of triangles whose apices are oxygen atomslocated at the surface of a layer-small trianglesnoted A and large triangles noted B (Fig. la); this isin contrast to the ideal hexagonal bronze structure,where all the triangles are equivalent (Fig. lb). Thedifferent stacking modes generate two sorts of siteswhich are available for M and K cations. In pyroch-lore, two A triangles belonging to neighboring MrOnsheets are one above the other, forming an octahe-dron (Fig. 3a) whose ternary axis is parallel to the(lll)" direction, where the M ion is located. Ananalogous disposition is obtained for the B trianglesin alunite, forming trigonal antiprisms (Fig. 3b)where the K* ions (or Ca2* in crandallite) are 1o-cated. In fact, the opposite directions of the tilting ofoctahedra in Figures 3a and 3b lead to a six-coordi-nated M cation in pyrochlore, while K* (or Ca'*) istwelve-coordinated in alunite, since the oxygenatoms which are common to the octahedra of a"M3O,r" group are not at the same z level in bothstructures: they are neighbors for K*, but not for M.The polyhedra KO,, can be considered as built fromflattened octahedra KO. (antiprisms) having thesame disposition in KO, layers as the MOu octahedrain MO3 layers. Both structural families can thus beregarded as forming strongly related host latticeswhich are built up from the stacking of MO, andMrOn layers along (lll). for the I\[oO,, framework(Fig. 4a) and from the stacking of KO, and
GOREAUD AND RAVEAU: ALUNITE AND CRANDALLITE
( b )
layers (a) in pyrochlore (b) in alunite and crandallite.
AI3(OH)"O. layers along c" for the alunite framework
Gig. ab).These frameworks delimit cavities which are dif-
ferent in each structure. In the case of pyrochlore, alarge triangle B is sited directly above and below thehexagon formed by six octahedra (Fig. 2a), while foralunite such a hexagon is surrounded on both sidesby small triangles A (Fig. 2b). Hence the cavities ofthe pyrochlore structure, bounded by 18 oxygenatoms, are limited by the hexagonal crowns of six oc-tahedra and the "M3O,5" blocks of two successiveMrO, layers (Fig. 5a) and share their distorted hexag-onal faces, forming tunnels parallel to the ( I l0). di-rection. In the non-stoichiometric pyrochloresAr*"B2Ou, the large A cations (K, Rb, Cs, Tl, etc. . . .)are located inside these cavities, whereas they are lo-cated on the common faces in A2M2O' pyrochlores,
M r o r s
MOr
Msots
( o ) ( b )
Fig. 3. Coordination of M and K* respectively in M03 andKO3 layers: (a) the MO6 octahedron of pyrochlore; (b) the KOuantiprism of alunite; the K* ion has however six additional closeneighbors at equal distances, belonging to the "M3O15" blocksabove and under the antiprism.
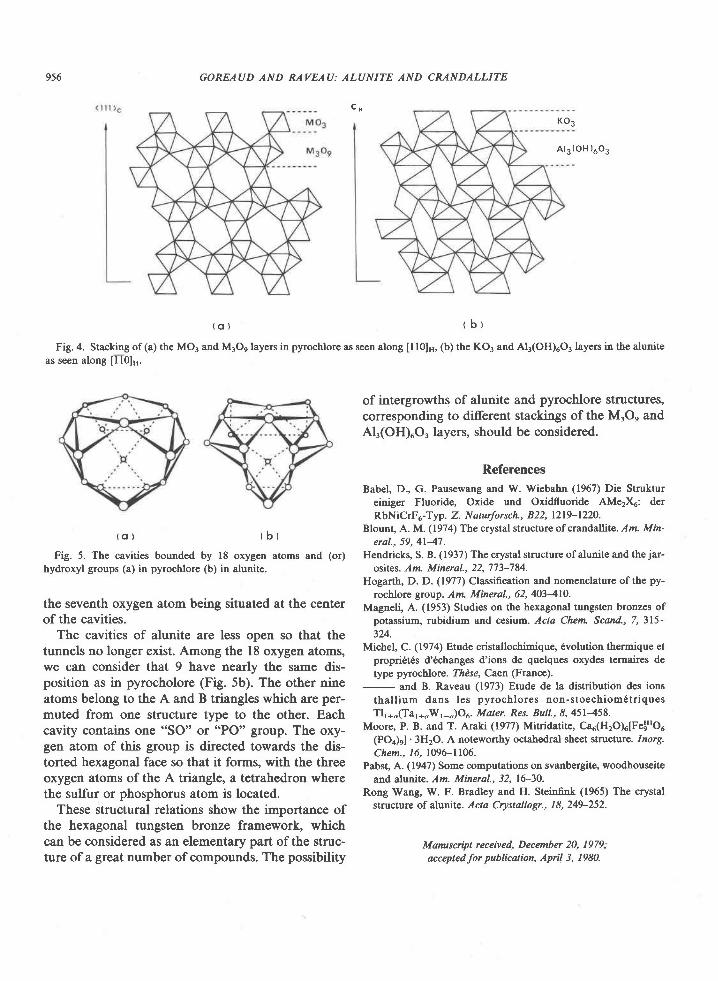
9s6 GOREAUD AND RAVEAU: ALUNITE AND CRANDALLITE
Kog
A t3 (oH )603
{ o ) t b t
Fig. 4. Stacking of (a) the MO3 and M3Oe layers in pyrochlore as seen along I l0]g, (b) the KO3 and AI3(OH)5O3 layers in the alunite
as seen along [10]g.
c H
( o ) ( b )
Fig. 5. The cavities bounded by 18 oxygen atoms and (or)
hydroxyl groups (a) in pyrochlore (b) in alunite.
the seventh oxygen atom being situated at the centerofthe cavities.
The cavities of alunite are less open so that thetunnels no longer exist. Among the 18 oxygen atoms,we can consider that t have nearly the same dis-position as in pyrocholore (Fig. 5b). The other nineatoms belong to the A and B triangles which are per-muted from one structure type to the other. Eachcavity contains one "SO" or "PO" group. The oxy-gen atom of this group is directed towards the dis-torted hexagonal face so that it forms, with the threeoxygen atoms of the A triangle, a tetrahedron wherethe sulfur or phosphorus atom is located.
These structural relations show the importance ofthe hexagonal tungsten bronze framework, whichcan be considered as an elementary part of the struc-ture of a great number of compounds. The possibility
of intergrowths of alunite and pyrochlore structures,corresponding to different stackings of the MrO" andAl3(OH)"Oj layers, should be considered.
ReferencesBabel, D,, G. Pausewang and W. Wiebahn (1967) Die Struktur
einiger Fluoride, Oxide und Oxidfluoride AMe2)Q: derRbNiCrF5-Typ . Z. N aturforsch., B 22, l2I9-122O.
Blount, A. M. (1974) The crystal structure of crandallite. Am. Min-eral., 59, 4147.
Hendricks, S. B. (1937) The crystal structure of alunite and the jar-osites. lzr Mineral., 22,'173-784.
Hogarth, D. D. (1977) Classification and nomenclature of the py-rochlore group. Am- Mineral., 62,403410.
Magneli, A. (1953) Studies on the hexagonal tungsten bronzes ofpotassium, rubidium and cesium. Acta Chem. Scand., 7,315-324.
Michel, C. (1974') Etude cristallochirnique, dvolution thermique etpropridt€s d'6changes d'ions de quelques oxydes ternaires detype pyrochlore . Thdse, Caen (France).
- and B. Raveau (1973) Etude de la distribution des ionsthal l ium dans les pyrochlores non-stoechiom6triquesTlr*.(Tat*"Wr --)06. Mater. Res. Bull., 8,451458.
Moore, P. B. and T. Araki (1977) Mitridatite, Car(HzO)o[FelrIOe(POo)sl . 3H2O. A noteworthy octahedral sheet structure. lnorg.Chem., 16, 1096-1106.
Pabst, A. (1947) Some computations on svanbergite, woodhouscitcand alunite. Am. Mineral., 32, 16-30.
Rong Wang, W. F. Bradley and H. Steinfink (1965) The crystalstructure of alunite. Acta Crystallogr., 18,249-252.
Manuscripl received, December 20, 1979;
acceptedfor publication, Apfl 3, 1980.
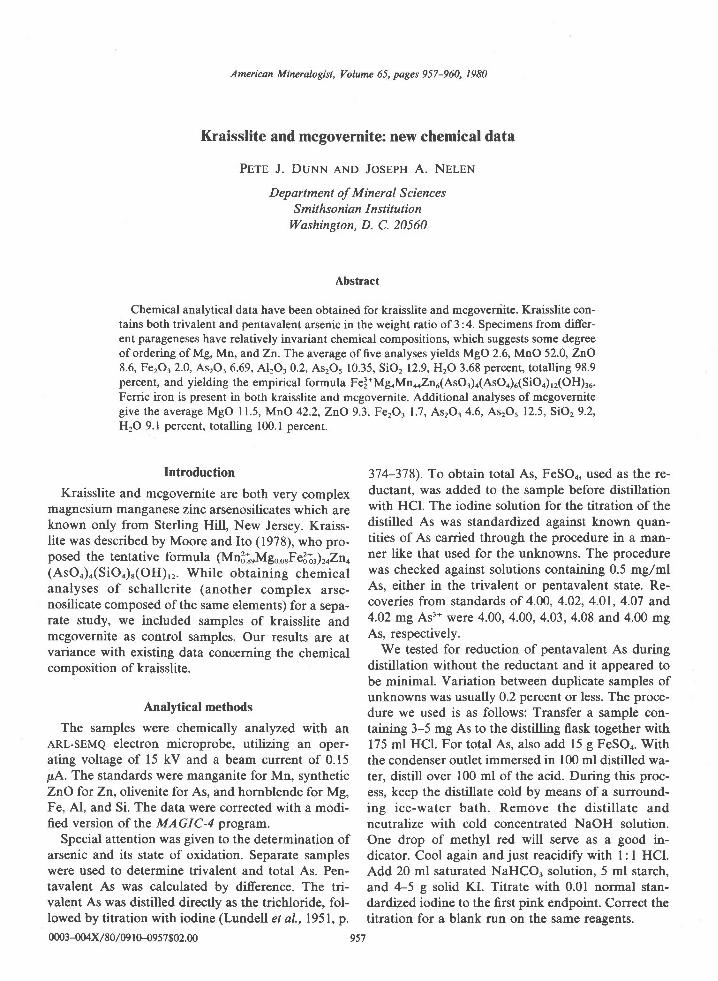
American Mineralogist, Volume 65, pages 957-960, 1980
Kraisslite and mcgovernite: new chemical data
PETE J. DUNN AND JoSEPH A. NELEN
Department of Mineral SciencesS mit hs o ni qn I n stitutio n
Washington, D. C.20560
Abstract
Chemical analytical data have been obtained for kraisslite and mcgoverdite. Kraisslite con-tains both trivalent and pentavalent arsenic in the weight ratio of 3 :4. Specimens from differ-ent parageneses have relatively invariant chemical compositions, which suggests some degreeof ordering of Mg, Mn, andZn. The average of five analyses yields MgO 2.6, MnO 52.0, ZnO8.6, FerO, 2.0, AsrO, 6.69, Alror 0.2, AsrO, 10.35, SiO, 12.9, }J2O 3.68 percent, totalling 98.9percent, and yielding the empirical formula Fe]*MgoMn*Zn"(AsOr)o(AsOo)o(SiOo),r(OH)ru.Ferric iron is present in both kraisslite and mcgovernite. Additional analyses of mcgovernitegive the average MgO I1.5, MnO 42.2, ZnO 9.3, FerO, 1.7, AszOr 4.6, AsrO, 12.5, SiO, 9.2,H2O 9.1 percent, totalling 100.1 percent.
Introduction
Kraisslite and mcgovernite are both very complexmagnesium manganese zinc arsenosilicates which areknown only from Sterling Hill, New Jersey. Kraiss-lite was described by Moore and Ito (1978), who pro-posed the tentative formula (MdinMgo""Fef;ir)roZno(AsO").(SiOn).(OH),,. While obtaining chemicalanalyses of schallerite (another complex arse-nosilicate composed of the same elements) for a sepa-rate study, we included samples of kraisslite andmcgovernite as control samples. Our results are atvariance with existing data concerning the chemicalcomposition of kraisslite.
Analytical methods
The samples were chemically analyzed with anARL-sEMQ electron microprobe, utilizing an oper-ating voltage of 15 kV and a beam current of 0.15pA. The standards were manganite for Mn, syntheticZnO for Zn, olivenite for As, and hornblende for Mg,Fe, Al, and Si. The data were corrected with a modi-fied version of the MAGIC-4 program.
Special attention was given to the determination ofars€nic and its state of oxidation. Separate sampleswere used to determine trivalent and total As. Pen-tavalent As was calculated by difference. The tri-valent As was distilled directly as the trichloride, fol-lowed by titration with iodine (Lundell et al.,1951, p.
374-378). To obtain total As, FeSOo, used as the re-ductant, was added to the sample before distillationwith HCl. The iodine solution for the titration of thedistilled As was standardized against known quan-tities of As carried through the procedure in a man-ner like that used for the unknowns. The procedurewas checked against solutions containing 0.5 mglmlAs, either in the trivalent or pentavalent state. Re-coveries from standards of 4.00, 4.02, 4.01,4.07 and4.02 mg Asr* were 4.00,4.00, 4.03, 4.08 and 4.00 mgAs, respectively.
We tested for reduction of pentavalent As duringdistillation without the reductant and it appeared tobe minimal. Variation between duplicate samples ofunknowns was usually 0.2 percent or less. The proce-dure we used is as follows: Transfer a sample con-taining 3-5 mg As to the distilling flask together with175 ml HCl. For total As, also add 15 g FeSOo. Withthe condenser outlet immersed in 100 rnl distilled wa-ter, distill over 100 ml of the acid. During this proc-ess, keep the distillate cold by means of a surround-ing ice-water bath. Remove the disti l late andneutralize with cold concentrated NaOH solution.One drop of methyl red will serve as a good in-dicator. Cool again and just reacidify with l: I HCl.Add 20 ml saturated NaHCO, solution, 5 ml starch,and 4-5 g solid KI. Titrate with 0.01 normal stan-dardized iodine to the first pink endpoint. Correct thetitration for a blank run on the same reagents.
0003-004x/80/09 l0-0957$02.00 957
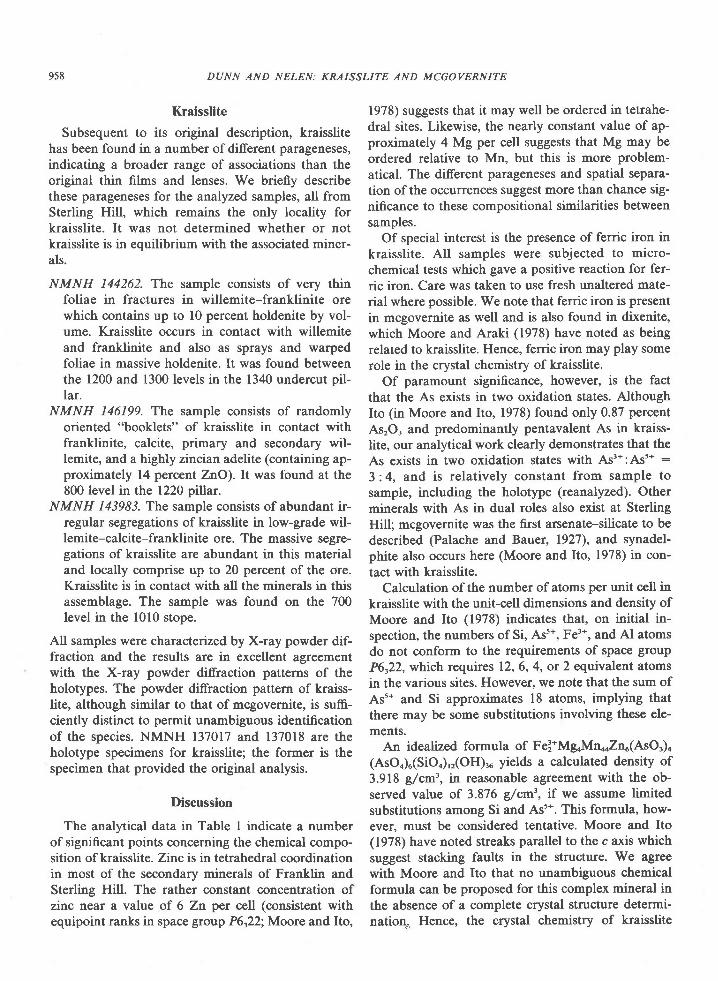
958 DUNN AND NELEN: KRAISSLITE AND MCGOVERNITE
Kraisslite
Subsequent to its original description, kraisslitehas been found in a number ofdifferent parageneses,indicating a broader range of associations than theoriginal thin fiLns and lenses. We briefly describethese parageneses for the analyzed samples, all fromSterling Hill, which remains the only locality forkraisslite. It was not determined whether or notkraisslite is in equilibrium with the associated miner-als.
NMNH 144262. The sample consists of very thinfoliae in fractures in willemite-franklinite orewhich contains up to l0 percent holdenite by vol-ume. Kraisslite occurs in contact with willemiteand franklinite and also as sprays and warpedfoliae in massive holdenite. It was found betweenthe 1200 and 1300 levels in the 1340 undercut pil-lar.
NMNH 146199. The sample consists of randomlyoriented "booklets" of kraisslite in contact withfranklinite, calcite, primary and secondary wil-lemite, and a highly zlncran adelite (containing ap-proximately 14 percent ZnO). It was found at the800 level in the 1220 pillar.
NMNH 143983. The sample consists of abundant ir-regular segregations of kraisslite in low-grade wil-lemite-calcite-franklinite ore. The massive segre-gations of kraisslite are abundant in this materialand locally comprise up to 20 percent of the ore.Kraisslite is in contact with all the minerals in thisassemblage. The sample was found on the 700level in the l0l0 stope.
All samples were characteized by X-ray powder dif-fraction and the results are in excellent agreementwith the X-ray powder diffraction patterns of theholotypes. The powder diffraction pattern of kraiss-lite, although similar to that of mcgovernite, is suffi-ciently distinct to permit unambiguous identificationof the species. NMNH 137017 and 137018 are theholotype specimens for kraisslite; the former is thespecimen that provided the original analysis.
Discussion
The analytical data in Table I indicate a numberof significant points concerning the chemical compo-sition of kraisslite. Zinc is in tetrahedral coordinationin most of the secondary minerals of Franklin andSterling Hill. The rather constant concentration ofzinc near a value of 6 Zn per cell (consistent withequipoint ranks in space group P6r22; Moore and Ito,
1978) suggests that it may well be ordered in tetrahe-dral sites. Likewise, the nearly constant value of ap-proximately 4 Mg per cell suggests that Mg may beordered relative to Mn, but this is more problem-atical. The different parageneses and spatial separa-tion of the occurrences suggest more than chance sig-nificance to these compositional similarities betweensamples.
Of special interest is the presence of ferric iron inkraisslite. All samples were subjected to micro-chemical tests which gave a positive reaction for fer-ric iron. Care was taken to use fresh unaltered mate-rial where possible. We note that ferric iron is presentin mcgovernite as well and is also found in dixenite,which Moore and Araki (1978) have noted as beingrelated to kraisslite. Hence, ferric iron may play somerole in the crystal chemistry of kraisslite.
Of paramount significance, however, is the factthat the As exists in two oxidation states. AlthoughIto (in Moore and Ito, 1978) found only 0.87 percentAsrO, and predominantly pentavalent As in kraiss-lite, our analytical work clearly demonstrates that theAs exists in two oxidation states with As'*:As'* :
3 :4, and is relatively constant from sample tosample, including the holotype (reanalyzed). Otherminerals with As in dual roles also exist at SterlingHill; mcgovernite was the first arsenate-silicate to bedescribed (Palache and Bauer, 1927), and synadel-phite also occurs here (Moore and lto, 1978) in con-tact with kraisslite.
Calculation of the number of atoms per unit cell inkraisslite with the unit-cell dimensions and density ofMoore and lto (1978) indicates that, on initial in-spection, the numbers of Si, Ast*, Fe3*, and Al atomsdo not conform to the requirements of space groupP622, which requires 12, 6, 4, or 2 equivalent atomsin the various sites. However, we note that the sum ofAs'* and Si approximates 18 atoms, implying thatthere may be some substitutions involving these ele-ments.
An idealized formula of Fel*MgoMn*Zno(AsOr)n(AsO.).(SiOo),,(OH).. yields a calculated density of3.918 g/cm3, in reasonable agreement with the ob-served value of 3.876 g/cm', if we assume limitedsubstitutions among Si and As'*. This formula, how-ever, must be considered tentative. Moore and Ito(1978) have noted streaks parallel to the c axis whichsuggest stacking faults in the structure. We agreewith Moore and Ito that no unarrbiguous chemicalformula can be proposed for this complex mineral inthe absence of a complete crystal structure determi-nation, Hence, the crystal chemistry of kraisslite
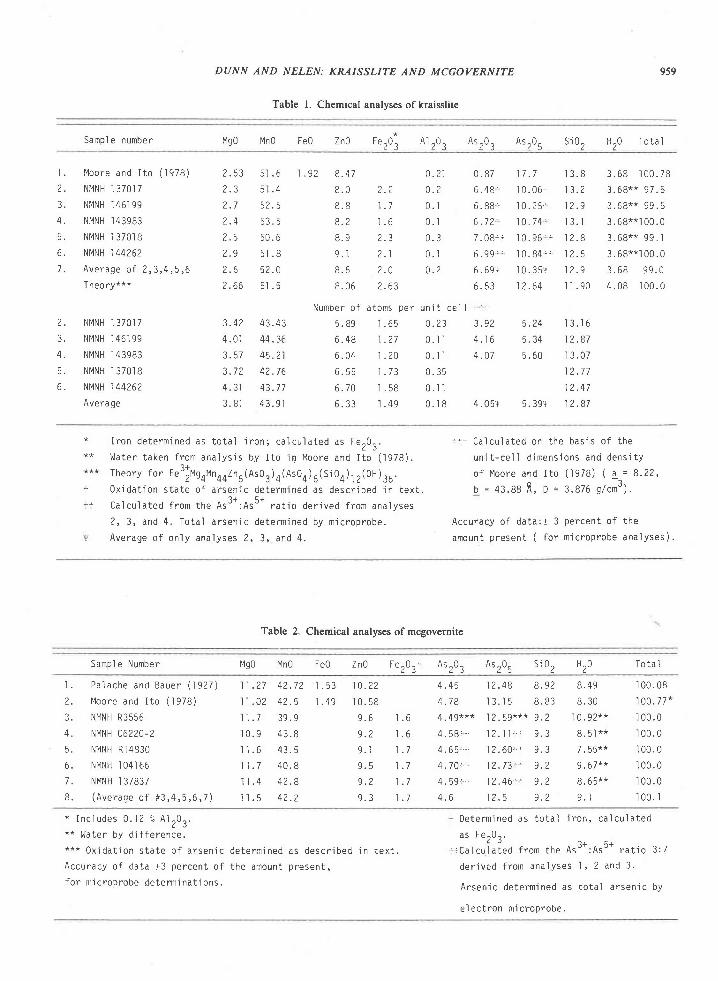
DUNN AND NELEN: KRAISSLITE AND MCGOVERNITE
Table l. Chemical analyses of kraisslite
959
Samp l e number Zn014n0Mgo Fe0 FerO, A l 203 AsrO, AsrOU S i02 HZ1 Tota l
l . M o o r e a n d I t o ( 1 9 7 8 )
2 . N M N H 1 3 7 0 1 7
3. Ni '1NH t 46t 99
4 . N M N H 1 4 3 9 8 3
5 . N I4NH l 3701 8
6 . N I4NH I 44262
7 . A v e r a g e o f 2 , 3 , 4 , 5 , 6
T heo ry ***
2 . N I " I N H I 3 7 0 i 7
3 . N M N H 1 4 6 1 9 9
4 . NMNH I 43983
5. NI4NH I 3701 8
6 . N |YNH 144262
Ave ra ge
1 . 9 2 8 . 4 7
8 . 0 2 . 2
8 . 8 1 . 7
8 . 2 I . 6
8 . 9 2 . 3
9 . . l 2 . 1
8 . 6 2 . 4
8 . 0 6 2 . 6 3
0 . 2 r 0 . 8 70 . 2 6 . 4 8 '0 . , l 6 . 8 8 ,
0 . t 6 . 7 2
0 . 3 7 . 0 8 ' +
0 . ] 6 . 9 9 , ,
0 . 2 6 . 6 9 !
6 . 5 3
1 7 . 7 1 3 . 8
1 0 . 0 6 * 1 3 . 2
1 0 . 2 5 , 1 2 . 9
1 0 . 7 4 1 3 . r
I 0 . 9 6 ' ' 1 2 . 8
1 0 . 8 4 . , 1 2 . 5
1 0 . 3 5 r 1 2 . 9
1 2 . 6 4 ' l 1 . 9 0
5 . 2 4 1 3 . ' l 6
5 . 34 12 .87
5 . 6 0 I 3 . 0 7
1 2 . 7 7
1 2 . 4 7
5. 39 , r 12 .87
2 . 5 3 5 t . 6
2 . 3 5 t . 4
2 . 7 5 2 . 5
2 . 4 5 3 . 5
2 . 5 5 0 . 6
2 . 9 5 t . 8
2 . 6 5 2 . 0
2 . 6 6 5 1 . 5
3 . 4 2 4 3 . 4 3
4 . 0 1 4 4 . 3 6
3 . 5 1 4 5 . 2 1
3 . 7 2 4 2 . 7 6
4 . 3 t 4 3 . 7 7
3 . 8 1 4 3 . 9 1
3 . 6 8 r 0 0 . 7 8
3 . 6 8 * * 9 7 . 5
3 . 6 8 * * 9 9 . 5
3 . 6 8 * * l 0 0 . 0
3 . 6 8 * * 9 9 . I
3 . 6 8 * * 1 0 0 . 0
3 . 6 8 9 9 . 0
4 . 0 8 ' l 0 0 . 0
N u m b e r o f a t o m s p e r u n i t c e l I ' ' '
5 . 8 9 . l . 6 5
0 . 2 3 3 . 9 2
6 . 4 8 1 . ? 7 O . i l 4 . 1 6
6 . 0 4 1 . 2 0 0 . l l 4 . 0 7
6 . 5 5 1 . 7 3 0 . 3 5
6 . 7 0 1 . 5 8 O . i l
6 . 3 3 I . 4 9 0 . 1 8 4 . 0 5 ' r
I r o n d e t e r m j n e d a s t o t a l i r o n ; c a l c u l a t e d a s F e r o r .
W a t e r t a k e n f r o m a n a l y s i s b y I t o i n M o o r e a n d I t o ( 1 9 7 8 ) .
Theo ry f o r Fe " r l " l gOMnOOZnU (As0 , ) o (As0O ) 6
( S i 04 ) I 2 ( 0H ) 36 .
0 x i d a t i o n s t a t e o f a r s e n i c d e t e r m ' i n e d a s d e s c r i b e d . i n t e x t .
Ca l cu la ted f r om the As3* :As5* r a t i o de r i ved f r o i n ana l yses
2 , 3 , a n d 4 . T o t a l a r s e n i c d e t e r m i n e d b y m i c r o p r o b e .
A v e r a g e o f o n l y a n a l y s e s 2 , 3 , a n d 4 .
+ - ' C a l c u l a t e d o n t h e b a s i s o f t h e
u n i t - c e ' l ' l d i m e n s i o n s a n d d e n s i t y
o f l 4 o o r e a n d t t o ( ] 9 7 8 ) ( a = 8 . 2 2 ,
b = 4 3 . 8 8 R , o = : . a z o s / c m 3 ; .
Accu racy o f da ta : t 3 pe rcen t o f t he
amoun t p resen t ( f o r m i c rop robe ana l yses ) .
Table 2. Chemical analvses of mceovernite
Samp l e Number Fe0Mn01,1,o0 Zn0 F e r 0 r ' A s r o , A s r O U S i 0 2 H Z O Tota 1
I . Pa l ache and Baue r ( 1 927 )
2 . l ' l oo re and I t o ( ' l 978 )
3 . N t4NH R3556
4 . N r lNH C6220 -2
5 . NMNH R I 4830
6 . N |YNH ' l 04 . l 66
7 . NMNH . l 37837
8 . ( A v e r a g e o f r 3 , 4 , 5 , 6 , 7 )
1 1 . 2 7 4 2 . 7 2 I . 5 3
I I . 0 2 4 2 . 5 I . 4 9
i l . 7 3 9 . 9
1 0 . 9 4 3 . 8
l t . 6 4 3 . 5
l l . 7 4 0 . 8
l l . 4 4 2 . E
I I . 5 4 2 . 2
1 2 . 4 8 I . 9 2 B . 4 9 I 0 0 . 0 8
1 3 . 1 5 8 . 8 3 8 . 3 0 ] 0 0 . 7 7 *
1 2 . 5 9 * * * 9 . 2 ' l 0 . 9 2 * * ' ] 0 0 . 0
l 2 . l l , . 9 . 3 8 . 5 ] * * ' l 0 0 . 0
1 2 . 6 0 + ' 9 . 3 7 . 5 5 * * 1 0 0 . 0
1 2 . 7 3 . = 9 . 2 9 . 6 7 * * I 0 0 . 0
1 2 . 4 6 . ' 9 . 2 8 . 6 5 * * ' l 0 0 . 0
1 2 . 5 9 . 2 9 . r 1 0 0 . 1
1 0 . 2 2
1 0 . 5 8
9 . 6 ' l . 6
9 . 2 I . 6o 1 1 7
9 . 5 1 . 1
9 . 2 1 . 1o ? 1 a
4 . 4 5
4 . 7 8
4 . 49 * * *
4 . 5 8 r .
4 . 6 5 . .
4 . 7 0 + .
4 . 5 9 + *
4 . 6
* I nc l udes 0 . I 2 t ; A l 203 .
** ' , , la ter by di f f erence.* * * 0x i da t i on s ta te o f a r sen i c de te r rn i ned as desc r i bed i n t ex t .
Accu racy o f da ta r 3 pe rcen t o f t he amoun t p resen t ,
f o r m i c rop robe de te rm ina t j ons .
+ D e t e r m i n e d a s t o t a l i r o n , c a l c u l a t e d
a s F e r 0 . .
+ - C a l c u i a i e a f r o m t h e A s 3 * ' A s 5 * r a t i o 3 : 7
d e r i v e d f r o m a n a l Y s e s I , 2 a n d 3 .
A rsen i c de te rm ined as t o ta l a r sen i c by
e l e c t r o n m i c r o p r o b e .
960
might be much more complex than indicated by ouranalytical study.
Mcgovernite
Mcgovernite was originally described by Palacheand Bauer (1927).Its symmetry has been discussedby Wuensch (1960, 1968) and Moore and Araki(1978). Its chemical constituents are the same asthose of kraisslite but are present in different ratios.We present new analyses of mcgovernite, togetherwith those of Bauer (Palache and Bauer, 1927) andIto (Moore and Ito, 1978), in Table 2. The analyzedsamples have all been identified by X-ray diffraction.
Of special interest is the presence of ferric iron inmcgovernite, in concentrations similar to those inkraisslite, but with less variance. It is present in allsamples, although not previously reported. Our de-termination of the oxidation states of the As sub-stantiates the determinations by Bauer and lto. Wehave calculated the ratio of As'*: As'* for the micro-probe analyses using the 3:7 ratio determined empir-ically by analysis (Table 2), rather than the sirnplerI :3 ratio suggested by the formula of Moore andAraki (1978).
As with kraisslite, the relative concentrations ofMg, Mn, andZn suggest some ordering of these ele-ments in the crystal structure. We present additionalanalyses as evidence of the relatively invariant com-position of this mineral. We offer no chemical for-mula for mcgovernite; calculation of cell contents
DT]NN AND NELEN: KRAISSLITE AND MCGOVERNITE
yields results not in conformity with the space grouprequirements. The presence of over 1200 atoms in theunit cell, combined with the probability of complexsubstitutions such as are likely in kraisslite, precludesany simple formula.
AcknowledgmentsWe thank Drs. Michael Fleischer, Peter Leavens, Joseph Man-
darino. Donald Peacor, Frederick Wicks, and Carl Francis for
critical readings of the manuscript. Samples for study were do-
nated by John Kolic, a miner in the Sterling mine who first noted
the various parageneses. We thank Mr. Richard Johnson and Mr.
Frank Walkup for the preparation of polished sections, and Mr.
Charles Obermeyer for technical assistance. Mrs. Esther Claffy
provided literature assistance. This project was supported in part
by a grant from Mrs. E. Hadley Stuart, Jr.
References
Lundell, G. E. F., J. I. Hoffman and H. A. Bright (1951) Chemical
Analysis of Iron and Steel. Wiley, New York.
Moore, P. B. and T. Araki (1978) Hematolite: a complex dense-
packed sheet structure. Am. Mineral., 63, 150-159.- and J. Ito (1978) Kraisslite, a new platy arsenosilicate frorn
Sterling Hill, New Jersey. Am. Mineral.,63,938-940.
Palache, C. and L. H. Bauer (1927) McGovernite, a new mineral
from Sterling Hill, New Jersey. Am. Mineral., 12,373-3'14.
Wuensch, B. J. (1960) The crystallography of mcgovernite, a com-
plex arsenosilic ate. A m. M iner al., 4 5, 9f7 -9 45.- (1968) Comparison of the crystallography of dixenite,
mcgovernite and hematolite . Z. Kristallogr., 1 27, 309-3 18.
Manuscript received, March 14, 1980;
acceptedfor publication, May 8, 1980.
American Mineralogisl, Volume 65, pages 961-967, 1980
Hydrated sulfates from Sydney Coalfield, Cape Breton Island,Nova Scotia, Canada: the copiapite group
ERWIN L. ZoDRow
Department of Geology, College of Cape BretonSydney, Nova Scotia, Canada BIP 6L2
Abstract
Selected samples of copiapite from locations in the Sydney Coalfield are classifed accord-ing to atomic proportions in the X position of the structural formula of copiapite. In particu-lar, the metal content in the position is calculated by purely algebraic means, le., by solutionsof linear simultaneous equations. Proportions in the X and R positions of the structural for-mula are assumed l:4 on the basis of substitution which at the same time serves as a check onobtained solutions. Identified species of the copiapite group include aluminocopiapite, co-piapite, magnesiocopiapite, and even ferroan magnesiocopiapite. It appears that di-fferentparts in the coalfield represent di-fferent environments as judged by the chemical compositionof the sampled copiapites.
Introduction
Over the last four years many hydrated sulfatespecimens have been collected from the SydneyCoalfield, leading to several studies by Zodrow andMcCandlish (1978a, b; 1979). Among these sulfatesare certain minerals of the copiapite group, withaluminocopiapite being predominant. Minerals ofthis group have a wide geographical distribution inthe coalfield; Figure I shows the locations of samples.
The copiapite group consists of hydrated sulfateswith the general formula XR (SO.)6(OH)r.nHrO,where X is one oxygen equivalent (with a totalcharge of 2+). The X position contains one or moreof Cu (cuprocopiapite), Fe (copiapite), Mn, Zn, Na,K, Co, Ca, Mg (magnesiocopiapite), Al, and others;R is mainly Fe'* and some Al. The upper limit of z is20 for fully hydrated minerals (Fanfani et al., 1973\;Berry Q947) proposed 2l on the basis of statisticalaverages. The substitutional possibilities are largeand diversffied in the X position; they are fully ex-plainable by the weak bonding of the coordinationpolyhedra to the structural chain motif (Fanfani etal., 1973).In aluminocopiapite (Berry, 1947, p. 25,29), N is the dominant metal in the X position.
The Al-rich nature of the sediments in the SydneyCoalfield is reflected in the composition of the hy-drated sulfate minerals (Zodrow and McCandlish,1978a,1979), in the acid run-offs, and in shales and
0003-0o4x,/80/09 I 0-096 I $02.00
pyrite (Zodrow, in preparation); see Table l. Copiap-ite group minerals occur on practically every outcropof coal, on coal faces in the older mines, as precipi-tates from acid run-offs, and in shale in the proximityof coal.
Of all the hydrated sulfates observed in their natu-ral environment, copiapite minerals are the most re-sistant to seasonal changes. For example, on theEmery seam in Glace Bay (Zodrow and McCand-lish, 1978a, their Fig. 2) pickeringite [MgAl,(SO.)o .22H2O1, halotr ichi te [FeAlr(SOn)o .
22I{2O} and other hydrated sulfates "bloom" onlyin the summer; a similar situation exists in the PointAconi area (Fig. l), where the predominant hydratedsulfate is sideronatrite [Na,Fc(SO.),(OH)'3HrO].These minerals vanished during winter but co-piapite survived.
This paper, part of an environmental study of hy-drated sulfates in the Sydney Coalfield, attempts toclassify selected copiapite group minerals from theunit-cell content as calculated by Berry Q947, p. 30):". . . an analysis is placed in one of the . . . five groupsif the oxygen equivalent of the principal constituentof X exceeds 0.5." Berry's five groups are ferri-, alu-mino-, magnesio-, ferro-, and cuprocopiapites. In thisstudy the number of atoms in the X and R positionsare estimated by solutions of simultaneous linearequations based on the assumptions of substitutionsin the general copiapite formula.
961
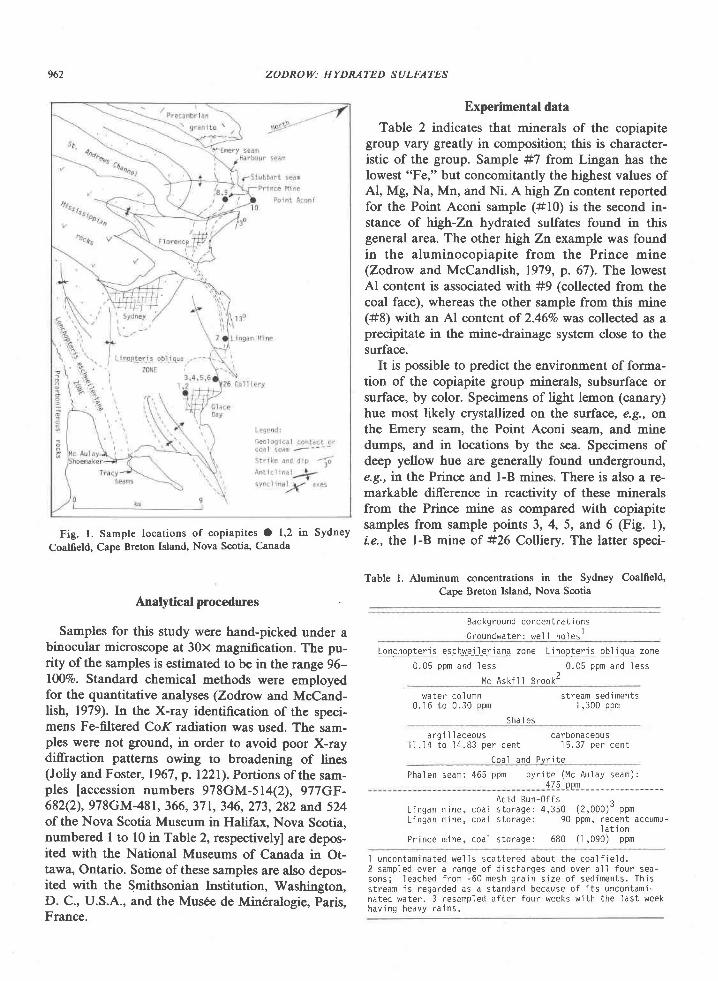
962 ZODROW: HYDRATED SULFATES
Fig. l. Sample locations of copiapites O 1,2 in Sydney
Coalfield, Cape Breton Island, Nova Scotia, Canada
Analytical procdures
Samples for this study were hand-picked under abinocular microscope at 30x magnification. The pu-rity of the samples is estimated to be in the range 96-1007o. Standard chemical methods were employedfor the quantitative analyses (Zodrow and McCand-lish, 1979). In the X-ray identification of the speci-mens Fe-filtered CoK radiation was used. The sam-ples were not ground, in order to avoid poor X-raydiffraction patterns owing to broadening of lines(Jolly and Foster, 1967, p. l22l). Portions of the sam-ples [accession numbers 978GM-514(2), 977GF-682(2),978GM-491, 366, 371, 346, 273, 282 and 524of the Nova Scotia Museum in Halifax, Nova Scotia,numbered I to 10 in Table 2, respectivelyl are depos-ited with the National Museums of Canada in Ot-tawa, Ontario. Some of these samples are also depos-ited with the Smithsonian Institution, Washington,D. C., U.S.A., and the Mus6e de Mindralogie, Paris,France.
Experimental data
Table 2 indicates that minerals of the copiapitegroup vary greatly in composition; this is character-istic of the group. Sample #7 from Lingan has thelowest "Fe," but concomitantly the highest values ofAl, Mg, Na, Mn, and Ni. A high Zn content reportedfor the Point Aconi sample (#10) is the second in-stance of high-Zn hydrated sulfates found in thisgeneral area. The other high Zn example was foundin the aluminocopiapite from the Prince mine(Zodrow and McCandlish, 1979, p. 67).The lowestAl content is associated udth #9 (collected from thecoal face), whereas the other sample from this mine(#8) with an Al content of 2.46Vo was collected as aprecipitate in the mine-drainage system close to thesurface.
It is possible to predict the environment of forma-tion of the copiapite group mins1als, subsurface orsurface, by color. Specimens of light lemon (canary)hue most likely crystallized on the surface, e.9., onthe Emery seam, the Point Aconi seam, and minsdumps, and in locations by the sea. Specimens ofdeep yellow hue are generally found underground,e.9., in the Prince and l-B mines. There is also a re-markable difference in reactivity of these mineralsfrom the Prince mine as compared with copiapitesamples from sample points 3, 4, 5, and 6 (Fig. l),i.e., the l-B mine of #26 Colliery. The latter speci-
Table l. Aluminum concentrations in the Sydney Coalficld,Cape Breton Island, Nova Scotia
Backg round concen t ra t i onsI
b r o u n o w a r e r : w e t I n o t e s
lqS_lql9f f f eschwei ' ler iana zone Linopter is obl iqua zone
0 .05 ppm and l ess 0 .05 ppm and l ess
I l c Ask i l l B rook2
water col umn0 . ' l 6 t o 0 . 3 0 p p m
stream sediments1 ,300 ppm
S h a l e s
a rg i l l a ceous ca rbonaceousl l . l 4 t o
' l 4 . 8 3 p e r c e n t ' l 5 . 3 7 p e r c e n t
Coa l and Pv r i t e
Pha len seam: 465 ppm py r i t e (Mc Au lay seam) :
L i n g a n m i n e , c o a lL i n g a n m i n e , c o a l
P r i nce m ine , coa l
Ac id Run -O f f s 1s to rage : 4 ,350 (2 ,000 ) " ppmstorage: 90 ppm, recent accumu-' l a t i on
storage: 680 ( I ,090) ppm
I uncon tan ina ted we l l s sca t t e red abou t t he coa l f i e l d .2 samp led ove r a r ange o f d i scha rges and ove r a l l f ou r sea -sons ; l eached f r om -60 mesh g ra i n s i ze o f sed imen ts . Th j ss t r eam i s r ega rded as a s t anda rd because o f i t s uncon tam i -nated water. 3 resampled af ter four weeks wi th the last weekhav ing heavy ra i ns .
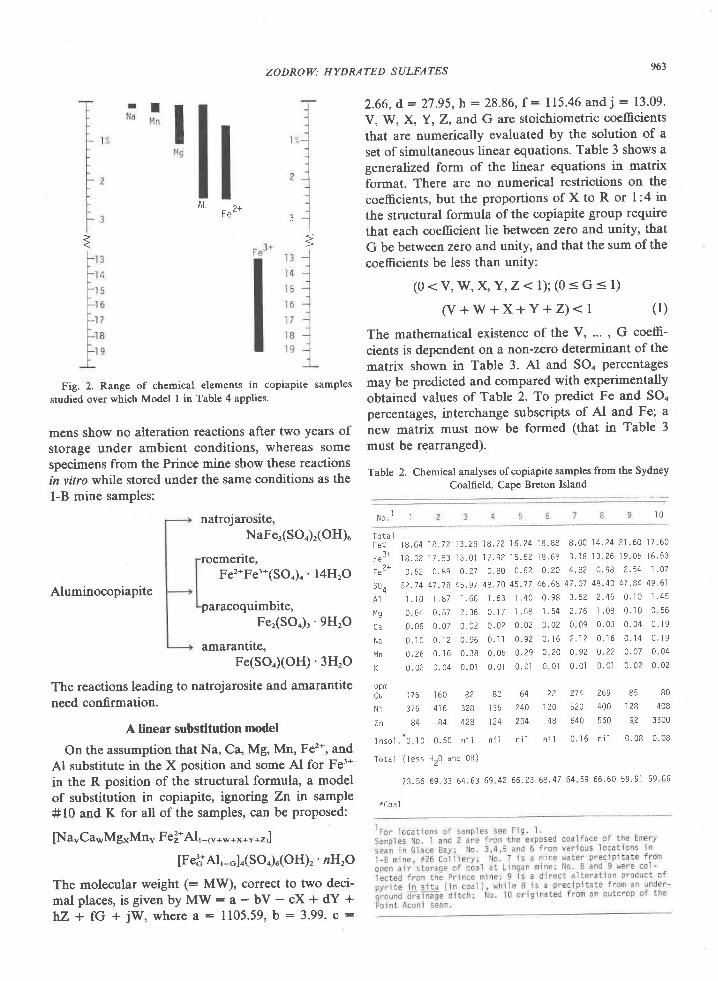
963
J
Fig. 2. Range of chemical elements in copiapite samples
studied over which Model I in Table 4 applies'
mens show no alteration reactions after two years ofstorage under ambient conditions, whereas somespecimens fron the Prince mine show these reactionsin vitro while stored under the sam€ conditions as thel-B mine samples:
natrojarosite,
Aluminocopiapite
NaFe'(SOo),(OH)u
roemerite,Fe'*Fe'*(SOo)n' l4HrO
paracoquimbite,Fer(SOo), '9HrO
amarantite,Fe(SO.XOH)'3H,O
The reactions leading to natrojarosite and amarantiteneed confirmation.
A linear substitution nodel
On the assumption that Na, Ca, Mg, Mq Fe'*, andAl substitute in the X position and some Al for Fe3*in the R position of the structural formula, a modelof substitution in copiapite, ignoring Zn rn sample#10 and K for all of the samples, can be proposed:
[Na"Ca*Mg*Mn" Fe]*Al,-,t*****t*t,l
[Fe!*Al'-o]o(SOo).(OH),' nH,O
The molecular weight (: MW), correct to two deci-mal places, is given by MW: a - bV - cX + dY +hZ + fG + jW, where a : 1105.59, b : 3.99. c :
2 . 6 6 , d : 2 7 . 9 5 , h : 2 8 . 8 6 , f : 1 1 5 . 4 6 a n d j : 1 3 . 9 9 .V, W, X, Y, Z, and G are stoichiometric coefficientsthat are numerically evaluated by the solution of aset of sirnultaneous linear equations. Table 3 shows ageneralized form of the linear equations in matrixformat. There are no numerical restrictions on thecoefficients, but the proportions of X to R or l:4 inthe structural formula of the copiapite group requirethat each coefficient lie between zero and unity, thatG be betweenzero and unity, and that the sum of thecoefficients be less than unitY:
(0 <V, W, X , Y , Z . t ) ; (0 < G < l )
(v+w+x+Y+z)<r ( l )
The mathematical existence of the V, ... , G coeffi-
cients is dependent on a non-zero determinant of the
matrix shown in Table 3. Al and SOo percentages
may be predicted and compared with experimentally
obtained values of Table 2. To predict Fe and SOo
percentages, interchange subscripts of Al and Fe; a
new matrix must now be formed (that in Table 3
must be rearranged).
Table 2. Chemical analyses of copiapite samples from the Sydney
Coalfield, CaPe Breton Island
N o l I
To ta Ir " l l 1 8 . 6 4 1 B 7 2 1 3 . 2 8 1 8 . 7 2 1 6 ' 2 4
' ] 8 . 8 8 8 . 0 0 l 4 ' 2 4 2 1 6 0 1 1 ' 6 0
r e 3 * 1 8 . 0 2 1 7 . 8 3 1 3 . 0 1 1 7 . 9 2 1 5 . 6 2 1 8 6 8 3 . 1 8 ' t 3 . 2 6
l 9 0 6 ' t 6 . 5 3
F . 2 * 0 . 6 2 0 . 8 9 0 . 2 7 o 8 0 0 . 6 2 o . 2 o 4 . 8 2 0 . 9 8 2 . 5 4 1 ' 0 7
soq 52 .74 47 .78 45 .97 48 .70 45 .77 46 .68 47 07 48 '40 47 84 49 .61
A t t . l 0 1 . 8 7 ' ] . 6 6
1 . 6 3 ' l . 4 0
0 . 9 8 3 . 6 2 2 . 4 6 0 1 0 1 . 4 5
t 4 g O 6 4 0 . 5 7 2 . 3 6 O ' 1 7 ' l . 5 8
1 5 4 2 . 7 6 1 ' 0 8 0 ' 1 0 0 s 6
C a 0 . 0 6 0 . 0 7 O 0 2 O . O 2 0 . 0 2 0 . 0 2 0 0 9 0 ' 0 3 0 0 4 0 ' 1 9
N a 0 . 1 0 0 . 1 2 0 9 6 0 . l l 0 . 9 2 0 . 1 6 2 . 1 2 0 ' 1 6 0 ' 1 4 0 ' l 9
l , l n 0 . 2 6 0 . 1 6 0 . 3 8 O 0 6 0 . 2 9 0 2 0 0 9 2 0 2 2 0 ' 0 7 0 0 4
K 0 . 0 2 0 . 0 4 o . 0 l o . o l 0 . 0 1 0 . 0 ] 0 . 0 ] 0 . 0 1 0 . 0 2 0 0 2
ppmC , 1 7 6 1 6 0 8 2 8 2 6 4 2 2 2 7 4 2 6 9 8 5 8 0
N i 376 41 6 328 I 36 240 120 520 400 128 408
7n 84 84 428 124 204 48 640 560 92 3300
I n s o l . * o l o o . 5 0 n i l n i l n i l n i l 0 . 1 6 n i l 0 . 0 8 0 . 0 8
T o t a l ( l e s s H 2 0 a n d 0 H )
7 3 . 5 6 6 9 3 3 6 4 . 6 3 6 9 4 2 6 6 . 2 3 6 8 ' 4 7 6 4 5 9 6 6 . 6 0 5 9 . 9 1 5 9 . 6 6
*Coa l
t
AL
t 0
ZODROW: HYDRATED SULFATES
=
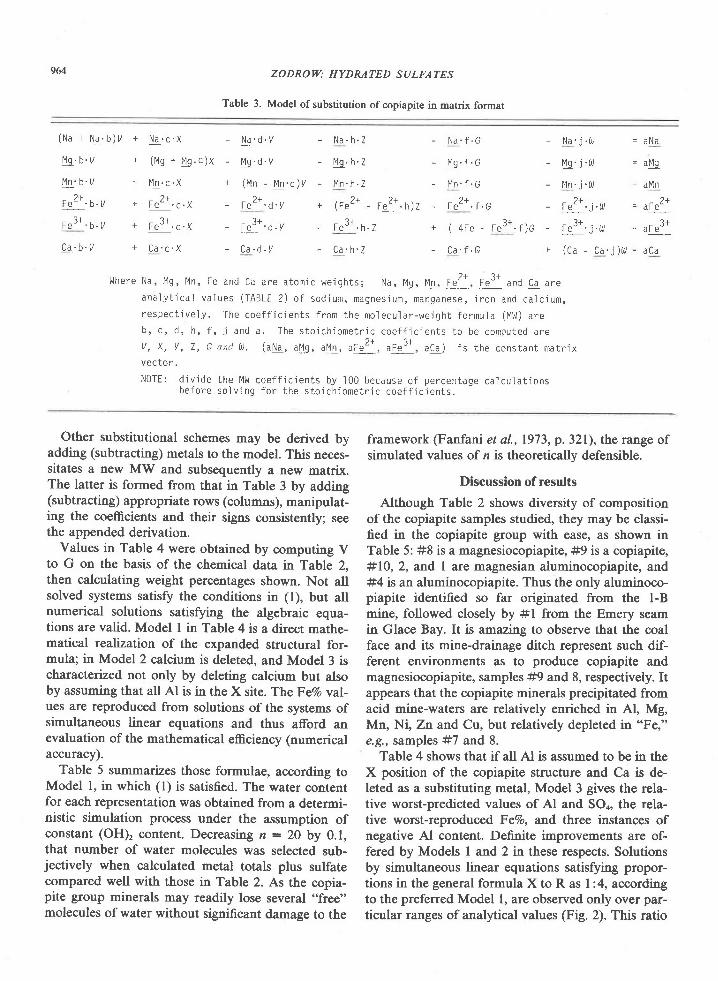
964 ZODROI{: HYDRATED SULFATES
Table 3. Model of substitution of copiapite in matrix format
( N a + N a . b ) U + N a . c . x - N a . d . /
U g . b . t / + ( t v t g + I g . c ) X - U g . d . y
I ] n ' b ' Y + M n . c . X + ( M n - M n . d ) V
F e 2 + . b . v + F e Z * . c . x - F e 2 + . d . y
F e 3 * ' b . v + F e 3 + . c . x - F e 3 + ' d . y
C a . b . U + C a . c . X - C a . d . /
- i ' l a . h . Z - N a . f . G
- Ug .h . z - ! s ' f .G- M n . h . Z - l Y n . f . G
2 + t + t ++ ( t e - - F e ' . h ) Z - F e ' . f . G
? + ? r- F e " ' h . Z + ( 4 F e - F e " ' . f ) G
- C a ' h ' Z - C a . f . G
- l la ' j . ( t / = aNa
- US' j . { , = a lg
- Mn' j . f t i = a l4n
2+ 2+- F e - ' j . f i J = a F e - '
? + ? +- Fe " ' j . [ ' J = aFe "
+ ( C a - C a . j ) 0 = a C a
l Jhe re l , l a , Mg , l 4n , Fe and Ca a re a tom ic we igh t s ; Na , ! g , l ' 4n , FeZ+ , Fe3+ and Ca a re
a n a i y t i c a l v a l u e s ( T A B L E 2 ) o f s o d i u m , m a g n e s i u m , m a n g a n e s e , i r o n a n d c a l c i u m ,
respec t i ve l y . The coe f f i c i en t s f r om the mo lecu la r -we igh t f o rmu la ( l y t , / ) a re
b , c , d , h , f , j a n d a . T h e s t o i c h i o m e t r i c c o e f f i c j e n t s t o b e c o m p u t e d a r e
v , X , V , 7 , G and a . ( aNa , aug , a t " l n , aFe& , aFe3+ , aCa ) i s t he cons tan t ma t r j x
vec to r .
NOTE: d i v i de t he M ln l coe f f i c i en t s by 100 because o f pe rcen tage ca l cu l a t i onsb e f o r e s o l v i n g f o r t h e s t o i c h i o m e t n i c c o e f f i c i e n t s .
Other substitutional schemes may be derived byadding (subtracting) metals to the model. This neces-sitates a new MW and subsequently a new matrix.The latter is formed from that in Table 3 by adding(subtracting) appropriate rows (columns), manipulat-ing the coemcients and their signs consistently; seethe appended derivation.
Values in Table 4 were obtained by computing Vto G on the basis of the chemical data in Table 2,then calculating weight percentages shown. Not allsolved systems satisfy the conditions in (l), but allnumerical solutions satisfying the algebraic equa-tions are valid. Model I in Table 4 is a direct mathe-matical realizalion of the expanded structural for-mula; in Model2 calcium is deleted, and Model3 ischaracterued not only by deleting calcium but alsoby assuming that all Al is in the X site. TheFeVo val-ues are reproduced from solutions of the systems ofsimultaneous linear equations and thus afford anevaluation of the mathematical efficiency (numericalaccuracy).
Table 5 summarizes those formulae, according toModel l, in which (l) is satisfied. The water conrentfor each representation was obtained from a determi-nistic simulation process under the assumption ofconstant (OH), content. Decreasing n : 2O by 0.1,that number of water molecules was selected sub-jectively when calculated metal totals plus sulfatecompared well with those in Table 2. As the copia-pite group minerals may readily lose several "free"molecules of water without significant damage to the
framework (Fanfani et al., 1973, p. 321), the range ofsimulated values of n is theoretically defensible.
Discussion of results
Although Table 2 shows diversity of compositionof the copiapite samples studied, they may be classi-fied in the copiapite group with ease, as shown inTable 5: #8 is a magnesiocopiapite, #9 is a copiapite,#10, 2, and I are magnesian aluminocopiapite, and#4 is an aluminocopiapite. Thus the only aluminoco-piapite identified so far originated from the l-Bmine, followed closely by #l from the Emery seamin Glace Bay. It is amazing to observe that the coalface and its mine-drainage ditch represent such dif-ferent environments as to produce copiapite andmagnesiocopiapite, samples #9 and 8, respectively. Itappears that the copiapite minerals precipitated fromacid mine-waters are relatively enriched in A| Mg,Mn, Ni, Zn and Cu, but relatively depleted in "Fe,"e.9., samples #7 and 8.
Table 4 shows that if all Al is assumed to be in theX position of the copiapite structure and Ca is de-leted as a substituting metal, Model 3 gives the rela-tive worst-predicted values of Al and SOo, the rela-tive worst-reproduced FeVo, and three instances ofnegative Al content. Definite improvements are of-fered by Models I and,2 in these respects. Solutionsby simultaneous linear equations satisfying propor-tions in the general formula X to R as l:4, accordingto the preferred Model l, are observed only over par-ticular ranges of analytical values (Fig. 2). This ratio
ZODROIV: HYDRATED SULFATES
Table 4. Comparison between predicted and obsewed values of Al and SOa according to different assumptions in thc substitutional
model of copiapite
Samp l e No . l 0
MODEL l : (Nauca rMgxMnyFe2+zA l 1 - ( v +
0 . , , fP red i c t ed Va l ue l . 04 I . ' 1 0
( O b s e r v e d , T A B L E Z l . l 0 1 . 8 7
S 0 , % ( P r e d i c t e d V a l u e 4 7 . 0 1 4 l . 0 1
" l obse rved , IABLE 2 52 . ] 4 47 .78
?+
a r x t v , l ) ( F e ' - G A l 1 - c ) 4
( s 0 4 ) 6 ( 0 H ) 2 ' 2 0 ' 0 F 2 0
0. 95+ 1 .62 0 . 30+ - O. 09+ 3 . 33+ 2 .91 0 . 08 I . 7 l
1 . 6 6 ] . 6 3 ] . 4 0 0 . 9 8 3 . 6 2 2 . 4 6 0 . ] 0 ] . 4 5
4 8 . 6 4 4 7 . 0 8 4 7 . 8 2 4 7 . 1 0 4 9 . 9 6 4 8 . 3 0 4 6 . 3 0 4 7 . 3 0
4 5 . 9 7 4 8 . 7 0 4 5 . 7 7 4 6 . 6 8 4 7 . 0 7 4 8 . 4 0 4 7 - 8 4 4 9 . 6 ]
- - . ( R e p r o d u c e d v a l u e * ' l 8 . 6 7 ' ] 8 . 7 5 ' l 3 . 3 9 ' l 8 . 7 3 ' l 6 . 3 5 ' l 8 . 8 5
8 . 0 8 1 4 . 2 8 2 1 - 6 2 1 7 ' 6 3F e " '
i o b s . r u " d , T A B L E 2 1 g . 6 4 1 8 . 1 2 1 3 . 2 8 1 8 . 7 2 1 6 . 2 4 l B . 8 8 8 . q q 1 4 . ? 4 - - - . 2 1 . 6 0 ' l 7 . 6 0
I40DEL 2 : (NauMg*MnnFe2+ zA11 - l v ,
A l % ( P r e d i c t e d V a l u e ' l . 0 4
l . l l
S 0 O % ( P r e d i c t e d V a l u e 4 7 . 0 8 4 7 . 0 8
Fe% (Rep roduced Va l ue * I 8 . 67 I 8 . 75
r , . ^ 3 * n r \ r / < rz l t U L € ' l - G , 4 ' - J 4 ) 6 ( 0 F ) 2 ' 2 0 ' 0 1 ' 2 0
1 . 6 2 0 . 3 0 o . I 5 + 3 . 3 4 + 2 . 9 1 0 . 0 9 + 1 . 7 1
4 7 . O g 4 7 . 8 2 4 7 . 2 2 4 9 . 9 8 4 8 . 3 0 4 6 . 3 1 4 7 . 4 2
1 8 . 7 3 ' 1 6 . 3 5
l B . 4 O 8 . 0 8 1 4 . 2 8 2 1 . 6 0 1 7 . 6 3
X + Y +
0 . 95+
48 .64
1 3 . 3 9
I4ODEL 3 : (Nau r , t s ^unu re2+zA l l - ( y + y + | + 7 ) ) , . t * o ( s04 )6 (0H)2 ' 20 .0H20
A l % ( P r e d i c t e d V a l u e 0 . 9 4 O . g 2 - 1 . 8 9 + 1 . 4 7 - ' l . 0 9 + 0 . 1 6 - 6 . 2 9 + 0 ' 2 3
S 0 , % ( P r e d i c t e d V a l u e 4 7 . 0 8 4 6 . 9 9 4 7 . 2 5 4 7 . 0 1 4 7 . 1 4 4 7 . 2 2 4 6 . ' l ' ] 4 6 . 9 8
F e i ( R e p r o d u c e d V a t u e * 1 8 . 4 5 1 9 . 1 0 ' l 8 . 5 8
l g . O Z ' l 8 . 8 9 ' t 8 . 4 0
2 2 . 7 6 ' l 9 . ' l 9
0 . 6 4 0 . 8 44 6 . 5 8 4 6 . 9 82 0 . 6 0 1 9 . 2 8
' ' To ta l Fe compu ted f r om co r respond ing mo lecu la r we igh t f o rmu la . + S t o i c h i o m e t r i c r e q u i r e m e n t s n o t s a t i s f i e d .
is not satisfied for any value that falls outside itsrange. The possibility that certain pure end-membersin the group, e.g.,Mn or Mg, are mathematically notfeasible is thus implied.
The failure of the model in certain instances, as forexample if (Na + Mg) > 1.70 or when Fe2* is ratherlow, and an apparent excess of sulfate (average ob-served are larger than average predicted values), areproblems demanding attention. The excess sulfate ismarginally decreased but the spread between pre-dicted and observed Al values widens considerably
when residual positive charges of the X position of
the stoichiometric formulae in Table 5 are algebrai-cally eliminated; this may be seen from Table 6, in
which the average of 47.30 percent of predicted sul-
fate is marginally higher than the 47.19 percent aver-
age of predicted values from stoichiometric formulae
in Table 4, as compared with the observed averagevalue of 49.18 percent (Table 2). Aluminum predic-
tions in Table 6 are definitely inferior to those in
Table 4.Whether the excess of sulfate is a characterizing
Table 5. Stoichiometric formulae of minerals from the copiapite group, Sydney Coalfreld, Cape Breton Island
(Nu0 .o8 : cu0 .009 Mgo .se r Mn0 .o48 t t ' * o . r ' , 0 A lo . t t g )
(Nuo .ozo cu0 .0 r2 M9o .o5 r Mno .0 r6 t t ' * o l ! u A lo . zeo )
( ' u 0 . l o o c u 0 . 0 5 8 M g o . z 8 o M n 0 . 0 0 9 ' " ' * o . r r r A l o . : z o )
(Nuo .o6q cu0 .oz r M90 .287 Mno .035 o t ' *o . , ss A lo . : ge )
(Nuo .o5 : cu0 .0 rB M9o .g2e Mno .058 t " ' * 0 . , : o A lo .+ rz )
(Nuo .0s8 cu0 .006 M90 .o8s MnO.0 r3 ' " t *0 . ' z s A lo .oo : )
? +( F e " o . z . t O A I O . Z S O ) +
F o -A
(Fe " o .go2 A lO .oss )+
( F e " 0 . 9 7 9 A l O . O Z t ) +
( F e - 0 . 9 8 9 A l O . O t t ) +
? f
( F e " o . s s : A l O . o t Z ) q
l soo)u (oH)z
l s o o ) u ( o H ) z
lsoo)u (oH)z
( so4 )6 (ot't ) z
(so4)6 (oH)z
(so4 )6 (oH ) z
=20 .0H20 SamP le No .
= , l 8 . 5 H 2 0 S a m P l e N o .
= ' l 8 . 0H20 SamP le No .
= ' l 8 . 5 H 2 0 S a m P l e N o '
= 1 6 . oHzO SamP l e No .
= . l 8 . 4H20 SamP le No '
1 0
Note : cha rge -ba lanced f o rmu lae have t hese A l coe f f i c i en t s , by ( 2 - V - 2 ( l ' l + X + Y
O . l 0 7 , O . 2 l ' l , 0 . 2 4 6 , 0 . 2 8 6 , 0 . 2 9 2 ' a n d 0 . 4 6 ] '
S a m p l e N o . 8 i s a m a g n e s i o c o p j a p i t e ; N o . 9 t h e s p e c i e s ' n a m e , c o p i a p i t e ; N o s ' ' l 0 ,
c o p i a p i t e , a n d N o . 4 i s a l u m i n o c o p i a p j t e .
+ 7 ) ) / 3 :
r e s p e c t j v e l Y .
2 , a n d I a r e m a g n e s i a n a l u m j n o -
ZODROI{: HYDRATED SULFATES
A t i i l 0 . 7 4 o 8 2 1 . 9 ' l + t . t 7
T A B L E 4 1 . 0 4 l . t 0 0 . 9 5 + 1 . 6 2
o b s e r v e d l . l 0 1 . 8 7 1 . 6 6 1 . 6 3TABLE 2
1 . 0 0 + - . 0 8 + 5 - 4 9 + 2 . A 60 30+ - . 09+ 3 .33+ 2 9 tr . 4 0 0 . 9 8 3 . 6 2 ? 4 6
Table 6. Comparison between predicted and observed values ofAl and SOa according to Model l: residual positive charge of
stoichiometric formulae in Table 5 is eliminated
S a m p l e N o . l l 0
Exchange the constant term a Ca with eaw, collectterms to obtain
-CabV - CacX + CadY + CahZ +
gefc-(Ca-eqi)w:-aea
when multiplied by -l the last row of the matrix inTable 3 is realized. This procedure is systematicallyfollowed for the remaining elements.
To add a metal, say Cu, to the substitutionalmodel would necessitate (a) augmenting the numberof subscripts and calculating a new MW, and O)forming a new Table 3 according to the above devel-opments. The sign of the Cu component in MW is"+" as Cu has a larger atomic weight than Al, themetal value to be predicted. However, in the matrixformat the "+" changes to a "-". To delete a metalcomponent, put zero in the appropriate term of MW(and delete the corresponding row and column in thematrix).
Note added in proofAluminocopiapite, according to X-ray analysis, col-
lected from a coal seam in Smithers, B.C., Canada,by Keith McCandlish in 1979 with compositionll.92%o Fe'*, 2.23Vo Fe2*, 42.75Vo SOe, l.54vo Al,l.OSVo Mg, O.l37o Ca, O.02Vo Na, and O.O4Vo Mn doesnot satisfy the stoichiometric conditions, i.e., Fe3*and Na contents appear to be too low according tothe empirical criteria in Figure 2.
AcknowledgmentsThis investigation is wholly supported by N. R. C. (Canada),
Grant A6125. I thank Dr. J. K. Sutherland, Research and Produc-tivity Council of New Brunswick, for identification and chcmicalanalyses of the samples. I acknowledge valuable help from thecomputer c€nter at Dalhousie University, Halifax, N. S., in exe-cuting by r€mote entry the program of sinultaneous linear equa-tions. Dr. R. F. Martin, Geological Sciences, McGill University,Montreal, P. Q., is thanked for constructive critique of the manu-script. F. Baechler, Nova Scotia Department of Environment, Wa-ter Planning and Management Division, Sydney, N. S., suppliedinformation on aluminum in the Sydney Coalfield, Table l; thiscooperation is appreciated. The use ofthe algebraic expression forthe elimination of residual positive charges was suggested by Pro-fessor G. A. Chao, Department of Geology, Carleton University,Ottawa, Ontario.
ReferencesBerry, L. G. (1947) Composition and optics of copiapite. Univ. To-
ronlo Stud., Geol. Ser., 21,2L-34.Fanfani, L., A. Nunzi, P. F. Zanazzi and A. R. ZaM ri (1973) The
copiapite problem: the crystal stnrcture of a ferrian copiapite.Am. Mineral., 58, 3l+322.
Jolly, J. H. and H. L. Foster (1967) X-ray diffraction data ofaluminocopiapite. A m. M ineral., 5 2, l22l - 1223.
- . 0 9 1 4 20 . 0 8 I . 7 10 . 1 0 1 . 4 5
s 0 4 % 4 7 . 1 9 4 7 . 1 8 4 8 . t 6 4 7 2 9 4 7 . 4 8 4 7 . 0 9 4 8 8 2 4 8 . 3 1 4 6 3 7 4 7 . 4 6T A B L E 4 4 7 . 0 7 4 7 . 0 7 4 8 . 6 4 4 7 . 0 8 4 7 8 2 4 7 1 0 4 9 . 9 6 4 8 . 3 0 4 6 . 3 0 4 7 . 3 0
observed 52 .74 47 .78 45 97 48 .70 45 .77 46 .68 47 .07 48 .40 4 i .84 49 6 l]ABLE 2
AVERAGIS
rv :2 r . r53
so or"2 47. 3oo
TABLE 4 observed (TABLE 2)
l . 4 t 0 I 4 3 5
4 7 . 1 8 7
too" t 47 .535 47 .66d
4 9 t 7 8
48 056
+ S t o i c h i o m e t r j c r e q u i r e m e n t s n 0 t s a t ' i s f j e d .
l L u t t h " c o e f f i c i e n t o f A l i n T A B L E 4 b e : ( 2 - V - 2 ( t i + X + y + z ) ) / 3a n d a l s o s u b s t i t u t e t h i s e x p r e s s i o n j n t h e m o l e c u l a r w e i g h tfo rmula ( l4 t l ) to ob ta in a new fo rmula we igh t and hence the va lues ;see TABLE 5 .
2 A u " " u g " o f 6 s a m p l e s , o r s a m p l e s o f + S t o i c h i o m e t r i c r e q u i r e m e n t s
n o t s a t i s f i e d a r e e x c l u d e d .3 A u " " u g " o f a l l l o s a m p l e s .
feature of copiapite samples from the SydneyCoalfield, or a problem of mathematlsal maniFula-tion in the prediction process, is not known at thisjuncture without further investigation. Fanfani et al.(1973), however, show well the problem between therelationship of chemical data and atomic arrange-ments in some copiapite samples.
Continuing research is concentrated on possible(OH) substitutions and recognition of additional an-ions, and sulfate content. Unit-cell refinements are inprogress.
Appendix
Derivation of a system of simultaneous linear equations
The MW is obtained directly from Model l, Table4, by expanding: Na" i Ca* f Mg* * Mn, t Fe, *4Feo * [4Al - 4AL + Al - Al(V + W + X + Y +Z)l + 6(504) + 2(OH) + 20H,O which upon evalua-tion in terms of atomic weights of the componentsleads directly to (a - bV - cX + dy + hZ + fG +jW) : MW. To reproduce CaVo from Table 2 we con-sider that CaVo : Ca*/MW which when rearrangedbecomes the last equation (row) in Table 3.
Ca: Ca*/(a - bV - cX + dY +hZ + fG + jW)

ZODROW: HYDRATED SULFATES 967
Zodrow, E. L. and K. McCandlish (1978a) Hydrated sulfates in - and - (1979) Hydrated sulfates in the Sydneythe Sydney Coalfield, Cape Breton, Nova Scotia. Can. Mineral., Coalfield of Cape Breton, Nova Scotia. II. Pyrite and its altcra-16, 17-22. tion products. Can. Mineral., 17,63-70.
- and - (1978b) Roofweakness: fossilization and cyclicregenerative hydrated sulfates. Discussion. Can. Inst. Min. IVa. Manuscripl received, October 22, 1979;Bull.,7l(796),90-91. acceptedfor publicatiott, January 29, 1980.
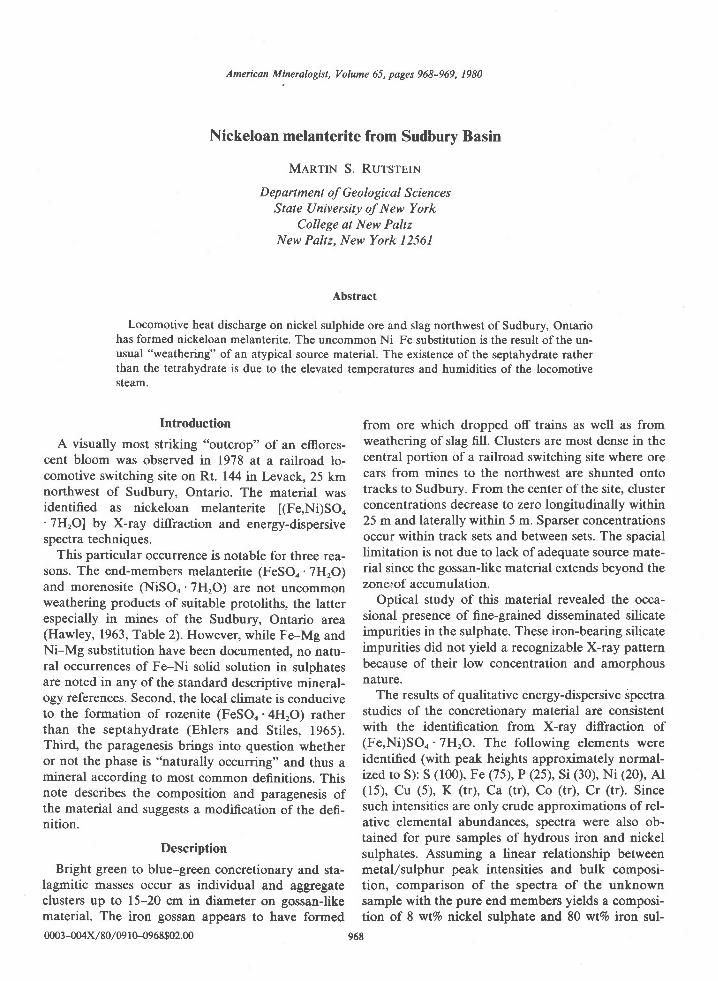
American Mineralogist, Volume 65, pages 968-969, 1980
Nickeloan melanterite from Sudburv Basin
MenrrN S. RursrerN
Department of Geological SciencesState University of New York
College at New PaltzNew Paltz, New York 12561
Abstract
Locomotive heat discharge on nickel sulphide ore and slag northwest of Sudbury, Ontariohas formed nickeloan melanterite. The uncommon Ni-Fe substitution is the result of the un-usual "weathering" of an atypical source material. The existence of the septahydrate ratherthan the tetrahydrate is due to the elevated temperatures and humidities of the locomotivesteam.
Introduction
A visually most striking "outcrop" of an effiores-cent bloom was observed in 1978 at a railroad lo-comotive switching site on Rt. lzg in Levack, 25 kmnorthwest of Sudbury, Ontario. The material wasidentified as nickeloan melanterite [(Fe,Ni)SO.'7HrOl by X-ray diffraction and energy-dispersivespectra techniques.
This particular occurrence is notable for three rea-sons. The end-members melanterite (FeSOo. THrO)and morenosite (NiSO4.7HrO) are not uncommonweathering products of suitable protoliths, the latterespecially in mines of the Sudbury, Ontario area(Hawley, 1963, Table 2). However, while Fe-Mg andNi-Mg substitution have been documented, no natu-ral occurrences of Fe-Ni solid solution in sulphatesare noted in any of the standard descriptive mineral-ogy references. Second, the local climate is conduciveto the formation of rozenite (FeSOo.4HrO) ratherthan the septahydrare (Ehlers and Stiles, 1965).Third, the paragenesis brings into question whetheror not the phase is "naturally occurring" and thus amineral according to most common definitions. Thisnote describes the composition and paragenesis ofthe material and suggests a modification of the defi-nition.
Description
Bright green to blue-green concretionary and sta-lagmitic masses occur as individual and aggregateclusters up to 15-20 cm in diameter on gossan-likematerial. The iron gossan appears to have formed
0003-004x/80/09 I 0-0968$02.00
from ore which dropped off trains as well as fromweathering of slag fill. Clusters are most dense in thecentral portion of a railroad switching site where orecars from mines to the northwest are shunted ontotracks to Sudbury. From the center of the site, clusterconcentrations decrease to zero longitudinally within25 m and laterally within 5 m. Sparser concentrationsoccur within track sets and between sets. The spaciallimitation is not due to lack of adequate source mate-rial since the gossan-like material extends beyond thezonerof accumulation.
Optical study of this material revealed the occa-sional presence of fine-grained disseminated silicateimpurities in the sulphate. These iron-bearing silicateimpurities did not yield a recognizable X-ray patternbecause of their low concentration and amorphousnatur€.
The results of qualitative energy-dispersive spectrastudies of the concretionary material are consistentwith the identification from X-ray diffraction of(Fe,Ni)SOo '7H2O. The following elements wereidentified (with peak heights approximately normal-ized to S): S (100), Fe (75), P (25), Si (30), Ni (20), Al(15), Cu (5), K (tr), Ca (tr), Co (tr), Cr (tr). Sincesuch intensities are only crude approximations of rel-ative elemental abundances, spectra were also ob-tained for pure samples of hydrous iron and nickelsulphates. Assuming a linear relationship betweenmetallsulphur peak intensities and bulk composi-tion, comparison of the spectra of the unknownsample with the pure end members yields a composi-tion of 8 wt%o nickel sulphate and 80 wtTo iron sul-
96E
RUTSTEIN: NICKELOAN MELANTERITE 969
phate. The lack of summation to lOOTo suggests thatthe intensity:composition relationship might not belinear, but instead might display a negative devia-tion. Evaluation of various slopes and considerationof analytical errors indicates a composition of 80-90Vo iron end members and l0-20%o nickel end mem-ber.
The X-ray pattern of the slag matrix was identifiedas consisting mainly of a clinopyroxene-like phase.Energy-dispersive analysis of slag matrix material re-vealed the following elements (given with peakheights here approximately normalized to Si):5(100), S(80), Fe(70), P(50), A(45), C(30), K(15),Ca(10), Mg(5), Ni(tr), As(tr). The physical state ofthe phosphorus, probably added during smelting,could not be determined. The chlorine may be a resi-due from salts used to melt snow. Copper was not de-tected in the matrix, although the sulphate has anFe-Cu energy dispersive intensity ratio of 15: l.
These data are consistent with the eflorescentbloom having formed from oxidative alteration andhydration of, and on, iron silicate slag in the intimatepresence of Cu-Ni-Fe sulfide ore. Retgers as well asWyrouboff (in Palache et al., 1951, p. 517) reportedthat in experimental studies on Mg-Fe-Ni sulphatehydrates, "Fe substitutes for Mg up to at least Fe-Ni: I :5." The lack of such cornpositions in natural en-vironments is due to the rarity of suitable protolithsfor weathering. In this occurrence, the lack of Mgand the availability of Fe and Ni have produced thisunusual solid solution.
Initially, the laboratory hydration-dehydration ofthe sulphate was readily reversible. However, afler afew months of storage in a water-containing dessica-tor, the reversible reaction could no longer be dem-onstrated since the iron had oxidized and the sul-phate was partially converted to limonite. Before thisoxidation had started, the dehydrated material exhib-ited an X-ray diffraction pattern interpreted as due toa single phase similar to the tetrahydrate rozenite(FeSOo'4HrO). Thus, the conversion of this partialnickeliferous-ferrous solid solution suggests that a Nitetrahydrate analogue to FeSOo '4H2O may be pos-sible. However, the natural occurrence of this as apure phase has not yet been reported.
Discussion
Ehlers and Stiles (1965) conclude that the stabilityfield of rozenite and melanterite is a simple functionof temperature and relative humidity. Under drierconditions, the tetrahydrate is stable. The amount ofNi solid solution in the materials studied here is be-lieved unlikely to have a pronounced effect on these
stability relations. Thus, it is unusual to observe the
septahydrate in a mid-continental region of moderate
humidity, where rozenite is more likely to form (see
Jambor and Traill, 1963). On the other hand, a
source for elevated relative humidity (and temper-
ature to speed the reaction) is locally available. At
the switching site, cooling motors discharge heated
air laterally from the engines. Reaction with moder-
ately humid air produces a steam which "weathers"
the ore and slag rubble. This causative agent restricts
the sulphate formation longitudinally and laterally
along the right-of-way in the switching area. Thus,
even though similar source material is available out- '
side of the immediate area of bloom formation, the
limited "artificial climate" localizes formation of theseptahydrate. Further, in 1979 when the switching
site was unused because of a labor strike, no bloomformation was observed.
The hydrated sulphate formed not as the result of
man's willful action, but as a by-product of or in-
cidental to man's direct and deliberate activities. The
oft-quoted definition of Berry and Mason (1959, p.
3-4) notes that a mineral is "naturally occurring," al-
though exceptions are often made which tend to be
largely dependent upon the degree of human vJ. nat-
ural (non-human) activity involved. To accommo-date anthropogenic phases, the following formalizedredefinition is proposed: "a mineral .. . should have
formed by natural processes which are not the result
of man's willful or deliberate actions . . ." Then, the
nickeloan melanterite discussed herein is clearly not
a synthetic analogue to a mineral, but is a mineral in
the strict sense.
Note added in proof
By July 1980, the "outcrop" no longer exists, hav-
ing been removed by bulldozing and the site covered
with grass planted as part of a reforestation project.
Acknowledgments
The constructive comments of W. G. White are appreciated.
References
Berry, L. G. and B. Mason (1959) Mineralogy: Concepts, Descrip'
lions, Determinctions. Freeman, San Francisco.
Ehlers, E. G. and D. V. Stiles (1965) Melanterite-rozenite equilib-
rirum. Am. Mineral., 50, 1457-1461.
Hawley, J. E. (1963) The Sudbury ores: their mineralogy and ori-
gin. Can. Mineral., 7, l-207.
Jambor, J. L. and R. J. Traill (1963) On rozenite and siderotil.
Can. Mineral., 7, 7 51-'163.
Palache, C., H. Berman and C. Frondel (1951) The System of Min-
eralagy, Vol. II. Wiley, New York.
Manuscript received, June 18, 1979;
acceptedfor publication, April 18, 1980.
American Mineralogist, Volume 65, pages 970-980, 1980
The low-temperature inversion in sub-potassic nephelines
C. M. B. HnNoBnsoN
Department of Geology, The UniversityManchester MI3 gPL, England
AND ALAN BnucB THolrtpsoN
I nstitut fiir Krist all o gr ap hie und P etro gr ap hie, E T HZiirich C H - 809 2. Swit z erland
Abstract
Differential 5sxnning calorimetric (DSC) and high-temperature X-ray di-ffraction studieson seven nephelines belonging to the system NaAlSiOo(Ne)-KAlSiO4(Ks) show that sampleswith less than 2.5 mol percent Ks (sub-potassic nephelines) exhibit complex relations. AType-C nepheline containing 1.6 percent Ks has a 5ingle sharp DSC peak near 360 K thistemperature is close to that at which extra X-ray reflections characteristic of an orthorhombic3c superstructure disappear (365 K) and marks an inversion to hexagonal symmotry. Type-Bnephelines containing 0 to 0.36 percent Ks have two DSC peaks below 480 K which are sepa-rated by 2Oo to 40". The two peaks conflrm the existence of two phases in Type-B nephelinesand the presence of two inversions. For each sample, the lower-temperature DSC peak coin-cides with the disappearance of the orthorhombic superstructure (c/ Type-C) and the higher-temperature peak with the disappearance of extra X-ray reflections typical of a low-symmetrysecond phase. Type-B and -C nephelines have DSC scans sirnilar to that for tridymite whichsuggests that the low-temperature inversions in sub-potassic nephelines are caused by the col-lapse of the 'tridymite-like' framework about the relatively small Na* in the larger cationsites. In contrast, nephelines with more than 2.5 percent Ks are hexagonal at room temper-ature and show no inversions. Thus a Type-H nepheline eeat4ining 27 perc:ent Ks does nothave extra X-ray reflections and does not show any peaks on DSC scans between 340 and520 K.
The heat capacity (C) data for A.4O7 (pure-Na, Type-B) above 500 K show excellentagreement with the Ci equation fitted to the drop calorimetric data of Kelley et al. (1953) onsynthetic pure Na nepheline between 467 and ll80 K and can be used for thermochemicalcalculations on Ks-bearing nephelines above about 5M K.
Introduction
Although the natural occurrence of nepheline min-erals is restricted, they have been the subject of manydetailed experimental studies. [n particular, thenepheline (NaAlSiOo, Ne)-kalsilite (KAlSiOo, Ks)system has served as a useful analogue f61 6qdsllingactivity-composition relations of other imml5siUsNa-K phases (e.9. feldspars, micas, and halides). Inaddition, nepheline solid solution towards SiO, hasprovided necessary information on defect solid solu-tions, and the Na"KrAl8Si8O32 phase is an excellentexample of what may be an ordered compoundwithin a solid-solution series. However, nephelines of
the same composition may crystallize in differentspace-groups under different cooditions and theseforms may be related by phase transitions sf higherthan first-order. Very little is known generally of howsuch transitions affect phase equilibria in mineralsystems, but the large amount of information avail-able for nephelines makes them suitable candidatesfor such studies.
Henderson and Roux (1977) showed that neph-elines synthesized in the system Ne-Ks have differ-ent structures, depending upon composition andmethod of synthesis. At room temperature those withbetween 25 and 2.5 percent Ks (all compositions aregiven as mol percent) are hexagonal (Type-H). This
0003-004x/80/09 l M970$02.00 970
HENDERSON AND THOMPSON: SUB-POTASSIC NEPHELINES 971
composition range has x : 2.0 to 0.2, where -r is thenumber of K atoms in the unit cell Nar_,K,Al8Si8O3r.All X-ray peaks in this type of nepheline can be un-equivocally indexed using the Hahn and Buerger(1955) cell (HBC). In contrast, Henderson and Roux(1977) showed that nephelines with <2.5 percent Ks[sub-potassic nephelines (Donnay et al., 1959)l haveextra reflections that cannot be indexed with theHBC, have anomalous pseudohexagonal cell param-eters, and show multiple twin lamellae. Nephelineswith between 2.5 and -0.7 percent Ks (x : 0.2 to0.06) were believed to be orthorhombic (Type-C)with an, $an 3cnsuperstructures, where an and co re-fer to hexagonal cell parameters. Hydrothermallysynthesized nephelines with 0 to -0.7 percent Ks(Type-B) were shown to contain two phases, one withan orthorhombic 3c superstructure and a second witheven lower synmetry. Pure-Na nephelines synthe-sized dry from gels at I atm were found to be single-phase (Type-A), with a diferent set of extra reflec-tions from those characteiztng pure-Na, Type-Bnephelines.
Henderson and Roux (1977) showed that Type-Band -C nephelines inverted to hexagonal symmetry at<473 K; the inversion temperature decreased as theKs content increased. The extra reflections and twinlamellae disappeared at the inversion, and the cellparameters became consistent with those expectedfor nephelines having the HBC structure. The speci-mens showed -30o hysteresis, with inversion temper-atures during r:ooling being lower than those on heat-ing; however, the effect of cooling rate on the degreeof hysteresis was not studied. All pure-Na, Type-Bnephelines (A.72, A.88, A.407, and the Schairersample) showed small steps in the a parameter at thelow-temperature inversion with some specimens alsohaving distinct steps in c, and hence discontinuitiesin volume (see Fig. 6, Henderson and Roux, 1977'). AType-C nepheline (N.233) showed inflections, but nosteps in a and c at the inversion; the displacements ins and c were in the opposite sense so that no disconti-nuity in Zwas detected. A Type-A specimen (N.10)showed a rather diferent behavior. Although therewas an inflection in a (but no step) at 453 K, and noapparent inflection in c, the extra reflections only dis-appeared above 873 K. The temperature of 453 Kwas equated with the low-temperature inversion ob-served in the other sub-potassic nephelines.
Henderson and Roux (1977\ related the differ-ences in the inversion behavior of the samples tovarying degrees of collapse of the framework aboutthe small Na cations that must occupy the larger cat-
ion site (Foreman and Peacor, 1970; Dollase, 1970).In addition it was suggested that superstructures ob-served in natural nephelines could also be related toframework collapse at the low-temperature in-verslon.
Because the thermal effects of the low-temperatureinversion in nepheline are detectable by diferentialthermal analysis (e.9. Cohen and Klement, 1976), theinversion could be further characterized by differen-tial scanaing calorimetry (DSC). Because the in-version is displacive (in the sense of Buerger, l95l), itis important to correlate the presence or absence of adiscontinuity in V, or in the coefficient of thermal ex-pansion at the inversion, with possible changes inheat capacity or its integrated thermodynamic func-tions.
We have studied at least one sample of Type-A,-B, -C, and -H nephelines by DSC and the results arepresented here. DSC measurements on Type-B neph-elines show two heat effects at <473 K. consistentwith the presence of two phases, but Henderson andRoux (1977) only identified one inversion at <473 Kin such nephelines. We have, therefore, reconsideredthe results of their X-ray experiments and have fur-ther studied the low-temperature inversion with sev-eral new samples using high-temperature X-ray dif-fraction methods.
X-ray investigations
Sample preparation and X-ray procedures
Several of the samples are those studied by Hen-derson and Roux (1976, 1977), namely: A.417, N.4,NE. Schairer, and A.407. Unfortunately, there wereinsufficient quantities of some of Henderson andRoux' samples for heat capacity measurements, sonew samples (NE.12, NE.17, and NE.1289) were syn-thesized hydrothermally from gels of the appropriatecompositions. The compositions and synthesis condi-tions for the nephelines studied are summarized inTable l. Because the nepheline type is crucially re-lated to Ks content, the compositions for some of thesynthesized samples were confirmed by determina-tion of KrO by atomic absorption spectrophotometry.The quoted compositions (Table l) are believed to beaccurate to +5 percent (relative).
Cell parameters w€re determined at room temper-ature (293 K) using a conventional Philips PW 1050diffractometer with CuKa radiation (CuKa 1.54178,CuKa' 1.54051A) and a scanaing rate of 0.5"20/mtn.Si was added as internal standard 1a : 5.43065A)and cell parameters were calculated by least squares.
HENDERSON AND THOMPSON: SUB-POTASSIC NEPHELINES
Cell parameters at elevated temperatures were deter-mined using the method of Henderson and Taylor(1975) in which the Pt sample holder peaks wereused for internal standardization. The 2d values forthe peaks were measured with a vernier rule and arereproducible to within +0.005" 2d.
The room temperature cell parameters (Table l)for the sub-potassic nephelines refer to a pseudo-hexagonal cell, whereas those for Type-B nephelinesare averaged values for the two phases present (Hen-derson and Roux, 1977, p.293). This averaging is re-flected in the relatively high standard errors for thesesamples.
The low-temperature inversion was studied vdth aheating stage mounted on an X-ray diffractometer,using a heating rate of -3o min-' and a cooling rateof -5o min-t.
X-ray results
The room-temperature X-ray patterns for the threenew specfunens show that NE.l7 (1.6 percent Ks) isType-C whereas NE.l2 (0.36 percent Ks) andNE.l289 (0.30 percent Ks) are clearly Type-B. Allthree specimens have anouralous cell parameters atroom temperature (Table l) and plot below the 'nor-
mal nepheline lins' dsfiasd in Figure 3 of Hendersonand Roux (1977). Note that the average c parameterfor the two phases in NE.l289 is substantially smallerthan the c parameters for the specimens studied pre-viously.
The inversion in NE.l7 was monitored using theextra reflection at -28.2" 20 CuKa which is charac-teristic of the orthorhombic 3c superstructure ofType-C nephelines. The -reflection decreased in in-tensity and eventually disappeared over the temper-ature range 358-368+5 K, but it reappeared on cool-ing with a hysteresis of -15o.
Type-B nephelines have split (002) reflections, in-dicating the presence of two phases. The presence ofan extra reflection at -28.2"20 CuKa confirms thatone of the phases has the orthorhombic 3c super-structure whereas extra reflections at 22.6", 29.2",and 30.2" 20 CuKa presumably belong to the lower-symmetry second phase (Henderson and Roux, 1977,p. 293). Thus the inversions in NE.l2 and NE.l289(both Type-B) were monitored using the extra reflec-tions at 28.2" and 30.2" 20, and the split (002) reflec-tion. On heating NE.l2, the 28.2" 2d reflection de-creased and disappeared over the temperature range413428t5 K. The (002) peak was broad and asym-metric at 448 K, showing that two phases were stillpresent. The 30.2o 20 reflection disappeared over the
Table I. Synthesis condit ions, composit ion and room
temperature (293 K) cell parameters for different types ofsYnthetic nePhelines
KsSpecimen mol % T, K
Time
days a, A
Type -A
N , 4 *
Tvpe:E_
Schairer* +
A . 4 0 7 *
N 8 . 1 2
N E . 1 2 8 9
UP::.c-N E 1 7
TVoe-H_L . 4 r 1
1390 1 atm
rszo) -t l a m
r32ot870 2. 5 kbar
1170 1 l$ar1240 2 l$ar
990 I kbar
8?3 2l'dtrar
1
( sl " n
5043
0
00 . 3 60 . 3 0
9 . 9 6 3 G ) 8 . 3 4 1 ( 2 ) 7 r 1 . 7 ( 2 )
e . e 6 9 ( 3 ) 8 . 3 6 1 ( 4 ) 7 1 9 . 6 ( 5 )
9 .977 (2 , \ 8 . 33e(4) 718.9(5)e . 9 3 1 ( 6 ) 8 . 3 3 9 ( e ) 7 1 9 . 5 ( s )9 . 9 9 5 ( 3 ) 8 . 2 7 5 ( 6 ) ? 1 5 . 9 ( 5 )
s . 9 9 0 ( 1 ) 8 . 3 2 9 p \ 7 r 9 . 9 p l
10 .004(2) 8 . 390(3) 727. 2 (3)
* Data from Herderson and Roux (1977).
+ Glass start ing mater ial ; others synthesized from ge].
** Numbers in pereotheses.are est\mated standard deviations oI
D a € m e t e r s : a . c x 1 0 3 , v x 1 o ' .
range 428468+5 K. On cooling, the extra reflectionsreappeared at about l5o below these temperatures.On heating NE.1289, t}lre 28.2" 2d reflection dis-appeared over the nnge 413428+5 K, (002) wascomparatively sharp zt 425 K, and the 30.2" 20 extrareflection disappeared over the runge 423-444+5 K.Q1 ssqling, all of the extra reflections reappearedat -410 K but broadening of(002) could only be de-tected at -365 K.
In NE.12 and NE.1289 thLe 28.2" 2d reflection dis-appeared before there was any major decrease in theintensity of the 30.2" 2d reflection. Further study ofX-ray charts from heating experiments on Type-Bnephelines N.1042 (0.2 percent Ks) and N.1040 (0.5percent Ks) (Henderson and Roux, 1977) alsoshowed that the extra reflections at -28.2" 20 dis-appeared -10 K before the 30.2" 2d reflection beganto decrease. The same relationship was reported forthe pure-Na, Type-B nephelines (e.g. A.72, Hender-son and Roux, 1977, p. 289). The implication is thatthe two phases present in Type-B nephelines invertto hexagonal symmetry over different temperatureranges (see later discussion).
The X-ray patterns for NE.l2, NE.l l , andNE.l289 above their respective inversion temper-atures are entirely consistent with hexagonal symme-try and can be fully indexed using the HBC. Cell pa-rameters determined above the inversions are: NE.17(408 K) a : 9.981 esd O.OOI, c : 8.360 esd 0.00.21,NE.l2 (500 K) a : 9.992 esd 0.001, c : 8.366 esd0.002; NE.l289 (48 K) a : 9.983 esd 0.001, c :
8.360 esd 0.001A. These values plot close to the 'nor-
mal nepheline line' and in this respect the new speci-
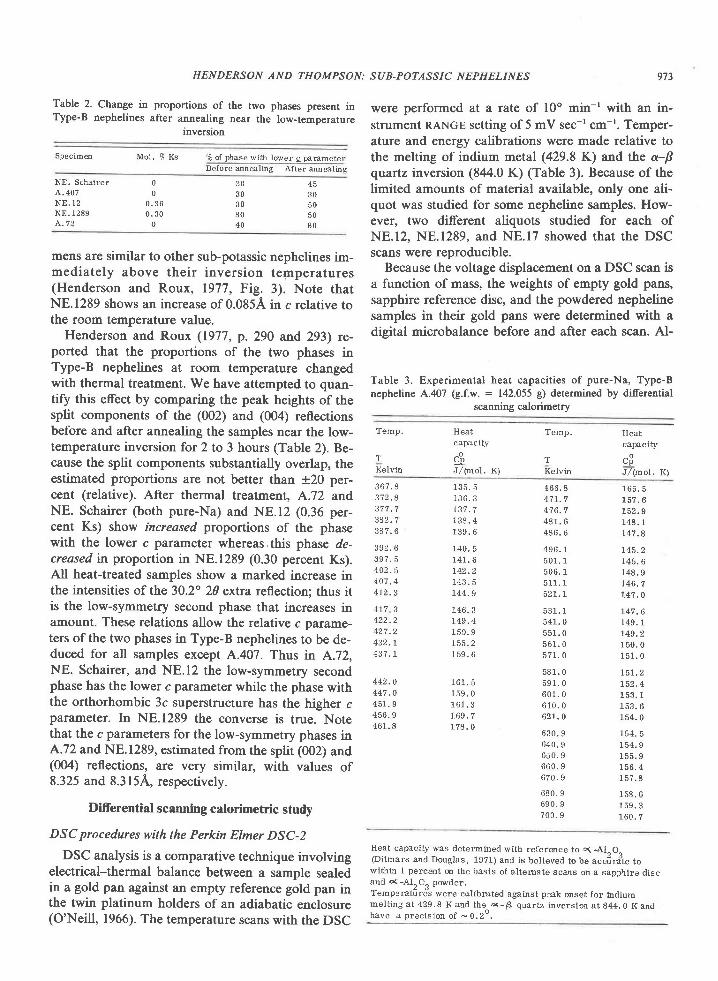
Table 2. Change in proportions of the two phases present inType-B nephelines after annealing near the low-temp€rature
lnverston
Specim@ Mol. % Ks % of phase with lower q panmeterBeforc annal ing After anneal ing
973
were perfonned at a rate of l0o min-' with an in-strument RANGE setting of 5 mV sec-rcm-r. Temper-ature and energy calibrations were made relative tothe melting of indium metal (429.8 K) and the a-Bquafiz inversion (8214.0 K) (Table 3). Because of thelimited amounts of material available, only one ali-quot was studied for some nepheline samples. How-ever, two different aliquots studied for each ofNE.l2, NE.1289, and NE.l7 showed that the DSCscans were reproducible.
Because the voltage displacement on a DSC scan isa function of mass, the weights of empty gold pans,sapphire reference disc, and the powdered nephelinesamples in their gold pans were determined with adigital rricrobalance before and after each scan. Al-
Table 3. Experimental heat capacities of pure-Na, Type-Bnepheline A.407 (e.f.w- : 142 tjlP_aff.-ined by differential
Temp.
HENDERSON AND THOMPSON: SUB-POTASSIC NEPHELINES
NE. Schairer4 .407N E . 1 2N E . 1 2 8 94 . 7 2
00
0 . 3 60 . 3 0
0
3 0505 08 0
303 03 08 040
mens are similar to other sub-potassic nephelines im-mediately above their inversion tefirperatures(Henderson and Roux, 1977, Fig. 3). Note thatNE.1289 shows an increase of 0.085A in c relative tothe room temperature value.
Henderson and Roux (1977, p.290 and 293) re-ported that the proportions of the two phases inType-B nephelines at room temperature changedwith thermal treatment. We have attempted to quan-tify this effect by comparing the peak heights of thesplit components of the (002) and (004) reflectionsbefore and after annealing the samples near the low-temperature inversion for 2 to 3 hours (Table 2). Be-cause the split components substantially overlap, theestimated proportions are not better than +20 per-cent (relative). After thermal treatment, A.72 andNE. Schairer (both pure-Na) and N8.12 (0.36 per-cent Ks) show increased proportions of the phasewith the lower c parameter whereas.this phase de-ueased in proportion in NE.l289 (0.30 percent Ks).All heat-treated samples show a marked increase inthe intensities of the 30.2" 20 extra reflection: thus itis the low-symmetry second phase that increases inamount. These relations allow the relative c parame-ters of the two phases in Type-B nephelines to be de-duced for all samples except A.407. Thus in A.72,NE. Schairer, and NE.l2 the low-symmetry secondphase has the lower c parameter while the phase withthe orthorhombic 3c superstructure has the higher cparameter. In NE.l289 the converse is true. Notethat the c parameters for the low-symmetry phases inA.72 and NE.1289, estimated from the split (002) and(004) reflections, are very similar, with values of8.325 and 8.315A, respectively.
Differential scanning calorimetric study
DSC procedures with the Perkin Elmer DSC-2
DSC analysis is a comparative technique involvingelectrical-thermal balance between a sample sealedin a gold pan against an empty reference gold pan inthe twin platinum holders of an adiabatic enclosure(O'Neill, 1966). The temperature scans with the DSC
Heat caprcity was determined with refermce to D( -Alroe(Ditmars and Douglas, 1971) and is believed to be accira"te towithin 1 percent m the basis of alternate scans on a sapphire discand o( -Alooo pwder,TemperatfirJs were calibrated against p3ak mset for indiummel t ing a t 429,8 K and the a-A quar tz inyers ion a t 844.0 Kandhave a prec is im o f -O.2o ,
TKeIvin
Heatcapac rty
sJ/(mo]. K)
Temp.
TKelvin
Heatcapa.city
upJ/(mol. K)
3 6 7 . 8372.8
382.73 3 7 , 6
3 9 2 . 63 9 7 . 5402.5407.44 r 2 . 3
41,7 34 2 2 . 24 2 7 . 2432.14 3 7 . 1
4 4 2 . 0447.04 5 1 . 9456.9461.8
1 3 5 . 51 3 6 . 3r 3 7 . 71 3 8 . 41 3 9 . 6
140. 51 4 1 . 6t42 .2143.5I 4 4 . 9
1 4 6 . 3r49 .41 5 C . 9L55.21 5 9 . 6
1 6 1 . 51 5 9 . 01 6 1 , 3t69 .71 7 8 . 0
4 6 6 . 8471.74 7 6 . 74 8 1 . 64 3 6 . 6
496.75 0 1 . 15 0 6 . 15 1 1 . 1521. t
5 3 1 . 15 4 1 . 05 5 1 . 05 6 1 . 05 7 1 . 0
5 8 1 . 05 9 1 . 06 0 1 . 06 1 0 . 062r.0
6 3 0 . 9640.96 5 0 . 96 6 0 . 9670.9
6 8 0 . I6 9 0 . 97 0 0 . I
1 6 5 . 5r 5 7 , 6
148, 1r 4 7 . 8
I 4 5 . 2t45.61 4 8 . 9146.7147 .0
t47 .61 4 9 . 1r49.21 5 0 . 01 5 1 . 0
15t.2152.41 5 3 , 1I O J . b
1 5 4 . 0
1 5 4 . 91 5 5 . I1 5 6 . 41 5 7 . 8
1 5 3 , 61 5 9 . 31 6 0 . 7
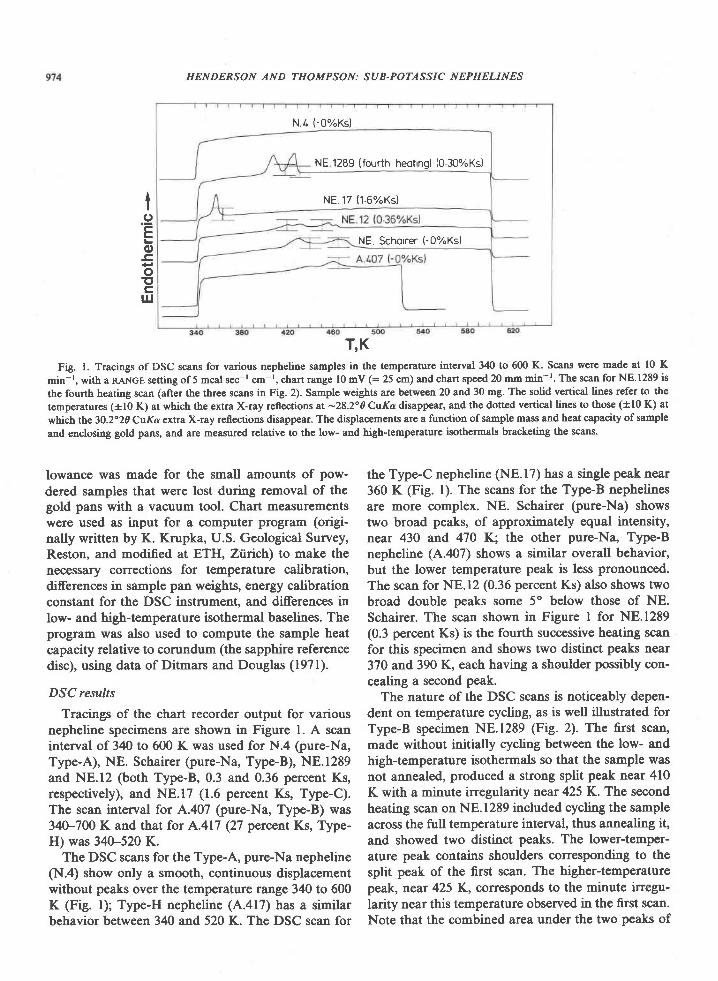
HENDERSON AND THOMPSON: SUB-POTASSIC NEPHELINES
N.4 ( -O%Ks)
NE 1289 (fourth heoting) (0 30%Ks)
NE.17 (1.6%Ksl
NE. Schoirer (-O%Ks)
T'KFig. l. Tracings of DSC scans for various nepheline samples in the temperature interval 34() to 600 K. Scans were made at l0 K
min-r, with a RANGE setting of 5 mcal sec-r cm-r, chart range l0 mV (: 25 cm) and chart speed 20 mm min- r. The scan for NE.1289 is
the fourth heating scan (after the three scans in Fig. 2). Sample weights are between 20 and 30 mg. The solid vertical lines refer to the
temperatures (tlQ K) at which the extra X-ray reflections at -28.200 CuKa disappear, and the dotted vertical lines to those (+10 K) at
which the 30.2"20 CuKa extra X-ray rcflections disappear. The displacements are a function of sample mass and heat capacity of sample
and enclosing gold pans, and are measured relative to the low- and high+emperature isothermals bracketing the scans.
lI
.9Eo-coItcul
lowance was made for the small amounts of pow-dered samples that were lost during removal of thegold pans with a vacuum tool. Chart measurementswere used as input for a computer program (origi-nally written by K. Krupka, U.S. Geological Survey,Reston, and modified at ETH, Ztrich) to make thenecessary corrections for temperature calibration,differences in sample pan weights, energy calibrationconstant for the DSC instrument, and differences inlow- and high-temperature isothermal baselines. Theprogram was also used to compute the sample heatcapacity relative to corundum (the sapphire referencedisc), using data of Ditmars and Douglas (1971).
DSC results
Tracings of the chart recorder output for variousnepheline specimens are showr in Figure 1. A scaninterval of 340 to 600 K was used for N.4 (pure-Na,Type-A), NE. Schairer (pure-Na, Type-B), NE.1289and NE.l2 (both Type-B, 0.3 and 0.36 percent Ks,respectively), and NE.l7 (1.6 percent Ks, Type-C).The scan interval for A.407 (rure-Na, Type-B) was34V7W K and that for A.417 (27 percent Ks, Type-H) was 340-520 K.
The DSC sc,ans for the Type-A, pure-Na nepheline(N.4) show only a smooth, continuous displacementwithout peaks over the temperature range 340 to 600K (Fig. l); Type-H nepheline (,4..417) has a similarbehavior between 340 and 520 K. The DSC scan for
the Type-C nepheline (NE.17) has a single peak near360 K (Fig. l). The scans for the Type-B nephelinesare more complex. NE. Schairer (pure-Na) showstwo broad peaks, of approxinately equal intensity,near 430 and 470 K; the other pure-Na, Type-Bnepheline (A.,107) shows a similar overall behavior,but the lower temperature peak is less pronounced.The scan for NE.12 (0.36 percent Ks) also shows twobroad double peaks some 50 below those of NE.Schairer. The scan shown in Figure I for NE.l289(0.3 percent Ks) is the fourth suceessive fusating scanfor this specimen and shows two distinct peaks near370 and 390 K, each having a shoulder possibly con-cealing a second peak.
The nature of the DSC scans is noticeably depen-dent on temperature cycling, as is well illustrated forType-B specimen NE.l289 (Fig. 2). The first scan,made without initially cycling between the low- andhigh-temperature isothermals so that the sample wasnot annealed, produced a strong split peak near 410K with a minute irregularity near 425 K. The secondheating scan on NE.l289 included cycling the sampleacross the full temperature interval, 16ot anasaling it,and showed two distinct peaks. The lower-temper-ature peak contains shoulders corresponding to thesplit peak of the first scan. The higher-temperaturepeak, near 425 K, corresponds to the minute irregu-larity near this temperature observed in the first scan.Note that the combined area under the two peaks of
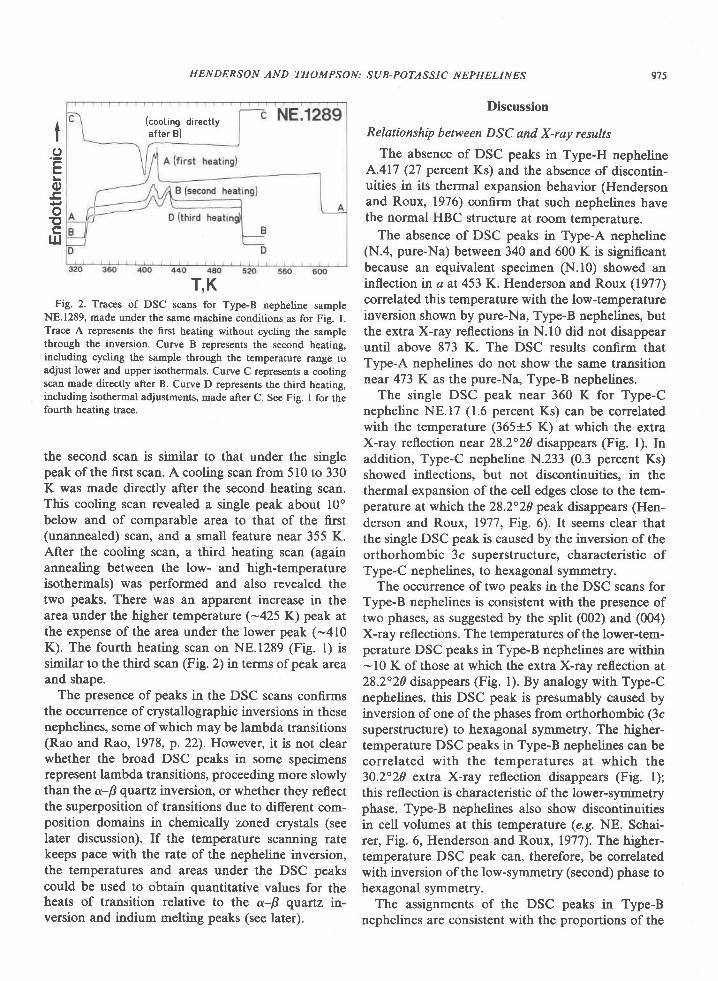
(cool . ing di rect tyafter B)
HENDERSON AND THOMPSON: SI]B-POTASSIC NEPHELINES 975
II
.9Eo
oE
IJJ
T,KFig. 2. Traces of DSC scans for Type-B nepheline sample
NE.1289, made under the same machine conditions as for Fig. l.Trace A represents the first heating without cycling the samplethrough the invenion. Curve B r€presents the second heating,including cycling the sample through the temperature range toadjust lower and upper isothermals. Curve C represents a coolingscan made directly after B. Curve D represents the third heating,including isothermal adjustments, made after C. See Fig. I for thefourth heating trace.
the second scan is similar to that under the singlepeak ofthe first scan. A cooling scan from 510 to 330K was made directly after the second heating scan.This cooling scan revealed a single peak about l0obelow and of comparable area to that of the first(unannealed) scan, and a small feature near 355 K.After the cooling scan, a third heating scan (againannealing between the low- and high-temperatureisothermals) was perfonned and also revealed thetwo peaks. There was an apparent increase in thearea under the higher temperature (-425 K) peak atthe expense of the area under the lower peak (-410K). The fourth heating scan on NE.l289 (Fig. l) issimilar to the third scan (Fig. 2) in terms of peak areaand shape.
The presence of peaks in the DSC scans confirmsthe occurrence of crystallographic inversions in thesenephelines, some of which may be lambda transitions(Rao and Rao, 1978, p. 22).However, it is not clearwhether the broad DSC peaks in some specimensrepresent lambda transitions, proceeding more slowlythan the a-B quartz inversion, or whether they reflectthe superposition of transitions due to different com-position domains in chemically zoned crystals (seelater discussion). If the temperatgls 5sanning ratekeeps pace with the rate of the nepheline inversion,the temperatures and areas under the DSC peakscould be used to obtain quantitative values for theheats of transition relative to the o'-B quartz in-version and indium melting peaks (see later).
Discussion
Relationship between DSC and X-ray results
The absence of DSC peaks in Type-H nephelineA.417 (27 percent Ks) and the absence of discontin-uities in its thermal expansion behavior (Hendersonand Roux, 1976) confirm that such nephelines havethe normal HBC structure at room temperature.
The absence of DSC peaks in Type-A nepheline(N.4, pure-Na) between 340 and 600 K is signifisallbecause an equivalent specimen (N.10) showed aninflection in a at 453 K. Henderson and Roux (1977)correlated this temperature with the low-temperatureinversion shown by pure-Na, Type-B nephelines, butthe extra X-ray reflections in N.l0 did not disappearuntil above 873 K. The DSC results confirm thatType-A nephelines do not show the same transitionnear 473 K as the pure-Na, Type-B nephelines.
The single DSC peak near 360 K for Type-Cnepheline NE.17 (1.6 percent Ks) can be correlatedwith the temperature (365+5 K) at which the extraX-ray reflection near 28.2"20 disappears (Fig. l). Inaddition, Type-C nepheline N.233 (0.3 percent Ks)showed inflections, but not discontinuities, in thethermal expansion of the cell edges close to the tem-perature at which the 28.2"20 peak disappears (Hen-derson and Roux, 1977, Fig. 6). It seems clear thatthe single DSC peak is caused by the inversion of theorthorhombic 3c superstructure, characteristic ofType-C nephelines, to hexagonal symmetry.
The occurrence of two peaks in the DSC scans forType-B nephelines is consistent with the presence oftwo phases, as suggested by the split (002) and (004)X-ray reflections. The temperatures of the lower-tem-perature DSC peaks in Type-B nephelines are within- l0 K of those at which the extra X-ray reflection at28.2"20 disappears (Fig. l). By analogy with Type-Cnephelines, this DSC peak is presumably caused byinversion of one of the phases from orthorhombic (3csuperstructure) to hexagonal symmetry. The higher-temperature DSC peaks in Type-B nephelines can becorrelated with the temperatures at which the30.2"20 extra X-ray reflection disappears (Fig. l);this reflection is characteristic of the lower-symmetryphase. Type-B nephelines also show discontinuitiesin cell volumes at this temperature (e.9. NE. Schai-rer, Fig. 6, Henderson and Roux, 1977). The higher-temperature DSC peak can, therefore, be correlatedwith inversion of the low-symmetry (second) phase tohexagonal symmetry.
The assignments of the DSC peaks in Type-Bnephelines are consistent with the proportions of the
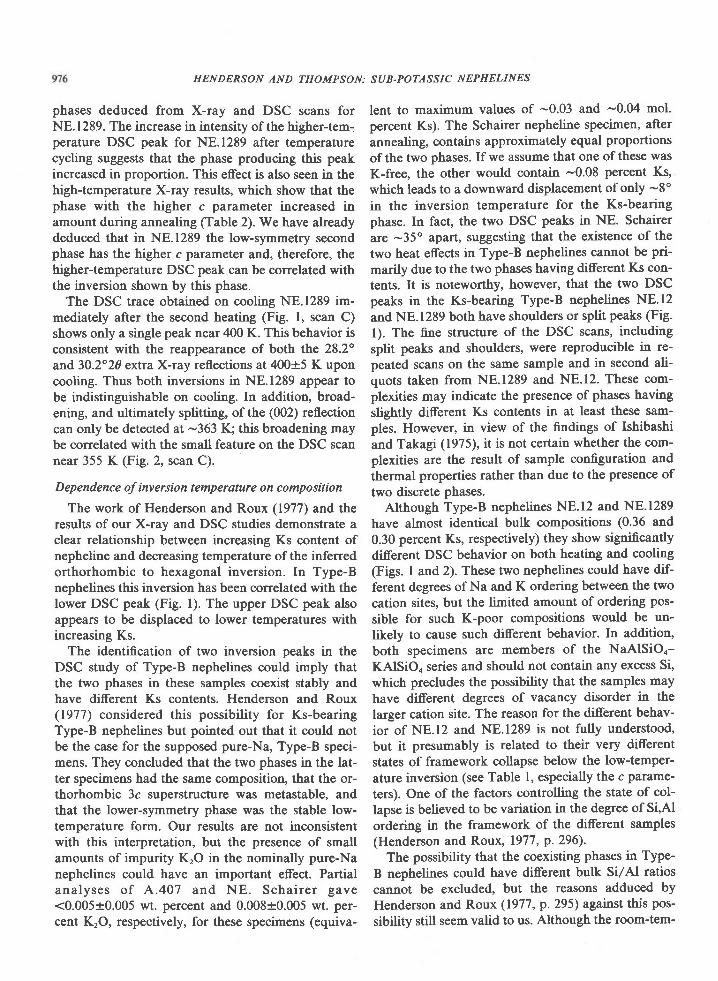
HENDERSON AND THOMPSON: SUB.POTASSIC NEPHELINES
phases deduced from X-ray and DSC scans forNE.1289. The increase in intensity of the higher-temlperature DSC peak for NE.l289 after temperaturecycling suggests that the phase producing this peakincreased in proportion. This effect is also seen in thehigh+emperature X-ray results, which show that thephase with the higher c parameter increased inamount during annealing (Table 2). We have alreadydeduced that in NE.l289 the low-symmetry secondphase has the higher c parameter and, therefore, thehigher-temperature DSC peak can be correlated withthe inversion shown by this phase.
The DSC trace obtainsd s1 sesling NE.l289 im-mediately after the second heating (Fig. I, scan C)shows only a single peak near 400 K. This behavior isconsistent with the reappearanc€ of both the 28.2"and 30.2"20 extra X-ray reflections at 400+5 K uponcooling. Thus both inversions in NE.l289 appear tobe indistinguishable sn ss6ling. In addition, broad-sning, and ultfunately splitting, of the (002) reflectioncan only be detected at -363 K; this 6lendsling ma]be correlated with the small feature on the DSC scannear 355 K (Fig. 2, scan C).
Dependence of inverion temperature on composition
The work of Henderson and Roux (1977) and theresults of our X-ray and DSC studies demonstrate aclear relationship between increasing Ks content ofnepheline and decreasing temperature of the inferredorthorhombic to hexagonal inversion. In Type-Bnephelines this inversion has been correlated with thelower DSC peak (Fig. l). The upper DSC peak alsoappears to be displaced to lower temperatures withincreasing Ks.
The identification of two inversion peaks in theDSC study of Type-B nephelines could imply thatthe two phases in these samples coexist stably andhave different Ks contents. Henderson and Roux(1977) considered this possibility for Ks-bearingType-B nephelines but pointed out that it could notbe the case for the supposed pure-Na, Type-B speci-mens. They concluded that the two phases in the lat-ter specimens had the same composition, that the or-thorhombic 3c superstructure was metastable, andthat the lower-symmetry phase was the stable low-temperature form. Our results are not inconsistentwith this interpretation, but the presence of smallamounts of impurity KrO in the nominally pure-Nanephelines could have an important effect. Partialanalyses of A.407 and NE. Schairer gave<0.005+0.005 wt. percent and 0.008+0.005 wt. per-cent KrO, respectively, for these specimens (equiva-
lent to maximum values of -0.03 and -0.04 mol.percent Ks). The Schairer nepheline specimen, afterannealing, contains approximately equal proportionsof the two phases. If we assume that one of these wasK-free, the other would contain -0.08 percent Ks,which leads to a downward displacement of only -8o
in the inversion temperature for the Ks-bearingphase. In fact, the two DSC peaks in NE. Schairerare -35o apart, suggesting that the existence of thetwo heat effects in Type-B nephelines cannot be pri-marily due to the two phases having diferent Ks con-tents. It is noteworthy, however, that the two DSCpeaks in the Ks-bearing Type-B nephelines NE.l2and NE.1289 both have shoulders or split peaks (Fig.l). The fine structure of the DSC scans, includingsplit peaks and shoulders, were reproducible in re-peated scans on the same sample and in second ali-quots taken from NE.l289 and NE.l2. These com-plexities may indicate the presence of phases havingslightly different Ks contents in at least these sam-ples. However, in view of the findings of Ishibashiand Takagi (1975), it is not certain whether the com-plexities are the result of sample configuration andthermal properties rather than due to the presence oftwo discrete phases.
Although Type-B nephelines NE.l2 and NE.l289have almost identical bulk compositions (0.36 and0.30 percent Ks, respectively) they show significantlydi.fferent DSC behavior on both heating nnd sseling(Figs. I and2). These two nephelines could have dif-ferent degrees of Na and K ordering between the twocation sites, but the limited amount of ordering pos-sible for such K-poor compositions would be un-likely to cause such different behavior. In addition,both specimens are members of the NaAlSiOo-KAlSiOo series and should not contain any excess Si,which precludes the possibility that the samples mayhave different degrees of vacancy disorder in thelarger cation site. The reason for the different behav-ior of NE.l2 and NE.l289 is not fully understood,but it presumably is related to their very differentstates of framework collapse below the low-temper-ature inversion (see Table l, especially the c parame-ters). One of the factors controlling the state of col-lapse is believed to be variation in the degree of Si,Alordering in the framework of the different samples(Henderson and Roux, 1977, P. 296).
The possibility that the coexisting phases in Type-B nephelines could have different bulk Si/Al ratioscannot be excluded, but the reasons adduced byHenderson and Roux (1977, p.295) against this pos-sibility still seem valid to us. Although the room-tem-
HENDERSON AND THOMPSON: SUB-POTASSIC NEPHELINES
perature c parameters for the orthorhombic 3c super-structures in A.72 and NE.l289 differ bv as much as0. l2A, the lower-symmetry phases, *hi"h irr"r"ur"in amount on annealing in both specimens, havealmost identical room-temperature c parameters(8.320+0.005A, based on HBC-indexing). Thusphases with the orthorhombic 3c superstructure oc-cur in very different states of framework collapse.These structures are almost certainly metastable, andthe low-symmetry phase therefore appears to be thestable low-temperature form.
Relations between low-temperature inversions innep he line and t ri dymit e
Henderson and Roux (1977) related the occur-rence of the low-temperature inversion in sub-potas-sic nephelines to the collapse of the 'tridymite-type'
framework about the small Na atoms occupying thelarger cation sites (Dollase, 1970; Foreman and Pea-cor, 1970). They also drew attention to the similarbehavior of tridymite, which exhibits displacivetransformations near 470 K and which forms variouslower-symmetry (pseudohexagonal) cells below 470K (Sato, 1963a,b, 1964; Dollase, 1967 ; Kihara, 1977 ;Nukui et al.,1978).
Thompson and Wennemer (1979) measured theheat capacities of synthetic tridymite, cristobalite,and tridymite-cristobalite 'mixed phases' by DSC.Tridymite showed a sharp peak at 390 K and twobroad, overlapping peaks in the range 436470 K.These heat effects were correlated with the mono-clinic to low-orthorhombic and low-orthorhombic tointermediate-orthorhombic tridymite inversions ofNukui et al. (1978).
The DSC traces for sub-potassic nephelines andtridymite are broadly similar in that DSC peaks oc-cur within similar ranges of temperature. The singleDSC peak occurring in Type-C nephelines (NE.l7)has a similar form to the 390 K peak in tridymite.The two peaks occurring in Type-B nephelines (e.g.AA07) are similar in form and temperature range tothe broad heat effects between 436 and 470 K in tri-dymite. These similarities support the suggestion(Henderson and Roux, 1977) that the low-temper-ature inversions in sub-potassic nephelines are pri-marily a property of framework collapse and that theinterframework cations play a relatively subordinaterole. Further correlation between nepheline and tri-dymite is not possible because we do not fully under-stand either the nature of the structures of the stablelow-temperature forms or the role of 'structural cav-ities' (defects) in determining the structure. In addi-
tion, the nature of tridymite-cristobalite 'mixed
phases' is not yet known (Thompson and Wennemer,1979), but their occurrence suggests the possible exis-tence of analogous nepheline-carnegieite'mixedphases.' If such structural modulations exist as do-mains in sub-potassic nephelines (e.5. n the two-phase Type-B nephelines) the problem ofcharacter-izing the stable low-temperature form of nephelineswill become even more complex.
Correlation of heat capacity measurements withprevious data
Our data for the heat capacity (C) of nepheline4.407 (pure-Na, Type-B) are shown as a function oftemperature in Figure 3. Also shown are the low-temperature (50-298 K) adiabatic calorimetric mea-surements for synthetic nepheline (NaAlSiOo) andkaliophilite (KAlSiO4) from Kelley et al. (1953).(Note that the nepheline sample used by these work-ers was synthesized by J. F. Schairer and presumablyis similar to our specimen NE. Schairer.)Kelley et al.also measured the heat contents for the same syn-thetic nepheline sample from 387 to 1509 K by dropcalorimetry and presented three linear equations ofCi vs. Z for the ranges 298467 K (the low-temper-ature inversion), 467-1180 K (the high-temperatureinversion), and l180-1525 K. These equations wereadopted by Robie et al. (1978) in their recent com-pilation of thermochemical data. The fits for the 298-467 K and 467-1180 K ranges are shown by short-dashed lines in Figure 3. Our Ci data for A.4O7 above500 K agree well with the 467-1180 K equation ofKelley et al. (1953, p. l5). However, their equationfor the range 298467 K represents only an averageof measurements for sample A.407 because of thecomplex behavior of Ci at the inversions. The DSCmeasurements (summarized in Table 3) suggest thatthe peaks at 439 K and 462 K may represent lambda-type transitions (see also Kelley et al., 1953, p. l5).
The difficulties in evaluation of E-Idn" and SrSrn, from heat capacity measurements across broadtransitions are well known (see Rao and Rao, 1978).However, the Ci data obtained for nepheline ,{.407(Table 3) have been fitted to polynomial equationscovering various temperature ranges. The smoothedvalues of Ci and the integrated functions, If-Ifrn"and Sr-Sr,* are presented in Table 4. The heat in-volved in the transition (Fig. 3) for the inversions in4.407 was estimated by subtracting 14229 J mol-',the area between 400 K and 500 K below the extrap-olated 467-1180 K Co equation of Kelley et al., fromthe integrated areas in Table 4 (15397 J mol-'). The

978 HENDERSON AND THOMPSON: SUB-POTASSIC NEPHELINES
200.0
180.0
-
oE
oo-(J
160.0
140.0
100.0
120.0
200.0
Fig. 3. Heat capacity (Co) in joules mol-rK-r as a function of temperature for the specimen of pure-Na, Type-B nepheline A.407measured by DSC (O symbols between 3?0 and 700 K); note the presence of two peaks neat 440 and 460 K. Also shown are data pointsfor synthetic nepheline (tr, NaAlSiOo) and katiophilite (4, KAlSiO4) to 298 K determined by adiabatic calorimetry (Kelley el al., 1953).The short-dash lines, passing approximately through the transitions to 467 K and from 467 to 7N K, refer to the fits to the dropcalorimetric data for NaAlSiOa (Kelley et al., 1953). The long-dash curve refers to equivalent fits for KAlSiOa (see Robie et al.,1978' p.
405-416).
300.0 4oo.o 500.0 600.0 700'0
T,K
resulting value for the heat of transition (1168 Jmole ') is not noticeable on the scale of Figure 4 ofKelley et al., and has not been used to introduce dis-continuities into the integrated functions E-I{r",and S;-S;,8 presented in Table 4.
Although ttre 29846'7 K Ci equation of Kelley era/. represents an average of our measurements forsample A.407, it will only be valid for nominallypure-Na, Type-B nephelines because the heat capac-ity relationships for Ks-bearing Type-B and -C neph-elines will clearly be different from those for thespecimen of Kelley et al. (cf. NE. Schairer with Ks-bearing nephelines in Fig. l). In addition, we haveshown that Type-H nephelines do not exhibit any
DSC peaks between 340 and 520 K the only neph-elines likely to show such peaks in this temperaturerange are those with <2.5 percent Ks. The naturalnephelines occurring in igneous and metamorphicrocks (e.g. Dollase and Thomas, 1978) and meteorites(e.g. Allende; Grossman and Steele, 1976) invariablycontain more than 2.5 percent Ks and should showsmooth curves of Ci vs. temperature with no discon-tinuities. Therefore, although the equation of Kelleyet al. between 467 and I 180 K can be used as a refer-ence in thermochemical calculations applied to natu-ral nephelines, the equation below 467 K will nor-mally not be valid. Similar reasoning can be used tojustify the extrapolation of the equation of Kelley et
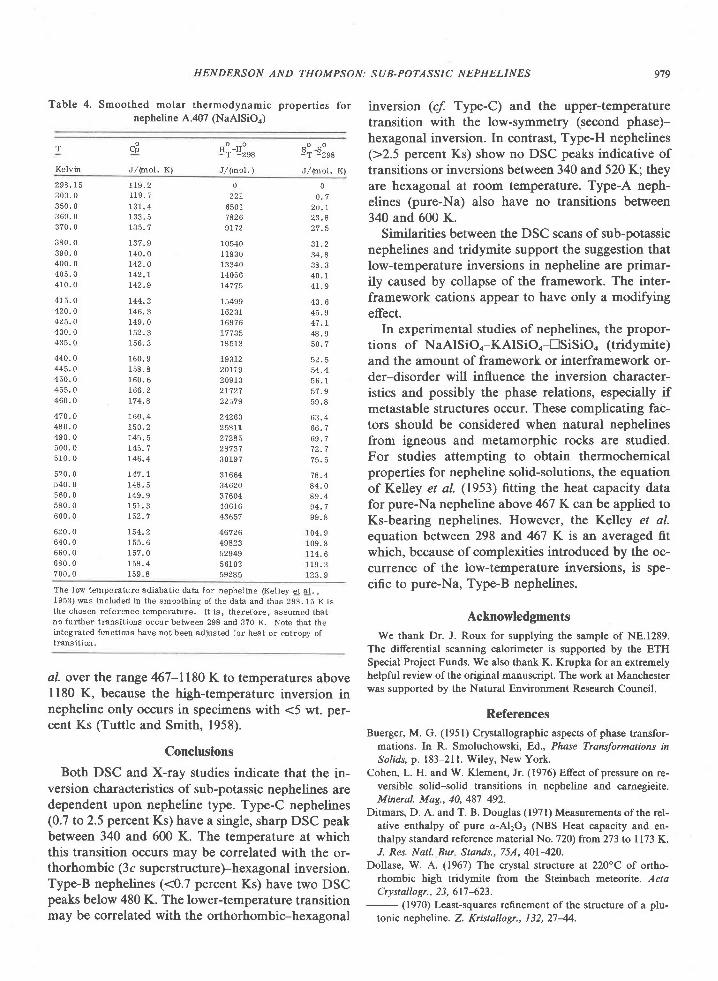
Table 4. Smoothed molar thermodynamic propert ies fornepheline A.407 (NaAlSiOa)
979
inversion (cf. Type-C) and the upper-temperaturetransition with the low-symmetry (second phase)-hexagonal inversion. [n contrast, Type-H nepheiines(>2.5 percent Ks) show no DSC peaks indicative oftransitions or inversions between 340 and 520 K; theyare hexagonal at room temperature. Type-A neph-elines (pure-Na) also have no transitions between340 and 600 K.
Similarities between the DSC scans of sub-potassicnephelines and tridymite support the suggestion thatlow-temperature inversions in nepheline are primar-ily caused by collapse of the framework. The inter-framework cations appear to have only a modifyingeffect.
In experirnental studies of nephelines, the propor-tions of NaAlSiO.-KAlSiO4-trSiSiOo (tridymite)and the amount of framework or interframework or-der-disorder will influence the inversion character-istics and possibly the phase relations, especially ifmetastable structures occur. These complicating fac-tors should be considered when natural nephelinesfrom igneous and metamorphic rocks are studied.For studies attempting to obtain thermochemicalproperties for nepheline solid-solutions, the equationof Kelley et al. (1953) fitting the heat capacity datafor pure-Na nepheline above 467 K can be applied toKs-bearing nephelines. However, the Kelley et al.equation between 298 and 467 K is an averaged fitwhich, because of complexities introduced by the oc-currence of the low-temperature inversions, is spe-cific to pure-Na, Type-B nephelines.
AcknowledgmentsWe thank Dr. J. Roux for supplying the sample of N8.1289.
The differential scanning calorimeter is supported by the ETHSpecial Project Funds. We also thank K. Krupka for an extremelyhelpful review of the original manuscript. The work at Manchesterwas supported by the Natural Environment Research Council.
References
Buerger, M. G. (1951) Crystallographic aspects of phase transfor-mations. In R. Smoluchowski, Ed., Phase Transformations inSolids, p. 183-21L Wiley, New York.
Cohen, L. H. and W. Klement, Jr. (1976) Effect of pressure on re-versible solid-solid transitions in nepheline and carnegieite.Mineral. Mag., 40, 487 492.
Ditmars, D. A. and T. B. Douglas (1971) Measurements of the rel-ative enthalpy of pure a-Al2O3 (NBS Heat capacity and en-thalpy standard reference material No. 720) fron 273 to I 173 K.J. Res. Natl. Bur Stands., 75A, 401420.
Dollase, W. A. (1967) The crystal structure at 220"C of ortho-rhombic high tridymite from the Steinbach meteoire. ActaCrystallogr., 2 3, 617 -623.
- (1970) Least-squares refinement of the structure of a plu-tonic nepheline. Z. Kristallogr., 132,27-44.
HENDERSON AND THOMPSON: SUB-POTASSIC NEPHELINES
T
Kelv in
^oup
J/Gnol. K)
to -Ho
J/(m01. )
^o ^o
J/(rnol. K)
2 9 8 . 1 53 0 t . 03 5 0 . 03 6 0 . 03 ? 0 . 0
3 8 0 . 03 9 0 . 04 0 0 . 04 0 5 . 04 1 0 . 0
4 1 5 . 0420.0425.04 3 0 . 04 3 5 . 0
440.04 4 5 . 04 5 0 , 04 5 5 , 04 6 0 . 0
470.04 8 0 . 04 9 0 . 05 0 0 . 05 1 0 . 0
5 2 0 . 05 4 0 . 05 6 0 . 05 3 0 . 06 0 0 . 0
6 2 0 . 06 4 0 . 06 6 0 . 06 3 0 . 0? 0 0 . 0
r19 .21 1 9 . 7t3t.41 3 3 . 51 3 5 . ?
1 3 7 . 91 4 0 . 0742,01 L ' 1
t 4 2 , 9
r 4 4 , 31 4 6 . 31 4 9 . 0752.31 5 6 . 3
1 6 0 , 91 5 8 . 81 6 0 . 6166.2I 7 4 . 8
1 6 0 . 4150.2] 4 5 , 5r45 .7t46.4
747.71 4 8 . 51 4 9 . 91 5 1 . 3152.7
t 5 4 . 21 5 5 . 6t 5 7 , 01 5 8 . 41 5 9 . 8
02 2 1
650178269r72
r0540119301334014056I4775
15499r623116976t7 ' t351 8 5 1 3
1931220t1,9209132 r 7 2 722579
2+26325311272852873730197
316643+620376044061643657
4672649823529495610359285
00 . 7
2 0 . 1
3 1 . 23 4 . 83 8 . 34 0 . 14 r . 9
4 3 . 64 5 . 94 7 . 1€ . 950.7
54.45 6 . 1
5 9 . 8
6 3 . 46 6 . 76 9 , 77 2 . 77 5 , 5
7 8 , 48 4 . 08 9 . 49 4 . 79 9 . 8
1 0 4 . 91 0 9 . 81 1 4 . 61 1 9 . 3L 2 3 . 9
The loil tempenture adiabatic data for nepheline (Keliey q! q!. ,1953) was included in the smocthing of the data and thus 293.15 K isthe chosen referace tempenture. It is, therefore, assumed thatno further trositions occur between 298 md 370 K. Note that theintegnted functi@s have not been adiusted for heat or entropy oftrmsitiof,.
al. ovet the range 467-1180 K to temperatures abovell80 K, because the high-temperature inversion innepheline only occurs in specimens with <5 wt. per-cent Ks (Tuttle and Smith, 1958).
Conclusions
Both DSC and X-ray studies indicate that the in-version characteristics of sub-potassic nephelines aredependent upon nepheline type. Type-C nephelines(0.7 to 2.5 percent Ks) have a single, sharp DSC peakbetween 340 and 600 K. The temperature at whichthis transition occurs may be correlated with the or-thorhombic (3c superstructure)-hexagonal inversion.Type-B nephelines (<0.7 percent Ks) have two DSCpeaks below 480 K. The lower-temperature transitionmay be correlated with the orthorhombic-hexagonal

980
- and W. M. Thomas (1978) The crystal chemistry of silica-rich, alkali-deficient nepheline. Contrib. Mineral. Parol., 66,3 l 1 -318.
Donnay, G., J. F. Schairer and J. D. H. Donnay (1959) Ncphelinesolid solutions. Mineral. Mag., 32,93-t09.
Foreman, N. and D. R. Peacor (1970) Refinement of the nephelinestructur€ at several temperatures. Z. Kristallogr., 132,45-70.
Grossman, L. and I. M. Steele (1976) Amoeboid olivine aggre-gates in the Allende meteorite. Geochim. Cosmochim. Acta, 40,t49-155.
Hahn, T. and M. J. Buerger (1955) The detailed stnrcture of neph-eline KNa3AloSi4O 16. Z. Kristallogr., 1 06, 308-338.
Henderson, C. M. B. and J. Roux (1976) The thermal expansionsand crystallographic transformations of some synthetic neph-elines. Prog. Exp. Petrol., N.E.RC. Rep. 3,60-69.
- and - (1977) Inversions in sub-potassic nephelines.Contrib. Mineral. Petrol., 6 I, 279-298.
- and D. Taylor (1975) Thermal expansion by X-ray diffrac-tion: the use ofthe specimen holder as the internal standard andthe expansion of MgO (rcriclase) and MgAl2Oa (spinel). Trcns.Brit. Ceram. Soc., 74, 55-5'1.
Ishibashi, Y. and Y. Takagi (1975) Comments on specific heatmeasurements. Jap. J. Appl. Phys., 14,637-642.
Kelley, K. K., S. C. Todd, R. L. Orr, E. G. King and K. R. Bon-nickson (1953) Thermodynamic properties of sodium-alumi-num and potassium-aluminum silicates. U.S. Bur. Mines, Rep.Invest. 4955.
Kihara, K. (197'l) An orthorhombic superstructure of tridymite
HENDERSON AND THOMPSON: ST]B.POTASSIC NEPHELINES
coexisting between about 105 and l80oC. Z. Kristallogr., 146,185-203.
Nukui, A., H. Nakazawa and M. Akao (1978) Thermal changes in
monoclinic tridymite. Am. M ineral., 6 3, 1252-1259.O'Neilt, M. J. (1966) Measurement of specific heat functions by
differential scanning calorimetry. Anal. Chem., J& 133l-1336.Rao, C. N. R. and K. J. Rao (1978) Phase Transitions in Solids.
McGraw-Hill, New York.Robie, R. A., B. S. Hemingway and J. R. Fisher (1978) Thermody-
namic properties of minerals and related substances at 298. 15 Kand one bar (ld pascals) pressure and at higher temperatures.U.S. Geol. Sun. Bull. 1452.
Sato, M. (1963a) X-ray study of tridymite (l). On tridymite M andtridymite S. Mineral. J. (Japan),4' 115-130.
- (1963b) X-ray study of tridymite (2). Structure of low tri-dymite, type M. Mineral. f. Qapan),4, 13l-146'
- (1964) X-ray study of tridymite (3). Unit cell dimensionsand phase transition of tridymite, tyt/e S. Mineral. J. (Japan), 4'215-225.
Thompson, A. B. and M. Wennemer (1979) Heat capacities andinversions in tridymite, cristobalite, and tridymite-cristobalitemixed phases. Am. Mineral.,64, 1018-1026.
Tuttle, O. F. and J. V. Smith (1958) The nepheline-kalsilite sys-tem II. Phase relations. Am. J. $ci.,256,571-589.
Manuscript received, April 2, 1979;
accepted for publication, April 4, 1980.
Amertcan Mineralogist, Volume 65, pages 981-985, 1980
The role of cationic hydrogen in pyroxenoid crystal chemistry
FRTEDRIcH LIBgeu
Mineralo gisches Institut der U niversitcitD-2300 Kiel, Federal Republic of Germany
Abstract
In pyroxenoids containing cationic hydrogen [pectolite, schizolite, serandite, unnamedCa(Sc,Fe3*)H[Si3Or], synthetic CdrNaH[SirOn], nambulite, Li-hydrorhodonite, santaclaraite,and babingtonitel the identity periods of the silicate chains are approximately 0.25A shorterthan those of corresponding non-acid pyroxenoids with similar mean cation size (wollaston-ite, bustamite, rhodonite). This observation is interpreted as caused by the reduction of repul-sive forces between [SiOo] tetrahedra of the silicate chains due to an increase of the averageelectronegativity of the cations when cationic hydrogen is present. This effect (which existsalso in polyphosphates and probably polygermanates) is an extreme case of the general efectthat anionic tetrahedral chains will be less stretched when the average electronegativity of thecations is higher, which compensates the valence of the chains. The theory explains why acidchain silicates are common in pyroxenoids but not observed in pyroxenes.
Introduction
Pyroxenoids are silicates containing unbranchedsingle chains tU, :)[SUO'] with periodicities p : 3,5,7, 9, r.e. with an odd number of [SiO,] tetrahedrain the repeat unit of the chains. Although the pyrox-enes have a crystallographic periodicity p,,n", : 2,they can be regarded as end members of the pyroxe-noid series with a formal periodicity pn,-ot: 2n + |with z --+ oo (Liebat,1972).
In pyroxenes as well as in pyroxenoids cation-oxy-gen octahedra share edges to form octahedral slabsthat can be regarded as one-dimensionally infiniteparts of the hexagonal or pseudo-hexagonal octahe-dral layers characteristic of the hydroxides M(OH)r,M : Mg, Zn,Mn, Ca, and of most of the clay miner-als. Tak6uchi and Koto (1977) have pointed our that,based on the structure of the octahedral slabs, twogroups of pyroxenoids can be distinguished. Usingthe most common members of each group, wollas-tonite and pectolite, they named the two groups ofpyroxenoids the w-p series and the p-p series, respec-tively. Table I shows that the known members of thew-p series are anhydrous while those of the p-p seriescontain hydrogen atoms bonded to [SiO.] tetrahedra,i.e. they are acid silicates.
Ohashi and Finger (1978), in their discussion ofthe role of octahedral cations in pyroxenoid crystalchemistry, point out that "the role of hydrogen
would be at least as important as that of the alkaliatoms in making the structures of hydrous pyroxe-noids distinct from those of anhydrous ones." How-ever, since the positions of the hydrogen atoms havenot yet been accurately determined, no further dis-cussion of their crystal-chemical role was offered.
A regression analysis of 54 single-chain silicates(Liebau and Pallas, in preparation) revealed a strongnegative correlation between the degree of stretchingof the silicate chains, measured by a stretching factor
I": l,r,uin/l"' p, and the average values 1 and 7 of theelectronegativities and valences ofthe cations. I"n". isthe chain period in A, l.: 2.704 is the length of thetetrahedral edge in shattuckite, Cu,[SirOu]r(OH)r, thesilicate with the most stretched chain known (Evansand Mrose, 1977), and p is the periodicity of thechain. For pyroxenes and pyroxenoids, for which zhardly deviates from 2, an additional positive corre-lation between stretching factor and the average cat-ion radius is observed.
Observations
Table I gives the lattice parameter along the chaindirection, I.n,,", for the known p-p series sitcates.Also given are the chain periods for those w-p seriessilicates which have a similar average cation radiusas the p-p series silicates (hydrogen not considered).Where the acid-non-acid pairs are known, the chain
0003-004x/80,/09 l0-098 l $02.00 981
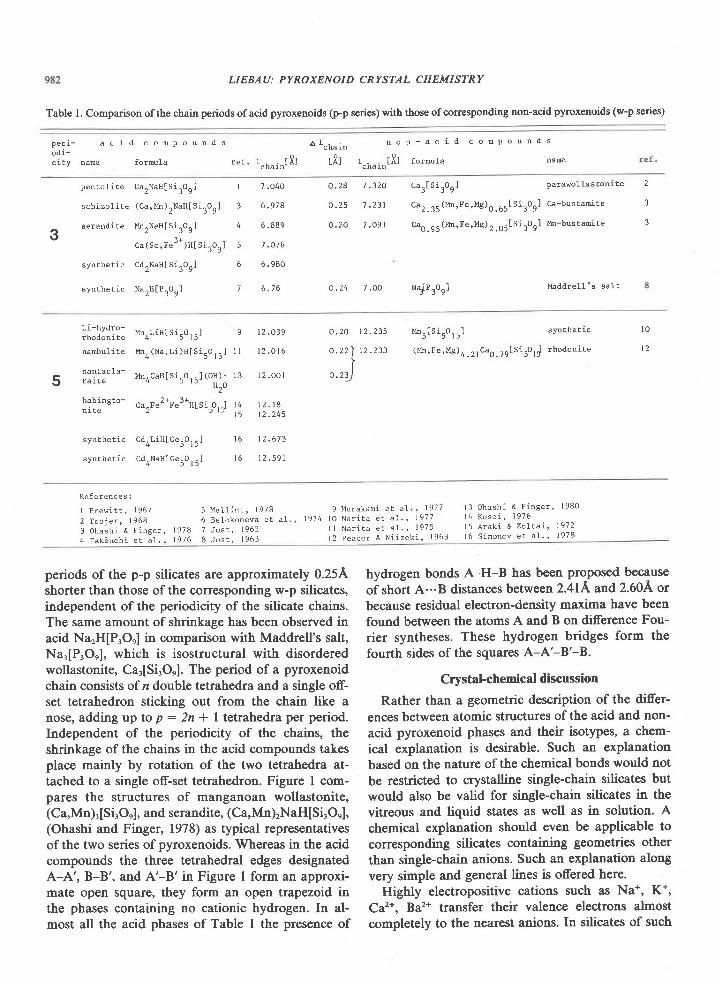
LIEBAU: PYROXENOID CRYSTAL CHEMISTRY
Table l. Comparison ofthe chain periods ofacid pyroxenoids (p-p series) with those ofcorresponding non-acid pyroxenoids (w-p series)
p e r i - a c i d
o d i -c l E y n a m e r"n.ir[ 8]
c o m p o u n d s
f o r m l a r e f .
n o n - a c i d c o E P o u n d s
r . t8l formula nanec n a t n
A rch" i .
rtl
p e c t o l i t e
sch izo l i te
serandi te2
r J r r L r r s L a L
c v n r h a r i ^
ca2NaHlS i30g l
(Ca, I4n) ,NaHI
SirOn 1
I4nrNaHIs i r0 ,J
c a ( s c , F e - ) H [ s i 3 o 9 ]
cdrNaHI S ia0n1
NarHI PrOr l
I
3
4
5
6
7
7 .O40
6 , 9 7 8
6 . 8 8 9
7 . 0 7 6
6 , 9 8 0
6 . 7 6
0.28 7 .32O ca3[S i3o9] paravo l las ton i te
o . 2 5 7 . 2 3 1 c a 2 , 3 5 ( M n , F e , M c ) o . O S I t i : o g ] c a - b u s t a m i t e
o . 2 0 7 , 0 9 1 c a o . 9 5 ( M n , F e , M c ) 2 . 0 5 [ s i 3 o 9 ] ] t n - b u s t a n i t e
o .24 7 .oo Na jP309 l M a d d r e l l ' s s a l t
2
3
3
L i -hydro- Mn.L i t t l s i -o - - l
r h o d o n l t e 4 -
) l )
nambuli te MnO (Na, Li )H I S iro , ,1
s a n E a c l a - M n , c a H l s i - 0 . . 1 ( o H ) .r a r l e q - ) l ) -
H 2 O
: i : : " t t ' - ca2Fe2*Fe3+Hls i jo r5 l
synEhet ic CdOLiHIGerO, r1
synthe t ic Cd4NaHlGe50 I 5 l
9
l l
l 3
12 .o39
l 2 . o t 6
r 2 . o 0 l
1 2 . 1 8t2 .245
t 2 . 6 7 3
t 2 . 5 9 1
o ,20 12 .235
o . z2 f t 2 . 233
Io.23_)
M n 5 [ S i 5 O l 5 ] s l n E h e t i c
( l 4 n , F e , M g ) 0 . r , c u O . f S l s i S o t d
r h o d o n i t e
l 0
l 2
5t 4l 5
l 6
1 6
R e f e r e n c e s :
I P r e w i t t , 1 9 6 7
2 T r o j e r , 1 9 6 8
3 O h a s h i & F i n g e r , 1 9 7 8
4 T a k 6 u c h i e t a 1 . , 1 9 7 6
5 M e l 1 i n i , 1 9 7 86 Be lokoneva e t a17 JosL, 19628 J o s t , 1 9 6 3
9 M u r a k a m i e t a l . ' 1 9 1 7
1 9 7 4 l O N a r i t a e t a I . , 1 9 1 7
I I N a r i t a e t a l . , 1 9 7 5
l 2 P e a c o r & N i i z e k i , 1 9 6 3
l 3 O h a s h i & F i n g e r , l 9 8 Ot 4 K o s o i , 1 9 7 6l5 Arak i & zo l :La i , 1972i 6 S i m o n o v e t a 1 . , 1 9 7 8
periods of the p-p silicates are approximately 0.25A hydrogen bonds A-H-B has been pro-posed becauseihorter than those of the corresponding w-p silicates, of short A...B distances between 2.41A and 2.60A orindependent of the periodicity of the silicate chains. because residual electron-density maxima have beenThe same amount of shrinkage has been observed in found between the atoms A and B on difference Fou-acid NarH[PrOn] h comparison with Maddrell's salt, rier syntheses. These hydrogen bridges form theNar[P.Or], which is isostructural with disordered fourth sides of the squares A-A'-B'-8.wollastonite, Car[SirO,]. The period of a pyroxenoidchain consists of n double tetrahedra and a single off- crystal-chemical discussion
set tetrahedron sticking out from the chain like a Rather than a geometric description of the differ-nose, adding up top : 2n I I tetrahedra per period. ences between atomic structures of the acid and non-Independent of the periodicity of the chains, the acid pyroxenoid phases and their isotypes, a chem-shrinkage of the chains in the acid compounds takes ical explanation is desirable. Such an explanationplace mainly by rotation of the two tetrahedra at- based on the nature of the chemical bonds would nottached to a single off-set tetrahedron. Figure I com- be restricted to crystalline single-chain silicates butpares the structures of manganoan wollastonite, would also be valid for single-chain silicates in the(Ca,Mn)r[SirOn], and serandite, (Ca,Mn)rNaH[Si3On], vitreous and liquid states as well as in solution. A(Ohashi and Finger, 1978) as typical representatives chemical explanation should even be applicable toof the two series of pyroxenoids. Whereas in the acid corresponding silicates ssilaining geometries othercompounds the three tetrahedral edges designated 1[11 5ingle-chain anions. Such an explanation alongA-A', B-B', and A'-B'in Figure I form an approxi- very simple and general lines is offered here.mate open square, they form an open trapezoid in Highly electropositive cations such as Na*, K*,the phases containing no cationic hydrogen. In al- Ca", B** transfer their valence electrons almostmost all the acid phases of Table I the presence of completely to the nearest anions. In silicates of such
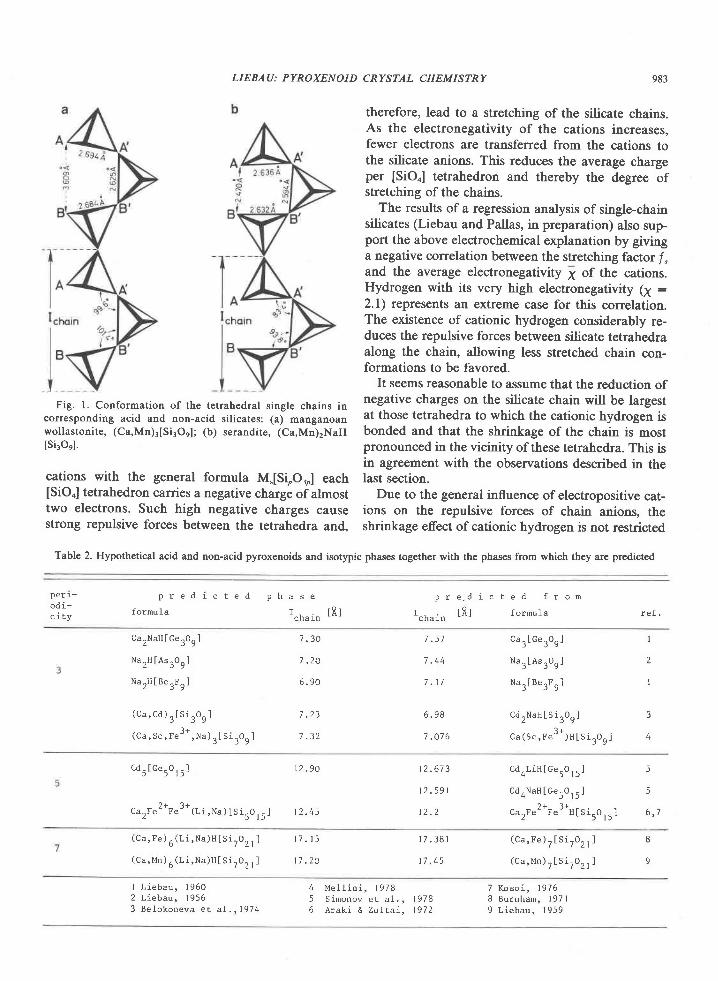
LIEBAU: PYROXENOID CRYSTAL CHEMISTRY 983
Fig. |. Conformation of the tetrahedral single chains incorresponding acid and non-acid silicates: (a) manganoanwollastonire, (Ca,Mn)3[Si3Or]; (b) serandite, (Ca,Mn)2NaH
lsi3oel.
cations with the general formula M"[Si,Or,] each[SiOn] tetrahedron carries a negative charge of almosttwo electrons. Such high negative charges causestrong repulsive forces between the tetrahedra and,
therefore, lead to a stretching of the silicate chains.As the electronegativity of the cations increases,fewer electrons are transferred from the cations tothe silicate anions. This reduces the average chargeper [SiO4] tetrahedron and thereby the degree ofstretching of the chains.
The results of a regression analysis of single-chainsilicates (Liebau and Pallas, in preparation) also sup-port the above electrochemical explanation by givinga negative correlation between the stretching factor /"and the average electronegativity 1 of the cations.Hydrogen with its very high electronegativity 1X :2.1) represents an extreme case for this correlation.The existence of cationic hydrogen considerably re-duces the repulsive forces between silicate tetrahedraalong the chain, allowing less stretched chain con-formations to be favored.
It seems reasonable to assume that the reduction ofnegative charges on the silicate chain will be largestat those tetrahedra to which the cationic hydrogen isbonded and that the shrinkage of the chain is mostpronounced in the vicinity of these tetrahedra. This isin agreement with the observations described in thelast section.
Due to the general influence of electropositive cat-ions on the repulsive forces of chain anions, theshrinkage effect of cationic hydrogen is not restricted
Table 2. Hypothetical acid and non-acid pyroxenoids and isotypic phases together with the phases from which they are predicted
od i -c i t y
p r e d i c t e d
formu la
p h a s e
1.r,. i . [8]
r e , d i c t e d f r o m
t8 l fo rmula
p
Ic n a r n
r e f .
Ca^NaH I Ge r0n J
NarH IAs rO, J
NarH I BerF, J
( c a , C d ) r l s i r o n J
(ca , sc , Fe3+ , Na ) , t s i r on J
7 . 3 0
7 . 2 0
6 . 9 0
7 . 2 3
7 . 3 2
7 . 5 7
7 . 4 4
7 . 1 7
6 . 9 8
7 . O 1 6
C a - [ G e . O ^ ]J J '
Na, I As,On J
Na, I BerF, I
cdrNaII lSironJ
C a ( S c , F e - ' ) H l s i 3 0 9 l
I
2
I
3
4
C d - [ G e - O . - I) - ) l ) -
) + ? +C a . F e - F e - ( L i . N a ) I S i - 0 . - |
z ' ) t ) -
1 2 . 9 0
t 2 . 4 5
1 2 . 6 7 3
1 2 . 5 9 |
r 2 . 2
CdOL iH l ce rO , r J
Cd ONaH I GerO, , J, + ?+
C a r F e - F e - H l S i 5 O l 5 l
5
5
6 , 7
(Ca , Fe ) r
( L i , Na )H l S i ZoZ t l
( c a , M n ) U
( L i , N a ) H l S i r 0 r , J
r 7 . r 5
] . 2 0
1 7 . 3 8 r
t 7 . 4 5
( C a , F e ) r l S i r o r , J
( c a , M n ) r l S i r o , l
8
9
456
23
L i e b a u , l 9 6 0L i e b a u , | 9 5 6B e l o k o n e v a e E a L . , 1 9 7 4
M e 1 l i n i , 1 9 7 8S i m o n o v e t a l . , 1 9 7 8Arak i & Zo) , ta i , 1972
7 K o s o i , 1 9 7 68 B u r n h a m , l 9 7 l
9 L i e b a u , 1 9 5 9
LIEBAU: PYROXENOID CRYSTAL CHEMISTRY
to single-chain silicates but also works in other com-pounds such as polyphosphates, polygermalales, etc.
Conclusions
In general, acid hydrogen tends to form hydrogenbonds. In chain silicates these may bridge either be-tween oxygen atoms of [SiO.] tetrahedra of the samechain (intra-chain hydrogen bonds) or between
[SiO"] tetrahedra of different chains (inter-chain hy-drogen bonds). The latter would most probably dis-rupt the infinite slabs of cation-oxygen polyhedra
and require a major rearrangement of the structure.On the other hand, intra-chain hydrogen bonds willnot have to change the cation-oxygen clusters sub-stantially and are therefore energetically easier toachieve. The hydrogen bonds will be formed moreeasily if the non-acid chains are already folded sothat two tetrahedra of the chain are sufficiently closethat slight rotation of these tetrahedra allows forma-tion of a hydrogen bridge between them.
This requirement is fulfilled in the structures of thenon-acid pyroxenoids and their isotypic poly-germanates and polyphosphates but fails for the py-
roxenes and their isotypes, although their structuresare closely related to those of the pyroxenoids (end
members of the pyroxenoid series). In fact, pyroxenes
containing cationic hydrogen have not been reportedin the literature while acid pyroxenoids are quitecommon. In conclusion, if acid pyroxenes should bediscovered, they would contain inter-chain ratherthan intra-chain hydrogen bonds and would be lessstable than the acid pyroxenoids.
Some hypothetical pyroxenoid-type phases andtheir approximate chain periods are further predicted(Table 2) frorr the information on known pyroxe-
noids.At first glance one would expect that acid ana-
logues of multiple-chain silicates could also exist forxonotlite, Ca"{2'-} [SLO,,](OH), (Mamedov and Be-lov, 1956), inesite, CarMn, {2:} [Si,oOr'](OH), ' 5HrO(Wan and Ghose, 1978), canasite, CarNa.Kr{4:}
[Si,rO.o](OH,F)o (Shiragov et a1.,1969), and miserite,Ca,oK,[Si,O,],{4'-\ [Si',O''](OH,F), (Scott, l9'7 6).However, since in multiple chains the freedom of ro-tation of the tetrahedra is considerably reduced,more energy would be required to shorten a multiplechain by 0.25A per chain period as compared withthe case ofsingle chains. Therefore, only in favorablecases could acid multiple-chain silicates with intra-chain hydrogen bridges be formed. One such casemight be canasite, which has a chain period of only7.19A for the non-acid chains.
Note added in proof
The crystal structure of an unnamed acid silicate,(Mn'*, Mn3*)rNa,,'H{B:}(Sirrvor)O,'](OH), hasbeen published by R. Basso and A. Della Giusta(Neues Jqhrb. Mineral. Abh., 138, 333-342, l98O).This silicate contains open-branched fiinfer srnglechains with I.n.. : 11.9624. In agreement with theother acid pyroxenoids discussed this period is 0.27Ashorter than that of the corresponding non-acidrhodonite.
AcknowledgmentI thank Professors M. Mellini and Y. Ohashi for providing un-
published results on Ca(Sc,F€3+)H[Si3Oe] and santaclaraite re-spectively, and the latter for a critical review of the manuscript.
References
Araki, T. and T. Zoltai (1972) Crystal structure of babingtonite. Z.Kristallogr., I 35, 355-373-
Belokoneva, E. L., P. A. Sandomirskii, M. A. Simonov and N. V.Belov (1974) Crystal structur€ of cadmium pectol i te
NaHCd2[Si3O"l. Sov. Phys. Dokl., 18, 629-630.Burnham, C. W. (1971) The crystal structure of pyroxfcrroite from
Mare Tranquillitatis. Proc. Second Lunar Sci. Conf., l,47-5'1.Evans, Jr., H. T. and M. E. Mrose (1977) The crystal chemistry of
the hydrous copper silicates, shattuckite and planch6ite. lrn.Mineral., 62,491-502.
Jost, K.-H. (1962) Die Struktur eines sauren Natriumpolyphos-phales. Acta Crystallogr., 15, 95 l-955.
- (1963) Zur Struktur des Maddrellschen Salzes. Acta Crys-tallogr., 16,428.
Kosoi, A. L. (1976) The structure of babingtonite. Sov. Phys. Crys-tallogr., 20,446-4.51.
Liebau, F. (1956) Uber die Kristallstruktur des Natriumpolyarsc-nats, (NaAsO3) ̂. Acta Crystallogr., 9, 8ll-817.
- (1957) Uber die struktur des Schizoliths. Neues Jahrb.Mineral. M onatsh., 227 -229.
- (1960) Zur Kristallchemie der Silikatc, Germanate undFluoberyIlate des Formeltyps ABX3. Neues Jahrb. Mineral.
Abh.,94, 1209-1222.- (19'12\ Crystal Chemistry of Silicon. In K. H. Wcdepohl,
Ed., Handbook of Geochemistry, Vol. II, 3, l4-A. Springer-Ver-lag, Berlin.
Mamedov, K. S. and N. V. Belov (1956) Crystal structures of min-
erals of the wollastonite group. I. Structure of xonotlite. Zap.
Vses. Mineralog. Obshch., 8t 13-38.Murakami, T., Y. Takduchi and T. Tagai (1977) Lithium-hydro-
rhodonite. Acta Crystallogr., 833, 919-921-Narita. H.. K. Koto and N. Morimoto (1977) The crystal struc-
tures of MnSiO3 polymorphs (rhodonite- and pyroxmangite-
type). Mineral. J., 8, f29-342.Ohashi, Y. and L. W. Finger f 1978) The role of octahedral cations
in pyroxenoid crystal chemistry. I. Bustamite, wollastonite, and
the pectolite-schizolite-serandite series. Am. Mineral., 63' 2'14-288.
- and - (1980) The crystal structure of santaclaraite,CaMncHSisOrs(OH)' HrO: the role of hydrogen atoms in thepyroxenoid structure. Am. Mineral., in prcss.
LIEBAU: PYROXENOID CRYSTAL CHEMISTRY
Peacor, D. R. and N. Niizeki (1963) The redetermination and re-finement of the crystal structure of rhodonite, (Mn,Ca)SiO3. Z.Kristallogr., I I 9, 98-116.
Prewitt, C. T. (1967) Refinement of the structure of pectolite,Ca2NaHSi3Or. Z. Kristallogr., I 25, 298-316.
Scott, J. D. (1976) Crystal structure of miserite, a Zoltai type 5structure. Can. Mineral., 14, 515-528.
Shiragov, M. L, K. S. Mamedov and N. V. Belov (1969) The crys-tal structure of canasite--CarNaoKr[Si,2O3sl(OH,F)a. Dokl.Akad. Nauk SSS& 18t 672-674.
Simonov, M. A., E. L. Belokoneva, Yu. K. Egorov-Tismcnko, andN. V. Belov (1978) The crystal structures of natural rhodonite
CaMnoIS i5Ot5 ] and syn the t i c NaHCdaIGe5O15] andLiHCda[Ge5O1 51. Sov. Phys. Dokl., 22, 241-242.
Tak6uchi, Y. and K. Koto (1977) A systematics of pyroxenoidstructures. Mineral. J., 8, 272-285.
Trojer, F. J. (1968) The crystal structure of parawollastonite. Z.Krisrallogr., I 27, 29 l-308.
Wan, C. and S. Ghose (1978) Inesite, a hydrated calcium manga-nese silicate with five-tetrahedral repeat double chains. ,4n.Mineral., 63, 563-5'l l.
Manuscript received, November 19, 1979;acceptedfor publication, March 13, 1980.
American Mineralogist, Volume 65, pages 986-995, 1980
Low albite: an X-ray and neutron diffraction study
GBoncs E. HARLow
Department of Mineral SciencesAmerican Museum of Natural History
New York. New York 10024
AND GoRDoN E. BRowN. JR.
Department of Geology, Stanford UniversityStanford, C affi rnia 9 4 3 05
Abstract
Least-squares refinements of the structure of low albite from Amelia, Virginia with three-dimensional neutron and X-ray diffraction intensity data sets yield weighted R factors of0.024 and 0.035, respectively, with anisotropic thermal models. The two methods result in es-sentially identical positional parameters, though slight differences in thermal parameters maybe due to the variation in relative scattering powers. Direct refinement of Allsi occupancy oftetrahedral sites was possible for the neutron data but not for the X-ray data, resulting in thefollowing values of (T:O) Gn A) and Al occupancy (associated errors in parentheses): TrOr.743Q)L,0.97(2) Al; T,m 1.609(l)A, O.U(z) Al; T,O 1.614(l)A, 0.0 Al; T,m 1.616(l)A, 0.0Al. The diference between the refned T,O occupancy and an Al-filled T,O site is signi-ficantat a 9Wo confidence. When these data are combined with other neutron di-ffraction estimatesof order/disorder for a low sanidine and Himalaya orthoclase, a non-linear plot of (T-O) vs.Al content results, which is best fit with a 3rd-order polynomial. This curve differs from thelinear plot by as much as 0.016A in the high-Al region. However, direct comparison of av-erage T-O bond lengths between ordered and disordered tetrahedra includes an apparentshortening in disordered feldspars (comparable to a thermal motion etrect) which mayamount to 0.003A. Analysis of the apparent-thermal-motion anisotropy of the Na site withdisplacive split-site models yields a splitting distance of 0.39A for both data sets, but a single-Na, anisotropic thermal model is preferred.
IntroductionSince Barth (1934) first suggested that the poly-
morphism of K-feldspars resulted from order-dis-order of Al and Si atoms, a considerable effort hasbeen made by crystallographers, mineralogists, andpetrologists to characterize Al-Si distributions in nat-ural and synthetic feldspars. The primary reasons forthe intense interest in this subject are (l) the naturalabundance of alkali feldspars in the Earth's crust and(2) their potential for geothermometry from a de-tailed knowledge of the composition-, temperature-,and pressure-dependence of intracrystalline Al-Sidistributions. Smith's (1954) important synthesis ofavailable structural data for feldspars provided thebasis for all subsequent optical and cell-parametermethods for determining the degree of ordering of Al
0003-004x/80/09 1G0986$02.00
and Si among the tetrahedral sites. He used thesimple idea that Al-containing tetrahedra are largerthan Si-containing ones and correlated mean T-Odistances (T : Si,AD with Al content of a tetrahe-dron. Later revision of Smith's study (Smith and Bai-ley, 1963) and statistical analyses of the correlationbetween mean T-O distance an:d Vo Al (Jones, 1968;Ribbe and Gibbs, 1969) have provided linear regres-sion equations for this correlation. However, seriousdoubts about the linear relationship between meanT-O distance and Al content of tetrahedra wereraised by Brown et al. (1969) and Ribbe et al. (1974),who pointed out a number of other factors which af-fect individual T-O distances in framework alumino-silicates. Because of these findings, the currently-usedfeldspar structural-state indicators, such as the lat-
986
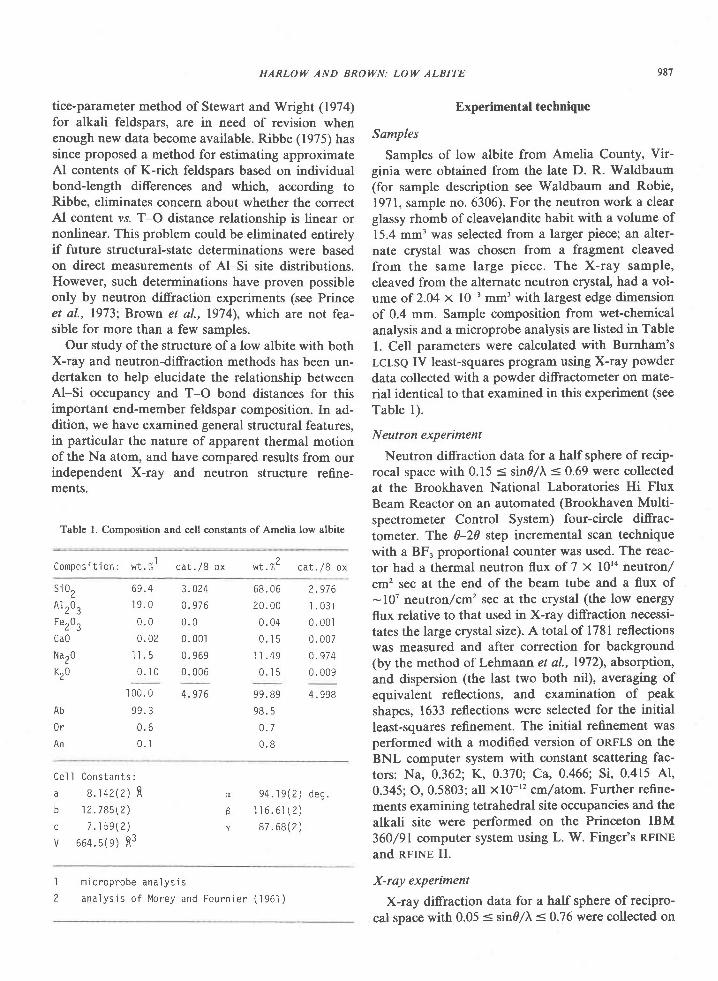
HARLOW AND BROWN: LOW ALBITE 987
tice-parameter method of Stewart and Wright (19'74)for alkali feldspars, are in need of revision whenenough new data become available. Ribbe (1975) hassince proposed a method for estimating approximateAl contents of K-rich feldspars based on individualbond-length differences and which, according toRibbe, eliminates concern about whether the correctAl content vs. T-O distance relationship is linear ornonlinear. This problem could be eliminated entirelyif future structural-state determinations were basedon direct measurements of Al-Si site distributions.However, such determinations have proven possibleonly by neutron diffraction experiments (see Princeet al., 1973; Brown et al., 1974), which are not fea-sible for more than a few samples.
Our study of the structure of a low albite with bothX-ray and neutron-diffraction methods has been un-dertaken to help elucidate the relationship betweenAl-Si occupancy and T-O bond distances for thisimportant end-member feldspar composition. In ad-dition, we have examined general structural features,in particular the nature of apparent thermal motionof the Na atom, and have compared results from ourindependent X-ray and neutron structure refine-ments.
Table l. Composition and cell constants of Amelia low albite
C o m p o s i t i o n : w t . % l c a t . / B o x w t . % Z c a t . / 8 o x
Experimental technique
Samples
Samples of low albite from Amelia County, Vir-ginia were obtained from the late D. R. Waldbaum(for sample description see Waldbaum and Robie,1971, sample no. 6306). For the neutron work a clearglassy rhomb of cleavelandite habit with a volume of15.4 mm3 was selected from a larger piece; an alter-nate crystal was chosen from a fragment cleavedfrom the same large piece. The X-ray sample,cleaved from the alternate neutron crystal, had a vol-
ume of 2.04 x l0-? mm'with largest edge dimensionof 0.4 mm. Sample composition from wet-chemical
analysis and a microprobe analysis are listed in Table
l. Cell parameters were calculated with Burnham'sLCLSQ IV least-squares program using X-ray powder
data collected with a powder di-ffractometer on mate-
rial identical to that examined in this experiment (see
Table l).
Neutron experiment
Neutron diffraction data for a half sphere of recip-rocal space with 0.15 < sind/tr < 0.69 were collectedat the Brookhaven National Laboratories Hi Flux
Beam Reactor on an automated (Brookhaven Multi-
spectrometer Control System) four-circle diffrac-
tometer. The 0-20 step incremental scan techniquewith a BF, proportional counter was used. The reac-
tor had a thermal neutron flux of 7 x l0'4 neutron,/
cm' sec at the end of the beam tube and a flux of-10' neutron/cn'sec at the crystal (the low energy
flux relative to that used in X-ray diffraction necessi-
tates the large crystal size). A total of l78l reflectionswas measured and after correction for background(by the method of Lehmann et al., 1972), absorption,
and dispersion (the last two both nil), averaging of
equivalent reflections, and examination of peak
shapes, 1633 reflections were selected for the initial
least-squares refinement. The initial refinement wasperformed with a modified version of onpts on theBNL computer system with constant scattering fac-
tors: Na, 0.362l' K, 0.370; Ca, 0.466; Si, 0.415 AL
0.345;O,0.5803; all xl0-'2 cmlatom. Further refine-
ments examining tetrahedral site occupancies and the
alkali site were performed on the Princeton IBM
360/91 computer system using L. W. Finger's RFINE
and npINe II.
X-ray experiment
X-ray diffraction data for a half sphere of recipro-
cal space with 0.05 < sind/l < 0.76 were collected on
s i02Ar ̂0^
/ <
Fe.,0.L J
Ca0Nar0Kzo
Ab0rAn
69.4 3 .0241 9 . 0 0 . 9 7 6
0 . 0 0 . 0
0 . 0 2 0 . 0 0 1
I I . 5 0 . 9 6 9
0 . 1 0 0 . 0 0 6
6 8 . 0 6 2 . 9 7 6
2 0 . 0 0 I . 0 3 |
0 . 0 4 0 . 0 0 1
0 . I 5 0 . 0 0 7
1 1 . 4 9 0 . 9 7 4
0 . I 5 0 . 0 0 9, I 0 0 .
0
9 9 . 3
0 . 6
0 . 1
4 . 9 7 6 9 9 . 8 9 4 . 9 9 8
9 8 . 5
0 . 7
0 . 8
Ce l I Cons tan ts :
a 8 . 1 4 2 Q ) f l
b ' l 2 . 7 8 5 ( 2 )
c 7 . 1 5 9 1 2 )
\ / 6 6 4 . 5 ( e ) R 3
9 4 . 1 9 ( 2 ) d e g .1 r 6 . 6 r ( 2 )87 .68(2)
0
B
I
2
m i c r o p r o b e a n a l y s i s
a n a l y s i s o f M o r e y a n d F o u r n i e r ( 1 9 6 1 )
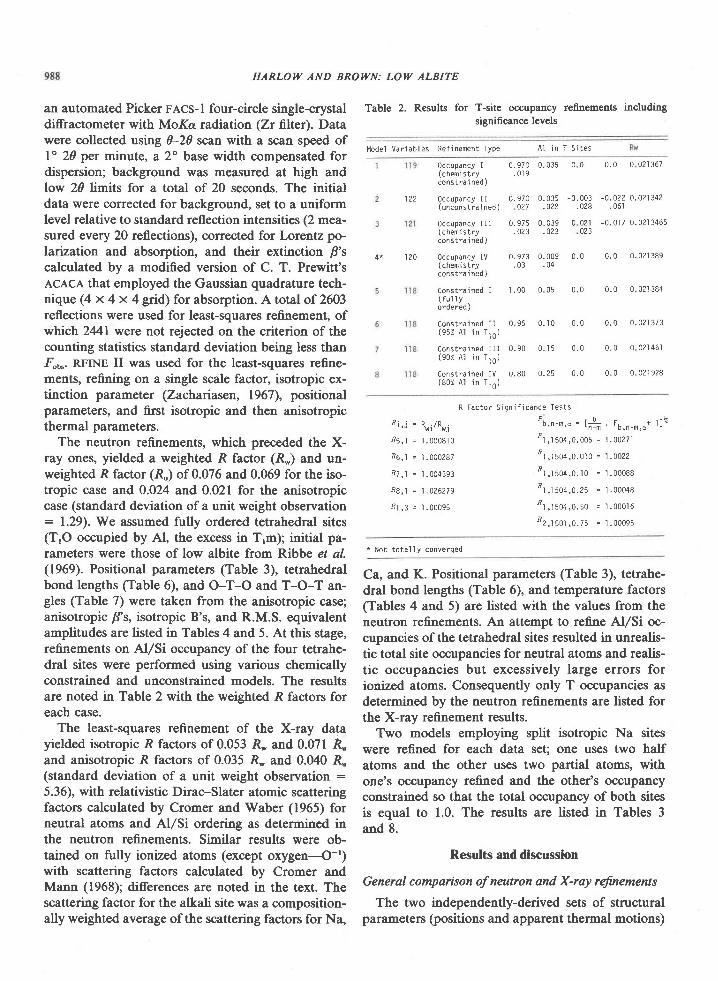
HARLOI{ AND BROWN: LOW ALBITE
an automated Picker FAcs-l four-circle single-crystaldiffractometer with MoKa radiation (Zr filter). Datawere collected using 0-20 scan with a scan speed ofl" 20 per minute, a 2" base width compensated fordispersion; background was measured at high andlow 20 limits for a total of 20 seconds. The initialdata were corrected for background, set to a uniformlevel relative to standard reflection intensities (2 mea-sured every 20 reflections), corrected for Lorentz po-laruation and absorption, and their extinction B'scalculated by a modified version of C. T. Prewitt'sAcAcA that employed the Gaussian quadrature tech-nique (4 x 4 x 4 grid) for absorption. A total of 2603reflections were used for least-squares refinement, ofwhich 241 were not rejected on the criterion of thecounting statistics standard deviation being less than-qb". RFINE I[ was used for the least-squares refine-ments, rsfining on a single scale factor, isotropic ex-tinction parameter (Zachariasen, 1967), positionalparameters, and first isotropic and then anisotropicthermal parameters.
The neutron refinerrents, which preceded the X-ray ones, yielded a weighted R factor (R*) and un-weighted R factor (R") of 0.076 and 0.069 for the iso-tropic case and 0.024 and 0.021 for the anisotropiccase (standard deviation of a unit weight observation: 1.29).We assumed fully ordered tetrahedral sites(T,O occupied by Al, the excess in T,m); initial pa-rameters were those of low albite from Ribbe el a/.(1969). Positional parameters (Table 3), tetrahedralbond lengths (Table 6), and O-T-O and T-O-T an-gles (Table 7) were taken from the anisotropic case;anisotropic B's, isotropic B's, and R.M.S. equivalentamplitudes are listed in Tables 4 and 5. At this stage,refinements on Al/Si occupancy of the four tetrahe-dral sites were performed using various chemicallyconstrained and unconstrained models. The resultsare noted in Table 2 with the weighted R factors foreach case.
The least-squares refinement of the X-ray datayielded isotropic R factors of 0.053 R* and 0.071 R"and anisotropic R factors of 0.035 R* and 0.040 R"(standard deviation of a unit weight observation :5.36), with relativistic Dirac-Slater atomic scatteringfactors calculated by Cromer and Waber (1965) forneutral atoms and Al/Si ordering as determined inthe neutron refnements. Similar results were ob-tained on fully ionized atoms (except oxygen--{-r)with scattering factors calculated by Cromer andMann (1968); differences are noted in the text. Thescattering factor for the aftali site was a composition-ally weighted average of the scattering factors for Na,
Tablc 2. Results for T-site occupancy refinements includingsignificance levels
l ' , l o d e l V a r i a b l e s R e f i n e n e n t T y p e A l i n T S i t e s
0ccupancy I 0 .970 0 .035(chemis t ry .019constra i ned )
occupancy I I 0 .970 0 .035(unconst ra ined) 027 .028
o c c u p a n c y I I I 0 . 9 7 5 0 . 0 3 9(chen is t ry .023 -023const ra i ned )
occupancy lV 0 .973 0 .009(chemis t ry .03 .04constra i ned )
C o n s t r a i n e d I 1 . 0 0 0 . 0 5( f u l l yordered )
C o n s t r a i n e d l l 0 9 5 0 . 1 0( 9 5 % A l i n T . , O )
C o n s t r a i n e d I I I 0 . 9 0 0 . 1 5( 9 0 % A l i n T l 0 )
Const ra ined Iv 0 .80 0 .25( 8 0 % A l i n T t 0 )
122
120
0 0 0 . 0 0 0 2 1 3 6 7
-0 .003 -0 .022 0 .02 ' ]342.028 .061
0 021 -0 .017 0 .02 ]3465023
0 . 0 0 . 0 0 . 0 2 1 3 8 9
0 . 0 0 . 0 0 . 0 2 1 3 8 4
0 . 0 0 . 0 0 . 0 ? 1 3 / 3
0 . 0 0 . 0 0 0 2 1 4 6 1
0.0 0 .0 0 .021928
''w i ' 'wj
n 5 , t = | . 0 0 0 8 1 0
. R 6 t = l n o n 2 c 7
B 7 , l = 1 . 0 0 4 3 9 3
n 8 , 1 = 1 . 0 2 6 2 7 9
R l , 3 = 1 . 0 0 0 9 5
R F a c l o r S i g n i f i c a n c e T e s t s
"b,n- t ,o = [ f i . ro,n-r ,o* t ; - !
" r , t5o4,o.oo5 = ' t .oo2i1
" t , t s o q , o . o t o = t . o o z zn t , t so+ ,o . t o = t . ooo88
" r , r so+ ,0 .25 = I . ooo4g
" t , t s o q , o . s o = t . o o o l 6Fz, t sot ,0. zs = r . ooo95
* t lot total ly converged
Ca, and K. Positional parameters (Table 3), tetrahe-dral bond lengths (Table 6), and temperature factors(Tables 4 and 5) are listed with the values from theneutron refinements. An attempt to refine Al/Si oc-cupancies of the tetrahedral sites resulted in unrealis-tic total site occupancies for neutral atoms and realis-tic occupancies but excessively large errors forionized atoms. Consequently only T occupancies asdetermined by the neutron refinements are listed forthe X-ray refinement results.
Two models employing split isotropic Na siteswere refined for each data set; one uses two halfatoms and the other uses two partial atoms, withone's occupancy refined and the other's occupancyconstrained so that the total occupancy of both sitesis equal to 1.0. The results are listed in Tables 3and 8.
Results and discussion
General comparison of neutron and X-ray reftnements
The two independently-derived sets of structuralparameters (positions and apparent thermal motions)
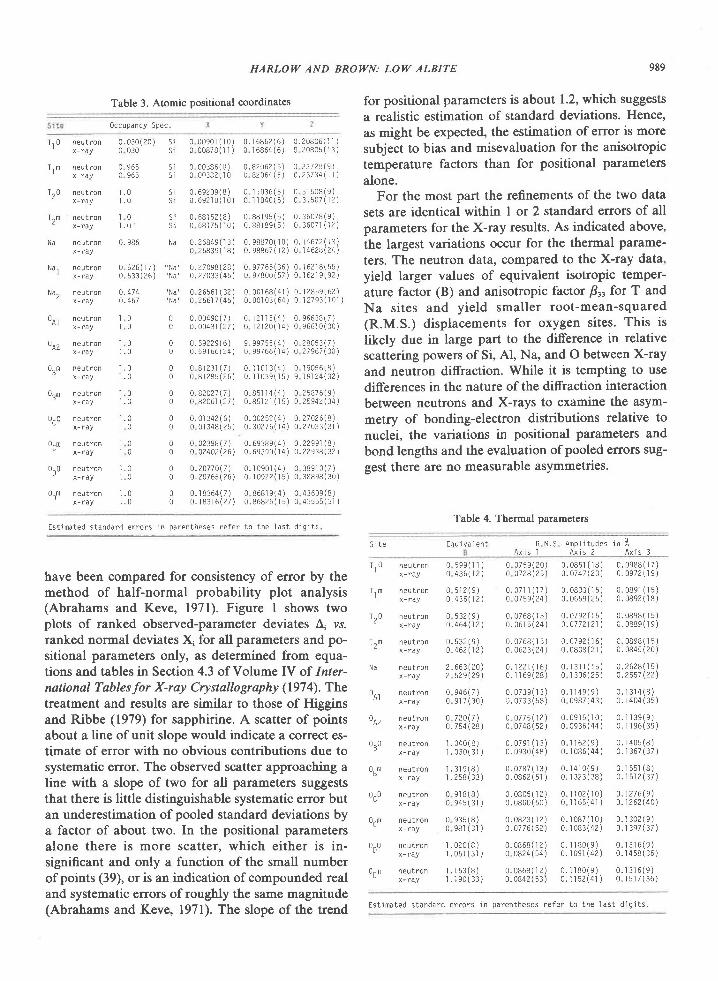
HARLOW AND BROWN: LOW ALBITE 989
0ccupancy spec .
Table 3. Atomic positional coordinates for positional parameters is about 1.2, which suggestsa realistic estimation of standard deviations. Hence,as might be expected, the estimation of error is moresubject to bias and misevaluation for the anisotropictemperature factors than for positional parametersalone.
For the most part the refinements of the two datasets are identical within I or 2 standard errors of allparameters for the X-ray results. As indicated above,the largest variations occur for the thermal parame-ters. The neutron data, corrpared to the X'tay data,yield larger values of equivalent isotropic temper-ature factor (B) and anisotropic factor B" for T andNa sites and yield smaller root-mean-squared(R.M.S.) displacements for oxygen sites. This islikely due in large part to the difference in relativescattering powers of Si, Al, Na, and O between X-rayand neutron diffraction. While it is tempting to usedifferences in the nature of the diffraction interactionbetween neutrons and X-rays to examine the asym-metry of bonding-electron distributions relative tonuclei, the variations in positional parameters andbond lengths and the evaluation ofpooled errors sug-gest there are no measurable asymmetries'
Table 4. Thermal parameters
T t o
T r t
rza
rz'
N A
N a r
N " 2
ont
olz
o"o
oB*
oco
oct
ooo
oDt
neut ron 0 . 030( 20 ) S ix - ray 0 030 S i
neut ron 0 965 S ix - ray 0 965 S j
n e u t r o n 1 . 0 S ix - r a y I . 0 S i
neut ron I 0 S ix - ray I .0 S i
neut ron 0 . 986 Nax- ray
n e u t r o n 0 5 2 6 ( 1 7 ) " N a "x - r a y 0 5 3 3 ( 2 6 ) " N a "
neut ron 0 ,474x- ray 0 .467
neut ron I 0 0x- ray I 0 0
neut ron I 0 0x- ray
. ] .0 0
neut ron I .0 0x - r a y I . 0 0
neut ron I .0 0x - r a y I . 0 0
neut ron I .0 0x- ray I 0 0
neut ron I 0 0x- ray I 0 0
neut ron I .0 0x- ray I 0 0
neut ron I .0 0x - r a y 1 . 0 0
0 . 1 6 8 6 2 ( 6 ) 0 . 2 0 8 0 6 ( l r )o r 6 8 6 4 ( 6 ) 0 2 0 8 0 5 ( 1 3 )
0 . 8 2 0 6 2 ( 5 ) O 2 3 1 2 6 1 9 )o 8 2 0 6 4 ( 5 ) A . 2 3 7 3 4 \ t l )
o r 1 0 3 6 ( 5 ) 0 3 1 5 o B ( 9 )o | 0 4 0 ( 5 ) 0 3 1 5 0 7 ( 1 2 )
o . 8 8 t 9 5 ( 5 ) o . 3 6 0 7 B ( 9 )0 . 8 8 1 8 9 ( 5 ) o 3 6 0 7 1 ( . l 2 )
0 . 9 8 8 7 0 ( , ] 0 ) 0 . r 4 6 7 2 ( r 8 )0 . 9 8 8 6 7 ( l 2 ) A 1 4 6 2 ' d ( 2 4 )
0 9 7 7 6 5 ( 3 6 ) 0 1 6 2 r 8 ( 5 5 )o 97800(s7) o 16219\92)
0 . 0 0 r 6 8 ( 4 1 ) 0 . 1 2 8 5 9 ( 6 2 )0 . 0 0 1 0 3 ( 6 4 ) 0 . r 2 7 9 3 ( l c l )
0 t 2 | 5 ( 4 ) 0 . 9 6 6 3 8 ( 7 )o r 2 r 2 o ( 1 4 ) 0 e 6 6 t o ( 3 0 )
9 99755(4) A 28053(7)o 99766(14) A 27967130)
o . i l o r 3 ( 4 ) 0 1 9 0 5 6 ( 8 )0 . | 0 3 9 ( 1 5 ) I 1 9 1 2 4 ( 3 2 )
0 . 8 5 f 4 ( 4 ) o 2 5 8 7 6 ( 9 )0 . 8 5 r 2 r ( r 5 ) o 2 5 s 4 2 ( 3 4 )
0 . 3 0 2 5 2 ( 4 ) 0 . 2 7 A 2 6 ( 8 )o . 3 0 2 7 6 ( 1 4 ) 0 . 2 7 a 2 3 ( 3 t )
0 . 6 9 3 8 9 ( 4 ) 0 . 2 2 9 9 1 1 8 )0 . 6 9 3 9 0 ( r 4 ) A . 2 2 9 3 8 \ 3 2 )
0 . r 0 e 0 r ( 4 ) 0 3 8 e 1 0 ( 7 )0 . r 0 9 2 2 ( r 5 ) 0 3 8 B e B ( 3 0 )
0 8 6 8 1 9 ( 4 ) 0 4 3 6 0 9 ( 8 )0 . 8 6 8 2 5 ( r 5 ) 0 4 3 5 5 5 ( 3 1 )
0 0 0 9 0 1 ( r 0 )o 00878( i l )
0 00386( rJ )0 0n382( , l0
0 . 6 9 2 0 9 ( B )0 . 6 9 2 1 o ( I 0 )
0 . 6 8 r 5 2 ( B )o 6 8 1 7 5 ( r o )
0 . 2 6 8 4 e ( r 3 )0 2 6 8 3 9 ( 1 8 )
0 . t7AsB\28)0 . 2 7 0 3 3 ( 4 5 )
0 26561\32)o 2 6 6 1 7 ( 4 5 )
0 . 0 0 4 9 0 ( 7 )0 . 0 0 4 8 r ( 2 7 )
a.5922916)0 . 5 9 r 6 5 ( 2 4 )
0 B r 2 3 r ( 7 )0 8 r 2 8 5 ( 2 6 )
0.82A27 \1 )0 82461 \27 )
0 . 0 r 3 4 2 ( 6 )0 0 1 3 4 8 ( 2 5 )
0 0 2 3 9 8 ( 7 )0 02402\26)
0 . ? 0 7 7 0 ( 7 )0 .207 65 \26)
0 . r 8 3 6 4 ( 7 )0 . t B 3 t 6 ( 2 7 )
Est imated s tandard er ro rs in paren theses re fe r to the las t d iq i ts
have been compared for consistency of error by themethod of half-normal probability plot analysis(Abrahams and Keve, l97l). Figure I shows twoplots of ranked observed-parameter deviates A, vs.ranked normal deviates X, for all parameters and po-sitional parameters only, as determined from equa-tions and tables in Section 4.3 of VolumeIY of Inter-national Tablesfor X-ray Crystallography (1974). Thetreatment and results are similar to those of Higginsand Ribbe (1979) for sapphirine. A scatter of pointsabout a line of unit slope would indicate a correct es-timate of error with no obvious contributions due tosystematic error. The observed scatter approaching aline with a slope of two for all parameters suggeststhat there is little distinguishable systematic error butan underestimation of pooled standard deviations bya factor of about two. In the positional parametersalone there is more scatter. which either is in-significant and only a function of the small numberof points (39), or is an indication of compounded realand systematic errors of roughly the same magnitude(Abrahams and Keve, 1971). The slope of the trend
0 0 7 5 9 ( 2 0 ) 0 . 0 8 5 r ( r 8 ) 0 . 0 9 8 8 ( 1 7 )0 0 7 2 8 ( 2 s ) 0 . 0 7 4 7 ( 2 3 ) 0 0 9 7 2 ( r 9 )
0 . 0 7 r ( 1 7 ) 0 . 0 8 0 3 ( r s ) 0 . 0 8 9 1 0 5 )a 0 1 5 9 ( 2 4 ) 0 . 0 6 5 9 ( 2 5 ) 0 . 0 8 9 2 ( r 8 )
0 . 0 7 6 8 ( 1 5 ) 0 . 0 7 9 2 ( 1 5 ) 0 . 0 8 9 8 ( 1 5 )0 . 0 6 1 5 ( 2 4 ) 0 - a 7 7 2 \ 2 1 ) 0 . 0 8 8 e ( l 9 )
0 . 0 7 6 8 ( r 5 ) 0 . 0 7 9 2 ( r 6 ) 0 0 B 9 B ( 1 5 )0 . 0 6 2 3 \ 2 4 ) 0 . 0 8 0 8 ( 2 r ) 0 . 0 8 4 5 ( 2 0 )
0 . 1 2 2 1 1 1 6 ) 0 . r 3 i l ( r s ) 0 . 2 6 2 8 ( r 5 )0 . i l 6 9 ( 2 8 ) 0 r 3 0 6 ( 2 5 ) 0 . 2 5 5 7 \ 2 2 )
0 . 0 7 3 9 ( r 3 ) 0 . i l 4 9 ( 9 ) 0 . r 3 1 4 ( B )1 . 0 7 3 3 ( 5 8 ) 0 0 9 8 7 ( 4 3 ) 0 . t 4 0 4 ( 3 5 )
a 0 7 7 5 ( 1 2 ) 0 . 0 9 1 5 ( 1 0 ) 0 . 1 1 3 9 ( 9 )o 0 7 4 8 \ 5 2 ) 0 . 0 9 1 6 ( 4 4 ) 0 . r ' r 9 6 ( J 9 )
0 . 0 7 9 1 ( 1 3 ) 0 . 1 r 6 2 ( e ) 0 . r 4 0 5 ( B )0 . 0 9 3 0 ( 4 8 ) 0 . 1 0 8 6 ( 4 4 ) 0 . r 3 6 7 ( 3 7 )
0 . 0 7 8 7 ( 1 3 ) 0 . r 4 1 0 ( 9 ) 0 . r 5 5 r ( 8 )0 . 0 8 6 2 ( s r ) 0 . r 3 2 3 ( 3 8 ) 0 . r 5 1 2 ( 3 7 )
0 . 0 8 0 5 ( r 2 ) 0 . , ] 1 0 2 ( r 0 ) a . 1 2 7 6 ( 9 )o . o 8 o o ( 5 0 ) o i l 6 5 ( 4 r ) 0 . r 2 6 2 ( 4 0 )
0 . 0 8 2 3 ( r 2 ) 0 . r 0 8 7 ( r 0 ) 0 . r 3 0 2 ( e )a . a 7 7 6 1 5 2 ) 0 . r 0 8 3 ( 4 2 ) 0 . 1 3 9 7 ( 3 7 )
0 . 0 8 6 8 ( r 2 ) o . l ] B o ( 9 ) o . r 3 1 6 ( 9 )o o B 2 4 ( 5 4 ) 0 . r 0 9 r ( 4 2 ) 0 . r 4 s 8 ( 3 6 )
0 . 0 a 6 8 ( 1 2 ) 0 . 1 r 8 0 ( e ) 0 . r 3 r 6 ( e )0 . 0 8 4 2 ( s 3 ) 0 . r 5 2 ( 4 1 ) 0 . ' l 5 1 7 ( 3 6 )
S i t e E q u i v d l e n t A m p l i t u d e s i n F ,A x i s 2 A x i s 3
R t 1 . SA x i s I
T t o
T r t
rzo
lz '
n e u t r o n 0 5 9 9 ( l l )x - r a y 0 4 3 6 ( 1 2 )
n e u t r o n 0 5 1 2 ( 9 )x - r a y 0 . 4 3 6 ( 1 2 )
n e u t r o n 0 5 3 2 ( 9 )x - ray 0 .464(12)
n e u t r o n 0 . 5 3 2 ( 9 )x - r a y 0 . 4 6 2 ( 1 2 )
neut ron 2-663(2A)x-ray 2 529129)
neut ron 0 946(7 )x - r a y 0 9 1 7 ( 3 0 )
n e u t r o n a 7 2 0 1 1 )x - r a y 0 . 7 5 4 \ 2 8 )
n e u t r o n , ] . 0 4 0 ( B )
x - r a y . l . 0 3 0 ( 3 ' )
)
n e u t r o n ' ] . 3 1 9 ( B )
x - r a y 1 . 2 5 8 ( 3 3 )
n e u t r o n 0 9 l B ( 8 )x - r a y 0 9 4 5 ( 3 1 )
neut ron 0 935(8)x-ray 0 98') (3'l )
n e u t r o n l 0 2 0 ( B )x - r a y 1 . 0 5 ] ( 3 1 )
n e u t r o n 1 . 1 5 3 ( 3 )x - r a y
. ] . 1 9 0 ( 3 3 )
ont
oAz
ogo
oBt
oco
oct
oDo
oDt
Est imated s tandard er ro rs in paren theses re fe r to the las t d ig i ts .
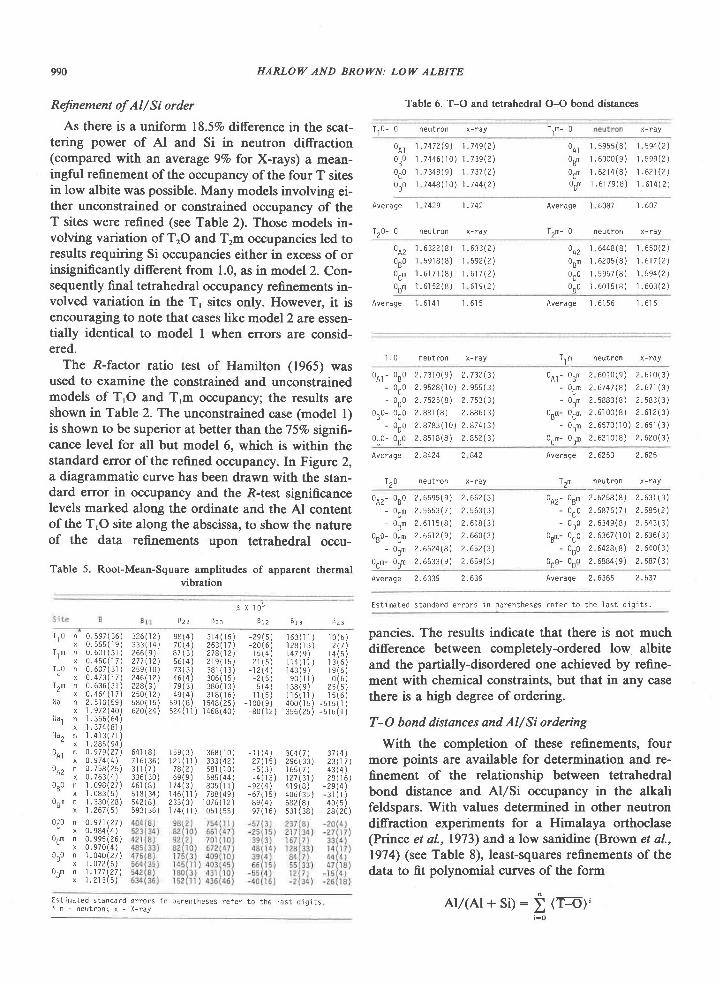
990 HARLOW AND BROWN: LOIV ALBIT:E
Refinement of Al/ Si order
As there is a uniform 18.57o difference in the scat-tering power of Al and Si in neutron diffraction(compared with an average 9Vo for X-rays) a mean-ingful refinement of the oocupancy of the four T sitesin low albite was possible. Many models involving either unconstrained or constrained occupancy of theT sites were refined (see Table 2). Those models in-volving variation of TrO and Trm occupancies led toresults requiring Si occupancies either in excess of orinsignifiganlly different from 1.0, as in model 2. Con-sequently final tetrahedral occupancy refnements in-volved variation in the T, sites only. However, it isencouraging to note that cases like model 2 are essen-tially identical to model I when errors are consid-ered.
The R-factor ratio test of Hamilton (1965) wasused to examine the constrained and unconstrainedmodels of T,O and T,m occupancy; the results areshown in Table 2. The unconstrained case (model l)is shown to be superior at better than the 75Vo signifi-cance level for all but model 6, which is within thestandard error ofthe refined occupancy. [n Figure 2,a diagrammatic curve has been drawn with the stan-dard error in occupancy and the 4-test significancelevels marked along the ordinate and the Al contentof the T,O site along the abscissa, to show the natureof the data refinements upon tetrahedral occu-
Table 5. Root-Mean-Sqt"ll'll#"Oes of apparent thermal
B X I O -
B z 2 B : : B t z B r : B z z
Table 6. T-O and tetrahedral O-O bond distances
Tl0- 0 neut ron x - ray T lm- 0 x- ray
ontosoocoooo
1 . 7 4 7 2 ( 9 ) 1 . 7 4 9 ( 2 )
r . 7 4 4 6 ( 1 0 ) r . 7 3 9 ( 2 )
t 7 3 4 8 \ 9 ) 1 . 7 3 7 ( 2 )
r 7 4 4 8 ( r 0 ) r . 7 4 4 ( 2 )
ontoBtoctoDt
r . 59ss (8 ) r 594 (2 )r . 6 0 0 0 ( e ) r . 5 9 9 ( 2 )1 . 6 2 t 4 1 8 ) 1 . 6 2 t ( 2 )r . 6 r / 9 ( 8 ) r . 6 1 4 ( 2 )
Average 1 1429 1-742
I 20- 0 neutron x-ray
Average I 6087 1 .607
IZm- 0 neut ron x - ray
oaz0.0
oct
oDt
rage
1 .6322 (8 ) 1 .633 (2 )r 5 9 r B ( B ) r . 5 s 2 ( 2 )r . 6 1 7 t ( B ) r . 6 1 7 ( 2 )r . 6 1 5 2 ( 8 ) r 6 1 9 ( 2 )
0 A 2 1 6 4 4 8 ( 8 ) i 6 s 0 ( 2 )o u n 1 . 6 2 0 5 ( 8 ) 1 . 6 1 7 ( 2 )oco r . 5957 (B ) r 594 (2 )000 r . 601 5 (8 ) r . 603 (2 )
I . 6 l 4 t 1 . 6 1 5 Average I .61 56 I .6 .1 6
T t o neut ron x - ray T r " neut ron x - ray
o A t - 0 8 0 2 . 7 3 r 0 ( 9 ) 2 . 7 3 2 1 3 )- 0 c 0 2 . 9 5 2 8 ( r 0 ) 2 . 9 s 5 ( 3 )- 0 D 0 2 . 7 5 2 5 ( 8 ) 2 . 7 5 3 ( 3 J
0 8 0 - 0 C 0 2 . 8 8 r ( 8 ) 2 , 8 8 6 ( 3 )- 0 D 0 2 . 8 7 8 3 ( 1 0 ) 2 . 8 7 4 \ 3 )
o c o - 0 D 0 2 . B 5 l B ( 8 ) 2 . 8 5 2 ( 3 )
0 A l - o B m 2 6 0 1 0 ( 9 ) 2 6 ' ] 0 ( 3 )- 1 c n 2 6 7 4 7 ( 8 ) 2 . 6 7 1 ( 3 )- o D n 2 . 5 8 8 3 ( 8 ) 2 . 5 8 3 ( 3 )
0 U m - o r m 2 . 6 1 0 0 ( 8 ) 2 . 6 1 2 ( 3 )- o o m 2 . 6 5 7 0 ( 1 0 ) 2 . 6 5 1 ( 3 )
O r m - O o n 2 . 6 2 ' l 0 ( B ) 2 . 6 2 0 ( 3 )
Average 2-8424 2 842
1 Z0 neut ron x - ray
Average 2 .6253 2 .6?5
fZ^ neut ron x - ray
E s t i n r a t e d s t a n d a r d e r r o r s i n p a r e n t h e s e s r e f e r t o t h e ' l a s t
d i g i t s* n - n e u t r o n ; x - X - r a y
0Or- l rn 2.6258(8) 2.63' | (3)- 0 c 0 2 . 5 8 7 s ( 7 ) 2 . 5 8 5 ( 2 )- oDo 2 .6349 (B ) 2 .543 (3 )
oum- 0 ro 2 .6367 (10 ) 2 .636 (3 )- oDo 2 6428 (8 ) 2 .640 (3 )
oco- oDo 2.6884(9) 2.68713)
Average 2 .6339 2 .636 Average 2 .6365 2-637
Est imated s tandard er ro rs ' in paren theses re fe r to the las t d iq i ts .
pancies. The results indicate that there is not muchdifference between completely-ordered low. albiteand the partially-disordered one achieved by refine-ment with chemical constraints, but that in any casethere is a high degree of ordering.
T-O bond distances and Al/ Si ordering
With the completion of these refinements, fourmore points are available for deterrrination and re-finement of the relationship between tetrahedralbond distance and AllSi occupancy in the alkalifeldspars. With values determined in other neutrondifraction experiments for a Himalaya orthoclase(Prince et al.,1973) and a low sanidine (Brown et al.,1974) (see Table 8), least-squares refinements of thedata to fit polynomial curves of the form
N/(Ar+ si): i tr-61'i -O
0A2- 0Bo- oc*- oDt
0u0- 0ro- oDt
Orm- OOm
2.6595\9J 2 .662(3)
2 . 5 6 5 3 ( 7 ) 2 . 5 6 3 ( 3 )
2 . 6 1 1 5 ( 8 ) 2 . 6 1 8 ( 3 )
2 .6612(9) 2 .660(3)
t . o ) z 4 \ 6 ) a . o J z \ J l
2 . 6 s 3 3 ( e ) 2 . 6 s 9 ( 3 )
T r 0 n 0 . 5 9 7 ( 3 6 )' x 0 . 5 5 5 ( , ] 9 )T r m n 0 . 6 0 ] ( 3 1 )' x 0 . 4 5 0 ( ' l 7 )T , 0 n 0 . 6 0 7 ( 3 , ] ). x 0 . 4 7 3 ( 1 7 )T ? n n 0 . 6 3 6 ( 3 1 )- x 0 . 4 6 4 ( l 7 )i ' l a n 2 . 5 1 0 ( 5 9 )
x 1 . 9 7 2 ( 4 0 )l a r n
, ] . 3 5 6 ( 6 4 )'
x I . 3 7 4 ( 8 1 )i l a 2 n 1 . 4 , ] 3 ( 7 1 )- x 1 . 2 8 5 ( 9 4 )J a l n 0 . 9 7 9 ( 2 7 )' ' ' x 0 . 9 7 4 1 4 )tp n 0 .758(25)" " x 0 . 7 6 3 ( 4 )
0 e 0 n 1 . 0 9 3 ( 2 7 )" x 1 . 0 8 3 ( 5 )
o R m n 1 . 3 3 0 ( 2 8 )- x 1 . 2 6 7 ( 5 )
0 ; 0 n 0 . 9 i 1 ( 2 7 )" x 0 . 9 8 4 ( 4 )
0 . m n 0 . 9 9 5 ( 2 6 )- x 0 . 9 7 0 ( 4 )c r o n 1 . 0 4 0 ( 2 7 )- x 1 . 0 7 2 ( 5 )0 . n n 1 . 1 7 7 ( 2 7 )
" x 1 . 2 , l 3 ( s )
3 2 6 1 ' t 2 J e B ( 4 ) 3 1 4 ( i 5 )3 3 3 ( 1 4 1 7 0 ( 4 ) 2 6 3 ( 1 7 )266(s) 37 (3 ) 278\12)2 7 7 1 1 2 ) 5 6 ( 4 ) 2 1 9 ( t s )2 5 e ( r 0 ) 7 3 ( 3 ) 3 8 1 ( 1 3 )2 4 6 ( 1 2 ) 4 6 ( 4 ) 3 0 6 ( t s )2 2 8 ( c ) 7 e ( 3 ) 3 8 0 ( 1 3 )2 5 0 1 1 2 ) 4 9 ( 4 ) 3 1 8 ( 1 6 )5 8 0 ( t 5 ) s e t ( B ) I 5 4 8 ( 2 5 )620(24) 524( i l ) 1468(40)
- 2 s ( 5 ) r 6 3 ( | ) t 0 ( 6 )- 2 0 ( 6 ) r 2 8 ( r 3 ) 2 \ 7 )r 5 ( 4 ) r 4 7 ( 9 ) t 4 ( 5 )2 r ( 5 ) r 1 4 ( r ' r ) l 3 ( 6 )
- 1 2 \ 4 ) r 4 3 ( e ) t 9 ( 5 )- 2 ( 5 ) s o ( l r ) 0 ( 6 )5 ( 4 ) r 3 8 ( e ) 2 5 ( s )
i l ( 5 ) n6 ( i l ) r 5 (6 )- r 00 (e ) 400 ( r s ) - 5 r 5 ( r )- 80 ( r2 ) 356 (2s ) - 5 r6 (1 )
6 4 r ( B ) 1 5 e ( 3 ) 3 6 8 ( 1 0 ) - l t ( 4 ) 3 0 4 ( 7 ) 3 7 ( 4 )7 r 6 ( 3 6 ) l 2 r ( 1 1 ) 3 3 3 ( 4 2 ) 2 7 ( 1 5 \ 2 e 6 t 3 3 ) 2 3 t 1 7 )3 l l ( i ) 7 8 ( 2 ) 5 B r ( 1 0 ) - 5 ( 3 ) 1 6 5 ( 7 ) 4 3 ( 4 )3 3 6 ( 3 0 ) 6 e ( e ) 5 8 5 ( 4 4 ) - 4 ( 1 3 ) 1 2 7 ( 3 1 ) 2 8 ( 1 6 )4 6 ] ( B ) r 7 4 ( 3 ) 8 0 5 ( l i ) - e 2 1 4 ) 4 l s ( 8 ) - 2 s \ 4 \5 1 8 ( 3 4 ) r 4 6 ( | ) 7 8 8 ( 4 9 ) - 6 7 ( t s ) 4 0 6 ( 3 5 ) - 3 1 ( 1 )5 4 2 ( 8 ) 2 3 3 ( 3 ) r 0 7 6 ( 1 2 ) B e ( 4 ) 5 8 2 ( 8 ) 4 0 ( 5 )5 9 3 ( 3 6 ) r 7 4 ( i l ) t o s t ( 5 s ) 9 7 ( r 6 ) 5 3 1 ( 3 8 ) z \ l z 0 )
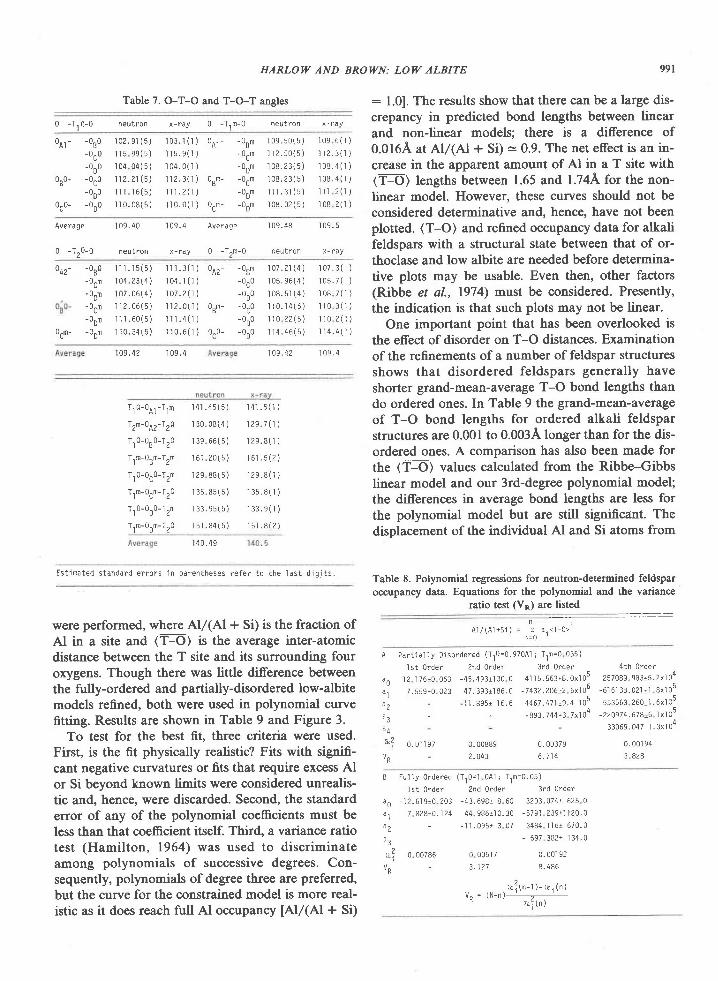
HARLOW AND BROWN: LOW ALBITE 991
ont - -0g0-oco-ooo
0g0- -0c0
-ooo0c0- -000
Table 7. O-T-O and T-O-T angles
0 -T l 0 -0 neut ron x - ray 0 -T1m-0 neut ron x - ray
- 0 B r 1 0 9 s 0 ( 5 ) r 0 9 6 ( r )- O c r ' 1 1 2 . 5 0 ( 5 )
1 1 2 . 3 ( 1 )- O D r 1 0 8 . 2 3 ( s ) 1 0 8 . 4 ( 1 )- 0 c r 1 0 8 . 2 3 ( 5 ) 1 0 8 . 4 ( l )- 0 0 r l 1 l . 3 l ( 5 ) l l l 2 ( l )- 0 D r 1 0 8 . 0 2 ( 5 )
, ] 0 8 2 ( l )
A v e r a g e 1 0 9 . 4 0 1 0 9 . 4 A v e r a g e ] 0 9 . 4 8 1 0 9 . 5
0 -T20-0 neut ron x - ray 0 -T2n-0 neut ron x - ray
- 0 g 0 l l 1 . l 5 ( 5 ) 1 , ] 1 . 3 ( l ) 0 A 2 - - 0 B r 1 0 7 . 2 1 ( 4 ) 1 0 7 . 3 ( l )- 0 c r 1 0 4 . 2 3 ( 4 ) 1 0 4 . 1 ( l ) - 0 c 0 1 0 5 . 9 6 ( 4 ) 1 0 5 . 7 ( l )- o o m 1 0 7 . 0 6 ( 4 ) 1 0 7 . 2 ( l ) - 0 0 0 1 0 8 . 5 1 ( 4 ) l 0 B i ( l )- 0 c r r 2 . 0 6 ( 5 ) i l 2 . 0 ( r ) o B m - - 0 c 0 i l 0 . r 4 ( 5 ) i l 0 3 ( 1 )- o D r r 1 r . 6 0 ( 5 ) i l r . 4 ( r ) - 0 0 0 i l o 2 2 ( s ) i l o 2 ( r )- 0 D r 1 1 0 . 3 4 ( 5 ) 1 1 0 . 6 ( l ) 0 c 0 - - 0 0 0 1 1 4 . 4 6 ( 5 ) 1 1 4 . 4 ( 1 )
I 0 9 . 4 2 I 0 9 . 4
: 1.01. The results show that there can be a large dis-crepancy in predicted bond lengths between linearand non-linear models; there is a difference of0.016A at All(Al + SD - 0.9. The net effect is an in-crease in the apparent amount of Al in a T site with(T-o) lengths between 1.65 and 1.74A for the non-linear model. However, these curves should not beconsidered determinative and, hence, have not beenplotted. (T-O) and refined occupancy data for alkalifeldspars with a structural state between that of or-thoclase and low albite are needed before determina-tive plots may be usable. Even then, other factors(Ribbe et al., 1974) must be considered. Presently,the indication is that such plots may not be linear.
One important point that has been overlooked isthe effect of disorder on T-O distances. Examinationof the refinements of a number of feldspar structuresshows that disordered feldspars generally haveshorter grand-mean-average T-O bond lengths thando ordered ones. In Table 9 the grand-mean-averageof T-O bond lengths for ordered alkali feldsparstructures are 0.001 to 0.003A longer than for the dis-ordered ones. A comparison has also been made forthe (T:O) values calculated from the Ribbe-Gibbslinear model and our 3rd-degree polynomial model;the differences in average bond lengths are less forthe polynomial model but are still signfficant. Thedisplacement of the individual Al and Si atoms from
Table 8. Polynomial regressions for neutron-determined feldsparoccupancy data. Equations for the polynomial and the variance
ratio test fv") -" tiril _--:
A l / (A l+s i ) = .1 a ' , . r -o ' i
A Par t ia l l y D isordered (T t0=O. SZOnt ; T ,m=0 035)
ls t o rder 2nd 0rder 3 rd Order
r 0 2 . e l ( s ) 1 0 3 . 1 ( l )i l 5 9 9 ( 5 ) ] l 5 . e ( r )r 0 4 0 4 ( 5 ) 1 0 4 . 0 ( t )1 1 2 . 2 1 ( 5 ) 1 r 2 . 3 ( r )i l r . 1 6 ( 5 ) i l r . 2 ( r )' n 0 . 0 8 ( 5 )
r 1 0 . 0 ( r )
onr -
0^m-
oct-
o a2-
oct-
1 0 9 . 4 2 I 0 9 . 4
T l 0 -oAt -T tm
I rn-l Or-I rO
Tl 0 -080-T20
Tl m-0Bm-T2n
Tt 0 -0C0-T2m
Ttm-ocm- I20
Tt 0 -000-T2m
Tln-0Dm-T20
I 4 0 . 4 9
Est imated s tandard er ro rs in paren theses re fe r to the las t d ig i ts .
were performed, where All(Al + Si) is the fraction ofAl in a site and 1T-o) is the average inter-atomicdistance between the T site and its surreulding fouroxygens. Though there was little difference betweenthe fully-ordered and partially-disordered low-albitemodels refined, both were used in polynomial curvefitting. Results are shown in Table 9 and Figure 3.
To test for the best fit, three criteria were used.First, is the fit physically realistic? Fits with 5ignifi-cant negative curvatures or fits that require excess Alor Si beyond known limits were considered unrealis-tic and, hence, were discarded. Second, the standarderror of any of the polynomial coefficients must beless than that coefficient itself. Third, a variance ratiotest (Hamilton, 1964) was used to discriminateamong polynomials of successive degrees. Con-sequently, polynomials of degree three are preferred,but the curve for the constrained model is more real-istic as it does reach full Al occupancy [All(A1+ Si)
l 2 ' ] 7 6 1 C
0 6 3 - 4 5 . 4 9 3 1 ] 3 0 0 4 1 ] 5 . 5 6 3 1 8 0 x 1 0 5
7.559 i0 023 47 .3931]86 .0 -1432.20612 6x10⁶- - l l . 8 9 s t 1 6 . 6 4 4 6 7 . 4 7 1 t 9 . 4 ' 1 0 5
-893. 744t3 7x l 04
' r 4 r . 4 s ( 5 ) r 4 1 . 5 ( 1 )
1 30 .08 (4 ) 129 .7 \ 1 )
r 3 9 . 6 6 ( 5 ) l 2 e . B ( l )
1 6 r . 2 0 ( 5 ) r 6 r . 5 ( 2 )
r 2 9 8 8 ( s ) r 2 9 . 8 ( l )
r 3 s . 8 s ( 5 ) r 3 s . 8 ( 1 )
r 3 3 . 9 5 ( 5 ) r 3 3 . 9 ( 1 )
1 5 r . 8 4 { 5 ) r s r . 8 ( 2 )
a o
a l
u z
a 3
a 4
l
' R
0. 0 ' l I 97 0 .00889- 2 .043
4th order257089.98315.2x1 04
- 6 l 6 l 3 s . 0 2 l t l B x l 0 5
553563 260t1 . 6x l 05-220914.678$ 1x10⁵
3 3 0 6 9 . 0 4 7 l . 3 x l 0 4
0 . 0 0 1 9 4
3 828
0 . 0 0 3 7 9
6 . 7 1 4
B Fu l ly o rdered (T t0= l 0A l ; T tm=o.05)
ls t o rder 2nd order 3 rd 0 rder
a o
a l
a z
a J
o2.- 1
vn
-12 .619r0 203 -43 .6981 8 .60 3203.074! 625 0
7 828!0.124 44 986110.30 -5791 239!1120.0- - 1 . l . 0 9 5 t 3 0 7 3 4 8 4 l l 6 t 6 7 0 . 0
697. 382r ,l
34 . 0
0 00786 0 0051 7 0 .001 92- 3 . 1 2 7 8 . 4 8 6
o ? ( n - t ) - r , , ( n tV a = ( N - n ) ] - - 7 _ - ' -
' & l ( n )
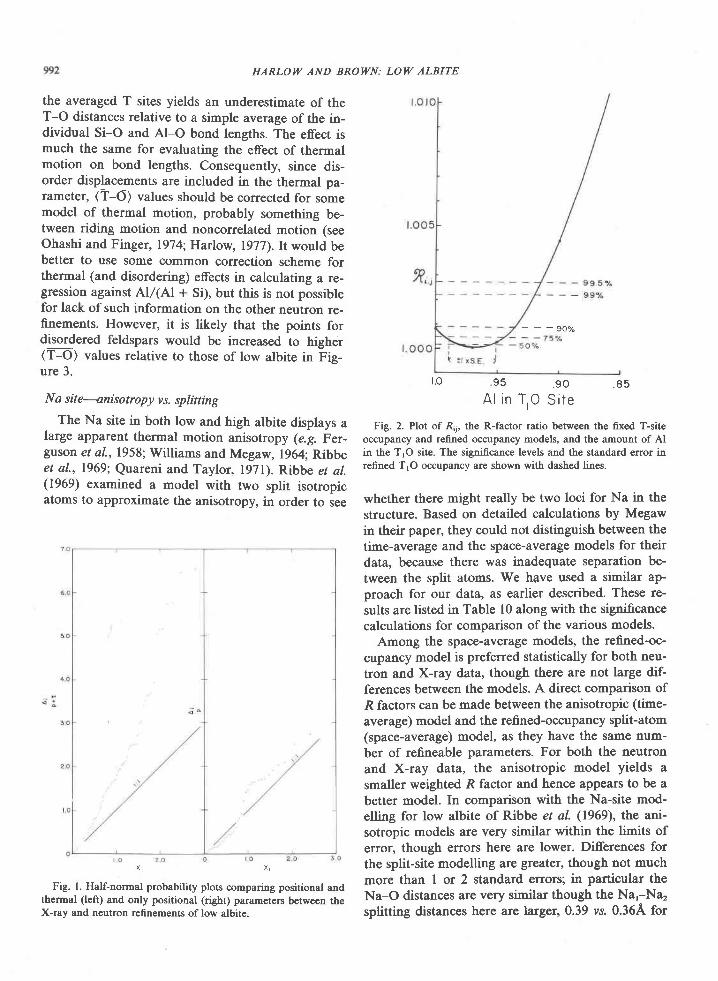
HARLOW AND BROWN: LOW ALBITE
the averaged T sites yields an underestimate of theT-O distances relative to a simple average of the in-dividual Si-O and Al-O bond lengths. The effect ismuch the same for evaluating the effect of thermalmotion on bond lengths. Consequently, since dis-order displacements are included in the thermal pa-rameter, (T_o) values should be corrected for somemodel of thermal motion, probably something be-tween riding motion and noncorrelated motion (seeOhashi and Finger, 1974;Harlow,1977).It would bebetter to use some common correction scheme forthermal (and disordering) effects in calculating a re-gression against All(Al + Si), but this is not possiblefor lack of such information on the other neutron re-finements. However, it is likely that the points fordisordered feldspars would be increased to higher(T-OD values relative to those of low albite in Fig-ure 3.
Na site---<nisotropy vs. splitting
The Na site in both low and high albite displays alarge apparent thermal motion anisotropy (e.g. Fer-guson et al.,1958; Williams and Megaw, 1964; Ribbeet al., 1969; Quareni and Taylor, l97l). Rlbbe et al.(1969) examined a model with two split isotropicatoms to approximate the anisotropy, in order to see
^ i ^ i
Fig. l. Half-normal probability plots comparing positional andthermal (lcft) and only positional (right) parameters between theX-ray and neutron refinements of low albite.
t o 95 .90 .85At in T ,O S i te
Fig. 2. Plot of R,r, the R-factor ratio between the fixed T-siteoccupancy and refined occupancy models, and the arnount of Alin the T1O site. The significance levels and the standard error inrefined T1O occupancy are shown with dashed lines.
whether there might really be two loci for Na in the
structure. Based on detailed calculations by Megaw
in their paper, they could not distinguish between the
time-average and the space-average models for their
data, because there was inadequate separation be-
tween the split atoms. We have used a similal np-proach for our data, as earlier described. These re-
sults are listed in Table l0 along with the signifcance
calculations for comparison of the various models.Among the space-average models, the refined-oc-
cupancy model is preferred statistically for both neu-
tron and X-ray data, though there are not large dif-
ferences between the models. A direct comparison of
R factors can be made between the anisotropic (time-
average) model and the refined-occupancy split-atom(space-average) model, as they have the same num-
ber of refineable parameters. For both the neutron
and X-ray data, the anisotropic model yields a
smaller weighted R factor and hence appears to be a
better model. In comparison with the Na-site mod-
elling for low albite of Ribbe et al. (1969), the ani-sotropic models are very similar within the limits of
error, though errors here are lower. Differences for
the split-site modelling are greater, though not much
more than I or 2 standard errors; in particular theNa-O distances are very similar though the Na'-Na,
splitting distances here are larger, 0.39 vs. 0.36A for
- - - 9 0 %
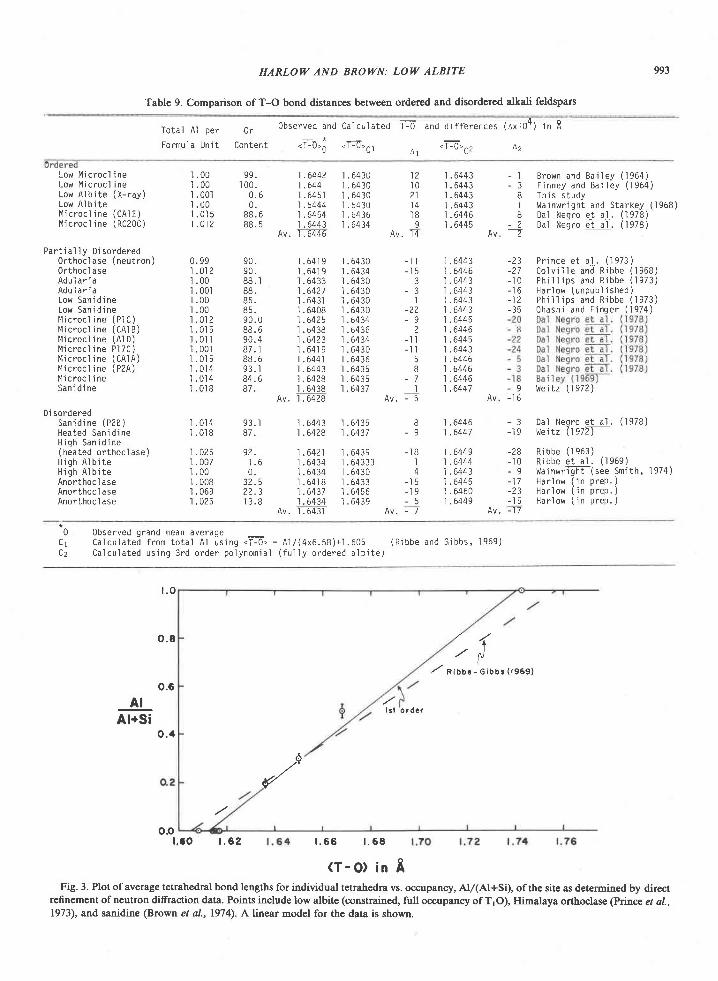
HARLOW AND BROII/N: LOW ALBITE
Table 9. Comparison ofT-O bond distances between ordered and disordered alka[ feldspars
99f
Total Al per 0r
Fo rmu la Un i t Con ten t
Obsc rved and Ca l c i r l a t ed f f i and d i f f e rences (Ax l04 ) i n R
< i - U > ^ . t - U \ ^ , . I - } , ^ c L )U L
Low Mi croc] i neLow lvli crocl i neLow A lb i t e (X - ray )Low A' lb i teM ic roc l i ne (CA l E )M ic roc l i ne (RC20C)
Pa r t i a l l y D i so rde red0 r t hoc lase (neu t ron )0rthoc l aseAdu la r i aAdu la r i aLow San id i neLow San id i neM i c r o c l i n e ( P l C )I l i c r oc l i ne (CA1 B )M ic roc l i ne (A lD )M ic roc ' l i ne P lTC)M ic roc l i ne (CA IA )M i c r o c l j n e ( P 2 A )M ic roc l ' i neS a n i d i n e
Di sorderedS a n i d i n e ( P 2 B )Hea ted San id i neH i g h S a n i d i n e(heated or thoc' lase)H i g h A l b i t eH i g h A l b i t eAnorthoc l aseAnorthoc l aseAnorthoc l ase
I . 0 01 . 0 01 . 0 0 1I . 0 01 . 0 1 51 . 0 1 2
0 . 9 9' I . 0 1 2
1 . 0 0I . 001I . 0 0I . 0 0' I
. 012l 0 1 51 . o i l' l
. 001t . 0 l 5I . 0 1 4' I
. 014' ] . 0 1 8
' I .01 4
I . 0 t 8
1 . 0 2 5'I . 007
1 . 0 0l 0081 . 0 6 91 . 0 2 5
9 9 . 1 . 6 4 4 2 1 . 6 4 3 0I 00 . I . 644 I . 6430
0 . 6 1 . 6 4 5 1 1 . 6 4 3 00 . 1 . 6 4 4 4 l . b 4 3 r j
8 8 . 6 1 . 6 4 5 4 1 . 6 4 3 68 8 . s 1 . 6 4 4 3 1 . 6 4 3 4
A v . 1 . 6 4 4 6
9 0 . r . 6 4 1 9 1 . 6 4 3 09 0 . I . 6 4 1 9 r . 6 4 3 48 8 . 1 r . 6 4 3 3 1 . 6 4 3 08 8 . 1 . 6 4 2 1 1 . 6 4 3 08 5 . 1 . 6 4 3 1 L 6 4 3 08 5 . 1 . 6 4 0 8 1 . 6 4 3 09 0 . 0 1 . 6 4 2 5 1 . 6 4 3 48 8 . 6 1 . 6 4 3 8 1 . 6 4 3 69 0 . 4 1 . 6 4 2 3 1 . 6 4 3 48 7 . t r . 6 4 1 9 1 . 6 4 3 08 8 . 6 1 . 6 4 4 1 t . 6 4 3 69 3 . 1 1 . 6 4 4 3 1 . 6 4 3 58 4 . 6 1 . 6 4 2 8 1 . 6 4 3 58 7 . 1 . 6 4 3 8 1 . 6 4 3 7
Av . I . 6428
9 3 . I8 7 .
I . 6443 I . 64351 . 6 4 2 8 1 . 6 4 3 7
- I B rown and Ba i l ey ( ' l 964 )- 3 F i n n e y a n d B a i l e y ( 1 9 6 4 )
8 Th i s s t udyI Wa jnwr i gh t and S ta r key ( ' l 968 )8 Da l Neg ro e t a l . ( ' l 978 )
- 2 D a l N e g r o e t a 1 . ( 1 9 7 8 )--2
-23 P r i nce e t a l . ( ' ] 973 )-27 co t v i l lE - f f i R ibbe ( ' ] 968 )- l 0 P h i l l i p s a n d R i b b e ( 1 9 7 3 )- ' ] 6 Ha r ' l ow (unpub l i shed )- 1 2 P h i l l i p s a n d R j b b e ( 1 9 7 3 )- 3 5 0 h a s h i a n d F i n g e r ( 1 9 7 4 )
- 9 W e i t z ( ' ] 9 7 2 )- 1 6
1 2l 02 1t 4t 89
A v . I 4
' I . 6439 - lB
I . 6 4 3 3 3 I1 . 6 4 3 0 4I . 6 4 3 3 - r 5I . 6 4 5 6 - 1 9I . 6439 - 5
A v . - 7
I . 6443L 6443I . 64431 . 6 4 4 31 . 6 4 4 6I . 6445
't . 6443
1 . 6 4 4 6'I . 6443
I . 6443I . 6 4 4 3I . 6443| .6445' t .6446| . 6 4 4 5I . 64431 .64461 .b446L64461 . 6 4 4 7
1 . 6 4 4 6t . 6 4 4 7
I .6449 -281 . 6 4 4 4 - l 0i . 6443 - 91 .6445 -17I .6460 -23L6449 - l 5
Av . - . ] 7
_ t I
3- 3
I- 2 2- 9
?_ t I- t I
58
- 7I
A v . - 5
8- 9
- 3 D a l N e q r o e t a l . ( ] 9 7 8 )-19 ' / tei tz Us77-
R i b b e ( 1 9 6 3 )R i b b e e t a l . ( l 9 6 9 )t ,Jainwr ig l t (see Smith,
' l974)
H a r ' l o w ( i n p r e p . )Ha r l ow ( i n p rep . )H a r l o w ( i n p r e p . )
9 2 . 1 . 6 4 2 11 . 6 l 64340 . 1 .6434
3 2 . 5 l 6 4 1 82 2 . 3 1 . 6 4 3 71 3 . 8 1 . 6 4 3 4
Av . I . 643 ]*oC 1C z
0bserved grand mean averageC a l c u l a t e d f r o m t o t a l A l u s i n g . T - b , = A 1 / ( 4 x 6 . 5 8 ) + 1 . 6 0 5 ( R i b b e a n d G i b b s ,
' ] 9 6 9 )
Ca l cu la ted us i ng 3 rd o rde r po l ynom ia l ( f u11y o rde red a l b i t e . ;
/ a i oo " - c i bbs ( r 969 )
oot . ao t . 6 2 t . 6 6 t . 6 8
(T -O) in IFig. 3. Plot ofaverage tetrahedral bond lengths for individual tetrahedra vs. occupancy, All(Al+SD, ofthe site as determined by direct
refinement of neutron diffraction data. Points include low albitc (constrained, full occupancy of TrO), Himalaya orthoclase (Pirrcn, et at.,1973), and sanidine (Brown et al., 1974\. A linear model for the data is shown.
/
L O
o.8
o.6AI
Al+SiO..l
o t d e fl s t

994 HARLOW AND BROIVN: LOW ALBITE
I '
2
3
Table 10. Results for anisotropic and split-site modelling of Nasite includins Na-O bond distances
lvlode Iu c c u p a n c y 5 D l l t t r n q u l r e c t r o n 0 t ) p r r r l l n 9 ^
N a r ( A ) t o a t o b t o c
r o r . 0 ( 8 ) r 4 5 . 4 ( 5 ) s l . 9 ( 5 )r 0 3 . s ( r 3 ) 1 4 2 . 9 ( 5 ) 4 e . r ( 5 )
0 3 9 2 ( 3 ) r 0 l 1 1 4 5 . 3 5 1 . 70 . 3 8 7 ( 4 ) r 0 2 9 1 4 3 . 3 4 9 . 6
0 . 3 9 3 ( 3 ) 1 0 1 . 2 1 4 5 . 3 5 1 . 1
283. We acknowledge the late Walter C. Hamilton of Brookhaven
National Laboratory for providing reactor port time during the
summer of 1972 and for many stimulating discussions. We also
thank Thomas F. Koetzle (rNI-) and Mogens S. Lehmann (cEDEx)
for assisting us with data collection, and Paul H. Ribbe for his
constructive review.
References
Abrahams, S. C. and E. T. Keve (1971) Normal probability plotanalysis of error in measured and derived quantities and stan-dard deviations. Acta Crystallogr., 427, 1 57-165.
Bailey, S. W. (1969) Refinement of an intermediate microclinestructure. Am. Mineral., 54, 1540-1545.
Barth, T. F. W. (1934) Polymorphic phenomena and crystal struc-tlute. Am. J. Sci., 27,2'13-286.
Brown, B. E. and S. W. Bailey (196a) The structure of maximummicrocline. Acta Crystallogr., 17, lf9l-14ffi.
Brown, G. E., G. V. Gibbs and P. H. Ribb€ (1969) The nature andvariation in length of the Si-O and AI-O bonds in frameworksilicates. Am. Mineral., 54, 1044-1061.
W. C. Hamilton and C. T. Pr€witt (1974) Neutron difrac-tion study of AllSi ordering in sanidine: a comparison with X-ray difraction data. In W. S. MacKenzie and J. Zussman, Eds.,The Feldspars, p. 68-80. Manchester University Press, Manches-ter, England.
Colville, A. A. and P. H. Ribbe (1968) The crystal structure of anadularia and a refinement of the structure of orthoclase. lm.Minerol., 53, 25-27.
Cromer, D. T. and J. B. Mann (1968) X-ray scattering factorscomputed from numerical Hartree-Fock wave functions. ,4ctaCrystallo gr., A 24, 321-324.
- and J. T. Waber (1965) Scattering factors computed fromrelativistic Dirac-Slater wave functions. Acta Crystallogr., 18,104-109.
Dal Negro, A., R. De Pieri, S. Quareni and W. H. Taylor (1978)The crystal structures of nine K feldspars from the Adamellomassif (northern ltaly). Acta Crystallogr., 8 34, 2699-27 07 .
Ferguson, R. 8., R. J. Traill and W. H. Taylor (1958) The crystalstructures of low-temperature and high-temperature albites.Acta Crystallogr., I 1, 331-348.
Finney, J. J. and S. W. Bailey (1964) Crystal structure of an authi-genic maximurn microcline. Z. Kristollotr., 119,413436.
Hamilton, W. C. (1964) Section 4-6. Multivariate linear hypothe-ses. In W. C. Hamilton, Ed., Stalislics in Physical Science, p.139-142. Ronald Press Company, New York.
- (1965) Significance tests on the crystallographic R factor.Acta Crystallogr., 1 8, 502-510.
Harlow, G. E. (1977) The Anorthoclase Stractures: a Room andHigh-temperature S tudy. Ph.D. Dissertation, Princeton Univer-sity, Princeton, New Jersey.
Higgins, J. B. and P. H. Ribb€ (1979) Sapphirine II: i{ neutronand X-ray diffraction study of (Mg-Al)vr and (Si-Al)rv orddr-ing in rnonoclinic sapphirine. Contrib. Mineral. Petrol., 6E,357-368.
International Tables for X-ray Crystallography, VoL a. (974) Ky-noch Press, !i61ingham, England.
Jones, J. B. (1968) Al-O and Si-O tetrahedral distances in alu-minosilicate framework structures. A ctd Crystallogr., 8 24, 355-358.
Lehmann, M. S., W. C. Hamilton and F. K. Larsen (1972) Back-ground determination for step-scan Bragg reflections. Am Crys-tallogr. Assoc. Meeting, Albuquerque, N.M., Abstract 09, 87.
neut ronx- ray
neut ronx-ray
neut ron
0. 02r 380 . 0 3 5 4 1
0 . 0 2 2 3 1 0 . 50 . 0 3 5 9 9 0 . 5
a x i s o f t h e a n i s o t r o p i c e l l i p s o
F = Rr2/R"3
n e u t r o n ( n = 1 5 1 5 ) 1 . 0 0 0 8 3
x-ray ln=2322) 1.0004
S i g n i f i c a n c e L e v e l( s o % ) 1 7 5 % )
n l , n , o . l o n t , n , o . e 5
I .00087 I .00048
I .0057 I .00031
I' la (0000)
neut ron x -
Na - 0 Bond D is tances (A)
l.la 1Nu2
oAt (0000) 2 .671\11 2 671(2)
oAt (oooc) 2 537(1) 2 537(2)
0 A 2 ( o o o o ) 2 . 3 7 2 1 1 ) 2 . 3 6 s ( 2 )
0 A 2 ( 0 0 0 c ) 3 . 7 2 4 ( l ) 3 . 7 1 9 ( 3 )
o A 2 ( o o o c ) 3 . 7 2 5 ( r ) 3 . 7 3 3 ( 3 )
0B(000c) 2 461(1 \ 2 464(2 \
0 B ( m 0 0 C ) 3 . 4 6 5 ( 2 ) 3 . 4 6 6 ( 3 )
0 c ( 0 2 i 0 ) 2 . 9 6 1 ( L ) 2 . 9 s 9 ( 2 )
0 r ( m z i 0 ) 3 . 2 6 6 ( 1 ) 3 . 2 6 7 ( 2 )
0D(0000) 2 .431( t ) 2 .44012)
0o(m000) 2 .996\2 \ 2 .997(3)
2 B o 1 ( 2 ) 2 . 7 e 7 ( 4 )
2 .45812) 2 .45614)
2 . 3 8 0 ( 2 ) 2 . 3 8 1 ( 4 )
3 8 3 7 ( 3 ) 3 . 8 3 7 ( 5 )
3 6 2 3 ( 3 ) 3 . 6 2 7 ( 5 )
2 .49212) 2 .49914)
3 . 6 4 0 ( 3 ) 3 . 6 4 1 ( 5 )
2 . 8 3 s ( 2 ) 2 . 8 3 e ( 4 )
3 . 3 e 0 ( 3 ) 3 . 3 9 0 ( 5 )
2 .45112) 2 .447(4)
2 . 8 3 5 ( 3 ) 2 . 8 3 4 ( 4 )
2 . s 2 1 \ 2 ) 2 5 3 5 ( 4 )
2 . 6 4 4 ( 2 ) 2 . 6 4 3 ( 4 )
2 381(2) 2 372(4)
3 . 6 0 0 ( 3 ) 3 . 5 e 0 ( 5 )
3 . 8 5 3 ( 3 ) 3 . 8 6 3 ( 5 )
2 .442(2) 2 .438(4)
3 . 2 6 r ( 3 ) 3 . 2 6 5 ( 5 )
3 . r 6 ( 2 ) 3 . r 0 6 ( 1 )
3 . 1 2 7 ( 3 ) 3 . 1 3 1 ( 4 )
2 438(2) 2 .449(4J
3 . r 8 8 ( 3 ) 3 r 8 8 ( s )
Es t imated er ro rs in paren theses re fe r to las t d ig i ts
the Ribbe et al. model. With Megaw's theoretical ap-proach to distinguish the models, for our data thelower limit for splitting is 0.36A for the neutron dataand 0.33A for the X-ray data; these limits are slightlysmaller than those for the refined splittings. These re-sults tend to support the time-average positionmodel, though not with any great certainty. Usingdata collected at 300o and 600oC, Quareni and Tay-lor (1971) concluded that anisotropic thermal motionwas the correct solution for Na in low albite. Morerecently Winter et al. (1977) examined the Na ani-sotropy of a Tiburon, California low albite at variouselevated temperatures; they found that their mea-sured apparent-thermal-motion magnitudes extrapo-late to zero at 0K, which indicates that real thermalmotion is the source of the large Na-site anisotropicdelocalization. Since our results agree, we concludethat thermal motion is the most reasonable inter-pretation for the Na-site anisotropy.
AcknowledgmentsThis work was initiated while both authors were at the Depart-
ment of Geological and Geophysical Sciences at Princeton Uni-versity and was partially supported by NASA grant NGL-31-001-
* f o r t h e a n i s o t r o p i c c a s e t h i s r e f e r s t o t h e d i r e c t i o n o f t h e m a J o r
Morey, G. W. and R. O. Fournier (1961) The decomposition ofmicrocline, albite, and nepheline in hot water. Am. Mineral., 96,688.
Ohashi, Y. and L. W. Finger (1974) Refinement of the crystalstructure of sanidine at 25o and 400o . Carnegie Inst. Wash. YearBook 73-74,539-544.
Phillips, M. W. and P. H. Ribb€ (1973) The structures of mono-clinic potassium-rich feldspars. Am. M ineral., 58, 495499.
Prince, E., G. Donnay and R. F. Martin (1973) Neutrotr stnrcturerefrnement of an ordercd orthoclase.,4 n. M ineral., 58, 500-507.
Quareni, S. and W. H. Taylor (1971) Anisotropy of the sodiumatom in low albite. Acta Crystallogr., 827,281-285.
Ribbe, P. H. (1963) A refinement of the crystal structure of sani-dinized orthoclase. A cta Crystallo gr., 1 6, 42H27.
- (19?5) The chemistry, structure, and nomenclature of feld-spars. In P. H. Ribbe, Ed., Feldspar Mineraloglt, p. Rl-R72.Mineral. Soc. Am. Short Course Notes, Vol. 2.
- and G. V. Gibbs (1969) Statistical analysis of mean AllSi-O bond distances and the aluminum content of tetrahedra infeldspars. Am. Mineral., 54, 85-94.
- M. W. Phillips and G. V. Gibbs (1974) Tetrahedral bondlength variations in feldspars. In W. S. MacKenzie and J. Zuss-man, Eds., The Feldspars, p. 25-48. Manchester UniversityPress, Manchester, England.
Traill (1969) The albite structures. Acta Crystallogr.,825,1503-r 518.
HARLOW AND BROWN: LOW ALBITE 99s
Smith, J. V. (1954) A review of AI-O and Si-O distatces. Acta
Crystallogr., 7, 4'l 9481.- and s. w. Bailey (1963) Second review of Al-o and si-o
tetrahedral distances. Acta Crystallogr.' 16, 801-811.Stewart, D' B. and r' L' wright (1974) Allsi order and symmetry
of natural alkali feldspars, and the relationship of strained cell
parameters to bulk composition' 8zl/. Soc- fr. Mindral' Cristal-
logr., 97,356-37'1.Waldbaum, D. R. and R. A. Robie (1971) Calorimetric investiga-
tion of Na-K mixing and polymorphism in the alkali feldspars.
Z. Kristallogr., 1 34, 381420.Wainwright, J. E. and J. Starkey (1968) Crystal structure of a
metamorphic low albite (abstr.). Geol- Soc. Am. Abstracts with
Programs,3lO.Weitz, G. (1972) Die Struktur des Sanidins bei verschiedenen
Ordnungs graden. Z. Kristallogr., 136' 418426.Williams, P. P. and H. D. Megaw (1964) The crystal structures of
high and low albites at -l80oC. Acta Crystallogr', 17,882-890.
Winter, J. K., S. Ghose and F. P. Okamura (1977) A high-temper-
ature study ofthe thermal expansion and the anisotropy of the
sodium atom in low albite. Am. Mineral., 62' 921'931.
Zachaiasen,w. H. (1967) A general theory of X-ray difraction in
crystals. Acta Crystallogr., 23, 558-564.
Manuscript received, November 23' 1979;
accepted for publication, March 31, 1980.
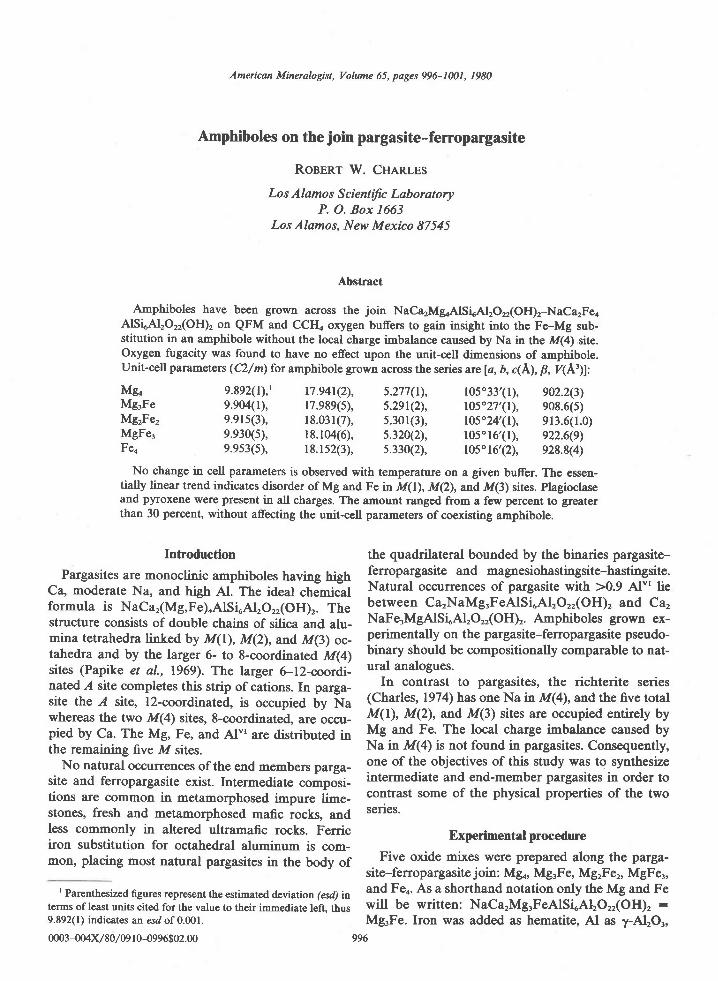
American Mineralogist, Volume 65, pages 996-IMI, 1980
Amphiboles on the join pargasite-ferropargasite
RosnRr W. CHanrns
Los Alamos Scientific LaboratoryP. O. Box 1663
Los Alamos, New Mexico 87545
Abstract
Amphiboles have been grown across the join NaCarMgoAlSLAlrOrr(OH)r-NaCarFeaAlSLAlrOrr(OH), on QFM and CCH. oxygen bufers to gain insight into the Fe-Mg sub-stitution in an amphibole without the local charge imbalance caused by Na in the M(4) site.Oxygen fugacity was found to have no effect upon the unit-cell dimensions of amphibole.Unit-cell parameterc (A/m) for amphibole grown across the series are la, b, c(ll, p, V(A\l:
9.892(l),' r7.94t(2), 5.277(t), 105.33'(l), 902.2(3)9.904(l), 17.989(5), 5.291(2), t05"27'(t), 908.6(5)9.915(3), 18.031(7), 5.301(3), 1o5"24'(r), 913.6(1.0)9.930(5), 18.104(6), 5.320(2), 105"16'(l), 922.6(9)9.953(5), 18.152(3), 5.330(2), l05o16'(2), 928.8(4)
No change in cell parameters is observed with temperature on a given bufler. The essen-tially linear trend indicates disorder of Mg and Fe in M(l), M(2), and M(3) sites. plagioclaseand pyroxene were present in all charges. The amount ranged from a few percent to greaterthan 30 percent, without affecting the unit-cell parameters of coexisting amphibole.
MgoMgrFeMgrFe2MgFe3Feo
Introduction
Pargasites are monoclinic amphiboles having highCa, moderate Na, and high Al. The ideal chemicalformula is NaCar(Mg,Fe)oAlSi"Al,Orr(OH)r. Thestructure consists of double chains of silica and alu-mina tetrahedra linked by M(l), M(2), and M(3) oc-tahedra and by the larger 6- to 8-coordinated M(4)sites (Papike et al., 1969). The larger 6-12-coordi-nated A site completes this strip of cations. In parga-site the A site, l2-coordinated, is occupied by Nawhereas the two M(4) sites, 8-coordinated, are occu-pied by Ca. The Mg, Fe, and Al"'are distributed inthe remaining five M sites.
No natural occurrenoes of the end members par5a-site and ferropargasite exist. Intermediate composi-tions are corrmon in metamorphosed impure lime-stones, fresh and metamorphosed mafic rocks, andless commonly in altered ultramafic rocks. Ferriciron substitution for octahedral aluminum is com-mon, placing most natural pargasites in the body of
I Parenthesized fgures represent the estimated deviation (esd) interms of least units cited for the value to their immediate left. thus9.892(l) indicates an esd of 0.001.
0003-oo4x/80/09 l 0-0996$02.00
the quadrilateral bounded by the binaries pargasite-ferropargasite and magnesiohastingsite-hastingsite.Natural occurrenses of pargasite with >0.9 Al't liebetween CarNaMgrFeAlSi"AlrOrr(OH), and Ca,NaFe,MgAlSLAl,O,,(OH),. Amphiboles grown ex-perimentally on the pargasite-ferropargasite pseudo-binary should be compositionally comparable to nat-ural analogues.
In contrast to pargasites, the richterite series(Charles, 1974) has one Na in M(4), and the five totalM(l), M(2), and M(3) sites are occupied entirely byMg and Fe. The local charge imbalance caused byNa in M(4) is not found in pargasites. Consequently,one of the objectives of this study was to synthesizeintermediate and end-member pargasites in order tocontrast some of the physical properties of the twoseries.
Experimental procedure
Five oxide mixes were prepared along the par9l-site-ferropargasite join: Mg., MgrFe, MgrFer, MgFer,and Feo. As a shorthand notation only the Mg and Fewill be written: NaCarMg,FeAlSLAlrOrr(OH), :MgrFe. Iron was added as hematite, Al as 7-AlrOr,
996
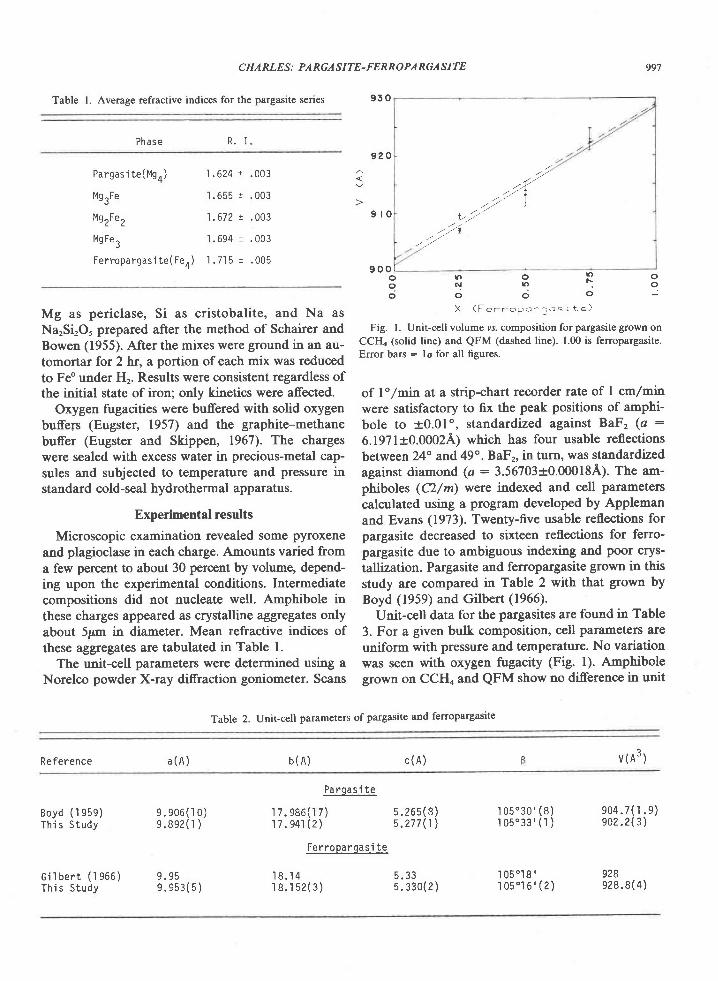
C H A RLE S : PA RGA S I TE - FERRO PA RGA S I TE
9 3 0Table l. Average refractive indices for the pargasite senes
Phase R . I .
P a r q a s i t e ( M q , )' - + '
Mq ̂Fe
t49rFe,
MqFe^
Ferrooarqas i te ( Fe, )' + '
' l . 6 2 4 r . 0 0 3
I . 6 5 5 ! . 0 0 3
1 . 6 7 2 ! . 0 0 3
1 . 6 9 4 1 . 0 0 3. l . 7 . l 5 1 . 0 0 5
Mg as periclase, Si as cristobalite, and Na asNarSirO, prepared after the method of Schairer andBowen (1955). After the mixes were ground in an au-tomortar for 2 hr, a portion of each mix was reducedto Feo under Hr. Results were consistent regardless ofthe initial state of iron; only kinetics were affected.
Oxygen fugacities were bufered with solid oxygenbuffers (Eugster, 1957) and the graphite-methanebuffer (Eugstcr and Skippen, 1967). The chargeswere sealed with excess water in precious-metal cap-sules and subjected to temperature and pressure instandard cold-seal hydrothermal apparatus.
Experimental results
Microscopic examination revealed some pyroxeneand plagioclase in each charge. Amounts varied froma few percent to about 30 percent by volume, depend-ing upon the experimental conditions. Intermediatecompositions did not nucleate well. Amphibole inthese charges appeared as crystalline aggregates onlyabout 5pm in diameter. Mean refractive indices ofthese aggregates are tabulated in Table l.
The unit-cell parameters were determinsd u5ing aNorelco powder X-ray difraction goniometer. Scans
997
9 2 0
9 r o "t''(t"27
!
O Looo
9 0r r o P o6 t l l oo 6 0
X ( F e r r o p o r q o s r t e )
Fig. l. Unit-cell volume rs. composition for pargasite grown on
CCHa (solid line) and QFM (dashed line). 1.00 is ferropargasite.
Error bars : lo for all figures.
of lo/min at a strip-chart recorder rate of I cm/minwere satisfactory to fix the peak positions of amphi-bole to +0.01", standardized against BaF, (a :
6.1971+0.0002A; which has four usable reflectionsbetween 24" and 49".BaFr, in turn, was standardizedagainst diamond (a: 3.56703+0.00018A). The am-phiboles (A/m) were indexed and cell parameterscalculated gsing a program developed by Applemanand Evans (1973). Twenty-five usable reflections forpargasite decreased to sixteen reflections for ferro-pargasite due to ambiguous indexing and poor crys-tallization. Pargasite and ferropargasite grown in thisstudy are compared in Table 2 with that grown byBoyd (1959) and Gilbert (1966).
Unit-cell data for the pargasites are found in Table3. For a given bulk composition, cell parameters areuniform with pressure and temperature. No variationwas seen with oxygen fugacity (Fig. l). Amphibolegrown on CCH. and QFM show no di.fference in unit
Table 2. Unit-cell parameters ofpargasite and ferropargasite
Reference a ( A ) b ( A ) c ( A ) v (n3 )
Boyd ( l 959)T h i s S t u d y
G i l b e r t ( 1 9 6 6 )T h i s S t u d y
9 .e06 ( ro )e .Be2( r )
9 . 9 5o o ( ? / q \
P a r g a s i t e
r 7 . 9 8 6 ( r 7 )1 7 . e 4 1 ( 2 )
Fer ropargas i te
' I 8 . 1 4' r 8 . 1 5 2 ( 3 )
s .26s (s )5 . 2 7 7 ( 1 )
5 . J J
5 . 330 (2 )
1 0 5 . 3 0 ' , ( B )l n E o ? ? r f l \
' | 05018 ' ,' | 0 5 . 1 6 ' ( 2 )
e 0 4 . 7 ( r . e )e 0 2 . 2 ( 3 )
928e 2 8 . 8 ( 4 )
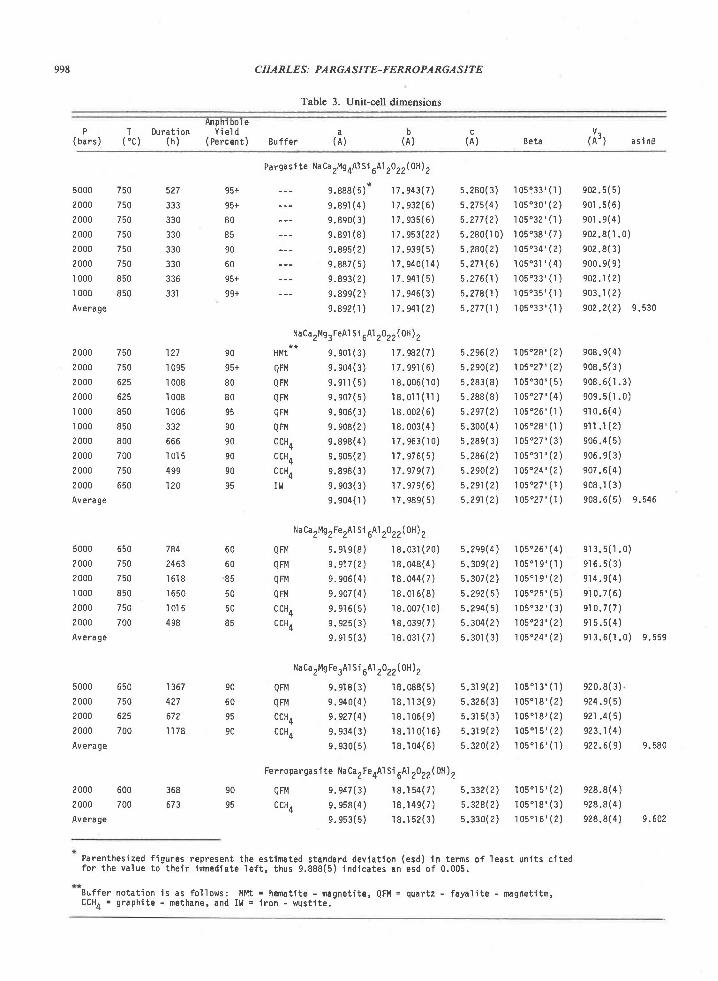
998 C H A RLE S: PA RGA S I TE- FERRO PA RGA S I TE
Table 3. Unit-cell dimensions
P T Durat ion( b a r s ) ( ' c ) ( h )
Anphl b0 | et r e t d
( Percent ) (A ) Be ta( A )Buffer (A)t,
(A r ) as l nB
Pargasl te Na CarMgOAl Si UA1 20 Z2(OH) z
5000
2000
2 000
2 000
2 000
2 000
I 000'I 000
Av erage
2000
2 000
2 000
2 000'I
000
1 000
2000
2000
2 000
2 000
Avera ge
5000
2 000
2 000'I 000
2000
2000
Av era ge
5 000
2 000
2000
2 000
Av era ge
750
750
750
750
750
750
850
850
90
95+
80
80
95
90
90
90
90
95
/cu
750
o z a
o z a
850
850
800
700
750
o i u
60
6 0
85
C U
50
85
650
750
t c u
850
750
700
527
J 5 t
330
330
J J U
330
J J O
331
95+
95+
80
85
90
50
95+
99+
e.888( s )9 . 8 e 1 ( 4 )
e .8eo( 3 )e .8e l (8 )
9 .8es( 2 )e. 887( 5 )e . 8 e 3 ( 2 )e .8ee(2 )9 . 8 s 2 ( 1 )
r 7 . 9 4 3 ( 7 )r 7 . e 3 2 ( 6 )r 7 . 9 3 s ( 6 )17.953(22\r 7 . 9 3 9 ( 5 )' r 7 . e 4 o ( r 4 )' r 7 . 9 4 r ( 5 )' r 7 . e 4 5 ( 3 )
17 .941(2)
NaCarMsrFeAl Si U A1 Z0 z2(0H) zHMt** 9 ,901(3) 17 .g lz (7)
Q F M e . 9 0 4 ( 3 ) r 7 . e e ] ( 6 )
Q F M e . e l r ( s ) 1 8 . 0 0 6 ( 1 0 )
Q F M e . 9 0 7 ( s ) l 8 . o l l ( l l )
Q F M e . 9 0 5 ( 3 ) 1 8 . 0 0 2 ( 6 )
Q F M s . e 0 8 ( 2 ) r 8 . 0 0 3 ( 4 )ccH4 9 .898(4) r 7 .953(1 0)c c H 4 9 . 9 0 s ( 2 ) r 7 . e 7 6 ( s )ccH4 e .8s8(3) 17 .e79(7)r w e . 9 0 3 ( 3 ) 1 7 . e 7 s ( 6 )
e . e04( r ) r 7 . e8e( s )
Na Ca2Mgz FeZA I S i 6A1 Z0 z2(0H) 2
Q F M e . e l e ( 8 ) 1 8 . 0 3 r ( 2 0 )
QFr4 9.917(2',) 18.048(4)
Q FM e. eo6( 4) 1 8. 044( 7 )QFr , r e .eo7(4) 18 .016(8)ccH4 e .91 6( 5 ) r 8 . oo7( r 0 )c c H 4 9 . 9 2 5 ( 3 ) r 8 . 0 3 9 ( 7 )
e . e ] s ( 3 ) r 8 . o 3 r ( 7 )
NaCaZMg Fe3Al Si O A1 2022rcH)z
QFM
QFMccH,rau
5 . 2 8 0 ( 3 ) r 0 s 9 3 3 ' ( r )5 . 2 7 5 ( 4 ) l 0 5 " 3 o ' ( 2 )5 .277 (2 ) 1 05 .32 ' ( r )5 . 2 8 0 ( 1 0 ) 1 0 5 " 3 8 ' ( 7 )5 . 2 8 0 ( 2 ) r 0 5 . 3 4 ' ( 2 )s . 2 7 1 ( 5 ) 1 o s . 3 r ' ( 4 )5 . 2 7 6 ( r ) r 0 5 . 3 3 ' ( r )5 . 2 7 8 ( r ) r 0 s " 3 5 ' ( 1 )5 . 2 7 7 ( 1 ) r 0 s . 3 3 ' , ( 1 )
5 .296(2) r05 '28 ' , (2 )5 . 2 s 0 ( 2 ) 1 0 s " 2 7 ' ( 2 )s . 2 8 3 ( 8 ) r 0 s " 3 0 ' ( s )5 . 2 8 8 ( 8 ) r 0 5 ' 2 7 ' , ( 4 )s .2e7 (2 ) r 0s"26 ' ( 1 )5 . 3 0 0 ( 4 ) r o s ' 2 8 ' ( l )s . 2 8 e ( 3 ) r 0 s . 2 7 , ( 3 )5 . 2 8 6 ( 2 ) 1 0 s ' 3 r ' , ( 2 )s .290(2) 105.24 ' (2 )5 . 2 e 1 ( 2 ) r o s ' 2 7 ' ( l )5 .291(2) r05o27 ' ( r )
s . 2 e 9 ( 4 ) 1 0 s . 2 6 ' ( 4 )5 . 3 0 9 ( 2 ) r 0 5 " r e , ( r )5 . 3 0 7 ( 2 ) r 0 s . r e ' ( 2 )5 ,292(5) I 05025' ( s)s . 2 e 4 ( 5 ) r o s . 3 2 ' ( 3 )5 . 3 0 4 ( 2 ) r o 5 o 2 3 ' , ( 2 )s . 3 0 r ( 3 ) r 0 5 . 2 4 ' ( 2 )
eoz.s (s )eor .5 (5)e o l . e ( 4 )e 0 2 . 8 ( 1 . 0 )e02.8( 3 )e00. 9 ( e )eoz. r ( 2)903. r (2 )
902.2(2) e .530
e 0 8 . 9 ( 4 )e08. s ( 3 )e 0 8 . 5 ( r . 3 )s o e . s ( l . o )e l 0 . 6 ( 4 )e i l . l (2 )s06.4( 5 )e06.9( 3 )e 0 7 . 5 ( 4 )e 0 8 . 1 ( 3 )
9 0 8 . 6 ( s ) e . s 4 6
e r 3 . s ( 1 . 0 )e I 6 . f l 3 )e r 4 . e ( 4 )e I 0 . 7 ( 6 )e l 0 . 7 ( 7 )e r 5 . 5 ( 4 )o r ? a l l n \ o E ( o
92 0 .8 ( 3 )e24 .e (s )e 2 r . 4 ( s )e23 . r (4 )922.6(9) 9 .580
e28.8(4 )e28.8 ( 4 )928.8(4) 9 .602
2000 500
2000 700
Average
1 0 5 . 1 3 ' ( l )
l o 5 " l 8 ' ( 2 )
1 0 5 " t 8 ' ( 2 )
r o s ' r s ' ( 2 )1 0 s . r 6 , ( r )
l 0 5 o l 5 , ( 2 )
l 0 5 . l 8 , ( 3 )' r 05"1 6, ( 2)
90
60
95
90
650
750
625
700
127'I 095
1 008
I 008
I 006
J J I
665
l 0 l 5
499
120
I J O /
427
672
1 1 7 8
368
673
784
a + o J
1 5 1 8'I 650
'101 5
498
Ferropargas I te Na Ca, FeOAI Si rAl Z0 ZZ(OH) z
9 . 9 1 8 ( 3 ) r 8 . 0 8 8 ( s ) s . 3 1 9 ( 2 )e . e 4 o ( 4 ) 1 8 . ' n 3 ( e ) 5 . 3 2 6 ( 3 )e . 9 2 7 ( 4 ) r 8 . 1 0 6 ( e ) 5 . 3 1 s ( 3 )9 . e 3 4 ( 3 ) r 8 . l 1 o ( r 6 ) 5 . 3 r e ( 2 )e .e30(s ) r8 . r04(5) 5 .320(2)
e . e 4 7 ( 3 ) 1 8 . r s 4 ( 7 ) s . 3 3 2 ( 2 )
9 .e58(4) r8 . l4e(7) 5 .32812)e . 9 5 3 ( s ) r 8 . l s 2 ( 3 ) s . 3 3 0 ( 2 )
90
95QFMccH4
Parenthesized f igures represent the est imated standard devlat ion (esd) in terms of least uni ts c i tedfo r t he va lue t o t he i r i nmed la te l e f t , t hus 9 .888 (5 ) i nd i ca tes an esd o f 0 .005 .
Euffer notat ion is as fo l lows: HMt = hemat l te - nagnet i te, QFl4 = quartz - fayal i te - magnet i te,CCHA = graphi te - methane, and I t { = l ron - wust i te.
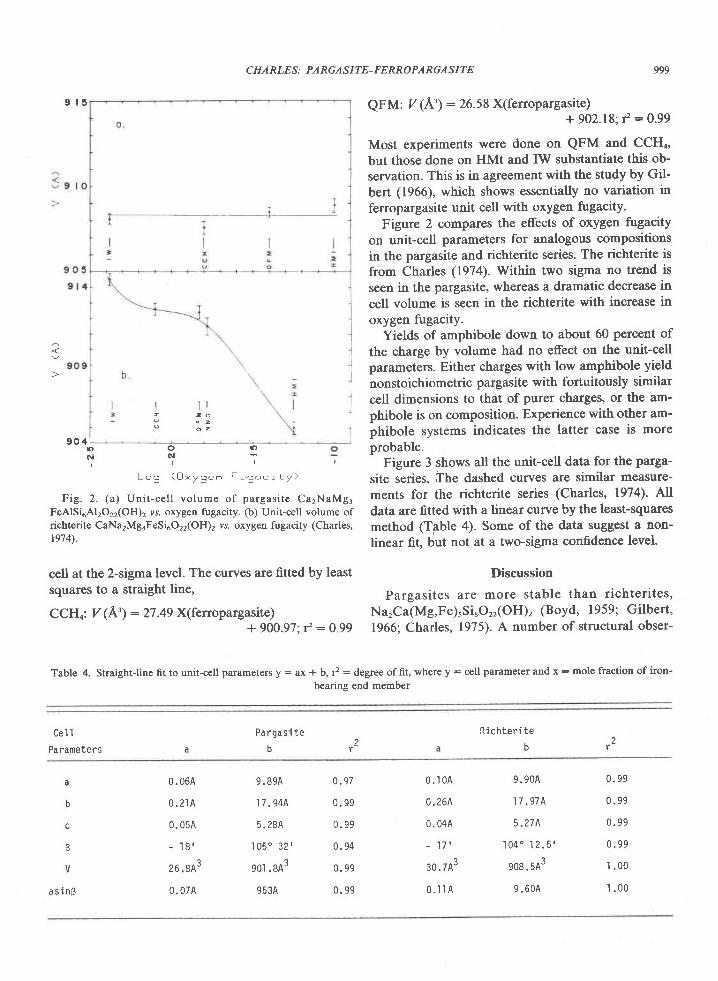
9 t 5
C HA R LE S : PA RGA S I TE- FE RRO PA RGA S I TE 999
QFM: V (A'7 :26.58 X(ferropargasite)+ 902.18; f :O99
Most experiments were done on QFM and CCt{o'but those done on HMt and IW substantiate this ob-servation. This is in agreement with the study by Gil-bert (1966), which shows essentially no variation inferropargasite unit cell with oxygen fugacity.
Figure 2 compares the effects of oxygen fugacityon unit-cell parameters for analogous compositionsin the pargasite and richterite series. The richterite isfrom Charles (1974). Within two sigma no trend isseen in the pargasite, whereas a dramatic decrease incell volume is seen in the richterite with increase inoxygen fugacity.
Yields of amphibole down to about 60 percent ofthe charge by volume had no effect on the unit-cellparameters. Either charges with low amphibole yieldnonstoichiometric pargasite with fortuitously similarcell dimensions to that of purer charges, or the am-phibole is on composition. Experience with other am-phibole systems indicates the latter case is moreprobable.
Figure 3 shows all the unit-cell data for the parga-site series. f,he dashed curves 41s 5imilar measure-ments for the richterite series (Charles, 1974). Alldata are fltted with a linear curve by the least-squaresmethod (Tpble 4). Some of the data suggest a non-linear fit, but not at a two-sigma confidence level.
Discussion
Pargasites are more stable than richterites,Na,Ca(Mg,Fe),Si,O,,(OH), (Boyd, 1959; Gilbert'1966; Charles, 1975). A number of structural obser-
o r )N
t l
4 Lt)o|
9 0
I I
I o
o 2
L o g ( O * y g e - F u g o c r t y )
Fig. 2. (a) Uni t -cel l volume of pargasi te Ca2NaMg.FeAlSi5Al2Orr(OH)2 r,s. oxygen fugacity. (b) Unircell volume ofrichterite CaNarMgoFeSi6O22(OH)2 ys. oxygen fugacity (Charles,r974).
cell at the 2-sigma level. The curves are fitted by leastsquares to a straight line,
CCH.: V (A\ : 27.49 X(ferropargasite)+ 900.97: r'?:0.99
Table 4. StraightJine fit to unit-cel parameters y: ax + b, r2: degree of fit, where y: cell parameter and x: mole fractionof iron-
bearing end member
C e l I
Pa rameters
P a r g a s i t e2r
R ich ter i te
DLr
0 . 0 6 A
0 . 2 1 A
0 . 0 5 A
- l g '
2 6 . 8 A 3
0. 07A
9 .89A
1 7 . 94A
5 . 2 8 4
I 0 5 0 3 2 '
9 0 l . 8 A 3
q q ? a
0 . 1 0 A
0 . 2 6 A
0. 04A
- 1 7 '
30 .7A3
0 . 1 I A
9. 90A
1 7 . 9 7 A
5 . 2 7 A
' I 0 4 0 1 2 . 5 ' ,
908.5A3
9 .60A
a
o
R
V
0 . 9 7
0 . 9 9
n q q
0. 94
n o o
0 . 9 9
n o o
n o q
n q q
0 . 9 9'I
.00
1 . 0 0a s i n B
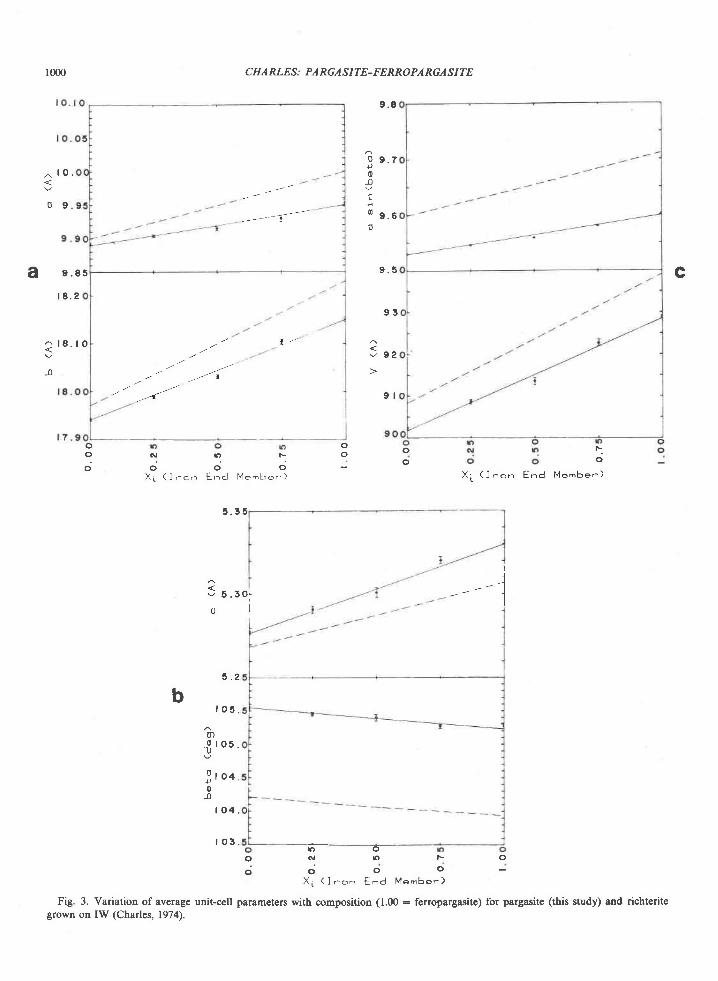
1000
^ t o .
0 9 .
a 9 . 8 5
| 8 . 2
1-1-ts
C H A RLE S : PA RGA S I TE- FERRO PA RGA S I TE
9 . 8
0 9 . 7,0n
co 9 . 6n
9 . 5
9 3
c
5 g z. l 8 . l O
-o
oo
oo;
5 . 3 0 :I
L0
//
/
" '
t / {
''<. 9 l
N b F
o o oX i ( I n o - E - d M e - F , e . )
5 . 3 5
5 . 2
I o 5 .
r ) oo N ( ) F O
d o o oX ; ( l n o n E - d M e m b e r )
Fig. 3. Variation of average unit-cell parameters with composition (1.00 : ferropargasite) for pargasite (this study) and richteritegrown on IW (Charles, 1974).
io
oo
I
b
r)0 | 0 5 .U
l ,oo0
-D
I 0 4 .
I o 3 .
X ; ( l r o - E n d M e - b e . )
CHA RL,ES: PA RGA SITE- FERRO PARGA SITE
vations contrast the two amphibole series. The richte-rite structure has a local charge imbalance becauseone sodium must occupy an M(4) site and be coordi-nated by six oxygens (Ghose, 1966; Whittaker,1949,1960). This is compensated by addition of a smallamount of ferric iron in M(2) which is nearest toM(4) in the iron-bearing richterites. In pargasiteM(4) and I are occupied by Ca and Na respectively.The interior M sites contain Al and 4(Mg,Fe).Should some Na be present n M(4), Al in M(2)would alleviate any charge imbalance. This observa-tion and the closer proximity of the adjacent doublechains caused by a smaller mean cation size in the Msites indicate why pargasite is thermally more stablethan richterite.
Figure 2 shows one effect of local charge imbal-ance. Pargasite shows a more uniform cell volumewith respect to oxygen fugacity than does richterite.The local charge imbalance in richterite is enhancedat higher oxygen fugacities, presumably causingmore ferric iron to enter M(2). At the higher oxygenfugacities of the HMt buffer, richterite unit-cell pa-rameters deviate from those observed at lower buf-fers toward magnesioriebeckite (Ernst, 1968), whichis known to have Fe'* occupying M(2) (Bancroft andBurns, 1969).
The unit-cell parameters of pargasite are linearwith composition in contrast to richterite (Charles,1974). The variation in unit-cell parameters withcomposition can be interpreted in terms of arrphi-bole structure. The parameters a and asinB dependupon the mean size of cations linking the doublechains of silica and alumina tetrahedra (Ernst, 1968;Huebner and Papike, 1970; Cameron and Papike,1979). One would expect a linear change with addi-tion of iron. This is observed in the pargasite series.Parameter b depends upon the occupancy of M@)and M(2) which actually link the chains of silica-alu-mina tetrahedra. M(4) is occupied by Ca and Na inall cases. If iron and magnesium are randomly dis-tributed n M(l), M(2), and M(3), a linear increasewould result as is observed. Parameter c. chainlength, reflects the occupancy of the chain and theM(l) and M(3) sites. Six Si and two Al are the tet-rahedral cations for all pargasites. Linear increase inchain length reflects random mixing of Fe and Mg inM(l) and M(3). Beta mirrors changes in I site size.In all cases I is occupied by Na and possibly Ca.However, the structure around I becomes increas-ingly larger due to addition of iron. The net effect isthat of placing a relatively smaller cation in,4, caus-ing B to decrease. Combining these effects for parga-
site, one sees a linear increase in volume within thescatter of the data.
The nonlinearities seen in richterite due to prefer-ential filling of M(l) and M(3) with ferrous iron overM(2) are not seen in the pargasites. A more completediscussion of richterite unit-cell parameter is pre-sented in Charles (1974).
AcknowledgmentsI thank Professor H. J. Greenwood, The University of British
Columbia, and Department of Energy for most of the support forthe research presented here, and Marcella Kramer for the carefulpreparation of this manuscript.
References
Appleman, D. E. and H. T. Evans, Jr. (1973) Indexing and leastsquares refinement of powder diffraction datl. Natl. Tech. Inf.Serv., U.S. Dep. Commerce, Springfield, Virginia. Document PB-216 188.
Bancroft, G. M. and R. G. Burns (1969) Mossbauer and absorp-tion spectral study of alkali amphiboles. Mineral. Soc. Am.Spec. Pap., 2, 13'1-148.
Boyd, F. R. (1959) Hydrothermal investigations of amphiboles. InP. H. Abelson, 8d,., Researches in Geochemistry, p. 377-396.Wiley, New York.
Cameron, M and J. J. Papike (1979) Amphibole crystal chemistry:a review. Fortschr. Mineral., 57,28-67.
Charles, R. W. (1974) The physical properties of the Mg-Fe rich-teites. Am. Mineral., J9,518-528.
- (1975) The phase equilibria of richterite and ferrorichte-ite. Am. Mineral., 60,367-374.
Ernst, W. G. (1968) Amphiboles. Springer-Verlag, New York.Eugster, H. P. (1957) Heterogeneous reactions involving oxidation
and reduction at high pressures and temperaturcs. J. Chem.Phys., 26, l76Fl761.
- and G. B. Skippen (1967) Igneous and metamorphic reac-tions involving gas equilibria. In P. H. Abelson, Ed,., Researchesin Geochemistry, p. 492-520. Wiley, New York.
Ghose, S. (1966) A scheme of cation distribution in amphiboles.Mineral. Mag., 35, 4G54.
Gilbert, M. C. (1966) Synthesis and stability relations of the horn-blende ferropatgasite. Am. J. Sci., 264,698-742.
Huebner, J. S. and J. J. Papike (1970) Synthesis and crystalchemistry of sodium-potassium richteri te, (Na,K)NaCaMg5SisO22(OH,F)2: a model for amphiboles. Am. Min-eral., 55, 1973-1992.
Papike, J. J., M. Ross and J. R. Clark (1969) Crystal chemicalcharacterization of clinoamphiboles based on five new structurerefinements. Mineral. Soc. Am. Spec. Pap., 2, 117-136.
Schairer, J. F. and N. L. Bowen (1955) The system K2O-AI2O3-SiO2. Am. J. Sci., 253,681-745.
Whittaker, E. J. W. (1949) The structure of Bolivia crocidolite.Acta Crystallogr., 2, 312-317.
- (1960) The crystal chemistry of the amphiboles. Acta Crys-tallogr., I 3, 291-298.
Manuscript received, November 13, 1979;
acceptedfor publication, March 12, 1980.
American Mineralogist, Volume 65, pages 1002-I0lI, 1980
Rapid-quench hydrothermal experiments in dilute chloride solutions appliedto the muscovite-quartz-sanidine equilibrium
Roslnr P. WrNTscH, ENRIeUE MEnrNo eNo Rosnnr F. BlmBrv
Department of Geology, Indiana UniversityB lo omingt on, I ndiana 4 7 40 5
Abstract
We have conducted a series of experiments in 0.01-molal chloride solutions at2OOoC and 2kbar on the muscovite-quartz-sanidine equilibrium for variable solid/fluid ratios, which inthese experiments are proportional to the surface area of the solids. The quench pH decreaseswith increasing solid/fluid ratios for runs with starting solution compositions in the sanidinefield (r.e., relatively alkaline solutions), but increases with increasing solid/fluid ratios forruns with starting solutions in the muscovite field (1.e., relatively acid). The two trends inter-sect at a solid/fluid ratio of -l/16, which is the ratio that yields the narrowest equilibriumreversals; in turn these reversals agree well with the independently-calculated log K (200"C, 2kbar).
For the same reaction in 0.01-molal chloride solutions at205"C and 17 bar vapor pressure,the same trend of quench pH-us.-solid/fluid ratio is observed for the runs approaching equi-librium from the muscovite field as for the 2 kbar runs, but no clear trend emerges from theruns approaching equilibrium from the sanidine field. Taken together, the experiments at 2kbar and 17 bar indicate that surface reactions cannot accouot for the two trends in quenchpH; if they did, the trends observed on approaching equilibrium from both sides would be thesame, which they are not. We conclude that dilute solutions are appropriate for collectinghigh-temperature/high-pressure equilibrium data provided one uses the rapid-quench tech-nique with solid/fluid mass ratios of -l/16.
The rapid-quench, dilute chloride solution technique was also used to determine log K vs.Z for the muscovite-quartz-sanidine reaction at 2 kbar and solid/fluid -l / 16 over the inter-val 20G-500"C. The log .rKs, determined vla aqueous-speciation calculations for each T and P,coincide with the log r(s calculated independently from the thermodynamic properties of thereactants and products.
Introduction
Experimental studies of solid-fluid equilibria havetraditionally employed concentrated (l-2 molar)chloride solutions. Although these studies have gen-erally been successful, the technique has severaldrawbacks. First, the amount of solid that must reactin order to bufer the solution is relatively large,which increases the time necessary to establish equi-librium. Second, the use of concentrated chloride so-lutions causes activities of aqueous species to departfrom the corresponding molalities and the activity ofHrO to depart from unity.' Both of these departures
I The standard state adopted here for aqueous species is one ofunit activity in a hypothetical one-molal solution referenced to in-finite dilution at any temperature and pressure. The standard statechosen for H2O and for minerals is one of pure liquid H2O andpure solids, respectively, at any temperature and pressure.
0003-004x,/80/09 l 0- I 002$02.00
can alter the values obtained for the equilibrium con-stant of the reaction under investigation. The use ofdilute solutions eliminates these problems, but in-troduces the uncertainty of interpreting quench pHbecause ofthe possible effect ofsurface reactions. Inspite of the successful use of dilute chloride solutionsin autoclave experim€nts (Usdowski and Barnes,1972), no systematic study has yet been carried out ofthe possible distorting effects of surface reactions onquench pH. These efects might be more important indilute than in concentrated solutions. We report theresults of our experiments of reaction l, along withan assessment of the rapid-quench pH technique indilute chloride solution.
The reaction studied is:
3 /2K-feldspar + Hio € l/2muscovite* 3quartz * Klo (l)
1002
For the standard states chosen here (see footnote l),the equilibrium constant is
Kr: a**/a* (2)
This reaction was chosen because (l) it has beenstudied experimentally over a large range of temper-ature, pressure, and salinity (Hemley, 1959; Shade,1968, 1974; Usdowski and Barnes, 1972; Gunter,1974; Wintsch,1915); (2) equilibrium constants maybe calculated from the thermodynamic properties ofthe reactants and products (Helgeson and Kirkham,1976; Helgeson e/ al., 1978); (3) dissociation con-stants for the aqueous complexes of interest in the fi-nal solution are well known (Helgeson and Kirkham,1976; Walther and Helgeson, 1977); and (4) thequench molalities of H* and K* may be easily mea-sured with specific-ion electrodes (Usdowski andBarnes, 1972).
Many of our experiments have been designed todetermine if surface reactions of the type discussedby Garrels and Howard (1959),
K-mica * H*: H-mica * K* (3)
K-feldspar * H* : H-feldspar + K* (4)
occur in rapid-quench experiments during thequench. Because these are surface reactions, theamount of hydrogen ion adsorbed will be propor-tional to the surface area of the minerals present. Inorder to vary the surface area in each experiment, themass of the starting solids has been varied, keepingconstant the mass of starting fluid. The particle sizeof the solids was always the same. Thus, the totalmineral surface area is proportional to the mass ofsolids, and also to the solid/fluid ratio. Both highpressure and vapor pressure experiments have beencarried out at 200"C for the purpose of contrastingthe two different quenching techniques involved (seebelow).
Methods
Starting mqterials
Only synthetic quartz, muscovite and K-feldsparhave been used in this study. They were prepared byusing ox ide mixes of reagent-grade HrSi03,AlCl3 '6HrO, and K'CO.. The AlClr .6HrO washeated at about 900"C for several hours to produceX-ray amorphous AlrOr. Appropriate mixtures ofthese materials were sealed in gold capsules with 0.05g distilled-deionized HrO, and starting materialswere synthesized in standard cold-seal pressure ves-sels.
1003
The grain size and unit-cell dimensions of the syn-thetic starting materials are listed in Table I alongwith the experimental conditions of synthesis. The X-ray technique suggested by Wright and Stewart(1968) using copper radiation (trCuKao : 1.5405624)has been followed, except that U.S. Bureau of Stan-dards silicon (a : 5.43088A at 25'C) has been usedas an internal standard instead of CaF, and that sam-ples have been run at slower scanning rates (l/4" 20/min). Unit cell parameters were calculated from themeasured 2d values by the computer program ofBurnham (1962).In all cases both lM and 2M' mus-covite have been synthesized together, but intensityof lM muscovite peaks is considerably larger thanthat of 2M, muscovite. The relatively large errors in
the refinements of the muscovite structures are a con-sequence of the overlapping lM and 2M, peaks. Syn-thetic K-feldspar is high sanidine with slightly anom-alous cell dimensions. Unit-cell parameters forquartz are identical to those for a-quartz and are notincluded in Table l. Aqueous chloride solutions ofvariable rfl*.r/trr^c, ratios but constant chlorinity were
prepared by mixing l0-'molal KCI and l0-'molalHCI solutions. All rapid-quench experiments wereconducted in sealed gold capsules. A constant 0.30 g
of solution was used in each run, and differentamounts of muscovite + sanidine + quartz (always inthe mass ratio of I : I : l) were weighed as required tovary the mineral surface area.
High-pressure experiments
High-pressure experiments were carried out inrapid-quench cold-seal pressure vessels of the typefigured by Rudert et al. (1976). The pressure and ex-tension vessels were 30 and 25 cm long respectively.
An 8-cm filler rod was used in each run to limit con-vection of the HrO pressure medium. Temperatureswere measured with sheathed chromel-alumelthermocouples standardized against the meltingpoint of NaCl (800.5'C). Rudert et al. report temper-ature gradients in rapid-quench bombs which theybelieve are unacceptably large. We report our mea-sured temperature gradients in some detail becauseso little is known about them and because our results
are significantly smaller than those of Rudert et a/.Temperature gradients between the thermocouple
well and the charge were determined by comparingthe temperature measured in the thermocouple wellwith the melting temperature of tin (231.9oC), zinc(419.6), and antimony (630.7). These metals weresealed in evacuated silica tubes (5 to 6 cm long and 6mm O.D.) of dimensions close to those of the gold
WINTSCH ET AL.: MUSCOVITE-OUARTZ-SANIDINE
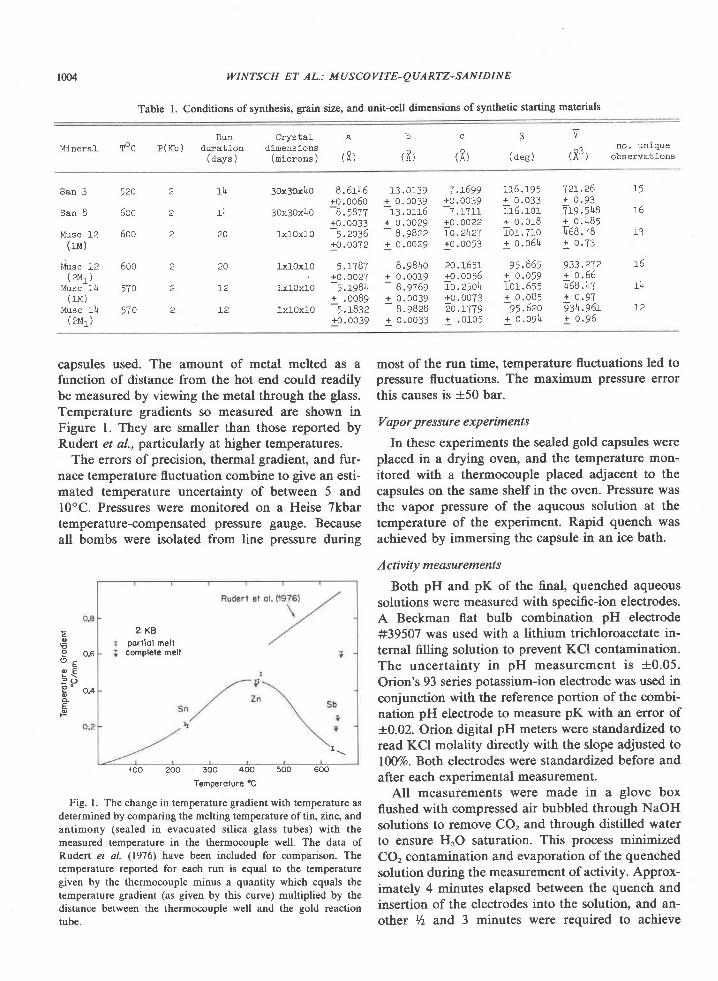
1004 WINTSCH ET AL: MUSCOVITE-QUARTZ-SANIDINE
Table t. Conditions of synthesis, grain size, and unit-cell dimensions of synthetic starthg materials
Mineral TocRun CrystaL
P(Ift) duration dimensions(aays ) (nicrons )
a b c
(8) (8) t l tB
( d e g )
V
^? no . unaque( I - ) observa t ions
San 3
San 8
Musc l-2(ru)
I&rsc L2(2M, )
MUSC a4
( 1M)Musc l-\
( 2M1)
52O 2 14
5oo 2 l+
600 2 20
600 2 zo
570 2 12
570 2 12
3ox3ox1+o B .6rl+6+0 . OO50
3ox3oxl+0 8.5877+0 . 0033
1x1Ox10 '5.2C36
+0 . 0072
lxloxl-O 5.1787. +0 .0027
Lxloxlo 5 '1981++ . 0089
lx lOxfO 5.1832+0 .0039
13.0139 7 . t699+ 0 .0039 +0.0039- r l .o116 -7 . rTr r
+ 0 . 0 0 2 9 + 0 . o o 2 2- 8.9822 To.z\zt
+ 0 . 0 0 2 9 + 0 . 0 0 5 3
B. 9BI+o 20 .r65a+ 0 .0019 +0.0056-
B .9T69 lo . e :01++ 0 .0039 !0 .0073
8.9828 20 . r7T9+ 0 .0033 + .0105
116.l |95 72r.26+ 0 . 0 3 3 + 0 . 9 3-rr5
. ror 1tg .>\8+ o , O1B + O. l l85ror.7:-o [68.TB+ o . o 5 \ + 0 . 7 3
95.865 933.272+ 0 . 0 5 9 + 0 , 5 6lot-.6ss T68.\T+ 0 . 0 8 5 + o . 9 7-95.620 gz\.get+ o . O 9 ) + + 0 , 9 6
'I 5
a o
13
L O
r)+
t 2
capsules used. The amount of metal melted as afunction of distance from the hot end could readilybe measured by viewing the metal through the glass.Temperature gradients so measured are shown inFigure l. They are smaller than those reported byRudert et al., particularly at higher temperatures.
The errors of precision, thermal gradient, and fur-nace temperature fluctuation combine to give an esti-mated temperature uncertainty of between 5 and10"C. Pressures were monitored on a Heise Tkbartemperature-compensated pressure gauge. Becauseall bombs were isolated from line pressure during
most of the tg1 1ime, temperature fluctuations led topressure fluctuations. The maximum pressure errorthis causes is i50 bar.
Vapor pressure experiments
In these experiments the sealed gold capsules wereplaced in a drying oven, and the temperature mon-itored with a thermocouple placed adjacent to thecapsules on the same shelf in the oven. Pressure wasthe vapor pressure of the aqueous solution at thetemperature of the experiment. Rapid quench wasachieved by immersing the capsule in an ice bath.
Activity measarements
Both pH and pK of the final, quenched aqueoussolutions were measured with specffic-ion electrodes.A Beckman flat bulb combination pH electrode#39507 was used with a lithium trichloroacetate in-ternal filling solution to prevent KCI contamination.The uncertainty in pH measurement is +0.05.Orion's 93 series potassium-ion electrode was used inconjunction with the reference portion of the combi-nation pH electrode to measure pK with an error of+0.02. Orion digital pH meters were standardized toread KCI molality directly with the slope adjusted to1007o. Both electrodes were standardized before andafter each experimental measurement.
All measurements were made in a glove boxflushed with compressed air bubbled through NaOHsolutioirs to remove CO, and through distilled waterto ensure HrO saturation. This process minimizedCO, contamination and evaporation of the quenchedsolution during the measurement of activity. Approx-irnately 4 minutes elapsed between the quench andinsertion of the electrodes into the solution, and an-other t/z and 3 minutes were required to achieve
oEI 0.6
o Et , \
5 0.4oE
2 K Bporf io l mel tcomplele mell
I :
roo 200 300 400 500 600
Temoerolure rc
Fig. l. The change in temperature gradient with temperature asdetermined by comparing the melting temperature of tin, zinc, andantimony (sealed in evacuated silica glass tubes) with themeasured temperature in the thermocouple well. The data ofRudert et al. (1976) have been included for comparison. Thetemperature reported for each run is equal to the temperaturegiven by the thermocouple minus a quantity which equals thetemperature gradient (as given by this curve) multiplied by thedistance between the thermocouple well and the gold reactiontube.
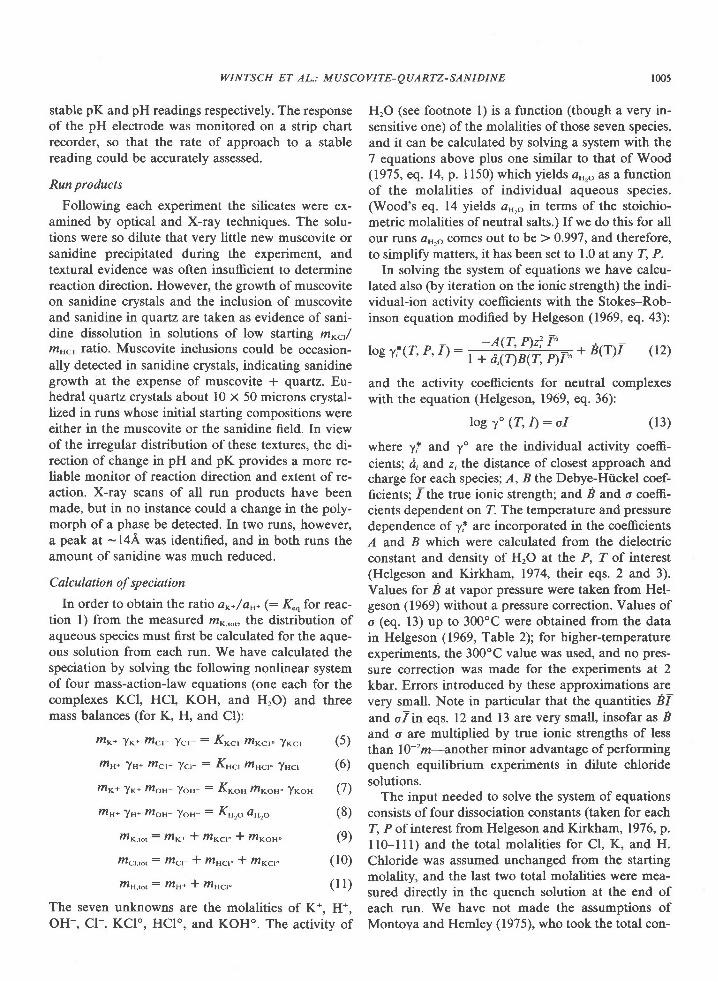
WINTSCH ET AL.: MUSCOVITE-OUARTZ-SANIDINE 1005
stable pK and pH readings respectively. The responseof the pH electrode was monitored on a strip chartrecorder, so that the rate of approach to a stablereading could be accurately assessed.
Run products
Following each experiment the silicates were ex-amined by optical and X-ray techniques. The solu-tions were so dilute that very little new muscovite orsanidine precipitated during the experiment, andtextural evidence was often insufficient to determinereaction direction. However, the growth of muscoviteon sanidine crystals and the inclusion of muscoviteand sanidine in quartz are taken as evidence of sani-dine dissolution in solutions of low starting m*.,/mr., tatio. Muscovite inclusions could be occasion-ally detected in sanidine crystals, indicating sanidinegrowth at the expense of muscovite * quartz. Eu-hedral quartz crystals about l0 x 50 microns crystal-lized in runs whose initial starting compositions wereeither in the muscovite or the sanidine field. In viewof the irregular distribution of these textures, the di-rection of change in pH and pK provides a more re-liable monitor of reaction direction and extent of re-action. X-ray scans of all run products have beenmade, but in no instance could a change in the poly-morph of a phase be detected. In two runs, however,a peak at -l4A was identified, and in both runs theamount of sanidine was much reduced.
Calculation of speciation
In order to obtain the ratio a**/ar, (: K." for reac-tion l) from the measured m*'o,, the distribution ofaqueous species must first be calculated for the aque-ous solution from each run. We have calculated thespeciation by solving the following nonlinear systemof four mass-action-law equations (one each for thecomplexes KCl, HCl, KOH, and HrO) and threemass balances (for K, H, and Cl):
mK+ yK+ ntcr- lcr : K*c, fltrccr" -lxcr (5)
mH+ y.'* fncr- ^lcr- : Kncr fr1'cr" .fsct (6)
flTy+ lr+ lllon- los- : K*o" f/l*os" fxou Q)
//ls+ ls+ tilon 'f ou- : Krro Atro (8)
/flp,o.: mK* + m*.r" * m*.,r" (9)
ffict,ror: fficr- I mHcr" + mKa" (10)
f/111,1s1 : t:llH* * fllHc]r" ( l l )
The seven unknowns are the molalities of K*. H*,OH-, Cl-, KClo, HClo, and KOH.. The activity of
HrO (see footnote l) is a function (though a very in-sensitive one) of the molalities of those seven species,and it can be calculated by solving a system with the7 equations above plus one similar to that of Wood(1975, eq. 14, p. I150) which yields a",o as a functionof the molalities of individual aqueous species.(Wood's eq. 14 yields a",o in terms of the stoichio-metric molalities of neutral salts.) If we do this for allour runs aH,o comes out to be > 0.997, and therefore,to simplify matters, it has been set to 1.0 at any T, P.
In solving the system of equations we have calcu-lated also (by iteration on the ionic strength) the indi-vidual-ion activity coefficients with the Stokes-Rob-inson equation modified by Helgeson (1969, eq. 43):
roe yl(r, P,T7: ;ffiHfi.+ i(rx- 02)and the activity coefficients for neutral complexeswith the equation (Helgeson, 1969, eq. 36):
log yo (7, D : of (13)
where y,t and yo are the individual activity coeffi-cients; d, and z, the distance of closest approach andcharge for each species; A, B the Debye-Hiickel coef-ficients; 1-the true ionic strength; and B nd o coeffi-cients dependent on Z. The temperature and pressuredependence of y,l are incorporated in the coefficientsA and B which were calculated from the dielectricconstant and density of HrO at the P, 7 of interest(Helgeson and Kirkham, 1974, their eqs. 2 and, 3).Values for B at vapor pressure were taken from Hel-geson (1969) without a pressure correction. Values ofo (eq. 13) up to 300"C were obtained from the datain Helgeson (1969, Table 2); for higher-temperatureexperirnents, the 300"C value was used, and no pres-sure correction was made for the experiments at 2kbar. Errors introduced by these approximations arevery small. Note in particular that the quantities B^f-and, olin eqs. 12 and 13 are very small, insofar as Band o are multiplied by true ionic strengths of lessthan l0-'m-another minor advantage of performingquench equilibrium experiments in dilute chloridesolutions.
The input needed to solve the system of equationsconsists of four dissociation constants (taken for eachZ, P of interest from Helgeson and Kirkham , 197 6, p.ll0-lll) and the total molalities for Cl, K, and H.Chloride was assumed unchanged from the startingmolality, and the last two total molalities were mea-sured directly in the quench solution at the end ofeach run. We have not made the assumptions ofMontoya and Hemley (1975), who took the total con-
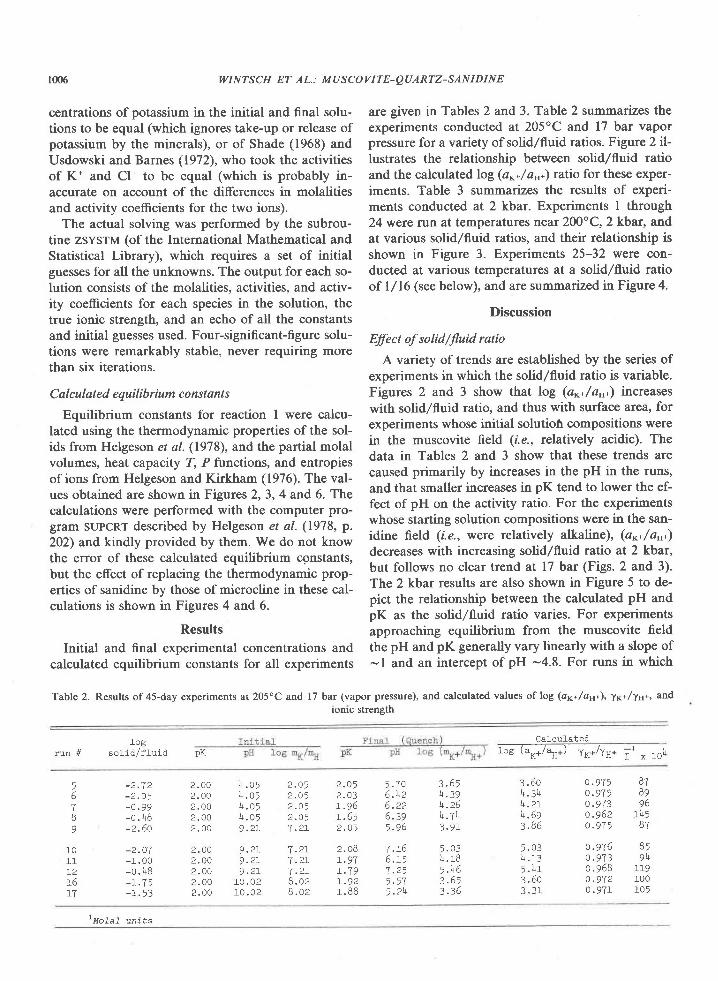
1006 WINTSCH ET AL.: MUSCOVITE-QUARTZ-SANIDINE
centrations of potassium in the initial and flnal solu-tions to be equal (which ignores take-up or release ofpotassium by the minerals), or of Shade (1968) andUsdowski and Barnes (1972\, who took the activitiesof K* and Cl- to be equal (which is probably in-accurate on account of the differences in molalitiesand activity coefficients for the two ions).
The actual solving was performed by the subrou-tine zsvsru (of the International Mathematical andStatistical Library), which requires a set of initialguesses for all the unknowns. The output for each so-lution consists of the molalities, activities, and activ-ity coefficients for each species in the solution, thetrue ionic strength, and an echo of all the constantsand initial guesses used. Four-significant-figure solu-tions were remarkably stable, never requiring morethan six iterations.
C al culat e d e quilib rium c ons t an t s
Equilibrium constants for reaction I were calcu-lated using the thermodynamic properties of the sol-ids from Helgeson et al. (1978), and the partial molalvolumes, heat capacity T, P functions, and entropiesof ions from Helgeson and Kirkham (1976). The val-ues obtained are shown in Figures 2,3, 4 and 6. Thecalculations were performed with the computer pro-gram SUPCRT described by Helgeson et al. (1978, p.202) and kindly provided by them. We do not knowthe error of these calculated equilibrium constants,but the effect of replacing the thermodynamic prop-erties of sanidine by those of microcline in these cal-culations is shown in Figures 4 and 6.
Results
Initial and final experimental concentrations andcalculated equilibrium constants for all experiments
are given in Tables 2 and 3. Table 2 summarizes theexperiments conducted at 205oC and 17 bar vaporpressure for a variety of solid/fluid ratios. Figure 2 il-lustrates the relationship between solid/fluid ratioand the calculated log(a**/an*) ratio for these exper-iments. Table 3 summarizes the results of experi-ments conducted at 2 kbar. Experiments I through24 were run at temperatures near 200oC, 2 kbar, andat various solid/fluid ratios, and their relationship isshown in Figure 3. Experiments 25-32 were con-ducted at various temperatures at a solid/fluid ratioof l/16 (see below), and are summarized in Figure 4.
Discussion
Effect of solid/fluid ratio
A variety of trends are established by the series ofexperiments in which the solid/fluid ratio is variable.Figures 2 and 3 show that log (a**/a'*) increaseswith solid/fluid ratio, and thus with surfacp area, forexperiments whose initial solutiofi compositions werein the muscovite field (i.e., relatively acidic). Thedata in Tables 2 and 3 show that these trends arecaused primarily by increases in the pH in the runs,and that smaller increases in pK tend to lower the ef-fect of pH on the activity ratio. For the experimentswhose starting solution compositions were in the san-idine field (r.e., were relatively alkaline), (a"*/a"*)decreases with increasing solid/fluid ratio at 2 kbar,but follows no clear trend at l7 bar (Figs. 2 and 3).The 2 kbar results are also shown in Figure 5 to de-pict the relationship between the calculated pH andpK as the solid/fluid ratio varies. For experimentsapproaching equilibrium from the muscovite fieldthe pH and pK generally vary linearly with a slope of-l and an intercept of pH -4.8. For runs in which
Table 2. Results of 45-day experiments at 205oC and 17 bar (vapor pressure), and calculated values of log (ay*/as*), 76*/7s*, and
romc strength
Calculated.
run #1og
so_L1o/ r l -u f o pK iosl%7"trt yK/n{* i '* ro!
,6TB9
10l_1I2a o
17
- 2 . 7 2- 2 . 0 5-a ,99-o . l +8- 2 . 6 0
- 2 . 0 7- 1 . 0 0-0. l+B
2 . 0 52 . O 52 n q
T . 2 I
7 . 2 r7 . 2 r7 . 2 L8 . o 28 . 0 2
t o q
2 . O 3l - . y o
2 . O 5
2 . 08r o 77 . 7 9I O t
1 . 8 8
5 . 7 05 . ) 1 26 . z zA ? o
s . g 6
7 . 1 66 . r 5T . 2 '5 . 5 75 . 2 \
4 . 3 9)1 .264 . 7 4? o l
q n ?
l+. 18, . \ 61 A c
J , J O
3 . 6 04 . 3 4) + . 2 I) ] . 693 . 8 6
q n ?
\ . 1 35 .1+13 . 6 0? ? l
o . 9 7 5o . 9 7 50 .9?3o . 9 6 2o . 9 7 5
0 . 9 7 6o . 9 7 3o.9680 . 9 7 20 .9Tr
2 . 0 0 4 . 0 52 . o o ) + . 0 52 . o o ) + . 0 52 . o o ) + . 0 52 , O 0 9 . 2 I
2 . 0 0 9 . 2 I2 . O O 9 . 2 12 . 0 0 9 . 2 r2 . 0 0 1 0 . 0 22 . 0 0 1 0 . 0 2
8?8996
r ) , <
87
o )
9)+
100105
rMo la f un i ts
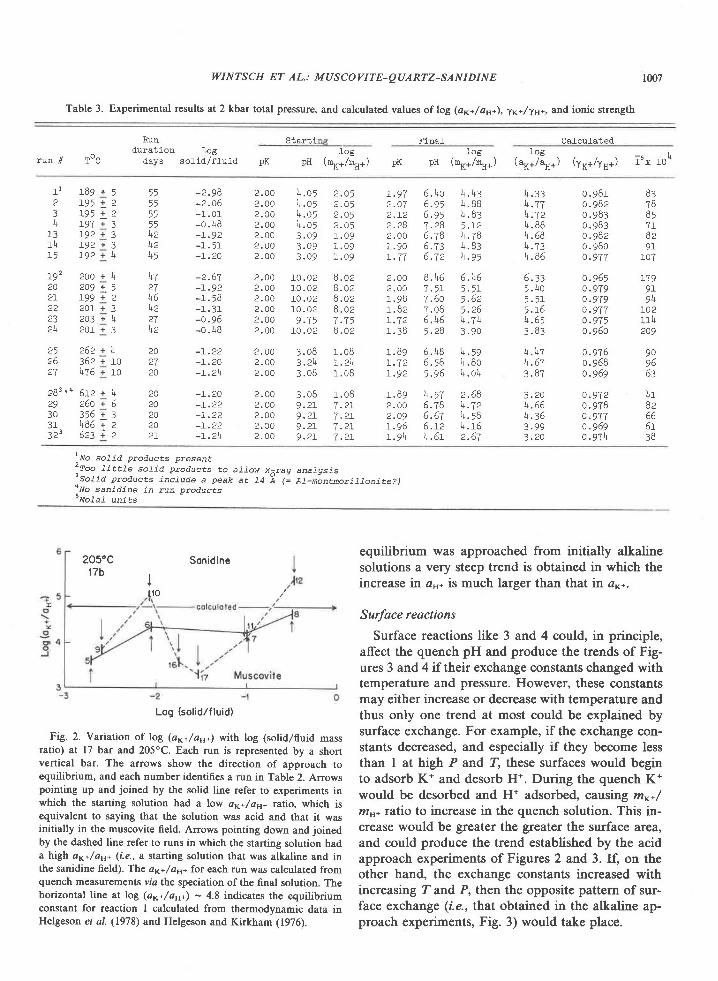
WINTSCH ET AL.: MUSCOVITE-QUARTZ-SANIDINE 1007
Table 3. Experimental results at 2 kbar total pressure, and calculated values oflog (a.*,/as*),.rx*/ytt*, and ionic strength
run tr Toc
Runduration Log
cays soalo/ r -Lu1clog
pfi (n6+/\+/
Start l Final Ca.Iculated
pKpK1og 1og
pH (**+/1r+) ("*+/a"*) (yrr.*/yn*) fsx roL
1 1 1 8 9 + 5 j j2 1 9 5 + 2
"3 1 9 5 + 2 5 54 1 9 7 + 3
"1 3 I 9 2 + 3 \ 21 l + r 9 2 + 3 ) + 21 5 I 9 2 + \ 4 5
r 9 2 2 o o + 4 ) . + T2 0 2 0 9 + 5 2 T2 r 1 9 9 + 2 \ 622 201 +3 ) . +223 203 + l+ 27d - + 2 O l + 3 \ 2
25 262 + ).+ 2026 362 + ro a727 475 + rO 20
a83 ,4 51e + )+ zo2 9 2 6 0 + 5 2 03 0 3 5 6 + 3 2 03 1 ) + 8 5 T 2 2 03 2 3 6 z l i z 2 r
- 2 - 9 8- 2 . 0 5- t . 01-0 .1+8-r .92- 1 . 5 1-r .20
- ) 6 a
- t 0 2
- 1 . ) o
-o.96-0 . )+B
-r.22-r.20
- 1 . 2 0- I .22-1.22-r.22
2 , 0 5
t n q
1 . 0 91 . 0 91 . 0 9
8 . 0 28 . 0 28 . 0 28 . 0 27 . 7 58 . o 2
1 . 0 8L . d +1 . 0 8
1 . 0 87 . 2 rT . 2 I7 . 2 r7 . 2 r
4 . 4 31 . 8 8l + . 8 3q 1 t
I t . 78]+. 83+ . 9 )
5. )+6
> . z ol+ .71+? o n
4 . 8 04 . 0 4
2 . 6 8\ . 7 2\ . t 8l+ .162 . 6 7
4 . J t
) t .77\ . 7 2l+ .884 . 5 8)+ .734 . 8 6
5. l+o
4 . b )
4 . 4 7)1 .673 . 8 7
3 . 2 0)+ ,56c . J o
3 . 9 93 . 2 0
o .981o.982o .9830 . 9 8 3o . 9 8 20 . 9 8 0O . 9 T T
v . 9 0 )
0 . 9 7 90 . 9 7 9o . 9 7 70 . 9 7 'o , 9 6 0
o . 9 7 60 . 9 6 80.969
0 . 9 7 20.9780 . 9 7 70 . 9 6 9
2 .00 )+ . 052 . 0 0 l + . 0 52 . 0 0 I + . 0 52 . 0 0 1 . 0 5z . O a 3 . 0 92 . O O 3 . o g2 . 0 0 3 . 0 9
2 . 0 0 1 0 . 0 22 . 0 0 1 0 . 0 22 . O 0 1 0 . 0 22 . 0 0 1 0 . 0 22 . 0 0 9 . 7 52 . 0 0 1 0 . 0 2
2 . o o 3 . 0 82 .00 3 . d12 . O O 3 . 0 8
2 . o o 3 . 0 82 . O 0 9 . 2 72 . O O g . 2 I2 . 0 0 9 . 2 r2 . 0 0 9 . 2 r
r . 9 T 6 . 4 02 . o 7 6 . 9 52 . r 2 5 . 9 52 . 2 8 7 . 2 82 . 0 0 6 . 7 81 . 9 0 6 . 7 3r . T 7 6 . 7 2
2 . o o 8 . 4 62 . 0 0 7 . r r1 . 9 8 7 . 6 01 . 8 2 T . 0 8I . 7 2 5 . ) + 51 . 3 8 5 . 2 8
I .89 5 . r+8r . T 2 6 . 1 8r . 9 2 5 . 9 6
1 . 8 9 \ . 5 72 . o o 6 . 7 82 . o 9 5 . 5 7t . y o o , r z1. 9 )+ 4 . 6 r
8378I t7 IB 2q l
f07
179Q l
9)+ro21 r l ,
209
9o96O J
8z66o f
38
' lrto solid products present'T_oo.1-ltt le
soTid products to aiLow x6raq anafgsis".SoJid products incLude a peak at 14 A (= AJ.-montmorif lonite?)'IVo sanidine in run ptoducxs'Molai units
205oC Sonidiner7b
ilto ,'
Log (solid./fluid)
Fig. 2. Variation of log (as*/as*) with log (solid/fluid massratio) at 17 bar and 205'C. Each run is represented by a shortvertical bar. The arrows show the direction of approach toequilibrium, and each number identifies a run in Table 2. Arrowspointing up and joined by the solid line refer to experiments inwhich the starting solution had a low a.**/as* ratio, which isequivalent to saying that the solution was acid and that it wasinitially in the muscovite field. Arrows pointing down and joinedby the dashed line refer to runs in which the starting solution hada high ap/as* (r.e., a starting solution that was alkaline and inthe sanidine field). The a1.+/as+ for each run was calculated fromquench measurements via the speciation of the final solution. Thehorizontal line at log (aa./as*) - 4.8 indicates the equilibriumconstant for reaction I calculated from thermodynamic data inHelgeson et al. (1978) and Helgeson and Kirkham (1976).
equilibrium was approached from initially alkalinesolutions a very steep trend is obtained in which theincrease in a". is much larger than that in a**.
Surfoce reactions
Surface reactions like 3 and 4 could, in principle,affect the quench pH and produce the trends of Fig-ures 3 and 4 if their exchange constants changed withtemperature and pressure. However, these constantsmay either increase or decrease with temperature andthus only one trend at most could be explained bysurface exchange. For example, ifthe exchange con-stants decreased, and especially if they become lessthan I at high P and Z, these surfaces would beginto adsorb K* and desorb H*. During the quench K*would be desorbed and H* adsorbed, savsinr mK*/mB* tatio to increase in the quench solution. This in-crease would be greater the greater the surface area,and could produce the trend established by the acidapproach experiments of Figures 2 and 3.If, on theother hand, the exchange constants increased withincreasing T and P, then the opposite pattern of sur-face exchange (i.e., that obtained in the alkaline ap-proach experiments, Fig. 3) would take place.
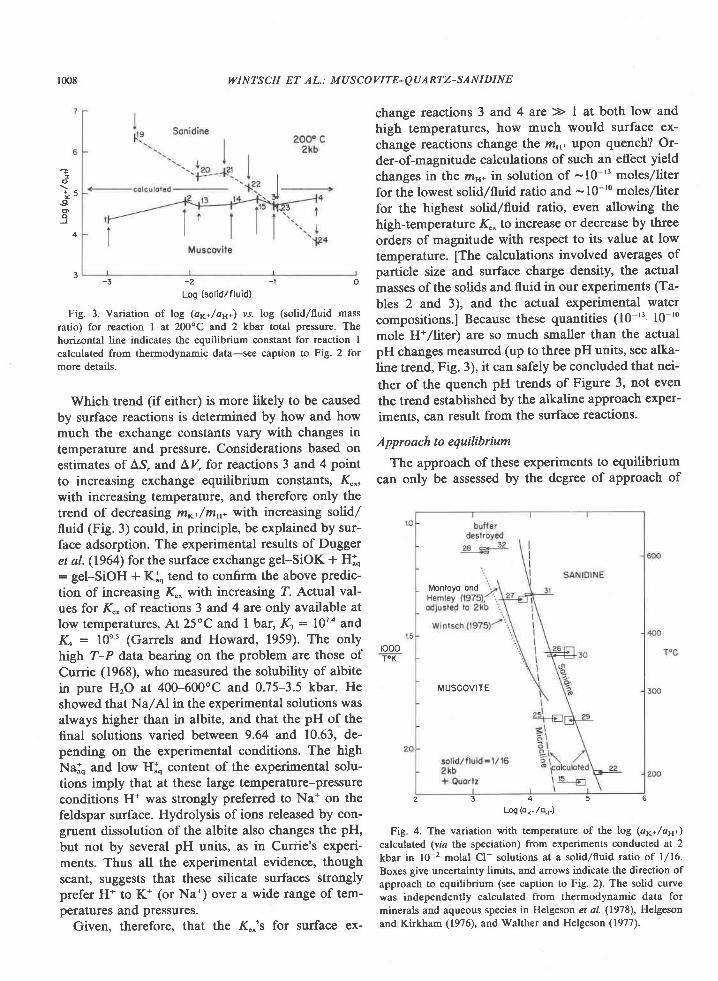
1008
3 - 3 - 2 - t O
-og (solid/fluid)
Fig. 3. Variation of log (ap/as.) vs. log (solid/fluid mass
ratio) for reaction I at 200'C and 2 kbar total pressure. The
horizontal line indicates the equilibrium constant for reaction I
calculated from thermodynamic data-see caption to Fig. 2 for
more details.
Which trend (if either) is more likely to be causedby surface reactions is determined by how and howmuch the exchange constants vary with changes intemperature and pressure. Considerations based onestimates of A^S, and LV, for reactions 3 and 4 pointto increasing exchange equilibrium constants, Ke*,with increasing temperature, and therefore only thetrend of decreasing rfis'/ms* with increasing solid/fluid (Fig. 3) could, in principle, be explained by sur-face adsorption. The experimental results of Duggeret al. (1964) for the surface exchange gel-SiOK + Hio: gel-SiOH + Ki tend to confirm the above predic-tion of increasing K"- with increasing L Actual val-ues for K"- of reactions 3 and 4 are only available atlow temperatures. At 25oC and I bar, K, : l0'o andKo : 10" (Garrels and Howard, 1959). The onlyhigh Z-P data bearing on the problem are those ofCurrie (1968), who measured the solubility of albitein pure H,O at 400-600"C and 0.75-3.5 kbar. Heshowed that Na/Al in the experimental solutions wasalways higher than in albite, and that the pH of thefinal solutions varied between 9.64 and 10.63, de-pending on the experimental conditions. The highNalo and low Hi content of the experimental solu-tions imply that at these large temperature-pressureconditions H* was strongly preferred to Na* on thefeldspar surface. Hydrolysis of ions released by con-gruent dissolution of the albite also changes the pH,but not by several pH units, as in Currie's experi-ments. Thus all the experimental evidence, thoughscant, suggests that these silicate surfaces stronglyprefer H* to K* (or Na*) over a wide range of tem-peratures and pressures.
Given, therefore, that the K"*'s for surface ex-
WINTSCH ET AL: MUSCOVITE-QUARTZ-SANIDINE
o
-9oq
4
change reactions 3 nd 4 are >> I at both low andhigh temperatures, how much would surface ex-change reactions change the m.* upon quench? Or-der-of-magnitude calculations of such an effect yieldchanges in the z"r in solution of -10-'' moles/literfor the lowest solid/fluid ratio and -10-'o moles/literfor the highest solid/fluid ratio, even allowing thehigh-temperature K"* to increase or decrease by threeorders of magnitude with respect to its value at lowtemperature. [The calculations involved averages ofparticle size and surface charge density, the actualmasses of the solids and fluid in our experiments (Ta-bles 2 and 3), and the actual experimental watercompositions.] Because these quantities (10-''-10-'0mole H*/liter) are so much smaller than the actualpH changes measured (up to three pH units, see alka-line trend, Fig. 3), it can safely be concluded that nei-
ther of the quench pH trends of Figure 3, not eventhe trend established by the alkaline approach exper-iments, can result from the surface reactions.
Approach to equilibrium
The approach of these experiments to equitbriumcan only be assessed by the degree of approach of
Montoyo ond
MUSCOVITE
2 3 4 5 6Log (oK./oHt
Fig. 4. The variation with temperature of the log (ap/att)
calculated (via the speciation) from experiments conducted at 2
kbar in l0-2 molal Cl- solutions at a solid/fluid ratio of 1/16.
Boxes give uncertainty limits, and arrows indicate the direction of
approach to equilibrium (see caption to Fig. 2). The solid curve
was independently calculated from thermodynamic data for
minerals and aqueous species in Helgeson et al. (1978), Helgeson
and Kirkham (1976), and Walther and Helgeson (1977).
roooTOK
WINTSCH ET AL.: MUSCOVITE-OUARTZ-SANIDINE
aK*/aH* ratios at similar solid/fluid ratios. The sys-tematic trends of Figure 3 show that the closest ap-proach to equilibrium of initially very different start-ing solutions is obtained at a solid/fluid ratio of-10-'2 : l/16. The experiments at l7 bar (Fig. 2)suggest an optimum solid/fluid ratio of -ll10, butbecause they are more erratic than those at 2 kbar,l/16 zppears to be the most favorable solid/fluid ra-tio to approach equilibrium most closely.
H igher - t emp e ratur e e xp e rime nt s
Experiments investigating reaction I have beenconducted at -260,360, 480, and 620oC at 2 kbar,and at a solid/fluid ratio of l/16. Figure 4 shows thatall experiments between 200' and 500'C exept #26form tight reversals of reaction l. Comparison ofthese reversals with the calculated equilibrium con-stant yJ. temperature curve shows good agreement
PH zoo
2.OO 2.50pK
Fig. 5. Calculated (-log as*) vs. calculated (-log ap*) forexperiments conducted near 200oC at 2 kbar. The crosses indicatethe uncertainties in the activities. The equilibrium constantcalculated from thermodynamic data for minerals and aqueousspecies at 200'C is given by the slope of the solid line. See captionto Fig. 2 for more details.
r50
m ' -
50
uLog 1o*,/or.)
6 7
Fig. 6. The variation with temperature of the log (ay*/ar*)
calculated from experiments of this study and from Usdowski andBarnes (1972). The equilibrium constants calculated theoreticallyfor reaction I using alternatively microcline and sanidine areincluded for comparison.
between the two. Two experiments (28 and 32) above600oC on Figure 4 fall to the left of the calculatedline but very close to each other. In each case a l4Aphase (aluminum montmorillonite?) was produced,destroying the buffer assemblage of reaction l. Thusthese two points should not plot with the lower-tem-perature results because a different assemblage buf-fers these experiments. These two experiments arenevertheless compatible with what is known aboutthis chemical and mineralogical system, because alltheoretically calculated equilibrium constants formuscovite-aluminosilicate lie to the left of the mus-covite-sanidine line. The convergence of the solutioncompositions of these two runs suggests that a closeapproach to (probably metastable) equilibrium hasbeen achieved. Thus these 600"C results further sup-port the reliability of the rapid-quench technique, be-cause they yield solution compositions in generalagreement with theoretical prediction and becausethey are closely reversed.
Comparison with other work
Our results at 200oC and 17 bar are compared inFigure 6 to the work of Usdowski and Barnes (1972)and to the calculated equilibrium constants for mi-crocline and sanidine. In view of the different experi-mental techniques and starting materials used inthese two experimental studies, the results are in re-
WINTSCH ET AL.: MUSCOVITE-QUARTZ-SANIDINE
markable agreement with each other. Also, the ex-perimental data are in reasonable agreement with the
calculated curves.Higher-ptessure experiments have been conducted
on reaction I by Hemley (1959), Shade (1968, 1974),Gunter (19'14), and Wintsch (1975). Most of these re-
sults are difficult to compare with the present study
because the experiments were conducted at differentpressures or chlorinities from those reported here.
The study of Wintsch (1975) includes five experi-ments run at 2 kbar in l0-' molal solutions. Thiscurve lies at activity ratios approximately 0.4 log
units smaller than the results reported here. These
experiments involved solid/fluid ratios of betweenl/30 and l/60, and the data in Table 3 show thathalf of the discrepancy between the two experimentalstudies could be a consequence of this smaller solid/fluid ratio. The error in the activity ratio of these ex-periments is =0.2 log units. Thus within the uricer-tainty of the data, the results of this study and ofWintsch (1975) are in agreement.
It is difficult to compare the calculated activity ra-
tios of Shade (1968, 1974) and Montoya and Hemley(1975) with our calculations, because the former
studies do not include the computation of activity co-
efficients, the calculations of Shade (1968, 1974) in-volve the simphfying assumption that a** : dcr-,
which is not strictly valid, and the calculations of
Montoya and Hemley (1975) are for I kbar. We
have, however, adjusted the activity ratios of Mon-
toya and Hemley to 2 kbar. The corrected ratios are
included in Figure 4 for comparison. [n view of the
different methods involved in these calculations, theyare in reasonable agreement.
The data in Figure 4 are thus significant because
the equilibrium constant for reaction I at 2 kbar as a
function of temperature has been obtained by a vari-
ety of methods that yield similar results. Within the
limits of the errors involved, the equilibrium con-
stants calculated from Hemley's (1959) experimentsat I kbar in 2-molar solutions are indistinguishablefrom those calculated in this study from experimentsat2kbar in l0-'zmolal solutions. Both of these results
agree with the equilibrium constants calculated from
the thermodynamic data of Helgeson et al. (1978)which were, in turn, calculated from other experi-mental studies involving the synthetic minerals of re-
action l. We conclude, therefore, that the thermody-namic properties of synthetic muscovite, sanidine,
and quartz are uniform from laboratory to labora-
torv.
Conclusions
From the data summarized in Figures 2 and 3 itappears that surface reactions do not affect quenchpH in dilute solutions. Although we have no ex-planation for the observed trends of pK and pH vs.the solid/fluid ratio, they suggest that the narrowestreversals are obtained at solid/fluid ratios of l/16.Significantly, these narrowest reversals are also theones closest to the calculated log K.
We recommend that the aqueous concentrations ofall elements be measured after quench for two rea-sons: to better monitor the approach to equilibriumof the solutions with the whole assemblage, and to al-low for a more thorough calculation of the speciationof the final solution (in this case the addition of silicaand aluminum species).
The agreement of our equilibrium constants, de-termined from experiments in dilute solutions, withthe constants determined by others from experimentsin concentrated solutions, and with constants calcu-lated from an internally-consistent set of thermody-namic properties is remarkable. Clearly, accuratehigh-temperature/high-pressure solid-fluid equilib-rium data can be obtained from experiments in-volving dilute chloride solutions.
AcknowledgmentsIt is a pleasure to thank H. C. Helgeson and G. C' Flowers of
the University of California at Berkeley for their prompt and en-
Iightening answers to many queries and for the computer program
supcRT. We also thank E. Inouye, C. Moore, and B. Ransom for
assistance in the laboratory, W. Moran and B' Moore for drafting,
ancl T. F. Brown and S. Douthitt for typing. We acknowledge the
support of the National Science Foundation (grant EAR 76-
22560), of the Indiana University Foundation, and of the Indiana
Geological Survey. The ttvtsL subroutines are a proprietary pack-
age of the International and Statistical Libraries. We acknowledge
computer time given by Indiana University's Wrubel Computing
Center, which also obtained the routines.
References
Burnham, C. W. (1962) Lattice constant refrnement. Carnegie Inst.
Wash. Year Book, 61, 132-115.
Currie, K. L. (1968) On the solubility of albite in supercritical wa-
ter in the range 400 to 600oC and 750 to 3500 bars' Am. J. Sci-'
265,321-341.Dugger, D. L., J. H. Stanton, B. N. Irby, B. L. McConnell' W. W.
Cummings and R. W. Maatman (1964) The exchange of twenty
metal ions with the weakly acidic silanol group of silica gel. "/.Phys. Chem., 68, 757 -760.
Garrels, R. M. and P. Howard (1959) Reactions of feldspar and
mica with water at low temperature and pressure. In A. Swine-
ford, Ed., Clays and Clay Minerals, p. 68-88' Pergamon Press,
New York.
Gunter, W. D. (1974) An experimental study of mineral'solution
IryINTSCH ET AL.: MUSCOVITE-OUART,Z-SANIDINE
equilibria applicable to metamorphic rocks. Ph.D. Thesis, TheJohns Hopkins University, Baltimore, Maryland.
Helgeson, H. C. (1969) Thermodynamics of hydrothermal systemsat elevated temperatures and pressures. Am. J. Sci., 267,729-804.
- and D. H. Kirkham (1974) Theoretical prediction of thethermodynamic behavior of aqueous electrolytes at high pres-sures and temperatures: II. Debye-Hiickel parameters for activ-ity coefficients and relative partial molal properties. Am. J. Sci.,274, lt99-1261.
- and - (1976) Theoretical prediction of the thermody-namic behavior of aqueous electrolytes at high pressures andtemperatures: III. Equation of state for aqueous species at in-finite dilution. Am. J. Sci., 276,9'1-240.
-, J. M Delany, H. W. Nesbiu and D. K. Bird (1978) Sum-mary and critique of the thermodynamic properties of rock-forming minerals. Am. J. Sci., 278-A, l-229.
Hemley, J. J. (1959) Some mineralogical equilibria in the systemK2O-AI2O3-SiO2H2O. Am. J. Sci., 257,241-270.
Montoya, J. W. and J. J. Hemley (1975) Activity relations andstabilities in alkali feldspar and mica alteration reactions. Econ.Geol.. 70. 57'7-58f.
Rudert, V, I-M. Chou and H. P. Eugster (1976) Temperature gra-dients in rapid-quench cold-seal pressure vessels. 4n. Mineral.,6 , 1 , l 0 l 2 -1015 .
Shade, J. W. (1968) Hydrolysis Equilibria in the System K2O-AI20j-SiO2-H20. Ph.D. Thesis, The Pennsylvania State Uni-versity, University Park, Pennsylvania.
- (19'14) Hydrolysis reactions in the SiO2-excess portion ofthe system K2O-AI2O3-SiO2-H2O in chloride fluids at mag-matic conditions. Econ. Geol., 69,218-228.
Usdowski, H. E. and H. L. Barnes (1972) Untersuchungen iiberdas Gleichgewicht zwischen K-Feldspat, Quarz und Muskovit
und die Anwendung auf Fragen der Gesteinsbildung bei tiefe-
ren Temperaturcn. Contrib. Mineral. Petrol., 36, 20'7 -219.
Walther, J. V. and H. C. Helgeson (1977) Calculation of the
thermodynamic properties of aqueous silica and the solubility
of quartz and its polymorphs at high pressures and temper-atures. Am. J. Sci., 277, 1315-135 t.
Wintsch, R. P (1975) Muscovite, sanidine, sillimanite, quartz and
H2O equilibria as a function of chloride concentration (abstr.).
EOS, s6,465466.Wood, J. R. (1975) Thermodynamics of brine-salt equilibria-I.
The systems NaCl-KCl-MgCl2-CaCl2-H2O and NaCl-
MgSOaH2O at 25"C. Geochim. Cosmochim. Acta, 39, ll47-l 163
Wright, T L and D. B. Stewart (1968) X-ray and optical study of
alkali feldspar. I. Determination of composition and structural
state from refined unit-cell parameters and 2V. Am. Mineral.,
5J, 38-87.
Manuscript received, September 17, 1979;accepted for publicalion, January 30, 1980.
American Mineralogist, Volume 65, pages 1012-1019, I9E0
Crystallization of mordenite from aqueous solutions
Seronu UEDA, HIRosHI Munarn, MITSUE KoIzuMI
Institute of Scientific and Industrial ResearchOsaka (Jniversity, Yamadakami, Suita, Osaka 565, Japan
AND HIROSHI NISHIMURA
College of General Education, Osaka UnfuersityToyonaka, Osaka 560, Japan
Abstract
Mordenite was formed directly at l00oC, I atm from clear aqueous Na-Al-Si solutionscontaining an extremely small quantity of Al. In seeded and unseeded systems, mordenitecrystals up to 4pm x 21nn with acicular or prismatic habit were grown. They were elongatedalong the c axis of the orthorhombic cell with the prism zone formed predominantly by the(ll0) plane.
In the seeded syitems, rapid crystallization of mordenite occurred because the seed surfaceprovided nucleation sites. Mordenite grew on the seed surfaces, whether or not the morphol-ogy and the composition and structure of the seed differed widely from mordenite. Suchgrowth phenomena were di-flerent from those observed with analcime grown in seed systems.
The chemical composition of mordenite was governed by the initial ratios of soda, alu-miha, and silica in the initial gels and was independent of the depletion of nutrient with reac-tion time.
These results probably can be explained by the crystallization meohanism for analcimeproposed by Ueda and Koizumi (1979).
IntroductionMost zeolites have been synthesized from active al-
kaline aluminosilicate gels consisting of hetero-geneous phases in which amorphous solid and aque-ous solutions coexist. The amorphous materialdecreases as the crystallization of zeolite proceeds,and consequently two solid phases, amorphous solidand crystalline material, coexist with solution untilthe reaction is completed. The crystallization mecha-nism in such heterogeneous phases is complicatedand is not yet fully understood, but both the natureof the nutrient solid gel and the aqueous solutioncontribute directly to the zeolite formation.
Two hypotheses have been proposed for zeolitecrystallization, namely, in the gel phase or from thesolution phase. The former was postulated by Breckand Flanigen (1968), and later by McNicol er a/.(1971, 1972\, and Aiello et al. (l97la,b), and the lat-ter was proposed by Kerr (1966, 1968), and later byCiric (1968), Culfaz and Sand (1973), Cournoyer etal. (1975\, and Ueda and Koizumi (1979).
0003--004x/80/09 r0- 10 1 2$02.00
In 1979 we reported that analcime, hydroxy-sodalite, and zeolite B crystallized from clear aque-ous solutions. [n the present study, the crystallizationof mordenite from a low-Al solution phase in theNarO-AlrOr-SiOr-HrO system was investigated at Iatm.
Barrer (1948) first synthesized mordenite, andthere are many studies of its mineralogy, geology andchemistry: Barrer and White (1952)' Sand et al.(1957,1971), Ames and Sand (1958), Coombs et a/.(1959), Ellis (1960), Ames (1963), Domine and Quo-bex (1968), Sand (1968), Senderov (1968), Kranich etal. (1911), Senderov and Khitarov (1971), Whitte-more (1972), Culfaz and Sand (1973)' and Nakajima(1973). Mordenite syntheses were made under hydro-thermal conditions in various types of high-pressurereaction vessels.
In our experiments, the following problems wereexamined: (l) the effect of added seed crystals on thecrystallization and morphology of synthesized mor-denite, (2) the selectivity of seed materials for morde-
l0 t2
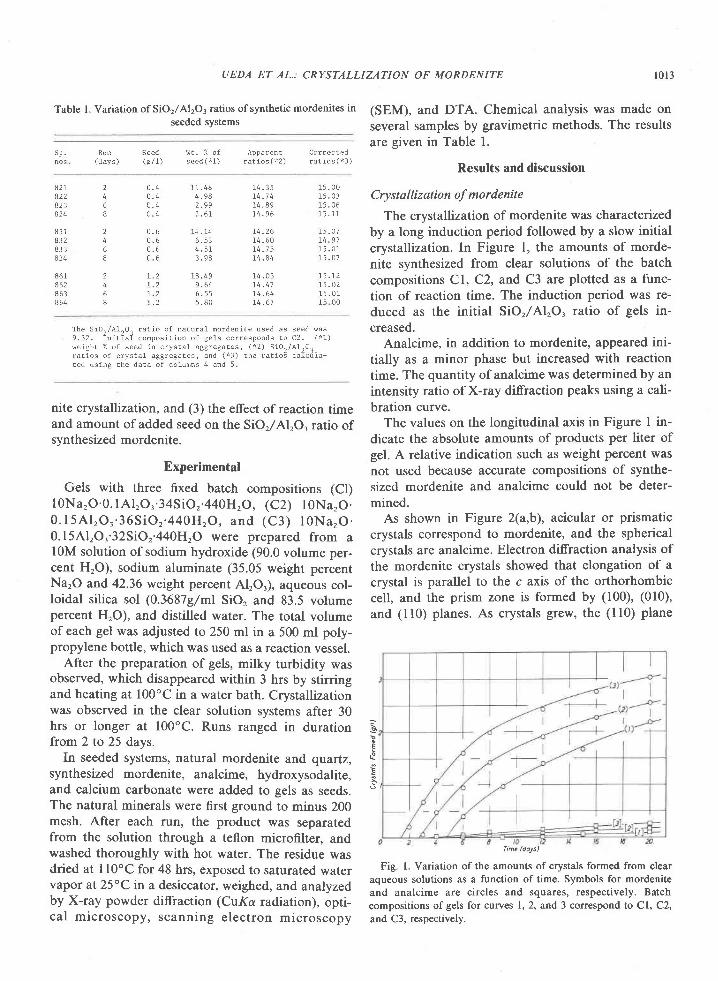
n o s
Table l. Variation of SiO2/Al2O3 ratios of synthetic mordenites in
seeded sYstems
r0 l3
(SEM), and DTA. Chemical analysis was made on
several samples by gravimetric methods. The results
are given in Table l.
Results and discussion
C ry st al liz ation of mordenit e
The crystallization of mordenite was characterizedby a long induction period followed by a slow initialcrystallization. In Figure l, the amounts of morde-
nite synthesized from clear solutions of the batch
compositions Cl, C2, and C3 are plotted as a func-
tion of reaction time. The induction period was re-
duced as the initial SiOr/AlrO3 ratio of gels in-creased.
Analcime, in addition to mordenite, appeared ini-
tially as a minor phase but increased with reaction
time. The quantity of analcime was determined by an
intensity ratio of X-ray diffraction peaks using a cali-bration curve.
The values on the longitudinal axis in Figure I in-
dicate the absolute amounts of products per liter ofgel. A relative indication such as weight percent was
not used because accurate compositions of synthe-sized mordenite and analcime could not be deter-
mined.As shown in Figure 2(a,b), acicular or prismatic
crystals correspond to mordenite, and the sphericalcrystals are analcime. Electron diffraction analysis of
the mordenite crystals showed that elongation of a
crystal is parallel to the c axis of the orthorhombiccell, and the prism zone is formed by (100), (010),
and (ll0) planes. As crystals grew, the (ll0) plane
Fig. l. Variation of the amounts of crystals formed from clearaqueous solutions as a function of time. Symbols for mordenite
and analcime are circles and squares, respectively. Batch
compositions ofgels for curves l, 2, andS conespond to Cl, C2,
and C3, respectively.
Run( d a y s )
S e e d U t . Z o I( g / 1 ) s e e d ( * 1 )
UEDA ET AL: CRYSTALLIZATION OF MORDENITE
A n n r r 6 - f f ^ r r D ? r o A
r a t i o s ( x 2 ) r a t i o s ( * 3 )
246B
2468
2468
8 6 1a 6 28 6 38 6 4
82L822823424
8 3 18328 3 3
0 . 40 . 40 . 40 . 4
0 . 60 , 60 . 60 . 6
1 . 2r . 2t . 2t . 2
1 1 . 4 84 . 9 82 . 9 92 . 6 7
1 1 . 1 46 . 5 34 . 5 13 . 9 8
1 8 . 4 99 . 6 46 . 5 55 . 8 0
1 4 . 3 51 4 . 7 41 4 . 8 91 4 . 9 6
1 4 . 2 61 4 . 6 01 4 . 1 51 4 . 8 4
1 4 . 0 5
t 4 . 6 4L 4 . 6 7
1 5 . 0 0I 5 . 0 31 5 . 0 61 5 . t l
L 5 . 0 7L 4 . 9 11 5 . 0 11 5 . 0 7
1-5 .121 5 . 0 21 5 . 0 115 00
T h e S i 0 r / A 1 1 0 r r a t l o o f n a t u r a l m o r d e n i t e u s e d a s s e e d u a s9 . 1 2 . l n l E i a l c o n p o s i E i o n o f g e l s c o r r e s p o n d s ! o C 2 . ( * 1 )
w e i g ' t ' . o f s e p d i n c r y s t a l a g g r e g a t e s , ( * 2 ) S i o r / A l , O .r a ! i o s o f c r y s t a l a g g r e g a t e s , a n d ( * 3 ) t h e r a t i o ! c a l c i l a -t e d u s i n o t h e d a t a o f c o l u m n s 4 a n d 5 .
nite crystallization, and (3) the effect of reaction timeand amount of added seed on the SiOr/AlrO, ratio ofsynthesized mordenite.
Experimental
Gels with three fixed batch compositions (Cl)l0Na,O.0. lAI ,O3.34SiO,.440H2O, (C2) 1ONa,O.0 . l 5 A l , O 3 ' 3 6 S i O , ' 4 4 0 H , O , a n d ( C 3 ) l 0 N a , O .0.l5AlrO3'32SiOr'440HrO were prepared from alOM solution of sodium hydroxide (90.0 volume per-cent H.O), sodium aluminate (35.05 weight percentNa,O and 42.36 weight percent AlrO3), aqueous col-loidal silica sol (0.3687g/ml SiO, and 83.5 volumepercent HrO), and distilled water. The total volurneof each gel was adjusted to 250 ml in a 500 mt poly-propylene bottle, which was used as a reaction vessel.
After the preparation of gels, milky turbidity wasobserved, which disappeared within 3 hrs by stirringand heating at 100'C in a water bath. Crystallizationwas observed in the clear solution systems after 30hrs or longer at 100"C. Runs ranged in durationfrom 2 to 25 days.
In seeded systems, natural mordenite and quartz,synthesized mordenite, analcime, hydroxysodalite,and calcium carbonate were added to gels as seeds.The natural minerals were first ground to minus 200mesh. After each run, the product was separatedfrom the solution through a teflon microfilter, andwashed thoroughly with hot water. The residue wasdried at ll0oc for 48 hrs, exposed to saturated watervapor at 25'C in a desiccator, weighed, and analyzedby X-ray powder diffraction (CurKa radiation), opti-ca l microscopy, scanning e lect ron microscopy
E
,9
!5
fine (doys)
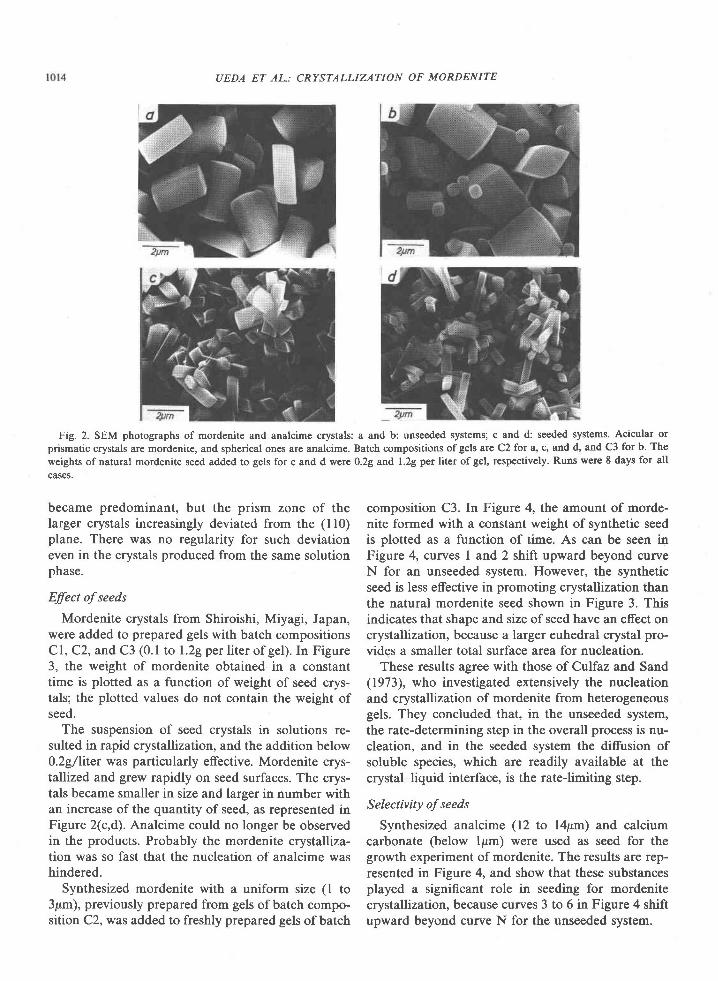
UEDA ET AL,: CRYSTALLIZATION OF MORDENITE
Fig. 2. SEM photographs of mordenite and analcime crystals: a and b: uns€eded systems; c and d: seeded systems. Acicular or
prismatic crystals are mordenite, and spherical ones are analcime. Batch compositions of gels are C2 for a, c, and d, and C3 for b' The
weights ofnatural mordenite seed added to gels for c and d were 0.2g and l.2g per liter ofgel, respectively. Runs were 8 days for all
cases.
became predominant, but the prism zone of thelarger crystals increasingly deviated from the (l l0)plane. There was no regularity for such deviationeven in the crystals produced from the same solutionphase.
Effect of seeds
Mordenite orystals from Shiroishi, Miyagi, Japan,were added to prepared gels with batch compositionsCl, C2, and C3 (0.1 to l.2gper liter of gel). In Figure3, the weight of mordenite obtained,in a constanttime is plotted as a function of weight of seed crys-tals; the plotted values do not contain the weight ofseed.
The suspension of seed crystals in solutions re-sulted in rapid crystallization, and the addition belowO.2g/liter was particularly effective. Mordenite crys-tallized and grew rapidly on seed surfaces. The crys-tals became smaller in size and larger in number withan increase of the quantity of seed, as represented inFigure 2(cd). Analcime could no longer be observedin the products. Probably the mordenite crystalliza-tion was so fast that the nucleation of analcime washindered.
Synthesized mordenite with a uniform size (l to3prm), previously prepared from gels of batch compo-sition C2, was added to freshly prepared gels of batch
composition C3. In Figure 4, the amount of morde-nite formed with a constant weight of synthetic seedis plotted as a function of time. As can be seen inFigure 4, curves I and 2 shift upward beyond curveN for an unseeded system. However, the syntheticseed is less effective in promoting crystallization thanthe natural mordenite seed shown in Figure 3. Thisindicates that shape and size of seed have an effect oncrystallization, because a larger euhedral crystal pro-vides a smaller total surface area for nucleation.
These results agree with those of Culfaz and Sand(1973), who investigated extensively the nucleationand crystallization of mordenite from heterogeneousgels. They concluded that, in the unseeded system,the rate-determining step in the overall process is nu-cleation, and in the seeded system the diffusion ofsoluble species, which are readily available at thecrystal-liquid interface, is the rateJimiting step.
Selectivity of seeds
Synthesized analcime (12 to l4pm) and calciumcarbonate (below lpm) were used as seed for thegrowth experiment of mordenite. The results are rep-resented in Figure 4, and show that these substancesplayed a significant role in seeding for mordenitecrystallization, because curves 3 to 6 in Figure 4 shiftupward beyond curve N for the unseeded system.
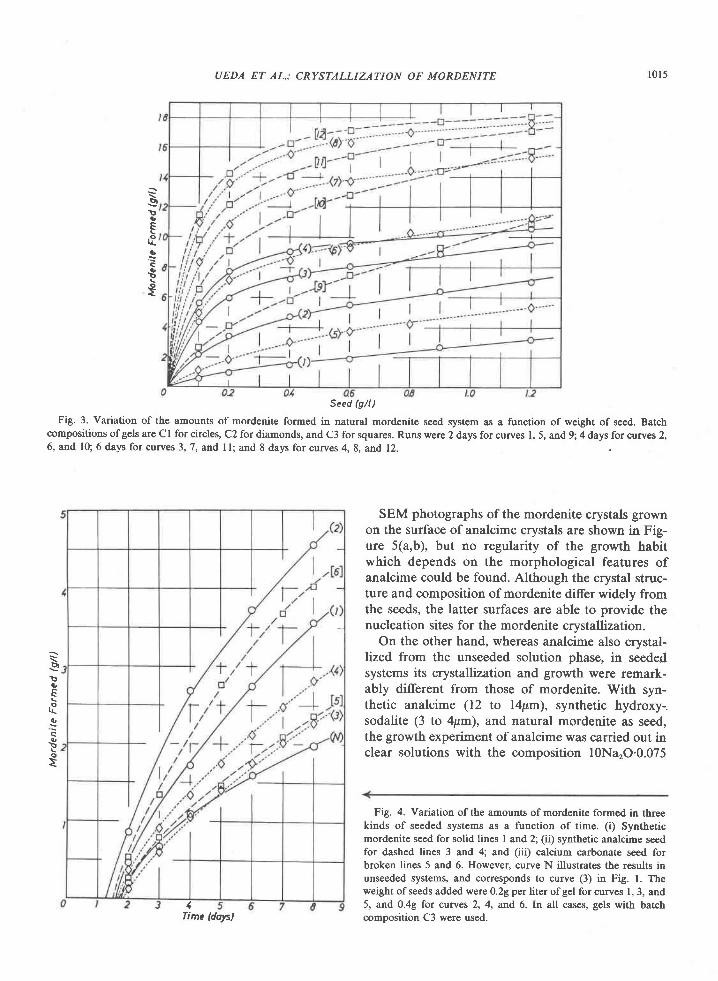
UEDA ET AL; CRYSTALLIZATION OF MORDENITE l0 l5
Seed (g/l)
Fig. 3. Variation of the amounts of mordenite formed in natural mordenite seed system as a function of weight of seed. Batchcompositions ofgels are Cl for circles, C2 for diamonds, and C3 for squares. Runs were 2 days for curves l, 5, and 9;4 days for curves 2,6, and l0; 6 days for curves 3, 7, and 1l; and 8 days for curves 4,8, and 12.
SEM photographs of the mordenite crystals grownon the surface of analcime crystals are shown in Fig-ure 5(a,b), but no regularity of the growth habitwhich depends on the morphological features ofanalcime could be found. Although the crystal struc-ture and composition of mordenite differ widely fromthe seeds, the latter surfaces are able to provide thenucleation sites for the mordenite crystallization.
On the other hand, whereas analcime also crystal-lized from the unseeded solution phase, in seededsystems its crystallization and growth were remark-ably different from those of mordenite. With syn-thetic analcime (12 to l4pm), synthetic hydroxy-,sodalite (3 to 4pm), and natural mordenite as seed,the growth experiment of analcime was carried out inclear solutions with the composition l0NarO.0.075
Fig. 4. Variation of the amounts of mordenite formed in threekinds of seeded systems as a function of time. (i) Syntheticmordenite seed for solid lines I and 2; (ii) synthetic analcime seedfor dashed lines 3 and 4; and (iii) calciurn carbonate seed forbroken lines 5 and 6. Howeveq curve N illustrates the results inunseeded systems, and corresponds to curve (3) in Fig. l. Theweight ofseeds added were 0.2g per liter ofgel for curves l, 3, and5, and 0.4g for curves 2, 4, and 6. In all cases, gels with batchcomposition C3 were used.
S!3s
.o(ic
ts
!oE
,tgc*f
1fime(dopl
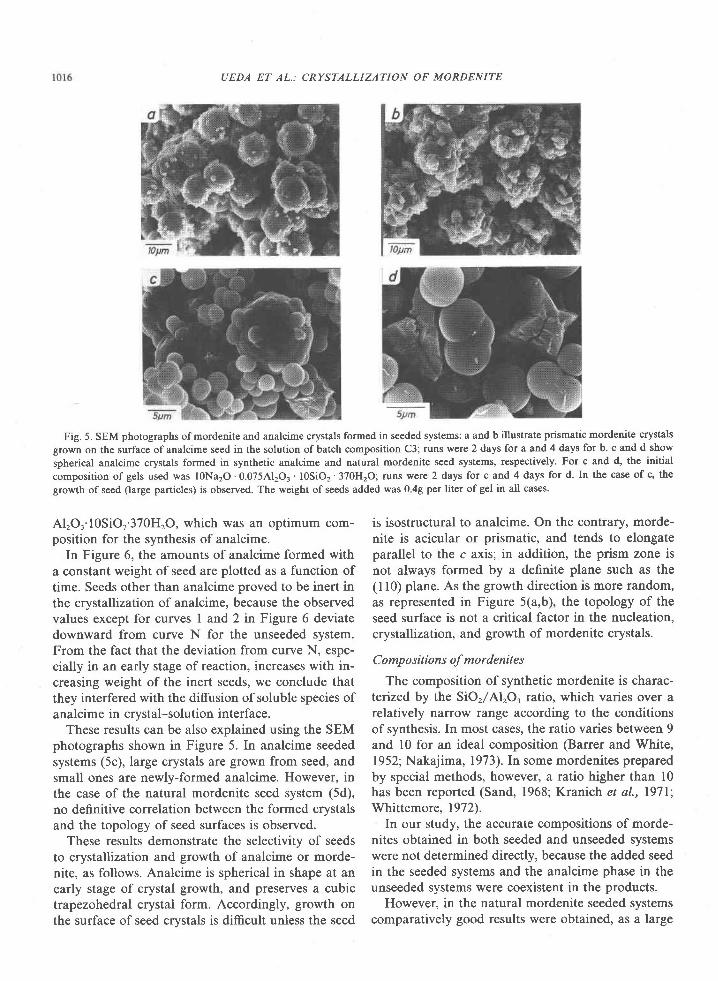
UEDA ET AL.: CRYSTALLIZATION OF MORDENITE
Fig. 5. SEM photographs of mordenite and analcime crystals formed in seeded systems: a and b illustrate prismatic mordenite crystals
gtown on the surface of analcime seed in the solution of batch composition C3; runs were 2 days for a and 4 days for b' c and d show
spherical analcime crystals formed in synthetic analcime and natural mordenite seed systems, respectively. For c and d, the initial
composition of gels used was lONa2O . 0.075A12Or . lOSiO2 . 370HzO; rurN were 2 days for c and 4 days for d. In the case of c, the
growth of seed (large particles) is observed. The weight of seeds added was 0 49 per liter of gel in all cases.
AlrO3'l0SiO;370}{20, which was an optimum com-position for the synthesis of analcime.
In Figure 6, the amounts of analcime formed witha constant weight of seed are plotted as a function oftime. Seeds other than analcime proved to be inert inthe crystallization of analcime, because the observedvalues except for curves I and 2 in Figure 6 deviatedownward from curve N for the unseeded system.From the fact that the deviation from curve N, espe-cially in an early stage of reaction, increases with in-creasing weight of the inert seeds, we conclude thatthey interfered with the diffusion of soluble species ofanalcime in crystal-solution interface.
These results can be also explained using the SEMphotographs shown in Figure 5. In analcime seededsystems (5c), large crystals are grown from seed, andsmall ones are newly-formed analcime. However, inthe case of the natural mordenite seed system (5d),no definitive correlation between the formed crystalsand the topology of seed surfaces is observed.
These results demonstrate the selectivity of seedsto crystallization and growth of analcime or morde-nite, as follows. Analcime is spherical in shape at anearly stage of crystal growth, and preserves a cubictrapezohedral crystal form. Accordingly, growth onthe surface of seed crystals is difficult unless the seed
is isostructural to analcime. On the contrary, morde-nite is acicular or prismatic, and tends to elongateparallel to the c axis; in addition, the prism zone isnot always formed by a definite plane such as the(l l0) plane. As the growth direction is more random,as represented in Figure 5(a,b), the topology of theseed surface is not a critical factor in the nucleation,crystallization, and growth of mordenite crystals.
Comp ositions of mordenites
The composition of synthetic mordenite is charac-terized by the SiO,/AlrO3 ratio, which varies over arelatively narrow range according to the conditionsof synthesis. In most cases, the ratio varies between 9and l0 for an ideal composition (Barrer and White,1952; Nakajima, 1973). [n some mordenites preparedby special methods, however, a ratio higher than l0has been reported (Sand, 1968; Kranich et al., l97l;Whittemore, 1972).
In our study, the accurate compositions of morde-nites obtained in both seeded and unseeded systemswere not determined directly, because the added seedin the seeded systems and the analcime phase in theunseeded systems were coexistent in the products.
However, in the natural mordenite seeded systemscomparatively good results were obtained, as a large
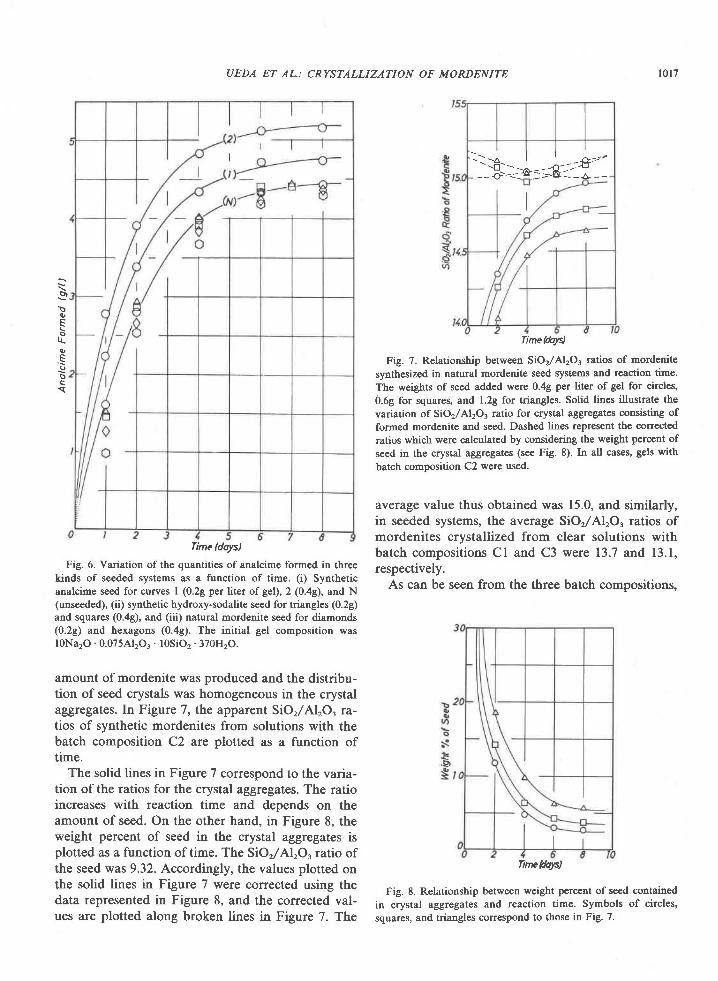
UEDA ET AL.: CRYSTALLIZATION OF MORDENITE l0 l7
E'b
e,Eo
lJ-(,dbc
Time Hoys)Fig. 6. Variation of the quantities of analcime formed in three
kinds of se€ded systems as a function of time. (i) Syntheticanalcime seed for curves I (0.2g pcr liter of gel), 2 (0.4g), and N(unseeded), (ii) synthetic hydroxy-sodalite seed for triangles (0.2g)and squares (0.4g), and (iii) natural mordenite seed for diamonds(0.2g) and hexagons (0.4g). The initial gel composition waslONarO. 0.075AJ203 . lOSiO2. 370H2O.
amount of mordenite was produced and the distribu-tion of seed crystals was homogeneous in the crystalaggregates. In Figure 7, the apparent SiOr/AlrO, ra-tios of synthetic mordenites from solutions with thebatch composition C2 arc plotted as a function oftime.
The solid lines in Figure 7 correspond to the varia-tion of the ratios for the crystal aggregates. The ratioincreases with reaction time and depends on theamount of seed. On the other hand, in Figure 8, theweight percent of seed in the crystal aggregates isplotted as a function of time. The SiOr/AlrO. ratio ofthe seed was 9.32. Accordingly, the values plotted onthe solid lines in Figure 7 were corrected using thedata represented in Figure 8, and the corrected val-ues are plotted along broken lines in Figure 7. The
Time(&y)
Fig. 7. Relationship between SiOz/Al2O3 ratios of mordcnitesynthesized in natural mordenite seed systems and reaction time.The weights of seed added were 0.49 per liter of gel for circles,0.69 for squares, and l.2g for triangles. Solid lines illustratc thevariation of SiOz/AlzO: ratio for crystal aggregates consisting offormed mordenite and seed. Dashed Iines represent the correctcdratios which were calculated by considering the weight percent ofseed in the crystal aggregates (see Fig. 8). In all cases, gels withbatch composition C2 were used.
average value thus obtained was 15.0, and similarly,in seeded systems, the average SiOr/AlrO3 ratios ofmordenites crystallized from clear solutions withbatch compositions Cl and C3 were 13.7 and 13.1,respectively.
As can be seen from the three batch compositions,
Fig. 8. Relationship between weight percent of seed contained
in crystal aggregat€s and reaction time. Symbols of circles,
squares, and triangles correspond to those in Fig. 7.
l - - ^ | | f t - ; '
-l€:-::*: -${aa.--
fineHols)
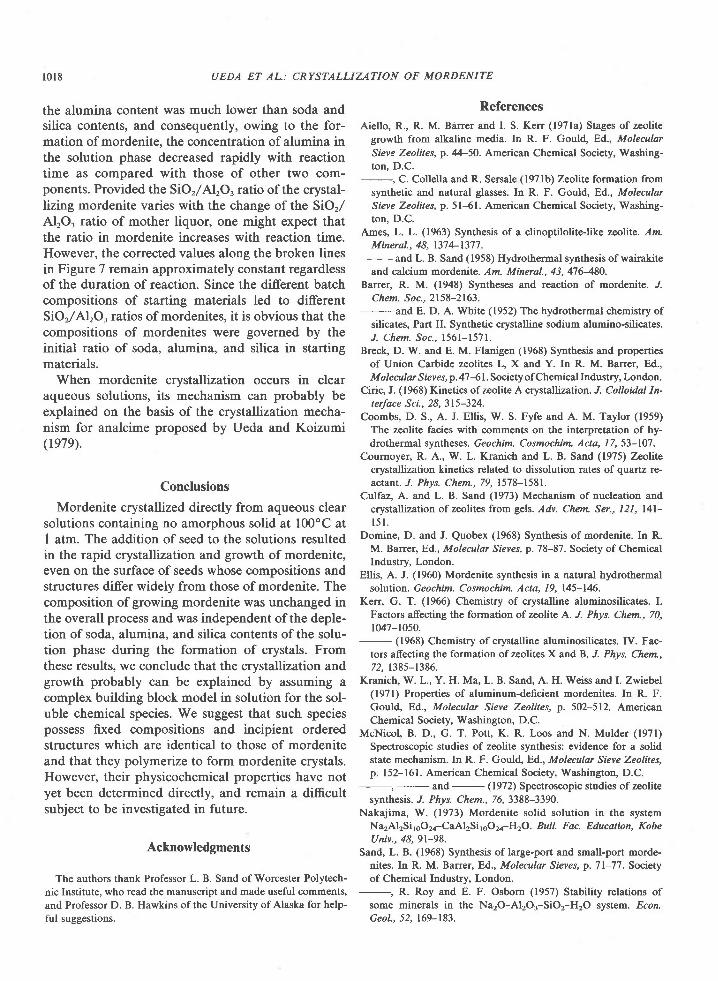
l 0 l8
the alumina content was much lower than soda andsilica contents, and consequently, owing to the for-mation of mordenite, the concentration of alumina inthe solution phase decreased rapidly with reactiontime as compared with those of other two com-ponents. Provided the SiOr/AlrO, ratio of the crystal-lizing mordenite varies with the change of the SiOr/AlrO, ratio of mother liquor, one might expect thatthe ratio in mordenite increases with reaction time.However, the corrected values along the broken linesin Figure 7 remain approximately constant regardlessof the duration of reaction. Since the different batchcompositions of starting materials led to differentSiOr/AlrO, ratios of mordenites, it is obvious that thecompositions of mordenites were governed by theinitial ratio of soda, alumina, and silica in startingmaterials.
When mordenite crystallization occurs in clearaqueous solutions, its mechanism can probably beexplained on the basis of the crystallization mecha-nism for analcime proposed by Ueda and Koizumi(re7e).
Conclusions
Mordenite crystallized directly from aqueous clearsolutions containing no amorphous solid at 100"C at1 atm. The addition of seed to the solutions resultedin the rapid crystallization and growth of mordenite,even on the surface of seeds whose compositions andstructures differ widely from those of mordenite. Thecomposition of growing mordenite was unchanged inthe overall process and was independent ofthe deple-tion of soda, alumina, and silica contents of the solu-tion phase during the formation of crystals. Fromthese results, we conclude that the crystallization andgrowth probably can be explained by assuming acomplex building block model in solution for the sol-uble chemical species. We suggest that such speciespossess fixed compositions and incipient orderedstructures which are identical to those of mordeniteand that they polymeize to form mordenite crystals.However, their physicochemical properties have notyet been determined directly, and remain a difficultsubject to be investigated in future.
Acknowledgments
The authors thank Professor L. B. Sand of Worcester Polytech-
nic Institute, who read the manuscript and made us€ful comments,
and Professor D. B. Hawkins of the University of Alaska for help-
ful suggestions.
UEDA ET AL.: CRYSTALLIZATION OF MORDENITE
References
Aiello, R., R. M. Barrer and L S. Kerr (l97la) Stages of zeolite
growth from alkaline media. In R. F. Gould, Ed., Molecular
Sieve Zeolites, p. 44-50. American Chemical Society, Washing-ton. D.C.
synthetic and natural glasses. In R. F. Gould, Ed., MolecularSieve Zeolites, p. 5l-61. American Chemical Society, Washing-
ton, D.C.Ames, L. L. (1963) Synthesis of a clinoptilolite-like z.eolite. Am.
Mineral., 48, I37 4-137'1.- and L. B. Sand (1958) Hydrothermal synthesis of wairakite
and calcium mordenite. Am. Mineral., 43,476480.Barrer, R. M. (1948) Syntheses and reaction of mordenite. .L
Chem. Soc.,2158-2163.- and E. D. A. White (1952) The hydrothermal chemistry of
silicates, Part II. Synthetic crystalline sodium alumino-silicates.
J. Chem. Soc. , l56l -1571.Breck, D. W. and E. M. Flanigen (1968) Synthesis and properties
of Union Carbide zeolites L, X and Y. In R. M. Barrer, Ed.,M olecalar Sieves,p. 47-6 l. Society of Chernical Industry, London.
Ciric, J. (1968) Kinetics ofzeolite A crystallization. J. Colloidal In-terface Sci., 28, 315-324.
Coombs, D. S., A. J. Ellis, W. S. Fyfe and A. M. Taylor (1959)The zeolite facies with comments on the interpretation of hy-
drothermal syntheses. Geochim. Cosmochim. Acta, I 7, 53- 107.Cournoyer, R. A., W. L. Kranich and L. B. Sand (1975) Zeolite
crystallization kinetics related to dissolution rates of quartz re-actant.,f. Phys. Chem., 79, 1578-158I.
Culfaz, A. and L. B. Sand (1973) Mechanism of nucleation andcrystallization of zeolites from gels. Adv. Chem. Ser., 121, I4l-l 5 l .
Domine, D. and J. Quobex (1968) Synthesis of mordenite. In R.M. Barrer, Ed., Molecular Sieves, p.78-87. Society of ChemicalIndustry, London.
Ellis, A. J. (1960) Mordenite synth€sis in a natural hydrothermalsolution. Geochim. Cosmochim. Acta, 19, 145-L4f..
Kerr, G. T. (1966) Chemistry of crystalline aluminosilicates. I.Factors affecting the formation of zeolite A. J. Phys. Chem., 70,1047-1050.
- (1968) Chemistry of crystalline aluminosilicates. IV. Fac-tors affecting the formation of zeolites X and B. J. Phys. Chem.,72, r385-t386.
Kranich, W. L., Y. H. Ma, L. B. Sand, A. H. Weiss and I. Zwiebel(1971) Properties of aluminum-deficient mordenites. In R. F.Gould, Ed., Molecular Sieve Zeolites, p. 5O2-512. AmericanChemical Society, Washington, D.C.
McNicol, B. D., G. T. Pott, K. R. Loos and N. Mulder (1971)
Spectroscopic studies of zeolite synthesis: evidence for a solidstate mechanism. In R. F. Gould, Ed., Molecalar Sieve Zeolites,p. 152-161. American Chemical Society, Washington, D.C.
synthesis. J. Phys. Chem., 76, 3388-3390.Nakajima, W. (1973) Mordenite solid solution in the system
Na2Al2Si 16O2a-CaAI2Sit6O2o-H 20. Bull. Fac. Education, KobeUniv., 48,9l-98.
Sand, L. B. (1968) Synthesis oflarge-port and small-port morde-nites. In R. M. Barrer, Ed., Molecular Sreleg p. 7l-77. Societyof Chemical Industry, London.
some minerals in the Na2O-AI2O3-SiO2-H2O system. .Econ.Geol., 52, 169-183.
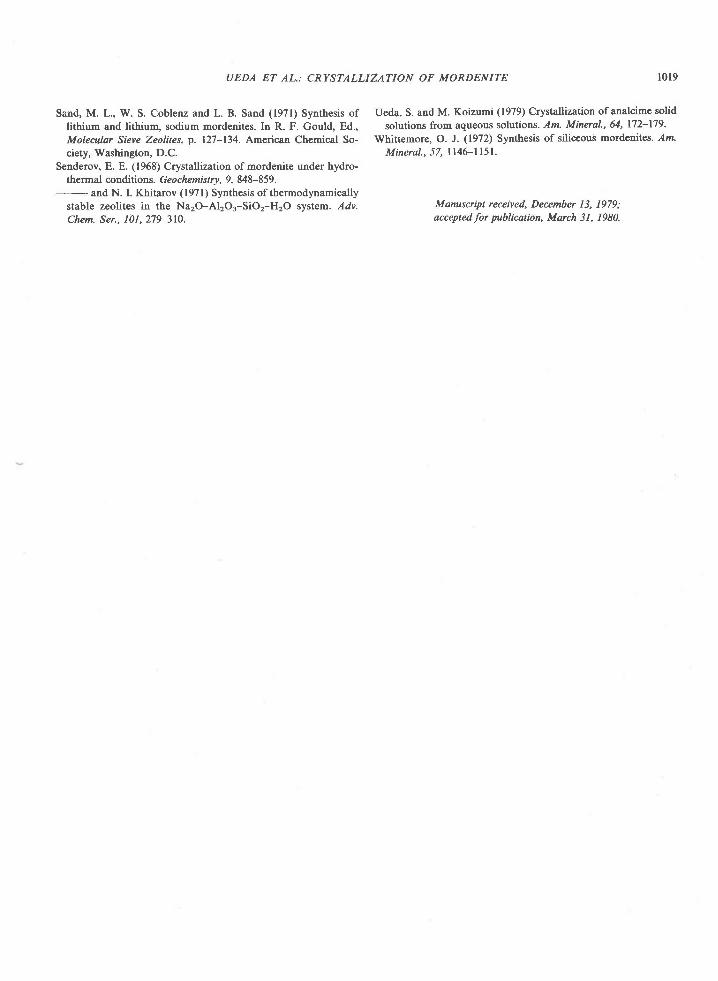
UEDA ET AL.: CRYSTALLIZATION OF MORDENITE l0l9
Sand, M. L., W. S. Coblenz and L. B. Sand (1971) Synthesis of Ueda, S. and M. Koizumi (1979) Crystallization of analcime solid
lithium and lithium. sodium mordenites. In R. F. Gould. Ed., solutions from aqueous solutions. Am. Mineral.,64, 172-179.
Molecalar Sieve Zeolites, p. 127-134. American Chemical So- Whittemore, O. J. (1972) Synthesis of siliceouS mordenites. lrn.
ciety, Washington, D.C. Mineral., 57, 1146-115l.Senderov, E. E. (1968) Crystallization of mordenite under hydro-
thermal conditions. Geochemistry, 9, 848-859.- and N. I. Klitarov (1971) Synthesis of thermodynamically
stable zeolites in the Na2O-AI2O3-SiO2-H2O system. ldv. Manusciipt received, December 13, 1979;Chem. Ser., I0l,2j9_31O. accepted for publication, March 31, 1980.
American Mineralogist, Yolume 65, pages 1020-1025, 1980
Uranium- and thorium-rich vesuvianite from the Seward Peninsula, Alaska
GIBN R. Hnrauelnnnc
U. S. Geological SurveyDepartment of Geology, University of Missouri
Columbia. Missouri 652I I
nNo TnouAS P. MILLER
U. S. Geological Sumey1209 Orca Street
Anchorage, Alaska 99 50 l
Abstract
Vesuvianite rich in U, Th, and REE occurs in a syenite and nepheline syenite in south-eastern Seward Peninsula, Alaska. The vesuvianite occurs as large (up to 1.5 cm) tabularcrystals; in thin section it is brownish-yellow and commonly zoned with an isotropic (meta-mict) core and an anisotropic (non-metamict) rim. The chemical composition can be approxi-mated by the formula (Ca,Na,La,Ce,Pr,Nd,U,Th)re r(Al,Ti,Fe,Mn,Mg)t2 rSi,6(O,OH,F)t6.UO, content ranges from 0.39 (non-metamict) to 0.84 weight perc€nt (metamict), and ThOtranges from 0.72 (non-metamict) to 2.70 weight percent. Coexisting allanite has UO, andThO2 contents that range from 0.29 to 0.40 and 0.77 to 1.30 weight percents, respectively. Thevesuvianite probably formed by metasomatic activity prior to intrusion of subsilicic alkalinedikes.
Introduction
Vesuvianite occurs in a variety of environnents,principally in metamorphosed limestone but also inveins associated with mafic and ultramafic rocks andin nepheline syenite and other alkalic rocks. Inoueand Miyashiro (1951) have shown that compositionalvariations ofvesuvianite are related to its occurrence.The mineral generally does not contain appreciableamounts of uranium and thorium nor is it metamict.To our knowledge, the only previously-reported oc-currence of U- and Th-rich vesuvianite containedl.@ weight percent UrO. and 0.53 weight percentThO, and occurred in a nepheline syenite in theUSSR (Kononova, 1960). We report a recent findingof a U- and Th-rich metamict vesuvianite in syeniteand nepheline syenite from the southeastern SewardPeninsula, Alaska (Fig. l). The mineral was earlierreported to be allanite (Miller et al.,1916), but moredetailed study has shown that it is vesuvianite; 1o-cally, allanite is abundant and in hand specimen isindistinguishable from vesuvianite. The identifica-tion of vesuvianite is based on optical properties,
m03-004x/80/09 I 0- I 020$02.00
chemical composition, and the powder X-ray difrac-tion pattern of a heated sample.
Geologic setting and petrography
The vesuvianite-bearing syenite occurs in the cen-ter of the Kachauik pluton, which is a large com-posite body of monzonite, syenite, and granodioriteof mid-Cretaceous age (Miller and Bunker, 1976).The pluton occupies an upland region west of theDarby Mountains and has an outcrop area of about530 km'z. A N40oE-trending alkaline dike swannconsisting of pulaskite and pseudoleucite porphyrycuts much of the north half of the pluton.
Vesuvianite occurs in syenite boulders scatteredalong a ridge crest over an area approximately 1.3 by0.4 km in the north-central part of the Kachauik plu-ton (Fig. l). Extensive frost action has reduced mostoutcrops to rubble and talus. Due to the absence ofoutcrop, the relation of the vesuvianite-bearing sye-nite to the remaining syeqite and monzonite of thepluton is uncertain. Vesuvianite-bearing syenite oc-curs as discrete boulders, although thin-section studyindicates some gradation into adjacent vesuvianite-
1020
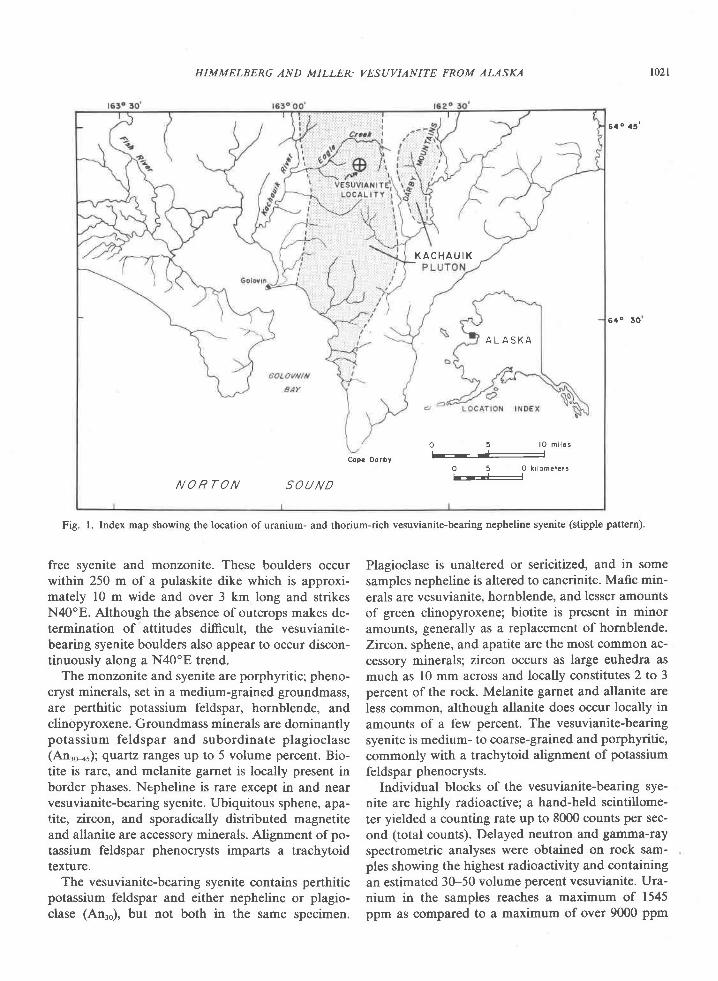
free syenite and monzonite. These boulders occurwithin 250 m of a pulaskite dike which is approxi-mately l0 m wide and over 3 km long and strikesN40oE. Although the absence of outcrops makes de-termination of attitudes difficult, the vesuvianite-bearing syenite boulders also appear to occur discon-tinuously along a N40'E trend.
The monzonite and syenite are porphyritic; pheno-cryst minerals, set in a medium-grained groundmass,are perthitic potassium feldspar, hornblende, andclinopyroxene. Groundmass minerals are dominantlypotassium feldspar and subordinate plagioclase(An.o"r); quartz ranges up to 5 volume percent. Bio-tite is rare, and melanite garnet is locally present inborder phases. Nepheline is rare except in and nearvesuvianite-bearing syenite. Ubiquitous sphene, apa-tite, zircon, and sporadically distributed magnetiteand allanite are accessory minerals. Alignment of po-tassium feldspar phenocrysts imparts a trachytoidtexture.
The vesuvianite-bearing syenite contains perthiticpotassium feldspar and either nepheline or plagio-clase (Anro), but not both in the same specimen.
102 I
Plagioclase is unaltered or sericitized, and in somesamples nepheline is altered to cancrinite. Mafic min-
erals are vesuvianite, hornblende, and lesser amountsof green clinopyroxene; biotite is present in minoramounts, generally as a replacement of hornblende.Zircon, sphene, and apatite are the most common ac-cessory minerals; zircon occurs as large euhedra asmuch as l0 mm across and locally constitutes 2 to 3percent of the rock. Melanite garnet and allanite areless common, although allanite does occur locally in
amounts of a few percent. The vesuvianite-bearingsyenite is medium- to coarse-grained and porphyritic,
commonly with a trachytoid alignment of potassium
feldspar phenocrysts.Individual blocks of the vesuvianite-bearing sye-
nite are highly radioactive; a hand-held scintillome-ter yielded a counting rate up to 8000 counts per sec-
ond (total counts). Delayed neutron and gamma-ray
spectrometric analyses were obtained on rock sam-ples showing the highest radioactivity and containingan estimated 30-50 volume percent vesuvianite. Ura-nium in the samples reaches a maximum of 1545ppm as compared to a maximum of over 9000 ppm
HIMMELBERG AND MILLER: VESUVIANITE FROM ALASKA
6a o 45 '
6 4 0 3 0
Fig. l. Index map showing the location of uranium- and thorium-rich vesuvianite-bearing nepheline syenite (stipple pattern).
KACHAU I K
Copc Do.by
SOU ND
O 5 l o m i l o st---J--l
O 5 l O k r l o m e t e r s
N O R T O N
A L A S K A
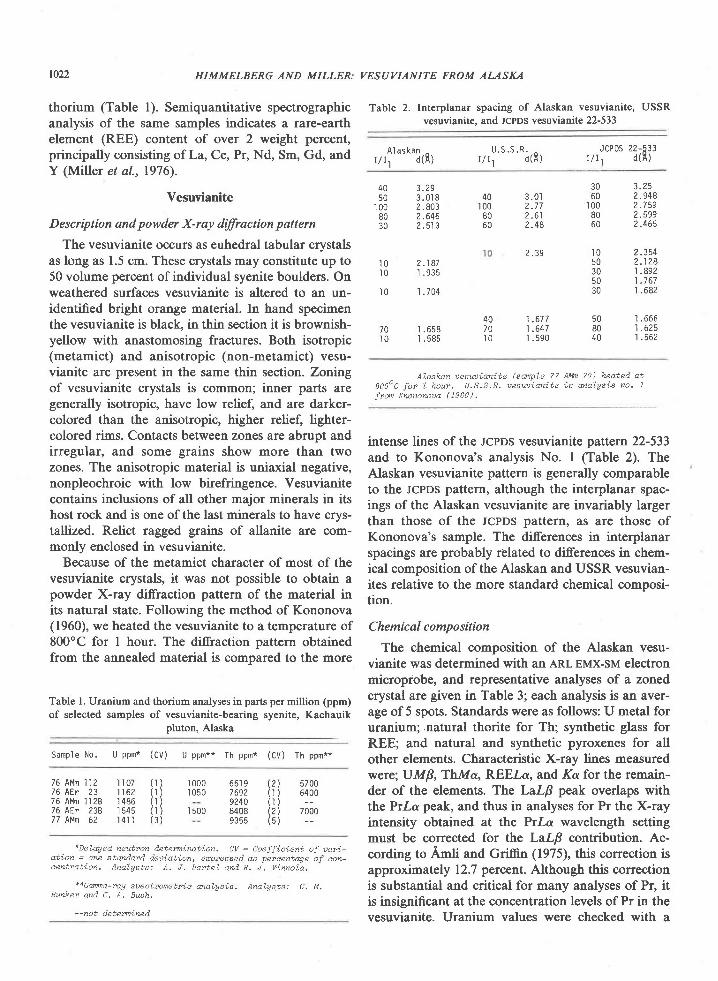
to22 HIMMELBERG AND MILLER:
thorium (Table l). Semiquantitative spectrographicanalysis of the same samples indicates a rare-earthelement (REE) content of over 2 weight percent,principally consisting of La, Ce, Pr, Nd, Sm, Gd, andY (Miller et al.,1976).
Vesuvianite
Description and powder X-ray dffiaction pattern
The vesuvianite occurs as euhedral tabular crystalsas long as 1.5 cm. These crystals may constitute up to50 volume percent of individual syenite boulders. Onweathered surfaces vesuvianite is altered to an un-identified bright orange material. In hand specimenthe vesuvianite is black. in thin section it is brownish-yellow with anastomosing fractures. Both isotropic(metamict) and anisotropic (non-metamict) vesu-vianite are present in the same thin section. Zoningof vesuvianite crystals is common; inner parts aregenerally isotropic, have low relief, and are darker-colored than the anisotropic, higher relief, lighter-colored rims. Contacts between zones are abrupt andirregular, and some grains show more than twozones. The anisotropic material is uniaxial negative,nonpleochroic with low birefringence. Vesuvianitecontains inclusions of all other major minerals in itshost rock and is one of the last minerals to have crys-1s,l1iz.ed. Relict ragged grains of allanite are com-monly enclosed in vesuvianite.
Because of the metamict character of most of thevesuvianite crystals, it was not possible to obtain apowder X-ray diffraction pattern of the material inits natural state. Following the method of Kononova(1960), we heated the vesuvianite to a temperature of800oC for I hour. The diffraction pattern obtainedfrom the annealed material is compared to the more
Table l. Uranium and thorium analyses in parts per million (ppm)of selected samples of vesuvianite-bearing syenite, Kachauik
pluton, Alaska
Sample No. U ppm* (CV) U ppm** Th ppm* (CV) Th ppm**
VESUVIANITE FROM ALASKA
Table 2. Interplanar spacing of Alaskan vesuvianite, USSR
vesuvianite, and rcpos vesuvianite 22-533
A l askan ̂t / t 1 d ( H )
u . s . s . R . ^t / r l d ( H )
JCP0S 22-533r l r t d ( [ )
4050'100
8030
' t 0
l 0
1 0
3 . 2 93 . 0 1 82 .803? .6462 . 5 1 3
2 .187'1 .935
r . 704
70 ' l . 658
t 0 ' l . 5 8 5
4 0 1 . 6 7 77 0 1 . 6 4 7l 0 1 . 5 9 0
3 . 2 52 .9482 .7592.599Z . C O J
2 .3542 . 1 2 81 .8921 . 7 6 7'I
.682
5 0 1 . 6 6 680 1 .6254 0 ] . 5 6 2
401 0 08060
3 . 0 ]2 . 7 72 . 6 12 . 4 8
2 . 3 9
3060
1 0 08060
l 050305030
661 97692924084089355
76 AMm 1 1276 AEr 2376 Al '1m 1l2876 AEr 23877 Al4n 62
(2 ) 57oo(1 ) 6400( r )(2 ) Tooo( 5 )
*Delaged neutron detemination. CV = Coefficient of uari-at'Lon = one stmdard deoiation, erpressed as percentage of eon-centration. AnalAslts: A. J, Bartel qnd R. J, Vinnola.
t"Gmma-!al:/ spectrcnetric malgsie. Analysts: C. M.Bunker qnd C. A. Bwh.
--not detemined
r 1 o 7 ( r )| 6 2 ( r )r486 ( r )' r 545 (r )r 4 r ' l ( 3 )
I 000' t050
'I 500
Alaskan uesuuianite (smple 77 AIhn 70) heqted at800oc 7or L hour . U .S.S.R. uesuuLan i te i s ma lys is no . 1
frm Knonorcua (1960).
intense lines of the JcPDs vesuvianite pattern 22-533and to Kononova's analysis No. I (Table 2). TheAlaskan vesuvianite pattern is generally comparableto the JcPDs pattern, although the interplanar spac-ings of the Alaskan vesuvianite are invariably largerthan those of the JCPDS pattern, as are those ofKononova's sample. The di.fferences in interplanarspacings are probably related to differences in chem-ical composition of the Alaskan and USSR vesuvian-ites relative to the more standard chemical composi-tion.
Chemical composition
The chemical composition of the Alaskan vesu-vianite was determined with an ARL EMx-sM electronmicroprobe, and representative analyses of a zonedcrystal are given in Table 3; each analysis is an aver-age of 5 spots. Standards were as follows: U metal foruranium; .natural thorite for Th; synthetic glass forREE; and natural and synthetic pyroxenes for allother elements. Characteristic X-ray lines measuredwere;UMB,TltMa, REEZa, and Ka for the remain-der of the elements. The LaLB peak overlaps withtbLe PrLa peak, and thus in analyses for Pr the X-rayintensity obtained at the PrZc wavelength settingmust be corrected for the LaLB c,ontibution. Ac-cording to Amli and Grifrn (1975), this correction isapproximately 12.7 percent. Although this correctionis substantial and critical for many analyses of Pr, itis insignifislnt at the concentration levels of Pr in thevesuvianite. Uranium values were checked with a
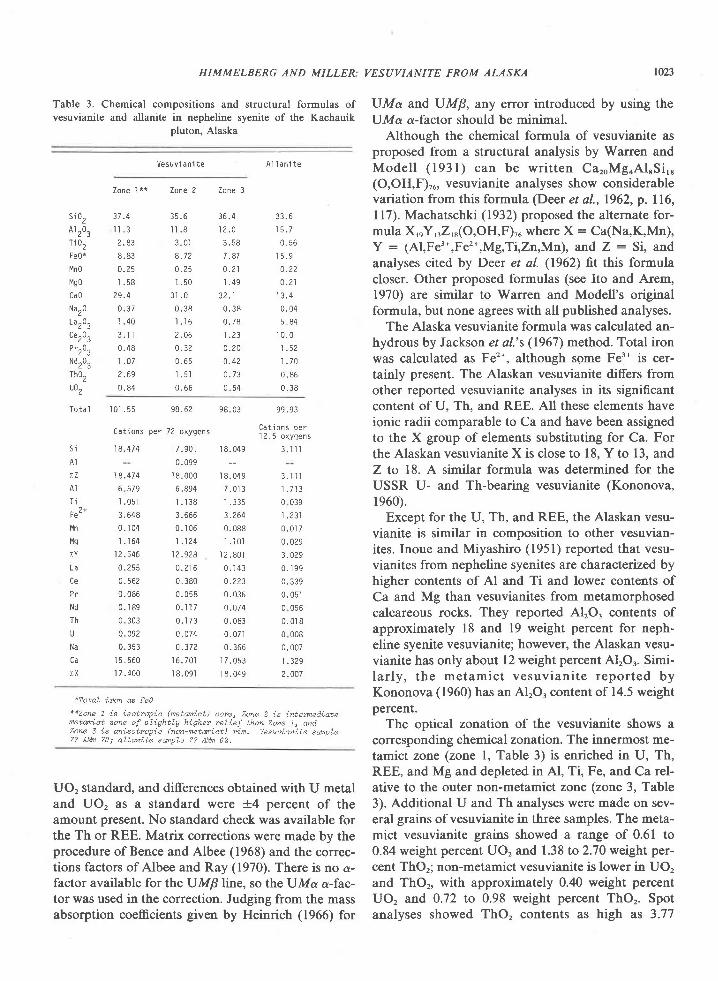
HIMMELBERG AND MILLER:
Table 3. Chemical compositions and structural formulas ofvesuvianite and allanite in nepheline syenite of the Kachauik
pluton, Alaska
Vesuv i an i te A l l a n i t e
VESUVIANITE FROM ALASKA t023
UMa and UMB, any error introduced by using theUMa a-factor should be minimal.
Although the chemical formula of vesuvianite asproposed from a structural analysis by Warren andModel l (1931) can be wr i t ten CaroMgoAl .Si , ,(O,OH,F)r6, vesuvianite analyses show considerablevariation from this formula (Deer et al., 1962, p. I16,I l7). Machatschki (1932) proposed the alternate for-mula X,nY,rZrr(O,OH,F)ru where X : Ca(Na,K,Mn),y : (Al,Fe3*,Fe2*,Mg,Ti,Zn,Mn), and Z: Si, andanalyses cited by Deer et al. (1962) fit this formulacloser. Other proposed formulas (see Ito and Arem,1970) are similar to Warren and Modell's originalformula, but none agrees with all published analyses.
The Alaska vesuvianite formula was calculated an-hydrous by Jackson et al.'s (1967) method. Total ironwas calculated as Fe2*, although some Fe3* is cer-tainly present. The Alaskan vesuvianite differs fromother reported vesuvianite analyses in its significantcontent of U, Th, and REE. All these elements haveionic radii comparable to Ca and have been assignedto the X group of elements substituting for Ca. Forthe Alaskan vesuvianite X is close to 18, Y to 13, andZ to 18. A similar formula was determined for theUSSR U- and Th-bearing vesuvianite (Kononova,1960).
Except for the U, Th, and REE, the Alaskan vesu-vianite is similar in composition to other vesuvian-ites. Inoue and Miyashiro (1951) reported that vesu-vianites from nepheline syenites are characterized byhigher contents of Al and Ti and lowei contents ofCa and Mg than vesuvianites from metamorphosedcalcareous rocks. They reported AlrO. contents ofapproximately 18 and 19 weight percent for neph-eline syenite vesuvianite; however, the Alaskan vesu-vianite has only about 12 weight percent AlrO3. Simi-lar ly , the metamict vesuviani te repor ted byKononova (1960) has an AlrO, content of 14.5 weightpercent.
The optical zonation of the vesuvianite shows acorresponding chemical zonation. The innermost me-tamict zone (zone l, Table 3) is enriched in U, Th,REE, and Mg and depleted in Al, Ti, Fe, and Ca rel-ative to the outer non-metamict zone (zone 3, Table3). Additional U and Th analyses were made on sev-eral grains of vesuvianite in three samples. The meta-mict vesuvianite grains showed a range of 0.61 to0.84 weight percent UO, and 1.38 to 2.70 weight per-cent ThOr; non-metamict vesuvianite is lower in UO,and ThOr, with approximately 0.40 weight percentUO, and 0.72 to 0.98 weight percent ThOr. Spotanalyses showed ThO, contents as high as 3.77
Zone l **
s i oz 37 .4A l2o3 l ' l . 3T i 02 2 .83Fe0* 8.83[4n0 0.25l1s0 l 58Cao 29 .4Na20 0 ,371u203 1 .40Ce203 3 . I IP r r0 , 0 .48Nd203 1 .07Ihoz 2.69u1z 0.84
T o t a l 1 0 1 . 5 5 98.62 98 .03
Zone ? Zone 3
35 .6 36 .4l l . 8 12 .03 . 0 l 3 . 5 88 . 7 2 7 . 8 70 . 2 5 0 . 2 11 . 5 0 1 . 4 9
3 1 . 0 3 2 . 10 . 3 8 0 . 3 8l . 1 6 0 . 7 82 . 0 6 1 . 2 30 . 3 2 0 . 2 00 . 6 5 0 . 4 ?t . 5 t 0 . 7 30 . 6 6 0 . 6 4
3 3 . 6
r 5 . 7
0 . 5 6
1 5 . 9
0 . 2 2
0 . 2 1
I 3 . 4
0 . 0 4
5 . 8 4
1 0 . 0
1 . 5 2
1 . 7 0
0. 86
0 . 3 8
s iAI
t:zAI
T i
Fe-
11n
t'lg
' Y
Cat ions per 72 oxygens
9 9 . 9 3
Cat ions perI 2 .5 oxygens
3 . 1 i l
3 . r ' l l
l 7 1 3
0 039
1 . ? 3 1
0 . 0 r 70 .0293.0290 . 1 9 90 . 3390 . 0510 0560 . 0 1 80 0080 . 0071 .3292.007
' 18 .474
18.47 4
6 579']
051
3 . 6 4 8
0 . 1 0 4
I . 1 6 4
12.s46
0 . 2 5 5
0.562
0.086
0 . 1 8 9
0 . 3 0 3
0.092
0 . 3 5 3
1 5 . 5 6 0
1 7 .400
1 7 .901 1 8 .0490 .099
18 .000 18 .0496 .894 7 .01 31 . 1 3 8 l 3 3 53 .666 3 .2640 . 1 0 6 0 . 0 8 81 . 1 2 4 t . t o l
' t ? . 928 l 2 . 8010 . 2 1 6 0 . 1 4 30 .380 0 .2230 .058 0 .0360 . 1 1 7 0 . 0 7 40 . I 73 0 . 0830 .074 0 .07 10 .372 0 .366
1 6 . 7 0 1 1 7 . 0 5 31 8.09 1 1 8. 049
Ce
Pr
Nd
T h
Na
T X
*Total iron 6 fe1
**Zone 1 is isatropic (metmicl :) co?e, Zone 2 is intemediatenetmict zone of s l ight ly higher reLief thm Zone 1, andZone 3 is anisotropie (non-metmi,ct) ytn, VesutLqnite smpLe77 AW 70; al lmite smple 77 AMn 62.
UO, standard, and differences obtained with U metaland UO, as a standard were -r4 percent of theamount present. No standard check was available forthe Th or REE. Matrix corrections were made by theprocedure of Bence and Albee (1968) and the correc-tions factors of Albee and Ray (1970). There is no a-factor available for theUMB line, so theUMa a-fac-tor was used in the correction. Judging from the massabsorption coefficients given by Heinrich (1966) for
1024
weight percent. The vesuvianite from the USSR con-tains 1.00 weight percent U.O, (0.96 percent UOr)and 0.53 percent ThOr.
Allanite
Allanite was also analyzed, and a representativeanalysis is given in Table 3. The mineral formula wascalculated anhydrous on the basis of 12.5 oxygens.All iron was calculated as Fe2*, although a smallamount of the total iron is certainly Fe'*, whichwould adjust the calculated formula. The allaniteshows smaller amounts of UO, (0.29 to 0.40 weightpercent) relative to the coexisting vesuvianite al-though ThO, contents are similar (0.77 to 1.30 weightpercent). An optically zoned allanite shows Th zon-ing, the core having 0.77 weight percent, an inter-mediate zone 1.38 weight percent, and the rim 2.00 to2.88 weight percent ThOr. These UO, and ThO, con-tents are relatively high for allanite but within therange reported by Frondel et al. (1967 p. 50).
Petrogenesis of the vesuvianite-bearing syenite
Although the exposures are poor and consequentlyinterpretations are uncertain, the relation betweenthe vesuvianite-bearing syenite and the surroundingsyenite and monzonite of the Kachauik pluton ap-pears to be gradational over a few centimeters. Theseobservations suggest that the vesuvianite-bearingsyenite is indeed a part of the enclosing syenite andmonzonite and not a later intrusive phase.
Most of the vesuvianite-bearing syenite containsnepheline, whereas most of the surrounding mon-zonite and syenite are silica-saturated rocks with rarenepheline. Furthermore, nepheline and plagioclaseare mutually exclusive in vesuvianite-bearing syenite,suggesting that nepheline may be a metasomaticproduct resulting from alkali-exchange reactions thatconverted plagioclase to perthite plus nepheline, asproposed by Rao and Murthy (1974). Textural evi-dence also suggests that the coarse vesuvianite wasamong the last minerals to form, since it containsabundant inclusions of all other minerals.
We therefore suggest that the vesuvianite and itshost rocks of syenite and nepheline syenite wereformed by metasomatic activity involving the in-troduction of alkali elements, IJ, Th, Zr, and REEinto the syenite and monzonite of the Kachauik plu-ton. Chemical zonation of the vesuvianite grains sug-gests that the U, Th, and REE content of the metaso-matic fluids decreased with time. Some allanite,which also occurs in the surrounding syenite and
HIMMELBERG AND MILLER: VESUVIANITE FROM ALASKA
monzonite, was probably a primary minera! how-ever, local concentrations of allanite suggest that
much of it was also introduced. The thorium-rich rim
on some allanite grains probably grew on primary
grains during metasomatism.The metasomatic fluids may be related to the alka-
line pulaskite dikes which also contain nepheline and
occur in the immediate area of the vesuvianite-
bearing syenite. The dikes were emplaced along apersistent N40"E joint system in the syenite and
monzonite. Since the occurrence of the vesuvianite-
bearing syenite boulders also appear to trend roughly
N40"E, either the metasomatic fluids could have per-
vaded the syenite and monzonite along an incipient
fracture system into which the pulaskite dikes were
later emplaced, or the metasomatism may have oc-
curred at the time of emplacement of the pulaskite
dikes.
References
Albee, A. L. and L. Ray (1970) Correction factors for electron
probe microanalysis of silicates, oxides, carbonates, phosphates,
and sulfates. Anal. Chem., 42, 1408-1414.
Amh, R. and W. L. Griffin (19?5) Microprobe analysis of REE
minerals using empirical correction factots. Am. Mineral., 60,
599-606.Bence, A. E. and A. L. Albee (1968) Empirical correction factors
for the electron microanalysis of silicates and oxides. J. Geol.,
76, 182403.Deer, W. A, R. A. Howie and J. Zussman (1962) Rock-Forming
Minerals, Yol. l, Ortho- and Ring Silicates. Wiley, New York
Frondel, J. W., M. Fleischer and R. S. Jones (1967) Glossary of
uranium- and thorium-bearing minerals (fourth ed). U. S. Geol'
Surv. Bull. 1250.Heinrich, K. F. J. (1966) X-ray absorption uncertainty. In T. D.
McKinley, K. F. J. Heinrich and D. B. Wittry, Eds., The Elec-
tron Microprobe, p. 296-377. Wiley, New York.
Inoue, T. and A. Miyashiro (1951) Occurrence of vesuvianite in
nepheline-syenitic rocks of the Fukushinzan district, Korea,
with general mnsideration of the relation between the composi-
tion and occurrence ofvesuvianite. J. Geol. Soc. Japan,57,5l-
57 .Ito, J. and J. E. Arem (1970) Idocrase: synthesis, phase relations,
and crystal chemistry. Am. Mineral., Jt 880-912.
Jackson, E. D., R. E. Stevens and R. W. Bowen (1967) A com-
puter-based procedure for deriving rnineral formulas from min-
eral analyses. U. S. Geol. Sum. Prof. Pap., 575-C, C23-C31.
Kononova, V. A. (1960) On a metamict variety of vesuvianite
from an alkaline pegmatite in southwest Twl Dokl. Akad.
Nauk. SSSR, 130,40MO3.ltansl. Dokl. Acad. Sci. SSSR, 1J0,
t2e-t32 (t96r)1.Machatschki, F. (1932) Zur Formel des Vesuvian. Z. Kristallogr.,
81, 148-152.Miller, T. P. and C. M. Bunker (1976) A reconnaissance study of
the uranium and thorium contents of plutonic rocks of the

HIMMELBERG AND MILLER: VESUVIANITE FROM ALASKA 1025
southeastern Seward Peninsula, Alaska. J, Rel U, S. Geol. product. Am. Mineral., 59,69M93.Sum., 4, !67-37'l . Warren, B. E. and D, I. Modell (1931) The structure of vesuvianite
- R. L. Elliott, W. L Finch and R. A. Brooks (1976) Prelimi- CaroAL(Mg,Fe)2SieO34(OH)4. Z. Kristallogr., 78,422432.nary report on uranium-, thorium-, and rare-earth-bearingrocks near Golovin, Alaska. U. S. Geol. Sum. Open-file Rep. 76-710. Manuscript received, December 21, 1979;
Rao, Y. J. and I. S. N. Murthy (1974) Nepheline as a metasomatic accepted for publication, March 13, 1980.
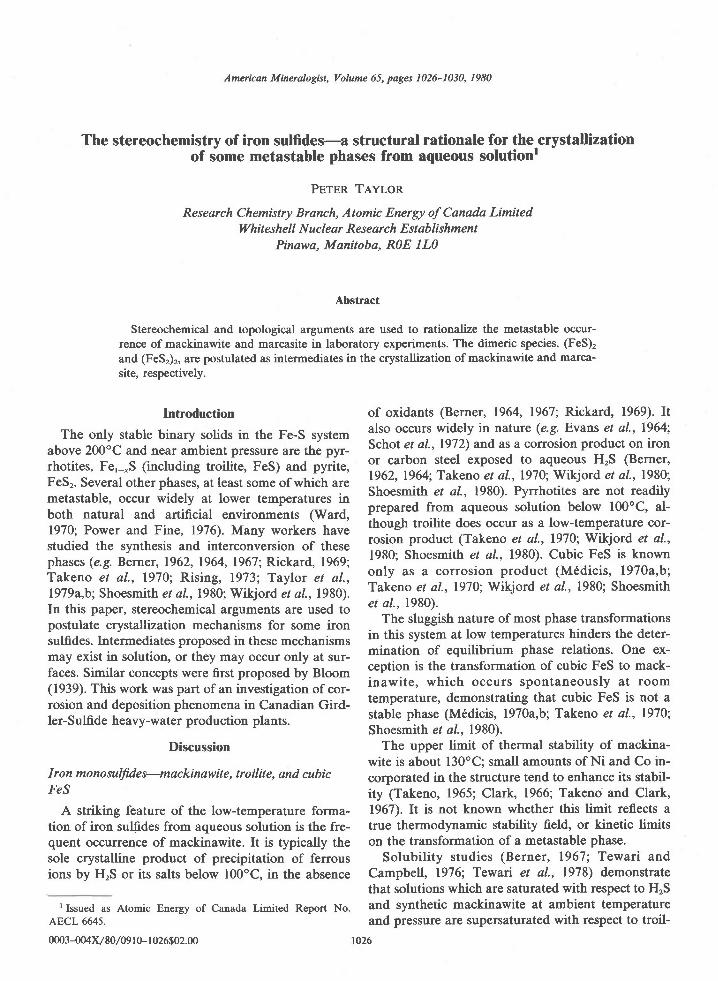
American Mineralogist, Volume 65, pages 1026-1030, 1980
The stereochemistry of iron sulfides-a structural rationale for the-crystallizationof some metastable phases from aqueous solutionr
Pnrnn Tnvron
Research Chemistry Branch, Atomic Energy of Canada LimitedWhiteshell Nuclear Research Establishment
Pinawa, Manitoba, ROE lLO
Abstract
Stereochemical and topological arguments are used to rationalize the metastable occur-rence of mackinawite and marcasite in laboratory experiments. The dimeric species, (FeS),and (FeSr)r, are postulated as intermediates in the crystallization of mackinawite and marca-site, respectively.
Introduction
The only stable binary solids in the Fe-S systemabove 200"C and near ambient pressure are the pyr-rhotites, Fe,-,S (including troilite, FeS) and pyrite,FeSr. Several other phases, at least some of which aremetastable, occur widely at lower temperatures inboth natural and artificial environments (Ward,1970; Power and Fine, 1976). Many workers havestudied the synthesis and interconversion of thesephases (e.9. Berner, 1962, 1964, 1967; Rickard, 1969;Takeno et al., 1970; Rising, 1973; Taylor et al.,l979a,b; Shoesmith et al.,l98O; Wikjord et al., 1980).In this paper, stereochemical arguments are used topostulate crystallization mechanisms for some ironsulfides. Intermediates proposed in these mechanismsmay exist in solution, or they may occur only at sur-faces. Similar concepts were first proposed by Bloom(1939). This work was part of an investigation of cor-rosion and deposition phenomena in Canadian Gird-ler-Sulfide heavy-water production plants.
Discussion
I ron monosulfides-mackinawite, troilite, and cabicFeS
A striking feature of the low-temperature forma-tion of iron sulfides from aqueous solution is the fre-quent occurre4ce of mackinawite. It is typically thesole crystalline product of precipitation of ferrousions by HrS or its salts below l00oC, in the absence
rlssued as Atomic Energy of Canada Limited Report No.AECL 6645.
0003-004x/80/09 I o- I 026$02.00
of oxidants (Berner, 1964, 1967; Rickard, 1969). Italso occurs widely in nature (e.g. Evans et al., 1964;'Schot et al., 1972) and as a corrosion product on ironor carbon steel exposed to aqueous HrS (Berner,1962,1964; Takeno et al.,1970; Wikjord et al.,1980;Shoesmith et al., 1980). Pyrrhotites are not readilyprepared from aqueous solution below l00oC, al-though troilite does occur as a low-temperature cor-rosion product (Takeno et al., 1970; Wikjord et al.,1980; Shoesmith et al., 1980). Cubic FeS is knownonly as a corrosion product (M€dicis, l97oa,b;Takeno et al., l97O; Wikjord et al.,1980; Shoesmithet al.,1980).
The sluggish nature of most phase transformationsin this system at low temperatures hinders the deter-mination of equilibrium phase relations. One ex-ception is the transformation of cubic FeS to mack-inawite, which occurs spontaneously at roomtemperature, demonstrating that cubic FeS is not astable phase (M6dicis, l97oa,b; Takeno et al., 1970;Shoesmith et al., l98O).
The upper limit of thermal stability of mackina-wite is about l30oC; small amounts of Ni and Co in-corporated in the structure tend to en-hance its stabil-ity (Takeno, 19651' Clark, 1966; Takeno and Clark,1967). lt is not known whether this limit reflects atrue thermodynamic stability field, or kinetic limitson the transformation of a metastable phase.
Solubility studies (Berner, 1967; Tewari andCampbell, 1976; Tewai et al., 1978) demonstratethat solutions which are saturated with respect to HrSand synthetic mackinawite at ambient temperatureand pressure are supersaturated with respect to troil-
1026
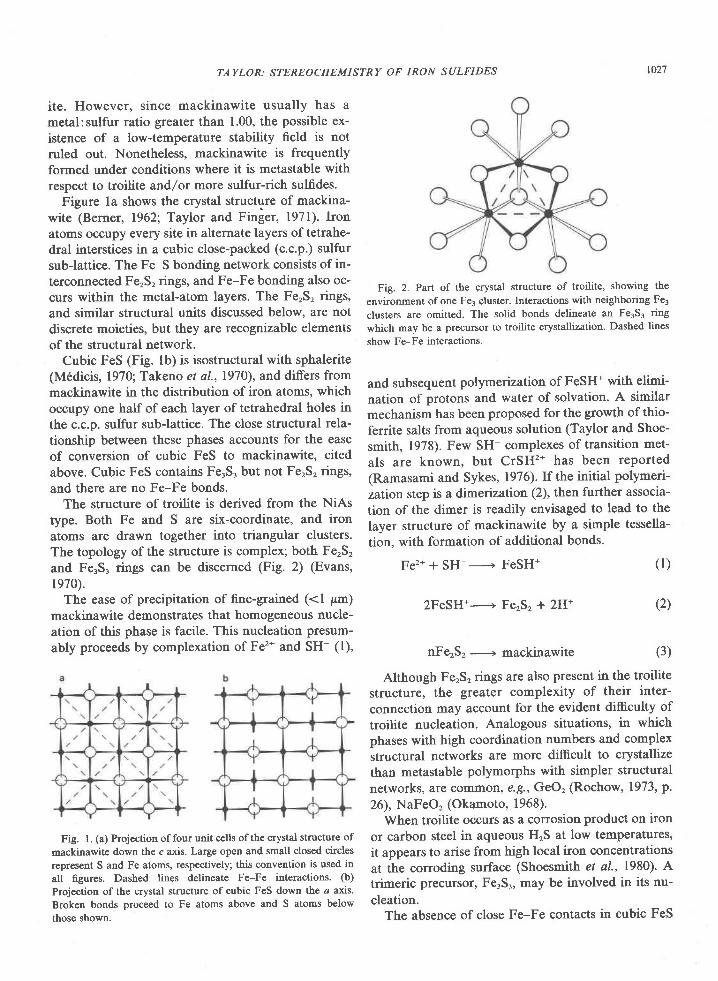
TAYLOR: STEREOCHEMISTRY OF IRON SULFIDES to2'l
ite. However, since mackinawite usually has ametal:sulfur ratio greater than 1.00, the possible ex-istence of a low-temperature stability field is notruled out. Nonetheless, mackinawite is frequentlyformed under conditions where it is metastable withrespect to troilite and/or more sulfur-rich sulfides.
Figure la shows the crystal structure of mackina-wite (Berner, 1962; Taylor and Finger, l97l). Ironatoms occupy every site in alternate layers of tetrahe-dral interstices in a cubic close-packed (c.c.p.) sulfursub-lattice. The Fe-S bonding network consists of in-terconnected FerS, rings, and Fe-Fe bonding also oc-curs within the metal-atom layers. The FerS, rings,and similar structural units discussed below, are notdiscrete moieties, but they are recognizable elementsof the structural network.
Cubic FeS (Fig. lb) is isostructural with sphalerite(M6dicis, 1970; Takeno et a1.,1970), and differs frommackinawite in the distribution of iron atoms, whichoccupy one haHofeach layer oftetrahedral holes inthe c.c.p. sulfur sub-lattice. The close structural rela-tionship between these phases accounts for the easeof conversion of cubic FeS to mackinawite, citedabove. Cubic FeS contains FerS. but not FerS, rings,and there are no Fe-Fe bonds.
The structure of troilite is derived from the NiAstype. Both Fe and S are six-coordinate, and ironatoms are drawn together into triangular clusters.The topology of the structure is complex; both FerS,and FerS. rings can be discerned (Fig. 2) (Evans,1970).
The ease of precipitation of fine-grained (<l pm)mackinawite demonstrates that homogeneous nucle-ation of this phase is facile. This nucleation presum-ably proceeds by complexation of Fe2* and SH- (l),
Fig. l. (a) Projection of four unit cells of the crystal structure of
mackinawite down the c axis. Large open and small closed circles
represent S and Fe atoms, respectively; this convention is used in
all figures. Dashed lines delineate Fe-Fe interactions. (b)
Projection of the crystal structure of cubic FeS down the a axis.
Broken bonds proceed to Fe atoms above and S atoms b€low
those shown.
Fig. 2. Part of the Qrystal structure of troilite, showing the
environment ofone Fe3 cluster. Interactions with neighboring Fe3
clusters are omitted. The solid bonds delineate an Fe3S, ring
which may be a precursor to troilite crystallization. Dashed lines
show Fe-Fe interactions.
and subsequent polymerization of FeSH* with elimi-
nation of protons and water of solvation. A similar
mechanism has been proposed for the growth of thio-
ferrite salts from aqueous solution (Taylor and Shoe-
smith, 1978). Few SH- complexes of transition met-
als are known, but CrSH2* has been reported(Ramasami and Sykes, 1976). If the initial polymeri-
zation step is a dimerization (2), then further associa-
tion of the dimer is readily envisaged to lead to the
layer structure of mackinawite by a simple tessella-
tion, with formation of additional bonds.
Fer* + SH- ------+ FeSH* (l)
2FeSH*-------+ FerS, + 2H* (2)
nFerS2 -------+ mackinawite (3)
Although FerS, rings are also present in the troilitestructure, the greater complexity of their inter-connection may account for the evident difficulty oftroilite nucleation. Analogous situations, in whichphases with high coordination numbers and complexstructural networks are more difficult to crystallizethan metastable polymorphs with sirnpler structuralnetworks, are common, e.g., GeOt (Rochow, 1973, p.26), NaFeO, (Okamoto, 1968).
When troilite occurs as a corrosion product on ironor carbon steel in aqueous HrS at low temperatures,it appears to arise from high local iron concentrationsat the corroding surface (Shoesmith et al., 1980). Atrimeric precursor, FerSr, may be involved in its nu-cleation.
The absence of close Fe-Fe contacts in cubic FeS
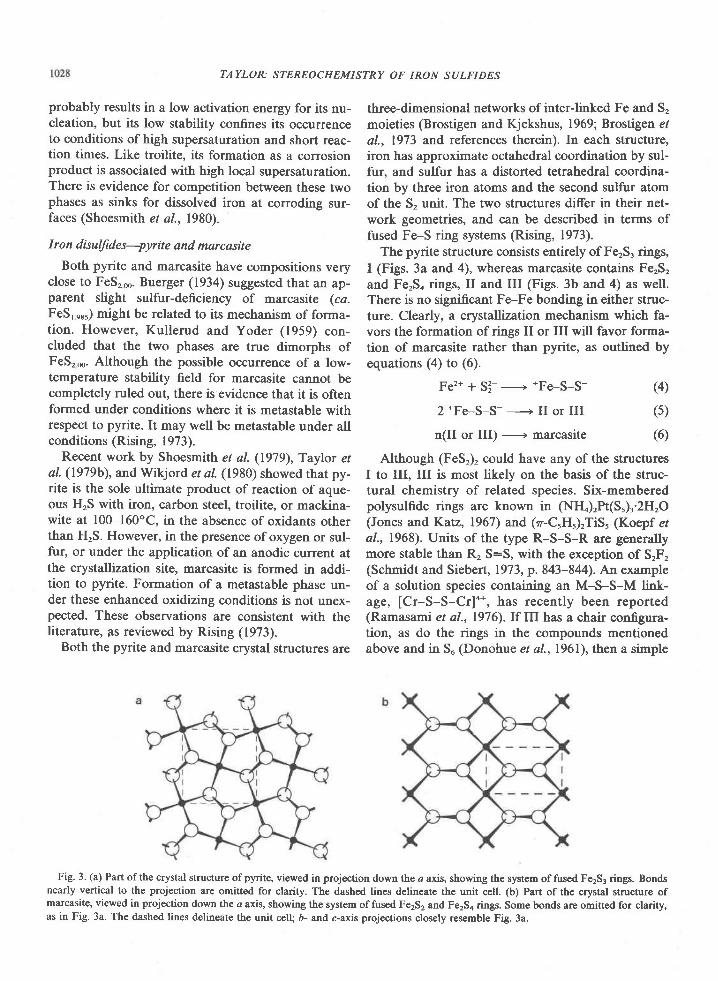
TAYLOK STEREOCHEMISTRY OF IRON SI]LFIDES
probably results in a low activation energy for its nu-cleation, but its low stability confines its occurrenceto conditions ofhigh supersaturation and short reac-tion times. Like troilite. its formation as a corrosionproduct is associated with high local supersaturation.There is evidence for competition between these twophases as sinks for dissolved iron at corroding sur-faces (Shoesmith et al., 1980).
I ron disulfides--ayrite and marcasite
Both pyrite and marcasite have compositions veryclose to FeSr*. Buerger (1934) suggested that an ap-parent slight sulfur-deficiency of marcasite (ca.FeS,,rr) might be related to its mechanism of forma-tion. However, Kullerud and Yoder (1959) con-cluded that the two phases are true dimorphs ofFeSr-. Although the possible occurrence of a low-temperature stability field for marcasite cannot becompletely ruled out, there is evidence that it is oftenformed under conditions where it is metastable withrespect to pyrite. It may well be metastable under allconditions (Rising, 1973).
Recent work by Shoesmith et al. (1979), Taylor etal. (1979b), and Wikjord et al. (1980) showed that py-rite is the sole ultimate product of reaction of aque-ous HrS with iron, carbon steel, troilite, or mackina-wite at 100-160"C, in the absence of oxidants otherthan HrS. However, in the presence of oxygen or sul-fur, or under the application ofan anodic current atthe crystallization site, marcasite is formed in addi-tion to pyrite. Formation of a metastable phase un-der these enhanced oxidizing conditions is not unex-pected. These observations are consistent with theliterature, as reviewed by Rising (1973).
Both the pyrite and marcasite crystal structures are
three-dimensional networks of interJinked Fe and S,moieties (Brostigen and Kjekshus, 1969; Brostigen e/al., 1973 and references therein). In each structure,iron has approximate octahedral coordination by sul-fur, and sulfur has a distorted tetrahedral coordina-tion by three iron atoms and the second sulfur atomof the S, unit. The two structures differ in their net-work geometries, and can be described in terms offused Fe-S ring systems (Rising, 1973).
The pyrite structure consists entirely of FerS, rings,I (Figs. 3a and 4), whereas marcasite contains FerS,and Fe,So rings, II and III (Figs. 3b and 4) as well.There is no significant Fe-Fe bonding in either struc-ture. Clearly, a crystallization mechanism which fa-vors the formation of rings II or III will favor forma-tion of marcasite rather than pyrite, as outlined byequations (a) to (6).
Fe't + S3- -------- *Fe-S-S- (4)
2 *Fe-S-S- ----+ II or III (5)
n(II or III) ------+ marcasite (6)
Although (FeSr), could have any of the structuresI to III, III is most likely on the basis of the struc-tural chemistry of related species. Six-memberedpolysulfide rings are known in (NH.),Pt(S5L'2H,O(Jones and Katz, 1967) and (r-C,H,),TiS, (Koepf eral., 1968). Units of the type R-S-S-R are generallymore stable than R, S:S, with the exception of SrF,(Schmidt and Siebert, 1973, p.843-844). An exampleof a solution species containing an M-S-S-M link-age, [Cr-S-S-Cr]o*, has recently been reported(Ramasami et al., 1976).If III has a chair confgura-tion, as do the rings in the compounds mentionedabove and in Su (Donohve et al.,196l), then a simple
Fig. 3. (a) Part of the crystal structure of pyrite, viewed in projection down the a axis, showing the system of fused FerS3 rings. Bondsnearly vertical to the projection are omitted for clarity. The dashed lines delineate the unit cell. (b) Part of the crystal structure ofmarcasite, viewed in projection down the a axis, showing the system of fused Fe2S, and Fe2Sa rings. Some bonds are omitted for clarity,as in Fig. 3a. The dashed lines delineate the unit cell; b- and c-axis projections closely resemble Fig. 3a.
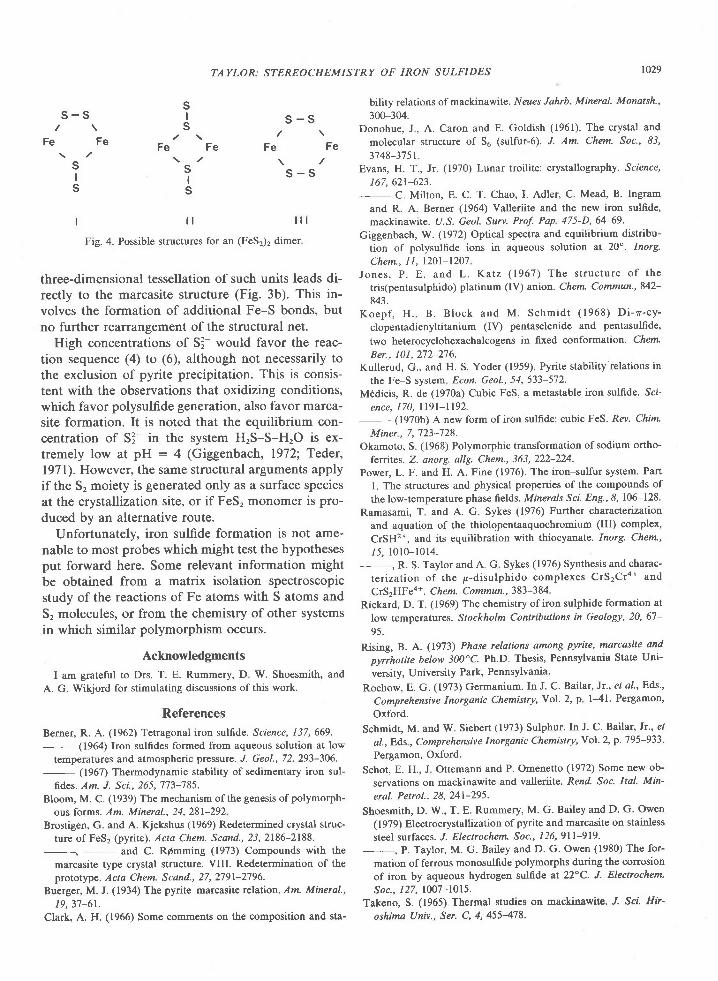
TAYLOR: STEREOCHEMISTRY OF IRON SULFIDES to29
Ss -s I
/ \ SF e F e - 'r e
s 'sl gS g
s-s\ / \
Fe Fe Fe/ \ /
s-s
I l l l l l
Fig. 4. Possible structures for an (FeS2)2 dimer
three-dimensional tessellation of such units leads di-rectly to the marcasite structure (Fig. 3b). This in-volves the formation of additional Fe-S bonds, butno further rearrangement of the structural net.
High concentrations of S3- would favor the reac-tion sequence (4) to (6), although not necessarily tothe exclusion of pyrite precipitation. This is consis-tent with the observations that oxidizing conditions,which favor polysulfide generation, also favor marca-site formation. It is noted that the equilibrium con-centration of S3- in the system H,S-S-HrO is ex-tremely low at pH : 4 (Giggenbach, 1972; Teder,l97l). However, the same structural arguments applyif the S, moiety is generated only as a surface speciesat the crystallization site, or if FeS, monomer is pro-
duced by an alternative route.Unfortunately, iron sulfide formation is not ame-
nable to most probes which might test the hypothesesput forward here. Some relevant information might
be obtained from a matrix isolation spectroscopicstudy of the reactions of Fe atoms with S atoms andS, molecules, or from the chemistry of other systemsin which similar polymorphism occurs.
Acknowledgments
I am grateful to Drs. T. E. Rummery, D W. Shoesmith, andA. G. Wikjord for stimulating discussions of this work.
References
Berner, R. A. (1962) Tetragonal iron sulfide. Science, 137,669.- (1964) Iron sulfides formed from aqueous solution at low
temperatures and atmospheric pressure. J. Geol., 72,293-306.- (1967) Thermodynamic stability of sedimentary iron sul-
fides. Am. J. Sci.,265,773-785.Bloom, M. C. (1939) The mechanism of the genesis of polymorph-
ous forms. Am. Mineral., 24,281-292Brostigen, G. and A. Kjekshus (1969) Redetermined crystal struc-
ture of FeS2 (pyrite). Acta Chem. Scand., 23,2186-2188.
marcasite type crystal structure. VIII. Redetermination of theprototype. Acta Chem. Scand., 27,2791-2796.
Buerger, M. J. (1934) The pyrite-marcasite relation. Am. Mineral.,/ ,9.3' l-61.
Clark, A. H. (1966) Some comments on the composition and sta-
bility relations of mackinawite. Neues Jahrb. Mineral. Monatsh.,
300-3M.Donohue, J, A. Caron and E. Goldish (1961). The crystal and
molecular structure of 56 (sulfur-6). J. Am. Chem. Soc.' 83,
3'148-f'l5lEvans, H. T., Jr. (1970) Lunar troilite: crystallography. Science,
167. 621-623.- C. Milton, E. C. T. Chao, I. Adler, C. Mead, B. Ingram
and R. A. Berner (1964) Valleriite and the new iron sulfrde,
mackinawite. II.S. Geol. Surv. Prof' Pap 475-D,64-69.
Giggenbach, W. (1972) Optical spectra and equilibrium distribu-
tion of polysulfide ions in aqueous solution aI 2O". Inorg.
Chem.. 1 l. 120l-1207
Jones, P. E. and L. Katz (1967) The structure of the
tris(pentasulphido) platinum (IV) anion. Chem' Commun., 842-
843.Koep f , H . , B . B lock and M . Schm id t ( 1968 ) D i - z - cy -
clopentadienyltitanium (IV) pentaselenide and pentasulfide,
two heterocyclohexachalcogens in fixed conformation. Cftenr.
Ber., 101, 272-216.Kullerud, G., and H. S. Yoder (1959). Pyrite stability relations in
the Fe-S system Econ. GeoI.,54,533-5'12.
M€dicis, R. de (1970a) Cubic FeS, a metastable iron sulfide. Sci-
ence, 170, I l9 l - l 192- (1970b) A new form ofiron sulfide: cubic FeS. Rev. Chim.
Miner , 7,72f-728.
Okamoto, S. (1968) Polymorphic transformation of sodium ortho-
fetites. Z. anorg. allg. Chem.,363,222-224.
Power, L. F. and H. A. Fine (1976). The iron-sulfur system. Part
l. The structures and physical properties of the compounds of
the low-temperature phase fields. Minerals Sci. Eng., & 106-128.
Ramasami, T and A. G. Sykes (1976) Further characterization
and aquation of the thiolopentaaquochromium (II! complex,
CrSH2*, and its equilibration with thiocyanate' Inorg. Chem.,
/J, l0 l0-1014.R. S. Taylor and A. G Sykes (1976) Synthesis and charac-
ter izat ion of the p-disulphido complexes CrS2Cro* and
CrS2HFea*. Chem. Commun, 383-384.
Rickard, D. T. (1969) The chemistry of iron sulphide formation at
low temperatures. Stockholm Contributions in Geology, 20,67-
95.
Rising, B. A. (1973) Phase relations among Pyrite' marcasile and
pyrrhotite below 300"C. Ph.D. Thesis, Pennsylvania State Uni-
versity, University Park, Pennsylvania'
Rochow, E. G. (1973) Germanium. In J. C. Bailar, lt., et 4l', Eds',
Comprehensive Inorganic Chemistry, Vol. 2' p l-41' Pergamon'
Oxford.
Schmidt, M. and W. Siebert (1973) Sulphur. In J. C. Bailar, Jr., et
al., Eds, Comprehensiv e I no r ganic Chemi stry, Y ol. 2' p. 7 9 5-933.
Pergamon, Oxford.
Schot, E. H., J Ottemann and P. Omenetto (1972) Some new ob-
servations on mackinawite and valleriite ' Rend. Soc. Ital. Min-
eral. Petrol., 28, 241-295
Shoesmith, D. W., T. E. Rummery, M. G. Bailey and D. G. Owen
(1979) Electrocrystallization ofpyrite and marcasite on stainless
steel surfaces. J. Electochem' Soc', I26,9Il-919.
mation of ferrous monosulfide polymorphs during the corrosion
of iron by aqueous hydrogen sulfide at 22"C. J' Eleclrochem.
Soc., 127, 1007-1015.
Takeno, S. (1965) Thermal studies on mackinawite. J. Sci Hir-
oshima Univ., Ser. C,4,455478'
1030 TAYLOR: STEREOCHEMISTRY OF IRON SULFIDES
- and A. H. Clark (1967) Tetragonal (Fe,Ni,Co)1*.S, mack- aqueous polysulfide solutions. Acta Chem. Scand., 25, 1722-inawite. J. Sci. Hiroshima Univ., Ser. C, 5,28'7-293. 1728.
fide-with special reference to mackinawite . Am. Mineral., 55, fide (troilite) in aqueous sulfuric acid. J. Phys. Chem., 80, 1844-1639-t649. 1848.
Tay lo r , L .A .andL .W.F inge r ( l 97 l )S t ruc tu re re f i nemen tandcomposition of mackinawite. Carnegie Inst. Wash. Year Book, iron sulfides and their role in mass transport in Girdler-Sulfide69,318-323. heavy water plants- Atomic Energy of Canada Limiled Report
Taylor, P. and D. W. Shoesmith (1978) The nature of green alka- No. AECL-5960.Iine iron sulfide solutions and the preparation of sodium iron Ward,J. C. (1970)Thestructureandpropertiesof someiron sul-(III) sulfide, NaFeS2. Can. J. Chem., 56,279'l-2802. phides. Rev. Pure Appl. Chem., 20, l'15-2M.
T. E. Rummery and D. G. Owen (1979a) On the con- Wikjord, A. G., T. E. Rummery, F. E. Doern and D. G. Owenversion of mackinawite to greigite- J. Inorg. Nucl. Chem., 41, (1980) Corrosion and deposition during the exposure of carbon595-596. steel to H2O-H2S solutions at elevated pressures. Corrosion Sci-
'-- and - (1979b) Reactions ofiron monosulfide ence, rn press.solids with aqueous hydrogen sulfide up to 160'C. J. Inorg.Nucl. Chem., 41, 1683-168'1. tVanuscript received, October 24, 1979;
Teder, A. (1971) The equilibrium between elementary sulfur and acceptedfor publication, May 5, 1980.
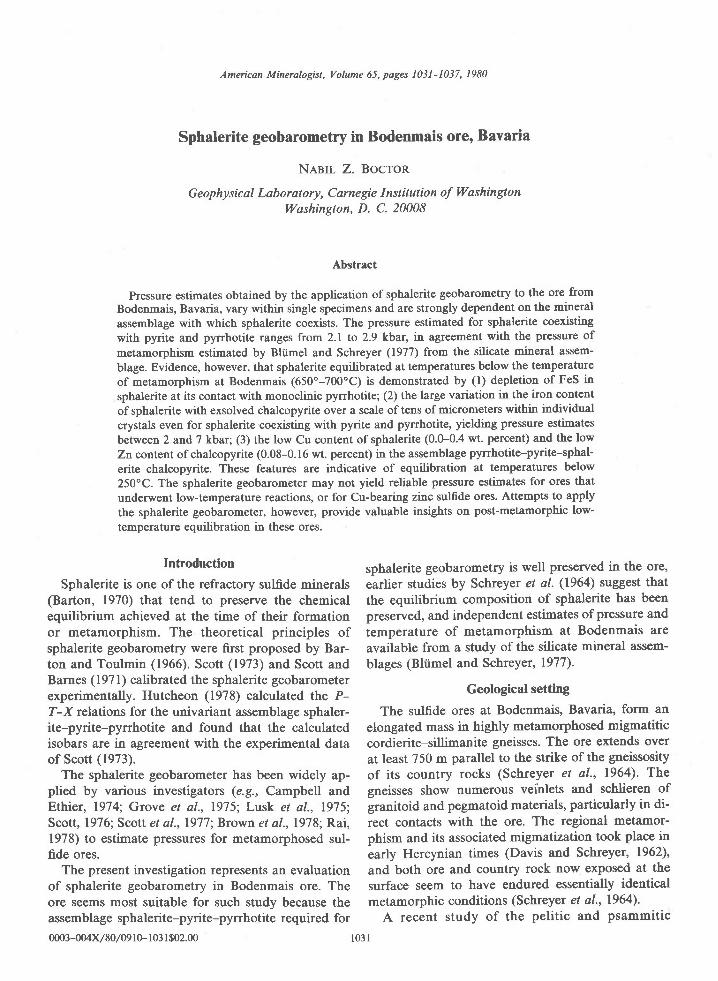
American Mineralogist, Volume 65, pages l03l-1037, 1980
Sphalerite geobarometry in Bodenmais ore' Bavaria
N^q.srl- Z. BocroR
Geophy sic al Lab oratory, Carne gie I nstitution of lV'ashingt onlf/ashington, D. C. 20008
Abstract
Pressure estimates obtahed by the application of sphalerite geobarometry to the ore fromBodenmais, Bavaria, vary within single specimens and are strongly dependent on the mineralassemblage with which sphalerite coexists. The pressure estimated for sphalerite coexistitgwith pyrite and pyrrhotite ranges from 2.1 to2.9kbar, in agreement with the pressure ofmetamorphism estimated by Bliimel and Schreyer (1977) from the silicate mireral assem-blage. Evidence, however, that sphalerite equilibrated at temperatures below the temperatureof metamorphism at Bodenmais (650"-700'C) is demonstrated by (1) depletion of FeS insphalerite at its contact with monoclinic pyrrhotite; (2) the large variation in the iron contentof sphalerite with exsolved chalcopyrite over a scale of tens of micrometers within individualcrystals even for sphalerite coexisting with pyrite and pyrrhotite, yielding pressure estimatesbetween 2 and 7 kbar; (3) the low Cu content of sphalerite (0.0-0.4 wt. percent) and the lowZn content of chalcopyrite (0.08-0.16 wt. percent) in the assemblage pyrrhotite-pyrite-sphal-erite-chalcopyrite. These features are indicative of equilibration at temperatures below250'C. The sphalerite geobarometer may not yield reliable pressure estimates for ores thatunderwent low-temperature reactions, or for Cu-bearing zinc sulfide ores. Attempts to applythe sphalerite geobarometer, however, provide valuable insights on post-metamorphic low-temperature equilibration in these ores.
Introduction
Sphalerite is one of the refractory sulfide minerals(Barton, 1970) that tend to preserve the chemicalequilibrium achieved at the time of their formationor metamorphism. The theoretical principles ofsphalerite geobarometry were first proposed by Bar-ton and Toulmin (1966). Scott (1973) and Scott andBarnes (1971) calibrated the sphalerite geobarometerexperimentally. Hutcheon (1978) calculated the P-T-X relations for the univariant assemblage sphaler-ite-pyrite-pyrrhotite and found that the calculatedisobars are in agreement with the experimental dataof Scott (1973).
The sphalerite geobarometer has been widely ap-plied by various investigators (e.9., Campbell andEthier, 1974; Grove et al., 1975; Lusk et al., 1975;Scott, 1976; Scott e/ al.,1977; Brown et al.,1978;R.ai,1978) to estinate pressures for metamorphosed sul-fide ores.
The present investigation represents an evaluationof sphalerite geobarometry in Bodenmais ore. Theore seems most suitable for such study because theassemblage sphalerite-pyrite-pyrrhotite required for0nn3-00/.X / 80 /09 l 0- l 03 l $02.00
sphalerite geobarometry is well preserved in the ore,earlier studies by Schreyer et al. (1964) suggest thatthe equilibrium composition of sphalerite has beenpreserved, and independent estimates of pressure andtemperature of metamorphism at Bodenmais areavailable from a study of the silicate mineral assem-blages (Bliimel and Schreyet, 1977).
Geological setting
The sulfide ores at Boden-rrais, Bavaria, form anelongated mass in highly metamorphosed migmatiticcordierite-sillimanite gneisses. The ore extends overat least 750 m parallel to the strike ofthe gneissosityof its country rocks (Schreyer et al-, 1964). Thegneisses show numerous veinlets and schlieren ofgranitoid and pegmatoid materials, particularly in di-rect contacts with the ore. The regional metamor-phism and its associated migmatization took place inearly Hercynian times (Davis and Schreye4 1962'5,and both ore and country rock now exposed at thesurface seem to have endured essentially identicalmetamorphic conditions (Schreyer et al., 1964).
A recent study of the pelitic and psammitic
l 031

r032 BOCTOR: SPHALERITE GEOBAROMETRY
gneisses in the Lam-Bodenmais area by Bliimel andSchreyer (1977) delineated two major metamorphiczones: a sillimanite-K-feldspar zone with coexistingbiotite * sillimanite (+ K-feldspar + quartz) and acordierite-K-feldspar zone with coexisting biotite +cordieritetsillimanite (+ K-feldspar + qrraftz). Thetwo metamorphic zones are related to each other bythe multivariant reaction:
biotite + sillimanite +"T?".Yr" + K-feldspar * H,o
The temperature and pressure of metamorphism thatformed the cordierite-K-feldsplr zone were esti-mated by Bliimel and Schreyer (1977) as 650o-700oCand 2-3 kbar, assuming water pressure to be equal tototal pressure.
The origin of the sulfide ores at Bodenmais is stillcontroversial; a summary of the various hypotheseswas given by Schreyer et al. (1964). A contact meta-morphic origin was proposed by Hegemann andMaucher (1933). Fischer (1938) suggested that theore formed by preferential mobilization from thegneisses during regional metamorphism. Schrcicke(1955) concluded, on the basis of petrological andstructural studies, that the ore formed earlier than theregional metamorphic episode. Schreyer et al. (1964)objected to a contact metamorphic origin because ofthe lack ofdiscordant late granite in contact or evenin the vicinity of the ore. They noted, however, thatthe mineral assemblages show similarities to those ofcertain metamorphic ore deposits in the Fennoscan-dian shield that are generally known as Mg-richskarn deposits.
Methods of study
The ore specimens were studied in both reflected
and transmitted light. Electron microprobe analyses
of sulfides were performed using an automated
MAC-500 electron microprobe. Synthetic sphalerite,
pyrrhotite of different compositions, and pure Cd,
Mn, and Cu were used as standards. Data reduction
was performed with the computer program Magic IV(Colby, l97l). For distinction between monoclinic
and hexagonal pyrrhotite, both etching and X-ray
diffraction were used.
Mineralogy
The samples were collected from a massive sulfide-rich ore from Barbarastollen, Silberberg, Bodenmais.The ore is composed mainly of sphalerite, pyrite,pyrrhotite, and chalcopyrite. Sphalerite occurs aslarge crystals that may reach I cm. Where coexistingwith pyrite and pyrrhotite, the three-phase assem-blage forms interlocking crystal aggregates in mutualcontact. In many instances, sphalerite coexists witheither pyrrhotite (Fig. la) or pyrite. The iron sulfidesoccasionally display intergrowths of sphalerite andanhedral inclusions of galena. Chalcopyrite is abun-dant in some specimens as large discrete crystals thatmay enclose small crystals of sphalerite. Chalcopyriteexsolutions in sphalerite are rare. Optical examina-tion of pyrrhotite in reflected light reveals no inter-growths. However, on etching with 50 percent HI bythe technique of Schwarcz and Harris (1970), mono-clinic pyrrhotite was found to coexist with hexagonalpyrrhotite in many specimens. In addition to its oc-
b
Fig. l. (a) Large crystal of sphalerite in mutual contact with pyrrhotite. Bar: I mm; reflected light; oil immersion. (b) Pyrrhotite incontact with sphalerite, pyrite, and silicates etched with 50Vo Hl. Note rims of unetched monoclinic pyrrhotite at contact with sphalerite,pyrite, and silicate and formation of monoclinic pyrrhotite along cracks. Bar : I mm; reflected light
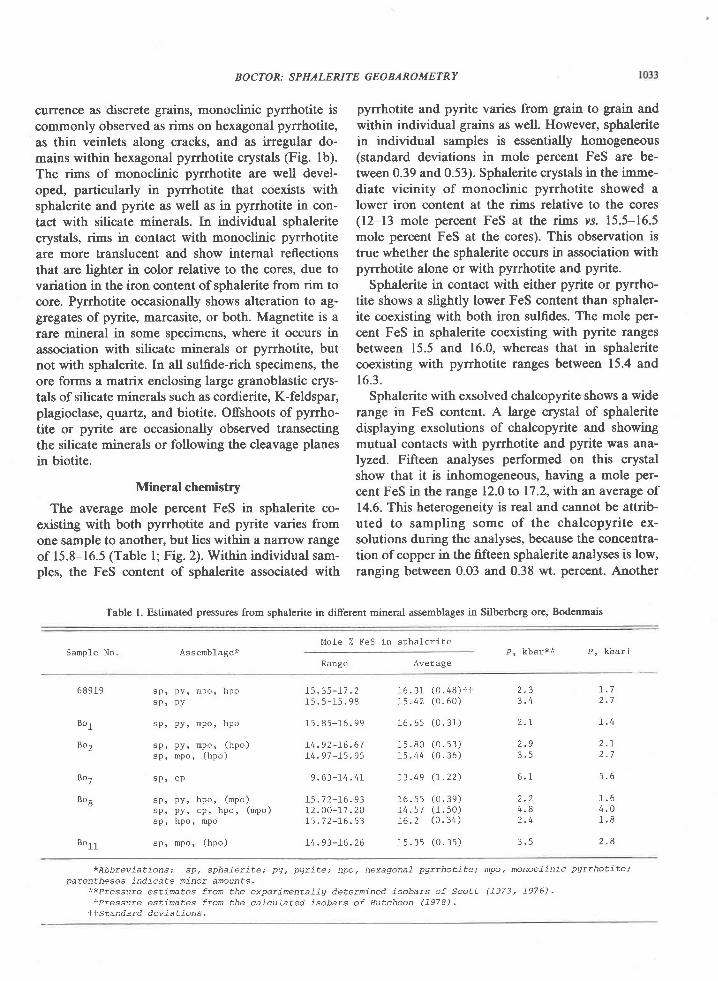
BOCTOR: SPHALERITE GEOBAROMETRY
currence as discrete grains, monoclinic pyrrhotite iscommonly observed as rims on hexagonal pyrrhotite,as thin veinlets along cracks, and as irregular do-mains within hexagonal pyrrhotite crystals (Fig. lb).The rims of monoclinic pyrrhotite are well devel-oped, particularly in pyrrhotite that coexists withsphalerite and pyrite as well as in pyrrhotite in con-tact with silicate minerals. In individual sphaleritecrystals, rims in contact with monoclinic pyrrhotiteare more translucent and show internal reflectionsthat are lighter in color relative to the cores, due tovariation in the iron content of sphalerite from rim tocore. Pyrrhotite occasionally shows alteration to ag-gregates of pyrite, marcasite, or both. Magnetite is arare mineral in some specimens, where it occurs inassociation with silicate minerals or pyrrhotite, butnot with sphalerite. In all sulfde-rich specimens, theore forms a matrix enclosing large granoblastic crys-tals of silicate minerals such as cordierite, K-feldspar,plagioclase, quartz, and biotite. Offshoots of pyrrho-tite or pyrite are occasionally observed transectingthe silicate minerals or following the cleavage planesin biotite.
Mineral chemistry
The average mole percent FeS in sphalerite co-existing with both pyrrhotite and pyrite varies fromone sample to another, but lies within a narrow rangeof 15.8-16.5 (Table l; Fig. 2). Within individual sam-ples, the FeS content of sphalerite associated with
pyrrhotite and pyrite varies from grain to grain andwithin individual grains as well. However, sphaleritein individual samples is essentially homogeneous(standard deviations in mole percent FeS are be-tween 0.39 and 0.53). Sphalerite crystals in the imme-diate vicinity of monoclinic pyrrhotite showed alower iron content at the rims relative to the cores(12-13 mole percent FeS at the rims vs. 15.5-16.5mole percent FeS at the cores). This observation istrue whether the sphalerite occurs in association withpyrrhotite alone or with pyrrhotite and pyrite.
Sphalerite in contact with either pyrite or pyrrho-tite shows a slightly lower FeS content than sphaler-ite coexisting with both iron sulfides. The mole per-cent FeS in sphalerite coexisting with pyrite rangesbetween 15.5 and 16.0, whereas that in sphaleritecoexisting with pyrrhotite ranges between 15.4 and16.3.
Sphalerite with exsolved chalcopyrite shows a widerange in FeS content. A large crystal of sphaleritedisplaying exsolutions of chalcopyrite and showingmutual contacts with pyrrhotite and pyrite was ana-lyzed. Fifteen analyses performed on this crystalshow that it is inhomogeneous, having a mole per-cent FeS in the range 12.0 to l7 .2, with an average of14.6. This heterogeneity is real and cannot be attrib-uted to sampling some of the chalcopyrite ex-solutions during the analyses, because the concentra-tion of copper in the fifteen sphalerite analyses is low,ranging between 0.03 and 0.38 wt. percent. Another
Table L Estimated pressures from sphalerite in different mineral assemblages in Silberberg ore, Bodenmais
Mole % FeS in spha ler i teSample No. Assemblagex P , k b a l * * P, kbar t
Range Average
689L9 5 P t P f , n ' P u r r r P v
s p , p y
D P ' P ) ' n r P U ' r ' P U
s p , p y , m p o , ( h p o )
s p , m p o , ( h p o )
s p , c p
D P t P y t l P U t \ n ' P U /
s p , p y , c p , h p o , ( m p o )
sp , hpo, mpo
s p , m p o , ( h p o )
1 5 . 3 5 - 1 7 . 21 5 . 5 - 1 5 . 9 8
1 5 . 8 5 - 1 6 . 9 9
1 4 . 9 2 - 1 6 . 6 7L 4 . 9 1 - r 5 . 9 5
9 . 6 3 - 1 4 . 4 L
L 5 . 7 2 - 1 6 . 9 31 2 . 0 0 - 1 1 . 2 0t 5 . 7 2 - L 6 . 5 3
L 4 . 9 3 - L 6 . 2 6
1 6 . 3 1 ( 0 . 4 8 ) - f rL 5 . 4 2 ( 0 . 6 0 )
1 6 . 6 5 ( 0 . 3 1 )
1 5 . 8 0 ( 0 . 5 3 )1 s . 4 4 ( 0 . 3 6 )
L 3 . 4 9 ( L . 2 2 )
r 6 . s 5 ( 0 . 3 9 )1 4 . 5 7 ( 1 . 5 0 )L 6 . 2 ( 0 . 3 4 )
1 5 . 3 s ( 0 . 3 5 )
) 2
3 . 4
2 . 1
2 . 93 . 5
6 . 1
2 . 24 . 82 . 4
r . l2 . 1
r . 4
2 . L2 . 7
5 . 6
1 . 64 . 01 . 8
2 . 8
B o l
B o 2
Bo7
Bo8
Borl
xAbbrev ia t ions : sp , sphafer i te ; pg , pqr i te ; hpo, hexagona l pVr rho t j te ;parentheses indicate minor arcunts.
x*Pressure estimates from the experimentaTTg detetnined isobars of scottfPressure es t imates f rom the caTcuLated isobars o f Hutcheon (1978) .
++ sxandard dev ia t ions .
mpo, rcnoc7 ).nic pqrrhotixe ;
( 1 9 7 3 , 7 9 7 6 ) .
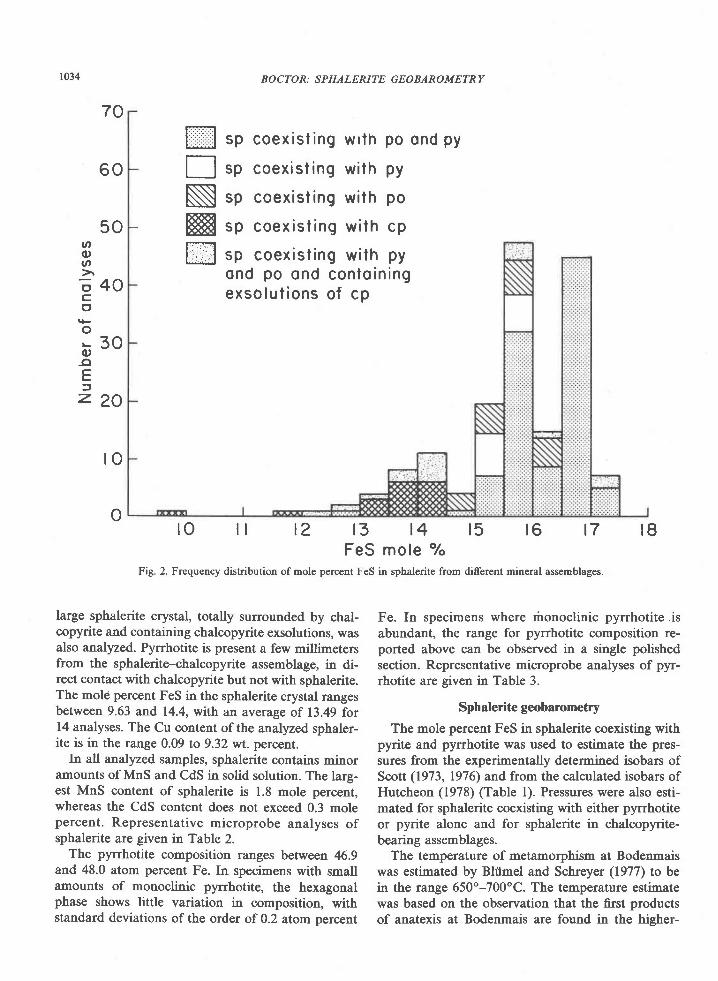
r034
70
60
50
40
30
20
ro
o
large sphalerite crystal, totally surrounded by chal-copyrite and containing chalcopyrite exsolutions, wasalso analyzed. Pyrrhotite is present a few millims1615from the sphalerite-chalcopyrite assemblage, in di-rect contact with chalcopyrite but not with sphalerite.The molC percent FeS in the sphalerite crystal rangesbetween 9.63 and 14.4, with an average of 13.49 for14 analyses. The Cu content ofthe analyzed sphaler-ite is in the range 0.09 to 9.32 wt. percent.
In all analyzed samples, sphalerite contains minoramounts of MnS and CdS in solid solution. The larg-est MnS content of sphalerite is 1.8 mole percent,whereas the CdS content does not exceed 0.3 molepercent. Representative microprobe analyses ofsphalerite are given in Table 2.
The pyrrhotite composition ranges between 46.9and 48.0 atom percent Fe. In specimens with smallamounts of monoclinic pyrrhotite, the hexagonalphase shows little variation in composition, withstandard deviations of the order of 0.2 atom percent
BOCTOR: SPHALERITE GEOBAROMETRY
sp coexis t ing wrfh po ond py
sp coexis t ing wi th py
sp coexist ing wi th po
sp coexis f ing wi lh cp
sp coexis t ing wi th pyond po ond conto in ingexsolut ions of cp
l l t2 13 t4 15 t6 t7FeS mole 7"
Fig. 2. Frequency distribution ofmole percent FeS in sphalerite from different mineral assemblages.
Ef,tlNffiffio
oo3oco
o
o-oEtz.
r8ro
Fe. In specimens where rhonoclinic pyrrhotite ,isabundant, the range for pyrrhotite composition re-ported above can be observed in a single polishedsection. Representative microprobe analyses of pyr-rhotite are given in Table 3.
Sphalerite geobarometry
The mole percent FeS in sphalerite coexisting withpyrite and pyrrhotite was used to estimate the pres-sures from the experimentally determined isobars ofScott (1973, 1976) and from the calculated isobars ofHutcheon (1978) (Table l). Pressures were also esti-mated for sphalerite coexisting with either pyrrhotiteor pyrite alone and for sphalerite in chalcopyrite-bearing assemblages.
The temperature of metamorphism at Bodenmaiswas estimated by Bltimel and Schreyer (1977) to bein the range 650"-700'C. The temperature estimatewas based on the observation that the first productsof anatexis at Bodenmais are found in the higher-
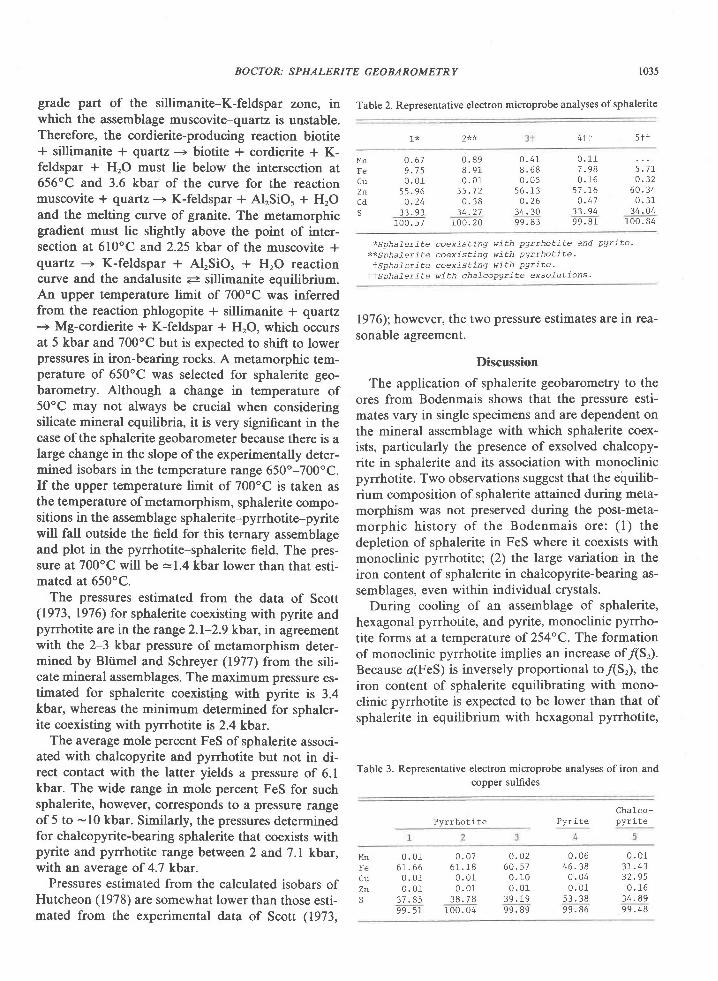
BOCTOR: SPHALERITE GEOBAROM ETRY 1035
grade part of the sillimanite-K-feldspar zone, inwhich the assemblage muscovite-quartz is unstable.Therefore, the cordierite-producing reaction biotite* sillimanite + quartz ---> biotite + cordierite * K-feldspar + HrO must trie below the intersection at656'C and 3.6 kbar of the curve for the reactionmuscovite + quartz -+ K-feldspar + AlrSiOs + HrOand the melting curve of granite. The metamorphicgradient must lie slightly above the point of inter-section at 6l0oC and 2.25 kbar of the muscovite *quartz ---> K-feldspar * AlrSiOs + HrO reactioncurve and the andalusite ? sillimanite equilibrium.An upper temperature limit of 700"C was inferredfrom the reaction phlogopite + sillimanite + quartz-+ Mg-cordierite + K-feldspar + HrO, which occursat 5 kbar and 700oC but is expected to shift to lowerpressures in iron-bearing rocks. A metamorphic tem-perature of 650oC was selected for sphalerite geo-barometry. Although a change in temperature of50"C may not always be crucial when consideringsilicate mineral equilibria, it is very significant in thecase of the sphalerite geobarometer because there is alarge change in the slope of the experimentally deter-mined isobars in the temperature range 650"-700"C.If the upper temperature limit of 700'C is taken asthe temperature of metamorphism, sphalerite compo-sitions in the assemblage sphalerite-pyrrhotite-pyritewill fall outside the field for this ternary assemblageand plot in the pyrrhotite-sphalerite field. The pres-sure at 700'C will be =1.4 kbar lower than that esti-mated at 650oC.
The pressures estimated from the data of Scott(1973,1976) for sphalerite coexisting with pyrite andpyrrhotite are in the range2.l-2.9 kbar, in agreementwith the 2-3 kbar pressure of metamorphism deter-mined by Bliimel and Schreyer (1977) from the sili-cate mineral assemblages. The maximum pressure es-timated for sphalerite coexisting with pyrite is 3.4kbar, whereas the minimum determined for sphaler-ite coexisting with pyrrhotite is 2.4 kbar.
The average mole percent FeS of sphalerite associ-ated with chalcopyrite and pyrrhotite but not in di-rect contact with the latter yields a pressure of 6.1kbar. The wide range in mole percent FeS for suchsphalerite, however, corresponds to a pressure rangeof 5 to -10 kbar. Similarly, the pressures determinedfor chalcopyrite-bearing sphalerite that coexists withpyrite and pyrrhotite range between2 and,7.l kbar,with an average of 4.7 kbar.
Pressures estimated from the calculated isobars ofHutcheon (1978) are somewhat lower than those esti-mated from the experimental data of Scott (1973,
Table 2. Representative electron microprobe analyses ofsphalerite
5 t tl x 2,t *
MnFeCuZncds
o . 6 79 . 7 50 . 0 1
5 5 . 9 6o . 2 4
3 3 . 9 31 0 0 . 5 7
0 . 8 98 . 9 10 . 0 1
5 5 . 7 20 . 3 8
3 4 . 2 11 0 0 . 2 0
0 . l r l8 . 6 80 . 0 5
5 6 . 1 30 . 2 6
3 4 . 3 09 9 . 8 3
0 . 1 17 . 9 8 5 . 7 L0 . 1 6 0 . 3 2
5 t . 1 6 b u , J 4
0 . 4 7 0 . 3 133 .94 34 .0499 . 81 100 . 84
*sphafer i te coex is t inq w ixh pgr rho t i te and pgr i te -* *sphafer i te coex i s t ing w ixh pgr rho t i te .
l sphafer i te coex is t ing w i th pgr i te .
tl sphaferite with chaTcapgrite exsofuxions -
1976); however, the two pressure estimates are in rea-sonable agreement.
Discussion
The application of sphalerite geobarometry to theores from Bodenmais shows that the pressure esti-mates vary in single specimens and are dependent onthe mineral assemblage with which sphalerite coex-ists, particularly the presence of exsolved chalcopy-rite in sphalerite and its association with monoclinicpyrrhotite. Two observations suggest that the equilib-rium composition of sphalerite attained during meta-morphism was not preserved during the post-meta-
morphic history of the Bodenmais ore: (l) thedepletion of sphalerite in FeS where it coexists withmonoclinic pyrrhotite; (2) the large variation in theiron content of sphalerite in chalcopyrite-bearing as-semblages, even within individual crystals.
During cooling of an assemblage of sphalerite,hexagonal pyrrhotite, and pyrite, monoclinic pyrrho-
tite forms at a temperature of 254"C. The formationof monoclinic pyrrhotite implies an increase of/(S').Because a(FeS) is inversely proportional toflSr), theiron content of sphalerite equilibrating with mono-clinic pyrrhotite is expected to be lower than that ofsphalerite in equilibrium with hexagonal pyrrhotite,
Table 3. Representative electron microprobe analyses ofiron and
copper sulfides
Pyr rho t i teC h a l c o -
P ! , r i f o n l r r i f a
MnFeCuZnS
0 . 0 l6 r . 6 60 . 0 10 . 0 l
3 7 . 8 59 9 . 5 r
0 . 0 76 1 . 1 8
0 . 0 10 . 0 1
3 8 . 7 8100 . 04
0 . o 26 0 . 5 10 . 1 00 . 0 l
39 .L99 9 . 8 9
0 . 0 6 0 . 0 14 6 . 3 8 3 L . 4 3
0 . 0 4 3 2 . 9 50 . 0 1 0 . 1 6
5 3 . 3 8 3 4 . 8 999 .86 99 .48
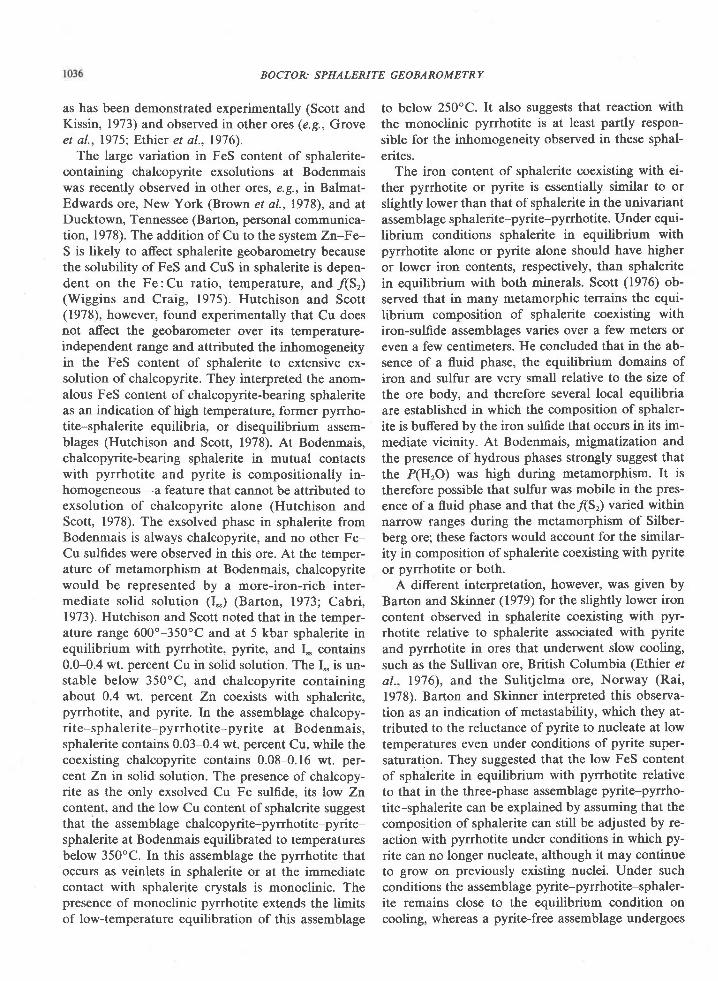
BOCTOR: SPHALERITE GEOBAROMETRY
as has been demonstrated experimentally (Scott andKissin, 1973) and observed in other ores (e.9., Groveet al., 1975; Ethier et al., 1976).
The large variation in FeS content of sphalerite-containing chalcopyrite exsolutions at Bodenmaiswas recently observed in other ores, e.9., in Balmat-Edwards ore, New York (Brown et al., 1978), and atDucktown, Tennessee (Barton, personal communica-tion, 1978). The addition of Cu to the system Zll.-Fe-S is likely to affect sphalerite geobarometry becausethe solubility of FeS and CuS in sphalerite is depen-dent on the Fe:Cu ratio, temperature, and lSr)(Wiggins and Craig, 1975). Hutchison and Scott(1978), however, found experimentally that Cu doesnot affect the geobarometer over its temperature-independent range and attributed the hhomogeneityin the FeS content of sphalerite to extensive ex-solution of chalcopyrite. They interpreted the anom-alous FeS content of chalcopyrite-bearing sphaleriteas an indication of high temperature, former pyrrho-tite-sphalerite equilibria, or disequilibrium assem-blages (Hutchison and Scott, 1978). At Bodenmais,chalcopyrite-bearing sphalerite in mutual contactswith pyrrhotite and pyrite is compositionally in-homogeneous-a feature that cannot be attributed toexsolution of chalcopyrite alone (Hutchison andScott, 1978). The exsolved phase in sphalerite fromBodenmais is always chalcopyrite, and no other Fe-Cu sulfides were observed in this ore. At the temper-ature of metamorphism at Bodenmais, chalcopyritewould be represented by a more-iron-rich inter-mediate solid solution (I"") (Barton, 1973; Cabi,1973). Hutchison and Scott noted that in the temper-ature range 600'-350"C and at 5 kbar sphalerite inequilibrium with pyrrhotite, pyrite, and I", contains0.0-0.4 wt. percent Cu in solid solution. The I," is un-stable below 350oC, and chalcopyrite containingabout 0.4 wt. percent Zn coexists with sphalerite,pyrrhotite, and pyrite. In the assemblage chalcopy-rite-sphalerite-pyrrhotite-pyrite at Bodenmais,sphalerite contains 0.03-0.4 wt. percent Cu, while thecoexisting chalcopyrite contains 0.08-0.16 wt. per-cent Zn in solid solution. The presence of chalcopy-rite as the only exsolved Cu-Fe sulfide, its low Zncontent, and the low Cu content of sphalerite suggestthat the assemblage chalcopyrite-pyrrhotite-pyrite-sphalerite at Bodenmais equilibrated to temperaturesbelow 350oC. In this assemblage the pyrrhotite thatoccurs as veinlets in sphalerite or at the immediatecontact with sphalerite crystals is monoclinic. Thepresence of monoclinic pyrrhotite extends the limitsof low-temperature equilibration of this assemblage
to below 250"C. It also suggests that reaction with
the monoclinic pyrrhotite is at least partly respon-
sible for the inhomogeneity observed in these sphal-erites.
The iron content of sphalerite coexisting with ei-
ther pyrrhotite or pyrite is essentially similar to or
slightly lower than that of sphalerite in the univariantassemblage sphalerite-pyrite-pyrrhotite. Under equi-librium conditions sphalerite in equilibrium withpyrrhotite alone or pyrite alone should have higheror lower iron contents, respectively, than sphaleritein equilibrium with both minerals. Scott (1976) ob-served that in many metamorphic terrains the equi-librium composition of sphalerite coexisting withiron-sulfide assemblages varies over a few meters oreven a few centimeters. He concluded that in the ab-sence of a fluid phase, the equilibrium domains ofiron and sulfur are very small relative to the size ofthe ore body, and therefore several local equilibriaare established in which the composition of sphaler-ite is buffered by the iron sulfide that occurs in its im-mediate vicinity. At Bodenmais, migmatization andthe presence ofhydrous phases strongly suggest thatthe P(H,O) was high during metamorphism. It istherefore possible that sulfur was mobile in the pres-
ence of a fluid phase and that thefiSr) varied withinnarrow ranges during the metamorphisrn of Silber-berg ore; these factors would account for the similar-ity in composition of sphalerite coexisting with pyrite
or pyrrhotite or both.A different interpretation, however, was given by
Barton and Skinner (1979) for the slightly lower iron
content observed in sphalerite coexisting with pyr-rhotite relative to sphalerite associated with pyrite
and pyrrhotite in ores that underwent slow cooling,such as the Sullivan ore, British Columbia (Ethier etal., 1976), and the Sulitjelma ore, Norway (Rai,
1978). Barton and Skinner interpreted this observa-tion as an indication of metastability, which they at-tributed to the reluctance of pyrite to nucleate at lowtemperatures even under conditions of pyrite super-saturation. They suggested that the low FeS contentof sphalerite in equilibrium with pyrrhotite relativeto that in the three-phase assemblage pyrite-pyrrho-
tite-sphalerite can be explained by assuming that thecomposition of sphalerite can still be adjusted by re-
action with pyrrhotite under conditions in which py-
rite can no longer nucleate, although it may continueto grow on previously existing nuclei. Under suchconditions the assemblage pyrite-pyrrhotite-sphaler-ite remains close to the equilibrium condition oncooling, whereas a pyrite-free assemblage undergoes
reaction, yielding a metastable assemblage of mono-clinic pyrrhotite and FeS-depleted sphalerite (andpossibly marcasite). In Bodenmais ore, monoclinicpyrrhotite commonly occurs in association with bothhexagonal pyrrhotite and pyrite, and this associationsuggests that it is a metastable phase. The commonoccurrence of monoclinic pyrrhotite at the interfacebetween hexagonal pyrrhotite and sphalerite and thedepletion of sphalerite in the immediate vicinity ofmonoclinic pyrrhotite suggest that the reaction pos-tulated by Barton and Skinner (1979\ between hex-agonal pyrrhotite and sphalerite apparently tookplace but did not proceed to completion.
In conclusion, the application of sphalerite geo-barometry may not be a reliable method for estimat-ing pressure in ores that underwent low-temperaturereactions, or in Cu-bearing zinc sulfide areas. How-ever, attempts to apply sphalerite geobarometry pro-vide valuable insights on the post-metamorphic low-temperature equilibration in these ores.
Acknowledgments
I thank Dr. Gunnar Kullerud for kindly providing the samplesused in this investigation and for useful discussions, and Dr. PaulB. Barton, Jr, for reviewing an early version of this manuscript,for stimulating discussions regarding the sphalerite geobarometer,and for providing a preprint of Barton and Skinner's articlequoted in the manuscript. Critical comments on the manuscript byDr. H S. Yoder, Jr., and L. B Wiggins are appreciated.
References
Barton, P B , Jr (1970) Sulfide petrology Mineral. Soc. Am Spec.Pap., 3, 187-198.
- (1973) Solid solution in the system Cu-Fe-S. Part l: TheCu-S and CuFe-S joins. Econ. Geol., 68,455465.
- and B. J. Skinner (1979) Sulfide mineral stabilities. In H.L Barnes, Ed., Geochemistry of Hydrothermal Ore Deposits,2ded, p.278403 Wiley, New York.
- and P Toulmin, III (1966) Phase relations in the Fe-Zn-Ssystem. Econ. Geol., 61,815-849.
Bliimel, P. and W. Schreyer (1977) Phase relations in pelitic andpsammitic gneisses of the sillimanite-potash feldspar and cor-dierite-potash feldspar zones in the Moldanubicum of the Lam-Bodenmais area, Bavaria J. Petrol., 18,431-459.
Brown, P. 8., E. J. Essene and W C. Kelly (1978) Sphalerite geo-barometry in the Balmat-Edwards district, New York. Am. Min-eral., 63, 250-257.
Cabri, J. L. (1973) New data on the phase relations in the Cu-Fe-S system. Econ. Geol., 68,443454.
Campbell, F A. and V. G. Ethier (1974) Sulfur isotopes, rron con-tent ofsphalerites and ore textures in the Anvil ore body, Can-ada- Econ. Geol., 69,482-493.
Colby, J. W. (1971) Magic IV---a Computer Program for Quan-titative Electron Microprobe Analysrs Bell Telephone Laborato-ries, Inc., Allentown, Pa
1037
Davis, G. L. and W. Schreyer (1962) Altersbestimmungen an Ge-
steinen des ostbayerischen Grundgebirges und ihre geologische
Deutung. Geol. Rundsch., 52, 146-169.
Ethier, V. G., F. A. Campbell, R. A. Both and N R. Krouse(1976) Geological setting ofthe Sullivan ore body and estimates
of temperatures and pressures of metamorphisrn. Econ. Geol.,
71 ,1570 -1588 .Fischer, G. (1938) Uber das Grundgebirge der Bayerischen Ost-
mark. Die Gneise ncirdlich des Pfahls. Jahrb. Preuss. Geol.
Lande sanst alt, 59, 289-152.Grove, D. I., R. A. Binns, F. M. Barrett and K. G. McQueen
(1975) Sphalerite compositions from Westem Australian nickel
deposits, a guide to equilibria below 300oC. Econ. Geol., 70,
t9t-396.Hegemann, F. and A. Maucher (1933) Die Bildungsgeschichte der
Kieslagersttitte im Silberberg bei Bodenmais. Abhandl. Geol.
Landesunters Bayer Oberbergamt, 11, 4-36.
Hutcheon, I. (1978) Calculation of metamorphic pressure usingsphalerite-pyrrhotite-pyrite equilibrium. Am. Mineral., 63, 87 -
95 .Hutchison, M. N. and S. D. Scott (1978) Effect of copper on the
sphalerite geobarometer (abstr.). Geol. Soc. Am. Abstracts with
Programs, 3,426.Lusk, J., F. A. Campbell and H. R. Krouse (1975) Application of
sphalerite geobarometry and sulfur isotope geothermometry to
ores of the Quemont Mine, Noranda, Quebec. Econ. Geol., 70,
107 1- 1083.Rai, K (1978) Micromineralogy and geochemistry of sphalerite
from Sulitjelma Mining District, Norway. Norsk Geol. Tidsskr.,
58, t7-32.
Schreyer, W., G. Kullerud and P. Ramdohr (1964) Metamorphic
conditions of ore and country rock of the Bodenrnais, Bavaria,
sulfide deposit. Neues Jahrb. Mineral. Abh., 101, l-26.
Schr6cke, H. (1955) Petrotektonische Untersuchung des Cordie-ritgneisgebietes um Bodenmais im Bayer. Wald und der ein-gelagerten Kieslagerstiitten. Heidelberger Beitr. Mineral. Petrog.,
4,464-503Schwarcz, E. J. and D. C. Harris (1970) Phases in natural pyrrho-
rite and the effect of heating on their magnetic properties andcomposition J. Geomagn. Geoelectr., 22, 463470.
Scou, S. D. (1973) Experimental calibration of the sphaleritegeobarometer Econ. Geol., 68, 466-4'14.
- (1976) Application of the sphalerite geobarometer to re-gionally metarnorphosed terrains Am. Mineral., 6 1, 661-670.
- and H. L. Barnes (1971) Sphalerite geothermometry andgeobarometry Econ. Geol.. 66, 475479.
R A. Both and S. A. Kissin (1977) Sulfide petrology of
the Broken Hill region, New South Wales. Econ. Geol., 72,
t4t0-1425.- and S. A Kissin (1973) Sphalerite composition in the Zn-
Fe-S system below 300"C. Econ. Geol., 68,475479.Wiggins, L. B. and J. R. Craig (1975) A reconnaissance investiga-
tion of chalcopyrite-sphalerite relationships in the Cu-Fe-Zn-Ssystem (abstr.). Geol. Soc. Am. Abstracts with Programs, T, 1327
Manuscript received, October 15, 1979;
acceptedfor publication, May 5, 1980.
BOCTOR: SPHA LERITE GEOBAROMETRY
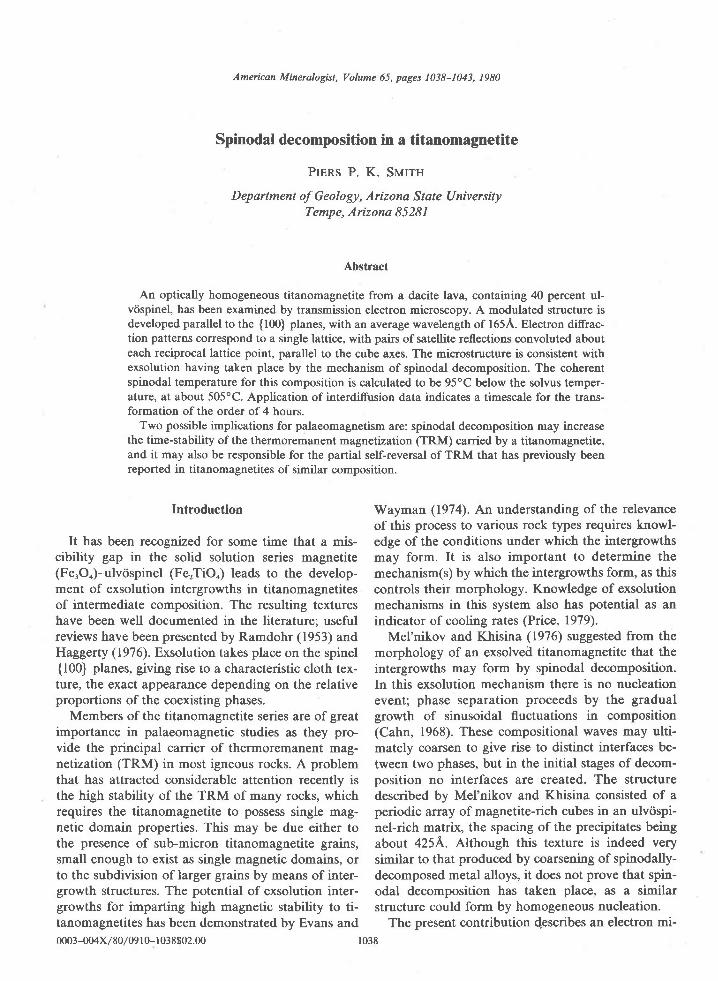
American Mineralogist, Volume 65, pages 1038-1043, 1980
Spinodal decomposition in a titanomagnetite
Plens P. K. Sunn
Department of Geology, Arizona State UniversityTempe, Arizona 85281
Abstract
An optically homogeneous titanomagnetite from a dacite lava, containing 40 percent ul-v<ispinel, has been examined by transmission electron microscopy. A modulated structure isdeveloped parallel to the {100} planes, with an average wavelength of 165A. Electron di-ffrac-tion patterns correspond to a single lattice, with pairs ofsatellite reflections convoluted abouteach reciprocal lattice point, parallel to the cube axes. The microstructure is consistent withexsolution having taken place by the mechanism of spinodal decomposition. The coherentspinodal temperature for this composition is calculated to be 95oC below the solvus temper-ature, at about 505"C. Application of interdiffusion data indicates a timescale for the trans-formation of the order of 4 hours.
Two possible implications for palaeomagnetism are: spinodal decomposition may increasethe time-stability of the thermoremanent magnetization (TRM) carried by a titanomagnetite,and it may also be responsible for the partial self-reversal of TRM that has previously beenreported in titanomagnetites of similar composition.
Introduction
It has been recognized for some time that a mis-cibility gap in the solid solution series magnetite(FerOo)-ulvrispinel (FerTiOo) leads to the develop-ment of exsolution intergrowths in titanomagnetitesof intermediate composition. The resulting textureshave been well documented in the literature; usefulreviews have been presented by Ramdohr (1953) andHaggerty (1976). Exsolution takes place on the spinel
{100} planes, giving rise to a characteristic cloth tex-ture, the exact appearance depending on the relativeproportions of the coexisting phases.
Members of the titanomagnetite series are of greatimportance in palaeomagnetic studies as they pro-vide the principal carrier of thermoremanent mag-netization (TRM) in most igneous rocks. A problemthat has attracted considerable attention recently isthe high stability of the TRM of many rocks, whichrequires the titanomagnetite to possess single mag-netic domain properties. This may be due either tothe presence of sub-micron titanomagnetite grains,small enough to exist as single magnetic domains, orto the subdivision of larger grains by means of inter-growth structures. The potential of exsolution inter-growths for imparting high magnetic stability to ti-tanomagnetites has been demonstrated by Evans and00o3-004x/80/09 10- 1038$02.00
Wayman (1974). An understanding of the relevanceof this process to various rock types requires knowl-edge of the conditions under which the intergrowthsmay form. It is also important to determine themechanism(s) by which the intergrowths form, as thiscontrols their morphology. Knowledge of exsolutionmechanisms in this system also has potential as anindicator of cooling rates (Price, 1979).
Mel'nikov and Khisina (1976) suggested from themorphology of an exsolved titanomagnetite that theintergrowths may form by spinodal decomposition.In this exsolution mechanism there is no nucleationevenU phase separation proceeds by the gradualgrowth of sinusoidal fluctuations in composition(Cahn, 1968). These compositional waves may ulti-mately coarsen to give rise to distinct interfaces be-tween two phases, but in the initial stages of decom-position no interfaces are created. The structuredescribed by Mel'nikov and Khisina consisted of aperiodic array of magnetite-rich cubes in an ulvospi-nel-rich matrix, the spacing of the precipitates beingabout 425A. Although this texture is indeed verysimilar to that produced by coarsening of spinodally-decomposed metal alloys, it does not prove that spin-odal decomposition has taken place, as a similarstructure could form by homogeneous nucleation.
The present contribution dpscribes an electron mi-
1038
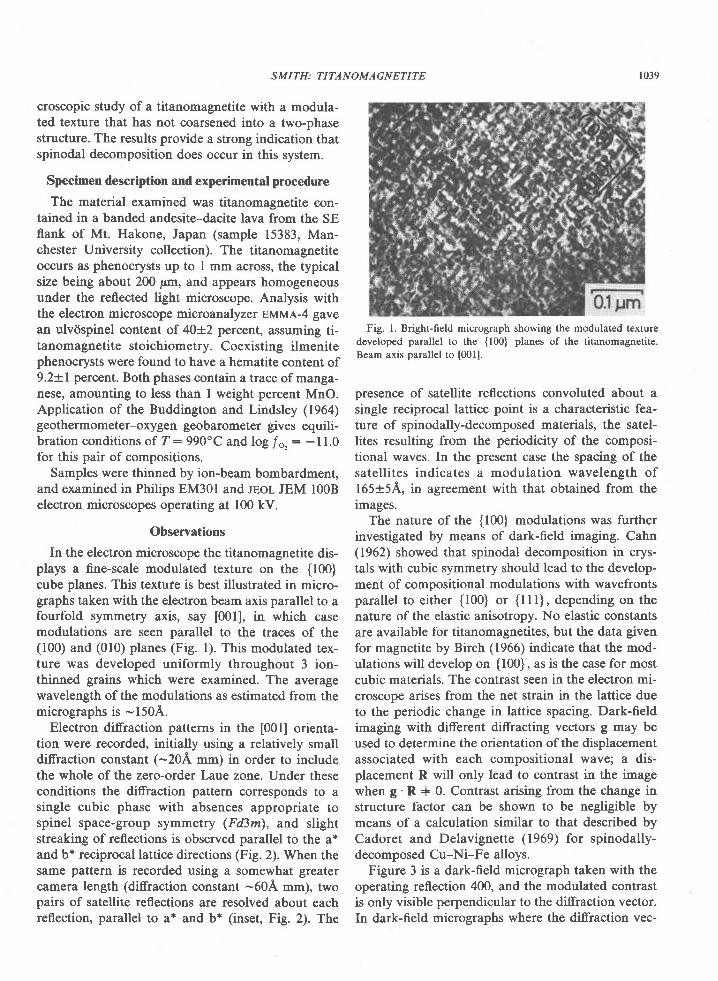
S M ITH: TITA N O MA GN ETITE 1039
croscopic study of a titanomagnetite with a modula-ted texture that has not coarsened into a two-phasestructure. The results provide a strong indication thatspinodal decomposition does occur in this system.
Specimen description and experimental procedure
The material examined was titanomagnetite con-tained in a banded andesite-dacite lava from the SEflank of Mt. Hakone, Japan (sample 15383, Man-chester University collection). The titanomagnetiteoccurs as phenocrysts up to I mm across, the typicalsize being about 200 pm, and appears homogeneousunder the reflected light microscope. Analysis withthe electron microscope microanalyzer EMMA-4 gavean ulvdspinel content of 40t2 percent, assuming ti-tanomagnetite stoichiomptry. Coexisting ilmenitephenocrysts were found to have a hematite content of9.2+l percent. Both phases contain Ltrace of manga-nese, amounting to less than I weight percent MnO.Application of the Buddington and Lindsley (196a)geothermometer-oxygen geobarometer gives equili-bration conditions of T :990'C and log .fo, : -l1.0for this pair of compositions.
Samples were thinned by ion-beam bombardment,and examined in Philips EM30l and lBoL JEM l00Belectron microscopes operating at 100 kV.
Observations
In the electron microscope the titanomagnetite dis-plays a fine-scale modulated texture on the {100}cube planes. This textufe is best illustrated in micro-graphs taken with the electron beam axis parallel to afourfold symmetry axis, say [001], in which casemodulations are seen parallel to the traces of the(100) and (010) planes (Fig. l). This modulated tex-ture was developed uniformly throughout 3 ion-thinned grains which were examined. The averagewavelength of the modulations as estimated from themicrographs is -150A.
Electron diffraction patterns in the [001] orienta-tion were recorded, initialy using a relatively smalldiffraction constant (-204 mm) in order to includethe whole of the zero-order Laue zone. Under theseconditions the diffraction pattern corresponds to asingle cubic phase with absences appropriate tospinel space-group symmetry (Fd3m), and slightstreaking of reflections is observed parallel to the a*and b* reciprocal lattice directions (Fig. 2). When thesame pattern is recorded using a somewhat greatercamera length (diffraction constant -60A mm), twopairs of satellite reflections are resolved about eachreflection, parallel to a* and b* (inset, Fig. 2). The
Fig. l. Bright-field micrograph showing the modulated texturedeveloped parallel to the (100] planes of the titanomagnetite.Beam axis parallel to [001].
presence of satellite reflections convoluted about asingle reciprocal lattice point is a characteristic fea-ture of spinodally-decomposed materials, the satel-lites resulting from the periodicity of the composi-tional waves. In the present case the spacing of thesatell i tes indicates a modulation wavelength ofl65a5A, in agreement with that obtained from thermages.
The nature of the {100} modulations was furtherinvestigated by means of dark-field imaging. Cahn(1962) showed that spinodal decomposition in crys-tals with cubic symmetry should lead to the develop-ment of compositional modulations with wavefrontsparallel to either {100} or {lll}, depending on thenature of the elastic anisotropy. No elastic constantsare available for titanomagnetites, but the data givenfor magnetite by Birch (1966) indicate that the mod-ulations will develop on {100}, as is the case for mostcubic materials. The contrast seen in the electron mi-croscope arises from the net strain in the lattice dueto the periodic change in lattice spacing. Dark-fieldimaging with different diffracting vectors g may beused to determine the orientation of the displacementassociated with each compositional wave; a dis-placement R will only lead to contrast in the irnagewhen g'R + 0. Contrast arising from the change instructure factor can be shown to be negligible bymeans of a calculation similar to that described byCadoret and Delavignette (1969) for spinodally-decomposed Cu-Ni-Fe alloys.
Figure 3 is a dark-field micrograph taken with theoperating reflection 400, and the modulated contrastis only visible perpendicular to the diffraction vector.In dark-field micrographs where the diffraction vec-
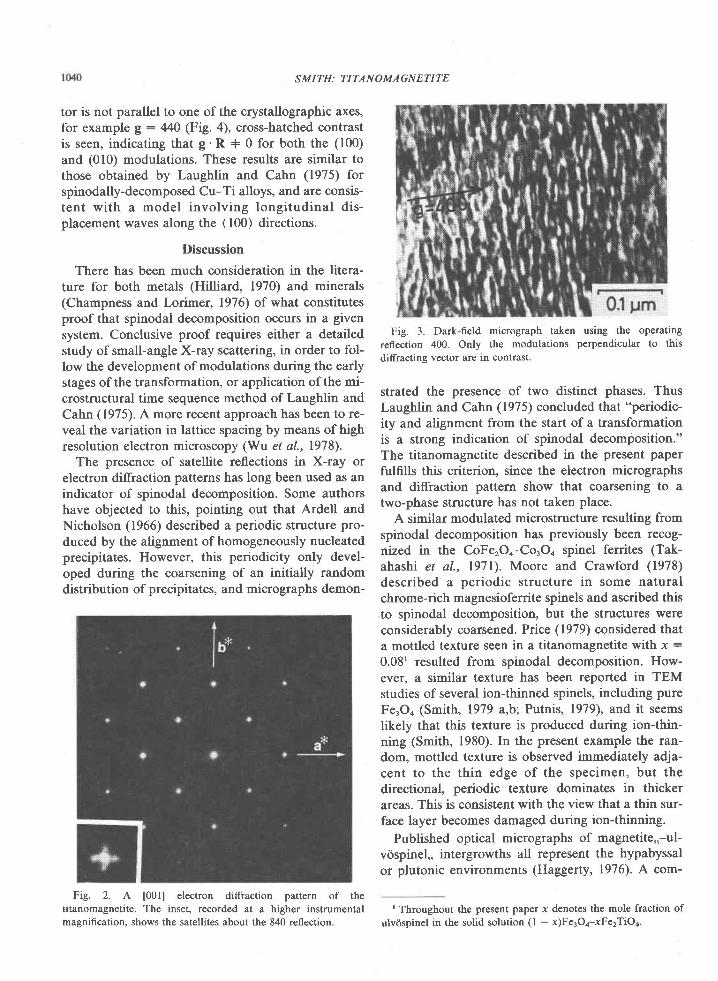
SM I TH : TI TA N O MAGN ETITE
tor is not parallel to one of the crystallographic axes,for example E: 440 (Fig. 4), cross-hatched contrastis seen, indicating that g'R + 0 for both the (100)
and (010) modulations. These results are si:nilar tothose obtained by Laughlin and Cahn (1975) forspinodally-decomposed Cu-Ti alloys, and are consis-tent with a model involving longitudinal dis-placement waves along the (100) directions.
Discussion
There has been much consideration in the litera-ture for both metals (Hilliard, 1970) and minerals(Champness and Lorimer, 1976) of what constitutesproof that spinodal decomposition occurs in a given
system. Conclusive proof requires either a detailedstudy of small-angle X-ray scattering, in order to fol-low the development of modulations during the earlystages of the transformation, or application of the mi-crostructural time sequence method of Laughlin andCahn (1975). A more recent approach has been to re-veal the variation in lattice spacing by means of highresolution electron microscopy fllru e/ al., 1978).
The presence of satellite reflections in X-ray orelectron diffraction patterns has long been used as anindicator of spinodal decomposition. Some authorshave objected to this, pointing out that Ardell andNicholson (1966) described a periodic structure pro-
duced by the alignment of homogeneously nucleatedprecipitates. However, this periodicity only devel-oped during the coarsening of an initially randomdistribution of precipitates, and micrographs demon-
Fig. 2. A [00ll electron diffraction pattern of thetitanomagnetite. The inset, recorded at a higher instrumentalmagnification, shows the satellites about the 840 reflection.
Fig. 3. Dark-field micrograph taken using the operating
reflection 400. Only the modulations perpendicular to this
diffracting vector are in contrast.
strated the presence of two distinct phases. ThusLaughlin and Cahn (1975) concluded that "periodic-ity and alignment from the start of a transformationis a strong indication of spinodal decomposition."The titanomagnetite described in the present paperfutfrlls this criterion, since the electron nicrographsand diffraction pattern show that coarsening to atwo-phase structure has not taken place.
A similar modulated microstructure resulting fromspinodal decomposition has previously been recog-nized in the CoFerOo-Co.Oo spinel ferrites (Tak-
ahashi et al., l97l). Moore and Crawford (1978)
described a periodic structure in some naturalchrome-rich magnesioferrite spinels and ascribed thisto spinodal decomposition, but the structures wereconsiderably coarsened. Price (1979) considered thata mottled texture seen in a titanomagnetite with x :
0.08' resulted from spinodal decomposition. How-ever, a similar texture has been reported in TEMstudies of several ion-thinned spinels, including pure
Fe.Oo (Smith, 1979 a,b; Putnis, 1979), and it seemslikely that this texture is produced during ion-thin-ning (Smith, 1980). In the present example the ran-dom, mottled texture is observed immediately adja-cent to the thin edge of the specimen, but thedirectional, periodic texture dominates in thickerareas. This is consistent with the view that a thin sur-face layer becomes damaged during ion-thinning.
Published optical micrographs of magnetite".-ul-v6spinel"" intergrowths all represent the hypabyssal
or plutonic environments (Haggerty, 1976). A com-
rThroughout the present paper r denotes the mole fraction of
ulv<ispinel in the solid solution (l - -r)Fe3Oa-xFe2TiOa'
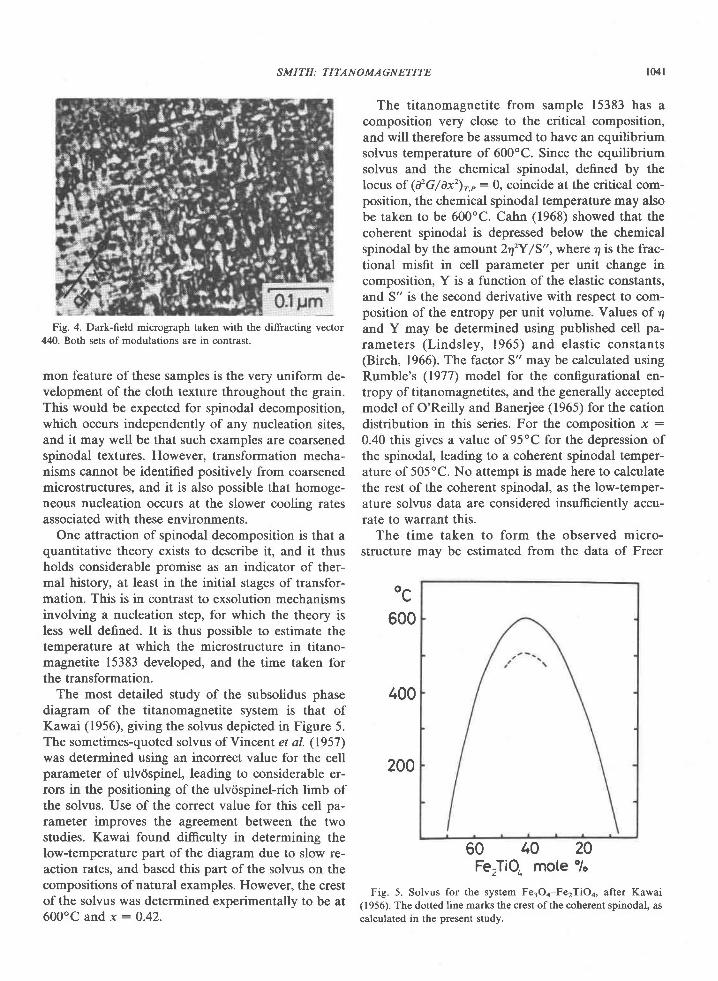
Fig. 4. Dark-field micrograph taken with the diffracting vector440. Both sets of modulations are in contrast.
mon feature of these samples is the very uniform de-velopment of the cloth texture throughout the grain.This would be expected for spinodal decomposition,which occurs independently of any nucleation sites,and it may well be that such examples are coarsenedspinodal textures. However, transformation mecha-nisms cannot be identified positively from coarsenedmicrostructures, and it is also possible that homoge-neous nucleation occurs at the slower cooling ratesassociated with these environments.
One attraction of spinodal decomposition is that aquantitative theory exists to describe it, and it thusholds considerable promise as an indicator of ther-mal history, at least in the initial stages of transfor-mation. This is in contrast to exsolution mechanismsinvolving a nucleation step, for which the theory isless well defined. It is thus possible to estimate thetemperature at which the microstructure in titano-magnetite 15383 developed, and the time taken forthe transformation.
The most detailed study of the subsolidus phasediagram of the titanomagnetite system is that ofKawai (1956), giving the solvus depicted in Figure 5.The sometimes-quoted solvus of Vincent et al. (1957)was determined using an incorrect value for the cellparameter of ulvcispinel, leading to considerable er-rors in the positioning of the ulvcispinel-rich limb ofthe solvus. Use of the correct value for this cell pa-rameter improves the agreement between the twostudies. Kawai found difficulty in determining thelow-temperature part of the diagram due to slow re-action rates, and based this part ofthe solvus on thecompositions of natural examples. However, the crestof the solvus was determined experimentally to be at600'C and x:0.42.
SM ITH: TITA N OMAGNETITE
600
400
200
The titanomagnetite from sample 15383 has acomposition very close to the critical composition,and will therefore be assumed to have an equilibriumsolvus temperature of 600"C. Since the equilibriumsolvus and the chemical spinodal, defined by thelocus of (dGl0x'),.": 0, coincide at the critical com-position, the chemical spinodal temperature may alsobe taken to be 600"C. Cahn (1968) showed that thecoherent spinodal is depressed below the chemicalspinodal by the amount 2rfY/5", where q is the frac-tional misfit in cell parameter per unit change incomposition, Y is a function of the elastic constants,and S" is the second derivative with respect to com-position of the entropy per unit volume. Values of 4and Y may be determined using published cell pa-rameters (Lindsley, 1965) and elastic constants(Birch, 1966). The factor S" may be calculated usingRumble's (1977) model for thg configurational en-tropy of titanomagnetites, and the generally acceptedmodel of O'Reilly and Banerjee (1965) for the cationdistribution in this series. For the composition x :
0.40 this gives a value of 95oC for the depression ofthe spinodal, leading to a coherent spinodal temper-ature of 505"C. No attempt is made here to calculatethe rest of the coherent spinodal, as the low-temper-ature solvus data are considered insufficiently accu-rate to warrant this.
The time taken to form the observed micro-structure may be estimated from the data of Freer
t04l
oc
60 40FerTiQ mote
Fig. 5. Solvus for the system Fe3Oa-Fe2TiOa, after Kawai( 1956). The dotted line marks the crest of the coherent spinodal, ascalculated in the present study.
20olo

tM2 S M ITH: TITA N O MAGN ETITE
and Hauptman (1978) for interdiffusion betweenpure Fe3O4 and titanomagnetite with x : 0.20. Theexponential expression obtained by these authorsleads to an interdiffusion constant of l.l x l0-" cm2/sec at 500oC. Freer and Hauptman showed how onemay calculate the approximate time taken to create alamellar intergrowth, given the interdiffusion con-stant and the scale of the microstructure. Taking theaverage interdiffusion distance in the spinodally-de-composed titanomagnetite to be half of the modula-tion wavelength, one obtains a transformation timeof -4 hours. This figure should only be treated as arough guide, since the classical diffusion laws are notstrictly applicable in the immediate vicinity of thespinodal, but it does indicate that this kind of micro-structure may form in titanomagnetites on the time-scale of laboratory experiments.
Implications for palaeomagnetism
Exsolution in titanomagnetites was previously con-sidered to be restricted to the hypabyssal and plu-tonic environments (Haggerty, 1976); the present re-sults show that submicroscopic exsolution may occurin volcanic titanomagnetites of suitable composition.As mentioned in the introduction, such exsolutioncan lead to an increased coercivity, and therefore anincreased time-stability, of the TRM carried by arock. An analogous increase in coercivity was ob-served in spinodally-decomposed cobalt ferrite byTakahashi et al. (1971). The form of the titano-magnetite solvus indicates that the coherent spinodalwill be at prohibitively low temperatures for spinodaldecomposition to occur in titanomagnetites fromsubmarine tholeiites, which typically have ulvcispinelcontents of -0.6-0.7; a TEM study of such a sampledid not reveal any exsolution (Smith, 1979a). Spin-odal decomposition is probably restricted to titano-magnetites from intermediate and acidic volcanicsuites, which have lower ulv<ispinel contents.
Fine-scale exsolution in titanomagnetite may alsobe relevant to the problem ofself-reversal ofthe nat-ural remanent magnetization of rocks. Although it isnow well established that reversed magnetizations ofrocks are almost exclusively the result of geomag-netic field reversals, there is still some interest in pos-sible mechanisms for the complete or partial self-re-versals recorded in a few rocks.
Shcherbakov et al. (1975) described a partial self-reversal that occurs in some synthetic mixed ferritesand in a natural Fe.Oo-MgrTiOo spinel. The effect ismanifested as a sharp peak in the thermal demagne-tization curve of a thermoremanent magnetization
(TRM) near the final Curie point, implying that thepartial TRM acquired by the sample over this tem-perature range is reversed. Bol'shakov et al. (1977)
showed that this behavior is consistent with a model
in which chemical inhomogeneities on a scale of-100A lead to a diffuse Curie temperature, thechemical composition being a continuous function ofposition. Spinodal decomposition clearly provides apossible mechanism to produce this kind of in-homogeneity. A similar partial self-reversal was ob-served by Petherbridge et al. (1974) in some partially
unmixed synthetic titanomagnetites. The anomalouspeak was present for samples cooled from 1350"C toroom temperature over a l5-hour period, but was ab-sent in a rapidly quenched sample. The timescale in-dicated for this exsolution process is thus similar to
that calculated for spinodal decomposition in thepresent paper.
A natural example of a partially seH-reversed rockis the lava from Mt. Etna, Sicily, described by Helleret al. (1979). The TRM of this rock is carried by opti-cally homogeneous titanomagnetite that is zonedfrom x : 0.34 to 0.45. The self-reversal was ascribed
to magnetostatic interaction between exsolved Ti-
rich and Ti-poor phases, with compositions x -0.12
and -0.55. In view of the similar bulk compositionand geological environment to the titanomagnetitefrom lava 15383, it is likely that the Etna material
also exsolved by spinodal decomposition. Transmis-
sion electron microscopy of such thermomagneticallycharacteized samples would be of great value in un-derstanding self-reversal mechanisms of the ferri-magnetic spinels.
Acknowledgments
This research was commenced at the University of Manchester
during the tenure of a Natural Environment Research Council fel-
lowship, which I gratefully acknowledge. I thank Professor J.
Zussman (Department of Geology) and Professor E. Smith (De-
partment of Metallurgy) for the provision of laboratory facilities
during this period.
The study was completed in the electron microscope laboratory
in the Center for Solid State Science at Arizona State University,
with financial support from NSF grant EAR 7'l-00128. I thank
David R. Veblen for reviewing the manuscript.
References
Ardell, A. J. and R. B. Nicholson (1966) On the modulated struc-
ture of aged Ni-Al alloys. Acta Metallurgica, 14, 1295-13O9.
Birch, F. (1966) Compressibility; elastic constants. In S. P. Clark,
Ed , Handbook of Physical Constants, p. 97-173- Geol. Soc. Am.
Mem.97 .Bol'shakov, A. S., A. K. Gapeyev, D. M. Dashevskaya, B. N.
Mel'nikov and V. P. Shcherbakov (1977) Study of the thermo-
remanent magnetization anomaly in synthetic ferrite. Dokl.
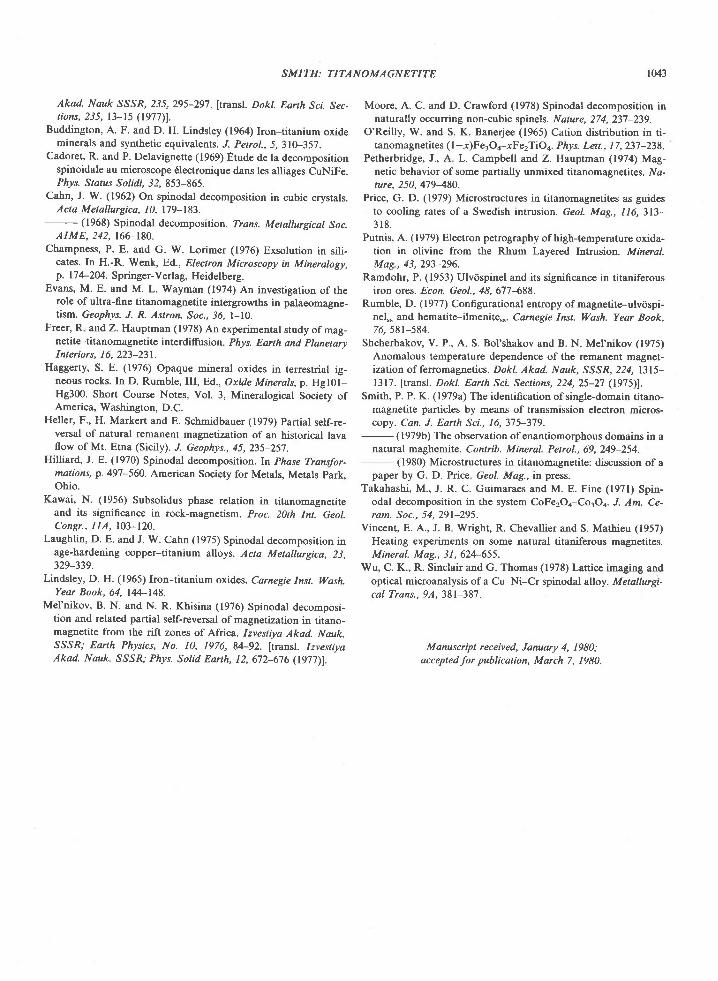
Akad. Nauk SSS& 2-tt 295-297. [transl. Dol</. Earth Sci. Sec-tions, 235, l3-15 (1977).
Buddington, A. F. and D. H. Lindsley (1964) Iron-titanium oxideminerals and synthetic equivalents. J. Petrol., t 310-357.
Cadoret, R. and P. Delavignette (1969) Etude de la decompositionspinoidale au microscope 6lectronique dans les alliages CuNiFe.Phys. Status Solidi, 32,853-865.
Cahn, J. W. (1962) On spinodal decomposition in cubic crystals.Acta Metallurgica, 10, 179-181.
- (1968) Spinodal decomposition. Trans. Metallurgical Soc.AIME, 242, 166-180.
Champness, P. E. and G. W. Lorimer (1976) Exsolution in sili-cates. In H.-R. Wenk, Ed., Electron Microscopy in Mineralogy,p. l7 4-2M. Springer-Verlag, Heidelberg.
Evans, M. E. and M. L. Wayman (1974) An investigation of therole of ultra-fine titanomagnetite intergrowths in palaeomagne-tism. Geophys. J. R. Astron. Soc., 36, l-lo.
Freer, R and Z. Hauptman (1978) An experimental study of mag-netite-titanomagnetite interdiffusion. Pftys. Eailh and planetary
Interiors, I 6, 223-231.Haggerty, S. E. (1976) Opaque mineral oxides in terrestrial ig-
neous rocks. In D. Rumble, III, Ed., Oxide Minerals, p. Hgl0l-Hg300. Short Course Notes, Vol. 3, Mineralogical Society ofAmerica, Washington, D.C.
Heller, F., H. Markert and E. Schmidbauer (1979) panial self-re-versal of natural remanent magnetization of an historical lavaflow of Mt. Etna (Sicily). J. Geophys., 45, 235-25'1.
Hilliard, J. E. (1970) Spinodal decomposirion. lt phase Transfor-mations, p. 497-560. American Society for Metals, Metals park,
Ohio.Kawai, N. (1956) Subsolidus phase relation in titanomagneure
and its significance in rock-magnetism. Proc. 20th Int. Geol.Congr. , I IA,103-120.
Laughlin, D. E. and J. W. Cahn (1975) Spinodal decomposition inage-hardening copper-titanium alloys. Acta Metallurgica, 23,329-339.
Lindsley, D. H. (1965) Iron-titanium oxides. Carnegie Inst. Wash.Year Book, 64, 144-148.
Mel'nikov, B. N. and N. R. Khisina (1976) Spinodal decomposi-tion and related partial self-reversal of magnetization in titano-magnetite from the rift zones of Africa. Izvestiya Akad. Nauk.SSSR; Earth Physics, No. 10, 1976, 84-92. ftransl. IzvestiyaAkad. Nauk. SSSR; Pftys. Solid Earth, t2,672-676 (t977)1.
S M ITH : TITAN OMA GN ETITE 1043
Moore, A. C. and D. Crawford (1978) Spinodal decomposition innaturally occurring non-cubic spinels. N ature, 2 7 4, 237 -239.
O'Reilly, W. and S. K. Banerjee (1965) Cation distribution in ti-tanomagnetites ( l-x)Fe3Oa-xFe2TiOa. Phys. Lett., I 7, 237 -238.
Petherbridge, J., A L. Campbell and Z. Hauptman (1974) Mag-netic behavior of some partially unmixed titanomagne tites. .l[a-ture, 250, 479480.
Price, G. D. (1979) Microstructures in titanomagnetites as guidesto cooling rates of a Swedish intrusion. Geol. Mag., 116, 313-3 1 8 .
Putnis, A. (1979) Electron petrography ofhigh+emperature oxida-tion in olivine from the Rhum Layered Intrusion. Mineral.Mag., 43,293-296.
Ramdohr, P. (1953) Ulv<ispinel and its significance in titaniferousiron ores. Econ. Geol., 48, 67'l-688.
Rumble, D. (1977) Configurational entropy of magnetite-ulv<ispi-nel"" and hematite-ilmenite"". Carnegie Inst. Wash, Year Book,76.58r-584.
Shcherbakov, V. P., A. S. Bol'shakov and B. N. Mel'nikov (1975)Anomalous temperature dependence of the remanent magnet-ization offerromagnetics. Dokl. Akad. l{azk, SSSR, 224, l3l5-1317. [transl. Dokl. Earth Sci. Sections, 224,25-2'l (1975)].
Smith, P. P. K. (1979a) The identification of single-domain ritano-magnetite particles by means of transmission electron micros-copy. Can. J. Earth Sci., 16,375-3'19.
- (1979b) The observation of enantiomorphous domains in anatural maghem ite. C ont rib. M ineral. P et r ol., 69, 249-254.
- (1980) Microstructures in titanomagnetite: discussion of apaper by G. D. Price Geol. Mag., in press.
Takahashi, M., J. R. C. Guimaraes and M. E. Fine (1971) Spin-odal decomposition in the system CoFe2O4-Co3Oo. "/. Am. Ce-ram. Soc., 54,291-295.
Vincent, E. A., J. B Wright, R. Chevallier and S. Mathieu (1957)
Heating experiments on some natural titaniferous magnetites.Mineral. Mag., 3 1, 62+655.
Wu, C. K., R. Sinclair and G. Thomas (1978) Lattice imaging andoptical microanalysis of a Cu-Ni-Cr spinodal alloy. Metallurgi-cal Trans., 9A,381-f8'7 -
Manuscript received, January 4, 1980;acceptedfor publication, March 7, 1980.
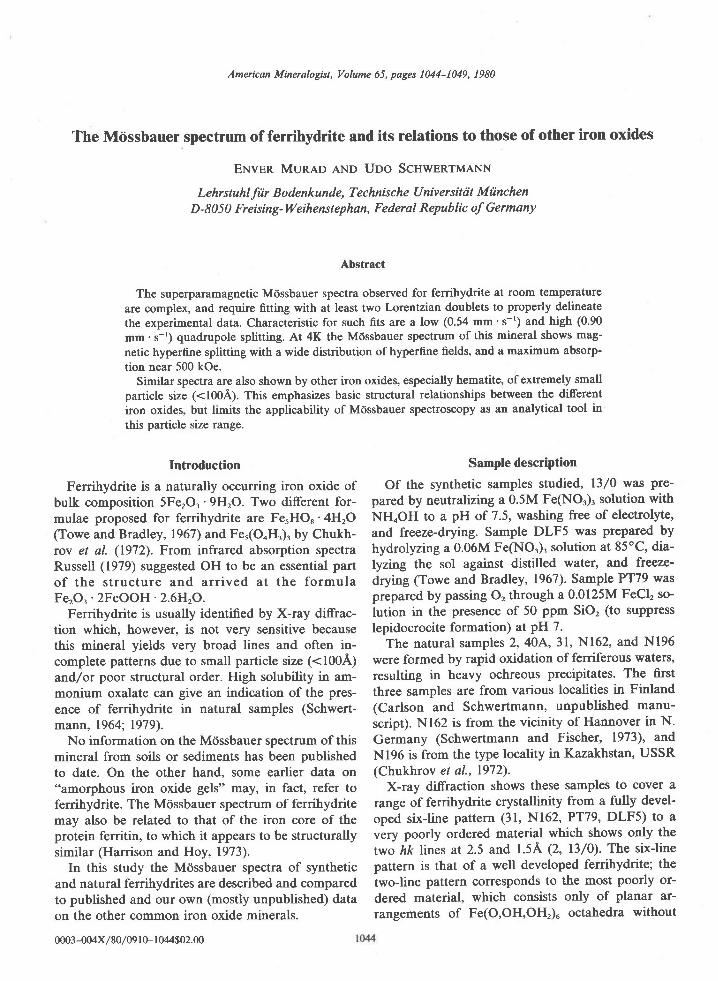
American Mineralogist, Volume 65, pages 1044-149, D80
The Mdssbauer spectrum of ferrihydrite and its relations to those of other iron oxides
ENven Munao eNu Uoo ScnwBntuaxn
Lehrstuhl fiir Bodenkunde, Technische Universitrit Mtinchen
D - 80 5 0 Freising- ll/eihenstephan, Federal Repub lic of Germany
Abstract
The superparamagnetic Mcissbauer spectra observed for ferrihydrite at room temperatureare complex, and require fltting with at least two Lorentzian doublets to properly delineatethe experimental data. Characteristic for such fits are a low (0.54 mm's-') and high (0.90mm. s-') quadrupole splitting. At 4K the Mdssbauer spectrum of this mineral shows mag-
netic hyperfine splitting with a wide distribution of hyperfine flelds, and a maximum absorp-tion near 500 kOe.
Similar spectra are also shown by other iron oxides, especially hematite, of extremely smallparticle size (<100A). This emphasizes basic structural relationships between the differentiron oxides, but limits the applicability of Mdssbauer spectroscopy as an analytical tool inthis particle size range.
Introduction
Ferrihydrite is a naturally occurring iron oxide ofbulk composition 5FerOr'9HrO. Two di-fferent for-mulae proposed for ferrihydrite are FerHO.'4HrO(Towe and Bradley,1967) and Fe,(OoH.), by Chukh-tov et al. (1972). From infrared absorption spectraRussell (1979) suggested OH to be an essential partof the structure and arr ived at the formulaFe,O, '2FeOOH '2.6H,O.
Ferrihydrite is usually identified by X-ray diffrac-tion which, however, is not very sensitive becausethis mineral yields very broad lines and often in-complete patterns due to small particle size (<100A)and/or poor structural order. High solubility in am-monium oxalate can give an indication of the pres-ence of ferrihydrite in natural samples (Schwert-mann, 1964;1979).
No information on the M0ssbauer spectrum of thismineral from soils or sediments has been publishedto date. On the other hand. some earlier data on"amorphous iron oxide gels" may, in fact, refer toferrihydrite. The Mcissbauer spectrum of ferrihydritemay also be related to that of the iron core of theprotein ferritin, to which it appears to be structurallysimilar (Harrison and Hoy, 1973).
In this study the Mcissbauer spectra of syntheticand natural ferrihydrites are described and comparedto published and our own (mostly unpublished) dataon the other common iron oxide minerals.
Sample descriPtion
Of the synthetic samples studied, l3l0 was pre-pared by neutralizing a 0.5M Fe(NOr)' solution withNHIOH to a pH of 7.5, washing free of electrolyte,and freeze-drying. Sample DLF5 was prepared byhydrolyzing a 0.06M Fe(NOr), solution at 85oC, dia-lyzrng the sol against distilled water, and freeze-drying (Towe and Bradley, 1967). Sample PT79 wasprepared by passing O, through a 0.0125M FeCl, so-lution in the presence of 50 ppm SiO' (to supptesslepidocrocite formation) at PH 7.
. The natural samples 2, 40A,31, N162, and Nl96were formed by rapid oxidation of ferriferous waters,resulting in heavy ochreous precipitates. The firstthree samples are from various localities in Finland(Carlson and Schwertmann, unpublished manu-script). Nl62 is from the vicinity of Hannover in N.Germany (Schwertmann and Fischer, 1973), andNl96 is from the type locality in Kazakhstan, USSR(Chukhrov et al., 1972).
X-ray diffraction shows these samples to cover arange of ferrihydrite crystallinity from a fully devel-oped six-line pattern (31, N162, PT79, DLF5) to avery poorly ordered material which shows only thetwo hk lines at 2.5 and l.5L (2, l3l0). The six-linepattern is that of a well developed ferrihydrite; thetwo-line pattern corresponds to the most poorly or-dered material, which consists only of planar ar-rangements of Fe(O,OH,OHr)u octahedra without
000.3-00'4X / 80 / 09 r 0- l 044$02.00
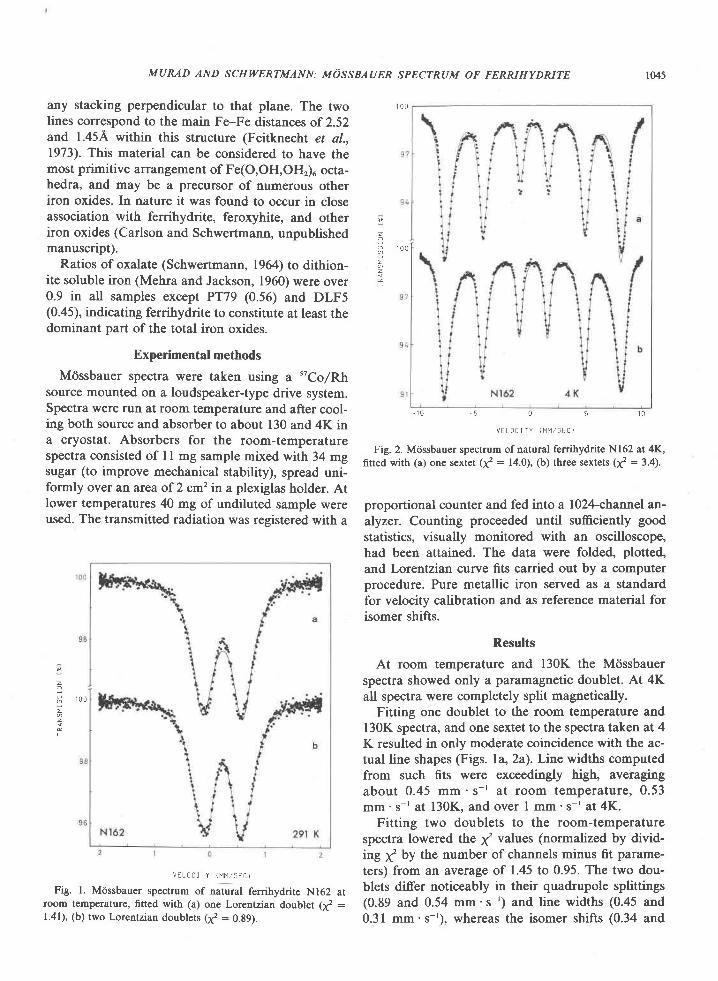
any stacking perpendicular to that plane. The twolines correspond to the main Fe-Fe distances of 2.52and 1.45A within this structure (Feitknecht et al.,1973). This material can be considered to have themost primitive arrangement of Fe(O,OH,OHr)u octa-hedra, and may be a precursor of numerous otheriron oxides. In nature it was found to occur in closeassociation with ferrihydrite, feroxyhite, and otheriron oxides (Carlson and Schwertmann, unpublishedmanuscript).
Ratios of oxalate (Schwertmann, 1964) to dithion-ite soluble iron (Mehra and Jackson, 1960) were over0.9 in all samples except PT79 (0.56) and DLF5(0.45), indicating ferrihydrite to constitute at least thedominant part of the total iron oxides.
Experimental methods
Mdssbauer spectra were taken using a "Co/Rhsource mounted on a loudspeaker-type drive system.Spectra were run at room temperature and after cool-ing both source and absorber to about 130 and 4K ina cryostat. Absorbers for the room-temperaturespectra consisted of I I mg sample mixed with 34 mgsugar (to improve mechanical stability), spread uni-formly over an area of 2 cm' in a plexiglas holder. Atlower temperatures 40 mg of undiluted sample wereused. The transmitted radiation was registered with a
v E L 0 c t T Y ( N 1 t { , / 5 E C i
Fig. l. M<issbauer spectrum of natural ferrihydrite Nl62 atroom temperature, fitted with (a) one Lorentzian doublet (t' :1.41), (b) two Lorentzian doublets (t' : 0.89).
1045
1 0 0
- l o - 5
u r a o r r t o , , " " r , r ,
u 1 0
Fig. 2. Mdssbauer spectrum of natural ferrihydrite Nl62 at 4K,fitted with (a) one sextet (t' : 14.0), (b) three sextets k2 : 3.4).
proportional counter and fed into a 1024-channel an-
alyzer. Counting proceeded until sufficiently goodstatistics, visually monitored with an oscilloscope,had been attained. The data were folded, plotted,and Lorentzian curve fits carried out by a computerprocedure. Pure metallic iron served as a standardfor velocity calibration and as reference material forisomer shifts.
Results
At room temperature and l30K the Mcissbauerspectra showed only a paramagnetic doublet. At 4Kall spectra were completely split magnetically.
Fitting one doublet to the room temperature andl30K spectra, and one sextet to the spectra taken at 4K resulted in only moderate coincidence with the ac-tual line shapes (Figs. la, 2a). Lrne widths computedfrom such fits were exceedingly high, averagingabout 0.45 mm's-r at room temperature, 0.53mm's- ' at 130K. and over I mm's- ' at 4K.
Fitting two doublets to the room-temperaturespectra lowered the t' values (normalized by divid-ing t' by the number of channels minus fit parame-ters) from an average of 1.45 to 0.95. The two dou-blets differ noticeably in their quadrupole splittings(0.89 and 0.54 mm's-') and line widths (0.45 and0.3 I mm's-'), whereas the isomer shifts (0.34 and
MURAD AND SCHWERTMANN: MOSSBAUER SPECTRUM OF FERRIHYDRITE
- t o o
t
3 l o o;
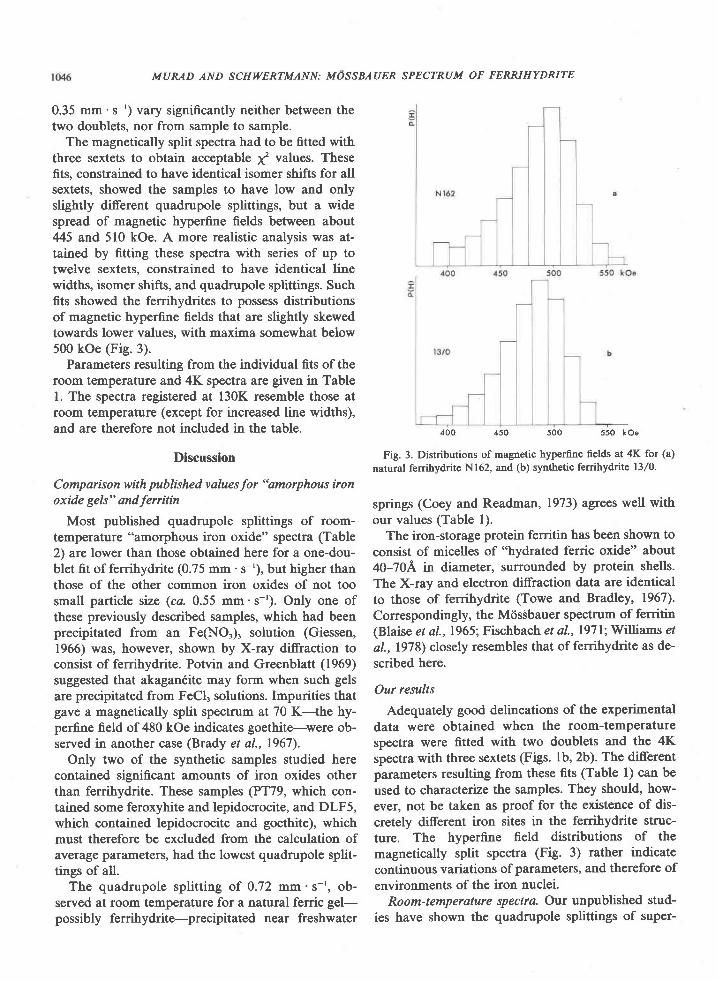
MURAD AND SCHWERTMANN: MOSSBAUER SPECTRUM OF FERRIHYDRITE
0.35 mm's-') vary significantly neither between thetwo doublets, nor from sample to sample.
The magnetically split spectra had to be fitted withthree sextets to obtain acceptable t' values. Thesefits. constrained to have identical isomer shifts for allsext€ts, showed the samples to have low and onlyslightly different quadrupole sptttings, but a widespread of magnetic hyperfine fields between about445 and 510 kOe. A more realistic analysis was at-tained by fitting these spectra with series of up totwelve sextets. constrained to have identical linewidths, isomer shifts, and quadrupole splittings. Suchfits showed the ferrihydrites to possess distributionsof magnetic hyperfine fields that are slightly skewedtowards lower values. with maxima somewhat below500 koe (Fig. 3).
Parameters resulting from the individual fits of theroom temperature and 4K spectra are given in Tablel. The spectra registered at l30K resemble those atroom temperature (except for increased line widths),and are therefore not included in the table.
Discussion
Comparison with published valuesfor "amorphous ironoxide gels" andfenitin
Most published quadrupole sptttings of room-temperature "amorphous iron oxide" spectra (Table2) are lower than those obtained here for a one-dou-blet fit of ferrihydrite (0.75 mm ' s-'), but higher thanthose of the other cornmon iron oxides of not toosmall particle size (ca. 0.55 mm' s-'). Only one ofthese previously described samples, which had beenprecipitated from an Fe(NO'), solution (Giessen,1966) was, however, shown by X-ray diffraction toconsist of ferrihydrite. Potvin and Greenblatt (1969)suggested that akagan6ite may form when such gelsare precipitated from FeCl, solutions. Impurities thatgave a magneticauy split spectrum at 70 K-the hy-perfine field of 480 kOe indicates goethite-were ob-served in another case (Brady et al.,1967).
Only two of the synthetic samples studied herecontained significant amounts of iron oxides otherthan ferrihydrite. These samples (PT79, which con-tained some feroxyhite and lepidocrocite, and DLF5,which contained lepidocrocite and goethite), whichmust therefore be excluded from the calculation ofaverage parameters, had the lowest quadrupole split-tings of all.
The quadrupole splitting of 0.72 mm's-', ob-served at room temperature for a natural ferric gel-possibly ferrihydrite-precipitated near freshwater
400 450 500 550 kOe
Fig. 3. Distributions of magnetic hyperfine fields at 4K for (a)natural ferrihydrite N162, and (b) synthetic ferrihydrite l3l0.
springs (Coey and Readman, 1973) agrees well withour values (Table l).
The iron-storage protein ferritin has been shown toconsist of micelles of "hydrated ferric oxide" about40-70A in diameter, surrounded by protein shells.The X-ray and electron diffraction data are identicalto those of ferrihydrite (Towe and Bradley, 1967).Correspondingly, the MdsSbauer spectrum of ferritin(Blaise et al.,19651- Fischbach et al.,l97l; Williams etal.,1978) closely resembles that of ferrihydrite as de-scribed here.
Our results
Adequately good delineations of the experimentaldata were obtained when the room-temperaturespectra were fitted with two doublets and the 4Kspectra with three sextets (Figs. lb, 2b). The differentparameters resulting from these fits (Table l) can beused to characterize the samples. They should, how-ever, not be taken as proof for the existence of dis-cretely different iron sites in the ferrihydrite struc-ture. The hyperfine field distributions of themagnetically split spectra (Fig. 3) rather indicatecontinuous variations ofpararreters, and therefore ofenvironments of the iron nuclei.
Room-temperoture spectra. Our unpublished stud-ies have shown the quadrupole splittings of super-
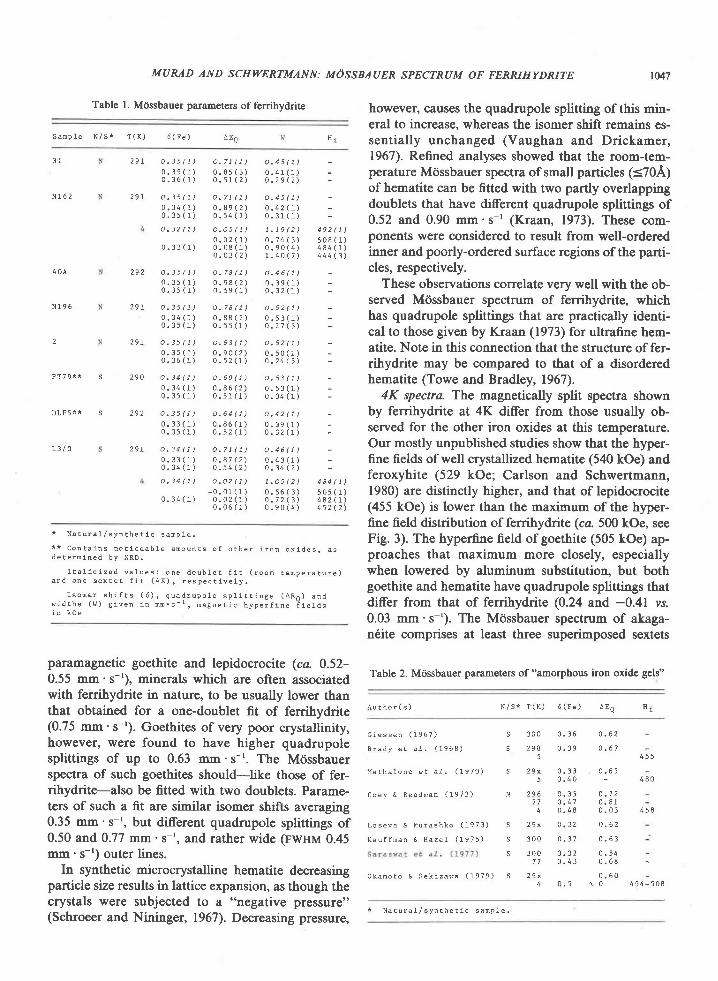
MURAD AND SCHWERTMANN: MOSSBAUER SPECTRUM OF FERRIHYDRITE
Table l. M<issbauer parameters of ferrihydrite
t0,7
S a m p l e N / S * T ( K )
* N a t u r a l / s y o t h e t i c s a m p l e .
* * C o n t a i n s n o E i c e a b l e a n o u n t s o f o t h e r i r o n o x i d a (d e t e r m i n e d b y X R D .
I t a l l c i z e d v a l u e s : o n e d o u b l e ! f i t ( r o o m t e m p e r a C u t e )a n d o n e s e x t e t f l t ( 4 K ) , r e s p e c t i v e l y .
l s o m e r s h i f t s ( 6 ) , q u a d r u p o l e s p l i t t l n g s ( A E n ) a n dw i d t h s ( l . l ) g i v e n i n n n . s - 1 , m a g n e r i c h y p e r f i n e l i e l d si n k o e
paramagnetic goethite and lepidocrocite (ca. 0.52-0.55 mm's-'), minerals which are often associatedwith ferrihydrite in nature, to be usually lower thanthat obtained for a one-doublet fit of ferrihydrite(0.75 mm's-'). Goethites of very poor crystallinity,however, were found to have higher quadrupolesplittings of up to 0.63 mm.s-'. The M<issbauerspectra of such goethites should-like those of fer-rihydrite-also be fitted with two doublets. Parame-ters of such a fit are similar isomer shifts averaging0.35 mm's-r, but different quadrupole splittings of0.50 and 0.77 mm.s-r, and rather wide (rwHrvr 0.45mm's-') outer lines.
In synthetic microcrystalline hematite decreasingparticle size results in lattice expansion, as though thecrystals were subjected to a "negative pressure"(Schroeer and Nininger, 1967). Decreasing pressure,
however, causes the quadrupole splitting of this min-eral to increase, whereas the isomer shift remains es-sentially unchanged (Vaughan and Drickamer,1967). Refined analyses showed that the room-tem-perature Mcissbauer spectra of small particles (<70A)of herratite can be fitted with two partly overlappingdoublets that have different quadrupole splittings of0.52 and 0.90 mm's-' (Kraan, 1973). These com-ponents were considered to result from well-orderedinner and poorly-ordered surface regions ofthe parti-cles, respectively.
These observations correlate very well with the ob-served Mdssbauer spectrum of ferrihydrite, whichhas quadrupole splittings that are practically identi-cal to those given by Kraan (1973) for ultrafine hem-atite. Note in this connection that the structure of fer-rihydrite may be compared to that of a disorderedhematite (Towe and Bradley,1967).
4K spectra. The magnetically split spectra shownby ferrihydrite at 4K differ from those usually ob-served for the other iron oxides at this temperature.Our mostly unpublished studies show that the hyper-fine fields of well crystallized hematite (540 kOe) andferoxyhite (529 kOe; Carlson and Schwertmann,1980) are distinctly higher, and that of lepidocrocite(455 kOe) is lower than the maximum of the hyper-fine field distribution of ferrihydrite (cc. 500 kOe, seeFig. 3). The hyperfine field of goethite (505 kOe) ap-proaches that maximum more closely, especiallywhen lowered by aluminum substitution, but bothgoethite and hematite have quadrupole splittings thatdiffer from that of ferrihydrite (0.24 and, -0.41 vs.0.03 mm's-'). The Mdssbauer spectrum of akaga-n€ite comprises at least three superimposed sextets
Table 2. M<issbauer parameters of "amorphous iron oxide gels"
A u t h o r ( s ) N / s * T ( K ) 6 ( F e )
d ( F e ) A E o
N 1 5 2
4 0 A
N 1 9 6
2
P T 7 9 * * S
D L F 5 * * S
o . 3 5 ( 1 ) o . 7 1 ( 1 )0 , 3 s ( 1 ) 0 . 8 s ( 3 )0 . 3 6 ( 1 ) 0 . s 1 ( 2 )
o . 3 5 ( 1 ) o . 7 t ( 1 )0 . 3 4 ( r ) 0 . 8 9 ( 2 )0 . 3 s ( 1 ) 0 . 5 4 ( 1 )
o . 3 2 ( 1 ) o . o 5 ( 1 )0 . 0 2 ( 1 )
0 . 3 3 ( 1 ) 0 . 0 8 ( 1 )0 . 0 3 ( 2 )
o . 3 s ( 1 ) o . 7 8 ( 1 )0 . 3 s ( r ) 0 . 9 8 ( 2 )0 . 3 s ( 1 ) 0 . 5 9 ( r . )
o . 3 s ( 1 ) o . 7 8 ( 1 )0 . 3 4 ( 1 ) 0 . 8 8 ( 2 )0 . 3 5 ( 1 ) o . s 5 ( r )
o . 3 5 ( 1 ) a . 8 3 ( 1 )o . 3 s ( r ) o . e 0 ( 2 )0 . 3 6 ( 1 ) 0 . s 2 ( I )
o . 3 4 ( 1 ) O . 6 9 ( 1 )0 . 3 4 ( 1 ) 0 . 8 6 ( 2 )0 . 3 5 ( 1 ) o , s r ( 1 )
o . 3 s ( 1 ) o . 6 4 ( 1 )0 . 3 3 ( 1 ) 0 . 8 6 ( 1 )0 . 3 s ( 1 ) 0 . s 2 ( 1 )
o . 3 4 ( 1 ) O . 7 1 ( 1 )0 , 3 3 ( 1 ) 0 . 8 7 ( 2 )0 . 3 4 ( 1 ) o , s 4 ( 2 )
o . 3 4 ( 1 ) O . O 2 ( 1 )- 0 . 0 1 ( 1 )
0 . 3 4 ( 1 ) 0 . 0 2 ( 1 )0 . 0 6 ( 1 )
o . 4 5 ( 1 )0 . 4 1 ( 1 )o . 2 9 ( 2 )
o . 4 5 ( 1 )0 . 4 2 ( 1 )0 . 3 1 ( 1 )
1 . 1 9 ( 2 ) 4 9 2 ( 1 )0 . 7 4 ( 3 ) 5 0 8 ( 1 )0 . 9 0 ( 4 ) 4 8 4 ( r )1 . 4 0 ( 7 ) 4 4 4 ( 3 )
o . 4 6 ( 1 )0 . 3 e ( 1 )0 . 3 2 ( 1 )
o . s 2 ( 1 )0 . 5 3 ( 1 )o . 2 7 ( 5 )
o . 5 2 ( t )0 . s 0 ( 1 )o . 2 4 ( 5 )
o . s 3 ( 1 )0 . s 3 ( r )0 . 3 4 ( 1 )
o . 4 2 ( 1 )0 . 3 9 ( r )0 . 3 2 ( 1 )
o . 4 6 ( 1 )0 . 4 3 ( 1 )o . 3 4 ( 2 )
1 . O 5 ( 2 ) 4 8 4 ( 1 )0 . s 6 ( 3 ) 5 0 5 ( 1 )o . 7 2 ( 3 ) 4 8 2 ( r )0 . e 0 ( 4 ) 4 s 2 ( 2 )
? q r
2 9 1
291
2 9 0
2 9 2
1 3 / 0 2 9 1
H 1
G i e s s e n ( 1 9 6 7 )
B r a d y e t a l , ( 1 9 6 8 )
M a t h a l o n e e t a - 1 . ( 1 9 7 0 )
C o e y & R e a d m a n ( 1 9 7 3 )
L o s e v a & M u r a s h k o ( 1 9 7 3 )
K a u f f m a n & H a z e l ( 1 9 7 5 )
3 0 0 0 . 3 6 0 . 6 2
2 9 8 0 . 3 9 0 . 6 75
0 k a m o ! o & S e k i z a w a ( 1 9 7 9 )
0 . 3 3 0 . 6 50 . 4 0
0 , 3 5 0 , 7 20 . 1 1 0 . 8 10 . 4 8 0 . 0 3
o . 3 2 0 . 6 2
o , 3 7 0 . 6 3
0 . 3 2 0 . 5 40 . 4 3 0 . 6 8
0 . 5 00 . 5 r 0 4 9 4 - 5 o B
ss
s
N
S
s
s
S
2 9 x5
2 9 67 7
2 9 x
3 0 0
3 0 07 7
2 9 x4
4 8 0
* N a t u r a l / s y n ! h e ! i c s a m p l e .
1048
that have similar hyperfine fields between 473 and486 kOe, but different quadrupole splittings of 0.90'0.30, and -0.05 mm's-' (Murad,1979).
The (poorly ordered) surface regions of small hem-atite particles were found to have a reduced hyper-fine field (Kraan, 1973). This was considered to bethe result of decreasing mutual interactions of sur-face ions with decreasing particle size. The particlesizes at which such effects become noticeable (70-40A) are quite comparable to those usually observedfor ferrihydrite. The hyperfine field distributionsshown by this mineral are probably the outcome ofparticle size distributions.
Conclusions
One-doublet and one-sextet fits of room temper-ature and 4K Mdssbauer spectra of ferrihydrite canbe used to characterize this mineral. Typical parame-ters of such fits are a high quadrupole splitting of0.75 mm's-' at room temperature, and a hyperfinefield of about 490 kOe at 4K.
Physically sound fits require the room temperaturespectra of ferrihydrite to be fltted with at least twosuperparamagnetic doublets of similar isomer shiftsbut different quadrupole splittings. At 4K hyperfinesplitting with a distribution of magnetic hyperfinefields is observed. Both effects are also shown byother iron oxides of extremely small particle size, forexample hematite. It thus appears that-in the mi-crocrystal range-as particle sizes decrease, the indi-vidual characteristics of the different iron oxidesgradually disappear, until finally only fundamentalstructural elements of short-range order common toall, i.e. Fe'* surrounded by six O, OH, and/or OHr'remain. This is in agreement with the conclusionsfrom X-ray diffraction.
AcknowledgmentsWe are indebted to Dr. F. E. Wagner (Physics Department,
Technische UniversitAt Mrinchen) for making the measurementsat 130 and 4K possible, and for critically reviewing the manu-script. Natural and synthetic ferrihydrite samples were kindly pro-vided by Dr. L. Carlson (Helsinki), Professor F. V. Chukhrov(Moscow), and Dr. D. G. Lewis (Adelaide). This study has beensupported by the Deutsche Forschungsgemeinschaft under grant
Schw 90/27.
References
Blaise, A., J. Chappert and J.-L. Girardet (1965) Observation parmesures magnetiques et efet Mtissbauer d'un anti-ferromagnetisme de grains fins dans la ferritine. C. R. Acad. Sci.Paris, 261, 23lL23l3.
MURAD AND SCHWERTMANN: MOSSBAUER SPECTRUM OF FERRIHYDRITE
Brady, G. W., C. R. Kurkjian, E. F. X. Lyden, M. B. Robin' P.
Saltman, T. Spiro and A. Terzis (1967) The structure of an iron
core analog of ferritin. Biochemistry, 7,2185-2192.Carlson, L. and U. Schwertmann (1980) A natural occurrence of
feroxyhite (6'-FeOOH). Clays Clay Minerals, in press.
Chukhrov, F. V., B. B. Zvyagtn, L. P. Ermilova and A. I. Gorsh-kov (1972) New data on iron oxides in the weathering zone.Proc. Int. Clay Conf. Madrid,333-341.
Coey, J. M. D. and P. W. Readman (1973) Characterization andmagnetic properties ofnatural ferric gel. Earth Planet. Sci' Lett.,
21 .45-5 t .Feitknecht, W., R. Giovanoli, W. Michaelis and M' Miiller (1973)
Uber die Hydrolyse von Eisen (III) Salzlcisungen. I. Die Hydro-lyse der Ltisungen von Eisen (III) chlorid. Helvetica Chim. Acta,56.2847-2856.
Fischbach, F. A., D. W. Gregory, P. M. Harrison, T. G. Hoy and
J. M. Williams (1971) On the structure of hemosiderin and itsrelationship to ferritin. J. (Jltrostructure Res., 37,495-503.
Giessen, A. A. van der (1966) The structure of iron (III) oxidc-hydrate gels. J. Inorganic Nuclear Chem., 28,2155-2159.
- (1967) Magnetic propetties of ultra-fine iron (III) oxide-hydrate particles prepared from iron (III) oxide-hydrate gels. ,f.Phys. Chem. Solids, 28,343-346.
Harrison, P. M. and T. G. Hoy (1973) Ferritin. In G. L. Eicbhorn,Ed., Inorganic Biochemistry, Vol. I, p. 253-279. Elsevier, Am-sterdam. London. New York.
Kauffman, K. and F. Hazel (1975) Infrared and M<issbauer spec-troscopy, electron microscopy and chemical reactivity of ferricchloride hydrolysis products. J. Inorganic Nuclear Chem., 37,I 139-l 148.
Kraan, A. M. van der (1973) Mtissbauer effect studies of surfaceions of ultrafine c-Fe2O3 particles. Phys. Status Solidi, Al8,215-226.
Loseva, G. V. and N. V. Murashko (1973) Use of Mtissbauer spec-troscopy to investigate the formation of hematite fromamorphous iron hydroxide. Inorganic Mater., 9, I 301-1302.
Mathalone, Z'., M. Ron and A Biran (1970) Magnetic ordering iniron gel. Solid State Comm., 8,333-336.
Mehra, O. P. and M. L. Jackson (1960) Iron oxide removal fromsoils and clays by a dithionite-citrate system buffered with so-dium bicarbonate. Clays Clay Minerals, 7,31'l-327.
Murad, E. (1979) Mcissbauer and X-ray data on B-FeOOH(akagan6ite). Clay Minerals, 1 4, 273-283.
Okamoto, S. and H. Sekizawa (1979) Magnetic properties ofamorphous ferric hydroxide gels. 'I. Phys., 40, C2, 137-139.
Potvin, W. J. and S. Greenblatt (1969) Mdssbauer study of the dis-integration products of a high surface iron oxide gel. J. Phys.Chem. Solids, 30, 2'192-2'194.
Russell, J. D. (1979) Infrared spectroscopy of ferrihydrite: evi-dence for the presence ofstructural hydroxyl groups. Clay Min-era ls ,14 ,109-114.
Saraswat, I. P., A. C. Vajpei and V. K. Gary Q977) M6ssbaucrresonance study of brown ferric oxyhydroxide gel. Indian I.Chem., 15A,493494.
Schroeer, D. and R. C. Nininger (1967) Morin transition in c-Fe2O3 microcrystals. Pftys. Rev. Lett., 19,632-634.
Schwertmann, U. (1964) Differenzierung der Eisenoxide des Bod-ens durch photochemische Extraktion mit sauer Ammonium-oxalat-Lcisung. Z. Pflanzenerniihrung, Dtingung, Bodenkunde,105. 19+202.
- (1979) Is there amorphous iron oxide in soils? AgronomyAbstracts, 228-229.
MURAD AND SCHWERTMANN: MOSSBAUER SPECTRUM OF FERRIHYDRITE
- and W R. Fischer (1973) Natural "amorphous" ferric hy- Williams, J. M., D. P. Danson and C. Janot (1978) A Mrissbauerdroxide. Geoderma, 10,237-247. determination ofthe iron core particle size distribution in ferri-
Towe, K. M. and W. F. Bradley (1967) Mineralogical constitution tin. Phys. Medicine Biology,2l, E35-851.of colloidal "hydrous ferric oxides." f. Colloid Interfuce Sci., 24,384-392.
Vaughan, R. W. and H. G. Drickamer (1967) High-pressureM6ssbauer studies on a-Fe2O3, FeTiO3, and FeO. J. Chem. Manuscript received, January 29, 1980;Phys.' 47,1530-1536. acceptedfor publication, March 7, 1980.
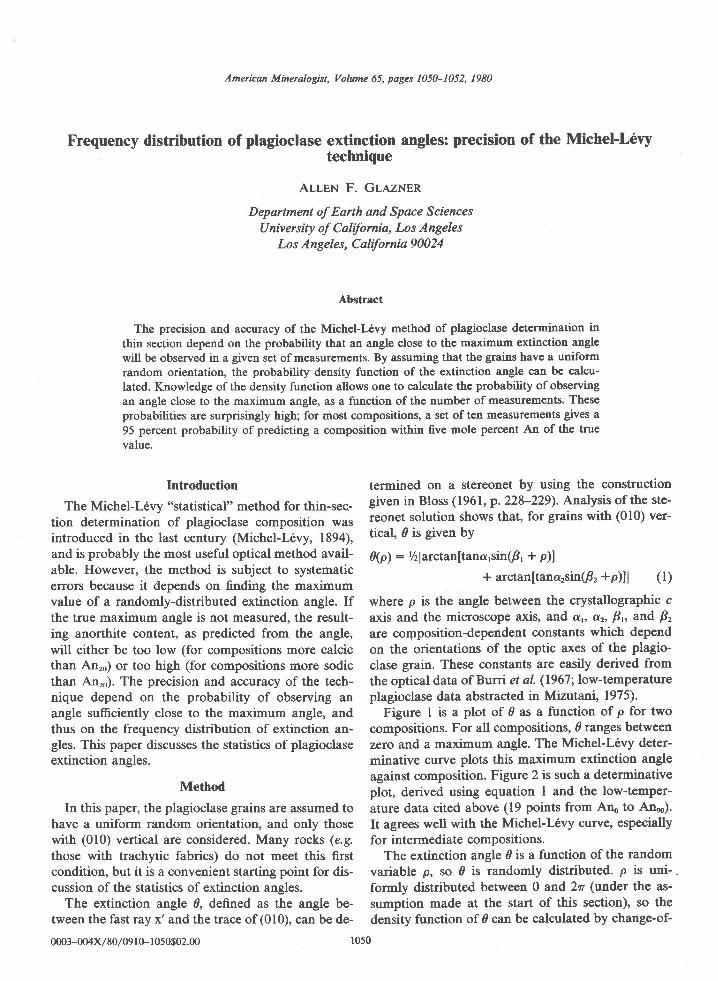
American Mineralogist, Volume 65, pages 1050-1052, 1980
Frequency distribution of plagioclase extinction angles: precision of the Michel-L6vytechnique
ALLEN F. GL,qZNEN
Department of Earth and Space SciencesUniversity of Caldornia, Los Angeles
Los Angeles, California 90024
Abstract
The precision and accuracy of the Michel-L€vy method of plagioclase determination inthin section depend on the probability that an angle close to 16s maximum extinction anglewill be observed in a given set of measurements. By assuming that the grains have a uniformrandom orientation, the probability density function of the extinction angle can be calcu-lated. Knowledge of the density function allows one to calculate the probability of observingan angle close to the maximum angle, as a function of the number of measurements. Theseprobabilities are surprisingly higfu for most compositions, a set of ten measurements gives a95 percent probability of predicting a composition within flve mole percent An of the truevalue.
Introduction
The Michel-L6vy "statistical" method for thin-sec-tion determination of plagioclase composition wasintroduced in the last century (Michel-L6vy, 1894),and is probably the most useful optical method avail-able. However, the method is subject to systematicerrors because it depends on finding the maximumvalue of a randomly-distributed extinction angle. Ifthe true maximum angle is not measured, the result-ing anorthite content, as predicted from the angle,will either be too low (for compositions more calcicthan Anro) or too high (for compositions more sodicthan Anro). The precision and accuracy of the tech-nique depend on the probability of observing anangle sufrciently close to the maximum angle, andthus on the frequency distribution of extinction an-gles. This paper discusses the statistics of plagioclaseextinction angles.
Method
In this paper, the plagioclase grains are assumed tohave a uniform random orientation, and only thosewith (010) vertical are considered. Many rocks (e.9.those with trachytic fabrics) do not meet this firstcondition, but it is a convenient stafting point for dis-cussion of the statistics of extinction angles.
The extinction angle d, defined as the angle be-tween the fast ray x'and the trace of(010), can be de-
termined on a stereonet by using the constructiongiven in Bloss (1961, p.228-229). Analysis of the ste-reonet solution shows that, for grains with (010) ver-tical, 0 is given by
0(p): Vzlarctanftanc,sin(B' + p)l
* arctan[tana,sin(B, +P)l; (l)
where p is the angle between the crystallographic caxis and the rnicroscope axis, and c,, dz, Fo and B,are coqrposition-dependent constants which dependon the orientations of the optic axes of the plagio-clase grain. These constants are easily derived fromthe optical data of Burri et al. (1967; low-temperatureplagioclase data abstracted in Mizutani, 1975).
Figure I is a plot of 0 as a function of p for twocompositions. For all compositions, d ranges betweenzero and a maximum angle. The Michel-L6vy deter-minative curve plots this maximum extinction angleagainst composition. Figure 2 is such a determinativeplot, derived using equation I and the low-temper-ature data cited above (19 points from Ano to An*).It agrees well with the Michel-Ldvy curve, especiallyfor intermediate compositions.
The extinction angle d is a function of the randomvariable p, so d is randorrly distributed. p is uni-.formly distributed between 0 and 2n (under the as-sumption made at the start of this section), so thedensity function of 0 can be calculated by change-of-
0003-004x/80/09 l 0- 1050$02.00 l0s0
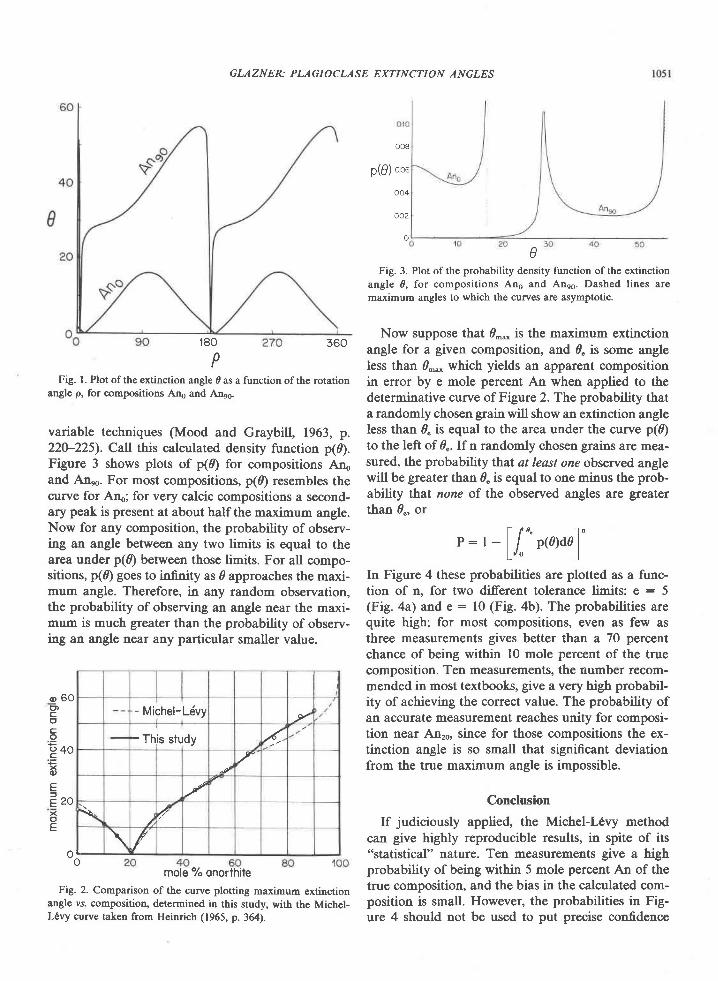
GLAZNER: PI-/IGI OCLASE EXTINCTION ANGLES
360
Fig. l. Plot of the extinction angle d as a function of the rotationangle p, for compositions An6 and An*.
variable techniques (Mood and Graybill, 1963, p.220-225). Call this calculated density function p(d).Figure 3 shows plots of p(d) for compositions Atuand Anro. For most compositions, p(4 resembles thecurve for Ano; for very calcic compositions a second-ary peak is present at about half the maximum angle.Now for any composition, the probability of observ-ing an angle between any two linrits is equal to thearea under p(0) between those limits. For all compo-sitions, p(d) goes to infinity as d approaches the maxi-mum angle. Therefore, in any random observation,the probability of observing an angle near the maxi-mun is much greater than the probability of observ-ing an angle near any particular smaller value.
o Lomole 7" onorthite
Fig. 2. Comparison of the curve plotting maximum extinctionangle vs. compositioq determined in this study, with the Michcl-L6vy curve taken from Heinrich (1965, p. 364).
o08
P(B) oou
oo4
oo2
o
Fig. 3. Plot of the probability density function of the extinction
angle d, for compositions An6 and Anee. Dashed lines are
maximum angles to which the curves are asymptotic.
Now suppose that d-"* is the maximum extinctionangle for a given composition, and e. is some angleless than d-"- which yields an apparent compositionin error by e mole porcent An when applied to thedeterminative curye of Figure 2. The probability thata randomly chosen grain will show an extinction angleless than d" is equal to the area under the curve p(d)to the left of d.. If n randomly chosen grains are mea-sured, the probability that at least one observed anglewill be greater than 0. is equal to one minus the prob-ability that none of the observed angles are greaterthan Q, or
P:I - | f "p@)ae1"Lr'o J
In Figure 4 these probabilities are plotted as a func-tion of n. for two diferent tolerance limits: e : 5(Fig. aa) and e : 10 (Fig. 4b). The probabilities arequite hig[ for most compositions, even as few asthree measurements gives better than a 70 percentchance of being within l0 mole percent of the truecomposition. Ten measurements, the number recom-mended in most textbooks, give a very high probabil-ity of achieving the correct value. The probability ofan accurate measurement reaches unity for composi-tion near Anro, since for those compositions the ex-tinction angle is so small that significant deviationfrom the true maximum angle is impossible.
Conclusion
If judiciously applied, the Michel-Ldvy methodcan give highly reproducible results, in spite of its"statistical" nature. Ten measurements give a highprobability of being within 5 mole percent An of thetrue composition, and the bias in the calculated com-position is small. However, the probabilities in Fig-ure 4 should not be used to put precise confidence
r80
P
o 6 0(]l,coco
- - ".Ex(D
E7roxoE
e
- Michel-Ldvy
- This study 4
\ I
\ /
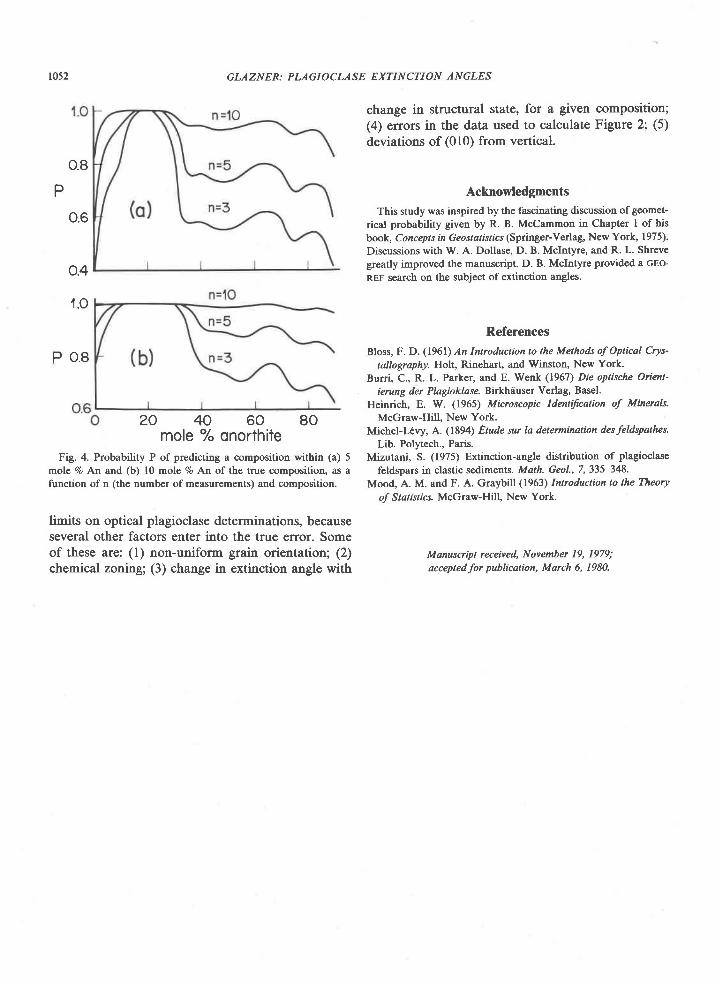
1052 GLAZNER: PLAGIOCLASE EXTINCTION ANGLES
o.8
P
o.6
o.4
1.O
P O.8
Fig. 4. Probability P of predicting a composition within (a) 5mole Vo An and (b) l0 mole Vo An of the true composition, as afunction of n (the number of measurements) and composition.
limits on optical plagioclase determinations, becauseseveral other factors enter into the true error. Someof these are: (l) non-uniform grain orientation; (2)chemical zoning; (3) change in extinction angle with
change in structural state, for a given composition;(4) errors in the data used to calculate Figure 2; (5)
deviations of (010) from vertical.
Acknowledgments
This study was inspired by the fascinating discussion of geomet-rical probability given by R. B. McCammon in Chapter I of hisbook, Concepts in Geostatistics (Springer-Verlag, New York, 1975).Discussions with W. A. Dollase, D. B. Mclntyre, and R. L. Shrevegreatly improved the manuscript. D. B. Mclntyre provided a ceo-REF search on the subject ofextinction angles.
References
Bloss, F. D. (1961) An Introduction to the Methods of Optical Crys'tallography. Holt, Rinehart, and Winston, New York.
Burri, C., R. L. Parker, and E. Wenk (1967) Die optische Orient-ierung der Plagioklase. Birkhiiuser Verlag, Basel.
Heinrich, E. W. (1965) Microscopic ldentifrcation of Minerals.McGraw-Hill. New York.
Michel-L6vy, A. (1894) Etude sur la determination des feldspathes.Lib. Polytech., Paris.
Mizutani, S. (1975) Extinction-angle distribution of plagioclasefeldspars in clastic sediments. Math. Geol., 7,335-348.
Mood, A. M. and F. A. Graybill (1963) Introduction to the Theoryof Statistics. McGraw-Hill, New York.
Manuscript received, November 19, 1979;
acceptedfor publication, March 6, 1980.
20 40 60 80mole % onorthite
American Mineralogist, Volume 65,pages 1053-1056, 1980
A simple rapid-quench design for cold-seal pressure vessels
Genv K. JAcoBs AND DERRTLL M. Kennrcr
Department of Geosciences, The Pennsylvania State UniversityUniv ersity Park, Pennsylvania I 6802
Abstract
A simple rapid-quench design, utilizing conventional cold-seal pressure vessels, operatesby flushing the capsule chamber with cold water injected through an axial capillary tube.Compared to a conventional air quench, improved quench rates are gained without the dis-advantages associated with other rapid-quench methods (e.g. water-bath immersion or water-jacketed tilt mechanisms). The need for a rapid quench is illustrated by quench reactions inexperiments with wollastonite-bearing equilibria in H2O-CO, fluids. Upon air quenching,wollastonite reacts with CO, to form calcite and (presumably) silica in solution. Quenchingexperiments involving wollastonite and HrO-CO, fluids indicate that back-reaction duringcooling is minimized through use of the new rapid-quench design.
Introduction
Interpretation of hydrothermal experiments can becomplicated by the precipitation of undesirablephases during quenching of conventional cold-sealpressure vessels. For example, calcite readily formsduring compressed air quenches in experiments in-volving wollastonite equilibria in HrO-CO, fluids(Kerrick and Ghent, 1980; Johannes, personal com-munication; Shmulovich, 1977; Ziegenbein and Jo-hannes, 1974). Although rapid quenching of the pres-sure vessel through immersion into a water bath mayalleviate this problem, repeated quenching by thismethod can shorten vessel life and lead to explosivefailure. Use of water-jacketed rapid-quench vesselscan be quite successftrl in reducing quench problems,provided precautions pointed out by Ludington(1978) and Rudert et al. (1976\ are observed. Thepresent paper describes a new rapid-quench designthat utilizes a conventional cold-seal vessel (Tuttle,1949) through which cool water is injected into thecapsule chamber via an axial capillary tube; this pro-cedure results in a rapid temperature drop in the im-mediate vicinity of the capsules. This new design issimple and requires little modification of a cold-sealhydrothermal laboratory.
Rapidquench mechanism
Figure I is a schematic diagram illustrating therapid-quench design used in this study. In our exper-iments, the pressure vessel was oriented horizontally
0003-004x/80/09 l 0- I 053$02.00
to minimize temperature gradients (Boettcher andKerrick, l97l). Temperatures (12"C) were measuredwith an internal, inconel-sheathed, chromel-alumelthermocouple which, along with capillary A (Fig. l),extends through the hollow filler rod to the positionof the capsules. Both the thermocouple and capillaryA were silver-soldered to the nipple at the top of theT-junction. Valve A is used to isolate the pressurevessel from the main pressure line aftbr final pressureadjustments are completed. Using water ?s a me-dium, pressures were generated with an air-drivenhydraulic pump (Haskel # osxuw-903). Pressures(120 bars) were monitored with a bourdon-tubegauge for each vessel, catbrated against a factory-calibrated standard gauge.
At the end of an experiment, pressure in the mainline (Fig. l) is equalized to that in the vessel. Valve Ais then opened to connect the vessel to the main pres-sure line. The vessel is then removed from the fur-nace, placed in a stream of compressed air, and valveB is immediately opened, allowing the hot water inthe vessel to exit through the T-junction, capillary B,and bleed line. Cool water, pumped in through capil-lary A as the hydrautc pump cycles to maintain con-stant pressure, flows over (and quenches) the. cap-sules (see inset in Fig. l). A large-volum€ waterreservoir between each vessel and the main pressureline should help reduce momentary pressure dropswhich occur between each cycle of the hydraulicpump. When the vessel is cool, pumping is stopped
1053
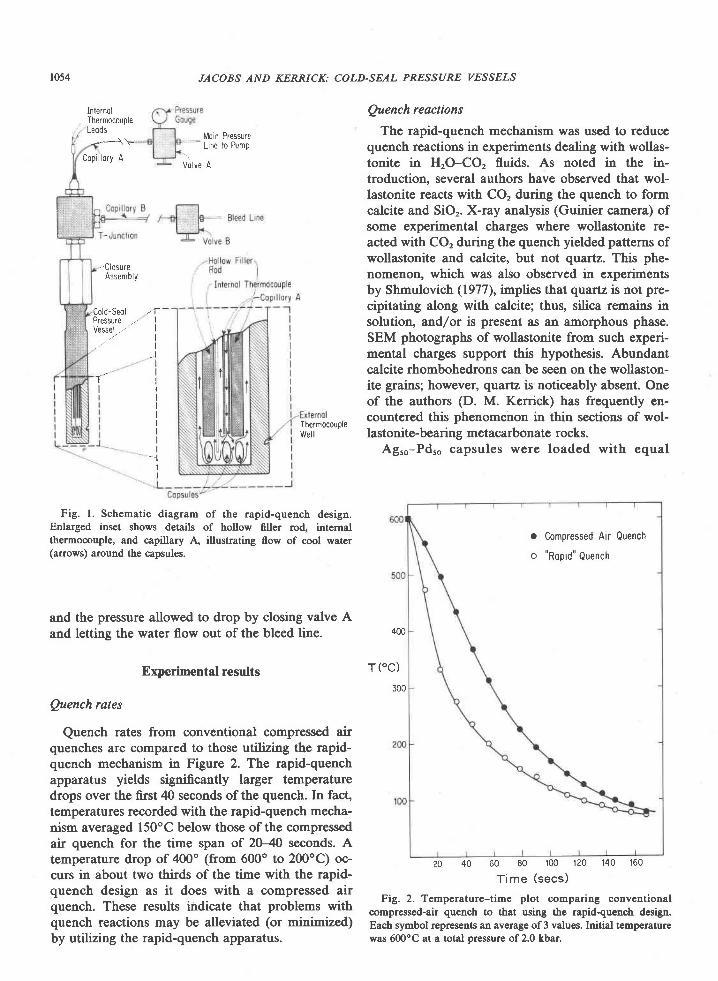
t054 JACOBS AND KERRICK: COLD.SEAL PR,ESSUNE VESSELS
Fig. l. Schematic diagram of the rapid-quench design.Enlarged inset shows details of hollow filler rod, internalthermocouple, and capillary A, illustrating flow of cool water(arrows) around the capsules.
and the pressure allowed to drop by closing valve Aand letting the water flow out of the bleed line.
Experimental results
Quench rates
Quench rates from conventional compressed airquenches are compared to those utilizing the rapid-quench mechanism in Figure 2. The rapid-quenchapparatus yields significantly larger temperaturedrops over the first 40 seconds ofthe quench. In fact,temperatures recorded with the rapid-quench mecha-nism averaged 150'C below those of the compressedair quench for the time span of 20-40 seconds. Atemperature drop of 400o (from 600o to 200'C) oc-curs in about two thirds of the time with the rapid-quench design as it does with a compressed airquench. These results indicate that problems withquench reactions may be alleviated (or minimized)by utilizing the rapid-quench apparatus.
Qumch reactions
The rapid-quench mechanism was used to reducequench reactions in experiments dealing with wollas-tonite in HrO-CO, fluids. As noted in the in-troduction, several authors have observed that wol-lastonite reacts with CO, during the quench to formcalcite and SiOr. X-ray analysis (Guinier camera) ofsome experimental charges where wollastonite re-acted with CO, during the quench yielded patterns ofwollastonite and calcite, but not quartz. This phe-nomenon, which was also observed in experimentsby Shmulovich (1977), implies that quartz is not pre-cipitating along with calcite; thus, silica remains insolution, and/ot is present as an amorphous phase.SEM photographs of wollastonite from such experi-mental charges support this hypothesis. Abundantcalcite rhombohedrons can be seen on the wollaston-ite grains; however, quartz is noticeably absent. Oneof the authors (D. M. Kerrick) has frequently en-countered this phenomenon in thin sections of wol-lastonite-bearing metacarbonate rocks.
Agro-Pdro capsules were loaded with equal
o Compressed Air Quench
o "Roprd" Quench
400
T("C)
300
20 40 60 80 100 ',120 140 160
Time (secs)
Fig. 2. Temperature-time plot comparing conventionalcomprcssed-air quench to that using the rapid-qucnch design.Each symbol represents an average of3 values. Initial temperaturewas 600oC at a total pressure of 2.0 kbar.
lnternolThermocouple
'LeodsMoin Pressure- Lrne to Pump
Copi l lory A
..ClosureAssembly
Cold-SeolPressure ,'Vessel_,-,
Volve A
T
,,r_I
II
.-lIIII
IIII
II-..l
I
ThermocoupleWel l
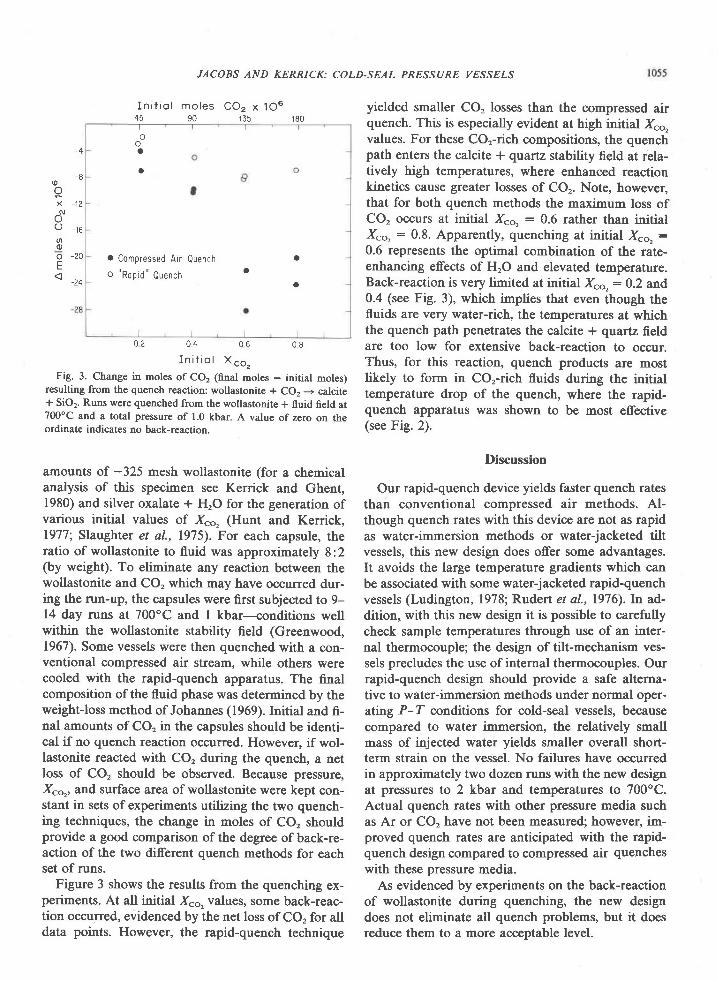
JACOBS AND KERRICK: COLD.SEAL PRESSURE VESSELS
- 8(o
f - rzNo
o -reoc)o -20E4 -ro
I n i t i o l m o l e s C O 2 x 1 0 645 90 135 180
o
a
a
a Compressed Arr Quencho "Rop id" Quench
aa
a
0 4 0 6 0 8
I n i t i o l X " o "
Fig. 3. Change in moles of CO2 (final moles - initial moles)resulting from the quench reaction: wollastonite * COz + calcite* SiO2. Runs were quenched from the wollastonite + fluid field at700"C and a total pressure of 1.0 kbar. A value of zero on theordinate indicates no back-reaction.
amounts of -325 mesh wollastonite (for a chemicalanalysis of this specimen see Kerrick and Ghent,1980) and silver oxalate + HrO for the generation ofvarious initial values of Xco, (Hunt and Kerrick,1977; Slaughter et al.,1975). For each capsul€, theratio of wollastonite to fluid was approximately 8:2(by weight). To eliminate any reaction between thewollastonite and CO, which may have occurred dur-ing the run-up, the capsules were first subjected to 9-14 day runs at 700"C and I kbar-conditions wellwithin the wollastonite stability field (Greenwood,1967). Some vessels were then quenched with a con-ventional compressed air stream, while others werecooled with the rapid-quench apparatus. The finalcomposition of the fluid phase was determined by theweight-loss method of Johannes (1969). Initial and fi-nal amounts of CO, in the capsules should be identi-cal if no quench reaction occurred. However, if wol-lastonite reacted with CO, during the quench, a netloss of CO, should be observed. Because pressure,X"o,, arlrd surface area of wollastonite were kept con-stant in sets of experiments utilizing the two quench-ing techniques, the change in moles of CO, shouldprovide a good comparison of the degree of back-re-action of the two different quench methods for eachset of runs.
Figure 3 shows the results from the quenching ex-periments. At all initial X.o. values, some back-reac-tion occurred, evidenced by the net loss of CO, for alldata points. However, the rapid-quench technique
yielded smaller CO, losses than the compressed airquench. This is especially evident at high initial Xco,values. For these COr-rich compositions, the quenchpath enters the calcite + qaaftz stability field at rela-tively high temperatures, where enhanced reactionkinetics cause greater losses of COr. Note, however,that for both quench methods the maximum loss ofCO, occurs at initial Xco,: 0.6 rather than initialX.o, : 0.8. Apparently, quenching at initial Xco,:0.6 represents the optimal combination of the rate-enhancing effects of HrO and elevated temperature.Back-reaction is very limited at initial Xco,:0.2 and0.4 (see Fig. 3), which implies that even though thefluids are very water-rich, the temperatures at whichthe quench path penetrates the calcite * quartz fieldare too low for extensive back-reaction to occur.Thus, for this reaction, quench products are mostlikely to form in CO,-rich fluids during the initialtemperature drop of the quench, where the rapid-quench apparatus was shown to be most effective(see Fig. 2).
Discussion
Our rapid-quench device yields faster quench ratesthair conventional compressed air methods. Al-though quench rates with this device are not as rapidas water-immersion methods or water-jacketed tiltvessels, this new design does offer some advantages.It avoids the large temperature gradients which canbe associated with some water-jacketed rapid-quenchvessels (Ludington, 1978; Rudert et al.,1976). In ad-dition" with this new design it is possible to carefullycheck sample temperatures through use of an i-nter-nal thermocouple; the design of tilt-mechanism ves-sels precludes the use of internal thermocouples. Ourrapid-quench design should provide a safe alterna-tive to water-immersion methods under normal oper-atimg P-T conditions for cold-seal vessels, becausecompared to water immersion, the relatively smallmass of injected water yields smaller overall short-term strain on the vessel. No failures have occurredin approxinately two dozen runs with the new designat pressures to 2 kbar and temperatures to 700'C.Actual quench rates with other pressure media suchas Ar or CO, have not been measured; however, im-proved quench rates are anticipated with the rapid-quench design compared to compressed air quencheswith these pressure media.
As evidenced by experiments on the back-reactionof wollastonite during quenching, the new designdoes not eliminate all quench problems, but it doesreduce them to a more acceptable level.
1056
AcknowledgmentsWe thank I-Ming Chou and D. H. Eggler for their careful re-
view of this paper. This work represents part of G. K. Jacobs'Ph.D. research and was supported in part by NSF grants EAR 76-84199 and EAR 79-082,U (D. M. Kerrick) and an Owens-CorningFiberglas Graduate Fellowship (G. K. Jacobs).
References
Boettcher, A. L. and D. M. Kerrick (1971) Temperature calibra-tion in cold-seal pressure vessels. In G. C. Ulmer, Ed., ResearchTechniquesfor High Pressure and High Temperature, p. 179-193.Springer-Verlag, New York.
Greenwood, H. J. (1967) Wollastonite: stability in H2O-CO2 mix-tures and occurrence in a contact-metamorphic aureole nearSalmo, British Columbia, Canada. Am. Mineral.,52, 1669-1680.
Hunt, J. A. and D. M. Kerrick (1977) The stability of sphene: ex-perimental redetermination and geologic implications. Geochim.Cosmochim. Acta, 4 l, 279-288.
Johannes, W. (1969) An experimental investigation of the syst€mMgO-SiO2-H2O-CO2. Am. J. Sci., 267, 1083-1104.
Kerrick, D. M. and E. D. Ghent (1980) P-f-Xco, relations ofequilibria in the system: CaO-AI2O3-SiO2-CO2-H2O. (in Rus-
JACOBS AND KERRICK: COLD-SEAL PRESSURT VESSELS
sian) In V. A. Zharikov, V. L Fonarev, and S. P. Korikovskii'Eds., Problems ol Physico-chemical Pelrology, p. 32-52. D. S.
Korzhinskii Commemorative Volume.Ludington, S. (1978) Temperature gradients in rapid-quench cold-
seal pressure vessels-the effect of inclination (abstr.). Geol.
Soc. Am. Abstracts with Programs, 10, 47.Rudert, V., I-M. Chou and H. P. Eugster (1976) Temperature gra-
di€nts in rapid-quench cold-seal pressule vessels. lm' Mineral.,61, lol2-lol5.
Shmulovich, K. l. (197't-) Stability limits of grossular and wollas-
tonite in the H2O-CO2 system up to 6 kbar. Geokhimiya, 12'180G1816. ltransl. Geochem. Int., 14, 126-114 (1978)1. '
Slaughter, J., D. M. Kerrick and V. J. Wall (1975) Experimentaland thermodynamic study of equilibria in the system CaO-MgO-SiOz-HzO-CO2. Am. J. Sci., 275, 143-162.
Tuttle, O. F. (1949) Two pressure vessels for silicate-water studies'
Geol. Soc. Am. Bull., 60, 1727-1729.Ziegenbein, D. and W. Johannes (1974) Wollastonitbildung aus
Quarz und Calcit bei Pr: 2, 4, und 6 kb' Fortschr' Mineral', 52,77-79.
Manuscript received, February 15, 1980;
acceptedfor publication, May 9, 1980.
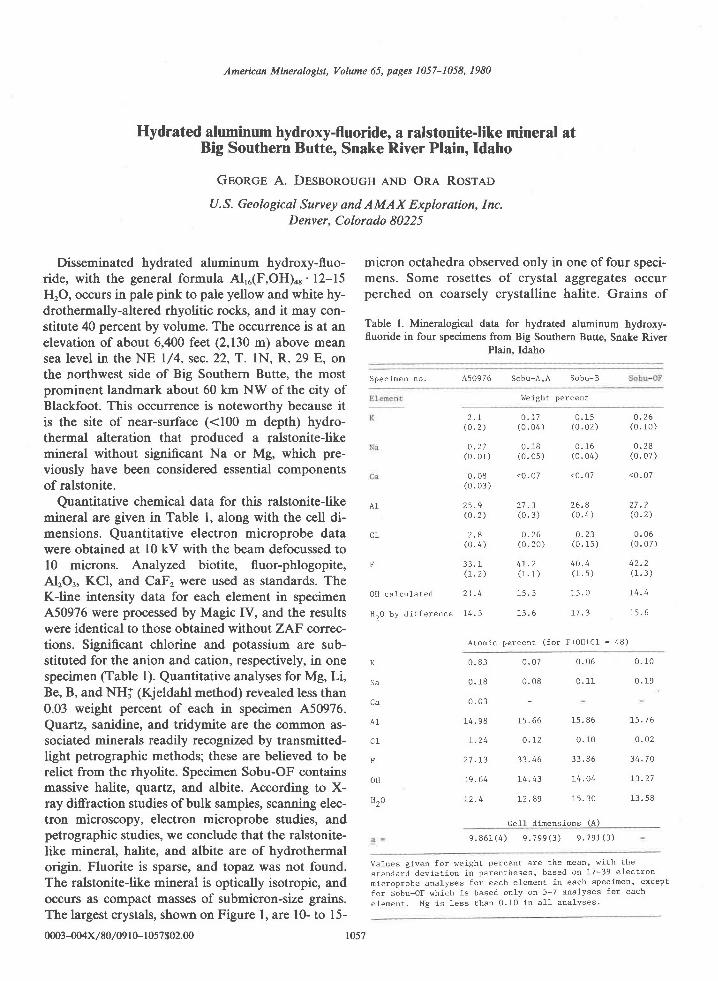
American Mineralogist, Volume 65, pages 1057-1058, 1980
Hydrated alnminum hydroxy-fluoride, a ralstonite-like mineral atBig Southern Butte, Snake River Plainr ldaho
Geoncn A. DEsBoRoucH AND On-c. Rosrno
U.S. Geological Survey and AMAX Exploration, Inc.Denver, Colorado 80225
Disseminated hydrated aluminum hydroxy-fluo-ride, with the general formula AI,6(F,OH)48'12-15HrO, occurs in pale pink to pale yellow and white hy-drothermally-altered rhyolitic rocks, and it may con-stitute 40 percent by volume. The occurrence is at anelevation of about 6,400 feet (2,130 m) above meansea level in the NE l/4, sec.22, T. lN, R. 29 E, onthe northwest side of Big Southern Butte, the mostprominent landmark about 60 km NW of the city ofBlackfoot. This occurrence is noteworthy because itis the site of near-surface (<100 m depth) hydro-thermal alteration that produced a ralstonite-tkemineral without sigfficant Na or Mg, which pre-viously have been considered essential componentsof ralstonite.
Quantitative chemical data for this ralstonite-likemineral are given in Table 1, along with the cell di-mensions. Quantitative electron microprobe datawere obtained at l0 kV with the beam defocussed tol0 microns. Analyzed biotite, fluor-phlogopite,Al2O., KC| and CaF, were used as standards. TheK-line intensity data for each element in specimenA50976 were proc€ssed by Magic [V, and the resultswere identical to those obtained without ZAF correc-tions. Significani chlorine and potassium are sub-stituted for the anion and cation, respectively, in onespecinen (Table l). Quantitative analyses for Mg, Li,Be, B, and NHf (Kjeldahl method) revealed less than0.03 weight percent of each in specimen A50976.Quartz, sanidine, and tridymite are the common as-sociated minerals readily recognized by transmitted-light petrographic methods; these are believed to berelict from the rhyolite. Specimen Sobu-OF containsmassive halite, qvartz, and albite. dssslfling to X-ray diffraction studies of bulk samples, scanning elec-tron microscopy, electron microprobe studies, andpetrographic studies, we conclude that the ralstonite-like mineral, halite, and albite are of hydrothermalorigin. Fluorite is sparse, and topaz was not found.The ralstonite-tke mineral is optically isotropic, andoccurs as compact masses of submicron-size grains.The largest crystals, shown on Figure l, are l0- to 15-
micron octahedra observed only in one of four speci-mens. Some rosettes of crystal aggregates occurperched on coarsely crystalline halite. Grains of
Table 1. Mineralogical data for hydrated aluminum hydroxy-fluoride in four specimens from Big Southern Butte, Snake River
Plain. Idaho
A5097 6S p e c i m e n n o . S o b u - A , A S o b u - B
W e i g h t p e r c e n t
A1
C1
F
o H c a l c u l a t e d
" 2 " " : * ^ - , ' - ' " - '
2 . I 0 . 1 7 0 . 1 5( 0 . 2 ) ( 0 . 0 4 ) ( 0 . 0 2 ,
o . 2 7 0 . 1 8 0 . I 6( 0 . 0 1 ) ( 0 . 0 s ) ( 0 . 0 4 )
0 . 0 8 < 0 . 0 7 < 0 . 0 7( 0 . 0 3 )
2 5 . 9 2 1 . 3 2 6 . 8( 0 . 2 ) ( 0 . 3 ) ( 0 . 4 )
2 . 8 0 . 2 6 0 . 2 3( 0 . 4 ) ( 0 . 2 0 ) ( 0 . 1 5 )
3 3 . 1 4 7 . 2 4 0 , 4( r . 2 ) ( 1 . 1 ) ( 1 . 5 )
2 r . 4 1 5 . 3 1 5 . 0
r 4 . 3 L 5 . 6 1 7 . 3
ALomic percent ( fo r F+oH+Cl = 48)
o . 2 6( 0 . 1 0 )
0 . 2 8( 0 . 0 i )
< 0 . 0 7
2 1 . 2( 0 . 2 )
0 . 0 6( 0 . 0 7 )
4 2 . 2( 1 . 3 )
1 4 . 4
1 5 . 6
K
Na
C a
c1
F
OH
H ^ 0
0 . 8 3 0 . 0 7
0 . 1 8 0 . 0 8
0 . 0 3
1 4 . 9 8 1 5 . 6 6
7 . 2 4 0 . 1 2
2 7 . r 3 3 3 . 4 6
7 9 . 6 4 1 4 . 4 3
I 2 . 4 1 2 . 8 9
15 .86 L5 .7 6
0 . 1 0 0 . o 2
3 3 . 8 6 3 4 . 7 0
r4 .o4 13 .27
15 . 30 13 . 58
0 . 0 6
0 . 1 1
0 . 1 0
0 . 1 9
LeII Olnensaons (A,,
9 . 8 6 1 ( 4 ) 9 . 1 9 9 ( 3 ) 9 . 7 9 1 ( 3 )
Values given for welght percent are the mean, with the
s E a n d a r d d e v i a t i o n i n p a r e n t h e s e s , b a s e d o n 1 7 - 3 9 e l e c t r o n
microprobe analyses for each elenent in each specimen' except
for Sobu-oF which is based only on 5-7 analyses for each
e l e n e n t . M g i s l e s s t h a n 0 . 1 0 i n a l l a n a l y s e s .
0/J0.3-.00/.X/ 80 /09 l 0- 1057$02.00 t057
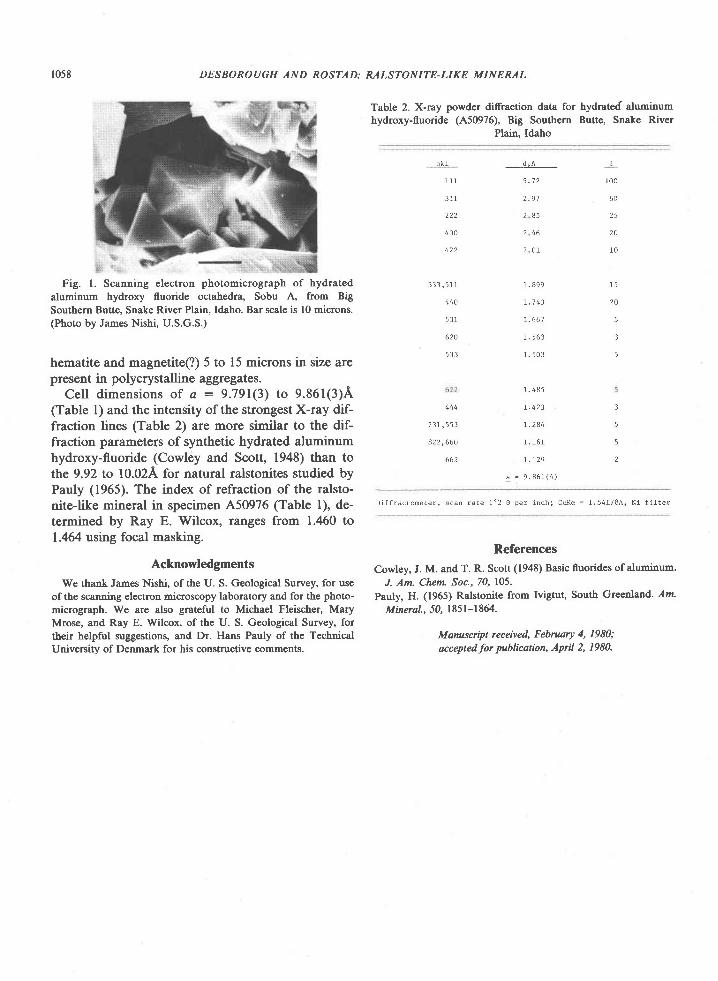
1058
Fig. 1. Scanning electron photomicrograph of hydrated
aluminum hydroxy fluoride octahedra, Sobu A, from Big
Southern Butte, Snake River Plain, Idaho. Bar scale is l0 microns.(Photo by James Nishi, U.S.G.S.)
hematite and magnetite(?) 5 to 15 microns in size arepresent in polycrystalline aggregates.
Cell dimensions of a : 9.791(3) to 9.861(3)A(Table l) and the intensity of the strongest X-ray dif-fraction lines (Table 2) are more similar to the dif-fraction parameters of synthetic hydrated aluminumhydroxy-fluoride (Cowliy and Scott, 1948) than tothe 9.92 to 10.02A for natural ralstonites studied byPauly (1965). The index of refraction of the ralsto-nite-like mineral in specimen A50976 (Table l), de-termined by Ray E. Wilcox, ranges from 1.460 to1.464 using focal masking.
AcknowledgmentsWe thank James Nishi, of the U. S. Geological Survey, for use
of the scanning electron microscopy laboratory and for the photo-
nicrograph. We are also grateful to Michael Fleischer, Mary
Mrose, and Ray E. Wilcox, of the U. S. Geological Survey, for
their helpful suggestions, and Dr. Hans Pauly of the TechnicalUniversitv of Denmark for his constructive comments.
DESBOROUGH AND ROSTAD: MLSTONITE-LIKE MINERAL
Table 2. X-ray powder difraction data for hydrated aluminumhydroxy-fluoride (A50976), Big Southern Butte, Snake River
Plain. Idaho
b k 1
1 1 1
3 1 1
3 3 3 , 5 1 1
440
5 3 1
I
100
60
2 5
2 0
10
2 2 2
4 0 0
4 2 2
1 5
2 0
5
l
5
6 2 0
5 3 3
5 . 7 2
2 . 9 7
2 8 5
2 4 6
2 0 I
l . 8 9 9
r . 7 4 3
l - 6 6 1
r . 5 6 3
1 . 5 0 3
1 . 4 8 5
4 4 4 r . 4 2 3 3
7 3 7 , 5 5 3 r . 2 8 4 5
8 2 2 , 6 6 0 1 . 1 6 1 5
6 6 2 7 . 1 2 9 2
a = 9 . 8 6 1 ( 4 )
D i f f r a c t o m e E e r , s c a n r a t e 1 ' 2 0 p e r i n c h ; c u K o = 1 . 5 4 I 7 8 A , N i f i l t e r
References
Cowley, J. M. and T. R. Scott (1948) Basic fluorides of aluminum.J. Am. Chem. Soc.,70, 105.
Pauly, H. (1965) Ralstonite from Ivigtut, South Gteenland. Am.
Mineral., JA 185 l-1864.
Manuscript received, February 4, 1980;
acceptedfor publication, April 2, 1980.
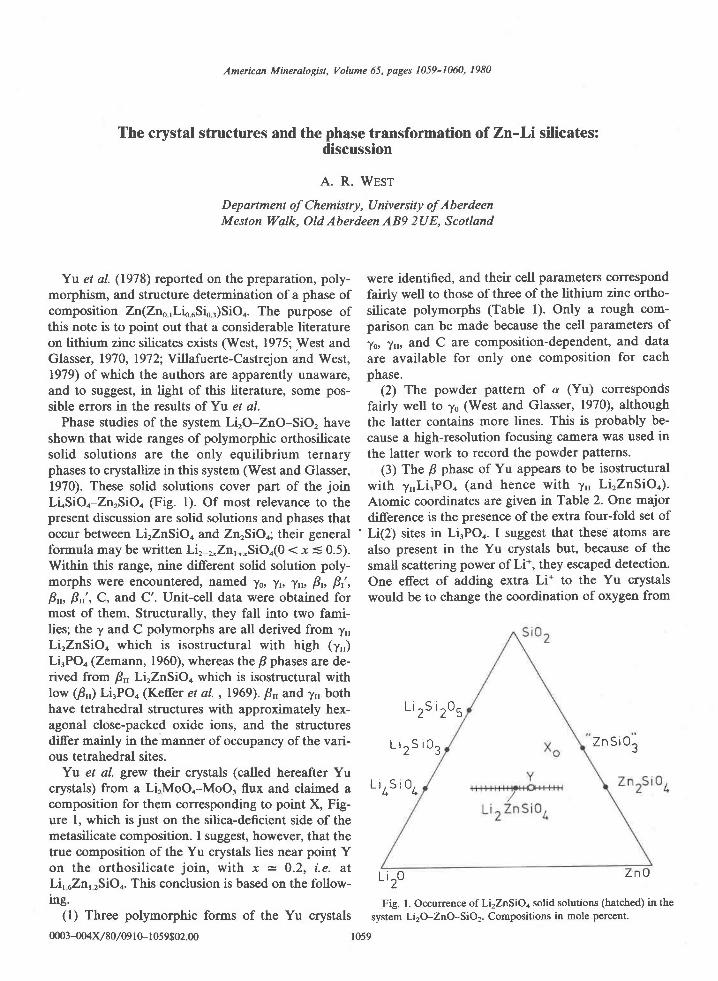
American Mineralogist, Volume 65, pages 1059-1060, 1980
The crystal structures and the phase transformation of Zn-Li silicates:discussion
A. R. WEST
Department of Chemistry, University of AberdeenMeston Wqlk, Old Aberdeen AB9 2UE, Scotland
Yu et al. (1978) reported on the preparation, poly-morphism, and structure determination of a phase ofcomposition Zn(Za,LLuSLr)SiOo. The purpose ofthis note is to point out that a considerable literatureon lithium zinc silicates exists (West, 1975; West andGlasser, 1970, 1972; Villafuerte-Castrejon and West,1979) of which the authors are apparently unaware,and to suggest, in light of this literature, some pos-sible errors in the results of Yu et al.
Phase studies of the system LirO-ZnO-SiO, haveshown that wide ranges of polymorphic orthosilicatesolid solutions are the only equilibrium ternaryphases to crystallize in this system (West and Glasser,1970). These solid solutions cover part of the joinLLSiOo-Zn,SiO. (Fig. l). Of most relevance to thepresent discussion are solid solutions and phases thatoccur between LilnSiOo and ZnrSiOo; their generalformula may be written Lir-r,Zn,*,SiO.(0 < x = 0.5).Within this range, nine different solid solution poly-morphs were encountered, named fo, .h, Trc Br, Br',Brr, Brr', C, and C'. Unit-cell data were obtained formost of them. Structurally, they fall into two fami-lies; the 7 and C polymorphs are all derived from y,,LirZnSiOn which is isostructural with high (y,,)LirPO4 (Zemann,1960), whereas the B phases are de-rived from F,, LirZnSiOo which is isostructural withlow (B,,) Li3PO4 (Keffer et al. ,1969). B,, and y,, bothhave tetrahedral structures with approxinately hex-agonal close-packed oxide ions, and the structuresdiffer mainly in the manner of occupancy of the vari-ous tetrahedral sites.
Yu et al. grew their crystals (called hereafter Yucrystals) from a LirMoOo-MoO, flux and claimed acomposition for therr corresponding to point X, Fig-ure t, which is just on the silica-deficient side of themetasilicate composition. I suggest, however, that thetrue composition of the Yu crystals lies near point Yon the orthosilicate join, with x - 0.2, i.e. atLi,uZn,rSiOo. This conclusion is based on the follow-ing.
(l) Three polymorphic forms of the Yu crystals
were identified, and their cell parameters correspondfairly well to those of three of the lithium zinc ortho-silicate polymorphs (Table l). Only a rough com-parison can be made because the cell parameters ofyo, yu, and C are composition-dependent, and dataare available for only one composition for eachphase.
(2) The powder pattern of a (Yu) correspondsfairly well to 7o (West and Glasser, 1970), althoughthe latter contains more lines. This is probably be-cause a high-resolution focusing camera was used inthe latter work to record the powder patterns.
(3) The B phase of Yu appears to be isostructuralwith y,,Li.POo (and hence with 71 Li'ZnSiO.).Atomic coordinates are given in Table 2. One majordifference is the presence ofthe extra four-fold set of
' Li(2) sites in Li.POn. I suggest that these atoms arealso present in the Yu crystals but, because of thesmall scattering power of Li*, they escaped detection.One effect of adding extra Li* to the Yu crystalswould be to change the coordination of oxygen from
L i ^ 0 z n uI
Fig. l Occurrence of Li2ZnSiOa solid solutions (hatched) in the
system Li2O-ZnO-SiO2. Compositions in mole percent.
L i 2s i 205
L i 2 s i 0 3 Z n S i 0 ,
L i4s i04
0n0.l_w4x / 80 /09 I 0- I 059$02.00 1059
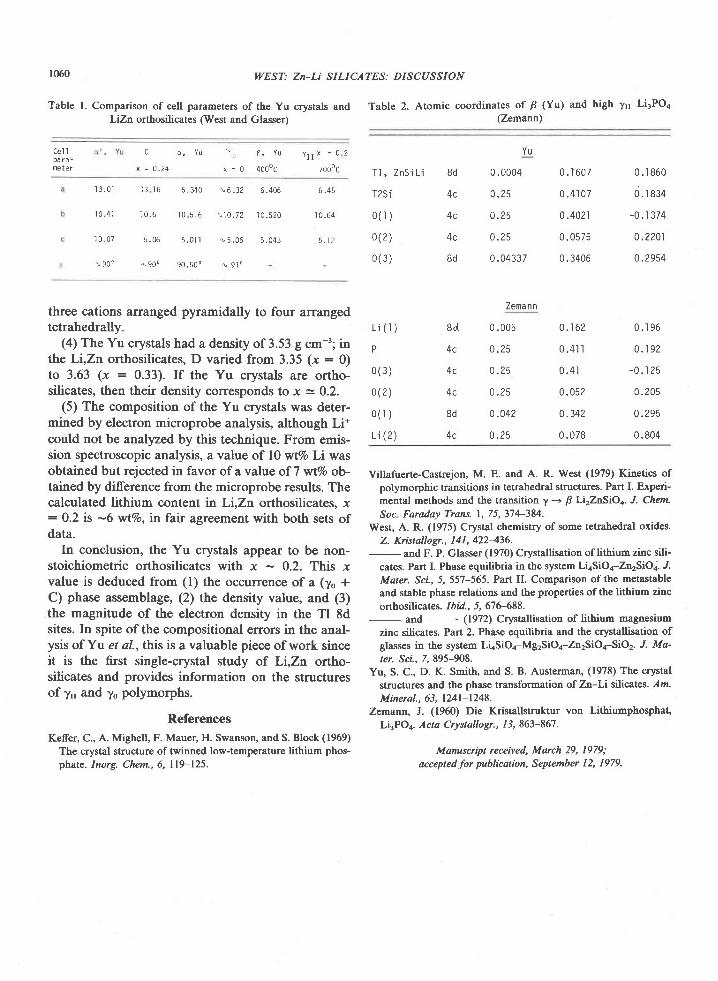
r060 WEST: Zn-Li SILICATES: DISCUSSION
Table l. Comparison of cell parameters of the Yu crystals andLiZn orthosilicates (West and Glasser)
Table 2. Atomic coordinates of B (Yu) and high 1n Li3POa
(Zemann)
Cel Ipara -neter
C c , Y u
x = 0 . 2 4
Y u
0 .0004
0 . 2 5
0 . 2 5
0 . 2 5
0 . 0 4 3 3 7
Zemann
0 . 0 0 5
0 . 2 5
0 . 2 5
0 . 2 5
0.042
0 . 2 5
T l , ZnSi L i
T2Si
0 ( l )
0 ( 2 )
0 ( 3 )
L i ( r )
P
0 ( 3 )
0 ( 2 )
0 ( t )
L i ( 2 )
0 .1 860
o. tasq-0 .1 374
0 .2201
0.2954
' . B , Y u y i l x = 0 2
x = 0 4 o 0 o c 7 0 0 0 c
1 3 . 0 1
I 0 . 4 1
'10 07
o 900
6.406
1 0 . 5 2 0
5 . 0 4 3
6 .45
1 0 . 6 4
5 . 1 2
0 . 1 6 0 7
0 . 4 1 0 7
0.4021
0 .0575
0 . 3 4 0 6
1 3 1 6 6 . 3 4 0 * 6 . 3 2
I 0 . 6 I 0 . 5 . ] 6 \ 1 0 . 7 2
5 . 0 6 5 . 0 1 1 o 5 . 0 6
r 9 0 o 9 0 . 5 0 0 r 9 l o
8d
4c
4c
4c
8d
B d
4 c
8d
three cations arranged pyramidally to four arrangedtetrahedrally.
(a) The Yu crystals had a density of 3.53 g cm-3; int}lre Li,Zn orthositcates, D varied from 3.35 (x : 0)to 3.63 (x : 0.33). If the Yu crystals are ortho-silicates, then their density corresponds to x = 0.2.
(5) The composition of the Yu crystals was deter-mined by electron microprobe analysis, although Li*could not be analyzed by this technique. From emis-sion spectroscopic analysis, a value of l0 tt4%o Li wasobtained but rejected in favor ofa value of7 wt%o ob-tained by diference from the microprobe results. Thecalculated lithium content in Li,Zn orthosilicates, x: 0.2 is -6 wt%o, in fair agreement with both sets ofdata.
In conclusion, the Yu crystals appear to be non-stoichiometric orthosilicates with x - 0.2. This xvalue is deduced from (l) the occurrence of a (yo *C) phase assemblage, (2) the density value, and (3)the magnitude of the electron density in the Tl 8dsites. In spite of the compositional errors in the anal-ysis of Yu et al., this is a valuable piece of work sinceit is the first single-crystal study of L|Zn ortho-silicates and provides information on the structuresof n, and yo polymorphs.
ReferencesKeffer, C., A. Mighell, F. Mauer, H. Swanson, and S. Block (1969)
The crystal structure of twimed low-temperature lithium phos-
phate. Inorg. Chem.,6, l19-125.
Villafuerte-Castrejon, M. E. and A. R. West (1979) Kinetics ofpolymorphic transitions in tetrahedral structures. Part I. Experi-mental methods and the transition y + B L\rZnSiOe. J. Chem.Soc. Faraday Trans. 1,75,374-384.
West, A. R. (1975) Crystal chemistry of some tetrahedral oxides.Z. Kristallogr., 1 4 1, 422436.
- and F. P. Glasser (1970) Crystallisation of lithium zinc sili-cates. Part I. Phase equilibria in the system LiaSiOa-ZnrSiOj. J.Mater. Sci., 5, 557-565. Part II. Comparison of the metastableand stable phase relations and the properties of the lithium zincorthosilicates. Ibid., 5, 67G688.
- and - (1972) Crystallisation of lithium magnesiumzinc silicates. Part 2. Phase equilibria and the crystallisation ofglasses in the system LiaSiOa-MgrSiOa-Zn2SiOa-SiO2. J. Ma-ter. Sci., Z 895-908.
Yu, S. C., D. K. Smith, and S. B. Austerman, (1978) The crystalstructures and the phase transformation of Zn-Li silicates. lrn-Mineral., 63, 124l-1248.
Zemann, J. (1960) Die Kristallstruktur von LittriumphosphatLi3PO4. Acta Crystallogr., I 3, 863-867.
Manuscript received, March 29, 1979;acceptedfor publication, September 12, 1979.
0 . 1 6 2
0.4 . l I
0 . 4 1
0 . 0 5 2
0.342
0 .078
0 . 1 9 6
0 . ' l 9 2
- 0 . I 2 5
0 .205
0.295
0 .804
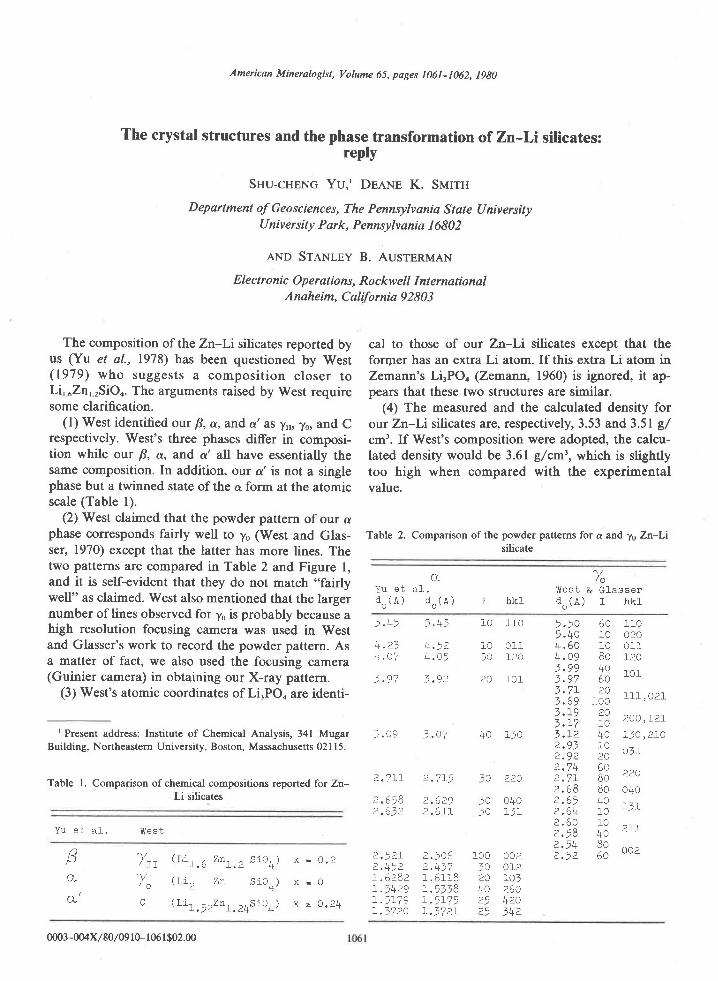
American Mineralogist, Volume 65, pages 106l-1062, 1980
The crystal structures and the phase transformation of zn-Li silicates:reply
Suu-cHrNc Yu,' DEANE K. SMrrH
Department of Geosciences, The Pennsylvania State UniversityUniversity Park, Pennsylvania I 6802
A'NO STANTEY B. AUSTERMAN
Electronic Op erations, Ro ckwell InternationalA naheim, C alifo rnia 9 280 3
The composition of the Zn-Li silicates reported byus (Yu et al., 1978) has been questioned by West(1979) who suggests a composi t ion c loser toLiruZn,rSiOo. The arguments raised by West requiresome clarification.
(l) West identified our B, a, and a'ts ]rr, /o, and Crespectively. West's three phases differ in composi-tion while our B, d, and a' all have essentially thesame composition. In addition, our d'is not a singlephase but a twinned state of the c form at the atomicscale (Table l).
(2) West claimed that the powder pattern of our aphase corresponds fairly well to yo (West and Glas-ser, 1970) except that the latter has more lines. Thetwo patterns are compared in Table 2 and Figure l,and it is self-evident that they do not match "fairlywell" as claimed. West also mentioned that the largernumber of lines observed for 7o is probably because ahigh resolution focusing camera was used in Westand Glasser's work to record the powder pattern. Asa matter of fact, we also used the focusing camera(Guinier camera) in obtaining our X-ray pattern.
(3) West's atomic coordinates of Li.POo are identi-
rPresent address: Institute of Chemical Analysis, 341 MugarBuilding, Northeastern University, Boston, Massachusetts 02 1 1 5.
Tabfe 1. Comparison of chemical compositions reported for Zn-Li silicates
Yu e t a f .
cal to those of our Zn-Li silicates except that thefororer has an extra Li atom. If this extra Li atom inZemann's Li3PO4 (Zemann, 1960) is ignored, it ap-pears that these two structures are similar.
(4) The measured and the calculated density forour Zn-Li silicates are, respectively, 3.53 and3.5l g/cm'. If West's composition were adopted, the calcu-lated density would be 3.61 g/cm', which is slightlytoo high when compared with the experimentalvalue.
Table 2. Comparison ofthe powder patterns for a and yq Zt-Li
ctYu e t a I .d o ( A ) d c ( A ) r h k l
%Wes t & G las6e rd o ( A ) r h k l
5 . + 5 ' . $ 1 0 l t o
4 . 2 3 4 . r 2 1 0 O r f4 . o 7 4 . o 5 , a f 2 0
3 . 9 7 3 . 9 2 2 a f o f
t . a 9 J . o ? 4 0 r J o
5 . 5 0 6 a5 . 4 0 f 04 . 6 0 r o4 . 0 9 B o3 . 9 9 4 03 . 9 7 5 0z a 1) . ( L a v
3 . 6 9 f o o< l o ) i
J . L ? l - oi . r z 4 u2 0 z r n
2 . 9 2 2 02 . ? 4 6 02 . 7 \ B o2 . 6 8 B o1 . O 2 + U2 . 6 4 f o2 . 6 A r 02 . 5 8 4 02 .54 Boa . 2 z b u
l l o0200 1 1I20
10 I
f f t _ , 0 2 t
2OO, r2 ) -
L1A,z raOJI
224
040
W E S t
7r , (L i r .6 znr . , s iou)' V
/ a ;, o r ! . 2 L I t o r t 4 /
c (LL:. .rzznr.ausio4)
2 . 7 r r 2 . 7 r 5
2 . 6 5 8 2 . 6 2 92 .632 2 .6 r r
) a ) 1 ) q a a
2 . 4 r 2 2 . 4 3 7r . 6 2 8 2 1 . 6 1 1 8r . 5 4 2 9 L . r 3 J B1 q r ? o I E i t t q
L . 3 ? 2 a r . 3 7 2 r
30 220
3a 0404 n I < l
002ot-2LOJ2504203 h 2
t a t
2IL
oo2Ra
1003 A204o2 52 5
0003-004x/80/09 l0- 106 l$02.00
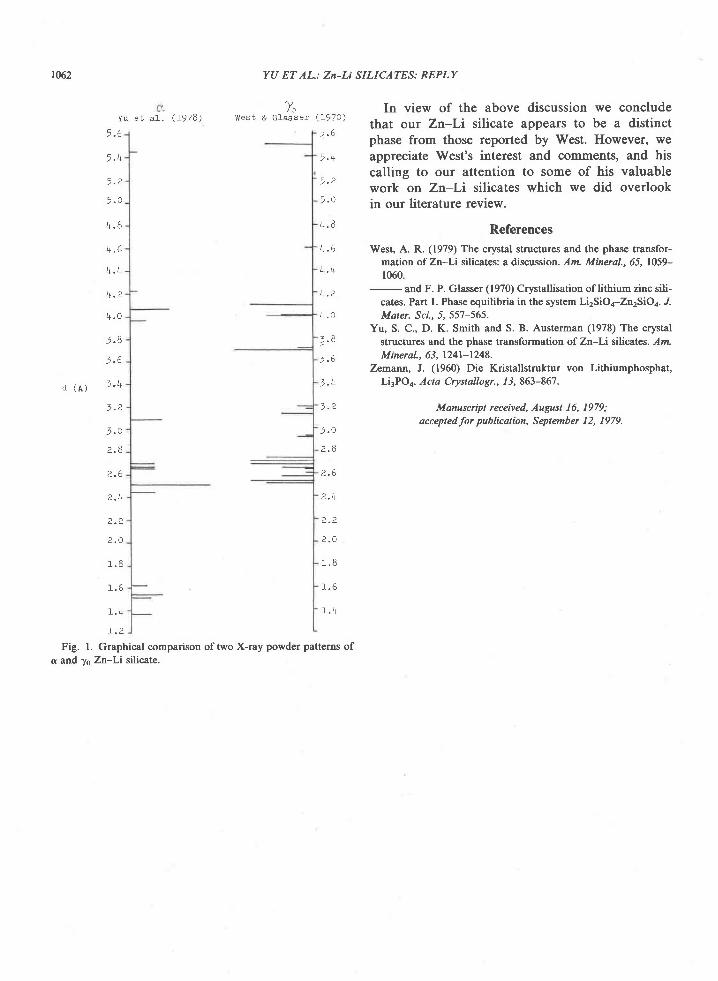
t06.2 YU ET AL.: Zn-Li SILICATES: REPLY
q /
q 2
q A
4 . 8
4 ' 6
+ . +
4 . O
4 R
z t ,d ( A )
2 . 8
" . 4
2 . 2
r Q
r . 4
I . 2
Fig. l. Graphical comparison of two X-ray powder patt€rns ofc and 76 Zn-Li silicate.
ln view of the above discussion we concludethat our Zn-Li silicate appears to be a distinctphase from those reported by West. However, weappreciate West's interest and comments, and hiscalling to our attention to some of his valuablework on Zn-Li silicates which we did overlookin our literature review.
ReferencesWest, A. R. (1979) The crystal structures and the phase transfor-
mation of Zn-Li silicates: a discussion. Am. Mineral., 65, 1059-1060.
- and F. P. Glasser (1970) Crystallisation of lithium zinc sili-cates. Part l. Phase equilibria h the system Li2SiOa-Zn2SiOa. "/.Mater. Sci., t 557-565.
Yu, S. C., D. K. Smith and S. B. Austerman (1978) The crystalstructures and the phase transformation of Zn-Li silicates. lm.Mineral., 63, 124l-1248.
Zemann, J. (1960) Die Kristallstruktur von Lithiumphosphat,Li3PO4. Acta Crystallogr., 1 3, 863-867.
Manuscripl received, August 16, 1979;acceptedfor publication, September 12, 1979.
Y u e t a 1 . ( 1 9 7 8 )T.
W e s t & c l a s s e r ( 1 9 7 0 )
4 . 8
4 . 5
4 . 4
4 . 2
4 . o
2 . 8
) A
2 . 4
? , 2
1 . 8
1 . 5
1 . 4
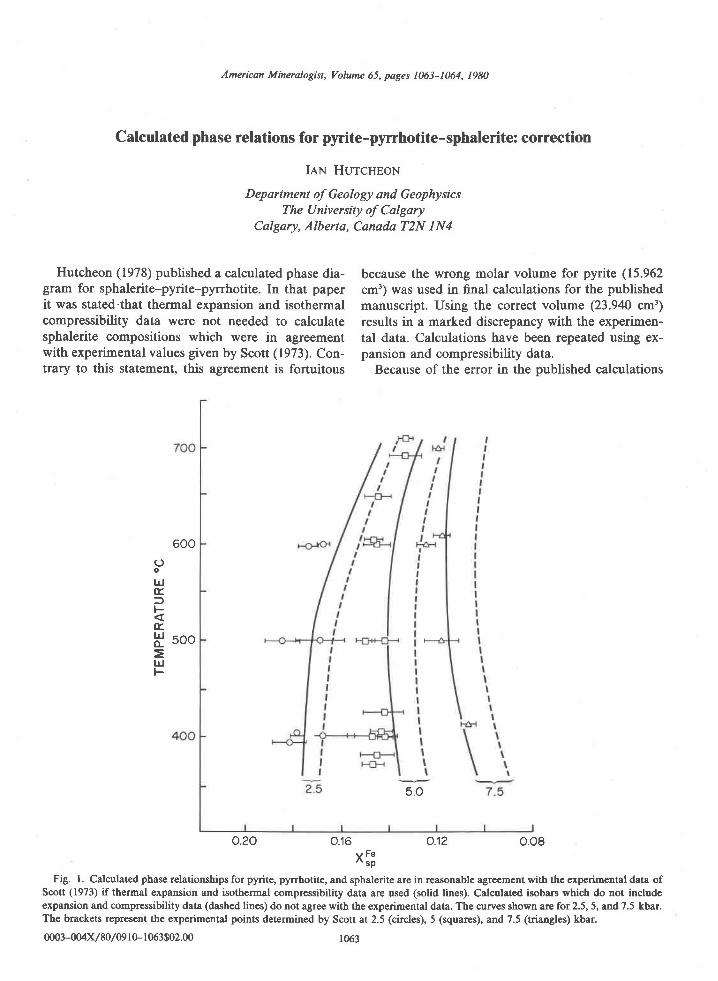
American Mineralogist, Volume 65, pages 1063-1064, 1980
Calculated phase relations for pyrite-pyrrhotite-sphalerite: correction
IaN HurcnpoN
Department of Geology and GeophysicsThe University of Calgary
Calgary, Alberta, Canada T2N lN4
Hutcheon (1978) published a calculated phase dia-gram for sphalerite-pyrite-pyrrhotite. In that paperit was stated.that thermal expansion and isothermalcompressibility data were not needed to calculatesphalerite compositions which were in agreementwith experimental values given by Scott (1973). Con-trary to this statement, this agreement is fortuitous
because the wrong molar volume for pyrite (15.962cm') was used in final calculations for the publishedmanuscript. Using the correct volume (23.940 cm3)results in a marked discrepancy with the experimen-tal data. Calculations have been repeated using ex-pansion and compressibility data.
Because of the error in the published calculations
600()o
UJ(Ef,F(tsI soo=lrlF
5.O
o.20 0.16 0.12 o.o8x!;
Fig. 1. Calculated phase relationships for pyrite, pyrrhotite, and sphalerite are in reasonable agreement with the experirnental data ofScott (1973) if thermal expansion and isothermal compressibility data are used (solid lines). Calculated isobars which do not includeexpansion and compressibility data (dashed lines) do not agree with the experimental data. The curves shown arc for 2.5,5, and 7.5 kbar.The brackets represent the expefmental points determined by Scott at 2.5 (circles), 5 (squares), and 7.5 (triangles) kbar.
0003-004x/80/09 l0- I 063$02.00 1063
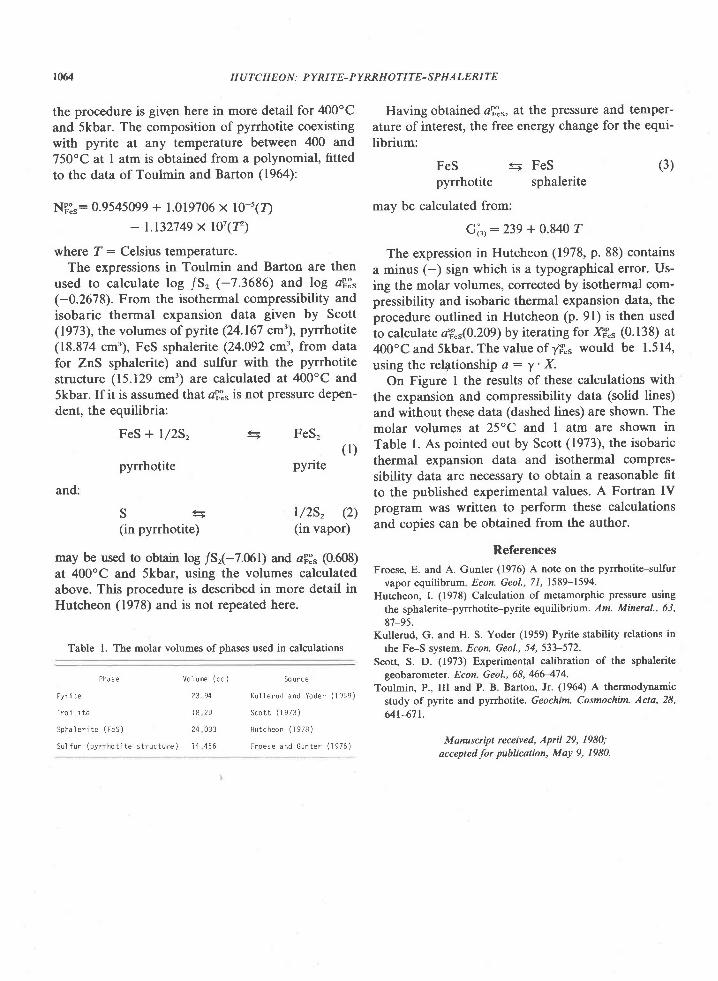
rou
the procedure is given here in more detail for 400"C
and 5kbar. The composition of pyrrhotite coexistingwith pyrite at any temperature between 400 and750"C at I atm is obtained from a polynomial, fitted
to the data of Toulmin and Barton (1964):
NE?": 0.9545099 + 1.019706 x l0-'(r)- 1.132749 x 10⁷(r)
where 7: Celsius temperature.The expressions in Toulmin and Barton are then
used to calculate log /S, (-7.3686) and log aE3"(-0.2678). From the isothermal compressibility andisobaric thermal expansion data given by Scott(1973), the volumes of pyrite (24.167 cm3), pyrrhotite(18.874 cm'), FeS sphalerite (24.092 cm', from datafor ZnS sphalerite) and sulfur with the pyrrhotitestructure (15.129 cm') are calculated at 400"C and5kbar. If it is assumed that affi" is not pressure depen-dent, the equilibria:
FeS + l/2S,
pyrrhotite
S S(in pyrrhotite)
S FeS,( l )
pyrite
and:
r/2s, (2)(in vapor)
may be used to obtain log /S,e7.061) and aB3" (0.608)at 400oC and 5kbar, using the volumes calculatedabove. This procedure is described in more detail inHutcheon (1978) and is not repeated here.
Table L The molar volurnes ofphases used in calculations
H U TC H EO N : PY RI TE-PYRRH OTITE- S P HA LERITE
So urce
K u l l e r u d a n d Y o d e r ( 1 9 5 9 )
S c o t t ( l 9 7 3 )
Hutcheon ( l 978)
F r o e s e a n d G u n t e r ( 1 9 7 6 )
Having obtained a?""r, at the pressure and temper-ature of interest, the free energy change for the equi-librium:
FeS S FeS (3)pyrrhotite sphalerite
may be calculated from:
Go ' :239 + 0 .840 r
The expression in Hutcheon (1978, p. 88) containsa minus (-) sign which is a typographical error. Us-ing the molar volumes, corrected by isothermal com-pressibility and isobaric thermal expansion data, theprocedure outlined in Hutcheon (p. 9l) is then usedto calculate 4'i"s(0.209) by iterating for S.. (0.138) at400'C and 5kbar. The value of lf." would be 1.514,using the rel4tionship a: y' X.
On Figure I the results of these calculations withthe expansion and compressibility data (solid lines)and without these data (dashed lines) are shown. Themolar volumes at 25"C and I atm are shown inTable l. As pointed out by Scott (1973), the isobaricthermal expansion data and isothermal compres-sibility data are necessary to obtain a reasonable fitto the published experimental values. A Fortran IVprogram was written to perform these calculationsand copies can be obtained from the author.
ReferencesFroese, E. and A. Gunter (1976) A note on the pyrrhotite-sulfur
vapor equilibrum Econ. Geol.,71, 1589-1594'
Hutcheon, I. (1978) Calculation of metarnorphic pressure using
the sphalerite-pyrrhotite-pyrite equilibrium. Am. Mineral., 63,
87-95.Kullerud, G. and H. S. Yoder (1959) Pyrite stability relations in
the Fe-S systern. Econ. Geol., 54,53f-572.
Scott, S. D. (1973) Experimental calibration of the sphalerite
geobarometer. Econ. Geol., 68, 466474.
Toulmin, P., III and P. B. Barton, Jr. (1964) A thermodynamic
study of pyrite and pyrrhotite. Geochim. Cosmochim. Acta, 28,
641-671.
Manuscript received, April 29, 1980;
acceptedfor publication, May 9, 1980.
P h a s e
Pyri te
T r o i l i t e
S p h a l e r i t e ( F e S )
Vo'l ume (cc )
2 3 . 9 4
' tB 20
2 4 0 3 3
S u l f u r ( p y r r h o t i t e s t r u c t u r e ) l 4 4 5 6
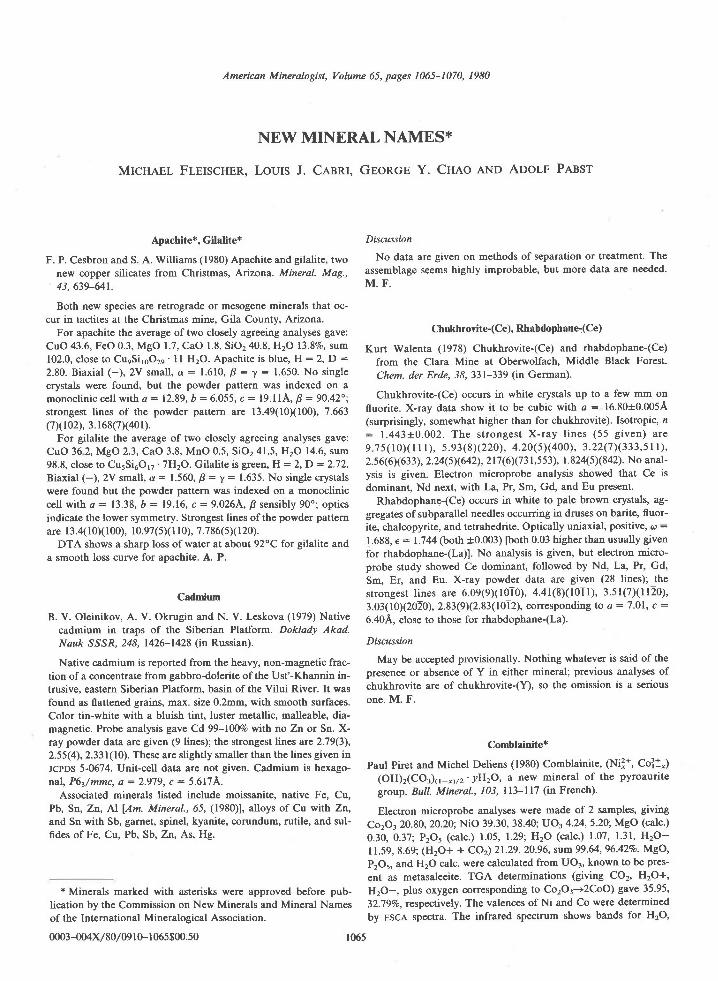
American Mineralogist, Volume 65, pages 1065-1070, 1980
NEW MINERAL NAMES*
MtcserI. Frelscnen. LoUIS J. CesnI. GEoRGE Y. Cueo AND ADoLF Pnnsr
Apachite*, Gilalite*
F. P. Cesbron and S. A. Williams (1980) Apachite and gilalite, two
new copper silicates from Christmas, Arizona. Mineral. Mag.,
43.639-641.
Both new species are retrograde or mesogen€ minerals that oc-
cur in tactites at the Christmas mine, Gila County, Arizona.
For apachite the average oftwo closely agreeing analyses gave:
CuO 43.6, FeO 0.3, MgO 1.7, CaO 1.8, SiO2 210.8, H20 13.87o, sum
102.0, close to CueSi,6O2e ' I I H2O. Apachite is blue, H : 2, D :
2.80. Biaxial (-), 2V small, o : 1.610, B : t : 1.650. No single
crystals were found, but the powder pattern was indexed on a
monoclinic cell with a: 12.89, b : 6.055, c : 19.l lA, B : 90.42";
strongest lines of the powder pattern ar€ 13.49(l0xl00), 7.663(7Xr02), 3. 168(7X401).
For gilalite the average of two closely agreeing analyses gave:CuO 36 2, MgO 2.3, CaO 3.8, MnO 0.5, SiO2 41.5, H2O 14.6, sum98.8, close to CurSi6Otr '7HrO. Gilalite is green, H:2,D :2.72.
Biaxial (-), 2V small, a : 1.560, B: t: 1.635. No single crystalswere found but the powder pattern was indexed on a monocliniccell with a : 13.38, D : 19.16, c : 9.0264. p sensibly 90o; opticsindicate the lower symmetry. Strongest lines of the powder patternare I 3.4( l0)( 100), 10.97(sX I l0), 7.786(sX I 20).
DTA shows a sharp loss of water at about 92oC for gilalite anda smooth loss curve for apachite. A. P.
Cadmium
B. V. Oleinikov, A. V. Okrugin and N. V. Leskova (1979) Nativecadmium in traps of the Siberian Platform. Doklady Akad.Nazk SSSR, 248, 1426-1428 (in Russian).
Native cadmium is reported from the heavy, non-magnetic frac-tion of a conc€ntrate from gabbro-dolerite of the Ust'-Khannin in-trusive, eastern Siberian Platform, basin of the Vilui River. It wasfound as flattened grains, max. size 0.2mm, with smooth surfaces.Color tin-white with a bluish tint. luster metallic, malleable, dia-magnetic. Probe analysis gave Cd 99-l00%o with no Zn or Sn. X-ray powder data are given (9 lines); the strongest lines are 2.79(3),2.55(4),2.331(10). These are slightly smaller than the lines given inJcpDS 5-0674. Unit-cell data are not given. Cadmium is hexago-nal, P61/mmc, a:2.979, c : 5.617A.
Associated minerals listed include moissanite, native Fe, Cu,Pb, Sn, Zn, Al lAm. Mineral.,6J, (1980), alloys of Cu with Zn,and Sn with Sb, garnet, spinel, kyanite, corundum, rutile, and sul-fides ofFe, Cu, Pb, Sb, Zn, As, Hg.
* Minerals marked with asterisks were approved before pub-lication by the Commission on New Minerals and Mineral Namesof the International Mineralogical Association.
Discassion
No data are given on methods of separation or treatment. The
assemblage seems highly improbable, but more data are needed.
M. F.
Chukhrovite-(Ce), Rhabdophanel(Ce)
Kurt Walenta (1978) Chukhrovite-(Ce) and rhabdophane-(Ce)
from the Clara Mine at Oberwolfach, Middle Black Forest.
Chem. der Erde, 38,331-339 (in German).
Chukhrovite-(Ce) occurs in white crystals up to a few mm on
fluorite. X-ray data show it to be cubic with a : 16.80+0.0054
(surprisingly, somewhat higher than for chukhrovite). Isotropic, n: 1.443+0.002. The strongest X-ray l ines (55 given) are
9 75( l0Xr r r ) , s .e3(8)(220\ , 4 .20(5)(400) , 3.22(7)(333,51l ) ,2. 5 6(6X63 3 ), 2.24 (5)(u2), 2t 7 (6)(7 1 t'5 53), | .824(5) (842). No anal-ysis is given. Electron microprobe analysis showed that Ce is
dominant, Nd next, with La, Pr, Sm, Gd, and Eu present'
Rhabdophane-(Ce) occurs in white to pale brown crystals, ag-
gregates of subparallel needles occurring in druses on barite, fluor-
ite, chalcopyrite, and tetrahedrite. Optically uniaxial, positive, @ :
1.688, e : 1.144 (both 10.003) [both 0.03 higher than usually given
for rhabdophane-(La)1. No analysis is given, but electron micro-
probe study showed Ce dominant, followed by Nd, La, Pr, Gd,
Sm, Er, and Eu. X-ray powder data are given (28 lines); the
strongest l ines are 6.09(9X10¹⁰), 4.41(8Xl0Tl) , 3.51(7Xl l20),
3.03(10X2020), 2.83(9X2.83(10T2), corresponding to a : 7.O1, c:
6.40A, close to those for rhaMophane-(La).
Discussion
May be accepted provisionally. Nothing whatever is said of the
presence or absence of Y in either mineral; previous analyses of
chukhrovite are of chukhrovite-(Y), so the omission is a senous
one. M. F.
Comblainite*
Paul Piret and Michel Deliens (1980) Comblainite, (Ni?+, Co?l')
(OH)r(CO3)(r-'trz'lHzO, a new mineral of the pyroaurite
group. Bull. Mineral., 103, ll3-ll'1 (in French).
Electron microprobe analyses were made of 2 samples, giving
Co2O3 20.80, 20.20; NiO 39.30, 38''10; UO3 4.24,5.20; MgO (calc.)
0.30, 0.37; P2O, (calc.) 1.05, 1.29; HrO (calc.) 1.07' l.3l' HrO-
I 1.59, 8.69; (H2O+ + CO) 21.29,20.96, sum 99.64,96.424o. MgO,
P2O5, and H2O calc. were calculated from UO3, known to be pres-
ent as metasaleeite. TGA determinations (giving CO2' H2O+'
H2O-, plus oxygen corresponding to Co2O3+2CoO) gave 35.95'
32.797o, respectively. The valences of Ni and Co were determined
by ESCA spectra. The infrared spectrum shows bands for H2O,
0003-004x/80/09 I 0- I 065$00.50 1065
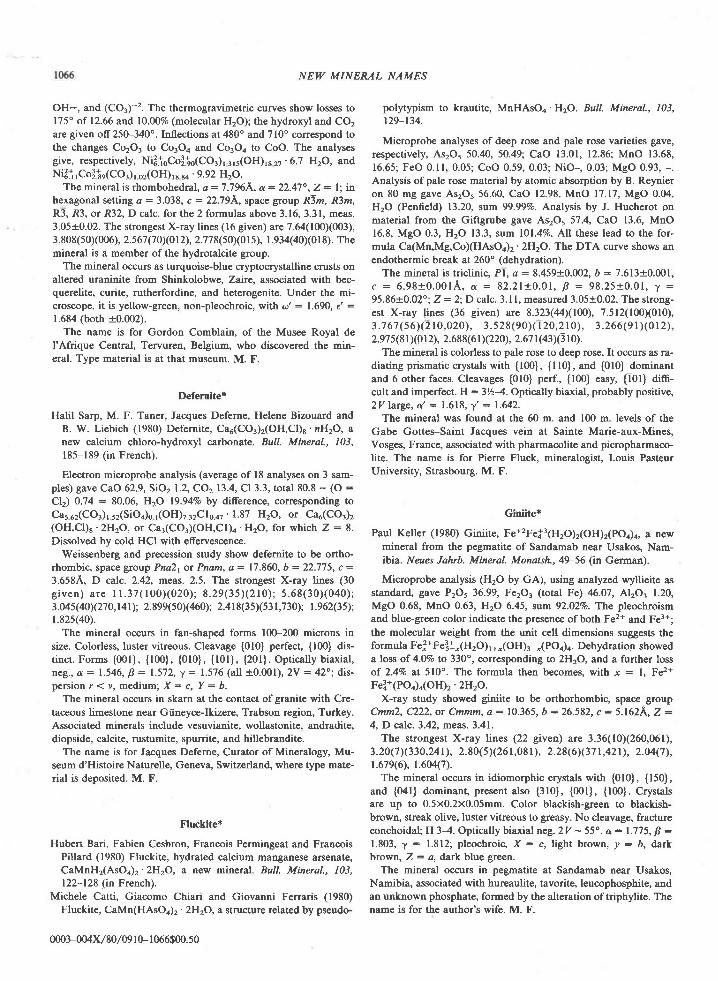
NEI,Y MINERAL NAMES
OH-, and (COr)-'. The thermogravimetric curves show losses tol'15" of 12.66 and l0.$OVo (molecular H2O); the hydroxyl and CO2are giv€n off250-340'. Inflections at 4800 and 7l0o correspond tothe changes Co2O3 to Co3Oo and Co3Oa to CoO. The analysesgive, respectively, NiSioColSo(CO3)r 3rs(OH) rezt. 6.7 HrO, andNill,col[r(cor), or(oH),, * .9.92 Il2O.
The mineral is rhombohedral, a : 7.7964, a : 22.4'l ", Z : l: nhexagonat setting a : 3.038, c :22.794, space group R3m, Rlm,R3, R3, or R32, D calc. for the 2 formulas above 3.16, 3.31, meas.3.05{-0.02. The strongest X-ray lines (16 given) are 7.64(100)(003),3. 808(50)(006), 2.s67 (7 0)(0 t2), 2.778(50X0 l s), r.e3a(a0)(0 l 8). rhemineral is a member of tie hydrotalcite group.
The mineral occurs as turquoise-blue cryptocrystalline crusts onaltered uraninite from Shinkolobwe, Zaire, associated with bec-querelite, curite, rutherfordine, and heterogenite. Under the mi-croscope, it is yellow-green, non-pleochroic, with a' : 1.690, e' :1.684 (both +0.002).
The name is for Gordon Comblain, of the Musee Royal deI'Afrique Central, Tervuren, Belgium, who discovered the min-eral. Type material is at that museum. M. F.
Defernite*
Halil Sarp, M. F. Taner, Jacques Deferne, Helene Bizouard andB. W. Liebich (1980) Defernite, Cae(COr)z(OH,Cl)B' nH2O, anew calcium chloro-hydroxyl carbonate. Bull. Mineral., 103,185-189 (in French).
Electron microprobe analysis (average of 18 analyses on 3 sam-ples) gave CaO 62.9, SiO2 1.2, CO2 13.4, Cl 3.3, total 80.8 - (O :
Clt 0.74 : 80.06, H2O l9.94%o by difference, corresponding toCa552(CO3)1 52(SiO4)o r(OH)7.32C10.47' 1.87 H2O, or Ca5(CO3)2(OH,CI)8'2H2O, or Ca3(CO3)(OH,CI)4'H2O, for which Z : 8.Dissolved by cold HCI with effervescence.
Weissenberg and precession study show defernite to be ortho-rhombic, space group Pna21 or Pnam, a: 17.860, b :22.775, c :3.6584, D calc. 2.42, meas. 2.5. The strongest X-ray lines (30g iven) a re 11 .37(100X020) ; 8 .29(35) (210) ; 5 .68(30X040) ;3.Ms(40X270, lal); 2.899(s0)(460); 2.418(35)(s3 1,730); 1.962(35);1.82s(40).
The mineral occurs in fan-shaped forms 100-200 microns insize. Colorless, luster vitreous. Cleavage {010} perfect, (100} dis-tinct. Forms {001), {100}, {010}, {l0l}, {201}. Optically biaxial,neg. , a : 1 .546, P :1 .5 '12 , y : 1 .576 (a l l +0 .001) ,2Y :42" ;d is -persion r < v, medium; X : c, Y : b.
The mineral occurs in skarn at the contact of granite with Cre-taceous limestone near Giineyce-Ikizere, Trabson region, Turkey.Associated minerals include vesuvianite, wollastonite, andradite.diopside, calcite, rustumite, spurrite, and hillebrandite.
The name is for Jacques Deferne, Curator of Mineralogy, Mu-seum d'Histoire Naturelle, Geneva, Switzerland, where type mate-rial is deposited. M. F.
Fluckite*
Hubert Bari, Fabien Cesbron, Francois Permingeat and FrancoisPillard (1980) Fluckite, hydrated calcium manganese arsenate,CaMnH2(AsOa)2'2H2O, a new mineral. Bull. Mineral., 103,122-128 (in French).
Michele Catti, Giacomo Chiari and Giovanni Ferraris (1980)Fluckite, CaMn(HAsOa)2'2H2O, a structure related by pseudo-
0003-004x,/80/09 r 0- I 066$00. s0
polytypism to krautite, MnHAsOa 'H2O. Bull. Mineral., 103,129-134.
Microprobe analyses of deep rose and pale rose varieties gave,respectively, As2Or 50.40, 50.49; CaO 13.01, 12.86; MnO 13.68,16.65; FeO 0.11, 0.05; CoO 0.59, 0.03; NiO-,0.03; MgO 0.93, -.
Analysis of pale rose material by atomic absorption by B. Reynieron 80 mg gave As2Or 56.60, CaO 12.98, MnO 17.17, MgO 0.04,HrO (Penfield) 13.20, sum 99.99Vo. Analysis by J. Hucherot onmaterial from the Giftgrube gave As2O5 57.4, CaO 13.6, MnO16.8, MgO 0.3, H2O 13.3, sum l0l.4%o. All these lead to the for-mula Ca(Mn,Mg,Co)(HAsOa)2'2H2O. The DTA curve shows anendothermic break at 260' (dehydration).
The mineral is triclinic, Pl, a :8.459+0.002, b : 7.613+0.001,c : 6 .98+0.001A, a : 82 .21+0.01 , B : 98 .25+0.01 , . ) , :95.86=0.029; Z :2;D calc. 3.1l, measured 3.05+0.02. The strong-est X-ray llnes (36 given) are 8.323(44X100), 7.512(100X010),3.7 67 (s 6)(2 tO,O20\, 3. 528(90X l 20, 2 l 0), 3.266(9 t)(0 t2\,2.975(8 l X0 I 2), 2.688(6 | )(220} 2.67 l (43X3 l 0).
The mineral is colorless to pale rose to deep rose, It occurs as ra-diating prismatic crystals with (100), {l l0}, and {010} dominantand 6 other faces. Cleavages {010} perf., {100) easy, G0l} diffi-cult and imperfect. H :31h4. Optically biaxial, probably positive,2Vlarge, a' : 1.618, I' : 1.642.
The mineral was found at the 60 m. and 100 m. levels of theGabe Gottes-Saint Jacques vein at Sainte Marie-aux-Mines,Vosges, France, associated with pharmacolite and picropharmaco-lite. The name is for Pierre Fluck, mineralogist, Louis PasteurUniversity, Strasbourg. M. F.
Giniite*
Paul Keller (1980) Giniite, Fe+2Fef,3(H2O)2(OH)2(POa)a, a newmineral from the pegmatite of Sandamab near Usakos, Nam-lbia. Neues Jahrb. Mineral. Monatsh.,49-56 (in German).
Microprobe analysis (HrO by GA), using analyzed wyllieite asstandard, gave P2O5 36.99, Fe2O3 (total Fe) 46.07, Al2O.. 1.20,MgO 0.68, MnO 0.63, H2O 6.45, sum 92.02%. The pleochroismand blue-green color indicate the presence of both Fe2* and Fe3+;the molecular weight from the unit cell dimensions suggests theformula Fe3*Fe3s:.(HrO) r +,(OH)3-"(POo)o. Dehydration showeda loss of 4.07o to 330o, corresponding to 2HrO, and a further lossof 2.4% at 510o. The formula then becomes, with x : l, Fe2+Fei*(POr)a(OH)2' 2H2O.
X-ray study showed giniite to be orthorhombic, space groupCmmL, A22, or Cmmm, a : 10.365, b :26.582, c : 5.1624, Z :4, D calc. 3.42, meas. 3.41.
The strongest X-ray lines (22 given) are 3.36(10)(260,061),3.20(7 )(330,24 | ), 2. 80(sX26 1,08 l ), 2. 28(6)(37 r,42r), 2.04(7 \,r.679(6\, 1.604(7).
The mineral occurs in idiomorphic crystals with {010}, {150},and {O4l} dominant, present also [310), {00U, {100}. Crystalsare up to 0.5x0.2x0.05mm. Color blackish-green to blackish-brown, streak olive, luster vitreous to greasy. No cleavage, fractureconchoidal; H 3-4. Optically biaxial neg. 2V - 55". a: 1.7'15, B :1.803, y : 1.812; pleocfuoic, X : c, light brown, y : b, darkbrown, Z: 4, dark blue green.
The mineral occurs in pegmatite at Sandamab near Usakos,Namibia, associated with hureaulite, tavorite, leucophosphite, andan unknown phosphate, formed by the alteration of triphylite. Thename is for the author's wife. M. F.
Helmutwinklerite*
Giinter Schnorrer-K<ihler ( 1980) Koritnigite and heknutwinkler-ite, two new minerals from Tsumeb, S. W. Africa. Aufschluss,31,4349 (in German).
Microprobe analysis (HrO by Karl Fischer method) gave (aver-age): As2O5 34.35, PbO 31.28, ZnO 27.50, CuO 1.48, H2O 6.14,sum 100.757o, corresponding to PbseCu, y.Zn2r7As1 e2Os.2.19H2O, or PbZn2(AsO4)2.2H2O. Dissolved by cold conc€n-trated HCl.
Triclinic, pseudo-monoclinic, Pl or Pf. Forms {001}, {010},(lT0), and {l lT} . Color sky-blue. G : 5.3, H: 4th, a: t.72(5), g: 1.80(5), f: 1.98(5); biaxial positive. Luster vitreous to resinous.No cleavage. The mineral occurs in cavities in tennantite, associ-ated with quartz and willemite.
The name is for Helrnut Winkler, Universitv of Gdttins.en. M.F,
Jungite*, Matulaite*
P. B. Moore and Jun Ito (1980) Jungite and matulaite, two newtabular phosphate minenls Aufschluss, 31,55-61 (in German).
Jungite
Analysis by J. I. gave P2O5 31.0, Al2O3 0.08, Fe2Or 28.4, ZnO14.6, MgO 0.06, MnO 2.80, CaO 5.89, Na2O 0.04, KrO 0.01,HrO- (180"C) 9.10, H2O+ (loss on ign.) 8.70, sum l0f..68%o, cone-sponding to CarZnaF e1s*(PO4)r(OH), . I 6H2O.
X-ray data show it to be orthorhombic, possible space groupsPcmm, Pcm2p or Pc2m, a : I1.98, b: 20.37, c : 9.95A, Z :2. Dcalc. 2.849, meas. 2.843. The strongest lines (50 given) aree.e6(6x 1 0x020), 5.0e(5x040), 3 ;1 e (4), 3.37 (5)(060), 3. 30(5).
The mineral occurs as rosettes up to I cm in diameter of verythin, tabular, bent crystals. H: l. Cleavag€ perfect [010]. Colordark green, streak yellow. Luster silky to vitreous. Optically biax-ial, neg.(?), B : 1.658, | : 1.664, 2V - 60', Y : a, Z : c, r < vstrong. The mean n, calculated by the Gladstone-Dale rule, isstated (without comment) to be 1.703.
The mineral occurs at the Hagendorf South pegmatite, Bavaria,associated with mitridatite and manganese oxides. The name is forDr. Gerhard Jung, who found the mineral.
Matulaite
Analysis of material from Hellertown gave P2O, 33.5, SiO, 3.0,TiO2 0.12, Al2O3 34.0, FerO3 1.05, ZnO 0.14, CuO 0.09, MnO0.07, CaO 1.59, BaO 0.06, Na.O 0.06, K2O 0.04, H2O- (140.C)15.39, H2O+ (loss on ign.) 10.64, sum99.757o. After subtractingquartz and hematite, this gives CaAl,r(POo),r(OH)2o. 28H2O.Difficultly soluble in HCl, easily in hot H2SO..
Weissenberg and rotation photograpis show matulaite to bemonoclinic, space group probably Y21/c, a : 20.4, b : 16.7, c :10.6A, B : 98.2" , Z : 2. The strongcst X-ray lines (38 given) are9.96(10), 6.37(4), 4.42(4), 2.395(4). A sample ground in acetonegave srongest lines 11.79(100), 10.93(90), 5.94(10), 5.51(80).
The mineral occurs in small rosettes of thin tabular crystals andbotryoidal forms. Cleavage {100} very perfect. Colorless to white,luster pearly. H : l; D : 2.330. Optically biaxial, ncg., 2V - 60" ,B : 1.57 6, y : 1.582; dispersion r < y strong, Y : b, Z : c : 8o. Themean index, calc. from the Gladstone-Dale rule, is stated to be1.542.
The mineral occurs at the Bachman iron mine, Hellertown,Pennsylvania (type locality), and from the Rotliiufchen iron mine,Waldgirmes, West Germany, at both of which it occurs as in-
w3 -DO/'x / 80 / 09 l 0- l 067$00.50
t067
crustations on chert, the youngest mineral of the association b€r-
aunite, rockbridgeite, dufrenite, cacoxenite, strengite, wavellite.
Also occurs at the LCA pegmatite, Gaston Co., N. Carolina.The name is for Mrs. Marge Matula of Allentown, Pa., who
found the Hellertown material. M.F.
Kolwezite*
Michel Deliens and Paul Piret (1980) Kolwezite, an hydroxy-carbonate of copper and cobalt, analogous to glaukosphaerite
and rosasite. Bull. Mineral., 103, 179-184 (in French).
Analysis (Cu, Co by X-ray fluorescence, CO2 volumetric, H2O+ CO2 by TGA) gave CoO 22.98, CuO 48.40, CO2 19.44, H2O8.78, sum 99.60Vo, corresponding to (Cur33Co667XCO3).eg(OH)zor or (Cu,Co)r(COTXOH), with Cu:Co : nearly 2: l. TheDTA curve showed a small endothermic break at I l0o, a large oneat 425", (loss of CO2), and a small one at 560oC (conversion ofCo2O3 to Co3Oa). The infrared absorption curve is very similar tothat of rosasite and somewhat similar to that of glaukosphaerite.
X-ray powder data are given; they corespond to a triclinic cellwith a : 9.5O, b : 12.15, c : 3.189A, a : 93.32" , I : 90.74", t :
91.47", Z : 4. D 3.94 ca[c.,3.97 meas. Th€ strongest lines (31g i ven ) a re 6 .04 (80 ) (020 ) ; s . 08 (80 ) (120 ) ; 3 . 70 (100 ) (220 ) ;2.es6(s0)(l I l); 2.9s1(80)(21 l); 2.s3s(s0)(21 l); l.l0e(50).
The mineral occurs in the oxidized zone of the Cu-Co depositof Kolwezi-Kamoto-Musonoi, southern Shaba, Zaire, as nodules(l-10 mm) and microcrystalline crusts. H near 4, color black tobeige, a' : 1.688*0.002, y'> 1.90.
The name is for the locality. Type material is at the MuseeRoyal Afrique Centrale, Tervuren, Belgium. M.F.
Kuramiter
V. A. Kovalenker, T. L. Evstigneeva, N. V. Troneva and L. N.Vyal'sov (1979) Kuramite, Cu3SnSa, a new mineral of the stan-nite group. Zap. Vses. Mineral. Obsh., 108, 564-569 (in Rus-sian).
Microprobe analyses of 5 samples gave Cu 36.54,36.74, 36.25,36.70, zl0. l0; Fe 2.94,2.39,2.84,2.21, 1.43; Zn 1.73,2.17,2.50,2. 10, 0.9 1; Sn 30.05, 30.92, 29.50, 31.77, 28.36; In 0.21, 0.3 1, 0.33,0.24, 0.51; S 28.02, 27.65, 28.M, 27.86, 27.75, sum 99.50, 100.18,99.46, 100.87, 99.06Vo. These correspond to Cu266(Cu,Fe,Zn)SnSawith Cu 2.56-2.83, Fe 0.12-0.24, Zn 0.M4.17, Sn 1.06-1.17, In0.01-0.02, S 3.88-3.92. This is a member of the srannite(CulFe2+SnSa)-kesterite(CuBn2+SnSa) series, the end memberbeing CulCu2*SnSa.
Kuramite is tetragonal, space group 142m, a: 5.1145+0.005, c :10.75+0.024, Z : 2. The strongest X-ray lines (ll given) are3. I 3( I 0X I I 2), t.e 14(8)(024,220), 1.640(6X I 32), l. I 08(4x2zt4).
Under the microscope neutral gray. Distinctly anisotropic, withcolor effects in brown shades. Reflectivity,(R** and R'e): is givenat 16 wave lengths, at 460nm, 25.3,25.L,5&,26.5,28.7;58O,26.7,29.5;640,26.5,28.OVo. H (20g load) 379432, av. 390 kglsq rnm ongrains of analyses 141'301-372, av 333 kglsq mm on grain 5(highest Cu content).
The mineral occurs in gold-sulfide-quartz ores in a deposit inthe Kuramin Mts., eastern Uzbekistan, as inclusions 5-80 micronsin diameter within goldfieldite, which also contains inclusions ofhessite, petzite, sylvanite, altaite, native Au, and other minerals.
The name is for the locality. Type material is at the Mineral-ogical Museum, Academy of Sciences, and in the Institute of OreDeposits, etc. (IGEM), both in Moscow. M.F.
NEW MINERAL NAMES

1068
Partheite*
Halit Sarp, Jacques Deferne, Helene Bizouard and B. W. Liebich(1979) Partheite, CaAl2Si2Os '2HrO, a new natural silicate of
aluminum and calcium. Schweiz. Mineral. Petrog. Mitt,, 59,5-
13 (in French).
Electron microprobe analyses (standards, analyzed vuagnatite'
wollastonite, albite, orthoclase) gave SiO2 40.24, 38.83, 38.10;
Al2O3 31.99, 30.46, 29.68; CaO 16.38, 16.31, 16.22; Na2O 0.32,
O.32, 0.32; K2O 0.23, 0.21, 0.23; HrO 10.83, 13.85, 15.45Vo, cnrre'
sponding to the formula above.
Weissenberg photographs show partheite to be monoclinig
space group probably A/q a :21.59, b : 8.78, c : 9.314, B :
91.47" , Z : 8; D calc. 2.31, meas. 2.39. The strongest X-ray lines
(36 given) are 10.79(100)(200) ' 8.12(80Xl l0) , 6.10(70)( l l l ) '
3.7 40(s0)(221), 3.600(,10X3 12,5 1T), 3. 190('tox022).Partheite occurs as white fib€rs of vitreous luster in rodingite of
the Taurus Mts., S. W. Turkey. Associated minerals are prebnite,
thomsonite, and augite. The mineral is optically biaxial positive'
2v : 48", a : r.54'1, P : r.549, y : 1.559 (all + 0.001); r > v med.,
eloingation negative, extinction 2!-30", XA elongation; cleavagedistinct parallel to fibers.
The name is for Edwin Parth6, Professor of Crystallography'University of Geneva. M.F.
Pianlinite
Liu Changling, Liu Deye, Zhang Fu, Li Jinsheng, Sun Weijun
and Lu Wenhan (1963) Pianlinite, a new clay mineral species.Kexue Tongbao, lO, 59-62 (in Chinese). Liu Changling (1979)
New data on pianlinite. Kexue Tongbao,24' 553-555 (in Chi-nese).
Chemical analysis gave Al2O3 42.63, SiO2 50.10, TiO, 0.32'Fe2O3 0.10, FeO 0.50, CaO 0.06, MgO 0.09, K2O 0'06, NarO 0.03'
ZrO2 0.N8, MnO tr, P2Os 0.005, H2O+ 4.55, H2O- 1.63, sum100.083, corresponding to A1203' 2SiO2' H2O.
The mineral is almost X-ray amorphous and gives many lines
on long exposures. The X-ray pattern of the better crystallized va-
riety is characterized by the lack of very intense lines and of low-
angle lines. The strongest lines (30 given) are 4'62(3, ditruse)'3.37 (1), 2.5 6(7), 2.42(5), 2.2 I (6), l. s 3(4), 1.48(3), r.27 (5), r.2s (3),
0.967(3), 0.846(4). Powder patterns for materials heated to 950",
t245', and 1385"C are also given. Powder and single-crystal elec-
tron diffraction studies show the mineral to be neither amorphousnor crystalline (no details given, GYC). The mineral is consideredto be "semi-crystalline" due to strong c-axis disorder as in meta-kaolinite. Diffractometer tracings of coarsely crushed material(1963) show a broad peak centered at 15" 2e and two sharp peaks
at2.016 and 2.336A, thought to be due to preferred orientation ef-
fect.The mineral is pure white and grayish white with vitreous luster
to gray and earthy. The mineral occurs as dense massive aggre-gates that are brittle, hard (6-7), with uneven to subconchoidalfracture. The true density is 2.45 g/unr.In thin section, the aggre-gates are mostly phanerocrystalline, displaying colloform' myrme-
ketic (up to 2mm), petal-like, and fine to coarse scaly structures.The mineral is colorless. Some specimens are weakly pleochroic
with X : colorless, 7 : pale yellow. The mineral has a perfect(001) cleavage and shows straight extinction with the cleavage par-
allel to the vibration direction of the slow ray. tr : l'532(2), B =
1.539(4), 7 : l.5 l( ), e) 2V :0o to 5o or less. Electron micros-copy shows the crystals to be irregular to nearly hexagonal plates.
ooo3-ootx/80/09 lo- l 068$00.50
DTA curve shows endothermic peaks at l44o (weak and broad)
and 892o (weak and may be absent) and exothermic peaks at 950o
(sharp and strong, crystallization of Al-Si-spinel) and at l245oC(weak, crystallization of mullite and cristobalite). TGA curve
shows a small initial weight loss to 100o, followed by a slow one-
stage major weight loss to 500"c.The infrared spectrum of pianlinite is similar to that of meta-
kaolinite heated to 900oC, except the presence of the G-H stretch-
ing band at 3l0G-3700-t and the absence offine structures in the
600-l400cm-t region of the former.The mineral occurs as a monomineralic clay bed (less than lm
in thickness) in an Upper Carboniferous sedimentary formation in
Pianling, China. Accessory minerals in the clay bed are quartz'
zircon, mica, rutile, augite, gamet, epidote, ilmenite, gibbsite' hal-
loysite, kaolinite, and ferromontmorillonite. The name is for the
locality.
Discttssion
The data show the mineral to be unique. The non-crystallinenature and the thermal behavior of the mineral are similar to those
of allophane but it may be distinguished from allophane by its
lower water coltent and higher refractive indices and density. It
may also be distinguished from the mitrerals of the kaolinite group
by its lower water content and the characteristic absence of a well-
defined endothermic reaction at 500o-700oC on its DTA curve.
However, the sharp reflections of 2.016 and 2.336L, observed on
the difractometer tracings of the nearly amorphous material" do
not match the X-ray lines given for the better crystallized material'
suggesting the presence of another phase. Further study of the
mineral, especially on its homogeneity and the range of composi-
tion variations, is desirable. The mineral should not havc beengiven a name at the present stage (see Bailey,'Can. Mincral-, 18'
143-150, 1980). G.Y.C.
Ruarsite
Tsu-hsiang Yu and Hsueh-tsi Chou (1979) Ruarsite, a new min-
erul. Science Bulletin (Ko'Hsueh Tu'ng Pao), 24' 310-316 (irr
Chinese).
Ruarsite is reported as a new mineral found in heavy mineral
conc€ntrates from and in polished sections of chromium ore from
an Alpine-type ultramafic, northem Tibet, as well as in placers de-
rived from the weathered ultramafics. Eight probe analyses for
seven grains gave Ru 42.45 (35.7449.84), Os 5.94 (nil to 14.84)' Ir
1.67 (nil to 2.8), Pt 0.07 (nil to 0.32), cu 0.00 (nil to 0.01), As 36.25(33.09-39.2), Sb 0.00 (nil to 0'01), and S 14.08 (13.7-15.0); sum
100.36 (98 .3-102.3) , cor respond ing to an average o f
(Ru6e13Os6*slr661sPt6661)As1 oroSory or, ideally, RuAsS. An X-
ray powder pattern (43 lines, plus 7 lines ascribed to laurite and
irarsite) of a ruarsite grain, of composit ion (Ruo *ooOs6 15,slres25Ptoso3)As10oaS6es1, was indexed as monoclinic' 4 :
5.9!1. b: 5.915, c: 6.003A, B: 112"27'which corresponds with
data for synthetic RuAsS (Hulliger, Nature, 201' 381-382, 1964).
The strongest lines are: 3.79(50)(Tl1), 2.77(t00X002)' 2'74(2OO),
1.8e0(70x3-02), 1.870(e0x3l 1), 1.6e5(e0)(13 l) 1.660(60X202)'
1.s80(s0xl03) and l. 149(50)(340)'Ruarsite occurs as irregular grains or as aggregates (100-150
pm). It is lead-grey to dark-lead grey with a metallic lustre and a
rough-textured surface. The streak is greyish black; it is brittle'non-magnetic and is not soluble in 1: I HCl. In polished sections it
is greyish white, pale yellow next to irarsite or laurite. The mineral
NEW MINERAL NAMES
NEW'MINERAL NAMES
polishes reasonably well, better than irarsite and laurite. It is bire-flectant, in oil; pleochroism varies from pale yellowish white tolight greyish yellow-white. The mineral is distinctly anisotropic;with nicols l-2o off 90' bluish grey to light-reddish. Reflectanceon a grain with minor Os gave: 42.0,43.O,42.5 (48O nm), 42.6,43.8,42.73 (5a6 nm), 42.9,41.3,42.6 (589 nm), and 43.4,44.3, 43.3(656 nm), and on a grain with l4%o Os:43.4 (480 nm),,14.1 (546nm),43.8 (589 nm) and 45.1 (656 nm). VHN2. : 982.1-1030.2 fortwo low-Os grains while the grain with l49o Os gave VHN2. :
804, VHN50 : 893, and VHNrm : 734. Internal reflection, cleav-age and twinning w€r€ not observed. In the Cr-ore associatedplatinum-group minerals are iridosmine, ruthenian iridosmine (:rutheniridosrnine?), sperrylite, and laurite; the latter occurs as rel-ics in ruarsite. The principal metallic minerals of the ore are Cr-spinel (85-957o) with minor pyrite, pyrrhorite, loellingite, magnet-ite, chalcopyrite, molybdenite, galena, and millerite found in theinterstices of the Cr-spinel. Principal gangue minerals are serpen-tine with minor chlorite. In the placer deposits, which occur on thewestern part of the ultramafic, the major PGM are Os-Ir-Ru al-loys, such as ruthenosmiridium (or osmiridium?), iridosmine,(Pt,Ir) alloy, (Ru,Fe) alloy, osmium, gold, trace amounts ofsperrylile, and the heavy minerals chromite, magnetite, ilmenite,rutile and garnet. The ruarsite occurs on the peripheries of someOs-Ir minerals, closely associated with PG-sulfide, -sulfarsenide
or -arsenides which occur as exsolutions in the Os-Ir-Ru alloys aswell as inclusions in sperrylite and replacing irarsite and laurite. Inaddition to ruarsite, ruthenarsenite, irarsite, platinian irarsite, iri-darsenite, and anduoite (Am. Mineral., 64, 464, 1979) occur withthese sulfarsenides and sulfides.
The mineral is named after its composition, as were osarsite andirarsite. Type specimens of ruarsite are deposited in the Museumof Geology.
Discussion
A very complete description of a new mineral species. L.J.C.
Schlossmacherite*
K. Schmetzer and H. Bank (1979) Schlossmacherite, a new min-eral, named for Prof. Dr. Karl Schlossmacher, honorary presi-dent of the German Gemmological Society. Z. deutsch. gemmol.Ges., 28, 13l-133 (in German).
A preliminary report. Analysis gave SO3 29.3, AsrOs 13.4,Al2O3 36.3, Fe2O, 0.6, CaO 3.5, SrO 0.3, BaO 0.3, KrO 0.5, NarO0.5, H2O-15, sum 100 9Vo, cotresponding to the formula(H3O,Ca)Al3(SOo,AsOo)2(OH)u with H3O>Ca and SOo>AsOo. Itis a member of the beudantite group.
The mineral is hexagonal, [trig(?)MF], a:6.998, c: 16.67L;strongest X-ray lines 4.92('10),2.98(50), 2.96(100). Av. n: 1.597.
The mineral occurs with c€ruleite and chenevixite at the EmmaLuisa mine. Guanaco. Chile. M.F.
Silver-4H, Silver-2H, Silver-3C
M. I. Novgorodova, A. I. Gorshkov and A. V. Molkhov (1979)Native silver and its new structural modifications. Zap. Vses.Mineral. Obsh., 108,552-563 (in Russian).
Electron diffraction patterns of native silver from northeast€rnUSSR showed, in addition to cubic silver, a : 4.08A, the presence
00n3-0o4x / 80 / 09 l 0- l 069$00. 50
of two hexagonal forms, Ag-4H (a : 2.94, 2.93, 2.88; c : l0.ll,10.18, 9.62A; D calc. : 9.53) and Ag-2H (a : 2.94,2.93,2.92; c :4.80, 4;19, 4.774; D calc. : l0.ll). X-ray powder data are given.Microprobe analyses of 6 samples by A. I. Tsepin showed Ag98.21-99.93, Au 0.O4-0.33, Sb 0.04-0.37, Bi 0.18-0.26, Cu up to0.50, and traces of Fe, Cr, and Ni. M.F.
Sinjarite*
Z. A. Aljubouri and S. M. Aldabbagh (1980) Sinjarite, a new min-eral from baq Mineral. Mag., 43,643-645.
A hygroscopic, soft, pink mineral was discovered in the dry bedof an intermittent stream in Sinjar town, west of Mosul city. Wet-chemical analysis gave Ca 25.84, Cl 46.64, H2O 26.55, Na 0.857o,sum 99.88; trace elements K226 ppm, Mg 5 ppm, Sr l4l ppm, Fe9 ppm. The X-ray powder pattern agrces well with that recordedfor CaCl2'2H2O (JcPDs card l-0989). The mineral is granular(massive), white streak, vitreous to resinous luster; H : l%. Elon-gated prismatic crystals have parallel extinction and positive elon-gation, n : 1.54.
It may be assumed that sinjarite has been pr€cipitat€d withinrecent sediments from the slow evaporation of ground water satu-rated with Ca and Cl ions. The mineral is ephemeral, and dis-solves quickly during wet seasons. Alternatively, because of itshygroscopic nature i t may change to the hexahydrateCaCl2'6H2O, which melts at 30oC and will not survive hot sea-sons. A.P.
Tarnowskite (= Tarnowitzite)
Maria Czaja (1978) New data on tarnowskite (tarnowitzite) fromTarnowskie Gory. Mineral. Polonica, 9, 89-96.
Tarnowitzite was named by Breithaupt for the locality in UpperSilesia. The Polish name is Tarnowskie Gory. Electron micro-probe analyses showed Pb 2.934.6Vo; X-ray and infrared data aregrven.
Discussion
Unnecessary name for plumboan aragonite. M.F.
Unnamed analogue of schoenfliesite
N. K. Marshukova, G. A. Sidorenko and N. I. Chistyakova (1978)On natural hydrostannat€s. New Data on Minerals of theU.S.S.R., 27,89-95 (in Russian).
The Mushiston tin deposit, Central Asia, contains stannite-chalcopyrite-sphalerite-galena mineralization. The stannite hasbeen altered to fine-grained earthy aggregates of brownish-greencolor . X-ray study showed the mineral to be cubic, a ='1
.'11!0.024. The strongest lines (17 given) are 3.840(10X200),2.719(8)(220), 1.722(6)(420). Microprobe analyses of 5 grains gavethe formulas:
(Cue 6sFeo ,rZna 1a)Sn6 s7(OH)u . 2.95 H2O(Cu6 52Fe6 aaZn6 ze)Sno az(OH)e ' 2.50 HrO(Cus a1Fe6 3lZna rr)Snt ,t(OH)5 7e(Cu6 56Fe6 23Zno ot)Sn,'u(OH)5 6e(Cu6 26Fes a2Zno 35)Sna s5(OH)6 6e
1070 NEW MINERAL NAMES
DiscassionNote that the first four of these have Cu dominant; the last has
Fe dominant. Material with Fe dominant had previously been de-scribed by Grubb and Hannaford, Mineralium Deposita, 2, 148-17l(1966) and by Geier and Ottemann, abstract in Am. Mineral.,J6, 1488 (1971). M.F.
Unnamed chlorite
F. Radke, P. K. Schultz, and R. N. Brown (1978) Zinc-rich chlo-rite from Chillagoe, Queensland. Amdel Bull., no. 23,25-28.
Drill cores in chloritized andesites and skarns have veins withcalcite, quartz, and fibrous green chlorite. Analyses show ZnO6.0-30.54o. Microprobe analysis by P.K.S. gave SiO2 32.0, Al2O3l2.4,FeO (total Fe) l2.9,ZnO 30.5, MgO 4.6, MnO 0.15, CaO 1.0,sum 93.5Vo, corresponding to (Zn2 a1Fe1,oMgo 1Cao,,Mnoo,Alo.re)Al(Si3 s2Alo 4s)Oro(OH)s. The strongest X-ray lines (9 given)are 14.2(8),7.15(10), 3.s7(4),2.66(3), 1.54(4). The mineral had a :1.582, y: 1.614. M.F.
Unnamed Na2HPOn, unnamed Na2HPOa' 2H2O
A. P. Khomyakov and Yu. P. Men'shikov (1979) Identification ofNa2HPOa and Na2HPOa . 2H2O in the products of alteration ofnatural natrophosphate. Dokl. Akad. Nauk SSSR, 248,1207-l2l I (in Russian).
Natrophosphate was described [see Am. Mineral., 58, 139(19?3)l as Na6H(POa)2F ' l7H2O, and is here stated to beNar(POo)2F' l9H2O. Material from Mt. Karnasur! Lovozeromassif, and from Yukspor and Koashva, Khibina massill is altercdto dense, porcelain-like, or friablc powdery aggregates of snow-white color, with dull luster. X-ray powder data show that theseconsist of mixtures of villiaumite (NaF), Na2HPO4 (ASTM l0-184), and Na2HPOa'2HrO (ASTM l-0232). M.F.
Unnamed V mineral of the montmorillonite group
M. Giiven and W. F. Hower (1979) A vanadium smectite. ClayMinerals, 14,241-245.
Analysis of material saturated with Na, then dried to constantweight at l05oC, gave Si 18.78, V 20.90, AJ2.52, Mg 0.93, Fe0.92,Ca0.62, Na 3.097o. This can be calculated as V3+ and Fe2* or asVa* and Fe3* respectively, giving SiOr 40.18, V2O3 30.75 or V2Oa34.03, Al2Oj 4.76, MgO 1.54, FeO l.l8 or Fe2O3 1.32, CaO 0.87,Na2O 4.26, loss on ign. 14.92, sum 98.46 or 101.887a.
The X-ray diffraction pattem ofthe oriented <2 rnicron fractionshows a very strong reflection 15.0*0.1A. The material saturatedwith Na has a basal spacrng of 12.6t0.1A, which expands toI6.7t0.lA on saturation with glycol. Randomly oriented powderindicated b :9.02+O.24.. SEM photographs are given. M.F.
NEW DATA
Metavivianite = partly oddized vivianite (?)
Jean-Francois Poullen (1979) New data on vivianite and metavi-vianite. C. R. Acad. Sci. (Paris), 289D,51-52 (in French).
Metavivianite was described in Am. Mineral., 59, 896-899(1974) as the triclinic dimorph of monoclinic vivianite. The pres-
ent note,'ivithout giving any data, states that powder data, single-crystal study, and infrared study ofmetavivianite from the Yukonshow that they are identical with those of naturally or artificallyoxidized vivianite.
Disctrssion
Since Poullen did not exarnine type metavivianite from SouthDakota, his conclusions have no standing. M.F.
DISCREDITED MINERALS
HYdroPhilite
M. H. Hey (1980) What was hydrophilite? Mineral. Mag.,43,682.
Hydrophilite was described by J. F. L. Hausmann (.6landb. Min'eral.,8'15, 18l3), as a coating on gypsum from the Ltineburg bora-cite deposit. He reported its constitutents to be calcium chlorideand water, and that it is hygroscopic, deliquescent, very soluble inwater, solubl€ in alcohol, and has an intensely bitter taste. Hydro-philite was evidently one of several hydrates of CaCl2, and mayhave been an early find of antarcticite (6H2O) or sinjarite (2H2O),but remains undefined. A.P.
Slavyanskite = Tunisite
A. S. Povarennykh (1979) Slavyanskite. Mineralog. Zhurnal, I, n'o.2, 105-106 (in Russian).
Slavyanskite, described as CaAl2Oa' 8-8*H2O (Am. Mineral.,63,599,1978) is shown by infrared spectrum to be a carbonate. ltsX-ray and optical data correspond closely to those oftunisite (ltaMineral., 54, l-13, 1969), described as HNaCa2Ala(CO3)4(OH)ro.In a footnote, Povarennykh states, without giving his evidence,that the correct formula for tunisite is CaAI2(CO3)2(OH)4. M.F.
00p3-00/.x / 80 / 09 l 0- l 070$00. 50
CHALCOPYRITE-ITS CHEMISTRY AND METALLURGY.By Fathi Habashi. McGraw-Hill, Inc., New York, 1978. 165pages. $24.50.
This book, as stated by the author, is meant to serve as a litera-ture review restricted to the chemical behavior and treatment ofthe most abundant copper-bearing mineral, chalcopyrite. It con-tains twelve chapters of which the first (7 pages) mentions the nat-ural occurrence of this mineral, the pres€nt methods of its treat-ment, the drawbacks inherent in these methods, and the attemptsbeing made to improve copper extraction. It concludes that hydro-metaUurgical methods must b€ developed to avoid air pollution.Chapter 2 (5 pages) discusses flotation, chapter 3 (10 pages) dealsurith structure and physical properties, chapter 4 (17 pages) citesdata pertaining to the thermal stability of this mineral. Chapter 5(17 pages) discusses thermal oxidation and chapters 6 and 7 (48pages) deal with aqueous oxidation. Chapter 8 (12 pages) is de-voted to reduction, chapter 9 (2 pages) to chlorination, chapter l0(5 pages) to electrolytic reactions and chapter I I (5 pages) to mi-nor and trace metals in chalcopyrite. The final chapter (l page)concludes that future chalcopyrite metallurgy will be directed to.ward acid pressure leaching of flotation concentrates at aboutll0oC and lists nine advantag€s of such procedures over oth€rmethods such as conventional smelting. The book also containstwo appendices; the first (5 pages) lists world primary copper smel-ters and the second (2 pages) provides references to discussions ofthe chemistry and metallurgy of copper in the eight-volume (Sys-tem Number 60) Gmelin's Handbook of Inorganic Chemistry.
The book in addition has a 5-page author index and a 9-pagesubject index. Although the list of references includes about 400items, it is by no means complete. Much information in print hasnot been included, for instance pertaining to the thermal stabilityand solid solution field of the chalcopyrite phase. There are nodata on the effect ofpressure on polymorphic inversions and struc-tural stabilities. The reader mieiht understand why the authorcould not present detailed information on copper and iron sulfidessuch as covellite, blue-remaining covellites, anilitc, digenite, djur-leite, chalcocite, pyrrhotite, pyrite, and even bornite, one or moreof which frequently coexist with chalcopyrite in ores. It is, how-ever, not easy to understand why cubanite is not described in de-tail, why practically nothing is said about talnakhite, and whymooihoekite and haycockite are not even mentioned in the text.The latter four minerals are all stable in the temperature range ofthe hydrometallurgical procedures suggested by the author. Some,or all, of these phases may form as intermediate products duringacid pressure leaching or may oc-cur with chalcopyrite in flotationconcentrates. The book in at least two places contains statementsto the effect that chalcopyrite only during the last l0 to 15 yearshas been realized to be the most abundant copper-bearing min-eral. This has been known to mineralogists at least since the turnof the century. The author also states that "It (chalcopyrite) ismined as cupriferous pyrite and pyrrhotite which contain copperin solid solution, or as disseminated grains of chalcopyrite." Chal-copyrite forms negligible solid solution with pyrite, and althoughchalcopyrite occurs in solid solution in pyrrhotite at high tcmper-atures, it is rapidly exsolved on cooling and is not found in solidsolulion in pyrrhotite in ores. Many statements are misleading; forinstance the legend to one figure says "Chalcopyrite-a major
source of rhenium." R-henium occurs in solid solution in molybde-nite which, particularly in porphyry copper ores, commonly oc-curs with chalcopyrite. Some of the discussions, for instance thaton the thermal stability of chalcopyrite, show that the author didnot read the reference material in detail. Some discussions arerather interesting, for ilstance those pertaining to thermal andaqueous oxidation and to reduction, chlorination, and electrolyticr€actions, but depth and detail are lacking.
The book is quite useful as a sourc€ of references to the pub-lished literature. It was printed with considerable care and is wellbound. The illustrations are ofgood quality.
GUNNAR KULLERUDPurdue Universitv
PETROLOGY OF THE METAMORPHIC ROCKS. By RogerMason. George Allen and Unwin, Londog 1979. 254 pages.Cloth $29.75, paperback $14.95.
This book, which is the current volume 3 of the classic Hatchand Wells petrology text, is described on the cov€r as follows:"The style of treatment should make the book useful to a widereadership among geologists and earth scientists. It should be par-ticularly suited to the needs of undergraduates who are not neces-sarily petrology specialists but need an authoritative introductionto metamorphic rocks at an intermediate level. It may also be ofvalue to teachers and senior school students of geology, and toothers needing a comprehensive introduction" [to metamorphicpetrologyl. In the opinion of this reviewer (note, unrelated to theauthor), this aim has been admirably and concisely obtained.
The author describes himself as a field petrologist, and through-out much of the book he uses the "case history" approach, de-scribing the different types of metamorphism in the light of spe-cific areas. Most of these are European-the Scottish Highlands,the Swiss Alps, the Scandinavian Caledonides-which may be aminor drawback (or perhaps an advantage) for a teacher in NorthAmerica. However, the descriptions are fresh and illuminating,and are supported by critical references. Metamorphism is inter-preted widely, and includes discussion of shock metamorphism as-sociated with m€teorite craters, and shock metamorphism in lunarrocks. Descriptions of metamorphic rocks are illustrated with ex-cellent drawings of these rocks as seen in thin sections. The de-scriptive petrography is complernented by a final section, "Meta-morphic Rocks in the Laboratory," which summarizes theapplication of laboratory studies of mineral syntheses and meta-morphic reactions, and of isotope geology, to metamorphic pet-rogenesrs.
This is a brief but comprehensive book which achieves the goalsoutlined above.
BRIAN MAsoNS mithso nian I nstitut ion
SEDIMENTARY ENVIRONMENTS AND FACIES. Edited byH. G. Reading. Elsevier, New York, 1978. 557 pages. $24.00(soft cover) $45.00 (hard cover).
Within the past decade a number of valuable review volumes,both new publications and revised editions, have treated the €vo-
Amertcon Mineralogist, Volume 65, pages 107I-1073, 1980
BOOK REVIEWS
0003-004x/80/09 l 0- l 07 t$00.50 l07l
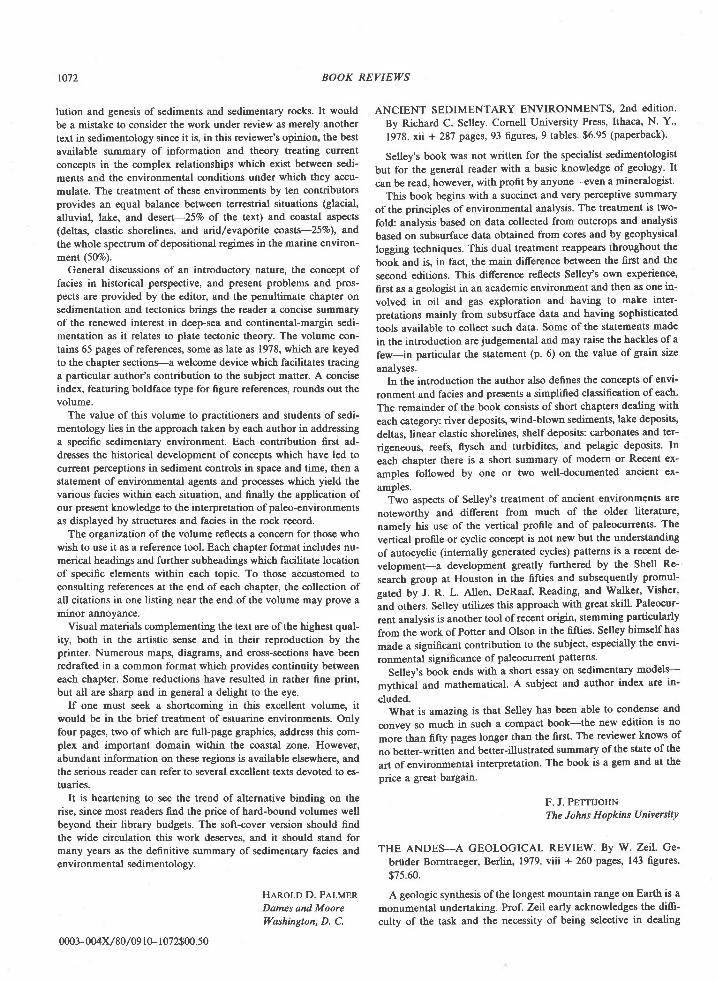
t072
lution and genesis of sediments and sedimentary rocks. It would
be a mistake to consider the work under review as merely another
text in sedimentology since it is, in this reviewer's opinion, the b€st
available surnmary of information and theory treating current
conoepts in the complex relationships which exist between sedi-
ments and the environmental conditions under which they accu-
mulate. The treatment of these environments by ten contributors
provides an equal balance between terrestrial situations (glacial,
alluvial, lake, and desert---257o of the t€xt) and coastal aspects(deltas, clastic shorelines, and aridlevaporite coasts-2s%), and
the whole spectrum of depositional regimes in the marine environ-
ment (5Mo).
General discussions of an introductory nature, the concept offacies in historical perspective, and present problems and pros-pects are provided by the editor, and the p€nultimate chapter onsedimentation and tectonics brings the reader a concise summaryof the renewed interest in deep-sea and continental-margin sedi-mentation as it relates to plate tectonic theory. The volume con-tains 65 pages ofreferences, som€ as late as 1978, which are keyed
to the chapter sections-a welcome device which facilitates tracing
a particular author's contribution to the subject matter. A conciseindex, featuring boldface type for figure references, rounds out thevolume.
The value of this volume to practitioners and students of sedi-mentology lies in the approach taken by each author in addressinga specific sedimentary environment. Each contribution first ad-
dresses the historical development of concepts which have led tocurrent perceptions in sediment controls in space and time, then astatement of environmental agents and processes which yield thevarious facies within each situation, and finally the application ofour present knowledge to the interpretation of paleo-environments
as displayed by structures and facies in the rock record.The organization of the volume reflects a conc€m for those who
wish to use it as a reference tool. Each chapter format includes nu-merical headings and further subheadings which facilitate locationof specific elements within each topic. To those accustomed toconsulting references at the end of each chapter, the collection ofall citations in one listing near the end of the volume may prov€ amrnor annoyanoe.
Visual materials complementing the text are of the highest qual-
ity, both in the anistic sense and in their reproduction by theprinter. Numerous maps, diagrams, and cross-sections have beenredrafted in a common format which provides continuity betweeneach chapter. Some reductions,have resulted in rather fine print,
but all are sharp and in general a delight to the eye.If one must seek a shortcoming in this excellent volumc, it
would be in the brief treatment of estuarine environments. Onlyfour pages, two of which are full-page graphics, address this com-plex and important domain within the coastal zone. However,abundant hformation on these regions is available elsewhere, andthe serious reader can refer to several excellent texts devoted to es-tuaries.
It is heartening to see the trend of alternative binding on therise, since most readers find the price of hard-bound volumes well
beyond their library budgets. The soft-cover version should findthe wide circulation this work deserves, and it should stand formany years as the definitive summary of sedimentary facies andenvironmental sedimentology.
HARoLD D. PALMERDames and MooreWashington, D. C.
ANCIENT SEDIMENTARY ENVIRONMENTS' 2Nd EditiON'
By Richard C. Selley. Cornell University Press, Ithaca, N. Y.,
1978. xii + 287 pages, 93 figures, 9 tables. $6.95 (paperback).
Selley's book was not written for the specialist sedimentologist
but for the general reader with a basic knowledge of geology. It
can be read, however, with profit by anyone---even a mineralogist.
This book begins with a succinct and very perceptive suflrmary
of the principles of environmental analysis. The treatment is two-
fold: analysis based on data collected from outcrops and analysis
based on subsurface data obtained from cores and by geophysical
logging techniques. This dual treatment reapp€ars throughout the
book and is. in fact, the main difference between the first and the
second editions. This di-fference reflects Selley's own experience,
first as a geologist in an academic environment and then as one in-
volved in oil and gas exploration and having to rnake inter-
pretations mainly from subsurface data and having sophisticated
tools available to collect such data. Some of the statements made
in the introduction are judgemental and may raise the hackles of a
few-in particular the statement (p. 6) on the value of grain size
analyses.In the introduction the author also defines the conc€pts of envi-
ronment and facies and presents a simplified classification of each.
The remainder of the book consists of short chapters dealing with
each category: river deposits, wind-blown sediments, lake deposits'
deltas, linear clastic shorelines, shelf deposits: carbonates and ter-
rigeneous, reefs, flysch and turbidites, and pelagic deposits. In
each chapter there is a short summary of modern or Recent ex-
amples followed by one or two well-documented ancient ex-
amples.Two aspects of Selley's treatment of ancient environments are
noteworthy and different from much of the older literature,
namely his use of the vertical profile and of paleocurrents. The
vertical profile or cyclic concept is not new but the understanding
of autocyclic (internally generated cycles) patterns is a recent de-
velopment-a development greatly furthered by the Shell Re-
search group at Houston in the fifties and subsequently promul-
gated by J. R. L. Allen, DeRaaf, Reading, and Walkcr, Visher,
and others. Selley utilizes this approach with great skill' Paleocur-
rent analysis is another tool of rcc€nt origin, stemming particularly
from the work of Potter and Olson in the fifties' Sclley himself has
made a significant contribution to the subject, especially the envi-
ronmental significance of paleocurrent patterns.
Selley's book ends with a short essay on sedimentary models-
mythical and mathematical. A subject and author index are in-
cluded.What is amazlng is that Selley has been able to condense and
convey so much in such a compact book-the new edition is no
-or" ih"o fifty pages longer than the first. The reviewer knows of
no better-written and better-illustrated summary of the state of the
art ofenvironmental interpretation' The book is a gem and at the
price a great bargain'
F. J. PETTUoHN
The Johns HoPkins UniversitY
THE ANDES-A GEOLOGICAL REVIEW. By W. Zeil. Ge-
briider Borntraeger, Berlin, 1979. viii + 260 pages, 143 figures.
$75.60.
A geologic synthesis ofthe longest mountain range on Earth is a
monumental undertaking. Prof. Zeil early acknowledges the diffi-
culty of the task and the necessity of being selective in dealing
BOOK REVIEWS
0003-004x/80/09 I 0- l 072$00. 50
with sourc€s of uneven g€ographic distribution and geologic qual-ity. His result is a book, vol. 13 of the series ..Beitriige zur region-alen Geologie der Erde," with 207 pages oftext, 33 pages ofrefer-ences, three indexes, and 143 frgures that include 14 fold-out mapsand sections. Owing to dubious organization and poor editing, thebook is a disappointment.
Following eight pages of introductory material, six chaptersmake up the bulk of The Andes-a geological review.'fhese are:"Crust and mantle in the Andes" (23 pages), "Igneous rocks" (45),"Sedimentary and metamorphic structural material" (48), ..The
Andes as a geodynamic body" (60), "The Andes as a plate tecton-ics model" (l l), and "The mineral deposits of the Andes-a briefreview" (12). References in the long bibliography, on the otherhand, are grouped under "General bibliography", "Crust, mantle,plate tectonics", "Magmatic rocks", "Venezuela", ..Colombia",
"Ecuador", "Peru", "Bolivia", "Argentina", and "Chile". Thereader will lose considerable tirne hunting the complex bibliogra-phy for some of the references cited in the text and, in fact, willfind that a few have been left out.
The isolation of igneous rocks in a separate chapter is unfortu-nate. In so many Andean sedimentary sections, tephra constitute amajor component and have important genetic connotations. Themetamorphic basement of the Andes (cropping out as .,isolated
eminences" we are told on p. 77) is dealt with in an independentsection 12 pages long. Regionally metamorphosed terrains in theAndes are assembled indiscriminately, yet extensive areas of rocksmetamorphosed regionally in Tertiary time on the Guajira penin-
sula and in the Sierra Nevada de Santa Marta, Colombia, as wellas in the Cordillera Oriental, Ecuador, are supracrustal.
It was disconcerting to find many factual errors on the part ofthe Andes with which I am familiar firsthand. A few are: contraryto Figure 25, no plutonic igneous rocks are known on the StaElena Peninsula, Ecuador, not are Late Cretaceous or youngerplutonites found on the border with Peru on the Pacific; the Anti-oquian batholith, Colombia, is not Paleozoic (Fig. 65); the Car-negie ridge is referred to as seismically acrive (p. 26), which it isnot, and it is mislocated geographically (Fig. l5); Sumaco, an ex-tinct volcano in Ecuador, is cited as active (p. 58 and Fig. 98); theelevations of the upper Cauca and Magdalena grabens, Colombia,are given as between 1800 and 2500 m (p. 75), whereas they areeverywhere below 1000 m; a map of the tectonic elements of theAndes in Ecuador (Fig. 98) omit"s large areas of basem€nt rocksshown correctly in Figure 69; annual displacement on the Bocon6fault, Venezuela, is stated to be 66 cm (p. 150), rather than 6.6mm; high-P/low-T metamorphism in the Western Cordillera ofColombia is referred to in several places, but in fact has nowherebeen documented; metamorphic basement rocks do not crop outin Ecuador solely in the Eastern Cordillera (p. 80), an extensiveterrain is found west of the Andes at the Peruvian border; pleisto-
cene volcanic deposits near the Rio Pisque, Ecuador, are whollycontinental and include no marine sediments as stated in Figure87; the Maracaibo basin is filled with "more than 10,000 m of sed!ments built up during the Cretaceous and the Quatemary', (p.I I lFwhat about th€ petroliferous Tertiary rocks that put Vene-zuela in opEc?; Cerro Pantanos, an important Colombian copperpfospect, is located in the wrong cordillera (p.202); and contraryto "until recently only relatively small [petroleum] deposits havebeen exploited in sedimentation basins on the pacific coast in Ec-uador and Peru" (p. 205), the Talara field in northwestern peru, incontinuous production for a century, is the first-discovered of theworld's "giant oil fields."
The usefulness ofthe book is further sapped by poor editing of
on3--oo4x/ 80 /09 l 0- 1073$00.s0
1073
the translation from German. A few examples: "implegnation de-posits", for disseminated deposits; "sedimentation basins", forsedimentary basins; "material", for rocks, "overtilted", for over-turned; "magmatic structural material", for igneous rocks; "mine-worthy", for mineable; "horizontal faults", for strike-slip faults; orsuch unclear expressions as "violent fracture faults"; "positive andnegative fracturing"; "latiandesites"; "narrow-bedded alpinotypestructures"; "magmatological events"; and many others. Heavywording and awkward sent€nc€ structure assault the reader. Twoexirmples are: " . .. the Cambro-Ordovician series are non-meta-morphically developed and contain corrcsponding fossils" (p.l3l); and "The primary and secondary conc€ntration of rich met-als in the material constitution of the range was conectly corre-lated at an early date with the quantitatively high proportion ofmagmatic proc€sses and rocks" (p. 200). Editing of thc mapswasn't much better. Th€ geologic map of Chile, admittedly atough country to depict on paper, leaves a 400-km-wide gap b€-tw€en the northem (Fig. 79) and central (Fig. 80) portions of thecountry. Also, the join betwe€n the central and southern (Fig. 82)portions does not match. The geology ofEcuador depicted on Fig-ure 69 departs markedly from that shown on Figure 98. Were twomaps necessary anyway? Also, five outlire maps of the continentare given, each more than a half page, solely to show the geo-graphic locations of Colombia (Fig. 9 ), Ecuador (Fig. 97), Peru(Fig. l0O), Bolivia (Fig. 102), and Chile (Fig. ll7). Does not areader of this book already have a firm idea of South Americangeography? At worst, he could be referred to a single map, prefer-ably placed in the early pages ofthe book. The numerous photo-graphs are mostly not well tied to the text. Accent marks and spell-ing of Spanish names and terms are meticulously correct in places,and seriously in error elsewhere.
Plate tectonic theory and its application to the Andes is treatedweakly, at best. The reader is offered statements that are meaning-less ("In the countries through which the Andes pass, the violentseismic activity frequently gives rise to severe catastrophes andproves that the mountain range is not yet consolidated with itssubstructure"-p. 4), or that suggest unfamiliarity with the theoryitself ("Since seismic activity and volcanic activity are far fromsynchronous-frequent severe earthquakes have occurred recentlyin the region of Peru north of Lima which is free from any recentvolcanism----one single explanation cannot easily be found forthese different tectonic phenomena"-p. 76; or "The Eastem Pa-cific ridge has been active for about 20 m.y."-p. 191). Prof. Zeilrightly points out that some zealots have forced or even distortedgeological and geophysical data to favor their arguments. Even so,rec€nt papers that deal with the oceanography and geophysics ofthe Nazca plate and its dynamic boundary with the South Ameri-can plate strongly support the applicability ofplate tectonic theoryto the Andes, although simultaneously emphasizing that the storyisn't as simple as that envisioned only ten years ago.
The Andes.---a geological review stresses the rich heterogeneity ofthe Andes, and effectively demolishes the concept of a uniform"Andean geosyncline." Nevertheless, the Andinophile will prob-ably learn little new, as the book offers no independent geologicinterpretation. The neophyte will be discouraged by the awkwardorganization and cumbersome prose. He would get a more coher-ent view ofthe Andes from Gansser's superb article, only 39 pageslong, "Facts and theories on the Andes" (J. Geol. Soc. London, t.r29. r97r.
ToMAs FETNINGERU niv er sit i Lav al, Queb ec
BOOK REVIEWS
American Mineralogist, Volume 65, page 1074, 1980
NOTICES
New Glossary of Geologr
The Glossary ofGeology has now appeared in an expanded up-to-date edition. It includes 36,000 terms, compared to 33,000 in the1972 edition, and reflects changes in the geoscience vocabulary inthe last decade. Changes it th.e Glossary are particularly evident insuch active fields as biostratigraphy, remote sensing, plate tecton-ics, caves and karst, igneous petrology, paleomagnetism, remotesensing, plate tectonics, and seismic stratigraphy. The compilersadded about 450 new mineral names, more than 100 abbrevi-ations, such as GOR (Gas Oil Ratio), LVL, and PDB, and nearly500 new references to the literature . The Glossary of Geology is ed-ited by Robert L. Bates and Julia A. Jackson. Second edition,American Geological Institute (1980). 749 pages, $60 from AGL
AGI Minority Participatiotr Program Scholarships
The'American Geological Institute will again offer scholarshipsfor geoscience majors who are United States citizens and members
of the following ethnic minority groups: American-born Blacks,American Indians, and Hispanics. Approximately 50 such awards(ranging from $500 to $1,250) were granted in 1980-1981. Aboutthe same number (and amounts) will be awarded for 198l-1982.Requests for application materials or nominations for scholarshipsshould be addressed to:
William H. Matthews IIIDirector of EducationAmerican Geoloeical InstituteBox 10031Lamar University StationBeaumont, TX777l0
The deadline for frling the completed application is February I,t 981 .
0003-004x/80/09 l o- I 074$00. 50
Copyright © 2022 FDOKUMEN