Recovery of Microcrystalline Graphite from Quartz Using ...
13
minerals Article Recovery of Microcrystalline Graphite from Quartz Using Magnetic Seeding Pengfei Hu 1,2 , Long Liang 1,2 , Yaoli Peng 1,2 , Hesheng Yu 1,2, * and Guangyuan Xie 1,2, * 1 Key Laboratory of Coal Processing and Efficient Utilization, Ministry of Education, Xuzhou 221116, China; [email protected] (P.H.);[email protected] (L.L.); [email protected] (Y.P.) 2 School of Chemical Engineering and Technology, China University of Mining and Technology, Xuzhou 221116, China * Correspondence: [email protected] (H.Y.); [email protected] (G.X.) Received: 7 December 2019; Accepted: 25 December 2019; Published: 27 December 2019 Abstract: Efficient beneficiation of microcrystalline graphite remains a challenge. Selective recovery of microcrystalline graphite from quartz using hydrophobized magnetite as magnetic seed is studied in this work. Magnetite was hydrophobized by the surface coating of sodium oleate. The hydrophobic agglomerates were then separated by magnetic separation. Sedimentation experiments were performed to study the adhesion of microcrystalline graphite and quartz to magnetite particles. The results showed that hydrophobized magnetite led to a higher microcrystalline graphite recovery than that of the original magnetite, due to the higher probability to bond with microcrystalline graphite. However, the hydrophobization of the magnetite surface had an insignificant effect on its interaction with quartz. The force analysis based on the extended Derjaguin-Landau-Verwey-Overbeek (EDLVO) theory indicated that the total attractive interaction between hydrophobized magnetite and microcrystalline graphite were obviously stronger than that between hydrophobized magnetite and quartz, resulting in the selective aggregation between hydrophobized magnetite and microcrystalline graphite. Keywords: microcrystalline graphite; hydrophobized magnetite; magnetic seeding; aggregation 1. Introduction Graphite is a typical carbonaceous material with excellent characteristics, such as electrical conductivity, corrosiveness resistance, tenacity, and lubrication [1–3], and its mineral deposits are found widely throughout the world. Natural graphite includes crystalline graphite and microcrystalline graphite, which have different physical appearances. Crystalline graphite is generally characterized by a large crystal size of >10 μm and a homogeneous flaky structure [4]. The carbon content of crystalline graphite can be upgraded to 95% by conventional purification technology [5,6]. Conversely, microcrystalline graphite is composed of fine graphite crystals that are less than 1 μm. Additionally, disseminates closely with gangue minerals, such as quartz, silicate minerals, and aluminum oxides. These impurities are difficult to be removed from graphite in traditional beneficiation processes [7–9]. Extensive research has been undertaken to improve microcrystalline graphite purification. Currently, chemical treatments, high temperature purification, and flotation are the most commonly used beneficiation methods [10,11]. Chemical methods, including chlorination roasting, hydrofluoric acid treatment, and alkali roasting, would consume plenty of strong acid and/or alkali chemicals [12–14]. High temperature purification is restricted to produce ultra-pure graphite (purity > 99.9%) due to high cost [4]. Although flotation is an economic technology, it is difficult to purify microcrystalline graphite because gangue minerals could easily pass into concentrate by entrainment or entrapment with the aid Minerals 2020, 10, 24; doi:10.3390/min10010024 www.mdpi.com/journal/minerals
-
Upload
khangminh22 -
Category
Documents
-
view
4 -
download
0
Transcript of Recovery of Microcrystalline Graphite from Quartz Using ...
minerals
Article
Recovery of Microcrystalline Graphite from QuartzUsing Magnetic Seeding
Pengfei Hu 1,2 , Long Liang 1,2, Yaoli Peng 1,2, Hesheng Yu 1,2,* and Guangyuan Xie 1,2,*1 Key Laboratory of Coal Processing and Efficient Utilization, Ministry of Education, Xuzhou 221116, China;
[email protected] (P.H.); [email protected] (L.L.); [email protected] (Y.P.)2 School of Chemical Engineering and Technology, China University of Mining and Technology,
Xuzhou 221116, China* Correspondence: [email protected] (H.Y.); [email protected] (G.X.)
Received: 7 December 2019; Accepted: 25 December 2019; Published: 27 December 2019 �����������������
Abstract: Efficient beneficiation of microcrystalline graphite remains a challenge. Selective recoveryof microcrystalline graphite from quartz using hydrophobized magnetite as magnetic seed isstudied in this work. Magnetite was hydrophobized by the surface coating of sodium oleate.The hydrophobic agglomerates were then separated by magnetic separation. Sedimentationexperiments were performed to study the adhesion of microcrystalline graphite and quartz tomagnetite particles. The results showed that hydrophobized magnetite led to a higher microcrystallinegraphite recovery than that of the original magnetite, due to the higher probability to bondwith microcrystalline graphite. However, the hydrophobization of the magnetite surface hadan insignificant effect on its interaction with quartz. The force analysis based on the extendedDerjaguin-Landau-Verwey-Overbeek (EDLVO) theory indicated that the total attractive interactionbetween hydrophobized magnetite and microcrystalline graphite were obviously stronger thanthat between hydrophobized magnetite and quartz, resulting in the selective aggregation betweenhydrophobized magnetite and microcrystalline graphite.
Keywords: microcrystalline graphite; hydrophobized magnetite; magnetic seeding; aggregation
1. Introduction
Graphite is a typical carbonaceous material with excellent characteristics, such as electricalconductivity, corrosiveness resistance, tenacity, and lubrication [1–3], and its mineral deposits are foundwidely throughout the world. Natural graphite includes crystalline graphite and microcrystallinegraphite, which have different physical appearances. Crystalline graphite is generally characterizedby a large crystal size of >10 µm and a homogeneous flaky structure [4]. The carbon content ofcrystalline graphite can be upgraded to 95% by conventional purification technology [5,6]. Conversely,microcrystalline graphite is composed of fine graphite crystals that are less than 1 µm. Additionally,disseminates closely with gangue minerals, such as quartz, silicate minerals, and aluminum oxides.These impurities are difficult to be removed from graphite in traditional beneficiation processes [7–9].Extensive research has been undertaken to improve microcrystalline graphite purification. Currently,chemical treatments, high temperature purification, and flotation are the most commonly usedbeneficiation methods [10,11]. Chemical methods, including chlorination roasting, hydrofluoric acidtreatment, and alkali roasting, would consume plenty of strong acid and/or alkali chemicals [12–14].High temperature purification is restricted to produce ultra-pure graphite (purity > 99.9%) due to highcost [4]. Although flotation is an economic technology, it is difficult to purify microcrystalline graphitebecause gangue minerals could easily pass into concentrate by entrainment or entrapment with the aid
Minerals 2020, 10, 24; doi:10.3390/min10010024 www.mdpi.com/journal/minerals

Minerals 2020, 10, 24 2 of 13
of hydrophobic microcrystalline graphite [9]. In summary, the efficient and economic beneficiation ofmicrocrystalline graphite remains a challenge.
Magnetic seeding is a method to separate ultrafine minerals. A strongly magnetic phase(e.g., fine magnetite) is added into a non-magnetic or weakly magnetic material. By adjustingthe physicochemical properties of the target mineral and the magnetite, the magnetite selectivelyattaches to the target mineral and improves its magnetism. Once the selective attachment takes place,these magnetic agglomerates can be recovered by magnetic separation [15–20]. Such techniques havebeen explored both experimentally and theoretically in mineral processing practices. Anastassakis [21]studied the separation of quartz from magnesite fines and showed that the attachment of fine magnetiteonto quartz was possible in the presence of dodecylamine and kerosene in the pH range of 6–11.Prakash et al. and Singh et al. [22,23] discussed the recovery of iron minerals from Indian iron ore slimesusing colloidal magnetic coating, followed by magnetic separation. The selective magnetic separationof pentlandite from serpentine with magnetite was studied extensively [24–26]. These techniques havealso found applications in the beneficiation of other minerals, including ferrihydrite, gold, coal, calcite,and dolomite [16,27,28]. However, to the best knowledge of the authors, the magnetic seeding methodhas not been utilized to recover microcrystalline graphite.
In this paper, the separation of microcrystalline graphite from quartz using magnetic seedingis reported for the first time. Both original and hydrophobized magnetite particles wereused as magnetic seeds. Sedimentation experiments were then conducted to investigate theattachment behaviors of different magnetic seeds onto graphite and quartz. Lastly, the extendedDerjaguin-Landau-Verwey-Overbeek (EDLVO) theory was applied to theoretically specify theinter-particle interactions. This work is expected to provide a promising alternative to the recovery ofmicrocrystalline graphite.
2. Materials and Methods
2.1. Materials
The microcrystalline graphite and quartz used in this study were high-grade minerals obtainedfrom Changsha and Suqian in China, respectively. Large pieces of microcrystalline graphite and quartzwith high purity were picked out and then crushed to −5.0 mm by a jaw-crusher, followed by drygrinding in an automatic agate mill for 30 min. Magnetite powder (purity > 98%), purchased fromSinopharm Chemical Reagent Co., Ltd., was employed as the seeding material. It is worthwhileto note that magnetite used as received is termed the “original” magnetite, while that with furtherhydrophobization is the “hydrophobized” magnetite. Both original and hydrophobized magnetitewere used as magnetic seeds. Mineral samples were characterized by an X-ray diffractometer (XRD,D8 Advance, Bruker) (Bruker Co., Karlsruhe, Germany), X-ray fluorescence (XRF) Spectrometer(S8 Tiger, Bruker) (Bruker Co., Karlsruhe, Germany), and a laser particle size analyzer (S3500, Microtrac)(Microtrac, Inc., Montgomeryville, PA, USA).
Sodium oleate of analytical purity (from Aladdin Industrial Corporation) was used to modify themagnetite surface property. Dodecane (from Aladdin Industrial Corporation, AR, Shanghai, China)was used as an adhesion reagent. Potassium chloride (KCl) (from Xilong Scientific Co., Ltd., AR,Shantou, China) was used for the preparation of supporting the electrolyte solution. NaOH and HClof analytical grade were utilized to adjust the pH level of solutions.
2.2. Magnetite Hydrophobization
A total of 10 g of original magnetite was added to 100 mL of 2 × 10⁻² M sodium oleate solution,followed by stirring for 20 min at 298 K. The prepared suspension was then kept still for 24 h toallow sodium oleate to interact with the magnetite surface. Afterwards, the magnetite particleswere collected and washed six times with distilled water to remove excessive sodium oleate. Lastly,these magnetite particles were dried at 80 ◦C in an oven. The contact angle of magnetite before and
Minerals 2020, 10, 24 3 of 13
after the modification were measured using a contact angle tester (JC2000D1, Powereach Co., Ltd.,Shanghai, China) to determine the effectiveness of the hydrophobization.
2.3. Beneficiation Using Magnetic Seeding
Figure 1 shows the experimental testing equipment for the beneficiation of graphite using magneticseeding. Magnetic seeding experiments were carried out in a 5 L beaker. A high shear mixer (fromFLUKO Equipment Shanghai Co., Ltd., Shanghai, China) was used to maintain mineral particles insuspension at a fixed solid–water ratio of 10 g of solids to 1 L water at pH 7. The solids consistedof microcrystalline graphite and quartz with a solid weight ratio of 4:1. The pulp was initiallyconditioned for 2 min, followed by another 4 min of conditioning with the addition of 0.1 g of magnetiteseeds (both original and hydrophobized magnetite) and 40 kg/t of dodecane at a stirring speed of10,000 rpm. The magnetite seeds were evenly sprinkled into the pulp to prevent eager aggregationbetween hydrophobized magnetite particles. Dodecane was added to promote selective aggregationof the particles due to its increased ability to adhere to hydrophobic particles. Both original andhydrophobized magnetite particles were used to show the importance of surface property on selectiveaggregation. Afterwards, magnetic separation was conducted in a high gradient magnetic separator(Slon-100, Slon Magnetic Separator Ltd., Ganzhou, China). The pulp entered the magnetic separator,where the magnetic fraction was retained inside, while the non-magnetic fraction exited at the bottom.As the concentrate, the magnetic fraction was washed out in the absence of the magnetic field at theend of each experiment. The magnetic concentrates and non-magnetic tailings were dried and weighedfor subsequent analysis of fixed carbon content, according to the Chinese standard GB/T 3521-2008 [29].
Minerals 2020, 10, x FOR PEER REVIEW 3 of 13
2.3. Beneficiation Using Magnetic Seeding
Figure 1 shows the experimental testing equipment for the beneficiation of graphite using magnetic seeding. Magnetic seeding experiments were carried out in a 5 L beaker. A high shear mixer (from FLUKO Equipment Shanghai Co., Ltd., Shanghai, China) was used to maintain mineral particles in suspension at a fixed solid–water ratio of 10 g of solids to 1 L water at pH 7. The solids consisted of microcrystalline graphite and quartz with a solid weight ratio of 4:1. The pulp was initially conditioned for 2 min, followed by another 4 min of conditioning with the addition of 0.1 g of magnetite seeds (both original and hydrophobized magnetite) and 40 kg/t of dodecane at a stirring speed of 10,000 rpm. The magnetite seeds were evenly sprinkled into the pulp to prevent eager aggregation between hydrophobized magnetite particles. Dodecane was added to promote selective aggregation of the particles due to its increased ability to adhere to hydrophobic particles. Both original and hydrophobized magnetite particles were used to show the importance of surface property on selective aggregation. Afterwards, magnetic separation was conducted in a high gradient magnetic separator (Slon-100, Slon Magnetic Separator Ltd., Ganzhou, China). The pulp entered the magnetic separator, where the magnetic fraction was retained inside, while the non-magnetic fraction exited at the bottom. As the concentrate, the magnetic fraction was washed out in the absence of the magnetic field at the end of each experiment. The magnetic concentrates and non-magnetic tailings were dried and weighed for subsequent analysis of fixed carbon content, according to the Chinese standard GB/T 3521-2008 [29].
Figure 1. Experimental set-up for the magnetic seeding.
2.4. Sedimentation Experiments
Mixed solids were accurately weighed and placed into a 100 mL cylinder. The mixture comprising 0.05 g of magnetic seeds and 0.02 g of mineral (microcrystalline graphite or quartz) was prepared. The cylinder was then filled with 100 mL of water at neutral pH, followed by inverting it 20 times. The perfectly mixed suspension was then given 3 min to settle. Its supernatant was sampled using a 5 mL pipette, at a fixed distance of 5 cm below the air–liquid interface. The number of particles in the supernatant samples was measured by a particle counter (GWF-8JD, Tianhe Analytic Instrument Co., Ltd., Tianjin, China) and was used to calculate particle concentrations.
2.5. Zeta Potential Measurements
The zeta potential at different pH values was measured by Brookhaven 90Plus ZetaPALS (Brookhaven Instruments Corporation, Brookhaven, MS, USA). For each measurement, 0.01 g of solids were added into 1.0 L of 1.0 × 10⁻⁴ M KCl electrolyte solution. The suspension was stirred for 5 min and its pH value was adjusted using HCl or NaOH solution. A total of 1 mL of the suspension was then taken out by a pipette for the measurement of zeta potential.
3. Theoretical Calculations
Figure 1. Experimental set-up for the magnetic seeding.
2.4. Sedimentation Experiments
Mixed solids were accurately weighed and placed into a 100 mL cylinder. The mixture comprising0.05 g of magnetic seeds and 0.02 g of mineral (microcrystalline graphite or quartz) was prepared.The cylinder was then filled with 100 mL of water at neutral pH, followed by inverting it 20 times.The perfectly mixed suspension was then given 3 min to settle. Its supernatant was sampled using a5 mL pipette, at a fixed distance of 5 cm below the air–liquid interface. The number of particles in thesupernatant samples was measured by a particle counter (GWF-8JD, Tianhe Analytic Instrument Co.,Ltd., Tianjin, China) and was used to calculate particle concentrations.
2.5. Zeta Potential Measurements
The zeta potential at different pH values was measured by Brookhaven 90Plus ZetaPALS(Brookhaven Instruments Corporation, Brookhaven, MS, USA). For each measurement, 0.01 g of solidswere added into 1.0 L of 1.0 × 10⁻⁴ M KCl electrolyte solution. The suspension was stirred for 5 min

Minerals 2020, 10, 24 4 of 13
and its pH value was adjusted using HCl or NaOH solution. A total of 1 mL of the suspension wasthen taken out by a pipette for the measurement of zeta potential.
3. Theoretical Calculations
The interactions between particles are commonly determined by the classical EDLVO theory,which considers the sum of Van der Waals interactions (VA) and electrostatic double layer interactions(VE). The hydrophobized magnetite and microcrystalline graphite used in this work have goodhydrophobicity; therefore, there also exists hydrophobic interactions (VHPB) between these particles.The EDLVO theory is then used to include hydrophobic interactions as follows [30,31]:
VT = VA + VE + VHPB (1)
The Van der Waals interaction energy of two spherical particles is expressed in the followingequations [32]:
VA = −A132
6hR1R2
R1 + R2(2)
A132 =3kBT
4
(ε1 − ε3
ε1 + ε3
)(ε2 − ε3
ε2 + ε3
)+
3}ω8√
2
(n1
2− n3
2)(
n22− n3
2)
(n12 + n32)
√n22 + n32 + (n22 + n32)
√n1
2 + n32(3)
where A132 is the Hamaker constant, R is the radius of spherical particles, h is the distance betweentwo mineral particles, kB is the Boltzmann constant with a value of 1.381 × 10⁻²³ J/K, T is temperature(298 K), ε1 and ε2 are the dielectric constant of two minerals, ε3 is the dielectric constant of water, } isthe Planck constant with the value of 6.626 × 10⁻³⁴ J·s, ω is the characteristic relaxation frequency ofthe UV region with a value of 3.0 × 10¹⁵ s−1, n1 and n2 are the refractive indices of two minerals, andn3 is the refractive index of water.
The electrostatic double layer interaction energy of two spherical particles is presentedas below [33]:
VE =εε0πR1R2
R1 + R2
[2ψ1ψ2 ln
1 + e−κh
1− e−κh+
(ψ1
2 +ψ22)
ln(1− e−2κh
)](4)
κ−1 =0.304√
CKCl(5)
where ε and ε0 are the permittivity of solution and vacuum, respectively; ψ1 and ψ2 are the zetapotential of minerals 1 and 2, respectively; κ−1 is the Debye length, which is 30.4 nm in 1.0 × 10⁻⁴ MKCl solution; and CKCl is the molar concentration of KCl solution.
The hydrophobic interactions energy is usually determined by Equation (6) [26]:
VHPB = −2πR1R2
R1 + R2U0
HAh0exp(−
hh0
)(6)
where h0 is the attenuation decay length and U0HA is the hydrophobic energy constant between particles,
which can be calculated by Equation (7) [34,35]:
U0HA = 2[
√γ+3
(√γ−1 +
√γ−2 −
√γ−3
)+
√γ−3
(√γ+1 +
√γ+2 −
√γ+3
)−
√γ+1 γ
−
2 −
√γ−1 γ
+2 ] (7)
where γ+1 and γ+2 are the electron acceptor of two minerals, γ+3 is the electron acceptor of a liquid, γ−1and γ−2 are the electron donors of two minerals, and γ−3 is the electron donor of a liquid. The values ofγ+1 , γ+2 , γ−1 , and γ−2 can be derived from Equation (8) [36]:
(1 + cos θ)γL = 2([√γLW
S γLWL +
√γ+S γ
−
L +√γ−Sγ
+L ]) (8)

Minerals 2020, 10, 24 5 of 13
where γLW is the apolar (Lifshitz–Van der Waals) component of the solid and liquid surface tensionand the index S and L refer to solid and liquid, respectively. In order to obtain the values, γLW
S , γ+S ,and γ−S , of minerals, the contact angles (θ) of three different liquids (of which two must be polar) withknown γLW
L , γ−L , and γ+L were measured and put into Equation (8) three times. Table 1 shows theaverage contact angles of microcrystalline graphite, quartz, and original and hydrophobized magnetite.The values for the components of surface energy were calculated by Equation (8) and presented inTable 2.
Table 1. Contact angle of microcrystalline graphite, quartz, and original and hydrophobized magnetiteformed by a drop of water, formamide, and diiodomethane.
MineralsContact Angle (Degree)
Distilled Water Formamide Diiodomethane
Microcrystalline graphite 97 65 38Quartz 5 11 24
Original magnetite 13 10 16Hydrophobized magnetite 132 110 105
Table 2. Values of components of surface energies of microcrystalline graphite, quartz, and originaland hydrophobized magnetite.
MineralsSurface Energy (mJ/m2)
γ+S γ−S γLWS
Microcrystalline graphite 0.03 0.07 40.6Quartz 0.34 56.62 46.50
Original magnetite 0.21 53.49 48.85Hydrophobized magnetite 0.03 0.98 6.98
4. Results and Discussion
4.1. Characterization
Figure 2 shows the XRD patterns of quartz (PDF card #: 65-0466) and microcrystalline graphite(PDF card #: 41-1487) used in the present work. These minerals were of a very high grade and containednegligible impurities. The XRF analysis, summarized in Table 3, indicated that microcrystalline graphitecontained 96.00 wt% of C and 1.79 wt% SiO2. The quartz mineral contained 97.93 wt% of SiO2 and0.86 wt% of Al2O3. Such XRF results corresponded well to the XRD patterns. The particle sizedistributions of different minerals are tabulated in Table 4. The particle sizes are represented by D50,D90 (particle diameter at a cumulative distribution of 50% and 90%), and volume average diameters inthe unit of µm. The volume average diameters of microcrystalline graphite, quartz, and magnetitewere close. Similar findings can also be found in terms of D50 and D90 values. These results indicatethat the size distributions of different mineral particles used in the current study were similar.
Table 3. Chemical analysis of microcrystalline graphite and quartz minerals.
Sample Content (%)
microcrystallinegraphite
C SiO2 Fe2O3 Al2O3 Other96.00 1.79 0.69 0.52 1.00
quartz SiO2 Al2O3 K2O Other97.93 0.86 0.57 0.64

Minerals 2020, 10, 24 6 of 13
Minerals 2020, 10, x FOR PEER REVIEW 5 of 13
Table 1. Contact angle of microcrystalline graphite, quartz, and original and hydrophobized magnetite formed by a drop of water, formamide, and diiodomethane.
Minerals Contact Angle (Degree)
Distilled Water Formamide Diiodomethane Microcrystalline graphite 97 65 38
Quartz 5 11 24 Original magnetite 13 10 16
Hydrophobized magnetite 132 110 105
Table 2. Values of components of surface energies of microcrystalline graphite, quartz, and original and hydrophobized magnetite.
Minerals Surface Energy (mJ/m2) 𝜸𝑺 𝜸𝑺 𝜸𝑺𝑳𝑾 Microcrystalline graphite 0.03 0.07 40.6
Quartz 0.34 56.62 46.50 Original magnetite 0.21 53.49 48.85
Hydrophobized magnetite 0.03 0.98 6.98
4. Results and Discussion
4.1. Characterization
Figure 2 shows the XRD patterns of quartz (PDF card #: 65-0466) and microcrystalline graphite (PDF card #: 41-1487) used in the present work. These minerals were of a very high grade and contained negligible impurities. The XRF analysis, summarized in Table 3, indicated that microcrystalline graphite contained 96.00 wt% of C and 1.79 wt% SiO2. The quartz mineral contained 97.93 wt% of SiO2 and 0.86 wt% of Al2O3. Such XRF results corresponded well to the XRD patterns. The particle size distributions of different minerals are tabulated in Table 4. The particle sizes are represented by D50, D90 (particle diameter at a cumulative distribution of 50% and 90%), and volume average diameters in the unit of μm. The volume average diameters of microcrystalline graphite, quartz, and magnetite were close. Similar findings can also be found in terms of D50 and D90 values. These results indicate that the size distributions of different mineral particles used in the current study were similar.
Figure 2. X-ray diffractometer (XRD) patterns of quartz and microcrystalline graphite. Figure 2. X-ray diffractometer (XRD) patterns of quartz and microcrystalline graphite.
Table 4. Grain size distribution of different minerals.
Mineral D50, µm D90, µm Volume Average Diameter, µm
microcrystalline graphite 6.26 14.25 10.72quartz 7.69 18.74 14.31
magnetite 7.13 16.54 13.84
4.2. Magnetite Hydrophobization
The contact angles of magnetite before and after the treatment with sodium oleate are shown inFigure 3. The contact angle increased from 13◦ to 132◦ after surface modification, which indicatesthat magnetite gains hydrophobicity through surface coating of sodium oleate. This is because theelectrostatic interaction between carboxylic acid head groups of the oleate and the hydroxyl groupsof magnetite tends to form a hydrophobic shell. This mechanism has been elaborated by previousstudies [22,37–40].
Minerals 2020, 10, x FOR PEER REVIEW 6 of 13
Table 3. Chemical analysis of microcrystalline graphite and quartz minerals.
Sample Content (%)
microcrystalline graphite C SiO2 Fe2O3 Al2O3 Other
96.00 1.79 0.69 0.52 1.00
quartz SiO2 Al2O3 K2O Other 97.93 0.86 0.57 0.64
Table 4. Grain size distribution of different minerals.
Mineral D50, μm D90, μm Volume Average Diameter, μm microcrystalline graphite 6.26 14.25 10.72
quartz 7.69 18.74 14.31 magnetite 7.13 16.54 13.84
4.2. Magnetite Hydrophobization
The contact angles of magnetite before and after the treatment with sodium oleate are shown in Figure 3. The contact angle increased from 13° to 132° after surface modification, which indicates that magnetite gains hydrophobicity through surface coating of sodium oleate. This is because the electrostatic interaction between carboxylic acid head groups of the oleate and the hydroxyl groups of magnetite tends to form a hydrophobic shell. This mechanism has been elaborated by previous studies [22,37–40].
Figure 3. The contact angle of original (a) and hydrophobized (b) magnetite.
4.3. Beneficiation of Microcrystalline Graphite
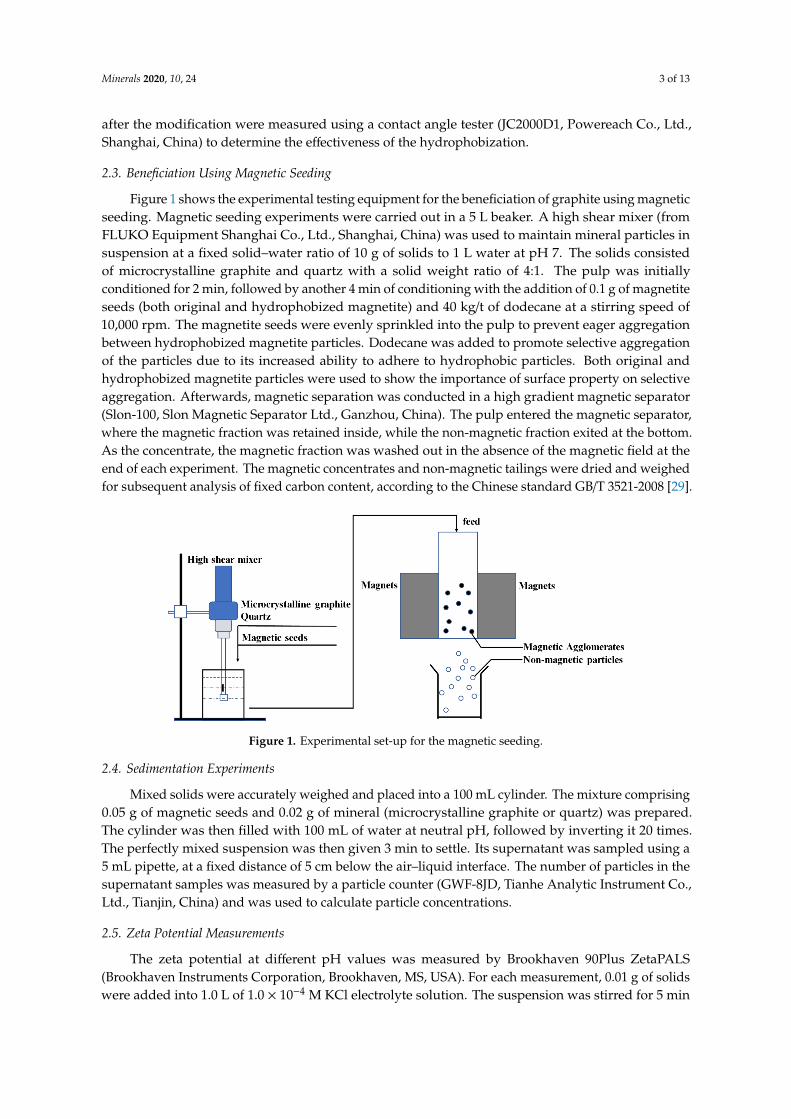
Figure 4 presents the recovery of microcrystalline graphite as a function of magnetic field intensities. The same mass of original and hydrophobized magnetite were employed. It is obvious from Figure 4 that the recovery of microcrystalline graphite rose considerably, while the magnetic field intensity increased from 0.2 T to 1 T. The hydrophobized magnetite possessed a higher microcrystalline graphite recovery than the original magnetite did over the entire range of the magnetic field intensity. The microcrystalline graphite recovery of 77.6% can be achieved at 1 T of magnetic field intensity for hydrophobized magnetite, and it was 27.6% higher than that for original magnetite under the same condition. This clearly indicates that hydrophobic magnetite benefitted the recovery of microcrystalline graphite.
Figure 3. The contact angle of original (a) and hydrophobized (b) magnetite.
4.3. Beneficiation of Microcrystalline Graphite
Figure 4 presents the recovery of microcrystalline graphite as a function of magnetic field intensities.The same mass of original and hydrophobized magnetite were employed. It is obvious from Figure 4 thatthe recovery of microcrystalline graphite rose considerably, while the magnetic field intensity increasedfrom 0.2 T to 1 T. The hydrophobized magnetite possessed a higher microcrystalline graphite recoverythan the original magnetite did over the entire range of the magnetic field intensity. The microcrystalline
Minerals 2020, 10, 24 7 of 13
graphite recovery of 77.6% can be achieved at 1 T of magnetic field intensity for hydrophobizedmagnetite, and it was 27.6% higher than that for original magnetite under the same condition.This clearly indicates that hydrophobic magnetite benefitted the recovery of microcrystalline graphite.Minerals 2020, 10, x FOR PEER REVIEW 7 of 13
Figure 4. The recovery of microcrystalline graphite as a function of magnetic field intensity for two magnetic seeds. The error bars show the standard deviation of multiple replicates.
Figure 5 shows the fixed carbon content of microcrystalline graphite for the two magnetic seeds. There was an increase in the fixed carbon content of magnetic concentrate with increasing magnetic field intensity. The fixed carbon of feed was measured at 70.2%. As for hydrophobized magnetite, the fixed carbon content of magnetic concentrate increased from 81.9% at 0.2 T to 87.6% at 1 T. Compared with hydrophobized magnetite, the original counterpart led to a lower fixed carbon content of magnetic concentrate in all circumstances. These findings clearly indicate that surface hydrophobization was beneficial to enhance concentrate quality.
Figure 5. The fixed carbon content of microcrystalline graphite as a function of magnetic field intensity for different magnetic seeds. The error bars represent the standard deviation of multiple replicates.
4.4. Sedimentation Experiments
Sedimentation experiments were conducted to examine the effect of surface property of magnetic seeds on their selective attachment with microcrystalline graphite and quartz. When magnetic seeds agglomerate with minerals (microcrystalline graphite or quartz), the resultant agglomerates will settle quickly, whereas the remaining fine particles will suspend for a long time.
Figure 4. The recovery of microcrystalline graphite as a function of magnetic field intensity for twomagnetic seeds. The error bars show the standard deviation of multiple replicates.
Figure 5 shows the fixed carbon content of microcrystalline graphite for the two magnetic seeds.There was an increase in the fixed carbon content of magnetic concentrate with increasing magnetic fieldintensity. The fixed carbon of feed was measured at 70.2%. As for hydrophobized magnetite, the fixedcarbon content of magnetic concentrate increased from 81.9% at 0.2 T to 87.6% at 1 T. Compared withhydrophobized magnetite, the original counterpart led to a lower fixed carbon content of magneticconcentrate in all circumstances. These findings clearly indicate that surface hydrophobization wasbeneficial to enhance concentrate quality.
Minerals 2020, 10, x FOR PEER REVIEW 7 of 13
Figure 4. The recovery of microcrystalline graphite as a function of magnetic field intensity for two magnetic seeds. The error bars show the standard deviation of multiple replicates.
Figure 5 shows the fixed carbon content of microcrystalline graphite for the two magnetic seeds. There was an increase in the fixed carbon content of magnetic concentrate with increasing magnetic field intensity. The fixed carbon of feed was measured at 70.2%. As for hydrophobized magnetite, the fixed carbon content of magnetic concentrate increased from 81.9% at 0.2 T to 87.6% at 1 T. Compared with hydrophobized magnetite, the original counterpart led to a lower fixed carbon content of magnetic concentrate in all circumstances. These findings clearly indicate that surface hydrophobization was beneficial to enhance concentrate quality.
Figure 5. The fixed carbon content of microcrystalline graphite as a function of magnetic field intensity for different magnetic seeds. The error bars represent the standard deviation of multiple replicates.
4.4. Sedimentation Experiments
Sedimentation experiments were conducted to examine the effect of surface property of magnetic seeds on their selective attachment with microcrystalline graphite and quartz. When magnetic seeds agglomerate with minerals (microcrystalline graphite or quartz), the resultant agglomerates will settle quickly, whereas the remaining fine particles will suspend for a long time.
Figure 5. The fixed carbon content of microcrystalline graphite as a function of magnetic field intensityfor different magnetic seeds. The error bars represent the standard deviation of multiple replicates.

Minerals 2020, 10, 24 8 of 13
4.4. Sedimentation Experiments
Sedimentation experiments were conducted to examine the effect of surface property of magneticseeds on their selective attachment with microcrystalline graphite and quartz. When magnetic seedsagglomerate with minerals (microcrystalline graphite or quartz), the resultant agglomerates will settlequickly, whereas the remaining fine particles will suspend for a long time.
As shown in Figure 6a, the particle concentration in the supernatant of the hydrophobizedmagnetite-microcrystalline graphite system was smaller than that of the original magnetite-microcrystalline graphite system in the size range of 1–10 µm. The supernatant particle concentrationsin the whole size range of 1–20 µm were 37,599 particles per milliliter for hydrophobized magnetite and47,963 particles per milliliter for original magnetite, respectively. Figure 6b compares the supernatantparticle concentrations of hydrophobized magnetite-quartz and original magnetite-quartz systems.The results show that the supernatant particle concentrations of the two systems were almost the same.In conclusion, the hydrophobized magnetite had an increased likelihood to form agglomeration withmicrocrystalline graphite over original magnetite. However, the hydrophobized magnetite and originalmagnetite had similar interaction with quartz. This explains why hydrophobized magnetite hadgreater graphite recovery and higher concentrate quality than the original counterpart in Section 4.3.
Minerals 2020, 10, x FOR PEER REVIEW 8 of 13
As shown in Figure 6a, the particle concentration in the supernatant of the hydrophobized magnetite-microcrystalline graphite system was smaller than that of the original magnetite-microcrystalline graphite system in the size range of 1–10 μm. The supernatant particle concentrations in the whole size range of 1–20 μm were 37,599 particles per milliliter for hydrophobized magnetite and 47,963 particles per milliliter for original magnetite, respectively. Figure 6b compares the supernatant particle concentrations of hydrophobized magnetite-quartz and original magnetite-quartz systems. The results show that the supernatant particle concentrations of the two systems were almost the same. In conclusion, the hydrophobized magnetite had an increased likelihood to form agglomeration with microcrystalline graphite over original magnetite. However, the hydrophobized magnetite and original magnetite had similar interaction with quartz. This explains why hydrophobized magnetite had greater graphite recovery and higher concentrate quality than the original counterpart in Section 4.3.
Figure 6. The particle concentrations of the supernatant after original magnetite/hydrophobized magnetite agglomerates with (a) microcrystalline graphite and (b) quartz. The error bars represent the standard deviation of multiple replicates.
4.5. Zeta Potential Measurement and Inter-Particle Interaction Energy Analysis
Figure 7 shows the zeta potentials of microcrystalline graphite, hydrophobized magnetite, original magnetite, and quartz, respectively, at different pH values. It is observed that the values at the point of 0 charge (pzc) of microcrystalline graphite, hydrophobized magnetite, and original magnetite in the present work were around 4.5, 3.2, and 6.3, respectively. The surface of quartz was negatively charged in the whole pH range between 2 and 12. These results are close to previous findings [1,41,42]. Compared with the surface charge of original magnetite, hydrophobized magnetite became more negative over the whole pH range examined. Therefore, electrostatic double layer repulsion was expected between hydrophobized magnetite and quartz at a pH value around 7 due
Figure 6. The particle concentrations of the supernatant after original magnetite/hydrophobizedmagnetite agglomerates with (a) microcrystalline graphite and (b) quartz. The error bars represent thestandard deviation of multiple replicates.
4.5. Zeta Potential Measurement and Inter-Particle Interaction Energy Analysis
Figure 7 shows the zeta potentials of microcrystalline graphite, hydrophobized magnetite,original magnetite, and quartz, respectively, at different pH values. It is observed that the values at the

Minerals 2020, 10, 24 9 of 13
point of 0 charge (pzc) of microcrystalline graphite, hydrophobized magnetite, and original magnetitein the present work were around 4.5, 3.2, and 6.3, respectively. The surface of quartz was negativelycharged in the whole pH range between 2 and 12. These results are close to previous findings [1,41,42].Compared with the surface charge of original magnetite, hydrophobized magnetite became morenegative over the whole pH range examined. Therefore, electrostatic double layer repulsion wasexpected between hydrophobized magnetite and quartz at a pH value around 7 due to similar surfacecharges. Conversely, the surface charges of hydrophobized magnetite and graphite differed largely,since an electrostatic double layer attraction could exist. Thus, the surface charge of hydrophobizedmagnetite had a positive effect on selective aggregation in the current study. However, this impact wasnegligible compared to the hydrophobic interaction, which is evidenced by the following calculationsbased on the EDLVO theory.
Minerals 2020, 10, x FOR PEER REVIEW 9 of 13
to similar surface charges. Conversely, the surface charges of hydrophobized magnetite and graphite differed largely, since an electrostatic double layer attraction could exist. Thus, the surface charge of hydrophobized magnetite had a positive effect on selective aggregation in the current study. However, this impact was negligible compared to the hydrophobic interaction, which is evidenced by the following calculations based on the EDLVO theory.
Figure 7. Zeta potentials of microcrystalline graphite, quartz, magnetite, and hydrophobic magnetite as a function of pH in 1.0 × 10⁻⁴ M KCl solution.
Figure 8 presents the total interaction energy between seeds (original or hydrophobic magnetite) and minerals (microcrystalline graphite or quartz) calculated at pH 7, according to Equations (1)–(8). The negative energy indicates attraction between particles. On the contrary, the positive sign means repulsion between particles.
The total inter-particle interaction energy between original magnetite and quartz was repulsive. An obvious attraction interaction between original magnetite and microcrystalline graphite was present. This indicates that original magnetite particles could also selectively aggregate with microcrystalline graphite. Additionally, it appears that hydrophobized magnetite was likely to aggregate with quartz by the attractive interaction. However, interactions between hydrophobized magnetite and microcrystalline graphite were obviously much stronger than that between hydrophobized magnetite and quartz. As a result, hydrophobized magnetite tended to bond with microcrystalline graphite rather than with quartz to form selective agglomerates under the high intensity agitation. These results are consistent with those of magnetic seeding and sedimentation experiments.
Figure 7. Zeta potentials of microcrystalline graphite, quartz, magnetite, and hydrophobic magnetiteas a function of pH in 1.0 × 10⁻⁴ M KCl solution.
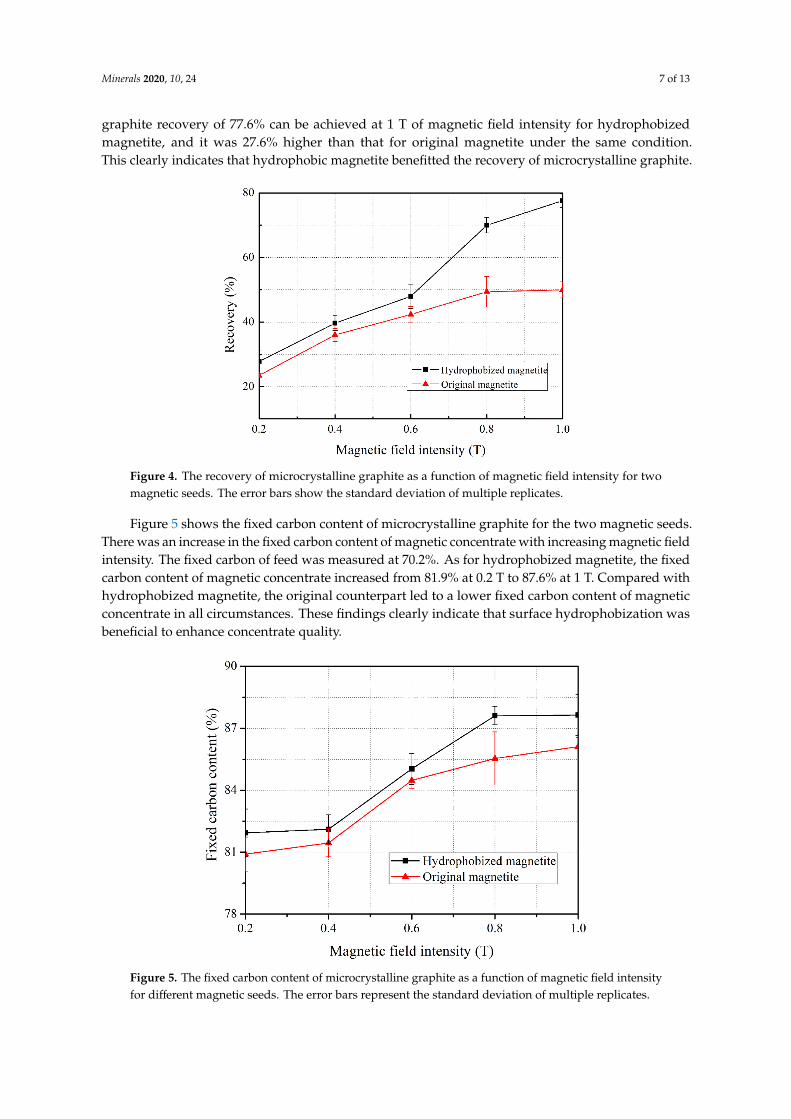
Figure 8 presents the total interaction energy between seeds (original or hydrophobic magnetite)and minerals (microcrystalline graphite or quartz) calculated at pH 7, according to Equations (1)–(8).The negative energy indicates attraction between particles. On the contrary, the positive sign meansrepulsion between particles.
The total inter-particle interaction energy between original magnetite and quartz was repulsive.An obvious attraction interaction between original magnetite and microcrystalline graphite was present.This indicates that original magnetite particles could also selectively aggregate with microcrystallinegraphite. Additionally, it appears that hydrophobized magnetite was likely to aggregate withquartz by the attractive interaction. However, interactions between hydrophobized magnetite andmicrocrystalline graphite were obviously much stronger than that between hydrophobized magnetiteand quartz. As a result, hydrophobized magnetite tended to bond with microcrystalline graphiterather than with quartz to form selective agglomerates under the high intensity agitation. These resultsare consistent with those of magnetic seeding and sedimentation experiments.
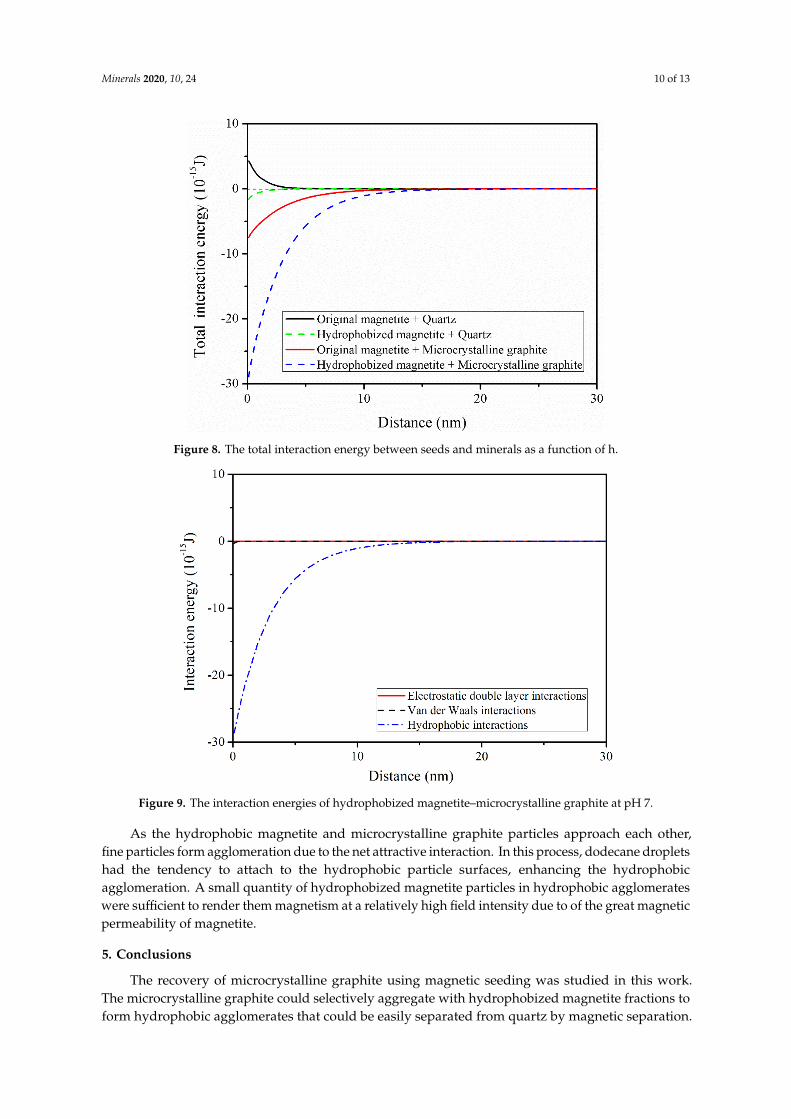
Individual interaction energies versus separation distance for hydrophobized magnetite andmicrocrystalline graphite particles are illustrated in Figure 9, which indicates that the aggregationbetween hydrophobized magnetite and microcrystalline graphite was driven mainly by the attractivehydrophobic interaction.
Minerals 2020, 10, 24 10 of 13Minerals 2020, 10, x FOR PEER REVIEW 10 of 13
Figure 8. The total interaction energy between seeds and minerals as a function of h.
Individual interaction energies versus separation distance for hydrophobized magnetite and microcrystalline graphite particles are illustrated in Figure 9, which indicates that the aggregation between hydrophobized magnetite and microcrystalline graphite was driven mainly by the attractive hydrophobic interaction.
Figure 9. The interaction energies of hydrophobized magnetite–microcrystalline graphite at pH 7.
As the hydrophobic magnetite and microcrystalline graphite particles approach each other, fine particles form agglomeration due to the net attractive interaction. In this process, dodecane droplets had the tendency to attach to the hydrophobic particle surfaces, enhancing the hydrophobic agglomeration. A small quantity of hydrophobized magnetite particles in hydrophobic agglomerates were sufficient to render them magnetism at a relatively high field intensity due to of the great magnetic permeability of magnetite.
Figure 8. The total interaction energy between seeds and minerals as a function of h.
Minerals 2020, 10, x FOR PEER REVIEW 10 of 13
Figure 8. The total interaction energy between seeds and minerals as a function of h.
Individual interaction energies versus separation distance for hydrophobized magnetite and microcrystalline graphite particles are illustrated in Figure 9, which indicates that the aggregation between hydrophobized magnetite and microcrystalline graphite was driven mainly by the attractive hydrophobic interaction.
Figure 9. The interaction energies of hydrophobized magnetite–microcrystalline graphite at pH 7.
As the hydrophobic magnetite and microcrystalline graphite particles approach each other, fine particles form agglomeration due to the net attractive interaction. In this process, dodecane droplets had the tendency to attach to the hydrophobic particle surfaces, enhancing the hydrophobic agglomeration. A small quantity of hydrophobized magnetite particles in hydrophobic agglomerates were sufficient to render them magnetism at a relatively high field intensity due to of the great magnetic permeability of magnetite.
Figure 9. The interaction energies of hydrophobized magnetite–microcrystalline graphite at pH 7.
As the hydrophobic magnetite and microcrystalline graphite particles approach each other,fine particles form agglomeration due to the net attractive interaction. In this process, dodecane dropletshad the tendency to attach to the hydrophobic particle surfaces, enhancing the hydrophobicagglomeration. A small quantity of hydrophobized magnetite particles in hydrophobic agglomerateswere sufficient to render them magnetism at a relatively high field intensity due to of the great magneticpermeability of magnetite.
5. Conclusions
The recovery of microcrystalline graphite using magnetic seeding was studied in this work.The microcrystalline graphite could selectively aggregate with hydrophobized magnetite fractions toform hydrophobic agglomerates that could be easily separated from quartz by magnetic separation.

Minerals 2020, 10, 24 11 of 13
Sedimentation experiments further confirm that hydrophobized magnetite had a better selectivitythan original magnetite. The mechanism of aggregation could be explained by the EDLVO theory.The interactions between hydrophobized magnetite and microcrystalline graphite were attractive.Compared with the Van der Waals interactions and electrostatic double layer interactions, hydrophobicattraction was much stronger and played a dominant role in the interaction between hydrophobizedmagnetite and microcrystalline graphite.
Author Contributions: Conceptualization, Y.P., G.X.; Methodology, L.L., P.H.; Writing-Original Draft Preparation,P.H.; Writing–Review & Editing, H.Y. Project Administration, G.X. All authors have read and agreed to thepublished version of the manuscript.
Funding: This work was supported by the Future Scientists Program of “Double First Rate” of China Universityof Mining and Technology (2019WLKXJ023).
Acknowledgments: The authors express their great appreciation to the anonymous reviewers for their valuabletime, constructive comments, and helpful suggestions.
Conflicts of Interest: The authors declare no conflict of interest.
References
1. Liang, L.; Zhang, T.; Peng, Y.; Xie, G. Inhibiting heterocoagulation between microcrystalline graphite andquartz by pH modification and sodium hexametaphosphate. Colloids Surf. A Physicochem. Eng. Asp. 2018,553, 149–154. [CrossRef]
2. Klunder, K.J.; Nilsson, Z.; Sambur, J.B.; Henry, C.S. Patternable Solvent-Processed Thermoplastic GraphiteElectrodes. J. Am. Chem. Soc. 2017, 139, 12623–12631. [CrossRef] [PubMed]
3. Guan, Z.; Shen, X.; Yu, R.; Wang, Z.; Chen, L. Chemical intercalation of solvated sodium ions in graphite.Electrochim. Acta 2016, 222, 1365–1370. [CrossRef]
4. Xie, W.; Wang, Z.; Kuang, J.; Xu, H.; Yi, S.; Deng, Y.; Cao, T.; Guo, Z. Fixed carbon content and reactionmechanism of natural microcrystalline graphite purified by hydrochloric acid and sodium fluoride. Int. J.Miner. Process. 2016, 155, 45–54. [CrossRef]
5. Lu, X.; Forssberg, E. Flotation selectivity and upgrading of Woxna fine graphite concentrate. Miner. Eng.2001, 14, 1541–1543. [CrossRef]
6. Bulatovic, S.M. Beneficiation of Graphite Ore. In Handbook of Flotation Reagents: Chemistry, Theory and Practice;Elsevier: Amsterdam, The Netherlands, 2015; Volume 3, pp. 163–171.
7. Xie, W.; Zhu, X.; Yi, S.; Kuang, J.; Cheng, H.; Tang, W.; Deng, Y. Electromagnetic absorption properties ofnatural microcrystalline graphite. Mater. Des. 2016, 90, 38–46. [CrossRef]
8. Wang, J.; Huang, J.; Yan, R.; Wang, F.; Cheng, W.; Guo, Q.; Wang, J. Graphene microsheets from naturalmicrocrystalline graphite minerals: Scalable synthesis and unusual energy storage. J. Mater. Chem. A 2015, 3,3144–3150. [CrossRef]
9. Li, H.; Feng, Q.; Yang, S.; Ou, L.; Lu, Y. The entrainment behaviour of sericite in microcrystalline graphiteflotation. Int. J. Miner. Process. 2014, 127, 1–9. [CrossRef]
10. Feng, Q.; Chen, Y.; Zhang, G.; Lu, Y.; Ou, Y. Study on the purification of aphanitic graphite. Conserv. Util.Miner. Resour. 2003, 3, 20–22.
11. Luo, L.; Tan, X.; Tian, J. Research progress of graphite purification. Chem. Ind. Eng. Prog. 2014, 33, 2110–2116.12. Ge, P.; Wang, H.; Zhao, J.; Xie, L.; Zhang, Q. Preparation of high purity graphite by an alkaline
roasting–leaching method. New Carbon Mater. 2010, 25, 22–28. [CrossRef]13. Lu, X.J.; Forssberg, E. Preparation of high-purity and low-sulphur graphite from Woxna fine graphite
concentrate by alkali roasting. Miner. Eng. 2002, 15, 755–757. [CrossRef]14. Zhang, L.; Fang, J.; Zhao, M.; Li, G. Development of aphanitic graphite purification. Chem. Ind. Eng. Prog.
2017, 36, 261–267.15. Wan, T.J.; Shen, S.M.; Siao, S.H.; Huang, C.F.; Cheng, C.Y. Using magnetic seeds to improve the aggregation
and precipitation of nanoparticles from backside grinding wastewater. Water Res. 2011, 45, 6301–6307.[CrossRef] [PubMed]
16. Parsonage, P. Principles of mineral separation by selective magnetic coating. Int. J. Miner. Process. 1988, 24,269–293. [CrossRef]

Minerals 2020, 10, 24 12 of 13
17. Feng, D.; Aldrich, C.; Tan, H. Removal of heavy metal ions by carrier magnetic separation of adsorptiveparticulates. Hydrometallurgy 2000, 56, 359–368. [CrossRef]
18. Qiu, Y.; Xiao, X.; Ye, Z.; Guan, Z.; Sun, S.; Ren, J.; Yan, P. Research on magnetic separation for complex nickeldeep removal and magnetic seed recycling. Environ. Sci. Pollut. Res. 2017, 24, 9294–9304. [CrossRef]
19. Zhao, C.; Li, Y.; Wu, X.; Lu, D.; Han, S. Experimental investigation on aggregation of coal-fired PM10 bymagnetic seeding. Chem. Eng. J. 2007, 133, 301–309. [CrossRef]
20. Yiacoumi, S.; Rountree, D.A.; Tsouris, C. Mechanism of particle flocculation by magnetic seeding. J. ColloidInterface Sci. 1996, 184, 477–488. [CrossRef]
21. Anastassakis, G.N. Separation of Fine Mineral Particles by Selective Magnetic Coating. J. Colloid Interface Sci.2002, 256, 114–120. [CrossRef]
22. Prakash, S.; Das, B.; Mohanty, J.K.; Venugopal, R. The recovery of fine iron minerals from quartz andcorundum mixtures using selective magnetic coating. Int. J. Miner. Process. 1999, 57, 87–103. [CrossRef]
23. Singh, S.; Sahoo, H.; Rath, S.S.; Sahu, A.K.; Das, B. Recovery of iron minerals from Indian iron ore slimesusing colloidal magnetic coating. Powder Technol. 2015, 269, 38–45. [CrossRef]
24. Lu, J.; Yuan, Z.; Liu, J.; Li, L.; Zhu, S. Effects of magnetite on magnetic coating behavior in pentlandite andserpentine system. Miner. Eng. 2015, 72, 115–120. [CrossRef]
25. Lu, J.; Yuan, Z.; Wang, N.; Lu, S.; Meng, Q.; Liu, J. Selective surface magnetization of pentlandite withmagnetite and magnetic separation. Powder Technol. 2017, 317, 162–170. [CrossRef]
26. Yuan, Z.T.; Lu, J.W.; Liu, J.T.; Li, L.X.; Wang, S.Y. Enhancement of pentlandite surface magnetism andimplications for its separation from serpentine via magnetic separation. Trans. Nonferrous Met. Soc. China2017, 27, 204–210. [CrossRef]
27. Gray, S.R.; Langberg, D.E.; Gray, N.B. Fine mineral recovery with hydrophobic magnetite. Int. J. Miner. Process.1994, 41, 183–200. [CrossRef]
28. Karapinar, N. Magnetic separation of ferrihydrite from wastewater by magnetic seeding and high-gradientmagnetic separation. Int. J. Miner. Process. 2003, 71, 45–54. [CrossRef]
29. Chinese GB Standards. GB/T 3521-2008: Method for Chemical Analysis of Graphite 2009; StandardizationAdministration of China: Beijing, China, 2009; 10p.
30. Hu, Y.; Dai, J. Hydrophobic aggregation of alumina in surfactant solution. Miner. Eng. 2003, 16, 1167–1172.[CrossRef]
31. Xu, Z.; Yoon, R. The Role of Hydrophobic Interactions in Coagulation. J. Colloid Interface Sci. 1989, 132,532–541. [CrossRef]
32. Israelachvili, J.N. Intermolecular and Surface Forces; Academic Press: Cambridge, MA, USA, 2011.33. Yu, Y.; Ma, L.; Xu, H.; Sun, X.; Zhang, Z.; Ye, G. DLVO theoretical analyses between montmorillonite and fine
coal under different pH and divalent cations. Powder Technol. 2018, 330, 147–151. [CrossRef]34. Yao, J.; Yin, W.; Gong, E. Depressing effect of fine hydrophilic particles on magnesite reverse flotation. Int. J.
Miner. Process. 2016, 149, 84–93. [CrossRef]35. Van Oss, C.J. Interfacial Forces in Aqueous Media; Marcel Dekker: New York, NY, USA, 2006.36. Van Oss, C.J.; Good, R.J. Surface Tension and the Solubility of Polymers and Biopolymers: The Role of Polar
and Apolar Interfacial Free Energies. J. Macromol. Sci. Part A Chem. 1989, 26, 1183–1203. [CrossRef]37. Holuszko, M.E.; Franzidis, J.P.; Manlapig, E.V.; Hampton, M.A.; Donose, B.C.; Nguyen, A.V. The effect of
surface treatment and slime coatings on ZnS hydrophobicity. Miner. Eng. 2008, 21, 958–966. [CrossRef]38. Liu, X.; Kaminski, M.D.; Guan, Y.; Chen, H.; Liu, H.; Rosengart, A.J. Preparation and characterization of
hydrophobic superparamagnetic magnetite gel. J. Magn. Magn. Mater. 2006, 306, 248–253. [CrossRef]39. Shaikh, A.M.H.; Dixit, S.G. Role of Magnetite and Sodium Oleate in the High Gradient Magnetic Separation
of Calcite Using Magnetic Coating of the Surface. J. Colloid Interface Sci. 1993, 155, 340–346. [CrossRef]40. Roonasi, P.; Yang, X.; Holmgren, A. Competition between sodium oleate and sodium silicate for a silicate/oleate
modified magnetite surface studied by in situ ATR-FTIR spectroscopy. J. Colloid Interface Sci. 2010, 343,546–552. [CrossRef]

Minerals 2020, 10, 24 13 of 13
41. Carlson, J.J.; Kawatra, S.K. Factors affecting zeta potential of iron oxides. Miner. Process. Extr. Metall. Rev.2013, 34, 269–303. [CrossRef]
42. Barale, M.; Lefèvre, G.; Carrette, F.; Catalette, H.; Fédoroff, M.; Cote, G. Effect of the adsorption of lithiumand borate species on the zeta potential of particles of cobalt ferrite, nickel ferrite, and magnetite. J. ColloidInterface Sci. 2008, 328, 34–40. [CrossRef]
© 2019 by the authors. Licensee MDPI, Basel, Switzerland. This article is an open accessarticle distributed under the terms and conditions of the Creative Commons Attribution(CC BY) license (http://creativecommons.org/licenses/by/4.0/).