Cobalt, Lithium, Manganese, Natural Graphite, Nickel - JRC ...
Upload
khangminh22Category
view
0download
0
Impact of Non-Arrhenius Temperature Behavior on the Fast-Charging Capabilities of LiCoO2minusGraphite Lithium-Ion BatteriesPublished as part of The Journal of Physical Chemistry virtual special issue ldquoEmily A Carter Festschriftrdquo
Wesley Changnabla Clement Bommiernabla Robert Mohr and Daniel Steingart
Cite This httpsdxdoiorg101021acsjpcc0c09972 Read Online
ACCESS Metrics amp More Article Recommendations
ABSTRACT Fast-charging lithium-ion batteries in 15 min or lessis an important capability that may lead to greater electric vehicleadoption but remains challenging to implement Heating tomoderate temperature (40minus50 degC) during the fast-charge stephas been introduced as one method to mitigate the loss of lithiuminventory by enhancing transport and kinetics Unfortunately thisedge has two sides as even moderate temperature elevation willaccelerate capacity fade due to interface and electrolytedegradation While the thermal enhancement of transport and degradation is intuitive the mechanistic effects of varioustemperature ranges on fast-charging capabilities are under-reported The present work examines the balance between agingtemperature and charge rate and describes cycling protocols in combination with high-temperature ranges that may enable fast-charging capabilities A galvanostatic intermittent titration technique (GITT) analysis reveals non-Arrhenius diffusion behavior atthe cell level This shift is attributed to a mechanistic difference in graphite staging at temperatures above and below 40 degC Coupledwith differential capacity and voltage analysis we indicate the specific phase transition that is kinetically sluggish at low temperaturesrelative to the other phase transitions but is comparable to the other phase transitions at high temperatures This reduction of thetransport bottleneck in addition to the benefits of thermal activation of diffusion further minimizes the likelihood of lithium platingthat is triggered by particle scale transport challenges well before full lithiation of the graphite This helps to explain recentlydescribed outsized successes of elevated temperature fast-charge protocols but also questions the temperature at which fast-chargeshould take place as the diffusivity gains for 55 vs 45 degC are less dramatic than 45 vs 35 degC and side reactions may deter operationabove 50 degC These diffusivity studies are connected with long-term aging studies which indicate improved high-temperature agingat lower states-of-charge rather than higher states-of-charge Taken together we introduce a cycling protocol utilizing a constantcurrent fast-charge at high temperature to take advantage of lower overpotentials shorter duration at high states-of-charge andimproved cell diffusivity
1 INTRODUCTION
The global adoption of electric vehicles and the hypothesis that200 mile range alleviates ldquorange anxietyrdquo has led to an interest infast-charge capabilities comparable with combustion enginevehicles12 Such fast-charge capability may offset the capital andmass requirements for 300 mile or more batteries Reports fromthe calendar year 2017 indicated that the electric vehicle marketcomprised around 17 of global vehicles sold3 Recently the2020 Bloomberg New Energy Finance Executive Summaryconcluded that electric vehicles accounted for 3 of global carsales rising to 7 in 20234 In addition to the cost metric of lessthan $100kWh and the cycle life retention of 80 at 1000cycles5 electric vehicle lithium ion batteries (LIBs) should berecharged in 10minus15 min to be competitive with conventionalcombustion engine vehicles6 The 15 min fast-charge has been atarget set by various government agencies as well as automobilecorporations However introducing fast-charging capabilitiesinto LIBs imposes significant constraints Conventional graphite
negative electrodes plate lithium at low temperatures andorhigh current rates78 For example external temperatureenvironments and varying cycling protocols5 have beenintroduced as possible methods for mitigating lithium platingand meeting fast-charging specifications In particular Wang etal recently demonstrated the use of a 6C charging rate to 80state-of-charge (SOC) with 80 capacity retention over 1700cycles using asymmetrical temperature modulation9 Theirlarge-format electric vehicle pouch cells were selectively heatedupon the fast-charging step and then cooled during the discharge
Received November 4 2020Revised December 17 2020
ArticlepubsacsorgJPCC
copy XXXX American Chemical SocietyA
httpsdxdoiorg101021acsjpcc0c09972J Phys Chem C XXXX XXX XXXminusXXX
Dow
nloa
ded
via
PRIN
CE
TO
N U
NIV
on
Janu
ary
15 2
021
at 0
252
09
(UT
C)
See
http
sp
ubs
acs
org
shar
ingg
uide
lines
for
opt
ions
on
how
to le
gitim
atel
y sh
are
publ
ishe
d ar
ticle
s
step It is likely that asymmetric heating protocols areconcurrently being adopted by various electric vehiclecompanies in attempts to reduce charge timeHerein we provide a mechanistic hypothesis to explain the
outsized impact a moderate increase in temperature has on theability for a ldquostandardrdquo LIB to accept higher charge rates The useof high temperatures and fast-charging marks a departure frompreviously established LIB cycling protocols which stipulatedthat higher temperatures (gt45 degC) should be avoided due todegradation reactions resulting in low cycle life For examplePopov et al10 demonstrated in LiCoO2 (LCO)-based 18650cylindrical cells 70 capacity loss after 490 cycles at 55 degC incontrast with 30 capacity loss at room temperature and 36capacity loss at 45 degC Dubarry et al11 reviewed many of theseprevious studies concluding that LCOgraphite-based chem-istries undergo rapid capacity degradation at high temperaturesalong with high or medium SOC These results were furthersupported by Pecht et al who reported faster degradation inLCO-based 18650 cylindrical cells at higher temperatures12 Atthe same time low temperatures also induce capacity fading dueto higher anode polarization leading to dendritic lithiumdeposition Fast-charging at low temperatures would aggravatelithium deposition even furtherIn this manuscript we first explore the high-temperature fast-
charging cycling protocol as recently introduced by Wang etal913 by comparing the constant current (CC) and constantvoltage (CV) contributions in a constant current constantvoltage (CCCV) charge protocol After verifying the benefits ofhigh temperatures to capacity retention we then conduct a long-term aging study to investigate the effects of both hightemperatures and high SOCs Given the significant impact oftemperature on transport we then conduct diffusivity measure-ments of LCOgraphite pouch cells using the galvanostaticintermittent titration technique (GITT) We extract an effectivediffusivity curve of the full cell as a function of temperature toexplore the relationship between full cell diffusivity SOC andtemperature The full cell diffusivity measurements areconfirmed to be indicative of graphite anode staging throughhalf-cell GITT measurements and differential voltage analysisWe explain why these results suggest the benefits of hightemperature during fast-charging and how higher temperatureenvironments can be utilized while also minimizing increasedaging effects Lastly we take these aging and steady-statediffusivity studies and demonstrate significantly improved ratecapability and fast-charge cycling performance of full cells byavoiding conditions that involve both high temperature and highSOC at the same time
2 EXPERIMENTAL METHODS21 Pouch Cell Properties Cells used for cyclingaging
tests and initial GITT studies were LCOgraphite pouch cells(nominal capacity of 210 mAh size 651 628 obtained from AAPortable Power Corp) LCO electrodes were sonicated in n-methyl-2-pyrrolidone (NMP) and graphite electrodes weresonicated in deionized water the respective slurries were driedin the vacuum oven at 150 degC overnight to obtain the driedpowder for loading and density measurements Cells aremanufacturer rated to 2C cycling ratesAdditional GITT and fast-charging protocol tests were
conducted on 400mAh LCOgraphite from Li-Fun TechnologyCo Ltd (size 482 727 pouch cells Zhuzhou City China) Thecathode was pure LCO Electrolyte was 1 M hexafluorophos-phate (LiPF6) in ethylene carbonate (EC) propylene carbonate
(PC) diethylcarbonate (DEC) (111 vv) with sim2fluoroethylene carbonate (FEC) and 13-propane sultone(PS) additives No other additives or coatings were present inthe electrodes or the electrolyte Cells are manufacturer rated to1C cycling rates Cell properties are listed in Table 1 Loadingand estimated nominal capacity values are per coated area(cm2)
22 Cycling Protocol Cells were cycled on a NewareBTS4000 cycler with the described charge protocol andconstant current discharge The lower current cutoff forCCCV charge protocols was C10 The voltage cutoffs were42 and 27 V Cells were cycled in environmental temperaturechambers with environmental temperature monitored bytemperature sensors and cell surface temperatures bythermistors coupled with the cycler with 01 degC resolutionHalf-cells were assembled from individual electrodes
harvested from the commercial LCOgraphite pouch cellsinside an argon-filled glovebox (O2 lt 05 ppm H2O lt 05 ppm)Typically 127 cm diameter electrode disks were punched outand placed into flooded 2032-coin cells using dual glass fiber(Whatman) polypropylene (Celgard) separators 1 M LiPF6 inethylene carbonate (EC) dimethyl carbonate (DMC) (11 vv) electrolyte (Sigma-Aldrich) and a 750 μm thick Li metalcounter electrode (Sigma-Aldrich) Half-cells were cycled at 1mA using cutoff voltages of 001minus20 V for the anode and 32minus45 V for the cathode with cutoff voltages in reference to Li+Li
23 GITT Protocol Galvanostatic intermittent titrationtesting (GITT) was conducted with 10 min current pulses at C10 followed by a 60 min rest at open circuit potential The half-cell GITT tests followed the same timing with a 01 mA pulsecurrent For accurate measurement of the diffusivity only thesquare root time dependence portion of the transient currentpulse was used This was found by taking a linear regression ofthe transient pulse to find the slope of best fit with best fit judgedby the mean squared error which was lt1 times 10minus4 for alltemperature conditions A slightly higher error was found for thelower-temperature regimes because of the increase in thetransition time before the square root dependence takes holdThe molar volume and molar mass of LCO and graphite wereused for the electrode parameters in calculating the diffusivityThe active material surface area was estimated using BrunauerminusEmmettminusTeller (Micromeritics ASAP 2020 HV BET analyzer)
Table 1 Cell Properties
210 mAh LCOgraphite (AAportable power)
400 mAhLCOgraphite (Li-Fun Technology Co
Ltd)
electrode LiCoO2
graphite (typeunknown) LiCoO2
graphite(artificial)
loading (mgcm2) 179 (est) 140 (est) 200 102density (gcm3) 154 (est) 106 (est) 405 16electrolyte 1 M LiPF6 in ECDMC
(11 vv)1 M LiPF6 inECPCDEC(111 vv) sim2FEC and PS
active materialloading
unknown unknown 985 95
nominal capacity(mAhcm2)
268 (est) 48 (est) 30 35
otheradditivecoatings
unknown unknown none none
The Journal of Physical Chemistry C pubsacsorgJPCC Article
httpsdxdoiorg101021acsjpcc0c09972J Phys Chem C XXXX XXX XXXminusXXX
B
measurements from the sonicated and dried electrode material(245 m2g for LCO 318 m2g for graphite)
3 RESULTS AND DISCUSSION
31 Comparing Capacity Loss between ConstantCurrent and Constant Current Constant Voltage Thecomparison of constant current (CC) and constant currentconstant voltage (CCCV) charging protocols for cycling at a rateof 1C and three different temperature regimes is shown in Figure1 For either the CC or CCCV protocol the low temperature of5 degC results in poor capacity retention at the rate of 1C (Figure1ab) This is attributed to the loss of lithium inventory due tolithium plating at high rates and low temperatures as is wellestablished in the literature14minus17 A full investigation of theeffects of temperature and current rate on the degree of platingfor the cells used in this study can be found in our recentmanuscript using the in operando acoustic technique8 Thecapacity retention for a given cell as shown in Figure 1c anddescribed in this section is defined as the charge capacitymeasured at 1000 cycles vs the initial charge capacity The highcell overpotential at 1C rate and 20 degC causes the constantcurrent voltage to hit the cutoff of 42 V fairly quickly This limitsthe capacity obtained and results in only 15 capacity retentionof the initial capacity after 1000 cycles On the other hand theCCCV charge protocol results in 60 capacity retention of theinitial capacity after 1000 cycles Including a constant voltageportion allows the cell to access additional capacity and reachhigher states-of-charge and this is why conventional cycling
tests utilize a CCCV protocol In contrast the 60 degCenvironment results in lower overpotentials leading tocomparable capacity retention between the CC and CCCVcharge protocols (Figure 1c)A closer analysis of the CCCV charge protocol shown in
Figure 1b provides informative detail about the relationshipbetween time spent at the high voltage and capacity retention ata given temperature Decoupling the CC and CV contributionsto the total charge capacity at 60 degC reveals that over 90 of theinitial capacity is obtained through the CC contribution at thebeginning of cycling (orange markers indicate the CCcomponent of the CCCV protocol at 60 degC) After 1000 cyclesthe CC contribution drops to merely 47 of the initial capacitywhereas the CC charge protocol in Figure 1a still retains 75 ofits initial capacity The high rate capability of the CCCVprotocol is compromised by the CV component during cyclingWhereas the CC protocol begins discharge immediately after the42 V cutoff the CCCV protocol begins discharge much laterdue to the longer CV step during which the cell remains at highSOC until the trickle current cutoff of C10
32 Long-Term Aging Tests at High-Temperature andVarying SOCs To further understand and confirm thedeleterious effects of high SOC and high-temperaturecombinations a long-term aging test was conducted for a totalduration of nearly 15 years Cells were cycled at 1C and CCCVcharge with 72 h duration rest states in between each cycle andheld at either top-of-charge (TOC) or bottom-of-charge(BOC) The results of this aging experiment are depicted in
Figure 1 Long-term cycling protocol and aging tests (a) Charge capacity (Ah) fade of 210mAh commercial LCOgraphite pouch cells (rated for 2C)at constant current (CC) 1C rate and temperature conditions of 5 20 and 60 degC (b) Charge capacity (Ah) fade of 210 mAh commercial LCOgraphite pouch cells at constant current constant voltage (CCCV) 1C rate and the same temperature conditions as (a) CC component of 60degC isdepicted in orange showing faster degradation than the CC cycling protocol in (a) The for 60 degC at cycle 500 indicates a brief pause before restartingthe cycling script whichmay have introduced a cycling artifact and kink in the aging rate (c) Capacity retention at 1000 cycles from the CC andCCCVcycling protocols showing poor capacity retention (lt10) for both protocols at 5 degC significantly poorer retention for CC if conducted at 20 degC (15for CC vs 60 for CCCV) and slightly improved retention for CC (75 for CC vs 70 for CCCV) if conducted at 60 degC (d) Aging test for cells at 520 and 60 degC at either top-of-charge (TOC) or bottom-of-charge (BOC) with a 72 h hold in between each 1C rate cycle
The Journal of Physical Chemistry C pubsacsorgJPCC Article
httpsdxdoiorg101021acsjpcc0c09972J Phys Chem C XXXX XXX XXXminusXXX
C
Figure 1d After nearly 500 days in a 60 degC environment the cellheld at BOC retained approximately 93 of its initial capacityshowing that even in such a high-temperature environmentcapacity losses can be minimized by keeping the cell at lowerSOC In contrast storing at TOC led to less than 50 retentionof initial capacity after only 50 cycles or about 150 days Thehigh-temperature aged cells can be compared with the lower-temperature aged cells where although the capacity fade appearsto be slower less capacity is attained due to the lowertemperature and higher overpotentials The significant variationbetween storage at TOC and BOC at 60 degC is attributed toincreased electrolyte degradation when high-temperaturestorage is paired with high SOC This echoes findings byUmeda et al18 who showed faster onset of a thermal runaway forLCO-type 18650s stored at 80 degC andTOC as opposed to BOCand by Dahn et al19 who showed deleterious effects of highervoltages on overall SOCThese initial results suggest that reducing time spent at both
high SOCs and high temperatures improve capacity retentionrelative to initial capacity for a 1C cycling rate At 60 degC aconstant current charge to the voltage cutoff results in about thesame capacity as a CCCV protocol but with a substantiallyimproved cycle life and could be an effective fast-chargeprotocol After the informative albeit lengthy 500-day experi-ment showing that cells stored at lower SOCs age slower thancells stored at higher SOCs and 60 degC we sought to furtherexplore transport properties of the graphite anode which is also
highly dependent on temperature While graphite anodetransport and diffusivity at higher temperatures have beenexplored in the past the recent emergence of fast-chargeapplications and temperature-dependent properties warrants acloser analysis of the diffusivity curves and how they relate tohigh-temperature fast-charge conditions Here we use GITT tomeasure the diffusivity of both full cells and half-cells todemonstrate a link between the effective full cell diffusivity andindividual electrode diffusivities
33 Analysis of Effective Diffusivity as Measured byGITT The GITT measurements were conducted according toWeppnerrsquos original 1977 paper21 where short pulse galvano-static titration experiments result in a constant equilibriumvoltage leading to the following equation
ikjjjjj
yzzzzz
ikjjjj
yzzzzD
m VM S
EE t
4(d d )
B M
B
2s
2
π τ=
Δtimes
where τ is the current pulse duration mB is the electrode massVM is the molar volume MB is the molar mass S is theelectrochemically active surface area ΔEs is the steady-statevoltage change assuming a sufficiently low current pulse anddEdradict is the slope of the square root time-dependent currentpulse This relation is derived from the solution to Fickrsquos secondlaw equation assuming certain boundary conditions with thesquare root time dependence arising from the assumption ofshort-time current pulses (t ≪ L2D)
Figure 2 GITT and differential analysis for 210 mAh LCOgraphite commercial pouch cells (AA Portable Power) (a) Linear regression fit oftransient voltage vs square root of time during a sample current pulse note that the lowest temperature condition has a noticeable period of time beforeentering the square root time dependence (b) Sample current pulses along with subsequent voltage relaxation steps (c) Box-and-whisker plot ofArrhenius relation (logarithmic diffusivity and inverse temperature) showingmedian and confidence interval with absoluteminimum indicated by thestarred marker which indicates the zenith of the diffusivity trough at around 38 V The relationship appears non-Arrhenius with a steeper drop-off ofdiffusivity below 40 degC (d)Diffusivity curves fromGITT for all temperature conditions (e) dQdV (AhV) of the initial C20 cycle immediately priorto the GITT charge test for all temperatures (f) dVdQ (VAh) of the initial C20 cycle immediately prior to the GITT charge test for alltemperatures Note that differential curves were shifted in the y-direction by 1 AhV to clearly show each curve
The Journal of Physical Chemistry C pubsacsorgJPCC Article
httpsdxdoiorg101021acsjpcc0c09972J Phys Chem C XXXX XXX XXXminusXXX
D
While GITT tests are conventionally conducted on half-cells2021 to investigate the diffusivity of one electrode inreference to a lithium metal reference a recent study byCabanero et al22 suggested that the full cell GITT diffusivityvalues could be attributed mainly to the graphite electrode atlower SOCs and to the cathode at higher SOCs due to thedifferences between the two voltage profiles at lower and higherSOCs Dees et al showed that diffusivity values of the graphiteanode should agree within an order of magnitude20 and manypublished reports appear to measure relatively similar values22
with differences arising from the measurement of electro-chemical surface area As explained in the next sectionindividual measurements of anode and cathode half-cells suggestthat the diffusion troughs observed in full cell effective diffusivitycurves can be matched to the graphite anode half-cells as well asthe graphite phase transition peaks in differential analysisGITT was conducted on the 210 mAh pouch cells in
temperature environments ranging from 0 to 60 degC in 10 degCincrements where temperature sensors of the cell surfaceshowed that the surface temperature did not deviate much fromthe environmental temperature This is because the currentpulses use a low rate of C10 and have a short duration of 10min as consistent with other GITT reports elsewhere Thesquare root time dependence of the galvanostatic current pulsewas found by implementing a linear regression vs the square root
of time (Figure 2a) Lower temperatures were observed to havea longer transition period (sim100 s for the 0 degC condition) beforeentering the square root time-dependent relationship Thesubsequent relaxation step was confirmed to be of adequateduration for the cell to reach near steady state with changes inthe voltage being negligible or on the order of noise (lt1 mVh)as shown in Figure 2b The Arrhenius plot of logarithmicdiffusivity and the inverse temperature are plotted in Figure 2cwhere the relationship between the full cell diffusivity andtemperature deviates from linearity The box-and-whisker plotshows the spread of diffusivity including the median andconfidence interval with the starred markers indicating theminimum diffusivity value that corresponds to the primarydiffusion trough around 38 V The slope of the Arrhenius plotdecreases at higher temperatures indicating a possible change inthe activation energy (Figure 2c) Note that the calculateddiffusivity measurements here are within the same range of10minus9minus10minus11 cm2s for the graphite diffusivity in priorstudies2324 The diffusivity curves as a function of voltage areshown in Figure 2d where the primary diffusion trough isobserved at 38 V along with several minor troughs at higherSOCs These correlate with the peaks observed in differentialanalysis (Figure 2ef) which correspond to graphite phasetransitions Interestingly the differential analysis indicates extrapeaks at temperatures above 40 degC notably between 375 and
Figure 3 GITT and differential capacity analysis for 400 mAh Li-Fun LCOgraphite pouch cells (Li-Fun) Multiple cells were tested at eachtemperature condition with temperature monitored by thermistors on the pouch cell surface (a) Box-and-whisker plot of Arrhenius relation(logarithmic diffusivity and inverse temperature) showing median and confidence interval The median diffusivity appears linear and Arrheniuswhereas the minimum diffusivity appears non-Arrhenius (b) Diffusivity curves fromGITT of all cells tested with local minima labeled AminusE Note thesignificantly depressed diffusivity trough for point C (stage 2L2) at lower temperatures (c) Calculated activation energies from linear fit trendlines forthe primary diffusivity trough located at near 38 V for the two different temperature regimes indicating a doubling of the activation energy from high tolow temperatures (d) Corresponding dQdV of C10 constant current cycle immediately prior to GITT with peaks corresponding to graphite two-phase regions and also correlated with GITT diffusivity troughs Note that the differential peaks in (d) were shifted in the y-direction by 1 AhV toclearly show the trends in each individual curve (e) Comparison of the diffusivity curve and dQdV for a cell at 55 degC showing the correlation ofdiffusivity minima with dQdV peaks
The Journal of Physical Chemistry C pubsacsorgJPCC Article
httpsdxdoiorg101021acsjpcc0c09972J Phys Chem C XXXX XXX XXXminusXXX
E
38 V A closer investigation of the diffusivity curves in Figure 2dshows that the extra peak immediately below 38 V as seen inFigure 2e seems to also arise in the diffusivity curve A similarcurvature of the Arrhenius plot was observed in a larger format1500 mAh pouch cell from the same supplier (AA PortablePower) shown in Figure 4aTo confirm the trends extracted from commercial cells with
proprietary additive compositions we applied the same GITTstudy at varying temperatures between 5 and 55 degCwith a LCOgraphite pouch cell (nominal capacity of 400 mAh pure LCOartificial graphite) manufactured with known compositions Themanufacturer of these cells (Li-Fun Technology Co LtdZuzhouCity China) has been extensively tried and tested by theDahn research group The tested batch of cells use pure LCOwithout surface coatings as the cathode artificial graphite as theanode and 1 M LiPF6 in ECDECPC (111 vv) with sim2FEC and PS which improve capacity retention at 55 degC cyclingas investigated by Lucht et al25 Both FEC and PS result in lowerimpedance and alter the composition of the solidminuselectrolyteinterphase (SEI) with PS resulting in lithium alkylsulfonateformation and inhibition of ethylene gassing The use of a knowntemperature-stable electrolyte composition along with pureLCO and a high manufacturer-rated voltage cutoff of 435 Vallows for a diffusivity study without significant degradationeffects conflating the results The GITT results confirmed thenon-Arrhenius trend observed for commercial cells as in Figure2 For improved fidelity three cells were tested at 10 differenttemperatures in increments of 5 degC instead of 10 degC Themeasured pouch cell surface temperature was plotted against themeasured diffusivity The dEdradict term was accuratelymeasured by fitting a linear regression line to the square roottime dependence in the transient pulse and the ΔEs term wasfound by taking the average steady-state voltage during therelaxation stepThe GITT results confirm that higher temperatures increase
diffusivity at all states-of-charge (Figure 3b) This is especiallyapparent with the large diffusion trough present at lowertemperatures between 385 and 390 V (point C) Thecorrelation of diffusion troughs with peaks in differential analysisand graphite stage transitions was first explored by Dahn andAurbach2426 Lithiation of the initial dilute solid solution (stage1L x sim 004minus007) results in stage 4L (x sim 012) at around 37V followed closely by stage 3L (x sim 021) to a liquidlike stage2L phase to stage 2 (x sim 05) and finally stage 1 at highSOC2627 Comparing these initial results to our study we findthat the main diffusion trough at around 385 V or 35 SOC(point C) can be assigned to the stage 2L2 transition Themagnitude of this trough increases by over an order ofmagnitude with higher temperatures from around 7 times 10minus13
cm2s at 5 degC to 1 times 10minus11 cm2s at 55 degCThe diffusivity troughs in Figure 3b can be further compared
with dQdV peaks in Figure 3d At 55 degC there are threesimilarly sized diffusivity troughs at low states of lithiation(points AminusC) assigned to stage 4L3L stage 3L2L and stage2L2 phase transitions The dQdV curves in Figure 3d showthree peaks that are present at high temperatures but absent atlow temperatures as also reported by Aurbach28 dQdV peaksindicate two-phase regions of graphite staging At 5 degC we stillobserve point A and point B in the diffusivity curves with pointC exhibiting a significantly lower diffusivity This suggests thatlower temperatures hinder the staging process through thesephases and may be why only one large differential capacitancepeak is observed at lower temperatures At higher SOCs we
attribute point D to a LCOphase change and point E to the stage21 transition Lastly there is less variability in diffusivity acrossall SOCs at higher temperatures The 55 degC condition rangesbetween 1 times 10minus11 and 4 times 10minus11 cm2s as opposed to 7 times10minus13minus1 times 10minus11 cm2s at 5 degCFigure 3a indicates that the median diffusivity as plotted by a
box-and-whisker plot is roughly linear The linear logarithmicdiffusivity vs inverse temperature trend indicates Arrheniusbehavior of the overall diffusivity with a single activation energyat any given temperature However we note an interestingdeviation from this linearity with the minimum diffusivity Theminimum diffusivity exhibits a clear non-Arrhenius trend(Figure 3c) The higher temperatures above 40 degC follow alinear fit that has a lower slope than the lower temperaturesbelow 40 degC This suggests two different activation energieswith the lower-temperature regime measuring twice theactivation energy for the stage 2L2 transition Thereforethere is a fundamental change in the diffusion mechanism ofgraphite staging here with higher temperature significantlyreducing the diffusivity bottleneck that is present at coldertemperatures While several recent studies present Arrheniusbehavior between diffusivity and temperature those studieswere generally conducted up to 30 degC and no higher which isprobably why this nonlinear regime was not observed22 Thenon-Arrhenius trend shown here is reminiscent of earlier reportsby Aurbach et al2728 describing a non-Arrhenius diffusivitytrend with measurements up to 80 degC where those studies wereconducted using the potentiostatic intermittent titrationtechnique (PITT) and explained with a lattice gas modelHowever galvanostatic pulses rather than potentiostaticgenerally have improved fidelity especially within the graphitephase transitions that occur fast in a small range of differentialcapacities Aurbach claimed that this temperature-dependentdiffusion barrier may stem from a change in the type of short-range interactions of the intercalated lithium ionsWhy do the recent demonstrations9 of fast-charging at high
temperatures work so well despite the increase in electrolytedegradation that occurs in conventional carbonate-basedelectrolytes We show that significant diffusivity bottleneckswithin stage 2L2 are alleviated as temperature changes from 25degC to just above 40 degC therebymitigating the chance for lithiumplating The location of the stage 2L2 diffusivity trough is at thelowest point of the entire diffusivity curve at around 38 V or30 SOC After approximately 45 degC the benefits of increasedtemperature are less dramatic due to the trends outlined in thiswork This is also where recent work has demonstrated platingmay begin to occur during 2C or higher charge rates Forexample Konz et al29 observed plating signatures at rates higherthan 2C with differential open-circuit voltage (OCV) at around50 SOC and an increase in graphite SEI resistance at around30 SOC Bommier et al8 observed a reversal in the acoustictime-of-flight shift when plating occurs generally around 30SOC The exact location of the time-of-flight shift which is afunction of cell thickness and modulus changes depends on rateand temperature Fear et al30 observed with graphite half-cells aconsistent voltage minimum near 45 SOC attributed tolithium plating at 0 degC They conducted optical microscopyshowing localized plating occurring between 20 and 40 SOCThese studies are all in agreement with the onset of platingoccurring at the stage 2L2 diffusivity bottleneck In agreementwith these studies the diffusivity curves for both types of cellsand a third type are replotted as a function of SOC in Figure4bminusd which all show that this minimum diffusivity is located
The Journal of Physical Chemistry C pubsacsorgJPCC Article
httpsdxdoiorg101021acsjpcc0c09972J Phys Chem C XXXX XXX XXXminusXXX
F
between 20 and 40 SOC Slight variations may be due tovarying degrees of normalization of the state-of-charge and slightdifferences in chemistry in the commercial cells that would alterthe charge endpoint capacity at the voltage cutoffIn combination with our initial cycling protocol studies which
indicated the decreased aging rate of cells stored for 15 years atlower SOCs as opposed to higher SOCs we can take advantageof certain fast-charging protocols to avoid both high SOC andhigh-temperature conditions For example we showed that aconstant current charge at 60 degC results in nearly the samecapacity as a constant current constant voltage charge due to thelower overpotentials at 60 degC A constant current charge alsoavoids time spent at the high SOC as in a constant voltageprotocol and would delay the degradation observed at thoseconditions To further minimize duration spent at both hightemperature and high SOC the cells can be selectively heatedimmediately prior to and during the charge step Since aconstant current fast-charge of 2C occurs in less than 30 min (ora fast-charge of 5C which would occur in less than 12 min) theduration of time spent at high temperature would be short Thismechanistic analysis explains why the selective heating protocolas introduced by Wang et al9 resulted in significantly improvedcapacity retention of fast-charged cells34 Further Investigation of Anode and Cathode Half-
Cells One challenge with GITT studies of full cells is thedifficulty in decoupling anode and cathode contributions to thediffusivity However a recent study by Cabanero et al22
suggested that the lower states-of-charge of a full cell canapproximate graphite diffusivities and the higher states-of-charge the cathode diffusivities This is primarily because thecathode half-cell has a nearly flat voltage profile at lower states-of-charge whereas the graphite half-cell voltage profile flattens atthe higher voltages To confirm which electrode contributedmore to the diffusivity troughs observed at lower temperaturesboth anode and cathode half-cells were made from disassem-bling the original pouch cells and cycled at a current rate of 1mAcm2 For the graphite half-cells a steep drop-off in capacitywas observed between the 30 and 20 degC increments from sim30
mAhcm2 to less than 1 mAhcm2 (Figure 5a) This is also therange where the activation energy was observed to change asobserved by the change in the slope of the Arrhenius plot inFigures 2c and 3c The anodes at 0 degC had negligible capacityand are not included in the plot For the cathode half-cellstemperature does not drastically affect the capacity whichremains steady at around 35 mAhcm2 regardless of thetemperature (Figure 5b) These half-cell results confirm that thegraphite anode exhibits faster capacity fade than the LCOcathode at temperatures of 30 degC or lower and further supportsthat diffusivity bottlenecks within stages 2L2 causes thisreduction in capacity The half-cell at 30 degC starts at a highcapacity on the first cycle but then experiences a sudden drop incapacity which may be due to a plating event The half-cell at 20degC starts at a low capacity immediately signaling poor transportat this temperature These results show that the graphite half-cellexperiences greater capacity loss at low temperatures whencompared with the LCOhalf-cell which further suggests that thegraphite anode rate capability is more susceptible than thecathode to diffusivity bottlenecks at lower temperaturesGITT measurements were then conducted on the half-cells at
temperatures of 60minus10 degC (Figure 5cd) For the graphite anodehalf-cell the diffusivity curve shows the presence of two majordiffusion troughs around 008 and 011 V vs Li+Li (Figure 5e)These two troughs are attributed to the stage 2 to stage 1 (pointD) and stage 2L to stage 2 (point C) transitions respectively InFigure 5g where the same GITT is plotted as a function of SOCpoint C is located between 20 and 40 SOC which agrees withthe full cell diffusivity curves and the prior discussion on platingonset occurring within this range The minimum diffusivity ascalculated from half-cell data may be more difficult to ascertaindue to the increased noise observed The wide trough in Figure5e at the low state of lithiation at 022 V (unlabeled) is attributedto the stage 1L to stage 4L transition At higher temperaturestwo small troughs are observed between 014 and 017 V vs Li+Li The trough at 014 V has previously been attributed to thestage 3L to stage 2L transition (point B) The trough at 017 V isassigned to the stage 4L to stage 3L transition (point A) These
Figure 4Minimum diffusivity between 20 and 40 state-of-charge (a) Arrhenius plot and (b) diffusivity curve from GITT of larger LCOgraphitepouch cells (1500 mAh AA Portable Power) showing the non-Arrhenius trend of the minimum diffusivity Diffusivity curves replotted as a function ofstate-of-charge normalized to that of the cold temperature charge endpoint capacity showing that the minimum diffusivity occurs between 20 and 40SOC for all cell types and temperatures tested (c) Li-Fun Tech 400 mAh pouch cells and (d) AA Portable Power 210 mAh pouch cells
The Journal of Physical Chemistry C pubsacsorgJPCC Article
httpsdxdoiorg101021acsjpcc0c09972J Phys Chem C XXXX XXX XXXminusXXX
G
troughs also correspond to points A and B observed in the fullcell GITT (Figure 3b) confirming that the observed diffusivitytroughs are primarily due to graphite intercalation bottlenecksrather than cathode effects Points A and B in both Figure 3b(full cell diffusivity) and Figure 5e (anode diffusivity) are lessdistinguishable at low temperatures but more noticeable athigher temperaturesSimilarly GITT was conducted on the cathode half-cells
(Figure 5fh) The diffusivity values are less dependent ontemperature with about 05 times 10minus10 cm2s difference in theendpoints As expected there are no significant diffusivitytroughs with temperature with the diffusivity profile beingnearly flat through the entire range of charge Theminor troughsat around 408 and 417 V are attributed to several phasetransitions of the LCO cathode at high SOCs (sim50 and 70SOC)31
35 Fast-Charge Cycling Protocol The GITT resultsindicate that temperatures above 40 degC significantly change theactivation energy of the stage 2L to 2 transition The half-cellexperiments confirm that the bypass of the large diffusivitytrough in this region is linked to the significant increase in anoderate capability The sensitivity of graphite staging to temperature
can be determined from the full cell GITT without a three-electrode cell Taking these mechanistic insights a proof-of-concept was introduced to demonstrate the improved fast-charging capabilities at higher temperatures while minimizingduration spent at high SOCs The 210 mAh commercial cellmanufacturer rated for 2C was charged at a current rate of 5Cusing a CC protocol in a 60 degC environment (Figure 6a) A CCprotocol instead of a CCCV protocol limits the time spent at thehigh-voltage cutoff while in the 60 degC environment As shownearlier at 60 degC a CC charge recovers most of the capacity thatwould be recovered by a CCCV charge and also results inimproved capacity retention over cycling Over 500 cycles of a4minus5 min 5C charge and 1C discharge the cell was able to reachroughly 30 SOC per cycle While short of a full charge thisdemonstrates the cell could be cycled at a much faster chargethan the 2C rating just with simple changes to the cyclingprotocol A 5C charge rate showed negligible capacity at roomtemperature indicating the significant impact of high-temper-ature environments on fast-charging capabilitiesThe fast-charging high-temperature protocol was replicated
for the 400 mAh Li-Fun cells which were manufacturer rated for1C While these cells could not be appreciably charged at rates
Figure 5Half-cell capacity and diffusivity measurements (a) Graphite anode half-cell delithiation capacities (mAhcm2) for 10 cycles at a current rateof 1 mAcm2 and (b) LCO cathode half-cell delithiation capacities (mAhcm2) for 10 cycles at a current rate of 1 mAcm2 Graphite half-cell showslow capacities due to diffusivity limitations below 40 degC at the current rate tested whereas the LCOhalf-cell is not significantly affected by temperature(c) GITT protocol for the graphite anode half-cell with the inset showing a representative transient and relaxation pulse (d) GITT protocol for theLCO cathode half-cell with the inset showing a representative transient and relaxation pulse (e) Diffusivity curve (cm2s) for graphite anode half-cellwhere point A marks stage 4L to 3L point B marks stage 3L to stage 2L point C marks stage 2L to stage 2 and point D marks stage 2 to stage 1 (f)Diffusivity curve for LCO cathode half-cell (g) Diffusivity curve for the graphite anode as a function of SOC showing that point C (stage 2L2)corresponds to the primary diffusivity bottleneck in the full cell (Figure 3b) and also occurs between 20 and 40 SOChere (h) Diffusivity curve for theLCO cathode as a function of SOC showing two small troughs corresponding to LCO phase transitions at around 50 and 70 SOC
The Journal of Physical Chemistry C pubsacsorgJPCC Article
httpsdxdoiorg101021acsjpcc0c09972J Phys Chem C XXXX XXX XXXminusXXX
H
2C or higher at room temperature due to instantly hitting thevoltage cutoff of 435 V a temperature environment of 55 degC(with ameasured cell surface temperature reaching 60 degC duringthe fast-charge) allowed the cells to charge at a rate of 3C(Figure 6b) The constant current 3C charge at 55 degC takesabout 10 min before hitting the voltage cutoff and attains over60 SOC during that time This is not too far from the goal of80 SOC with a 15 min charge time With a CCCV chargeprotocol the benefits of higher temperatures to capacityretention are not as clear (Figure 6c) The improvement incapacity retention is clear when comparing CC and CCCVcharge protocols at low temperatures However at 55 degC theCCCV charged cell has a lower capacity than the CC chargedcell after 300 cycles A CC charge protocol minimizes durationspent at high SOCs and temperatures above 40 degC result inenhanced cycle life when compared with the CCCV protocolThe different staging mechanism observed at gt40 degC that
causes a non-Arrhenius diffusivity trend does not take intoaccount other effects such as fast-charging inhomogeneity andgreater SEI decomposition Fast-charge rates result insignificantly higher overpotentials with buildup of lithiationfronts near the separator side of the graphite electrode and alsoinhomogeneous staging at the particle level3233 As recentlydemonstrated by Finegan et al32 a significant lithiation frontdevelops during a 6C charge and only the surface of the graphiteelectrode nearest the separator underwent any transition to stage3L or stage 22L As a result of the faster diffusivity at 60 degCespecially within the deep stage 2L2 trough the lithiation frontsobserved in single particles as well as the entire electrode byFinegan et al may be overcome more easily resulting in highercapacities and deeper degrees of lithiation while minimizingplating In parallel with these electrochemical analyses Canas etal34 recently demonstrated with in situ X-ray diffraction (XRD)a more homogeneous graphite phase transition process ataround 47 degC with an increased overlap of several differentphases Bauer et al35 also demonstrated with dilation measure-ments that graphite lithiation occurs in a multiphase process atboth high current rates and low temperatures Regarding platinglikelihood within or after the stage 2L2 transition variousmeasurement techniques including differential OCV analysis29
acoustic time-of-flight shifts8 and optical microscopy30 have allpointed toward significant lithium plating to occur between 30and 50 SOC during 3C and higher fast-charge ratesWhile fast-charging presents a situation that is much further
from equilibrium than GITT studies high-temperature fast-charge rates should still reduce graphite anode diffusivity energybarriers The much greater internal temperature rise due to thefast-charge should be taken into account when controlling theenvironmental temperature though this is out of the scope ofthe current study This internal temperature rise most likelycontributes to observed diffusivity values of high rates that arehigher than would be expected by GITT as recently shown byDees et al36 The lt2 Ah pouch cells in the current studymeasured about 10 degC higher on the surface than thetemperature chamber during the fast-charge For larger gt2 Ah-size commercial cells improved thermal management systemscan be used for monitoring the even more significant rise intemperature upon fast-charging and taking advantage of aselective heating protocol to improve diffusivity whileminimizing degradation Future extension of this high-temper-ature fast-charge mechanism should continue to use high-temperature stable electrolytes37 that meet the cost andscalability requirements for practical adoption
4 CONCLUSIONSIn short we present a diffusivity argument to explain why high-temperature conditions aid the fast-charging capabilities ofconventional LCOgraphite pouch cells
(1) We first demonstrate that the additional capacityextracted from the constant voltage charge step at 25 degCbecomes less significant at 60 degC where CC and CCCVcharge protocols retain similar capacities This suggeststhe possibility of utilizing a constant current chargeprotocol at high temperatures to obtain sufficient capacityby taking advantage of lower overpotentials and less timespent at higher states-of-charge Long-term aging studiesover the course of 15 years show slower aging rates at 60degC when stored at bottom-of-charge as compared to top-of-charge
Figure 6 High-temperature fast-charge cycling protocol (a) Fast-charge protocol of 210 mAh pouch cells (AA Portable Power rated for 2C) at 5Ccharge demonstrating greatly enhanced rate capability at 60 degC over 500 fast-charge cycles (b) Fast-charge protocol with 400 mAh Li-Fun cells (ratedfor 1C) at constant current 3C charge demonstrates enhanced capacity retention up to 60 SOC at an elevated temperature of 55 degC (c) Constantcurrent constant voltage 3C charge demonstrates enhanced capacity retention at 35 degC but faster capacity fades beyond 35 degC At 55 degC the CCCVcell degrades faster than the CC cell despite starting at a higher capacity due to the constant voltage step
The Journal of Physical Chemistry C pubsacsorgJPCC Article
httpsdxdoiorg101021acsjpcc0c09972J Phys Chem C XXXX XXX XXXminusXXX
I
(2) Careful statistically confirmed GITT measurements ofdifferent LCOgraphite pouch cells demonstrate a non-Arrhenius relationship between the minimum celldiffusivity and cell temperature Diffusivity measurementsfrom GITT indicate a change in the diffusion mechanismof the graphite stage 2L to 2 transitions at around 40 degCas measured by a doubling of the activation energy atlower temperatures All diffusivity troughs are correlatedwith differential capacity peaks where graphite phasetransitions occur though some of the differential capacitypeaks are not discernible at low temperatures GITT anddifferential analysis are then conducted on individual half-cells to show how full cell diffusivity can be related to thegraphite stage transitions The improvements in thediffusivity of the stage 2L2 transition around 30 SOCexplain why higher temperatures mitigate lithium plating
(3) This concept of utilizing high temperatures while avoidingtime spent at high voltages to bypass graphite diffusivitytroughs and minimize electrolyte degradation is thenapplied to a high-temperature fast-charge protocol A 3Cconstant current charge protocol at 55 degC results in over60 capacity retention in under 15 min whereas the samecells could not be charged faster than 1C at 25 degC Thisapproaches the accepted target of 80 SOC in 15 min orless Over the course of 400 fast-charge cycles at 55 degCthe constant current protocol retains the same capacity asa constant current constant voltage protocol
These results help to explain some recent demonstrations ofeffective high-temperature fast-charge protocols both inacademia and industry Proper temperature controls canmitigate unwanted lithium deposition by enhancing celldiffusivity through heating The non-Arrhenius behavior ofgraphite lithiation at high temperatures deviates from conven-tionally understood temperature-dependent phase behaviorand more fundamental mechanistic studies should be under-taken to study the 40minus60 degC temperature range for fast-charginglithium-ion batteries
AUTHOR INFORMATIONCorresponding AuthorDaniel Steingart minus Department of Mechanical and AerospaceEngineering Andlinger Center for Energy and theEnvironment and Department of Chemical and BiologicalEngineering Princeton University Princeton New Jersey08544 United States Department of Earth andEnvironmental Engineering Department of ChemicalEngineering and Columbia Electrochemical Energy CenterColumbia University New York 10027 United Statesorcidorg0000-0002-8184-9641 Email dansteingart
columbiaedu
AuthorsWesley Chang minus Department of Mechanical and AerospaceEngineering and Andlinger Center for Energy and theEnvironment Princeton University Princeton New Jersey08544 United States Department of Chemical Engineeringand Columbia Electrochemical Energy Center ColumbiaUniversity New York 10027 United States orcidorg0000-0002-9389-1265
Clement Bommier minus Andlinger Center for Energy and theEnvironment Princeton University Princeton New Jersey08544 United States Columbia Electrochemical EnergyCenter Columbia University New York 10027 United States
Robert Mohr minus Department of Chemical Engineering andColumbia Electrochemical Energy Center ColumbiaUniversity New York 10027 United States
Complete contact information is available athttpspubsacsorg101021acsjpcc0c09972
Author ContributionsnablaWC and CB contributed equally to this work
NotesThe authors declare no competing financial interest
ACKNOWLEDGMENTSWC and CB were supported by Mercedes Benz Research andDevelopment North America CB was supported by thePrinceton IP Accelerator Fund RM was supported by a grantfrom ARPA-E
REFERENCES(1) Tomaszewska A Chu Z Feng X OrsquoKane S Liu X Chen JJi C Endler E Li R Liu L et al Lithium-Ion Battery FastCharging A Review eTransportation 2019 1 No 100011(2) Schmuch R Wagner R Horpel G Placke T Winter MPerformance and Cost of Materials for Lithium-Based RechargeableAutomotive Batteries Nature Energy 2018 3 267minus278(3) Yang X-G Wang C-Y Understanding the Trilemma of FastCharging Energy Density and Cycle Life of Lithium-Ion Batteries JPower Sources 2018 402 489minus498(4) BloombergNEF Bloomberg Electric Vehicle Outlook 2020 2020httpsefilingenergycagovgetdocumentaspxtn=233410(5) Mussa A S Klett M Behm M Lindbergh G Lindstrom RW Fast-Charging to a Partial State of Charge in Lithium-Ion BatteriesA Comparative Ageing Study J Energy Storage 2017 13 325minus333(6) Keyser M Pesaran A Li Q Santhanagopalan S Smith KWood E Ahmed S Bloom I Dufek E Shirk M et al EnablingFast Charging minus Battery Thermal Considerations J Power Sources2017 367 228minus236(7) Waldmann T Wilka M Kasper M Fleischhammer MWohlfahrt-Mehrens M Temperature Dependent Ageing Mechanismsin Lithium-Ion Batteries minus A Post-Mortem Study J Power Sources2014 262 129minus135(8) Bommier C Chang W Lu Y Yeung J Davies G Mohr RWilliams M Steingart D In Operando Acoustic Detection of LithiumMetal Plating in Commercial LiCoO2Graphite Pouch Cells Cell RepPhys Sci 2020 1 No 100035(9) Yang X-G Liu T Gao Y Ge S Leng YWang DWang C-Y Asymmetric Temperature Modulation for Extreme Fast Charging ofLithium-Ion Batteries Joule 2019 3 3002minus3019(10) Ramadass P Haran B White R Popov B N Capacity Fadeof Sony 18650 Cells Cycled at Elevated Temperatures Part I CyclingPerformance J Power Sources 2002 112 606minus613(11) DubarryM Qin N Brooker P Calendar Aging of CommercialLi-Ion Cells of Different Chemistries minus A Review Curr OpinElectrochem 2018 106minus113(12) Leng F Tan C M Pecht M Effect of Temperature on theAging Rate of Li Ion Battery Operating above Room Temperature SciRep 2015 5 No 12967(13) Yang X-G Zhang G Ge S Wang C-Y Fast Charging ofLithium-Ion Batteries at All Temperatures Proc Natl Acad Sci USA2018 115 7266minus7271(14) Li Y Qian K He Y-B Kaneti Y V Liu D Luo D Li HLi B Kang F Study on the Reversible Capacity Loss of Layered OxideCathode during Low-Temperature Operation J Power Sources 2017342 24minus30(15) Matadi B P Genies S Delaille A Chabrol C de Vito EBardet MMartin J-F Daniel L Bultel Y Irreversible Capacity Lossof Li-Ion Batteries Cycled at Low Temperature Due to an Untypical
The Journal of Physical Chemistry C pubsacsorgJPCC Article
httpsdxdoiorg101021acsjpcc0c09972J Phys Chem C XXXX XXX XXXminusXXX
J
Layer Hindering Li Diffusion into Graphite Electrode J ElectrochemSoc 2017 164 A2374(16) Zinth V von Luders C Hofmann M Hattendorff JBuchberger I Erhard S Rebelo-Kornmeier J Jossen A Gilles RLithiumPlating in Lithium-Ion Batteries at Sub-Ambient TemperaturesInvestigated by in Situ Neutron Diffraction J Power Sources 2014 271152minus159(17) Ouyang M Chu Z Lu L Li J Han X Feng X Liu G LowTemperature Aging Mechanism Identification and Lithium Depositionin a Large Format Lithium Iron Phosphate Battery for Different ChargeProfiles J Power Sources 2015 286 309minus320(18) Taniguchi S Shironita S Konakawa K Mendoza-HernandezO S Sone Y Umeda M Thermal Characteristics of 80 degC Storage-Degraded 18650-Type Lithium-Ion Secondary Cells J Power Sources2019 416 148minus154(19) Fathi R Burns J C Stevens D A Ye H Hu C Jain GScott E Schmidt C Dahn J R Ultra High-Precision Studies ofDegradation Mechanisms in Aged LiCoO2graphite Li-Ion Cells JElectrochem Soc 2014 161 A1572minusA1579(20) Dees DW Kawauchi S Abraham D P Prakash J Analysis ofthe Galvanostatic Intermittent Titration Technique (GITT) as Appliedto a Lithium-Ion Porous Electrode J Power Sources 2009 189 263minus268(21) Weppner W Huggins R A Determination of the KineticParameters of Mixed-Conducting Electrodes and Application to theSystem Li3Sb J Electrochem Soc 1977 124 1569(22) Cabanero M A Boaretto N Roder M Muller J Kallo JLatz A Direct Determination of Diffusion Coefficients in CommercialLi-Ion Batteries J Electrochem Soc 2018 165 A847(23) Yang H Bang H J Prakash J Evaluation of ElectrochemicalInterface Area and Lithium Diffusion Coefficient for a CompositeGraphite Anode J Electrochem Soc 2004 151 A1247(24) Levi M D Aurbach D Diffusion Coefficients of Lithium Ionsduring Intercalation into Graphite Derived from the SimultaneousMeasurements and Modeling of Electrochemical Impedance andPotentiostatic Intermittent Titration Characteristics of Thin GraphiteElectrodes J Phys Chem B 1997 101 4641minus4647(25) Zhang B Metzger M Solchenbach S Payne M Meini SGasteiger H A Garsuch A Lucht B L Role of 13-Propane Sultoneand Vinylene Carbonate in Solid Electrolyte Interface Formation andGas Generation J Phys Chem C 2015 119 11337minus11348(26) Dahn J R Phase Diagram of Li X C 6 Phys Rev B CondensMatter Mater Phys 1991 44 9170(27) Levi M D Wang C Markevich E Aurbach D Chvoj ZNoteworthy Electroanalytical Features of the Stage 4 to Stage 3 PhaseTransition in Lithiated Graphite J Solid State Electrochem 2003 8 40minus43(28) Levi M D Wang C Aurbach D Chvoj Z Effect ofTemperature on the Kinetics and Thermodynamics of ElectrochemicalInsertion of Li-Ions into a Graphite Electrode J Electroanal Chem2004 562 187minus203(29) Konz Z M McShane E J McCloskey B D Detecting theOnset of Lithium Plating and Monitoring Fast Charging Performancewith Voltage Relaxation ACS Energy Lett 2020 5 1750minus1757(30) Fear C Adhikary T Carter R Mistry A N Love C TMukherjee P P In Operando Detection of the Onset and Mapping ofLithium Plating Regimes during Fast Charging of Lithium-IonBatteries ACS Appl Mater Interfaces 2020 12 30438minus30448(31) Amatucci G G Tarascon J M Klein L C CoO2 The EndMember of the LixCoO2 Solid Solution J Electrochem Soc 1996 1431114(32) Finegan D P Quinn AWragg D S Colclasure A M Lu XTan C Heenan T M M Jervis R Brett D J L et al SpatialDynamics of Lithiation and Lithium Plating during High-RateOperation of Graphite Electrodes Energy Environ Sci 2020 132570minus2584(33) Yao K P C Okasinski J S Kalaga K Shkrob I A AbrahamD P Quantifying Lithium Concentration Gradients in the Graphite
Electrode of Li-Ion Cells Using Operando Energy Dispersive X-RayDiffraction Energy Environ Sci 2019 12 656minus665(34) Canas N A Einsiedel P Freitag O T Heim C SteinhauerM Park D W Friedrich K A Operando X-Ray Diffraction duringBattery Cycling at Elevated Temperatures A Quantitative Analysis ofLithium-Graphite Intercalation Compounds Carbon 2017 116 255minus263(35) Bauer M Wachtler M Stowe H Persson J V Danzer M AUnderstanding the Dilation and Dilation Relaxation Behavior ofGraphite-Based Lithium-Ion Cells J Power Sources 2016 317 93minus102(36) Dees D W Rodrigues M-T F Kalaga K Trask S EShkrob I A Abraham D P Jansen A N Apparent IncreasingLithium Diffusion Coefficient with Applied Current in Graphite JElectrochem Soc 2020 167 No 120528(37) Logan E R Dahn J R Electrolyte Design for Fast-Charging Li-Ion Batteries Trends Chem 2020 2 354minus366
The Journal of Physical Chemistry C pubsacsorgJPCC Article
httpsdxdoiorg101021acsjpcc0c09972J Phys Chem C XXXX XXX XXXminusXXX
K
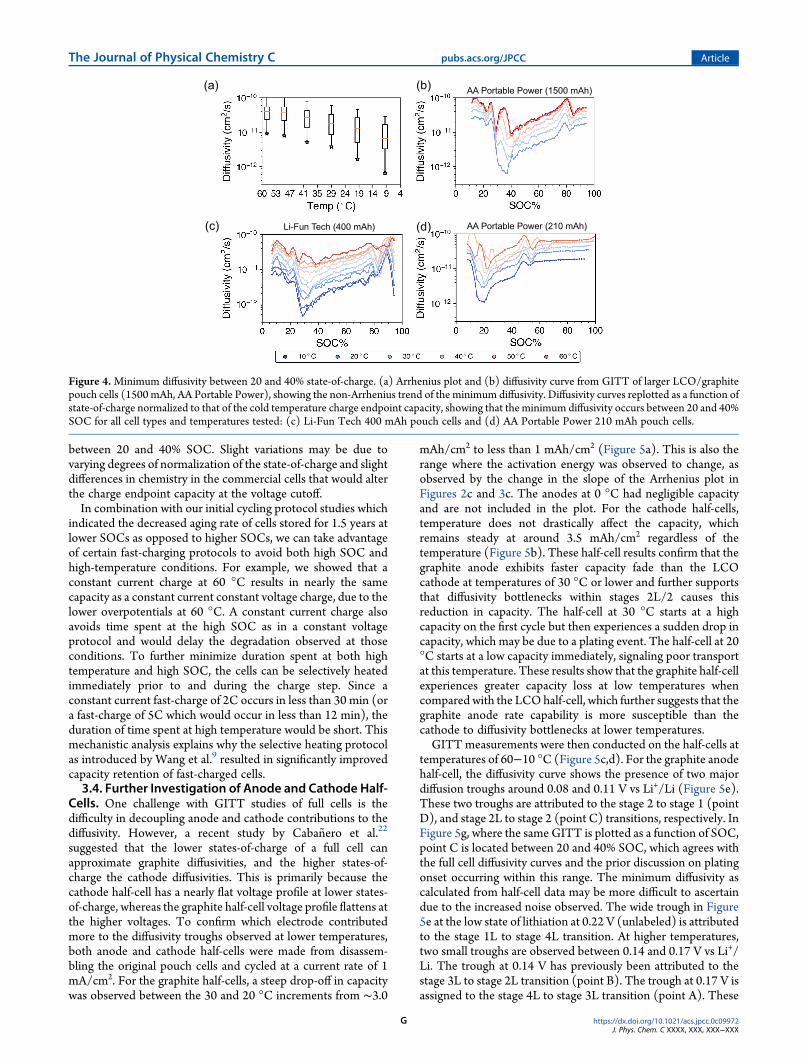
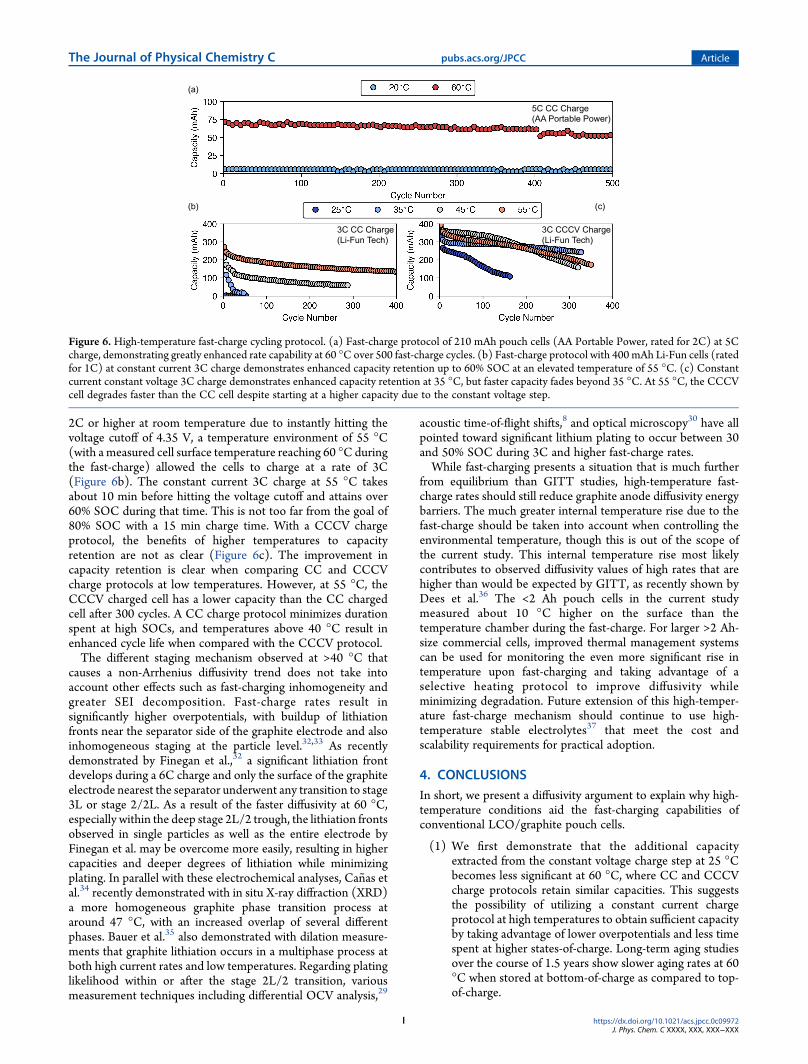
Copyright © 2022 FDOKUMEN