Thermal modeling of a cylindrical LiFePO4/graphite lithium-ion battery
8
Journal of Power Sources 195 (2010) 2961–2968 Contents lists available at ScienceDirect Journal of Power Sources journal homepage: www.elsevier.com/locate/jpowsour Thermal modeling of a cylindrical LiFePO 4 /graphite lithium-ion battery Christophe Forgez a,∗ , Dinh Vinh Do a , Guy Friedrich a , Mathieu Morcrette b , Charles Delacourt b a Université de Technologie de Compiègne, EA 1006, Laboratoire d’Electromécanique de Compiègne, BP 20529, 60205 Compiègne Cedex, France b Laboratoire de Réactivité et de Chimie des Solides, UMR 6007, Université de Picardie Jules Verne, 33 Rue Saint Leu, 80039 Amiens, France article info Article history: Received 29 July 2009 Received in revised form 1 October 2009 Accepted 20 October 2009 Available online 13 November 2009 Keywords: Li-ion battery Thermal modeling Temperature Heat source abstract A lumped-parameter thermal model of a cylindrical LiFePO 4 /graphite lithium-ion battery is developed. Heat transfer coefficients and heat capacity are determined from simultaneous measurements of the surface temperature and the internal temperature of the battery while applying 2 Hz current pulses of different magnitudes. For internal temperature measurements, a thermocouple is introduced into the battery under inert atmosphere. Heat transfer coefficients (thermal resistances in the model) inside and outside the battery are obtained from thermal steady state temperature measurements, whereas the heat capacity (thermal capacitance in the model) is determined from the transient part. The accuracy of the estimation of internal temperature from surface temperature measurements using the model is validated on current-pulse experiments and a complete charge/discharge of the battery and is within 1.5 ◦ C. Furthermore, the model allows for simulating the internal temperature directly from the measured current and voltage of the battery. The model is simple enough to be implemented in battery management systems for electric vehicles. © 2009 Elsevier B.V. All rights reserved. 1. Introduction Most of the models used in battery management systems (BMS) and state of charge (SOC) or state of health (SOH) observers consist in lumped-parameter equivalent electric circuits that are to some degree in relation with the physical phenomena within the bat- tery, such as charge transfer, diffusion, and double layer effects [1]. Generally, values of model parameters are obtained using electro- chemical impedance spectroscopy (EIS) under various conditions of state of charge, state of health, and temperature. However, under regular operating conditions, the internal battery temperature departs significantly from that measured at the surface, hence the set of input parameters determined at a given temperature using low-current methods like EIS is no longer appropriate. Therefore, having a thermal model able to estimate the internal temperature of the battery under operation can help improving the accuracy of the model used in the BMS. Several papers deal with thermal modeling of battery. In most of them, a thermal model is coupled with an electrochemical model so as to simulate the temperature profile of a battery under dif- ferent operating conditions, geometries or cooling rate [2,3]. Such coupled models can also be used to explore pulse power limitations in order to prevent thermal runaway or to design heat dissipation systems [3–5]. Three-dimensional thermal models have also been ∗ Corresponding author. E-mail address: [email protected] (C. Forgez). investigated in order to provide a better insight about the behavior of cells under abuse conditions [6]. Such models are well-suited for the battery design purpose, but are not compatible with the low computational resources of micro-controllers used in BMS. This paper presents a simplified thermal model able to esti- mate the internal temperature of the battery (assumed uniform) from surface temperature measurements, which is straightforward to implement in a low-cost micro-controller while enabling an improvement of the accuracy of the electrochemical model used in the BMS. The input parameters of the thermal model (heat trans- fer coefficients and heat capacity) are determined from transient experiments for which the battery temperature is raised using cur- rent pulses as the heat source instead of an external heating system as reported previously [7]. The internal temperature in the center of the cell is monitored by means of a thermocouple inserted into the cell and is used for parameter determination and model validation purpose. The model validation is restricted to regular tempera- ture conditions (<60 ◦ C), with natural-convection heat dissipation. Beside, the cell temperature coefficient, used for evaluation of the heat source term, is determined from open-circuit potential mea- surements at various temperatures and states of charge, and the enthalpy potential is derived. After Section 2 where the experimental device is detailed, Section 3 presents the model development together with the assumptions that were used for simplification purpose. The way the input parameters of the thermal model were determined is detailed in Section 4. Finally, the model accuracy is assessed under various operating conditions in Section 5. 0378-7753/$ – see front matter © 2009 Elsevier B.V. All rights reserved. doi:10.1016/j.jpowsour.2009.10.105
-
Upload
independent -
Category
Documents
-
view
2 -
download
0
Transcript of Thermal modeling of a cylindrical LiFePO4/graphite lithium-ion battery

T
Ca
b
a
ARRAA
KLTTH
1
aidtGcsrdslhot
tsfcis
0d
Journal of Power Sources 195 (2010) 2961–2968
Contents lists available at ScienceDirect
Journal of Power Sources
journa l homepage: www.e lsev ier .com/ locate / jpowsour
hermal modeling of a cylindrical LiFePO4/graphite lithium-ion battery
hristophe Forgeza,∗, Dinh Vinh Doa, Guy Friedricha, Mathieu Morcretteb, Charles Delacourtb
Université de Technologie de Compiègne, EA 1006, Laboratoire d’Electromécanique de Compiègne, BP 20529, 60205 Compiègne Cedex, FranceLaboratoire de Réactivité et de Chimie des Solides, UMR 6007, Université de Picardie Jules Verne, 33 Rue Saint Leu, 80039 Amiens, France
r t i c l e i n f o
rticle history:eceived 29 July 2009eceived in revised form 1 October 2009ccepted 20 October 2009vailable online 13 November 2009
a b s t r a c t
A lumped-parameter thermal model of a cylindrical LiFePO4/graphite lithium-ion battery is developed.Heat transfer coefficients and heat capacity are determined from simultaneous measurements of thesurface temperature and the internal temperature of the battery while applying 2 Hz current pulses ofdifferent magnitudes. For internal temperature measurements, a thermocouple is introduced into thebattery under inert atmosphere. Heat transfer coefficients (thermal resistances in the model) inside and
eywords:i-ion batteryhermal modelingemperatureeat source
outside the battery are obtained from thermal steady state temperature measurements, whereas theheat capacity (thermal capacitance in the model) is determined from the transient part. The accuracyof the estimation of internal temperature from surface temperature measurements using the modelis validated on current-pulse experiments and a complete charge/discharge of the battery and is within1.5 ◦C. Furthermore, the model allows for simulating the internal temperature directly from the measuredcurrent and voltage of the battery. The model is simple enough to be implemented in battery management
les.
systems for electric vehic. Introduction
Most of the models used in battery management systems (BMS)nd state of charge (SOC) or state of health (SOH) observers consistn lumped-parameter equivalent electric circuits that are to someegree in relation with the physical phenomena within the bat-ery, such as charge transfer, diffusion, and double layer effects [1].enerally, values of model parameters are obtained using electro-hemical impedance spectroscopy (EIS) under various conditions oftate of charge, state of health, and temperature. However, underegular operating conditions, the internal battery temperatureeparts significantly from that measured at the surface, hence theet of input parameters determined at a given temperature usingow-current methods like EIS is no longer appropriate. Therefore,aving a thermal model able to estimate the internal temperaturef the battery under operation can help improving the accuracy ofhe model used in the BMS.
Several papers deal with thermal modeling of battery. In most ofhem, a thermal model is coupled with an electrochemical modelo as to simulate the temperature profile of a battery under dif-
erent operating conditions, geometries or cooling rate [2,3]. Suchoupled models can also be used to explore pulse power limitationsn order to prevent thermal runaway or to design heat dissipationystems [3–5]. Three-dimensional thermal models have also been∗ Corresponding author.E-mail address: [email protected] (C. Forgez).
378-7753/$ – see front matter © 2009 Elsevier B.V. All rights reserved.oi:10.1016/j.jpowsour.2009.10.105
© 2009 Elsevier B.V. All rights reserved.
investigated in order to provide a better insight about the behaviorof cells under abuse conditions [6]. Such models are well-suited forthe battery design purpose, but are not compatible with the lowcomputational resources of micro-controllers used in BMS.
This paper presents a simplified thermal model able to esti-mate the internal temperature of the battery (assumed uniform)from surface temperature measurements, which is straightforwardto implement in a low-cost micro-controller while enabling animprovement of the accuracy of the electrochemical model used inthe BMS. The input parameters of the thermal model (heat trans-fer coefficients and heat capacity) are determined from transientexperiments for which the battery temperature is raised using cur-rent pulses as the heat source instead of an external heating systemas reported previously [7]. The internal temperature in the center ofthe cell is monitored by means of a thermocouple inserted into thecell and is used for parameter determination and model validationpurpose. The model validation is restricted to regular tempera-ture conditions (<60 ◦C), with natural-convection heat dissipation.Beside, the cell temperature coefficient, used for evaluation of theheat source term, is determined from open-circuit potential mea-surements at various temperatures and states of charge, and theenthalpy potential is derived.
After Section 2 where the experimental device is detailed,
Section 3 presents the model development together with theassumptions that were used for simplification purpose. The way theinput parameters of the thermal model were determined is detailedin Section 4. Finally, the model accuracy is assessed under variousoperating conditions in Section 5.
2962 C. Forgez et al. / Journal of Power Sources 195 (2010) 2961–2968
Nomenclature
List of symbolsA, B, C constants used in the fitscj concentration of species j (mol m−3)Cp heat capacity (J K−1)F Faraday’s constant (96,487 C mol−1)hin heat transfer coefficient inside the battery (W K−1)hout heat transfer coefficient outside the battery (W K−1)H̄j partial molar enthalpy of species j (J mol−1)I current (A)n number of electrons exchangedqn heat flux transferred to the outside of the battery
(W)Q̇ rate of heat generated or consumed (W)ri rate of a chemical reaction i (mol s−1)Rin heat transfer resistance inside the cell (K W−1)Rout heat transfer resistance outside the cell (K W−1)t time (s)T temperature (K)Tamb bulk temperature of air (K)Tin internal temperature of the battery (K)Tsurf surface temperature of the battery (K)U equilibrium potential of the cell (V)UH enthalpy potential of the cell (V)v volume (m3)V cell voltage (V)�Hi variation of the enthalpy of a chemical reaction i
(J mol−1)�S variation of entropy of the cell reaction (J K−1 mol−1)� constant used in a fit
superscriptavg property evaluated at the volume-averaged concen-
2
wo(pmsattttg
2
h2amupsi
tration∞ variable at steady state
. Experimental
A LiFePO4/graphite lithium-ion battery (26650 cyclindrical cell)as equipped with two T-type thermocouples (TC Direct, France):
ne on the surface and another one inserted into the batteryFig. 1a) after it was discharged and drilled in the center of theositive electrode side. The thermocouple for internal temperatureeasurement was an insulated thermocouple (321 stainless steel
heath) of 1 mm external diameter. This diameter is chosen to bes close as possible to the diameter of the central hole in the bat-ery roll to get a good thermal contact. The thermocouple for surfaceemperature measurement is a non-insulated one. A resin was usedo ensure a good seal between the inner thermocouple and the bat-ery casing. The overall process was carried out inside a argon-filledlove-box so as to ensure an inert atmosphere.
.1. Measurements under current pulses
During experiments, the battery was kept away from externaleat sources, and was placed in air with an ambient temperature of2 ◦C. In order to raise the temperature of the battery, symmetricalnd periodic current pulses with 2 Hz frequency and of different
agnitudes (±10, ±15, and ±20 A) were applied to the batterysing a power amplifier (VMP3 Biologic, Claix, France, Fig. 1b). Theulses are symmetrical in order to hold the battery at an averagetate of charge (50%) over time. This SOC value was chosen since thiss an average value used in many applications (this is for operating
Fig. 1. (a) Battery with inserted and surface mounted thermocouples and (b) exper-imental device
conditions around that SOC that the battery exhibits the maximumcharge/discharge power). Of course, one could reproduce the sametests at other average SOCs in order to get the SOC-dependence ofthe model parameters (Cp and Rin). A 2 Hz frequency was selectedfrom an analysis of the impedance spectra of the battery, whichshows that this frequency is intermediate between the low fre-quency of the interfacial part and the high frequency of the diffusionpart. Output voltages from both thermocouples were recordedusing a digital scope (Yokogawa DL716, Fig. 1b) and further con-verted to temperatures. Fig. 2 displays the experimental surfaceand internal temperature data measurements when current pulsesof different magnitudes (±10, ±15, and ±20 A) are applied duringone hour (0–3600 s in the plots, Fig. 2), after which the current isturned off to allow for temperature relaxation. From the Fig. 2, it isseen that a thermal steady state has been reached after around anhour under current pulses. Furthermore, whatever the magnitudeof the current pulses, the temperature dynamics seem to be simi-lar, with a non-zero slope at initial time indicative of a first-orderbehavior.
2.2. Measurements under open-circuit potential (OCP)
OCP measurements were carried out for cell temperatures rang-ing from 6 to 36 ◦ C at different SOCs using a VMP3 potentiostat(Biologic, Claix, France) and a programmable climatic chamber(Binder KB53, Germany). The SOC was changed using a C/20 currentat 25 ◦ C and the battery was subsequently allowed to relax for 5 hat the same temperature, after which the thermal cycle (16 ◦C, 3 h;6 ◦C, 3 h; 21 ◦C, 3 h; 36 ◦C, 3 h; 26 ◦C, 3 h) was applied.
3. Thermal model
3.1. Energy balance
The equation for energy balance inside the cell reads
Cp∂Tin
∂t= −qn + Q̇ , (1)

C. Forgez et al. / Journal of Power Sources 195 (2010) 2961–2968 2963
Fm
wocotAfl
q
Iottevbmt
miimt
3
d
Q
wt
ig. 2. Temperature measurements inside and on the surface for current pulses ofagnitude ±10, ±15, and ±20 A.
here Cp is the heat capacity, Tin the bulk (or internal) temperaturef the battery, t the time, Q̇ the rate of heat generated (> 0) oronsumed (< 0), and qn is the heat flux transferred to the outsidef the battery. qn is related to the temperature difference betweenhe bulk and the surface by means of a heat transfer coefficient.pplying such a relationship inside and outside the battery, theux conservation equation reads
n = hin(Tin − Tsurf ) = −hout(Tamb − Tsurf ). (2)
n Eq. (2), hin and hout are the heat transfer coefficients inside andutside the battery, respectively, Tsurf is the surface temperature ofhe battery, and Tamb is the bulk temperature of air, far enough fromhe surface of the battery. Note that the heat transfer coefficientsncompass different heat transport modes such as conduction, con-ection, and radiation. The predominant transport mode within theattery is the conduction, while convection and radiation are theore likely modes in the surrounding air. The readers are invited
o consult specific literature for more details [8].In the approach developed throughout this paper, the thermal
odel is described using equivalent electric circuits, where capac-tances are used for heat capacities and resistances are used for thenverse of heat transfer coefficients. Now let us detail the mathe-
atical expression for the rate of heat generated or consumed inhe battery.
.2. Heat source in the cell
An expression for the heat source in a lithium-ion battery waserived by Thomas and Newman [9]. It reads
˙ =I(V−Uavg)+IT∂Uavg
−∑
�Havgri −∫ ∑(
H̄j−H̄avgj
) ∂cjdv,
∂Ti
i
j∂t
(3)
ith Q̇ the rate of heat generated or consumed, V the cell voltage, Uhe equilibrium potential, I the current (> 0 on charge), T the tem-
Fig. 3. Example of the voltage variation during the thermal cycle for SOC 20%.
perature, �Hi the variation of enthalpy of a chemical reaction i, ri
the rate of reaction i, H̄j the partial molar enthalpy of species j, cj itsconcentration, t the time, and v the volume. The superscript ‘avg’indicates that the properties are evaluated at the volume-averagedconcentration. The first term on the right is the heat generated fromresistive dissipation, and is always positive. The second term is thereversible entropic heat (we recall that �S/nF = ∂U/∂T , with �Sthe entropy change of the cell reaction, n the number of electronsexchanged and F Faraday’s constant.). This term can be either pos-itive or negative. The third term represents the heat produced orconsumed by any chemical reaction that may occur in the cell, andis either positive or negative as well. In the cylindrical cell underconsideration in this study, side reactions accounting for aging areassumed to be slow enough to be neglected, so is also the thirdterm in Eq. (3). Finally, the last term accounts for the heat of mix-ing, which is due to the formation and relaxation of concentrationgradients within the cell. Such gradients may develop across thesolid active materials of the porous electrodes and across the elec-trolyte (in the electrodes and the separator), as well as radiallywithin the active material particles and within the pores of theelectrode filled with electrolyte. Heat mixing terms can be eitherpositive or negative. A general trend is that for electrochemical sys-tems with good transport properties, concentration gradients arelimited and heat of mixing can usually be ignored. Because the bat-tery under consideration is designed for high power applications, itis thought to follow the above statement. Furthermore, because thepositive electrode is a two-phase material, the two heat of mixingterms due to concentration gradients within the active materialare zero. Although an insertion electrode material is used as thenegative electrode, i.e., the graphite, the two heat of mixing termswithin this active material are likely very small since the varia-tions of the enthalpy potential UH (UH = U − T∂U/∂T) with lithiumconcentration are moderate [9,10]. This is also verified from theexperimental measurements we performed and that are detailedin the next paragraph.
The reversible heat source term (second term on the right handside of Eq. (3)) is most often not negligible; it is of the sameorder of magnitude as the irreversible term [9]. We performedOCP experiments at various temperatures in order to determinethe temperature coefficient and enthalpy potential as a function ofthe SOC. As emphasized by Thomas et al. [10,11], it is more conve-nient to vary the cell temperature for a given SOC rather than the
reverse. Therefore, this method was utilized here. Fig. 3 provides anexample of the voltage variation while the thermal cycle is applied.There is a slight drift of the cell voltage over time, which is not corre-lated with the temperature change, and which is ascribed to the cell
2964 C. Forgez et al. / Journal of Power So
Fa
rtfB
tTpUUS[rte
Fw
ig. 4. (a) Temperature coefficient ∂U/∂T and (b) equilibrium potential at 25 ◦C U25 ◦C
nd enthalpy potential UH as a function of SOC.
elaxation following the previous SOC change. In order to extracthe temperature coefficient from these data, the voltage was fit to aunction V(t, T) = A + BT + Ct with A, B, and C some constants, andcorresponding to the temperature coefficient ∂U/∂T .
Fig. 4 presents the variation of ∂U/∂T with the SOC, together withhat of the equilibrium potential U and the enthalpy potential UH.he temperature coefficient is negative up to SOC 35%, and becomesositive for higher SOC values. It is interesting to compare U andH: while U is monotonic and increases with the SOC as expected,H is not. Furthermore, the dependence of ∂U/∂T and UH with the
OC presents some similitudes with that of graphite/lithium cells10,12], which is not surprising since in most of the compositionanges explored here, the positive electrode LiFePO4 undergoes awo-phase process and therefore no variation of ∂U/∂T (and UH) arexpected. The fairly abrupt variation between SOC 70% and SOC 80%ig. 5. Evolution of (V − U)I (blue) and corresponding smoothed curve (red). (For interpreb version of the article.
urces 195 (2010) 2961–2968
probably corresponds to the transition between the first and secondstages of the graphite. This would indicate an excess of graphiteover the positive electrode material, as it is frequently observed incommercial lithium-ion batteries.
Although the reversible heat source term cannot be neglected,for the current-pulse experiments used in this study, the cell tem-perature during a single period of current (0.5 s for parametersdetermination or 20 s for model validation) can be regarded as aconstant, and therefore the average reversible heat source termover a period is almost zero. It is consequently discarded in theheat source term evaluation with the current pulses used in thefollowing.
The irreversible source term (first term on the right hand sideof Eq. (3)) is directly calculated for each test from the current andvoltage values recorded every 10 ms. It is subsequently smoothedusing a function of the type I(V − U) = A + B exp(−t/�), where A, B,and � are refined by least square regression. The experimental andfitted curves are overlaid in Fig. 5.
3.3. Lumped model
As explained above, the energy balance (Eq. (1)) is representedusing an equivalent electric circuit, where capacitors and resistorsare used for accumulation terms and heat transfer phenomena,respectively, and a current source is used for the heat source termQ̇ . Equivalent circuits with different degrees of complexity may bechosen (Fig. 6). For instance, if the lateral surface temperature dif-fers from that of the bases of the cylindrical battery, an equivalentcircuit such as that of Fig. 6a would be used, in which heat fluxesinside and outside the battery are considered explicitly in axial andlateral directions. Furthermore, the different heat transport modesthat may coexist can be visualized by a parallel association of resis-tors, as it is done for heat transport in the air surrounding thebattery, for which convective and radiative effects are consideredexplicitely.
The main limitation of using such a detailed lumped model isthat there are a lot of parameters to be determined, which usuallyrequires additional experimental measurements. Since the goal ofthis work is to build a model that is able to get an estimate of the
internal temperature of the battery from a simple measurementof the lateral surface temperature, simplifications to the equiva-lent circuit of Fig. 6a can be made. Under the assumption that thesurface temperature of the battery is uniform (i.e. the surface tem-perature of the terminals is close to the lateral temperature), theetation of the references to color in this figure legend, the reader is referred to the

wer Sources 195 (2010) 2961–2968 2965
icwe
pwwatFn±tfib
4
(pmpervt
4
te
Wt
Table 1Values of Rout , Rin, Rin/Rout , and Cp determined from current-pulses experimentswith different current magnitudes.
Pulse ±10 A ±15 A ±20 A
Rout(K W−1) 9.12 9.08 8.44
C. Forgez et al. / Journal of Po
nternal heat transfer resistors can be combined into a single onealled Rin in the simplified equivalent circuit of Fig. 6b. In the sameay, the external heat transfer resistors are combined, yielding an
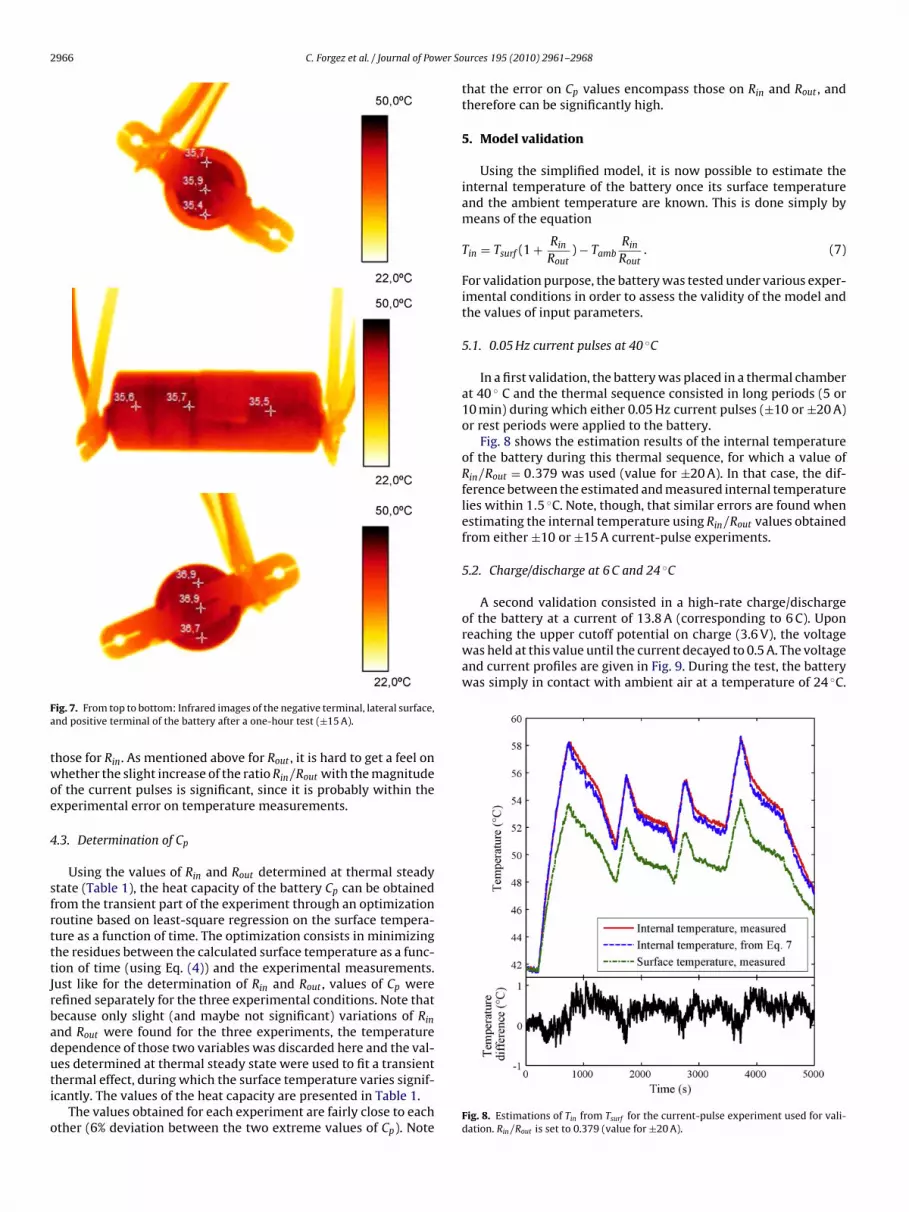
quivalent resistor Rout .In order to assess the validity of the assumption of surface tem-
erature uniformity, infrared imaging was carried out. The batteryas first painted in black so as to get a well-defined emissivity,hich was set to unity. Infrared photos of the battery terminals
nd of the lateral surface were recorded while increasing the bat-ery temperature using current pulses as described in Section 2.ig. 7 displays the infrared images of the lateral and the termi-al surfaces at the end of the test (after an hour with pulses at15 A). This clearly shows that the temperature difference between
he different surfaces is within 2 ◦C. This validates that the simpli-ed equivalent circuit of Fig. 6b can be used to model the thermalehavior of the battery.
. Determination of the model parameters
In this section, values for the three parameters of the modelRin, Rout , and Cp) are extracted from the experimental data. All thearameters can be obtained from a single current-pulse experi-ent: Rin and Rout are determined from the thermal steady state
art while the transient part allows for the determination of Cp. Asxplained in Section 2, several current-pulse experiments were car-ied out under different current magnitudes, and a set of parameteralues was obtained for each experiment, with the goal of assessinghe temperature influence on the parameter values.
.1. Determination of Rout
Using the simplified equivalent circuit (Fig. 6b), the surfaceemperature is obtained by solving for the first-order differentialquation
dTsurf
dt= Tamb − Tsurf
Cp(Rin + Rout)+ Q̇Rout
Cp(Rin + Rout). (4)
hen a thermal steady state is reached, the term dTsurf /dt goeso zero, which means that all the heat flux generated by the heat
Fig. 6. Lumped models ((a) complete m
Rin(K W−1) 3.273 3.386 3.20Rin/Rout 0.359 0.373 0.379Cp(J K−1) 73.2 77.7 77.9
source Q̇ flows through Rin and Rout . Eq. (4) then reads
Rout = Tsurf,∞ − Tamb
Q̇∞, (5)
where the index ∞ means that the value is taken at thermal steadystate (after an hour under current pulses in this study). The valuesof Rout determined from the thermal steady state data for the threeexperimental values of current magnitude are provided in Table 1.
It is seen that the values of Rout are fairly dispersed, and a slightdecrease is observed when the magnitude of the current pulses (andtherefore the thermal steady state surface temperature) increases.Although this might point out a temperature-dependence of theheat transfer coefficient of the air surrounding the battery, experi-mental uncertainties on temperature measurements have a ratherlarge impact on the values of Rout . As an example, if an ambient tem-perature of 23 ◦ C is taken instead of 22 ◦C, a value of 8.135 K W−1
is obtained for Rout .
4.2. Determination of the ratio Rin/Rout
Because the same heat flux flows through Rin and Rout , the ratioRin/Rout can be simply expressed in terms of the internal tempera-ture, the surface temperature, and the ambient temperature of theair, which reads
Rin Tin − Tsurf
Rout=
Tsurf − Tamb. (6)
Note that this relationship is valid at all times. The values of Rin/Rout
determined at thermal steady state are reported in Table 1 forthe three experimental values of current magnitude together with
odel and (b) simplified model).
2966 C. Forgez et al. / Journal of Power So
Fa
twoe
4
sfrtttJrbaduti
o
of the battery at a current of 13.8 A (corresponding to 6 C). Uponreaching the upper cutoff potential on charge (3.6 V), the voltagewas held at this value until the current decayed to 0.5 A. The voltageand current profiles are given in Fig. 9. During the test, the batterywas simply in contact with ambient air at a temperature of 24 ◦C.
ig. 7. From top to bottom: Infrared images of the negative terminal, lateral surface,nd positive terminal of the battery after a one-hour test (±15 A).
hose for Rin. As mentioned above for Rout , it is hard to get a feel onhether the slight increase of the ratio Rin/Rout with the magnitude
f the current pulses is significant, since it is probably within thexperimental error on temperature measurements.
.3. Determination of Cp
Using the values of Rin and Rout determined at thermal steadytate (Table 1), the heat capacity of the battery Cp can be obtainedrom the transient part of the experiment through an optimizationoutine based on least-square regression on the surface tempera-ure as a function of time. The optimization consists in minimizinghe residues between the calculated surface temperature as a func-ion of time (using Eq. (4)) and the experimental measurements.ust like for the determination of Rin and Rout , values of Cp wereefined separately for the three experimental conditions. Note thatecause only slight (and maybe not significant) variations of Rin
nd Rout were found for the three experiments, the temperatureependence of those two variables was discarded here and the val-
es determined at thermal steady state were used to fit a transienthermal effect, during which the surface temperature varies signif-cantly. The values of the heat capacity are presented in Table 1.The values obtained for each experiment are fairly close to eachther (6% deviation between the two extreme values of Cp). Note
urces 195 (2010) 2961–2968
that the error on Cp values encompass those on Rin and Rout , andtherefore can be significantly high.
5. Model validation
Using the simplified model, it is now possible to estimate theinternal temperature of the battery once its surface temperatureand the ambient temperature are known. This is done simply bymeans of the equation
Tin = Tsurf (1 + Rin
Rout) − Tamb
Rin
Rout. (7)
For validation purpose, the battery was tested under various exper-imental conditions in order to assess the validity of the model andthe values of input parameters.
5.1. 0.05 Hz current pulses at 40 ◦C
In a first validation, the battery was placed in a thermal chamberat 40 ◦ C and the thermal sequence consisted in long periods (5 or10 min) during which either 0.05 Hz current pulses (±10 or ±20 A)or rest periods were applied to the battery.
Fig. 8 shows the estimation results of the internal temperatureof the battery during this thermal sequence, for which a value ofRin/Rout = 0.379 was used (value for ±20 A). In that case, the dif-ference between the estimated and measured internal temperaturelies within 1.5 ◦C. Note, though, that similar errors are found whenestimating the internal temperature using Rin/Rout values obtainedfrom either ±10 or ±15 A current-pulse experiments.
5.2. Charge/discharge at 6 C and 24 ◦C
A second validation consisted in a high-rate charge/discharge
Fig. 8. Estimations of Tin from Tsurf for the current-pulse experiment used for vali-dation. Rin/Rout is set to 0.379 (value for ±20 A).

C. Forgez et al. / Journal of Power Sources 195 (2010) 2961–2968 2967
Fig. 9. Current and voltage profile during a charge/discharge of the battery at aco
Up
pmpmw
rw
q
FA
urrent of 13.8 A. The constant current–constant voltage (CCCV) protocol was usedn charge.
sing infrared imaging, the surface temperature was shown to beretty uniform (not shown here).
As done above for the current-pulse profile, the internal tem-erature is calculated from the measured surface temperature byeans of Eq. (7), using Rin/Rout values obtained from ±15 A current-
ulse experiments. As seen in Fig. 10, the difference betweeneasured and estimated internal temperature is within ca. 1.2 ◦C,hich is satisfactory.
Finally, the internal temperature is directly estimated from cur-ent and voltage profiles, using the overall energy balance (Eq. 1),here qn is expressed as
n = Tin − Tamb
Rin + Rout, (8)
ig. 10. Estimations of Tin from Tsurf for the full charge/discharge experiment at 13.8. Rin/Rout is set to 0.373 (value for ±15 A).
Fig. 11. Estimations of Tin for the full charge/discharge experiment at 13.8 A usingthe voltage and current. Values of model parameters obtained from current-pulsesexperiments at ±15 A were used.
by a rearrangement of Eq. (2) to cancel Tsurf . Eq. (3) is used for Q̇ ,with the two terms on the right side being set to zero
Q̇ = I(V − Uavg) + IT∂Uavg
∂T. (9)
The open-circuit potential U at various temperatures and the tem-perature coefficient ∂U/∂T were determined experimentally as afunction of the SOC (see above).
In order to solve for the internal temperature, the energy bal-ance was solved at each time. This is a simple initial-value problem.The energy balance was discretized in time using the (first-order)Euler method with a time step of 0.1 s. The simulated internaltemperature is overlaid to the experimental one in Fig. 11. Thereis a good agreement between the two, especially under constantcurrent. The error is larger under constant voltage charging (max-imum temperature difference of 1.8 ◦C), probably because of alarger error on U and ∂U/∂T near full charge (SOC ≈ 100%). Asa way to assess the importance of the reversible heat sourceterm (second term on right side of Eq. (9)), the internal temper-ature was determined by setting this term to zero, and is shownin Fig. 11. The temperature difference between the measuredand simulated internal temperature is larger when the reversibleterm is neglected, especially during the charge (maximum tem-perature difference of 2.3 ◦C), and near the end of discharge.This emphasizes the importance of considering this term in thesimulations when the conditions used above for current-pulseexperiments (symmetric pulses having a short period) are not ful-filled.
6. Conclusion
A simple thermal model of a cylindrical LiFePO4/graphite
lithium-ion battery was developed. A thermocouple was insertedin the battery so as to measure the internal temperature and there-fore to determine the input parameters for the model. A differenceup to 10 ◦ C was observed between the center of the battery andthe surface, which emphasizes the need for taking into account the
2 wer So
tmabewBcwptm
A
s
968 C. Forgez et al. / Journal of Po
emperature distribution in dynamic models used in BMS. Using theodel and measurements of the surface temperature by means ofsurface-mounted thermocouple, the internal temperature of theattery could be determined with an error less than 1.5 ◦C. Thestimation method of the internal temperature is very straightfor-ard and readily implementable on a low-cost micro-controller forMS, and could greatly improve the accuracy of the electrochemi-al model since input parameters are temperature-dependent. Thisork is a preliminary study, and the final goal is to achieve a com-lete thermal model of a battery pack. In order to simplify the use ofhe proposed method in the case of a pack, future work will focus on
ethods that do not require a thermocouple inserted in the battery.
cknowledgment
The authors acknowledge the Région Picardie for the financialupport.
[[
[
urces 195 (2010) 2961–2968
References
[1] H.J. Bergveld, W.S. Kruijt, P.H.L. Notten, Battery Management Systems, Designby Modelling, vol. 1, Kluwer Academic Publishers, 2002.
[2] P.M. Gomadam, R.E. White, J.W. Weidner, Journal of the Electrochemical Society150 (10) (2003) A1339–A1345.
[3] S. Al-Hallaj, H. Maleki, J.S. Hong, J.R. Selman, Journal of Power Sources 83 (1–2)(1999) 1–8.
[4] K. Smith, C.Y. Wang, Journal of Power Sources 160 (1) (2006) 662–673.[5] S.A. Khateeb, S. Amiruddin, M. Farid, J.R. Selman, S. Al-Hallaj, Journal of Power
Sources 142 (1–2) (2005) 345–353.[6] G.H. Kim, A. Pesaran, R. Spotnitz, Journal of Power Sources 170 (2) (2007)
476–489.[7] E. Barsoukov, J.H. Jang, H. Lee, Journal of Power Sources 109 (2) (2002) 313–320.[8] W.M. Deen, Analysis of Transport Phenomena, Oxford University Press, 1998.[9] K.E. Thomas, J. Newman, Journal of the Electrochemical Society 150 (2) (2003)
A176–A192.10] K.E. Thomas, Ph.D. Thesis, University of California, Berkeley, 2002.11] K.E. Thomas, C. Bogatu, J. Newman, Journal of the Electrochemical Society 148
(6) (2001) A570–A575.12] Y. Reynier, R. Yazami, B. Fultz, Journal of Power Sources 119–121 (2003)
850–855.