Highly Porous Expanded Graphite: Thermal Shock vs ... - MDPI
17
materials Article Highly Porous Expanded Graphite: Thermal Shock vs. Programmable Heating Alexander G. Bannov 1, *, Arina V. Ukhina 2 , Evgenii A. Maksimovskii 3 , Igor Yu. Prosanov 2 , Artyom A. Shestakov 1 , Nikita I. Lapekin 1 , Nikita S. Lazarenko 1 , Pavel B. Kurmashov 1 and Maksim V. Popov 1,4 Citation: Bannov, A.G.; Ukhina, A.V.; Maksimovskii, E.A.; Prosanov, I.Y.; Shestakov, A.A.; Lapekin, N.I.; Lazarenko, N.S.; Kurmashov, P.B.; Popov, M.V. Highly Porous Expanded Graphite: Thermal Shock vs. Programmable Heating. Materials 2021, 14, 7687. https://doi.org/ 10.3390/ma14247687 Academic Editors: Agustín Francisco Pérez-Cadenas, MaríaPérez-Cadenas and Esther Bailón-García Received: 3 November 2021 Accepted: 10 December 2021 Published: 13 December 2021 Publisher’s Note: MDPI stays neutral with regard to jurisdictional claims in published maps and institutional affil- iations. Copyright: © 2021 by the authors. Licensee MDPI, Basel, Switzerland. This article is an open access article distributed under the terms and conditions of the Creative Commons Attribution (CC BY) license (https:// creativecommons.org/licenses/by/ 4.0/). 1 Department of Chemistry and Chemical Engineering, Faculty of Mechanical Engineering, Novosibirsk State Technical University, 630092 Novosibirsk, Russia; [email protected] (A.A.S.); [email protected] (N.I.L.); [email protected] (N.S.L.); [email protected] (P.B.K.); [email protected] (M.V.P.) 2 Institute of Chemistry of Solid State and Mechanochemistry, Siberian Branch, Russian Academy of Sciences, 630092 Novosibirsk, Russia; [email protected] (A.V.U.); [email protected] (I.Y.P.) 3 Institute of Inorganic Chemistry, Siberian Branch, Russian Academy of Sciences, 630090 Novosibirsk, Russia; [email protected] 4 N.D. Zelinsky Institute of Organic Chemistry, Russian Academy of Sciences, 119991 Moscow, Russia * Correspondence: [email protected] Abstract: Highly porous expanded graphite was synthesized by the programmable heating tech- nique using heating with a constant rate (20 ◦ C/min) from room temperature to 400–700 ◦ C. The samples obtained were analyzed by scanning electron microscopy, energy-dispersive spectroscopy, low-temperature nitrogen adsorption, X-ray photoelectron spectroscopy, Raman spectroscopy, ther- mogravimetry, and differential scanning calorimetry. A comparison between programmableheating and thermal shock as methods of producing expanded graphite showed efficiency of the first one at a temperature 400 ◦ C, and the surface area reached 699 and 184 m 2 /g, respectively. The proposed technique made it possible to obtain a relatively higher yield of expanded graphite (78–90%) from intercalated graphite. The experiments showed the advantages of programmable heating in terms of its flexibility and the possibility to manage the textural properties, yield, disorder degree, and bulk density of expanded graphite. Keywords: expanded graphite; textural characteristics; porosity; surface area; thermal shock; graphite; thermal analysis; heating 1. Introduction Expanded graphite (EG) is used for the production of sealing materials [1], graphite paper [2–4], protection coatings [5], fillers for polymer composites [6–8], adsorbent [9], electrode material for supercapacitors [10,11], cathodes for aluminum-ion batteries [12], components of antibacterial materials [13,14], adsorbents [15], catalysts [16], etc. There are two main methods of manufacturing EG, thermal expansion [17,18] and liquid-phase expansion [19]. Thermal expansion is usually used to produce EG from intercalated graphite [20]. Rapid heating leads to the decomposition of intercalated graphite compounds and induces strong formation of a gas phase, which produces a porous cellular structure [21]. The relatively high surface area of the EG determines its applications in adsorption, etc. [22]. In [23], liquid phase expansion was carried out using the mixture of H 2 SO 4 and H 2 O 2 (9:1 vol. ratio) and flake graphite. The porosity of expanded graphite strongly depends on the method of intercalation. For example, van Heerden et al. [24] carried out a comparison of three intercalation methods (FeCl 3 gas phase intercalation, electrochemical intercalation, and Hummers method) with regard to the characteristics of EG. Gas phase intercalation with FeCl 3 was carried out using the mixture of graphite and anhydrous FeCl 3 (1:2 wt. ratio), which were dried (50 ◦ C, 2 h) and heated (300 ◦ C, 25 h). It was found that electrochemical intercalation in Materials 2021, 14, 7687. https://doi.org/10.3390/ma14247687 https://www.mdpi.com/journal/materials
-
Upload
khangminh22 -
Category
Documents
-
view
1 -
download
0
Transcript of Highly Porous Expanded Graphite: Thermal Shock vs ... - MDPI

materials
Article
Highly Porous Expanded Graphite: Thermal Shock vs.Programmable Heating
Alexander G. Bannov 1,*, Arina V. Ukhina 2, Evgenii A. Maksimovskii 3, Igor Yu. Prosanov 2,Artyom A. Shestakov 1 , Nikita I. Lapekin 1, Nikita S. Lazarenko 1, Pavel B. Kurmashov 1 and Maksim V. Popov 1,4
�����������������
Citation: Bannov, A.G.; Ukhina, A.V.;
Maksimovskii, E.A.; Prosanov, I.Y.;
Shestakov, A.A.; Lapekin, N.I.;
Lazarenko, N.S.; Kurmashov, P.B.;
Popov, M.V. Highly Porous Expanded
Graphite: Thermal Shock vs.
Programmable Heating. Materials
2021, 14, 7687. https://doi.org/
10.3390/ma14247687
Academic Editors: Agustín
Francisco Pérez-Cadenas,
María Pérez-Cadenas and
Esther Bailón-García
Received: 3 November 2021
Accepted: 10 December 2021
Published: 13 December 2021
Publisher’s Note: MDPI stays neutral
with regard to jurisdictional claims in
published maps and institutional affil-
iations.
Copyright: © 2021 by the authors.
Licensee MDPI, Basel, Switzerland.
This article is an open access article
distributed under the terms and
conditions of the Creative Commons
Attribution (CC BY) license (https://
creativecommons.org/licenses/by/
4.0/).
1 Department of Chemistry and Chemical Engineering, Faculty of Mechanical Engineering, Novosibirsk StateTechnical University, 630092 Novosibirsk, Russia; [email protected] (A.A.S.); [email protected] (N.I.L.);[email protected] (N.S.L.); [email protected] (P.B.K.); [email protected] (M.V.P.)
2 Institute of Chemistry of Solid State and Mechanochemistry, Siberian Branch, Russian Academy of Sciences,630092 Novosibirsk, Russia; [email protected] (A.V.U.); [email protected] (I.Y.P.)
3 Institute of Inorganic Chemistry, Siberian Branch, Russian Academy of Sciences, 630090 Novosibirsk, Russia;[email protected]
4 N.D. Zelinsky Institute of Organic Chemistry, Russian Academy of Sciences, 119991 Moscow, Russia* Correspondence: [email protected]
Abstract: Highly porous expanded graphite was synthesized by the programmable heating tech-nique using heating with a constant rate (20 ◦C/min) from room temperature to 400–700 ◦C. Thesamples obtained were analyzed by scanning electron microscopy, energy-dispersive spectroscopy,low-temperature nitrogen adsorption, X-ray photoelectron spectroscopy, Raman spectroscopy, ther-mogravimetry, and differential scanning calorimetry. A comparison between programmable heatingand thermal shock as methods of producing expanded graphite showed efficiency of the first one ata temperature 400 ◦C, and the surface area reached 699 and 184 m2/g, respectively. The proposedtechnique made it possible to obtain a relatively higher yield of expanded graphite (78–90%) fromintercalated graphite. The experiments showed the advantages of programmable heating in terms ofits flexibility and the possibility to manage the textural properties, yield, disorder degree, and bulkdensity of expanded graphite.
Keywords: expanded graphite; textural characteristics; porosity; surface area; thermal shock;graphite; thermal analysis; heating
1. Introduction
Expanded graphite (EG) is used for the production of sealing materials [1], graphitepaper [2–4], protection coatings [5], fillers for polymer composites [6–8], adsorbent [9],electrode material for supercapacitors [10,11], cathodes for aluminum-ion batteries [12],components of antibacterial materials [13,14], adsorbents [15], catalysts [16], etc.
There are two main methods of manufacturing EG, thermal expansion [17,18] andliquid-phase expansion [19]. Thermal expansion is usually used to produce EG fromintercalated graphite [20]. Rapid heating leads to the decomposition of intercalated graphitecompounds and induces strong formation of a gas phase, which produces a porous cellularstructure [21]. The relatively high surface area of the EG determines its applications inadsorption, etc. [22]. In [23], liquid phase expansion was carried out using the mixture ofH2SO4 and H2O2 (9:1 vol. ratio) and flake graphite.
The porosity of expanded graphite strongly depends on the method of intercalation.For example, van Heerden et al. [24] carried out a comparison of three intercalation methods(FeCl3 gas phase intercalation, electrochemical intercalation, and Hummers method) withregard to the characteristics of EG. Gas phase intercalation with FeCl3 was carried outusing the mixture of graphite and anhydrous FeCl3 (1:2 wt. ratio), which were dried(50 ◦C, 2 h) and heated (300 ◦C, 25 h). It was found that electrochemical intercalation in
Materials 2021, 14, 7687. https://doi.org/10.3390/ma14247687 https://www.mdpi.com/journal/materials

Materials 2021, 14, 7687 2 of 17
sulfuric acid electrolyte and the Hummers method led to the formation of indistinguishableproducts with similar surface areas of 18.7 and 21.7 m2/g, respectively. In [25], the authorscarried out heating of graphite intercalation compounds (GICs) from 800 to 900 ◦C for20 s, leading to exfoliation of graphite oxide and expanded graphite, but the change inspecific surface area was relatively low. In [26,27], it was concluded that the surface area ofgraphite intercalated with sulfuric acid was low enough (45 m2/g). Goudarzi et al. [28]noted that the particle size of GICs and temperature of exfoliation significantly affected thepore size of expanded graphite. Textural characteristics increased when the temperatureincreased from 700 to 900 ◦C. The increase in GIC particle size induces a drop in specificpore area of EG.
Usually, the surface area of expanded graphite is relatively low; therefore, novel meth-ods for its synthesis must be developed in order to improve the important characteristics forfurther application. In this study, programmable heating was used to synthesize EG. Theeffects of various final temperatures used for heating intercalated graphite on the disorderdegree, porosity, and chemical composition of EG were studied in detail. A comparisonbetween thermal shock and programmable heating used for obtaining EG was done.
2. Experimental2.1. Preparation of Expanded Graphite
Two sets of highly porous expanded graphite samples were synthesized.The first set contained 4 samples, which were synthesized from 1 g of intercalated
graphite (EG-350-50, Chemical Systems Ltd., Moscow, Russia). To synthesize the thermallyexpanded graphite and control its porosity, programmable heating, as the first synthesistechnique, was used. In addition, a comparison of programmable heating with thermalshock, the second synthesis technique, was done.
The description of samples synthesized under different conditions is shown in Table 1.
Table 1. Samples synthesized under different conditions.
Sample Temperature, ◦C Synthesis Technique
TEG1-400 400 Programmable heatingTEG1-500 500 Programmable heatingTEG1-600 600 Programmable heatingTEG1-700 700 Programmable heatingTEG2-400 400 Thermal shock
TEG2-1000 1000 Thermal shock
Programmable heating was performed by using a certain temperature program set ina muffle furnace (SNOL, Utena, Lithuania) in which the Al2O3 crucible with intercalatedgraphite was placed. The sample was heated from room temperature (25 ± 1 ◦C) tomaximum temperatures of 400, 500, 600, and 700 ◦C in air atmosphere. The heating ratewas 20 ◦C/min, set by the controller of the furnace. The cooled samples were taken fromthe furnace and were analyzed.
The second method was thermal shock, which was used for comparison with pro-grammable heating. The crucible with the sample was quickly placed into the hot furnace.Usually to synthesize EG, temperatures of 800–1200 ◦C are used [29–31]; therefore, tocarry out the comparison, 2 temperatures were used, one lower than this range (400 ◦C)and one within this range (1000 ◦C), taking into account that the temperature gradientsthat influence EG are around 375 and 975 ◦C/s. Each sample was kept in the furnace for10 min at the given temperature, then the sample was taken out and cooled down in airatmosphere without additional intensification of cooling.
The appearance of samples obtained by programmable heating and thermal shock areshown in Figure 1.

Materials 2021, 14, 7687 3 of 17
Figure 1. Appearance of the TEG1-400 (a) and TEG2-400 (b) samples.
2.2. Characterization
The EG obtained was characterized by the following method. The bulk density ofthe sample was measured according to GOST 25699.14-93 by compaction of the bed of EGplaced into a 10 mL measuring cylinder under the action of vibration until the constantheight of the bed was reached.
The yield of EG (%) synthesized using the 2 techniques was determined by weighingthe samples using an analytical balance (Sartogosm, Sankt-Peterburg, Russia) as the ratioof sample weight after synthesis to sample weight before synthesis.
The morphology of the surface of samples obtained was investigated by a S-3400Nscanning electron microscope (SEM) (Hitachi, Japan). The add-on for energy-dispersiveX-ray spectroscopy (EDX) (Oxford Instruments, Abingdon, UK) was used to analyzeelements present in the samples.
X-ray diffraction was performed on a DRON-3 diffractometer (Polysorb, Russia) usingCuKα radiation (λ = 1.54 Å). The number of carbon layers (n) in a crystallite along thec-axis direction was calculated by Equation (1) [32,33]:
n =Lc
d002+ 1 (1)
where Lc is the crystallite size and d002 is the interlayer distance. Lc parameter was calcu-lated using Sherrer’s formula with values of K = 0.9 [34].
The graphitization degree (g, %) was calculated by the Maire–Mering Equation (2) [35].
g =3.44 − d002
3.44 − 3.354(2)
Raman spectroscopy was performed using T64000 Horiba Jobin Yvon (Japan) (λ = 514 nm)spectrometer.
The study of the chemical composition of sample surfaces was done using X-ray pho-toelectron spectroscopy (XPS). The analysis was performed using a surface nano analysisspectrometer (SPECS GmbH, Berlin, Germany) equipped with a PHOIBOS-150 hemispher-ical analyzer and an XR-50M X-ray radiation source with double Al/Ag anode. Al Kα
monochromized radiation (h* = 1486.74 eV) was used for the study. The relative concentra-tions of elements in zones of analysis were determined based on the integral intensitiesof XPS spectral lines, taking into account the section of photoionization of correspondingterms. The spectra were deconvoluted by individual components. After subtracting thebaseline by the Shirley method, the experimental curve was decomposed to a set of linescorresponding to the photoemission of electrons from atoms in various surrounding chem-icals. CasaXPS software (2.3.24, Teignmouth, U.K.) was used for data treatment. The shapeof peaks was approximated with a symmetric function obtained by multiplying the Lorenzand Gauss functions.

Materials 2021, 14, 7687 4 of 17
The texture characteristics of the obtained carbon materials were studied using low-temperature nitrogen adsorption at 77 K using Quantachrome NOVA 1000 e adsorptionunit (Quantachrome Instruments, Boynton Beach, Florida, USA). Specific surface area wascalculated using the BET method. The surface area of the pores remaining after filling themicropores with the adsorbate was calculated by the comparative t-method (de Boor andLippens). Pore size distribution was calculated using the Barrett–Joyner–Halenda (BJH)method. The samples were preliminarily subjected to degassing in a vacuum at 50 Torr for5 h at 300 ◦C. The mass of one sample was around 0.01 g.
Thermogravimetry (TG) and differential scanning calorimetry (DSC) were carried outusing a STA 449C thermal analyzer (Netzsch, Selb, Germany). The heating was conductedin an Al2O3 crucible with a tip. The temperature of exfoliation of intercalated graphite wasdetermined in pure argon. The stability of EG samples toward oxidation was analyzed at aheating rate of 10 ◦C/min in a mixture of argon and oxygen.
3. Results and Discussion
Figure 2 shows the TG and DSC curves of intercalated graphite used for preparing EG.
Figure 2. TG/DSC curves of intercalated graphite (Ar, 2.5 ◦C/min).
The mass of the sample decreased during heating and there was a sharp drop inthe TG curve at 193 ◦C. According to the DSC curve, the onset of the exothermic peakattributed to exfoliation of the intercalated graphite (as a result of decomposition of graphiteintercalation compounds) was 267 ◦C, and this temperature can be treated as the beginningof thermal exfoliation [36]. The maximum of DSC peak was detected at 360 ◦C. It was notpossible to determine the end of the DSC peak, since the curve was noisy, and this effectwas repeated many times with intercalated graphite. It is interesting that the mass losscontinued during heating above 400 ◦C, although the value of loss within a temperaturerange 400–700 ◦C was 2.87%. This indicates the occurrence of additional processes ingraphite after its exfoliation.
SEM images of the samples subjected to programmable heating and thermal shockare shown in Figure 3 with SEM images of initial intercalated graphite (Figure 3a,b) shownfor comparison. Intercalated graphite showed morphology typical for graphite. Heatingof intercalated graphite induced the deformation of porous particles (Figure 3c,d) of thesample, with the appearance of cracks on the surface (Figure 3e,f).
Table 2 shows the EDX data of intercalated graphite and TEG1-400. The initial interca-lated graphite contained the following elements: mainly C (87.31 at.%), O (11.06 at.%), and

Materials 2021, 14, 7687 5 of 17
S (1.14 at.%), and traces of Al (0.06 at.%), Si (0.18 at.%), Cr (0.05 at.%), Fe (0.07 at.%), andCu (0.12 at.%).
The presence of sulfur and oxygen is mainly attributed to graphite intercalated com-pounds, the content of which decreased after thermal expansion of the sample. Thecomposition of intercalated graphite can indicate that the sample is represented by graphitebisulfate. The presence of chromium in the sample makes it possible to suggest thatK2Cr2O7 was used as an oxidizer for synthesis. According to data on thermal analysis,the DSC peak attributed to the decomposition of GICs (graphite bisulfate) is exothermic,whereas some studies [37,38] reported that it had an endothermic nature. An exothermicDSC peak appearing as a result of graphite bisulfate decomposition was also found in [39].Taking into account that the sample expansion was strong enough, there was also smallamount of residual elements present in the TEG1-400, attributed to the GICs (S, 0.29 wt.%;O, 5.60 wt.%). The presence of silicon, iron, and copper can be explained by their traceamounts in graphite used for commercial intercalated graphite. The sulfur content in IG isin agreement with EDX data reported in [29].
Table 2. Concentration of the main elements in the EG samples (EDX).
Element
Concentration, at.%
IntercalatedGraphite
TEG1-400
TEG1-500
TEG1-600
TEG1-700
TEG2-400
TEG2-1000
C 87.31 95.13 96.47 95.69 97.37 93.26 97.46
O 11.06 4.32 3.05 3.75 2.17 6.21 2.14
S 1.14 0.29 0.28 0.23 0.14 0.37 0.05
As can be seen, the EG sample had a porous structure that was more well-developedcompared to the intercalated graphite. Figure 4 shows the dependence of the bulk density ofEG synthesized by programmable heating on the synthesis temperature. The bulk densityof the samples obtained by programmable heating ranged from 0.017 to 0.058 g/cm3.Increasing the temperature of synthesis induced a decrease in bulk density; the highest bulkdensity value (0.058 g/cm3) was achieved at 400 ◦C. In addition, increasing the temperatureabove 500 ◦C led to an almost constant bulk density value (0.017–0.018 g/cm3) independentof the temperature. Temperatures above 700 ◦C were not used for the programmableheating method because of strong oxidation of EG beginning from 650–700 ◦C. The thermalshock method showed similar bulk density values (TEG2-400, 0.016 g/cm3; TEG2-1000,0.019 g/cm3), which are lower than that of TEG1-400 (0.058 g/cm3) due to higher pressureacting on the structural defects of the material during expansion at relatively high heatingrates of ~400 and 1000 ◦C/s.
The bulk density values were close to the values obtained in [28] for expanded graphitesynthesized from GICs with 200 mesh. This mesh size is close enough to the particle size ofIG, which was in a range of 100–200 µm.
The data on bulk density, yield, and texture characteristics are shown in Table 3.

Materials 2021, 14, 7687 6 of 17
Figure 3. SEM images of the samples: (a,b)–intercalated graphite; (c,d)–TEG1-400 sample, obtainedby programmable heating; (e,f)–TEG2-400 sample, obtained by thermal shock.
Table 3. Yield, bulk density, and textural characteristics of samples synthesized by programmableheating and thermal shock.
SampleTotal
SurfaceArea, m2/g
SurfaceArea of
Micropores,m2/g
SurfaceArea of
Mesopores,m2/g
Total PoreVolume,
cm3/g
AveragePore
Diameter,nm
Yield,%
BulkDensity,
g/cm3
TEG1-400 699 261 438 0.945 5.4 89.2 0.058
TEG1-500 626 163 463 0.736 4.7 79.0 0.018
TEG1-600 257 85 172 0.325 5.0 78.7 0.018
TEG1-700 229 95 134 0.231 4.0 77.8 0.017
TEG2-400 184 90 94 0.198 4.3 77.4 0.016
TEG2-1000 639 204 435 0.761 4.8 76.9 0.019

Materials 2021, 14, 7687 7 of 17
Figure 4. Dependence of bulk density of EG, synthesized by programmable heating, on the synthe-sis temperature.
One of the important characteristics showing the efficiency of the synthesis processis the yield of EG. Usually, the most of authors do not pay attention to yield, however itis extremely important for chemical engineering and further scale up of technology. Theyield was in the range of 77.8–89.2% and decreased with increasing temperature. Thehighest yield was reached at 400 ◦C, whereas the bulk density was relatively high, which isinappropriate for some applications (adsorption [40], catalysis [41,42], sealing materials [1],etc.) where this value must be lower. The bulk density of TEG1-500 sample is low enough,but the surface area and yield were lower compared to sample prepared at 400 ◦C. Thedifference in yield TEG1-400 and TEG1-500 was 10.2% and it is high enough. ThereforeTEG1-400 sample is better compared to other samples from technological and economicalpoints of view.
Specific surface area is linked to bulk density and yield. In particular, the highestsurface area of 699 m2/g corresponded to TEG1-400, and it decreased with increasingtemperature. The bulk density of the samples synthesized at 500–700 ◦C by programmableheating was almost the same, but the specific surface area changed significantly. Thesamples obtained using programmable heating and thermal shock were predominantlymesoporous, with a fraction of micropores within 26–41%, and for TEG1-400, TEG1-500,TEG1-600, and TEG1-700, it was 37.3, 26.0, 33.1, and 41.4%, respectively. Thus, increasingtemperature induces a decreasing fraction of mesopores. Probably increasing the tempera-ture above 500 ◦C leads to stronger “opening” of mesopores and micropores, leading todecreased fractions and reduced total surface area. The fraction of both micropores andmesopores in programmable heating decreases with increasing temperature. For thermalshock, the dependence is opposite, i.e., both micropores and mesopores increase.
The differences in porous structure of the samples can be seen in SEM images shownin Figures 3 and 5. The samples obtained using thermal shock look more porous comparedto those using programmable heating. However, the data on surface area showed that thedifference between the porous structure of samples is significant.

Materials 2021, 14, 7687 8 of 17
Figure 5. SEM images of the EG samples: TEG1-500 (a), TEG1-600 (b), TEG1-700 (c), TEG2-1000 (d).
Comparing the textural characteristics of samples obtained by programmable heatingand thermal shock, we can see that the samples synthesized by the former had a higherspecific surface area than the latter at higher yield. The yield of samples TEG2-400 andTEG2-1000 was 77.4 and 76.9%, respectively, due to the higher driving force of the thermalexpansion process at high temperature gradients.
The XRD pattern of the initial commercial intercalated graphite is shown in Figure 6a.
Figure 6. XRD patterns of the intercalated graphite and TEG1-400 (a) and 002 reflection of thesesamples (b).
The spectrum is represented by a wide peak around 2θ = 26◦, which consists oftwo main peaks: 2θ = 26.5◦, corresponding to graphite (d002 = 3.368 Å), and 2θ = 26.0◦,with an interlayer distance lower than that in pure graphite, corresponding to graphitebisulfate [43]. The EDX and XRD data suggest that the sample of initial intercalated
Materials 2021, 14, 7687 9 of 17
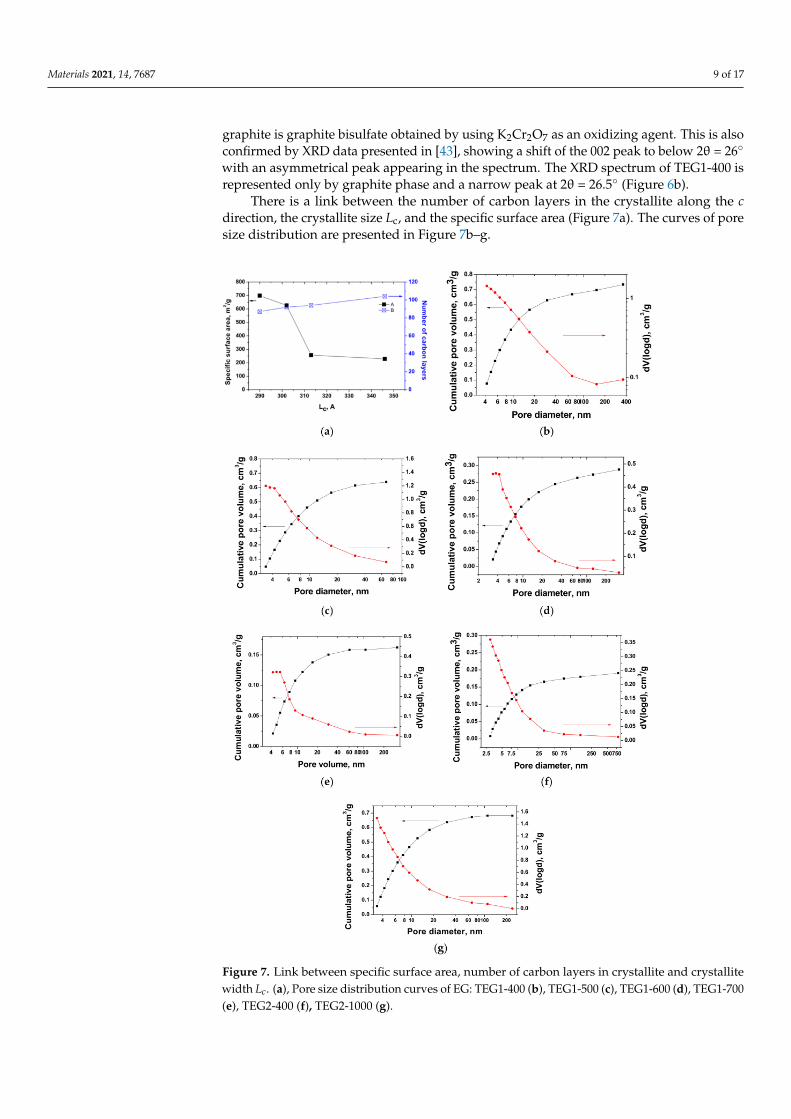
graphite is graphite bisulfate obtained by using K2Cr2O7 as an oxidizing agent. This is alsoconfirmed by XRD data presented in [43], showing a shift of the 002 peak to below 2θ = 26◦
with an asymmetrical peak appearing in the spectrum. The XRD spectrum of TEG1-400 isrepresented only by graphite phase and a narrow peak at 2θ = 26.5◦ (Figure 6b).
There is a link between the number of carbon layers in the crystallite along the cdirection, the crystallite size Lc, and the specific surface area (Figure 7a). The curves of poresize distribution are presented in Figure 7b–g.
Figure 7. Link between specific surface area, number of carbon layers in crystallite and crystallitewidth Lc. (a), Pore size distribution curves of EG: TEG1-400 (b), TEG1-500 (c), TEG1-600 (d), TEG1-700(e), TEG2-400 (f), TEG2-1000 (g).

Materials 2021, 14, 7687 10 of 17
This shows that the specific area decreases with the growth of crystallite size, and thevalue of Lc = 290 Å corresponds to the highest surface area (699 m2/g). The data of averagepore size confirm that the pore diameter of EG decreases when increasing temperatureusing programmable heating. Thermal shock led to the increase in average pore diameterwhen increasing temperature.
Isotherms of adsorption are presented in Supplementary Materials (Figure S2). Basedon the type of adsorption and desorption isotherms, it can be concluded that all EG sampleshave an inhomogeneous porous structure. All EG samples are characterized by a steep riseof the isotherm in the region P/P0 < 0.4 and up to P/P0 = 0.99, which indicates the presenceof micropores in the structure, which can have a positive effect on the sorption propertiesof the material. An insignificant loop of the capillary condensation hysteresis of the H4type is observed when increasing the relative pressure in the region P/P0 = 0.4–0.99 due tothe presence of slit-shaped mesopores [44]. The isotherms of the analyzed EG samples aredifficult to classify according to the generally accepted classification of physical sorptionisotherms adopted by IUPAC. The type of analyzed isotherms is most closely matchedwith IVa type from the proposed updated qualification of isotherms [45]. Type IV is typicalfor mesoporous adsorbents (e.g., mesoporous molecular sieves). In the case of type IVaisotherms, capillary condensation is accompanied by a slight hysteresis of the H4 type.This occurs when the pore width exceeds a certain critical width, which depends on theadsorption system and temperature, which is typical for cylindrical, narrowed, and slit-likepores with a diameter of ~4 nm.
The FTIR spectra of typical TEG1-400 and IG samples are shown in Figure 8.
Figure 8. FTIR spectra of IG and TEG1-400.
The IG and expanded graphite spectra show the presence of O–H vibrations (3500 cm−1),C=C stretching vibrations (1642 cm−1), and CO stretching vibrations (1750 cm−1) [29,46].The IG spectrum shows an C=S stretching band at 1050 cm−1, the intensity of whichdecreased after exfoliation [47].

Materials 2021, 14, 7687 11 of 17
Raman spectra and the parameters of spectra of EG are presented in Figure 9 andTable 4. Raman spectrum of IG is presented in Supplementary Materials (Figure S1).
Figure 9. Raman spectra of samples synthesized by programmable heating (a) and thermal shock (b).
Table 4. Raman spectroscopy data of EG samples.
Sample D Peak Position,cm−1
DFWHM,cm−1
G Peak Position,cm−1
GFWHM,cm−1 I (D)/I (G)
TEG1-400 1357 53 1584 20 0.1
TEG1-500 1359 19 1584 17 0.0104
TEG1-600 1355 36 1584 16 0.0125
TEG1-700 1357 33 1584 18 0.038
TEG2-400 1357 22 1584 17 0.014
TEG2-1000 1357 22 1584 15 0.007
There were D and G bands typical for graphite materials presented in Raman spectracorresponded to disorder in graphite and E2g mode of graphite related to sp2 bondedatoms [48]. The position of G peak remained unchanged for the entire set of samples. Dand G peaks became narrow when increasing the temperature of graphite expansion. Theratio of intensity of peaks I (D)/I (G) was low enough indicating perfect crystallinity ofexpanded graphites. The highest I (D)/I (G) ratio attributed to defectiveness of EG wasshown by TEG1-400 and it decreased as the temperature rise. The difference of I (D)/I(G) ratio of samples TEG1-400 and TEG2-400 obtained using programmable heating andthermal shock is high enough (0.1 and 0.014, respectively), and it is in agreement withtextural characteristics shown in Table 3. The data corresponded to samples obtained bythermal shock showed the deeper removal of GICs from the material making it closerto pure graphite, i.e., material with high graphitization degree. The difference of I (D)/I(G) ratio of TEG1-400 and TEG2-400 (0.1 and 0.014, respectively) samples is in agreementwith data of textural characteristics. It was supposed that the higher expansion degree thehigher defectiveness. The gas phase formed as a result of decomposition of GICs passesthrough the certain defect regions in the sample obtained using thermal shock. The numberof regions through which the gas phase penetrates in the sample TEG1-400 is higher sinceits pressure is not so high as in thermal shock. It means that the samples obtained usingprogrammable heating will have higher defectiveness compared to thermal shock becauseof larger number of defect regions available for gas phase pathways. Higher temperaturegradients lead to contribution of only limited defects which were immediately expandedand the subsequent drop in driving force decelerates the expansion.

Materials 2021, 14, 7687 12 of 17
According to XPS, the typical C1s spectra of IG and EG consist of four main com-ponents corresponding to C=C (284.5 eV), C-O (286.5 eV), C=O (288 eV), and O-C=O(288.8 eV) groups (Figure 10) [49,50].
Figure 10. C1s XPS spectra of intercalated graphite (a) and TEG1-400 sample (b); O1s spectra of intercalated graphite andTEG1-400 sample (c).
The fractions of these components for IG were 96.7%, 2.8%, 0.3%, and 0.2%, respec-tively; after exfoliation (TEG1-400), they were 92.9%, 5.6%, 1.1%, and 0.4%, respectively.Exfoliation led to an increase in the C=C component of the C1s spectrum attributed tocarbon bonding with carbon in sp2 hybridization. It also induced the removal of C-O andC=O groups from the intercalated graphite during heating, whereas the concentrationof carboxyls decreased slightly. This confirms the thermodynamic stability of carboxylicgroups with respect to heating. However, some articles reported that the temperaturerange of the release of carboxylic groups was 100–250 ◦C [51].
The O1s spectrum of intercalated graphite is represented by a peak at 531.5 eV at-tributed to oxygen in SOx groups, a peak at 532.5 eV attributed to oxygen in C=O groups,and two peaks at 533.6 and 535.1–535.7 eV corresponding to OH groups and water, re-spectively (Figure 10c). This gives us additional confirmation of the presence of graphitebisulfate in the initial sample used for exfoliation.

Materials 2021, 14, 7687 13 of 17
The oxidation resistance of expanded graphite is an extremely important characteristiclinked to defectiveness, specific surface area, and chemical composition. DSC makes itpossible to estimate the dynamics of oxidation of EGs obtained using two methods underconsideration. The results of the analysis of DSC data on EG thermal oxidation are shownin Table 5.
Table 5. Analysis of DSC peak of oxidation of EG samples.
Sample Peak Onset,Tonset (◦C)
Peak Maximum,Tmax (◦C)
Peak End, Tend(◦C)
Heat Release,J/g
TEG1-400 652 740 800 9582
TEG1-500 675 764 812 12,207
TEG1-600 639 748 829 12,975
TEG1-700 637 753 828 12,789
TEG2-400 642 773 841 11,967
TEG2-1000 641 733 803 13,773
It can be seen that the oxidation process of EG has a dependence on the synthesistemperature for the samples obtained using programmable heating. The DSC curves of EGsamples are shown in Figure 11.
Figure 11. DSC curves of EG samples (10 K/min) (exo down).
For example, the TEG1-500 sample showed higher temperature oxidation at the be-ginning and the highest temperature at the maximum DSC peak. The increased synthesistemperature makes the DSC exothermic oxidation peak broader compared with the rel-atively narrow peaks for the TEG1-400 and TEG1-500 samples. The TEG1-400 sampleshowed the lowest heat release during oxidation of 9582 J/g. The EG obtained had alarge surface area along with high graphitization degree, accompanied by high onset oxi-dation temperature, which makes it a good candidate for catalysis (catalyst support forhigh-temperature processes) and electrochemistry (as a material with good conductivityand porosity).
It is worth noting that the oxidation resistance of the EG obtained was high enough,higher than that of various porous graphites, and can be compared to the expanded graphite

Materials 2021, 14, 7687 14 of 17
coated with SiC (expanded graphite +25 or 100 vol.% silane coupling agent) synthesizedin [52], graphite foil obtained from expandable graphite modified with boric acid [53], andboron oxide modified graphite foil reported by Savchenko et al. [54].
According to the data presented above, programmable heating is an alternative wayto improve the textural properties and to obtain porous expanded graphite. Table 6 showsa comparison of the specific surface area of expanded graphite obtained in this work withdata reported in the literature. As can be seen, the EG synthesized in this study significantlyexceeds other samples, and its specific surface area is about 100–200 m2/g higher than thatof expanded graphite obtained from graphite oxide or graphene oxide, which makes thisapproach very attractive for practical applications. The high specific surface area of EGobtained by programmable heating can be explained by the relatively low heating rate,which makes it possible for the balloon walls in the cells to expand more gradually, whilethermal shock is rapid heating that results in fast formation of expanded cells occurringsimultaneously with the formation of defects in the graphite structure. These defects arepaths for the gas phase formed as a result of the decomposition of GICs. Since thermalshock has an extremely high heating rate, these defective regions expand rapidly andthe gas phase leaves the cell. This effect of “bleeding” of gas leads to the expansion of acertain small number of pores, leaving the remaining pores almost unexpanded. Comparedwith thermal shock, the heating rate used in programmable heating is low enough that itpreserves some defects from rapid expansion and the gas phase stays in the balloon cell.Thus, the number of pores formed is higher and the specific surface area is high enough.
Table 6. Surface area values of expanded graphite and related materials reported in literature depending on precursor type,synthesis technique, and synthesis temperature.
Material Precursor Specific SurfaceArea (BET), m2/g
SynthesisTechnique
SynthesisTemperature, ◦C Reference
Expanded graphite Intercalated graphite 678 Programmableheating (20 ◦C/min) 400 This work
Expanded graphiteGraphite oxide
(modified Hummersmethod)
400 Thermal shock(1570 ◦C/min) 500–900 [55]
Expanded graphite Graphite bisulfate 77 Thermal shock 1300 [1]
Expanded graphiteGraphene
oxide(Hummersmethod)
466 Exfoliation inaqueous media n/a [56]
Expanded graphite
Expandable naturalgraphite flake (interca-lated by using sulfuric
acid) from
45 Thermal shock 900 [21]
Expanded graphite Expandable graphite(H2SO4–GIC) 10–40 Thermal shock 400–1000 [57]
Expanded graphite Expandable graphite 22.4 Thermal shock 600 [58]
Sulfur-freeExpanded graphite GIC 245 Thermal shock 950 [9]
Re-expanded EG Expanded EG 33.5 Thermal shock 800 [59]
It is worth noting that the heating rate in the programmable heating method is ananalogue of residence time, a value usually used in chemical engineering to describe theresidence of reagent in a reactor or other apparatus. The higher the heating rate, the lowerthe residence time, and vice versa.
In conclusion, it can be noted that the method of programmable heating makes itpossible to obtain highly porous material at relatively moderate temperatures (400–500 ◦C)with higher yield. The advantage of this method is the possibility to increase the time

Materials 2021, 14, 7687 15 of 17
of exposure of intercalated graphite in the furnace. At the same time, this method ismore flexible than thermal shock because it allows for the possibility to vary the texturalproperties, yield, and bulk density in a wide range.
4. Conclusions
In this study, the highly porous expanded graphite was synthesized by the pro-grammable heating technique using heating with a constant rate (20 ◦C/min) from roomtemperature to 400–700 ◦C. A comparison between programmable heating and thermalshock as methods of producing expanded graphite showed its efficiency at an extremelylow temperature (400 ◦C), and the surface area reached 699 and 184 m2/g. It was found thatthe novel method of production of expanded graphite from intercalated graphite made itpossible to obtain a relatively higher yield (78–90%). The EG obtained using programmableheating had a large surface area along with high graphitization degree, accompaniedby high onset oxidation temperature, which makes it a good candidate for catalysis andelectrochemistry. The programmable heating led to obtaining predominantly mesoporousexpanded graphites. The advantage of this method is the possibility to increase the time ofexposure of intercalated graphite in the furnace. This method is more flexible than thermalshock because it allows for the possibility to vary the textural properties, yield, and bulkdensity in a wider range.
Supplementary Materials: The following are available online at https://www.mdpi.com/article/10.3390/ma14247687/s1, Figure S1: Raman spectrum of the intercalated graphite, Figure S2: Isothermsof adsorption of expanded graphites: TEG1-400 (a), TEG1-500 (b), TEG1-600 (c), TEG1-700 (d),TEG2-400 (e), TEG2-1000 (f).
Author Contributions: Methodology, writing—original draft preparation, supervision, A.G.B.,A.A.S., N.I.L., N.S.L.; writing—review and editing, A.G.B.; resources, M.V.P.; investigation, A.V.U.,E.A.M., I.Y.P., P.B.K. All authors participated in the discussions of the results. All authors have readand agreed to the published version of the manuscript.
Funding: The work was funded by the State task of Ministry of Science and Higher Education ofRussia (project no. FSUN-2020-0008).
Institutional Review Board Statement: Not applicable.
Informed Consent Statement: Not applicable.
Conflicts of Interest: The authors declare no conflict of interest.
References1. Sorokina, N.E.; Redchitz, A.V.; Ionov, S.G.; Avdeev, V.V. Different exfoliated graphite as a base of sealing materials. J. Phys. Chem.
Solids 2006, 67, 1202–1204. [CrossRef]2. Pandey, I.; Tiwari, J.D.; Saha, T.K.; Khosla, A.; Furukawa, H.; Sekhar, P.K. Black carbon paper based polyanthraquinone coated
exfoliated graphite for flexible paper battery. Microsyst. Technol. 2019, 3, 1–9. [CrossRef]3. Huang, L.; Rao, W.; Fan, L.; Xu, J.; Bai, Z.; Xu, W.; Bao, H. Paper electrodes coated with partially-exfoliated graphite and
polypyrrole for high-performance flexible supercapacitors. Polymers 2018, 10, 135. [CrossRef] [PubMed]4. Raghunandanan, A.; Yeddala, M.; Padikassu, P.; Pitchai, R. Partially Exfoliated Graphite Paper as Free-Standing Electrode for
Supercapacitors. ChemistrySelect 2018, 3, 5032–5039. [CrossRef]5. Pajarito, B.B.; Cayabyab, C.A.L.; Costales, P.A.C.; Francisco, J.R. Exfoliated graphite/acrylic composite film as hydrophobic
coating of 3D-printed polylactic acid surfaces. J. Coat. Technol. Res. 2019, 16, 1133–1140. [CrossRef]6. Berdyugina, I.S.; Steksova, Y.P.; Shibaev, A.A.; Maksimovskii, E.A.; Bannov, A.G. Thermal degradation of epoxy composites based
on thermally expanded graphite and multiwalled carbon nanotubes. Russ. J. Appl. Chem. 2016, 89, 1447–1453. [CrossRef]7. Yim, Y.-J.; Park, S.-J. Effect of silver-plated expanded graphite addition on thermal and electrical conductivities of epoxy
composites in the presence of graphite and copper. Compos. Part A Appl. Sci. Manuf. 2019, 123, 253–259. [CrossRef]8. Bannov, A.G.; Nazarenko, O.B.; Maksimovskii, E.A.; Popov, M.V.; Berdyugina, I.S. Thermal behavior and flammability of epoxy
composites based on multi-walled carbon nanotubes and expanded graphite: A comparative study. Appl. Sci. 2020, 10, 6928.[CrossRef]
9. He, J.; Song, L.; Yang, H.; Ren, X.; Xing, L. Preparation of Sulfur-Free Exfoliated Graphite by a Two-Step Intercalation Process andIts Application for Adsorption of Oils. J. Chem. 2017, 2017, 1–8. [CrossRef]

Materials 2021, 14, 7687 16 of 17
10. Rachiy, B.I.; Budzulyak, I.M.; Ivanenko, E.A.; Revo, S.L. A composite of nanoporous carbon and thermally exfoliated graphite asan effective electrode material for supercapacitors. Surf. Eng. Appl. Electrochem. 2015, 51, 501–508. [CrossRef]
11. Bannov, A.G.; Yusin, S.I.; Timofeeva, A.A.; Dyukova, K.D.; Ukhina, A.V.; Maksimovskii, E.A.; Popov, M.V. Synthesis of exfoliatedgraphite and its use as an electrode in supercapacitors. Prot. Met. Phys. Chem. Surf. 2016, 52, 645–652. [CrossRef]
12. Dong, X.; Chen, H.; Lai, H.; Wang, L.; Wang, J.; Fang, W.; Gao, C. A graphitized expanded graphite cathode for aluminum-ionbattery with excellent rate capability. J. Energy Chem. 2022, 66, 38–44. [CrossRef]
13. Hou, S.; Li, J.; Huang, X.; Wang, X.; Ma, L.; Shen, W.; Kang, F.; Huang, Z.-H. Silver nanoparticles-loaded exfoliated graphite andits anti-bacterial performance. Appl. Sci. 2017, 7, 852. [CrossRef]
14. Mangu, R.; Rajaputra, S.; Singh, V.P. MWCNT-polymer composites as highly sensitive and selective room temperature gas sensors.Nanotechnology 2011, 22, 215502. [CrossRef]
15. Wu, K.-H.; Huang, W.-C.; Hung, W.-C.; Tsai, C.-W. Modified expanded graphite/Fe3O4 composite as an adsorbent of methyleneblue: Adsorption kinetics and isotherms. Mater. Sci. Eng. B 2021, 266, 115068. [CrossRef]
16. Chen, X.; Li, H.; Zeng, T.; Zhang, Y.; Wan, Q.; Li, Y.; Yang, N. Three-dimensional catalyst systems from expanded graphite andmetal nanoparticles for electrocatalytic oxidation of liquid fuels. Nanoscale 2019, 11, 7952–7958. [CrossRef]
17. Saidaminov, M.I.; Maksimova, N.V.; Zatonskih, P.V.; Komarov, A.D.; Lutfullin, M.A.; Sorokina, N.E.; Avdeev, V.V. Thermaldecomposition of graphite nitrate. Carbon 2013, 59, 337–343. [CrossRef]
18. Yin, G.; Sun, Z.; Gao, Y.; Xu, S. Preparation of expanded graphite for malachite green dye removal from aqueous solution.Microchem. J. 2021, 166, 106190. [CrossRef]
19. Jin, S.; Xie, L.S.; Ma, Y.L.; Han, J.J.; Xia, Z.; Zhang, G.X.; Dong, S.M.; Wang, Y.Y. Low-temperature expanded graphite forpreparation of graphene sheets by liquid-phase method. J. Phys. Conf. Ser. 2009, 188, 012040. [CrossRef]
20. Yakovlev, A.V.; Finaenov, A.I.; Zabud’kov, S.L.; Yakovleva, E.V. Thermally expanded graphite: Synthesis, properties, and prospectsfor use. Russ. J. Appl. Chem. 2006, 79, 1741–1751. [CrossRef]
21. Hong, X.; Chung, D.D.L. Exfoliated graphite with relative dielectric constant reaching 360, obtained by exfoliation of acid-intercalated graphite flakes without subsequent removal of the residual acidity. Carbon 2015, 91, 1–10. [CrossRef]
22. Afanasov, I.M.; Shornikova, O.N.; Vlasov, I.I.; Kogan, E.V.; Seleznev, A.N.; Avdeev, V.V. Porous carbon materials based onexfoliated graphite. Inorg. Mater. 2009, 45, 135–139. [CrossRef]
23. Li, M.; Liu, J.; Pan, S.; Zhang, J.; Liu, Y.; Liu, J.; Lu, H. Highly Oriented Graphite Aerogel Fabricated by Confined Liquid-PhaseExpansion for Anisotropically Thermally Conductive Epoxy Composites. ACS Appl. Mater. Interfaces 2020, 12, 27476–27484.[CrossRef] [PubMed]
24. Van Heerden, X.; Badenhorst, H. The influence of three different intercalation techniques on the microstructure of exfoliatedgraphite. Carbon 2015, 88, 173–184. [CrossRef]
25. Yu, Z.; Nan, F.; Su, L.; Zhang, S.; He, Y. Effect of Ammonium Bicarbonate on Intercalation and Exfoliation of Graphite Materials. J.Nanomater. 2019, 2019, 1–8. [CrossRef]
26. Chung, D.D.L. A review of exfoliated graphite. J. Mater. Sci. 2015, 51, 554–568. [CrossRef]27. Wang, A.; Chung, D.D.L. Dielectric and electrical conduction behavior of carbon paste electrochemical electrodes, with decoupling
of carbon, electrolyte and interface contributions. Carbon 2014, 72, 135–151. [CrossRef]28. Goudarzi, R.; Motlagh, G.H. The effect of graphite intercalated compound particle size and exfoliation temperature on porosity
and macromolecular diffusion in expanded graphite. Heliyon 2019, 5, e02595. [CrossRef]29. Asghar, H.M.A.; Hussain, S.N.; Sattar, H.; Brown, N.W.; Roberts, E.P.L. Environmentally friendly preparation of exfoliated
graphite. J. Ind. Eng. Chem. 2014, 20, 1936–1941. [CrossRef]30. Asghar, H.M.A.; Hussain, S.N.; Sattar, H.; Brown, N.W.; Roberts, E.P.L. Potential Graphite Materials for the Synthesis of GICs.
Chem. Eng. Commun. 2015, 202, 508–512. [CrossRef]31. Seredych, M.; Tamashausky, A.V.; Bandosz, T.J. Surface features of exfoliated graphite/bentonite composites and their importance
for ammonia adsorption. Carbon 2008, 46, 1241–1252. [CrossRef]32. Manoj, B.; Kunjomana, A.G. Study of stacking structure of amorphous carbon by X-ray diffraction technique. Int. J. Electrochem.
Sci. 2012, 7, 3127–3134.33. Bannov, A.G.; Uvarov, N.F.; Ukhina, A.V.; Chukanov, I.S.; Dyukova, K.D.; Kuvshinov, G.G. Structural changes in carbon nanofibers
induced by ball milling. Carbon 2012, 50, 1090–1098. [CrossRef]34. Shiraishi, M.; Inagaki, M. Chapter 10—X-ray Diffraction Methods to Study Crystallite Size and Lattice Constants of Carbon
Materials. In Carbon Alloys; Yasuda, E., Inagaki, M., Kaneko, K., Endo, M., Oya, A., Tanabe, Y.B.T.-C.A., Eds.; Elsevier Science:Oxford, UK, 2003; pp. 161–173. ISBN 978-0-08-044163-4.
35. Maire, J.; Mering, J. Chemistry and Physics of Carbon; CRC Press: Boca Raton, FL, USA, 1975.36. Bannov, A.G.; Popov, M.V.; Kurmashov, P.B. Thermal analysis of carbon nanomaterials: Advantages and problems of interpreta-
tion. J. Therm. Anal. Calorim. 2020, 142, 349–370. [CrossRef]37. Leshin, V.S.; Sorokina, N.E.; Avdeev, V.V. Electrochemical synthesis and thermal properties of graphite bisulfate. Inorg. Mater.
2004, 40, 649–655. [CrossRef]38. Huang, J.; Tang, Q.; Liao, W.; Wang, G.; Wei, W.; Li, C. Green Preparation of Expandable Graphite and Its Application in
Flame-Resistance Polymer Elastomer. Ind. Eng. Chem. Res. 2017, 56, 5253–5261. [CrossRef]39. Hong, Y.; Wang, Z.; Jin, X. Sulfuric acid intercalated graphite oxide for graphene preparation. Sci. Rep. 2013, 3, 1–6. [CrossRef]

Materials 2021, 14, 7687 17 of 17
40. Xu, C.; Jiao, C.; Yao, R.; Lin, A.; Jiao, W. Adsorption and regeneration of expanded graphite modified by CTAB-KBr/H3PO4 formarine oil pollution. Environ. Pollut. 2018, 233, 194–200. [CrossRef]
41. Li, W.; Han, C.; Liu, W.; Zhang, M.; Tao, K. Expanded graphite applied in the catalytic process as a catalyst support. Catal. Today2007, 125, 278–281. [CrossRef]
42. Lan, R.; Su, W.; Li, J. Preparation and catalytic performance of expanded graphite for oxidation of organic pollutant. Catalysts2019, 9, 280. [CrossRef]
43. Salvatore, M.; Carotenuto, G.; De Nicola, S.; Camerlingo, C.; Ambrogi, V.; Carfagna, C. Synthesis and Characterization of HighlyIntercalated Graphite Bisulfate. Nanoscale Res. Lett. 2017, 12, 1–8. [CrossRef]
44. Sing, K.S.W.; Williams, R.T. Physisorption hysteresis loops and the characterization of nanoporous materials. Adsorpt. Sci. Technol.2004, 22, 773–782. [CrossRef]
45. Thommes, M.; Kaneko, K.; Neimark, A.V.; Olivier, J.P.; Rodriguez-Reinoso, F.; Rouquerol, J.; Sing, K.S.W. Physisorption of gases,with special reference to the evaluation of surface area and pore size distribution (IUPAC Technical Report). Pure Appl. Chem.2015, 87, 1051–1069. [CrossRef]
46. Zaaba, N.I.; Foo, K.L.; Hashim, U.; Tan, S.J.; Liu, W.W.; Voon, C.H. Synthesis of Graphene Oxide using Modified HummersMethod: Solvent Influence. Procedia Eng. 2017, 184, 469–477. [CrossRef]
47. Greenwood, N.N. Spectroscopic Properties of Inorganic and Organometallic Compounds; Royal Society of Chemistry: London, UK,2007; Volume 5, p. 630. [CrossRef]
48. Hao, R.; Qian, W.; Zhang, L.; Hou, Y. Aqueous dispersions of TCNQ-anion-stabilized graphene sheets. Chem. Commun. 2008, 48,6576–6578. [CrossRef] [PubMed]
49. Marcano, D.C.; Kosynkin, D.V.; Berlin, J.M.; Sinitskii, A.; Sun, Z.; Slesarev, A.; Alemany, L.B.; Lu, W.; Tour, J.M. Improvedsynthesis of graphene oxide. ACS Nano 2010, 4, 4806–4814. [CrossRef]
50. Seredych, M.; Tamashausky, A.V.; Bandosz, T.J. Graphite oxides obtained from porous graphite: The role of surface chemistry andtexture in ammonia retention at ambient conditions. Adv. Funct. Mater. 2010, 20, 1670–1679. [CrossRef]
51. Justh, N.; Berke, B.; László, K.; Szilágyi, I.M. Thermal analysis of the improved Hummers’ synthesis of graphene oxide. J. Therm.Anal. Calorim. 2018, 131, 2267–2272. [CrossRef]
52. Liao, N.; Li, Y.; Shan, J.; Zhu, T.; Sang, S.; Jia, D. Improved oxidation resistance of expanded graphite through nano SiC coating.Ceram. Int. 2018, 44, 3319–3325. [CrossRef]
53. Saidaminov, M.I.; Maksimova, N.V.; Avdeev, V.V. Expandable graphite modification by boric acid. J. Mater. Res. 2012, 27,1054–1059. [CrossRef]
54. Savchenko, D.V.; Serdan, A.A.; Morozov, V.A.; van Tendeloo, G.; Ionov, S.G. Improvement of the oxidation stability and themechanical properties of flexible graphite foil by boron oxide impregnation. New Carbon Mater. 2012, 27, 12–18. [CrossRef]
55. Qiu, Y.; Moore, S.; Hurt, R.; Külaots, I. Influence of external heating rate on the structure and porosity of thermally exfoliatedgraphite oxide. Carbon 2017, 111, 651–657. [CrossRef]
56. Stankovich, S.; Dikin, D.; Piner, R.D.; Kohlhaas, K.; Kleinhammes, A.; Jia, Y.; Wu, Y.; Nguyen, S.T.; Ruoff, R.S. Synthesis ofgraphene-based nanosheets via chemical reduction of exfoliated graphite oxide. Carbon 2007, 45, 1558–1565. [CrossRef]
57. Kang, F.; Zheng, Y.-P.; Wang, H.-N.; Nishi, Y.; Inagaki, M. Effect of preparation conditions on the characteristics of exfoliatedgraphite. Carbon 2002, 40, 1575–1581. [CrossRef]
58. Tichapondwa, S.M.; Tshemese, S.; Mhike, W. Adsorption of phenol and chromium (VI) pollutants in wastewater using exfoliatedgraphite. Chem. Eng. Trans. 2018, 70, 847–852. [CrossRef]
59. Krawczyk, P.; Gurzeda, B. Electrochemical properties of exfoliated graphite affected by its two-step modification. J. Solid StateElectrochem. 2016, 20, 361–369. [CrossRef]