A Batch-Fabricated Single-Layer Elastomeric Actuator With Corrugated Surface

Electrically conductive composites based onan elastomeric matrix filled with expandedgraphite as a potential oil sensing material
Igor Krupa1a,2, Martin Prostredný2,3, Zdenko Špitalský2, Juraj Krajči2 andMariam Ali S AlMaadeed1,4
1a QAPCO Polymer Chair, Center for Advanced Materials, Qatar University, PO Box 2713 Doha, Qatar1 Center for Advanced Materials, Qatar University, PO Box 2713 Doha, Qatar2 Polymer Institute, Slovak Academy of Sciences, Dubravska cesta 9, 845 41 Bratislava, Slovakia3 Institute of Polymer Materials, Faculty of Chemical and Food Technology, Slovak University ofTechnology, in Bratislava, Radlinského 9, 812 37 Bratislava, Slovakia4Materials Science and Technology Program, Qatar University, PO Box 2713, Doha, Qatar
E-mail: [email protected]
Received 18 March 2014, revised 18 September 2014Accepted for publication 24 September 2014Published 30 October 2014
AbstractThe preparation and properties of electrically conductive polymeric composites based on anelastomer matrix (styrene-isoprene styrene block copolymer) filled with expanded graphite arereported in this paper. The developed materials were tested as oil sensors in various modes. Theoperation of this sensor is based on changes in the electrical resistance R of the composites whenexposed to oil. This phenomenon involves both simple geometrical changes and changes ininherent material characteristics such as the specific electrical conductivity (resistivity). Anoriginal method for the improvement of the sensors’ response rate based on the application ofstretched sensing films was developed. Slightly stretched films (by 4% of the original length)showed a response that was 12.5 times faster with respect to oil absorption than an un-stretchedfilm. The specific electrical conductivity of a material strongly depends on the extent to which itis stretched. For a composite filled with 10 wt.% of the filler, it was found that the electricalconductivity remained constant up to 11% of the sample extension before sharply decreasing. Itwas also found that an increase in the filler content reduced the response rate of the sensors.
Keywords: oil sensor, expanded graphite, elastomer, composite
(Some figures may appear in colour only in the online journal)
1. Introduction
Oil constitutes a major source of water contamination. Oilspills may be caused by releases of crude oil from tankers,offshore platforms, or drilling rigs and wells and may includethe spill of refined petroleum products (e.g. gasoline anddiesel fuel) and their by-products from heavier fuels used bylarge ships (e.g. bunker fuel) or from the spill of any oilyrefuse or waste oil. Significant amounts of oil also enter themarine environment via the seepage of natural oil [1]. Oilspills can be controlled by chemical dispersion, combustion,mechanical containment and/or adsorption. However, the first
step is frequent monitoring to ensure regulatory compliance.Considerable effort has been devoted to developing sensitive,reliable, low-cost and autonomous analytical tools that can bedirectly employed in the field [2]. Chemical sensors should beable to provide rapid and real-time quantitative informationregarding hydrocarbon-derived contaminants in the biosphere[3, 4]. Various devices capable of monitoring oil pollutantsare commercially available, and they mainly measure UVfluorescence, light scattering, capacitance, electromagneticabsorption and other properties. These devices are usuallyrelatively large (e.g. require water to be pumped in) and arethus expensive and consume significant amounts of energy.
Smart Materials and Structures
Smart Mater. Struct. 23 (2014) 125020 (9pp) doi:10.1088/0964-1726/23/12/125020
0964-1726/14/125020+09$33.00 © 2014 IOP Publishing Ltd Printed in the UK1

Recently, mass-based sensors that use piezoelectric trans-duction (e.g. quartz crystal microbalance and surface acousticwaves) have been considered promising analytical tools forthe detection of a wide range of organic compounds in water[5]. One alternative is represented by electrically conductivepolymeric composites or by nanocomposites, which areconsidered prospective materials for gas and liquid sensing.The sensing materials research community is currentlyfocused on developing new materials that are based onpolymeric matrices with a certain permeability modified witha filler material, preferably carbon nanotubes or graphene.These fillers ensure an appropriate level of electrical con-ductivity of the material at a low filler content. The factorsdriving nanostructured materials research are the expectedlow cost, low operating temperature (for instance, commercialgas sensors based on metal oxides that operate at temperaturesof 200–500 °C and consume energy) and the ease of fabri-cation of such material into various shapes. Numerous sensordesigns based on carbon nanotubes (CNTs) in particular havebeen proposed [6, 7]. For example, as clearly summarized in[7], the proposed designs include CNTs that are partiallyembedded in a polymer matrix [8], CNTs arranged in a densenetwork on polymer surfaces or fibers [9] and CNTs fullyembedded in a polymer matrix. The solution casting ofpolymer-nanotube dispersions is a very promising method forsensor preparation using thin films [10–13] as well as layer-by-layer assembly [14]. In the context of the large-scaleprocessing of sensory materials, fully embedded CNTs havethe most potential because these materials can be producedusing cost-efficient and tailored melt processing techniquessuch as injection or compression molding [15, 16], blowmolding, and fiber spinning [17].
The operation of graphene-based polymeric nano-composites [18, 19] sensors is based on changes in theelectrical conductivity of graphene due to graphene-analyteinteractions or the swelling of the polymeric matrix. How-ever, while these analyte-substrate interactions are the drivingforce for gas sensing in particular, swelling affects are muchmore important in the detection of liquids. If a solvent is ableto diffuse into the polymer matrix, the resulting expansioninduces an increase in the interparticle distance betweenneighboring filler particles, which reduces the tunneling cur-rent. Therefore, the resistivity of the filler network increaseswith swelling. When the critical tunneling distance is excee-ded, which is approximately 1.8 nm [20], individual grapheneparticles and clusters are separated from the network [21]. Inthis work, expanded graphite was used as an electricallyconductive filler. Expanded graphite (EG) is considered to bethe best material for the large-scale preparation of grapheneparticles; however, it requires an optimized route for com-posite preparation via ultrasonic or intensive shear mixing,which is usually accomplished by the surface treatment ofgraphitic particles [22].
In this paper, we report on the oil sensing ability ofcomposites based on a polymeric matrix, namely styrene-isoprene-styrene (SIS) block copolymer, filled with expandedgraphite. SIS is an elastomer that, due to its high isoprenecontent, is able to swell easily if exposed to oil. Moreover, the
polystyrene phase possesses physical crosslinks that make thematerial highly stretchable, even if filled with a high amountof the EG. Composites filled with 20 wt.% of EG can beextended over 1000%. The reversible elasticity of highly fil-led composites is one of the features that are exploited insensor design, as will be discussed later.
The operation of this sensor is based on changes in theelectrical resistance R of the composites when exposed to oil.An original method for the improvement of the sensors’response rate based on the application of stretched sensingfilms was developed. As far as we know, such systems havenot been published yet. The stretchable electrically con-ductive polymeric composites are usually reported as pressuresensors. Elastic electrically conductive composites are usuallyapplied as pressure sensors. For example, Yazdani et al [23]reported a study on the strain sensitivity response of thepolyvinylchloride/carbon black composites’ electrical con-ductivity exposed to cyclic tensile loading. This study wasfocused on the development of sensor-enabled geogrids forperformance-monitoring of reinforced earth structures. Astretchable resistive pressure sensor is achieved by coating acompressible substrate with a highly stretchable electrode, asfound by Choong et al [24]. Their set-up was composed by anarray of microscale pyramidal features, and the electrode wascomprised of a polymer composite. When the pressure-induced geometrical change was maximized at 40% elonga-tion, a sensitivity of 10.3 kPa−1 was achieved.
In this work, no surface treatment of EG was performeddue to reasons that will be clarified later. Scanning electronmicroscopy (SEM) and x-ray diffraction (XRD) wereemployed to investigate the exfoliation of EG within the SISmatrix. The thickness of the lamella was observed to decreaseas a function of the exfoliation of the EG grains; however, thisdid not lead to total sheet separation. XRD spectra also helpedidentify a large fraction of the bulk graphite phase within theSIS matrix. These findings did not allow to us to refer to thesematerials as ‘nanocomposites’ or to the filler as ‘graphene’;therefore, the materials reported here will be referred to ascomposites based on the expanded graphite.
1.1. Sensor design
The electrical conductivity of composites is very sensitive togeometrical changes, particularly if the filler content is closeto the percolation threshold. It is known that a small increasein the filler content can greatly enhance the conductivity ofmaterials; likewise, a small decrease in the filler content cancause a decrease in the conductivity. However, a significantchange in the electrical conductivity can also be induced bygeometrical changes in the matrix. For example, if the volumeof the matrix increases, the filler concentration in the systemwill show a proportional decrease. Therefore, close to thepercolation threshold, an increase in the volume of a sampleshould result in a sharp decrease in the conductivity. How-ever, even if the change in the electrical conductivity is not sodramatic, the induced change from a more conductive mate-rial to a less conductive one can be sufficient enough to detectwith suitable accuracy.
2
Smart Mater. Struct. 23 (2014) 125020 I Krupa et al

These effects are the bases for the operation of the pro-posed oil sensor, as schematically shown in figure 1. Oilabsorption leads to polymer swelling, which results in anincrease in volume and a decrease in conductivity.
In this paper, we present the results concerning thefollowing:
(i) What is the influence of the filler content on the responserate of the sensor?
(ii) What is the influence of the material thickness on theresponse rate of the sensor?
(iii) How does the electrical conductivity of the sensingmaterial change under mechanical stretching?
(iv) How does the stretching of the sensing material influenceits response rate?
2. Experimental
Styrene-isoprene-styrene (SIS) tri-block co-polymer (KratonD1165 PT, Kraton Polymers, USA) composed of 30 wt.%polystyrene was used as the polymeric matrix, and expandedgraphite with an average diameter of 5 μm (grade GFG 5 SGLCarbon, Germany) was used as the filler.
The sensor response was tested using commercial motoroil (Madit Super SAE 10W-40, Slovnaft, Slovakia).
All of the composite films were prepared by casting froma toluene solvent solution. The dispersions were first preparedby sonicating expanded graphite in toluene with an ultrasonictip (Hielscher 400S with Sonotrode H7) for 15 min with anamplitude of 80% at 0.75 s per cycle, followed by mixingwith a polymer solution (2 grams of polymer in 20 ml ofsolvent). Thin films were cast onto a Teflon array. The castcomposites were first left to dry at ambient temperature forone day and then dried at 70 °C under vacuum overnight.
In one case, a sample was prepared by spin coating. Thefilm was deposited from a solution onto a mica glass substrate(2 × 2 cm) at 10 000 rpm with a WS-400 spin coater producedby Laurell Technologies Company.
Thin-film sensing elements (length 5 cm, width 1 cm,thickness 0.4 mm) were connected to an electrical circuit (thedistance between the contacts was 4.5 cm) and placed in oil.A voltage of 10 V was applied, and the dependence of theelectric current (I) on time (t) was measured. The I(t)
dependence during oil absorption was tested at various fillercontents and various thicknesses of the film.
Conductivity measurements were performed by Novo-control Concept 40 with an Alpha dielectric spectrometerprovided by Novocontrol Technologies GmbH (Hundsangen,Germany) in the frequency range from 10−1 Hz to 106 Hz at atemperature of 25 °C. The BDS-1200, parallel-plate capacitorwith two gold-plated electrodes was used as a test cell, sup-plied also by Novocontrol Technologies. The diameter of thespecimens was 20 mm. The system is fully automated, andWinDETA software was used for system control and dataacquisition.
The electrical current measured during the oil absorptionwas recorded by an APPA 305 Multimeter, and a dc voltageof 10 V was applied to the device using a Protek 3006 dcPower Supply.
An INSTRON 3365 (UK) universal tensile tester wasused to measure the electrical behavior of samples underdeformation. Testing specimens were tested at a deformationspeed of 10 mmmin−1 at room temperature. The sampleswere held in the jaws of the Instron machine, which wereisolated by insulation foil.
Dual Beam (FIB/SEM) Microscope Quanta 3D 200i(FEI) was used to study the composite polymer materials. Inthe mode of the secondary electrons, we investigated thesurface and the cross sections of these materials.
3. Results and discussion
3.1. Determination of electrical conductivity of composites
The electrical conductivity of the net SIS and its compositeswith the expanded graphite (EG) in the concentration rangefrom 3 to 10 wt.% is shown in figure 2. The neat polymermatrix is an insulator with a conductivity of around 2.10−16
S · cm−1. As is seen from figure 2, an addition of the filler upto 4.5 wt.% has only a slight effect on the electrical con-ductivity of the composites. However, an increase in the fillercontent leads to the dramatic increase of the electrical
Figure 1. A sketch of the proposed oil sensor.
Figure 2. Electrical conductivity of the SIS/EG composites.
3
Smart Mater. Struct. 23 (2014) 125020 I Krupa et al

conductivity of materials. The amount of 5 wt.% of EGincreased conductivity over 9 orders up to 2.3 × 10⁻⁶ S · cm−1.The addition of the filler leads to the further enhancement ofelectrical conductivity; the composites filled with 17.5–20 wt.% of the filler approached the value of 10−3 S · cm−1. It is seenin figure 2 that electrically conductive composites composedof an insulating polymeric matrix and an electrically con-ductive filler demonstrate typical sigmoidal behavior. Thepercolation effect is experimentally observed in the depen-dence of conductivity versus filler content and manifests itselfas a dramatic increase in conductivity (by several orders ofmagnitude) in a rather narrow filler concentration rangewithin the area of the percolation threshold.
To describe the electrical behaviors of composites, alarge number of different models were developed, taking intoaccount various parameters [25–27]. The most prominent one,which belongs to the groups of geometrical percolationmodels, is Kirkpatrick’s [26]. In this model, the correlationbetween the electrical conductivities of the composites andthe volume portions of the fillers is given by equation (1):
σ σ Φ Φ= − β( ) , (1)c f f c
where σc is the electrical conductivity (of the composite), σf isthe conductivity of the filler, Φf is the volume portion of thefiller, Φc is the percolation concentration and β is a parameterdetermining the power of the conductivity increase above Φc
(the so-called percolation exponent).Kirkpatrick [28] gave the following values for the
exponent β:
β = ±1.6 0.1(for the bond percolation model)
β = ±1.5 0.1(for the point percolation model)
However, other percolation exponents can be found in theliterature. According to Tchmutin et al [29], for example, thepercolation exponent for a three-dimensional system isβ= 1.6–1.9, while the percolation concentration is 0.17.
The experimental results were evaluated according to thelinearized form of equation (1). The volume portion of thefiller were calculated before the evaluation (the specificdensity of the filler is 2.25 g · cm−3, and the specific density ofSIS is 0.93 g · cm−3).
The values β = 1.5 ± 0.1 for the percolation exponent andΦc= 0.022 ± 0.001 were found.
The rise of the filler network formation within a matrix atthe filler content of 5 wt.% is also demonstrated by scanningelectron microscopy, as shown in figure 3.
3.2. The influence of the filler content on the response rate
Figure 4 shows the dependence of the normalized electriccurrent (I/I0) on the time t during the oil exposure. I is theelectric current at time t, and I0 is the electric current at t= 0.On one hand, it is clear that an increase in the filler contentresults in an increase in the electrical conductivity of thecomposite (and thus in the increase in the electric current thatflows through the sample at a given voltage and samplegeometry). On the other hand, as shown in figure 4, the higher
filler content reduces the response rate of the sensor. In otherwords, the change in the electric current over the selected timeinterval Δt decreases with an increase in the filler content.
To characterize the response rate of the sensor morequantitatively, we introduced an arbitrary parameter v definedas the derivative of I(t)/I0 at t= 0:
=
=
⎛
⎝
⎜⎜⎜⎜⎜
⎛⎝⎜
⎞⎠⎟
⎞
⎠
⎟⎟⎟⎟⎟v
dI
I
dt(2)
t
0
0
Prior to taking the derivative of I/I0, the experimentaldependencies were fitted by the following bi-exponential
Figure 3. SEM micrograph of a composite filled with 5 wt.% of theEG showing a creation of the percolation network of filler particles.
Figure 4. The dependence of the normalized electrical current (I/I0)on time during oil absorption at different filler contents. The dottedline shows the dependence I/I0 over time for composite 94/6 w/w,which was not submerged in oil.
4
Smart Mater. Struct. 23 (2014) 125020 I Krupa et al

function
= + −− −I
IA Aexp (1 ) exp (3)at bt
0
( ) ( )
where A, a, and b are adjustable parameters. The bi-expo-nential function was used because a simple exponentialfunction does not fit the experimental data appropriately,especially for rapidly responding materials (this indicates thepresence of at least two mechanisms of current conduction;however, this is beyond the scope of the present paper). Theparameters A, a, b and v of the investigated composites aresummarized in table 1.
The x/y notation represents the SIS/EG w/w ratio; thevalues in parentheses represent the standard deviations.
The parameter v decreases with an increase in the fillercontent, which confirms that an increase in the filler contentreduces the response rate of the material when exposed to oil.
3.3. The influence of the film thickness on the response rate
The effect of the sensor thickness on the dependence of I/I0 ontime t during oil exposure is shown in figure 5. The experimentswere arbitrarily performed for composites filled with 10 wt.% ofthe filler to ensure a suitably high electric current (on the orderof a few mA). The results support the common observation thatthe response time of the sensors decreases with the decrease inthe thickness of the sensing film.
A 50% decrease in the current for the thickest film prepared(470 μm) was reached in 1250 s, whereas the same decrease wasreached in 300 sec for a 210 μm thick film and in 10 s for a60 μm thick film. The response rate was characterized in termsof equation (2) after fitting the experimental data withequation (3). The obtained parameters are summarized in table 2.
These results are in line with the common observation thatrapidly responding sensors are usually based on ultra-thin films(100–102 nm). In this study, the thin film was prepared by spincoating of the dissolved composite with arbitrarily selected fillercontent of 10 w/w%. The thickness of the film was estimated tobe approximately 20 μm by SEM, as shown in figure 6(a). Thefilm shown in figure 6(a) was simply mechanically removed fromthe wafer. This value is relatively high because spin coating atsuch a high rotation speed should lead to the formation of muchthinner films. However, it seems that such thin films cannot be
attained for this composition due to spatial restrictions. Simply,the amount of filler particles as well as their size is too high tostack the particles in a nano-sized layer, as shown in figure 6(b).
To test this film as a sensing element, the borders of thefilm were sputtered with gold (figure 7) to create good elec-trical contacts. Wires were connected to the sample withhighly electrically conductive glue (Gravipol, Polymer Insti-tute, SAS, Slovakai). A photograph of the sensor is shown infigure 7 (including a schematic sketch of the experimental set-up used).
Testing was performed under the same conditionsdescribed above. The dependence of the electric current I ontime t during oil exposure is shown in figure 8. The experi-mental results show the very fast response of the sensor withrespect to oil absorption. The current exponentially decreaseswith an increase in oil absorption. The current decreased to50% of the original value in 8 s, and equilibrium was reachedafter 17 s.
3.4. The influence of the stretching of the sensing film on theresponse rate
As mentioned above, an increase in the filler content leads toan improvement in the electrical conductivity, which makes
Table 1. The I0 values and parameters A, a, b and v found for the investigated composites.
Sample I0, mA A a b R2 v
94/6 0006 0.012 0.0025 0.006 0.96789 −5.47 × 10⁻³
(0.04) (0.0009) (0.001)93/7 0127 0.125 0.0029 0.0032 0.99320 −3.16 × 10⁻³
(0.003) (0.0005) (0.0008)92/8 0388 0.199 0.0054 0.00 120 0.99 683 −3.04 × 10⁻³
(0.002) (0.0004) (0.00 004)91/9 0590 0.23 0.0074 0.00 083 0.98 589 −2.33 × 10⁻³
(0.01) (0.0004) (3 × 10⁻⁵)90/10 1247 0.053 0.0069 0.000 600 0.99 906 −9.42 × 10⁻⁴
(0.002) (1 × 10⁻⁴) (4 × 10⁻⁶)
Figure 5. The dependence of the normalized electrical current (I/I0)on time during oil absorption for different sensing film thicknesses.
5
Smart Mater. Struct. 23 (2014) 125020 I Krupa et al
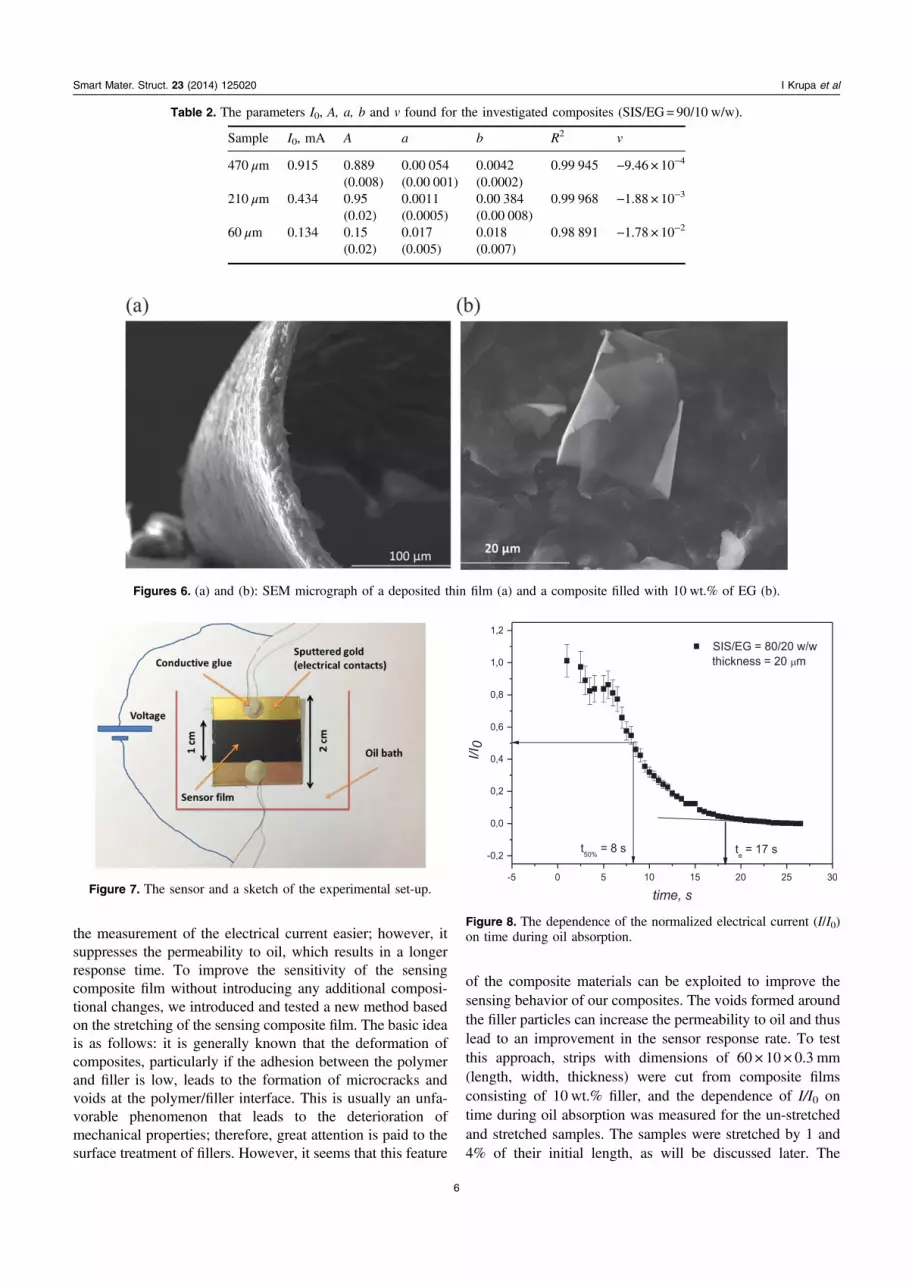
the measurement of the electrical current easier; however, itsuppresses the permeability to oil, which results in a longerresponse time. To improve the sensitivity of the sensingcomposite film without introducing any additional composi-tional changes, we introduced and tested a new method basedon the stretching of the sensing composite film. The basic ideais as follows: it is generally known that the deformation ofcomposites, particularly if the adhesion between the polymerand filler is low, leads to the formation of microcracks andvoids at the polymer/filler interface. This is usually an unfa-vorable phenomenon that leads to the deterioration ofmechanical properties; therefore, great attention is paid to thesurface treatment of fillers. However, it seems that this feature
of the composite materials can be exploited to improve thesensing behavior of our composites. The voids formed aroundthe filler particles can increase the permeability to oil and thuslead to an improvement in the sensor response rate. To testthis approach, strips with dimensions of 60 × 10 × 0.3 mm(length, width, thickness) were cut from composite filmsconsisting of 10 wt.% filler, and the dependence of I/I0 ontime during oil absorption was measured for the un-stretchedand stretched samples. The samples were stretched by 1 and4% of their initial length, as will be discussed later. The
Table 2. The parameters I0, A, a, b and v found for the investigated composites (SIS/EG= 90/10 w/w).
Sample I0, mA A a b R2 v
470 μm 0.915 0.889 0.00 054 0.0042 0.99 945 −9.46 × 10⁻⁴
(0.008) (0.00 001) (0.0002)210 μm 0.434 0.95 0.0011 0.00 384 0.99 968 −1.88 × 10⁻³
(0.02) (0.0005) (0.00 008)60 μm 0.134 0.15 0.017 0.018 0.98 891 −1.78 × 10⁻²
(0.02) (0.005) (0.007)
Figures 6. (a) and (b): SEM micrograph of a deposited thin film (a) and a composite filled with 10 wt.% of EG (b).
Figure 7. The sensor and a sketch of the experimental set-up.
Figure 8. The dependence of the normalized electrical current (I/I0)on time during oil absorption.
6
Smart Mater. Struct. 23 (2014) 125020 I Krupa et al

method is illustrated in figure 9. A home-built device wasused to stretch the samples to various extents. To test the filmsas sensing elements, the borders of the films were sputteredwith gold to create good electrical contacts, and connectingwires were attached to the samples with highly electricallyconductive glue. Then, the samples were stretched, and theI t( ) dependence was measured at a voltage of 10 V. Thestretching of the samples led to an instantaneous decrease inthe current, partly due to the change in sample geometry andpartly due to the filler orientation within the matrices of thesamples. After a few minutes, equilibrium was reached, andthe current no longer changed over time. The initial current1.3 mA decreased to 0.3 mA due to stretching and remainedconstant at this value. Then, the device featuring the stretchedsample was placed in oil, and the I(t) response was con-tinuously recorded.
The results are shown in figure 10. As shown, theresponse rate of the stretched foil is significantly higher thanthat of the un-stretched one. The results of this experimentsupport the previous findings; however, a deeper investigationof the phenomenon must be carried out.
To compare the response rates of the un-stretched andstretched foils quantitatively, we introduced a relative para-meter vu-s, defined as vu-s = vunstretched/vstretched, where theparameters v are computed from equation (2).
Prior to taking the derivative of I/I0, both dependencieswere fitted by equation (3), and the following parameters wereobtained:
(i) For the un-stretched sample, A= 0.9228 ± 0.0009,a= 0.000 530 ± 0.000 001, b= 0.0845 ± 0.0002(R2 = 0.99 771).
(ii) For the stretched sample, A= 0.33 076 ± 0.0009,a= 0.000 720 ± 0.000 004, b= 0.0209 ± 0.0001(R2 = 0.99 055).
Then, the value of vu-s was found to be 12.5, whichindicates that the change in the electric current (and, pro-portionally, in the electrical resistance) due to oil absorption is12.5 times higher for the stretched samples than for the un-stretched ones. Very similar results were obtained for thesample filled with 10% filler when it was stretched by 1% ofits original length. In this case, the response rate of thestretched sample was 14.3 times higher than the response rateof the un-stretched one. The detailed determination of the pre-stretching effect in a broad range of deformations on the oilabsorption sensitivity is currently under deeper investigation.
The correlation between the filler content, film thicknessand the extent of sample stretching on one hand and theresponse rate on the other is the subject of our future researchbecause the preliminary results suggest that this relationship isimportant in the design of rapidly responding sensors.
3.5. The influence of stretching on the electrical conductivity ofthe composite
The use of stretched materials as potential sensing compo-nents requires knowledge of how the electrical resistance R ofthe materials behaves under mechanical stress that inducessample deformation (elongation, in our case). It was foundthat the increase in the deformation of our sample led to amonotonic decrease in the flowing electrical current, as shownin figure 11. The sample filled with 10 wt.% of the filler wastested. When the deformation reached 40% of the initiallength, the flowing electric current was close to zero (con-sidering the accuracy of the device used for the electricalcurrent measurement). This indicates the highest limit ofapplicable deformation, meaning that any applied stretchingmust be maintained below this value.
It is important to be able to distinguish the changes inelectric resistance R upon deformation caused by simplechanges in sample dimensions from those that are induced byinherent changes in the specific electrical resistivity (con-ductivity), which is the material constant of particular interest.In other words, how the specific electrical conductivity σ [SIunits: Ω · m; S/m] depends on the extent of the deformationmust be clarified. A simple physical analysis can be per-formed using Ohm’s law. For conductors, the relationshipbetween the electric current and applied voltage is describedby Ohm’s law U=RI, where U is the voltage, R is the
Figure 9. A sketch of the experimental set-up used to measure the I(t) response of the stretched samples during oil exposure.
Figure 10. The dependence of the normalized electrical current (I/I0)on time during oil absorption for the un-stretched and stretchedsamples (SIS/EG= 90/10 w/w).
7
Smart Mater. Struct. 23 (2014) 125020 I Krupa et al

electrical resistance and I is electric current. The electricresistance is expressed as R= ρL/S, where ρ is the specificresistivity, L the length of the conductor and S is the cross-sectional area. If an elastic conductor is stretched during themeasurement of I(t), then R is not constant and varies sig-nificantly because all three parameters (ρ, L, S) can change.These changes can be divided into two groups. The first typerepresents geometrical changes caused by the variation in Land S. If we consider the specific resistivity (or its reciprocalquantity, called the specific electrical conductivity σ= 1/ρ) asa material constant (which depends only on the temperatureand pressure and is invariant to geometry), the dependence I/I0, as a function of the relative elongation ε during stretching,can be easily described by equation ((4a) and (b))
εε
=+
I
Ia
( ) 1
(1 )(4 )
02
where
ε =−L L
Lb(4 )0
0
is the relative elongation.The precondition for this derivation is that the samples
behave as rubber elastomers with a Poisson’s ratio equals to 0.5.Thus, the initial volume of the samples V0 = S0L0 does notchange during stretching; so, S0L0 =S(L)L, where S(L) is thecross-sectional area of a sample deformed to a length L. Theexperimental dependence of I/I0 on elongation ε during samplestretching is shown in figure (11) and is compared with thetheoretical relationship given by the equation ((4a) and (b)).
It is clearly seen that the experimental dependence of I/I0is in agreement with the theoretical one given by equation((4a) and (b)) only up to 11% of the deformation (region A infigure (11)). Beyond this value, the experimental values of I/I0significantly deviate from the predicted ones (region B infigure (12)). This behavior represents an important finding:the specific resistivity (or conductivity) of a material is con-stant only over a limited range of sample deformation,approximately up to 11%, and then changes with an increase
in the deformation. The electrical conductivity of the inves-tigated sample as a function of various extents of deformationcan be calculated from the experimental values of I using theparameters S0, L0 and U0 (the applied voltage = 10 V),according to equation (5)
σ ε ε ε= +L
S UI( ) (1 ) ( ) (5)0
0 0
2
The dependence of the electrical conductivity on the extent ofdeformation is shown in figure (11). The figures show that theelectrical conductivity remains relatively constant up to 11%of the deformation (region A in figure 11) and then steeplydecreases (region B). The value of σ in region A was found tobe (0.08 ± 5 × 10⁻⁵) S/m (R2 = 0.9968).
The dependence of σ in the region B (ε> 11%) can besimply described by the linear function
σ ε= − × −−0.08 2.92 10 ( 11).B 3
This means that the specific electrical conductivity of thesamples cannot be considered a constant material parameter overthe entire deformation region and depends on the extent of thedeformation. Because the volume of the sample did not change,the effective concentration of the filler within a sample remainsunchanged. However, the orientation of the filler particleschanges, as well as the inter-particle distances between neigh-boring particles. To summarize the above-mentioned results, itcan be concluded that the experimental dependence I/I0 definestwo important deformation values, namely 11% deformation,where the specific resistivity becomes dependent on the extent ofdeformation, and 40% deformation, where the current is out ofthe range of accurate measurement (for this type of device).
4. Conclusions
1. An interesting approach to the improvement of the oilsensors’ response rate was developed. It was shown that
Figure 11. The dependence of the tensile stress (triangles), theelectrical current (circles) and the specific electrical conductivity(squares) on elongation. Figure 12. The dependence of the normalized electrical current
(squares) on the extension. The solid line represents the modeldescribed by equation ((4a) and (b)).
8
Smart Mater. Struct. 23 (2014) 125020 I Krupa et al

stretched sensing foils are much more sensitive to oilabsorption than the un-stretched ones. The change in theelectric current (and, proportionally, an electrical con-ductivity) due to oil absorption is 12.5 times higher forthe stretched samples than for the un-stretched sample. Inother words, the initial response rate of the stretchedsamples is 12.5 times higher than the response fastness ofthe un-stretched sample. As far as we know, thisapproach for the design of sensing elements has not yetbeen reported in the literature.
2. It was found that the specific electrical conductivity ofthe materials [S/m] strongly depends on the extent towhich the materials are stretched. For the investigatedcomposite filled with 10 wt.% filler, the electricalconductivity was observed to remain constant up to the11% sample extension; however, beyond this value, itsharply decreases.
3. Higher filler content leads to higher electrical conductiv-ity in the composite materials; however, a high fillercontent reduces the response rate of the sensors.
Acknowledgements
This work was supported by grants NMT-ERANET andAPGRAPHEL and by project VEGA 2/0119/12. The authorsalso thank Dr Eva Kovacova from the Institute of ElectricalEngineering of Slovak Academy of Sciences for the pre-paration of the spin-coated samples and SEMcharacterizations.
References
[1] Park I, Efimenko K, Sjoblom J and Genzer J 2009 Rapidremoval of organics and oil spills from waters using siliconerubber sponges J. Dispers. Sci. Technol. 30 318–27
[2] Steele J, Thorpe S A and Turekian K K (ed) 2009Measurement Techniques, Sensors and Platforms; aDerivative of Encyclopedia of Oceanscience 2nd edn(Waltham: Academic Press)
[3] Lawrence N S 2006 Analytical detection methodologies formethane and related hydrocarbons Talanta 69 385–92
[4] Lieberzeit P A and Dickert F L 2007 Sensor technology and itsapplication in environmental analysis Anal. Bioanal. Chem.387 237–47
[5] Pejcic B, Eadington P and Ross A 2007 Environmentalmonitoring of hydrocarbons: a chemical sensor perspectiveEnvironmental Science and Technology 41 6333–42
[6] Li C, Thostenson E T and Chou T W 2008 Sensors andactuators based on carbon nanotubes and their composites: areview Compos. Sci. Technol 68 1227–49
[7] Witt N, Tang Y, Ye L and Fang L 2013 Silicone rubbernanocomposites containing a small amount of hybrid fillerswith enhanced electrical sensitivity Mater. Des. 45 548–54
[8] Wei C, Dai L, Roy A and Tolle T B 2006 Multifunctionalchemical vapor sensors of aligned carbon nanotube andpolymer composites J. Am. Chem. Soc. 128 1412–3
[9] Fan Q, Qin Z, Villmow T, Pionteck J, Poetschke P, Wu Y,Voit B and Zhu M 2011 Vapor sensing properties ofthermoplastic polyurethane multifilament covered with
carbon nanotube networks Sens. Actuators B Chem. 15663–70
[10] Philip B, Abraham J K, Chandrasekhar A and Varadan V K2003 Carbon nanotube/PMMA composite thin films for gas-sensing applications Smart Mater. Struct. 12 935–9
[11] Yoon H, Xie J, Abraham J K, Varadan V K and Ruffin P B2006 Passive wireless sensors using electrical transition ofcarbon nanotube junctions in polymer matrix Smart Mater.Struct. 15 S14–20
[12] Luo Y, Wang C and Li Z 2007 Preparation, fabrication andresponse behavior of a HTBN/TDI/MWCNT compositesensing film by in situ dispersed polymerization Synth. Met.157 390–400
[13] Zhang B, Fu R W, Zhang M Q, Dong X M, Lan P L andQiu J S 2005 Preparation and characterization of gas-sensitive composites from multi-walled carbon nanotubes/polystyrene Sens. Actuators B Chem. 109 323–8
[14] Castro M, Lu J, Bruzaud S, Kumar B and Feller J F 2009Carbon nanotubes/poly(ε-caprolactone) composite vapoursensors Carbon 47 1930–42
[15] Kobashi K, Villmow T, Andres T, Haubler L and Potschke P2009 Investigation of liquid sensing mechanism of poly(lactic acid)/multi-walled carbon nanotube composite filmsSmart Mater. Struct. 18 035008
[16] Kobashi K, Villmow T, Andres T and Potschke P 2008 Liquidsensing of melt-processed poly(lactic acid)/multi-walledcarbon nanotube composite films Sens. Actuators B Chem.134 787–95
[17] Potschke P, Andres T, Villmow T, Pegel S, Brünig H,Kobashi K, Fischer D and Häussler L 2010 Liquid sensingproperties of fibres prepared by melt spinning from poly(lactic acid) containing multi-walled carbon nanotubesCompos. Sci. Technol. 70 343–9
[18] Singh V, Joung D, Zhai L, Das S, Khondaker S I and Seal S2011 Graphene based materials: Past, present and futureProg. Mater. Sci. 56 1178–271
[19] Taherian R, Hadianfard M J and Golikand A N 2016Manufacture of a polymer-based carbon nanocomposite asbipolar plate of proton exchange membrane fuel cells Mater.Des. 49 242–51
[20] Li C Y, Thostenson E T and Chou T W 2007 Dominant role oftunneling resistance in the electrical conductivity of carbonnanotube-based composites Appl. Phys. Lett. 91 223114
[21] Villmow T, Pegel S, John A, Rentenberger R and Pötschke P2011 Liquid sensing: smart polymer/CNT compositesMater. Today 14 340–5
[22] Špitalský Z, Danko M and Mosnáček J 2011 Preparation offunctionalized graphene sheets Curr. Org. Chem. 151133–50
[23] Yazdani H, Hatami K, Khosravi E, Harper K and Grady B PStrain-sensitive conductivity of carbon black-filledPVC composites subjected to cyclic loading Carbon 79393–405
[24] Choong C-L et al 2014 Highly stretchable resistive pressuresensors using a conductive elastomeric composite on amicropyramid array Adv. Mater. 26 3451–8
[25] Stauffer D 1985 Introduction to Percolation Theory (London:Taylor and Francis)
[26] Gul V E 1996 Structure and Properties of ConductingPolymer Composites (Utrecht: VSB BV)
[27] Lux F J 1993 Models proposed to explain the electricalconductivity of mixtures made of conductive and insulatingmaterials J. Mater. Sci. 28 285–301
[28] Kirkpatrick S 1973 Percolation and conduction Rev. ModernPhys. 45 574–88
[29] Tchmutin I A, Letyagin S V, Shevchenko V G andPonomarenko A T 1994 Electroconducting polymercomposites: structure, contact phenomena, and anisotropy: areview Polymer Science 36 576–88
9
Smart Mater. Struct. 23 (2014) 125020 I Krupa et al
Copyright © 2022 FDOKUMEN