Torsion in Base-Isolated Structures with Elastomeric Isolation Systems
Upload
independentCategory
view
1download
0
0
Multiaxial Fatigue and Life Prediction of Elastomeric
Components
Touhid Zarrin-ghalami, Graduate Research Assistant
and
Ali Fatemi, Professor (Corresponding Author)
Mechanical, Industrial and Manufacturing Engineering Department
The University of Toledo
2801 West Bancroft Street
Toledo, Ohio 43606, USA
Tel: 419-530-8213, Fax: 419-530-8213
Email: [email protected]
Submitted to the:
International Journal of Fatigue
October 2012
1
Abstract
Elastomeric components have wide usage in many industries. The typical service
loading for most of these components is variable amplitude and multiaxial. In this study a
general methodology for life prediction of elastomeric components under these typical
loading conditions was developed and illustrated for a passenger vehicle cradle mount.
Crack initiation life prediction was performed using different damage criteria. The
methodology was validated with component testing under different loading conditions
including constant and variable amplitude in-phase and out-of-phase axial-torsion
experiments. The optimum method for crack initiation life prediction for complex
multiaxial variable amplitude loading was found to be a critical plane approach based on
maximum normal strain plane and damage quantification by cracking energy density on
that plane. Rainflow cycle counting method and Miner’s linear damage rule were used for
predicting fatigue life under variable amplitude loadings. The fracture mechanics
approach was used for total fatigue life prediction of the component based on specimen
crack growth data and FE simulation results. Total fatigue life prediction results showed
good agreement with experiments for all of the loading conditions considered.
Keywords: Multiaxial fatigue, Elastomers, Fatigue failure, Crack initiation, Crack
growth

2
1. Introduction
Many elastomeric components and structures are typically subjected to variable
amplitude or random multi-axial loading histories. The extreme values for the strain
and/or stress components are not usually coincide with each other under complex loading
conditions. This indicates the complex nature of strain history in applications like
vibration isolators. Therefore, the study of multiaxial fatigue and deformation of
elastomers under variable amplitude loading is an important issue for their proper design
and life prediction analysis.
Life prediction methodologies for uniaxial loading have been relatively well
developed. These methodologies for the more complex case of multiaxial variable
amplitude loading are not yet well established, particularly when the loads are
non-proportional. Very limited papers can be found in the literature related to fatigue life
prediction of elastomeric components under variable amplitude multiaxial loading.
Multiaxial fatigue life prediction methodologies for rubber can be classified into
four main approaches. These consist of the equivalent strain approaches, energy
approaches, equivalent stress approaches, and the more recent critical plane approaches.
Critical plane models can be used for both proportional and non-proportional loading
conditions and are based on the physical process of the damage process. Critical plane
approaches could be strain-based (such as the maximum normal strain), stress-based
(such as the maximum principal Cauchy stress), or energy-based (such as cracking
energy density). Energy-based critical plane approaches, which use both stress and strain,
can reflect the constitutive behavior of the material, while strain-based critical plane
approaches do not require the constitutive behavior of the material.

3
In general, a good multiaxial fatigue model should be robust, sensitive to load
phasing and mean stress, and applicable to variable amplitude loading. Another important
characteristic is the ability to consider crack closure effects.
Crack initiation is normally related to the continuum mechanics quantities (e.g.
stress or strain) which are macroscopic. The most widely used parameters for crack
initiation are the maximum principal strain, maximum principal Cauchy stress and strain
energy density (SED). Approaches such as the cracking energy density (CED) or based
on configurational mechanics (Eshelby stress tensor) are more complex and recent
approaches dealing with multiaxial fatigue analysis of elastomers.
The maximum principal strain criterion was introduced by Cadwell et al. [1] for
unfilled vulcanized natural rubber in 1940 and still remains one of the most commonly
used criteria for rubber. For incompressible materials, this criterion always gives a
positive value for maximum principal strain. Octahedral shear strain is also another
strain-based predictor which also always gives a positive value for rubber-like
materials. In addition, since rubber is incompressible, the hydrostatic stress is
independent of strain tensor.
Ayoub et al. [2] established a relationship between the fatigue life of
styrene-butadiene rubber and the stretch amplitude. They conducted multiaxial constant
and variable amplitude tests on cylindrical (axisymmetric) specimens. The specimen
curvature radius was large enough to minimize the stress triaxiality effect. Their results
showed a good agreement between predicted and experimental fatigue lives. The
predictions were based on continuum damage mechanics improved by incorporating CED
criterion. The developed model is both a fatigue damage criterion and an accumulative
damage rule.
4
Rivlin and Thomas first applied strain energy density (SED) criterion to rubber
material under static loading. This criterion has some drawbacks including inability to
differentiate between simple tension and compression, inability to account for crack
closure and the fact that all of the stored energy in the material would not release due to
crack growth [3]. Strain energy density usually uses a hyperelastic formulation which is
defined in terms of strains. If strain energy density and maximum principal strain would
be applied as scalar criteria, the fact that cracks are usually observed to orient in specific
orientation could not be predicted.
Mars and Fatemi [4] designed a novel specimen for investigating the mechanical
behavior of elastomers under multiaxial loading conditions. By utilizing this specimen
and based on their experimental observations [5] they concluded that the maximum
principal strain as a fatigue damage parameter gave the best prediction of fatigue life,
while the traditionally used strain energy density gave the worst correlation of
experimental data.
Mars and Fatemi [6] discussed the observations of crack initiation and small flaw
growth in filled natural rubber under multiaxial loading conditions. They used their
designed ring specimen with axial, torsion and both proportional and non-proportional
axial-torsion loadings. They suggested that crack nucleation in rubber starts from existing
flaws in the virgin material such as voids, surface cavities and non-rubber particles.
Fatigue crack initiation and growth were observed to occur on preferred failure planes.
For axial, torsion and in-phase axial-torsion loading the cracking plane was transverse to
the maximum principal strain direction. For more complex loading they still observed
preferred nucleation planes but their relation to the principal strain directions was
sometimes different. Crack closure affected the nucleation plane and more closure was
5
observed in cyclic torsion under static compression. This also happened in fully reversed
axial-torsion experiments due to friction during the torsion-compression part of the
loading.
Andre et al. [7] performed torsion experiments on axisymmetrical notched sample
geometry specimens and concluded that the maximum principal Cauchy stress could be
related to multiaxial fatigue damage mechanisms. They proposed that the maximum
principal Cauchy stress could be used as a fatigue damage quantification parameter and
observed that crack orientation is perpendicular to its direction. Brunac et al. [8] extended
Haigh’s diagram to arbitrary 3D loadings by considering the smallest sphere containing
the closed path of the positive part of the Cauchy stress tensor. They concluded that this
approach results in successfully predicting fatigue life.
Saintier at al. [9] investigated the micro-mechanisms leading to crack initiation
under multiaxial fatigue loading conditions and suggested that cracks initiate from
inclusions or large carbon black agglomerates. They observed decohision and cavitation
as damage mechanisms and suggest that cyclic loading does not produce a new damage
mechanism in rubber, in contrast to metallic materials. They observed that the maximum
first principal stress reached during the cycle defined the orientation of the crack in all of
the fatigue loading conditions they considered. In another study, Saintier et al. [10]
proposed a critical plane approach for fatigue crack initiation based on the
micro-mechanisms of crack initiation. In their study, under non-proportional multiaxial
loading, dependent on the material, fatigue crack growth orientation was found to be on
the plane of maximum shear stress amplitude (shear cracking), maximum normal stress
plane (tensile cracking), or even mixed-mode shear and tensile cracking.

6
Mars and Fatemi [11] concluded that scalar equivalence criteria were not capable
of predicting the fatigue initiation life in natural rubber. They suggested using cracking
energy density which is the portion of the strain energy density that is available to cause
crack growth on a particular plane. The application of this method involves knowledge of
the constitutive behavior of the material. Zine et al. [12] applied the cracking energy
density criterion in a FE code and found good agreement between numerical and
analytical results for common strain states. Their experiments results also showed the
efficiency of this criterion to explain fatigue life of elastomers under multiaxial loading
conditions.
Harbour et al. [13] used the multiaxial ring specimen in [4] and performed both
constant and variable amplitude axial-torsion experiments. They used two rubber
materials, one which strain crystallizes (natural rubber) and one which does not (SBR).
They concluded that both cracking energy density and normal strain approaches were
able to predict the dominant crack orientations for some of the test signals in each
material (i.e. axial and multilevel axial tests), but not successful for some other loadings
such as for fully reversed torsion experiments. In another study Harbour et al. [14] used
the maximum normal strain to find the critical plane and the cracking energy density on
that plane to determine fatigue life. Their results showed that this criterion produced
similar fatigue life results compared to other approaches such as cracking energy density,
strain energy density and maximum principal strain. Because maximum normal strain is
independent of constitutive behavior, the critical plane can be identified more easily than
for CED. They [14] also studied the effect of variable amplitude multiaxial loading and
concluded that Miner’s linear damage rule gave reasonable predictions of their
experimental results. Verron et al. [15] proposed a multiaxial criterion for crack

7
nucleation based on the local properties of the Eshelby second-order tensor [16] and
defined in terms of continuum mechanics parameter.
Wang et al. [3] evaluated fatigue life prediction approaches by using experimental
results from proportional and non-proportional loading paths applied to small
axisymmetric diabolo specimens made of vulcanized NR. They conclude maximum
principal strain and octahedral shear strain provide good predictions of the fatigue life.
They also found that compared to traditional criterion of strain energy density, the
cracking energy density model gives better life prediction results.
Mars [17] investigated the duty cycle on each material plane along with its
corresponding damage to transform the multiaxial loading into the localized flaws. After
identifying the damaging events, the original duty cycle is simplified and reconstituted to
a new duty cycle including the number of the most damaging events of the original duty
cycle. The new shortened duty cycle maintains those features of the original duty cycle
corresponding to the original mode of failure and shortens the time scale of the test. For
multiaxially loaded rubber parts, Flamm et al. [18] proposed discretizing the continuous
signal by a level crossing cycle counting method for each loading channel. Then they
constituted the stress amplitude history and performed Rainflow cycle counting on these
alternating points.
The objective of this study was to evaluate a robust methodology for fatigue life
prediction of elastomeric components under complex loading conditions and validate it
by using an automobile cradle mount as an illustrative example. In this paper, first the life
prediction methodology for general random and multiaxial loading is discussed. Both
crack initiation and crack growth approaches are included. Then applications to constant
amplitude axial-torsion in-phase and out-of-phase loading as well as variable amplitude

8
loading are demonstrated using experimental results from a vehicle cradle mount made of
natural rubber. Material deformation and fatigue behavior of the mount are characterized
in [19]. The component FEA and fatigue life analysis and predictions for uniaxial
constant amplitude and variable amplitude loadings are presented in [20] and [21],
respectively.
2. Life prediction methodology for general random and multiaxial
loading
Component fatigue damage is typically localized at points of high strains or
stresses. For complex component geometry, finite element analysis is often performed to
identify the critical location and obtain the stress and strain states for that location. A
cycle counting method and a cumulative damage rule are then used for damage
calculations. The cycle counting procedure relates the damage effect of variable
amplitude loading to constant amplitude material fatigue data and fits. The most popular
method is the Rainflow method proposed by Matsuishi and Endo [22], which is also used
here. Linear damage rule is the simplest form of cumulative damage rule, which is used
in this work. However, load sequence effect or interaction between cycles is not
accounted for in this rule.
A damage quantification parameter is also needed to relate the component
multiaxial stresses and strains to uniaxial specimen test and data. Harbour et al. [14]
evaluated maximum normal strain as a critical plane approach. Normal strain can be
defined from:
1ˆ..ˆ)ˆ(
NCNeN
(1)

9
where C = FT F is the Green’s deformation tensor, F is the deformation gradient tensor
and N̂ is the unit vector normal to the plane in space. By using a MATLAB script, the
maximum value of normal strain and its direction could be defined on all planes in space
in spherical coordinates. Then, the normal strain history on maximum normal strain
(MNS) plane is calculated.
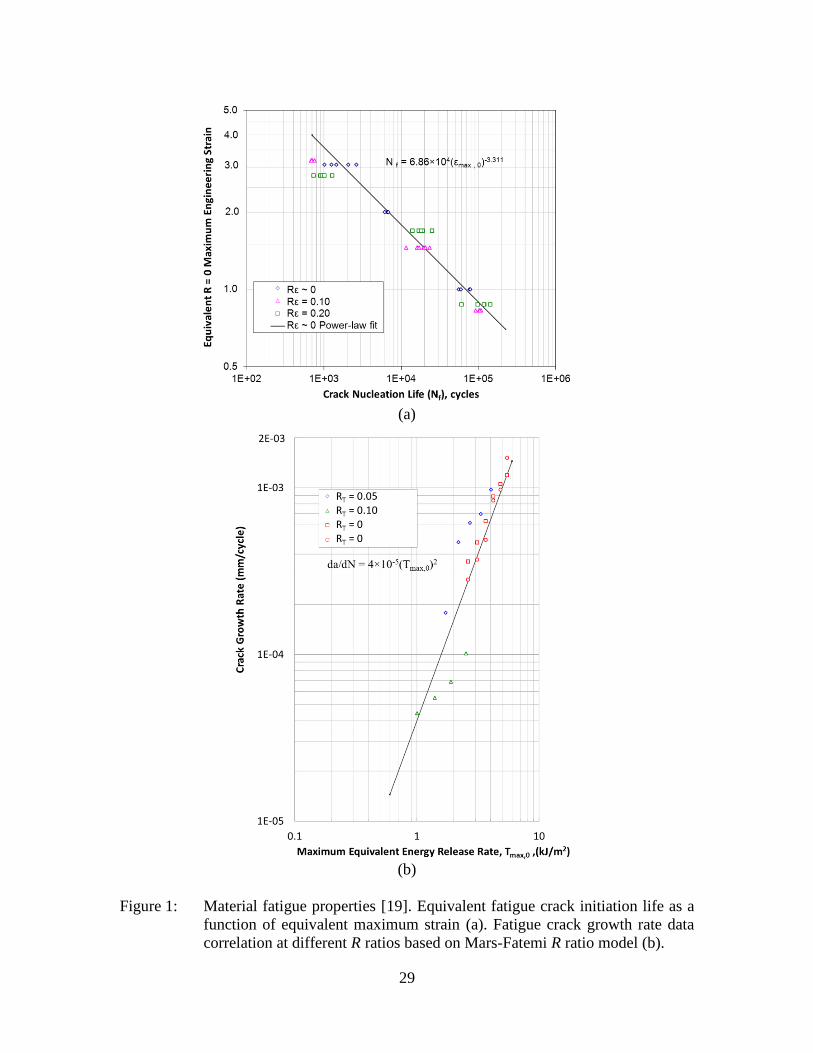
The next step is using the strain-life equation obtained from uniaxial fatigue tests,
as shown in Figure 1(a) and represented by:
3.30max,,1
4 )(1086.6 fN (2)
The strain R ratio effect during each loading cycle at the critical location can be
accounted for by using maximum equivalent R = 0 engineering strain ( 0max,,1 ) based on
Mars-Fatemi R ratio material model [23] discussed in [19] and given by:
)74()741(max,,10max,,1
33
25.6 RRR
(3)
For variable amplitude loading, cycle counting is performed on the critical plane
(i.e. MNS) and damage is calculated for each cycle using the linear damage rule (LDR).
Another successful damage quantification parameter mentioned previously is
cracking energy density (CED). The increment in cracking energy density dWc in the
spatial description is defined in terms of the traction vector T
and the unit displacement
vector
d on a given plane in the instantaneous deformed configuration and is given by:
dTdWc . (4)
The normal to the plane is defined by the unit vector r
. By converting from the spatial
description to the material description, the final expression for CED increment is given
by [24]:
10
RIER
RdESIER
RCR
RdESCRdW
T
T
T
T
c
)2(
~)2(
~
00
(5)
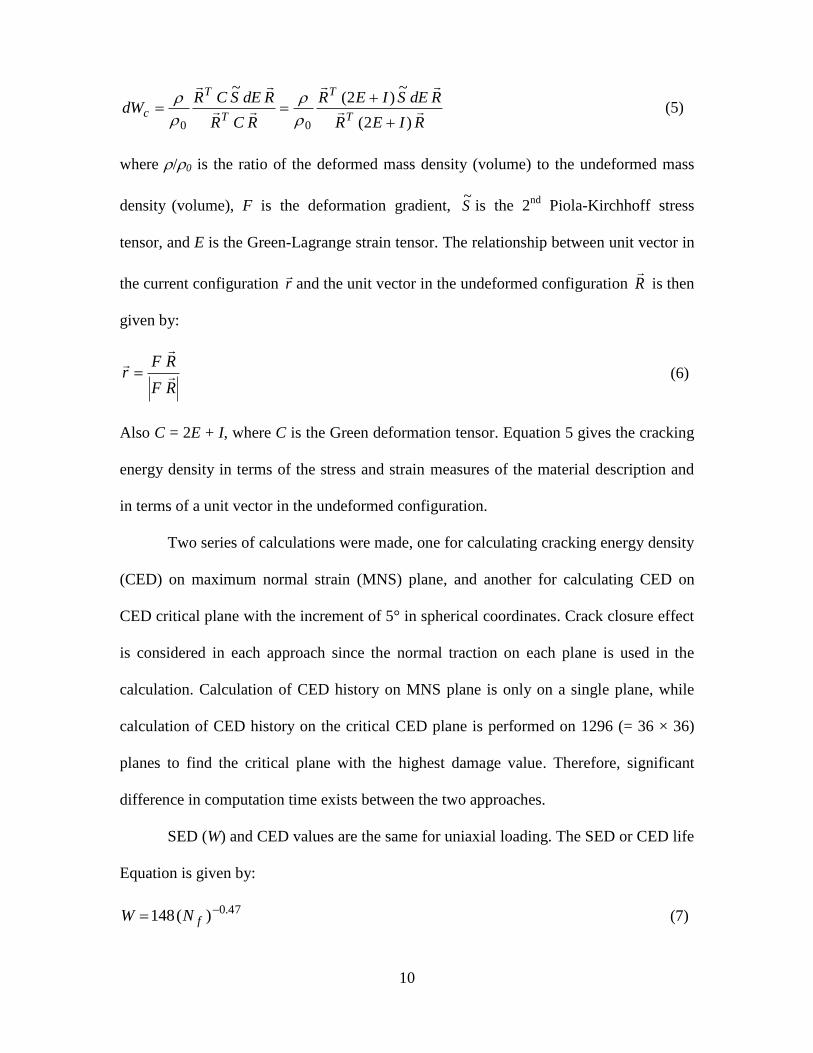
where /0 is the ratio of the deformed mass density (volume) to the undeformed mass
density (volume), F is the deformation gradient, S~
is the 2nd
Piola-Kirchhoff stress
tensor, and E is the Green-Lagrange strain tensor. The relationship between unit vector in
the current configuration r
and the unit vector in the undeformed configuration R
is then
given by:
RF
RFr
(6)
Also C = 2E + I, where C is the Green deformation tensor. Equation 5 gives the cracking
energy density in terms of the stress and strain measures of the material description and
in terms of a unit vector in the undeformed configuration.
Two series of calculations were made, one for calculating cracking energy density
(CED) on maximum normal strain (MNS) plane, and another for calculating CED on
CED critical plane with the increment of 5° in spherical coordinates. Crack closure effect
is considered in each approach since the normal traction on each plane is used in the
calculation. Calculation of CED history on MNS plane is only on a single plane, while
calculation of CED history on the critical CED plane is performed on 1296 (= 36 × 36)
planes to find the critical plane with the highest damage value. Therefore, significant
difference in computation time exists between the two approaches.
SED (W) and CED values are the same for uniaxial loading. The SED or CED life
Equation is given by:
47.0)(148 fNW (7)
11
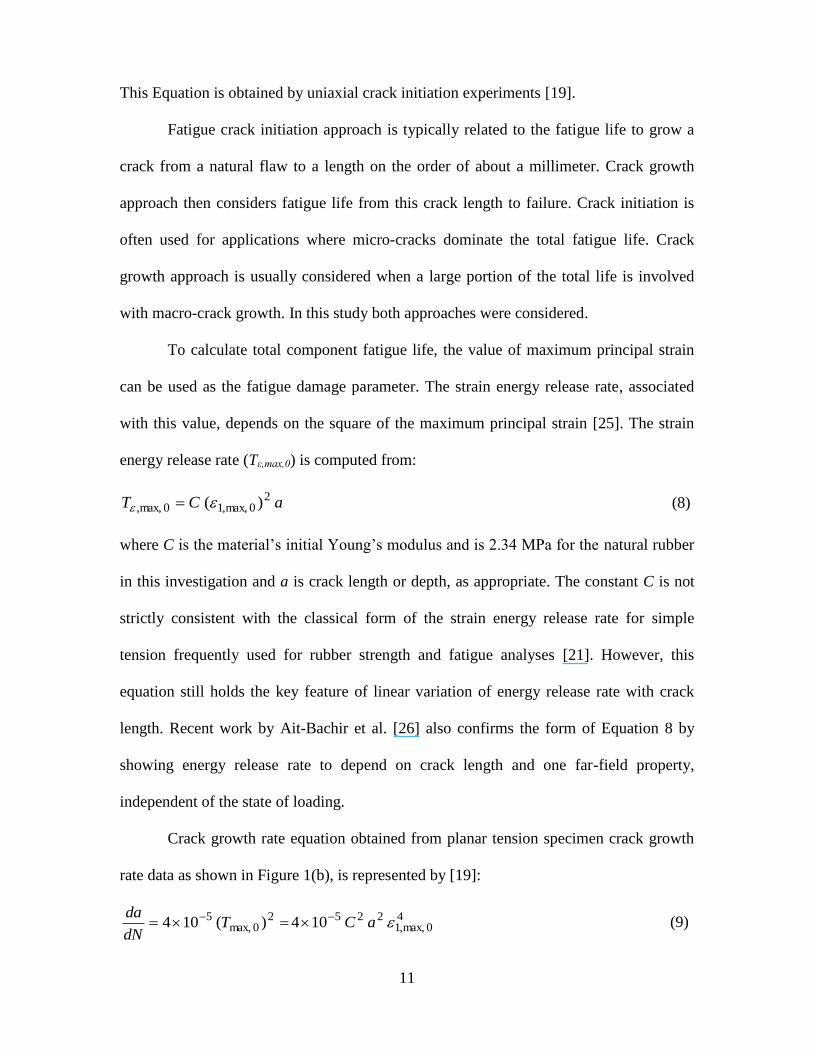
This Equation is obtained by uniaxial crack initiation experiments [19].
Fatigue crack initiation approach is typically related to the fatigue life to grow a
crack from a natural flaw to a length on the order of about a millimeter. Crack growth
approach then considers fatigue life from this crack length to failure. Crack initiation is
often used for applications where micro-cracks dominate the total fatigue life. Crack
growth approach is usually considered when a large portion of the total life is involved
with macro-crack growth. In this study both approaches were considered.
To calculate total component fatigue life, the value of maximum principal strain
can be used as the fatigue damage parameter. The strain energy release rate, associated
with this value, depends on the square of the maximum principal strain [25]. The strain
energy release rate (Tε,max,0) is computed from:
aCT 20max,,10max,, )( (8)
where C is the material’s initial Young’s modulus and is 2.34 MPa for the natural rubber
in this investigation and a is crack length or depth, as appropriate. The constant C is not
strictly consistent with the classical form of the strain energy release rate for simple
tension frequently used for rubber strength and fatigue analyses [21]. However, this
equation still holds the key feature of linear variation of energy release rate with crack
length. Recent work by Ait-Bachir et al. [26] also confirms the form of Equation 8 by
showing energy release rate to depend on crack length and one far-field property,
independent of the state of loading.
Crack growth rate equation obtained from planar tension specimen crack growth
rate data as shown in Figure 1(b), is represented by [19]:
40max,,1
22520max,
5 104)(104 aCTdN
da (9)

12
By utilizing maximum equivalent R = 0 engineering strain as a damage parameter along
the crack path, the relationship between strain and crack depth is then obtained.
Predictions based on the damage parameter along the critical dominating crack element
for each individual event is obtained from integrating Equation 9 and is given by:
104
0max,,1
114566
aaN f
(10)
where a0 and a1 are natural flaw size and critical element’s depth, respectively (in mm).
For the natural rubber material of the component used in this study the effective initial
flaw size was 0.02 mm [19].
3. Applications to multiaxial constant amplitude loading
3.1 Experimental program and results
Component level fatigue tests were conducted in order to validate the fatigue life
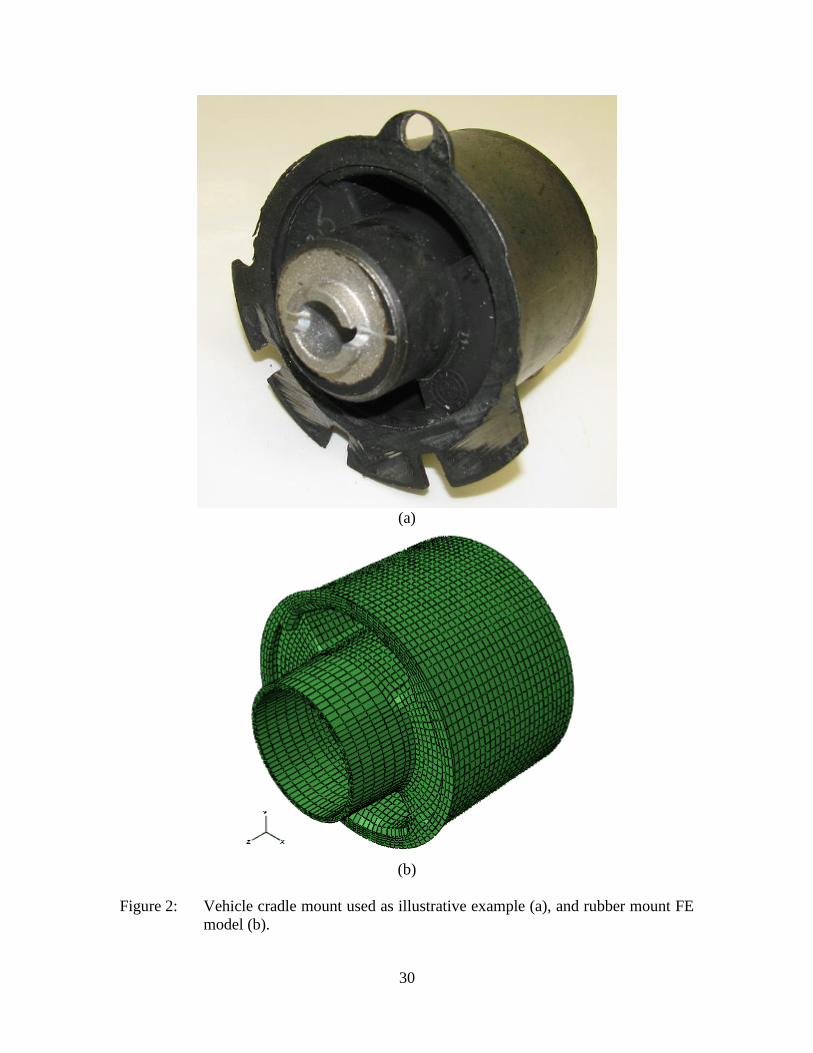
prediction methodology discussed above. Figure 2(a) shows the component used, which
is a vehicle cradle mount. The finite element model of the component is shown in
Figure 2(b). Axial loading with amplitude of 1100 N and R ~ 0 and torsion loading with
amplitude of 30 N.m. and R = -1 were used as the experimental loading conditions. Both
in-phase and 90 out-of-phase tests were conducted with two tests for each condition.
One test of each condition was stopped in regular intervals to monitor crack initiation and
growth. Fatigue tests were conducted with a sinusoidal waveform of 1 Hz using a
servo-hydraulic axial-torsion load frame and axial as well as rotational displacement
responses of each test specimen were periodically recorded.
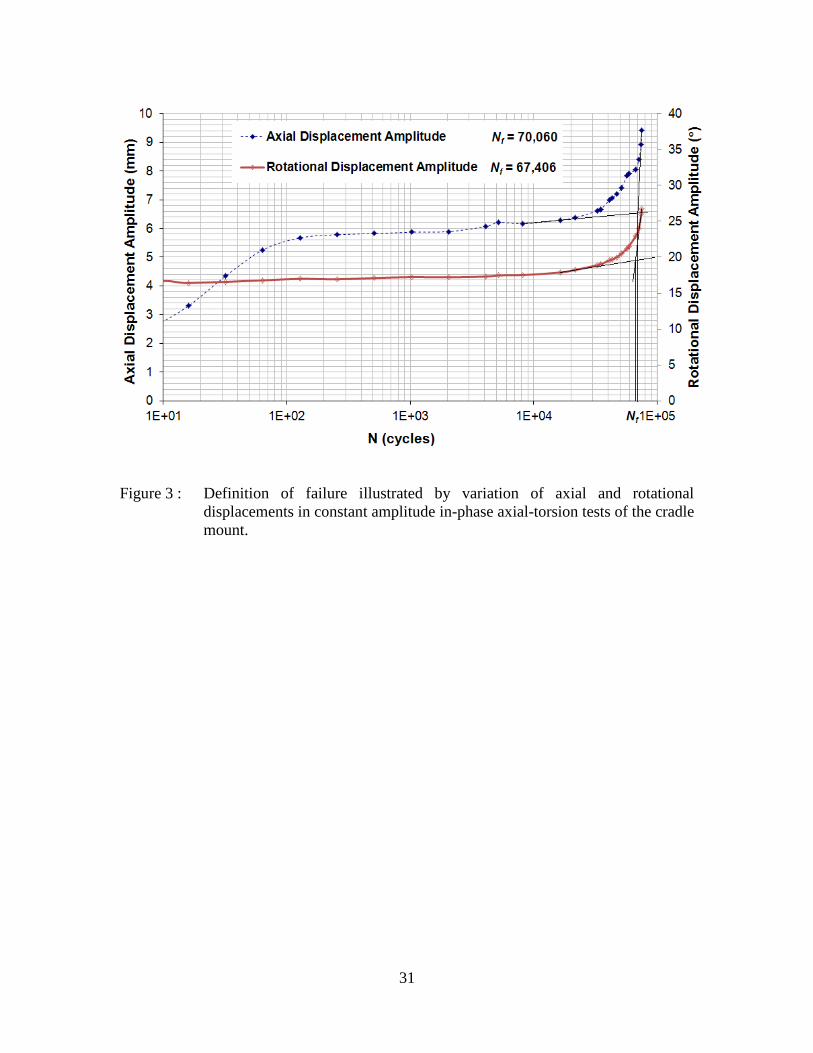
The loading conditions chosen resulted in fatigue lives between about 21,500
cycles and 67,500 cycles. The maximum axial and rotational displacements increased

13
initially due to the Mullin’s effect and then stabilized after several hundred cycles. When
a fatigue crack initiated and then grew to a critical size, the displacement and rotation
amplitudes increased rapidly due to reduced stiffness. Failure was defined as the lower
number of cycles at which the axial or rotational displacement amplitudes increased
drastically from its gradual linear change, as illustrated for a typical test in Figure 3.
The experimental fatigue lives at different load levels are tabulated in Table 1.
Test results from uniaxial fatigue tests reported in [20] and [21] are also included in this
table. The life comparisons show shorter life for 90° out-of-phase loading, as compared
to in-phase loading. Experimental life scatter between duplicate tests was within a factor
of three for in-phase tests and within a factor of two for out-of-phase tests. This table also
shows the first crack observations for the tests which were stopped at regular intervals for
monitoring. The crack nucleation life for a duplicate test for which initiation was not
monitored was calculated based on the ratio of crack nucleation life to total life of the
monitored test of the same loading condition. Crack growth life was a significant portion
of the total fatigue life (about 75%) for in-phase test, while for out-of-phase test, this ratio
was about 30%.
Crack length as well as its depth and their changes were measured at critical
(failure) location by periodic test interruptions and visual inspection. For in-phase
loading, crack length did not have a significant effect on fatigue life, as even at a length
of about 4 cm, the component was still at only about half of its total life. Crack depth had
a more dominant effect on life than crack length. When crack depth was on the order of
3 cm, the component was near failure. Stiffness drop also correlated better with crack
depth than with crack length. Crack length and depth versus cycles are shown in
Figure 4(a) for in-phase loading. For out-of-phase loading, crack length was a key factor,
14
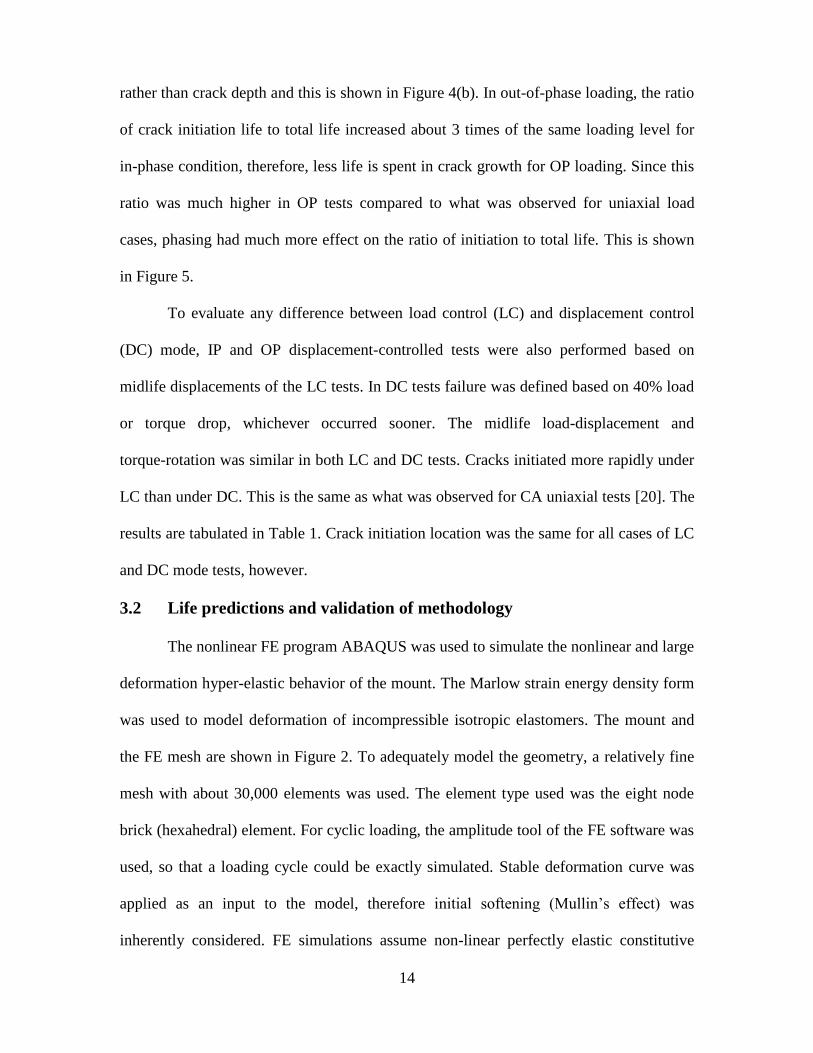
rather than crack depth and this is shown in Figure 4(b). In out-of-phase loading, the ratio
of crack initiation life to total life increased about 3 times of the same loading level for
in-phase condition, therefore, less life is spent in crack growth for OP loading. Since this
ratio was much higher in OP tests compared to what was observed for uniaxial load
cases, phasing had much more effect on the ratio of initiation to total life. This is shown
in Figure 5.
To evaluate any difference between load control (LC) and displacement control
(DC) mode, IP and OP displacement-controlled tests were also performed based on
midlife displacements of the LC tests. In DC tests failure was defined based on 40% load
or torque drop, whichever occurred sooner. The midlife load-displacement and
torque-rotation was similar in both LC and DC tests. Cracks initiated more rapidly under
LC than under DC. This is the same as what was observed for CA uniaxial tests [20]. The
results are tabulated in Table 1. Crack initiation location was the same for all cases of LC
and DC mode tests, however.
3.2 Life predictions and validation of methodology
The nonlinear FE program ABAQUS was used to simulate the nonlinear and large
deformation hyper-elastic behavior of the mount. The Marlow strain energy density form
was used to model deformation of incompressible isotropic elastomers. The mount and
the FE mesh are shown in Figure 2. To adequately model the geometry, a relatively fine
mesh with about 30,000 elements was used. The element type used was the eight node
brick (hexahedral) element. For cyclic loading, the amplitude tool of the FE software was
used, so that a loading cycle could be exactly simulated. Stable deformation curve was
applied as an input to the model, therefore initial softening (Mullin’s effect) was
inherently considered. FE simulations assume non-linear perfectly elastic constitutive
15
behavior, therefore, the same deformation curve for loading and unloading. Quasi-static
simulation was performed for constant amplitude axial loading.
Load and/or displacement are applied to the reference point (located on the inner
axis of the mount), which is coupled with inner FE nodes of the mount at the interface
with metallic part by utilizing the rigid body constraint capability of the software. To
prevent rigid body motion the outer portion of the mount was fixed. More details of FE
model can be found in [20].
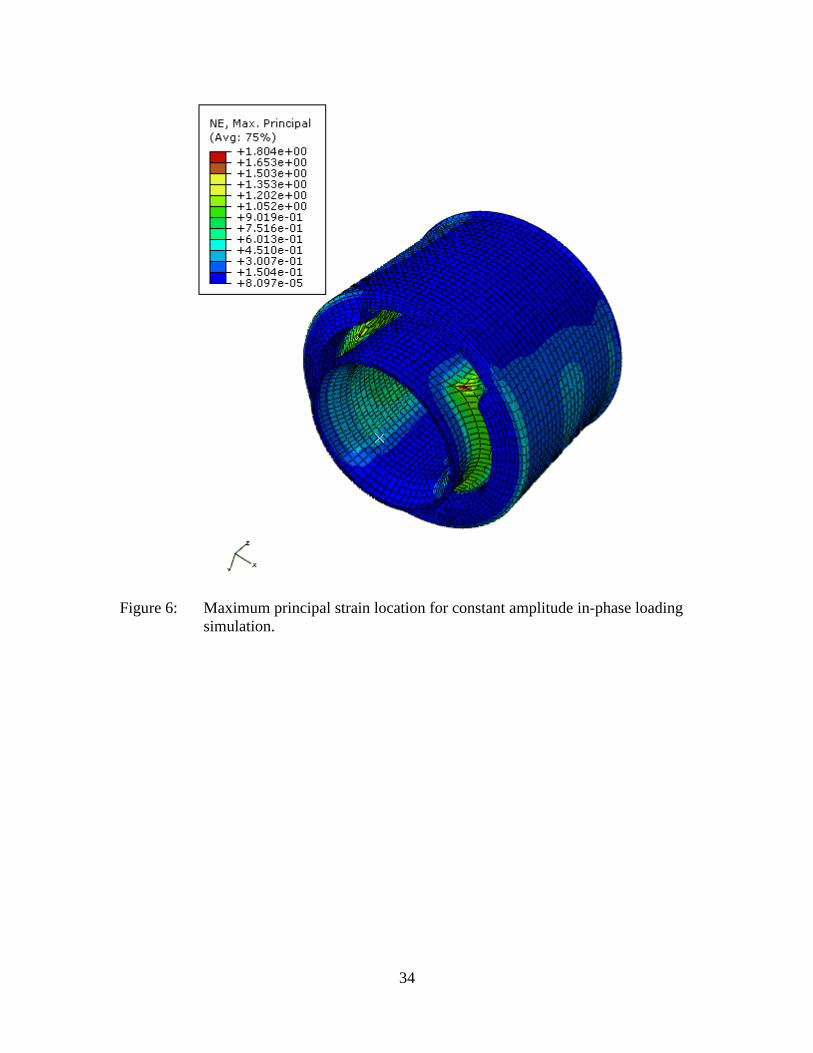
Maximum principal strain distributions of the mount under IP loading is shown in
Figure 6, which is similar to that for OP loading. The maximum principal strain occurs at
the interface between the inner bushing and the bulk rubber material at a location of
abrupt geometry change. Locations, at which the maximum principal strain occurred, as
indicated in Figure 6 for in-phase loading, were also observed to be the site(s) of fatigue
cracking during all fatigue tests of the component. The maximum principal strain at the
critical location determined from FEA was, therefore, one of the parameters used for
evaluating the fatigue damage.
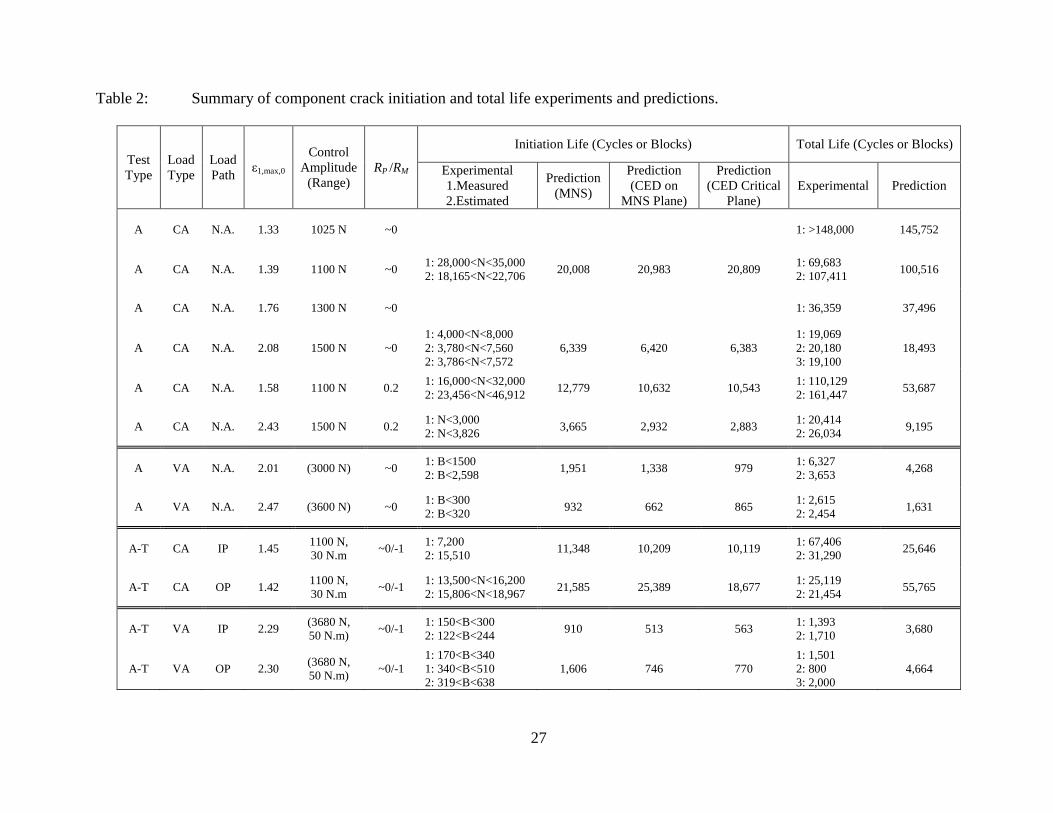
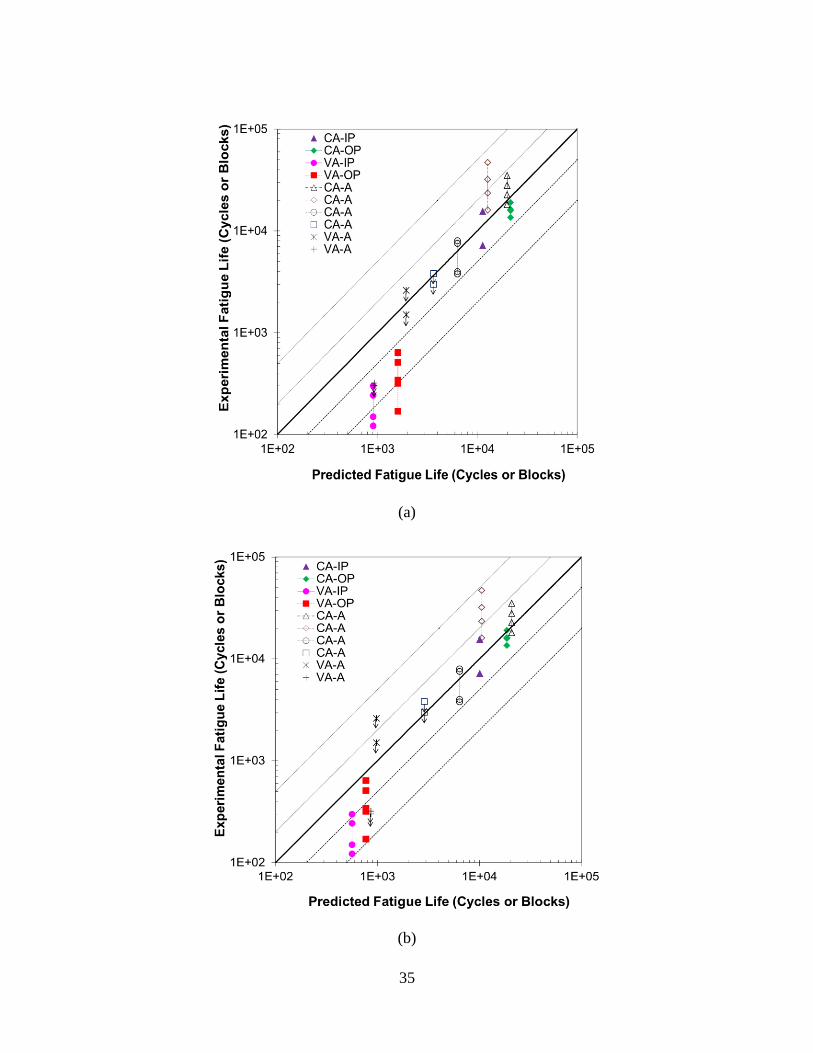
By using the data from critical element (defined as the location with the highest
maximum principal strain) of the mount in each loading cycle, life predictions were
performed. Values of the maximum normal strain (MNS), critical cracking energy
density (CED), and CED on MNS plane are listed in Table 2. Through a tensor
transformation program developed in MATLAB, the maximum normal strain value and
direction was defined. Equations 2 and 3 based on uniaxial fatigue properties were then
used to perform life predictions. The correlation of the predicted and experimental results
is shown in Figure 7(a). The predictions are within a factor of two for all experiments by
16
using the maximum normal strain parameter. Numerically it is an efficient parameter for
determining the critical or failure plane(s) through a 3-D search process.
Maximum normal strain plane direction and Cauchy stress history were used in
another MATLAB program to obtain cracking energy density on the MNS plane.
Equation 7 for CED based on uniaxial fatigue properties was used to perform life
predictions. The correlation of predicted results with experimental results for CED is
shown in Figure 7(b) and the same plot for CED on MNS plane is shown in Figure 7(c).
The results show that using CED on MNS gives similar predictions to the critical CED
criterion. As discussed earlier, this is a computationally efficient approach (by a factor of
about 45), to predict crack initiation life of the component, since CED history is
calculated on a single plane.
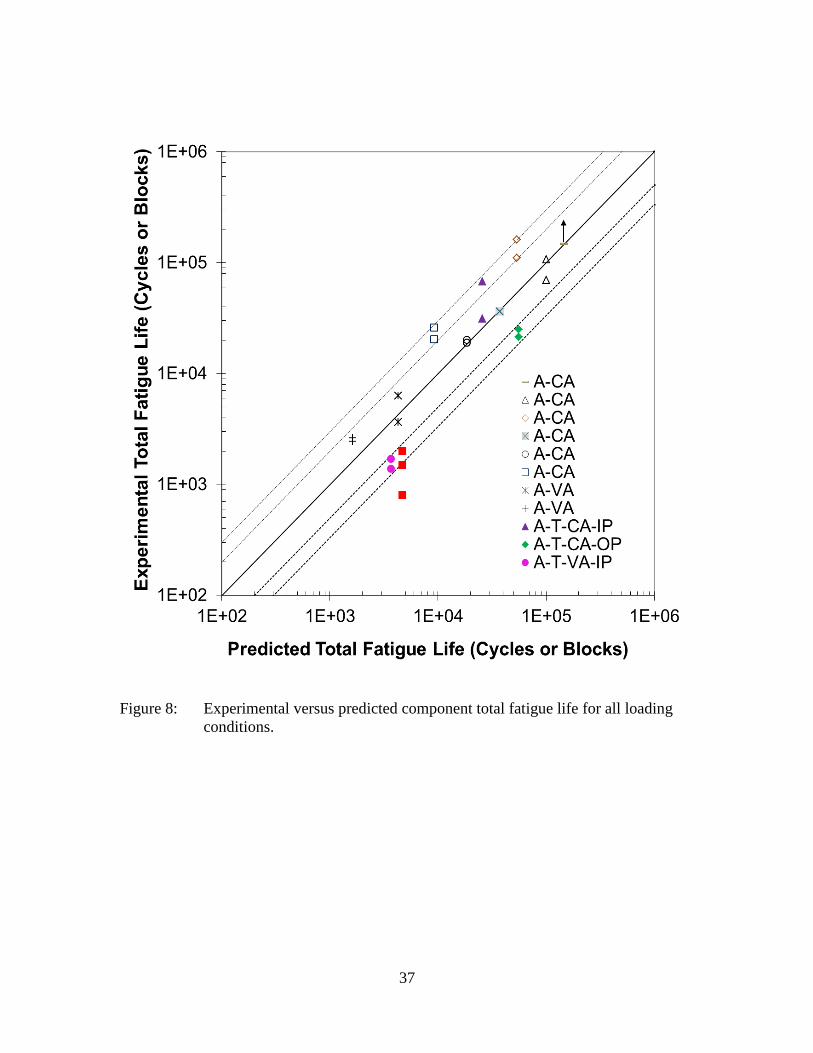
Total life of the component was also predicted based on Equation 10.
The predicted and experimental results are tabulated in Table 2. The correlation of
predicted versus experimental total lives are shown in Figure 8. The predictions are all
within a factor of three of the experiments.
4. Applications to variable amplitude multiaxial loading
For evaluating more complex loading conditions, variable amplitude proportional
and non-proportional axial-torsion tests were also conducted on the elastomeric
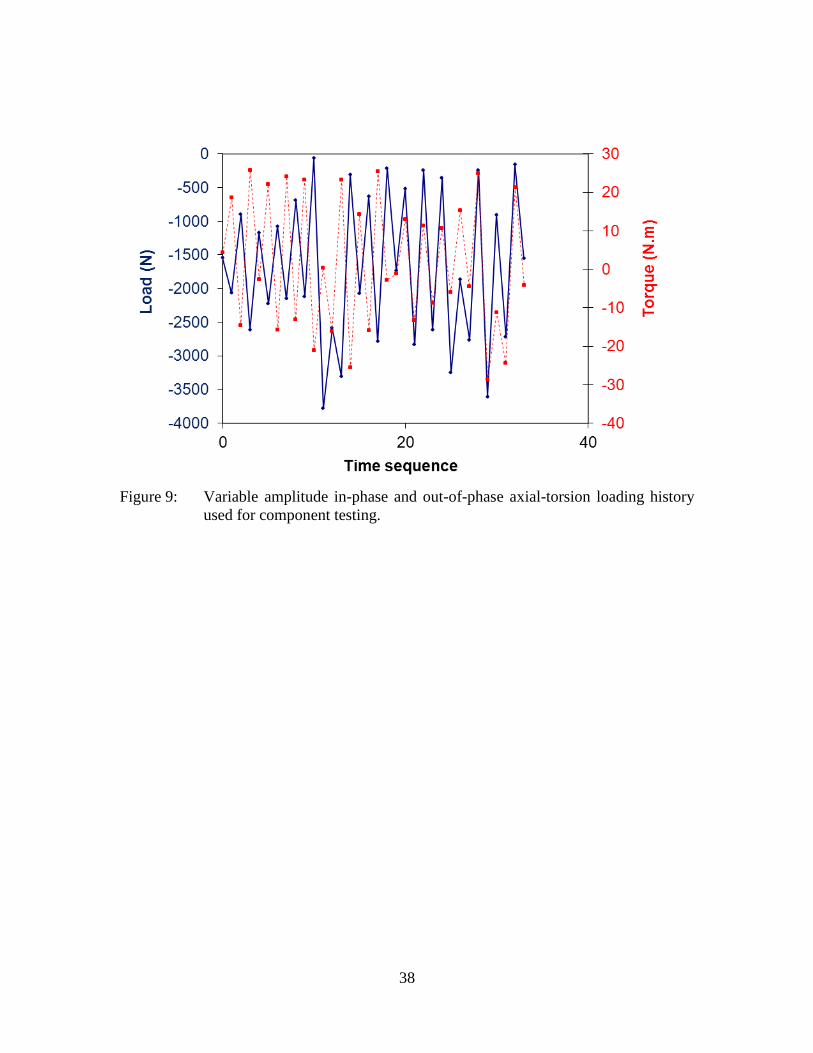
component. Two in-phase and two out-of-phase tests were conducted. For in-phase
loading the peaks and valleys in both axial and torsion load signals are reached at the
same time, while for out-of-phase loading they are not (see Figure 9). Experiments were
conducted with the load range of 3,680 N in comparison with minimum load of near zero
and torque range of 50 N.m. with mean value of near zero. For one duplicate test of each
17
condition, the test was stopped at regular intervals (every 10% of the expected life) to
monitor crack initiation and growth.
Test results for variable amplitude tests are given in Table 1. Experimental life
scatter between duplicate tests was within a factor of two for both in-phase and
out-of-phase loading. Crack initiation range is also tabulated in Table 1. Crack growth
life constitutes a significant portion of the total life in all tests. In out-of-phase tests the
ratio of crack initiation life to total life increased about 1.5 times, as compared to
in-phase loading. The same observation was made in constant amplitude loading. This is
shown in Figure 5. Crack length and depth measurement results showed that crack depth
was key factor in component fatigue life for both in-phase and out-of-phase tests. This
was also observed in constant amplitude uniaxial tests.
The maximum principal strain occurs at the interface between the inner bushing
and the bulk rubber material at a location of abrupt geometry change, similar to all other
loading cases and corresponding to that observed during the fatigue tests. This crack
initiation site remained the same for all of the simulations, either IP or OP.
The same methodology used for constant amplitude axial-torsion loading
condition was used to define crack initiation life as well as total fatigue life of the
component. The only difference for variable amplitude loading is the use of Rainflow
cycle counting method for event identification and then using Miner linear rule to
accumulate the fatigue damage. Figures 10(a) and 10(b) show normal strain history on
maximum normal strain plane for in-phase and out-of-phase loadings, respectively. As
can be seen from this figure, the maximum normal strain history for both IP and OP
conditions at critical location is different from the nominal loading history applied to the
component (see Figure 9). Cycle counting was performed on the shown MNS history.

18
After event identification, by utilizing Miner rule, the fatigue life prediction was
performed.
Life prediction results, shown in Figure 7 for different damage parameters,
indicate that MNS criterion is not accurate for complex variable amplitude multiaxial
loading. Both critical CED and CED on MNS criteria give better predictions. Most of the
total fatigue life predictions are within a factor of three of experiments in this case
according to Figure 8.
5. Discussion of Results
Predicted crack nucleation locations based on the developed methodology
matched observed failure locations for all loading conditions. Crack initiation lives were
predicted well (mostly within a factor of two) based on the maximum normal strain and
the developed methodology for most of the loading conditions. Because only strain is
involved in this approach, maximum normal strain can be a very efficient parameter to
determine critical or failure plane. Most of the predictions were on non-conservative side
(i.e. predicted life longer than experimental life). This is, at least partly, because of the
fact that in the FE model the strain and stress at critical location were lower than in the
component since a finer mesh could not be used due to practical considerations.
Of the two CED criteria, the CED on MNS plane criterion gives quite acceptable
predictions with much less calculation time, compared to the critical CED plane criterion.
This is because CED history is calculated on just one MNS plane and not on many planes
in space. Calculation of CED requires knowledge of the constitutive behavior of the
material, however. Both of these approaches resulted in better life predictions than MNS
for multiaxial variable amplitude loading conditions.
19
Two criteria of Smith-Watson-Topper (SWT) commonly used for metallic
materials and strain energy density (SED) traditionally used for elastomers were also
evaluated. All of the predictions based on SWT criterion were overly conservative
predictions by up to a factor of 23. Predictions based on SED resulted mostly in life
within a factor of two for this particular component and the loading conditions
considered. SED criterion gives close predictions compared to CED criterion because of
the particular component geometry where based on the FE results the maximum principal
strain at the critical location is much higher than the other two principal strains. This
indicates essentially uniaxial strain state, although the loading of the component was
multiaxial. In addition, the principal strain at the critical location is tensile, while for
compression strain there would be a large deviation between SED and CED criteria
predictions. The difference between SED and CED criteria is also large when torsion
loading is dominant compared to axial loading, which was not the case for the loading
considered in this study. Differences between CED and SED criteria based on different
loading conditions are also discussed in [15]. Overall, of all fatigue crack initiation
criteria studied here, those which use critical plane approaches work better than the scalar
damage parameters or those damage parameters which do not take constitutive behavior
into account.
Crack growth constitutes a significant portion of the component total fatigue life.
The ratio of initiation to total fatigue life varied between 6 and 69 % for different loading
cases. For constant amplitude or variable amplitude uniaxial tests, by increasing the load
amplitude, the ratio of crack initiation life to total life decreased (i.e. more life spent in
crack growth). This is expected, since higher load level initiates a crack quicker and
fatigue life is dominated by crack growth.

20
Multiaxial load phasing had an important effect on the ratio of crack initiation to
total life. For constant amplitude out-of-phase loading, this ratio increased about 3 times
compared to in-phase loading at the same level. This means more life was involved in
crack initiation for out-of-phase loading, compared to in-phase loading. Total life
comparison showed shorter life for out-of-phase loading compared to
in-phase loading for both constant and variable amplitude loadings, indicating much
faster crack growth rate once a crack has initiated in out-of-phase loading.
The fracture mechanics approach was used for total fatigue life prediction for
each loading condition based on specimen crack growth data and FE simulation results.
The methodology used for component total fatigue life resulted in reasonable predictions
for nearly all the loading conditions. The prediction results are sensitive to initial crack
length used for analysis, but not very sensitive to the final crack length used. This was
also observed in [20] where the critical element of the component had the highest effect
in the total life prediction.
6. Conclusions
1. Shorter total life was observed for out-of-phase loading compared to
in-phase loading at the same level for both constant and variable amplitude loadings.
In addition, for out-of-phase loading the ratio of crack initiation life to total life was
about 3 times higher than for in-phase loading. This indicates more life was involved
in crack initiation but much faster crack growth rate once a crack initiated in out-of-
phase loading, as compared to in-phase loading.
2. Crack initiation location was observed to remain the same for all of the loading
conditions used for fatigue tests of the component. This location corresponded to the
21
point at which the maximum principal strain occurred. Therefore, maximum normal
strain (MNS) is an effective parameter to determine the critical or failure plane.
3. Although the maximum normal strain (MNS) parameter correlated the constant
amplitude fatigue life data within mostly a factor of about two, it could not correlate
the data satisfactorily for the more complex case of variable amplitude loading.
4. Amongst the different approached evaluated, a computationally efficient and
relatively accurate fatigue crack initiation life prediction approach for complex
loading was found to be a critical plane approach based on MNS and quantifying
damage on this plane using the cracking energy density (CED) parameter.
5. For variable amplitude loading the rainflow cycle counting of the maximum normal
strain (MNS) history was found to be an efficient method. Miner linear damage rule
was then used to accumulate damage on the MNS plane based on constant amplitude
fatigue data, resulting in satisfactory life predictions for variable amplitude loading.
6. Crack growth constituted a significant portion of the component total fatigue life. The
fracture mechanics approach was used for total fatigue life prediction based on
specimen crack growth data and FE simulation results. The methodology used for
component total fatigue life resulted in reasonable predictions with nearly all the life
predictions being within a factor of three of the experimental lives.

22
References
[1] Cadwell, S., Merrill, R.A., Sloman, C.M., and Yost, F.L., 1940, “Dynamic fatigue life
of rubber,” Rubber Chemistry and Technology, Vol. 13, No. 2, pp. 304-315.
[2] Ayoub, G., Nait-Abdelaziz, M., Zairi, F., Gloaguen, J.M. and Charrier, P., 2011, “A
continuum damage model for the high-cycle fatigue life prediction of styrene-butadiene
rubber under multiaxial loading,” International Journal of Solids and Structures,
Vol. 48, pp. 2458-2466.
[3] Wang, Y., Yu, W., Chen, X. and Yan, L., 2008, “Fatigue life prediction of vulcanized
natural rubber under proportional and non-proportional loading,” Fatigue and Fracture of
Engineering Materials and Structures, Vol. 31, pp. 38-48.
[4] Mars, W.V. and Fatemi, A., 2004, “A novel specimen for investigating the
mechanical behavior of elastomers under multiaxial loading conditions”, Experimental
Mechanics, Vol. 44, No. 2, pp. 136-146.
[5] Mars, W.V. and Fatemi, A., 2005, “Multiaxial fatigue of rubber: Part II: experimental
observations and life predictions”, Fatigue and Fracture of Engineering Materials and
Structures, Vol. 28, pp. 523-538.
[6] Mars, W.V. and Fatemi, A., 2006, “Nucleation and growth of small fatigue cracks in
filled natural rubber under multiaxial loading,” Journal of Material Science, Vol. 41,
pp. 7324-7332.
[7] Andre, N., Cailletaud, G. and Piques, R., 1999, “Haigh diagram for fatigue crack
initiation prediction of natural rubber components,” Kaust Gummi Kunstst, Vol. 52,
pp. 120-123.
[8] Brunac, J., Gerardin, O., and Leblond, J., 2009, “On the heuristic extension of
Haigh’s diagram for the fatigue of elastomers,” International Journal of Fatigue,
Vol. 31, pp. 859-867.
[9] Saintier, N., Cailletaud, G., and Piques, R., 2006, “Crack initiation and propagation
under multiaxial fatigue in a natural rubber,” International Journal of Fatigue, Vol. 28,
pp. 61-72.
[10] Saintier, N., Cailletaud, G., and Piques, R., 2006, “Multiaxial fatigue life prediction
for a natural rubber,” International Journal of Fatigue, Vol. 28, pp. 530-539.
[11] Mars, W.V. and Fatemi, A., 2005, “Multiaxial fatigue of rubber: Part I: equivalence
criteria and theoretical aspects”, Fatigue and Fracture of Engineering Materials and
Structures, Vol. 28, pp. 515-522.

23
[12] Zine, A., Benseddiq, N., Nait-Abdelaziz, M., Ait Hocine, N. and Bouami, D., 2006,
“Prediction of rubber fatigue life under multiaxial loading,” Fatigue and Fracture of
Engineering Materials and Structures, Vol. 29, pp. 267-278.
[13] Harbour, R.J., Mars, W.V. and Fatemi, A., 2008, “Fatigue crack orientation in NR
and SBR under variable amplitude and multiaxial loading conditions,” Journal of
Material Science, Vol. 43, pp. 1783-1794.
[14] Harbour, R.J., Mars, W.V. and Fatemi, A., 2008, “Fatigue life analysis and
predictions for NR and SBR under variable amplitude and multiaxial loading conditions,”
International Journal of Fatigue, Vol. 30, pp. 1231-1247.
[15] Verron, E., Le Cam, J., and Gornet, L., 2006, “A multiaxial criterion for crack
nucleation in rubber,” Mechanics Research Communications, Vol. 33, pp. 493-498.
[16] Eshelby, J.D., 1975, “The elastic energy-momentum tensor,” Journal of Elasticity,
Vol. 5, No. 3-4, pp. 321-335.
[17] Mars, W.V., 2010, “Identifying the damaging events in a multiaxial duty cycle,”
Constitutive Models for Rubber VI, Heinrich, G., Kaliske, M., Lion, A. and Reese, S.,
Eds., Proceedings of the 6th
European Conference on the Constitutive Models for Rubber,
London, Taylor and Francis; 1st edition, pp. 261-267.
[18] Flamm, M., Steinweger, T., and Weltin, U., 2003, “Lifetime prediction of
multiaxially loaded rubber springs and bushings,” Constitutive Models for Rubber III,
Busfield, J.J.C. and Muhr, A.H., Eds., Proceedings of the 3rd
European Conference on
the Constitutive Models for Rubber, London, Taylor and Francis; 1st edition, pp. 49-53.
[19] Zarrin-Ghalami, T. and Fatemi, A., 2012, “Material deformation and fatigue
behavior characterization for elastomeric component life predictions,” Polymer
Engineering and Science, Vol. 52, pp. 1795-1805.
[20] Zarrin-Ghalami, T. and Fatemi, A., 2012, “Rubber component deformation and
fatigue life analysis and predictions,” Journal of Automobile Engineering (In-press).
[21] Zarrin-Ghalami, T., and Fatemi, A., 2012, “Cumulative Fatigue Damage and Life
Prediction of Elastomeric Components,” Fatigue and Fracture of Engineering Materials
and Structures (In-press).
[22] Matsuishi, M. and Endo, T., 1968, “Fatigue of metals subjected to varying stress,”
Japan Society of Mechanical Engineering, Fukuoka, Japan.
[23] Mars, W.V. and Fatemi, A., 2003, “A phenomenological model for the effect of
R ratio on fatigue of strain crystallizing rubbers”, Rubber Chemistry and Technology,
Vol. 76, pp. 1241-1258.
24
[24] Mars W. V., 2001, “Multiaxial Fatigue of Rubber,” Ph.D. Dissertation, The
University of Toledo, Toledo, Ohio.
[25] Mars, W.V. and Fatemi, A., 2007, “The correlation of fatigue crack growth rates in
rubber subjected to multiaxial loading using continuum mechanical parameters,” Rubber
Chemistry and Technology, Vol. 80, Issue 1, pp. 169-182.
[26] Ait-Bachir, M., Mars, W.V., and Verron, E., 2012, “Energy release rate of small
cracks in hyperelastic materials,” International Journal of Non-linear Mechanics, Vol.
47, Issue 4, pp. 22-29.

25
Acknowledgements
Funding of this study was provided by Chrysler Group LLC. PAULSTRA
provided the cradle mount component for the study.

26
Table 1: Component experimental conditions and test results.
Test
Type
Load
Type
Load
Path
Control
Mode
Control
Amplitude
(Range)
RP /RM
or
R /R
Frequency
(Hz)
a / a
or
Pa / Ma
Fatigue Life (Cycles or Blocks)
Initiation1 Total
2
A3 CA N.A. LC 1025 N ~0 1 6.24 mm >148,000
A CA N.A. LC 1100 N ~0 1 7.16 mm 18,165<N<22,7064 69,683
A CA N.A. LC 1100 N ~0 1 7.52 mm 28,000<N<35,000 107,411
A CA N.A. LC 1300 N ~0 1 7.88 mm 36,359
A CA N.A. LC 1500 N ~0 1 10.1 mm 3,780<N<7,560 19,069
A CA N.A. LC 1500 N ~0 1 10.4 mm 4,000<N<8,000 20,180
A CA N.A. LC 1500 N ~0 3 8.85 mm 3,786<N<7,572 19,100
A CA N.A. LC 1100 N 0.2 1,0.5,0.75 8.04 mm 23,456<N<46,912 161,447
A CA N.A. LC 1100 N 0.2 1 7.39 mm 16,000<N<32,000 110,129
A CA N.A. LC 1500 N 0.2 0.75 9.44 mm N<3,826 26,034
A CA N.A. LC 1500 N 0.2 1 9.7 mm N<3,000 20,414
A VA N.A. LC (3000 N) ~0 16.5 S/B5 8.59 mm B<2,598 6,327
A VA N.A. LC (3000 N) ~0 16.5 S/B 8.77 mm B<1,500 3,653
A VA N.A. LC (3600 N) ~0 16.5 S/B 9.94 mm B<320 2,615
A VA N.A. LC (3600 N) ~0 16.5 S/B 9.87 mm B<300 2,454
A-T CA IP LC 1100 N/30 N.m ~0/-1 1 6.85 mm/19.26° 15,510 67,406
A-T CA IP LC 1100 N/30 N.m ~0/-1 1 7.04 mm/18.62° 7,200 31,290
A-T CA IP DC 6.95 mm/18.94° 0.1/-1 1 1044 N/28.2 N.m 0<N<3,600 74,230
A-T CA OP LC 1100 N/30 N.m ~0/-1 1 7.04 mm/19.68° 15,806<N<18,967 25,119
A-T CA OP LC 1100 N/30 N.m ~0/-1 1 8.14 mm/21.67° 13,500<N<16,200 21,454
A-T CA OP LC 1100 N/30 N.m ~0/-1 1 8.08 mm/21.97° >21,250
A-T CA OP DC 7.53 mm/20.68° ~0/-1 1 1085 N/30 N.m 43,750
A-T VA IP LC (3680 N/50 N.m) ~0/-1 43.5 S/B 11.32 mm/15.52° 122<B<244 1,393
A-T VA IP LC (3680 N/50 N.m) ~0/-1 43.5 S/B 9.81 mm/13.41° 150<B<300 1,710
A-T VA OP LC (3680 N/50 N.m) ~0/-1 47.6 S/B 11.22 mm/15.60° 319<B<638 1,501
A-T VA OP LC (3680 N/50 N.m) ~0/-1 47.6 S/B 11.99 mm/16.71° 170<B<340 800
A-T VA OP LC (3680 N/50 N.m) ~0/-1 47.6 S/B 7.63 mm/20.68° 340<B<510 2,000
1 1
st observed crack (with the length of 1 mm) by periodic test interruptions and visual examination
2 In LC defined by sudden increase of displacement amplitude (log scale), in DC defined by 40% load drop
3 A- Axial, T- Torsion, CA- Constant Amplitude, VA- Variable Amplitude, LC- Load-Controlled,
DC- Displacement-Controlled, IP- In-Phase, OP- Out-of-Phase 4 Bold font indicates the estimated initiation life which is calculated based on the ratio of initiation to total life of the
test with the same loading which is stopped in regular intervals for crack growth monitoring 5 S/B is seconds per block
27
Table 2: Summary of component crack initiation and total life experiments and predictions.
Test
Type
Load
Type
Load
Path ε1,max,0
Control
Amplitude
(Range)
RP /RM
Initiation Life (Cycles or Blocks) Total Life (Cycles or Blocks)
Experimental
1.Measured
2.Estimated
Prediction
(MNS)
Prediction
(CED on
MNS Plane)
Prediction
(CED Critical
Plane)
Experimental Prediction
A CA N.A. 1.33 1025 N ~0 1: >148,000 145,752
A CA N.A. 1.39 1100 N ~0 1: 28,000<N<35,000
2: 18,165<N<22,706 20,008 20,983 20,809
1: 69,683
2: 107,411 100,516
A CA N.A. 1.76 1300 N ~0 1: 36,359 37,496
A CA N.A. 2.08 1500 N ~0
1: 4,000<N<8,000
2: 3,780<N<7,560
2: 3,786<N<7,572
6,339 6,420 6,383
1: 19,069
2: 20,180
3: 19,100
18,493
A CA N.A. 1.58 1100 N 0.2 1: 16,000<N<32,000
2: 23,456<N<46,912 12,779 10,632 10,543
1: 110,129
2: 161,447 53,687
A CA N.A. 2.43 1500 N 0.2 1: N<3,000
2: N<3,826 3,665 2,932 2,883
1: 20,414
2: 26,034 9,195
A VA N.A. 2.01 (3000 N) ~0 1: B<1500
2: B<2,598 1,951 1,338 979
1: 6,327
2: 3,653 4,268
A VA N.A. 2.47 (3600 N) ~0 1: B<300
2: B<320 932 662 865
1: 2,615
2: 2,454 1,631
A-T CA IP 1.45 1100 N,
30 N.m ~0/-1
1: 7,200
2: 15,510 11,348 10,209 10,119
1: 67,406
2: 31,290 25,646
A-T CA OP 1.42 1100 N,
30 N.m ~0/-1
1: 13,500<N<16,200
2: 15,806<N<18,967 21,585 25,389 18,677
1: 25,119
2: 21,454 55,765
A-T VA IP 2.29 (3680 N,
50 N.m) ~0/-1
1: 150<B<300
2: 122<B<244 910 513 563
1: 1,393
2: 1,710 3,680
A-T VA OP 2.30 (3680 N,
50 N.m) ~0/-1
1: 170<B<340
1: 340<B<510
2: 319<B<638
1,606 746 770
1: 1,501
2: 800
3: 2,000
4,664

28
Figure captions
Figure 1: Material fatigue properties [19]. Equivalent fatigue crack initiation life as a
function of equivalent maximum strain (a). Fatigue crack growth rate data
correlation at different R ratios based on Mars-Fatemi R ratio model (b).
Figure 2: Vehicle cradle mount used as illustrative example (a), and rubber mount FE
model (b).
Figure 3 : Definition of failure illustrated by variation of axial and rotational
displacements in constant amplitude in-phase axial-torsion tests of the cradle
mount.
Figure 4: Evolution of crack length and depth for constant amplitude axial-torsion
(a) in-phase test with Nf = 31,290, and (b) out-of-phase test with
Nf = 21,454.
Figure 5: Crack initiation to total fatigue life ratio for all types of loadings.
Figure 6: Maximum principal strain location for constant amplitude in-phase loading
simulation.
Figure 7: Experimental versus predicted component initiation life for all loading
conditions based on (a) maximum normal strain, (b) critical CED, and
(c) CED on MNS plane.
Figure 8: Experimental versus predicted component total fatigue life for all loading
conditions.
Figure 9: Variable amplitude in-phase and out-of-phase axial-torsion loading history
used for component testing.
Figure 10: Normal strain on maximum normal strain (MNS) plane history of variable
amplitude and axial-torsion loading for (a) in-phase, and (b) out-of-phase
loading.
29
(a)
(b)
Figure 1: Material fatigue properties [19]. Equivalent fatigue crack initiation life as a
function of equivalent maximum strain (a). Fatigue crack growth rate data
correlation at different R ratios based on Mars-Fatemi R ratio model (b).
30
(a)
(b)
Figure 2: Vehicle cradle mount used as illustrative example (a), and rubber mount FE
model (b).
31
Figure 3 : Definition of failure illustrated by variation of axial and rotational
displacements in constant amplitude in-phase axial-torsion tests of the cradle
mount.

32
(a)
(b)
Figure 4: Evolution of crack length and depth for constant amplitude axial-torsion
(a) in-phase test with Nf = 31,290, and (b) out-of-phase test with
Nf = 21,454.

33
Figure 5: Crack initiation to total fatigue life ratio for all types of loadings.
34
Figure 6: Maximum principal strain location for constant amplitude in-phase loading
simulation.
35
(a)
(b)

36
(c)
Figure 7: Experimental versus predicted component initiation life for all loading
conditions based on (a) maximum normal strain, (b) critical CED, and
(c) CED on MNS plane.
37
Figure 8: Experimental versus predicted component total fatigue life for all loading
conditions.
38
Figure 9: Variable amplitude in-phase and out-of-phase axial-torsion loading history
used for component testing.

39
(a)
(b)
Figure 10: Normal strain on maximum normal strain (MNS) plane history of variable
amplitude and axial-torsion loading for (a) in-phase, and (b) out-of-phase
loading.
Copyright © 2022 FDOKUMEN