FATIGUE OF PARTIALLY PRESTRESSED CONCRETE
14
FATIGUE OF PARTIALLY PRESTRESSED CONCRETE By Mohsen El Shahawi 1 and Barrington deV. Batchelor 2 ABSTRACT: The fatigue behavior of partially prestressed concrete beams is in- vestigated in a series of tests of bonded post-tensioned T-beams. The beams are simply supported with the same overall dimensions, and designed for the same 0exural strength. The main parameter in the study is the degree of pre- stress (from 0.2-1.0). Eight beams are tested in fatigue: Five beams are sub- jected to a constant load cycle, while the remaining three beams are subjected to cumulative fatigue loading. All beams are initially cracked before the appli- cation of repeated loading. Rapid changes in cracking, deflections, and non- prestressed steel stress occur in the early stages of fatigue loading, and are followed by a stable period until just prior to failure. Cumulative fatigue load- ing always results in reduced life of the member. Fatigue failure is caused by successive fracturing of the non-prestressed reinforcement; and no failure of pretensioned reinforcement is observed. Crack spacing approximately coincides with shear reinforcement spacing which is constant in the tests, indicating that the latter spacing may have some effect on spacing of cracks. Based on the test results, it is concluded that at present there is no justification for the use of complicated expressions to predict maximum crack width, and that the simple expression proposed by the CEB-FIP Code gives satisfactory predictions. It ap- pears that a degree of prestress between 0.4 and 0.6 is optimum for satisfactory cracking and fatigue response. INTRODUCTION The increasing use of partially prestressed concrete in structures sub- jected to repeated loads makes it necessary in design to assess the in- fluence of stress fluctuation on the behavior of these structures as the degree of prestress is varied (6). In partially prestressed concrete, crack- ing is allowed at levels below the full service loading. Therefore frequent fluctuations in steel stress caused by opening and closing of these cracks under repeated loading pose a potential fatigue problem. A number of investigations on the fatigue behavior of partially prestressed concrete members has been reported in the literature, but the fact that in most cases the experimental values of stress variations are not reported, ren- ders a comparative evaluation of these studies extremely difficult. The general aim of the research (13) reported in this paper was to study the cracking and fatigue behavior of bonded, post-tensioned par- tially prestressed concrete beams for varying values of the degree of prestress, X, defined as the ratio of the force carried by the pretensioned reinforcement to the force carried by the total reinforcement at ultimate conditions, as shown in Eq. 1 'Research Asst., Civ. Engrg. Dept., Queen's Univ., Kingston, ON, Canada. 2 Prof. of Civ. Engrg., Queen's Univ., Kingston, ON, Canada. Note.—Discussion open until August 1, 1986. To extend the closing date one month, a written request must be filed with the ASCE Manager of Journals. The manuscript for this paper was submitted for review and possible publication on June 26, 1985. This paper is part of the Journal of Structural Engineering, Vol. 112, No. 3, March, 1986. ©ASCE, ISSN 0733-9445/86/0003-0524/$01.00. Paper No. 20440. 524 J. Struct. Eng. 1986.112:524-537. Downloaded from ascelibrary.org by Jawaharlal Nehru Tech University on 07/19/13. Copyright ASCE. For personal use only; all rights reserved.
Transcript of FATIGUE OF PARTIALLY PRESTRESSED CONCRETE

FATIGUE OF PARTIALLY PRESTRESSED CONCRETE
By Mohsen El Shahawi1 and Barrington deV. Batchelor2
ABSTRACT: The fatigue behavior of partially prestressed concrete beams is investigated in a series of tests of bonded post-tensioned T-beams. The beams are simply supported with the same overall dimensions, and designed for the same 0exural strength. The main parameter in the study is the degree of pre-stress (from 0.2-1.0). Eight beams are tested in fatigue: Five beams are subjected to a constant load cycle, while the remaining three beams are subjected to cumulative fatigue loading. All beams are initially cracked before the application of repeated loading. Rapid changes in cracking, deflections, and non-prestressed steel stress occur in the early stages of fatigue loading, and are followed by a stable period until just prior to failure. Cumulative fatigue loading always results in reduced life of the member. Fatigue failure is caused by successive fracturing of the non-prestressed reinforcement; and no failure of pretensioned reinforcement is observed. Crack spacing approximately coincides with shear reinforcement spacing which is constant in the tests, indicating that the latter spacing may have some effect on spacing of cracks. Based on the test results, it is concluded that at present there is no justification for the use of complicated expressions to predict maximum crack width, and that the simple expression proposed by the CEB-FIP Code gives satisfactory predictions. It appears that a degree of prestress between 0.4 and 0.6 is optimum for satisfactory cracking and fatigue response.
INTRODUCTION
The increasing use of partially prestressed concrete in structures subjected to repeated loads makes it necessary in design to assess the influence of stress fluctuation on the behavior of these structures as the degree of prestress is varied (6). In partially prestressed concrete, cracking is allowed at levels below the full service loading. Therefore frequent fluctuations in steel stress caused by opening and closing of these cracks under repeated loading pose a potential fatigue problem. A number of investigations on the fatigue behavior of partially prestressed concrete members has been reported in the literature, but the fact that in most cases the experimental values of stress variations are not reported, renders a comparative evaluation of these studies extremely difficult.
The general aim of the research (13) reported in this paper was to study the cracking and fatigue behavior of bonded, post-tensioned partially prestressed concrete beams for varying values of the degree of prestress, X, defined as the ratio of the force carried by the pretensioned reinforcement to the force carried by the total reinforcement at ultimate conditions, as shown in Eq. 1
'Research Asst., Civ. Engrg. Dept. , Queen ' s Univ., Kingston, ON, Canada. 2Prof. of Civ. Engrg., Queen 's Univ., Kingston, ON, Canada. Note.—Discussion open until August 1, 1986. To extend the closing date one
month, a written request must be filed with the ASCE Manager of Journals. The manuscript for this paper was submitted for review and possible publication on June 26, 1985. This paper is part of the Journal of Structural Engineering, Vol. 112, No. 3, March, 1986. ©ASCE, ISSN 0733-9445/86/0003-0524/$01.00. Paper No. 20440.
524
J. Struct. Eng. 1986.112:524-537.
Dow
nloa
ded
from
asc
elib
rary
.org
by
Jaw
ahar
lal N
ehru
Tec
h U
nive
rsity
on
07/1
9/13
. Cop
yrig
ht A
SCE
. For
per
sona
l use
onl
y; a
ll ri
ghts
res
erve
d.

where Av$ = area of prestressed reinforcement; As = area of non-pres-tressed reinforcement; fps = nominal strength of prestressed reinforcement; and fy = yield strength of non-prestressed reinforcement.
FATIGUE STRENGTH OF MATERIALS
The effects of the main material properties affecting the fatigue behavior of partially prestressed concrete members are summarized in this section.
Plain Concrete.—It is generally accepted that the fatigue strength of concrete for a life of 10,000,000 cycles in compression, tension or flexure is approximately 50% of the static ultimate strength (3,4). In practice the applied stresses in concrete are generally small compared to the fatigue strength. Hence the fatigue failure of concrete is unlikely to occur in partially prestressed members.
Reinforcing Steel (Bars).—The main variables influencing the fatigue strength of deformed bars are stress range, bar size, geometry of deformation, bending and welding characteristics (3,17,18,23). Fatigue life is relatively insensitive to yield and tensile strengths of reinforcing bars, and decreases slightly with increasing bar size (3,18,23).
ACI Committee 215 (3) recommends a limit of 138 MPa (20 ksi) on the stress range for straight deformed bars, while ACI Committee 443 (4) recommends an expression for stress range in terms of the minimum stress and the geometry of the deformations. The CEB-FIP model code (11,14) recommends a stress range of 250 MPa (36 ksi) for smooth bars and 150 MPa (22 ksi) for deformed bars, while the Ontario Highway Bridge Design Code (20) specifies a maximum stress range of 125 MPa (18 ksi) for deformed bars.
Prestressing Steel.—The fatigue strength of prestressing steel depends on the stress range, the type of prestressing steel (wire, strand or bar), steel treatment, anchorage and degree of bond (3). Stress range is the most critical factor to be considered in design, and depends mainly on the range of loading and the prestress level.
ACI Committee 215 (3) recommends that the stress range which may be imposed for less than 2,000,000 cycles in prestressed reinforcement, at a minimum stress level up to 60% of tensile strength, fpu, shall not exceed 0.10 fpu for strand or bars, and 0.12 fpu for wires. In European practice (11,14), a stress range of up to 200 MPa (29 ksi) is considered acceptable for prestressing tendons although a safe design value below 150 MPa (22 ksi) is preferred. Such limits are much higher than stress range values observed in fully prestressed uncracked members. However, because cracking is allowed in partial prestressing, the preceding limitations can become critical in design.
FATIGUE OF PARTIALLY PRESTRESSED BEAMS
In a number of studies, Abeles (1,2) reported the use of a large amount of experimental data to prove that partially prestressed sections that are adequately designed for static loading are also suitable when subjected to fatigue. He concluded that if the untensioned reinforcement is well-bonded and adequately distributed, temporary cracks caused by re-
525
J. Struct. Eng. 1986.112:524-537.
Dow
nloa
ded
from
asc
elib
rary
.org
by
Jaw
ahar
lal N
ehru
Tec
h U
nive
rsity
on
07/1
9/13
. Cop
yrig
ht A
SCE
. For
per
sona
l use
onl
y; a
ll ri
ghts
res
erve
d.
peated but infrequent loads are usually not harmful. Also, although wide cracks may develop, they will close completely upon removal of the load. However, in these studies, Abeles did not conduct a systematic investigation of any particular variable. Bennett, et al. (8,9,10) also reported that upon removal of service loads, complete closure of cracks occurred in beams with a degree of prestress higher than 0.5.
In a study by Stevens (24), it was recommended that partially pre-stressed concrete beams should not be used in conditions of fatigue, unless proven to be acceptable by testing.
Bennett and Joynes (9) observed rapid changes in crack width and deflections during the early stages of cyclic loading of test specimens, followed by relatively stable behavior. The existence of a stable period of behavior was also confirmed by Foo and Warner (16), who conducted constant cycle and cumulative fatigue tests on pretensioned partially prestressed concrete members.
In a theoretical study by Rao and Babu (21), it was concluded that the absolute value of the non-prestressed steel stress range is not much affected by the degree of prestress; however, the stress range increases considerably with an increase in the ratio of the working load level to the ultimate load.
From a reliability study by Siriaksorn and Naaman (22), it was concluded that fatigue is a very critical limit state for partially prestressed concrete members and that failure is most likely to be caused by fracture of the non-prestressed reinforcement.
CRACK LIMITATION FOR FATIGUE
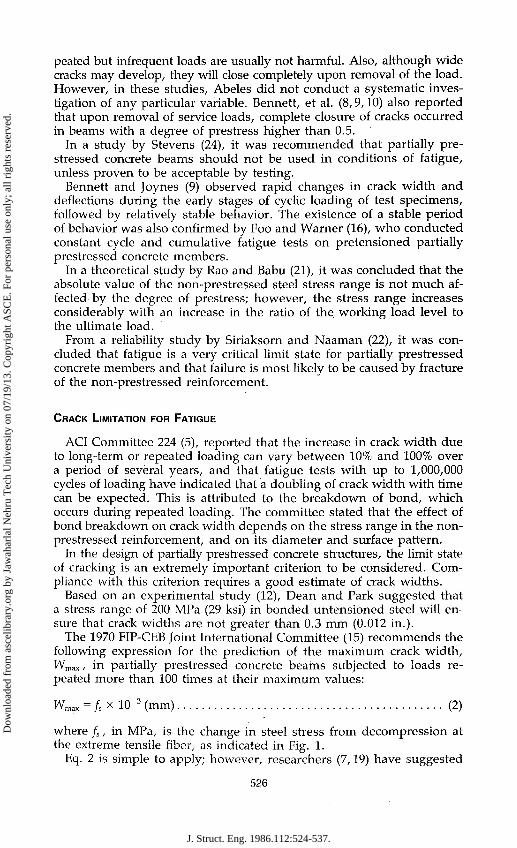
ACI Committee 224 (5), reported that the increase in crack width due to long-term or repeated loading can vary between 10% and 100% over a period of several years, and that fatigue tests with up to 1,000,000 cycles of loading have indicated that a doubling of crack width with time can be expected. This is attributed to the breakdown of bond, which occurs during repeated loading. The committee stated that the effect of bond breakdown on crack width depends on the stress range in the non-prestressed reinforcement, and on its diameter and surface pattern.
In the design of partially prestressed concrete structures, the limit state of cracking is an extremely important criterion to be considered. Compliance with this criterion requires a good estimate of crack widths.
Based on an experimental study (12), Dean and Park suggested that a stress range of 200 MPa (29 ksi) in bonded untensioned steel will ensure that crack widths are not greater than 0.3 mm (0.012 in.).
The 1970 FIP-CEB Joint International Committee (15) recommends the following expression for the prediction of the maximum crack width, Wmax, in partially prestressed concrete beams subjected to loads repeated more than 100 times at their maximum values:
Wmax = /, x 10-3 (mm) . (2)
where fs, in MPa, is the change in steel stress from decompression at the extreme tensile fiber, as indicated in Fig. 1.
Eq. 2 is simple to apply; however, researchers (7,19) have suggested
526
J. Struct. Eng. 1986.112:524-537.
Dow
nloa
ded
from
asc
elib
rary
.org
by
Jaw
ahar
lal N
ehru
Tec
h U
nive
rsity
on
07/1
9/13
. Cop
yrig
ht A
SCE
. For
per
sona
l use
onl
y; a
ll ri
ghts
res
erve
d.

STRESSES
"'ps'
1 \
— y*~~
Vdec
P
\
\
_ \ \ o) Prestress
Force,P
+
/// + ///
- /£-/"
b) Decompression Moment, M(jec
-o
h
/ / / 3>
'if ®
r—©
c)P + Md e c
<D at the tensile concrete face
© at non-prestressed steel level
O at prestressed steel level
FIG. 1.—Decompression States
that this equation underestimates the maximum crack width. This expression will be examined more closely in light of the test results reported in this paper.
TEST PROGRAM
Details of Test Beams.—Eight beams were fabricated and tested (13), all beams having the same overall dimensions and designed for the same flexural strength. The degree of prestress was varied by varying the proportion of prestressed to non-prestressed reinforcement. Details of the test beams and the results are summarized in Table 1, while the dimensions of a typical beam and the loading scheme are shown in Fig. 2.
The beams are designated as shown in Table 1, in accordance with the following system:
Beam designation
(D B20F1 B20F2 F40F1
B60F1 B60F2 B75F1 B75F2 B100F1
Area of non-prestressed steel, As
(mm2)
(2)
1,100
900
600
400
200
TABLE 1
Area of prestressed
steel, Afs (mm2)
P) 55
(1-9 mm strand) 148
(2-11 mm strands) 222
(3-11 mm strands) 297
(3-13 mm strands) 397
(4-13 mm strands)
—Summary of Test Program
Degree of prestress
\ (4)
0.16
0.39
0.59
0.73
1.0
Cracking test (5)
28.0 28.0 43.6
46.7 48.8 59.2 62.3 99.6
Moment theory
(6)
31.4
42.0
46.0
61.0
93.8
Test theory (kN-m)
(7)
0.9 0.9 1.04
1.02 1.06 0.97 1.02 1.06
Flexural strength (MPa)
(8)
164
169
165
161
167
Number of cycles to
failure (kN-m)
(9)
1,168,800 796,600
2,000,000a
1,400,000 800,000 769,000 292,000
2,000,000a
aDid not fail. Note: 1 mm2 = 1.55 x 10"3 sq in.; 1 MPa = 0.145 ksi; 1 k N ' m = 0.738 ft kip; 1 mm = 0.0394 in.
527
J. Struct. Eng. 1986.112:524-537.
Dow
nloa
ded
from
asc
elib
rary
.org
by
Jaw
ahar
lal N
ehru
Tec
h U
nive
rsity
on
07/1
9/13
. Cop
yrig
ht A
SCE
. For
per
sona
l use
onl
y; a
ll ri
ghts
res
erve
d.

1400 4500 1400 1400
V-A I
r v
'//fit L*A
145
l7-5mmDIA. !4-5mm DIA. !7-5mm DIA.[ at 90mm atlOOmm at 90 mm •
ELEVATION
65 L
500
220 1ffl25 t 2#I0M 3-11 mm STRANDS 2#20M
35 !22Qi
SECTION A-A
FIG. 2.—Details of Beam B60F1 (1 mm = 0.039 in.)
B20 : 20% degree of prestress Fl : Fatigue Test No. 1 (constant cyclic loading) F2 : Fatigue Test No. 2 (cumulative fatigue loading)
Test Procedure.—With the exception of beam B100F1, each beam was cracked prior to application of the fatigue loading. This was achieved by subjecting the specimen to a static loading up to approximately 40% of the theoretical ultimate load. Cracks were marked, and the test beam was then unloaded. The specimen was reloaded in increments up to the previous maximum load level, and readings of strain and deflection were recorded at each load increment. Crack widths were measured after application of the final load increment, and the specimen was then subjected to repeated loading by means of a closed loop electro-hydraulic loading system. The test was stopped at predetermined intervals and all readings recorded. This procedure was repeated until failure, or up to 2,000,000 cycles of loading.
Five beams were subjected to a constant load cycle which was repeatedly applied to the beam until failure, while the remaining beams were subjected to cumulative fatigue damage tests.
In the constant load cycle tests, the load was varied over a range from approximately 0.05 of the ultimate load (P„) to 0.40 P„. The testing was stopped at intervals of 100,000 cycles and the necessary readings were taken.
For the cumulative fatigue tests, two different maximum load levels were applied in a load block of 100,000 cycles with the minimum load level being kept the same as in the constant load cycle testing. For the first 90,000 cycles of the load block, the maximum load was approxi-
J. Struct. Eng. 1986.112:524-537.
Dow
nloa
ded
from
asc
elib
rary
.org
by
Jaw
ahar
lal N
ehru
Tec
h U
nive
rsity
on
07/1
9/13
. Cop
yrig
ht A
SCE
. For
per
sona
l use
onl
y; a
ll ri
ghts
res
erve
d.

mately 0.40 P„, and for the remaining 10,000 cycles the maximum load was 0.70 xn„,
PRESENTATION AND ANALYSIS OF RESULTS
Cracking and Deflections.—Cracking and strength results are summarized in Cols. 5-9 of Table 1. In all tests, pronounced increases in midspan deflections were observed during the early stages of repeated loading, followed by a relatively stable period during which deflections remained approximately constant or increased at a very slow rate. This typical behavior is shown in Fig. 3 for beams B60F1 and B60F2. The stable period extended to the point where fracture of a non-prestressed bar occurred. Further reinforcement failures led to a rapid deterioration in behavior accompanied by a new cycle of significant increases in crack widths and deflections. Shortly thereafter, failure of the member occurred. Fig. 3 suggests that there is a significant increase in deflection, and hence decrease in stiffness after the same number of cycles, for beam B60F2 compared with beam B60F1. This behavior was typical for all the corresponding beam specimens.
Fig. 4 shows typical load-deflection curves at various stages in the fatigue life of beam B60F1 which was subjected to constant cycle loading. The increases in deflection were most marked in the initial 100,000 cycles after which the deformation rate reduced considerably. This behavior is attributed to the fact that once the crack pattern is stabilized, further repetition of load has little influence on the widening and extension of cracks.
Fig. 5 presents plots of maximum measured crack width versus the number of cycles of loading for beams B60F1 and B60F2. It is seen that there is marked increase in crack width up to 100,000 cycles, after which stable behavior is observed with only slight increases in crack width. It is clear, also, that the cumulative fatigue test has no significant effect on
AT P= 0.4 Pu
o o —
FAILURE-
/B60FI
8 10 12
NUMBER OF CYCLES x 10
FIG. 3.—Effect of Cumulative Loading on Deflection (1 mm = 0.039 in.)
529
J. Struct. Eng. 1986.112:524-537.
Dow
nloa
ded
from
asc
elib
rary
.org
by
Jaw
ahar
lal N
ehru
Tec
h U
nive
rsity
on
07/1
9/13
. Cop
yrig
ht A
SCE
. For
per
sona
l use
onl
y; a
ll ri
ghts
res
erve
d.

100,000
2 4 6 8 10
MID-SPAN DEFLECTION, mm
FIG. 4.—Typical Load-Deflection Curves under Fatigue Loading (1 mm = 0.039 in.)
0.40
e E x" I-o
0.30
y: 0 0 . 2 0 < (_>
=> ^ 0.I0 X
< CD
©
O B60FI • B60F2
o ® €> C
O O
2 4 6 8 NUMBER OF CYCLES x I 0 5
O
IO
FIG. 5.-—Effect of Cumulative Loading on Maximum Crack Width (1 mm = 0.039 in.)
crack width. The behavior shown in Fig. 5 was typical for all the beam sets tested.
The difference in behavior between Figs. 3 and 5 due to the cumulative fatigue test should be noted. In Fig. 3, there is a marked increase in deflection in beam B60F2 over that in B60F1 at the same load level, while Fig. 5 shows no change in maximum crack width in these beams.
530
J. Struct. Eng. 1986.112:524-537.
Dow
nloa
ded
from
asc
elib
rary
.org
by
Jaw
ahar
lal N
ehru
Tec
h U
nive
rsity
on
07/1
9/13
. Cop
yrig
ht A
SCE
. For
per
sona
l use
onl
y; a
ll ri
ghts
res
erve
d.

This difference in behavior suggests increased internal cracking in the beams subjected to cumulative fatigue loading, and hence an increase in deflection with little or no increase in crack width.
Primary cracks formed in the maximum bending moment region when the cracking load was applied. Additional cracks continued to form in the early load cycles and the final crack pattern was developed within the first 100,000 cycles during which the absolute minimum crack spacing, termed the stabilized minimum crack spacing, Smin, was developed. The maximum possible crack spacing, Smax, under this stabilized condition was found to be approximately 1.4 times the minimum crack spacing. The stabilized mean crack spacing, S,„, is taken as the average spacing in the pure moment region in this stabilized state. Table 2 lists the minimum, maximum and mean stabilized crack spacings. Based on these results, the theoretical values of S,„ can be calculated from the following expressions:
Smin = 0.85 Sm (3a)
Smax = 1.20 S„, (3b)
It should be noted that the shear reinforcement in the pure moment region was spaced at a constant 100 mm (4 in.) which was very close to the stabilized mean crack spacing. This suggests that the stabilized crack pattern may be affected by the locations of the vertical shear reinforcement. Further research is required to study the effect of the stirrup spacing on flexural crack pattern.
Maximum crack widths were measured on both faces of the beam at the level of the non-prestressed steel. These measurements were taken over the constant moment zone of the beams at different stages of cyclic loading. Fig. 6 shows the plot of measured maximum crack widths versus the stresses in the non-prestressed steel at 40% of the ultimate load
TABLE 2.—Measured Crack Spacing
Beam designation
(D B20S1 B20F1 B20F2 B4QS1 B40F1 B60S1 B60F1 B60F2 B75S1 B75F1 B75F2 B100F1
Minimum, Smin (mm)
(2)
82.5 92.5 85.0 80.0 75.0 82.5 85.0 75.0 90.0 90.0 90.0 92.5
Crack Spacing
Maximum, Smax (mm)
(3)
110.0 110.0 105.0 112.5 112.5 110.0 130.0 115.0 160.0 167.5 120.0 110.0
Mean, S,„ (mm) (4)
96.8 100.5 95.3 97.3 92.1 96.8
106.3 94.4
109.2 107.1 103.3 100.6
s,„ Smax
(5)
0.88 0.91 0.91 0.86 0.82 0.88 0.82 0.82 0.68 0.64 0.86 0.91
Average = 0.84
Note: 1 mm = 0.039 in.
531
J. Struct. Eng. 1986.112:524-537.
Dow
nloa
ded
from
asc
elib
rary
.org
by
Jaw
ahar
lal N
ehru
Tec
h U
nive
rsity
on
07/1
9/13
. Cop
yrig
ht A
SCE
. For
per
sona
l use
onl
y; a
ll ri
ghts
res
erve
d.

0.40
E E . £0 .30 1 -Q
5
*: U 0 . 2 0 <
IUM
CR
^ 0.10 X < 2
—
—
o CONSTANT FATIGUE LOADING
WMAX= f s x l d 3 [ C E B - F I P 0 9 7 O ) ] \
/ / / / / / ° o / o A.
o / o o c§a«> o
X o / ° / / o
/ / / /
/ / / / /
/ 1 1
y y^
//° / 0
/ G2D O
OS) O
W M A X = a 2 6 fS - 9 5 ) * 1 0 " 3
° R 2 = 6 9 %
1 1 0 100 200 300 4 0 0
NON-PRESTRESSED STEEL STRESS, MPa
FIG. 6.—Relationship between Maximum Crack Width and Non-Prestressed Steel Stress (1 mm = 0.039 in.; 1 MPa = 0.145 ksi)
for all beams tested under constant cyclic loading. Also shown is the least squares regression line which is represented by
Wmax = (1.26/. - 95) X 10"3 (mm) (4)
with a multiple regression coefficient, R2 = 69%. It is seen from Fig. 6 that Eq. 4 gives predictions close to those given
by the FIP-CEB Eq. 2, and that the latter equation represents an upper limit for the test results. Fig. 6 suggests that the simple FIP-CEB expression (Eq. 2) reflects the trend of the data and can be satisfactorily used to predict the maximum crack width in members subjected to repeated loading.
Fatigue Resistance.—Of the eight beams tested, six failed in fatigue by successive fracturing of the non-prestressed reinforcing bars. Without exception, each fatigue fracture took place at a section where a crack had already developed in the concrete. No fracture was observed in the prestressed tendons. As shown in Col. 9 of Table 1, all three beams subjected to cumulative fatigue loading showed significant reduction in their fatigue life.
Fig. 7 shows the change in the non-prestressed steel stress from the stage of decompression at the level of the steel (Fig. 1) at midspan with increasing number of load cycles for beams B60F1 and B60F2. It is clear that significant increases occurred in the non-prestressed steel stress at midspan as a consequence of repeated loading. The rate of increase was gradual in the early load cycles, and became progressively greater with increasing number of cycles. Generally, Beam B60F2 showed about 25% increase in steel stress compared to beam B60F1. Fig. 8 shows that this trend existed for all beams regardless of degree of prestress. However,
532
J. Struct. Eng. 1986.112:524-537.
Dow
nloa
ded
from
asc
elib
rary
.org
by
Jaw
ahar
lal N
ehru
Tec
h U
nive
rsity
on
07/1
9/13
. Cop
yrig
ht A
SCE
. For
per
sona
l use
onl
y; a
ll ri
ghts
res
erve
d.

NUMBER OF CYCLES (LOG SCALE)
FIG. 7.—Effect of Cumulative Loading on Non-Prestressed Steel Stress (1 MPa 0.145 ksi)
UJ
UJ DC
a. I
z o
200
100
I I
AT 2 0 0 , 0 0 0 CYCLES
I I I !
-CUMULATIVE DAMAGE
^CONSTANT
CYCLE
i i i
0.2 0.4 0.6 0.8
DEGREE OF PRESTRESS
I.O
FIG. 8.—Effect of Degree of Prestress on Non-Prestressed Steel Stress (1 MPa 0.145 ksi)
the effect of the cumulative fatigue load was considerably severe on beam B75F2, due to the relatively low amount of non-prestressed steel available to resist the crack opening. This highlights the importance of providing adequate non-prestressed steel in all partially prestressed concrete sections.
These observations confirm most of those reported by Foo and Warner (16) for pretensioned beams, except that in this study, failure of prestressed and non-prestressed reinforcement was reported to occur with equal frequency. Failure of prestressed and non-prestressed reinforcement was also reported by Bennett, et al. (7,9,10). The difference in
533
J. Struct. Eng. 1986.112:524-537.
Dow
nloa
ded
from
asc
elib
rary
.org
by
Jaw
ahar
lal N
ehru
Tec
h U
nive
rsity
on
07/1
9/13
. Cop
yrig
ht A
SCE
. For
per
sona
l use
onl
y; a
ll ri
ghts
res
erve
d.

o Q. 2 UJ 450 e> z < IX.
w> <" 300 tt
0
0 0.2 0.4 0.6 0.8 1.0
DEGREE OF PRESTRESS
FIG. 9.—Effect of Working Load on Non-Prestressed Steel Stress Range (1 (VIPa = 0.145 ksi)
modes of failure could be due to the difference in location of prestressed reinforcement relative to the non-prestressed reinforcement in a section. This is a variable that warrants further investigation.
Fig. 9 shows the relationship between observed stress range in the non-prestressed steel and the degree of prestress, at different working load levels. At the lowest load level (20%), the steel in the beam with the loWest value of X was subjected to a higher stress range than the steel in the beams having higher X-values. As the load level increased, all beams exhibited rapid increases in the non-prestressed steel stress range after cracking. The beam having a value of X = 0.40 exhibited a lower steel stress range than the other beams. This suggests that from the point of view of stress in non-prestressed steel, a degree of prestress of about 0.40 appears to be optimum.
Fig. 10 shows the stress range in the non-prestressed steel stress with increasing number of cycles, and indicates a significant change in behavior between the beam with 40% prestress and all other beams. Although beam B20F1 and beam B60F1 showed higher change in stress compared to beam B40F1, the stress change remained stable and essentially the same with increasing number of cycles. However, beam B75F1 showed a very slow rate of increase in the stress range for the first 400,000 cycles followed by a rapid stress change until failure at 769,000 cycles. The rapid deterioration of behavior in beam B75F1 reflects the small amount of non-prestressed steel available to resist the crack opening, as well as possible bond deterioration accompanied by slip on either side of existing cracks. This observation also suggests that for optimum and safe design, the degree of prestress should be limited between 40 and 60%. Further research is needed to study more closely the behavior of beams in this region.
It should be noted that the load cycle, which varied between a maximum of 40 or 70% of the ultimate load and a minimum of 0.05 P„, is
534
• 0.2 Pu o 0.4 P„ A 0.6 Pu
J. Struct. Eng. 1986.112:524-537.
Dow
nloa
ded
from
asc
elib
rary
.org
by
Jaw
ahar
lal N
ehru
Tec
h U
nive
rsity
on
07/1
9/13
. Cop
yrig
ht A
SCE
. For
per
sona
l use
onl
y; a
ll ri
ghts
res
erve
d.

B75FI \ ^ ° B60FI
J I i I I I i i i i
0 4 8 12 16 20
NUMBER OF CYCLES , N x 10 5
FIG. 10.—Non-Prestressed Steel Stress Range versus Number of Cycles of Loading (1 MPa = 0.145 ksi)
considered to be somewhat severe in comparison to what would be expected in practice.
CONCLUSIONS AND RECOMMENDATIONS
The following are the conclusions and recommendations based on an experimental investigation of bonded, post-tensioned beams:
1. Pronounced increases in deflection and crack widths occurred in the early stages of testing, after which a stable period of behavior was observed. This stable period was interrupted when fracture of a non-prestressed bar occurred, which led to quite significant changes in behavior.
2. The beams subjected to cumulative fatigue loading exhibited significant increase in deflection over the other specimens which were subjected to constant cyclic loading. The former beams also exhibited reduced life—an important consideration even in beams that will be subjected to only a few cycles of overloading during their lifetime. However, it was observed that little or no change in maximum crack width occurred as a result of cumulative fatigue load.
3. Eq. 2 is acceptable for predicting the maximum crack width in partially prestressed concrete under repeated loading.
4. The minimum and maximum crack spacing can be expressed in terms of the mean crack spacing as given in Eq. 3.
5. It appears that stirrup spacing has a marked effect on crack spacing. This is an area that requires further study.
6. A degree of prestress of about 40% appears to be optimum for good fatigue behavior. Further testing is recommended with beams having values of degree of prestress between 0.3-0.6.
7. Care should be taken to provide an adequate amount of non-pres-tressed reinforcement in all partially prestressed concrete members, particularly those having high degrees of prestress. The minimum values
o a 2
in
« / •3 IX.
CO in ill <r H (/}
_ l HI h i H co
3 0 0
? 0 0
100
0
535
J. Struct. Eng. 1986.112:524-537.
Dow
nloa
ded
from
asc
elib
rary
.org
by
Jaw
ahar
lal N
ehru
Tec
h U
nive
rsity
on
07/1
9/13
. Cop
yrig
ht A
SCE
. For
per
sona
l use
onl
y; a
ll ri
ghts
res
erve
d.

of such reinforcement specified in North American Codes appear inadequate at high degrees of prestress, and should be reviewed.
ACKNOWLEDGMENT
The study was funded by a research grant from the Natural Sciences and Engineering Research Council.
APPENDIX I.—REFERENCES
1. Abeles, P. W. (Dec, 1954). "Static and Fatigue Tests on Partially Prestressed Concrete." ACI Journal, 51(12), 361-376.
2. Abeles, P. W. (Dec, 1965). "Studies of Crack Width and Deformation under Sustained and Fatigue Loading." PCI Journal, 10(6), 43-52.
3. ACI Committee 215. (Mar., 1974). "Considerations for Design of Concrete Structures Subjected to Fatigue Loading." ACI Journal, 71(3), 97-121.
4. ACI Committee 443. (1977). "Analysis and Design of Reinforced Concrete Bridge Structures." ACI Report No. 443R-77, Detroit, MI.
5. ACI Committee 224. (Oct., 1980). "Control of Cracking in Concrete Structures." Concrete International, ACI, 2(10), 35-76.
6. Batchelor, B. deV., and El Shahawi, M. (1983). "State-of-the-Art Report on Partially Prestressed Concrete Bridge Structures." Report No. 23156, Ontario Ministry of Transportation and Communication, Queen's Univ., Kingston, ON, Canada.
7. Bennett, E. W., and Chandrasekhar, C. S. (July, 1971). "Calculation of the Width of Cracks in Class 3 Prestressed Beams." Proceedings of the Institute of Civil Engineers, Vol. 49, 333-346.
8. Bennett, E. W. (1974). "Fatigue of Reinforcement in Beams with Limited Prestress." ACI Publications SP-41, Detroit, MI, 301-313.
9. Bennett, E. W., and Joynes, H. W. (Mar.-Apr., 1977). "Fatigue Resistance of Reinforcement in Partially Prestressed Beams." PC7 Journal, 22(2), 78-89.
10. Bennett, E. W. "Partially Prestressed Members: Repeated Loading." Presented at the June 18-22, 1984, NATO Advanced Workshop, held at Paris, France.
11. CEB-FIP Model Code for Concrete Structures. (1978). 3rd ed. 12. Dean, J. A., and Park, R. (Nov., 1981). "The Observed and Predicted Crack
ing Behaviour of Four Partially Prestressed Concrete Beam Sections." Journal of the New Zealand Institution of Engineers, 8(3), 65-76.
13. El Shahawi, M. "Fatigue and Cracking Behaviour of Partially Prestressed Concrete Members." Thesis presented to Queen's Univ. at Kingston, ON, Canada, in 1985, in partial fulfillment of the requirement for the degree of Doctor of Philosophy.
14. FIP Committee. (1984). "Recommendations for Practical Design of Reinforced and Prestressed Concrete Structures Based on the CEB-FIP Model Code (MC78)." London, England.
15. FIP-CEB Joint International Committee. (June, 1970). "Recommendations for the Design and Construction of Concrete Structure." Cement and Concrete Association, London, England, 1-80.
16. Foo, M. H., and Warner, R. F. "Fatigue Tests on Partially Prestressed Concrete Beams." Presented at the June 18-22, 1984, NATO-Advanced Research Workshop, held at Paris, France.
17. Hanson, J. M., Somes, N. F., and Helgason, T. (1974). "Investigation of Design Factors Affecting Fatigue Strength of Reinforcing Bars." Abeles Symposium on Fatigue of Concrete, ACI Publications SP-41, Detroit, MI, 71-106.
18. MacGregor, James G., Jhamb, I. C , and Nuttall, N. (Mar., 1971). "Fatigue Strength of Hot-Rolled Reinforcing Bars." ACI Journal, 68(33), 169-179.
536
J. Struct. Eng. 1986.112:524-537.
Dow
nloa
ded
from
asc
elib
rary
.org
by
Jaw
ahar
lal N
ehru
Tec
h U
nive
rsity
on
07/1
9/13
. Cop
yrig
ht A
SCE
. For
per
sona
l use
onl
y; a
ll ri
ghts
res
erve
d.

19. Meier, S. W., and Gergely, P. (Feb., 1981). "Flexural Crack Width in Pres-tressed Concrete Beams." /. Struct, Div., ASCE, 107(ST2), 429-432.
20. Ontario Highway Bridge Design Code. (1983). Ministry of Transportation and Communications, Downsview, ON, Canada.
21. Rao, S., and Babu, K. G. "Fatigue Behaviour of Partially Preslressed Concrete Members." Presented at the Aug., 1979, International Symposium on Nonlinear Design of Concrete Structures, held at the Univ. of Waterloo, ON, Canada.
22. Siriaksorn, A., and Naaman, A. E. (June, 1980). "Reliability of Partially Pre-stressed Beams at Serviceability Limit State." Report No. 80-1, Department of Materials Engineering, Univ. of Illinois at Chicago Circle, Chicago, IL.
23. Soretz, S. (July, 1965). "Fatigue Behaviour of High-yield Steel Reinforcement." Concrete and Construction Engineering, (London), 60(7), 272-280.
24. Stevens, R. F. (Nov., 1969). "Tests on Prestressed Reinforced Concrete Beams." Concrete, 3(11).
APPENDIX II.—NOTATION
The following symbols are used in this paper:
area of prestressed reinforcement, area of non-prestressed reinforcement, cylinder compressive strength of concrete, nominal strength of prestressed reinforcement, ultimate strength of prestressed reinforcement, change in non-prestressed steel stress after the stage of decompression at the extreme tensile fiber, yield strength of non-prestressed reinforcement, decompression moment , prestressing force, ultimate load, stabilized minimum, maximum and mean crack spacing, respectively, maximum crack width, and degree of prestress = (Aps/ps)/(^4pS/pS + Asfy).
Aps
As
f'c
IVs
Jpu
u /y
Mdec P
w, max
\
537
J. Struct. Eng. 1986.112:524-537.
Dow
nloa
ded
from
asc
elib
rary
.org
by
Jaw
ahar
lal N
ehru
Tec
h U
nive
rsity
on
07/1
9/13
. Cop
yrig
ht A
SCE
. For
per
sona
l use
onl
y; a
ll ri
ghts
res
erve
d.