Flexural Analysis Model of Externally Prestressed Steel ...
21
Citation: Yan, W.; Chen, L.; Han, B.; Xie, H.; Sun, Y. Flexural Analysis Model of Externally Prestressed Steel-Concrete Composite Beam with Nonlinear Interfacial Connection. Appl. Sci. 2022, 12, 4699. https:// doi.org/10.3390/app12094699 Academic Editor: Dario De Domenico Received: 12 April 2022 Accepted: 5 May 2022 Published: 7 May 2022 Publisher’s Note: MDPI stays neutral with regard to jurisdictional claims in published maps and institutional affil- iations. Copyright: © 2022 by the authors. Licensee MDPI, Basel, Switzerland. This article is an open access article distributed under the terms and conditions of the Creative Commons Attribution (CC BY) license (https:// creativecommons.org/licenses/by/ 4.0/). applied sciences Article Flexural Analysis Model of Externally Prestressed Steel-Concrete Composite Beam with Nonlinear Interfacial Connection Wutong Yan 1,2, * , Liangjiang Chen 1 , Bing Han 2 , Huibing Xie 2 and Yue Sun 3 1 China Railway Economic and Planning Research Institute Co., Ltd., Beijing 100038, China; [email protected] 2 School of Civil Engineering, Beijing Jiaotong University, Beijing 100044, China; [email protected] (B.H.); [email protected] (H.X.) 3 China Building Technique Group Co., Ltd., Beijing 100013, China; [email protected] * Correspondence: [email protected] Abstract: Interfacial slip effects and the unbonded phenomenon of external tendons are the key mechanical features of the externally prestressed steel-concrete composite beams (EPCBs). In this paper, an 8-node fiber beam element is built for the nonlinear analysis of the composite beam with interfacial slip effects. A multi-node slipping cable element is proposed for the simulation of external tendons. The derived formulations are programmed in OpenSees as newly developed element classes to be conveniently used for the flexural analysis of EPCBs. The effectiveness of the proposed model is fully verified against the experimental tests of simply supported and continuous beams and then applied to the parametric study. The results show that the increasing deviator spacing will significantly decrease the tendon effective depth at ultimate states and further decrease the flexural capacity. The larger effective depth is beneficial to the tendon stress increments and further improves the flexural capacity. The enhancement of interfacial shear connection degree will increase the structural capacity but the effects on the tendon stress increments and second-order effects were not monotonic. Keywords: external tendon; composite beam; interfacial slip; nonlinear behavior; flexural analysis 1. Introduction Steel-concrete composite beams are widely used in practice due to their efficient material usage and remarkable features: low self-weight, high ductility and rapid con- struction [1]. For the construction of longer span steel-concrete composite beams or in retrofitting, external prestressing is a commonly employed technology to improve struc- tural performance [2]. The flexural capacity, deflections and stress level will be significantly reinforced in the externally prestressed composite beams (EPCBs). Compared with conventional post-tensioned members, EPCB has two featured me- chanical behaviors, including slip effects at the interface [3] and the unbonded phenomenon of external tendons [4–6]. Both of the actions are member-dependent behaviors rather than cross-section-dependent, increasing the complexity of structural analysis and design. During recent decades, many experimental tests [7–16] have been conducted to in- vestigate the structural behaviors of EPCBs. The test by Ayyub et al. [7] confirmed the improvement of external prestressing on the structural load carrying capacity and ductility. While they also concluded that the interfacial slip caused larger deflections than their analytical predictions with the no-slip assumption. Chen and Gu [8,9] finished two EPCB tests under positive moment loading and four groups of EPCB tests under hogging moment loading, pointing out that external tendons developed substantial incremental stress at the ultimate state. Lorenc and Kubica [10] tested six EPCBs with different tendon profiles. Appl. Sci. 2022, 12, 4699. https://doi.org/10.3390/app12094699 https://www.mdpi.com/journal/applsci
-
Upload
khangminh22 -
Category
Documents
-
view
0 -
download
0
Transcript of Flexural Analysis Model of Externally Prestressed Steel ...

Citation: Yan, W.; Chen, L.; Han, B.;
Xie, H.; Sun, Y. Flexural Analysis
Model of Externally Prestressed
Steel-Concrete Composite Beam with
Nonlinear Interfacial Connection.
Appl. Sci. 2022, 12, 4699. https://
doi.org/10.3390/app12094699
Academic Editor: Dario De
Domenico
Received: 12 April 2022
Accepted: 5 May 2022
Published: 7 May 2022
Publisher’s Note: MDPI stays neutral
with regard to jurisdictional claims in
published maps and institutional affil-
iations.
Copyright: © 2022 by the authors.
Licensee MDPI, Basel, Switzerland.
This article is an open access article
distributed under the terms and
conditions of the Creative Commons
Attribution (CC BY) license (https://
creativecommons.org/licenses/by/
4.0/).
applied sciences
Article
Flexural Analysis Model of Externally PrestressedSteel-Concrete Composite Beam with NonlinearInterfacial ConnectionWutong Yan 1,2,* , Liangjiang Chen 1, Bing Han 2 , Huibing Xie 2 and Yue Sun 3
1 China Railway Economic and Planning Research Institute Co., Ltd., Beijing 100038, China;[email protected]
2 School of Civil Engineering, Beijing Jiaotong University, Beijing 100044, China; [email protected] (B.H.);[email protected] (H.X.)
3 China Building Technique Group Co., Ltd., Beijing 100013, China; [email protected]* Correspondence: [email protected]
Abstract: Interfacial slip effects and the unbonded phenomenon of external tendons are the keymechanical features of the externally prestressed steel-concrete composite beams (EPCBs). In thispaper, an 8-node fiber beam element is built for the nonlinear analysis of the composite beam withinterfacial slip effects. A multi-node slipping cable element is proposed for the simulation of externaltendons. The derived formulations are programmed in OpenSees as newly developed elementclasses to be conveniently used for the flexural analysis of EPCBs. The effectiveness of the proposedmodel is fully verified against the experimental tests of simply supported and continuous beamsand then applied to the parametric study. The results show that the increasing deviator spacingwill significantly decrease the tendon effective depth at ultimate states and further decrease theflexural capacity. The larger effective depth is beneficial to the tendon stress increments and furtherimproves the flexural capacity. The enhancement of interfacial shear connection degree will increasethe structural capacity but the effects on the tendon stress increments and second-order effects werenot monotonic.
Keywords: external tendon; composite beam; interfacial slip; nonlinear behavior; flexural analysis
1. Introduction
Steel-concrete composite beams are widely used in practice due to their efficientmaterial usage and remarkable features: low self-weight, high ductility and rapid con-struction [1]. For the construction of longer span steel-concrete composite beams or inretrofitting, external prestressing is a commonly employed technology to improve struc-tural performance [2]. The flexural capacity, deflections and stress level will be significantlyreinforced in the externally prestressed composite beams (EPCBs).
Compared with conventional post-tensioned members, EPCB has two featured me-chanical behaviors, including slip effects at the interface [3] and the unbonded phenomenonof external tendons [4–6]. Both of the actions are member-dependent behaviors rather thancross-section-dependent, increasing the complexity of structural analysis and design.
During recent decades, many experimental tests [7–16] have been conducted to in-vestigate the structural behaviors of EPCBs. The test by Ayyub et al. [7] confirmed theimprovement of external prestressing on the structural load carrying capacity and ductility.While they also concluded that the interfacial slip caused larger deflections than theiranalytical predictions with the no-slip assumption. Chen and Gu [8,9] finished two EPCBtests under positive moment loading and four groups of EPCB tests under hogging momentloading, pointing out that external tendons developed substantial incremental stress atthe ultimate state. Lorenc and Kubica [10] tested six EPCBs with different tendon profiles.
Appl. Sci. 2022, 12, 4699. https://doi.org/10.3390/app12094699 https://www.mdpi.com/journal/applsci
Appl. Sci. 2022, 12, 4699 2 of 21
Chen et al. [11,12], Nie et al. [13] and Sun et al. [14] tested the effects of external prestressingin continuous EPCBs and revealed that both the tendon stress increments and interfacialslip effects affected the structural deformation and load-carrying capacity. Recently, moreconcerns were paid to EPCB designed with a partial shear connection [17,18] or existingstructures with degraded interfacial shear resistance in particular [19]. The tests by Has-sanin et al. [15] and El-Sisi et al. [16] showed that an increase in shear connection degreefrom 0.4 to 1.0 led to a 46% load capacity increment of an EPCB. The simultaneous effects ofinterfacial slip and the unbonded phenomenon of external tendons lead to more difficultiesfor flexural response predictions of EPCB. The numerical model was usually taken as theoptional solution.
A reliable numerical model for EPCB should include the following considerations: thematerial and geometrical nonlinearities, the nonlinear interfacial connection, and the free-slipbehaviors of external tendons at deviators. To date, there are mainly two kinds of numericalmodels presented in the references, the refined solid model and the beam-tendon model.
In the refined solid models, the steel beam, concrete slab, and even the shear con-nectors were all modeled by the shell or solid elements concerning actual geometricalshapes [20–26]. These models were usually directly modeled in common FE software. Theinterfacial shear-slip behaviors between the steel beams and concrete slabs were modeledby the contact element with cohesive or friction properties. But there were still no availableelement types in current 3D FE software for external tendons with free-slip behaviors atdeviators. The conventional truss element [23–25] cannot satisfy the strain-compatiblerelation between the adjacent tendon segments. Meanwhile, the complex modeling processand enormous computational costs were usually needed in these models, reducing theanalysis efficiency for large-scale structures.
In beam-tendon models, the composite beam and external tendons were all modeled bythe one-dimensional structural element types, such as beam and link/truss elements. (1) Forcomposite beam, Lou et al. [27–30] and El-Zohairy et al. [31] adopted the conventional fiberbeam element to model the flexural behaviors. The interfacial slip effect was not consideredas there was no interfacial slip defined for the conventional fiber beam element. To addressthis issue, Zhang et al. proposed a modified modeling method [32] in which the steel beamand concrete slab were separately modeled by beam elements and the non-linear springelements were added between them to model the slip effect. This method was verifiedto be effective but needed a fussy modeling process to define the DOFs coupling relation.Dall’Asta [33–35] and Sousa et al. [36] proposed the idea of introducing additional DOFsinto the Euler–Bernoulli beam element to consider interfacial slip effects. A three-node 10-DOF element, taking the axial deformation of steel beams and concrete slabs as the separateDOFs, was proposed for the composite beam with deformable connectors. This was a goodidea and was followed by the authors. While a new thought of taking the interfacial relativeslip deformation as the additional DOF was proposed in this paper, then the FE formulationwas further simplified and a two-node 8 DOF element was built. (2) For the modelingof the external tendon, ignoring frictions between tendon and deviators, the traction wasassumed to be equal along the whole length. With the strain-compatible relation considered,Lou et al. [28–30] proposed an equivalent loads method to model the unbonded effectsof the external tendon. They only derived the resistance force equations but ignored thestiffness constructions of external tendons, reducing the numerical convergence in theNewton solution. Taking the external tendon as a whole member, the complete resistancevector and stiffness matrix of a multi-node slipping cable element are further derived anddirectly presented herein.
In this paper, a new beam-tendon model is proposed for the flexural analysis ofEPCBs with deformable interfacial connectors. A two-node 8-DOF fiber beam elementis proposed for steel-concrete composite beams with material, geometric and interfacialconnection nonlinearity. A multi-node slipping cable element is constructed to modelthe unbonded phenomenon of external tendons with the complete resistance vector andstiffness matrix. Compared with the existing method, this paper provides more simplified

Appl. Sci. 2022, 12, 4699 3 of 21
and highly efficient FE formulations which were then successfully developed in the open-source framework OpenSees. The proposed model and developed procedure are fullyverified against the experimental results of simply supported and continuous EPCBs. Theverified model is used for the parametric analysis. The effects of various factors, includingdeviator spacing, the effective height of external tendon, interfacial slip and loading typesare then discussed.
2. Finite Element Formulations and Developed Procedure2.1. Schemes of the Proposed Model
The proposed model is mainly applied for the analysis of EPCBs with deformableinterfacial connections, such as EPCBs designed with partial shear connections or existingEPCB with degraded shear connectors.
Based on the principles of high computational efficiency and accuracy, the schemes ofthe proposed model are built, as shown in Figure 1. There are two new types of elementsintroduced. For the steel-concrete composite beam, a new type of fiber beam elementconsidering nonlinear interfacial connection is proposed, improving the drawbacks oftraditional fiber beam element without interface-slip effects. For the external tendons, amulti-node slipping cable element is proposed to model the slip and strain-compatibleeffects of the external tendon across the deviators. Meanwhile, a rigid link element isbuilt for the connection of two components at the deviators. The FE formulations of theseelements are derived and the computational procedures are developed in the OpenSees [37]framework as new element classes. The proposed model and developed procedure providean effective tool for the flexural behavior analysis of externally prestressed compositebeams (EPCBs).
Appl. Sci. 2022, 12, x FOR PEER REVIEW 3 of 22
nection nonlinearity. A multi-node slipping cable element is constructed to model the un-
bonded phenomenon of external tendons with the complete resistance vector and stiffness
matrix. Compared with the existing method, this paper provides more simplified and
highly efficient FE formulations which were then successfully developed in the open-
source framework OpenSees. The proposed model and developed procedure are fully
verified against the experimental results of simply supported and continuous EPCBs. The
verified model is used for the parametric analysis. The effects of various factors, including
deviator spacing, the effective height of external tendon, interfacial slip and loading types
are then discussed.
2. Finite Element Formulations and Developed Procedure
2.1. Schemes of the Proposed Model
The proposed model is mainly applied for the analysis of EPCBs with deformable
interfacial connections, such as EPCBs designed with partial shear connections or existing
EPCB with degraded shear connectors.
Based on the principles of high computational efficiency and accuracy, the schemes
of the proposed model are built, as shown in Figure 1. There are two new types of elements
introduced. For the steel-concrete composite beam, a new type of fiber beam element con-
sidering nonlinear interfacial connection is proposed, improving the drawbacks of tradi-
tional fiber beam element without interface-slip effects. For the external tendons, a multi-
node slipping cable element is proposed to model the slip and strain-compatible effects of
the external tendon across the deviators. Meanwhile, a rigid link element is built for the
connection of two components at the deviators. The FE formulations of these elements are
derived and the computational procedures are developed in the OpenSees [37] framework
as new element classes. The proposed model and developed procedure provide an effec-
tive tool for the flexural behavior analysis of externally prestressed composite beams
(EPCBs).
Figure 1. Externally prestressed composite beam and the proposed model components.
2.2. Fiber Beam Element Model with Nonlinear Interfacial Connection
The fiber beam element model with a nonlinear interfacial connection is built with
the idea of inducing the additional DOF into the conventional fiber beam element to de-
scribe the interfacial slip deformation. In contrast to the methods in [33–36], only two ad-
ditional DOFs describing the relative slip deformation are introduced at both beam ends,
and a two-node 8-DOF fiber beam element is proposed, as shown in Figure 2. For each
node, four DOFs are defined to describe the kinematics of the composite beam, including
the axial displacement u, vertical displacement v, rotation θ and interfacial relative slip ucs
(introduced DOF compared with the conventional fiber beam element). The cross-section
PNode for anchorage
fiber beam element for composite beam
Rigid link
PNode for deviator
Tendon element
P P
(a) Externally prestressed composite beam
(b) Components of the proposed model
Figure 1. Externally prestressed composite beam and the proposed model components.
2.2. Fiber Beam Element Model with Nonlinear Interfacial Connection
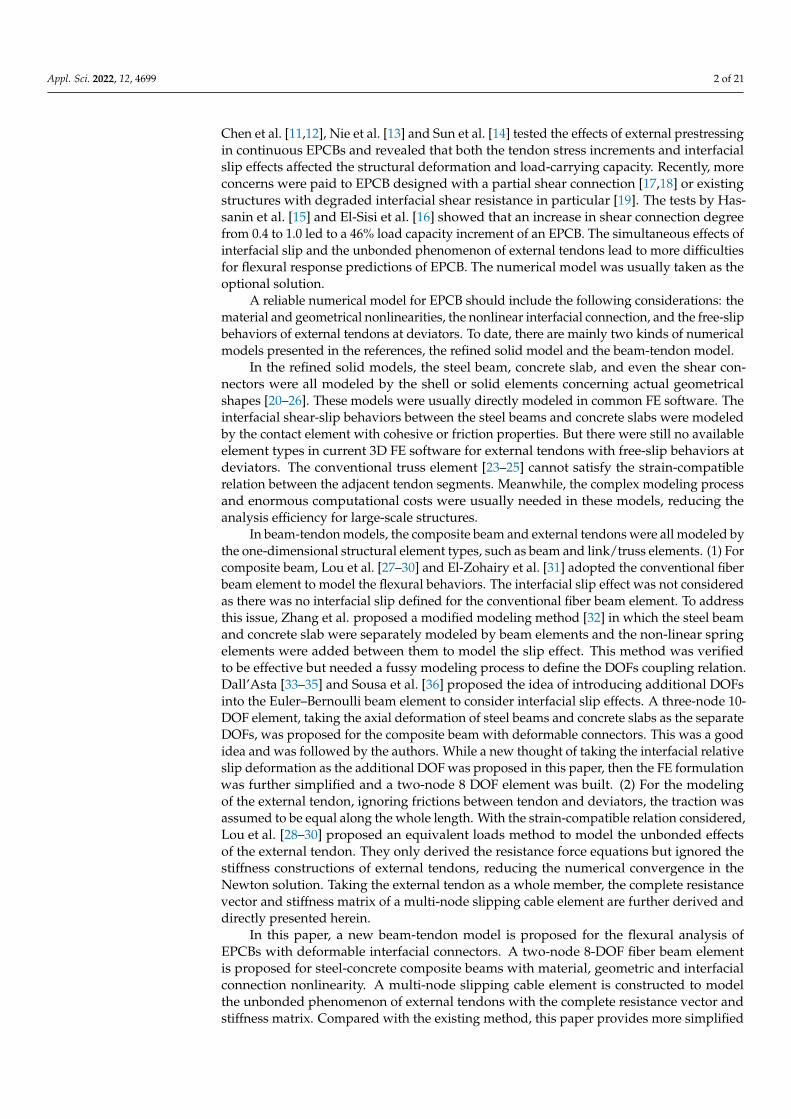
The fiber beam element model with a nonlinear interfacial connection is built with theidea of inducing the additional DOF into the conventional fiber beam element to describethe interfacial slip deformation. In contrast to the methods in [33–36], only two additionalDOFs describing the relative slip deformation are introduced at both beam ends, and atwo-node 8-DOF fiber beam element is proposed, as shown in Figure 2. For each node,four DOFs are defined to describe the kinematics of the composite beam, including theaxial displacement u, vertical displacement v, rotation θ and interfacial relative slip ucs(introduced DOF compared with the conventional fiber beam element). The cross-section isdefined by discrete fibers, including concrete fibers, steel fibers and reinforcement fibers.

Appl. Sci. 2022, 12, 4699 4 of 21
Appl. Sci. 2022, 12, x FOR PEER REVIEW 4 of 22
is defined by discrete fibers, including concrete fibers, steel fibers and reinforcement fi-bers.
Figure 2. Fiber beam element and fiber section definition.
The numbers of element nodes are named i and j. The element local coordinate axial x is defined along the element line and the yOz plane is defined in the cross-section, as shown in Figure 2. The displacement vector u and resistance vector F of the element are defined in Equations (1) and (2), respectively. The axial force N, shear force V, moment M and interfacial shear force Fcs are defined as the resistance force concerning u, v, θ and ucs. The subscript i and j denote the corresponding nodal number.
θ θ = T
i i i csi j j j csju v u u v uu (1)
T
i i i csi j j j csjN V M F N V M F = F
(2)
Eliminating the rigid body displacements, the main deformation modes of the ele-ment can be labeled axial deformation, rotational deformation and slip deformation, as shown in Figure 3. The basic deformation vector ub can be expressed as Equation (3). The transformation relation between ub and u is shown in Equation (4). cx = (L + ∆ux)/Ln, cx = ∆uy/Ln. L is the initial element length and Ln is the deformed element length. ∆ux and ∆uy
denote relative displacement along the local x and y axes, respectively.
Figure 3. Deformation modes of the proposed fiber beam element.
(a) Element definition
Concrete fiber
Rebar Steel fiber
(b) Fiber section
Concrete Slab
Steel Beamy
z
x
j
i
i j
vi
ui
vj
θi θj
L
xyOucsi uj
ucsj
y
z
kth fiber data(yk, zk, Ak, Ek, σk, ϕsk, ϕck)
Ωc
Ωs
ϕsk=0, ϕck=1 for (yk, zk) Ωc∈
ϕsk=1, ϕck=0 for (yk, zk) Ωs∈
(a) Axial deformation mode (b) Rotation deformation mode
θ
(c) Slip deformation mode
newly introduced mode
Figure 2. Fiber beam element and fiber section definition.
The numbers of element nodes are named i and j. The element local coordinate axialx is defined along the element line and the yOz plane is defined in the cross-section, asshown in Figure 2. The displacement vector u and resistance vector F of the element aredefined in Equations (1) and (2), respectively. The axial force N, shear force V, moment Mand interfacial shear force Fcs are defined as the resistance force concerning u, v, θ and ucs.The subscript i and j denote the corresponding nodal number.
u =[
ui vi θi ucsi uj vj θj ucsj]T (1)
F =[
Ni Vi Mi Fcsi Nj Vj Mj Fcsj]T (2)
Eliminating the rigid body displacements, the main deformation modes of the elementcan be labeled axial deformation, rotational deformation and slip deformation, as shown inFigure 3. The basic deformation vector ub can be expressed as Equation (3). The transforma-tion relation between ub and u is shown in Equation (4). cx = (L + ∆ux)/Ln, cx = ∆uy/Ln. L isthe initial element length and Ln is the deformed element length. ∆ux and ∆uy denoterelative displacement along the local x and y axes, respectively.
ub =[
∆u θ′ θ′ ucsi ucsj]T (3)
ub = Pu
P =
−cx −cy 0 0 cx cy 0 0−cy/Ln cx/Ln 1 0 cy/Ln −cx/Ln 0 0−cy/Ln cx/Ln 0 0 cy/Ln −cx/Ln 1 0
0 0 0 1 0 0 0 00 0 0 0 0 0 0 1
(4)
With the basic deformation vector ub, the deformation field inside the element canbe denoted by the Hermite polynomial interpolation method, as shown in Equation (5),in which ξ = x/L, x is the local coordinate in the element, and 0 ≤ ξ ≤ 1. The axial andslip deformations are interpolated by linear equations and the rotation deformation isinterpolated by a quadratic polynomial.
Appl. Sci. 2022, 12, 4699 5 of 21
u(x) = N(x)ub =[
∆u(x) θ(x) ucs(x)]T
N(x) =
ξ 0 0 0 00 3ξ2 − 4ξ + 1 3ξ2 − 2ξ 0 00 0 0 1− ξ ξ
(5)
E(x) =[
εs(x) εc(x) φ(x) ucs(x)]T
=[
∂∆u(x)∂x
∂(∆u(x)+ucs(x))∂x
∂θ(x)∂x ucs(x)
]T= B(x)ub
B(x) =
1/L 0 0 0 0
0 (6ξ − 4)/L (6ξ − 2)/L 0 01/L 0 0 −1/L 1/L
0 0 0 1− ξ ξ
(6)
Appl. Sci. 2022, 12, x FOR PEER REVIEW 4 of 22
is defined by discrete fibers, including concrete fibers, steel fibers and reinforcement fi-bers.
Figure 2. Fiber beam element and fiber section definition.
The numbers of element nodes are named i and j. The element local coordinate axial x is defined along the element line and the yOz plane is defined in the cross-section, as shown in Figure 2. The displacement vector u and resistance vector F of the element are defined in Equations (1) and (2), respectively. The axial force N, shear force V, moment M and interfacial shear force Fcs are defined as the resistance force concerning u, v, θ and ucs. The subscript i and j denote the corresponding nodal number.
θ θ = T
i i i csi j j j csju v u u v uu (1)
T
i i i csi j j j csjN V M F N V M F = F
(2)
Eliminating the rigid body displacements, the main deformation modes of the ele-ment can be labeled axial deformation, rotational deformation and slip deformation, as shown in Figure 3. The basic deformation vector ub can be expressed as Equation (3). The transformation relation between ub and u is shown in Equation (4). cx = (L + ∆ux)/Ln, cx = ∆uy/Ln. L is the initial element length and Ln is the deformed element length. ∆ux and ∆uy
denote relative displacement along the local x and y axes, respectively.
Figure 3. Deformation modes of the proposed fiber beam element.
(a) Element definition
Concrete fiber
Rebar Steel fiber
(b) Fiber section
Concrete Slab
Steel Beamy
z
x
j
i
i j
vi
ui
vj
θi θj
L
xyOucsi uj
ucsj
y
z
kth fiber data(yk, zk, Ak, Ek, σk, ϕsk, ϕck)
Ωc
Ωs
ϕsk=0, ϕck=1 for (yk, zk) Ωc∈
ϕsk=1, ϕck=0 for (yk, zk) Ωs∈
(a) Axial deformation mode (b) Rotation deformation mode
θ
(c) Slip deformation mode
newly introduced mode
Figure 3. Deformation modes of the proposed fiber beam element.
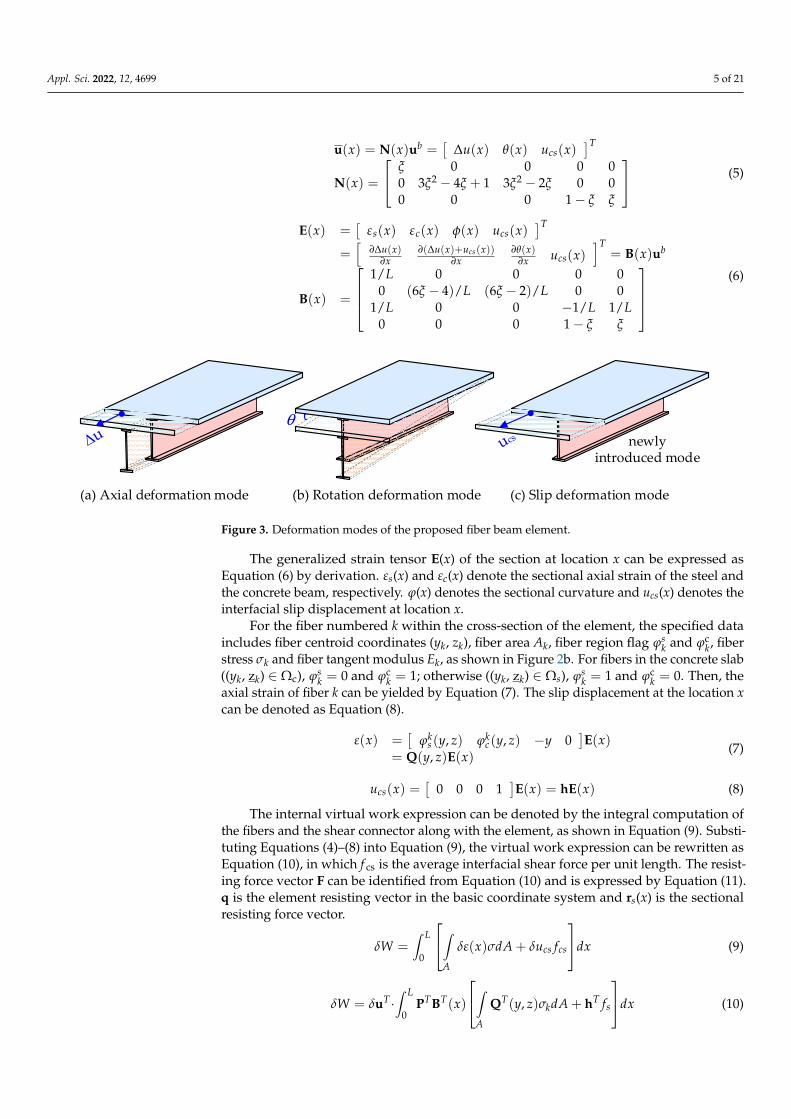
The generalized strain tensor E(x) of the section at location x can be expressed asEquation (6) by derivation. εs(x) and εc(x) denote the sectional axial strain of the steel andthe concrete beam, respectively. ϕ(x) denotes the sectional curvature and ucs(x) denotes theinterfacial slip displacement at location x.
For the fiber numbered k within the cross-section of the element, the specified dataincludes fiber centroid coordinates (yk, zk), fiber area Ak, fiber region flag ϕs
k and ϕck, fiber
stress σk and fiber tangent modulus Ek, as shown in Figure 2b. For fibers in the concrete slab((yk, zk) ∈ Ωc), ϕs
k = 0 and ϕck = 1; otherwise ((yk, zk) ∈ Ωs), ϕs
k = 1 and ϕck = 0. Then, the
axial strain of fiber k can be yielded by Equation (7). The slip displacement at the location xcan be denoted as Equation (8).
ε(x) =[
ϕks(y, z) ϕk
c(y, z) −y 0]E(x)
= Q(y, z)E(x)(7)
ucs(x) =[
0 0 0 1]E(x) = hE(x) (8)
The internal virtual work expression can be denoted by the integral computation ofthe fibers and the shear connector along with the element, as shown in Equation (9). Substi-tuting Equations (4)–(8) into Equation (9), the virtual work expression can be rewritten asEquation (10), in which f cs is the average interfacial shear force per unit length. The resist-ing force vector F can be identified from Equation (10) and is expressed by Equation (11).q is the element resisting vector in the basic coordinate system and rs(x) is the sectionalresisting force vector.
δW =∫ L
0
∫A
δε(x)σdA + δucs fcs
dx (9)
δW = δuT ·∫ L
0PTBT(x)
∫A
QT(y, z)σkdA + hT fs
dx (10)
Appl. Sci. 2022, 12, 4699 6 of 21
F = PTq
q =∫ L
0 BT(x)
[∫A
QT(y, z)σkdA + hT fs
]dx =
∫ L0 BT(x)rs(x)dx
(11)
The element stiffness matrix K can be obtained by the partial derivative of Equation (11)to u, as shown in Equation (12). kg is the geometric stiffness matrix and km is the materialstiffness matrix in the basic coordinate system. The derived expression of km is shown inEquation (13), in which ks is the sectional stiffness matrix. Based on the idea of the fibersection method, the integration style of rs and ks can be calculated by the algebraic sum-mary of the total fibers’ contribution, as shown in Equations (14) and (15). The integrationsof the km and q of the element are implemented using the Gauss–Lobatto method.
K = ∂F∂u = ∂
∂u(PTq
)= ∂PT
∂u q + PT ∂q∂ub
∂ub
∂u
= kg + PTkmP
(12)
km =∫ L
0BT(x)ksB(x)dx (13)
ks(x) =n
∑k=1
QT(y, z)EkQT(y, z) + hTρsh (14)
rs(x) =n
∑k=1
QT(y, z)σk + hT fs (15)
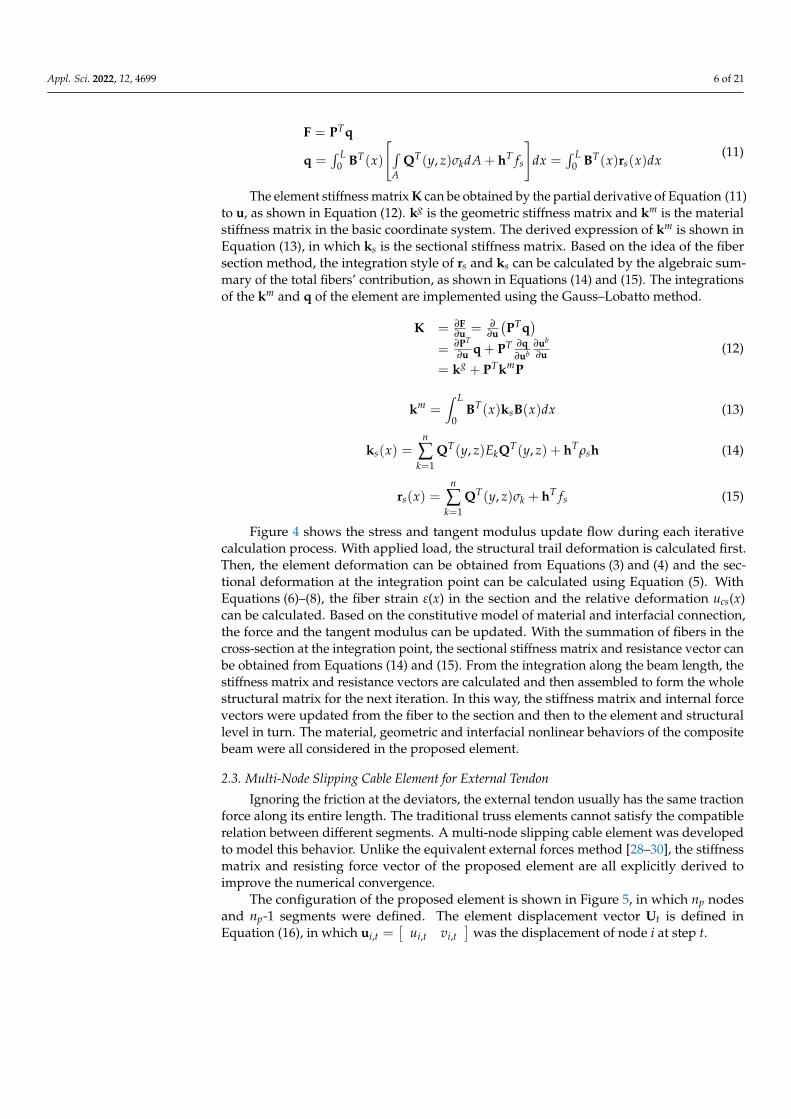
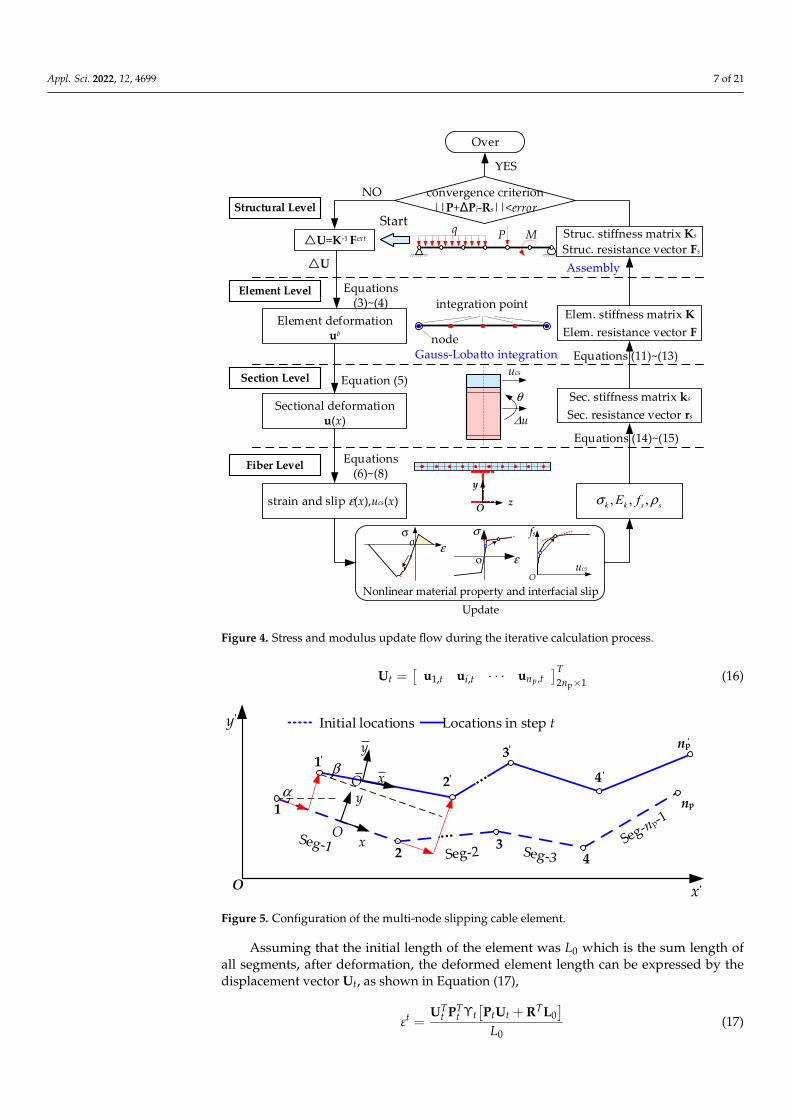
Figure 4 shows the stress and tangent modulus update flow during each iterativecalculation process. With applied load, the structural trail deformation is calculated first.Then, the element deformation can be obtained from Equations (3) and (4) and the sec-tional deformation at the integration point can be calculated using Equation (5). WithEquations (6)–(8), the fiber strain ε(x) in the section and the relative deformation ucs(x)can be calculated. Based on the constitutive model of material and interfacial connection,the force and the tangent modulus can be updated. With the summation of fibers in thecross-section at the integration point, the sectional stiffness matrix and resistance vector canbe obtained from Equations (14) and (15). From the integration along the beam length, thestiffness matrix and resistance vectors are calculated and then assembled to form the wholestructural matrix for the next iteration. In this way, the stiffness matrix and internal forcevectors were updated from the fiber to the section and then to the element and structurallevel in turn. The material, geometric and interfacial nonlinear behaviors of the compositebeam were all considered in the proposed element.
2.3. Multi-Node Slipping Cable Element for External Tendon
Ignoring the friction at the deviators, the external tendon usually has the same tractionforce along its entire length. The traditional truss elements cannot satisfy the compatiblerelation between different segments. A multi-node slipping cable element was developedto model this behavior. Unlike the equivalent external forces method [28–30], the stiffnessmatrix and resisting force vector of the proposed element are all explicitly derived toimprove the numerical convergence.
The configuration of the proposed element is shown in Figure 5, in which np nodesand np-1 segments were defined. The element displacement vector Ut is defined inEquation (16), in which ui,t =
[ui,t vi,t
]was the displacement of node i at step t.
Appl. Sci. 2022, 12, 4699 7 of 21Appl. Sci. 2022, 12, x FOR PEER REVIEW 7 of 22
Nonlinear material property and interfacial slip
Structural Level
Element Level
Section Level
Fiber Level
Element deformationub
U
integration point
node
ucs
Δu
θSectional deformation
u(x)
strain and slip ε(x),ucs(x)
Equation (5)
Equations (6)~(8)
Equations (14)~(15)
Sec. stiffness matrix ks
Sec. resistance vector rs
Elem. stiffness matrix KElem. resistance vector F
Equations (11)~(13)Gauss-Lobatto integration
U=K-1 Fext
Assembly
Struc. stiffness matrix Ks
Struc. resistance vector Fs
q P M
Over
YES
NO convergence criterion ||P+∆Pi-Rs||<error
, , ,k k s sE fσ ρz
y
O
Equations (3)~(4)
ucsO
fs
εoσ
ε
σ
o
Update
Start
Figure 4. Stress and modulus update flow during the iterative calculation process.
2.3. Multi-Node Slipping Cable Element for External Tendon Ignoring the friction at the deviators, the external tendon usually has the same trac-
tion force along its entire length. The traditional truss elements cannot satisfy the compat-ible relation between different segments. A multi-node slipping cable element was devel-oped to model this behavior. Unlike the equivalent external forces method [28–30], the stiffness matrix and resisting force vector of the proposed element are all explicitly de-rived to improve the numerical convergence.
The configuration of the proposed element is shown in Figure 5, in which np nodes and np-1 segments were defined. The element displacement vector Ut is defined in Equa-tion (16), in which , , ,i t i t i tu v = u was the displacement of node i at step t.
Figure 4. Stress and modulus update flow during the iterative calculation process.
Ut =[
u1,t ui,t · · · unp ,t]T
2np×1 (16)
Appl. Sci. 2022, 12, x FOR PEER REVIEW 8 of 22
Figure 5. Configuration of the multi-node slipping cable element.
p1, , ,
2 1p
T
t t i t n tn ×
= U u u u (16)
Assuming that the initial length of the element was L0 which is the sum length of all segments, after deformation, the deformed element length can be expressed by the dis-placement vector Ut, as shown in Equation (17),
0
0
T T Tt t t t tt
Lε
ϒ + =U P P U R L
(17)
in which,
( ) ( )2 2 2
1 0 11 0 1
1 0 1
1 0 1p p
t
n n− ×
− − = − −
P
, ( )( ) ( )1 12 2 2 2p
p pj n
n ndiag −
− × −
= R r r r ,
cos X cos Ycos Y cos Xj
= −
r , 1,0 ,0
,0
cos X j j
j
x xl
+ −= , 1,0 ,0
,0
cos Y j j
j
y yl
+ −= ,
1
1 1 11, 2 2 , 2 2 , 2 2np
t t j t tdiag l l l−
− − −× × ×
ϒ = I I I , 0 1,0 ,0 1,0p
TT T T
j n − = L L L L , ,0 ,0 0
T
j jl = L .
By the virtual work equation and variation principle, the resisting force vector and stiffness matrix of the element can be derived and expressed in Equations (18) and (19), respectively. Ap is the area of the external tendon, σp and Ep denote the tendon stress and tangent modulus at time t, respectively, which is calculated according to the material con-stitute model. g
tk and mtk denote the geometric and material stiffness matrix, respectively.
0= Tt p p t gAσ Γf L R P (18)
( )0 0 0=
g mt t tg Tt p p t t t t
m T T Tt p p t t t t
A
E A L
σ= +
= ϒ − Γ
Γ ϒ
K k kk P P
k P R L L R P
(19)
It should be noted that the nodal and segment number of the element was not limited during the derivation. This meant that the proposed element was able to be applied to
O x
y Initial locations Locations in step t
αβ
O1
2 34
np
1'
2
3
4
np
'
'
'
'
y
x
O_y_
x_
'
'
Figure 5. Configuration of the multi-node slipping cable element.
Assuming that the initial length of the element was L0 which is the sum length ofall segments, after deformation, the deformed element length can be expressed by thedisplacement vector Ut, as shown in Equation (17),
εt =UT
t PTt Υt
[PtUt + RTL0
]L0
(17)

Appl. Sci. 2022, 12, 4699 8 of 21
in which,
Pt =
−1 0 1
−1 0 1−1 0 1
. . . . . . . . .−1 0 1
(2np−2)×(2np)
, R = diag([
r1 rj · · · rnp−1
])(2np−2)×(2np−2)
,
rj =
[cos X cos Y− cos Y cos X
], cos X =
xj+1,0−xj,0lj,0
, cos Y =yj+1,0−yj,0
lj,0,
Υt = diag([
l−11,t I2×2 l−1
j,t I2×2 · · · l−1np−1,tI2×2
]), L0 =
[LT
1,0 LTj,0 · · · LT
np−1,0
]T, Lj,0 =
[lj,0 0
]T.
By the virtual work equation and variation principle, the resisting force vector andstiffness matrix of the element can be derived and expressed in Equations (18) and (19),respectively. Ap is the area of the external tendon, σp and Ep denote the tendon stress andtangent modulus at time t, respectively, which is calculated according to the material con-stitute model. kg
t and kmt denote the geometric and material stiffness matrix, respectively.
ft = σp ApLT0 RΓtPg (18)
Kt = kgt + km
tkg
t = σp ApPTt (Υt − Γt)Pt
kmt = Ep Ap/L0PT
t ΓtRTL0LT
0 RΥtPt
(19)
It should be noted that the nodal and segment number of the element was not limitedduring the derivation. This meant that the proposed element was able to be applied tomodel external tendons of any profile type. Meanwhile, the geometric and material stiffnessmatrix is expressed in explicit form, improving the computational convergence.
2.4. Rigid Link between Beam and Tendon
Taking the beam node as the master node and the external tendon node as the slavenode, the interaction relationship between the DOFs of the two nodes (DOFs of beamnode named uc and DOFs of tendon node named ut) can be expressed as Equation (20).As shown in Figure 6, one end of the rigid link connected to the beam node is the rigidconnection and the other end connected to the external tendon is the hinge connection.The translational and rotational displacements of beam nodes lead to the translation oftendon nodes.
ut =
[1 0 ∆y 00 1 −∆x 0
]uc (20)
2.5. Constitutive Model
(1) Concrete constitutive model
The Concrete02 material in OpenSees is adopted to model the nonlinear behaviors ofconcrete, as shown in Figure 7a. The compressive stress-strain relationship is assumed inthe parabolic-ascending linear-descending form. The tension stress-strain curve is linearelastic before cracking and then linear-softening for cases beyond the cracking strain. Theultimate compressive and tensile strain are determined according to the crushing andcracking energy to mitigate the mesh sensitivity, respectively. The equations are shown inEquations (21) and (22), in which L denotes the element characteristic length, GFc is theconcrete crushing energy, GF is the concrete fracture energy, f c is the concrete compressionstrength, ft is the concrete tension strength, Ec is the initial elastic modulus of concrete. Thevalues of GFc, GF and GF0 are determined following the suggestion of CEB-FIP [38].
εcu =2GFcfcL
+ εc0, GFc = 8.8√
fc (21)

Appl. Sci. 2022, 12, 4699 9 of 21
εtu = 2GF/(L ft), GF = GF0( fc/10)0.7 (22)
Appl. Sci. 2022, 12, x FOR PEER REVIEW 9 of 22
model external tendons of any profile type. Meanwhile, the geometric and material stiff-ness matrix is expressed in explicit form, improving the computational convergence.
2.4. Rigid Link between Beam and Tendon Taking the beam node as the master node and the external tendon node as the slave
node, the interaction relationship between the DOFs of the two nodes (DOFs of beam node named uc and DOFs of tendon node named ut) can be expressed as Equation (20). As shown in Figure 6, one end of the rigid link connected to the beam node is the rigid con-nection and the other end connected to the external tendon is the hinge connection. The translational and rotational displacements of beam nodes lead to the translation of tendon nodes.
Figure 6. The rigid link connection between the beam and tendon elements.
1 0 00 1 0t c
yx
Δ = −Δ
u u (20)
2.5. Constitutive Model (1) Concrete constitutive model The Concrete02 material in OpenSees is adopted to model the nonlinear behaviors of
concrete, as shown in Figure 7a. The compressive stress-strain relationship is assumed in the parabolic-ascending linear-descending form. The tension stress-strain curve is linear elastic before cracking and then linear-softening for cases beyond the cracking strain. The ultimate compressive and tensile strain are determined according to the crushing and cracking energy to mitigate the mesh sensitivity, respectively. The equations are shown in Equations (21) and (22), in which L denotes the element characteristic length, GFc is the concrete crushing energy, GF is the concrete fracture energy, fc is the concrete compression strength, ft is the concrete tension strength, Ec is the initial elastic modulus of concrete. The values of GFc, GF and GF0 are determined following the suggestion of CEB-FIP [38].
0 c
2, 8.8Fc
cu c F cc
GG f
f Lε ε= + = (21)
( ) ( )0.7
02 / 10tu F t F F cG Lf G G fε = =,
(22)
Beam element
Tendon element
Rigid link
Master node Nc
Slave node Nt
Rigid connection
Hinge connection
Δy=yc-y
t
uc=[u v θ ucs]T
ut=[uxt uyt]T
ut=Λuc
Δx=xc-xt
Figure 6. The rigid link connection between the beam and tendon elements.
(2) Prestressing steel tendon constitutive model
Appl. Sci. 2022, 12, x FOR PEER REVIEW 10 of 22
Figure 7. Constitutive model in the analysis of EPCB.
(2) Prestressing steel tendon constitutive model The material nonlinear behaviors of the prestressing tendon are modeled by the
Steel02 model in OpenSees, as shown in Figure 7b. Ep and fpy denote the initial elastic mod-ulus and yield strength of the prestressing tendons. bp represents the ratio of strain-hard-ening modulus to the initial elastic tangent. In this paper, we adopt bp =0, R0 = 18 for the Steel02 model definition and the default values are used for the other parameters (see http://opensees.berkeley.edu/ (accessed on 1 March 2020)). Meanwhile, the initial pre-stress σpe is defined in Steel02.
(3) Constitutive model for steel beam and reinforcements The Steel01 model is chosen to model the material behaviors of steel beams and rein-
forcements, as shown in Figure 7c. Es and fy denote the elastic modulus and yield of steel, respectively. b denotes the ratio of strain-hardening modulus to Es. For the steel beam, b = 0.005; for reinforcements, b = 0.0 is adopted in the simulation.
(4) Interfacial shear-slip model The interfacial shear-slip constitutive relationship proposed by Ollgaard et al. [39] is
employed to simulate the nonlinear interfacial behaviors, as shown in Equation (23). Vu denotes average interfacial shear capacity per unit length. Aus is the average area of the shear stud cross-section per unit length. fs represents the average shear force at the inter-face under ucs slip displacement. fu is the yield strength of steel studs. n and m are the curve shape calibration parameters according to the shear-slip tests of shear connector speci-mens. If there were no test data available, the default value m = 0.558 and n = 1 mm−1 can be adopted. Figure 7d shows the interfacial slip-shear curves. In OpenSees, we use the MultiLinear material model to define the curve and the initial modulus is determined as the secant modulus at 0.1 mm slip displacement.
ε
σtf
(εt0,σt0)
εtu(εcu,0) o1
Ec
o w
σGF/L
1Ec
w0
ft
1Ets
(εc0,σc0)
(a) Concrete
GFc/L
ε
σ
(c) Steel beam and reinforcements
o1
Es
1Es
εy
-εy
fy
-fy
Es=2×10⁵N/mm2
ucsO
fs
(d) Interfacial shear-slip model
u us c c us u0.43 0.7V A E f A f= ≤
( )u 1 csmnu
sf V e−= −
1bEs
1 bEs
fpy
(b) Prestressing steel tendon
1
Ep
fc
1 bpEp
Figure 7. Constitutive model in the analysis of EPCB.
The material nonlinear behaviors of the prestressing tendon are modeled by theSteel02 model in OpenSees, as shown in Figure 7b. Ep and fpy denote the initial elasticmodulus and yield strength of the prestressing tendons. bp represents the ratio of strain-hardening modulus to the initial elastic tangent. In this paper, we adopt bp = 0, R0 = 18for the Steel02 model definition and the default values are used for the other parameters(see http://opensees.berkeley.edu/ (accessed on 1 March 2020)). Meanwhile, the initialprestress σpe is defined in Steel02.
(3) Constitutive model for steel beam and reinforcements
The Steel01 model is chosen to model the material behaviors of steel beams andreinforcements, as shown in Figure 7c. Es and fy denote the elastic modulus and yield ofsteel, respectively. b denotes the ratio of strain-hardening modulus to Es. For the steel beam,b = 0.005; for reinforcements, b = 0.0 is adopted in the simulation.

Appl. Sci. 2022, 12, 4699 10 of 21
(4) Interfacial shear-slip model
The interfacial shear-slip constitutive relationship proposed by Ollgaard et al. [39]is employed to simulate the nonlinear interfacial behaviors, as shown in Equation (23).Vu denotes average interfacial shear capacity per unit length. Aus is the average area ofthe shear stud cross-section per unit length. f s represents the average shear force at theinterface under ucs slip displacement. fu is the yield strength of steel studs. n and m arethe curve shape calibration parameters according to the shear-slip tests of shear connectorspecimens. If there were no test data available, the default value m = 0.558 and n = 1 mm−1
can be adopted. Figure 7d shows the interfacial slip-shear curves. In OpenSees, we use theMultiLinear material model to define the curve and the initial modulus is determined asthe secant modulus at 0.1 mm slip displacement.
fs = Vu(1− e−nucs)m
Vu = 0.43Aus√
Ec fc ≤ 0.7Aus fu(23)
2.6. Computational Procedure Development
With the derived FE formulations, three types of elements are developed in theOpenSees framework [37] with the C++ programming language. Meanwhile, the Tclcommand interpreters are defined in the procedure for the convenient application in theanalysis model. The framework of the developed Classes in OpenSees is shown in Figure 8.The advantage of the developed procedure is that there are abundant nonlinear constitutivemodels and solvers built into the OpenSees software, which can be used conveniently inthe numerical model.
Appl. Sci. 2022, 12, x FOR PEER REVIEW 11 of 22
( )1 csmnu
s uf V e−= −
0.43 0.7u us c c us uV A E f A f= ≤ (23)
2.6. Computational Procedure Development With the derived FE formulations, three types of elements are developed in the Open-
Sees framework [37] with the C++ programming language. Meanwhile, the Tcl command interpreters are defined in the procedure for the convenient application in the analysis model. The framework of the developed Classes in OpenSees is shown in Figure 8. The advantage of the developed procedure is that there are abundant nonlinear constitutive models and solvers built into the OpenSees software, which can be used conveniently in the numerical model.
Figure 8. The framework developed in OpenSees.
2.7. Highlights of the Proposed Model The highlights of the proposed model can be concluded as follows: (1) A new modeling method is proposed by introducing two relative slip DOFs into
the ends of the fiber beam element. An 8-DOF fiber beam element was built for the com-posite beam with material, geometric and interfacial nonlinearity.
(2) Taking the external tendon as the whole member, a multi-node slipping cable el-ement is proposed with a complete stiffness and resistance matrix. Compared with the equivalent load method, the numerical convergence was improved and can be widely used for external tendons with different profiles.
(3) The methods and framework of the element classes developed in OpenSees are presented.
3. Experimental Verification 3.1. Verification for the Nonlinear Interfacial Behaviors
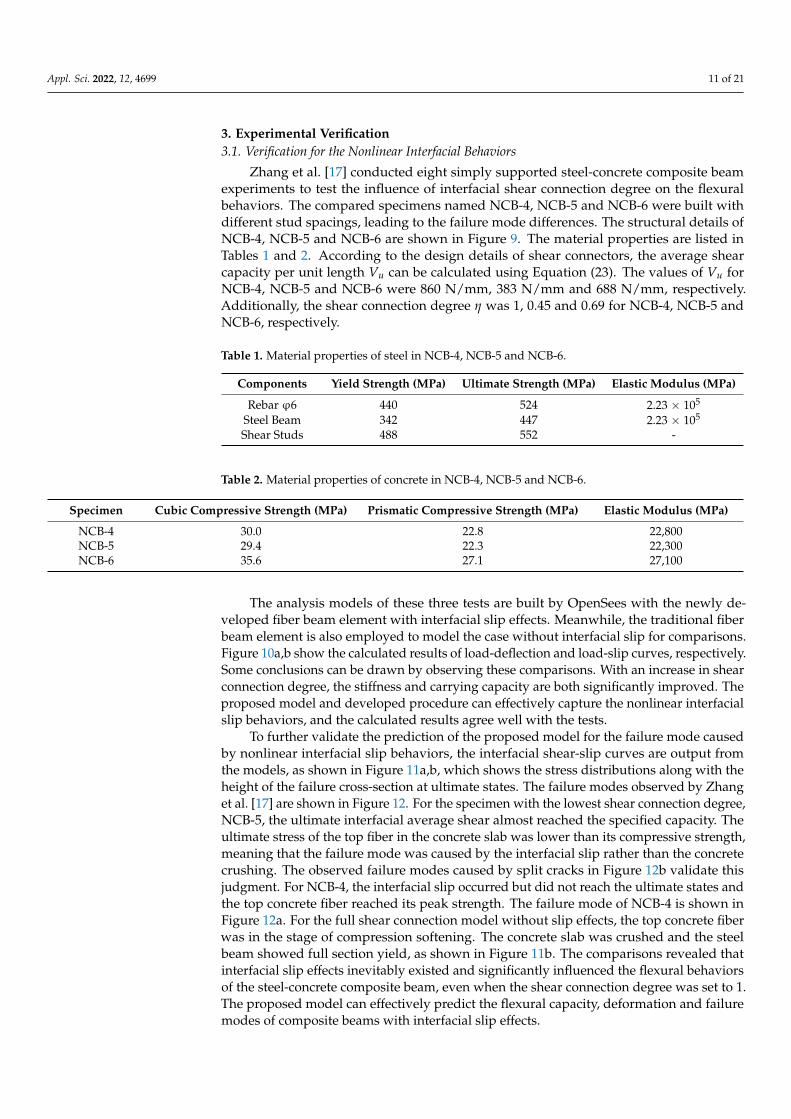
Zhang et al. [17] conducted eight simply supported steel-concrete composite beam experiments to test the influence of interfacial shear connection degree on the flexural be-haviors. The compared specimens named NCB-4, NCB-5 and NCB-6 were built with dif-ferent stud spacings, leading to the failure mode differences. The structural details of NCB-4, NCB-5 and NCB-6 are shown in Figure 9. The material properties are listed in
Classes for Composite Beam Element
Material Element CrdTransf
SectionForceDeformation
FiberSection_ComStruct
getregion(yloc,zloc,ymax,ymin)commitState()getStressResultant()getSectionTangent()getSectionDeformation()...
Dis_ComStruct
commitState()getResistingForce()getBasicStiff()getTangentStiff()getInitialStiff()...
CrdTransf_ComStruct
commitState()compElemtLengthAndOrient()compTransfMatrixLocalGlobal()compTransfMatrixBasicLocal()getGlobalResistingForce()getGlobalStiffMatrix()...
SectionForceDeformation Class Element Class Geometric Transformation Class
Base Classes
Classes for Slipping Cable Element
SlippingTendoncommitState()getResistingForce()getBasicStiff()getTangentStiff()getInitialStiff()...
TclModelBuilder
Tcl Command Interpreter
Tcl Com
mand Interpreter
Developed Parts
MP_Constraint
Rigid Link
Figure 8. The framework developed in OpenSees.
2.7. Highlights of the Proposed Model
The highlights of the proposed model can be concluded as follows:
(1) A new modeling method is proposed by introducing two relative slip DOFs intothe ends of the fiber beam element. An 8-DOF fiber beam element was built for thecomposite beam with material, geometric and interfacial nonlinearity.
(2) Taking the external tendon as the whole member, a multi-node slipping cable elementis proposed with a complete stiffness and resistance matrix. Compared with theequivalent load method, the numerical convergence was improved and can be widelyused for external tendons with different profiles.
(3) The methods and framework of the element classes developed in OpenSees are presented.
Appl. Sci. 2022, 12, 4699 11 of 21
3. Experimental Verification3.1. Verification for the Nonlinear Interfacial Behaviors
Zhang et al. [17] conducted eight simply supported steel-concrete composite beamexperiments to test the influence of interfacial shear connection degree on the flexuralbehaviors. The compared specimens named NCB-4, NCB-5 and NCB-6 were built withdifferent stud spacings, leading to the failure mode differences. The structural details ofNCB-4, NCB-5 and NCB-6 are shown in Figure 9. The material properties are listed inTables 1 and 2. According to the design details of shear connectors, the average shearcapacity per unit length Vu can be calculated using Equation (23). The values of Vu forNCB-4, NCB-5 and NCB-6 were 860 N/mm, 383 N/mm and 688 N/mm, respectively.Additionally, the shear connection degree η was 1, 0.45 and 0.69 for NCB-4, NCB-5 andNCB-6, respectively.
Table 1. Material properties of steel in NCB-4, NCB-5 and NCB-6.
Components Yield Strength (MPa) Ultimate Strength (MPa) Elastic Modulus (MPa)
Rebar ϕ6 440 524 2.23 × 10⁵
Steel Beam 342 447 2.23 × 10⁵
Shear Studs 488 552 -
Table 2. Material properties of concrete in NCB-4, NCB-5 and NCB-6.
Specimen Cubic Compressive Strength (MPa) Prismatic Compressive Strength (MPa) Elastic Modulus (MPa)
NCB-4 30.0 22.8 22,800NCB-5 29.4 22.3 22,300NCB-6 35.6 27.1 27,100
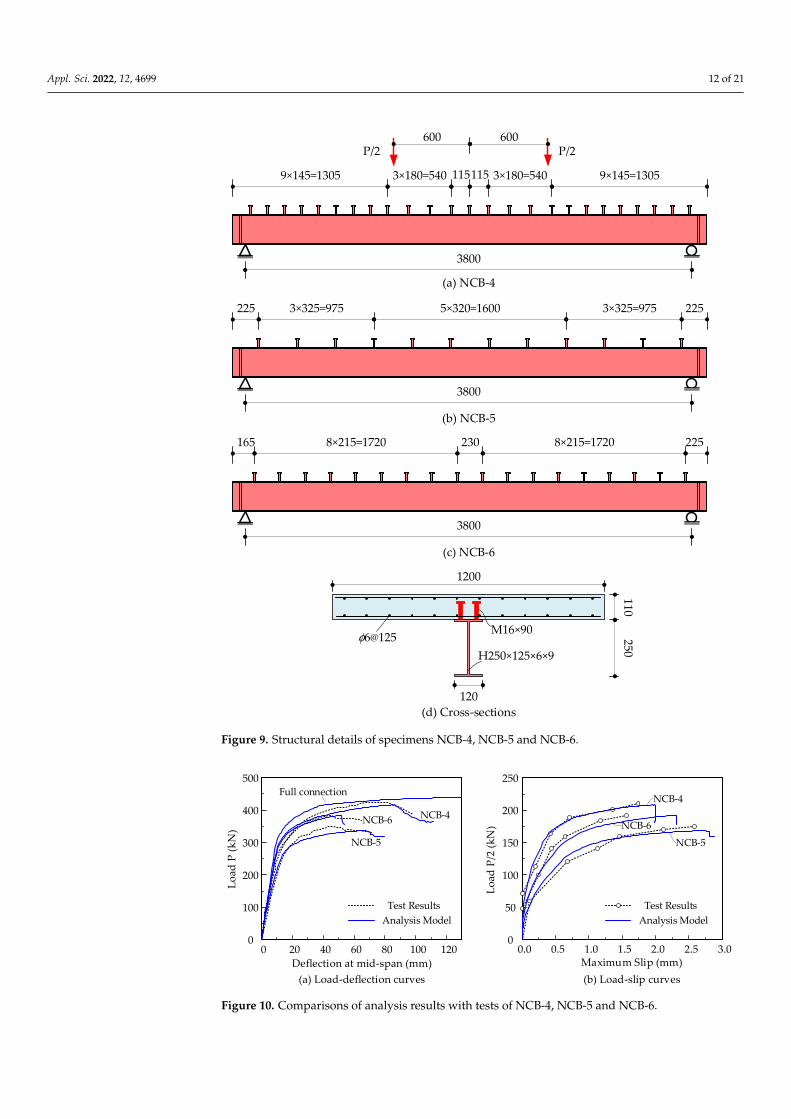
The analysis models of these three tests are built by OpenSees with the newly de-veloped fiber beam element with interfacial slip effects. Meanwhile, the traditional fiberbeam element is also employed to model the case without interfacial slip for comparisons.Figure 10a,b show the calculated results of load-deflection and load-slip curves, respectively.Some conclusions can be drawn by observing these comparisons. With an increase in shearconnection degree, the stiffness and carrying capacity are both significantly improved. Theproposed model and developed procedure can effectively capture the nonlinear interfacialslip behaviors, and the calculated results agree well with the tests.
To further validate the prediction of the proposed model for the failure mode causedby nonlinear interfacial slip behaviors, the interfacial shear-slip curves are output fromthe models, as shown in Figure 11a,b, which shows the stress distributions along with theheight of the failure cross-section at ultimate states. The failure modes observed by Zhanget al. [17] are shown in Figure 12. For the specimen with the lowest shear connection degree,NCB-5, the ultimate interfacial average shear almost reached the specified capacity. Theultimate stress of the top fiber in the concrete slab was lower than its compressive strength,meaning that the failure mode was caused by the interfacial slip rather than the concretecrushing. The observed failure modes caused by split cracks in Figure 12b validate thisjudgment. For NCB-4, the interfacial slip occurred but did not reach the ultimate states andthe top concrete fiber reached its peak strength. The failure mode of NCB-4 is shown inFigure 12a. For the full shear connection model without slip effects, the top concrete fiberwas in the stage of compression softening. The concrete slab was crushed and the steelbeam showed full section yield, as shown in Figure 11b. The comparisons revealed thatinterfacial slip effects inevitably existed and significantly influenced the flexural behaviorsof the steel-concrete composite beam, even when the shear connection degree was set to 1.The proposed model can effectively predict the flexural capacity, deformation and failuremodes of composite beams with interfacial slip effects.
Appl. Sci. 2022, 12, 4699 12 of 21
Appl. Sci. 2022, 12, x FOR PEER REVIEW 12 of 22
Tables 1 and 2. According to the design details of shear connectors, the average shear capacity per unit length Vu can be calculated using Equation (23). The values of Vu for NCB-4, NCB-5 and NCB-6 were 860 N/mm, 383 N/mm and 688 N/mm, respectively. Ad-ditionally, the shear connection degree η was 1, 0.45 and 0.69 for NCB-4, NCB-5 and NCB-6, respectively.
Figure 9. Structural details of specimens NCB-4, NCB-5 and NCB-6.
Table 1. Material properties of steel in NCB-4, NCB-5 and NCB-6.
Components Yield Strength (MPa) Ultimate Strength (MPa) Elastic Modulus (MPa)Rebar φ6 440 524 2.23 × 10⁵
Steel Beam 342 447 2.23 × 10⁵ Shear Studs 488 552 -
9×145=1305 9×145=13053×180=540 3×180=540115115
3800
3×325=975 3×325=9755×320=1600
3800
225 225
8×215=1720 8×215=1720230
3800
165 225
(a) NCB-4
(b) NCB-5
(c) NCB-6
1200
110250
120
φ6@125H250×125×6×9
M16×90
(d) Cross-sections
600 600P/2 P/2
Figure 9. Structural details of specimens NCB-4, NCB-5 and NCB-6.
Appl. Sci. 2022, 12, x FOR PEER REVIEW 13 of 22
Table 2. Material properties of concrete in NCB-4, NCB-5 and NCB-6.
Specimen Cubic Compressive Strength (MPa)
Prismatic Compressive Strength (MPa) Elastic Modulus (MPa)
NCB-4 30.0 22.8 22,800 NCB-5 29.4 22.3 22,300 NCB-6 35.6 27.1 27,100
The analysis models of these three tests are built by OpenSees with the newly devel-oped fiber beam element with interfacial slip effects. Meanwhile, the traditional fiber beam element is also employed to model the case without interfacial slip for comparisons. Figure 10a,b show the calculated results of load-deflection and load-slip curves, respec-tively. Some conclusions can be drawn by observing these comparisons. With an increase in shear connection degree, the stiffness and carrying capacity are both significantly im-proved. The proposed model and developed procedure can effectively capture the non-linear interfacial slip behaviors, and the calculated results agree well with the tests.
Figure 10. Comparisons of analysis results with tests of NCB-4, NCB-5 and NCB-6.
To further validate the prediction of the proposed model for the failure mode caused by nonlinear interfacial slip behaviors, the interfacial shear-slip curves are output from the models, as shown in Figure 11a,b, which shows the stress distributions along with the height of the failure cross-section at ultimate states. The failure modes observed by Zhang et al. [17] are shown in Figure 12. For the specimen with the lowest shear connection de-gree, NCB-5, the ultimate interfacial average shear almost reached the specified capacity. The ultimate stress of the top fiber in the concrete slab was lower than its compressive strength, meaning that the failure mode was caused by the interfacial slip rather than the concrete crushing. The observed failure modes caused by split cracks in Figure 12b vali-date this judgment. For NCB-4, the interfacial slip occurred but did not reach the ultimate states and the top concrete fiber reached its peak strength. The failure mode of NCB-4 is shown in Figure 12a. For the full shear connection model without slip effects, the top con-crete fiber was in the stage of compression softening. The concrete slab was crushed and the steel beam showed full section yield, as shown in Figure 11b. The comparisons re-vealed that interfacial slip effects inevitably existed and significantly influenced the flex-ural behaviors of the steel-concrete composite beam, even when the shear connection de-gree was set to 1. The proposed model can effectively predict the flexural capacity, defor-mation and failure modes of composite beams with interfacial slip effects.
0 20 40 60 80 100 1200
100
200
300
400
500
Load
P (k
N)
Deflection at mid-span (mm)
Test ResultsAnalysis Model
Full connection
NCB-4NCB-6
NCB-5
0.0 0.5 1.0 1.5 2.0 2.5 3.00
50
100
150
200
250
Load
P/2
(kN
)
Maximum Slip (mm)
Test ResultsAnalysis Model
NCB-4
NCB-6
NCB-5
(a) Load-deflection curves (b) Load-slip curves
Figure 10. Comparisons of analysis results with tests of NCB-4, NCB-5 and NCB-6.

Appl. Sci. 2022, 12, 4699 13 of 21Appl. Sci. 2022, 12, x FOR PEER REVIEW 14 of 22
0.0 0.5 1.0 1.5 2.0 2.5 3.00
200
400
600
800
Ave
rage
inte
rfac
ial s
hear
per
un
it le
ngth
(N/m
m)
Maximum Slip (mm)
NCB−5
NCB−6
NCB−4Vu for NCB−4
Vu for NCB−6
Vu for NCB−5260 280 300 320 340 360
-1.0
-0.6
-0.2
0.2
NCB−4NCB−5NCB−6Full connection
σc/fc
sectional height (mm)
0 50 100 150 200 250-200
0
200
400
σs (M
Pa)
sectional height (mm)
TensionCompression
TensionCompression
(b) Stress distributions along the height of cross-section(a) Average interfacial shear-slip curves Figure 11. Analysis of failure modes by the calculated results.
Figure 12. Failure modes observed in the tests.
3.2. Verification for the Case of Simply Supported EPCB Lorenc and Kubica [10] tested the flexural behaviors of externally prestressed steel-
concrete composite beams with different tendon profiles. Two specimens, named B3 and B4, are employed to verify the proposed model. B3 and B4 had similar structural dimen-sions (as shown in Figure 13) except for the tendon profiles, which were draped-style for B3 and straight-style for B4. The average compression strength of concrete fc = 31.7 MPa and the elastic modulus Ec = 28.6 GPa. The yield strength of the steel beam fy = 293 MPa and the yield stress of the cover-plate was 358 MPa. According to the push-out tests of the shear connector, the maximum interfacial shear capacity of a single connector was 75 kN and the authors recommended α = 0.3, β = 0.55. The reinforcements of 8 mm diameter were embedded into the concrete slab, and the yield stress of the rebar was 428 MPa. The exter-nal prestressing was implemented using two nominal diameters of 15.7 mm seven-wire strands, whose Ap = 150 mm2, Ep = 197.8 GPa and initial effective prestress σpe = 950 MPa.
Figure 11. Analysis of failure modes by the calculated results.
Appl. Sci. 2022, 12, x FOR PEER REVIEW 14 of 22
0.0 0.5 1.0 1.5 2.0 2.5 3.00
200
400
600
800
Ave
rage
inte
rfac
ial s
hear
per
un
it le
ngth
(N/m
m)
Maximum Slip (mm)
NCB−5
NCB−6
NCB−4Vu for NCB−4
Vu for NCB−6
Vu for NCB−5260 280 300 320 340 360
-1.0
-0.6
-0.2
0.2
NCB−4NCB−5NCB−6Full connection
σc/fc
sectional height (mm)
0 50 100 150 200 250-200
0
200
400
σs (M
Pa)
sectional height (mm)
TensionCompression
TensionCompression
(b) Stress distributions along the height of cross-section(a) Average interfacial shear-slip curves Figure 11. Analysis of failure modes by the calculated results.
Figure 12. Failure modes observed in the tests.
3.2. Verification for the Case of Simply Supported EPCB Lorenc and Kubica [10] tested the flexural behaviors of externally prestressed steel-
concrete composite beams with different tendon profiles. Two specimens, named B3 and B4, are employed to verify the proposed model. B3 and B4 had similar structural dimen-sions (as shown in Figure 13) except for the tendon profiles, which were draped-style for B3 and straight-style for B4. The average compression strength of concrete fc = 31.7 MPa and the elastic modulus Ec = 28.6 GPa. The yield strength of the steel beam fy = 293 MPa and the yield stress of the cover-plate was 358 MPa. According to the push-out tests of the shear connector, the maximum interfacial shear capacity of a single connector was 75 kN and the authors recommended α = 0.3, β = 0.55. The reinforcements of 8 mm diameter were embedded into the concrete slab, and the yield stress of the rebar was 428 MPa. The exter-nal prestressing was implemented using two nominal diameters of 15.7 mm seven-wire strands, whose Ap = 150 mm2, Ep = 197.8 GPa and initial effective prestress σpe = 950 MPa.
Figure 12. Failure modes observed in the tests.
3.2. Verification for the Case of Simply Supported EPCB
Lorenc and Kubica [10] tested the flexural behaviors of externally prestressed steel-concrete composite beams with different tendon profiles. Two specimens, named B3 and B4,are employed to verify the proposed model. B3 and B4 had similar structural dimensions(as shown in Figure 13) except for the tendon profiles, which were draped-style for B3 andstraight-style for B4. The average compression strength of concrete fc = 31.7 MPa and theelastic modulus Ec = 28.6 GPa. The yield strength of the steel beam fy = 293 MPa and theyield stress of the cover-plate was 358 MPa. According to the push-out tests of the shearconnector, the maximum interfacial shear capacity of a single connector was 75 kN andthe authors recommended α = 0.3, β = 0.55. The reinforcements of 8 mm diameter wereembedded into the concrete slab, and the yield stress of the rebar was 428 MPa. The externalprestressing was implemented using two nominal diameters of 15.7 mm seven-wire strands,whose Ap = 150 mm2, Ep = 197.8 GPa and initial effective prestress σpe = 950 MPa.
The behaviors of specimens are modeled with the proposed model and traditionalmodel, respectively. In the traditional model, the composite beam is modeled by thetraditional fiber beam element without shear-slip effects and the external tendons aremodeled by multiple truss elements. In the proposed model, the nonlinear interfacialbehaviors are considered in the developed fiber beam element and the external tendons aremodeled by only one proposed slipping-tendon element. According to the test procedure,the prestressing is applied in the analysis model firstly and then two equal concentratedforces are loaded at mid-span until structural failure.
Appl. Sci. 2022, 12, 4699 14 of 21Appl. Sci. 2022, 12, x FOR PEER REVIEW 15 of 22
Figure 13. Structural details of specimens B3 and B4.
The behaviors of specimens are modeled with the proposed model and traditional
model, respectively. In the traditional model, the composite beam is modeled by the tra-
ditional fiber beam element without shear-slip effects and the external tendons are mod-
eled by multiple truss elements. In the proposed model, the nonlinear interfacial behav-
iors are considered in the developed fiber beam element and the external tendons are
modeled by only one proposed slipping-tendon element. According to the test procedure,
the prestressing is applied in the analysis model firstly and then two equal concentrated
forces are loaded at mid-span until structural failure.
Figure 14a shows the analysis results of specimen B3. The proposed model shows
good agreement with the tests for both load-deflection curves and tendon stress incre-
ments. However, for the traditional model, the initial structural stiffness is overestimated
due to the ignored interfacial slip and the structural capacity is also slightly overestimated.
Meanwhile, the stress increments of the external tendon in the traditional model are dif-
ferent in the side and middle branches due to the strain-incompatible condition in the
separated truss element. The stress increment of the side branch truss element (seg-1) is
small and that of the middle truss element (seg-2) is large, as shown in Figure 14b. Speci-
men B4 is prestressed with straight tendons, in which case, the proposed slipping tendon
element used is the same as the traditional truss element. The main differences between
the two models are the interfacial slip effects. The traditional model overestimates the
initial structural stiffness and the proposed model shows a better prediction. Compared
with the traditional model, the proposed element significantly improves the prediction
accuracy.
512 512
1612 2300 1612
1000P P
Coverplate
512 512
1612 2300 1612
1000P P
Coverplate30
130
1
320
800
100
360
10
IPE360360×170×8×13
150
49
Shear studs spaced at every 100 mm
(a) B-3
(b) B-4
(c) Cross-section at mid-span
Coverplate
External tendonss15.7, Ap=150mm2
External Tendon
External Tendon
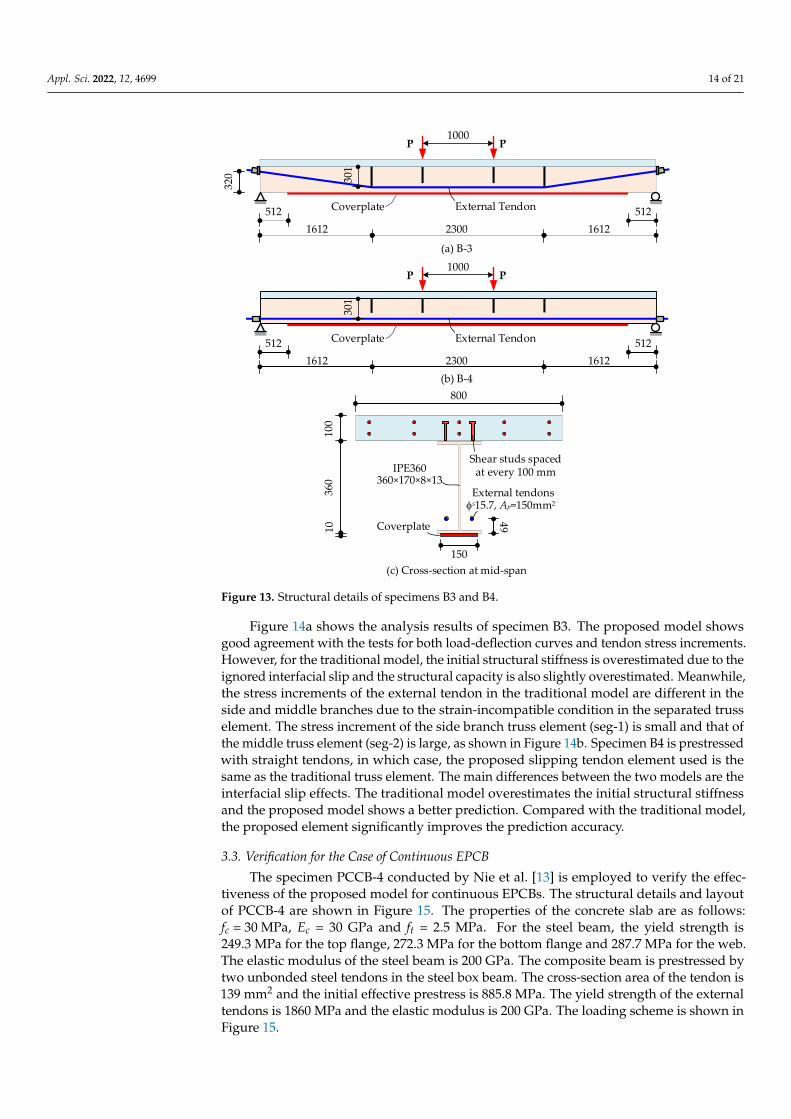
Figure 13. Structural details of specimens B3 and B4.
Figure 14a shows the analysis results of specimen B3. The proposed model showsgood agreement with the tests for both load-deflection curves and tendon stress increments.However, for the traditional model, the initial structural stiffness is overestimated due to theignored interfacial slip and the structural capacity is also slightly overestimated. Meanwhile,the stress increments of the external tendon in the traditional model are different in theside and middle branches due to the strain-incompatible condition in the separated trusselement. The stress increment of the side branch truss element (seg-1) is small and that ofthe middle truss element (seg-2) is large, as shown in Figure 14b. Specimen B4 is prestressedwith straight tendons, in which case, the proposed slipping tendon element used is thesame as the traditional truss element. The main differences between the two models are theinterfacial slip effects. The traditional model overestimates the initial structural stiffnessand the proposed model shows a better prediction. Compared with the traditional model,the proposed element significantly improves the prediction accuracy.
3.3. Verification for the Case of Continuous EPCB
The specimen PCCB-4 conducted by Nie et al. [13] is employed to verify the effec-tiveness of the proposed model for continuous EPCBs. The structural details and layoutof PCCB-4 are shown in Figure 15. The properties of the concrete slab are as follows:fc = 30 MPa, Ec = 30 GPa and ft = 2.5 MPa. For the steel beam, the yield strength is249.3 MPa for the top flange, 272.3 MPa for the bottom flange and 287.7 MPa for the web.The elastic modulus of the steel beam is 200 GPa. The composite beam is prestressed bytwo unbonded steel tendons in the steel box beam. The cross-section area of the tendon is139 mm2 and the initial effective prestress is 885.8 MPa. The yield strength of the externaltendons is 1860 MPa and the elastic modulus is 200 GPa. The loading scheme is shown inFigure 15.

Appl. Sci. 2022, 12, 4699 15 of 21Appl. Sci. 2022, 12, x FOR PEER REVIEW 16 of 22
Figure 14. Analysis results of specimens B3 and B4.
3.3. Verification for the Case of Continuous EPCB The specimen PCCB-4 conducted by Nie et al. [13] is employed to verify the effec-
tiveness of the proposed model for continuous EPCBs. The structural details and layout of PCCB-4 are shown in Figure 15. The properties of the concrete slab are as follows: fc = 30 MPa, Ec = 30 GPa and ft = 2.5 MPa. For the steel beam, the yield strength is 249.3 MPa for the top flange, 272.3 MPa for the bottom flange and 287.7 MPa for the web. The elastic modulus of the steel beam is 200 GPa. The composite beam is prestressed by two un-bonded steel tendons in the steel box beam. The cross-section area of the tendon is 139 mm2 and the initial effective prestress is 885.8 MPa. The yield strength of the external ten-dons is 1860 MPa and the elastic modulus is 200 GPa. The loading scheme is shown in Figure 15.
Figure 15. Structural details of specimen PCCB-4.
Two models, including the proposed model and the traditional model presented above, are built to simulate the flexural behaviors of PCCB-4 up to failure. Figure 16 shows the load-deflection curve comparisons, in which a better agreement of the proposed model with the tests is observed. For the prediction of external tendon stress increments, the three segments of the tendon in the traditional model have different behaviors. The
0 20 40 60 80 100 1200
100
200
300
400
Test resultsProposed ModelTraditional Model
Load
P (k
N)
Deflection at mid-span (mm)0 200 400 600 800 1000
0
100
200
300
400
Load
P (k
N)
Stress Increments (MPa)
Test resultsProposed ModelTraditional Model
Seg-1Seg-2
Seg-1
Seg-1
Seg-2
0 20 40 60 80 1000
100
200
300
400
Load
P (k
N)
Deflection at mid-span (mm)
Test resultsProposed ModelTraditional Model
0 100 200 300 400 500 600 7000
100
200
300
400
Load
P (k
N)
Stress Increments (MPa)
Test resultsProposed ModelTraditional Model
(a) Results of B3
(b) Results of B4
Δ
P P
Δ
P P
P/2 P/2 P/2 P/2
131 132 131
1400 1200 1400 1400 1200 14004000 4000
500
70160
100
65
8
unit: mm
Figure 14. Analysis results of specimens B3 and B4.
Appl. Sci. 2022, 12, x FOR PEER REVIEW 16 of 22
Figure 14. Analysis results of specimens B3 and B4.
3.3. Verification for the Case of Continuous EPCB
The specimen PCCB-4 conducted by Nie et al. [13] is employed to verify the effec-
tiveness of the proposed model for continuous EPCBs. The structural details and layout
of PCCB-4 are shown in Figure 15. The properties of the concrete slab are as follows: fc =
30 MPa, Ec = 30 GPa and ft = 2.5 MPa. For the steel beam, the yield strength is 249.3 MPa
for the top flange, 272.3 MPa for the bottom flange and 287.7 MPa for the web. The elastic
modulus of the steel beam is 200 GPa. The composite beam is prestressed by two un-
bonded steel tendons in the steel box beam. The cross-section area of the tendon is 139
mm2 and the initial effective prestress is 885.8 MPa. The yield strength of the external ten-
dons is 1860 MPa and the elastic modulus is 200 GPa. The loading scheme is shown in
Figure 15.
Figure 15. Structural details of specimen PCCB-4.
Two models, including the proposed model and the traditional model presented
above, are built to simulate the flexural behaviors of PCCB-4 up to failure. Figure 16 shows
the load-deflection curve comparisons, in which a better agreement of the proposed
model with the tests is observed. For the prediction of external tendon stress increments,
the three segments of the tendon in the traditional model have different behaviors. The
0 20 40 60 80 100 1200
100
200
300
400
Test results
Proposed Model
Traditional Model
Lo
ad P
(k
N)
Deflection at mid-span (mm)
0 200 400 600 800 10000
100
200
300
400
Lo
ad P
(k
N)
Stress Increments (MPa)
Test results
Proposed Model
Traditional Model
Seg-1Seg-2
Seg-1
Seg-1
Seg-2
0 20 40 60 80 1000
100
200
300
400
Lo
ad P
(k
N)
Deflection at mid-span (mm)
Test results
Proposed Model
Traditional Model
0 100 200 300 400 500 600 7000
100
200
300
400
Lo
ad P
(k
N)
Stress Increments (MPa)
Test results
Proposed Model
Traditional Model
(a) Results of B3
(b) Results of B4
P P
P P
P/2 P/2 P/2 P/2
131 132 131
1400 1200 1400 1400 1200 1400
4000 4000
500
7016
0
100
6
58
unit: mm
Figure 15. Structural details of specimen PCCB-4.
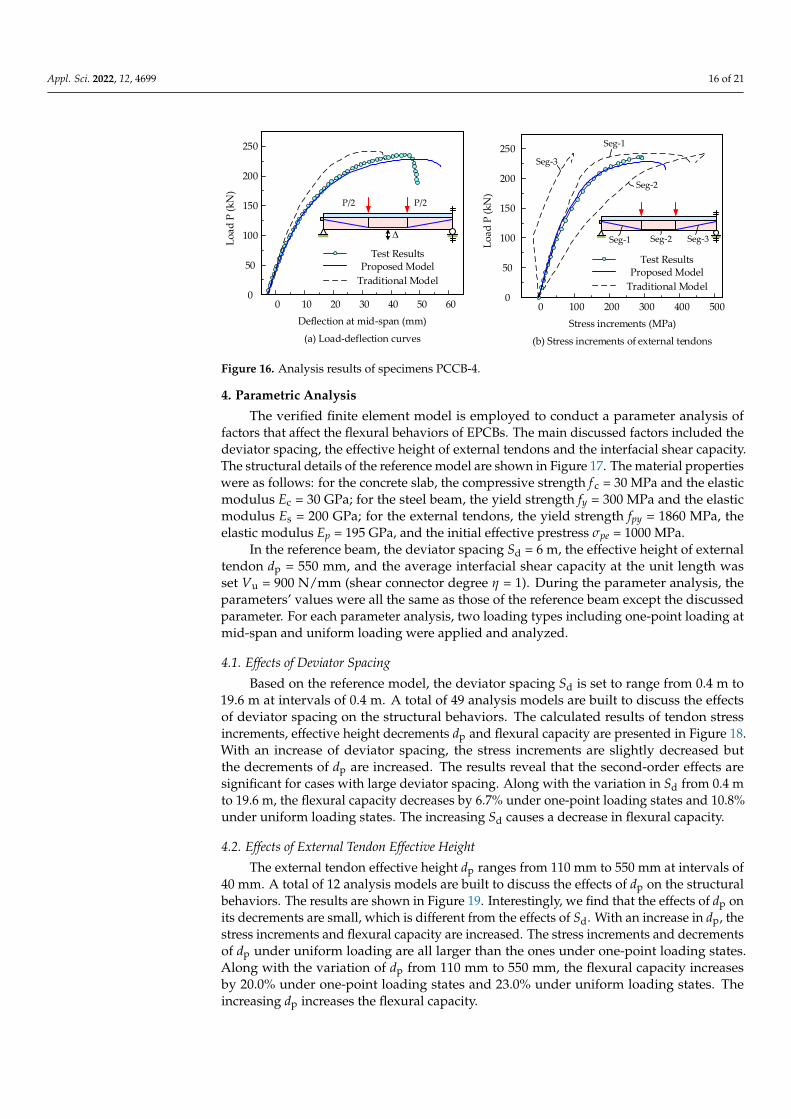
Two models, including the proposed model and the traditional model presented above,are built to simulate the flexural behaviors of PCCB-4 up to failure. Figure 16 shows theload-deflection curve comparisons, in which a better agreement of the proposed modelwith the tests is observed. For the prediction of external tendon stress increments, thethree segments of the tendon in the traditional model have different behaviors. The stressincrement in the seg-3 is small and the one in the middle segment is larger than that foundin the tests, causing the overestimation of the flexural capacity. For PCCB-4, the tendon ratiois low and the effects of the overestimated tendon stress on the behaviors are not obviousin consequences. However, for EPCBs with a high external tendon ratio, the traditionalmodel overestimates the flexural capacity significantly. In the proposed model, the externaltendon is modeled by the strain-compatible slipping tendon element which was close tothe actual behavior of the external tendon. The proposed model can be used to model thebehaviors of EPCB with multiple segments of external tendons.
Appl. Sci. 2022, 12, 4699 16 of 21
Appl. Sci. 2022, 12, x FOR PEER REVIEW 17 of 22
stress increment in the seg-3 is small and the one in the middle segment is larger than that
found in the tests, causing the overestimation of the flexural capacity. For PCCB-4, the
tendon ratio is low and the effects of the overestimated tendon stress on the behaviors are
not obvious in consequences. However, for EPCBs with a high external tendon ratio, the
traditional model overestimates the flexural capacity significantly. In the proposed model,
the external tendon is modeled by the strain-compatible slipping tendon element which
was close to the actual behavior of the external tendon. The proposed model can be used
to model the behaviors of EPCB with multiple segments of external tendons.
Figure 16. Analysis results of specimens PCCB-4.
4. Parametric Analysis
The verified finite element model is employed to conduct a parameter analysis of
factors that affect the flexural behaviors of EPCBs. The main discussed factors included
the deviator spacing, the effective height of external tendons and the interfacial shear ca-
pacity. The structural details of the reference model are shown in Figure 17. The material
properties were as follows: for the concrete slab, the compressive strength fc = 30 MPa and
the elastic modulus Ec = 30 GPa; for the steel beam, the yield strength fy = 300 MPa and the
elastic modulus Es = 200 GPa; for the external tendons, the yield strength fpy = 1860 MPa,
the elastic modulus Ep = 195 GPa, and the initial effective prestress σpe = 1000 MPa.
(L-Sd)/2 Sd
P
dp
500
(L-Sd)/2
L=20,000
1500
200
590
13
300
dp
Shear studs
(b) Cross-section at mid-span
External tendonsAp=1000mm2
25
25
(a) Dimensions of the reference beam model
q
0 10 20 30 40 50 600
50
100
150
200
250
Test ResultsProposed Model
Traditional Model
Lo
ad
P (
kN
)
Deflection at mid-span (mm)
0 100 200 300 400 5000
50
100
150
200
250
Lo
ad
P (
kN
)
Stress increments (MPa)
Test ResultsProposed Model
Traditional Model
P/2 P/2
Seg-1 Seg-2 Seg-3
Seg-3
Seg-1
Seg-2
(a) Load-deflection curves (b) Stress increments of external tendons
Figure 16. Analysis results of specimens PCCB-4.
4. Parametric Analysis
The verified finite element model is employed to conduct a parameter analysis offactors that affect the flexural behaviors of EPCBs. The main discussed factors included thedeviator spacing, the effective height of external tendons and the interfacial shear capacity.The structural details of the reference model are shown in Figure 17. The material propertieswere as follows: for the concrete slab, the compressive strength f c = 30 MPa and the elasticmodulus Ec = 30 GPa; for the steel beam, the yield strength fy = 300 MPa and the elasticmodulus Es = 200 GPa; for the external tendons, the yield strength fpy = 1860 MPa, theelastic modulus Ep = 195 GPa, and the initial effective prestress σpe = 1000 MPa.
In the reference beam, the deviator spacing Sd = 6 m, the effective height of externaltendon dp = 550 mm, and the average interfacial shear capacity at the unit length wasset Vu = 900 N/mm (shear connector degree η = 1). During the parameter analysis, theparameters’ values were all the same as those of the reference beam except the discussedparameter. For each parameter analysis, two loading types including one-point loading atmid-span and uniform loading were applied and analyzed.
4.1. Effects of Deviator Spacing
Based on the reference model, the deviator spacing Sd is set to range from 0.4 m to19.6 m at intervals of 0.4 m. A total of 49 analysis models are built to discuss the effectsof deviator spacing on the structural behaviors. The calculated results of tendon stressincrements, effective height decrements dp and flexural capacity are presented in Figure 18.With an increase of deviator spacing, the stress increments are slightly decreased butthe decrements of dp are increased. The results reveal that the second-order effects aresignificant for cases with large deviator spacing. Along with the variation in Sd from 0.4 mto 19.6 m, the flexural capacity decreases by 6.7% under one-point loading states and 10.8%under uniform loading states. The increasing Sd causes a decrease in flexural capacity.
4.2. Effects of External Tendon Effective Height
The external tendon effective height dp ranges from 110 mm to 550 mm at intervals of40 mm. A total of 12 analysis models are built to discuss the effects of dp on the structuralbehaviors. The results are shown in Figure 19. Interestingly, we find that the effects of dp onits decrements are small, which is different from the effects of Sd. With an increase in dp, thestress increments and flexural capacity are increased. The stress increments and decrementsof dp under uniform loading are all larger than the ones under one-point loading states.Along with the variation of dp from 110 mm to 550 mm, the flexural capacity increasesby 20.0% under one-point loading states and 23.0% under uniform loading states. Theincreasing dp increases the flexural capacity.

Appl. Sci. 2022, 12, 4699 17 of 21
Appl. Sci. 2022, 12, x FOR PEER REVIEW 17 of 22
stress increment in the seg-3 is small and the one in the middle segment is larger than that
found in the tests, causing the overestimation of the flexural capacity. For PCCB-4, the
tendon ratio is low and the effects of the overestimated tendon stress on the behaviors are
not obvious in consequences. However, for EPCBs with a high external tendon ratio, the
traditional model overestimates the flexural capacity significantly. In the proposed model,
the external tendon is modeled by the strain-compatible slipping tendon element which
was close to the actual behavior of the external tendon. The proposed model can be used
to model the behaviors of EPCB with multiple segments of external tendons.
Figure 16. Analysis results of specimens PCCB-4.
4. Parametric Analysis
The verified finite element model is employed to conduct a parameter analysis of
factors that affect the flexural behaviors of EPCBs. The main discussed factors included
the deviator spacing, the effective height of external tendons and the interfacial shear ca-
pacity. The structural details of the reference model are shown in Figure 17. The material
properties were as follows: for the concrete slab, the compressive strength fc = 30 MPa and
the elastic modulus Ec = 30 GPa; for the steel beam, the yield strength fy = 300 MPa and the
elastic modulus Es = 200 GPa; for the external tendons, the yield strength fpy = 1860 MPa,
the elastic modulus Ep = 195 GPa, and the initial effective prestress σpe = 1000 MPa.
(L-Sd)/2 Sd
P
dp
500
(L-Sd)/2
L=20,000
1500
200
590
13
300
dp
Shear studs
(b) Cross-section at mid-span
External tendonsAp=1000mm2
25
25
(a) Dimensions of the reference beam model
q
0 10 20 30 40 50 600
50
100
150
200
250
Test ResultsProposed Model
Traditional Model
Lo
ad
P (
kN
)
Deflection at mid-span (mm)
0 100 200 300 400 5000
50
100
150
200
250
Lo
ad
P (
kN
)
Stress increments (MPa)
Test ResultsProposed Model
Traditional Model
P/2 P/2
Seg-1 Seg-2 Seg-3
Seg-3
Seg-1
Seg-2
(a) Load-deflection curves (b) Stress increments of external tendons
Figure 17. Structural details of the reference model.
Appl. Sci. 2022, 12, x FOR PEER REVIEW 18 of 22
Figure 17. Structural details of the reference model.
In the reference beam, the deviator spacing Sd = 6 m, the effective height of external tendon dp = 550 mm, and the average interfacial shear capacity at the unit length was set Vu = 900 N/mm (shear connector degree η = 1). During the parameter analysis, the param-eters’ values were all the same as those of the reference beam except the discussed param-eter. For each parameter analysis, two loading types including one-point loading at mid-span and uniform loading were applied and analyzed.
4.1. Effects of Deviator Spacing Based on the reference model, the deviator spacing Sd is set to range from 0.4 m to
19.6 m at intervals of 0.4 m. A total of 49 analysis models are built to discuss the effects of deviator spacing on the structural behaviors. The calculated results of tendon stress incre-ments, effective height decrements dp and flexural capacity are presented in Figure 18. With an increase of deviator spacing, the stress increments are slightly decreased but the decrements of dp are increased. The results reveal that the second-order effects are signif-icant for cases with large deviator spacing. Along with the variation in Sd from 0.4 m to 19.6 m, the flexural capacity decreases by 6.7% under one-point loading states and 10.8% under uniform loading states. The increasing Sd causes a decrease in flexural capacity.
Figure 18. Effects of deviator spacing on flexural responses of EPCB.
4.2. Effects of External Tendon Effective Height The external tendon effective height dp ranges from 110 mm to 550 mm at intervals
of 40 mm. A total of 12 analysis models are built to discuss the effects of dp on the structural behaviors. The results are shown in Figure 19. Interestingly, we find that the effects of dp on its decrements are small, which is different from the effects of Sd. With an increase in dp, the stress increments and flexural capacity are increased. The stress increments and decrements of dp under uniform loading are all larger than the ones under one-point load-ing states. Along with the variation of dp from 110 mm to 550 mm, the flexural capacity increases by 20.0% under one-point loading states and 23.0% under uniform loading states. The increasing dp increases the flexural capacity.
0 5 10 15 200100200300400500600
Δσp (
MPa
)
Deviators spacing Sd (m)
One-Point LoadingUniform-Loading
0 5 10 15 203000310032003300340035003600
Mm
ax (k
N·m
)
Deviators spacing Sd (m)
0 5 10 15 200
50100
150200250300
Effe
ctiv
e he
ight
de
crem
ent
(mm
)
Deviators spacing Sd (m)
One-Point LoadingUniform-Loading
(a) Stress increments
(c) Flexural capacity
(b) Effective height dp decrement
dp
Figure 18. Effects of deviator spacing on flexural responses of EPCB.
4.3. Effects of Interfacial Slip
In this section, the Vu ranges from 100 to 1500 N/mm (shear connection degree ηranges from 0.11 to 1.67) to analyze the effects of shear connection on the flexural behaviors.The load-displacement curves of composite beams with various Vu under one-point loadingand uniform loading are shown in Figure 20a,b, respectively. With the increase in Vu, thestructural stiffness and capacity are increased. Figure 21 shows the stress increments,decrements of dp and flexural capacity variation caused by an increase in Vu. The resultsshow that the variation of stress increments and dp decrements are not monotonic. For weakshear connection models (Vu ≤ 300 N/mm for one-point loading states, Vu ≤ 400 N/mmfor uniform loading states), the structural failure is mainly caused by interfacial slip, and theincreasing interfacial shear capacity leads to larger structural deformation capacity beforepeak loads. Then, the stress increments and decrements of dp increase with an increase in
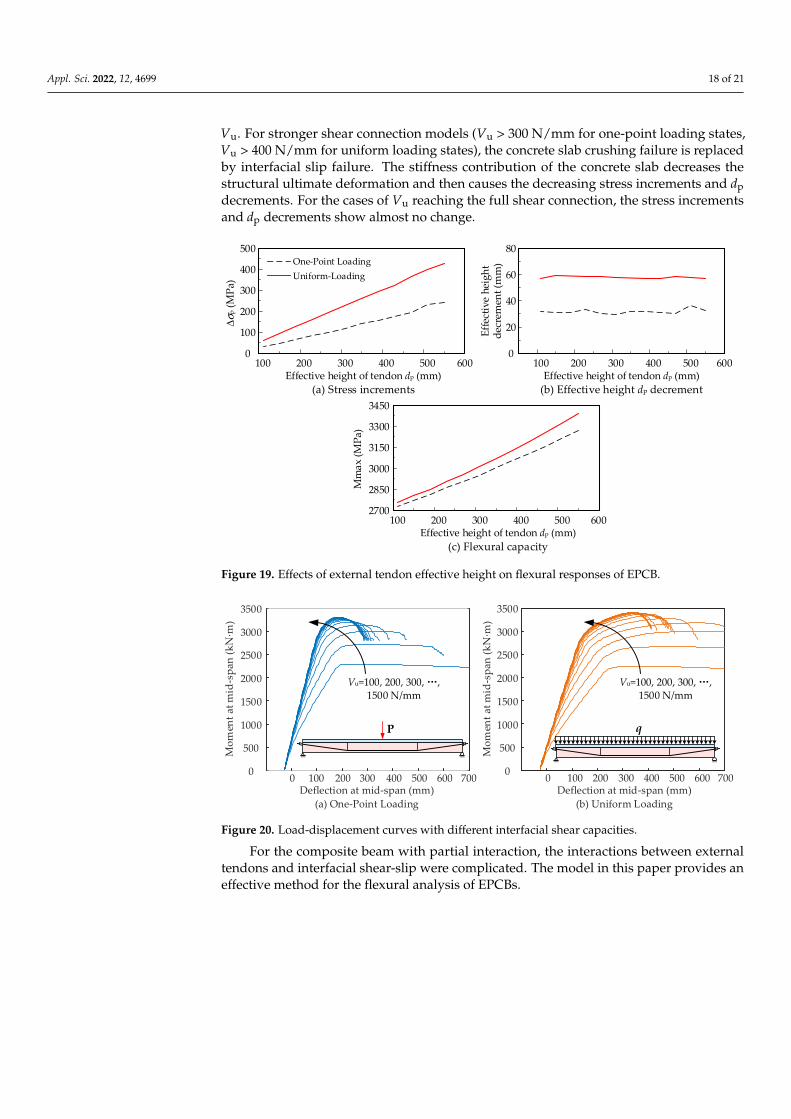
Appl. Sci. 2022, 12, 4699 18 of 21
Vu. For stronger shear connection models (Vu > 300 N/mm for one-point loading states,Vu > 400 N/mm for uniform loading states), the concrete slab crushing failure is replacedby interfacial slip failure. The stiffness contribution of the concrete slab decreases thestructural ultimate deformation and then causes the decreasing stress increments and dpdecrements. For the cases of Vu reaching the full shear connection, the stress incrementsand dp decrements show almost no change.
Appl. Sci. 2022, 12, x FOR PEER REVIEW 19 of 22
Figure 19. Effects of external tendon effective height on flexural responses of EPCB.
4.3. Effects of Interfacial Slip In this section, the Vu ranges from 100 to 1500 N/mm (shear connection degree η
ranges from 0.11 to 1.67) to analyze the effects of shear connection on the flexural behav-iors. The load-displacement curves of composite beams with various Vu under one-point loading and uniform loading are shown in Figure 20a,b, respectively. With the increase in Vu, the structural stiffness and capacity are increased. Figure 21 shows the stress incre-ments, decrements of dp and flexural capacity variation caused by an increase in Vu. The results show that the variation of stress increments and dp decrements are not monotonic. For weak shear connection models (Vu ≤ 300 N/mm for one-point loading states, Vu ≤ 400 N/mm for uniform loading states), the structural failure is mainly caused by interfacial slip, and the increasing interfacial shear capacity leads to larger structural deformation capacity before peak loads. Then, the stress increments and decrements of dp increase with an increase in Vu. For stronger shear connection models (Vu > 300 N/mm for one-point loading states, Vu > 400 N/mm for uniform loading states), the concrete slab crushing fail-ure is replaced by interfacial slip failure. The stiffness contribution of the concrete slab decreases the structural ultimate deformation and then causes the decreasing stress incre-ments and dp decrements. For the cases of Vu reaching the full shear connection, the stress increments and dp decrements show almost no change.
Figure 20. Load-displacement curves with different interfacial shear capacities.
100 200 300 400 500 6000
100
200
300
400
500
Δσp (
MPa
)
Effective height of tendon dp (mm)
100 200 300 400 500 6002700
2850
3000
3150
3300
3450
Mm
ax (M
Pa)
Effective height of tendon dp (mm)
100 200 300 400 500 6000
20
40
60
80
Effe
ctiv
e he
ight
de
crem
ent (
mm
)
Effective height of tendon dp (mm)
One-Point LoadingUniform-Loading
(a) Stress increments
(c) Flexural capacity
(b) Effective height dp decrement
0 100 200 300 400 500 600 7000
500
1000
1500
2000
2500
3000
3500
Deflection at mid-span (mm)
Mom
ent a
t mid
-spa
n (k
N·m
)
Vu=100, 200, 300, …, 1500 N/mm
0 100 200 300 400 500 600 7000
500
1000
1500
2000
2500
3000
3500
Vu=100, 200, 300, …, 1500 N/mm
Deflection at mid-span (mm)
Mom
ent a
t mid
-spa
n (k
N·m
)
(a) One-Point Loading (b) Uniform Loading
P q
Figure 19. Effects of external tendon effective height on flexural responses of EPCB.
Appl. Sci. 2022, 12, x FOR PEER REVIEW 19 of 22
Figure 19. Effects of external tendon effective height on flexural responses of EPCB.
4.3. Effects of Interfacial Slip
In this section, the Vu ranges from 100 to 1500 N/mm (shear connection degree η
ranges from 0.11 to 1.67) to analyze the effects of shear connection on the flexural behav-
iors. The load-displacement curves of composite beams with various Vu under one-point
loading and uniform loading are shown in Figure 20a,b, respectively. With the increase in
Vu, the structural stiffness and capacity are increased. Figure 21 shows the stress incre-
ments, decrements of dp and flexural capacity variation caused by an increase in Vu. The
results show that the variation of stress increments and dp decrements are not monotonic.
For weak shear connection models (Vu ≤ 300 N/mm for one-point loading states, Vu ≤ 400
N/mm for uniform loading states), the structural failure is mainly caused by interfacial
slip, and the increasing interfacial shear capacity leads to larger structural deformation
capacity before peak loads. Then, the stress increments and decrements of dp increase with
an increase in Vu. For stronger shear connection models (Vu > 300 N/mm for one-point
loading states, Vu > 400 N/mm for uniform loading states), the concrete slab crushing fail-
ure is replaced by interfacial slip failure. The stiffness contribution of the concrete slab
decreases the structural ultimate deformation and then causes the decreasing stress incre-
ments and dp decrements. For the cases of Vu reaching the full shear connection, the stress
increments and dp decrements show almost no change.
Figure 20. Load-displacement curves with different interfacial shear capacities.
100 200 300 400 500 6000
100
200
300
400
500
s
p (
MP
a)
Effective height of tendon dp (mm)
100 200 300 400 500 6002700
2850
3000
3150
3300
3450
Mm
ax
(MP
a)
Effective height of tendon dp (mm)
100 200 300 400 500 6000
20
40
60
80
Eff
ecti
ve
hei
gh
t d
ecre
men
t (m
m)
Effective height of tendon dp (mm)
One-Point Loading
Uniform-Loading
(a) Stress increments
(c) Flexural capacity
(b) Effective height dp decrement
0 100 200 300 400 500 600 7000
500
1000
1500
2000
2500
3000
3500
Deflection at mid-span (mm)
Mo
men
t at
mid
-sp
an (
kN
·m)
Vu=100, 200, 300, …, 1500 N/mm
0 100 200 300 400 500 600 7000
500
1000
1500
2000
2500
3000
3500
Vu=100, 200, 300, …, 1500 N/mm
Deflection at mid-span (mm)
Mo
men
t at
mid
-sp
an (
kN
·m)
(a) One-Point Loading (b) Uniform Loading
P q
Figure 20. Load-displacement curves with different interfacial shear capacities.
For the composite beam with partial interaction, the interactions between externaltendons and interfacial shear-slip were complicated. The model in this paper provides aneffective method for the flexural analysis of EPCBs.

Appl. Sci. 2022, 12, 4699 19 of 21Appl. Sci. 2022, 12, x FOR PEER REVIEW 20 of 22
Figure 21. Effects of interfacial slip on flexural responses of EPCB.
For the composite beam with partial interaction, the interactions between external tendons and interfacial shear-slip were complicated. The model in this paper provides an effective method for the flexural analysis of EPCBs.
5. Conclusions In this paper, a new beam-tendon hybrid model consisting of fiber beam elements
and slipping cable element is proposed to analyze the flexural behaviors of EPCBs. The mechanical characteristics of EPCBs, including the material and geometric nonlinearities, interfacial slip effects, and the unbonded effects of the external tendon are all considered in the model. The FE formulations of the proposed elements are presented and the com-putational procedure is developed in the OpenSees framework as the new element classes. The proposed model is validated by comparisons with experimental tests and the para-metric analysis is conducted. The main conclusions can be summarized as follows:
1. Interfacial slip effects are inevitable for steel-concrete composite beams during their service life, even when they are designed with full shear connections. The structural stiffness, capacity and failure modes are all affected. The proposed fiber beam element model considering interfacial slip effects can be used to predict the capacity, deformation and failure mode, which are all verified to agree well with the experimental results.
2. Ignoring the friction at the deviators, the external tendon has equal traction along its whole length. The conventional truss element could not satisfy the strain-compatibility property in multiple segments, causing some overestimation of the stress increments and flexural capacity. The proposed slipping cable element is built considering the strain-com-patibility property, which shows better agreement with the experimental results.
3. The parameter analysis results reveal that the deviator spacing, external tendon effective height, interfacial shear capacity and loading type all affect the flexural capacity of EPCBs. An increase in the deviator spacing decreases the ultimate effective height of the external tendon, which then leads to a decrease in the flexural capacity. The increased external tendon effective height increases the ultimate stress increments and flexural ca-pacity. With an increase in the interfacial shear capacity, the flexural capacity increases gradually but the stress increments and effective height of the tendon do not vary monot-onously. The proposed model provides an effective method for predicting the flexural behaviors of EPCBs.
0 200 400 600 800 1000 1200 1400 16000100200300400500600
Δσp (
MPa
)
Vu (N/mm)
0 200 400 600 800 1000 1200 1400 160022002400260028003000320034003600
Mm
ax (M
Pa)
Vu (N/mm)
0 200 400 600 800 1000 1200 1400 16000
20
40
60
80
100
Effe
ctiv
e he
ight
de
crem
ent (
mm
)
Vu (N/mm)(a) Stress increments
(c) Flexural capacity
(b) Effective height dp decrement
One-Point LoadingUniform-Loading
Figure 21. Effects of interfacial slip on flexural responses of EPCB.
5. Conclusions
In this paper, a new beam-tendon hybrid model consisting of fiber beam elementsand slipping cable element is proposed to analyze the flexural behaviors of EPCBs. Themechanical characteristics of EPCBs, including the material and geometric nonlinearities,interfacial slip effects, and the unbonded effects of the external tendon are all considered inthe model. The FE formulations of the proposed elements are presented and the computa-tional procedure is developed in the OpenSees framework as the new element classes. Theproposed model is validated by comparisons with experimental tests and the parametricanalysis is conducted. The main conclusions can be summarized as follows:
1. Interfacial slip effects are inevitable for steel-concrete composite beams during theirservice life, even when they are designed with full shear connections. The struc-tural stiffness, capacity and failure modes are all affected. The proposed fiber beamelement model considering interfacial slip effects can be used to predict the capac-ity, deformation and failure mode, which are all verified to agree well with theexperimental results.
2. Ignoring the friction at the deviators, the external tendon has equal traction along itswhole length. The conventional truss element could not satisfy the strain-compatibilityproperty in multiple segments, causing some overestimation of the stress incre-ments and flexural capacity. The proposed slipping cable element is built con-sidering the strain-compatibility property, which shows better agreement with theexperimental results.
3. The parameter analysis results reveal that the deviator spacing, external tendoneffective height, interfacial shear capacity and loading type all affect the flexuralcapacity of EPCBs. An increase in the deviator spacing decreases the ultimate effectiveheight of the external tendon, which then leads to a decrease in the flexural capacity.The increased external tendon effective height increases the ultimate stress incrementsand flexural capacity. With an increase in the interfacial shear capacity, the flexuralcapacity increases gradually but the stress increments and effective height of thetendon do not vary monotonously. The proposed model provides an effective methodfor predicting the flexural behaviors of EPCBs.
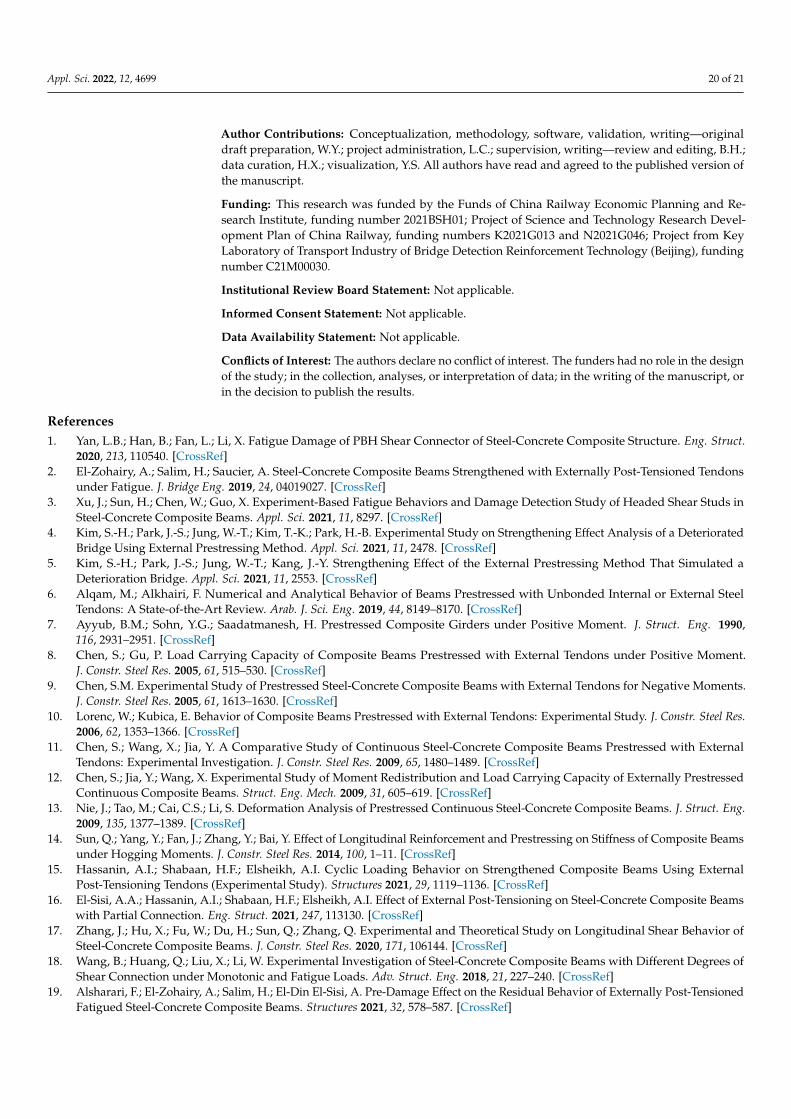
Appl. Sci. 2022, 12, 4699 20 of 21
Author Contributions: Conceptualization, methodology, software, validation, writing—originaldraft preparation, W.Y.; project administration, L.C.; supervision, writing—review and editing, B.H.;data curation, H.X.; visualization, Y.S. All authors have read and agreed to the published version ofthe manuscript.
Funding: This research was funded by the Funds of China Railway Economic Planning and Re-search Institute, funding number 2021BSH01; Project of Science and Technology Research Devel-opment Plan of China Railway, funding numbers K2021G013 and N2021G046; Project from KeyLaboratory of Transport Industry of Bridge Detection Reinforcement Technology (Beijing), fundingnumber C21M00030.
Institutional Review Board Statement: Not applicable.
Informed Consent Statement: Not applicable.
Data Availability Statement: Not applicable.
Conflicts of Interest: The authors declare no conflict of interest. The funders had no role in the designof the study; in the collection, analyses, or interpretation of data; in the writing of the manuscript, orin the decision to publish the results.
References1. Yan, L.B.; Han, B.; Fan, L.; Li, X. Fatigue Damage of PBH Shear Connector of Steel-Concrete Composite Structure. Eng. Struct.
2020, 213, 110540. [CrossRef]2. El-Zohairy, A.; Salim, H.; Saucier, A. Steel-Concrete Composite Beams Strengthened with Externally Post-Tensioned Tendons
under Fatigue. J. Bridge Eng. 2019, 24, 04019027. [CrossRef]3. Xu, J.; Sun, H.; Chen, W.; Guo, X. Experiment-Based Fatigue Behaviors and Damage Detection Study of Headed Shear Studs in
Steel-Concrete Composite Beams. Appl. Sci. 2021, 11, 8297. [CrossRef]4. Kim, S.-H.; Park, J.-S.; Jung, W.-T.; Kim, T.-K.; Park, H.-B. Experimental Study on Strengthening Effect Analysis of a Deteriorated
Bridge Using External Prestressing Method. Appl. Sci. 2021, 11, 2478. [CrossRef]5. Kim, S.-H.; Park, J.-S.; Jung, W.-T.; Kang, J.-Y. Strengthening Effect of the External Prestressing Method That Simulated a
Deterioration Bridge. Appl. Sci. 2021, 11, 2553. [CrossRef]6. Alqam, M.; Alkhairi, F. Numerical and Analytical Behavior of Beams Prestressed with Unbonded Internal or External Steel
Tendons: A State-of-the-Art Review. Arab. J. Sci. Eng. 2019, 44, 8149–8170. [CrossRef]7. Ayyub, B.M.; Sohn, Y.G.; Saadatmanesh, H. Prestressed Composite Girders under Positive Moment. J. Struct. Eng. 1990,
116, 2931–2951. [CrossRef]8. Chen, S.; Gu, P. Load Carrying Capacity of Composite Beams Prestressed with External Tendons under Positive Moment.
J. Constr. Steel Res. 2005, 61, 515–530. [CrossRef]9. Chen, S.M. Experimental Study of Prestressed Steel-Concrete Composite Beams with External Tendons for Negative Moments.
J. Constr. Steel Res. 2005, 61, 1613–1630. [CrossRef]10. Lorenc, W.; Kubica, E. Behavior of Composite Beams Prestressed with External Tendons: Experimental Study. J. Constr. Steel Res.
2006, 62, 1353–1366. [CrossRef]11. Chen, S.; Wang, X.; Jia, Y. A Comparative Study of Continuous Steel-Concrete Composite Beams Prestressed with External
Tendons: Experimental Investigation. J. Constr. Steel Res. 2009, 65, 1480–1489. [CrossRef]12. Chen, S.; Jia, Y.; Wang, X. Experimental Study of Moment Redistribution and Load Carrying Capacity of Externally Prestressed
Continuous Composite Beams. Struct. Eng. Mech. 2009, 31, 605–619. [CrossRef]13. Nie, J.; Tao, M.; Cai, C.S.; Li, S. Deformation Analysis of Prestressed Continuous Steel-Concrete Composite Beams. J. Struct. Eng.
2009, 135, 1377–1389. [CrossRef]14. Sun, Q.; Yang, Y.; Fan, J.; Zhang, Y.; Bai, Y. Effect of Longitudinal Reinforcement and Prestressing on Stiffness of Composite Beams
under Hogging Moments. J. Constr. Steel Res. 2014, 100, 1–11. [CrossRef]15. Hassanin, A.I.; Shabaan, H.F.; Elsheikh, A.I. Cyclic Loading Behavior on Strengthened Composite Beams Using External
Post-Tensioning Tendons (Experimental Study). Structures 2021, 29, 1119–1136. [CrossRef]16. El-Sisi, A.A.; Hassanin, A.I.; Shabaan, H.F.; Elsheikh, A.I. Effect of External Post-Tensioning on Steel-Concrete Composite Beams
with Partial Connection. Eng. Struct. 2021, 247, 113130. [CrossRef]17. Zhang, J.; Hu, X.; Fu, W.; Du, H.; Sun, Q.; Zhang, Q. Experimental and Theoretical Study on Longitudinal Shear Behavior of
Steel-Concrete Composite Beams. J. Constr. Steel Res. 2020, 171, 106144. [CrossRef]18. Wang, B.; Huang, Q.; Liu, X.; Li, W. Experimental Investigation of Steel-Concrete Composite Beams with Different Degrees of
Shear Connection under Monotonic and Fatigue Loads. Adv. Struct. Eng. 2018, 21, 227–240. [CrossRef]19. Alsharari, F.; El-Zohairy, A.; Salim, H.; El-Din El-Sisi, A. Pre-Damage Effect on the Residual Behavior of Externally Post-Tensioned
Fatigued Steel-Concrete Composite Beams. Structures 2021, 32, 578–587. [CrossRef]
Appl. Sci. 2022, 12, 4699 21 of 21
20. Nie, J.; Tao, M.; Cai, C.S.; Li, S. Analytical and Numerical Modeling of Prestressed Continuous Steel-Concrete Composite Beams.J. Struct. Eng.-ASCE 2011, 137, 1405–1418. [CrossRef]
21. El-Zohairy, A.; Salim, H.; Shaaban, H.; Mustafa, S.; El-Shihy, A. Finite-Element Modeling of Externally Posttensioned CompositeBeams. J. Bridge Eng. 2015, 20, 04015018. [CrossRef]
22. El-Zohairy, A.; Salim, H. Parametric Study for Post-Tensioned Composite Beams with External Tendons. Adv. Struct. Eng. 2017,20, 1433–1450. [CrossRef]
23. da Rocha Almeida, M.M.; Clemente de Souza, A.S.; de Albuquerque, A.T.; Rossi, A. Parametric Analysis of Steel-ConcreteComposite Beams Prestressed with External Tendons. J. Constr. Steel Res. 2022, 189, 107087. [CrossRef]
24. Sanchez, B.d.S.; Tamayo, J.P.; Morsch, I.B.; Miranda, M.P. A Nonlinear Geometric Model for Pre-Stressed Steel-Concrete CompositeBeams. J. Braz. Soc. Mech. Sci. Eng. 2021, 43, 233. [CrossRef]
25. Alsharari, F.; El-Zohairy, A.; Salim, H.; El-Sisi, A.E.-D. Numerical Investigation of the Monotonic Behavior of StrengthenedSteel-Concrete Composite Girders. Eng. Struct. 2021, 246, 113081. [CrossRef]
26. Palomino Tamayo, J.L.; Franco, M.I.; Morsch, I.B.; Desir, J.M.; Wayar, A.M.M. Some Aspects of Numerical Modeling of Steel-Concrete Composite Beams with Prestressed Tendons. Lat. Am. J. Solids Struct. 2019, 16, e219. [CrossRef]
27. Lou, T.; Lopes, S.M.R.; Lopes, A.V. Numerical Modeling of Externally Prestressed Steel-Concrete Composite Beams. J. Constr.Steel Res. 2016, 121, 229–236. [CrossRef]
28. Lou, T.; Karavasilis, T.L. Numerical Assessment of the Nonlinear Behavior of Continuous Prestressed Steel-Concrete CompositeBeams. Eng. Struct. 2019, 190, 116–127. [CrossRef]
29. Lou, T.; Karavasilis, T.L. Numerical Evaluation of Prestressed Steel-Concrete Composite Girders with External FRP or SteelTendons. J. Constr. Steel Res. 2019, 162, 105698. [CrossRef]
30. Lou, T.; Karavasilis, T.L.; Chen, B. Assessment of Second-Order Effect in Externally Prestressed Steel-Concrete Composite Beams.J. Bridge Eng. 2021, 26, 04021024. [CrossRef]
31. El-Zohairy, A.; Alsharari, F.; Salim, H. Analytical Model and Parametric Study for Externally Post-Tensioned Reinforced Concrete-Steel Composite Beams. Structures 2020, 27, 411–423. [CrossRef]
32. Zhang, Q.; Jia, D.; Bao, Y.; Dong, S.; Cheng, Z.; Bu, Y. Flexural Behavior of Steel-Concrete Composite Beams Considering InterlayerSlip. J. Struct. Eng. 2019, 145, 04019084. [CrossRef]
33. Dall’Asta, A.; Dezi, L.; Leoni, G. Failure Mechanisms of Externally Prestressed Composite Beams with Partial Shear Connection.Steel Compos. Struct. 2002, 2, 315–330. [CrossRef]
34. Dall’Asta, A.; Zona, A. Finite Element Model for Externally Prestressed Composite Beams with Deformable Connection. J. Struct.Eng. 2005, 131, 706–714. [CrossRef]
35. Zona, A.; Ragni, L.; Dall’Asta, A. Finite Element Formulation for Geometric and Material Nonlinear Analysis of Beams Prestressedwith External Slipping Tendons. Finite Elem. Anal. Des. 2008, 44, 910–919. [CrossRef]
36. Sousa, J.B.M., Jr.; Parente, E., Jr.; Lima, E.M.F.; Oliveira, M.V.X. Beam-Tendon Finite Elements for Post-Tensioned Steel-ConcreteComposite Beams with Partial Interaction. J. Constr. Steel Res. 2019, 159, 147–160. [CrossRef]
37. Mckenna, F.; Fenves, G. Opensees 2.5.0, Computer Software; UC Berkeley: Berkeley, CA, USA, 2015. Available online: http://opensees.berkeley.edu (accessed on 1 March 2020).
38. CEB-FIP, Model Code 2010; Thomas Telford: Lausanne, Switzerland, 2010.39. Ollgaard, J.G.; Slutter, R.G.; Fisher, J.G. Shear Strength of Stud Shear Connections in Lightweight and Normal Weight Concrete.
AISC Eng. J. 1971, 8, 55–64.