EFFICIENT PRECAST/PRESTRESSED FLOOR SYSTEM FOR ...
326
University of Nebraska - Lincoln University of Nebraska - Lincoln DigitalCommons@University of Nebraska - Lincoln DigitalCommons@University of Nebraska - Lincoln Construction Systems -- Dissertations & Theses Construction Systems 5-2012 EFFICIENT PRECAST/PRESTRESSED FLOOR SYSTEM FOR EFFICIENT PRECAST/PRESTRESSED FLOOR SYSTEM FOR BUILDING CONSTRUCTION BUILDING CONSTRUCTION Eliya Henin [email protected] Follow this and additional works at: https://digitalcommons.unl.edu/constructiondiss Part of the Civil Engineering Commons, Construction Engineering and Management Commons, and the Structural Engineering Commons Henin, Eliya, "EFFICIENT PRECAST/PRESTRESSED FLOOR SYSTEM FOR BUILDING CONSTRUCTION" (2012). Construction Systems -- Dissertations & Theses. 8. https://digitalcommons.unl.edu/constructiondiss/8 This Article is brought to you for free and open access by the Construction Systems at DigitalCommons@University of Nebraska - Lincoln. It has been accepted for inclusion in Construction Systems -- Dissertations & Theses by an authorized administrator of DigitalCommons@University of Nebraska - Lincoln.
-
Upload
khangminh22 -
Category
Documents
-
view
0 -
download
0
Transcript of EFFICIENT PRECAST/PRESTRESSED FLOOR SYSTEM FOR ...

University of Nebraska - Lincoln University of Nebraska - Lincoln
DigitalCommons@University of Nebraska - Lincoln DigitalCommons@University of Nebraska - Lincoln
Construction Systems -- Dissertations & Theses Construction Systems
5-2012
EFFICIENT PRECAST/PRESTRESSED FLOOR SYSTEM FOR EFFICIENT PRECAST/PRESTRESSED FLOOR SYSTEM FOR
BUILDING CONSTRUCTION BUILDING CONSTRUCTION
Eliya Henin [email protected]
Follow this and additional works at: https://digitalcommons.unl.edu/constructiondiss
Part of the Civil Engineering Commons, Construction Engineering and Management Commons, and
the Structural Engineering Commons
Henin, Eliya, "EFFICIENT PRECAST/PRESTRESSED FLOOR SYSTEM FOR BUILDING CONSTRUCTION" (2012). Construction Systems -- Dissertations & Theses. 8. https://digitalcommons.unl.edu/constructiondiss/8
This Article is brought to you for free and open access by the Construction Systems at DigitalCommons@University of Nebraska - Lincoln. It has been accepted for inclusion in Construction Systems -- Dissertations & Theses by an authorized administrator of DigitalCommons@University of Nebraska - Lincoln.

EFFICIENT PRECAST/PRESTRESSED FLOOR SYSTEM FOR BUILDING
CONSTRUCTION
by
Eliya E. A. Henin
A DISSERTATION
Presented to the Faculty of
The Graduate College at the University of Nebraska
In Partial Fulfillment of Requirements
For the Degree of Doctor of Philosophy
Major: Engineering
Under the Supervision of Professors
George Morcous and Maher K. Tadros
Lincoln, Nebraska
May, 2012

EFFICIENT PRECAST/PRESTRESSED FLOOR SYSTEM FOR BUILDING
CONSTRUCTION
Eliya E. A. Henin, Ph.D.
University of Nebraska, 2012
Advisors: George Morcous and Maher K. Tadros
Precast floor systems provide a rapidly constructed solution to multi-story buildings that
is economical, high quality, fire-resistant, and with excellent deflection and vibration
characteristics. Conventional precast concrete floor system cannot compete with cast-in-
place post tensioning flat slab floor systems when high span-to-depth ratio and flat soffit
are required. This is due to the significant depth of standard precast beams, and use of
column corbels and beam ledges. This research presents the development of a new
precast concrete floor system that eliminates the limitations of conventional precast floor
system and provides a competitive precast alternative to cast-in-place flat slab floor
systems. The main features of the proposed system are: span-to-depth ratio of 30, and flat
soffit (no ledges or corbels), and adequate resistance to lateral loads, in addition to
economy, consistency with prevailing erection techniques, and speed of construction. The
new system is a total precast concrete floor system that consists of continuous columns,
prestressed rectangular beams, prestressed hollow-core planks, and cast-in-place
composite topping. Fully insulated precast sandwich panels that are alternative to hollow-
core planks are also proposed for thermally efficient floor applications. These panels can
be easily produced, as they do not require specialized equipment for fabrication, in
addition to having comparative weight and capacity to hollow cores.

The dissertation presents the main concepts adopted in the system development as well as
the design procedures and construction sequence. Also, full-scale specimens have been
erected and tested at the structural laboratory to ensure the structural performance of the
proposed system and validated the results of the analytical models.

v
DEDICATION
I dedicate my dissertation
To The Glory of the LORD, Jesus Christ
I also dedicate this dissertation
To My Parents, My Wife, and My Little Angel, Sara

vi
ACKNOWLEDGMENTS
First of all, and foremost, all thanks to My Lord (Jesus Christ) for the gracious
kindness in all the endeavors I have taken up in my life.
I am deeply indebted and grateful to my advisor Dr. George Morcous, Associate
Professor, Durham School of Architectural Engineering and Construction, University
of Nebraska-Lincoln for his valuable advice, guidance and kind encouragement
provided throughout the stages of this study. His ingenious ideas, constructive
suggestions and tireless guidance made the completion of this work possible.
I wish to express my great thanks to Dr. Maher K. Tadros, Emeritus professor at the
Civil Engineering Department, University of Nebraska-Lincoln for his diligent,
guidance, continuous work, serious and numerous useful contributions in various
ways to the realization of this study. I also thank my supervisory committee Dr.
Christopher Tuan, and Dr. James Goedert.
I am also grateful to Prof. Sires and Dr. Foster for their scientific guidance and help in
preparing my dissertation. Thanks are due to the faculty, staff, and collages at the
civil engineering and construction-engineering program at the University of
Nebraska-Lincoln for their continuous support during my stay in Nebraska.
Last but not least, I owe my family members, my father Ezzat and my mother Mariam
a lot for their support to me during my whole life, words are not enough to thank my
wife-Dalia-who represents my backbone in life, and my little angel Sara who relief
any pain I may suffer by their heavenly smile. May the Lord give me the strength to
support them through their lives. Also, I would like to express my deepest thanks to
my brothers and my sisters

vii
TABLE OF CONTENTS
Chapter 1 ............................................................................................................................. 1�
INTRODUCTION .......................................................................................................... 1�
1.1 Background ........................................................................................................... 1�
1.2 Research Objectives .............................................................................................. 3�
1.3 Dissertation Organization ..................................................................................... 3�
Chapter 2 ............................................................................................................................. 6�
LITERATURE REVIEW ............................................................................................... 6�
2.1 Cast-in-Place Concrete Floor Systems.................................................................. 6�
2.2 Steel Joist Floor Systems ...................................................................................... 7�
2.3 Precast Concrete Floor Systems............................................................................ 9�
2.4 Emerging Systems .............................................................................................. 26�
Chapter 3 ........................................................................................................................... 32�
SYSTEM DESCRIPTION AND CONSTRUCTION SEQUANCE ............................ 32�
3.1 System Description ............................................................................................. 32�
3.2 Construction Sequence........................................................................................ 33�
Chapter 4 ........................................................................................................................... 42�
DESIGN OF FLAT SOFFIT FLOOR SYSTEM UNDER GRAVITY LOAD ............ 42�
4.1 Introduction ......................................................................................................... 42�
4.2 Design Example and Procedures ........................................................................ 42�

viii
4.2.1 Design for Gravity Loads ............................................................................. 45�
4.2.1.1 Floor Panels .......................................................................................... 45�
4.2.1.2 Flat Soffit Beam Design........................................................................ 46�
4.2.1.3 Column Design ..................................................................................... 54�
4.2.1.4 Design of Temporary and Hidden Corbels ........................................... 55�
4.2.1.5 Design of Beam Hidden Ledges and Temporary Ledges ..................... 65�
4.3 Flat Soffit Shallow Beam Design aids ................................................................ 72�
4.4 Constructability, Cost, and Schedule Analysis ................................................... 78�
Chapter 5 ........................................................................................................................... 83�
DESIGN OF FLAT SOFFIT FLOOR SYSTEM UNDER LATERAL LOAD ........... 83�
5.1 Introduction ......................................................................................................... 83�
5.2 Wind Loads ......................................................................................................... 84�
5.2.1 Low-moderate Wind Zone ........................................................................... 84�
5.2.2 High Wind Zone .......................................................................................... 88�
5.3 Seismic Loads ..................................................................................................... 89�
5.3.1 Low-moderate Seismicity Zone ................................................................... 90�
5.3.1.1 Story Drift ............................................................................................. 94�
5.3.2 High Seismicity Zone .................................................................................. 95�
5.3.2.1 Story Drift ............................................................................................. 97�
5.4 Load Combination for Low Seismicity Zone ..................................................... 99�

ix
5.5 Load Combination for High Wind Zone ........................................................... 100�
5.6 Load Combination High Seismicity Zone ........................................................ 102�
Chapter 6 ......................................................................................................................... 105�
TESTING OF FLAT SOFFIT FLOOR SYSTEM COMPONENTS AND
CONNECTIONS ........................................................................................................ 105�
6.1 Introduction ....................................................................................................... 105�
6.2 Beam-column Connection without Corbel ....................................................... 105�
6.2.1 Specimen design ........................................................................................ 106�
6.2.2 Specimen Fabrication and Erection ........................................................... 110�
6.2.3 Material Properties ..................................................................................... 111�
6.2.4 Test Setup and Procedures ......................................................................... 112�
6.2.4.1 HC Negative Moment Capacity .......................................................... 113�
6.2.4.2 Beam Negative Moment Capacity ...................................................... 115�
6.2.4.3 Beam Positive Moment Capacity........................................................ 118�
6.2.4.4 Beam-Column Connection Shear Capacity ........................................ 120�
6.2.5 Beam-Column Connection without Corbel Application............................ 123�
6.3 HC-beam Connection without Ledge ............................................................... 126�
6.3.1 Specimen Design ....................................................................................... 127�
6.3.2 Specimen Fabrication and Erection ........................................................... 132�
6.3.3 Material Properties ..................................................................................... 134�

x
6.3.4 Test Setup and Procedures ......................................................................... 136�
6.3.4.1 Testing HC-beam Connection............................................................. 136�
6.4 Testing the Flat Soffit Beam Flexural Capacity ............................................... 145�
Chapter 7 ......................................................................................................................... 147�
PRECAST/PRESTESSED SANDWICH FLOOR PANELS ..................................... 147�
7.1 Introduction ....................................................................................................... 147�
7.2 Panel Description and Design ........................................................................... 149�
7.3 Thermal Performance ........................................................................................ 151�
7.4 Phase I Experimental Investigation .................................................................. 154�
7.4.1 Specimens Design ...................................................................................... 155�
7.4.2 Specimens Erection .................................................................................... 158�
7.4.3 Material Properties ..................................................................................... 162�
7.4.4 Test Setup and Procedures ......................................................................... 163�
7.4.4.1 First Test (Without Topping) .............................................................. 164�
7.4.4.2 Second Test (With Topping) ............................................................... 166�
7.5 Design Optimization and Erection Simplification ............................................ 171�
7.6 Phase II Experimental Investigation ................................................................. 175�
7.6.1 Specimens Design ...................................................................................... 175�
7.6.2 Specimens Erection .................................................................................... 179�
7.6.3 Material Properties ..................................................................................... 181�

xi
7.6.4 Test Setup and Procedures ......................................................................... 182�
7.6.4.1 Flexural Test ....................................................................................... 182�
7.6.4.2 Shear Test............................................................................................ 194�
7.7 Analytical Models ............................................................................................. 202�
7.8 Embedment Depth of GFRP Ties ..................................................................... 209�
7.9 Summary ........................................................................................................... 214�
Chapter 8 ......................................................................................................................... 215�
SUMMARY, CONCLUSIONS AND RECOMMENDATIONS FOR Future WORK
..................................................................................................................................... 215�
8.1 Summary ........................................................................................................... 215�
8.2 Conclusions ....................................................................................................... 216�
8.3 Recommendations for Future Works ................................................................ 218�
REFERENCES ........................................................................................................... 220�
Appendix A ................................................................................................................. A-1�
DETAILED DESIGN EXAMPLE FOR SHALLOW FLAT SOFFIT PRECAST
CONCRETE FLOOR SYSTEM (BEAM WITH SHEAR KEY).................................... .�
Appendix B ................................................................................................................. B-1�
FACBRICATION OF BEAM-COLUMN CONNECTION WITHOUT CORBEL
COMPONENTS .............................................................................................................. .�
Appendix C ................................................................................................................. C-1�
xii
ERECTION OF BEAM-COLIMN CONNECTION WITHOUT CORBEL SPECIMEN
.......................................................................................................................................... .�
Appendix D ................................................................................................................. D-1�
FACBRICATION OF FLAT SOFFIT BEAM ................................................................ .�
Appendix E .................................................................................................................. E-1�
ERECTION OF HC-BEAM CONNECTION WITHOUT LEDGE SPECIMEN ........... .�
Appendix F................................................................................................................... F-1�
SANDWICH FLOOR PANEL FABRICATION ............................................................ .�
Appendix G ................................................................................................................. G-1�
NU FLOOR DESIGN EXAMPLE (PANEL WITH GFRP TIES) .................................. .�

xiii
TABLE OF FIGURE
Figure �2.1: Construction of post-tensioned cast-in-place concrete slab
(http://www.yde.co.il/Post-Tensioned-Buildings.aspx) ...................................................... 7�
Figure �2.2: Construction of open-web steel joist floor system
(http://steeljoist.org/steel_joist_projects/gsa_trade_shop) .................................................. 8�
Figure �2.3: Construction of steel joist girder floor system ................................................. 8�
(http://steel-girders.rolledsteels.com/steel-girders/) ........................................................... 8�
Figure �2.4: Low proposed system (above right), Plan details (top left), and section details
(bottom). (Thompson and Pessiki, 2004) .......................................................................... 10�
Figure �2.5: Perspective view (top), Cross-section of the beam at mid-span and Cross-
section of the beam at end (bottom & middle). (Tadros and Low, 1996) ......................... 11�
Figure �2.6: An exploded view illustrating the system elements (top) and plan view of an
assembled joint (bottom). (Simanjuntak, 1998) ................................................................ 12�
Figure �2.7: Section view through the side wall and the floor (top), and Section view along
the line 2-2 (bottom). (Reay, 1997) .................................................................................. 14�
Figure �2.8: Cross section elevation view (top) and cross-section elevation view taken
along line 2-2 (bottom). (Compton, (1990) ...................................................................... 15�
Figure �2.9: perspective view of the system (top), and plan view and elevation view taken
on line B - B and A - A (bottom). (Wise and Meade, 1978) ............................................ 17�
Figure �2.10: Cross-sectional view (top), and Plan view of the flooring system (bottom).
(Rahimzadeh, 2003) .......................................................................................................... 18�
Figure �2.11: precast slab showing the longitudinal extending trusses (left) and perspective
view of the special splicing (right). (Wise, 1973) ............................................................. 19�

xiv
Figure �2.12: Perspective view showing an example of building framing (top), and cross-
section shows the invented system (bottom).(Hanlon, 2008) ........................................... 22�
Figure �2.13: Elevation and Plan show the components of the described system ............. 23�
Figure �2.14: Composite Dycore structural floor system. (Composite Dycore Office
Structures, 1992) ............................................................................................................... 24�
Figure �2.15: Column temporary corbel and cross section of the beam. (Fawzy, 2088) ... 25�
Figure �2.16: HC-beam connection under ultimate design load and failure of HC-beam
connection. (Morcous and Tadros, 2010) ......................................................................... 26�
Figure �2.17: European practices in designing hollow core supporting beams. (fib steering
committee, 1999) .............................................................................................................. 27�
Figure �2.18: D-BEAMTM, by Girder-Slab Technologies LLC, Cherry Hill, NJ (2002). 27�
Figure �2.19: Construction using Girder-Slab system of Girder-Slab Technologies LLC
Cherry Hill, NJ (2002) ...................................................................................................... 28�
Figure �2.20: Filling the Deltabeam with self-consolidating concrete.
(http://www.peikko.ca/Default.aspx?id=625741) ............................................................. 28�
Figure �2.21: Construction of Deltabeam floor system.
(http://www.peikko.ca/Default.aspx?id=625741) ............................................................. 29�
Figure �2.22: Filigree precast slab with light steel truss. (Pessiki et. al. 1995) .................. 30�
Figure �2.23: The NEW Flooring System components. (Rafael and Orid , 2010)............. 31�
Figure �3.1: System Components ....................................................................................... 33�
Figure �3.2: Placing temporary corbels .............................................................................. 34�
Figure �3.4: Welding the top angles to beam and column ................................................. 35�
Figure �3.5: temporary beam ledges ................................................................................... 36�

xv
Figure �3.6: Hollow core planks on temporary beam ledges ............................................. 37�
Figure �3.7: Continuity reinforcement and HC-beam hat and loop bars ............................ 38�
Figure �3.8: Grouting the H.C keys and beam pocket with SCC ....................................... 38�
Figure �3.9: Beam continuity reinforcement ...................................................................... 39�
Figure �3.10: Placing the topping reinforcement ............................................................... 40�
Figure �3.11: Pouring and finishing the topping concrete .................................................. 40�
Figure �3.12: Removing the temporary corbels and ledges ............................................... 41�
Figure �4.1: Plan, elevation, and side views of the example building................................ 44�
Figure �4.2: Composite HC End-Span Section .................................................................. 46�
Figure �4.3: Dimensions of Standard FS beam with shear key (top) and FS�beam with
hidden corbel (bottom) ...................................................................................................... 47�
Figure �4.4: Plan and section views of the beam with shear key ledge and temporary steel
angles ................................................................................................................................ 52�
Figure �4.5: Plan and section views of the beam with shear key ledge and coil inserts .... 53�
Figure �4.6: Plan and section views of the beam with ledge and temporary steel angles .. 53�
Figure �4.7: Plan and section views of the beam with ledge and coil inserts ..................... 54�
Figure �4.9: Isometric view shows friction bolts and the temporary corbel ...................... 56�
Figure �4.10: Stiffened angle used as a temporary corbel. ................................................. 56�
Figure �4.11: Beam-column connection without reinforcement ........................................ 59�
Figure �4.12: Failure mechanisms of beam-column connection ........................................ 60�
Figure �4.13: Recess in the four side of the column........................................................... 61�
Figure �4.14: Hidden corbel reinforcement ........................................................................ 62�
Figure �4.15: Cross section of the beam shows the shear connectors ................................ 62�

xvi
Figure �4.16: Beam-column connection ............................................................................. 65�
Figure �4.17: HC-beam connection without reinforcement ............................................... 66�
Figure �4.18: HC-beam connection failure mechanisms .................................................... 67�
Figure �4.19: Beam shear key dimension ........................................................................... 68�
Figure �4.20: steel loops were placed in the HC slots ........................................................ 68�
Figure �4.21: Shape of reinforcement using in the HC-beam connection .......................... 69�
Figure �4.22: HC-beam connection .................................................................................... 72�
Figure �4.23: Design chart for FS 8 (9#8 and 6#6 negative reinforcement) ...................... 73�
Figure �4.24: Design chart for FS 8 (15#8 negative reinforcement) .................................. 74�
Figure �4.25: Design chart for FS 8 (9#9 and 6#8 negative reinforcement) ...................... 74�
Figure �4.27: Design chart for FS 10 (15#8 negative reinforcement) ................................ 75�
Figure �4.28: Design chart for FS 10 (9#9 and 6#8 negative reinforcement) .................... 76�
Figure �4.29: Design chart for FS 12 (9#8 and 6#6 negative reinforcement) .................... 76�
Figure �4.30: Design chart for FS 12 (15#8 negative reinforcement) ................................ 77�
Figure �4.31: Design chart for FS 12 (9#9 and 6#8 negative reinforcement) .................... 77�
Table �4.8: A schedule comparison between shallow flat soffit and a typical precast
flooring system.................................................................................................................. 82�
Figure �5.1: Two-dimensional frames adopted for lateral load analysis ............................ 83�
Figure �5.2: Wind load applied to the beam direction........................................................ 85�
Figure �5.3: Bending moment due to wind load in the beam direction .............................. 86�
Figure �5.4: Deformed shape due to wind load in the beam direction ............................... 86�
Figure �5.5: Wind load applied to the HC direction ........................................................... 87�
Figure �5.6: Bending moment due to wind load in the HC direction ................................. 87�

xvii
Figure �5.7: Deformed shape due to wind load in the HC direction .................................. 88�
Figure �5.8: Seismic load applied to the beam direction .................................................... 91�
Figure �5.9: Bending moment due to seismic load in the beam direction .......................... 92�
Figure �5.10: Deformed shape due to seismic load in the beam direction ......................... 92�
Figure �5.11: Seismic load applied to the HC direction ..................................................... 93�
Figure �5.12: Bending moment due to seismic load in the HC direction ........................... 93�
Figure �5.13: Deformed shape due to seismic load in the hc direction .............................. 94�
Figure �5.14: Beam-Column connection for high-moderate windy zone ........................ 101�
Figure �5.15: Beam-Column connection for high-moderate seismicity zone .................. 104�
Figure �6.1: Plan view of the precast components of test specimen ................................ 106�
Figure �6.2: Plan View of the Beam End ......................................................................... 107�
Figure �6.3: Detailing of the precast column.................................................................... 108�
Figure �6.4: Composite beam and its connection with the column .................................. 109�
Figure �6.5: Concrete strength gain with time.................................................................. 112�
Figure �6.6: Test setup for evaluating HC negative moment capacity ............................. 113�
Figure �6.7: Load-deflection curve for the HC negative moment capacity test ............... 114�
Figure �6.8: Cracking of the topping concrete at HC ultimate load ................................. 115�
Figure �6.9: Test setup for evaluating beam negative moment capacity .......................... 116�
Figure �6.11: Cracking of the topping concrete at beam ultimate load ............................ 117�
Figure �6.12: Test setup for evaluating the SIT beam positive moment capacity ............ 118�
Figure �6.13: Load-deflection curve for SIT beam positive moment capacity test.......... 119�
Figure �6.14: Cracking of the HC soffit at ultimate load ................................................. 120�
Figure �6.15: Test setup for beam-column connection shear capacity ............................. 121�

xviii
Figure �6.16: Load-deflection curve for testing beam-column connection ...................... 122�
Figure �6.17: Failure of beam-column connection ........................................................... 122�
Figure �6.18: Architectural elevation of the farmer’s mutual building ............................ 124�
Figure �6.19: connection details ....................................................................................... 125�
Figure �6.20: Under construction pictures for Farmer’s mutual building ........................ 126�
Figure �6.21: Plan view of the precast components of test specimen .............................. 128�
Figure �6.22: Dimensions and details of the HC specimen .............................................. 129�
Figure �6.23: HC-beam connection reinforcement (Hat and Loops bars)........................ 130�
Figure �6.24: Dimensions and reinforcement details of the beam of the first specimen.. 131�
Figure �6.25: Details of the tested four HC-beam connections ........................................ 131�
Figure �6.26: Blocking the HC openings before erection ................................................ 132�
Figure �6.27: Strain gauges locations ............................................................................... 134�
Figure �6.28: Concrete strength gain with time................................................................ 135�
Figure �6.29: Plan view for the test specimens shows the four connections .................... 137�
Figure �6.30: HC-beam connection setup ........................................................................ 138�
Figure �6.31: Failure of the HC at the critical section under ultimate loading ................ 139�
Figure �6.32: Failure of the HC at the critical section under ultimate loading ................ 140�
Figure �6.33: Failure of the HC at the critical section under ultimate loading ................ 140�
Figure �6.36: Load-deflection curve of HC-beam connection when tested as cantilever 143�
Figure �6.37: Load-strain relationships of HC-beam connection when tested as cantilever
......................................................................................................................................... 143�
Figure �6.38: Flat soffit beam flexural test setup ............................................................. 145�
Figure �6.40: Failure mode of the flat soffit beam ........................................................... 146�

xix
Figure �7.1: NU Tie .......................................................................................................... 150�
Figure �7.2: Shear connectors and horizontal shear force ................................................ 150�
Figure �7.4: Floor panel B with steel ties ......................................................................... 154�
Figure �7.5: floor panels casting position and nomenclature for the panels .................... 158�
Figure �7.6: GFRP and steel ties profile. .......................................................................... 159�
Figure �7.7: Hot melt slots into the foam blanks .............................................................. 159�
Figure �7.8: Insert GFRP tie into the XPS slot and filling the gap with expanding foam
insulation ......................................................................................................................... 160�
Figure �7.9: Setup the forms and tension the strands ...................................................... 161�
Figure �7.10: Casting the bottom wythe, installing foam panels, and casting the top wythe
......................................................................................................................................... 161�
Figure �7.11: Completing casting the panels .................................................................... 162�
Figure �7.12: Wet Burlap Curing ..................................................................................... 162�
Figure �7.13: Concrete strength gain with time................................................................ 163�
Figure �7.14: Test Setup ................................................................................................... 164�
Figure �7.15: Load-deflection relationships for panel A, and B without topping ............ 165�
Figure �7.16: Built the form for the topping and cast the concrete topping ..................... 166�
Figure �7.17: Second test setup ........................................................................................ 167�
Figure �7.18: Strain Gauges at the top surface ................................................................. 167�
Figure �7.19: Load-deflection relationship for the two panels with topping ................... 168�
Figure �7.20: Load-strain relationships of top fibers at mid-span .................................... 169�
Figure �7.21: Failure mode of panel A ............................................................................. 169�
Figure �7.22: Failure mode of panel B ............................................................................. 170�

xx
Figure �7.23: changing ties height in phase I (top) and phase II (bottom). ...................... 171�
Figure �7.24: The end of the panels in phase I (top) and phase II (bottom). .................... 172�
Figure �7.25: Topping reinforcement phase I (top) and phase II (bottom). ..................... 173�
Figure �7.26: Optimize number of strands and number of ties for phase I (top) and phase II
(bottom)........................................................................................................................... 174�
Figure �7.27: changes in the cross section for phase I (top) and phase II (bottom). ........ 175�
Figure �7.28: Fully insulated floor panels C and D .......................................................... 179�
Figure �7.29: Insert GFRP tie into the XPS slot and filling the gap with expanding foam
insulation ......................................................................................................................... 180�
Figure �7.30: Concrete strength gain with time................................................................ 181�
Figure �7.31: Test setup for panel C ................................................................................. 183�
Figure �7.32: Specimen instrumentation .......................................................................... 184�
Figure �7.33: Measuring the relative movement between the bottom and top wythes .... 184�
Figure �7.34: Load-deflection relationship for the panel C .............................................. 185�
Figure �7.35: Load-strain relationship at the top concrete surface ................................... 186�
Figure �7.36: Load-strain relationship for GFRP ties at different locations .................... 187�
Figure �7.37: Load-relative movement relationship for connected wytes ....................... 187�
Figure �7.38: Pull out of GFRP tie at failure .................................................................... 188�
Figure �7.39: Test setup for panel D ................................................................................ 189�
Figure �7.40: Specimen instrumentation .......................................................................... 190�
Figure �7.41: Load-deflection relationships for the panel D ............................................ 191�
Figure �7.42: Load-strain relationship at the top concrete surface ................................... 192�

xxi
Figure �7.43: Load-strain relationship for GFRP ties at different locations left side (Top)
and right side (bottom) .................................................................................................... 193�
Figure �7.44: Failure mode of panel D ............................................................................. 194�
Figure �7.45: Test 1 setup ................................................................................................. 195�
Figure �7.46: Test 1 specimen instrumentation ................................................................ 195�
Figure �7.47: Load-deflection relationship for test 1 ....................................................... 196�
Figure �7.48: Load-strain relationship for GFRP ties at left ............................................ 197�
Figure �7.49: Shear failure of test 1.................................................................................. 197�
Figure �7.50: Test 2 setup ................................................................................................. 198�
Figure �7.51: Test 2 specimen instrumentation ................................................................ 198�
Figure �7.52: Load-deflection relationship for test 2&3 .................................................. 199�
Figure �7.53: Load-strain relationship of GFRP ties for test 2......................................... 200�
Figure �7.55: Shear failure of test 2 &3 ........................................................................... 201�
Figure �7.56: Truss models of panel A, B, C, and D ........................................................ 203�
Figure �7.57: 3D FE model of panel A, B, C, and D........................................................ 204�
Figure �7.58: Service load deflection of panel A using the truss model and FE model ... 205�
Figure �7.59: Service load deflection of panel B using the truss model and FE model ... 205�
Figure �7.60: Service load deflection of panel C using the truss model and FE model ... 206�
Figure �7.61: Service load deflection of panel D using the truss model and FE model ... 207�
Figure �7.62: Camber and self-weight deflection of panel C and D ................................ 209�
Figure �7.63: Plan and Section view of the test specimen ............................................... 210�
Figure �7.64: Test specimen and setup ............................................................................. 211�
Figure �7.65: Pull-out of the tie from the concrete ........................................................... 212�

xxii
Figure �7.66: Rupture of the tie ........................................................................................ 212�
Figure �7.67: Average ultimate load for different tie size and embedment combination 213�
Figure �8.1: Proposed Testing Setup and a Preliminary Design of Post-tensioned Hybrid
Connection ...................................................................................................................... 219�

xxiii
LIST OF TABLES
Table �4.1: Design parameters ........................................................................................... 49�
Table �4.2: Beam final moments ........................................................................................ 49�
Table �4.3: Reinforcement used in the Designed FS 10 ..................................................... 50�
Table �4.4: Comparison of Demand and Capacity at Critical Sections. ............................ 50�
Table �4.5: Final shear values ............................................................................................ 51�
Table �4.6: Properties of standard FS beams...................................................................... 72�
Table �5.1: Wind pressure calculations .............................................................................. 85�
Table�5.2: Wind pressure calculations ............................................................................... 89�
Table �5.3: Base shear force calculations ........................................................................... 90�
Table �5.4: Base shear force distribution on each floor ..................................................... 91�
Table �5.5: Lateral displacements and interstory drifts due to seismic force in beam
direction and HC direction ................................................................................................ 95�
Table �5.6: Base shear force calculations ........................................................................... 96�
Table �5.7: Base shear force distribution on each floor ..................................................... 96�
Table �5.8: Lateral displacements and inter-story drifts due to seismic force ................... 97�
Table �5.9: Lateral displacements and inter-story drifts due to seismic force ................... 98�
Table �5.10: Lateral displacements and inter-story drifts due to seismic force ................. 98�
Table �5.11: Summary of lateral load analysis results ....................................................... 99�
Table �5.12: Comparison of factored lateral load and resistance ..................................... 100�
Table �5.13: Summary of lateral load analysis results ..................................................... 100�
Table �5.14: Comparison of factored lateral load and resistance ..................................... 101�
Table �5.15: Comparison of factored lateral load and resistance for high-moderate windy
zone. ................................................................................................................................ 101�
xxiv
Table �5.16: Summary of lateral load analysis results ..................................................... 102�
Table �5.17: Comparison of factored lateral load and resistance ..................................... 102�
Table �5.18: Summary of lateral load analysis results ..................................................... 103�
Table �5.19: Comparison of factored lateral load and resistance ..................................... 103�
Table �5.20: Comparison of factored lateral load and resistance ..................................... 104�
Table �6.1: Reinforcement used in beam-column connection without corbel ................. 107�
Table �6.2: Comparison of Demand and Capacity at Critical Sections. .......................... 107�
Table �6.3: Summary of Lateral Load Analysis Results .................................................. 110�
Table �6.4: Comparison of Factored Lateral Load and Resistance .................................. 110�
Table �6.5: Concrete mixes design ................................................................................... 111�
Table �6.6: Specified and actual concrete compressive strength at testing ...................... 112�
Table �6.7: Summary of all test results ............................................................................ 124�
Table �6.8: Concrete mixes design ................................................................................... 135�
Table �6.9: Specified and actual concrete compressive strength at testing ...................... 135�
Table �6.10: Summary results for HC-beam connections tests ........................................ 144�
Table �7.1: Comparing the proposed against existing floor systems ............................... 148�
Table �7.2: R-Values calculations for sandwich panel with concrete solid ends ............. 152�
Table �7.3: R-Value calculation for fully insulated sandwich panel ................................ 153�
Table �7.4: Concrete design mix for precast panel........................................................... 163�
Table �7.5: Comparing the theoretical against measured flexural capacity of phase I test
specimens ........................................................................................................................ 170�
Table �7.6: Comparing the theoretical against measured flexural capacity of phase II test
specimens ........................................................................................................................ 194�

xxv
Table �7.7: Comparing the theoretical against measured flexural capacity of phase II test
specimens ........................................................................................................................ 208�
Table �7.8: GFRP-tie size-embedment combinations and test results ............................. 211�
1
Chapter 1
INTRODUCTION
1.1 Background
Conventional precast hollow-core (HC) floor systems consist of HC planks supported by
inverted-tee (IT) precast prestressed concrete beams, which are, in turn, supported on
column corbels or wall ledges. These floor systems provide a rapidly constructed solution
to multi-story buildings that is economical, fire-resistant, and with excellent deflection
and vibration characteristics. The top surface of HC floor systems can be a thin non-
structural cementitious topping, or a 2 in. concrete composite topping that provides a
leveled and continuous surface. Despite the advantages of conventional precast HC floor
systems, they have four main limitations: a) low span-to-depth ratio, b) presence of floor
projections, such as column corbels and beam ledges, c) low thermal insulation; and d)
lack of resistance to lateral loads without shear walls.
For a 30 ft span floor, conventional precast HC floor system would require a 28 in. deep
IT plus a 2 in. topping, for a total floor depth of 30 in., which results in a span-to-depth
ratio of 12. On the other hand, post-tensioned cast-in-place concrete slab floor systems
can be built with a span-to-depth ratio of 45, which results in a structural depth of 8 in. If
the structural depth of precast floor systems can come close to that of post-tensioned cast-
in-place concrete slab system, then precast concrete could be very favorable due to their
rapid construction and high product quality. Reducing the structural floor depth lead to
reduce floor height, this in turn makes savings in architectural, mechanical and electrical
(AME) systems and may allow for additional floors for the same building height. The
cost of AME is about 75 to 80% of the total building life cycle cost, and any small

2
savings in these systems would have a significant impact on the overall project
economics.
Although the use of column corbels and beam ledges is the common practice in parking
structures and commercial buildings, it is not aesthetically favorable in residential and
office buildings, such as hotels. False ceiling are sometimes used in these applications to
hide the unattractive floor projections, which results in reduced vertical clearance.
Elimination of floor projections combined with shallow structural depth will improve the
building aesthetics and overall economics.
Hollow cores (HC) are considered one of the most common precast floor systems due to
their advantages in terms of economy, lightweight, structural capacity, and ease of
production and erection. The main limitation of the HC planks is the thermal insulation.
If the HC planks replaced with floor panels have comparative weight and structural
capacity while have thermal insulation that will be more efficient combined with shallow
structure depth will save much energy, which results in decreasing the live cycle cost.
Shear walls are typically used in conventional precast HC floor systems to resist lateral
loads. However, owners and developers prefer the flexibility a beam/column frame
offers, as opposed to structural walls that increases construction duration, adds to the
cost, and cannot be moved during remodeling. Precast concrete floor systems could gain
significant advantages over steel open web joist systems and cast-in-place floor systems
if they can be designed and detailed to resist lateral loads and minimize the used of shear
walls, especially, if this advantage is combined with the shallow structural depth.

3
1.2 Research Objectives
The main objective of this project is to develop a flat soffit shallow precast floor system
for multi-story residential and office buildings. The developed system will eliminate or
minimize the limitations of existing precast floor systems with regard to span-to-depth
ratio, floor projections, thermal efficient, and lateral load resistance while maintaining
speed of construction, simplicity, and economy. To achieve this general objective, the
following specific five goals are identified for the proposed system:
1. Has a span-to-depth ratio of 30 to reduce the floor height and save in architecture,
mechanical, and electrical costs.
2. Eliminates the column corbels and beam ledges to provide additional space and
flat soffit for residential building, and office buildings.
3. Be continuous for as much of the load as possible to provide adequate structural
capacity to resist both gravity and lateral loads, which minimizes the need for
shear walls
4. Has a fully insulated floor panel, which results in improving building thermal
efficient.
5. Has an easy-to-produce and erect precast/prestressed components with minimal
cast-in-place operations to ensure practicality, economy, and speed of
construction.
1.3 Dissertation Organization
This dissertation is organized into six chapters as follows:
Chapter 1: This chapter presents background information; research objectives, and
dissertation organization.

4
Chapter 2: This chapter reviews the literature and current practices of different types of
floor systems. Four different categories of floor system will be presented: such as cast-in-
place concrete floor systems, steel joist floor systems, precast concrete floor systems, and
emerging systems. Also the pros and cons of each system will be presented.
Chapter 3: This chapter presents description and construction sequence of proposed
system.
Chapter 4: In this chapter a design example of six-story office building will be
presented in addition to the design procedures of the building component such as floor
panels, flat soffit beam, column, hidden corbels, and hidden ledges under gravity loads.
Chapter 5: This chapter discusses the lateral loads analysis of the proposed flat shallow
floor system include the wind and seismic loads for two different regions (high and low)
calculated according to ASCE 7-05. These loads were applied to six-story building in
both beam and hollow core directions. Also two dimensional frame analysis was
performed using SAP 2000 will be presented.
Chapter 6: This chapter shows the experimental investigation which carried out to
investigate the structural performance of building component of the proposed systems.
Three full-scale specimens will be presented: beam-column connection without corbel,
HC-beam connection without ledge and flat soffit beam.
Chapter 7: This chapter presents a new floor panels which is alternative to the hollow
core planks with high thermal efficiency. The R-value calculation will be discussed for
fully insulated panel and for panels with concrete solid block at each end. Four full-scale
panels will be tested under flexural and shear, in addition to analytical models to predict
the service load deflection will be presented

5
Chapter 8: This chapter presents summary of the work, research conclusions, and
recommendations for future work.

6
Chapter 2
LITERATURE REVIEW
The various floor framing systems available in the US market at the meantime can be
categorized into four groups: cast-in-place concrete floor systems, open-web steel joist
systems, precast concrete floor systems, and emerging systems. The following
subsections briefly describe each of these categories and present their advantages and
limitations.
2.1 Cast-in-Place Concrete Floor Systems
Cast-in-place concrete slab floor systems are the most flexible floor systems as it
provides the designer with the freedom in floor plan designs. These systems include: one-
way slab and beam, two-way slab and beam, ribbed slab, flat slab, flat slab with drop
panel, flat slab with column capitals, slab with slab band, waffle slab, and waffle slab
with drops. Cast-in-place concrete slab can be the shallowest floor system when post-
tensioning is applied as it allows a span to depth ratio of up to 45 for two-way slab
systems, which results in a 8” thick slab for a typical bay of 30 ft x 30 ft compared to a
12” thick slab for the same bay when no post-tensioning is used. In addition to these
advantages, post-tensioned cast-in-place concrete slabs provide a clean flat soffit that is
suitable for residential applications. For more information on the different types of post-
tensioned floor systems and their span ranges, see Post Tensioning Institute (PTI,
2006)The major drawbacks of the cast-in-place construction, in general, are the cost and
duration required for shoring, forming, pouring, and stripping operations. In addition,
post-tensioning operations increase the construction cost, duration and complexity as it

7
requires the involvement of specialty contractors. Figure 2.1 shows an example of the
construction of post-tensioned concrete floor.
Figure 2.1: Construction of post-tensioned cast-in-place concrete slab
(http://www.yde.co.il/Post-Tensioned-Buildings.aspx)
2.2 Steel Joist Floor Systems
The open web steel joist system is an attractive solution for commercial applications as
shown in Figure 2.2. Open web steel joists are light weight and easy to install. A 28 in.-
32” deep open web steel joist is typically used for 32 ft span with 4 – 6 ft spacing. Metal
decking is generally used to form a 2”-4” thick composite slab. The utilities can pass
through the joist openings, saving the height needed for the utilities. However, as steel
prices continue to climb, these systems become less attractive. Also, a false ceiling is
required to cover the unattractive framing system, resulting in a large total floor height.
Several commercial products are currently available in the US market. Steel Joist
Institute (SJI, 2007) gives more information about open web steel joist system.

8
Steel Joist Girders are open web steel trusses used as primary framing members as shown
in Figure 2.3. The span of a joist girder shall not exceed 24 times its depth. Joist girders
have been designed to allow for a growing need for deeper/longer spans with primary
structural members (depths of 20" to 120" and span lengths to 120 feet). For more
information about the joist girders see specification guide under Joist Girders, Quincy
Joist Company, (2012).
Figure 2.2: Construction of open-web steel joist floor system
(http://steeljoist.org/steel_joist_projects/gsa_trade_shop)
Figure 2.3: Construction of steel joist girder floor system
(http://steel-girders.rolledsteels.com/steel-girders/)

9
2.3 Precast Concrete Floor Systems
Precast concrete floor systems can be made of a wide range of precast concrete products,
such as hollow core slabs, solid slabs, double trees, and inverted tee/rectangular/L-shaped
beams. These products can be also used in conjunction with steel beam and cast-in-place
concrete topping in some applications to satisfy design requirements.
A conventional precast concrete floor system utilizes hollow core slabs supported by
precast/prestressed concrete inverted tee beams which are in turn supported on column
corbels or wall ledges. It provides an economical and fire-resistant floor system with
excellent deflection and vibration characteristics for both residential and commercial
applications. The top surface can be prepared for installation of a floor covering by
placing thin non-structural cementations leveling topping, or a composite 2-3” concrete
composite topping (Precast/Prestressed Concrete Institute, 1998). For a 30 ft span, a 28”
deep beam can be used in addition to 2” cast-in-place topping, which results in a total of
30” thick floor. Also, the beam projection below the hollow core planks (ledge) does not
allow the utilities to pass through resulting in a reduction in the clear floor height.
Innovative precast floor systems have been developed over the last few decades by
researchers and industry experts. Low et al. (1991 and 1996) developed a shallow floor
system for single story construction as it uses single-story precast columns as shown in
Figure 2.4. The beam weight and the complexity of its design and detailing were
discouraging to producers.
Thompson and Pessiki, (2004) developed a floor system of inverted tees and double tees
with openings in their stems to pass utility ducts. This solution does not utilize the HC

10
planks, which are the most dominant and economical product for noni-parking
applications
Figure 2.4: Low proposed system (above right), Plan details (top left), and section details
(bottom). (Thompson and Pessiki, 2004)

11
Tadros and Low, (1996) developed a new precast system that consists of precast concrete
beams and columns as shown in Figure 2.5 (Patent number US 2002/0062616 A1). The
precast columns have voids at the floor level. Two steel angles are attached to the sides of
each column at the beam level. These angles are used as temporary supports for the
beams. Negative reinforcement is placed at the top of the beam through the column void.
Cast-in-place concrete is poured to fill the void between the ends of the beams and
column.
Column 14H Beam (16L, and16F) Ledges (24E, and 24F) Voids (80) Steel angles (82A) Support frame (84B, and 84A) Reinforcing rods (51, 53, and 55) Sleeve (57)
Figure 2.5: Perspective view (top), Cross-section of the beam at mid-span and Cross-
section of the beam at end (bottom & middle). (Tadros and Low, 1996)
Simanjuntak, (1998) developed a precast concrete system which consists of columns and
slabs joined together as shown in Figure 2.6 (Patent number 5,809,712). Each corner of
the slab has a steel pipe. The slab is a panel made from concrete ribs and thin plates,

12
where the ribs function as beams. Each column in the system has high tensile steel
reinforcement strands protruding at the top end to penetrate the steel pipes of the four
corners of the four slabs. The four steel pipes of the four slabs corners meeting on one
column are tied together with high tensile steel wire rope through three holes drilled
horizontally at three places of the pipe length. Special mortar cement is injected to the
implanted pipes through each pipe opening on the side surface of the column, in addition
to grouting the gaps between the pipes and slabs. The proposed system eliminates the
need for column corbels, in addition to using shallow ripped slab. The main drawbacks of
that system are: 1) limitations on the distance between the columns, because of the slab
dimension, 2) inadequacy of the system under lateral loads due to non-continuity of its
connections, 3) consuming more time due to the connections details and need for skilled
labor, and 4) need for false ceiling to cover the unattractive slab ribs
Lower column (1), Upper column (2) Slab side (3) Steel rods (4, 6) Steel plates (11,12) Holes (13, 14, 15) Steel strands (16) Steel pipes (20) Welding (23) Gab between slabs(25) Shear key (28) wire rope (31)
Figure 2.6: An exploded view illustrating the system elements (top) and plan view of an
assembled joint (bottom). (Simanjuntak, 1998)
Reay, (1997) developed method of construction of a multi-story building. The system
consists of precast slab walls and solid floor slab panels as shown in Figure 2.7 (Patent
number 5,660,020). The slab floor has a lower precast concrete floor unit. A concrete

13
topping will be added to the floor slab after the floor is in position. The wall is precast
with a cavity. If so desired, a metal or concrete support can be inserted in the cavity. The
floor unit is precast with one or more reinforcing rods, and positioned adjacent the floor
unite edge. A metal end cap is positioned at the edge and incorporates a bent metal strap
with two ends and a top portion. The ends are welded with the end cap. The end of each
of two reinforcing rods is rigidly secured by welding to the strap metal. A solid square,
metal bar is dimensioned to slide through the end cap and be precisely located within a
metal collar. The collar is of complementary dimensions to the solid square bar, and
secured to the top portion of the strap. Once in position and the floor complete the bar
acts to transfer loads between the floor and the sidewall. A locating pin (of flat mild steel)
is positioned in the unit and it is secured to one or more of the reinforcement. A notch is
placed on the underside of the square bar. That system provides flat soffit floor. The
drawbacks of that system are: 1) it requires shoring during the construction stage, 2)
inadequacy of the system in resisting lateral loads due to discontinuity of slab-column
connections, and 2) it should have at least two connections at each panel to transfer the
load to the wall which consuming time.

14
Slab floor (2) Concrete wall (3) Lower precast unit (4) Concrete topping (5) Cavity (6) Reinforcing rods (9) Floor unit edge (10) Metal end cap (11) Metal Strap (12) End of metal strap (13) Solid square metal bar (15) Metal collar (16) Flat mild steel pin (17) End of the pin (18) Notch (19)
Figure 2.7: Section view through the side wall and the floor (top), and Section view along
the line 2-2 (bottom). (Reay, 1997)
Compton, (1990) developed a new precast concrete beam supported at its end by columns
using retractable hanger located in cavities at the upper ends of the beam as shown in
Figure 2.8 (Patent number 4,903,448). Each hanger extends as cantilever into a recess in

15
the adjacent column. In its extend position, the hanger has its opposite ends supported on
bearing plates in the cavity and in the recess. The drawbacks of that connection are: 1)
inadequacy of the system in resisting lateral loads due to discontinuity of beam-column
connections; and 2) for precast components it has many details and that required highly
skilled labor
Beam (10), Column (11) Hunger member (12) Hunger eye device (13) Load transfer means (17) Components of a beam hanger arrangement (15) Floor slab (16), Recess (22) Beam end surface (18) Cavity (19), Beam upper surface (20) Column end (30), Beam end (31) Projection (32, 33) Hunger member top surface (34, 35) Wedge portion (36) Wedge portion top surface (37) Cavity bottom surface (39) Cavity upper end (40), Hunger side surface (42) Cables (45), Upper return bend portion (47) Legs (48), Frame (49) Bottom bars (52), Top bars (53) U-shaped stirrups (54), L bars (56) Prestressing cables (59)
Figure 2.8: Cross section elevation view (top) and cross-section elevation view taken
along line 2-2 (bottom). (Compton, (1990)
Wise and Meade, (1978) introduced a new building structure, in which precast columns,
beams and deck members are used (Patent number 5,081,935). The basic structure is
supported by precast concrete columns. At least one reinforcing rods in each corner was

16
extending upwardly in the first floor columns. The upper portion of column is hollow and
has U-shaped groove as indicated in Figure 2.9. Above the first floor column is the
second floor precast column. The upper column is structurally similar to the lower
column. The pairs of rods are clamped together by coupling means. Supported in the
hollow portion of the bottom column is at least one horizontal beam. Except at corners of
the floor, there will be at least two beams supported by a column. The beam is U-shaped
having hollow section. The U-shaped solid beams having rods extending from the end
thereof into the U-shape hollow column. When the topping layer of concrete is later
poured, the beam extended rods serve to lock in the beam into the finished unitary
structure. Supported on the upper edges of the beams are deck plates, which are typically
precast concrete slabs with length up to 60 ft. or more, widths of 4 to 8 ft. or
more.(particularly suitable for this application are those precast concrete slabs sold under
the trademark FILIGREE WIDESLAB. Once all mechanical and electrical work is
completed on the deck created by beams and deck plate, and the second column are in
place, the final step is pouring the concrete topping. Covering large spans is considered
the main advantage of that system. The drawbacks of that system are: 1) during the
construction, it is often desirable to have the beams supported by shoring; 2) it is hard to
align the top column vertically because it will be resting on top of these rods which
extend upward from the bottom column so that the top of the rods form a leveled plan;
and 3) it requires a false ceiling to cover the unattractive beam drop.

17
Bottom precast column (2) Upper precast column (26) Extended rods from bottom column (4) Extended rods from the upper column (28) Top part of the bottom column (6) Horizontal beam (12) Beam hollow section (14) Beam sides (18,16) Shoring (20) Deck plates (22) Coupler (30) Topping (42)
Figure 2.9: perspective view of the system (top), and plan view and elevation view taken
on line B - B and A - A (bottom). (Wise and Meade, 1978)
Rahimzadeh, (2003) developed a structural framing system. This system consists of a
steel beam that supports flooring sections interconnected using cast-in-place concrete
(Patent number US 6,543,165 B2). The system is created by anchoring steel beams to
vertical columns as shown in Figure 2.10. The floor sections span between the steel
beams. Cast-in-place concrete is poured into the beams to connect the flooring sections.
The concrete forms a rigid joint between the steel beam, floor sections, and the columns.

18
The drawbacks of that system are: 1) inadequate fire resistance; 2) it requires false ceiling
to cover the drops of the beams; and 3) inadequacy of the system to resist lateral loads
due to simple beam-column connections.
Vertical Column (14) Composite beam (16) Floor component (12) Sheath and solidifying material (24) Bottom plate (26) Containment sides (28) Reinforcement means (30) Joining Means (32) Support surface (34) The upper-most edge (38) Reinforcing means (40) Saddles (44)
Figure 2.10: Cross-sectional view (top), and Plan view of the flooring system (bottom).
(Rahimzadeh, 2003)

19
Wise, (1973) introduced a method for building two way slabs, flat slabs, reinforced
concrete floors, and roofs employing composite concrete flexural construction with little
or no formwork (Patent number 3,763,613). The bottom layer of the composite concrete
floor is formed by using thin prefabricated concrete panels laid side by side in place with
their ends resting on temporary or permanent supports. The panels are precast with one or
more lattice-type girders or trusses extending lengthwise from each panel having their
bottom chords firmly embedded in the panel and with the webbing and top chords
extending above the top surface of the panel as shown in Figure 2.11(left). Transverse
reinforcing of the panel is achieved by embedding reinforcing bars in the precast panels.
The ends of these bars take the shape of hooks, which extend above the upper surface of
the panel along the marginal edges. These hooks are joined by special splicing means to
offer transverse reinforcement from panel to panel as shown in Figure 2.11 (right). The
splice is completed and the transverse reinforcement is achieved when the concrete
topping is applied on the site to form the composite concrete floor slab. The main
drawback of that system is the need for shoring in construction stage, in addition to the
limitation in the dimensions of the panels.
Composite concrete floor (10) Special hooks (18) Transverse reinforcing bars (19) Splicing elements (20)
Figure 2.11: precast slab showing the longitudinal extending trusses (left) and perspective
view of the special splicing (right). (Wise, 1973)
20
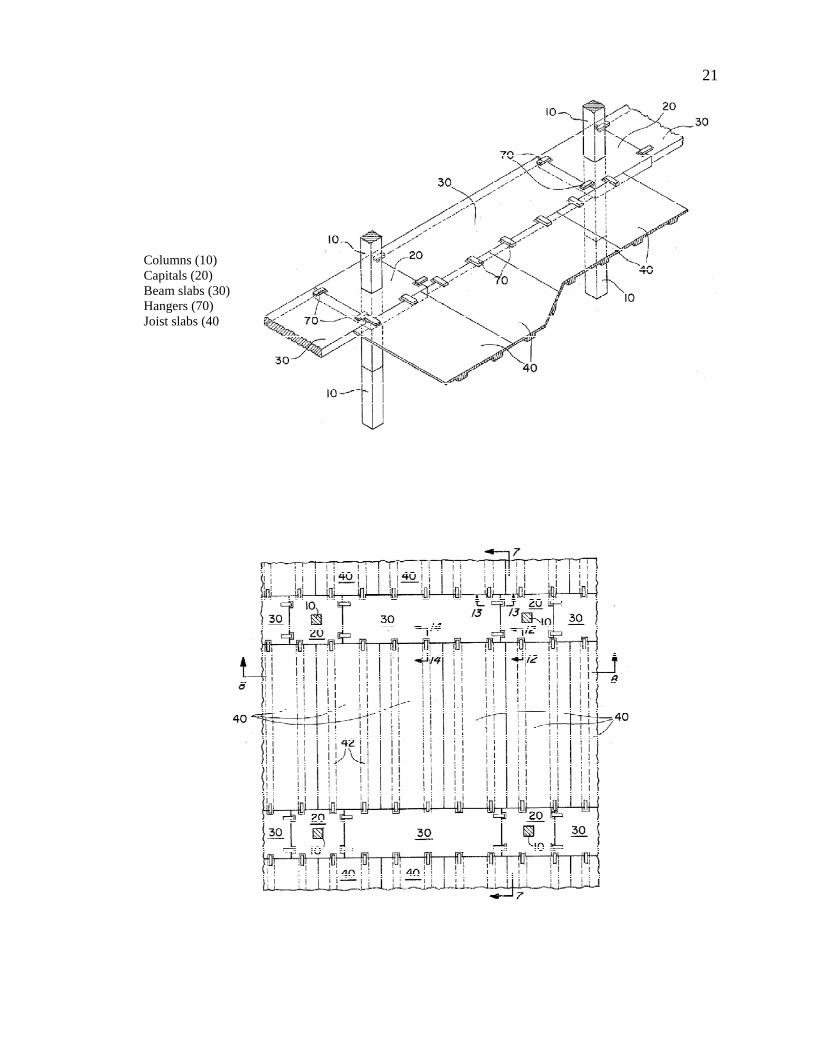
Hanlon, (2008) introduced a building system using modular precast concrete components
that include a series of columns with wide integral capitals (Patent number
US2008/0060293 A1). Wide beam slabs are suspended between adjacent column capitals
by hangers. Joist slabs can be suspended between the beam slabs and column capitals to
provide a floor surface as shown in Figure 2.12. After the columns have been erected,
beam slabs are suspended between adjacent column capitals. Hangers extending from the
ends on the top surface of the beam slabs allow the beam slabs to be dropped into place
between adjacent capitals. These hangers are anchored to the upper surface of the column
capitals to suspend and support the beam slab. After the insulation of the beam slabs, a
number of joist slabs can dropped into place across the span between adjacent runs of
column capitals and beam slabs. Finally, the finished assembly can be covered with a thin
concrete topping. This system is good system for long spans column grids with increasing
in the thickness. The main drawback of that system is the need for heavy construction
equipment in erection due to the weight of the precast components.
21
Columns (10) Capitals (20) Beam slabs (30) Hangers (70) Joist slabs (40

22
Figure 2.12: Perspective view showing an example of building framing (top), and cross-
section shows the invented system (bottom).(Hanlon, 2008)
Hanlon et al. (2009) developed a total precast floor system for the construction of the
nine-story flat-slab building in Avon, CO. This system consists of precast concrete
stair/elevator cores; 10-in. deep × 4-ft wide prestressed concrete beam-slab units; 10-in.-
deep prestressed concrete rib-slab floor elements; 10-in.-thick variable-width beam slab;
and integrated precast concrete columns with column capital as shown in Figure 2.13.
The need for special forms to fabricate these components and the need for high capacity
crane for erection are the main limitations of this system.

23
Figure 2.13: Elevation and Plan show the components of the described system. (Hanlon
et al. 2009)
Composite Dycore Office Structures (1992) developed the Dycore floor system for office
buildings, schools, and parking garages. This system consists of shallow soffit beam, high
strength Dycore floor slabs, and continuous cast-in-place/precast columns with blockouts
at the beam level as shown in Figure 2.14. In this system, precast beams and floor slabs
act primarily as stay-in-place forms for major cast-in-place operations required to
complete the floor system.

Figure 2.14: Composi
Fawzy, (2088) developed
system that eliminates th
walls which results in red
columns, partially continu
hollow-core planks, and
investigate was done to ch
full-scale specimen of 20
specimen includes a 14 ft
hollow core segments 8
specimen: a) IT beam co
column connection test.
osite Dycore structural floor system (Composite D
Structures, 1992)
ped a new continuous precast/prestressed concre
the need for column corbels as shown in Figure
reducing floor height. The system consists of co
tinuous 13 in. deep inverted tee beams, partially
nd minimum of 2 in. thick composite topping.
check the constructability and structural capacity
20 ft x 20 ft area around an interior column was
ft long column, two IT beam segments 11 ft long
8 ft long each. Three primary tests were pe
continuity test, b) hollow-core continuity test,
24
Dycore Office
crete shallow floor
re 2.15 and shear
continuous precast
ly continuous 8 in.
g. Experimentally
ity of the system, a
as fabricated . This
ong each, and eight
performed on the
t, and c) beam-to-

25
Figure 2.15: Column temporary corbel and cross section of the beam. (Fawzy, 2009)
Morcous and Tadros, (2010) developed a new HC-beam connection without ledge. They
tested a full-scale specimen. The test specimen consisted of 15 ft long rectangular beam
that is 10 in. thick, 48 in. wide, and four 8 ft long HC planks that are 10 in. thick and 48
in. wide each. The beam was supported by two roller supports that are 14 ft apart.
Temporary supports for HC planks were erected using two alternatives: 1) ¾ in. inserts
embedded in the beam to connect, the threaded rods holding HSS 5 ft long 4 in. 4 in. x
1/8 in., and; 2) #5-inverted U bar on top of the beam. That has ½ in. threads along the last
4 in. at each end to hang two angles back to back. HC planks were supported on the
temporary supports and concrete blocks. During the test, the connection failed at the
shear key as shown in Figure 2.16, which resulted in the separation of the hollow core
from the topping and the cracking of the topping slab.
This dissertation is an evolution of the system developed by Fawzy (2009) and the
connection developed by Morcous and Tadros (2010).

26
Figure 2.16: HC-beam connection under ultimate design load and failure of HC-beam
connection. (Morcous and Tadros, 2010)
2.4 Emerging Systems
Several efforts have been made to minimize the depth of flooring systems by combing
steel and precast concrete products. Figure 2.17 shows steel beam shapes used in Europe
to support hollow core planks by their bottom flanges and the composite topping by their
top flange. The first two shapes are plate girder (built up) sections, and the third is a
rolled steel section (Board of Federation International Du Beton (fib) steering committee,
1999). These systems provide a high span-to-depth ratio, however, they are limited to
about 20 ft spans, which is reasonable for apartment/hotel buildings, but considerably less
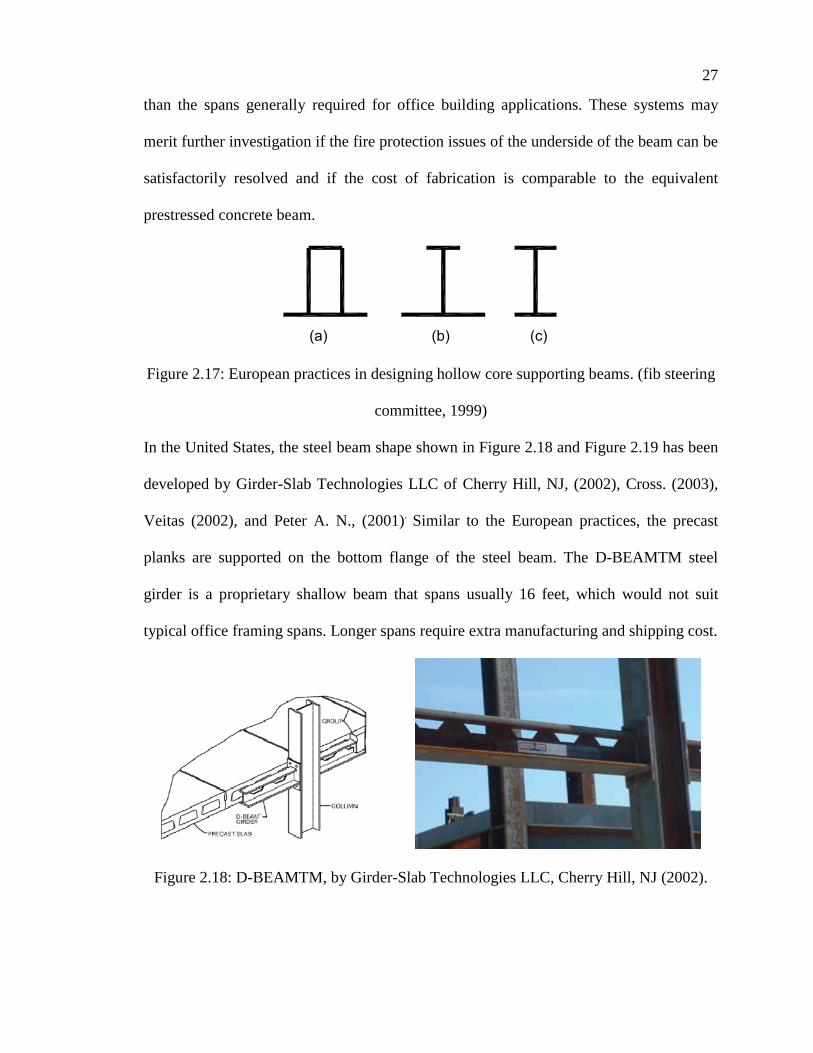
27
than the spans generally required for office building applications. These systems may
merit further investigation if the fire protection issues of the underside of the beam can be
satisfactorily resolved and if the cost of fabrication is comparable to the equivalent
prestressed concrete beam.
Figure 2.17: European practices in designing hollow core supporting beams. (fib steering
committee, 1999)
In the United States, the steel beam shape shown in Figure 2.18 and Figure 2.19 has been
developed by Girder-Slab Technologies LLC of Cherry Hill, NJ, (2002), Cross. (2003),
Veitas (2002), and Peter A. N., (2001). Similar to the European practices, the precast
planks are supported on the bottom flange of the steel beam. The D-BEAMTM steel
girder is a proprietary shallow beam that spans usually 16 feet, which would not suit
typical office framing spans. Longer spans require extra manufacturing and shipping cost.
Figure 2.18: D-BEAMTM, by Girder-Slab Technologies LLC, Cherry Hill, NJ (2002).
(a) (b) (c)

28
Figure 2.19: Construction using Girder-Slab system of Girder-Slab Technologies LLC
Cherry Hill, NJ (2002)
The Deltabeam, a product of the Piekko Group, Peikko News (2010) is an example of
these products. The Deltabeam a hollow steel-concrete composite beam made from
welded steel plates with holes in the sides. It is completely filled with concrete after
installation in site as shown in Figure 2.20. Deltabeam acts as a composite beam with
hollow-core, thin shell slabs, and in-situ casting. Deltabeam can have a fire class rating as
high as R120 without additional fire protection.
Figure 2.20: Filling the Deltabeam with self-consolidating concrete.
(http://www.peikko.ca/Default.aspx?id=625741)

29
The Deltabeam height varies based on the required span. For a 32 ft span, the Deltabeam
can be as shallow as 23” (21” deep beam + 2” topping). Although Deltabeam is
shallower than the corresponding precast/prestressed concrete inverted tee as shown in
Figure 2.21, it requires shoring for erection, adding shims to the base plate to raise up
hollow core to match the level of the top plate, and additional fire protection operations if
higher ratings are required. All of these operations result in a significant increase to the
construction cost and duration. In addition, Deltabeam can be erected only as a simple
beam with continuous column, continuous beam with discontinuous column, or simple
beam with discontinuous column. Deltabeam cannot be used as a continuous beam with
continuous columns, which reduces the system’s ability to resist lateral loads due to wind
or earthquake and increases construction complexity.
Figure 2.21: Construction of Deltabeam floor system.
(http://www.peikko.ca/Default.aspx?id=625741)

The use of built-up steel s
that steel sections be purc
for US precasters. Most U
equipped to perform con
require limited use of stru
Filigree Wideslap System
under the name of OMN
reinforced precast floor
composite with cast-in-p
bottom portion of the slab
top of the precast unit
behavior between precast
during erection. The typi
made in lengths up to 7
pretensioned: when reinfo
camber free. One of the m
required a false ceiling. H
extensive techniques to pr
Figure 2.22: Filigr
sections in precast concrete construction in the U
urchased from a steel fabricator, which is not a de
t US precasters have limited welding capabilities
continuous welding for plate girders. Therefore
tructural steel are more desirable.
em was originally developed in Great Britain and
NIDEC (Mid-State filigree Systems, Inc. 1992)
or panels that serve as permanent formwork.
place concrete and contain the reinforcement
lab. They also contain a steel lattice truss, which p
it as shown in Figure 2.22. The steel truss en
ast and cast–in-place concrete and provides the un
pical thickness of the prefabricated unit is 2.25 i
o 70 ft, and typical widths of 8 ft or less. Sla
nforcing steel and concrete are field-placed, the r
main advantages for this system is a flat soft floo
. However, this system has poor thermal insulati
produce” (Pessiki et. al. 1995)
igree precast slab with light steel truss. (Pessiki et.
30
e US would require
desirable approach
ies, as they are not
ore, solutions that
d is presently used
92). “It consists of
k. The panels are
nt required in the
h projects from the
ensures composite
unit with stiffness
5 in. The units are
Slab units can be
e resulting floor is
oor which does not
lation, and requires
et. al. 1995)

31
Rafael and Orid (2010) developed a new flooring system which consists of a structural
grid of concrete beams with expanded polystyrene (EPS) foams in between as shown in
Figure 2.23. The concrete beams have cross section of 4 x 12 in and the forms are 1.2 in
higher. The grid has beams in two directions every 32 in. The floor is finished with a
light paving system on top and a light ceiling system underneath. When finished, it
weights 41 psf, in buildings with columns separated by 23.3 ft and with a structure slab
thickness of 11.8 in. The production of these slabs is simple and usually is carried out in a
factory. First the EPS 4 x 8 ft forms are put together on a flat surface. If the final slab size
is not a multiple of 4 x 8 ft, then the EPS must be cut. After that the reinforcing steel and
the embedded connections are situated in the beam forms. Then, the concrete fills the grid
of beams. Finally, the precast pieces can be carried to the construction site or they can be
finished, including all the pipes, the floor and ceiling surface in the factory. This system
has many advantages, such as lightweight, flat soffit, and thermal insulation. However,
some of its disadvantages include the floor thickness, unique fabrication process of EPS
forms due to the special connections required.
1- Pavement.
2- EPS formwork.
3- Precast slab beams.
4- Connections.
5- Services.
6- Ceiling.
Figure 2.23: The NEW Flooring System components (Rafael and Orid, 2010)
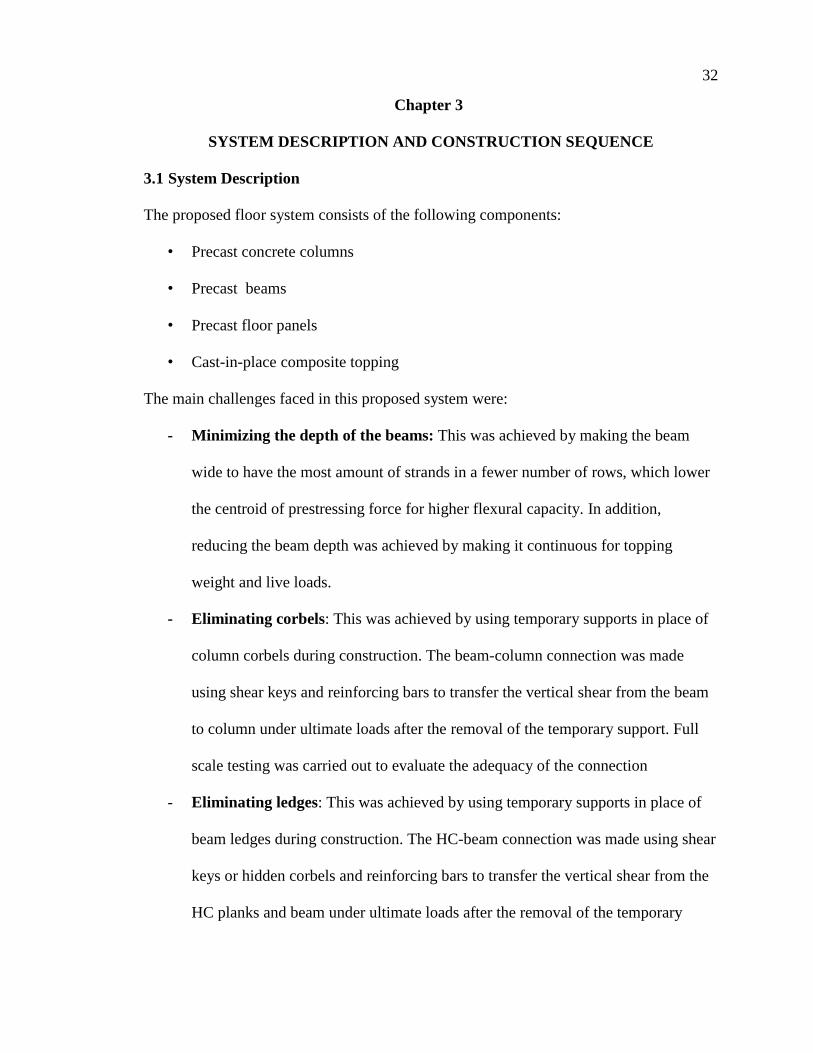
32
Chapter 3
SYSTEM DESCRIPTION AND CONSTRUCTION SEQUENCE
3.1 System Description
The proposed floor system consists of the following components:
• Precast concrete columns
• Precast beams
• Precast floor panels
• Cast-in-place composite topping
The main challenges faced in this proposed system were:
- Minimizing the depth of the beams: This was achieved by making the beam
wide to have the most amount of strands in a fewer number of rows, which lower
the centroid of prestressing force for higher flexural capacity. In addition,
reducing the beam depth was achieved by making it continuous for topping
weight and live loads.
- Eliminating corbels: This was achieved by using temporary supports in place of
column corbels during construction. The beam-column connection was made
using shear keys and reinforcing bars to transfer the vertical shear from the beam
to column under ultimate loads after the removal of the temporary support. Full
scale testing was carried out to evaluate the adequacy of the connection
- Eliminating ledges: This was achieved by using temporary supports in place of
beam ledges during construction. The HC-beam connection was made using shear
keys or hidden corbels and reinforcing bars to transfer the vertical shear from the
HC planks and beam under ultimate loads after the removal of the temporary

33
support. Full scale testing was carried out to evaluate the adequacy shear capacity
of the HC- beam connection.
- Providing continuity for lateral load resistance: A composite reinforced
concrete topping was used to make both beams and HC planks continuous for live
load. This continuity created adequate negative moment capacity to suppress the
positive moments generated by lateral loads.
3.2 Construction Sequence
Step 1) precast of building components (beams, columns, and HC planks) as shown in
Figure 3.1
Figure 3.1: System Components

34
Step 2) The precast columns are bolted to the foundation and temporary corbels are
installed beneath the beam lines. These corbels consist of two angles. The angles were
bolted to the column using two friction bolts though holes in the column as shown in
Figure 3.2. These angles are temporary, low cost supports for the precast beam during
construction and can be reused several times.
Figure 3.2: Placing temporary corbels
Step 3) Precast/prestressed beams are placed on each side of the column so that the
beams align to each other and the beam pockets align to the column opening as shown in
Figure 3.3. The beams were placed at a distance of 1 in. from the column face in addition
to the 1 in. recess in column sides, which creates a 2 in. wide gap between the column
face and beam end to be grouted later and ensure the adequacy of the compression flange
to resist negative moment at the support.

35
Figure 3.3: the beams on the temporary corbels
Step 4) Two steel angles were welded to the beam end plates and column side plates as
shown in Figure 3.4. These angles are required to stabilize the beams during HC erection
in addition to its contribution in resisting negative moment.
Figure 3.4: Welding the top angles to beam and column

36
Step 5) Steel tubes or steel angles are installed as temporary ledges to support the hollow
core planks. The tubes are connected to the bottom of the precast beam using coil inserts
and bolts. The steel angles are connected by welded the angle to the plates preinstalled on
the beam side as shown in Figure 3.5.
Figure 3.5: temporary beam ledges

37
Step 6) HC planks are placed on the temporary beam ledges on each side of the beam as
shown in Figure 3.6.
Figure 3.6: Hollow core planks on temporary beam ledges
Step 7) Continuity reinforcement is placed in the beam pockets and through the column
opening. This reinforcement includes the hidden corbel reinforcement needed for the
beam-column connection and the hat and loop bars connecting the HC planks to the beam
placed over the beam at the HC keyways and slots in the HC opining as shown in Figure
3.7.
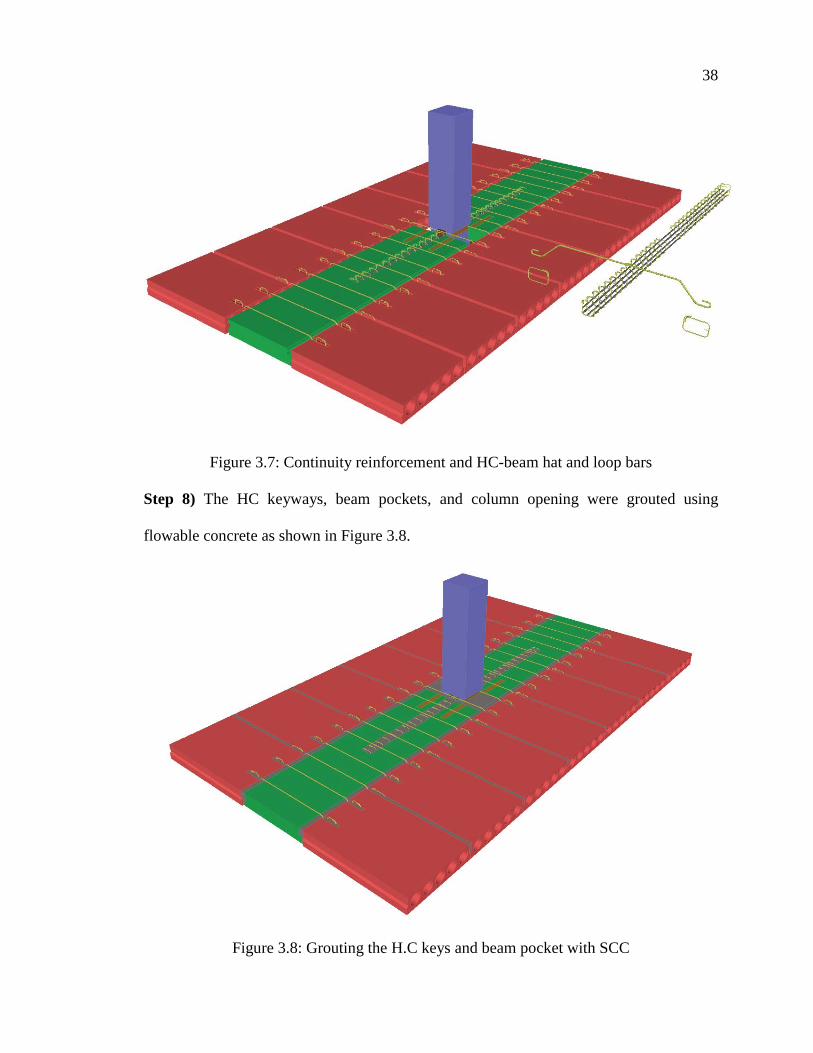
38
Figure 3.7: Continuity reinforcement and HC-beam hat and loop bars
Step 8) The HC keyways, beam pockets, and column opening were grouted using
flowable concrete as shown in Figure 3.8.
Figure 3.8: Grouting the H.C keys and beam pocket with SCC

39
Step 9) Second layer of continuity reinforcement is placed over the beam, as shown in
Figure 3.9
Figure 3.9: Beam continuity reinforcement
Step 10) Welded wire reinforcement is placed over the HC planks to reinforce the
composite topping as shown in Figure 3.10.

40
Figure 3.10: Placing the topping reinforcement
Step 11) Topping concrete is poured using medium slump 3.5 ksi concrete as shown in
Figure 3.11.
Figure 3.11: Pouring and finishing the topping concrete
Step 12) Finally, the temporary corbels and ledges are removed after topping concrete
reaches the required compressive strength to provide a flat soffit as shown in Figure 3.12.

41
Figure 3.12: Removing the temporary corbels and ledges

42
Chapter 4
DESIGN OF FLAT SOFFIT FLOOR SYSTEM UNDER GRAVITY LOAD
4.1 Introduction
The purpose of the design procedures shown in this chapter is to present the steps for
designing the flat soffit shallow precast concrete floor system in sufficient detail to allow
a knowledgeable engineer to replicate the design on actual projects. The next sections
discuss design concepts and Appendix A presents the design calculations in details.
Design procedures were entirely performed according to the provisions of the following
design codes, standards, and manuals:
� American Concrete Institute (ACI) “Building Code Requirements for Structural
Concrete (ACI 318-08) and Commentary”
� American Institute of Steel Construction, (AISC, (2008). “Steel Construction
Manual”, Thirteenth Edition.
� American Society of Civil Engineering, (ASCE. (2005)) “ASCE 7-05 Minimum
Design Loads for Buildings and Other Structure”
� Precast/Prestressed Concrete Institute (PCI. (2004)) “PCI Design Handbook”, 6th
Edition
4.2 Design Example and Procedures
In order to explain the main design criteria that apply to the proposed flat soffit shallow
hollow core floor system, an example building is used. Figure 4.1 shows the general plan,
elevation, and side views of a six-story office building. The proposed floor system
consists of continuous precast columns and partially continuous 10 in. deep rectangular
beams, partially continuous 10 in. deep HC planks, and minimum of 2 in. composite

43
concrete topping. This system benefits the precast/prestressed industry by utilizing
typical components that are easy to produce, handle, and erect. The 10 in. thick and 48 in.
wide, HC planks are the most affordable precast product due to their lightweight and use
in several applications. In addition, the 48 in. wide and 10 in. thick rectangular beams are
simple in fabrication, handling and shipping. All the connections in the new system are
greatly simplified for the precaster and contractor to speed up fabrication and erection
operations, which will result in the quick and wide use of this system. Two key methods
can be used to achieve the structural capacity of the proposed shallow floor system under
gravity and lateral loads: a) increasing the beam width up to 48 in. to accommodate 19-
0.6 in. diameter prestressing strands, and b) making the beam continuous for topping
weight and live loads. This continuity necessitates having openings through the
continuous column and pockets in the beam to allow the negative moment reinforcement
of the beam to go through the column. This will also provide adequate support for the
beam, so that the temporary corbels below the beams can be removed. HC planks are also
designed with partial continuity to provide adequate resistance to lateral load in other
direction.

44
Figure 4.1: Plan, elevation, and side views of the example building
Figure 4.1 shows the plan, elevation, and side views of an example building that will be
used in presenting design procedures. This building is a six-story office building that is
150 ft long, 146 ft wide, and 72 ft high designed for a 100 psf live load. The average
floor height is 12 ft (from centerline to centerline) and interior bays are 30 ft in the long
direction and 30 ft in the short direction, while exterior bays are 30 ft in the long direction
and 28 ft in the short direction. It is recommended that the flat soffit beams (FS) be used
12'
12'
12'
12'
12'
12'
72'
30'
30' 30' 30' 30' 30'
30'0"30'30'30'30'
ExteriorPrecastBeam
interiorPrecastBeam
PrecastColumn
HC Planks
PrecastSpandrelBeam
28'
28'
30'
30'
146'
45
along the short direction of the building, while hollow core (HC) planks are used in the
long direction of the building. This usually results in a more economical design. Below
are the properties of materials used in this design example:
� Concrete strength of precast components = 6,500 psi at release and 8,000 psi at
final
� Concrete strength of precast Hollow Core 6,000 psi
� Concrete strength of cast-in-place grout 6,000 psi
� Concrete strength of cast-in-place topping 4,000 psi
� Prestressing strands are 0.6 in. diameter Grade 270 low-relaxation
� Reinforcing steel is Grade 60 deformed bars
� Welded wire reinforcement (WWR) is Grade 75 deformed wires
4.2.1 Design for Gravity Loads
4.2.1.1 Floor Panels
Two alternative floor panels will be used in this study; a) Hollow core (HC) planks that
can be used when there is no need for thermal insulation and b) Sandwich floor panels
that can be used when there is a need for the thermal insulation. The following section
describes in details the design for both HC only and the sandwich panel will be presented
in chapter 7.
Hollow Core (HC) Design
The HC planks used in the proposed system are designed similar to HC planks used in
any conventional floor system. Manufacturer tables and design charts are used to
determine the maximum span and uniform load that can be carried by a specific type and
size of HC planks.

46
HC planks are designed as simply supported non-composite beams carrying the weight
of concrete topping and as simply supported composite beam carrying the live load and
superimposed dead loads. Camber and deflection of HC planks are calculated to
determine the thickness of the topping at the beam mid-span and end-span sections.
HC planks are made continuous over the interior beams to create a moment resisting
frame in the HC direction for resisting lateral loads. Therefore, the negative moment
capacity of the composite end-span section of HC, shown in Figure 4.2, is calculated
using strain compatibility to determine whether additional reinforcement is needed over
the column strip.
Figure 4.2: Composite HC End-Span Section
4.2.1.2 Flat Soffit Beam Design
Two different cross sections of flat shallow beams were designed to be used in the
proposed system; a) beam with shear key and b) beam with hidden corbel. Three standard
flat soffit beams (FS) are proposed for each cross section to be used with 8 in. 10 in., and
12 in. thick HC planks to cover a wide range of spans and loading conditions. Figure 4.3
shows the dimensions of the six FS beams (three from each cross section). For the
building example presented in this study, FS10 with 10 in. thick HC were selected, which
results in an average span-to-depth ratio of 30. The following subsections summarize the

47
flexure design, and shear design for this beam. Detailed design calculations for the same
example are presented in Appendix A.
Figure 4.3: Dimensions of Standard FS beam with shear key (top) and FS�beam with
hidden corbel (bottom)
3'-10"
10"1"1"
1"
4"
4'
7"10"
8"
6"
2"
4'
FS10
3'-10"
8"1"
1"
2"
4'
7" 8"
8"
4"
2"
4'
FS 8
3"
3"
3'-10"
1'1"1"
1"
4"
4'
7"1'
8"
8"
2"
4'
FS12
5"
2"
4'
7"
8"
6"
4'
4"6"
3'-4"
FS10
4'
7"
8"
4"
4'
4"4"
3'-4"
FS 8
4'
7"
8"
7"
4'
5"
7"
3'-4"
FS12
Mid-Span Section End-Span Section
4"
4"
4"

48
A. Flexure Design
Making the beam continuous for topping weight, live loads, and superimposed dead loads
was achieved in two stages:
1) Placing negative moment reinforcement in the pockets at the beam ends and
through the column and pouring the pockets to make the non-composite beam
continuous for topping weight, and
2) Placing negative moment reinforcement in the concrete topping to make the
composite beam continuous for superimposed dead and live loads.
Therefore, the flexural capacities of both mid-span and end-span sections are checked for
the following three conditions:
� Simply supported non-composite beam subjected to prestressing force and the
self-weight of FS beam and HC.
� Continuous non-composite beam subjected to topping weight.
� Continuous composite beam subjected to live load and superimposed dead load.
Four sections from the flat soffit beam need to be checked for their flexural capacity.
Non-composite mid-span and end-span sections are fully prestressed concrete sections
and need to be checked under service and ultimate loading conditions, while composite
mid-span and end-span sections are reinforced concrete sections and need to be checked
under ultimate loading conditions only. Non-composite mid-span and end-span sections
are designed as Class U sections to determine the required prestressing. Table 4.1 shows
beam design parameters required for this building. Table 4.2 shows the final moments of
the flat soffit beam obtained f using moment coefficients (ACI Section 8.3).

49
Table 4.1: Design parameters
Table 4.2: Beam final moments
Based on the analysis results, the exterior span of the FS10 was found to be the most
critical at both positive and negative moment sections. The design of these sections in
terms of the number of prestressing strands, precast top reinforcement, pocket
reinforcement, and topping reinforcement is presented in Table 4.3. Table 4.4 compares
the positive and negative moment capacities of composite and non-composite sections
(�Mn ), versus the ultimate moments (Mu) obtained from the analysis. Capacities were
calculated using strain compatibility as it provides more accurate results than the
approximate ACI equation 18-3.
Selected Beam Type FS 10
Column Width (in) 20
Average Topping Thickness (in) 2.25
LL (psf) 100
External Bay Size in Beam Direction (ft) 28
Internal Bay Size in Beam Direction (ft) 30
Bay Size in HC Direction (ft) 30
Beam Concrete Strength at Release (psi) 6500
Beam Concrete Strength at Final (psi) 8000
Grout Concrete Strength (psi) 6000
Topping Concrete strength (psi) 4000
Factored Non-Composite Positive Moment (kip.ft) 344
Factored Composite Positive Moment (kip.ft) 565
Factored Non-Composite Negative Moment (kip.ft) 76
Factored Composite Negative Moment (kip.ft) 397

50
Table 4.3: Reinforcement used in the Designed FS 10
Table 4.4: Comparison of Demand and Capacity at Critical Sections.
Prestress loss calculations performed according to the PCI Design Handbook six edition
method outlined in section 4.7. These calculations show elastic shortening losses of
approximately 9.13%, long-term losses of 7.9%, and total losses of 17%. The stresses in
the concrete after prestress transfer (before time-dependent losses) and stresses in
concrete at service loads after allowance for prestress losses are calculated. The
calculations indicates that the tension at the extreme top fibers at release exceed the code
limits at mid-span and end section, therefore, 4#4 top bonded reinforcement were
provided along the entire beam length in addition to 4#6 at the beam ends to control
concrete cracking at release. Since the tension at the extreme bottom fibers at final is high
Positive Moment Section Reinforcement Number Area (in2) Size
Prestressing Strands 19 0.217 0.6
Precast Top Reinforcement 7 0.20 #4
Negative Moment Section Reinforcement Number Area (in2) Size
Precast Top Reinforcement 4 0.44 #6
Pocket Reinforcement (Bottom) 6 0.44 #6
Pocket Reinforcement (Top) 3 0.79 #8
Topping Reinforcement 6 0.79 #8
SectionCapacity
(�Mn) kip.ftDemand
(Mu) kip.ftCheck
Positive Non-Composite Section 385 344 ��
Negative Non-Composite Section 140 76 ��
Positive Composite Section 678 565 ��
Negative Composite Section 425 397 ��
Factored Composite Positive Moment at the end-section(kip.ft)
100Demand will be calculated from the lateral load

51
than modulus of rupture, the FS beam was designed a Class U flexural member, which
allows the use of uncracked section properties for deflection calculations. End zone
reinforcement of this prestressed beam was also calculated according to the PCI design
handbook section 4.2.4, and it was found that 2#4 at 2 in. from the beam end is
satisfactory as the required area of bursting reinforcement is 0.18 in2.
B. Shear Design
The shear force for FS10 was calculated under the three loading conditions presented
earlier. Table 4.5 shows the final shear obtained using the shear coefficients (ACI Section
8.3). The flat soffit beam was designed using the ACI simplified method (Section 11.3.2).
Based on shear design, it was decided to use 2#4 @ 12 in. spacing along the entire beam
length in additional to the 2#4 provided at 2 in. from beam-ends for end zone cracking
Table 4.5: Final shear values
Two alternative solutions will be used to create the beam temporary ledges:
1) Two steel angles will be welded to beam side plates, which attached to the beam
during casting stage
2) Steel section will be attached to coil inserts, which placed in the bottom of the
beam during the casting stage.
Dimensions, reinforcement details, and method used to support the HC for the proposed
beam cross section are shown in Figure 4.4, Figure 4.5, Figure 4.6, and Figure 4.7.
Factored Non-Composite Shear (kip) 56
Factored Composite Shear (kip) 131

52
Figure 4.4: Plan and section views of the beam with shear key ledge and temporary steel
angles
14'-2"
1"
8"
7'-6"8"
7"
2"2"
2'4"
3'-10"
#4@12"
#4@12"
Mid-Span SectionEnd-Span Section
6"
4'19-0.6"
6#4
7"4"
2"
1'-312"
734" 1'-31
2"734"
938"93
8"
1034"
3'-6"
1'-7"1'-7"
9"
8"4"
Ø2"
L4x3x38"
#4@12"
PL3x6x38" every 48"
2-5"x12" studs
7#4
4'
7"
19-0.6"
#4@12"
3'-6"734"
Ø2"
1"
8"
7'-6"8"
7"
2"2"
2'4"

53
Figure 4.5: Plan and section views of the beam with shear key ledge and coil inserts
Figure 4.6: Plan and section views of the beam with ledge and temporary steel angles
#4@12"
#4@12"
3'-10"
6"
4'19-0.6"
6#4
7"4"
2"
1'-7"1'-7"
34" Coil Insert
#4@12" 7#4
4'
7"
19-0.6"
#4@12"
1"
8"
7'-6"
8"
7"
2"2"
2'4"
Mid-Span SectionEnd-Span Section
512"
7"
1'-4" 1'-4"
6#4
3'-10"
3'-2"103
4"
738" 73
8"
Ø2"
Ø112"
734"
1'-112"
4'
5"
19-0.6"
4"
1'-112"
734"
3'-10"
4'L4x3x3
8"
#4@12"
PL3x6x38" every 48"
4"3'-4"
312" Ø2"
3'-2"
734" Ø2"
2-7"x12" studs
7#45"6"
8"
8"4"
Ø2"
19-0.6"

54
Figure 4.7: Plan and section views of the beam with ledge and coil inserts
C. Torsion Design
The torsion design of FS beam was carried out according PCI Design Handbook 6th
Edition section 4.4 and ACI 318-08 section 11.5. The two sections were illustrated that
torsion critical section of prestressed members was located at distance h/2 from the face
of the support. The beam was used to support the HC blanks in construction stage, so the
construction stage was considered the critical stage according to torsion design. The
maximum torsion moment and torsion load were occurred due to placing the HC planks
in one side of the beam. The design proves that #4@12 in. close stirrups are enough to
resist the torsion.
4.2.1.3 Column Design
Design of columns for the proposed floor system is similar to the design of column for
any conventional floor system. Columns should be designed to resist axial and bending
moments according to Section 10.3 of ACI 318-08. Since the column of the proposed
1"
8"
7'-6"
8"
7"
2"2"
2'4"
4'
5"
19-0.6"
4"
512"
7"
1'-4" 1'-4"
6#46"
19-0.6"
4'
#4@12"
4"3'-4"
7#45"

55
system is continuous precast columns, stresses due to handling, shipping, and erection
should be also checked according to Chapter 5 of the 6th edition of the PCI Design
Handbook. In order to achieve the continuity of the flat soffit beams and eliminate the
need for column corbels, each column has an embedded 18 in. long HSS 10x8x1/2”
section and 1 in. recess from all sides at the location of each floor as shown in Figure 4.8.
This opening allows the continuity of the beam top reinforcement for resisting the
negative moment due to topping weight and live load. Also, when the column opening
along with the shear keys on the column sides are filled with concrete they act as a
hidden corbel to support the gravity loads of the floor.
Figure 4.8: Dimensions and reinforcement details of the column at the floor level.
4.2.1.4 Design of Temporary and Hidden Corbels
Temporary Corbels
The design of the temporary corbels is carried out according to the shear-friction design
method of ACI Section 11.6.4. Grade 150 threaded rods (TR) are used to attach the
10"
3"
314"
1012"
434"
7"9"
1'-8"
10"8"8"
1'
1'-8"4#11
#4@12
1'-8"

56
temporary corbels to the two column sides through the holes shown in Figure 4.8. These
rods will be tightened to the specified torque that creates a sufficient axial force to
transfer the load to the column through friction. The coefficient of friction between the
column and the steel temporary corbels is assumed to be 0.7 (ACI 11.6.4.3). Angles or
channel sections can be used as temporary corbels along with stiffener plates to support
Figure 4.9: Isometric view shows friction bolts and the temporary corbel
Figure 4.10 shows the bearing flange against bending. Also, the size of the angle or
channel section is determined so that the bearing flange is at least 4 in. wide and the web
height can provide a contact area with the column so that the bearing stress on the
concrete is not more than the smaller of 800 psi or 0.2f’c.
Figure 4.10: Stiffened angle used as a temporary corbel.

57
The following subsection presents the calculations performed to determine the required
diameter of the TR, size angle or channel section, and thickness of stiffeners
Resistance
Anet.TR 0.85in2�� DiameterTR 1in��
Fccolumn 8000psi�� � 0.7��
Number TR 2�� Columnwidth 20 in��
� sh 0.75� fuTR 150 ksi��
Design of Temporary Corbels
Loads
hc 12 in�� Wbeam 0.5kip
ft��
Interbeam.span 30 ft�� Exter beam.span 28 ft��
Avergthickness.top 2.5 in��HCweight.sq.ft 0.08kip
ft2
��
Span HC.direction 30 ft�� Construction L.L 0.015kip
ft2
��
VD.from.beam Wbeam
Interbeam.span2
� 7.5 kip����
VD.from.HC HCweight.sq.ftLHC�Interbeam.span
2� 29.25 kip����
VD.from.top Avergthickness.top � c� HCspan�Interbeam.span
2� 14.06 kip����
VDead.per.corbel VD.from.beam VD.from.HC VD.from.top 50.81 kip����
Vlive.per.corbel ConstructionL.L HCspan�Interbeam.span
2� 6.75 kip����
VU.per.corbel 1.4 VDead.per.corbel Vlive.per.corbel �� 80.59 kip����
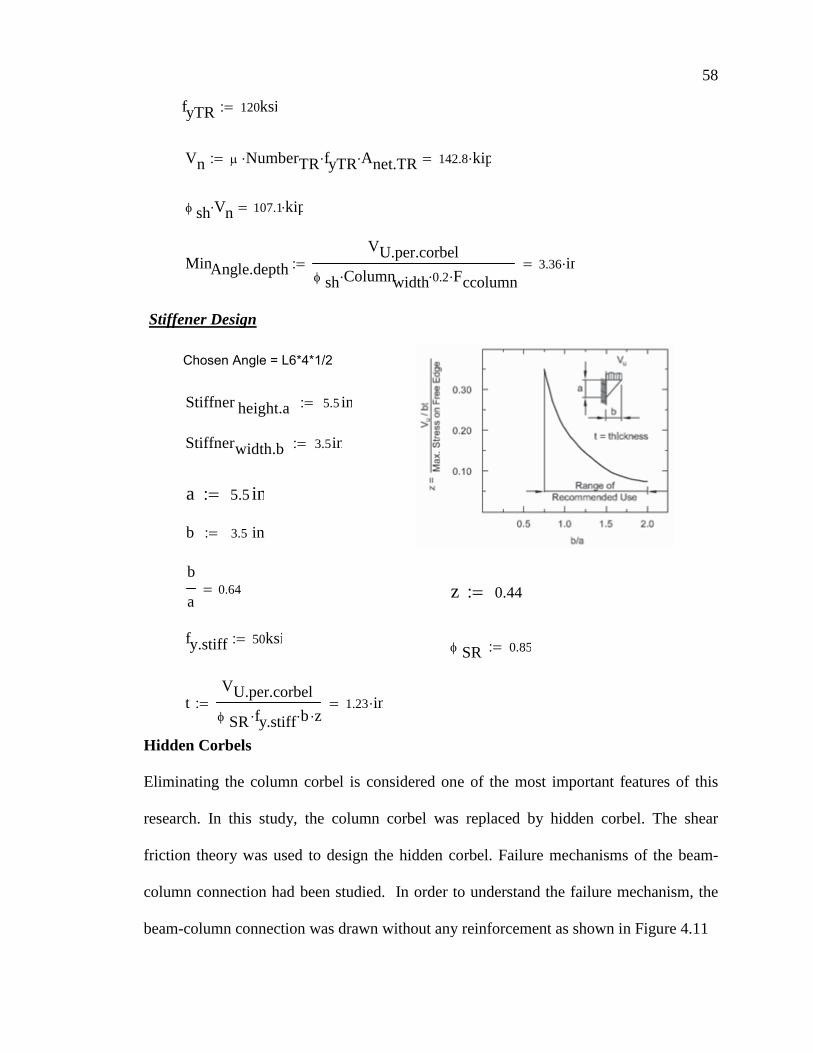
58
Hidden Corbels
Eliminating the column corbel is considered one of the most important features of this
research. In this study, the column corbel was replaced by hidden corbel. The shear
friction theory was used to design the hidden corbel. Failure mechanisms of the beam-
column connection had been studied. In order to understand the failure mechanism, the
beam-column connection was drawn without any reinforcement as shown in Figure 4.11
fyTR 120ksi��
Stiffener Design
Chosen Angle = L6*4*1/2
Vn � NumberTR� fyTR� Anet.TR� 142.8 kip����
� sh Vn� 107.1 kip��
MinAngle.depth
VU.per.corbel
� sh Columnwidth� 0.2� Fccolumn�3.36 in����
Stiffner height.a 5.5 in��
Stiffnerwidth.b 3.5in��
a 5.5 in��
b 3.5 in��
b
a0.64� z 0.44��
fy.stiff 50ksi��� SR 0.85��
tVU.per.corbel
� SR fy.stiff� b� z�1.23 in����

59
Figure 4.11: Beam-column connection without reinforcement
Figure 4.12 presents the failure mechanisms of the beam-column connection. It is clear
that the first mechanism of failure occur due to the interface shear between the beam and
the column as shown in Figure 4.12 (a). Figure 4.12 (b) shows the second mechanism of
failure which occur losing the bond between the precast beam and the pocket grout

60
(a) Shear the interface between the beam and the column
(b) Bond failure in the interface between the beam pocket and the grout
Figure 4.12: Failure mechanisms of beam-column connection
Preventing the first failure mechanism was achieved in two stages:
1) Make 1 in. recess (shear key) in the four side of the column as shown in
Figure 4.13
Plane of Shear Friction Failure

61
Figure 4.13: Recess in the four side of the column
2) Place grade 60 steel bars in beam pockets and through the column opening as
shown in Figure 4.14

62
Figure 4.14: Hidden corbel reinforcement
Preventing the second failure mechanism was achieved by making the beam pocket
surface roughened , in addition to making the beam composite with the topping by using
steel shear connectors as shown in
Figure 4.15: Cross section of the beam shows the shear connectors
The design of the hidden corbel is performed according to the shear-friction design
method of ACI Section 11.6.4. Grade 60 reinforcing bars provide continuity of the flat
soffit beam (i.e.3#8 and 6#6) that act as shear-transfer reinforcement. According to ACI
R11.6.7, no additional reinforcement is required unless the required shear-transfer
reinforcement exceeds the provided amount. The coefficient of friction between the FS
6"
4'19-0.6"
7"
#4@12"

63
beam and column is calculated as the weighted average of 1.4 for the area of hidden
corbel (concrete placed monolithically) and 0.6 elsewhere (concrete placed against
hardened concrete not intentionally roughened). These two coefficients were averaged
based on the ratio of the surface area the monolithically placed concrete to the
intentionally roughened hardened concrete. The following section presents factored
applied load and factored resistance of the hidden corbel. Figure 4.16 shows the
reinforcement details of beam-column connection. It should be noted that the effect of the
two angles welded to column sides and the top of beams on the shear transfer is ignored.
Loads
Resistance
hc 12 in�� Wbeam 0.5kip
ft��
Interbeam.span 30 ft�� HCweight.sq.ft 0.08kip
ft2
��
HCspan 30 ft�� LL 0.1kip
ft2
��
Avergthickness.top 2.5 in��
VDead.beam Wbeam Interbeam.span� 15 kip����
VDead.HC HCweight.sq.ftInterbeam.span� LHC� 58.5 kip����
VDead.Top Avergthickness.top� c� HCspan� Interbeam.span� 28.12 kip����
VDead.Load VDead.beam VDead.HC VDead.Top 101.63 kip����
VLive.Load LL HCspan� Interbeam.span� 90 kip����
VU 1.2 VDead.Load� 1.6 VLive.Load� 265.95 kip����

64
Areasteel 0.79in2
3� 0.44in2
6� 5.01 in2���� fyb 60 ksi��
Vn.final Vn1 Vn1 Vn.min�if
Vn.min otherwise
��
Vn.final 384 kip��
� sh Vn.final� 288 kip��
VU 265.95 kip��
Depthhidden.corbel 9in�� Widthhidden.corbel 7in��
Columnwidth 20 in�� Depthbeam 12in��
� pocket 1.4Depthhidden.corbelWidthhidden.corbel� �
ColumnwidthDepthbeam� �� 0.37���
� precast 0.6ColumnwidthDepthbeam� Depthhidden.corbelWidthhidden.corbel� �
ColumnwidthDepthbeam� �����
���
��
� precast 0.44�
� avg � pocket � precast 0.81��� fctop 4 103� psi��
Vn1 Areasteel fyb� � avg� � 2� 486.97 kip����
Vn2 0.2 fctop� Columnwidth� Depthbeam� � 2� 384 kip����
Vn3 480psi 0.08fctop � ColumnwidthDepthbeam� �� 2� 384 kip����
Vn.min Vn2 Vn2 Vn3�if
Vn3 otherwise
��
Vn.min 384 kip��

65
Figure 4.16: Beam-column connection
4.2.1.5 Design of Beam Hidden Ledges and Temporary Ledges
Eliminating the beam ledges is considered one of the most important features of this
research. In this study, the beam ledges were replaced by hidden ledges. The shear
friction theory was used to design the hidden ledge. Failure mechanisms of the HC-beam
connection had been studied. In order to understand the failure mechanism, the HC-beam
connection was drawn without any reinforcement as shown in Figure 4.17. Three
common failure mechanisms in the HC-beam connection were shown in Figure 4.18.
10"
3" 9#8
HSS 10x8x12
3x38" plate
4x38" plate
6"
3x2x38"
4'
1'-8"
19-0.6"
6#42"
3"
7"4"
2"
10"
3" 9#8
HSS 10x8x12
3x38" plate
4x38" plate
6"
3x2x38"
4'
1'-8"
2"
3"
7"4"
5"
19-0.6"
6#4

66
The first failure mechanism was the collapse of the beam’s shear key due to vertical shear
load. After that failure, the HC will separate from the concrete topping as shown in
Figure 4.18 (a). The second failure mechanism was the interface shear failure in the cast
in place concrete between the HC and the beam. This failure will cause the separation of
the HC from the Topping as shown in Figure 4.18 (b). The third failure mechanism was
the collapse of the HC due to the incline shear plan as shown in Figure 4.18 (c).
Figure 4.17: HC-beam connection without reinforcement
(a) Shear Failure in the beam shear key
Shear Failure Plane

67
(b) Shear Failure in cast-in-place concrete between the HC and the beam
��� Shear Failure in the HC�
Figure 4.18: HC-beam connection failure mechanisms
To prevent the collapse of beam shear key, the beam shear key was designed according to
ACI-308 section 11.6.5. The nominal vertical shear shall not exceed the smallest of 0.2
F`c Ac , (480 + 0.08 F`
c ) Ac , and 1600 Ac , where Ac is the area of concrete section
resisting shear transfer. According to the previous three equations, the beam shear key
Shear Failure Plane
Shear Failure Plane

68
was design to be 4 in. height to prevent the collapse due to the vertical shear load as
shown in Figure 4.19 .
Figure 4.19: Beam shear key dimension
To prevent the interface shear failure between the HC and beam, 6 in. from the HC holes
was filled with concrete after plugged HC openings to prevent the flow of concrete inside
the HC especially when a flowable concrete is used. In addition, 1 ft slots were made in
the top of the HC opening. Steel loop was placed in each slot to increase the composite
action between the HC and the topping as shown in Figure 4.20 , also to help in
preventing the separation of the HC from the topping.
Figure 4.20: steel loops were placed in the HC slots
48.0
46.0
4.0
2.0
4.0
2.0
4'
112"11
2"
338"
138"
738"
214"
358"
1'
112"11
2"
10"

69
To prevent any failure mechanism steel reinforcement was used in the connection. The
connection reinforcement was bent with 45 degrees as shown in Figure 4.21. The
reinforcement was bent to resist any vertical or incline shear plan. The following
subsection presents how the shear friction theory used in the hidden ledge design.
Figure 4.21: Shape of reinforcement using in the HC-beam connection
Hidden ledge design
The design of the beam-hidden ledge is performed according to the shear-friction design
method of ACI 318-08 Section 11.6.4. Grade 60 reinforcing bars used to provide a
support of the HC act as shear-transfer reinforcement. The coefficient of friction between
the beam and HC is calculated as 1 (concrete placed against hardened concrete with
surface intentionally roughened).
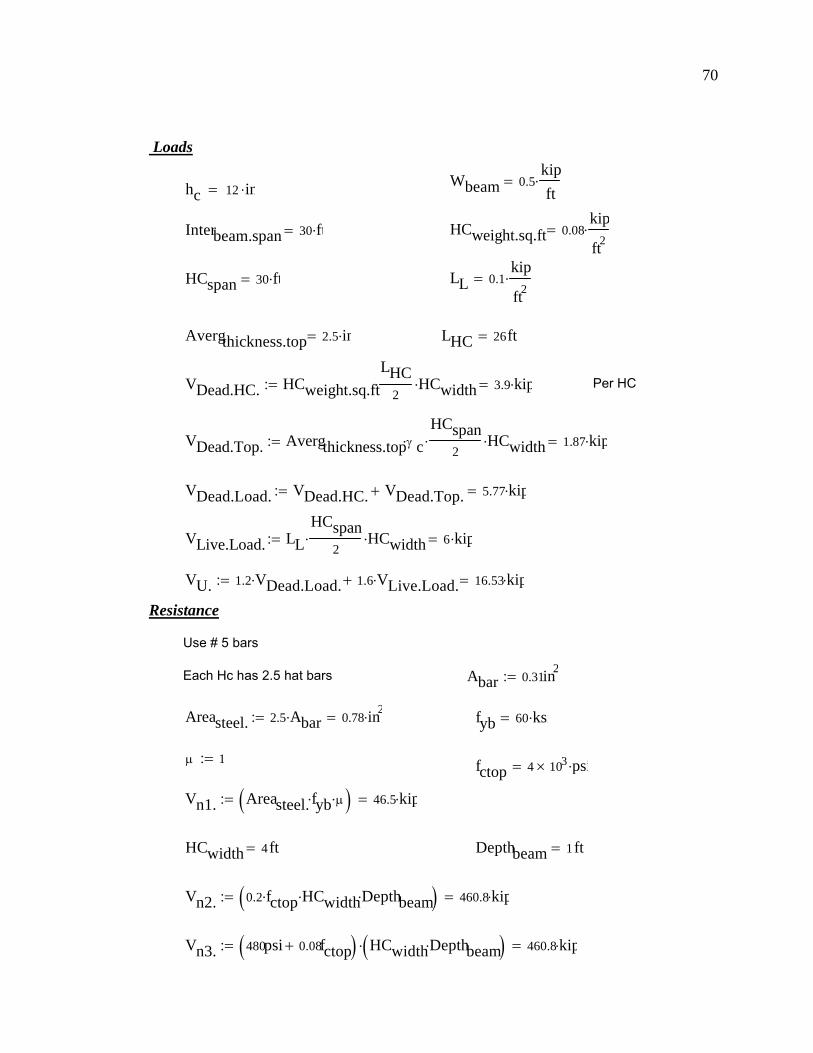
70
Loads
Per HC
Resistance
Use # 5 bars
Each Hc has 2.5 hat bars
Wbeam 0.5kip
ft��hc 12 in��
Interbeam.span 30 ft�� HCweight.sq.ft 0.08kip
ft2
��
HCspan 30 ft�� LL 0.1kip
ft2
��
Avergthickness.top 2.5 in�� LHC 26ft�
VDead.HC. HCweight.sq.ft
LHC2
� HCwidth� 3.9 kip����
VDead.Top. Avergthickness.top� c�HCspan
2� HCwidth� 1.87 kip����
VDead.Load. VDead.HC. VDead.Top. 5.77 kip����
VLive.Load. LL
HCspan2
� HCwidth� 6 kip����
VU. 1.2 VDead.Load.� 1.6 VLive.Load.� 16.53 kip����
Abar 0.31in2��
Areasteel. 2.5 Abar� 0.78 in2���� fyb 60 ksi��
� 1�� fctop 4 103� psi��
Vn1. Areasteel. fyb� �� � 46.5 kip����
HCwidth 4ft� Depthbeam 1ft�
Vn2. 0.2 fctop� HCwidth� Depthbeam� � 460.8 kip����
Vn3. 480psi 0.08fctop � HCwidthDepthbeam� �� 460.8 kip����

71
From the calculation, it was clear that one HC-beam connection can carry 34.88 kips,
which was 2.1 times the ultimate shear due to the dead and live loads. Figure 4.22 shows
complete reinforcement details for HC-beam connection.
The design of temporary ledges is performed according to beam design of American
institute of steel construction (AISC, 2008). It acts like a beam with double cantilever
subjected to point load at the cantilevers ends. The point load was calculated from the
self-weight of the HC, topping, and the construction load. The temporary ledge subjected
to factored moment 3kip.ft approximately. Table 3-13 of AISC manual thirteenth edition
illustrates that HSS4x4x1/8 section has enough capacity to carry that moment.
Vn.min. Vn2. Vn2. Vn3.�if
Vn3. otherwise
��
Vn.min. 460.8 kip��
Vn.final. Vn1. Vn1. Vn.min.�if
Vn.min. otherwise
��
Vn.final. 46.5 kip��
� sh Vn.final.� 34.88 kip��
VU. 16.53 kip��
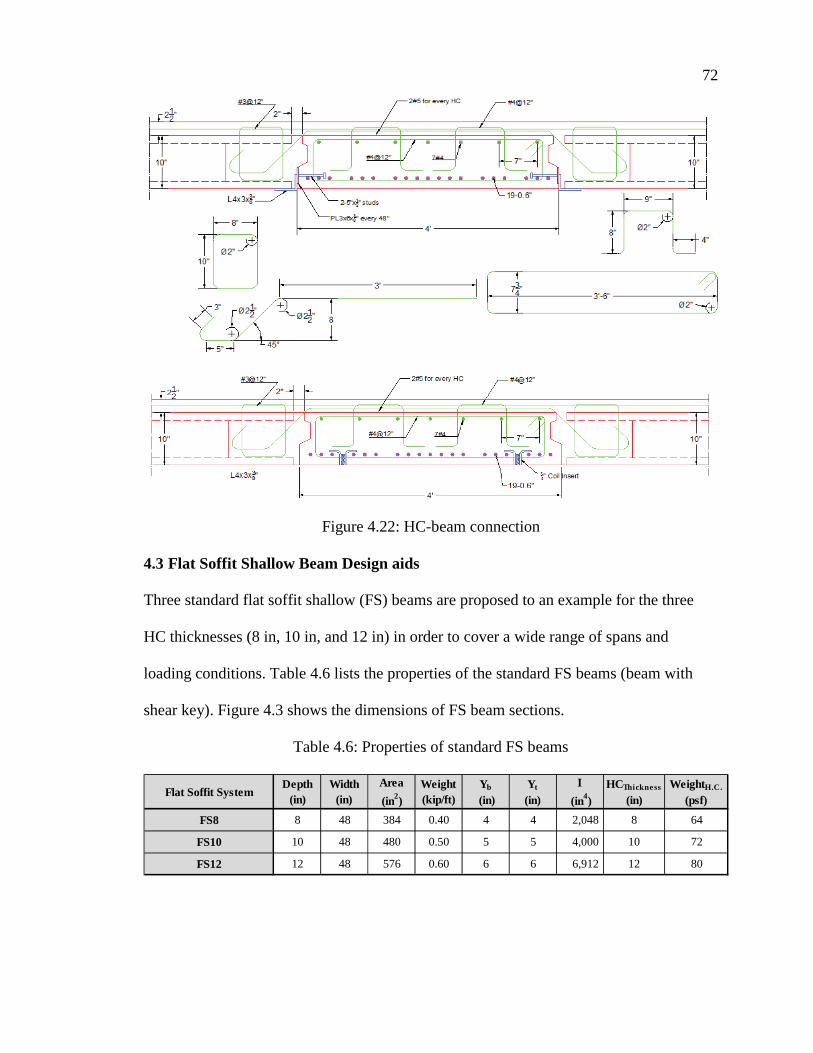
72
Figure 4.22: HC-beam connection
4.3 Flat Soffit Shallow Beam Design aids
Three standard flat soffit shallow (FS) beams are proposed to an example for the three
HC thicknesses (8 in, 10 in, and 12 in) in order to cover a wide range of spans and
loading conditions. Table 4.6 lists the properties of the standard FS beams (beam with
shear key). Figure 4.3 shows the dimensions of FS beam sections.
Table 4.6: Properties of standard FS beams
Flat Soffit SystemDepth
(in)Width
(in)
Area
(in2)
Weight(kip/ft)
Yb
(in)Yt
(in)
I
(in4)
HCThickness
(in)WeightH.C.
(psf)
FS8 8 48 384 0.40 4 4 2,048 8 64
FS10 10 48 480 0.50 5 5 4,000 10 72
FS12 12 48 576 0.60 6 6 6,912 12 80

73
The following charts present the design for three standard flat soffit beam (FS). The
vertical axis in the chart presents the value of the live load (psf) and the horizontal axis
presents the span of the beam. Every chat has four curves, which defined the HC span
direction. All the charts were developed by changing the negative reinforcement, while
the positive reinforcement (19-06 in. strand) remaining constant. The design curves for
FS 8 were shown in Figure 4.23, Figure 4.24, and Figure 4.25. Figure 4.26, Figure 4.27,
and Figure 4.28 show the design charts of FS 10, while Figure 4.29, Figure 4.30, and
Figure 4.31 show the design charts of FS 12
Figure 4.23: Design chart for FS 8 (9#8 and 6#6 negative reinforcement)
50
100
150
200
250
300
350
20 22 24 26 28 30 32 34 36 38
Liv
e L
oad,
psf
Beam Span, ft
HC = 20 ft
Hc = 24 ft
HC = 28 ft
HC = 32 ft
Hc = 36 ft
8"
9#8
6#6
19-0.6"4'

74
Figure 4.24: Design chart for FS 8 (15#8 negative reinforcement)
Figure 4.25: Design chart for FS 8 (9#9 and 6#8 negative reinforcement)
50
100
150
200
250
300
350
20 22 24 26 28 30 32 34 36 38
Liv
e L
oad,
psf
Beam Span, ft
HC = 20 ft
HC = 24 ft
HC = 28 ft
HC = 32 ft
HC = 36 ft
50
100
150
200
250
300
350
20 22 24 26 28 30 32 34 36 38
Liv
e L
oad,
psf
Beam Span, ft
HC = 20 ft
HC = 24 ft
HC = 28 ft
HC = 32 ft
HC = 36 ft
8"
19-0.6"
15#8
4'
6#8
8"
4'19-0.6"
9#9

75
Figure 4.26: Design chart for FS 10 (9#8 and 6#6 negative reinforcement)
Figure 4.27: Design chart for FS 10 (15#8 negative reinforcement)
50
100
150
200
250
300
350
20 22 24 26 28 30 32 34 36 38 40
Liv
e L
oad,
psf
Beam Span, ft
HC = 20 ftHC = 24 ftHC = 28 ftHC = 32 ft
50
100
150
200
250
300
350
20 22 24 26 28 30 32 34 36 38 40
Liv
e L
oad,
psf
Beam Span, ft
HC = 20 ft
HC = 24 ft
HC = 28 ft
HC = 32 ft
HC = 36 ft
HC = 40 ft
9#8
6#6
19-0.6"
10"
4'
15#8
19-0.6"
10"
4'

76
Figure 4.28: Design chart for FS 10 (9#9 and 6#8 negative reinforcement)
Figure 4.29: Design chart for FS 12 (9#8 and 6#6 negative reinforcement)
50
100
150
200
250
300
350
20 22 24 26 28 30 32 34 36 38 40
Liv
e L
oad,
psf
Beam Span, ft
HC = 20 ft
HC = 24 ft
HC = 28 ft
HC = 32 ft
HC = 36 ft
HC = 40ft
50
100
150
200
250
300
350
20 22 24 26 28 30 32 34 36 38
Liv
e L
oad,
psf
Beam Span, ft
HC = 20 ft
HC = 24 ft
HC = 28 ft
HC = 32 ft
HC = 34 ft
HC = 40 ft
19-0.6"
9#9
6#8
10"
4'
19-0.6"
9#8
6#6
1'
4'

77
Figure 4.30: Design chart for FS 12 (15#8 negative reinforcement)
Figure 4.31: Design chart for FS 12 (9#9 and 6#8 negative reinforcement)
50
100
150
200
250
300
350
20 22 24 26 28 30 32 34 36 38
Liv
e L
oad,
psf
Beam Span, ft
HC = 20 ft
HC = 24 ft
HC = 28 ft
HC = 32 ft
HC = 36 ft
HC = 40 ft
50
100
150
200
250
300
350
20 22 24 26 28 30 32 34 36 38 40
Liv
e L
oad,
psf
Beam Span, ft
HC = 20 ft
HC = 24 ft
HC = 28 ft
HC = 32 ft
HC = 36 ft
HC = 40ft
19-0.6"
15#8
1'
4'
19-0.6"
9#9
6#8
1'
4'

78
4.4 Constructability, Cost, and Schedule Analysis
This section compares the constructability, cost and schedule of the proposed system with
a typical precast floor system. The cost and schedule analysis refers to a single 120 ft x
120 ft elevated floor slab (16 bays each bay 30 ft x 30 ft).
A. Constructability Analysis
The flat soffit precast floor system appears to have no major constructability issues. The
temporary corbels are easy to install, as are the temporary beam ledges, rolling scaffold
provides easy access to both. Welding the two angles to the beam end plates and column
side plates take slightly longer than welding a typical inverted T beam to the column but
requires no exceptional skill or equipment. Placing the beams and the HC planks are no
more and no less complex than standard precast floor systems. Placing continuity
reinforcement while not complex, are additional steps required for the shallow flat soffit
precast floor system that requires more steel reinforcement. The grouting operation is
comparable to other precast floor systems with the exception of the need for slightly more
grout for the beam pocket and column opening. Placing the welded wire fabric and the
concrete topping are identical operations for both the shallow flat soffit precast floor
system and the typical precast floor system. Removing the temporary supports at the
column and the hollow core planks is a simple, albeit additional operation.
Cost Analysis
Table 4.7 shows a cost analysis comparing the flat soffit precast floor system to a typical
precast floor system. All cost data was developed using RSMeans Building Construction
Cost Data 2011 unless specified otherwise. For clarity, the estimate line items in this

79
section coincide with the construction steps described in the proposed system section of
this dissertation.
There are 25 precast concrete columns on each floor. Since the depth of the inverted-tee
beams in the typical precast system are 28 in. compared to 10 in. in the flat soffit precast
floor system, the typical precast columns are 12.5 ft per floor compared to 11 ft per floor
for the shallow flat soffit precast floor system to provide 10 ft equivalent clearance.
Columns are assumed approximately equivalent except for length since the shallow flat
soffit precast floor column includes a recessed area, steel tube and bolt sleeves as
compared to two heavily reinforced corbels.
Temporary corbels are attached to each shallow flat soffit precast floor system column.
Installation productivity is listed at five per hour with two structural steel workers and
two rolling scaffold while removal rates are estimated at 10 per hour. This is based on
actual field measurements from two full-scale installations. The angles are 6 in. x 4 in. x
0.5 in. and are 2 ft long with a weight of 16 pounds per lineal foot). There are 40 reusable
angles per floor at a cost of $32 each, which results in material cost of $1,280. Two, 1 in.
diameter and 2 ft long all thread rods fasten the angles to the columns through 1-1/16 in.
diameter holes precast into the 25 column. The cost for 50 rods is $650 for a total
material cost including angles of $1,930. Assuming a reuse rate of six give a total
material cost of $322 per floor.
Twenty beams are installed in either system and installation costs are similar because of
the similar weights between the two systems (RSMeans Building Construction Cost Data
2011, section (03 41 05.10 1400) There are eight spandrel beams that are the same for
either system since they are concealed within the exterior wall. The cost of the eight-

80
spandrel beams is $3,425 each. The beam material costs for the flat soffit beam system
and the inverted-tee were priced from the manufacturer at $150 and $120 per lineal foot,
respectively. Inserts are cast into the beam for field installation of the temporary plank
supports.
Installation of the temporary plank supports is estimated at 20 supports per hour with two
structural steel workers and two rolling scaffold while removal rates are estimated also at
20 per hour. This is based on measurements from full-scale field installation. The 5 ft
long temporary supports are 4 in. x 4 in. x 0.125 in. tubes that weigh 12 pounds per lineal
foot. There are 4 supports per plank and 120 planks. Each support is estimated to cost $50
plus $5 for bolt and washer resulting in total material cost of $18,000. With six reuses,
material cost per use is $3,000 per floor.
Continuity reinforcement is only required with the flat soffit precast floor system. There
are two layers as indicated in the construction sequence. There is 3.1 tons of
reinforcement required in the first layer and 8.2 tons in the second.
There are 16 bays, 30 ft x 30 ft that require approximately 4 yd3 of grout for each bay
regardless of operation. The flat soffit floor system requires an additional 0.5 yd3 per
column to fill the beam and column pocket.
Welded wire fabric is identical for both operations as is the concrete topping. There was
15,840 ft2 of welded wire fabric and 14,400 ft2 of 2.5 in. concrete topping.
Schedule Analysis
The schedule results are shown in the Table 4.8. Durations were determined from the

81
Table 4.7: A Cost ($US) Comparison between shallow flat soffit and typical precast floor
systems per floor
Item Shallow Flat Soffit Floor System Typical Precast Floor System Materials Labour Equipmen
t Total Materials Labour Equipmen
t Total
Column 29,150 7,838 4,373 41,361 33,125 8,906 4,969 47,000 Temporary Corbel
322 777 160 1,259
Beam placement
111,901
4004 2226 118,131
95,360 4,004 2,226 101,590
-angles vs. corbelsa
750 305 122 1177 777 312 1089
HC Supports
3000 1457 300 4,757
HC Plank Install
93,600 11,856
6,614 112,070
103,500
13,110
7,314 123,924
Continuity Reinf.
2,961 1,659 0 4,620
Grout 7,725 1,260 420 9,405 5,974 974 325 7,273 2nd
Continuity Reinf.
6,642 3,526 0 10,168
WWF Installation
2,995 3,960 0 6,955 2,995 4,514 0 6,954
Concrete Topping
12,240 11,376
4,032 27,648 12,240 11,376
4,032 27,648
Remove Supports
1846 380 2,226
Total cost 339,777
315,478
Cost per square foot
$23.6 $21.9
aThere are two corbel welds per column approximately 6 in. (15.24 cm) long in the overhead position from a scaffold vs. the two 36 in. (0.91 m) long angle welds in the horizontal position from the deck. It was determined that it would take approximately 15 minutes per column for the former and twice as long per column for the later at $58.05/hour for welder and equipment.
daily output from RSMeans. One crew was assumed for each activity in order to develop
a consistent comparison. Other durations were taken from the estimated productivity

82
described in the previous section. Since the focus of this analysis is on the difference
between shallow flat soffit precast floor system and a typical precast operation, it was
determined unnecessary to incorporate factors like learning curve, mobilization,
equipment delays, weather, etc. since these would have a similar effect on either floor
system.
Table 4.8: A schedule comparison between shallow flat soffit and a typical precast
flooring system
Item Proposed SystemDays
Typical Precast Floor SystemDays
Step 1-Column 2.3 2.6 -Temporary Corbel 1.0 N/A Step 2-Beam placement 1.4 1.6 -Weld angles 1.6 1 Step 3-Temporary HC Supports
1.9 N/A
Step 4-HC Plank Installation 3.5 3.8 Step 5-Continuity Reinf. 1.1 N/A Step 6-Grout 0.5 0.4 Step 7-2nd Continuity Reinf. 2.3 N/A Step 8-WWF Installation 5.1 5.1 Step 9-Concrete Topping 5.4 5.4 Step 10-Remove Supports 2.4 N/A Total durations in days 28.5 20

83
Chapter 5
DESIGN OF FLAT SOFFIT FLOOR SYSTEM UNDER LATERAL LOAD
5.1 Introduction
Lateral loads considered in the analysis of the proposed flat shallow floor system include
the wind and seismic loads calculated according to ASCE 7-05. These loads were applied
to the 75 ft high (six-story) marked frames in Figure 5.1 for both beam and hollow core
directions. Two Dimensional frame analysis was performed using Structural Analysis
Program (Computers and Structures, Inc. (2000)) to determine the maximum moments
due to wind and seismic loading in each direction.
Figure 5.1: Two-dimensional frames adopted for lateral load analysis
28'
28'
30'
30'
146'
30'
30' 30' 30' 30' 30'

84
5.2 Wind Loads
In this section, the wind loads will be calculated according to the wind speeds. Two-
wind zone will be discussed in this section. The first zone is low- moderate wind zone,
which located in the mid-west region. State of Nebraska was chosen as example for low-
moderate windy zone. The second zone is high wind zone, which located in the south east
coast. State of Florida was chosen as example for high wind zone.
5.2.1 Low-moderate Wind Zone
Wind loads were calculated according to Chapter 6 of the ASCE 7-05. The wind speed
used in the analysis was 90 mph, which is the design wind speed for Nebraska State.
Figure 5.2, Figure 5.3, and Figure 5.4 show, respectively, the loaded frame, bending
moment diagram, and deformed shape due to wind load applied to the beam direction.
Maximum unfactored bending moment was found to be 41.11 kip.ft, while maximum
deflection was 0.654 in.
Table 5.1 shows wind pressure calculations with references to the ASCE 7-05 sections,
tables and figures. These calculations indicate that the design wind pressure is
approximately 15 psf, which results in a lateral force per floor of 5.38 kip in beam and
HC directions.
Figure 5.2, Figure 5.3, and Figure 5.4 show, respectively, the loaded frame, bending
moment diagram, and deformed shape due to wind load applied to the beam direction.
Maximum unfactored bending moment was found to be 41.11 kip.ft, while maximum
deflection was 0.654 in.

Figure
The Basic Wind Speed (V)
Wind Directionality Fcator (Kd)
Importance Factor Depends On Velocity Pressure Exposure Coe
Topographic Factor (Kzt)
Equivalent Height Of The Structu
Turbulence intensity factor (C)Intensity Of Turbulence (Iz')
Integral length Scale LIntegral length Scale Power law EIntegral Length Scale of Turbulen
Mean Roof Height (h)
Horizontal Dimension of Buliding
Background response factor (Q)Peak Factor for Background Res
Peak Factor for Wind Response
Gust Effect Factor (G)External Pressure Coefficient (C
Velocity Pressure Evaluated at H
Design Wind Pressure (P)
Force at each node in the frame
Table 5.1: Wind pressure calculations
re 5.2: Wind load applied to the beam direction
90 mph
0.85
n Building Category (I&II) 1.0oefficient Evaluated at height z ( Kz) 1.23
1
cture (Z') 52.8 ft
0.20.18
500 ft
w Exponent (€') 0.2lence (Lz') 549.3
72 ft
ing Meaured Normal to Wind Direction (B) 146 ft
Q) 0.86Response (gQ) 3.4
se (gv) 3.4
0.86(Cp) 0.8
t Height z above ground (qz) 21.68 psf
14.9 psf
5.36 kip
85
ph Figure 6.1
Table 6-4
Table 6-1 Section 6.5.6
Section 6.5.7
Table 6-2
Table 6-2
Table 6-2
Table 6-2Section 6.5.8.1
Section 6.5.8.1
Section 6.5.8.1
Section 6.5.8.1Section 6.5.8.1
Section 6.5.8.1
Section 6.5.8.1Section 6.5.11
sf
sf
ip

Figure 5.3: Ben
Figure 5.4: De
Figure 5.5, Figure 5.6, a
moment diagram, and def
ending moment due to wind load in the beam dire
Deformed shape due to wind load in the beam dire
, and Figure 5.7 show, respectively, the loaded
eformed shape due to wind load applied to the HC
86
irection
irection
ed frame, bending
HC direction. Four

hollow cores planks arou
element that can resist
released). Maximum unf
maximum deflection was
Figure
Figure 5.6: Be
round the column (i.e. column strip) were mod
st negative moment only (i.e. positive moment
nfactored bending moment was found to be 42
as 0.397 in.
ure 5.5: Wind load applied to the HC direction
Bending moment due to wind load in the HC direc
87
odeled as a frame
ent resistance was
42.3 kip.ft, while
irection
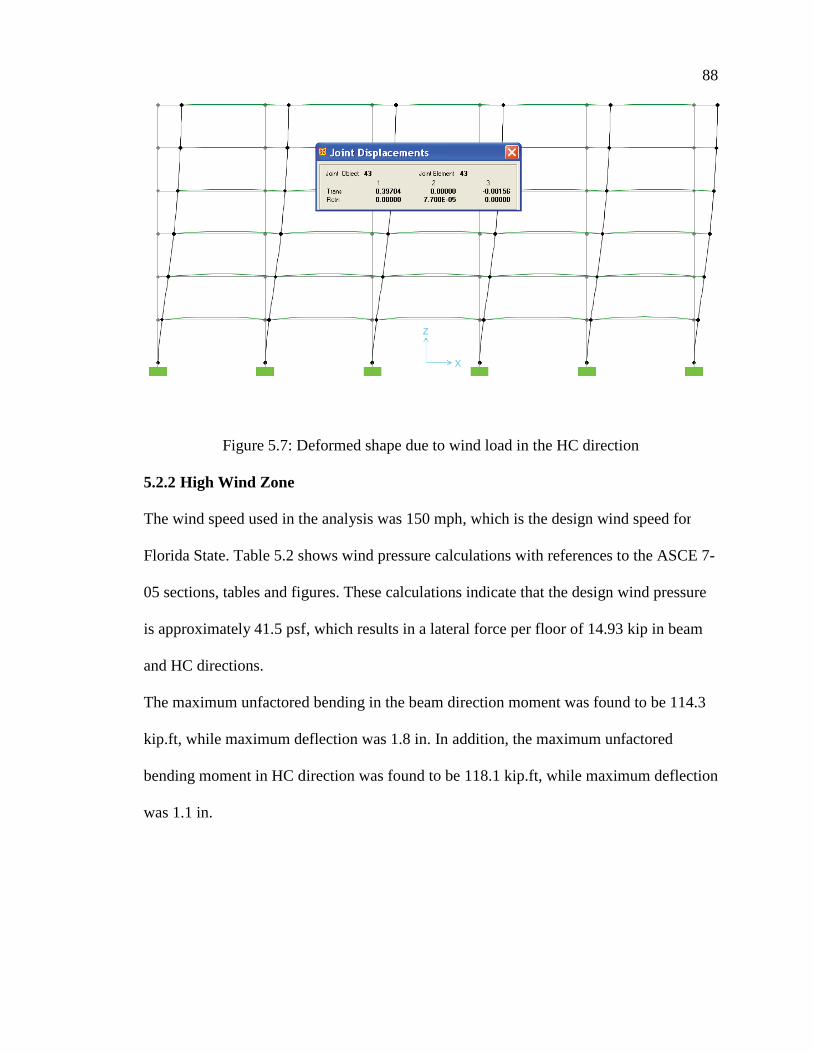
Figure 5.7: D
5.2.2 High Wind Zone
The wind speed used in th
Florida State. Table 5.2 sh
05 sections, tables and fig
is approximately 41.5 psf
and HC directions.
The maximum unfactored
kip.ft, while maximum de
bending moment in HC di
was 1.1 in.
Deformed shape due to wind load in the HC direc
the analysis was 150 mph, which is the design wi
shows wind pressure calculations with references
figures. These calculations indicate that the design
sf, which results in a lateral force per floor of 14.9
red bending in the beam direction moment was fou
deflection was 1.8 in. In addition, the maximum u
direction was found to be 118.1 kip.ft, while max
88
rection
wind speed for
es to the ASCE 7-
ign wind pressure
4.93 kip in beam
found to be 114.3
unfactored
aximum deflection
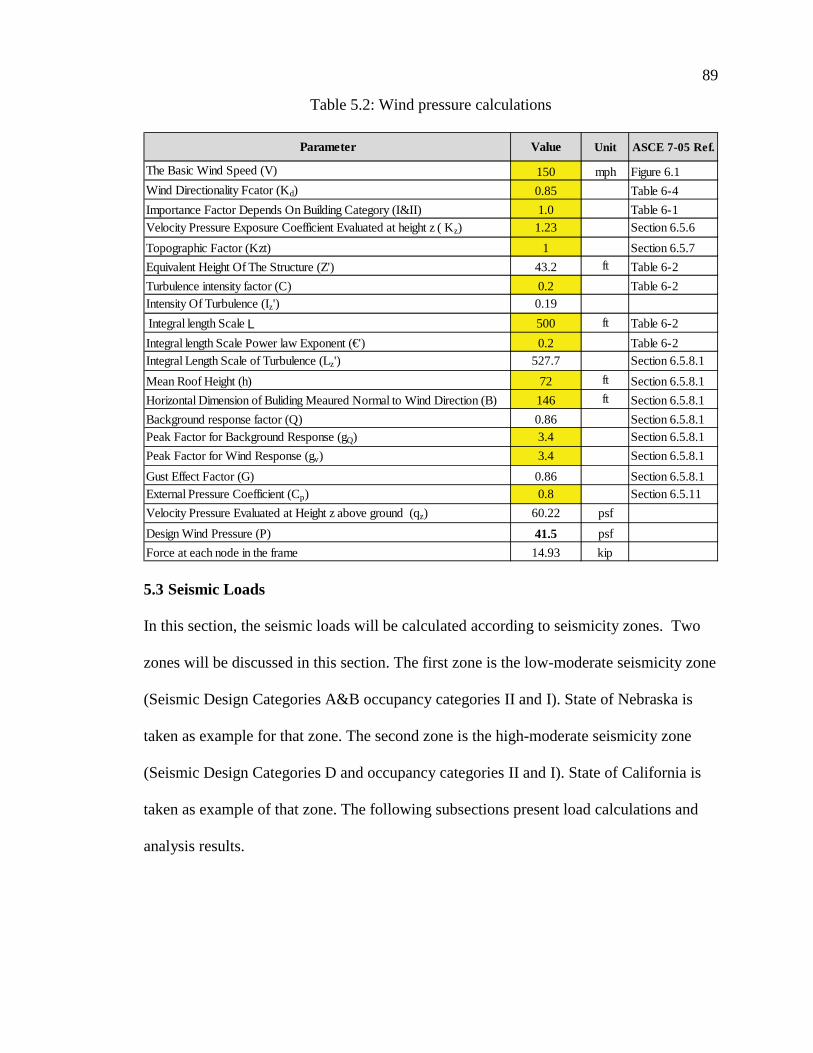
89
Table 5.2: Wind pressure calculations
5.3 Seismic Loads
In this section, the seismic loads will be calculated according to seismicity zones. Two
zones will be discussed in this section. The first zone is the low-moderate seismicity zone
(Seismic Design Categories A&B occupancy categories II and I). State of Nebraska is
taken as example for that zone. The second zone is the high-moderate seismicity zone
(Seismic Design Categories D and occupancy categories II and I). State of California is
taken as example of that zone. The following subsections present load calculations and
analysis results.
Parameter Value Unit ASCE 7-05 Ref.
The Basic Wind Speed (V) 150 mph Figure 6.1
Wind Directionality Fcator (Kd) 0.85 Table 6-4
Importance Factor Depends On Building Category (I&II) 1.0 Table 6-1 Velocity Pressure Exposure Coefficient Evaluated at height z ( Kz) 1.23 Section 6.5.6
Topographic Factor (Kzt) 1 Section 6.5.7
Equivalent Height Of The Structure (Z') 43.2 ft Table 6-2
Turbulence intensity factor (C) 0.2 Table 6-2Intensity Of Turbulence (Iz') 0.19
Integral length Scale L 500 ft Table 6-2
Integral length Scale Power law Exponent (€') 0.2 Table 6-2Integral Length Scale of Turbulence (Lz') 527.7 Section 6.5.8.1
Mean Roof Height (h) 72 ft Section 6.5.8.1
Horizontal Dimension of Buliding Meaured Normal to Wind Direction (B) 146 ft Section 6.5.8.1
Background response factor (Q) 0.86 Section 6.5.8.1Peak Factor for Background Response (gQ) 3.4 Section 6.5.8.1
Peak Factor for Wind Response (gv) 3.4 Section 6.5.8.1
Gust Effect Factor (G) 0.86 Section 6.5.8.1External Pressure Coefficient (Cp) 0.8 Section 6.5.11
Velocity Pressure Evaluated at Height z above ground (qz) 60.22 psf
Design Wind Pressure (P) 41.5 psf
Force at each node in the frame 14.93 kip

90
5.3.1 Low-moderate Seismicity Zone
Seismic loads were calculated according to Chapters 11 and 22 of the ASCE 7-05. The
0.2 sec. and 1.0 sec. spectral response acceleration used in the analysis were chosen for
Nebraska State. Table 5.3 shows the base shear force calculations with references to the
ASCE 7-05 sections, tables and figures, while Table 5.4 shows the force distribution on
each floor.
Table 5.3: Base shear force calculations
Parameter Value ASCE 7-05 Ref.
Soil Site Class D Section 11.4.2
0.2 Sec. Spectral Response Acceleration SS 0.18 Figure 22-1
1.0 Sec. Spectral Response Acceleration S1 0.04 Figure 22-2
Site Coefficient Fa 1.6 Table 11.4-1
Site Coefficient Fv 2.4 Table 11.4-2
Modified 0.2 Sec. Spectral Response Acceleration SMS 0.288
Modified 1.0 Sec. Spectral Response Acceleration SM1 0.096
Design 0.2 Sec. Spectral Response Acceleration SDS 0.192
Design 1.0 Sec. Spectral Response Acceleration SD1 0.064
T0 Sec. 0.067
TS Sec. 0.333
TL Sec. 4 Figure 22-15
Total Height ft 72
Ct value for approximate period calculation 0.016 Table 12.8-2
x value for approximate period calculation 0.90 Table 12.8-2
Approximate Fundamental Period Ta Sec. 0.75
Design Spectral Response Acceleration Sa 0.085
Importance Category I,II
Importance Factor I 1.0 Table 11.5-1
Seismic Design Category B Table 11.6-1, 11.6-2
Seismic Force-Resisting System
Response Modification Coefficient R 3 Table 12.2-1
Analysis Method
Seismic Response Coefficient Cs 0.0284
Total Weight W (kip) 12,902
Base Shear V (kip) 366.4
Equivalent Lateral Force
Ordinary RC moment frame
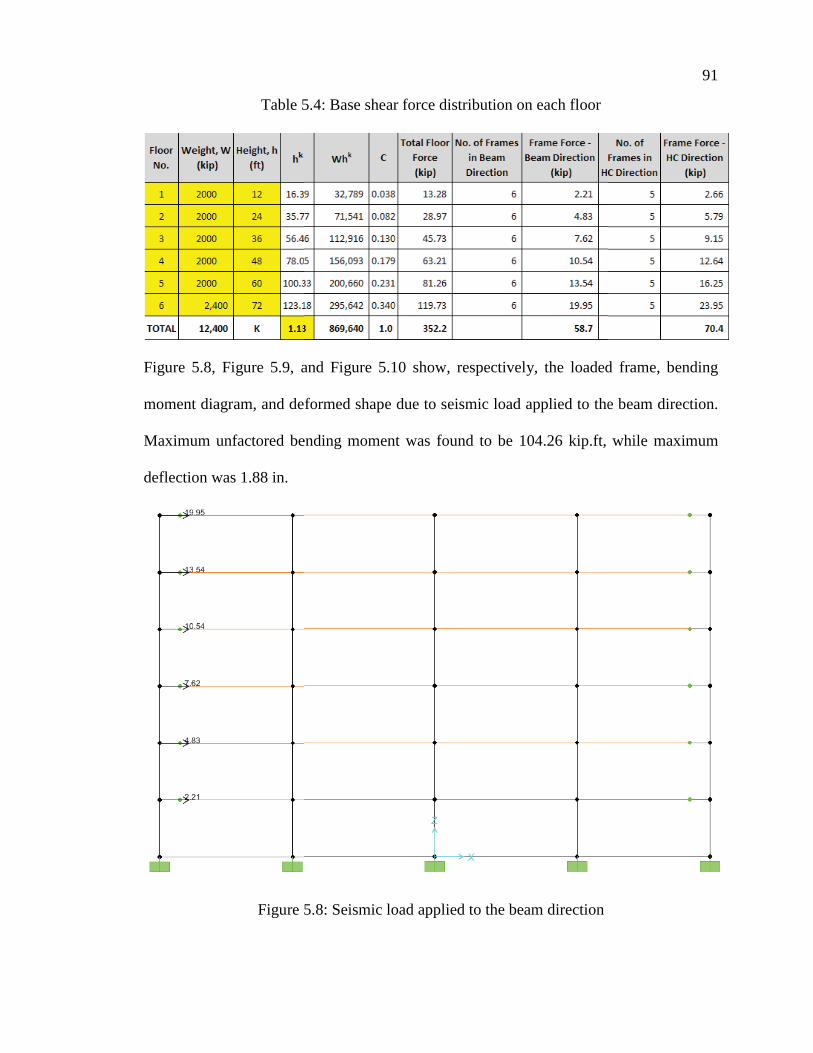
Table 5
Figure 5.8, Figure 5.9, a
moment diagram, and def
Maximum unfactored ben
deflection was 1.88 in.
Figure 5
5.4: Base shear force distribution on each floor
, and Figure 5.10 show, respectively, the loaded
deformed shape due to seismic load applied to the
bending moment was found to be 104.26 kip.ft,
5.8: Seismic load applied to the beam direction
91
ed frame, bending
the beam direction.
ft, while maximum

Figure 5.9: Bend
Figure 5.10: Def
ending moment due to seismic load in the beam di
eformed shape due to seismic load in the beam di
92
direction
direction

Figure 5.11, Figure 5.12,
moment diagram, and de
Four hollow cores plank
element that can resist
released). Maximum unf
maximum deflection was
Figure
Figure 5.12: Be
, and Figure 5.13 show, respectively, the loaded
deformed shape due to seismic load applied to th
nks around the column (i.e. column strip) mod
st negative moment only (i.e. positive moment
nfactored bending moment was found to be 1
as 1.36 in.
re 5.11: Seismic load applied to the HC direction
Bending moment due to seismic load in the HC dir
93
ed frame, bending
the HC direction.
odeled as a frame
ent resistance was
128 kip.ft, while
direction

Figure 5.13: D
5.3.1.1 Story Drift
A. Story Drift Determin
The story Drift was determ
contains the displacement
force in the beam directio
earthquake displacement
computed from �x are also
plan irregularity, the drift
earthquake displacement a
earthquake displacement a
Deformed shape due to seismic load in the hc dire
ination
ermined according to ASCE 7-05 section 12.8.6. T
ents �xe obtained from the elastic analyses using th
tion and HC direction. The table also contains the
nt �x computed by equation �x = Cd* �xe/I. The inte
lso contained in the table. For this structures that d
ift at story level (X) is determined by subtracting t
nt at the center of mass at the bottom of the story f
nt at the center of mass at the top of the story.
94
irection
Table 5.5
the design seismic
e design
nterstory drifts �
t doesn’t have
g the design
y from the design

95
Table 5.5: Lateral displacements and inter-story drifts due to seismic force in beam
direction and HC direction
The design story drifts � must not exceed the allowable story drift �a. For seismic
occupancy category II, �a = 0.020hsx. Thus for 12 ft story heights, �a = 0.020 x 12 x 12 =
2.88 in. It is evident from Table 5.5 that for all stories, the lateral drifts obtained are less
than the limiting values.
5.3.2 High Seismicity Zone
The 0.2 sec. and 1.0 sec. spectral response acceleration used in the analysis were chosen
for the San Francisco, CA. Table 5.6 shows the base shear force calculations for three
story frame with references to the ASCE 7-05 sections, tables and figures, while Table
5.7 shows the force distribution on each floor For three-story building.
Story�xe, (in.) Beam
Direction�xe, (in.) HC
DirectionI Cd
�x, (in.) Beam Direction
�x, (in.) HC Direction
�, (in.) Beam Direction
�, (in.) HC Direction
6 1.87 1.36 4.675 3.4 0.5 0.325
5 1.67 1.23 4.175 3.075 0.7 0.5
4 1.39 1.03 3.475 2.575 0.925 0.65
3 1.02 0.77 2.55 1.925 1.025 0.75
2 0.61 0.47 1.525 1.175 1 0.75
1 0.21 0.17 0.525 0.425 0.525 0.425
2.51

96
Table 5.6: Base shear force calculations
Table 5.7: Base shear force distribution on each floor
Parameter Value ASCE 7-05 Ref.
Soil Site Class D Section 11.4.2
0.2 Sec. Spectral Response Acceleration SS 1.5 Figure 22-1
1.0 Sec. Spectral Response Acceleration S1 0.61 Figure 22-2
Site Coefficient Fa 1 Table 11.4-1
Site Coefficient Fv 1.5 Table 11.4-2
Modified 0.2 Sec. Spectral Response Acceleration SMS 1.5
Modified 1.0 Sec. Spectral Response Acceleration SM1 0.915
Design 0.2 Sec. Spectral Response Acceleration SDS 1
Design 1.0 Sec. Spectral Response Acceleration SD1 0.61
T0 Sec. 0.122
TS Sec. 0.610
TL Sec. 16 Figure 22-15
Total Height ft 36
Ct value for approximate period calculation 0.016 Table 12.8-2
x value for approximate period calculation 0.90 Table 12.8-2
Approximate Fundamental Period Ta Sec. 0.40
Design Spectral Response Acceleration Sa 1.000
Importance Category II
Importance Factor I 1.0 Table 11.5-1
Seismic Design Category D Table 11.6-1, 11.6-2
Seismic Force-Resisting System
Response Modification Coefficient R 8 Table 12.2-1
Analysis Method
Seismic Response Coefficient Cs 0.1250
Total Weight W (kip) 6,400
Base Shear V (kip) 800.0
Equivalent Lateral Force
Ordinary RC moment frame
����
���������������
�������������� �� ��� �
�����������������
� ��������������������������
����������� ��������������
������
� �������������
�����������
����������� ������������
������
! "### !" !"�## "$�###������� #�!%" !"!�"!������� &������������������������� "#�"#������������������� %��������������������� "$�"$����������������
" "### "$ "$�## $'�###������� #�(#( "$"�$"������� &������������������������� $#�$#������������������� %��������������������� $'�$'����������������
( "$## (& (&�## '&�$##������� #�%$% $(&�(&������� &������������������������� )"�)(������������������� %��������������������� ')�")����������������
���*+ ������������� , � �� � ��������� � ���� ��� ���������� ��� �������������������� �� �����������������

97
The maximum unfactored positive and negative bending moments were found to be 196
kip. ft and 200.6 kip.ft, and maximum deflection was 1.76 in. in the beam direction, while
in the HC direction the maximum negative moment was 257.82 kip.ft and maximum
deflection was 1.34 in.
5.3.2.1 Story Drift
A- Story Drift Determination
Table 5.8 contains the displacements �xe obtained from the elastic analyses using the
design seismic force in the beam direction and HC direction. The table also contains the
earthquake displacement �x. The inter-story drifts � computed from �x are also contained
in the table.
Table 5.8: Lateral displacements and inter-story drifts due to seismic force
The design story drifts � must not exceed the allowable story drift �a. For seismic
occupancy category II, �a = 0.020hsx. Thus for 12 ft story heights, �a = 0.020 x 12 x 12 =
2.88 in. It is evident from Table 5.8 that not all the cells in all stories match the limiting
values. The lateral drifts in the shaded cells are higher than the allowable value
The stiffness of the building should be increase, in order to make the lateral drifts values
less than the limiting value. Increasing the stiffness will be done in two ways; 1) increase
the beam depth to 13 in. and 2) increase column dimension to 24 in. x 24 in. The
following subsection will present the lateral displacement and drift for each way.
Story �xe, (in.) Beam Direction
�xe, (in.) HC Direction I Cd
�x, (in.) Beam Direction
�x, (in.) HC Direction
�, (in.) Beam Direction
�, (in.) HC Direction
3 1.76 1.34 9.68 7.37 3.3 2.31
2 1.16 0.92 6.38 5.06 3.96 3.025
1 0.44 0.37 2.42 2.035 2.42 2.035
1 5.5

98
A-1 Increasing the Beam depth
The beam depth was increased from 10 in. to 13 in, in order to increase the building
stiffness. Table 5.9 shows the lateral displacement and inter-story drifts due to the
seismic force in both HC and beam direction
Table 5.9: Lateral displacements and inter-story drifts due to seismic force
It is evident from Table 5.9 that not all the cells in all stories match the limiting value.
The lateral drift in the green cell is higher than the allowable value.
A-2 Increasing the column dimension
When increasing the column dimension the maximum unfactored positive and negative
bending moments were found to be 149 kip. ft and 150.53 kip.ft, and maximum
deflection was 1.3 in. in the beam direction, while in the HC direction the maximum
negative moment was 191.18 kip.ft and maximum deflection was 1 in.. Table 5.10 shows
the lateral displacement and inter-story drifts due to the seismic force in both HC and
beam direction when changing the column dimension to 24 in. x 24 in.
Table 5.10: Lateral displacements and inter-story drifts due to seismic force
It is evident from Table 5.10 that all the cells in all stories match the limiting value. The
lateral drifts in cells are lower than the allowable value.
Story �xe, (in.) Beam Direction
�xe, (in.) HC Direction I Cd
�x, (in.) Beam Direction
�x, (in.) HC Direction
�, (in.) Beam Direction
�, (in.) HC Direction
3 1.46 1.04 8.03 5.72 2.585 1.65
2 0.99 0.74 5.445 4.07 3.3 2.42
1 0.39 0.3 2.145 1.65 2.145 1.65
1 5.5
Story �xe, (in.) Beam Direction
�xe, (in.) HC Direction I Cd
�x, (in.) Beam Direction
�x, (in.) HC Direction
�, (in.) Beam Direction
�, (in.) HC Direction
3 1.3 1 7.15 5.5 2.695 1.87
2 0.81 0.66 4.455 3.63 2.805 2.31
1 0.3 0.24 1.65 1.32 1.65 1.32
1 5.5

99
5.4 Load Combination for Low Seismicity Zone
Table 5.11 summarizes the 2-D analysis results of six-story building in both beam and
HC directions under wind and seismic loads. To evaluate the adequacy of the proposed
design to resist these loads, Table 5.12 lists the two load combinations considered in the
design of the example building and compares them versus the factored resistance. The
positive and negative moment capacities of the composite FS10 at the end section, and
the negative moment capacity of composite HC at the end section were calculated using
strain compatibility. The HC capacities were calculated for the four hollow core planks
forming the column strip effective in lateral load resistance (i.e 4x56.36 = 225.44 kip.ft).
It should be noted that the positive moment capacity of the FS 10 at end section should
include the permanent negative moment caused by the topping weight multiplied by 0.9
as it opposes the positive moment caused by lateral loads. Table 5.12 indicates that the
proposed design of the FS 10 and HC has adequate resistance to lateral load for the
example building shown in Figure 4.1. However, additional lateral load resisting system
(e.g. shear wall or moment resisting frame) might be needed in the hollow core direction
when different building configurations are used and/or more severe loading conditions
are applied.
Table 5.11: Summary of lateral load analysis results
-��������� ���
�������������
-��������� ���
�������������
����������� $"�( #�(.) !"' !�(&
������������� $!�!! #�&%$ !#$�"& !�''
���/�+�/ 0�������+�/

100
Table 5.12: Comparison of factored lateral load and resistance
5.5 Load Combination for High Wind Zone
Table 5.13 summarizes the 2-D analysis results of three-story building in both beam and
HC directions under seismic loads. To evaluate the adequacy of the proposed design to
resist these loads, Table 5.14 lists the load combination considered in the design of the
example building and compares them versus the factored resistance. Table 5.14 indicates
that the proposed design of the FS 10 has inadequate negative moment resistance to
lateral load for six-story of the example building shown in Figure 4.1. Therefore, addition
negative reinforcement needs to be added to the design of the beam-column connection.
Figure 5.14 shows the beam-column connection reinforcement for high-moderate windy
zone. The required area of reinforcement was found to be 13.61 in2 (15 # 8 + 4 #6),
which was 18.2 % higher than low-moderate seismicity zone connection. The connection
was designed to carry factored negative nominal moment and factored positive nominal
moment equal to 461 kip.ft and 196.6 kip.ft as shown in Table 5.15
Table 5.13: Summary of lateral load analysis results
�1�����
������2� 3����2� ������2�
���/�4�� ���5�� ��5�� �+ �($"�% &$�$" �&)�%'
0�������4�� ���5�� ��6�5�� ��+ �('! !#"�"& �!"'
������/�7��������� �$"% !%% �""%�$$
��6�� �� �� ��
�0�����+�/���8������
-��������� ���
�������������
����������� !!'�! !�!
������������� !!$�( !�'
���/�+�/

101
Table 5.14: Comparison of factored lateral load and resistance
Figure 5.14: Beam-Column connection for high-moderate windy zone
Table 5.15: Comparison of factored lateral load and resistance for high-moderate windy
zone.
�1�����
������2� 3����2� ������2�
���/�4�� ���5�� ���5�� ��+ � ��� � ��� �
������/����������� � � �
��6�� �� �� ��
+�/���8�������0�����
7"4"
2"10"
3" 15#8
HSS 10x8x12
3x38" plate
4x38" plate
6"
3x2x38"
4'
1'-8"
19-0.6"
6#42"
3"
�1�����
������2� 3����2� ������2�
���/�4�� ���5�� ���5�� ��+ � ��� � ��� �
������/����������� � �� �
��6�� �� �� ��
+�/���8�������0�����

102
5.6 Load Combination High Seismicity Zone
Table 5.16 summarizes the 2-D analysis results of three-story building in both beam and
HC directions under seismic loads. To evaluate the adequacy of the proposed design to
resist these loads, Table 5.17 lists the load combination considered in the design of the
six-story example building and compares them versus the factored resistance. Table 5.8
and Table 5.17 indicates that the proposed design of the FS 10 and HC has 1) higher drift
values than the allowable value, and 2) inadequate resistance to lateral load for three-
story of the example building shown in Figure 4.1.
Table 5.16: Summary of lateral load analysis results
Table 5.17: Comparison of factored lateral load and resistance
A- Increasing the Column Dimension
Table 5.18 summarizes the 2-D analysis results of three-story building in both beam and
HC directions under seismic loads when increasing the column dimension to 24 in. x 24
in. Table 5.19 lists the load combination considered in the design of the example building
-��������� ���
�������������
����������� "%)�' !�($
������������� "##�& !�)&
0�������+�/
�1�����
������2� 3����2� ������2�
0�������4�� ���5�� ��6�5�� ��+ �� � �� � � �
������/�7��������� �$"% !%% �""%�$$
��6�� �� �� ��
�0�����+�/���8������

103
and compares them versus the factored resistance. Table 5.10 and Table 5.19 indicates
that the proposed design of the FS 10 and HC has 1) drift values lower than the allowable
value, and 2) inadequate resistance to lateral load for three-story of the example building
shown in Figure 4.1. Addition negative reinforcement need to be added for both beam-
column connection and HC connection to be adequate for lateral load.
Table 5.18: Summary of lateral load analysis results
Table 5.19: Comparison of factored lateral load and resistance
In order to modify the connections to be work in high-moderate seismicity zone, Figure
5.15 shows the beam-column connection reinforcement details. All the negative
reinforcement (pocket and topping bars) was changed to # 8. Also topping mesh was
changed from D11@6 in. to D16@6 in. Table 5.20 shows the load combination
considered in the design of the three-story and compares them versus the modified
factored resistance.
-��������� ���
�������������
����������� !.!�!' !
������������� !%#�%( !�(
0�������+�/
�1�����
������2� 3����2� ������2�
0�������4�� ���5�� ��6�5�� ��+ �� �� �� � � � �
������/�7��������� �$"% !%% �""%�$$
��6�� �� �� ��
+�/���8�������0�����
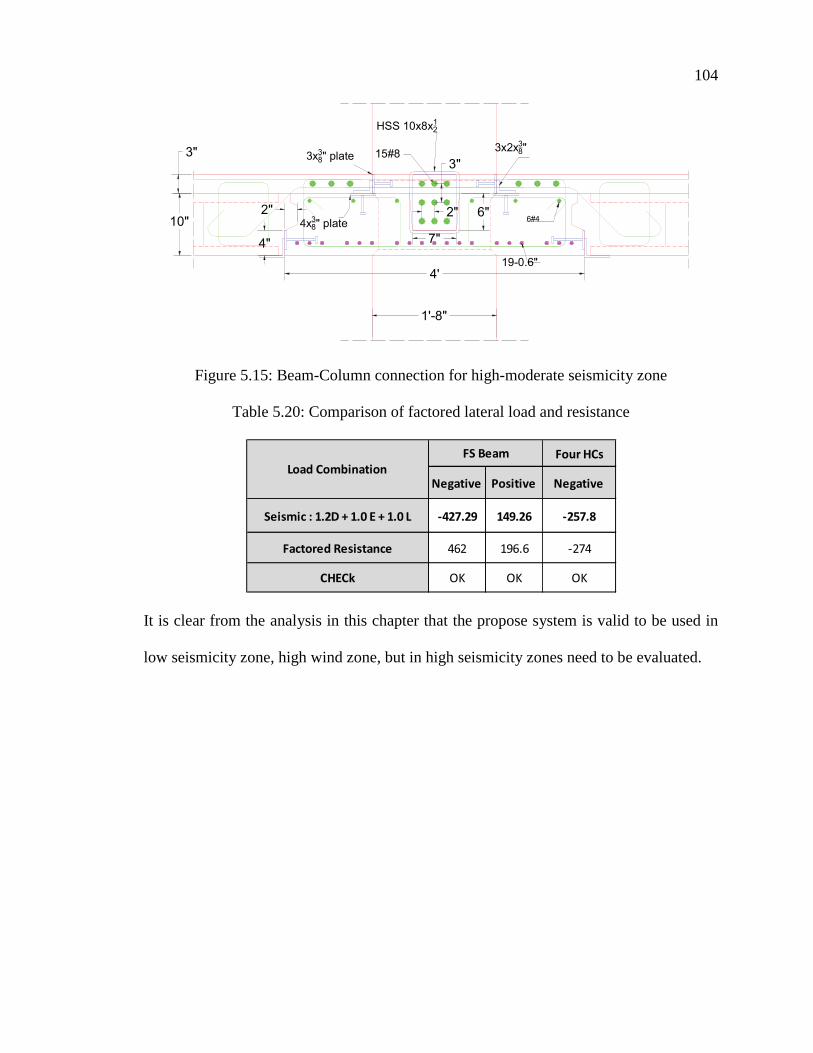
104
Figure 5.15: Beam-Column connection for high-moderate seismicity zone
Table 5.20: Comparison of factored lateral load and resistance
It is clear from the analysis in this chapter that the propose system is valid to be used in
low seismicity zone, high wind zone, but in high seismicity zones need to be evaluated.
7"4"
2"10"
3" 15#8
HSS 10x8x12
3x38" plate
4x38" plate
6"
3x2x38"
4'
1'-8"
19-0.6"
6#42"
3"
�1�����
������2� 3����2� ������2�
0�������4�� ���5�� ��6�5�� ��+ �� �� �� � � � �
������/�7��������� $&" !.&�& �")$
��6�� �� �� ��
+�/���8�������0�����

105
Chapter 6
TESTING OF FLAT SOFFIT FLOOR SYSTEM COMPONENTS AND
CONNECTIONS
6.1 Introduction
Experimental investigations were carried out to evaluate the constructability and
structural performance of the developed flat soffit shallow precast floor system. beam-
column connection without corbel, HC-beam connection without ledge, and flat soffit
beam full-scale specimens were tested to evaluate the following:
o Flexural capacity of the beam for resisting gravity and lateral loads.
o Flexural capacity of composite hollow core planks for resisting lateral loads.
o Shear capacity of the beam-column connection without corbel
o Shear capacity of the beam-HC connection without ledge
6.2 Beam-column Connection without Corbel
This section presents the experimental investigation carried out to evaluate the
performance and capacity of the beam-column connection without corbel. The dimension
of the beam-column connection without corbel presented in this test is different from the
dimension used in the flat soffit-building example. Despite of that difference, the design
and the test prove the concepts. A full-scale specimen present approximately 20 ft x 20 ft
segment of the floor around an interior column as shown in Figure 6.1. Specimen
components, which include two precast beam segments, one column, and eight HC
planks, were fabricated by Concrete Industries (CI) Inc., Lincoln, NE and erected and
tested at the Structural Laboratory of Peter Kiewit Institute (PKI) Omaha, NE.

106
Figure 6.1: Plan view of the precast components of test specimen
The following subsection describes in details the specimen design, fabrication, and
testing
6.2.1 Specimen design
The connection was designed for an interior column supporting area of 32 ft by 34 ft and
100 psf of live load. Based on the design procedure shown in chapter 4, 5 and appendix
A, the design of the beam column connection without corbel in terms pocket
reinforcement, and topping reinforcement is presented in Table 6.1. According to the
reinforcement, the connection able to carry shear force equal to 345 kip, while the
demand was 308.03 kip.
Table 6.2 compares the positive and negative moment capacities of composite and non-
composite sections (�Mn ), versus the ultimate moments (Mu) obtained from the analysis.

107
Figure 6.2 shows the plan view of the beam end, while Figure 6.3 illustrious the detailing
of the precast column. Figure 6.4 shows the Composite beam and its connection with the
column
Table 6.1: Reinforcement used in beam-column connection without corbel
Table 6.2: Comparison of Demand and Capacity at Critical Sections.
Figure 6.2: Plan View of the Beam End
Number Area (in2) Size
6 0.44 #6
9 0.79 #8
Negative Moment Section Reinforcement
Pocket Reinforcement
Topping Reingforcement
Capacity �Mn
(kip.ft)Demand �Mn
(kip.ft) Check
�"#!�. �!!)�' Ok
�&##�) �&##�$ Ok
138 115 OK
162.9 126 OK
Beam Negative Composite Section
HC Negative Composite section
Beam Positive Composite section
Section
Beam Negative Non-composite Section

108
Figure 6.3: Detailing of the precast column
412"
6"
11"
1'
1'D 2"
D 1 1/4"3"
1'-6" 1"
1"
HSS 10x8x12"
PL 18x3x12"
3"
9"
D 1/2"
7"9"
10"
5'-7"
C C
Section C-C
1'-8"
1'-8"
234"
134"
#4@12
4#v
11"41
2"
1'-5"
7'
14'
1'-8"

109
Figure 6.4: Composite beam and its connection with the column
Lateral loads was considered in the analysis include the wind and seismic loads
calculated as shown above in chapter 5. Table 6.3 summarizes the 2-D analysis results of
the building in both beam and HC directions under wind and seismic loads. To evaluate
the adequacy of the proposed design to resist these loads, Table 6.4 lists the two load
combinations considered in the design and compares them versus the factored resistance..
Table 6.4 indicates that the proposed design of the beam and HC has adequate resistance
to lateral load.
8"
26#4
2L 3x3x38"
D11@6"
End-Span Section
9#8
HSS10x8x12"
3"
6#6 8#44#61'-5"
3'-212"
1'-212"
10"
912"
Ø2"
#4@12"
11"
10"712"
3'-212"
Ø2"
#4@12"
9"
#4@12" Ø2"
3'-212"
3"
412"
1'-8"
7"
9"
#3@6"
#3@6"
Ø112"

110
Table 6.3: Summary of Lateral Load Analysis Results
Table 6.4: Comparison of Factored Lateral Load and Resistance
6.2.2 Specimen Fabrication and Erection
Specimen components (two beams, one column, and eight HC planks) were fabricated at
Concrete Industries Inc as shown in Appendix B. Below are the steps followed in the
erection of the specimen. Appendix C shows the erection process pictures
Step 2) To achieve the stability of the column under the loads, column was erected inside
a reinforced concrete base that is 4 ft x 4 ft x 3.5 ft.
Step 3) Installed the temporary corbels.
Step 4) The beams were placed on each side of the column so that the beams align to
each other and the beam pockets align to the column opening
Step 5) Two 38 in. long angles (3 in. x 2.5 in. x ½ in.) were welded to the beam end
plates and column side plates.
���/�+�/ 0�������+�/
-��������� ���
-��������� ���
����������� $% !"&
������������� $) !!%
������2� ������2�
������!�"�����!�&�����!�#�� �$.$�& �)"
��� !����!�"�����!�#�"���!�#�� �%($�$ �!"&
������/�7��������� �� �� �
��6�, �� ��
+�/���8����������� �1�����

111
Step 6) Four HC planks were erected on each side of the beam.
Step 7) First layer of reinforcement 6#6 bars inside closed stirrups of #3@6 in. was
placed in the beam pocket through the column opening.
Step 8) The HC keyways, beam pockets, and column opening were grouted using SCC
Grout.
Step 9) The 9#8 bars required to provide the beam continuity for live load and the D6 @6
in. WWR required to provide HC continuity for lateral load were placed
Step 10) The topping concrete was poured using a ready mix concrete with 8 in. slump
Step 11) After the topping concrete was cured and hardened, the temporary corbel angles
were removed and the specimen was ready for testing.
6.2.3 Material Properties
Table 6.5 shows the mix design for the precast, grout and topping concrete used in the
production of the second specimen. Figure 6.5 shows the gain of compressive strength
with time for the precast, grout, and topping concrete up to the time of testing.
Table 6.5: Concrete mixes design
Precast Components Mix Grout Mix Topping Mix
Portland Cement Type I /II 632* 650 611Fly Ash, Class C 100 100 -Limestone 1/2'' 1311 1265 950
47B Sand and Gravel 1449 1875 2190Total Water 292 225 275
High Range Water Reducer, HRWR, Glenium 3400, Master
Builders10 oz/cwt - -
MaterialsWeight (lb) per cubic Yards
* Type III cement

112
Figure 6.5: Concrete strength gain with time
Table 6.6 lists the actual and specified compressive strength of the concrete used in the
production of the specimen components at the time of testing. This table indicates that the
actual compressive strength of all components at the time of testing was satisfactory as it
exceeded the specified strength.
Table 6.6: Specified and actual concrete compressive strength at testing
6.2.4 Test Setup and Procedures
Testing the beam-column connection without corbel specimen was performed on June 7,
and 8, 2010. The test program includes the following four tests:
1- HC Negative Moment Capacity
0
2,000
4,000
6,000
8,000
10,000
12,000
0 5 10 15 20 25 30
Stre
ngth
(psi)
Age (days)
Precast
Grout
Topping
Components Actual strength (psi) Specified strength (psi)
Column 10,500 8,000Grout 6,500 4,000
Topping 5,200 3,500

113
2- Beam Negative Moment Capacity
3- Beam Positive Moment Capacity
4- Beam-Column Connection Shear Capacity
6.2.4.1 HC Negative Moment Capacity
The purpose of this test is to evaluate the negative moment capacity of the composite HC
section for resisting lateral loads. Figure 6.6 shows the test setup, where HC planks were
loaded at the unsupported end while clamping the other end to maintain specimen
stability. Testing was performed by applying a uniform load on the cantilevered HC at 5
ft from the center of the column up to the capacity, while measuring the deflection at the
cantilevered end.
Figure 6.6: Test setup for evaluating HC negative moment capacity
5'
5'
5'
6'

114
Figure 6.7 plots the load-deflection relationship of this test. This plot indicates that the
four composite HC planks were able to carry 61 kip, which corresponds to a total
negative moment capacity of 250 kip.ft (including the moment due to the weight of the
cantilevered HC). The demand for resisting lateral loads in the example building is 126
kip.ft, which is 50% less than the actual capacity. Also, the nominal capacity of the
composite HC planks predicted using strain compatibility approach was found to be 181
kip.ft, which is significantly below the actual capacity. Figure 6.8 shows the cracking of
the topping concrete under ultimate loads. The specimen was not loaded to failure to
maintain its integrity for further testing.
Figure 6.7: Load-deflection curve for the HC negative moment capacity test
0
10,000
20,000
30,000
40,000
50,000
60,000
70,000
0.00 0.01 0.02 0.03 0.04 0.05 0.06 0.07 0.08 0.09 0.10 0.11 0.12
Load
, lb
Deflection, in.

115
Figure 6.8: Cracking of the topping concrete at HC ultimate load
6.2.4.2 Beam Negative Moment Capacity
The purpose of this test is to evaluate the negative moment capacity at the end section of
the composite beam. Figure 6.9 shows the test setup, where the load was applied at the
unsupported end of the beam while clamping the other end to prevent tipping over. One
400 kip jack was used to apply a concentrated load on the beam at 9 ft from the centerline
of the column, up to the nominal capacity, while measuring the deflection of the
cantilevered end.

116
Figure 6.9: Test setup for evaluating beam negative moment capacity
Figure 6.10 shows the load-deflection relationship for this test. This plot indicates that the
beam was able to carry a load up to 76 kip, which corresponds to a negative moment
capacity at the critical section of 672 kip.ft (including the moment due to the weight of
the cantilevered beam). The ultimate factored negative moment due to topping weight
and live load was found to be 600 kip.ft, which is 11% below the actual section capacity.
Also, the nominal capacity of the composite beam predicted using strain compatibility
approach was found to be 667 kip.ft, which is very close to the actual capacity. Figure
6.11 shows the cracking of the top flange at the critical section under ultimate loading.
9'
10'
9'
9'
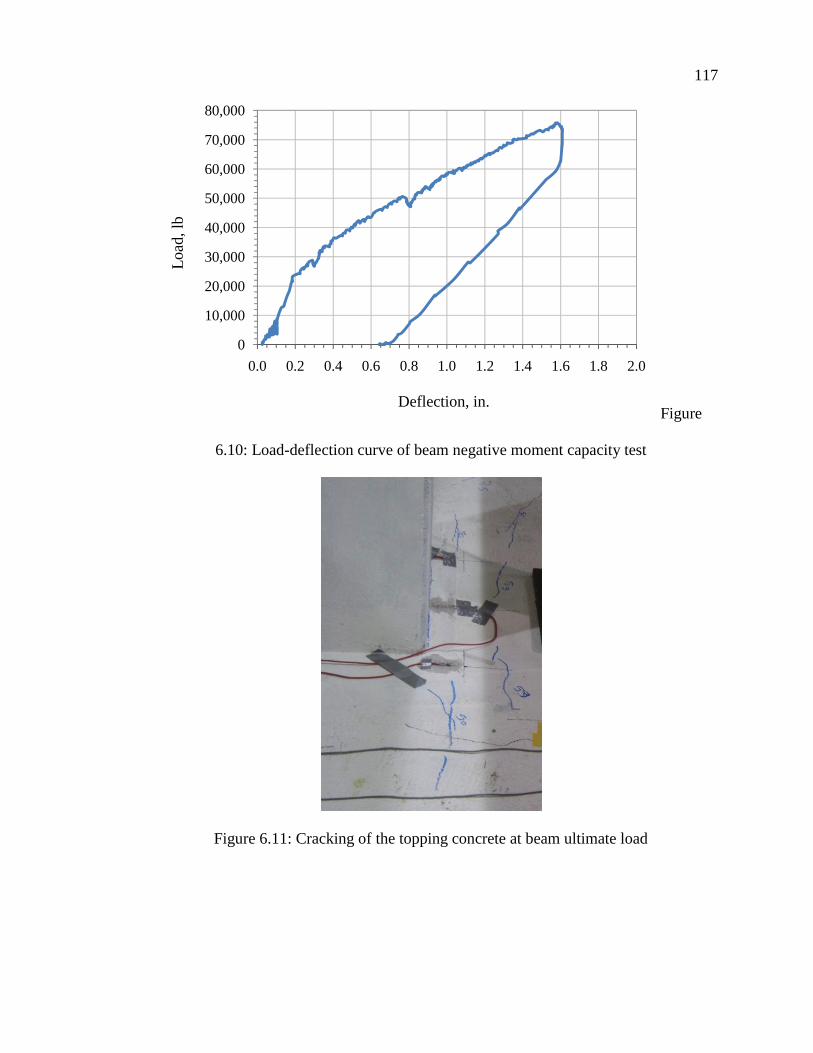
117
Figure
6.10: Load-deflection curve of beam negative moment capacity test
Figure 6.11: Cracking of the topping concrete at beam ultimate load
0
10,000
20,000
30,000
40,000
50,000
60,000
70,000
80,000
0.0 0.2 0.4 0.6 0.8 1.0 1.2 1.4 1.6 1.8 2.0
Load
, lb
Deflection, in.

118
6.2.4.3 Beam Positive Moment Capacity
The purpose of this test is to evaluate the positive moment capacity of the beam end
section for lateral load resistance. Figure 6.12 shows the test setup, where the load was
applied upwards at the cantilevered end of the SIT beam. One 400 kip jack was used to
apply a concentrated load at 9 ft from the centerline of the column up to the nominal
positive moment capacity of the end section. Upward movements of the cantilevered end
were recorded while loading.
Figure 6.12: Test setup for evaluating the SIT beam positive moment capacity
9'
10'
9'
9'
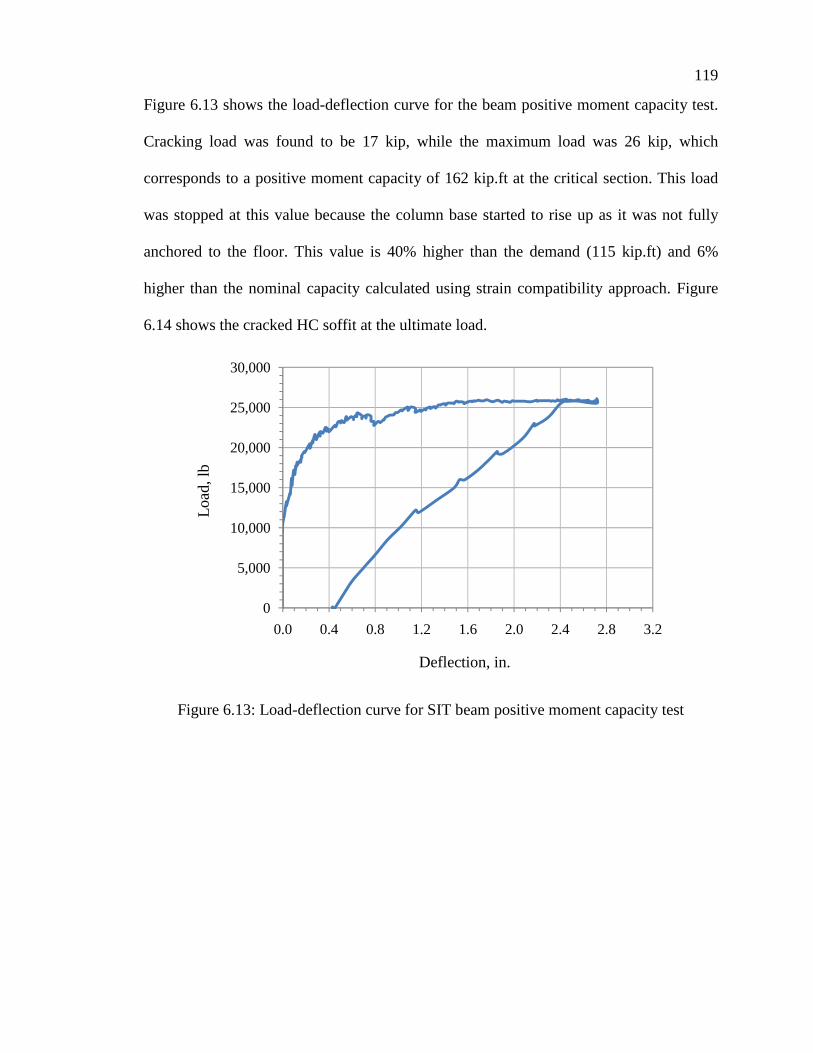
119
Figure 6.13 shows the load-deflection curve for the beam positive moment capacity test.
Cracking load was found to be 17 kip, while the maximum load was 26 kip, which
corresponds to a positive moment capacity of 162 kip.ft at the critical section. This load
was stopped at this value because the column base started to rise up as it was not fully
anchored to the floor. This value is 40% higher than the demand (115 kip.ft) and 6%
higher than the nominal capacity calculated using strain compatibility approach. Figure
6.14 shows the cracked HC soffit at the ultimate load.
Figure 6.13: Load-deflection curve for SIT beam positive moment capacity test
0
5,000
10,000
15,000
20,000
25,000
30,000
0.0 0.4 0.8 1.2 1.6 2.0 2.4 2.8 3.2
Load
, lb
Deflection, in.

120
Figure 6.14: Cracking of the HC soffit at ultimate load
6.2.4.4 Beam-Column Connection Shear Capacity
The purpose of this test is to evaluate the shear capacity of the modified Beam-column
connection without corbel. Figure 6.15 shows the test setup, where the beams are loaded
symmetrically at 3 ft from the centerline of the column on each side similar to
corresponding test of the first specimen. The other end of the beams and HC planks were
simply supported to stabilize the specimen. Two 400-kip loading jacks and two 12 in.
square loading plates were used to apply the load on the top surface of the concrete
topping up to failure.

121
Figure 6.15: Test setup for beam-column connection shear capacity
Figure 6.16 shows load-deflection curve of that test. This curve indicates that the
maximum load was 704 kip, which results in a shear force (627 kip) that is
significantly higher than demand of 32 ft x 32 ft bay size loaded with 100 psf live load
(308 kip) and the capacity calculated based on shear friction theory (460 kip). It should
be noted that this test was performed on a cracked specimen as the beam was already
tested for both positive and negative moment continuity. Figure 6.17 shows the failure
mode of the specimen
3'
10'
3'
3'
3'
9' 9'

122
Figure 6.16: Load-deflection curve for testing beam-column connection
Figure 6.17: Failure of beam-column connection
0
100,000
200,000
300,000
400,000
500,000
600,000
700,000
800,000
0.0 0.1 0.2 0.3 0.4 0.5 0.6 0.7 0.8 0.9 1.0
Load
, lb
Deflection, in.
North Deflection gauge
South Deflaction gauge

123
Table �6.7 summarizes the demand, theoretical capacity, and measured capacity of the
beam-column connection without corbel test. It also presents the ratios of experimental-
to-theoretical capacity for each test. Based on the test results summarized in Table �6.7,
the following conclusions can be made:
1. The proposed beam continuity system has adequate flexural capacity at the
positive and negative moment sections to resist both gravity and lateral loads.
This capacity can be accurately predicted using strain compatibility approach.
2. The proposed beam-column connection without corbel has adequate capacity to
carry gravity loads even after cracking. This capacity can be accurately predicted
using shear friction theory.
3. The proposed composite HC continuity system has adequate negative moment
capacity to resist lateral loads. This capacity can be accurately predicted using
strain compatibility approach.
6.2.5 Beam-Column Connection without Corbel Application
After the beam-column connection test was done and all the test results have been pass
the design values, the concept was used in real building. Farmer’s mutual building is a
building under construction, which used the same technics and design. The building
locates at 1220 Lincoln Mall, Lincoln, NE 68508 (the southwest corner of 13th St. and K
St). The design of the building was prepared by Concrete Industries, Inc. Nebraska and e.
Construct USA, LLC, Nebraska. Figure 6.18 and Figure 6.19 shows elevation view for
that building and one connection details used in that building. Also Figure 6.20shows
some pictures for the building under construction.

124
Figure 6.18: Architectural elevation of the farmer’s mutual building an
dN
omin
al
Cap
acity
Mea
sure
d C
apac
ityM
2618
125
0
0066
767
2
515
316
2
0846
062
7
Ta
ble
6.7
:
Su
m
ma
ry

125
Figure 6.19: connection details

126
Figure 6.20: Under construction pictures for Farmer’s mutual building
6.3 HC-beam Connection without Ledge
This section presents the experimental investigation carried out to evaluate the shear
capacity of the HC-beam connection without ledge constructability and its performance.
In this test, the full-scale specimen consisted of 28 ft long beam that is 10 in. thick and 48
in. wide and twelve 6 ft long HC planks that are 10 in. thick and 48 in. wide each. The
beam was supported by three roller supports that are 13.75 ft center to center. That test
represent approximately 16 ft x 28 ft segment of the floor around an interior beam as
shown in Figure 6.21. Specimen components, which include precast beam segment, and

127
12 HC planks, were fabricated by EnCon, Denver, Colorado and Concrete Industries (CI)
Inc., Lincoln, NE respectively and erected and tested at the Structural Laboratory of Peter
Kiewit Institute (PKI) Omaha, NE.
6.3.1 Specimen Design
The experimental test is focus in four different beam-HC connections. In order to
investigate all these connection in the same test, the flat soffit beam was fabricated with
two different sides; 1) side with shear key, and 2) side with hidden corbel. The temporary
supports for HC planks were erected using two alternatives: 1) ¾ in. coil inserts
embedded in the beam during the fabrication process to connect the threaded rods
holding 5 ft long 4 in. x 4 in. x1/8 in. HSS and; 2).Two steel angles 4 in x 3 in. x 3/8 in.
were welded to side beam plates which installed during the fabrication process to acts as
temporary supports and theses angles will not be moves at final stages. Each one from the
two alternatives temporary HC support was used in half of flat soffit beam span. The HC
have 1 ft slots in the top surface of two holes as shown in Figure 6.22. The HC key way
and the two slots allowed placing the connection reinforcements.

128
Figure 6.21: Plan view of the precast components of test specimen
28'
6'
4'
4'
10'
4'
3'
2'-8"
6'
3'
15'
Concrete Block
Roller Support
BeamLedge
3'
4'
15'
6' 6'
ShearKey
10'
15'
3'
2'
12'
6"
TemporarySupports2'
5'
A A
B B

129
Figure 6.22: Dimensions and details of the HC specimen
Based on the design procedure shown in chapter 5 and appendix A, the HC- beam
connection reinforcement were found to be #5 hat bars and #3 loop bars as shown in
Figure 6.23 , which installed in each HC key way and HC slots. The factored nominal
shear capacity of the HC- beam connection using shear friction theory was found 34.875
kip per each hollow core-to-beam connection, while the ultimate shearing force value due
to dead and live loads was 16.5 kip.
Figure 6.24 shows the beam Dimensions and reinforcement details Figure 6.25 shows the
connection details used in that test.
1'
6'
112"11
2"
10"
4'
112"11
2"
338"
138"
738"
214"
358"

130
Figure 6.23: HC-beam connection reinforcement (Hat and Loops bars)
45°3"
45°8"
3'
Ø212"Ø21
2"8"
Ø2"10"
8
28'
4'
A
A
B
B
Section A-A
L4x3x38"
4'
3'-7"
10"5"4"
112"
3"
2"
19-0.6"
#4@12"
7#4
PL3x6x38" every 48"
2-7"x12" studs
2"
1"
4"
3'-4"734" 9"8"
4"
2'-11"
312"
112"

131
Figure 6.24: Dimensions and reinforcement details of the beam of the first specimen
Figure 6.25: Details of the tested four HC-beam connections
The following subsection describes in details the specimen design and fabrication and
tests
4'
3'-7"
10"5"4"
112"
3"
19-0.6"
#4@12"
7#42"
1"
4"
3'-4"734" 9"8"
4"
2'-11"
312"
Section B-B
34" Coil Insert
112"
4"
10"PL3x6x3
8" every 48"2-5"x1
2" studs
212" 2"
1'
2.5#5 per HC
4"
10"
2.5#5 per HC212" 2"
1'
D11@12in. 2.5#4 per HC
C) Shear key without angle
2.5 #4 per HCD11@12"2.5
10.0
12.0
D) Hidden ledge without angle
2.5#5 per HC2.5#4 per HCD11@12in.
L4x3x38"
A) Shear key with angle
2.5#5 per HC 2.5 #4 per HCD11@12"
PL3x6x38" every 48"
2-5"x12" studs
L4x3x38"
B) Hidden ledge with angle

132
6.3.2 Specimen Fabrication and Erection
The beam was fabricated at EnCon, Denver, Colorado and 12 HC planks were fabricated
at Concrete Industries Inc, Lincoln, Nebraska. The beam was reinforced using 19-0.6 in.
diameter strands to investigate the positive moment capacity of the beam. HC planks
were poured during the regular HC production. The beam fabrication pictures will be
presented in appendix D. Below are the steps followed in the specimen erection, while
the pictures of the erection process shown in appendix E.
Step 1) After the beam delivered to the structural lab, the beam was placed on the three
roller supports.
Step 2) The beam was divided into two parts each part 14 ft. In the first half, two steel
angles 3 in. x 4 in. x 3/8 in. are used as beam ledges for supporting HC planks in
construction stage. The two angles are welded to beam side plates, which attached to the
precast beam in the fabrication process. In the second half, HSS tubes 4 in. x 4in. x 0.1/8
in. are used to work as temporary ledges for supporting HC planks. These sections are
connected to the bottom of the precast beam using ¾ in. coil inserts and threaded rods.
Step 3) HC openings were plugged to prevent the flow of concrete inside the HC as
shown in Figure 6.26 especially when a flowable concrete is used
Figure 6.26: Blocking the HC openings before erection

133
Step 4) Six HC planks were erected on each side of the beam as shown. The erection
sequence was set to test the torsional capacity of the beam when loaded from only one
side.
Step 5) Installed beam-HC connection reinforcing such as hat and loop bars
reinforcement. The hat bars connecting the HC planks to the beam are placed over the
beam at the HC keyways and slots. The loops placed in the HC hole opening to
connecting the HC planks to the topping. Thirty-two strain gauges were placed in that
test. Eight strain gauges in each corner, which are classified three in the hat bars (H),
three in the loop bars (L), and two the topping reinforcement (T) as shown in Figure 6.27
Step 6) The HC keyways, HC opening, shear key between the HC and the beam were
grouted. Grout (6 ksi) was delivered from Ready Mix.
Step 7) Welded wire reinforcement mesh was placed over the HC planks to reinforce the
composite topping. D11 @6 in. WWR required to provide HC continuity for lateral load
were placed at the top of the HC.
Step 8) The topping concrete was poured using a ready mix concrete with 8 in. slump.
Step 9) After the topping concrete was cured and hardened, the temporary ledges angles
were removed and the specimen was ready for testing.

6.3.3 Material Properties
Table 6.8 shows the mix
specimen. Figure 6.28 sho
grout, and topping concr
specified compressive stre
components at the time
strength of all componen
specified strength.
Figure 6.27: Strain gauges locations
ties
ix design for the precast, grout and topping concr
shows the gain of compressive strength with time
ncrete up to the time of testing. Table 6.9 lists
strength of the concrete used in the production o
me of testing. This table indicates that the actu
nents at the time of testing was satisfactory as
134
oncrete used in that
ime for the precast,
ists the actual and
on of the specimen
actual compressive
as it exceeded the

135
Table 6.8: Concrete mixes design
Figure 6.28: Concrete strength gain with time
Table 6.9: Specified and actual concrete compressive strength at testing
Precast Components Mix Grout Mix Topping Mix
Portland Cement Type I /II 755* 650 611Fly Ash, Class C 0 100 -Limestone 1/2'' 1620 1265 950
47B Sand and Gravel 1405 1875 2190Total Water 292 225 275
Water Reducer PS 1446 88 oz/cwt - -
MaterialsWeight (lb) per cubic Yards
* Type III cement
01,0002,0003,0004,0005,0006,0007,0008,0009,000
10,000
0 5 10 15 20 25 30
Com
pres
sive S
treng
th (p
si)
Age (Days)
Precast beamGroutTopping
Components Actual strength (psi) Specified strength (psi)Precast 9,390 8,000Grout 8,037 4,000
Topping 5,678 3,500

136
6.3.4 Test Setup and Procedures
Testing the full-scale specimen was performed on January 25, to 31, 2011. The test program includes the following three tests:
1) Testing HC-beam connection
A. Hidden corbel with angle (North-West Side)
B. Shear key with angle (North-East side)
C. Hidden corbel without angle (South-West Side)
D. Shear key without angle (South-East Side)
E. Testing HC-beam connection by loading HC as cantilever
2) Testing the beam flexural capacity by loading at mid-span
6.3.4.1 Testing HC-beam Connection
The purpose of this test is to evaluate the shear capacity of the HC-beam connections
under gravity loads. The HC planks were loaded at their mid-span in one side while
clamping the other side of the beam to maintain specimen stability. Testing was
performed using two jacks applying two concentrated loads to a spread steel beam to
create uniform load on the HC planks at 3 ft away from the HC-beam connection as
shown in Figure 6.29 . Loading continued to failure while measuring the deflection
under the load using potentiometer attached to the soffit of the middle HC plank. The
HC-beam connection was tested in two stages. In the first stage, HC planks were loaded
up to 100 kip (50 kip each side), which creates a shearing force at the connection of 16.5
kip. This value is the ultimate shearing force due to factored dead and live loads.

137
Figure 6.29: Plan view for the test specimens shows the four connections
In the second stage, HC planks were loaded up to the failure. The factored load applied to
shear the HC-beam connection using shear friction theory was predicted to be 209 kip
(104.5 kip each side, which is 34.9 kip per HC). Also, the factored loads applied to fail
the composite HC planks in flexure and shear were predicted to be 315 kip (157.5 kip
each side, which is 52.5 kip per HC) and 240 kip (120 kip each side, which is 40 kip per
HC) respectively. Figure 6.30 shows the test setup as simple support.
3'
2'-8"
Load
ing
Jack
& L
oad
Cel
l
28'
6'
4'4'
10'
4'
6'3'
15'
Con
cret
e Bl
ock
Rol
ler S
uppo
rt
Beam
Ledg
e
3' 4'
15'
6'
6'
She
arK
ey
10'
15'
3'
2'
12'
6"
Tem
pora
ryS
uppo
rts
2'
5'
AB
CD
South-west (Hidden ledge without angle) North-west (Hidden ledge with angle)
South-east (Shear key without angle) North-east (Shear key with angle)

138
Figure 6.30: HC-beam connection setup
A. Hidden Corbel with Angle (North-West)
Two 130 kip jacks were used to test the connection. In the first stage of loading, the
specimen performed well under ultimate design load with no signs of failure or cracking.
In the second stage, HC planks were loaded up to 258 kip (129 kip each side). The test
was stopped after reaching the ultimate load capacity of the used jacks. The applied load
creates a shearing force at the hollow core-to-beam connection of 43 kip. This value is
almost 2.6 times the demand and 12 % more than the design capacity of the connection.
At that load, the connection did not crack, while small shear cracks were observed in the
other end of HC.

139
B. Shear Key with Angle (North-East)
Two 400 kip jacks were used in this test. The specimen performed well under ultimate
design load with no signs of failure or cracking. In the second stage, HC planks were
loaded up to 240 kip (120 kip each side) without even cracking the connection. The test
was stopped due to the shear failure of HC planks as shown in Figure 6.31 . The applied
load created 40 kip shearing force on each HC. This value is almost 2.4 times the demand
and 15 % more than the design capacity of the connection.
Figure 6.31: Failure of the HC at the critical section under ultimate loading
C. Hidden Corbel without Angle (South-West)
Two 400 kip jacks were used in this test. The specimen performed well under ultimate
design load with no signs of failure or cracking. In the second stage, HC planks were
loaded up to 204 kip (102 kip in each side) without even cracking the connection. The
test was stopped because of the shear failure of HC planks as shown in Figure 6.32. The
applied load created 34 kip shearing force on each HC. This value is almost 2.1 times the
demand and equal to the design capacity of the connection.

140
Figure 6.32: Failure of the HC at the critical section under ultimate loading
D. Shear Key without Angle (South-East)
Two 130 kip jacks were used in this test. The specimen performed well under ultimate
design load with no signs of failure or cracking. In the second stage, HC planks were
loaded up to 227 kip (113.5 kip each side) without even cracking the connection. The test
was stopped due to the shear failure HC planks as shown in Figure 6.33. The applied load
created 37.8 kip shearing force on each HC. This value is almost 2.3 times the demand
and 8 % more than the design capacity of the connection.
Figure 6.33: Failure of the HC at the critical section under ultimate loading

141
Figure 10 presents the load deflection relationships of the four tested connections. Also
the strains in the connection reinforcement, which recorded by the strain gauges during
the test were found very small.
Figure 6.34: Load-deflection relationships of the four tested connections
E. Testing HC-Beam Connection by Loading HC as Cantilever
In the entire previous, the tests were done by applied the load at the mid span of the HC,
and the failure occurred in the HC without even cracking the connections. Therefore, in
order to investigate the full shear capacity of the connection, the HC was loaded as a
cantilever. Figure 6.35 shows the test setup, where HC planks were loaded on the free
end (south-west side) while clamping the other end (south-east side) to maintain
specimen stability. Testing was performed to the hidden ledge connection without angle
by applying a uniform load on the cantilevered HC at 4 ft from the centre of the beam,
0
50,000
100,000
150,000
200,000
250,000
300,000
0.0 0.1 0.2 0.3 0.4 0.5 0.6
Load
, lb
Deflection, in.
Shear Key without angle
Shear key with angle
Hidden corbel without angle
Hidden corbel with angle
������
�����/

142
while measuring the deflection at mid-span of the HC. The clamped side was clamped at
5 ft from the centre of the beam.
Figure 6.35: HC-beam connection setup by loading HC as cantilever
Figure 6.36 plots the load-deflection relationship. This plot indicates that the three
composite HC planks in the south-west side were able to carry 140 kip, which
corresponds to a total shear force 147.7 kip includes the self-weight of the HC and
topping (49.2 kip per HC). This is almost 3 times the demand and 40% more than the
design capacity of the HC-beam connection.

143
Figure 6.36: Load-deflection curve of HC-beam connection when tested as cantilever
Figure 6.37 plots the load-strain relationships for connection reinforcement, which
indicate that the topping reinforcement and hat bars reached the yield stress. The test was
stopped due to the shear failure of the HC at the clamped side and severe cracking of the
connection. Table 6.10 summarize the previous HC-beam connections test results
Figure 6.37: Load-strain relationships of HC-beam connection when tested as cantilever
0
20,000
40,000
60,000
80,000
100,000
120,000
140,000
160,000
0.00 0.20 0.40 0.60 0.80 1.00 1.20 1.40 1.60
Load
, lb
Deflection, in
0
20,000
40,000
60,000
80,000
100,000
120,000
140,000
160,000
0 500 1000 1500 2000 2500 3000 3500 4000 4500 5000
Load
, lb
Starin x 10-6
Hat Bars
Topping Bars
������
�����/

144
Table 6.10 summarizes the demand, normal capacity, and measured capacity of the
previous HC-beam connections test results the following summary can be made
Table 6.10: Summary results for HC-beam connections tests
Test ID Test Title
Max. applied load
(kip)/HC
Theoretical Capacity (kip)/HC
Demand (kip)/HC
HC Shear Capacity
(kip) Observation
A Hidden ledge with angle (Three point loading)
43.0 34.9 16.5 40.0 Test stopped because of reaching the capacity of the loading jacks
B Shear key with angle(Three point loading)
40.0 HC shear failure
C Hidden ledge without angle (Three point loading)
34.0 HC shear failure
D Shear key without angle(Three point loading)
37.8 HC shear failure
E Hidden ledge without angle (HC loaded as cantilever)
49.2 HC shear failure and several cracks in the connection
�1. All proposed HC-beam connections without ledge (shear key and hidden ledge
with and without angles) performed very well as their shear capacity exceeded the
predicted values and significantly exceeded the demand. None of these
connections has failed as the tested HC planks failed in shear prior to the failure
of the connections
2. The capacity of the proposed HC-beam connections without ledge can be
accurately predicted using shear friction theory.
3. Since the shear capacity of the HC-beam connections without steel angle was
adequate, steel angles are considered as temporary ledges that do not affect the
fire rating of the building
4. The results of testing full-scale specimen do not only indicate the efficiency of the
proposed system but also the consistency of its performance.

145
6.4 Testing the Flat Soffit Beam Flexural Capacity
The purpose of this test is to evaluate the positive moment capacity at the mid-section of
the composite beam. One 400-kip jack was used to apply a concentrated load on the beam
at 13.75 ft from the center line of roller supports as shown in Figure 6.38 , up to failure,
while measuring the deflection under the load.
Figure 6.38: Flat soffit beam flexural test setup
Figure 6.39 shows the load-deflection relationship. The load-deflection relationships
show a linear behavior up to the cracking load, which was approximately 50 kip. This
plot indicates that the beam was able to carry a load up to 91 kips, which corresponds to a
positive moment capacity at the critical section of 733 kip.ft (including the moment due
to the self-weight of beam, HC, and topping). The ultimate positive moment due to
factored dead and live loads was calculated to be 565 kip.ft (demand), which is 30%
below the measured capacity. The nominal capacity of the composite beam predicted
using strain compatibility approach was found to be 678 kip.ft, which is very close to the
actual capacity. It should be noted that the point load equivalent to service load is
approximately 49 kip and the corresponding final deflection is approximately 0.74 in.,

146
while the allowable deflection equal to 0.93 in. Figure 6.40 shows the flat soffit beam
failure under flexural.
Figure 6.39: Load-deflection relationship of flat soffit beam flexural test
Figure 6.40: Failure mode of the flat soffit beam
From the test results, the flexural capacity of the flat soffit prestressed beam exceeded the
demand and was accurately predicted using strain compatibility.
010,00020,00030,00040,00050,00060,00070,00080,00090,000
100,000
0.00 1.00 2.00 3.00 4.00 5.00 6.00 7.00
Load
, lb
Deflection, in.
Service load
Design load

147
Chapter 7
PRECAST/PRESTESSED SANDWICH FLOOR PANELS
7.1 Introduction
Structural floor systems represent a major portion of both the cost and weight of precast
concrete building frames. Also, structural floor systems in multi-story buildings have an
impact on the overall building height and design of other building systems. Many
approaches have been used to improve the structural and construction efficiency of floor
systems, some of these were sought to minimize the weight, depth, and cost of structural
floor systems through the use of higher strength materials and improved construction
techniques.
Hollow core (HC) precast prestressed concrete floor panels (Board of FIB steering
committee, 1999) are the common solution for several floor applications, especially
where flat soffit, long span, and lightweight floors are required. The number and size of
strands in the bottom flange determine the ultimate load/span capacity of the planks. HC
planks are produced using specialized equipment to ensure consistently, high quality, and
efficiency of production. HC planks are grouted together to produce a diaphragm action
and flat soffit. Enhanced structural performance can be achieved by using a composite
topping, which can result in a span-to-depth ratio of up to 40. Despite these advantages,
HC planks have poor thermal insulation, and require high initial investment for
production equipment.
Rip-slab floor panels (Hanlon, et al. 2009) is a modified precast prestressed concrete
double-tee with a 2 in. thick concrete slab and 8 in. deep ribs, for a total depth of 10 in.
Testing the ultimate load capacity of the rib-slab with a dapped end connection has

148
confirmed the feasibility of this floor system. The Rip-slab floor elements are
economical, structurally efficient, and can be easily produced. However, they do not
provide either flat soffit or thermal insulation.
Filigree wide slab system (Mid-State filigree Systems, Inc. 1992) was originally
developed in Great Britain and is presently used under the name of OMNIDEC. Filigree
precast panels are thin reinforced concrete slabs with steel lattice truss that are used as
formwork for the composite cast-in-place concrete topping. The steel truss ensures
composite behavior between precast and cast-in-place concrete and provides the panel
with the required stiffness during erection. The typical thickness of the prefabricated slab
is 2.25 in., but the total thickness of the panel varies due to the spans. The panels are
structurally efficient and easy to produce. They have a typical width of 8 ft and flat soffit
that eliminates the need for false ceiling. The main disadvantage of this system is the low
thermal insulation.
This chapter presents the development of a new precast/prestressed floor panel that is
alternative to HC planks. Table 7.1 compares the proposed floor panel with the existing
floor panels in terms of the criteria listed before. The proposed system consists of an
internal wythe of insulation and two external wythes of concrete similar to precast
concrete sandwich wall panels. The two concrete wythes are designed to be fully
composite through the use of shear connectors.
Table 7.1: Comparing the proposed against existing floor systems
Criteria Hollow core Rip-slab Filigree wide slab Sandwish Floor Panel
Does not Need Special Equipment to ProduceDoes not Need Cast-in-place ToppingThermal InsulationFlat Soffit

149
The proposed floor panel is expected to have flat soffit, lightweight and adequate
structural capacity while being efficient in thermal insulation and does not require
specialized equipment for fabrication. Sandwich panels can be used for many
applications to save the energy such as roof application due to the difference in
temperature between the inside and the outside. Also it can be in radial building as floor
application where there is different in temperature for each story.
7.2 Panel Description and Design
Sandwich panels are used since many years in wall application. Sandwich panel does not
used in floor application because of the Glass Fiber-Reinforced Polymer (GFRP) ties
under sustain loads. Many works was done in Canada to determinate GFRP bars creep.
When the stress in the GFRP bars should not be more than 0.2 Fu there is no creep
problems, where Fu is the ultimate tensile strength. A typical Precast/Prestressed
Concrete Sandwich Floor Panel (PCSFP) consists of two precast concrete wythes. The
bottom wythe may has steel reinforcing or steel strands as main reinforcement. The two
concrete wythes separated by a layer of insulation (e.g. Extruded Polystyrene (XPS)) and
joined together with connectors to achieve the composite action required for flexural
resistance and stiffness. These connectors can be concrete, steel, plastic ties, or any
combination of these components. However, the low thermal resistance of steel and
concrete connectors makes these products unattractive as they significantly reduce the
thermal efficiency of the PCSFP through thermal bridging. NU-Tie (GFRP) ties is a
product developed by researchers at the University of Nebraska-Lincoln (UNL) as shown
in Figure 7.1 and patented in 1995 (Tadros et al. 1995).

150
Figure 7.1: NU Tie
The proposed panel is designed to be fully composite. The flexural capacity of the
composite panel is that of a solid panel that has the same cross section as the two
concrete wythes.
Shear connectors are used to transfer horizontal shear forces between the concrete
wythes as shown in Figure 7.2.
Figure 7.2: Shear connectors and horizontal shear force
This force can be calculated using the strength method given in the PCI Design
Handbook, 6th Edition 2005 Section 5.3.5 “Horizontal Shear Transfer in Composite
Components”. In this method, the horizontal shear force is taken as the lesser of the
maximum compressive force in concrete and maximum tensile force in the

151
reinforcement/prestressing. This force is then used to determine the required number of
shear connectors over the horizontal shear span, which is one-half the clear span for
simply supported panels. Most manufacturers of shear connectors use the same method to
determine the amount of shear connectors for composite panels and distribute these
connectors uniformly along the horizontal shear span. In this study, another procedure
was used, in addition to the PCI Design Handbook 6th Edition procedure. A triangular
distribution of the horizontal shear force along the shear span is used to determine the
most efficient distribution of shear connector. Also the flexural capacity was determined
using the strain-compatibility for two loading stages: 1) panel without topping was
designed to carry 25 psf topping weight plus 25 psf construction loads; and 2) panel with
topping was designed to carry the live load (100 psf) plus any superimposed dead loads
(weight of flooring or ceiling).
7.3 Thermal Performance
Glass Fiber-Reinforced Polymer (GFRP) ties connectors was introduced for its superior
thermal resistance and structural strength. GFRP tie typically has a conductivity of k =
0.5 Btu*in./(hr*ft2*oF). Compare to concrete connector (k = 13.3 Btu*in. / (hr*ft2*oF))
and metal connector (k = 314 Btu*in. / (hr*ft2*oF)). In order to study the thermal
performances of these panels, R-Value are calculated using the “Zone Method” proposed
by PCI Design Handbook 6th Edition, Section 11.1.6. Two sandwich panels will be used
to calculate R-Value, 1) sandwich panel with concrete solid ends as shown Figure 7.3. the
panel was 26 ft long, 4 ft wide and 8 in. thick (3-4-1), plus 2 in. concrete topping and 2)
fully insulated sandwich panel as shown in Figure 7.28. The panel was 26 ft long ,4 ft
wide and 8 in. thick (3-3-2), plus 2 in. concrete topping. Table 7.2 Table 7.3 show R-

152
Value calculations for sandwich panel with concrete solid blocks at the ends and fully
insulated sandwich panel respectively.
Table 7.2: R-Values calculations for sandwich panel with concrete solid ends
Parameter Value UnitPanel Span 26 ftPanel width 4 ftThickness of the topping (tcf1) 2 in.Thickness of top wythe (tcf2) 2 in.Thickness of insulation (tin) 3 in.Thickness of bottom wythe (tcb) 3 in.Solid Concrete Block Length 1 ft
Insulation Coductivity Values (Kin) 0.2(Btu-in.)/(hr.
ft2. F)
Concrete Coductivity Values (Kcon) 13.3(Btu-in.)/(hr.
ft2. F)Alpha Coefficient (9� 0.48Beta Coefficient (:� 1.15Size of The Effective Zone (Ez) 2.98 in.Effective Zone Around the Solid Block 143.17 in2
Panel Area (At) 14976 in2
Concrete Area (As) !$('�(( in2
Insulated Area (Ap) 13537.67 in2
R-Value for Insulated Path in Winter 16.38 hr.ft2.F/BtuR-Value for Insulated Path in summer 16.46 hr.ft2.F/BtuR-Value for Concrete Path in Winter 1.60R-Value for Concrete Path in Summer 1.68Ratio of solid concrete (A's = As/At) 0.096Ratio of insulated concrete (A'P = AP/At) 0.90Final R-Value in Winter 8.68 hr.ft2.F/BtuFinal R-Value in Summer 8.93 hr.ft2.F/Btu
� � �� ������ ����
������
� � �� �������� �����
�������
�� � ��� � ������ � ����!" � ��� �!# � �!" $�
�
%�&'(%(
�&')%)

153
Table 7.3: R-Value calculation for fully insulated sandwich panel
Parameter Value UnitPanel Span 26 ftPanel width 4 ftThickness of the topping (tcf1) 2 in.Thickness of top wythe (tcf2) 2 in.Thickness of insulation (tin) 3 in.Thickness of bottom wythe (tcb) 3 in.Solid Concrete Block Length 0 ft
Insulation Coductivity Values (Kin) 0.2(Btu-in.)/(hr.
ft2. F)
Concrete Coductivity Values (Kcon) 13.3(Btu-in.)/(hr.
ft2. F)Alpha Coefficient (9� 0.48Beta Coefficient (:� 1.15Size of The Effective Zone (Ez) 2.98 in.Effective Zone Around the Solid Block 143.17 in2
Panel Area (At) 14976 in2
Concrete Area (As) 0.00 in2
Insulated Area (Ap) 14976 in2
R-Value for Insulated Path in Winter 16.38 hr.ft2.F/BtuR-Value for Insulated Path in summer 16.46 hr.ft2.F/BtuR-Value for Concrete Path in Winter 1.60R-Value for Concrete Path in Summer 1.68Ratio of solid concrete (A's = As/At) 0.000Ratio of insulated concrete (A'P = AP/At) 1.00Final R-Value in Winter 16.38 hr.ft2.F/BtuFinal R-Value in Summer 16.46 hr.ft2.F/Btu
� � �� ������ ����
������
� � �� �������� �����
�������
�� � ��� � ������ � ����!" � ��� �!# � �!" $�
�
%�&'(%(
�&')%)
26'
4'
4' 4' 4' 4' 4' 4' 1'1'B A
B A
3"

154
Figure 7.3: Floor panel A with GFRP ties
Figure 7.4: Floor panel B with steel ties
7.4 Phase I Experimental Investigation
Phase I of the experimental program focused on investigating the flexural behavior of
PCSFP under construction stage and final stage and the impact of such parameters as the
connectors distribution, using different types of shear connectors, effects of connectors
extension above the top wythe in the fabrication process, and using solid concrete blocks
#3@32"
8"
7-0.6"tensioned to 31 kips
3"4"
1"
6" 6"
8"
6" 3"
Section A-A
GFRP Ties
3'-2"
R134"
44°
2"8"
3'-714"
4'
1'-718"
4 #3
8"
7-0.6"tensioned to 31 kips
3"4"
1"
Section B-B
4#3
78"
78" 11
2"
6"6"
1'
712"Ø11
2"
3'-10"
614"Ø11
2"
4'
26'
4'
4' 4' 4' 4' 4' 4' 9"9"
( )
B A
B A
3" 3"
3'-6"
3"
#3@32"
8"
7-0.6"tensioned to 31 kips
3"4"
1"
6" 6"
8"
9"
Section A-A
Steel Ties3" 6"3'-6"
8"
1'-434"
45°90°
Ø112"
3'-212"
2"
4 #3
8"
7-0.6"tensioned to 31 kips
3"4"
1"
6"
Section B-B
4#3
Ø112"
1'
712"Ø11
2"
3'-10"
614"Ø11
2"
78"
112"
78" 11
2"4'
155
at the ends. This phase allowed determination of the best and efficient design in terms of
strength and cost. Based on the phase I results and the learned lessons phase II specimens
were tested to develop design recommendations.
7.4.1 Specimens Design
Two panels were fabricated and tested at the Structural Laboratory of the University of
Nebraska-Lincoln. Each panel was 26 ft long, 4 ft wide, and 8 in. thick. Both Panels were
longitudinally reinforced with seven 0.6 in. diameter grade 270 low-relaxation
prestressing strands tensioned to 31 kip, which is the maximum jacking force for 0.5 in.
diameter strands. The researchers used 0.6 in. diameter due to the unavailability of 0.5 in.
diameter strands at the time of panel fabrication. The 8 in. thick sandwich panels
consisted of two concrete wythes. The top concrete wythe is 1 in. thick and the bottom
concrete wythe is 3 in. thick and they are separated by a 4 in. thick layer of extruded
polystyrene (XPS) as shown in Figure 7.3 and Figure 7.4. Glass Fiber-Reinforced
Polymer (GFRP) ties were used in panel A as shear connectors in addition to 12 in. wide
solid concrete block at each end as shown in Figure 7.3. Steel ties and concrete
connectors were used in panel B as shear connectors plus concrete connectors. The
concrete connectors were 9 in. wide solid block at each end, 3 in. wide rip in each side,
and two 3 in. wide rips 8.75 ft apart from each end as shown in Figure 7.4 in addition to
the gap between the steel ties and the insulation. Both the GFRP ties and the steel ties are
8 in. high, which make the ties extended above the top wyth of the panel. The following
shows the calculation GFRP ties
Design of GFRB Ties

156
NU-Ties Properties
Total Horizontal Shear
Maximum Horizontal Shear
Horizontal Shear Gradient
Atie 0.11in2��Ce 0.7��
�tie 44��Cr 0.65��
Tiedepth 8in��� shear 0.75��
TieTensile.Strength 110ksi�� Fu TieTensile.Strength 1.1 105� psi���
Mu 98 kip ft��� Span 28ft�
Vh.totalMu
Tiedepth147 kip����
Vh.MaxVh.total 4�
Span21 kip
ft����

157
Factored Strength
Leg Capacity
The panel can be divided into segments that are multiples of 4 ft in length. Assuming 1 ft solid at each end
First segments
Number of Legs
Since one NU-Tie contains 4 legs,
Take it 8 ties
Second segments
GVh.Max 2�
Span1.5 kip
ft2����
Ff � shear Fu� Ce� Cr� 37.538 ksi����
F Atie Ff� cos �tie�
180���
����
� 2.97 kip����
Firstsegments 5ft��
Areasegment.oneVh.Max Vh.Max G Firstsegments� ��� ��
2Firstsegments� 86.25 kip����
NumberLegsAreasegment.one
F29.038���
NumberTiesNumberLegs
47.26���
Second segments 4ft��
V1second Vh.Max G Firstsegments� 13.5 kipft����

7.4.2 Specimens Erection
The panels were fabrica
Laboratory. Figure 7.5 sho
Figure 7.5: floor p
Below are the steps follow
Step 1) Production of GFR
Number of Legs
Since one NU-Tie con
Third segments
V2.second V1se��
Areasegment.secondV1se
��
NumberLegs
NumberTies
tion
ricated and cast in the prestressing bed at the
shows the casting orientation and the nomenclature
or panels casting position and nomenclature for the
llowed in the erection of phase I specimens.
FRP and steel ties as shown in Figure 7.6
tains 4 legs,
Take it 6 t
Take number of the tie = 4 ties
1second G Secondsegments� 7.5 kipft��
1second V2.second �2
Second segments� 42 kip��
egs.Areasegment.second
F14.14���
ies.NumberLegs.
43.535���
158
the PKI structural
ture of the panel.
the panels
ties

159
Figure 7.6: GFRP and steel ties profile.
Step 2) Preparation of XPS Foam Panels. The preparation of the XPS foam panels starts
from hot melting slots for inserting the ties connectors. This is done by a prefabricated
machine and should be accompanied by using exhaust containment hoods and adequate
ventilation to deal with smoke and fumes associated with the melting of slots. A picture
of this machine can be seen in Figure 7.7. After the blanks are ready, GFRP tie is
inserted into the foam and the remaining gaps are filled with canned expanding foam
insulation as shown in Figure 7.8. Excess foam is removed with a long, flat fine tooth
blade.
Figure 7.7: Hot melt slots into the foam blanks
Steel tie
GFRP tie

160
Figure 7.8: Insert GFRP tie into the XPS slot and filling the gap with expanding foam
insulation
Step 3) Setup the forms and lubricate the bed for concrete placement and tension the
strands and place the reinforcement. First, chamfer was stapled to the bed at the
appropriate spacing; then, the seven 0.6 in. diameter strands were threaded through the
south abutment plates, through the appropriate plywood end plates and confinement
reinforcement, then finally through the north abutment plates as shown in Figure 7.9.
Each strand was chucked at both ends and tensioned to 31 kip. The formwork for the
floor panel was prepared using plywood 0.75 in thickness and 8 in. height. These
plywood pieces were fixed to the floor, preventing horizontal movement due to the force
of the fresh concrete.
Panel A (4 steel stirrups at each end)

161
Panel B (3 steel stirrups at each end and one stirrup
at one-third of the span)
Figure 7.9: Setup the forms and tension the strands
Step 4) Pouring the concrete, SCC concrete was delivered by Ready Mix truck to the PKI
structural laboratory. Spread diameter was taken upon arrival and was found to be 25 in.
Cylinder samples were taken following the adequate spread diameter and pouring of the
panels commenced. First placed the bottom wythe, then place XPS panels with GFRP ties
on the fresh concrete of the bottom wythe and place the concrete of the top wythe as
shown in Figure 7.10.
Figure 7.10: Casting the bottom wythe, installing foam panels, and casting the top wythe
In case of panel B the XPS panels was placed without the ties, then placed the top
concrete wythe, finally install the steel ties. Casting of the panel required no vibration and

162
little labor due to the concrete’s flowing ability. The two panels were completed, as
shown in Figure 7.11, in approximately 60 minutes using a crane bucket. Wet burlap
curing commenced after the specimens had setup such that the burlap would not damage
the surface or lifting points, as shown in Figure 7.12.
Figure 7.11: Completing casting the panels Figure 7.12: Wet Burlap Curing
Step 5) Release and cut the strands. After three days, the forms were stripped and strands
were released gradually. At that time the concrete strength reached 8400 psi
7.4.3 Material Properties
Table 7.4 shows the mix designs used for precast panels and for the coming topping,
while Figure 7.13 shows compressive strength versus age relationships for precast
concrete panels and the used topping

163
Table 7.4: Concrete design mix for precast panel
Figure 7.13: Concrete strength gain with time
7.4.4 Test Setup and Procedures
Testing of the first phase specimens was performed on March 24, and April 1 and2 2010.
This includes the following three tests:
1- First test (without topping)
2- Second test (with topping)
PrecastPortland Cement Type I 705
Fly Ash, Class C 378Limestone (LBRS) 1340
Sand (S47B) 980Sand (S4110) 420Total Water 260
Water Reducer (AGLEN) 13 oz/cwt
MaterialsWeight (lb) per cubic Yards
Topping611
-
-9502190
-275
0
2,000
4,000
6,000
8,000
10,000
12,000
0 5 10 15 20 25 30
Com
pres
sive S
treng
th (p
si)
Age (days)
Precast
Topping

164
7.4.4.1 First Test (Without Topping)
The proposed panels will be used as floor panels instead of the hollow core planks. At the
stage of construction the panels should carry its own weight, plus the weight of the
topping and the construction loads. The construction loads assumed 25 psf plus 25 psf
topping weight. The first test was conducted to determine the behavior of the panels
without topping. At the time of the first test, the concrete strength was 9.6 ksi. One point
load was applied at mid-span of the panel using hydraulic jack and load cell. Roller
supports were placed 25.67 ft center to center. Specimen deflection was recorded using
one potentiometer located at mid-span under the point load as shown in Figure 7.14. The
net camber (after subtracting the self-weight deflection) of the two panels was
approximately 0.25 in.
Figure 7.14: Test Setup
26'
4'39 in
4 in
26'
4' 39 in
4 in
Roller supportRoller support
Hydraulic jack
Deflection gage
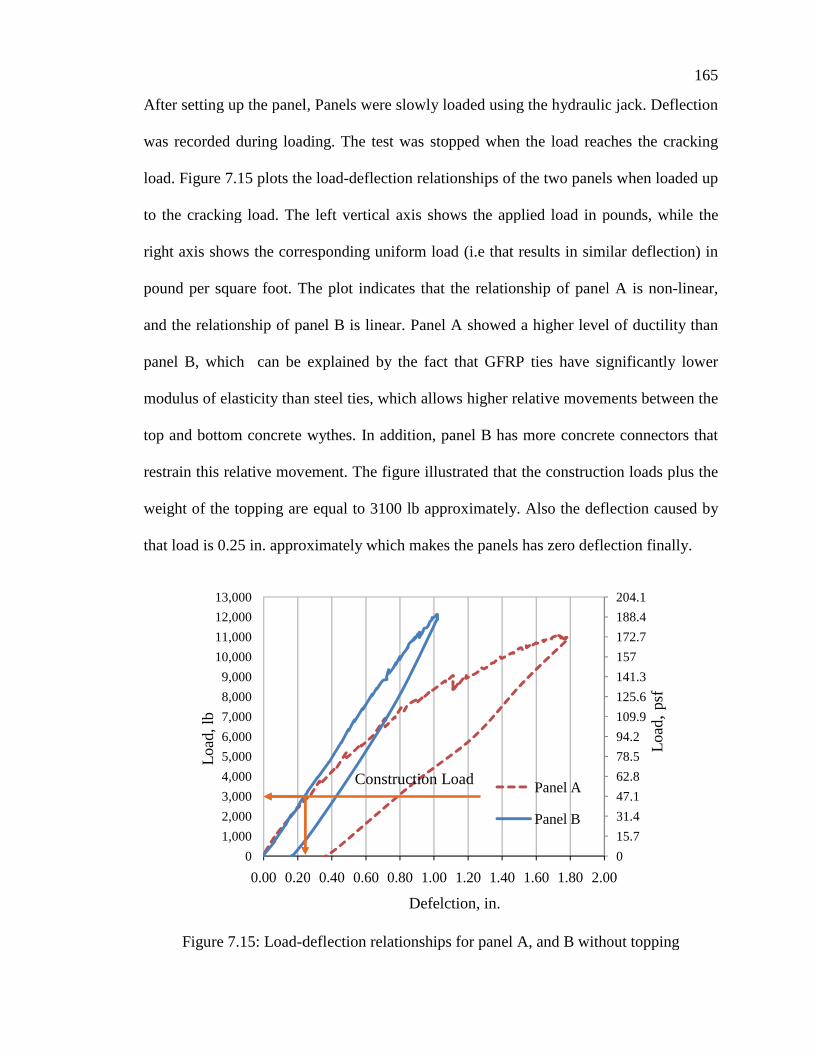
After setting up the panel,
was recorded during load
load. Figure 7.15 plots the
to the cracking load. The
right axis shows the corre
pound per square foot. Th
and the relationship of pan
panel B, which can be e
modulus of elasticity than
top and bottom concrete w
restrain this relative move
weight of the topping are
that load is 0.25 in. approx
Figure 7.15: Load-d
01,0002,0003,0004,0005,0006,0007,0008,0009,000
10,00011,00012,00013,000
0.00 0.20
Load
, lb
nel, Panels were slowly loaded using the hydraulic
oading. The test was stopped when the load reach
the load-deflection relationships of the two panels
he left vertical axis shows the applied load in po
orresponding uniform load (i.e that results in simil
. The plot indicates that the relationship of panel
panel B is linear. Panel A showed a higher level
be explained by the fact that GFRP ties have sig
han steel ties, which allows higher relative moveme
te wythes. In addition, panel B has more concrete
ovement. The figure illustrated that the constructio
are equal to 3100 lb approximately. Also the defle
proximately which makes the panels has zero deflec
deflection relationships for panel A, and B witho
.20 0.40 0.60 0.80 1.00 1.20 1.40 1.60 1.80 2.00Defelction, in.
Panel A
Panel B
Construction Load
165
lic jack. Deflection
eaches the cracking
els when loaded up
pounds, while the
milar deflection) in
nel A is non-linear,
vel of ductility than
significantly lower
ements between the
rete connectors that
ction loads plus the
eflection caused by
flection finally.
ithout topping
015.731.447.162.878.594.2109.9125.6141.3157172.7188.4204.1
2.00
Load
, psf

166
7.4.4.2 Second Test (With Topping)
After the first test was done, the panels moved to the bed, then 2 in. concrete topping was
casting over the top of the two panels, after placing #4@32 in. as transverse
reinforcement as shown in Figure 7.16. The concrete was delivered by Ready Mix truck
to the PKI structural laboratory. Table 7.4 shows the topping mix design. After the
topping concrete strength reached 3.4 ksi, the two panels were moved again to testing.
The second test setup is similar to the first one as shown in Figure 7.17. Concrete strain
gauges were attached to the top surface to measure the strain in extreme compression
fibers as shown in Figure 7.18. At the time of the second test, the compressive strength
for the panels and the topping was 10.8 ksi and 3.4 ksi respectively. These values
represent the average compressive strength of the tested cylinders.
Figure 7.16: Built the form for the topping and cast the concrete topping

167
Figure 7.17: Second test setup
Figure 7.18: Strain Gauges at the top surface
Figure 7.19 shows the load deflection relationships of the two panels. In this figure, the
left vertical axis shows the applied load in pounds, while the right axis shows the
corresponding uniform load (i.e that results in similar deflection) in pound per square
foot. The load-deflection relationships show a linear behavior up to the cracking load,
which was approximately15 kip for the two panels. A non-linear relationship continued
until the ultimate load was reached, which was approximately 33, kip for panel A and 34

168
kip for panel B. It should be noted that the point load equivalent to a live load of 100 psf
is 6.5 kip and the corresponding deflection is 0.4 in and 0.2 in. for panel A and B
respectively. This values of deflection are less than 0.85 in. which corresponding to the
limits of L/360
Figure 7.19: Load-deflection relationship for the two panels with topping
Prestress loss calculations were performed according to the 7th Edition of the PCI Design
Handbook (2010), which resulted in a total prestress loss of approximately 18%. The
nominal flexural capacity of the panel section (�Mn) was calculated using strain
compatibility and assuming a fully composite section and a resistance factor (�) of 1.0.
This resulted in a theoretical capacity of 226 kip.ft, depth of compression block of 2.224
in, and ultimate stress in prestressing strands of 270 ksi. It should be noted that the two
panels were made of the same concrete and had the same prestressing force.
0
78
156
234
312
390
468
546
624
0
5,000
10,000
15,000
20,000
25,000
30,000
35,000
40,000
0.0 1.0 2.0 3.0 4.0 5.0 6.0 7.0 8.0 9.0 10.0
Load
, lb
Deflection, in.
Panel A
Panel B
Load
, psf
Cracking Load
Service Load
Deflection for Uncracked Section

169
Figure 7.20 shows load strain relationships of the two panels at top fiber. The strain at
mid-span top fibers in panel A indicates that the concrete strain did not reach 0.003,
while it reached 0.003 in panel B. This behavior explains the failure mode of each panel,
which is shown in Figure 7.21 and Figure 7.22. Figure 7.21 shows that Panel A had
tension-controlled flexural failure. Also several cracks appeared in the top surface at each
ends, where the concrete end blocks restrained the panel rotation (i.e. partial fixity).
Figure 7.22 shows that panel B has compression-controlled flexural failure as the topping
concrete reached its ultimate strain.
Figure 7.20: Load-strain relationships of top fibers at mid-span
Figure 7.21: Failure mode of panel A
05,000
10,00015,00020,00025,00030,00035,00040,000
-4000 -3500 -3000 -2500 -2000 -1500 -1000 -500 0
Load
, lb
Strain x 10 -6
Top fibers for panel A
Top fibers for panel B
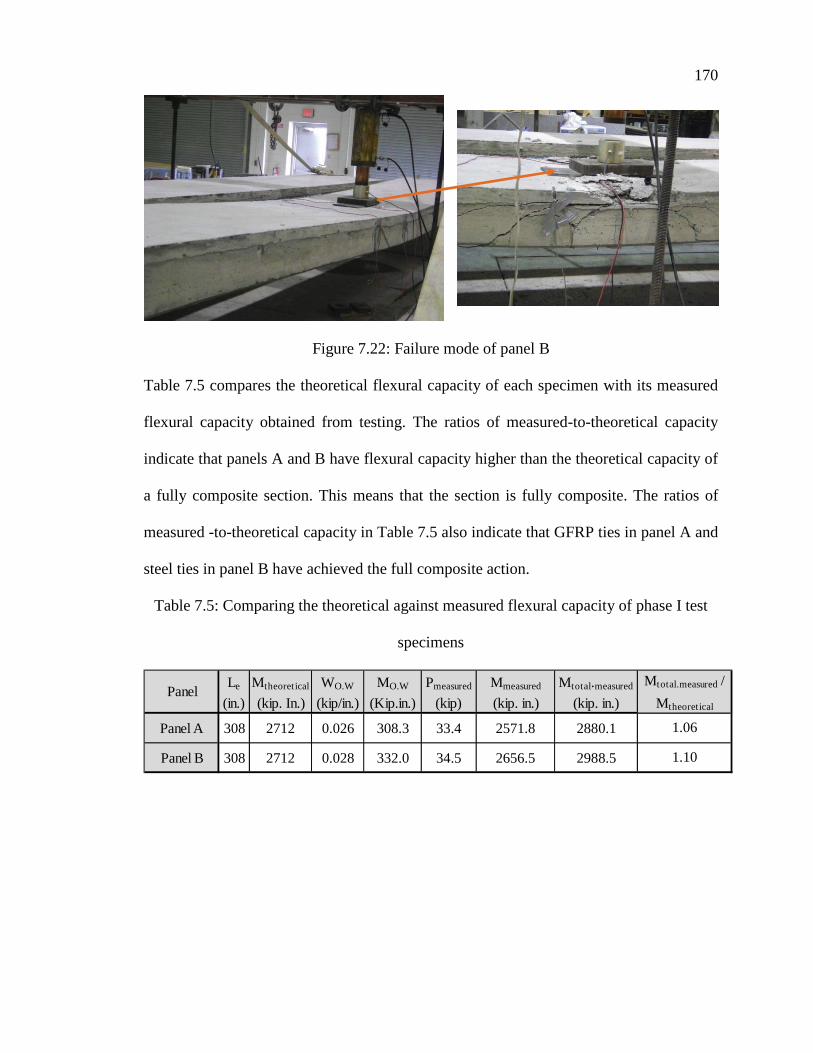
170
Figure 7.22: Failure mode of panel B
Table 7.5 compares the theoretical flexural capacity of each specimen with its measured
flexural capacity obtained from testing. The ratios of measured-to-theoretical capacity
indicate that panels A and B have flexural capacity higher than the theoretical capacity of
a fully composite section. This means that the section is fully composite. The ratios of
measured -to-theoretical capacity in Table 7.5 also indicate that GFRP ties in panel A and
steel ties in panel B have achieved the full composite action.
Table 7.5: Comparing the theoretical against measured flexural capacity of phase I test
specimens
Panel Le
(in.)Mtheoretical
(kip. In.)WO.W
(kip/in.)MO.W
(Kip.in.)Pmeasured
(kip)Mmeasured
(kip. in.)Mtotal.measured
(kip. in.)Panel A 308 2712 0.026 308.3 33.4 2571.8 2880.1
Panel B 308 2712 0.028 332.0 34.5 2656.5 2988.5
Mtotal.measured / Mtheoretical
1.06
1.10

171
7.5 Design Optimization and Erection Simplification
Based on fabrication and erection experience of phase I specimens, the following changes
were recommended and made to the design and detailing of phase II specimens:
1- The height of ties was changed from 8 in. to 7 in., which eliminate the extension
of the ties above the top wyth of the panel that is making the finishing of the top
wyth much easier and faster. See Figure 7.23
Figure 7.23: Changing the ties height in phase I (top) and phase II (bottom).
Ties extended above
the top wyth
Smooth surface

172
2- Eliminating any thermal bridges such as the solid concrete parts at the ends,
which increase the panel thermal efficient. For bearing at the ends, thermal
plastic lamber 6 in. x 3 in. x 48 in. were places. See Figure 7.24
Figure 7.24: The end of the panels in phase I (top) and phase II (bottom).
3- Topping reinforcement in the longitudinal direction was changed to be D5xD5 (6
in. X 18 in.) instead of using #4@32 in the transvers direction. See Figure 7.25
Concrete solid part at
each end
Fully insulated, no thermal
bridges

173
Figure 7.25: Topping reinforcement phase I (top) and phase II (bottom).
#4@32 in the
transvers direction
D5 x D5 @ 6in. x 18
in.

174
4- Optimize the design by using 24 ties and 4-0.5 strand instead of using 36 ties and
7-0.5 strand in the panel. See Figure 7.26
Figure 7.26: Optimize number of strands and number of ties for phase I (top) and phase II
(bottom).
7-0.6 strand
36 GFRP ties
24 GFRP ties 4-0.5 strand

175
5- Re-distribute the 8 in. height from 3-4-1 to 3-2-2. See Figure 7.27
Figure 7.27: changes in the cross section for phase I (top) and phase II (bottom).
7.6 Phase II Experimental Investigation
Based on the results of Phase I and the learning lessons, fully thermal insulated panels
will be investigated in Phase II, using GFRP ties as shear connectors.
7.6.1 Specimens Design
Two panels C and D were fabricated and tested at the Structural Laboratory of the
University of Nebraska-Lincoln. Each panel was 26 ft long, 4 ft wide, and 8 in. thick.
Both Panels were longitudinally reinforced with four 0.5 in. diameter grade 270 low-
relaxation prestressing strands tensioned to 31 kip, which is the maximum jacking force
for 0.5 in. diameter strands. The 8 in. thick, sandwich panels consisted of two concrete
wythes. The top concrete wythe is 2 in. thick and the bottom concrete wythe is 3 in. thick
and they are separated by a 3 in. thick layer of extruded polystyrene (XPS) as shown in
Figure 7.28. Glass Fiber-Reinforced Polymer (GFRP) ties were used in the two panels as
shear connectors. The design of the GFRP ties and the distribution will be presented in
the next subsection
4'
3"4"
1"
3"3"2"
4'

176
Design of GFRB Ties
NU-Ties Properties
Total Horizontal Shear
Maximum Horizontal Shear
Horizontal Shear Gradient
Ce 0.7��Atie.no3 0.11in2��
Cr 0.65���tie.no3 40��
TieTensile.Strength 110ksi��
Tiedepth.no3 7in�� � shear 0.75��
MU FactorLoad.Final 1.06 kipft���� Span 26ft�
Mu 89.57 kip ft���
Vh.totalMu
Tiedepth.no3153.55kip����
Vh.MaxVh.total 4�
Span23.62 kip
ft����
GVh.Max 2�
Span1.82 kip
ft2����

177
# 3
# 3 Leg
Since the length of NU-Tie is approximately 4 ft, the panel can be divided into segments that are 4 ft in length.
First segments
Second segments
Third segments
Ff.no3 � shear TieTensile.Strength� Ce� Cr� 37.54 ksi����
Fno3 Atie.no3 Ff.no3� cos �tie.no3�
180���
����
� 3.16 kip����
Firstsegments 4ft��
Areasegment.oneVh.Max Vh.Max G Firstsegments� ��� ��
2Firstsegments� 79.95 kip����
NumberLegs.segment1Areasegment.one
Fno325.28���
Second segments 4ft��
V1second Vh.Max G Firstsegments� 16.35 kipft����
V2.second V1second G Secondsegments� 9.09 kipft����
Areasegment.secondV1second V2.second �
2Second segments� 50.88 kip����
NumberLegs.segment2.Areasegment.second
Fno316.09���
V1third V2.second 2.92 105�lb
s2���
Thirdsegments 4ft��
V2.third V1third G Thirdsegments� 1.82 kipft����
Areasegment.thirdV1third V2.third �
2Thirdsegments� 21.81 kip����
NumberLegs.segment3.Areasegment.third
Fno36.89���

178
The ties were distributed to be uniform as shown in Figure 7.28
Check the stresses in the ties under sustain Load
Actual Stress in the ties due to Sustain Load
Less than 18 ksi
Actual Stress in the ties due to Live Load
Less than 30 ksi
Totallegs NumberLegs.segment3. NumberLegs.segment2. NumberLegs.segment1 48.26���
NumbertiesTotallegs
412.06���
MSustainWtopping Wpanel � Span21.2�
835.49 kip ft�����
Vh.total.sustain.loadsMSustain
Tiedepth.no360.84kip����
Actual leg.forceVh.total.sustain.loads
Actualno3.legs1.27 kip����
Actualleg.StressActual leg.force
Atie.no3 cos �tie.no3�
180���
����
�
15.04 ksi����
Vh.total.Live.loadML.L.factor
Tiedepth.no392.71kip����
Actualleg.force.Vh.total.Live.loadActualno3.legs
1.93 kip����
Actual no3.legs 48��
Actualleg.Stress.Actual leg.force.
Atie.no3 cos �tie.no3�
180���
����
�
22.92 ksi����

179
Figure 7.28: Fully insulated floor panels C and D
7.6.2 Specimens Erection
The panels C and D were fabricated and cast in the same bed as panels A and B. Below
are the steps followed in the erection of phase II specimens. Fabrication process pictures
were shown in Appendix F
Step 1) Preparation of XPS foam panels
Step 2) Production of GFRP, then linear strain gauges were connected to the tension legs
of the GFRP ties before concrete pouring. After the insulation blanks are ready, GFRP-tie
is inserted into the foam and the remaining gaps are filled with canned expanding foam
insulation as shown in Figure 7.29.
A
A
26'
4'
4' 4' 4' 4' 4'4'
Thermal plastic Lamber 6"x3"x48"Thermal plastic Lamber 6"x3"x48"
6"
#4@32"4-0.5"tensioned to 31 kips
3"3"2"
1' 6"
1' 3"
Section A-A
24#3 - 7" NU Ties4'
2"D5xD5 - 6x18

180
Figure 7.29: Insert GFRP tie into the XPS slot and filling the gap with expanding foam
insulation
Step 3) Setup the forms and lubricate the bed for concrete placement and tension the
strands and place the reinforcement.
GFRP Tie
Expansion Foam
Strain Gauge

181
Step 4) Pour the concrete. SCC concrete was delivered by Ready Mix truck to the PKI
structural laboratory. Spread diameter was taken upon arrival and was found to be 22 in.
First placed the bottom wythe, then Place XPS panels with GFRP ties on the fresh
concrete of the bottom wythe and Place the concrete of the top wythe. Lifting points were
then inserted into the still fresh concrete at each end. Wet burlap curing commenced after
the specimens had setup such that the burlap would not damage the surface or lifting
points.
Step 5) Release and cut the strands, after three days, the concrete strength reached
8034psi, then the strands were released gradually.
Step 6) place topping reinforcemnt D5 x D5 @ 6 in. x 18 in. and casting 2 in. the
concrete topping
7.6.3 Material Properties
The same mixes, which used in panel A and B was used in panel C and D as shown in
Table 7.4. Figure 7.30 shows compressive strength versus age relationships for precast
concrete and the topping.
Figure 7.30: Concrete strength gain with time
0
2,000
4,000
6,000
8,000
10,000
12,000
14,000
0 5 10 15 20 25 30
Com
pres
ssiv
e Stre
ngth
, psi
Age, days
Precast

182
7.6.4 Test Setup and Procedures
Testing of the phase II specimens was performed on December 1, 2, and 3, 2011 to
investigate the flexural and shear behavior of panel C and D under different type of
loading. The test program includes the following tests:
1- Flexural test
A. Using two point loads
B. Using one point loads
2- Shear test
A. Test 1
B. Test 2
C. Test 3
7.6.4.1 Flexural Test
A. Using Two Point Loads
The purpose of this test is to investigate the flexural behavior of panel C under two point
loads, also to evaluate the positive moment capacity of the composite panel for resisting
gravity loads. Figure 7.31 shows the test setup, where the panel was loaded as simply
supported. At the time of the test, the concrete strength was reached 11.5 ksi. Testing was
performed by applying two point loads at 9 ft from the center of the roller. Concrete
strain gauges were attached to the top surface to measure the strain in extreme
compression fibers. Specimen deflection was recorded using one potentiometer located at
mid-span, in addition to measure the strains in the GFRP ties. Figure 7.32 shows the
GFRP ties strain gauges locations. The relative movement between the top wythe and the
bottom wythe was recorded as shown in Figure 7.33. The deflection of panels C and D

183
due to self-weight plus topping weight was measured after setup the panels using laser
device as shown in Figure 7.31 and was found 0.385 in. Also the deflection was checked
using the analytical models (truss and FE model), and was found 0.35 in. after subtracted
the camber from the self-weight. See Figure 7.62
Figure 7.31: Test setup for panel C
25'-4"
4'
4" Plan
26'
10"
3" 4" Elevation
9' 9'7'-4"

184
Figure 7.32: Specimen instrumentation
Figure 7.33: Measuring the relative movement between the bottom and top wythes
Figure 7.34 plots the load deflection relationships of panel C. In this plot, the left vertical
axis shows the applied load in pounds, while the right axis shows the corresponding
uniform load (i.e that results in similar deflection) in pound per square foot. This plot
indicates that the composite panel was able to carry 13.3 kip, which corresponds to a total
positive moment capacity (Measured capacity) equal to 87.9 kip.ft (including the moment
due to the self-weight of the panel and the topping weight). The demand for resisting the
4'
4" Plan
26'
Steel Strain GaugesConcrete Strain Gauges
A (3ft) A (7ft) A (11ft)
Concrete Strain Gauges
Deflection Gauge
Deflection Gauge
A (3ft)
A (3ft)
A (3ft)
A (7ft) A (11ft)
A (7ft) A (11ft)
A (7ft) A (11ft)

185
loads is 89.57 kip.ft, which is 1.9% large than the actual capacity. Also, the nominal
capacity (theoretical capacity) of the composite panel predicted using strain compatibility
approach was found to be 112 kip.ft, which is significantly higher than the actual
capacity. The load-deflection relationships show a linear behavior up to 7 kip. It should
be noted that the point load equivalent to a live load of 100 psf is 8 kip and the
corresponding deflection is 0.85 in. approximately.
Figure 7.34: Load-deflection relationship for the panel C
Figure 7.35 and Figure 7.36 plot the load-strain relationships at the top concrete surface
and in the tension legs of several GFRP ties respectively. Figure 7.35 indicates that the
maximum compressive strain in the concrete at mid-span was 0.00046, which is below
0.003 (ultimate compressive strain). Figure 7.36 indicates that the maximum strain in the
GFRP ties is approximately 0.0067, which occurred at the ties located 3 ft and 7 ft from
the panel end. This strain corresponds to a stress of approximately 40.2 ksi using modulus
of elasticity of 6000 ksi. This stress level is below the design stress of the ties after
012.52537.55062.57587.5100112.5125137.5150162.5175
01,0002,0003,0004,0005,0006,0007,0008,0009,000
10,00011,00012,00013,00014,000
0.0 0.4 0.8 1.2 1.6 2.0 2.4 2.8 3.2 3.6 4.0
Load
, lb
Deflection, in.
Load
, psf
Cracking Load
Service Load
Deflection for Uncracked Section

186
considering the exposure and interaction coefficients (110 x 0.7 x 0.65 = 50 ksi). Figure
7.36 also indicates that the ties located 3 ft and 7 ft from the panel end have small
differences in the strains values. Ties located 11 ft from panel have strains less than
0.0008 in. That strain corresponds to a stress of approximately 4.8 ksi (i.e. very little
loads was carried by these ties). It also should be noted that the horizontal shear
distribution in the tested panel is the combination of the triangular distribution due to
self-weight and the rectangular distribution due to applied load, which explains why the
strain values are not linearly proportioned to the tie location and why the ties located 11 ft
from the panel end have less strains because there is no shear force due to the applied
load at that location. The measured mid-span deflections under the self-weight and
service load were found to be 0.385 in. and 0.85 in. respectively. Figure 7.37 illustrates
the relative movement between the two connected wythes (bottom wyth and the top
wyth). The figure shows that 0.1 in. is the maximum movement can be occurs between
the two connected wythes. It also should be noted that this movement was recorded for
the end which has no failure.
Figure 7.35: Load-strain relationship at the top concrete surface
02,0004,0006,0008,000
10,00012,00014,000
-500 -450 -400 -350 -300 -250 -200 -150 -100 -50 0
Load
, lb
Strain x 10-6

187
Figure 7.36: Load-strain relationship for GFRP ties at different locations
Figure 7.37: Load-relative movement relationship for connected wytes
01,0002,0003,0004,0005,0006,0007,0008,0009,000
10,00011,00012,00013,00014,000
0 1000 2000 3000 4000 5000 6000 7000 8000
Load
, lb
Strain x 10-6
Distance from panel endA 3 ftA 7 ftA 11 ft
01,0002,0003,0004,0005,0006,0007,0008,0009,000
10,00011,00012,00013,00014,000
-0.10 -0.09 -0.08 -0.07 -0.06 -0.05 -0.04 -0.03 -0.02 -0.01 0.00
Load
, lb
Relative Movement Between The Two Connected Wythes, in.

188
Figure 7.38 shows the mode failure of panel C. Because of the rectangular distribution of
shear diagram between the load and the support, the failure occurred due to the horizontal
shear. The horizontal shear caused the pullout of some ties from the bottom concrete
wythe. No cracks or deformation have been seen or recorded in middle part (between the
two loads) due to the zero shear diagrams in that area.
Figure 7.38: Pull out of GFRP tie at failure

189
B. Using One Point Load
Figure 7.39 shows panel D test setup, where the panel was loaded as simply supported..
Testing was performed by applying one point load at mid-span at 12.67 ft from the center
of the roller. Concrete strain gauges were attached to the top surface to measure the strain
in extreme compression fibers. Specimen deflection was recorded using one
potentiometer located at mid-span; also, the relative movement between the top wythe
and the bottom wythe was recorded. The strains in the GFRP ties were measured. Figure
7.40 shows the GFRP ties strain gauges locations.
Figure 7.39: Test setup for panel D
25'-4"
4'
4" Plan
26'
10"
3" 4" Elevation
12'-8"12'-8"
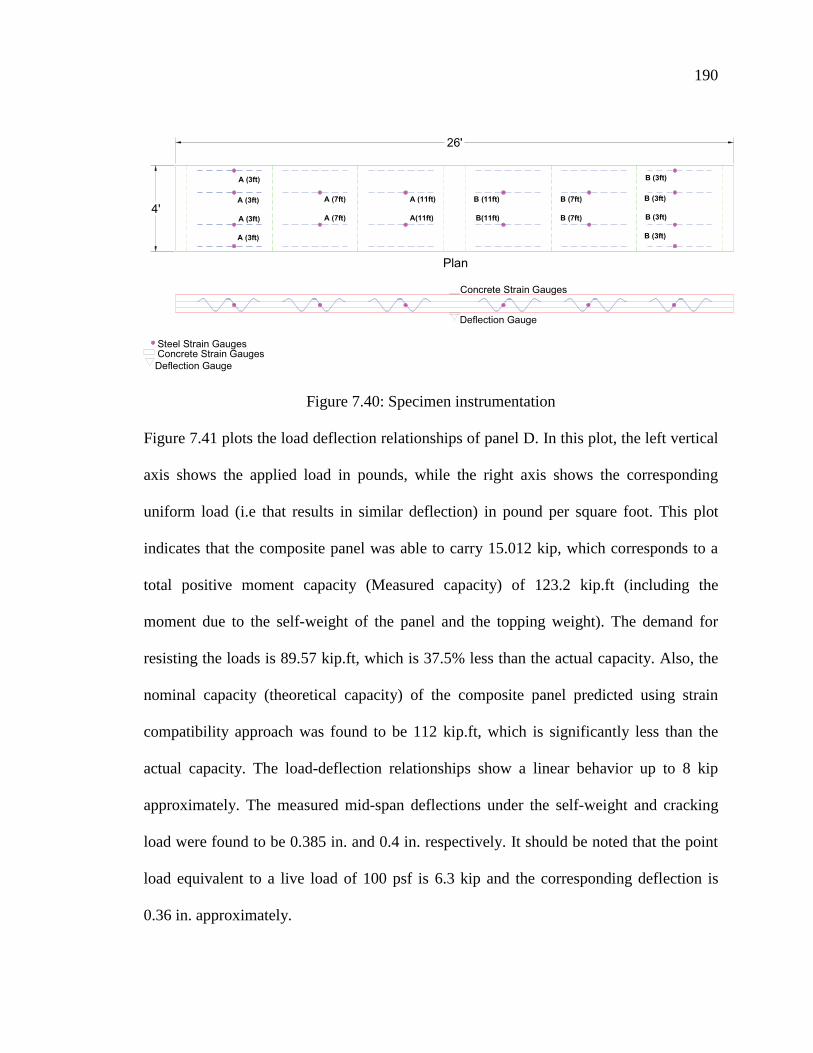
190
Figure 7.40: Specimen instrumentation
Figure 7.41 plots the load deflection relationships of panel D. In this plot, the left vertical
axis shows the applied load in pounds, while the right axis shows the corresponding
uniform load (i.e that results in similar deflection) in pound per square foot. This plot
indicates that the composite panel was able to carry 15.012 kip, which corresponds to a
total positive moment capacity (Measured capacity) of 123.2 kip.ft (including the
moment due to the self-weight of the panel and the topping weight). The demand for
resisting the loads is 89.57 kip.ft, which is 37.5% less than the actual capacity. Also, the
nominal capacity (theoretical capacity) of the composite panel predicted using strain
compatibility approach was found to be 112 kip.ft, which is significantly less than the
actual capacity. The load-deflection relationships show a linear behavior up to 8 kip
approximately. The measured mid-span deflections under the self-weight and cracking
load were found to be 0.385 in. and 0.4 in. respectively. It should be noted that the point
load equivalent to a live load of 100 psf is 6.3 kip and the corresponding deflection is
0.36 in. approximately.
4'
Plan
26'
Steel Strain GaugesConcrete Strain Gauges
Concrete Strain Gauges
Deflection Gauge
Deflection Gauge
A (3ft)
A (3ft)
A (3ft)
A (3ft)
A (7ft)
A (7ft)
B (7ft)
B (7ft)
B (3ft)
B (3ft)
B (3ft)
B (3ft)
A (11ft)
A(11ft)
B (11ft)
B(11ft)

191
Figure 7.41: Load-deflection relationships for the panel D
Figure 7.42 and Figure 7.43plot the load-strain relationships at the top concrete surface
and in the tension legs of several GFRP ties respectively. Figure 7.42 indicates that the
maximum compressive strain in the concrete at mid-span was 0.00161, which is well
below 0.003 (ultimate compressive strain). Figure 7.43 indicates that the maximum
strain in the GFRP ties is approximately 0.0074, which occurred at the ties located 7 ft
from the panel end. This strain corresponds to a stress of approximately 44.4 ksi using
modulus of elasticity of 6000 ksi. This stress level is below the design stress of the ties
after considering the exposure and interaction coefficients (110 x 0.7 x 0.65 = 50 ksi).
Figure 7.43also indicates that the ties located 3 ft, 7 ft, and 11 ft from the panel end have
the same strain behavior, but with small differences in the strains values. It also should be
noted that the horizontal shear distribution in the tested panel is the combination of the
triangular distribution due to self-weight and the rectangular distribution due to applied
0.015.831.647.463.279.094.8110.6126.4142.2158.0173.8189.6205.4221.2237.0252.8
01,0002,0003,0004,0005,0006,0007,0008,0009,000
10,00011,00012,00013,00014,00015,00016,000
0.0 0.5 1.0 1.5 2.0 2.5 3.0 3.5 4.0 4.5 5.0 5.5 6.0 6.5
Load
, lb
Deflection, in.
Load
, psf
Cracking Load Service Load
Deflection for Uncracked Section
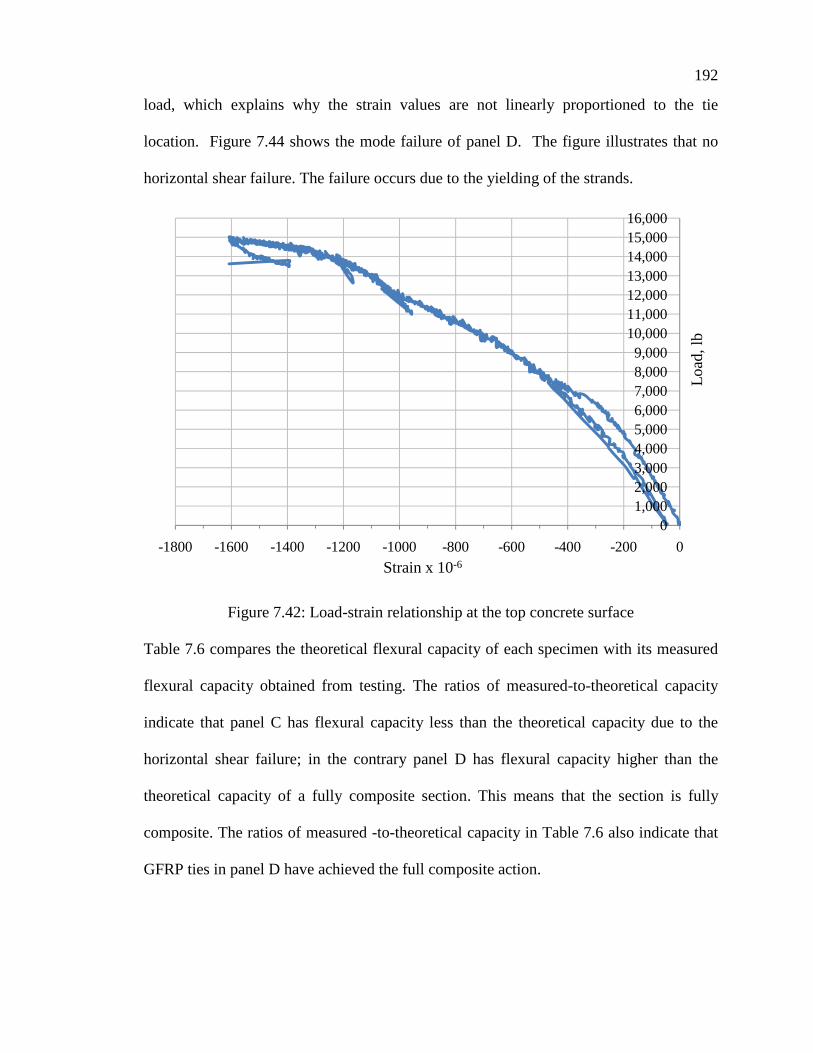
192
load, which explains why the strain values are not linearly proportioned to the tie
location. Figure 7.44 shows the mode failure of panel D. The figure illustrates that no
horizontal shear failure. The failure occurs due to the yielding of the strands.
Figure 7.42: Load-strain relationship at the top concrete surface
Table 7.6 compares the theoretical flexural capacity of each specimen with its measured
flexural capacity obtained from testing. The ratios of measured-to-theoretical capacity
indicate that panel C has flexural capacity less than the theoretical capacity due to the
horizontal shear failure; in the contrary panel D has flexural capacity higher than the
theoretical capacity of a fully composite section. This means that the section is fully
composite. The ratios of measured -to-theoretical capacity in Table 7.6 also indicate that
GFRP ties in panel D have achieved the full composite action.
01,0002,0003,0004,0005,0006,0007,0008,0009,000
10,00011,00012,00013,00014,00015,00016,000
-1800 -1600 -1400 -1200 -1000 -800 -600 -400 -200 0
Load
, lb
Strain x 10-6

193
Figure 7.43: Load-strain relationship for GFRP ties at different locations left side (Top)
and right side (bottom)
0
2,000
4,000
6,000
8,000
10,000
12,000
14,000
16,000
0 1,000 2,000 3,000 4,000 5,000 6,000 7,000 8,000
Load
, lb
Strain x 10-6
Distance from panel end
A 3 ft
A 7 ft
A 11 ft
0
2,000
4,000
6,000
8,000
10,000
12,000
14,000
16,000
0 1,000 2,000 3,000 4,000 5,000 6,000 7,000 8,000
Load
, lb
Strain x 10-6
Distance from panel endB 3 ft
B 7 ft
B 11 ft

194
Figure 7.44: Failure mode of panel D
Table 7.6: Comparing the theoretical against measured flexural capacity of phase II test
specimens
7.6.4.2 Shear Test
The shear test was done on some parts of panels C and D to investigate the shear
behavior of the precast sandwich panel. The following section will discuss the shear
behavior in details.
A. Test 1
Test 1 was done on the middle part of panel C. Figure 7.45 shows the test setup, where
the load was applied at the mid-span at 3.5 ft from the center of the roller. Specimen
deflection was recorded using one potentiometer located at mid-span; also the strains in
the GFRP ties were measured. Figure 7.46 shows the GFRP ties strain gauges locations.
Panel Le
(in.)Mtheoretical
(kip. In.)WO.W
(kip/in.)MO.W
(Kip.in.)Pmeasured
(kip)Mmeasured
(kip. in.)Mtotal.measured
(kip. in.)
Panel C 304 1344 0.0292 336.9 13.3 718.2 1055.1
Panel D 304 1344 0.0292 336.9 15 1140 1476.9
Mtotal.measured / Mtheoretical
0.79
1.10

195
Figure 7.45: Test 1 setup
Figure 7.46: Test 1 specimen instrumentation
Figure 7.47 plots the load deflection relationships of test 1. This plot indicates that the
composite panel was able to carry 30.7 kip, which corresponds to shear capacity
9'
4'
1' Plan
9'
3" 4" Elevation
3'-6"3'-6"
Plan
9'
Steel Strain GaugesDeflection Gauge
Deflection Gauge
4'
Elevation
Left
Left
Left
Left
Concrete Strain Gauges

196
(measured capacity) of 16.6 kip (including the load due to the self-weight of the panel
and the topping weight). The demand is 13 kip.ft, which is 27.7% less than the actual
capacity.
Figure 7.47: Load-deflection relationship for test 1
Figure 7.48 plot the load-strain relationships in the tension legs of several GFRP ties
respectively. Figure 7.48 indicates that the maximum strain in the GFRP ties is
approximately 0.0108, which occurred at the ties located at the left side of the panel end.
This strain corresponds to a stress of approximately 64.8 ksi using modulus of elasticity
of 6000 ksi. This stress level is above the design stress of the ties after considering the
exposure and interaction coefficients (110 x 0.7 x 0.65 = 50 ksi).
Figure 7.49 shows the failure of test 1. The failure occurred due to the horizontal shear.
The horizontal shear caused the pullout of some ties from the bottom concrete wythe
04,0008,000
12,00016,00020,00024,00028,00032,000
0.0 0.1 0.2 0.3 0.4 0.5 0.6 0.7 0.8 0.9 1.0
Load
, lb
Deflection, in.

197
Figure 7.48: Load-strain relationship for GFRP ties at left
.
Figure 7.49: Shear failure of test 1
04,0008,000
12,00016,00020,00024,00028,00032,000
0 2,000 4,000 6,000 8,000 10,000 12,000
Load
, lb
Strain x 10-6

198
B. Test 2 & 3
Test 2 and test 3 were done in two parts of panel D. Figure 7.50 shows the test setup,
where the load was applied at the mid-span at 4 ft from the center of the roller support.
Specimen deflection was recorded using one potentiometer located at mid-span; also the
strains in the GFRP ties were measured. Figure 7.51 shows the GFRP ties strain gauges
locations.
Figure 7.50: Test 2 setup
Figure 7.51: Test 2 specimen instrumentation
Figure 7.52 plots the load deflection relationships of test 2and 3. In this plot, the left
vertical axis shows the applied load in pounds. This plot indicates that the composite
panel was able to carry 21.535 kip and 20.85 kip, which corresponds to shear capacity
4'
6" Plan
9'
8'
6" 6"
4'
Elevation
4'
4'
Steel Strain GaugesDeflection Gauge
9'
Deflection Gauge
Plan
Elevation
Left
Right
Left
Left
Left
Right

199
(measured capacity) of 12.2 kip and 11.8 (including the load due to the self-weight of the
panel and the topping weight). While the demand was 13 kip.ft, which is 6.5% and 10%
higher than the actual capacity for test 2 and 3 respectively. The measured shear capacity
is less that the demand due to the flexural test effects, which decrease the composite
action due to lose in bond between the GFRP ties and the concrete.
Figure 7.52: Load-deflection relationship for test 2&3
Figure 7.53 and Figure 7.54 plots the load-strain relationships in the tension legs of
several GFRP ties. The plot indicates that the maximum strain in the GFRP ties is
approximately 0.00686 and 0.0073 in test 2 and 3 respectively. This strain corresponds to
a stress of approximately 41.16 ksi and 43.7 ksi using modulus of elasticity of 6000 ksi.
This stress level is below the design stress of the ties after considering the exposure and
interaction coefficients (110 x 0.7 x 0.65 = 50 ksi).
0
4,000
8,000
12,000
16,000
20,000
24,000
0.0 0.1 0.2 0.3 0.4 0.5 0.6 0.7 0.8 0.9 1.0
Load
,lb
Deflection, in.
Test 2
Test 3

200
Figure 7.53: Load-strain relationship of GFRP ties for test 2
Figure 7.54: Load-strain relationship of GFRP ties for test 3
0
4,000
8,000
12,000
16,000
20,000
24,000
-8000 -6000 -4000 -2000 0 2000 4000 6000
Load
,lb
Strain x 10-6
Left Ties
Right Ties
0
4,000
8,000
12,000
16,000
20,000
24,000
-8,000 -6,000 -4,000 -2,000 0 2,000 4,000 6,000
Load
, lb
Strain x 10-6
Right ties
Left Ties

201
Figure 7.55 show the mode failure of test 2 and 3. The failure occurred due to the
horizontal shear. The horizontal shear caused the pullout of ties from the top concrete
wythe.
Figure 7.55: Shear failure of test 2 &3

202
7.7 Analytical Models
In order to predict the behavior of precast concrete sandwich floor panels with different
number and distribution of ties, two modeling methods were investigated. The first
method is the planar truss method in which the top-chord members represent the top
wythe, bottom-chord members represent the bottom wythe, and diagonal members
represent tie legs. Figure 7.56 shows the two planar truss models developed for panel A,
B, C, and D. In each model, truss elements are assumed to be located at the centerlines of
actual elements and have the equivalent section properties. For example, the geometric
properties of a diagonal member in the end of the panel A are equal to eight times the
geometric properties of one tie leg. Connections between the diagonal members and top
and bottom chord members are assumed to be pinned with rigid end zone equal to the
portion of tie leg embedded in concrete. The truss models of panel A, B, and D are
assumed to be simply supported and subjected to 6.5 kip, 6.5 kip, and 6.3 kip one point
loads respectively, while panel C model subjected to 4 kip two point load which
represents the equivalent service live load 100 psf in terms of deflection.

203
Figure 7.56: Truss models of panel A, B, C, and D
The second modeling method is developing three-dimensional FE models in which the
top and bottom wythes are modeled as shell elements, and tie legs are modeled as frame
elements. Figure 7.57 shows the model developed for the panel A, B, C, and D. In each
model, shell and frame elements are assumed to be located at the centerlines of actual
elements and have their exact section properties. Connections between the frame and
shell elements are assumed to be pinned with rigid end zone equal to the portion of tie leg
embedded in concrete. Also the FE models of panel A, B, and D are assumed to be
simply supported and subjected to 6.5 kip, 6.5 kip, and 6.3 kip point loads respectively,
while panel C subjected to 4 kip two point load which represents the equivalent service
live load 100 psf in terms of deflection. Figure 7.58, Figure 7.59, Figure 7.60, and Figure
7"
26'1'4'4'4'4'4'4'1'
8 Ties 6 Ties 4 Ties
Panel A
9"9"4'4'4'4'4'4'
4Ties 2 Ties
7"
26'
Panel B
Beam element 1 Beam element 2
Beam element 5Beam element 1Beam element 4 Beam element 3
Beam element 1
4'
3"
Beam element 2
4'1'
Beam element 3
4'
3"
Beam element 4
4'
3" 7"
Beam element 5
4'9"
4'
4"Beam element 6
4'
3"Beam element 7
4Ties
4'4'4'1'4'4'4'
Panel C and D
Beam element 6 Beam element 7
6.5"
6"6"

204
7.61 illustrate the deflection values for the truss model and the deflection contour lines
for FE model of panel A, B, C, and D respectively under service load. Also the analysis
results of the truss and FE models are listed in Table 6.4.
Figure 7.57: 3D FE model of panel A, B, C, and D
Panel A
Panel B
Panel C and D
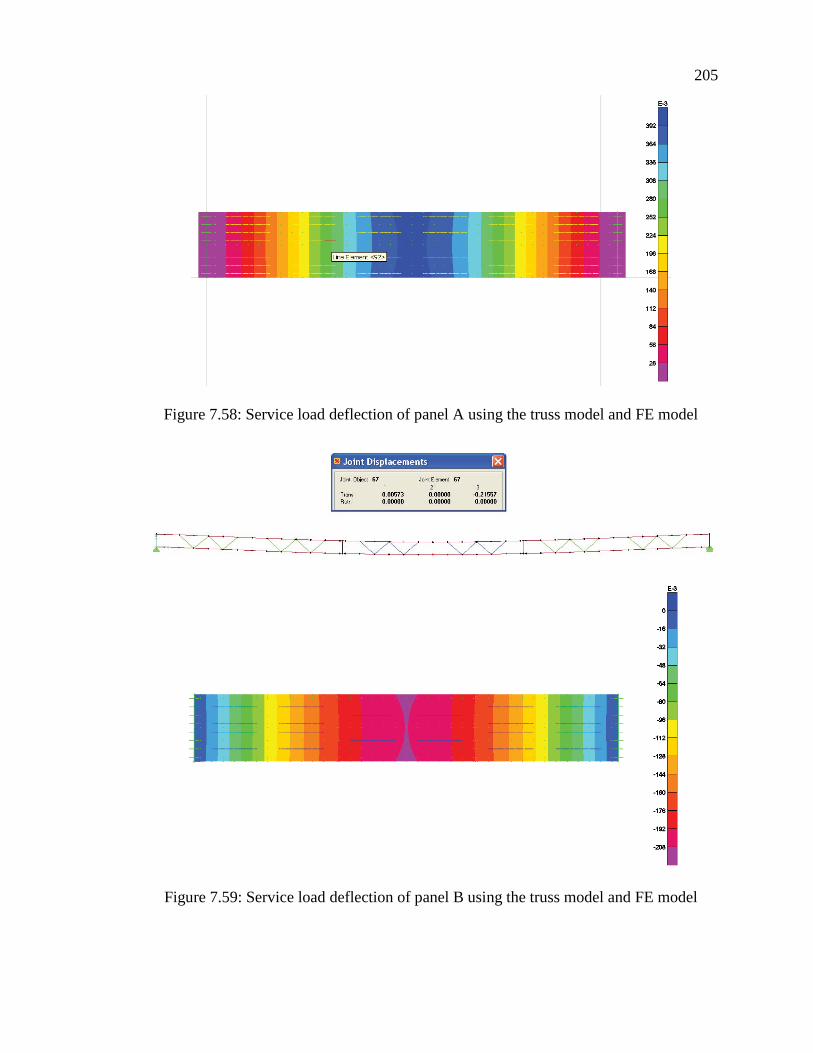
205
Figure 7.58: Service load deflection of panel A using the truss model and FE model
Figure 7.59: Service load deflection of panel B using the truss model and FE model

206
Figure 7.60: Service load deflection of panel C using the truss model and FE model

207
Figure 7.61: Service load deflection of panel D using the truss model and FE model
Table 7.7 presents the theoretical deflections of the four specimens calculated using truss
and FE models under 6.5 kip point load applied at mid-span. Comparing these values
against the actual deflections measured during testing indicates that both planar truss
models and 3D FE models provide very reasonable estimates of panel defections under
service load. Also it is shown that there is a high difference between the analytical
deflection model and the actual deflection for panel D. This difference was due to
problems in measuring the actual deflection, which lead to inaccurate values.

208
Table 7.7: Comparing the theoretical against measured flexural capacity of phase II test
specimens
Figure 7.62 shows the values of the camber and self-weight deflection obtained from the
analytical models of panel C and D. the final deflection after subtract the camber is 0.35
in. which is very close to the obtain values using the leaser
Panel Le
(in.)E(ksi) Ig (in.4) P (Kip) Dtruss (in.) DFE (in.) Dactual (in.)
Dactual
/ Dtruss
Dactual
/ DFE
Panel A 308 5813 2975 6.5 0.38 0.39 0.40 1.05 1.03
Panel B 308 5813 3016 6.5 0.22 0.21 0.20 0.91 0.95
Panel C 304 6112 3370 8* 0.78 0.72 0.85 1.09 1.18
Panel D 304 6112 3370 6.3 0.693 0.65 0.36 0.52 0.55* Two point load each one equal 4 kip
Camber of panel C and D

209
Figure 7.62: Camber and self-weight deflection of panel C and D
7.8 Embedment Depth of GFRP Ties
The common failure in sandwich panel is the horizontal shear failures due to the pull out
of the GFRP ties from the concrete wythes. In this section, experimental work performed
to investigate the capacity of three specimens made of 1/4, 3/8, and 1/2 in. diameter
GFRP ties with embedment depths ranging from 0.5 in. to 2.5 in. Each specimen was a
26 ft long, 4 ft wide and 4 in. thick slab with 12 GFRP-ties embedded at 2 ft spacing as
shown in Figure 7.63. The slabs were reinforced with 3#3 bars in the longitudinal
direction and made of 8 ksi self-consolidating concrete. Three ties were embedded at
each of the four-embedment depths shown in Table 7.8 (total of 12 ties per size).
Deflection due to self-weight of panel C and D
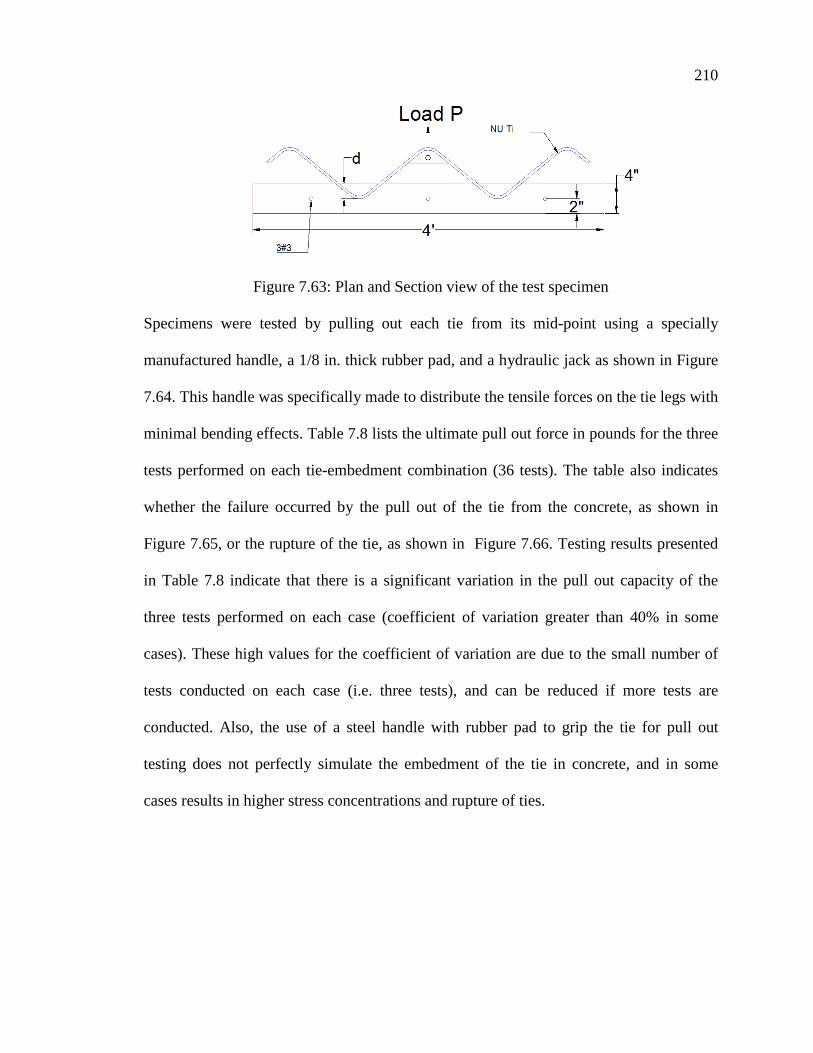
210
Figure 7.63: Plan and Section view of the test specimen
Specimens were tested by pulling out each tie from its mid-point using a specially
manufactured handle, a 1/8 in. thick rubber pad, and a hydraulic jack as shown in Figure
7.64. This handle was specifically made to distribute the tensile forces on the tie legs with
minimal bending effects. Table 7.8 lists the ultimate pull out force in pounds for the three
tests performed on each tie-embedment combination (36 tests). The table also indicates
whether the failure occurred by the pull out of the tie from the concrete, as shown in
Figure 7.65, or the rupture of the tie, as shown in Figure 7.66. Testing results presented
in Table 7.8 indicate that there is a significant variation in the pull out capacity of the
three tests performed on each case (coefficient of variation greater than 40% in some
cases). These high values for the coefficient of variation are due to the small number of
tests conducted on each case (i.e. three tests), and can be reduced if more tests are
conducted. Also, the use of a steel handle with rubber pad to grip the tie for pull out
testing does not perfectly simulate the embedment of the tie in concrete, and in some
cases results in higher stress concentrations and rupture of ties.

211
Table 7.8: GFRP-tie size-embedment combinations and test results
Figure 7.64: Test specimen and setup
Figure 7.67 plots the average of three tests for each tie-embedment combination. This
histogram clearly indicates that the deeper the GFRP-tie embedment, the higher the pull
out force. It also shows that the smaller the bar size, the higher the probability of the bar
�����;� �����;� �����;����1���-/�
*2������������������
<�������
� "%!������������ $.&�������������� (!.�������������� #$%%�&$' (%%�������������� #�(&
� !�!.&��������� "�#!"���������� "�'#)���������� (���)$*'$)� "�##%���������� #�$#
� (�(.!��������� "�$#&���������� !�(&(���������� (���)$*'$)� "�(')���������� #�$"
� (�"$$��������� (�!(&���������� "�"'.���������� (���)$*'$)� "�'.#���������� #�!'
� � %"%������������ &"(�������������� $).�������������� #$%%�&$' %$"�������������� #�!$
� !�%.$��������� .#&�������������� !�$(!���������� #$%%�&$' !�(!#���������� #�")
� (�#.!��������� (�%($���������� !�&'&���������� #$%%�&$' "�))#���������� #�(%
� &�!$%��������� &�(')���������� %�%&%���������� (���)$*'$)� &�#("���������� #�#)
� !�(.&��������� "�$$%���������� "�#.(���������� #$%%�&$' !�.)'���������� #�")
� (�%%&��������� %�%(.���������� %�%&%���������� #$%%�&$' $�'')���������� #�"$
� )�$%(��������� $�!..���������� )�&#&���������� #$%%�&$' &�$!.���������� #�(#
� !#�"()������ &�'#$���������� '�##%���������� (���)$*'$)� '�($.���������� #�"!
=�������+�/��8��= ��������������
��� �
6�8�/�������������� �
�>
�>�
�>�

212
rupture before pulling out from the concrete. The use of large bar sizes with small
embedment depths does not improve the tie capacity, as it reduces the amount of concrete
around the bar and increases the probability of the tie to pull out from concrete.
Figure 7.65: Pull-out of the tie from the concrete
Figure 7.66: Rupture of the tie

213
Figure 7.67: Average ultimate load for different tie size and embedment combination
From the previous results, the following conclusion can be mad
� The deeper the GFRP-tie embedment, the higher the pull-out force. Also the smaller
the bar size, the higher the probability that the bar will rupture before pulling out from
the concrete.
� Using large bar sizes with small embedment depths does not improve the tie capacity,
as it reduces the amount of concrete around the bar and increases the probability of
the tie to pull out from concrete.
� The minimum embedment depth recommended for GFRP ties is as follows:
- 1.5 in. for 1/4 in. diameter ties
- 2.0 in. for 3/8 in. diameter ties
- 2.5 in. for 1/2 in. diameter ties

214
7.9 Summary
Based on the results of the experimental and analytical investigations, the following
summaries are made:
1. The fabrication of proposed panels using the procedure presented in the paper is
simple, efficient, economical, and does not required specialized equipment
2. The number and distribution of ties required to achieve full composite action
should be calculated using the PCI Design Handbook method for horizontal shear
in composite members. This distribution should be follow the shear diagram , for
example using triangular distribution of the horizontal shear along the shear span
in case of uniform loads.
3. The proposed panels A, B, D have full composite action under ultimate load.
Their ultimate flexural capacity exceeded the theoretical capacity calculated using
strain compatibility, on the contrary panel C doesn’t reached the capacity which
prove the last the shear connector distribution concept.
4. Calculating deflections of the proposed floor panels using the truss models and FE
models results in consistent and realistic deflection predictions. Truss models are
recommended due to their simplicity and computational efficiency.

215
Chapter 8
SUMMARY, CONCLUSIONS AND RECOMMENDATIONS FOR Future WORK
8.1 Summary
The only option for constructing flat soffit shallow floors in multi-story buildings is using
post-tensioned cast-in-place concrete flat slab, which is complicated, costly, and time-
consuming. Current precast concrete floor systems require the use of beam ledges to
support hollow core planks and column corbels to support beams, which result in
projections that further reduce the clear floor height in addition to the already low span-
to-depth ratio. Moreover, conventional precast floor systems do not have adequate
resistance to lateral loads without shear walls. The proposed floor system solves this
problem by developing a flat soffit shallow precast concrete floor system that is
eliminates the need for beam ledges and column corbels, and provides a flat soffit. This
system has adequate resistance to lateral loads, which minimizes need for shear walls,
and makes it a total precast floor that can be rapidly erected without false or formwork
operations that are time-consuming and labor intensive. Economy, structural efficiency,
ease and speed of construction, and aesthetics are the main advantages of the proposed
system. The dissertation presented the construction sequence and summarized the design
of the proposed system for six-story building with 30 ft x 30 ft bay size under 100 psf live
load and lateral loads such as wind loads and seismic loads. Full-scale testing of beam-
column connection without corbel, the HC-beam connection without ledge and flat soffit
beam indicated that the proposed system components and connections are practical,
economical, and have adequate structural capacity for the design loads.

216
Also the dissertation discussed the development of new precast/prestressed panels for
floor systems that is alternative to HC planks. The proposed panels are sandwich panels
that have comparative weight and structural capacity to HC planks while being efficient
in thermal and sound insulation. These panels can be easily produced, as they do not
require specialized equipment for fabrication, which eliminates the need for high initial
investment. The proposed floor panels consist of an internal wythe of insulation and two
external wythes of concrete similar to precast concrete sandwich wall panels. The two
concrete wythes are designed to be fully composite using shear connectors. To minimize
the reduction of thermal performance of the shear connectors, GFRP-tie was introduced
for its superior thermal resistance and structural strength. Four full-scale testing of
sandwich panel with different tie distribution was tested. The test result indicated that the
proposed panels practical, easy to produce, and have adequate structural capacity for the
design loads.
8.2 Conclusions
Below are the main conclusions of this research:
1. The proposed flat soffit beam continuity system has adequate flexural capacity at
the positive and negative moment sections to resist both gravity and lateral loads.
This capacity can be accurately predicted using strain compatibility approach.
2. The proposed beam-column connection has adequate capacity to carry gravity
loads. This capacity can be accurately predicted using shear friction theory.
3. The proposed composite HC continuity system has adequate negative moment
capacity to resist lateral loads. This capacity can be accurately predicted using
strain compatibility approach.

217
4. All beam-HC connections performed very well in all tests as their capacities
exceeded the predicted capacities and significantly exceeded the demand. None of
these connections has failed as the tested HC planks failed in shear prior to the
failure of the connections.
5. The ratios of experimental-to-theoretical capacity of the full-scale specimens do
not only indicate the efficiency of the proposed system but also the consistency of
its performance.
6. The capacity of the proposed HC-beam connection can be accurately predicted
using shear friction theory.
7. Since the shear capacity of the HC-beam connections without steel angle was
adequate, steel angles are considered as temporary ledges that do not affect the
fire rating of the building.
8. The fabrication of proposed sandwich panels using the procedure presented in
chapter 7 is simple, efficient, economical, and does not required specialized
equipment
9. The number and distribution of ties required to achieve full composite action
should be calculated using the PCI Design Handbook method for horizontal shear
in composite members. This distribution should be following the shear diagram,
for example using triangular distribution of the horizontal shear along the shear
span in case of uniform loads.
10. The proposed panels A, B, D have full composite action under ultimate load.
Their ultimate flexural capacity exceeded the theoretical capacity calculated using
218
strain compatibility. On the contrary, panel C does not reached the capacity,
which proves the shear distribution concept.
11. Calculating deflections of the proposed floor panels using the truss models and FE
models results in consistent and realistic deflection predictions. Truss models are
recommended due to their simplicity and computational efficiency.
8.3 Recommendations for Future Works
Several experimental investigations were conducted to examine the seismic behavior of
precast concrete moment-resisting frames and connections, none of these investigations
have dealt with flat soffit shallow precast beams with no corbels and continuity
connections similar to those of the proposed system. Therefore, the proposed system and
its connection should be redesign and test for high seismicity zones (Seismic Design
Categories E, and F). There is a need for experimentally investigate the proposed interior
and exterior beam-column connections for their strength, failure mode, stiffness
degradation, ductility, and energy dissipation under cyclic loads. These connections may
include a non-post-tensioned connection and a post-tensioned hybrid connection with
mild steel reinforcement for both interior and exterior columns. Figure 8.1 shows the
proposed test setup as well as an example beam-column connection. Test procedures will
comply with the scheme specified in the ACI document “Acceptance Criteria for Moment
Frames Based on Structural Testing”. The output of these tests will include the lateral
load versus story drift response, cracking pattern, failure mode for forward and backward
loading cycles, and bond degradation among precast concrete, grout, and reinforcement.
Also a refined structural analysis of six-story building will be conducted using finite

219
element to account for mass distribution and determine the dynamic response of the
structure.
Figure 8.1: Proposed Testing Setup and a Preliminary Design of Post-tensioned Hybrid
Connection
7"4"
2"10"
3" 19#8
HSS 10x8x12
3x38" plate
4x38" plate
6"
3x2x38"
4'
1'-8"
19-0.6"
6#42"
3" PT

220
REFERENCES
American Concrete Institute, (ACI), (2008). Building Code Requirements for Structural Concrete and Commentary, June. Farmington Hills, Michigan. American Institute of Steel Construction, (AISC), (2008). Steel Construction Manual, Thirteenth Edition.
American Society of Civil Engineers (ASCE 7-05), (2005).Minimum Design Loads for Buildings and Other Structures. Reston, Virginia.
Board of Federation International Du Beton (FIB) Steering Committee, (1999) “Special Design consideration for Precast Prestressed Hollow Core floors,” No. 6, October 1999.
Compton, L. A. (2002) “Retractable Hangers for Mounting Precast Concrete Beams and the Like in Buildings” US Patent number 2002/0062616 A1.
Composite Dycore Office Structures (1992), Company literature - Finforck Industries, Inc., Orlando, Florida.
Computers and Structures, Inc. (2000). “Structural Analysis Program Advanced 14.1.0”, Berkeley, CA.
Fawzy F. (2009) “Shallow Precast Concrete Hollow-core Floor System” Master Thesis, University of Nebraska-Lincoln.
Girder-Slab Technologies LLC of Cherry Hill, NJ. (2002). Composite steel and precast system, Design Guide V.1.4. http://www.girder-slab.com/designguide.asp.
Hanlon J., Dolan C. W., Figurdki D., Deng J., and Dolan J. G., (2009) “Precast concrete building system components for the Westin Resort Hotel” part 1, PCI Journal, Vol. 54, No. 2 Spring, pp.88-96.
John C., (2003) “Coordinated Construction,” Modern Steel Construction, July.

221
Hanlon, J.W. (1990) “Building System Using Modular precast Concrete Components” United States Patent, Patent number: United States Patent, Patent number 4,903,448.
Low S., Tadros M. K., and Nijhawan J. C., (1991) “A New Framing System for Multistory Buildings," Concrete International, Vol. 13, No. 9, September, pp. 54-57.
Low S., Tadros, M., Einea A., and Magana, R., (1996 ) “Seismic Behavior of a Six Story Precast Concrete Office Building,” PCI Journal, Vol. 41, No. 6, November/December, pp.56-75. Mid-State filigree Systems, Inc. 1992 “The Filigree Widesslab Method of concrete Deck Construction” Company Literature –, Cranbury, NJ
Morcous. G. and Tadros K. M., (2010) “Shallow Flat Soffit Precast Concrete Floor System” 3rd fib International Congress, Washington, D.C.
Pessiki S., Prior R., Sause R., and Slaughter S., (1995) “Review of Existing precast concrete gravity load floor framing systems”. PCI Journal, Vol. 40, No. March-April, pp.70-83
Precast/Prestressed Concrete Institute. (1998). Design of Hollow Core Slabs Manual 2nd Edition, Chicago, Illinois
Peter A. N., (2001) “Steel and Precast Slab Construction System for Mid and High Rise Residential Buildings,” Modern Steel Construction, May.
Prestressed Concrete Institute (PCI), (2005). PCI Design Handbook, 6th Edition, Chicago, IL.
Post Tensioning Institute (PTI). (2006). Post-tensioning Manual 6th Edition, Phoenix, Arizona.
Peikko Group, Peikko News, (2010) “Delta Beam Composite Beams” http://www.peikko.com, june 12

222
Quincy Joist Company, (2012), “Standard Specifications for Joist Girders”]. http://www.quincyjoist.com/resources/downloads/default.asp, February 6
Reay, A. M. (1997) “Method of Construction Using Precast Floor Units” US, Patent number 5,660,020.
Rahimzadeh, H. (2003) “Composite Structural Framing System” US Patent number 6,543,195 B2.
Rafael B., and Orid P., (2010) “NEW Precast Light Flooring System” 3rd fib International Congress .
RSMeans Construction publishers & Consultants, 2011. “RSMeans Building Construction Cost Data” Kingston, MA
Simanjuntak, J. H. (1998) “System for Joining Precast Concrete Columns and Slabs” US, Patent number 5,809,712.
Steel Joist Institute (SJI). (2007). First Edition Composite Steel Joist Catalog.
Tadros M. K., Salmon D. C., Einea A., and Culp T. D. “Precast Concrete Sandwich Panels," US Patent number 5,440,845, 1995.
Tadros, k. M., and Low, S. (1996) “Concrete Framing System” US Patent number 5,507,124.
Thompson and Pessiki, (2004) “Behavior and Design of Precast/Prestressed Inverted Tee Girders with Multiple Web Openings for Service Systems,” ATLSS Report 04-07, Lehigh University, pp. 156.
Veitas R., (2002) “Slab Solution,” Modern Steel Construction, May.
Wise, H. H. (1973) “Composite Concrete Construction of Two-Way Slabs and Flat Slabs” US Patent number 3,763,613.

223
Wise, H. H., and Meade, B. (1978) “Building Structure Utilizing Precast Concrete Elements” US Patent number 4,081,935, Apr. 4, 1978.

A-1
Appendix A
DETAILED DESIGN EXAMPLE FOR SHALLOW FLAT SOFFIT PRECAST
CONCRETE FLOOR SYSTEM (BEAM WITH SHEAR KEY)
The design was done on a 6-story building for estimating design loads. The following Figure shows plane, elevation, and side views of the example building
Plane, elevation, and side views for the example building
1. Design of Hollow Core (HC)
Hollow core planks are designed as simply supported composite beam with loads including self-weight, topping weight, and live load.
Beamwidth 4ft�� HCwidth 4ft��
HCspan 30ft��
Clearspan.HC.direction HCspan Beamwidth 26 ft����
LHC Clearspan.HC.direction 26 ft����

A-2
Positive Moment
Design
The HC will be designed according to the design chart of the 10'' thick HC with 2'' composite topping used in the example building. This chart obtained from the HC Load Tables produced by Concrete Industries, Inc. The chart is very simple to use for a typical building floor. Given the Load in psf (live load and superimposed dead load), as shown in the vertical axis, the maximum span of a specific HC size is obtained in feet, as shown in the horizontal axisFor other types of HC produced by other manufacturer, the manufacturer tables should be used on the generic spreadsheet.
Hollow -Core Continuity will be design according to the lateral loads (Wind and Seismic loads)
Precast section properties
HCsw HCweight.sq.ftHCwidth� 0.3kipft����
Averg thickness.top 2.5in�� � c 0.15kip
ft3��
Topsw.sq.ft Avergthickness.top � c� 0.03kip
ft2����
LL 0.1kip
ft2��
WHC.DL HCsw Topsw.sq.ft HCwidth� � 0.43kipft����
WLL LL HCwidth� � 0.4kipft����
MHC WHC.DL 1.2�LHC
2
8�
WLL 1.6� LHC2�
8 97.17 kip ft�����
IHC 3214in4�� AHC 267in2��
hHC 10 in�� Yb.HC 5.04 in��
Yt.HC hHC Yb.HC 4.96 in����

A-3
Composite section
fctop 4000 psi�� fcHC 6000 psi��
nHCfctopfcHC
���
���
0.5
0.82���
hcHC 12 in�� ttop 2.5 in��
dtop hHCttop
2 11.25 in����
Ybc.HCAHC Yb.HC� � ttop HCwidth� nHC� dtop� ��� ��
AHC ttop HCwidth� nHC�
���
���
6.71 in����
Ytc.HC hcHC Ybc.HC 5.29 in����
Ic.topnHC HCwidth� ttop
3�
12nHC HCwidth� ttop� Ytc.HC
ttop2
���
���
2
���
Ic.top 1.65 103� in4��
Ic.HC IHC AHC Ybc.HC Yb.HC �2���
�� Ic.top 5.61 103� in4����

A-4
Design
Use D.11 @ 6 in
Moment at the bottom fibers
2. Shallow Inverted Tee (SIT) Beam Design
2.1 Section Properties
fyb.welded.wire 75ksi��� 1HC 0.75��
� c 0.003��
Try
C comp.block 0.36in��
acomp.block Ccomp.block � 1HC� 0.27 in����
� steel.1 � cdtop Ccomp.block �
Ccomp.block� 0.09���
Forcecomp 0.85 fcHC� HCwidth� acomp.block� 66.1 kip����
Ab3 0.11in2��
AsteelAb3 HCwidth�
6in0.88 in2����
Forceten Asteel fyb.welded.wire� 66 kip����
MnHC.comp. Forcecompacomp.block
2� Forceten dtop� 62.62ft kip����
� 0.9�� � MnHC.comp.� 56.36 kip ft���
W 1 48in�� h 1 10 in��

A-5
From ACI 318-08 section 8.12
2.1.1 Non-Composite Section
2.1.2 Composite Section
A1 W1 h1� 480 in2���� t 2.in��
h2 t 2 in���� W1 16 h2� 80 in��
beff W1 16 h2� 80 in����
W 2 b eff 80 in���� A2 W2 h2� 160 in2����
hnc h1 10 in���� hc hnc h2 12 in����
Anc A1 480 in2���� Ynch12
5 in����
Ybnc Ync 5 in���� Ytnc hnc Ync 5 in����
IncW112
h1 �3� A1 Ybnch12
���
���
2
����
��� 4 103� in4����
SbncInc
Ybnc800 in3���� Stnc
IncYtnc
800 in3����
Fcbeam 8000psi�� Fctop 4000psi��
nFctop
Fcbeam
���
���
0.71���
Ac Anc A2 n� 593.14 in2����
YcAnc Ync� A2 n� hnc
h22
���
����
���
���
Ac6.14 in����
Ybc Yc 6.14 in���� Ytc hnc h2 � Ybc 5.86 in����
IcA1 W1h1
3
12� A1 Ybc
h12
���
���
2
� 4.63 103� in4����

A-6
2.2 Loads
Bending moments Calculations
Stage one:
Simple supported non-composite section under beam self-weight, and HC self-weight
IcA2 W2h2
3
12� A2 h1
h22
Ybc ���
���
2
� 3.83 103� in4����
Ic IcA1 IcA2 8.45 103� in4����
Inter beam.span 30ft�� Exterbeam.span 28ft��
Span HC.direction 30ft�� Column width 20 in��
Spanexternal.beam Exterbeam.span Columnwidth 0.167ft 26.17 ft����
Spaninternal.beam Interbeam.span Columnwidth 0.167ft 28.17 ft����
Spanbeam.Avg.Spanexternal.beam Spaninternal.beam �
227.17 ft����
Wbeam Anc � c� 0.5kipft���� HCsw 0.3
kipft��
WH.C HCswLHC
4ft� 1.95
kipft����
WD.L Wbeam WH.C 2.45kipft����
Wtop Avergthickness.top � c� SpanHC.direction� 0.94kipft����
WHc.and.top Wtop WH.C 2.89kipft����
WL.L LL SpanHC.direction� 3kipft����

A-7
Stage Two:
Continuous non-composite section under topping weight
Stage Three:
Continuous composite section under live loads
Mnon.comp.simple.external.beamWD.L Spanexternal.beam
2
8209.68 kip ft�����
Mnon.comp.simple.internal.beam WD.LSpaninternal.beam
2
8� 242.96 kip ft�����
Vnon.comp.external.beam WD.LSpanexternal.beam
2� 32.05 kip����
Mnon.comp.con.external.beam WtopSpanbeam.Avg.
2
14� 49.42 kip ft�����
Mnon.comp.con.internal.beam WtopSpanbeam.Avg.
2
16� 43.24 kip ft�����
Mnegative.non.simple.comp. Wtop Spanbeam.Avg.
2
11� 62.9 kip ft�����
Vnon.comp.con.external.beam 1.15WtopSpanbeam.Avg.
2� 14.64 kip����
Mcomp.con.external.beam WL.LSpanbeam.Avg.
2
14� 158.14 kip ft�����
Mcomp.con.internal.beam WL.LSpanbeam.Avg.
2
16� 138.38 kip ft�����
Mnegative.comp. WL.L Spanbeam.Avg.
2
11� 201.28 kip ft�����
Vcomp.con.external.beam 1.15 WL.L�Spanbeam.Avg.
2� 46.86 kip����

A-8
Factor moments in non-composite section
Factor moments in composite section
Factor Shear in non-composite section
Mn.c.s.ex Mnon.comp.simple.external.beam 209.68 kip ft�����
Mn.c.c.ex Mnon.comp.con.external.beam 49.42 kip ft�����
Mnon.comp.external.beam 1.2 Mn.c.s.ex� 1.2 Mn.c.c.ex� 310.92 kip ft�����
Mn.c.s.in Mnon.comp.simple.internal.beam 242.96 kip ft�����
Mn.c.c.in Mnon.comp.con.internal.beam 43.24 kip ft�����
Mnon.comp.internal.beam 1.2 Mn.c.s.in� 1.2 Mn.c.c.in� 343.44 kip ft�����
Mnegative.non.comp.f 1.2 Mnegative.non.simple.comp.� 75.48 kip ft�����
Mc.c.ex 1.6Mcomp.con.external.beam 253.03 kip ft�����
Mc.c.in 1.6 Mcomp.con.internal.beam� 221.4 kip ft�����
Mcomp.external.beam Mnon.comp.external.beam Mc.c.ex 563.96 kip ft�����
Mcomp.internal.beam Mnon.comp.internal.beam Mc.c.in 564.85 kip ft�����
Mn.c 1.6 Mnegative.comp.� 322.04 kip ft�����
Mnegative.comp Mnegative.non.comp.f Mn.c 397.52 kip ft�����
Vn.c.s.ex 1.2 Vnon.comp.external.beam� 38.46 kip����
Vc.c.ex 1.2 Vnon.comp.con.external.beam� 17.57 kip����
Vnoncomposite Vn.c.s.ex Vc.c.ex 56.04 kip����
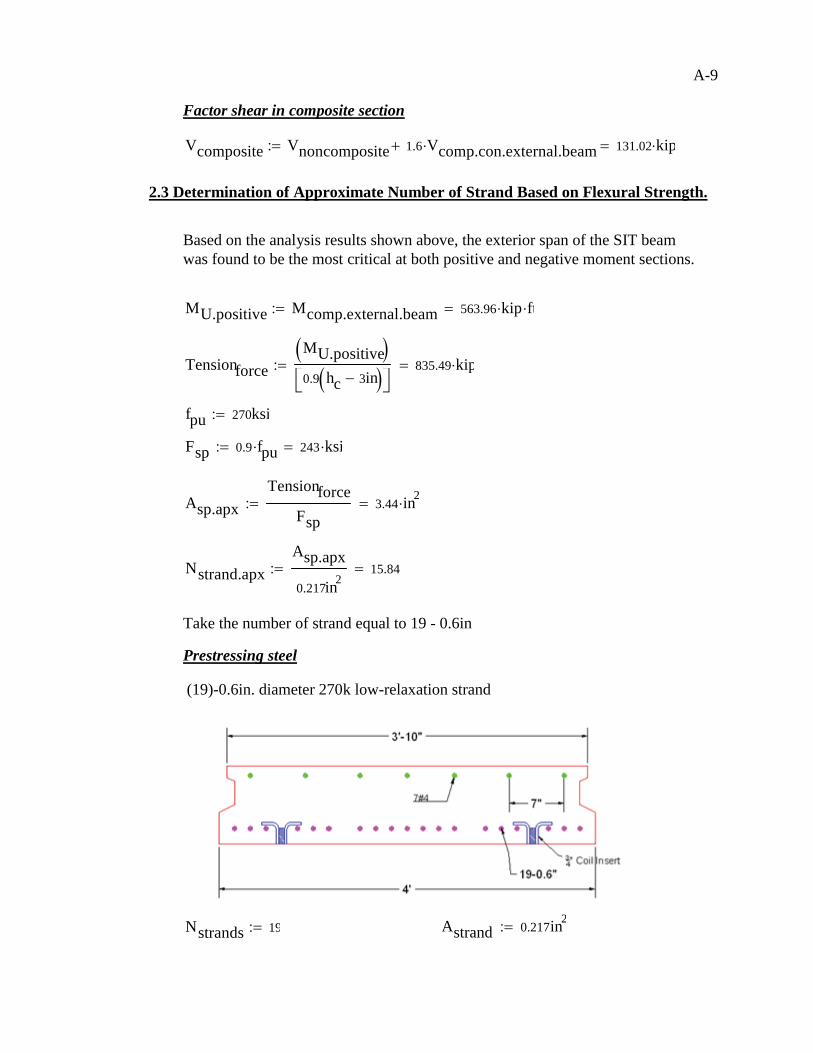
A-9
Factor shear in composite section
2.3 Determination of Approximate Number of Strand Based on Flexural Strength.
Based on the analysis results shown above, the exterior span of the SIT beam was found to be the most critical at both positive and negative moment sections.
Take the number of strand equal to 19 - 0.6in
Prestressing steel
(19)-0.6in. diameter 270k low-relaxation strand
Vcomposite Vnoncomposite 1.6 Vcomp.con.external.beam� 131.02 kip����
MU.positive Mcomp.external.beam 563.96 kip ft�����
TensionforceMU.positive �0.9 hc 3in ��� ��
835.49 kip����
fpu 270ksi��
Fsp 0.9 fpu� 243 ksi����
Asp.apxTensionforce
Fsp3.44 in2����
Nstrand.apxAsp.apx
0.217in215.84���
Nstrands 19�� Astrand 0.217in2��

A-10
2.4 Prestress losses
Prestress loss calculations performed according to the PCI Design Handbook 6th Edition method outlined in section 4.7.
Aps Nstrands Astrand� 4.12 in2���� Yps 2in��
e Ync Yps 3 in����
fci.beam 6500psi�� fc.beam 8000psi��
Ag Anc 480 in2���� Ig Inc 4 103� in4����
V 1in Anc �� 480 in3���� S 2 W1 hnc �� 116 in����
RH 70��V
S4.14 in2��
Aps 4.12 in2�� e 3 in��
fpu 270 ksi�� fpj 0.75 fpu� 202.5 ksi����
Pi fpj Aps� 834.91 kip����
Eps 28500ksi��
Eci 57000psi0.5 fci.beam� 4.6 103� ksi����
Ec 57000 psi0.5� fc.beam� 5.1 103� ksi����
MgWbeam Spanexternal.beam
2
842.79 kip ft�����
MdlHCsw
1ft
LHC4
�Spanexternal.beam
2
8�
���
���
WtopSpanexternal.beam
2 �8
���
M dl 247.13 kip ft���

A-11
2.4.1Elastic Shortening Losses
For pretension members
For pretension members
2.4.2 Creep Losses
For normal weight concrete
2.4.3 Shrinkage Losses
For pretension members
2.4.4 Relaxation Losses
Kes 1��
Kcir 0.9��
fcir KcirPiAg
Pie2
Ig�
����
����
� Mge
Ig� 2.87 ksi����
ES KesEpsEci� fcir� 17.81 ksi����
Kcr 2��
fcds Mdle
Ig� 2.22 ksi����
CR KcrEpsEc� fcir fcds �� 7.23 ksi����
Ksh 1��
SH 8.2 10 6 � Ksh� Eps� 1 0.061
in2
V
S�
���
���
���
���
� 100 RH ( )� 5.27 ksi����
K re 5000 psi��
J .037��
C 1��
RE Kre J SH CR ES( )� �� �� C� 3.88 ksi����
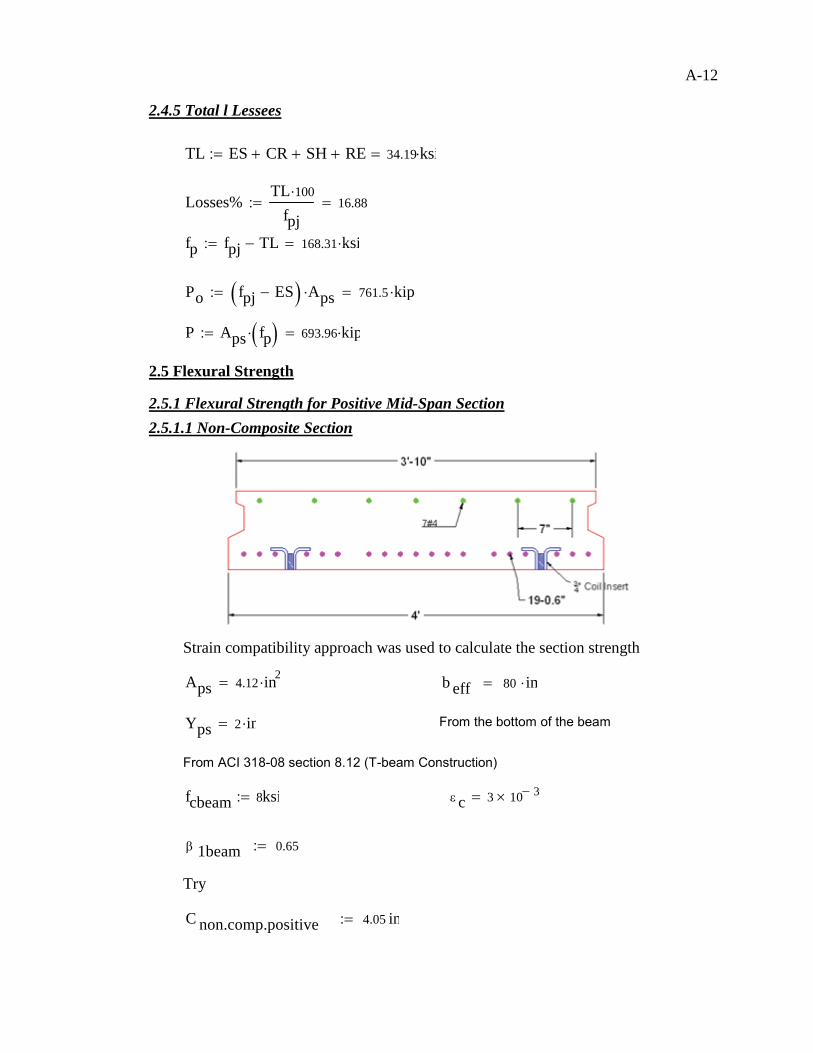
A-12
2.4.5 Total l Lessees
2.5 Flexural Strength
2.5.1 Flexural Strength for Positive Mid-Span Section 2.5.1.1 Non-Composite Section
Strain compatibility approach was used to calculate the section strength
From the bottom of the beam
From ACI 318-08 section 8.12 (T-beam Construction)
Try
TL ES CR SH RE 34.19 ksi����
Losses% TL 100�fpj
16.88���
fp fpj TL 168.31 ksi����
Po fpj ES � Aps� 761.5 kip����
P Aps fp �� 693.96 kip����
Aps 4.12 in2�� b eff 80 in��
Yps 2 in��
fcbeam 8ksi�� � c 3 10 3 ��
� 1beam 0.65��
C non.comp.positive 4.05 in��

A-13
anon.comp.positive � 1beam Cnon.comp.positive� 2.63 in����
C1non.comp.positive 0.85 anon.comp.positive� W1� fcbeam� 859.25 kip����
d1non.comp.positive hnc Yps 8 in����
dupperbars 1in��
� s1non.comp.positive � cd1non.comp.positive Cnon.comp.positive �
Cnon.comp.positive���
� s1non.comp.positive 2.93 10 3 ��
� upper.bars � cCnon.comp.positive dupperbars �
Cnon.comp.positive� 2.26 10 3 ����
Fsbars 60ksi��
� ps1non.comp.positive � s1non.comp.positivefp
Eps
���
���
8.83 10 3 ����
fp 1.68 105� psi�
Qps1 88727613
1 112.4 � ps1non.comp.positive� �7.36����
17.36���
���
2.61 104����
fps1non.comp.positive � ps1non.comp.positive Qps1 �� 1000� psi 230.59 ksi����
T1non.comp.positive fps1non.comp.positive Nstrands� Astrand� 950.72 kip����
Tensiontotal.non.comp.positive T1non.comp.positive 950.72 kip����
C2.upper.bars Fsbars 0.2� in2 7� 84 kip����
Compressiontotal.non.comp.positive C1non.comp.positive C2.upper.bars��
Compressiontotal.non.comp.positive 943.25 kip��
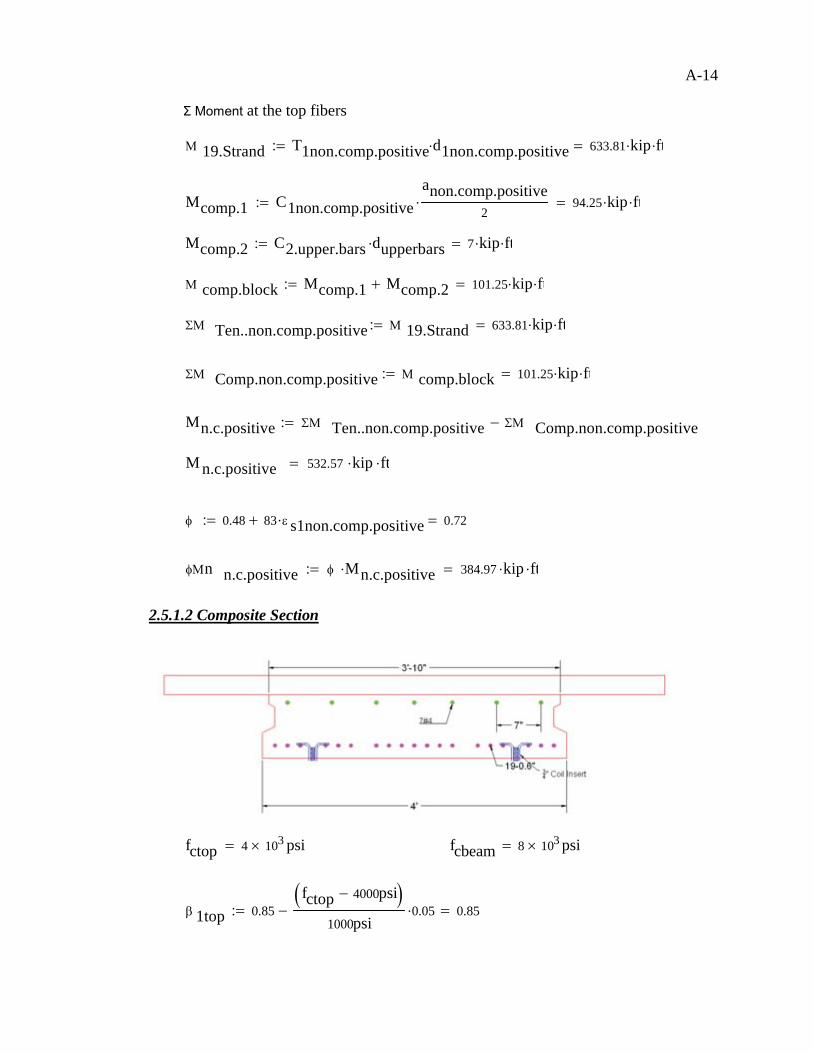
A-14
� Moment at the top fibers
2.5.1.2 Composite Section
19.Strand T1non.comp.positive d1non.comp.positive� 633.81 kip ft�����
Mcomp.1 C1non.comp.positiveanon.comp.positive
2� 94.25 kip ft�����
Mcomp.2 C2.upper.bars dupperbars� 7 kip ft�����
comp.block Mcomp.1 Mcomp.2 101.25 kip ft�����
! Ten..non.comp.positive 19.Strand 633.81 kip ft�����
! Comp.non.comp.positive comp.block 101.25 kip ft�����
Mn.c.positive ! Ten..non.comp.positive ! Comp.non.comp.positive ��
M n.c.positive 532.57 kip ft���
� 0.48 83 � s1non.comp.positive� 0.72���
� n n.c.positive � Mn.c.positive� 384.97 kip ft�����
fctop 4 103� psi� fcbeam 8 103� psi�
� 1top 0.85fctop 4000psi �
1000psi0.05� 0.85���

A-15
Try
� 1beam 0.65�
ccomp.positive 4.15in��
htop h2 0.5in 2.5 in����
beff2 16 htop� W1 88 in����
� 1average� 1top fctop� htop beff2� �� � 1beam fcbeam� W1� ccomp.positive htop ��
W1 ccomp.positive htop �� fcbeam� htop beff2� � fctop��� ����
� 1average 0.77�
acomp.positive ccomp.positive � 1average� 3.18 in����
C1comp.positive 0.85 fctop� htop beff2� �� 748 kip����
C2comp.positive 0.85 fcbeam� W1� acomp.positive htop �� 221.97 kip����
h hc 12 in����
dStrand. hc 0.5in 2in 10.5 in����
d1Comp 1.25 in��
d2.Comp htopacomp.positive htop �
2 2.84 in����
d3.bars 3.5 in��

A-16
Using the Power formula
� Moment at the top fiber
� s1comp.positive � cdStrand. ccomp.positive �
ccomp.positive� 4.59 10 3 ����
� comp.bars � cccomp.positive d3.bars �
ccomp.positive� 4.7 10 4 ����
Fs.bars � comp.bars 29000� ksi 13.63 ksi����
C3.bars Fs.bars 0.2� in2 7� 19.08 kip����
� ps1comp.positive � s1comp.positivefp
Eps 0.01���
Qps1comp.positive 88727613
1 112.4 � ps1comp.positive� �7.36����
17.36���
���
��
fps1comp.positive � ps1comp.positive Qps1comp.positive �� 1000� psi 246.47 ksi����
T1comp.positive 19 Astrand� fps1comp.positive� 1.02 103� kip����
Ctotal C1comp.positive C2comp.positive C3.bars 989.05 kip����
Ttotal T1comp.positive 1.02 103� kip����
!M comp.strand T1comp.positive dStrand.� 889.17 kip ft�����
C.1comp C1comp.positive d1Comp� 77.92 kip ft�����
C.2comp C2comp.positive d2.Comp �� 52.53 kip ft�����
C.3comp C3.bars d3.bars� 5.56 kip ft�����

A-17
This provided strength much higher than the required strength.
2.5.2 Flexural Strength for Negative End-Section
2.5.2.1 Non.Composite Section
Strain Compatibility approach was used to calculate the section strength.
Use the top reinforcement as the following
First row =3 # 6
First row = 4 # 6
!M comp.concrete C.1comp C.2comp C.3comp 136.01 kip ft�����
Mncomp.positive !M comp.strand !M comp.concrete 753.15 kip ft�����
� com.pv 0.9��
� com.pv Mncomp.positive� 677.84 kip ft���
OK
N1 first.row.non.comp. 3�� ANo.6 0.44in2��
A1steel.first.row.non.comp N1first.row.non.comp. ANo.6� 1.32 in2����
d1 first.row.non.comp. hnc 1.5in 8.5 in����
N2first.row.non.comp. 4�� ANo.6 0.44 in2��
A2steel.first.row.non.comp N2first.row.non.comp. ANo.6� 1.76 in2����

A-18
Try
use strength for the grout
dsecond.row.non.comp. hnc 4.5in 5.5 in����
d1 d1first.row.non.comp. 8.5 in����
d2 dsecond.row.non.comp. 5.5 in����
hnc 10 in��
Cnon.comp.negative 1.44in��
fcgrout 6000psi�� � 1grout 0.75��
anon.comp.negative � 1grout Cnon.comp.negative� 1.08 in����
C1non.comp.negative 0.85 W1� anon.comp.negative� fcgrout� 264.38 kip����
� s1non.comp.negative � cd1 Cnon.comp.negative �
Cnon.comp.negative� 0.01���
� s2non.comp.negative � cd2 Cnon.comp.negative �
Cnon.comp.negative� 8.46 10 3 ����
� 0.9� fyb 60000psi��
T1first.row.non.comp A1steel.first.row.non.comp fyb� 79.2 kip����
T2first.row.non.comp A2steel.first.row.non.comp fyb� 1.06 105� lbf���

A-19
� Moment at the bottom fibers
Thus the provided strength much higher than the required strength
2.5.2.2. Composite Section
First row 9 # 8
Tsecond.row.non.comp Asteel.second.row.non.comp fyb� 79.2 kip����
Tfirst.row.non.comp T1first.row.non.comp T2first.row.non.comp 184.8 kip����
!T non.comp.negative Tfirst.row.non.comp Tsecond.row.non.comp 264 kip����
!C non.comp.negative C1non.comp.negative 264.38 kip����
! steel Tfirst.row.non.comp d1� Tsecond.row.non.comp d2� 167.2 kip ft�����
! concrete C1non.comp.negativeanon.comp.negative
2� 11.9 kip ft�����
Mnnon.comp.negative ! steel ! concrete 155.3 kip ft�����
� Mnnon.comp.negative� 139.77 kip ft��� � 0.9�
Nfirst.row.comp.negative 9�� ANo.8 0.79in2��
Afirst.row.comp Nfirst.row.comp.negative ANo.8� 7.11 in2����
dfirst.row.comp.negative hc 1in 2in 11 in����

A-20
Second row =3 # 6
Second row = 4 # 6
Third row 3 # 6
N1 second.row.non.comp. 3��
A1steel.second.row.non.comp N1first.row.non.comp. ANo.6� 1.32 in2����
d1second.row.non.comp. hnc 1.5in 8.5 in����
N2second.row.non.comp. 4�� ANo.6 0.44 in2��
A2steel.second.row.non.comp N2first.row.non.comp. ANo.6� 1.76 in2����
d2second.row.non.comp. hnc 1.5in 8.5 in����
Nthird.row.comp.negative 3��
Athird.row.comp Nthird.row.comp.negative ANo.6� 1.32 in2����
dthird.row.comp.negative hc 1in 7.5in 5.5 in����
fcgrout 6 103� psi�
� 1grout 0.75�

A-21
Try
Ccomp.negative 3.65in�� Esb 29000ksi��
acomp.negative � 1grout Ccomp.negative� 2.74 in����
C1comp.negative 0.85 fcgrout� acomp.negative� W1� 670.14 kip����
� s1c � cdfirst.row.comp.negative Ccomp.negative �
Ccomp.negative� 6.04 10 3 ����
� s2c � cd2second.row.non.comp. Ccomp.negative �
Ccomp.negative� 3.99 10 3 ����
� s3c � cdthird.row.comp.negative Ccomp.negative �
Ccomp.negative� 1.52 10 3 ����
T1 Afirst.row.comp fyb� 426.6 kip����
T2 A1steel.second.row.non.comp A2steel.second.row.non.comp � fyb���
T2 184.8 kip��
T3 Athird.row.comp � s3c 29000� ksi �� 58.21 kip����
!T c T1 T2 T3 669.61 kip����
!C c C1comp.negative 670.14 kip����
first.row T1 dfirst.row.comp.negative� 391.05 kip ft�����
second.row T2 d2second.row.non.comp.� 130.9 kip ft�����
thired.row T3 dthird.row.comp.negative� 26.68 kip ft�����
! steel.comp first.row second.row thired.row 548.63 kip ft�����

A-22
Thus the provided strength much higher than the required strength
2.5.3 Flexural Strength For End-Section (Positive Moment)
2.5.3.1 Composite Section
First row 9 # 8
Second row =3 # 6
Second row = 4 # 6
! concrete.comp C1comp.negativeacomp.negative
2� 76.44 kip ft�����
Mncomp. ! steel.comp ! concrete.comp 472.19 kip ft�����
� Mncomp.� 424.97 kip ft���
N first.row.comp.positive 9�� ANo.8 0.79 in2��
Afirst.row.positive Nfirst.row.comp.negative ANo.8� 7.11 in2����
dfirst.row.comp.positive 1.5in��
N1second.row.non.positive. 3��
A1steel.second.row.non.positive N1 first.row.non.comp. ANo.6� 1.32 in2����
d1second.row.non.positive 4.5in��
N2second.row.non.positive 4�� ANo.6 0.44 in2��

A-23
Third row 3 # 6
A2steel.second.row.non.positive N2 first.row.non.comp. ANo.6� 1.76 in2����
d2second.row.non.positive 4.5in��
Nthird.row.comp.positive 3��
Athird.row.positive Nthird.row.comp.negative ANo.6� 1.32 in2����
d third.row.comp.positive 7.5 in��
� topping 0.85��
C comp.positive. 1.38 in��
acomp.positive. � topping Ccomp.positive.� 1.17 in����
C1comp.positive. 0.85 fctop� acomp.positive.� W2� 319.06 kip����
� s1c. � cdfirst.row.comp.positive Ccomp.positive. �
Ccomp.positive.� 2.61 10 4 ����
� s2c. � cd2second.row.non.positive Ccomp.positive. �
Ccomp.positive.� 6.78 10 3 ����
� s3c. � cdthird.row.comp.positive Ccomp.positive. �
Ccomp.positive.� 0.01���
Es 29000ksi��
T1. Afirst.row.positive � s1c.� Es� 53.79 kip����
T2. A1steel.second.row.non.positive A2steel.second.row.non.positive � fyb���
T2. 184.8 kip��

A-24
Thus the provided strength much higher than the required strength
2.6 Service Design
For serviceability design requirementsSee PCI Design Handbook 6th Edition Section 4.2.2See ACI 318-08 Section 18.4.2
Non-Composite Section
Composite Section
T3. Athird.row.positive fyb� 79.2 kip����
!T t. T2. T3. 264 kip����
!C c. C1comp.positive. T1. 265.27 kip����
first.row. T1. dfirst.row.comp.positive� 6.72 kip ft�����
second.row. T2. d2second.row.non.positive� 69.3 kip ft�����
thired.row. T3. dthird.row.comp.positive� 49.5 kip ft�����
! steel.comp. first.row. second.row. thired.row. 125.52 kip ft�����
! concrete.comp. C1comp.positive.acomp.positive.
2� 15.59 kip ft�����
Mncomp.positive. ! steel.comp. ! concrete.comp. 109.93 kip ft�����
� Mncomp.positive.� 98.94 kip ft���
Inc 4 103� in4��Anc 480 in2��
Ytnc 5 in��Y bnc 5 in��
Ic 8.45 103� in4��Ac 593.14 in2��
Ybc 6.14 in�� Ytc 5.86 in��

A-25
2.6.1 At Release ( Section at Distance = 2.5 ft from the End)
It should less than 6(fci)0.5
it should have top steel
It should less than 0.7fci
Ok
Steel Reinforcement Required at the Top
Mbeam WbeamSpanexternal.beam
2
8� 42.79 kip ft�����
MH.C WH.CSpanexternal.beam
2
8� 166.89 kip ft�����
Mtop WtopSpanexternal.beam
2
16� 40.12 kip ft�����
ML.L WL.LSpanexternal.beam
2
16� 128.38 kip ft�����
Dps 0.6in�� Lt 50 Dps� 30 in����
Mend WbeamSpanexternal.beam
2� Lt �� Wbeam Lt�
Lt2� 14.79 kip ft�����
ftop.endPoAg
Po e� �Ig
Ytnc����
���
Mend
IgYtnc�
���
���
1.05 ksi���� Tension
ftop.all.end 6 psi0.5 � fci.beam 0.48 ksi����
ftop.end ftop.all.end"
fbot.endPoAg
Po e� �Ig
Ybnc����
���
MendIg
Ybnc� 4.22 ksi���� Compression
fbot.all.end 0.7 fci.beam� 4.55 ksi����

A-26
2.6.2 At Release ( Mid - Span Section )
It should less than 3(fci)0.5
it should have top steel
It should less than 0.6fci
Steel Reinforcement Required at the Top
Use 7#4
Dtension.depth ftop.endhnc
ftop.end fbot.end �� 1.99 in����
As.end0.5 W1� Dtension.depth� ftop.end 6 psi0.5 � fci.beam�
�����
���
30000psi0.9 in2����
ftop.midPoAg
Po e� �Ig
Ytnc����
���
Mbeam
IgYtnc�
���
���
0.63 ksi���� Tension
ftop.all.mid 3 psi0.5 fci.beam� 0.24 ksi����
ftop.mid ftop.all.mid"
fbot.midPoAg
Po e� �Ig
Ybnc�Mbeam
IgYbnc� 3.8 ksi���� Compression
fbot.all.mid 0.6 fci.beam� 3.9 ksi����
fbot.mid fbot.all.mid�
Dtension.depth.mid ftop.midhnc �
ftop.mid fbot.mid� 1.42 in����
As.top.mid 0.5 Dtension.depth.mid� W2�ftop.mid ftop.all.mid �
30000psi� 0.73 in2����

A-27
2.6.3 During Construction (Mid-Span Section)
It should less than 0.45fc
No Limit
2.6.4 At Final (Mid-Span Section)
It should less than 0.6fc (beam)
It is Ok for class T
2.7 Development Length
2.7.1 Strands
P 693.96 kip��
ftop.con.P
Ag
P e� �Ig
Ytnc����
���
Mbeam MH.C Mtop �
IgYtnc� 2.59 ksi����
ftop.con.all 0.45 fc.beam� 3.6 ksi���� ftop.con ftop.con.all" Ok
fbot.conP
Ag
P e� �Ig
Ytnc����
���
Mbeam MH.C Mtop �Ig
Ytnc� 0.3 ksi����
fint.final ftop.con.ML.L
IcYtc hc hnc �� 3.29 ksi���� Compression
fint.all.final 0.6 fc.beam� 4.8 ksi����
fint.final fint.all.final�
fbot.final fbot.conML.L
IcYbc �� 0.82 ksi����
ClassU 7.5psi0.5 fc.beam0.5� 0.67 ksi����
ClassT 12psi0.5 fc.beam0.5� 1.07 ksi����

A-28
The required length to develop the strength of the strand, however is much longer , and is specified in ACI 12.9.1
2.7.2 Welded Wire Reinforcement in Tension
yield strength of welded wire
Welded wire deformed reinforcement factor (1) is the greater of the following as shown in ACI 318.08 section 12.7
For simplicity take Ktr=0
fse fp 168.31 ksi���� dbs Dps 0.6 in����
fps fps1comp.positive 246.47 ksi����
ldsfse
3000psi���
���
dbs�fps fse �1000psi
dbs� 80.56 in����
fy 75000lb
in2�� dbw 0.375 in��
5 dbw� �6
0.31 in��fy 35000
lb
in2 �
��
���
fy0.53�
#w 0.533�� # tw 1.0��
# ew 1.2�� # sw 0.8��
Cb 1in��
Fctop 27.78ft2
lblb
in2psi�� Ktr 0��
x 2.5Cb Ktr
dbw2.5"if
Cb Ktr
dbwotherwise
��Cb Ktr
dbw2.67�
x 2.5�

A-29
L.dw actual after multiplying by WWR factor (0.533)
2.7.3 Rebars
2.7.3.1 Rebars in Tension
According to ACI 318-08 section 12.2.3
For # 8 bars
Ldw3
40lb
in2
fy4000
�# tw # ew� # sw� �
x�
�����
�����
dbw� 1.07 ft����
Ldwactual #w Ldw� 0.57 ft����
fyb 60 ksi�� fctop 4 103� psi�
# tb8 1.3�� # eb8 1.0��
# sb8 1.0�� db8 1in��
Atr4 0.2in2�� s 12in��
nb8 9�� Cbb8 1in��
Ktrb89 40 Atr4� �
12in 9�0.67 in����
Cbb8 Ktrb8 �db8
1.67�
Z 2.5Cbb8 Ktrb8 �
db8
���
���
2.5"if
Cbb8 Ktrb8 �db8
���
���
���
���
otherwise
��
Z 1.67�
Ldb83
40psi0.5
fybfctop
�# tb8 # eb8� # sb8� �
Z�
����
����
db8� 55.5 in����

A-30
For # 6 bars
2.7.3.2 Rebars in Compression
According to ACI 318-08 section 12.3
Development length for Rebars in compression is the greater of X or Y
For # 6
# tb6 1.3�� # eb6 1.0��
# sb6 0.8�� db6 0.75in��
Atr8 0.2in2�� s. 6in��
n b6 6�� Cbb6 1in��
Ktrb66 40 Atr8� �
s nb6�0.67 in����
Cbb6 Ktrb6 �db6
2.22�
k 2.5Cbb6 Ktrb6 �
db6
���
���
2.5"if
Cbb6 Ktrb6 �db6
���
���
���
���
otherwise
��
k 2.22�
Ldb63
40psi0.5
fybfc.beam
�# tb6 # eb6� # sb6� �
k�
����
����
db6� 1.47 ft����
db6 0.75 in��
X 0.02fyb
1psi0.5 fc.beam� db6� 10.06 in����
Y 0.0003 fyb�db61psi� 13.5 in����

A-31
For # 8
2.8. Shear Design
Using the simplified Method ACI 318-08 Section 11.3.1
The critical section located at h/2 from the face of the support,
Ldc6 X X Y"if
Y otherwise
��
Ldc6 13.5 in��
db8 1 in�� Fctop 4 103� psi��
X 0.02fyb
fctop 1� psi0.5� db6� 14.23 in����
Y 0.0003 fyb� db8�1
1psi� 18 in����
Ldc8 X X Y"ifY otherwise
��
Ldc8 18 in��
Mu Mnegative.comp 100kip ft� 297.52 kip ft�����
Vu Vcomposite 131.02 kip����
dp hc Yps 10 in���� bw W1 48 in����
d 10in��
G 1VuMu
dp� 1$if
VuMu
dp����
���
otherwise
��

A-32
G 0.37�
Vc 0.6 1� psi0.5 fc.beam �0.5� 700 G� �psi��
�� bw� d� 149.06 kip����
VCon.shear 2 1� psi0.5 fc.beam �0.5� bw� d� Vc 2 1� psi0.5 fc.beam �0.5� bw� d��if
5 1� psi0.5 fc.beam �0.5� bw� d���
�� Vc 5 1� psi0.5 fc.beam �0.5� bw� d�$if
Vc otherwise
��
VCon.shear 149.06 kip��
� sh 0.75��
VsVu0.75
VCon.shear 25.63 kip����
Sst 12in��
fyb 6 104� psi�Av SstVs
fyb d�� 0.51 in2����
Avmin1 0.75 1� psi0.5 fc.beam �0.5� bw�Sstfyb� 0.64 in2����
Avmin250psi bw� Sst� �
fyb0.48 in2����
Avmin Avmin1 Avmin1 Avmin2$if
Avmin2 otherwise
��
Ashear Avmin AvminAps fpu� Sst� �
80 fyb� d�d
bw���
���
0.5��if
Aps fpu� Sst� �80 fyb� d�
dbw���
���
0.5�
Aps fpu� Sst� �80 fyb� d�
dbw���
���
0.5� Avmin�
Aps fpu� Sst� �80 fyb� d�
dbw���
���
0.5� Av$
if
Av otherwise
��
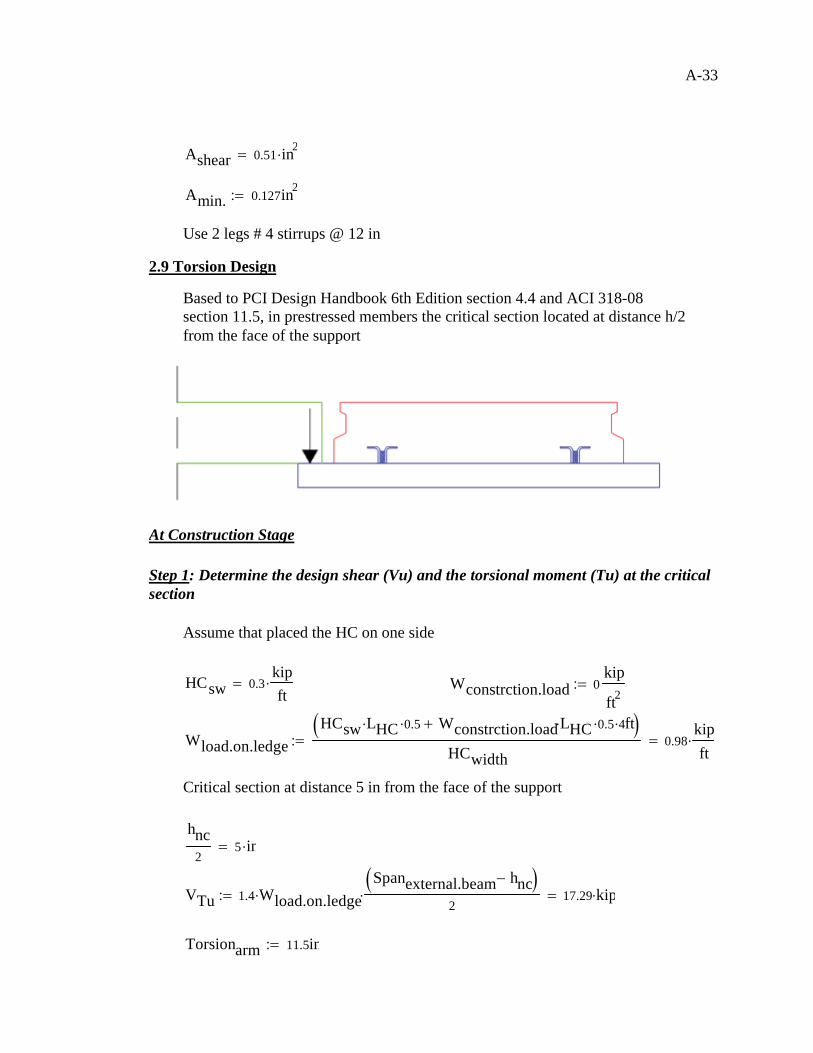
A-33
Use 2 legs # 4 stirrups @ 12 in
2.9 Torsion Design
Based to PCI Design Handbook 6th Edition section 4.4 and ACI 318-08 section 11.5, in prestressed members the critical section located at distance h/2 from the face of the support
At Construction Stage
Step 1: Determine the design shear (Vu) and the torsional moment (Tu) at the critical section
Assume that placed the HC on one side
Critical section at distance 5 in from the face of the support
Ashear 0.51 in2��
Amin. 0.127in2��
HCsw 0.3kipft�� Wconstrction.load 0
kip
ft2��
Wload.on.ledgeHCsw LHC� 0.5� Wconstrction.load LHC� 0.5� 4� ft �
HCwidth0.98
kipft����
hnc2
5 in��
VTu 1.4 Wload.on.ledge�Spanexternal.beam hnc �
2� 17.29 kip����
Torsionarm 11.5in��

A-34
Step 2: Determine if the torsion can be neglected, i.e., is Tu � Tu(min)
V.vol =� x2y
2.10 Design the End-Zone Reinforcement
By Using PCI Handbook Equation
Therefore, at least 0.18in2 of vertical reinforcement must be placed within h/2 from the beam end. at least As/2 should be placed at h/8 from the end and As/2 reinforcement at 3h/8 from the end.
2.11.Camber and Deflection
From PCI Design Hand book 6th Edition section 4.8For Span 30 ft
2.11.1. Stage I: At Release
Tu VTu Torsionarm� 16.57 kip ft�����
� sh 0.75� % 1��
fcbeam 8 103� psi� P 693.96 kip��
fpcP
Ag1.45 ksi����
� 1 10fpc
fcbeam�
���
���
0.5
1.68���
Xf hnc 10 in���� Yf W2 80 in����
Vvol Xf2 Yf� 8 103� in3����
Tu.min � sh 0.5psi0.5%� fcbeam �0.5� Vvol��
���� �� 37.46 kip ft�����
Tu Tu.min�
fs 30ksi�� As0.021 Po� hnc�
fs Lt�0.18 in2����
fc.beam 8 103� psi� fci.beam 6.5 103� psi�

A-35
Initial Camber
Own Weight Deflection
Net Camber/Deflection
2.11.2. Stage II: At Erection
Ec 5.1 106� psi� Eci 4.6 106� psi�
� c 0.15kip
ft3�� Ig 4 103� in4��
Ag 480 in2�� Aps 4.12 in2��
e 3 in�� L1 Spanexternal.beam 26.17 ft����
Po 761.5 kip�� P 693.96 kip��
& 1cPo e� L1
2�
8 Eci� Ig�1.53 in����
Wbeam 0.5kipft�� & 1D
5 Wbeam� L14� �
384.Ec Ig�0.26 in����
& net.camber.deflection.span1 & 1c & 1D 1.27 in����
WH.C 1.95kipft�� Wtop 0.94
kipft��
& 1D.due.HC5 WH.C� L1
4� �384.Ec Ig�
1.01 in����
& 1D.due.topWtop L1
4�
145 Ec� Ig�0.26 in����
Netcamber.deflection 1.85 & 1D� 1.8 & 1c� & 1D.due.HC & 1D.due.top��
Netcamber.deflection 1.01 in��

A-36
2.11.3 Stage III: At Final
WL.L 3kipft�� Ic 8.45 103� in4��
b W2 80 in���� dp 10 in��
fr 7.5 psi0.5 fc.beam �0.5� 0.67 ksi����
ML.L 128.38 kip ft���
fL ML.L YbcIc� 1.12 ksi���� ftL fbot.final 0.82 ksi����
'bApsb dp�
5.15 10 3 ����EpsEc
5.59�
IcrEpsEc
Aps� dp2� 1 1.6
EpsEc
'b����
���
0.5
� ����
����
� 1.68 103� in4����
1ftL fr �
fL
���
���
���
���
0.87� RatioMcr.Ma 1ftL fr �
fL
���
���
0.87���
Ie 1ftL fr �
fL
���
���
���
���
3
Ic� 1 1ftL fr �
fL
���
���
���
���
3
����
����
Icr� 6.11 103� in4����
& L.LWL.L L1
4�
145 Ec� Ie�0.54 in����
& final 2.4 & 1c� & 1D 2.2� 3 & 1D.due.HC� 2.3 & 1D.due.top� & L.L��
& final 1.05 in��

A-37
3. Design of Temporary and Hidden Corbels
3.1 Design of Temporary Corbels3.1.1 Loads
The design of the temporary corbels is carried out according to the shear-friction design method ACI 318-08 section 11.6.4
3.1.2 Resistance
hc 12 in�� Wbeam 0.5kipft��
Interbeam.span 30 ft�� Exterbeam.span 28 ft��
Avergthickness.top 2.5 in��HCweight.sq.ft 0.08kip
ft2��
SpanHC.direction 30 ft�� ConstructionL.L 0.015kip
ft2��
VD.from.beam WbeamInterbeam.span
2� 7.5 kip����
VD.from.HC HCweight.sq.ft LHC�Interbeam.span
2� 29.25 kip����
VD.from.top Avergthickness.top � c� HCspan�Interbeam.span
2� 14.06 kip����
VDead.per.corbel VD.from.beam VD.from.HC VD.from.top 50.81 kip����
Vlive.per.corbel ConstructionL.L HCspan�Interbeam.span
2� 6.75 kip����
VU.per.corbel 1.4 VDead.per.corbel Vlive.per.corbel �� 80.59 kip����
DiameterTR 1in�� Anet.TR 0.85in2��
fuTR 150ksi�� fyTR 120ksi��

A-38
3.1.3 Stiffener Design
Chosen Angle = L6*4*1/2
� 0.7��� sh 0.75�
NumberTR 2�� Columnwidth 20 in��
Fccolumn 8000psi��
Vn � NumberTR� fyTR� Anet.TR� 142.8 kip����
� sh Vn� 107.1 kip��
MinAngle.depthVU.per.corbel
� sh Columnwidth� 0.2� Fccolumn�3.36 in����
Stiffnerheight.a 5.5in��
Stiffnerwidth.b 3.5in��
a 5.5in��
b 3.5in��
b
a0.64� z 0.44��
fy.stiff 50ksi��� SR 0.85��

A-39
3.2 Design of Hidden Corbels
The design of the hidden corbel is performed according to the shear-friction design method Using ACI 318-08 section 11.6.4
3.2.1 Loads
3.2.2 Resistance
tVU.per.corbel� SR fy.stiff� b� z�
1.23 in����
hc 12 in�� Wbeam 0.5kipft��
Interbeam.span 30 ft�� HCweight.sq.ft 0.08kip
ft2��
HCspan 30 ft�� LL 0.1kip
ft2��
Avergthickness.top 2.5 in��
VDead.beam Wbeam Interbeam.span� 15 kip����
VDead.HC HCweight.sq.ft Interbeam.span� LHC� 58.5 kip����
VDead.Top Avergthickness.top � c� HCspan� Interbeam.span� 28.12 kip����
VDead.Load VDead.beam VDead.HC VDead.Top 101.63 kip����
VLive.Load LL HCspan� Interbeam.span� 90 kip����
VU 1.2 VDead.Load� 1.6 VLive.Load� 265.95 kip����
Areasteel 0.79in2 3� 0.44in2 6� 5.01 in2����
fyb 60 ksi��
Depthhidden.corbel 9in�� Widthhidden.corbel 7in��

A-40
Columnwidth 20 in�� Depthbeam 12in��
� pocket 1.4Depthhidden.corbelWidthhidden.corbel� �
Columnwidth Depthbeam� �� 0.37���
� precast 0.6Columnwidth Depthbeam� Depthhidden.corbel Widthhidden.corbel� �
Columnwidth Depthbeam� �����
���
��
� precast 0.44�
� avg � pocket � precast 0.81��� fctop 4 103� psi��
Vn1 Areasteel fyb� � avg� � 2� 486.97 kip����
Vn2 0.2 fctop� Columnwidth� Depthbeam� � 2� 384 kip����
Vn3 480psi 0.08fctop � Columnwidth Depthbeam� �� 2� 384 kip����
Vn.min Vn2 Vn2 Vn3�if
Vn3 otherwise
��
Vn.min 384 kip��
Vn.final Vn1 Vn1 Vn.min�if
Vn.min otherwise
��
Vn.final 384 kip��
� sh Vn.final� 288 kip��
VU 265.95 kip��

A-41
4. Design of Hidden Ledge
The design of the hidden corbel is performed according to the shear-friction design method Using ACI 318-08 section 11.6.4
4.1 Loads
Per HC
4.2 Resistance
Wbeam 0.5kipft��hc 12 in��
Interbeam.span 30 ft�� HCweight.sq.ft 0.08kip
ft2��
HCspan 30 ft�� LL 0.1kip
ft2��
Avergthickness.top 2.5 in�� LHC 26ft�
VDead.HC. HCweight.sq.ftLHC
2� HCwidth� 3.9 kip����
VDead.Top. Avergthickness.top � c�HCspan
2� HCwidth� 1.87 kip����
VDead.Load. VDead.HC. VDead.Top. 5.77 kip����
VLive.Load. LLHCspan
2� HCwidth� 6 kip����
VU. 1.2 VDead.Load.� 1.6 VLive.Load.� 16.53 kip����
Areasteel. 2.5 .31� in2 0.78 in2���� fyb 60 ksi��
� 1�� fctop 4 103� psi��
Vn1. Areasteel. fyb� �� � 46.5 kip����
HCwidth 4 ft� Depthbeam 1 ft�
Vn2. 0.2 fctop� HCwidth� Depthbeam� � 2� 921.6 kip����

A-42
5. Design of the Column
Design of columns for the proposed floor system is similar to the design column for any conventional floor system .Columns should be designed to resist axial and bending moments according to section 10.3 of ACI 318-08.
6. Design For Lateral Loads
Lateral loads considered in the analysis of the proposed shallow floor system include the wind and seismic loads calculated according to ASCE-05.These loads were applied to the marked frames in the following for both beam and hollow core directions. two dimensional frame analysis was performed using SAP 2000 V.14.1 to determine the maximum moments due to wind and seismic loading in each direction. the following subsections present load calculations and analysis results.
Vn3. 480psi 0.08fctop � HCwidth Depthbeam� �� 2� 921.6 kip����
Vn.min. Vn2. Vn2. Vn3.�if
Vn3. otherwise
��
Vn.min. 921.6 kip��
Vn.final. Vn1. Vn1. Vn.min.�if
Vn.min. otherwise
��
Vn.final. 46.5 kip��
� sh Vn.final.� 34.88 kip��
VU. 16.53 kip��
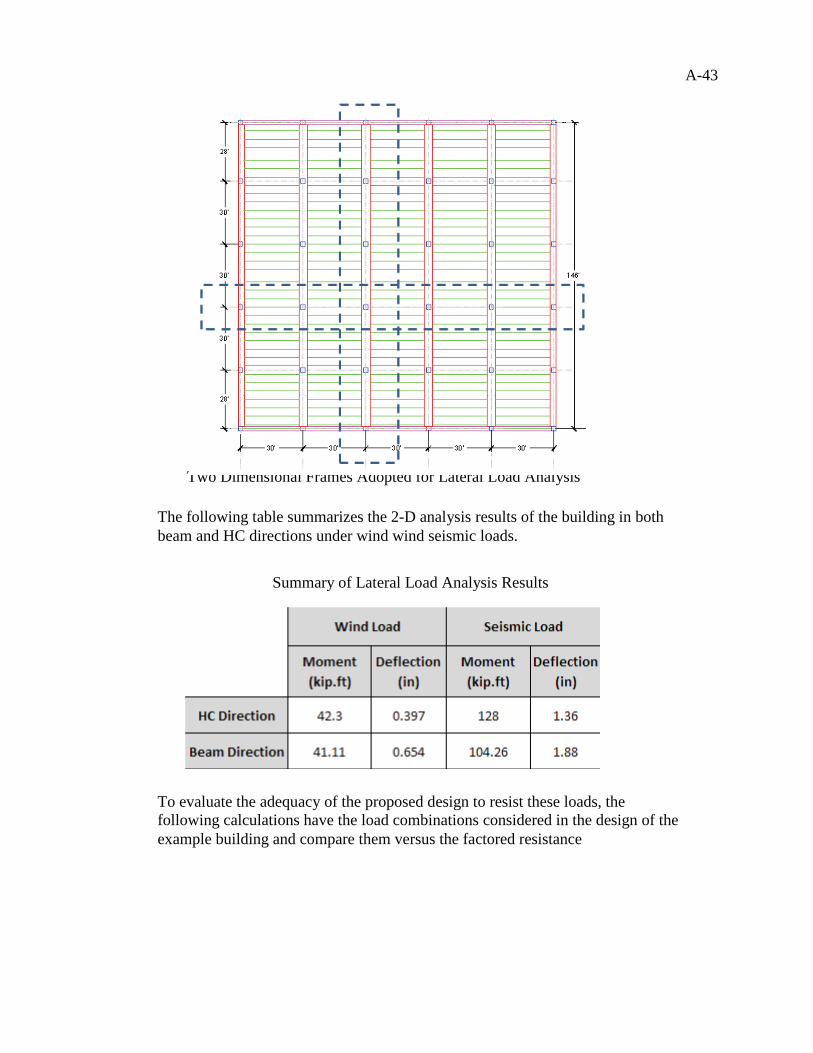
A-43
Two Dimensional Frames Adopted for Lateral Load Analysis
The following table summarizes the 2-D analysis results of the building in both beam and HC directions under wind wind seismic loads.
Summary of Lateral Load Analysis Results
To evaluate the adequacy of the proposed design to resist these loads, the following calculations have the load combinations considered in the design of the example building and compare them versus the factored resistance

A-44
6.1 FS 10 Beam NegativeEnd-Eection (Wind Case)
6.2 FS 10 Beam Negative End-section (Seismic Case)
Factor Resistance = Negative capacity Composite end section = -425 kip.ft
6.3 FS 10 Beam Positive End-Section (Wind Case)
6.4 FS 10 Positive End-Section (Seismic Case)
Mwind 41.11 kip ft���
Mdead.load Mnegative.non.simple.comp. 62.9 kip ft�����
Mlive.load Mnegative.comp. 201.28 kip ft�����
Mcombination.wind 1.2 Mdead.load� 1.6 Mwind� Mlive.load 342.53 kip ft�����
Mseismic 104.26 kip ft���
Mdead.load 62.9 kip ft���
Mlive.load 201.28 kip ft���
Mcombination.seismic 1.2 Mdead.load� 1.0 Mseismic� Mlive.load 381.01 kip ft�����
Mwind. 40.26kip ft���
Mdead.load. 0��
Mlive.load. 0��
Mcombination.wind. 1.2 Mdead.load.� 1.6 Mwind.� Mlive.load. 64.42 kip ft�����
Mseismic. 102.26kip ft���
Mdead.load. 0�
Mlive.load. 0�
Mcombination.seismic. 1.2 Mdead.load.� 1.0 Mseismic.� Mlive.load.��

A-45
6.5 HC Negative End-Section (Wind Case)
6.6 HC. Negative End-Section (Seismic Case)
Factor Resistance = Negative capacity Composite end section = -56.36*4 = -225.44 kip.ftwhere 56.36 kip.ft the capacity of one HC, and 4 is number if HC in Column Strip
Mcombination.seismic. 102.26 kip ft���
Factored Positive.mom.capacity.composite.end.section � Mncomp.positive.���
Factored Positive.mom.capacity.composite.end.section 98.94 kip ft���
Negativemom.from.toppingMnegative.non.comp.f
1.262.9 kip ft�����
F.Resistance.positive.end.sec � Mncomp.positive.� 0.9 Negativemom.from.topping���
F.Resistance.positive.end.sec 155.55 kip ft���
FactoredResistance.positive.end.section F.Resistance.positive.end.sec��
Mwind.. 42.3 kip ft���
ML.L.conti.. 0��
Mdead.load. 0�
Mcombination.wind.. 1.2 Mdead.load.� 1.6 Mwind..� ML.L.conti..��
Mcombination.wind.. 67.68 kip ft���
Mseismic.. 128 kip ft���
ML.L.conti... 0.��
Mdead.load. 0�
Mcombination.seismic.. 1.2 Mdead.load.� 1.0 Mseismic..� ML.L.conti...��
Mcombination.seismic.. 128 kip ft���

B-1
Appendix B
FACBRICATION OF BEAM-COLUMN CONNECTION WITHOUT CORBEL
COMPONENTS
Fabrication of the column

B-2
Fabrication of the beam

B-3
Precast beam, HC, and Column
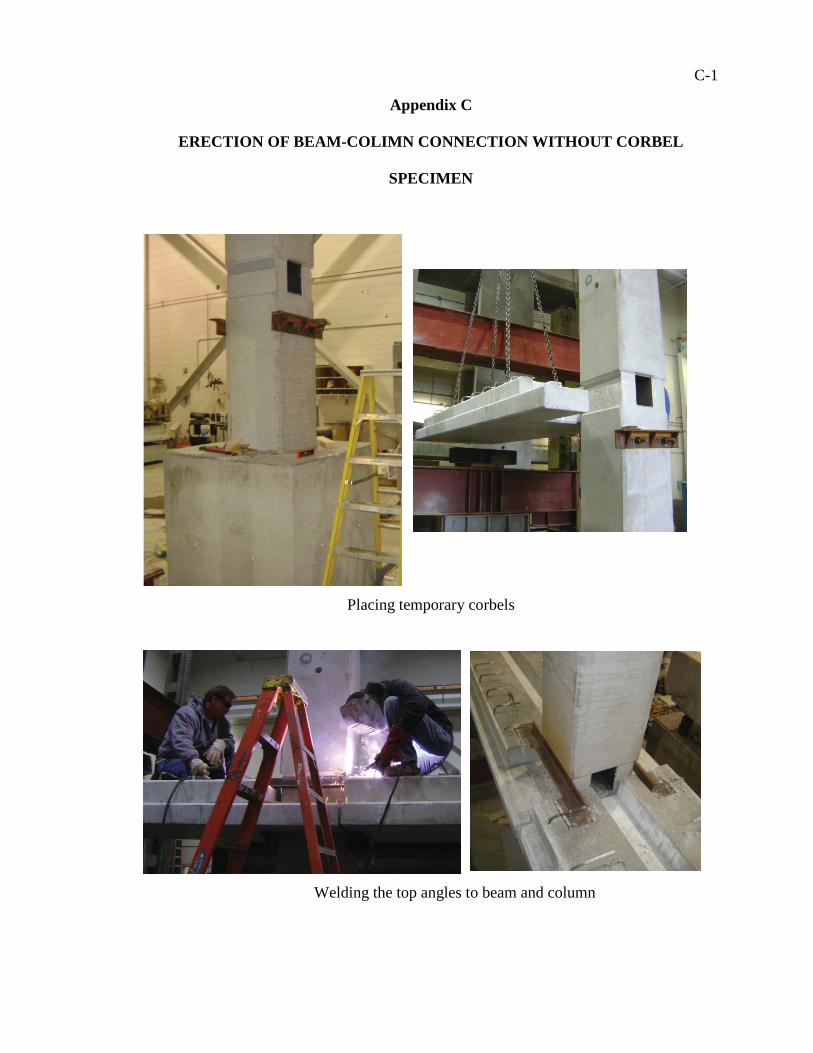
C-1
Appendix C
ERECTION OF BEAM-COLIMN CONNECTION WITHOUT CORBEL
SPECIMEN
Placing temporary corbels
Welding the top angles to beam and column

C-2
Placing HC planks and pocket reinforcement
Grouting the H.C keys and beam pocket with SCC
Placing the topping reinforcement and C-bars

C-3
Placing the topping reinforcement
Pouring and finishing the topping concrete
Removing the temporary corbels

D-1
Appendix D
FACBRICATION OF FLAT SOFFIT BEAM
Fabrication of beam specimen

E-1
Appendix E
ERECTION OF HC-BEAM CONNECTION WITHOUT LEDGE SPECIMEN
Placing the beam on the three supports
Placing the beam steel ledge and the temporary ledges

E-2
Placing the HC
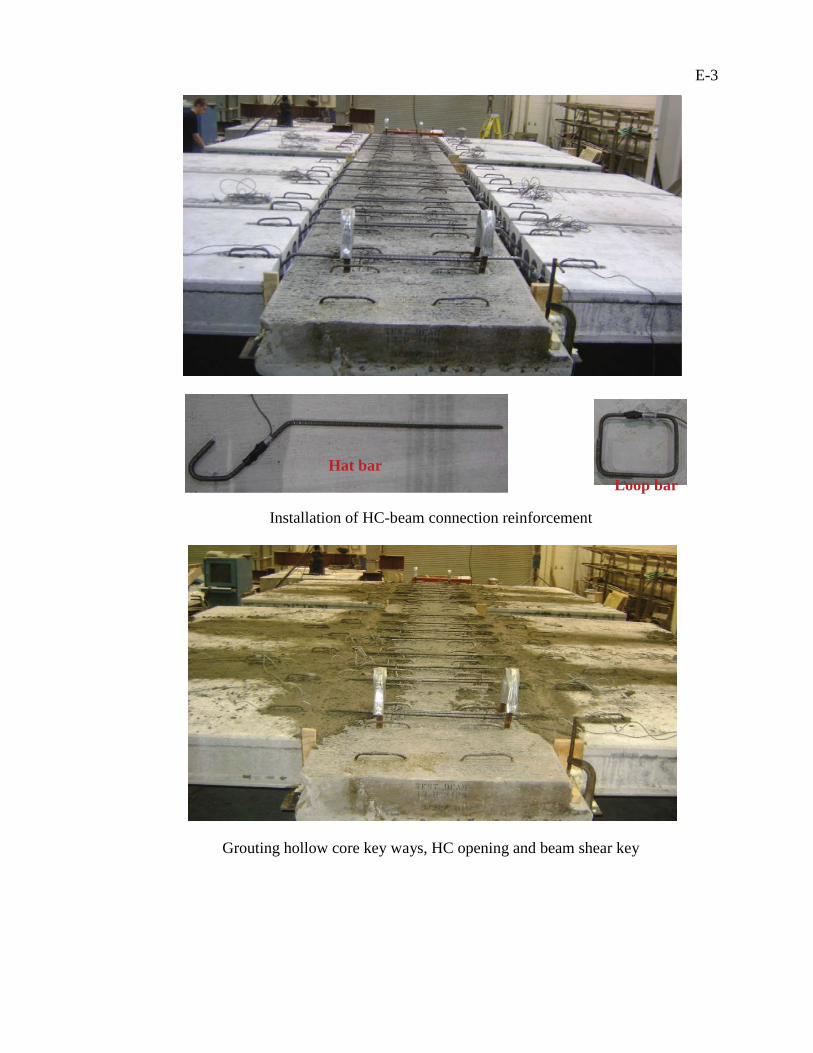
E-3
Installation of HC-beam connection reinforcement
Grouting hollow core key ways, HC opening and beam shear key
Hat bar Loop bar

E-4
Installation of welded wire reinforcement of the topping
Casting the topping
Remove temporary corbels after the topping hardening

F-1
Appendix F
SANDWICH FLOOR PANEL FABRICATION
Insert GFRP tie into the XPS slot and filling the gap with expanding foam insulation

F-2
Setup the forms and tension the strands
Casting the bottom wythe, installing foam panels, and casting the top wythe

F-3
Inserting the lifting point
Place topping reinforcement

F-4
Casting and finishing the topping

G-1
Appendix G
NU FLOOR DESIGN EXAMPLE (PANEL WITH GFRP TIES)
Span 26ft�� Width 4ft��
Topping thichnes 2.0in�� � 0.15 kip
ft3��
Lowerlayer.thicknes 3in�� Toplayer.thicknes 2in��
SelfWeight Lowerlayer.thicknes Toplayer.thicknes � Width��� �� �� 0.25 kipft����
Wpanel SelfWeight 0.25 kipft���� Wtopping Topping thichnes Width� �� 0.1 kip
ft����
Construction Load 50psf�� Wconstruction.load Construction Load Width���
LL 0.1 kip
ft2�� Wconstruction.load 0.2 kip
ft��
WL.L LL Width� 0.4 kipft����
Mpanel WpanelSpan2
8� 21.12kip ft�����
Mtopping WtoppingSpan2
8� 8.45 kip ft�����
MConstruction Wconstruction.loadSpan2
8� 16.9 kip ft�����
ML.L WL.LSpan2
8� 33.8 kip ft�����
MSustain.factored Mpanel Mtopping � 1.2� 35.49 kip ft�����
ML.L.factor 1.6 ML.L� 54.08 kip ft�����

G-2
1. Load
1.1 At Final Stage
2. Panel Design
2.1 Section Properties
2.1.1 Non-Composite Section
FactorLoad.Final 1.2 Wpanel Wtopping �� 1.6 WL.L� 1.06 kipft����
MuFactorLoad.Final Span2
�
889.57kip ft�����
QuFactorLoad.Final Span�
213.78 kip����
W1 48in�� h1 3in�� A1 W1 h1� 144 in2����
W2 48in�� h2 2in�� A2 W2 h2� 96 in2����
W3 48in�� h3 Topping thichnes 2 in���� A3 W3 h3� 96 in2����
Foamthikness 3in��
hnc h1 h2 Foamthikness 8 in���� hc hnc h3 10 in����

G-3
2.1.2 Composite Section
Anc A1 A2 240 in2���� Ync
A1h12� A2 h1 Foamthikness
h22
���
���
�
Anc3.7 in����
Ybnc Ync 3.7 in���� Ytnc hnc Ync 4.3 in����
IncW112
h1 �3� A1 Ybnch12
���
���
2
�W212
h2 �3� A2 Ytnch22
���
���
2
�����
����
1.88 103� in4
����
SbncInc
Ybnc508.76in3
���� StncInc
Ytnc437.77in3
����
Fcbeam 8000 lb
in2�� Fctop 4000 lb
in2�� n
FctopFcbeam
���
���
0.71���
Ac Anc A3 n� 307.88in2����
Yc
Anc Ync� A3 n� hnch32
���
���
����
���
Ac4.87 in����
Ybc Yc 4.87 in���� Ytc hnc h3 � Ybc 5.13 in����
IcA1 W1h1
3
12� A1 Ybc
h12
���
���
2
� 1.74 103� in4
����
IcA2 W2h2
3
12� A2 h1 Foamthikness
h22
Ybc ���
���
2
� 468.14in4����
IcA3 W3 n�h3
3
12� A3 n� h1 Foamthikness h2
h32
Ybc ���
���
2
� 1.18 103� in4
����

G-4
3. Prestressing steel
(7)-0.5 in. Diameter 270k low-relaxation strand
4. Prestress losses
Prestress loss calculations performed according to the PCI Design Handbook 6th Edition method outlined in section 4.7.
Ic IcA1 IcA2 IcA3 3.39 103� in4����
Nstrands 4�� Astrand 0.153in2��
Aps Nstrands Astrand� 0.61 in2����
Yps 1.5in�� e Ync Yps 2.2 in����
fci.panel 6000psi�� fc.panel 8000psi��
Nostrand 4�� Aone.ps 0.217in2��
Ag Anc 240 in2���� Ig Inc 1.88 103
� in4����
V 1in Anc �� 240 in3���� S 2 W1 hnc �� 112 in����
RH 70��V
S2.14 in2��
e 2.2 in��Aps 0.61 in2��
Eps 28500ksi��fpu 270ksi��
fpj 0.75 fpu� 202.5 ksi���� Pi fpj Aps� 123.93 kip����
Eci 57000psi0.5 fci.panel� 4.42 103� ksi����
Ec 57000psi0.5� fc.panel� 5.1 103
� ksi����
MgWpanel Span2
821.12kip ft�����
Mdl WtoppingSpan2 �
8� Wconstruction.load
Span2
8�
���
���
25.35kip ft�����

G-5
4.1 Elastic Shortening Losses
For pretension members
For pretension members
4.2 Creep Losses
For normal weight concrete
4.3 Shrinkage Losses
For pretension members
4.4 Relaxation Losses
4.5 Total l Lessees
Kes 1��
Kcir 0.9��
fcir KcirPiAg
Pie2
Ig�
����
����
� Mge
Ig� 0.46 ksi����
ES KesEpsEci� fcir� 2.94 ksi����
Kcr 2��
fcds Mdle
Ig� 0.36 ksi����
CR KcrEpsEc� fcir fcds �� 1.11 ksi����
Ksh 1��
SH 8.2 10 6 � Ksh� Eps� 1 0.06 1
in2
V
S�
����
����
����
����
� 100 RH ( )� 6.11 ksi����
Kre 5000psi��
J .037��
C 1��
RE Kre J SH CR ES( )� �� �� C� 4.62 ksi����
TL ES CR SH RE 14.79ksi����
Losses% TL 100�
fpj7.3���
fp fpj TL 187.71 ksi����
Po fpj ES � Aps� 122.13 kip����

G-6
6. Service Design
For serviceability design requirementsSee PCI Design Handbook 6th Edition Section 4.2.2See ACI 318-08 Section 18.4.2
Non-Composite Section
Composite Section
6.1 At Release (Section at Distance = 2.5 ft from the End)
It should less than 6(fci)0.5
It should less than 0.7fci
6.2 At Release (Mid - Span Section)
P Aps fp �� 114.88 kip����
Anc 240 in2�� Inc 1.88 103� in4��
Ybnc 3.7 in�� Ytnc 4.3 in��
Ic 23.55ft2 in2��Ac 307.88in2��
Ytc 5.13 in��Ybc 4.87 in��
Dps 0.5in�� Lt 50 Dps� 2.08 ft����
Mend WpanelSpan
2� Lt �� Wpanel Lt�
Lt2� 6.23 kip ft�����
ftop.endPoAg
Po e� �Ig
Ytnc����
���
Mend
IgYtnc�
���
���
0.07 ksi���� Compersion
ftop.all.end 6 psi0.5 � fci.panel 0.46 ksi����
ftop.end ftop.all.end�
fbot.endPoAg
Po e� �Ig
Ybnc����
���
MendIg
Ybnc� 0.89 ksi���� Compresion
fbot.all.end 0.7 fci.panel� 4.2 ksi����
ftop.midPoAg
Po e� �Ig
Ytnc����
���
Mpanel
IgYtnc�
���
���
0.47 ksi���� Compresion

G-7
It should less than 3(fci)0.5
It should less than 0.6fci
6.3 During Construction (Mid-Span Section)
It should less than 0.45fc
No Limit6.4 At Final (Mid-Span Section)
It should less than 0.6fc (beam)
It is Ok
ftop.all.mid 3 psi0.5 fci.panel� 0.23 ksi���� ftop.mid ftop.all.mid�
fbot.midPoAg
Po e� �Ig
Ybnc�Mpanel
IgYbnc� 0.54 ksi����
fbot.mid fbot.all.mid�fbot.all.mid 0.6 fci.panel� 3.6 ksi����
P 114.88 kip��
ftop.con.P
Ag
P e� �Ig
Ytnc����
���
Mpanel MConstruction Mtopping �
IgYtnc� 1.18 ksi����
ftop.con ftop.con.all�ftop.con.all 0.45 fc.panel� 3.6 ksi����
fbot.conP
Ag
P e� �Ig
Ytnc����
���
Mpanel Mtopping �Ig
Ytnc� 0.25 ksi���� Comp
fint.final ftop.con.ML.L
IcYtc hc hnc �� 1.55 ksi����
fint.all.final 0.6 fc.panel� 4.8 ksi����
fint.final fint.all.final�fbot.final fbot.conML.L
IcYbc �� 0.34 ksi����
ClassU 7.5 psi0.5 fc.panel0.5
� 0.67 ksi����
ML.L 33.8 kip ft���ClassT 12 psi0.5 fc.panel0.5
� 1.07 ksi����

G-8
7. Flexural Strength
7.1 Flexural Strength for Positive Mid-Span Section
7.1.1 Non.Composite Section
Strain compatibility approach was used to calculate the section strength
Aps 0.61 in2�� W2 4ft�
fcpanel 8ksi�� �c 0.003��
�1panel 0.85fcpanel 4ksi �
1ksi0.05� 0.65���
Cnon.comp.positive 0.78in��
anon.comp.positive �1panel Cnon.comp.positive� 0.51 in����
C1non.comp.positive 0.85 anon.comp.positive� W2� fcpanel� 165.48 kip����
d1non.comp.positive hnc 1.5in 6.5 in����
�s1non.comp.positive �cd1non.comp.positive Cnon.comp.positive �
Cnon.comp.positive� 0.02���
�ps1non.comp.positive �s1non.comp.positivefp
Eps
���
���
0.03���
Qps1 887 27613
1 112.4�ps1non.comp.positive� �7.36��
��
17.36���
���
9.48 103����

G-9
� Moment at the top fibers
7.1.2 Composite Section
fps1non.comp.positive �ps1non.comp.positive Qps1 �� 1000� psi 271.02 ksi����
T1non.comp.positive fps1non.comp.positive Nostrand� Astrand� 165.86 kip����
Tension total.non.comp.positive T1non.comp.positive 165.86 kip����
Compression total.non.comp.positive C1non.comp.positive 165.48 kip����
Strand T1non.comp.positive d1non.comp.positive� 89.84 kip ft�����
comp.block C1non.comp.positiveanon.comp.positive
2� 3.5 kip ft�����
! Ten..non.comp.positive Strand 89.84 kip ft�����
! Comp.non.comp.positive comp.block 3.5 kip ft�����
Mn.c.positive ! Ten..non.comp.positive ! Comp.non.comp.positive 86.35 kip ft�����
� 0.9��
� n n.c.positive � Mn.c.positive� 77.71 kip ft�����
fctopping 4ksi�� fcpanel 8 ksi��
�1topping 0.85fctopping 4000psi �
1000psi0.05� 0.85��� �1panel 0.65�
�1average 0.65��
ccomp.positive 1.52in��
acomp.positive ccomp.positive �1average� 0.99 in����

G-10
Using the Power formula
� Moment at the top fiber
C1comp.positive 0.85 fctopping� W3� acomp.positive� 161.24 kip����
h hc 10 in����
d1ten. hc 1.5in 8.5 in����
�s1comp.positive �cd1ten. ccomp.positive �
ccomp.positive� 0.01���
�ps1comp.positive �s1comp.positivefp
Eps 0.02���
Qps1comp.positive 887 27613
1 112.4�ps1comp.positive� �7.36��
��
17.36���
���
��
fps1comp.positive �ps1comp.positive Qps1comp.positive �� 1000� psi 263.65 ksi����
T1comp.positive Nostrand Astrand� fps1comp.positive� 161.36 kip����
Ctotal C1comp.positive 161.24 kip����
Ttotal T1comp.positive 161.36 kip����
d3comp.acomp.positive
20.49 in����
!M comp.strand T1comp.positive d1ten.� 114.29 kip ft�����
C.1non.comp C1comp.positive d3comp.� 6.64 kip ft�����
!M comp.concrete C.1non.comp 6.64 kip ft�����

G-11
Thus provided that the strength much higher than the required strength.
8. Design of GFRB Ties
NU-Ties Properties
Total Horizontal Shear
Maximum Horizontal Shear
Horizontal Shear Gradient
Mncomp.positive !M comp.strand !M comp.concrete 107.66 kip ft�����
� 0.9��
� Mncomp.positive� 96.89 kip ft���
OK
C e 0.7��Atie.no3 0.11in2��
C r 0.65���tie.no3 40��
TieTensile.Strength 110ksi��
Tiedepth.no3 7in�� � shear 0.75��
MU FactorLoad.Final 1.06 kipft���� Span 26ft�
Mu 89.57 kip ft���
Vh.totalMu
Tiedepth.no3153.55kip����
Vh.MaxVh.total 4�
Span23.62 kip
ft����

G-12
# 3
# 3 Leg
Since the length of NU-Tie is approximately 4 ft, the panel can be divided into segments that are 4 ft in length.
First segments
Second segments
GVh.Max 2�
Span1.82 kip
ft2����
Ff.no3 � shear TieTensile.Strength� Ce� Cr� 37.54 ksi����
Fno3 Atie.no3 Ff.no3� cos �tie.no3�
180���
����
� 3.16 kip����
Firstsegments 4ft��
Areasegment.oneVh.Max Vh.Max G Firstsegments� ��� ��
2Firstsegments� 79.95 kip����
NumberLegs.segment1Areasegment.one
Fno325.28���
Second segments 4ft��
V1second Vh.Max G Firstsegments� 16.35 kipft����
V2.second V1second G Secondsegments� 9.09 kipft����
Areasegment.secondV1second V2.second �
2Second segments� 50.88 kip����
NumberLegs.segment2.Areasegment.second
Fno316.09���

G-13
Third segments
Check the stresses in the ties under sustain Load
Actual Stress in the ties due to Sustain Load
Less than 18 ksi
Actual Stress in the ties due to Live Load
Less than 30 ksi
V1third V2.second 2.92 105�
lb
s2���
Thirdsegments 4ft��
V2.third V1third G Thirdsegments� 1.82 kipft����
Areasegment.thirdV1third V2.third �
2Thirdsegments� 21.81 kip����
NumberLegs.segment3.Areasegment.third
Fno36.89���
Totallegs NumberLegs.segment3. NumberLegs.segment2. NumberLegs.segment1 48.26���
NumbertiesTotallegs
412.06���
MSustainWtopping Wpanel � Span21.2�
835.49 kip ft�����
Vh.total.sustain.loadsMSustain
Tiedepth.no360.84kip����
Actual no3.legs 48��
Actual leg.forceVh.total.sustain.loads
Actualno3.legs1.27 kip����
Actualleg.StressActual leg.force
Atie.no3 cos �tie.no3�
180���
����
�
15.04 ksi����
Vh.total.Live.loadML.L.factor
Tiedepth.no392.71kip����
Actual leg.force.Vh.total.Live.loadActualno3.legs
1.93 kip����
Actualleg.Stress.Actual leg.force.
Atie.no3 cos �tie.no3�
180���
����
�
22.92 ksi����

G-14
9. Calculation of Mu. and Pu (Demand)
For four point loads
For three point loads
For three point loads
Mpanel 21.12 kip ft���Wpanel 0.25 kipft��
Wtopping 0.1 kipft�� Mtopping 8.45 kip ft���
WL.L 0.4 kipft�� ML.L 33.8 kip ft���
Mu 89.57 kip ft��� Testing panel.Span 26ft��
Wpanel.and.topping Wpanel Wtopping 0.35 kipft����
Leff Span 8in 25.33ft���
a 9ft��
PuMu Wpanel.and.topping Leff� 0.5� a� Wpanel.and.topping a2
� 0.5���
�� 2�
a14.19kip����
Pu. MuWpanel.and.topping Leff
2�
8
����
����
4Leff� 9.71 kip����

G-15
10. Calculation of Mn. and Pn (Nominal)
For four point loads
Mn from the actual concrete compressive strength at the time of testing equal to 112 kip.ft, so pn = 19.2 kip
For three point loads
Mn from the actual concrete compressive strength at the time of testing equal to 112 kip.ft, so pn = 13.25 kip
11. Calculation of the cracking load
Assume cracking Stress at the bottom fibers = 0 instead of 0.2(f'c)^0.5
Mn Mncomp.positive 107.66 kip ft�����
PnMn Wpanel.and.topping Leff� 0.5� a� Wpanel.and.topping a2
� 0.5���
�� 2�
a18.21kip����
Pu.. MnWpanel.and.topping Leff
2�
8
����
����
4Leff� 12.57kip����
Fr 0ksi�� P 114.88 kip��
Anc 240 in2�� Inc 1.88 103� in4��
McrInc
Ybnc
PoAnc
Po e� Ybnc�
Inc
���
���
� 43.97kip ft�����
Or
Sc Sbnc 508.76in3����
Fr. 6 psi0.5 fc.panel���
��� 536.66psi���
FcpcPo
Anc
Po e� Ybnc�
Inc 1.04 103� psi���
FdMpanel
Sbnc498.27psi���
MCr Sc Fr. Fcpc Fd �� 45.59 kip ft�����

G-16
For four point loads
For four point loads
11. Service load
Equivalent load
In term of moment
In term of deflection
12. Camber and Deflection
From PCI Design Hand book 6th Edition section 4.8
11.1 Stage I: At Release
Initial Camber
From Beam model
So
PMCr
a5.07 kip���� Pcr 2 P� 10.13 kip����
Pcr. 4MCrLeff� 7.2 kip����
PService1 LL Width� Leff� 10.13 kip����
PService2WL.L Leff
2��
��� 2�
8 a�7.13 kip����
PService32 30 WL.L� Leff
4���
���
a2 3 Leff� 4 a� �� 384�7.95 kip����
fc.panel.test 11500psi�� fci.panel.at.release 8034psi��
Eci. 57000psi0.5 fci.panel.at.release� 5.11 103� ksi����
Ec. 57000psi0.5� fc.panel.test� 6.11 103� ksi����
Ec. 6.11 106� psi� Ig 1.88 103� in4��
Ag 240 in2�� L1 Span 26 ft����
e 2.2 in��
Po 122.13 kip�� P 114.88 kip��
& Beam.cPo e� L1
2�
8 Eci.� Ig�0.34 in����

G-17
From Truss model
From the Finite Elements model
Own Weight Deflection
From Truss model
From the Finite Elements model
For using the Beam deflection equation
* Inertia reduction factor should be used, which equal to 0.475
Net Camber/Deflection
11.2 Stage II: At Erection
From Beam model
From Truss model
From the Finite Elements model
12 Thermal Performances
R-Value are calculated using thr Zone Method proposed by PCI Design Handbook
12.1 R-Value of Sandwich Panel with Solid Blocks at the ends
Panel Span Panel Width
Thickness of the topping
Thickness of the top wythe
& Truss.c 0.282 in��
& Finite.C 0.286 in��
Wpanel 0.25 kipft�� & Beam.D
5 Wpanel� Leff4��
���
384.Ec Ig�0.24 in����
& Truss.D 0.772in��
& Finite.D 0.770in��
& Beam.D& Truss.D
0.31�
& net.camber.deflection.span1 & Beam.c & Truss.c 0.62 in����
Wtopping 0.1 kipft��
& 1D.due.top5Wtopping Leff
4�
384 Ec� Ig�0.1 in����
& Truss.D.top 0.266in��
& Finite.D.top 0.266in��
L 26ft�� W 4ft��
tcf1 2in��
tcf2 1in��

G-18
Thickness of insulation
Thickness of the bottom wythe
Solid concrete block length
Insulation conductivity value
Insulation conductivity value
For insulated path
tin 4in��
tcb 3in��
Lsolid.block 12in��
Kin 0.2��
Kcon 13.3��
� 1 2.25Kin 0.26
0.26���
���
� 0.48���
� 1 1.458Kcon 12.05
12.05���
���
� 1.15���
Ez 1.4in 0.1 tin� �� 0.4 tcf1 tcf2 �� 0.1 tcb tcf1 tcf2 � �� ����� �� �� 2.59 in����
At L W� 1.5 104� in2����
As 2 W Lsolid.block Ez ���� ��� 1.4 103� in2����
Ap At As 1.36 104� in2����
Rvalue.summer 0.25 1Kcon
tcf1 tcf2 ����
���
in 1 �1
Kintin
���
���
in 1 ������
�����
1
Kcontcb
���
���
in 1 ������
�����
0.68��
Rvalue.summer 21.38�
Rvalue.summer.solid.path 0.25 1Kcon
tcf1 tcf2 tcb tin ����
���
in 1 ������
�����
0.68 1.68���
A'sAsAt
0.09���
A'pApAt
0.91���
FinalR.Value1
A'sRvalue.summer.solid.path
A'pRvalue.summer
���
���
10.2���