Prestress Force Monitoring and Quantification of Precast ...
21
Citation: Li, H.; Li, J.; Xin, Y.; Hao, H.; Le, T.D.; Pham, T.M. Prestress Force Monitoring and Quantification of Precast Segmental Beams through Neutral Axis Location Identification. Appl. Sci. 2022, 12, 2756. https:// doi.org/10.3390/app12052756 Academic Editors: Steve C. S. Cai, Wen Xiong and Xuan Kong Received: 10 January 2022 Accepted: 28 February 2022 Published: 7 March 2022 Publisher’s Note: MDPI stays neutral with regard to jurisdictional claims in published maps and institutional affil- iations. Copyright: © 2022 by the authors. Licensee MDPI, Basel, Switzerland. This article is an open access article distributed under the terms and conditions of the Creative Commons Attribution (CC BY) license (https:// creativecommons.org/licenses/by/ 4.0/). applied sciences Article Prestress Force Monitoring and Quantification of Precast Segmental Beams through Neutral Axis Location Identification Han Li 1 , Jun Li 1, * , Yu Xin 2 , Hong Hao 1 , Tan D. Le 1 and Thong M. Pham 1 1 Centre for Infrastructural Monitoring and Protection, School of Civil and Mechanical Engineering, Curtin University, Kent Street, Bentley, WA 6102, Australia; [email protected] (H.L.); [email protected] (H.H.); [email protected] (T.D.L.); [email protected] (T.M.P.) 2 College of Civil Engineering, Hefei University of Technology, Hefei 230009, China; [email protected] * Correspondence: [email protected] Abstract: This paper proposes using neutral axis locations to monitor and quantify the prestress force in post-tensioned precast segmental beams. Strain measurements are used to obtain the neutral axis locations of specific cross-sections of the precast prestressed segmental beams, based on the plane–remains–plane and linear strain distribution assumption. A theoretical calculation method based on the static equilibrium of a specific cross-section is developed to calculate the prestress force in segmental beams based on the neutral axis location. To verify the accuracy of the proposed method, a post-tensioned prestressed segmental beam is built and tested in the laboratory. A corresponding high-fidelity finite element model is also developed based on the beam design and material properties. Experimental studies and numerical simulations are conducted to verify the feasibility and accuracy of the proposed method in quantifying the prestress force in precast segmental beams. Both experimental and numerical results demonstrate that the proposed method can reliably estimate the prestress force, which can be used to monitor the prestress force loss in post-tensioned structures. Keywords: precast segmental beam; prestress force; quantification; post-tensioning; neutral axis location 1. Introduction Loss of prestress force jeopardizes the structural integrity, and in extreme cases could lead to catastrophic collapse of prefabricated segmented structures. As prefabrication has been becoming more and more popular in construction, effective monitoring of the prestress force is one of the primary concerns for management of prefabricated structures. Many studies have been conducted to investigate the effect of prestress force on the vibra- tion characteristics of prestressed concrete beams for developing methods to monitor the prestress force through vibration tests. The researchers [1–3] reported that an increase in the prestress force could lead to a decrease in the natural vibration frequencies of prestressed beams. However, different, or even opposite observations and conclusions have also been reported, with respect to the effect of prestress force on the natural vibration frequency of the prestressed concrete beams. The studies [4–7] concluded that the prestress force has a negligible effect on the vibration frequencies of prestressed beams, while [8–11] have demonstrated that prestress force and natural vibration frequency are positively correlated. Besides the mixed observations of the relationship between prestress force and vibration frequency, the vibration frequency of a structure is not always sensitive to the change in prestress force [12]. The effectiveness of using the natural vibration frequency as a feature to evaluate prestress force is also affected by other factors, e.g., measurement noise [13,14], temperature, and humidity [14,15], which may cause even more substantial variations in vibration frequencies of a structure than the change in prestress force. Therefore, the natural vibration frequencies of prefabricated structures, although they are relatively easily Appl. Sci. 2022, 12, 2756. https://doi.org/10.3390/app12052756 https://www.mdpi.com/journal/applsci
-
Upload
khangminh22 -
Category
Documents
-
view
0 -
download
0
Transcript of Prestress Force Monitoring and Quantification of Precast ...
�����������������
Citation: Li, H.; Li, J.; Xin, Y.; Hao, H.;
Le, T.D.; Pham, T.M. Prestress Force
Monitoring and Quantification of
Precast Segmental Beams through
Neutral Axis Location Identification.
Appl. Sci. 2022, 12, 2756. https://
doi.org/10.3390/app12052756
Academic Editors: Steve C. S. Cai,
Wen Xiong and Xuan Kong
Received: 10 January 2022
Accepted: 28 February 2022
Published: 7 March 2022
Publisher’s Note: MDPI stays neutral
with regard to jurisdictional claims in
published maps and institutional affil-
iations.
Copyright: © 2022 by the authors.
Licensee MDPI, Basel, Switzerland.
This article is an open access article
distributed under the terms and
conditions of the Creative Commons
Attribution (CC BY) license (https://
creativecommons.org/licenses/by/
4.0/).
applied sciences
Article
Prestress Force Monitoring and Quantification of PrecastSegmental Beams through Neutral Axis Location IdentificationHan Li 1, Jun Li 1,* , Yu Xin 2 , Hong Hao 1, Tan D. Le 1 and Thong M. Pham 1
1 Centre for Infrastructural Monitoring and Protection, School of Civil and Mechanical Engineering,Curtin University, Kent Street, Bentley, WA 6102, Australia; [email protected] (H.L.);[email protected] (H.H.); [email protected] (T.D.L.); [email protected] (T.M.P.)
2 College of Civil Engineering, Hefei University of Technology, Hefei 230009, China; [email protected]* Correspondence: [email protected]
Abstract: This paper proposes using neutral axis locations to monitor and quantify the prestressforce in post-tensioned precast segmental beams. Strain measurements are used to obtain theneutral axis locations of specific cross-sections of the precast prestressed segmental beams, basedon the plane–remains–plane and linear strain distribution assumption. A theoretical calculationmethod based on the static equilibrium of a specific cross-section is developed to calculate theprestress force in segmental beams based on the neutral axis location. To verify the accuracy of theproposed method, a post-tensioned prestressed segmental beam is built and tested in the laboratory.A corresponding high-fidelity finite element model is also developed based on the beam designand material properties. Experimental studies and numerical simulations are conducted to verifythe feasibility and accuracy of the proposed method in quantifying the prestress force in precastsegmental beams. Both experimental and numerical results demonstrate that the proposed methodcan reliably estimate the prestress force, which can be used to monitor the prestress force loss inpost-tensioned structures.
Keywords: precast segmental beam; prestress force; quantification; post-tensioning; neutral axis location
1. Introduction
Loss of prestress force jeopardizes the structural integrity, and in extreme cases couldlead to catastrophic collapse of prefabricated segmented structures. As prefabricationhas been becoming more and more popular in construction, effective monitoring of theprestress force is one of the primary concerns for management of prefabricated structures.Many studies have been conducted to investigate the effect of prestress force on the vibra-tion characteristics of prestressed concrete beams for developing methods to monitor theprestress force through vibration tests. The researchers [1–3] reported that an increase in theprestress force could lead to a decrease in the natural vibration frequencies of prestressedbeams. However, different, or even opposite observations and conclusions have also beenreported, with respect to the effect of prestress force on the natural vibration frequency ofthe prestressed concrete beams. The studies [4–7] concluded that the prestress force hasa negligible effect on the vibration frequencies of prestressed beams, while [8–11] havedemonstrated that prestress force and natural vibration frequency are positively correlated.Besides the mixed observations of the relationship between prestress force and vibrationfrequency, the vibration frequency of a structure is not always sensitive to the change inprestress force [12]. The effectiveness of using the natural vibration frequency as a featureto evaluate prestress force is also affected by other factors, e.g., measurement noise [13,14],temperature, and humidity [14,15], which may cause even more substantial variationsin vibration frequencies of a structure than the change in prestress force. Therefore, thenatural vibration frequencies of prefabricated structures, although they are relatively easily
Appl. Sci. 2022, 12, 2756. https://doi.org/10.3390/app12052756 https://www.mdpi.com/journal/applsci

Appl. Sci. 2022, 12, 2756 2 of 21
obtained through vibration tests, are not a reliable indicator for identification of the changesof the prestress force.
The neutral axis is a universal parameter of beam-like structures that is related to thecentroid of stiffness in a cross-section. Anastasopoulos et al. [14] reported that temperaturechanges in a concrete beam do not have a measurable influence on the neutral axis location,which is directly related with bending stiffness of the structural cross-section. The neutralaxis location is only dependent on the material and geometric properties of the beamcross-section [16]. It remains stable under changing temperature, and it is insensitiveto environmental noise, therefore making it a promising feature for structural conditionidentification. This characteristic of the neutral axis implies that it has the potential tobe used for damage detection [17–20], and condition assessment of the structures due totypical damage such as cracking, delamination, and loss of materials, which affects thecross-section, and may lead to a change in the location of the centroid [17]. The abovestudies focused on using the neutral axis location to detect whether damage has occurred.However, the possibility and feasibility of using the neutral axis location to quantify theprestress force, to the best of our knowledge, is yet to be reported. Since the neutralaxis location depends on the force equilibrium over the cross-section, identification ofthe neutral axis location would lead to the determination of prestress force. Abdel-Jaberand Glisic [21] reviewed the currently available prestress force monitoring methods forprestressed concrete structures, and found that most studies focused on monitoring theoccurrence of prestress force loss rather than the quantification of the prestress force level.
In recent years, precast prestressed segmental beams have been widely used in bridgeconstructions around the world, owing to the merits of better quality control and efficientconstruction on site. The prestress force has a significant effect on the static flexural anddynamic behavior of the precast prestressed segmental beams, and the loss of prestressforce owing to the corrosion or other causes, such as relaxation or friction, could affect theservice life of precast segmental beams [22,23]. Therefore, monitoring the prestress forceloss and quantifying the prestress force in precast prestressed segmental beams is essentialto ensure the integrity and performance of the prefabricated structures.
In this paper, a theoretical method is proposed to quantify the prestress force inprecast segmental beams, based on strain measurements to obtain the neutral axis location.This method is developed based on the static equilibrium over a specific cross-sectionof the segmental beam. Experimental tests on a scaled precast segmental concrete beamwith post-tensioned unbonded external prestressed tendons are conducted to verify theproposed approach. The corresponding high-fidelity FEM of the tested segmental beamis also established. Parametric sensitivity analysis is conducted using the verified FEM toidentify the most sensitive parameters to the prestress force change. The response surface(RS) method is used to update the initial FEM based on the measured static displacementresponses and the neutral axis location, to refine and ensure that the updated FEM canbetter reflect the behavior and status of the real tested structure. Numerical simulations forquantifying the prestress force by using the proposed approach are conducted. Based onexperimental verifications and numerical simulations, the accuracy and reliability of theproposed approach for quantifying the prestress force are validated.
The reminder of this paper is organized as follows. Section 2 provides a detailedtheoretical derivation for quantifying the prestress force in precast segmental beams basedon neutral axis location obtained from strain measurements. Section 3 describes the ex-perimental testing specimen of the prestressed segmental beam. This section includesa detailed description of the design, the geometry and material properties of the testedprestressed segmental beam. Experimental test setup, post-tensioning process, loading pro-cess, and strain data acquisition are described in this section. The experimental validationon the proposed approach is conducted, and the discussions on the difference betweenthe theoretically predicted and experimental measured results are also provided in thissection. Section 4 describes a corresponding high-fidelity FEM based on the design ofthe experimental segmental beam. In Section 5, the parametric sensitivity analysis and

Appl. Sci. 2022, 12, 2756 3 of 21
model updating are conducted for refining the initial model. Numerical simulations withdifferent levels of prestress forces are conducted, and the strain measurements are taken.Studies are conducted to further validate the accuracy of using the proposed approach forquantifying the prestress force with the strain data in numerical simulations. In addition,the strain responses at the web of the bridge model subjected to a dynamic load are alsoused for identifying the prestress force by the proposed method. Section 6 provides a briefconclusion and discussion of the feasibility and accuracy of the proposed approach.
2. Theoretical Derivation
In this study, a static equilibrium over a cross-section of the prestressed segmentalbeam is employed to obtain the neutral axis location with strain measurement data. Thestrain data-based methods were used for obtaining the neutral-axis location due to the ma-turity of the well-established relationship between strain and stress [21]. This cross-sectionanalysis uses strain values on a specific cross-section of a segmental beam to compute theneutral axis location by adopting the assumption of the linear strain distribution. Figure 1shows two parallel strain gauges installed at the web in the longitudinal direction, withone placed at the top denoted as εst and one at the bottom denoted as εsb, with a distanceof h between them. The distance between the bottom strain gauge and the bottom of thebeam section is denoted as m. The neutral axis location X0 can be calculated based on thelinear strain distribution as [24]:
X0 =εsbh
(εsb + εst)+ m (1)
1
Figure 1. Strain distribution along the cross-section of the beam.
By assuming linear strain distributions, which implies the cross-section remains planeduring deformation, and the beam is considered to be composed of discrete linear fibers [20],the longitudinal strain εI at any point on the cross-section of the beam can be calculatedbased on the distance hi from the neutral axis location. The strains at the top and bottom ofthe cross-section of the beam are denoted as εt and εb, respectively, as shown in Figure 1.The relationship between I and εsb, and the ratio of the top strain gauge εst and bottomstrain gauge εsb can be expressed as:
εi
εsb=
hi
hsb,εst
εsb=
hst
hsb(2)
where Ii, hsb and hst, as indicated in Figure 1, represent the distances from the point ofinterest, bottom strain gauge, and top strain gauge to the neutral axis, respectively.
During the post-tensioning process, only the stress in the prestress tendons causesthe deformation of the entire precast segmental beam, since no external loading force isapplied on the beam. Accordingly, the static equilibrium of a specific cross-section of the

Appl. Sci. 2022, 12, 2756 4 of 21
segmental beam with the post-tensioning force is obtained, as shown in Equation (3). Theschematic of the force equilibrium of the beam is illustrated in Figure 2.∫
AσdA = F (3)
Figure 2. Schematic for the force equilibrium of the beam.
During the post-tensioning process, concrete is in the linear elastic range, whereinstress σ is proportional to strain ε. Following Hooke’s law, it has σ = ε × EC, whereEC denotes the elastic modulus of concrete. The concrete stresses at the top and bottomlocations at the cross-section of the beam are denoted as σb and σt, respectively, as shownin Figure 2. Since tensile reinforcements, which discontinue between segments, have onlysmall deformation, and remain in the elastic range (σs < fy), the stress of the reinforcementscan be calculated from the corresponding strain by σs = εs × Es, where Es is the elasticmodulus of steel. Accordingly, based on the static equilibrium of the cross-section, therelationship between the neutral axis location X0 and the prestress force F can be derivedfrom the below equation:
−∫ X0
0f(σi)bdy − σbsAbs − σmsAms − F +
∫ Hb
X0
f(σi)bdy +∫ H
Hb
f(σi)bfdy + σtsAts = 0 (4)
where f(σi) denotes a function of the stress distribution along the cross-section, which iscalculated based on the strain distribution over the cross-section. Ats and σts represent thearea and stress of the top reinforcements, respectively; Abs and σbs are the area and stressof the bottom reinforcements, respectively; and Ams and σms denote the area and stressof the middle reinforcements, i.e., the reinforcements above the prestress tendon, whichmay or may not exist in practice, respectively. These reinforcements are included hereinfor the completeness. Hb represents the height of the flange, and H is the total height ofthe cross-section of the structure; b and bf are the web thickness and flange width of theT-shaped cross-section, respectively. Therefore, the prestress force of the tendon can becalculated as:
F =(σt + σb)
2H
(−2bX2
0 + bH 2b + bfH
2 − bfH2b
)+ σb(2bX0 − bHb − bfH + bfHb)− σbsAbs − σmsAms + σtsAts (5)
In this paper, experimental investigations and numerical verification of this proposedapproach for quantifying the prestress force in a segmental beam are conducted. Theresults are compared to those obtained in the test to verify the reliability and accuracyof the proposed method. The relative errors between experimental measured and theo-retically predicted prestress forces, and between numerically simulated and theoreticallypredicted prestress forces, are calculated and denoted by using the symbol ‘RE’ in thesubsequent studies.

Appl. Sci. 2022, 12, 2756 5 of 21
3. Experimental Verification3.1. Description of the Experimental Beam
In this study, a scaled precast segmental concrete beam with external post-tensionedunbonded tendons is fabricated, as shown in Figure 3. The total length of the precastprestressed segmental beam is 3.9 m. This precast segmental beam consists of four concretesegments, which are connected by two external post-tensioned unbonded tendons. Thecross-section of the tested beam is shown in Figure 4. The height of the cross-section is400 mm. The dimensions of the web of the T-shaped cross-section are 200 mm × 320 mm,and the flange size is 600 mm × 80 mm. The dry joints between every two segments aredesigned with multiple shear keys. Young’s modulus of the concrete used in the segmentalbeam measures 3.047 × 10¹⁰ Pa. More detailed information of the tested beam can be foundin Le et al. [22]. The material properties of steel reinforcement bars and prestressed steeltendons are listed in Table 1.
Figure 3. Tested precast prestressed concrete segmental beam.
Figure 4. Cross-section of the segmental beam.
Table 1. Material properties of steel bars and prestressed steel tendon.
Type Diameter (mm) Cross-SectionalArea (mm2) fy (MPa) fu (Mpa) Es (Gpa)
Steel bar ∅12 12 113 534 587 200Steel bar ∅10 10 78.5 489 538 200PrestressedSteel tendon 12.7 100 1674 1860 195
Appl. Sci. 2022, 12, 2756 6 of 21
3.2. Experimental Testing3.2.1. Post-Tensioning and Installed Strain Gauges
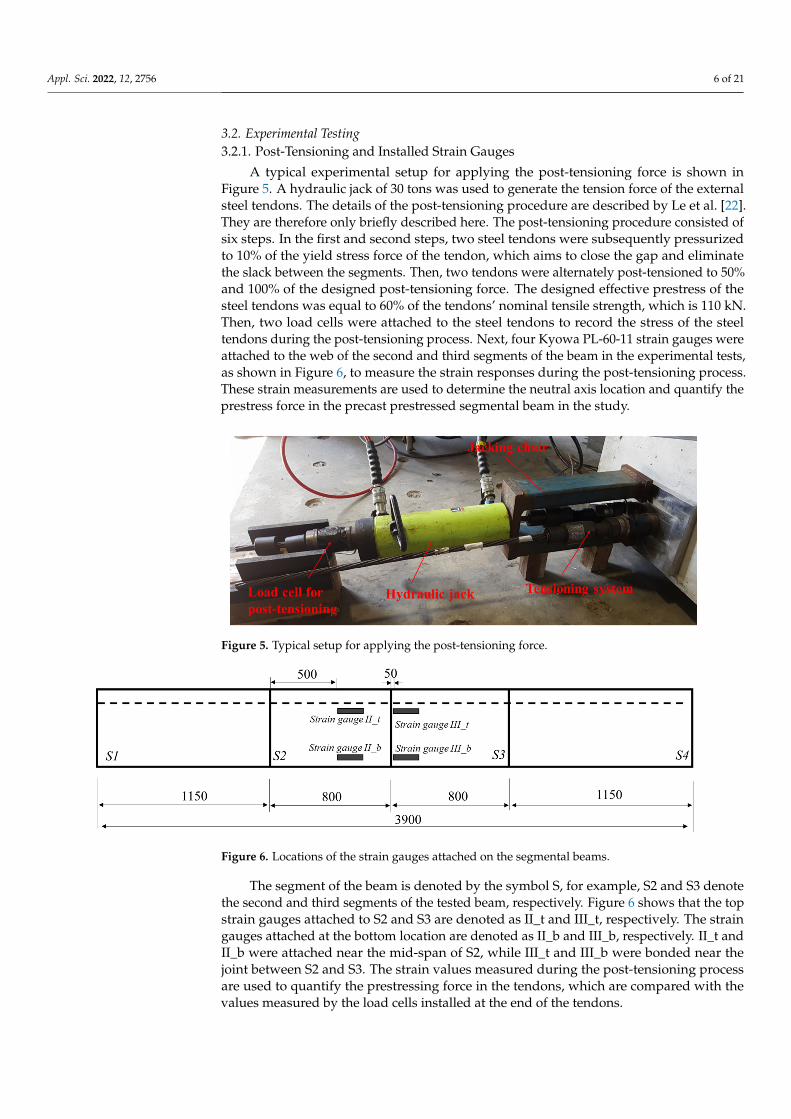
A typical experimental setup for applying the post-tensioning force is shown inFigure 5. A hydraulic jack of 30 tons was used to generate the tension force of the externalsteel tendons. The details of the post-tensioning procedure are described by Le et al. [22].They are therefore only briefly described here. The post-tensioning procedure consisted ofsix steps. In the first and second steps, two steel tendons were subsequently pressurizedto 10% of the yield stress force of the tendon, which aims to close the gap and eliminatethe slack between the segments. Then, two tendons were alternately post-tensioned to 50%and 100% of the designed post-tensioning force. The designed effective prestress of thesteel tendons was equal to 60% of the tendons’ nominal tensile strength, which is 110 kN.Then, two load cells were attached to the steel tendons to record the stress of the steeltendons during the post-tensioning process. Next, four Kyowa PL-60-11 strain gauges wereattached to the web of the second and third segments of the beam in the experimental tests,as shown in Figure 6, to measure the strain responses during the post-tensioning process.These strain measurements are used to determine the neutral axis location and quantify theprestress force in the precast prestressed segmental beam in the study.
Figure 5. Typical setup for applying the post-tensioning force.
Figure 6. Locations of the strain gauges attached on the segmental beams.
The segment of the beam is denoted by the symbol S, for example, S2 and S3 denotethe second and third segments of the tested beam, respectively. Figure 6 shows that the topstrain gauges attached to S2 and S3 are denoted as II_t and III_t, respectively. The straingauges attached at the bottom location are denoted as II_b and III_b, respectively. II_t andII_b were attached near the mid-span of S2, while III_t and III_b were bonded near thejoint between S2 and S3. The strain values measured during the post-tensioning processare used to quantify the prestressing force in the tendons, which are compared with thevalues measured by the load cells installed at the end of the tendons.

Appl. Sci. 2022, 12, 2756 7 of 21
3.2.2. Loading Process
The static loading test was performed after the completion of the post-tensioningprocess. The vertical load was generated by hydraulic jacks, and it was transferred throughtwo horizontal I-steel spreading beams to the segmental beam uniformly, as shown inFigure 7. The beam was tested for two cycles under the selected applied load of 20 kN. Inthe first cycle, the applied load was increased progressively to 20 kN and then decreasedto approximately 5 kN before starting the second cycle. In the second cycle, the appliedload was reduced to 0 kN. A load of 20 kN was selected here for analysis to ensure thatno joint opening and damage occurred and that the beam deformed linearly under theapplied load. A more detailed loading process is provided in Le et al. [22]. The appliedload was monitored by load cells, and the deflection of the beam in the experimental testswas obtained using four linear variable differential transformers (LVDTs). The locations ofthese installed LVDTs are shown in Figure 8.
Figure 7. Typical experimental setup for static loading test.
Figure 8. Location of linear variable differential transformers (LVDTs).
All LVDTs were placed at the joints between different segments of the beam as shownin Figure 8. LVDT2 and LVDT3 were located on the top surface of the beam between thesecond and third segments, whereas LVDT1 and LVDT4 were placed at the center of thetop surface between the first and second segments, and the second and third segments,respectively.
3.3. Experimental Results during the Post-Tensioning Process3.3.1. Experimental Validation of the Proposed Approach to Quantify Prestress Force
In the experiment, during the post-tensioning process, the neutral axis location calcu-lated from the recorded strain at II_t and II-b on segment S2 using Equations (1) and (2) isdenoted as ENAL2. Similarly, ENAL3 denotes the neutral axis location calculated from themeasured data at III_t and III-b on segment S3 of the beam. The prestress force recordedby the load cell in the experiment is denoted as ‘EF’. The theoretical prestress forces of thetendon (i.e., TF2 and TF3) were calculated based on ENAL2 and ENAL3 by using Equation(5). The obtained neutral axis locations, the experimentally measured prestress force of the

Appl. Sci. 2022, 12, 2756 8 of 21
beam, the calculated prestress force from strain measurements and neutral axis location,and the relative errors of the calculated prestress force against the measured ones in thetest are presented in Table 2.
Table 2. Comparison between the measured and calculated prestress forces of the beam.
ENAL2 (mm) EF (kN) TF2 (kN) RE2 ENAL3 (mm) EF (kN) TF3 (kN) RE3
305.05 61.57 64.17 4.22% 314.72 61.57 70.93 15.20%297.54 107.11 108.7 1.48% 303 107.11 119.72 11.77%
Table 2 indicates that the theoretically predicted and experimentally measured pre-stress forces have differences of 4.22% and 15.20% when using strain measurements ob-tained from segments S2 and S3, respectively, when the prestress force is approximately62 kN. At a higher prestressing level, i.e., 107 kN, the errors between the theoretical and ex-perimental results based on the measured strains on S2 and S3 are slightly reduced to about1.48% and 11.77%, respectively. These errors could be induced by a number of reasons. Theerror analysis of the theoretical calculation results is discussed in the following section.
3.3.2. Discussions
Overall, two sources are considered responsible for inducing such errors, including thevariation in the modulus of elasticity of concrete, and the strain gauge measurement error.
First, the error may have originated from the variation in the concrete modulus ofelasticity EC. The elastic modulus of concrete is a critical parameter, since it determines thestrain and displacement relationship in the section analysis, especially when the concrete isin the elastic region. The elastic modulus value can be calculated based on the compressivestrength of the concrete using the empirical formulas provided in the different designstandards and codes. However, these existing empirical equations predict the elasticmodulus of concrete with an inevitable error [25]. In this paper, the concrete properties wereobtained based on the experimental tests of six cylinders with a diameter of 100 mm and aheight of 200 mm, in compliance with the Australian Standards 1012.8.1 (AS 2014a) [26]and AS 1012.9 (AS 2014b) [27]. The compressive strength of the concrete obtained on theday of the test was 41.5 MPa, which was taken as the average of six concrete cylinders [22].The elastic modulus of concrete is 3.047 × 10¹⁰ Pa, which is calculated based on AS 3600:2018 [28] from the compressive strength of the concrete. However, it should be pointed outthat it is clearly stated that the elastic modulus of concrete has a range of ±20% from themean value [28]. Therefore, the error analysis was conducted to analyze the influence ofthe variation in the elastic modulus of the concrete on the prediction results of the prestressforce. Based on the range of the elastic modulus of concrete, the prestress force of the beamobtained from the proposed approach is recalculated based on Equation (5), and the relativeerrors of the prestress force between the theoretical calculation and experimental resultsare computed and listed in Table 3.
Table 3. Error analysis considering variations in modulus of elasticity of concrete.
Variation EC (Pa)S2 S3
RE2_62 RE2_107 RE3_62 RE3_107
−20% 2.438 × 10¹⁰ −18.77% −20.06% −10.42% −11.97%−10% 2.742 × 10¹⁰ −7.86% −9.29% 1.65% −0.09%10% 3.352 × 10¹⁰ 13.97% 12.26% 25.78% 23.65%20% 3.656 × 10¹⁰ 24.88% 23.03% 37.85% 36.52%
Original 3.047 × 10¹⁰ 3.06% 1.48% 13.72% 11.77%
Table 3 shows the relative errors in the predicted prestress force corresponding tothe different errors in elastic modulus of the concrete in the variation range given in the

Appl. Sci. 2022, 12, 2756 9 of 21
Australian Standard (AS) 3600:2018 [28]. The subscripts numbers of error indicator RE(i.e., 2 and 3) represent the segments S2 and S3, and the numbers (i.e., 62 and 107 kN)stand for the two prestressing force levels. Assuming the estimated elastic modulus basedon the obtained average concrete strength in the test is accurate, a variation of the elasticmodulus leads to significant variations in the estimated prestress force. A 10% variationin the value of the elastic modulus of concrete can result in an error of more than 10%,based on measured strains on S2, and more than 20%, based strains on S3. This meansthat the used value of the elastic modulus of concrete can result in a significant variationin the predicted prestress forces, and using strains measured on S2 always yields betterresults than those on S3. This is because strains on S3 were placed closer to the segmentjoints, where the deformation over the cross-section is not linear. More discussions onthis are presented in Section 5.4. These results demonstrate the influence of the elasticmodulus of the concrete on the prestress force estimations, and ideally the elastic modulusof concrete should be directly measured from the tested structure. Otherwise, the range ofthe identified prestress force can be determined by considering the possible variations inthe concrete elastic modulus.
The second factor that could lead to an error between the theoretically predicted resultand experimentally measured prestress force is related to the measurement error in thestrain gauge values. Since any data acquisition system has a certain level of inaccuracy andis affected by measurement noise, the errors in the strain gauges can potentially affect thetheoretical calculation results. Therefore, an error analysis of the effect of the strain gaugemeasurement accuracy on the prestress force identification is conducted, and the error ofthe strain measurement values is assumed to be at three different levels, namely, 2%, 5%,and 8%. The four strain gauges as shown in Figure 6 are considered to have these threedifferent error levels, respectively. Random numbers from the standard normal distributionwith a mean value of 0 and different standard deviation values (i.e., with different errorlevels) are added onto the experimental strain data. The relative errors in the calculatedprestress force under different error levels in the measured strains are listed in Table 4.
Table 4. Error analysis on the effect of strain measurement accuracy.
Uncertainty Error LevelS2 S3
RE2_62 (%) RE2_107 (%) RE3_62 (%) RE3_107 (%)
2% 2.84 1.38 12.68 11.445% 2.76 1.25 12.56 11.288% 2.43 1.05 12.24 10.99
Original 3.06 1.48 13.72 11.77
Table 4 indicates that increasing the strain measurement errors from 2% to 8% doesnot significantly change the estimated prestress force, with the errors remain at the similarlevel. This is because the errors in measured strains affect the positive and negative forcesfrom both the concrete and reinforcements over the cross-section, which cancel out theerror influences on the prestress force. Although both the strain and elastic modulus arelinearly proportional to the force, i.e., Eε, an error in the concrete elastic modulus hasmore significant effect on the estimated prestress force since it only affects the concreteforce over the cross-section. These results indicate that the reliability of the equipment andmeasurement noise in strain data would also influence the theoretical calculation results,but are less significant as compared to that owing to the error in concrete elastic modulus.
The experimental verification of using the proposed approach for quantifying theprestress force based on the neutral axis location shows that the predicted results havecertain differences, when compared with the experimental measured result. This may beattributed to the uncertainty of the estimated elastic modulus or strain gauge measurements.However, the proposed approach can identify the prestress force variation. Therefore, themethod can be used to identify the change in prestress force, and also approximately
Appl. Sci. 2022, 12, 2756 10 of 21
quantify the prestress level with an error range depending on the accuracy of the usedconcrete elastic modulus and measured strains. The above results also show that usingthe strains measured close to the segment joint leads to larger errors than using the strainsmeasured in the mid of the segment. Discussions and explanations of this observation willbe given in the subsequent section.
4. Numerical Verifications4.1. Numerical Finite Element Model of this Precast Segmental Beam
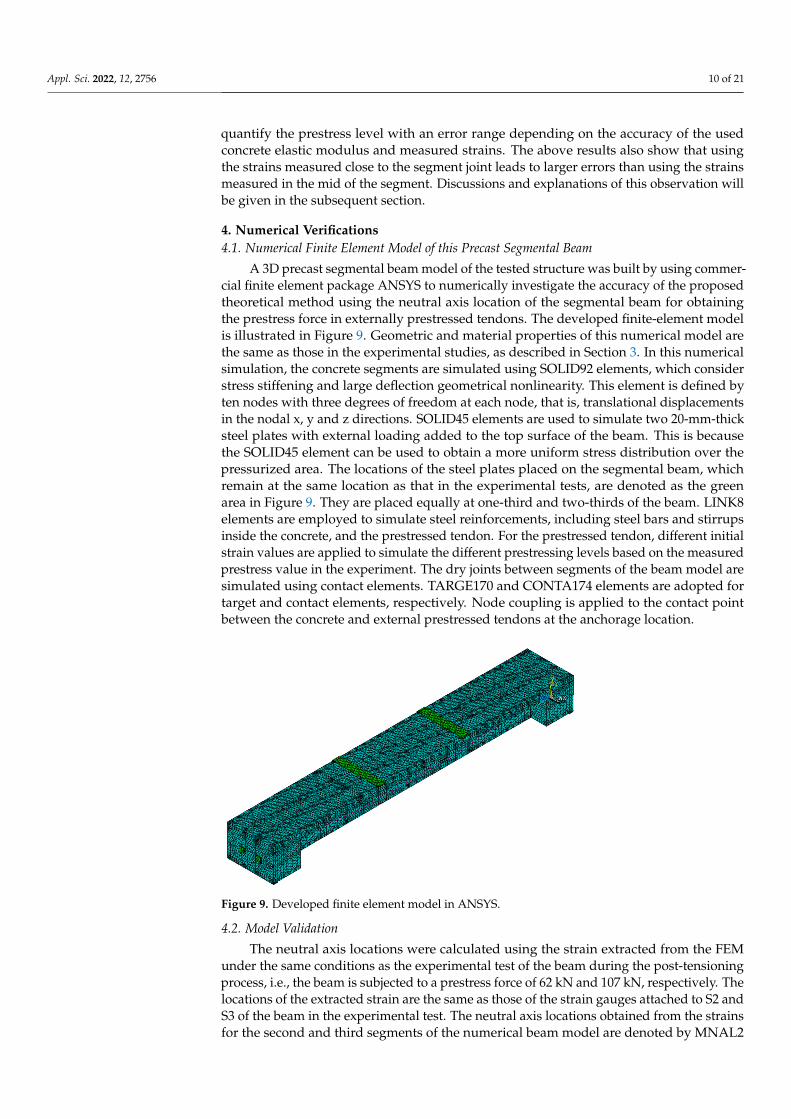
A 3D precast segmental beam model of the tested structure was built by using commer-cial finite element package ANSYS to numerically investigate the accuracy of the proposedtheoretical method using the neutral axis location of the segmental beam for obtainingthe prestress force in externally prestressed tendons. The developed finite-element modelis illustrated in Figure 9. Geometric and material properties of this numerical model arethe same as those in the experimental studies, as described in Section 3. In this numericalsimulation, the concrete segments are simulated using SOLID92 elements, which considerstress stiffening and large deflection geometrical nonlinearity. This element is defined byten nodes with three degrees of freedom at each node, that is, translational displacementsin the nodal x, y and z directions. SOLID45 elements are used to simulate two 20-mm-thicksteel plates with external loading added to the top surface of the beam. This is becausethe SOLID45 element can be used to obtain a more uniform stress distribution over thepressurized area. The locations of the steel plates placed on the segmental beam, whichremain at the same location as that in the experimental tests, are denoted as the greenarea in Figure 9. They are placed equally at one-third and two-thirds of the beam. LINK8elements are employed to simulate steel reinforcements, including steel bars and stirrupsinside the concrete, and the prestressed tendon. For the prestressed tendon, different initialstrain values are applied to simulate the different prestressing levels based on the measuredprestress value in the experiment. The dry joints between segments of the beam model aresimulated using contact elements. TARGE170 and CONTA174 elements are adopted fortarget and contact elements, respectively. Node coupling is applied to the contact pointbetween the concrete and external prestressed tendons at the anchorage location.
Figure 9. Developed finite element model in ANSYS.
4.2. Model Validation
The neutral axis locations were calculated using the strain extracted from the FEMunder the same conditions as the experimental test of the beam during the post-tensioningprocess, i.e., the beam is subjected to a prestress force of 62 kN and 107 kN, respectively. Thelocations of the extracted strain are the same as those of the strain gauges attached to S2 andS3 of the beam in the experimental test. The neutral axis locations obtained from the strainsfor the second and third segments of the numerical beam model are denoted by MNAL2

Appl. Sci. 2022, 12, 2756 11 of 21
and MNAL3, respectively. Furthermore, the static responses, namely, vertical deflectionsunder 15 kN and 20 kN loading levels, are also used for verifying the accuracy of thenumerical model. The locations of the deflections extracted from the FEM are the same asthose LVDTs installed in the experimental tests, as shown in Figure 8. Mid-span deflectionis calculated as the average value of the displacement data measured from LVDT2 andLVDT3. The deflections obtained from the experimental test are represented as EL1, EL23,and EL4, and the deflections from the FEM are expressed as ML1, ML23, and ML4. Theresults of neutral axis locations and the deflections from the numerical model are comparedwith experimental results and presented in Tables 5 and 6, respectively.
Table 5. Comparison of the neutral axis locations between the experimental and numerical results.
PrestressForce (kN)
ENAL2(mm)
MNAL2(mm) RE (%) ENAL3
(mm)MNAL3
(mm) RE (%)
62 305.05 301.55 −1.15% 314.72 308.85 −1.87%107 297.54 290.36 −2.41% 303 298.08 −1.62%
Table 6. Comparison of the deflections between experimental tests and numerical analysis.
Static Loads (kN) EL1 (mm) ML1 (mm) RE (%) EL23 (mm) ML23 (mm) RE (%) EL4 (mm) ML4 (mm) RE (%)
15 −0.80 −0.83 3.75 −1.03 −1.01 −1.94 −0.94 −0.84 −10.6420 −1.04 −1.11 6.73 −1.35 −1.4 3.70 −1.27 −1.12 −11.81
Table 5 indicates that the neutral axis locations from the experimental and numericalresults of the segmental beams are close to each other for the cases of 62 kN and 107 kNprestress force. The relative errors are less than 3%, which implies that this model canbasically represent the tested beam. The experimental deflection results of the segmentedbeam in general also agree with the numerical results, except at location L4, where a largererror of 11.81% is obtained. These errors might be introduced by the uncertainties in theFEM, such as the assumptions of the boundary conditions and material properties of theinitial model. The differences in the neutral axis locations and the deflections between theexperimental and numerical results show that it is necessary to refine the original FEM toensure that the built numerical model can be used to represent the structural behavior moreaccurately. Therefore, in this study, the neutral axis locations and structural deflectionsunder static loading tests are adopted to conduct the finite element model updating analysis.In particular, the neutral axis locations with 107 kN prestress force during the post-tensionprocess and the deflections at four locations on the top of the beam under two specific staticloading levels of 15 kN and 20 kN, are used.
5. Model Updating for the Segmental Beam5.1. Parametric Sensitivity Analysis
Parametric sensitivity analysis for selecting the parameters to be updated is conductedto determine which model parameters significantly affect the neutral axis locations andstatic displacement responses, before updating the original segmental beam model. Thegeometric parameters of the prestress tendons are measured, and therefore not consideredin the model updating analysis. For the segmental beam model, the model parameters,including three material parameters and two joint parameters, are selected as the parame-ters to be updated. The geometric parameters of the prestress tendons are measured andtherefore not considered in the model updating analysis.
The selected material parameters comprise the elastic modulus of concrete Ec, densityof concrete ρc, elastic modulus of the prestress tendon Es, normal contact stiffness factorNSct, and tangent contact stiffness factor TSct. NSct and TSct are the scale parametersof contact stiffness. In ANSYS, for the normal contact stiffness, there are two possibleapproaches to determine their values, which include defining a stiffness factor NSct thatacts as a scale factor of the contact stiffness Kn, or specifying the magnitude of the contact

Appl. Sci. 2022, 12, 2756 12 of 21
stiffness Kn directly. It is not evident if the determined stiffness value from these approachesis correct or reasonable for each contact problem since the value of the contact stiffnessKn is determined by certain parameters, such as Young’s modulus, contact area, and scalefactor NSct. Thus, scale factors are used to define the stiffness of the contact elements. Forthe normal contact stiffness, the normal stiffness factor NSct has a range of 0.01–1.0. Thedefault value in ANSYS is 1.0, and a higher stiffness value leads to a lower amount ofpenetration or slip [29].
The method for selecting more influential parameters from these candidate parametersis based on the sensitivity analysis, where the corresponding change in the structuraldisplacement responses and neutral axis locations is calculated when there is a 10% changein these parameters. The sensitivity analysis results are given in Table 7. When thesensitivity of displacement responses is greater than 2%, and the sensitivity of neutralaxis position calculated from S2 and S3 is larger than 0.03%, the corresponding structuralparameters are considered as candidate parameters for model updating.
Table 7. Sensitivity analysis results of the candidate model parameters.
ParametersChanges of
Parameters (%)
Sensitivity of DisplacementResponses with Respect to the
Parameter (%)
Sensitivity of Neutral AxisLocation (%)
ML1 ML23 ML4 MNAL2 MNAL2
Ec 10 8.04 8.04 8.04 0.14 0.08ρc 10 1.38 1.40 1.37 −0.18 −0.03Es 10 −10.65 −10.67 −10.65 0.41 0.25
NSct 10 2.02 2.06 2.15 −0.01 −0.02TSct 10 0.00 0.00 0.00 0.04 −0.01
Based on the aforementioned criteria, it can be observed from Table 7 that the elasticmodulus of the concrete and prestress tendons have significant influences on the displace-ment response and the neutral axis location. The density of concrete affects the displacementresponses more significantly than that of the neutral axis location. Both the normal andtangent contact stiffness factors show a relatively smaller influence on the displacementand neutral axis location than the other structural parameters. Accordingly, these threeparameters, Ec, ρc, and Es, are selected as the critical parameters to be updated for thesegmental beam model.
5.2. Model Updating Based on the Measured Static Data
The objective of the model updating is to minimize the objective function H(θ) for-mulated as the difference in the deflections and neutral axis locations between the ex-perimentally measured and numerical results when the prestress level of the beam is107 kN for obtaining the optimal value of the candidate parameters. In this paper, the RSmethod [30] is employed for updating the selected parameters. The second-order polyno-mial function with interaction effects is used to build the relationship between the physicalsystem parameters (i.e., Ec, ρc, Es) and output response in terms of vertical deflection andneutral-axis location.
H(θ) = HLα−15(θ) + HLα−20(θ) + HS2(θ) + HS3(θ) (6)
where
HLα−15(θ) =n
∑i=1
(RSMLα−15(θ)− ELα_15
ELα_15
)2
(7)
HLα−20(θ) =n
∑i=1
(RSMLα−20(θ)− ELα_20
ELα_20
)2
(8)

Appl. Sci. 2022, 12, 2756 13 of 21
HS2(θ) =n
∑i=1
(RSMS2(θ)− ENAL2
ENAL2
)2
(9)
HS3(θ) =n
∑i=1
(RSMS3(θ)− ENAL3
ENAL3
)2
(10)
in which the vector of parameters to be updated is defined as θ = [Ec, ρc, Es], ELα_15 andELα_20 represent the measured static displacements of the segmental beam at location αcorresponding to the four LVDTs during the static loading tests of 15 kN and 20 kN, respec-tively, and RSMLα−15(θ) and RSMLα−20(θ) are the respective predicted static displacementsat location α from the numerical analysis. The term RSMS2(θ) denotes the predicted neutralaxis locations of the second segment during the post-tensioning process, and RSMS3(θ)denotes the predicted neutral axis locations of the third segment of the tested beam. Theestimated RS function can thus be expressed as:
RSM(θ) = β0 +n
∑iβiθi +
n
∑iβiiθ
2i + ∑
i<j
n
∑j=2βijθiθj (11)
where βi denotes the partial regression coefficient, θi represents the model parameters, andθiθj denotes the interaction effect between these parameters.
When the RS model is determined with numerical analysis, the objective function H(θ)described in Equation (6) can be built based on the measured data. Then, the simulatedannealing global optimization algorithm is used to minimize the objective function H(θ),and obtain the optimal parameters of the segmental beam model. To validate the accuracyof the updated finite element model, the relative error is used to evaluate the difference instructural responses between the updated model and measured data in the experiment.
After the model updating of the segmental beam model, the calibrated model param-eters are presented in Table 8. The corresponding predicted structural responses of theupdated segmental beam model are listed in Table 9. Table 9 indicates that the updatedsegmental beam model can accurately predict the structural displacement responses andneutral axis locations with a maximum error less than 5%. This means that the calibratedsegmental beam model can reliably be used to predict the structural deflections.
Table 8. Initial values and updated parameters of the candidate parameters.
Parameters Ec (Pa) ρc(kg/m3) Es (Pa)
Initial values 3.047 × 10¹⁰ 2450 1.95 × 10¹¹
Updated values 3.045 × 10¹⁰ 2625 2.05 × 10¹¹
Table 9. Defined error indices for the updated model.
CasesNeural Axis Location 15 kN 20 kN
MNAL2 MNAL3 ML1 ML23 ML4 ML1 ML23 ML4
RE (%)Original −2.47 −1.65 4.15 1.92 11.29 6.73 3.86 13.73Updated 0.49 −0.15 −3.39 −0.96 1.25 −3.49 −3.55 4.9
From Table 9, the accuracy of the updated model exhibits an appreciable improvementwhen comparing with the initial model. The relative errors in neutral axis locations andstatic deflection responses are significantly reduced. After model updating, the relativeerrors of neutral-axis locations are less than 1%. For the deflections under two differentloading levels, although the results are not as good as that of the neutral axis locations, therelative errors are within an acceptable range, which is less than 5%. This means that anaccurate FEM is obtained to represent the tested precast segmental beam under the staticloads. To further validate the accuracy of the updated segmental beam model, a case with
Appl. Sci. 2022, 12, 2756 14 of 21
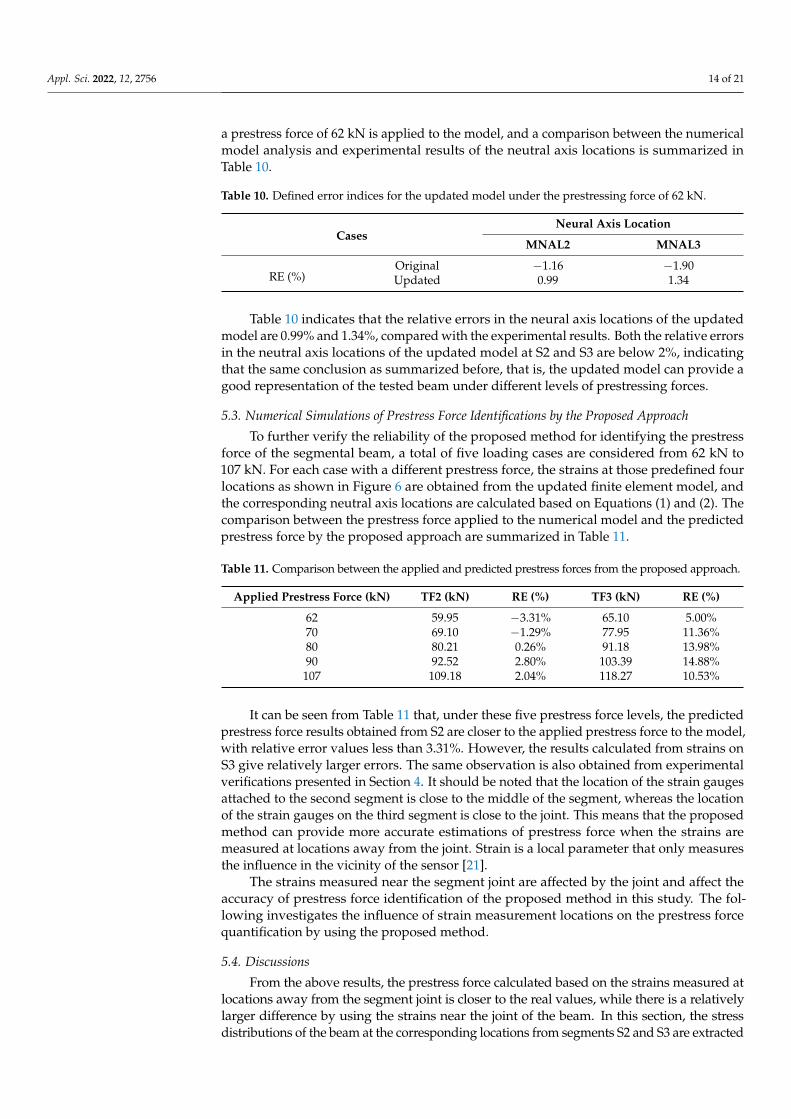
a prestress force of 62 kN is applied to the model, and a comparison between the numericalmodel analysis and experimental results of the neutral axis locations is summarized inTable 10.
Table 10. Defined error indices for the updated model under the prestressing force of 62 kN.
CasesNeural Axis Location
MNAL2 MNAL3
RE (%)Original −1.16 −1.90Updated 0.99 1.34
Table 10 indicates that the relative errors in the neural axis locations of the updatedmodel are 0.99% and 1.34%, compared with the experimental results. Both the relative errorsin the neutral axis locations of the updated model at S2 and S3 are below 2%, indicatingthat the same conclusion as summarized before, that is, the updated model can provide agood representation of the tested beam under different levels of prestressing forces.
5.3. Numerical Simulations of Prestress Force Identifications by the Proposed Approach
To further verify the reliability of the proposed method for identifying the prestressforce of the segmental beam, a total of five loading cases are considered from 62 kN to107 kN. For each case with a different prestress force, the strains at those predefined fourlocations as shown in Figure 6 are obtained from the updated finite element model, andthe corresponding neutral axis locations are calculated based on Equations (1) and (2). Thecomparison between the prestress force applied to the numerical model and the predictedprestress force by the proposed approach are summarized in Table 11.
Table 11. Comparison between the applied and predicted prestress forces from the proposed approach.
Applied Prestress Force (kN) TF2 (kN) RE (%) TF3 (kN) RE (%)
62 59.95 −3.31% 65.10 5.00%70 69.10 −1.29% 77.95 11.36%80 80.21 0.26% 91.18 13.98%90 92.52 2.80% 103.39 14.88%
107 109.18 2.04% 118.27 10.53%
It can be seen from Table 11 that, under these five prestress force levels, the predictedprestress force results obtained from S2 are closer to the applied prestress force to the model,with relative error values less than 3.31%. However, the results calculated from strains onS3 give relatively larger errors. The same observation is also obtained from experimentalverifications presented in Section 4. It should be noted that the location of the strain gaugesattached to the second segment is close to the middle of the segment, whereas the locationof the strain gauges on the third segment is close to the joint. This means that the proposedmethod can provide more accurate estimations of prestress force when the strains aremeasured at locations away from the joint. Strain is a local parameter that only measuresthe influence in the vicinity of the sensor [21].
The strains measured near the segment joint are affected by the joint and affect theaccuracy of prestress force identification of the proposed method in this study. The fol-lowing investigates the influence of strain measurement locations on the prestress forcequantification by using the proposed method.
5.4. Discussions
From the above results, the prestress force calculated based on the strains measured atlocations away from the segment joint is closer to the real values, while there is a relativelylarger difference by using the strains near the joint of the beam. In this section, the stressdistributions of the beam at the corresponding locations from segments S2 and S3 are extracted
Appl. Sci. 2022, 12, 2756 15 of 21
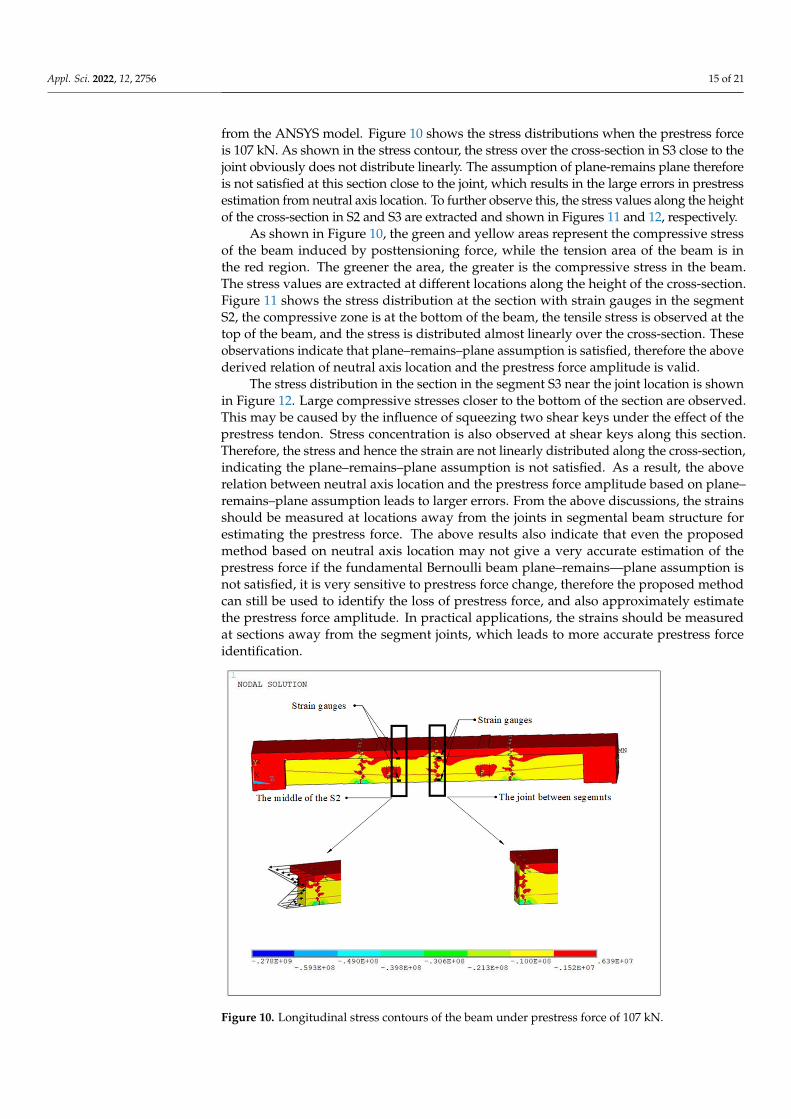
from the ANSYS model. Figure 10 shows the stress distributions when the prestress forceis 107 kN. As shown in the stress contour, the stress over the cross-section in S3 close to thejoint obviously does not distribute linearly. The assumption of plane-remains plane thereforeis not satisfied at this section close to the joint, which results in the large errors in prestressestimation from neutral axis location. To further observe this, the stress values along the heightof the cross-section in S2 and S3 are extracted and shown in Figures 11 and 12, respectively.
As shown in Figure 10, the green and yellow areas represent the compressive stressof the beam induced by posttensioning force, while the tension area of the beam is inthe red region. The greener the area, the greater is the compressive stress in the beam.The stress values are extracted at different locations along the height of the cross-section.Figure 11 shows the stress distribution at the section with strain gauges in the segmentS2, the compressive zone is at the bottom of the beam, the tensile stress is observed at thetop of the beam, and the stress is distributed almost linearly over the cross-section. Theseobservations indicate that plane–remains–plane assumption is satisfied, therefore the abovederived relation of neutral axis location and the prestress force amplitude is valid.
The stress distribution in the section in the segment S3 near the joint location is shownin Figure 12. Large compressive stresses closer to the bottom of the section are observed.This may be caused by the influence of squeezing two shear keys under the effect of theprestress tendon. Stress concentration is also observed at shear keys along this section.Therefore, the stress and hence the strain are not linearly distributed along the cross-section,indicating the plane–remains–plane assumption is not satisfied. As a result, the aboverelation between neutral axis location and the prestress force amplitude based on plane–remains–plane assumption leads to larger errors. From the above discussions, the strainsshould be measured at locations away from the joints in segmental beam structure forestimating the prestress force. The above results also indicate that even the proposedmethod based on neutral axis location may not give a very accurate estimation of theprestress force if the fundamental Bernoulli beam plane–remains—plane assumption isnot satisfied, it is very sensitive to prestress force change, therefore the proposed methodcan still be used to identify the loss of prestress force, and also approximately estimatethe prestress force amplitude. In practical applications, the strains should be measuredat sections away from the segment joints, which leads to more accurate prestress forceidentification.
Figure 10. Longitudinal stress contours of the beam under prestress force of 107 kN.

Appl. Sci. 2022, 12, 2756 16 of 21
Figure 11. (a) The stress distribution contour in the longitudinal direction of the cross-section withstrain gauges in S2. (b) Stress distribution over the cross-section with strain gauges in S2.
Figure 12. Cont.

Appl. Sci. 2022, 12, 2756 17 of 21
Figure 12. (a) The stress distribution in the longitudinal direction of the cross-section of strain gaugelocations in S3. (b) Stress distribution over the cross-section with strain gauges in S3.
5.5. Prestress Force Quantification under the Dynamic Load
In practice, dynamic testing is relatively easier to carry out than static loading tests. Inthis section, numerical study is conducted to identify the prestress force by using the strainresponses at the web of the bridge model subjected to a dynamic load. This investigation isconducted to simulate the realistic situation to predict the prestress force of the segmentalbeam from ordinary dynamic tests after the post-tensioning force has been applied, suchas hammer impact tests. Figure 13 shows the hammer impact load applied on the middleof the second segment with a sampling rate of 2048 Hz and a sampling duration of 0.5 s.It is noted that this hammer impact force is measured from a real vibration test with aninstrumented hammer, and this force is used as the external load applied in this numericalsimulation to calculate the strain response data. The true applied prestress force of thenumerical model is 107 kN. The strain responses calculated from the FEM at the top andbottom locations at the middle of the segment S2, i.e., II_t and II_b described in the aboveexperimental tests, under the applied dynamic load, are shown in Figure 14.
The prestress force is identified by using the proposed method based on Equations (3)–(5),with the above-extracted strain values at the same locations as those in the experimental test.The identified prestress force from strain measurements, and the relative error between theapplied prestress force in the FEM and the identified prestress force during the dynamictesting period, are shown in Figure 15a,b, respectively.
Figure 13. Dynamic load applied on the numerical model.

Appl. Sci. 2022, 12, 2756 18 of 21
Figure 14. The strain responses calculated from the FEM at the locations of II_t and II_b.
Figure 15. Prestress force identification results: (a) The identified prestress force from strain measure-ments. (b) The relative error between the simulated prestress force in the FEM and the identifiedprestress force with strain responses.
It can be observed from Figure 15 that the identified prestress forces have relativelylarge fluctuations within the first 0.05 s, owing to the influence of the applied external forceacting on the beam at the beginning, which in fact changes the prestress force. However, asthe vibration level is small, the change of the prestress force level is also small. The largesterror of the identified prestress force level is less than 3%. In the free-vibration phase, thevibration level is smaller, the identified prestress force is relatively stable, that is, it oscillatesbetween 108–109 kN. The relative error between the identified average prestress force andthe actual applied prestress force in the numerical model in the free-vibration phase from0.4–0.5 s is given in Table 12, and it is 1.32%, indicating that using the strain measurementsin segment S2 in standard vibration test, which is relatively easy to carry out, gives goodprestress force identification. These results demonstrate the feasibility and accuracy ofusing the proposed method in practical applications for quantifying the prestress force.
Appl. Sci. 2022, 12, 2756 19 of 21
Table 12. Comparison of the applied and identified average prestress forces from strain measurementsduring the free vibration period of the dynamic test.
Applied Prestress Force in theNumerical Model (kN)
Identified Average PrestressForce (kN) Relative Error (%)
107 108.41 1.32
6. Conclusions
This paper proposes a method to quantify the prestress force in the precast prestressedsegmental beams based on the strain measurement and neutral axis location. Under theplane–remains–plane assumption, neutral axis location is obtained by using the strain mea-surements. The static force equilibrium of a specific cross-section of the precast segmentalbeam is established to calculate the prestress force. The accuracy and reliability of theproposed method are verified through experimental and numerical studies on a prestressedsegmental beam.
The experimental results verify that the prestress forces can be predicted by usingthe strain measurement during the post-tensioning process, or during service through adynamic test. The results show that the theoretical prediction results have certain differ-ences when compared with the experimental measured results obtained near the segmentaljoints. Discussions on the possible sources, such as the concrete modulus of elasticityand uncertainty of strain measurements that may lead to the inaccurate predictions of theprestress force, are provided. However, using the strains measured in the middle of thesegment of the beam for calculating the prestress force shows a good correlation with thetheoretical prediction.
In the numerical verification, five prestress levels from 62 kN to 100 kN are used toverify the credibility of the proposed method. Similar to the experimental verifications,the results at the middle of the segment match well with the experimental results thanthat obtained from the location near the joints of the beam. Discussions are providedby showing stress distribution contour in the longitudinal direction of the cross-sectionobtained in numerical simulations. It is found that the plane–remains–plane assumptionis not valid at sections near the segmental joints, which explains why a relatively bigdifference is observed when measured data near the joint between the segments are used inthe analysis. The results suggest that the measurements should be made at locations awayfrom the joints in segmental beams for quantifying the prestress force. The reliability of theproposed method in identifying the prestress force of segmental beams in service conditionthrough a dynamic test is also verified. The results demonstrate that the proposed methodcan be used for identifying the prestress force.
To sum up, both the experimental test and numerical simulation results demonstratethat the proposed approach can reliably identify the change in prestress force, and wellquantify the prestress force level when selecting the strains away from the joints.
Author Contributions: Conceptualization, H.H., J.L. and H.L.; methodology, H.L., J.L., Y.X. and H.H.;validation, H.L., T.D.L. and T.M.P.; formal analysis, H.L. and Y.X.; investigation, J.L. and T.M.P.; datacuration, H.L. and T.D.L.; writing—original draft preparation, H.L. and Y.X.; writing—review andediting, J.L., H.H. and T.M.P.; visualization, H.L.; supervision, J.L. and H.H.; project administration,J.L. and H.H.; funding acquisition, H.H. All authors have read and agreed to the published version ofthe manuscript.
Funding: This research was funded by: Australian Research Council, grant number: FL180100196.
Data Availability Statement: The data presented in this study might be available on reasonablerequest from the corresponding author.
Acknowledgments: The work described in this paper was supported by the Australian ResearchCouncil Laureate Fellowship project FL180100196: Development of multi-hazard resilient and sus-tainable infrastructure. The first author would like to acknowledge the Australian Research TrainingProgram Scholarship for supporting her PhD study at Curtin University.

Appl. Sci. 2022, 12, 2756 20 of 21
Conflicts of Interest: The authors declare no conflict of interest.
References1. Saiidi, M.; Douglas, B.; Feng, S. Prestress Force Effect on Vibration Frequency of Concrete Bridges. J. Struct. Eng. 1994, 120,
2233–2241. [CrossRef]2. Miyamoto, A.; Tei, K.; Nakamura, H.; Bull, J. Behavior of Prestressed Beam Strengthened with External Tendons. J. Struct. Eng.
2000, 126, 1033–1044. [CrossRef]3. Chan, T.; Yung, T. A theoretical study of force identification using prestressed concrete bridges. Eng. Struct. 2000, 22, 1529–1537.
[CrossRef]4. Hamed, E.; Frostig, Y. Natural frequencies of bonded and unbonded prestressed beams—Prestress force effects. J. Sound Vib. 2006,
295, 28–39. [CrossRef]5. Dall’Asta, A.; Dezi, L. Discussion of “Prestress Force Effect on Vibration Frequency of Concrete Bridges” by M. Saiidi, B. Douglas
and S. Feng. J. Struct. Eng. 1996, 122, 458. [CrossRef]6. Wang, T.; Huang, R.; Wang, T. The variation of flexural rigidity for post-tensioned prestressed concrete beams. J. Mar. Sci. Technol.
2013, 21, 300–308.7. Noble, D.; Nogal, M.; O’Connor, A.; Pakrashi, V. The effect of prestress force magnitude and eccentricity on the natural bending
frequencies of uncracked prestressed concrete beams. J. Sound Vib. 2016, 365, 22–44. [CrossRef]8. Jang, J.; Lee, H.; Hwang, K.; Song, Y. A sensitivity analysis of the key parameters for the prediction of the prestress force on
bonded tendons. Nucl. Eng. Technol. 2010, 42, 319–328. [CrossRef]9. Toyota, Y.; Hirose, T.; Ono, S.; Shidara, K. Experimental Study on Vibration Characteristics of Prestressed Concrete Beam. Procedia
Eng. 2017, 171, 1165–1172. [CrossRef]10. Lu, Z.; Law, S. Identification of prestress force from measured structural responses. Mech. Syst. Signal Process. 2006, 20, 2186–2199.
[CrossRef]11. Ho, D.; Kim, J.; Stubbs, N.; Park, W. Prestress-Force Estimation in PSC Girder Using Modal Parameters and System Identification.
Adv. Struct. Eng. 2012, 15, 997–1012. [CrossRef]12. Xia, Y.; Hao, H.; Zanardo, G.; Deeks, A. Long term vibration monitoring of an RC slab: Temperature and humidity effect. Eng.
Struct. 2006, 28, 441–452. [CrossRef]13. Xiang, Z.; Chan, T.; Thambiratnam, D.; Nguyen, T. Synergic identification of prestress force and moving load on prestressed
concrete beam based on virtual distortion method. Smart Struct. Syst. 2016, 17, 917–933. [CrossRef]14. Anastasopoulos, D.; de Roeck, G.; Reynders, E. Influence of damage versus temperature on modal strains and neutral axis
positions of beam-like structures. Mech. Syst. Signal Process. 2019, 134, 106311. [CrossRef]15. Peeters, B.; de Roeck, G. One-year monitoring of the Z24-Bridge: Environmental effects versus damage events. Earthq. Eng. Struct.
Dyn. 2001, 30, 149–171. [CrossRef]16. Soman, R.; Majewska, K.; Mieloszyk, M.; Malinowski, P.; Ostachowicz, W. Application of Kalman Filter based Neutral Axis
tracking for damage detection in composites structures. Compos. Struct. 2018, 184, 66–77. [CrossRef]17. Xia, Y.; Lei, X.; Wang, P.; Liu, G.; Sun, L. Long-term performance monitoring and assessment of concrete beam bridges using
neutral axis indicator. Struct. Control Health Monit. 2020, 27, 12. [CrossRef]18. Sigurdardottir, D.; Glisic, B. Neutral axis as damage sensitive feature. Smart Mater. Struct. 2013, 22, 75030. [CrossRef]19. Sigurdardottir, D.; Glisic, B. Detecting minute damage in beam-like structures using the neutral axis location. Smart Mater. Struct.
2014, 23, 125042. [CrossRef]20. Xia, H. SHM-Based Condition Assessment of In-Service Bridge Structures Using Strain Measurement. Ph.D. Thesis, The Hong
Kong Polytechnic University, Hong Kong, China, 2012.21. Abdel-Jaber, H.; Glisic, B. Monitoring of prestressing forces in prestressed concrete structures—An overview. Struct. Control
Health Monit. 2019, 26, 8. [CrossRef]22. Le, T.; Pham, T.; Hao, H.; Li, H. Behavior of Precast Segmental Concrete Beams Prestressed with External Steel and CFRP Tendons.
J. Compos. Constr. 2020, 24, 4020053. [CrossRef]23. Le, T.; Pham, T.; Hao, H.; Yuan, C. Performance of precast segmental concrete beams posttensioned with carbon fiber-reinforced
polymer (CFRP) tendons. Compos. Struct. 2019, 208, 56–69. [CrossRef]24. Zhan, H.; Jiang, H.; Zhang, J.; Jiang, R. Condition Evaluation of an Existing T-Beam Bridge Based on Neutral Axis Variation
Monitored with Ultrasonic Coda Waves in a Network of Sensors. Sensors 2020, 20, 3895. [CrossRef] [PubMed]25. Noguchi, T.; Tomosawa, F.; Nemati, K.; Chiaia, B.; Fantilli, A. A Practical Equation for Elastic Modulus of Concrete. ACI Struct. J.
2009, 106, 690–696.26. AS 1012.8.1; Methods of Testing Concrete—Method 8.1: Method for Making and Curing Concrete—Compression and Indirect
Tensile Test Specimens. Standards Australia International Ltd.: Sydney, NSW, Australia, 2014.27. AS 1012.9; Methods of Testing Concrete—Method 9: Compressive Strength Tests—Concrete, Mortar and Grout Specimens.
Standards Australia International Ltd.: Sydney, NSW, Australia, 2014.

Appl. Sci. 2022, 12, 2756 21 of 21
28. AS 3600:2018; Concrete Structures. Standards Australia International Ltd.: Sydney, NSW, Australia, 2018.29. Hattori, G.; Serpa, A. Contact stiffness estimation in ANSYS using simplified models and artificial neural networks. Finite Elem.
Anal. Des. 2015, 97, 43–53. [CrossRef]30. Ren, W.; Fang, S.; Deng, M. Response Surface—Based Finite-Element-Model Updating Using Structural Static Responses. J. Eng.
Mech. 2011, 137, 248–257. [CrossRef]