PRELIMINARY QUANTIFICATION OF THE ACOUSTIC ...
17
FUTY Journal of the Environment, Vol. 7, No. 1, July 2012 34 © School of Environmental Sciences, Modibbo Adama University of Technology, Yola – Nigeria. ISSN: 1597-8826. http://dx.doi.org/10.4314/fje.v7i1.3 PRELIMINARY QUANTIFICATION OF THE ACOUSTIC PROPERTIES OF SOME SELECTED LECTURE THEATRES IN FEDERAL UNIVERSITY OF TECHNOLOGY, YOLA – NIGERIA. Odoh, E. O. and Urenyang, N. I. Department of Physics, Modibbo Adama University of Technology, Yola, Adamawa State, Nigeria. E-mail: [email protected] , Phone: +2347061268101 Abstract The reverberation times of some selected lecture theatres in Federal University of Technology, Yola which are the major contributory factors to their acoustic properties have been studied. The selected halls chosen as representatives are LT I, SMIT LT I and LT III having room volumes of 1473.4, 2156.4 and 763.0 m 3 respectively. Using acoustic standards the reverberation times were computed using the Sabine formula. The result shows that the reverberation times were 4.20, 1.80 and 2.17 s respectively when they were unoccupied. To understand their acoustic behavior when occupied, the reverberation times were recomputed with assumed human audience at various capacities. When full audience was assumed, their reverberation times reduced to 1.80, 0.90 and 0.62 s for LT I, SMIT LT I and LT III respectively. The values reduced further to 0.86, 0.80 and 0.46 s respectively when the audience was increased 50% above their normal capacities. The reverberation times dropped to 0.68, 0.67 and 0.36 s respectively on doubling the audience. This results shows that in its unoccupied state, the reverberation time of 4.20 s for LT I is too high for lecture theatre which by standard should have a reverberation time of about 1.0 s. On the other hand, occupying LT III 50 % above its normal capacity means that the sound power level would rapidly decay and consequently would render audibility problematic. The reverberation times of 0.9 and 0.62 s at full occupation of SMIT LT I and LT III showed their reverberation times were still under the generally preferred value for speech rooms like lecture theatres. This is also true of all the theatres when assumed filled, one-half times above their seating capacities. Under all conditions of the investigation, it was observed that SMIT LT I seemed to show more compatibility in the reverberation time. This could be attributed to the upholstered finishes on the chairs that have higher absorption coefficient than wood in the other theatres and possible choice of room volume to absorption power ratio. Key Words: Acoustics, Reverberation time, Absorber, Lecture theatre and Audience Introduction The quality of sound in an enclosure depends on the acoustic properties of the enclosure. Reverberation time is the primary descriptor of an acoustic environment. After sound has been produced in an enclosed space, it is reflected repeatedly by the boundaries of the enclosure even after the source ceases to emit sound (McGraw- Hill, 1980). If the sound rays (wave) reflecting from an interface or object reaches the observer, it experiences a longer path than the direct path from the source to the observer. Thus the reflected signal is delayed relative to the direct path transmission. This results in the received waveform being a summation of the transmitted signals and various weighted time shifts of the signal-multipath. The persistence of sound in
-
Upload
khangminh22 -
Category
Documents
-
view
0 -
download
0
Transcript of PRELIMINARY QUANTIFICATION OF THE ACOUSTIC ...

FUTY Journal of the Environment, Vol. 7, No. 1, July 2012 34 © School of Environmental Sciences, Modibbo Adama University of Technology, Yola – Nigeria. ISSN: 1597-8826. http://dx.doi.org/10.4314/fje.v7i1.3
PRELIMINARY QUANTIFICATION OF THE ACOUSTIC PROPERTIES OF SOME SELECTED LECTURE THEATRES IN FEDERAL UNIVERSITY OF
TECHNOLOGY, YOLA – NIGERIA.
Odoh, E. O. and Urenyang, N. I. Department of Physics, Modibbo Adama University of Technology, Yola, Adamawa State, Nigeria. E-mail: [email protected], Phone: +2347061268101 Abstract The reverberation times of some selected lecture theatres in Federal University of Technology, Yola which are the major contributory factors to their acoustic properties have been studied. The selected halls chosen as representatives are LT I, SMIT LT I and LT III having room volumes of 1473.4, 2156.4 and 763.0 m3 respectively. Using acoustic standards the reverberation times were computed using the Sabine formula. The result shows that the reverberation times were 4.20, 1.80 and 2.17 s respectively when they were unoccupied. To understand their acoustic behavior when occupied, the reverberation times were recomputed with assumed human audience at various capacities. When full audience was assumed, their reverberation times reduced to 1.80, 0.90 and 0.62 s for LT I, SMIT LT I and LT III respectively. The values reduced further to 0.86, 0.80 and 0.46 s respectively when the audience was increased 50% above their normal capacities. The reverberation times dropped to 0.68, 0.67 and 0.36 s respectively on doubling the audience. This results shows that in its unoccupied state, the reverberation time of 4.20 s for LT I is too high for lecture theatre which by standard should have a reverberation time of about 1.0 s. On the other hand, occupying LT III 50 % above its normal capacity means that the sound power level would rapidly decay and consequently would render audibility problematic. The reverberation times of 0.9 and 0.62 s at full occupation of SMIT LT I and LT III showed their reverberation times were still under the generally preferred value for speech rooms like lecture theatres. This is also true of all the theatres when assumed filled, one-half times above their seating capacities. Under all conditions of the investigation, it was observed that SMIT LT I seemed to show more compatibility in the reverberation time. This could be attributed to the upholstered finishes on the chairs that have higher absorption coefficient than wood in the other theatres and possible choice of room volume to absorption power ratio. Key Words: Acoustics, Reverberation time, Absorber, Lecture theatre and Audience Introduction
The quality of sound in an enclosure depends on the acoustic properties of the enclosure. Reverberation time is the primary descriptor of an acoustic environment. After sound has been produced in an enclosed space, it is reflected repeatedly by the boundaries of the enclosure even after the source ceases to emit sound (McGraw- Hill, 1980). If the sound rays (wave) reflecting from an interface or object reaches the observer, it experiences a longer path than the direct path from the source to the observer. Thus the reflected signal is delayed relative to the direct path transmission. This results in the received waveform being a summation of the transmitted signals and various weighted time shifts of the signal-multipath. The persistence of sound in

FUTY Journal of the Environment, Vol. 7, No. 1, July 2012
35
a particular space after the original sound is removed called reverberation can add pleasing characteristics to the acoustic quality of a room. However, excessive reverberation can ruin the acoustical properties of an otherwise well designed room. The mean free path of a sound ray in a room depends on the shape and size of the room, and to some extend on the distribution and nature of absorptive materials (Parker, 1988).
The reverberant sound in an auditorium dies away with time as the sound energy is absorbed by multiple interactions with the surface of the room. In a more reflecting room, it will take longer time for the sound to die away. In a very absorbent room the sound will die away quickly. An accurate determination of reverberation decay is important for both absorption measurements in reverberation chambers, the evaluation of concert hall and other rooms of various interests (Chu, 1978). The standard set to measure the reverberation is called reverberation time which is the time taken for the sound to decay to a level 60 dB below the original level or the time required for the sound pressure to drop by 60 dB (Kinsley and Frey, 1980).
Through extensive experimental studies of the acoustic properties of a room Wallace Clement Sabine arrived at an empirical relation among the reverberation characteristics of an enclosure, its size, and the amount of absorbing material present (Kinsley and Frey 1980). The optimum reverberation time for a room used primarily for speech is considerably shorter, while that of church, mosque, and discotheque is longer. A longer reverberation time in speech room than necessary will result in decrease in speech intelligibility (McMillan, 1992). In situation where short reverberation time is required, the reverberant sound field must decay otherwise continuing presence of reverberant sound will mask the next syllable and cause the speech to be blurred (Gyang and Odoh, 2000). Longer reverberation times ensure the quality of music which will otherwise become ‘sound dry’ or ‘dead’ if the reverberation time is too short. Typical reverberation time varies from a fraction of a second in small room to 5 s or more in very large enclosures like cathedral, gymnasia, indoor swimming pools, etc. The recommended reverberation time for speech is between 0.5 to 1 second (McMillan, 1992).
Unsuitable absorptive material distribution and ignorant decoration of room for aesthetic reasons by curtains and other material without proper consultation with an acoustician changes the purpose of the hall for which it is intended. These effects can be reduced by well articulated wall designs, choosing the right materials for floors, ceiling and other beautifying agents.
In many places and in different situations the constructions of buildings are made without due consideration to the acoustical need or the end use of such buildings. At other times, for economic and unavoidable reasons, certain public rooms and halls are densely crowded thereby altering their required acoustic suitability. This study was carried out with a view to unveil the acoustic scenario and the problem encountered by the teaming students’ audience in our lecture rooms. Due to students increased enrolment into the university, congestion in the lecture theatres have become a problem. The understanding of this acoustic problem has

FUTY Journal of the Environment, Vol. 7, No. 1, July 2012
36
been addressed by this work and would be useful in determining the number of students that could be assigned to receive lectures in the various auditoria currently in use. It is hoped that our result could also be useful for the design of other auditoria yet to be built. Theory
The earliest systematic work on reverberation was carried out by Sabine (1964) from which he obtained the empirical relation for the reverberation time as:
AVT 161.0
= (1)
where V = volume of the room, A = the total sound absorption of the room. ∑∑ == iii SAA α (2)
iA is the sound absorption of an ith surface in the room, iS is the surface area of the ith and iα is its sound absorption coefficient otherwise called its sound absorptivity.
Equation (1) assumes a diffused sound field with the sound rays having the same mean free paths. It is obvious that the Sabine formula is not applicable to the limiting case in which the absorption coefficient of the surfaces of the room boundaries is unity. Logically, under this condition of no reflection, T should be zero whereas the Sabine equation always gives a finite time (Gyang and Odoh, 2000; Odoh and Gyang, 2011). The Sabine formula therefore works best in rooms where the total absorption, A, is low and the absorbers are uniformly distributed on the room surfaces (Odoh, 1993).
There have been many other reverberation time formulae that have been derived following the original investigation of Sabine. Eyring (1930) observed that between successive reflections, the sound energy in a room is reduced by a factor
)1( Eα− where Eα is the area-weighted random-incidence energy absorption coefficient. A further extension to Eyring’s approach is that of Millington-Sette (1932). A case of sequential sound reflections occurring with preference to pairs of parallel walls and that of simultaneous sound reflection that are produced in walls as sounds propagates in rooms have been explained by Arau-Purchades (1988). The Sabine reverberation time has been considered adequate in this investigation as no directional preference or other conditions mentioned above were our interest. We sought to estimate the reverberation times of the various halls under no occupation and when assumed human audiences increased in the halls in which the later case would increase their total absorptivity. The lecture theatres and method of measurement
Three main auditoria have been selected for the characterization of their reverberation times. These are Lecture Theatre One (LT I), SMIT Lecture Theater One (SMIT LT I) and Lecture Theatre III (LT III) all located in the Federal University of Technology, Yola (FUTY). The choice of these particular rooms was made for them to serve as representatives of all other large rooms presently available for the purpose

FUTY Journal of the Environment, Vol. 7, No. 1, July 2012
37
of lectures in the University. Other lecture rooms are either smaller in size, about the same size or slightly larger with any of these ones chosen.
The entire LT I has hexagonal structure with a seating capacity of 316 persons. The floor made of terrazzo consisted of thirteen steps where seats were arranged as in Figure 1b. The seats themselves were made of plastic while the desks of plywood. The room has six sets of glass window; two of smaller size while the other four were of equal size. The room has two iron doors and one other door made of plywood located on the stage (see Table 1a). SMIT LT I has a shape of a square whose two edges along a diagonal were shaped out to make the stage and the rear parts of the room (Fig. 2). It has seating capacity of 351 persons. The seats were upholstered arranged on thirteen (13) curved steps. The floor was made of terrazzo. The room contained six (6) iron doors and forty-nine (49) windows made of glass, some of different sizes (Table 2a). LT III has a hexagonal shape structure with seating capacity of 306 persons (Fig. 3). The floor of the hall was also made of terrazzo. It consisted of eleven (11) steps on which seats were arranged. The various steps have equal lengths and breadths. The successive height (depth) differed by a common ratio of the first step height. The seats and desk tops were all made of wood. The seats were in twelve rows and three columns, the middle column been longer than those on the left and right of the hall. The hall also have twenty two (22) windows made of glass, two(2) doors made of wood and four(4) doors made of iron. The depth of the entire LT III was smaller than that of LT I. The ceilings in all the lecture halls were made of plaster board and suspended types.
The dimensions of the doors, windows, seats, board, ceiling and the floor exposed surfaces of the LT I, SMIT LT I and LT III were measured using a measuring tape for the purpose of calculating their absorption power. The heights of the ceilings were also measured. The volume of the halls were obtained by multiplying their ceiling areas by the respective room depths(heights) after correcting for the volumes of the rooms occupied by the seating elevated steps. A part of the opposite side walls of LT I was projected outward creating additional volume space to the hall. The volume of this additional space was determined from measurement and added to the original volume of this hall to give its actual volume. The results of the measurements for LT I, SMIT LT I and LT III are given in Tables 1, 2 and 3 respectively. Method of calculations
To evaluate the reverberation times of the lecture halls, we have adopted the acoustic standards of the materials as given by McMillan (1992) and Urenyang (2008). The absorption coefficient of ceiling has been computed earlier by Odoh (1993) and the same value was used by Gyang and Odoh (2000) in studying the distribution absorbers in rooms. We have also used the same value here in our calculations. We have also restricted ourselves to only the value of the absorption coefficients (of the materials found in the lecture theatres) at 500 Hz for speech in auditoria as this is the acoustically acceptable optimum frequency. Accordingly, the absorption power of each of the components in the auditoria and consequently their total absorptions were calculated using equation (2).

FUTY Journal of the Environment, Vol. 7, No. 1, July 2012
38
To obtain the correct value of the volume space in which the sound rays travel, the volume of the space occupied by the steps (seating position, Figure 5) in each hall was calculated using the following formula:
Volume occupied by steps =∑=
n
nnn nhbl
1)( (3)
where l is the length of nth step, b is its breath, h is the height of a step (all steps were of the same height in each hall) and n = 1, 2,..., n to the total number of steps available in the hall. The result of equation (3) was subtracted from the product of the ceiling area and the depth of the room to get the actual volume of each lecture hall. Other corrections to the volume involving the spaces occupied by the stages in all the halls were also considered. All these were made possible from measurement of the geometric shapes and sizes of the stages on the floors (Figures 2, 3 and 4). Using equation (1), the reverberation times of each of the lecture halls were calculated without human occupants. To study the variation in the reverberation of each of the lecture hall with audience, assumed human audience were varied in each of the halls up to the capacity of each and beyond to understand the problem of overcrowding in the halls. Results and Analysis
The results of the calculations are given in tables 1, 2 and 3. For proper understanding, each lecture theatre has been taken separately in our analysis. (a) Reverberation characteristics in LT I
From the calculation presented in table 1(b) it is seen that this auditorium when completely empty has a reverberation time of 4.25 s. This is very large ordinarily for a room of this size but whose volume of 1437.4m3 has increased its reverberation time. This could be linked to the tall bounding concrete wall in the room. Such tall wall has practically increased the volume of the lecture theatre resulting to the high reverberation time. Theoretically this will be an avenue for multiple echoes (Odoh and Gyang, 20011) that would be heard in the absence of reasonable number of audience. A normal lecture theatre should have a reverberation time between 0.5 s and 1.0 s in the region of 500- or 1000- Hz octave band used for most rooms (Hall, 1993). A plot of the reverberation time with assumed human audience is given in Figure 1. From that graph an audience of 316 persons (corresponding to the seating capacity) gave a reverberation time of 1.2 s. This value is not too far from the recommended value of the reverberation time as stated above and could be tolerable under this condition.
It is also seen that half this capacity gives the reverberation time of 1.8 s. This is fairly long for a speech room where activity like lecture should take place. This means that there would be masking of speech when fewer numbers of students than required are put in this hall, which will consequently affect the clarity. Doubling the normal audience capacity, that is 632, people gives reverberation time of 0.6 s which still falls within the recommended value. But the speaker under practical situation must reasonably be at a position where sound would sound absorption by the head of the audience would not easily dampen the speech. At this point too, the hall

FUTY Journal of the Environment, Vol. 7, No. 1, July 2012
39
would be highly congested for proper ventilation. When the auditorium is 1½ percent full, the RT is 0.86 s. This gets closer to the upper limit of acceptable reverberation time of this hall where reasonable understanding of speech would be achieved by listeners in this theatre if other factors that could interfere are taken care of. (b) Reverberation characteristics in SMIT LT I From calculation the reverberation time for SMIT LT I when unoccupied was found to be 1.8 s. This value is tolerable for this hall when empty as a few numbers of audiences would just bring the reverberation time close to the optimum value. Incidence of echoes may not be very pronounced when really unoccupied. The results are seen from table 2 (b) and Figure 7.
Having the actual number of audience in the hall (that is at full capacity) the RT is 0.98 s which is just okay for the purpose of lecture. On putting half the capacity, the RT becomes 1.27 s which appears to be a little higher but still tolerable for the same purpose stated above. Doubling the audience in the auditorium, a hard condition for ventilation, resulted in having a RT of 0.67 s. This value is still within the recommended value for a speech auditorium. The result of this finding can be attributed to the design of the over all structural design in addition to the acoustic properties of the surfaces. The chairs were upholstered which cumulative effect would lead to high absorption power. One half the audience capacity of SMIT LT I gave a reverberation time of 0.8 s. This condition is not critical to the reverberation condition of the hall if the problem of convenience is compromised and other factors being equal. Though not considered and not consequential to the present approach, the concave surfaces could bring sound focusing in certain parts of the hall and this would be an advantage to listeners in those areas. This however, could be a problem where a long hall than we have as SMIT LT I is to be constructed. (c) Reverberation characteristic in LT III
The calculations made on LT III showed that the reverberation time of the auditorium was 2.17 seconds in its unoccupied state - Table 3(b) and Figure 8. This value no doubt could be the result of the small room volume as the seating position occupied reasonable volume of the entire structure. This value is less than that of LT I when the auditorium was empty, even though they have almost the same seating design. This is because the ceiling in LT I is higher, creating larger volume than LT III.
When LT III was half-filled with assumed audience, the reverberation time was 0.97 s which was just okay as this value falls within the recommended range for a hall that would have good speech intelligibility. With the expected number of audience in the hall, the reverberation time was 0.62 s which is still within the recommended range for clarity of speech. When the auditorium was assumed 1½ percent full, the reverberation time was computed to be 0.46 s which theoretically appreciates to the lower threshold of reverberation time good for the hall. On doubling the full capacity, the reverberation time drops to 0.36 s which would rather render the auditorium acoustically dead. This implies that under this condition, the speech
FUTY Journal of the Environment, Vol. 7, No. 1, July 2012
40
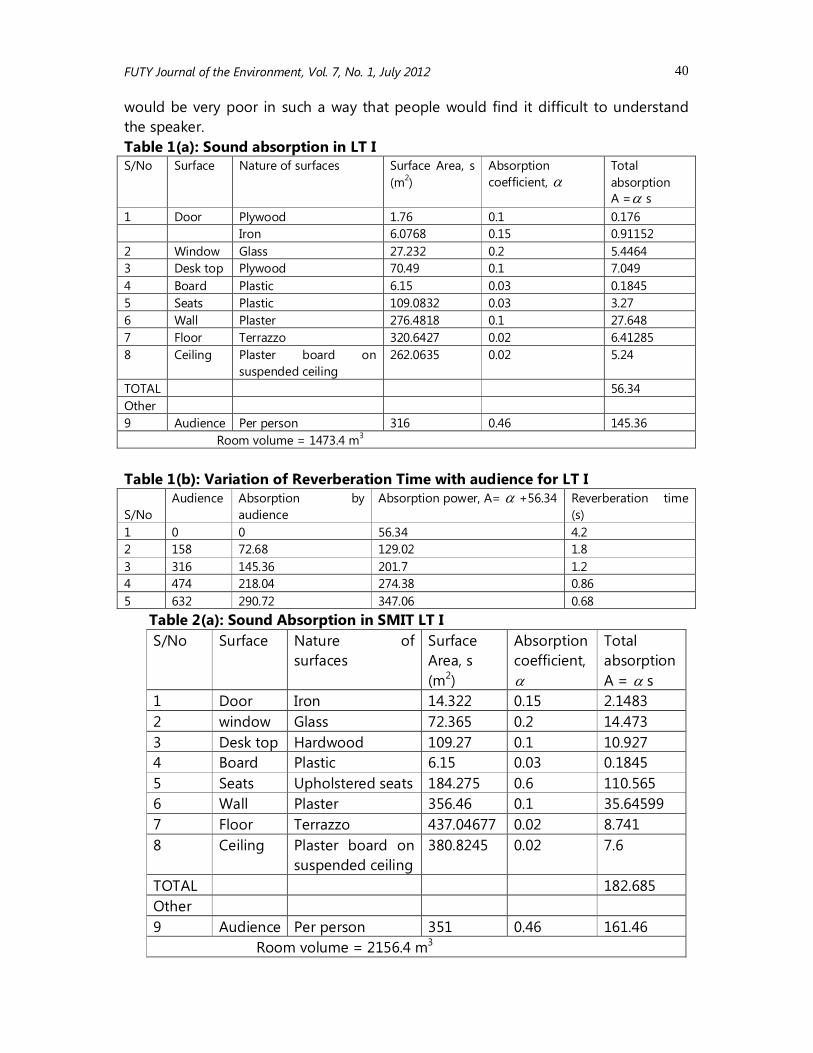
would be very poor in such a way that people would find it difficult to understand the speaker. Table 1(a): Sound absorption in LT I S/No Surface Nature of surfaces Surface Area, s
(m2) Absorption coefficient, α
Total absorption A =α s
1 Door Plywood 1.76 0.1 0.176 Iron 6.0768 0.15 0.91152 2 Window Glass 27.232 0.2 5.4464 3 Desk top Plywood 70.49 0.1 7.049 4 Board Plastic 6.15 0.03 0.1845 5 Seats Plastic 109.0832 0.03 3.27 6 Wall Plaster 276.4818 0.1 27.648 7 Floor Terrazzo 320.6427 0.02 6.41285 8 Ceiling Plaster board on
suspended ceiling 262.0635 0.02 5.24
TOTAL 56.34 Other 9 Audience Per person 316 0.46 145.36 Room volume = 1473.4 m3 Table 1(b): Variation of Reverberation Time with audience for LT I S/No
Audience Absorption by audience
Absorption power, A= α +56.34 Reverberation time (s)
1 0 0 56.34 4.2 2 158 72.68 129.02 1.8 3 316 145.36 201.7 1.2 4 474 218.04 274.38 0.86 5 632 290.72 347.06 0.68 Table 2(a): Sound Absorption in SMIT LT I
S/No Surface Nature of surfaces
Surface Area, s (m2)
Absorption coefficient, α
Total absorption A = α s
1 Door Iron 14.322 0.15 2.1483 2 window Glass 72.365 0.2 14.473 3 Desk top Hardwood 109.27 0.1 10.927 4 Board Plastic 6.15 0.03 0.1845 5 Seats Upholstered seats 184.275 0.6 110.565 6 Wall Plaster 356.46 0.1 35.64599 7 Floor Terrazzo 437.04677 0.02 8.741 8 Ceiling Plaster board on
suspended ceiling 380.8245 0.02 7.6
TOTAL 182.685 Other 9 Audience Per person 351 0.46 161.46 Room volume = 2156.4 m3

FUTY Journal of the Environment, Vol. 7, No. 1, July 2012
41
Table 2(b): Variation of Reverberation Time with Audience in SMIT LT I S/No Audience Absorption by
audience Absorption power , A= α + 56.34
Reverberation Time (s)
1 0 0 190.3 1.8 2 175 80.5 270.8 1.27 3 350 161.46 351.76 0.98 4 526 241.96 432.26 0.8 5 702 322.92 513.22 0.67
Table 3(a): Sound Absorption in LT III S/No Surfaces Nature of surface Surface
Area, s (m2) Absorption coefficient, α
Total sound absorption A = α s
1 Doors Plywood Iron
2.99 11.82
0.1 0.15
0.299 1.773
2 Windows Glass 29.232 0.2 5.8464 3 Desk and
bench Plywood 209.86 0.1 20.986
4 Board Plastic 6.15 0.03 0.1845 5 Wall Plaster 155.365 0.1 15.5365 6 Floor Terrazzo 377.8179 0.02 7.556 7 Ceiling Plaster board on
suspended ceiling 218.8179 0.02 4.376
TOTAL 56.557 Others 8 Audience Per person 316 0.46 Room volume = 763.0 m3
Table 3(b): Variation of Reverberation Time with audience in LT III S/No No of
Audience Sound absorbed by audience
Total sound absorbed
56.557 A += α
Reverberation Time (s)
1 0 0 56.557 2.17 2 153 70.38 126.937 0.97 3 306 140.76 197.317 0.62 4 459 211.14 267.697 0.46 5 612 281.52 338.077 0.36

FUTY Journal of the Environment, Vol. 7, No. 1, July 2012
42
(a)
(b) Figure 1 (a) Floor plan with seat arrangement typical of LT I and LT III; (b) Floor plan with seat arrangement typical of S LT I .
Stage 3.48
Stage

FUTY Journal of the Environment, Vol. 7, No. 1, July 2012
43
(a)
(b) Figure 2(a) Floor dimension of LT I (The dept of theatre = 7.01 m (b) Stage dimension of LT I (The height of stage = 0.14 m).
(1)
(2)
(3)
13.84 m
11.04 m
3.11 m
14.85 m
3.65 m
3.75 m
3.92 m
14.85 m
m 1.43 m
3.75 m
11.04 m
1.9 m 3.5 m 11.68 m
5.05 m 2.33 m m 3.64 m
m
1.92 m m
16.3 m 16.3 m
12.12 m 8.4 m
4.2 m
20.5 m
4.2 m
3.36 m
8.38 m 8.38 m
20.5 m
12.6 m

FUTY Journal of the Environment, Vol. 7, No. 1, July 2012
44
(a) (b) Figure 3 (a) Floor dimension of SLT I (The dept of theatre = 6.7 m); (b) Stage dimension of SLT I (The height of stage above the floor = 0.58 m). (a)
1.9 m 2.7 m
8.92 m
1.86 m
6.4 m
6.3 m 1.77 m
1.7 m
6.36 m
(3)
9.76 m
5.47 m
11.58 m
4.34 m 3.51 m
6.7 m
11.22 m
11.22 m
5.4 m 5.47 m
11.58 m
3.98 m
(2)
(1)
4.62 m 1.34 m
10.1 m
4.28 m
2.1 m 4.62 m
4.28 m
9.78 m

FUTY Journal of the Environment, Vol. 7, No. 1, July 2012
45
(b) Figure 4 (a) Floor dimension of LT III (The dept of theatre = 4.36m); (b) Stage dimension of LT III (The height of stage above the floor = 0.15 m).
Figure 5: A sectional side view of each of the lecture theatre from where the volume occupied by the audience seating position was calculated.
0
1
2
3
4
5
0 100 200 300 400 500 600 700
Number of audience
Reve
rberat
ion tim
e (s)
Stage

FUTY Journal of the Environment, Vol. 7, No. 1, July 2012
46
Figure 6: Variation of reverberation with assumed number of audience Lecture Theatre I (LT I).
0
0.5
1
1.5
2
0 100 200 300 400 500 600 700 800
Number of audience
Reve
rbera
tion t
ime (
s)
Figure 7: Variation of reverberation with assumed number of audience SMIT Lecture Theatre I (SLT I).
0
0.5
1
1.5
2
2.5
0 100 200 300 400 500 600 700
Number of audience
Reve
rberat
ion tim
e (s)
Figure 8: Variation of reverberation with assumed number of audience Lecture Theatre III (LT III).

FUTY Journal of the Environment, Vol. 7, No. 1, July 2012
47
Figure 9: Cross-sectional views of LT I.

FUTY Journal of the Environment, Vol. 7, No. 1, July 2012
48
Figure 10: Cross-sectional views of SMIT LT I.
Figure 11: Cross-sectional views of LT 3. Conclusion

FUTY Journal of the Environment, Vol. 7, No. 1, July 2012
49
Obtaining desirable acoustic features in any room particularly that for public use is a necessary condition if such a room should achieve the intended purpose. The problem of overcrowding in many lecture theatres in our higher institutions of learning hampers good and quality sound transmission during lectures. Our present investigation reveals that increased number of students than usual in the lectures room of the Federal University of Technology, Yola can hinder serious sound attention although not to zero level. This is as expected theoretically. However, the increase of audience more than double the capacity of each of the halls studied could set in serious problem of audibility.
Very large room volume occasioned by height of ceiling without commensurate number of seat can increase the reverberation time of the lecture theatre which may render it practically unfit as a speech room. On the other hand, too many seats in a room whose volume has been reduced by different levels of stepped seats should have high ceiling enough to give the desired reverberation time. While it is recommended that the use of public address system in the lectures theatres could increase loudness of sound by a lecturer or any speaker, the conditions stated above with appropriate design and room geometry can improve the acoustic conditions of future lecture theatres. Recommendation
The results obtained in this work are indications that lecture theatres in this university particularly LT I, SMIT LT I and LT III, as much as possible, should not be used for the purpose of lecture where the class size is more than their seating capacities, especially in excess of 500 audience. This is particularly very serious in LT III where the reverberation time will drastically fall below the recommended range.
The use of public address system during lecture in these theatres is strongly recommended, especially in LT III, when the class size is above normal limits. In doing so, the loud speaker could be placed in a corner above the heads of the audience so that all resonance modes can be excited as this will enhance clarity of the speech.
References Arau-Puchedes, H. (1988): An improved Reverberation formula. Acoustical Vol. 65
(4). Chu, W. T. (1978): Comparison of Reverberation Measurement using Schroeder’s
Implse Method nd Decay-curve Averaging Method. J. Acoustical Society of Am Vol. 63(5), 1144.
Eyring, C. P. (1930): Reverberation Time in ‘Dead’ Room. J. Acoustical Society of Am Vol 1, 217.
Gyang, B. N. and Odoh, E. O. (2000): Comparison of Reverberation Times Calculated Using Various Formula, with the Measured Values Under Different Distributions of Absorber. Nigeria Journal of Physics, Vol. 12.

FUTY Journal of the Environment, Vol. 7, No. 1, July 2012
50
Hall, D. E. (1993): Basic Acoustics. Krieger Publishing company, Malabar, Florida. Reprint edition. Pg 190 – 191.
Kingsley and Frey (1980): Fundamental of Acoustic. John Wiley & Sons, Inc. McGraw-Hill (1980): Encyclopedia of Science and Technology, Vol. 6th ed. McMillan, R (1992): Environmental Science in Building. McMillan Press Ltd. Millington (1932): J. Acoustical Soc. Am., 4, 69, and Sette, ibid, p.193 (in) Kinsler et
al., (1982): Fundamentals of Acoustics. John Wiley and son Inc. 3 ed. Odoh, E. O. (1993): The effects of area and distribution of absorber on
Reverberation time as measured in an improvised reverberation times. M.Sc. Thesis submitted to Department of Physics University of Jos, Jos.
Odoh, E. O. and Gyang, B.N. (2011): Variation of Reverberation Time with Quantity of
Absorbers in an Unfurnished Room. Global Journal of Pure and Applied Sciences. Vol. 17, No. 4, Pg 55 – 59.
Parker, S. P. (1988): Acoustics Source Book. McGraw Hill Inc. Sabine, W. C. (1964): Reverberation: Collected Papers on Acoustics. Dover
publication Inc. 163-164. Urenyang, H. I. (2008). Quantification of the Acoustic Properties of Some Selected
Lecture Theatres in FUTY. B.Sc. Thesis submitted to the Department of Physics, Federal University of Technology, Yola, Adamawa State – Nigeria.