
ADVANCES IN ACOUSTIC INSTRUMENT MEASUREMENTS ...
12
Proceedings of the Institute of Acoustics Vol.42. Pt.3. 2020 ADVANCES IN ACOUSTIC INSTRUMENT MEASUREMENTS AND SYSTEM L. Ausiello, Solent University Southampton V. Hockey Official Martin&Co. Repairs, [email protected], Southampton Abstract This paper presents the progress of sine-sweep based measurements to gather impulse responses of musical instruments, in particular acoustic guitars. In the attempt of quantifying the accuracy limit of the methodology a fully working instrument has been re-worked, and all phases of the process have been measured before and after each modification step. This provided useful data to perform a sensitivity analysis of this technique, and also showed the similarity between tuning a soundboard and tuning a dipole loudspeaker system based on a resonating plate and an exciter. The collected data proved that the measurement method is capable of capturing the influence of the varnish being applied or removed from the soundboard, the presence or absence of structural reinforcing struts (braces), and the presence or absence of further weight reduction applied to the braces of the soundboard. The findings suggest this approach is mature and ready to be used in combination with FEM simulations, computer aided machining, and additional manufacturing in order to achieve a desired frequency response for acoustic soundboards or panel loudspeakers. Furthermore, the responses collected with this method can be used for auralisation and creative purposes, enabling the community of guitar makers and players to progress in the difficult task of correlating quantitative data with players’ preference. I. Introduction Sine-sweep measurements have been ubiquitously used in the past 20 years, in fields as diverse as room acoustics or loudspeaker design and tuning [1]. This paper illustrates the progress of using such technique to gather quantitative data from musical instruments [2] and shows frequency responses of a complete instrument being re-worked in order to test the sensitivity limit of this measurement approach. In section 2 the basics of this method applied to musical instruments will be recapped, in section 3 the methodology of the experiments will be illustrated, in section 4 the results will be presented and commented, and finally in section 5 the final conclusions and future development will be discussed. II. Quantitative measurement of acoustic instrument The sine-sweep method is generally used to retrieve the Impulse Response (IR) of linear time-invariant system. To do so, the Device Under Test (DUT) is stimulated with a signal of constant amplitude containing all the frequency relevant to the analysis at hand, starting from the lowest and ending with the highest in a exponential progression. This can be easily shown with a picture of the time behaviour and the spectrogram of a sine-sweep test signal (figure 1). On the left hand side of fig.1, time is on the horizontal axis and the signal’s amplitude is on the vertical one; on the right hand side of fig.1, time is on the horizontal axis, frequency is on the vertical one, and the amplitude of the signal is colour coded.
-
Upload
khangminh22 -
Category
Documents
-
view
1 -
download
0
Transcript of ADVANCES IN ACOUSTIC INSTRUMENT MEASUREMENTS ...

Proceedings of the Institute of Acoustics
Vol.42. Pt.3. 2020
ADVANCES IN ACOUSTIC INSTRUMENT MEASUREMENTS AND SYSTEM L. Ausiello, Solent University Southampton V. Hockey Official Martin&Co. Repairs, [email protected], Southampton
Abstract This paper presents the progress of sine-sweep based measurements to gather impulse responses of musical instruments, in particular acoustic guitars. In the attempt of quantifying the accuracy limit of the methodology a fully working instrument has been re-worked, and all phases of the process have been measured before and after each modification step. This provided useful data to perform a sensitivity analysis of this technique, and also showed the similarity between tuning a soundboard and tuning a dipole loudspeaker system based on a resonating plate and an exciter. The collected data proved that the measurement method is capable of capturing the influence of the varnish being applied or removed from the soundboard, the presence or absence of structural reinforcing struts (braces), and the presence or absence of further weight reduction applied to the braces of the soundboard. The findings suggest this approach is mature and ready to be used in combination with FEM simulations, computer aided machining, and additional manufacturing in order to achieve a desired frequency response for acoustic soundboards or panel loudspeakers. Furthermore, the responses collected with this method can be used for auralisation and creative purposes, enabling the community of guitar makers and players to progress in the difficult task of correlating quantitative data with players’ preference. I. Introduction Sine-sweep measurements have been ubiquitously used in the past 20 years, in fields as diverse as room acoustics or loudspeaker design and tuning [1]. This paper illustrates the progress of using such technique to gather quantitative data from musical instruments [2] and shows frequency responses of a complete instrument being re-worked in order to test the sensitivity limit of this measurement approach. In section 2 the basics of this method applied to musical instruments will be recapped, in section 3 the methodology of the experiments will be illustrated, in section 4 the results will be presented and commented, and finally in section 5 the final conclusions and future development will be discussed. II. Quantitative measurement of acoustic instrument The sine-sweep method is generally used to retrieve the Impulse Response (IR) of linear time-invariant system. To do so, the Device Under Test (DUT) is stimulated with a signal of constant amplitude containing all the frequency relevant to the analysis at hand, starting from the lowest and ending with the highest in a exponential progression. This can be easily shown with a picture of the time behaviour and the spectrogram of a sine-sweep test signal (figure 1). On the left hand side of fig.1, time is on the horizontal axis and the signal’s amplitude is on the vertical one; on the right hand side of fig.1, time is on the horizontal axis, frequency is on the vertical one, and the amplitude of the signal is colour coded.

Proceedings of the Institute of Acoustics
Vol.42. Pt.3. 2020
Fig. 1: Sine-Sweep test signal; on the left, time domain representation, on the right the corresponding spectrogram.
The DUT reacts to the test signal by emitting an altered or filtered version of the sine-sweep, as per figure 2. What was a constant-amplitude time signal is now clearly varying in amplitude over time, suggesting the presences of resonances in the system which makes its response not flat.
Fig. 2: DUT response to the sine-sweep test signal. Note the harmonic distortion components in the spectrogram. As per [1], we can convolve the recorded output of the DUT with the ideal inverse filter of the original sine-sweep, obtaining its Impulse Response (figure 3).
Fig. 3: Output of the convolution between recorded output from DUT an ideal inverse filter. Circled in red the harmonic distortion products of the convolution process, in green the linear component of the IR.
The largest component of the IR resulting from the convolution is the linear component of the response, while the smaller peaks before it are harmonic distortion products [1]. In our scenario we’re mainly interested in the linear component of the IRs. Traditional musical instruments such as pianos, acoustic and classical guitars are passive systems made out of wood, metal, glue (normally aliphatic or organic one) [3]. We assume these systems are passive in the sense that the only energy they might store is contained in the materials they are made of, especially if any component is intentionally deformed of tensioned by other parts, as it happens with the strings tensioning a guitar soundboard, or with the cast-iron frame and wooden frame tensioning the soundboard of a piano [4]. This means that when exploiting the sine-sweep method the resulting impulse responses obtained will present all the information needed to characterise the DUT in their linear component [1]. More details can be found in [2, 5, 6] or corresponding with the author.
Proceedings of the Institute of Acoustics
Vol.42. Pt.3. 2020
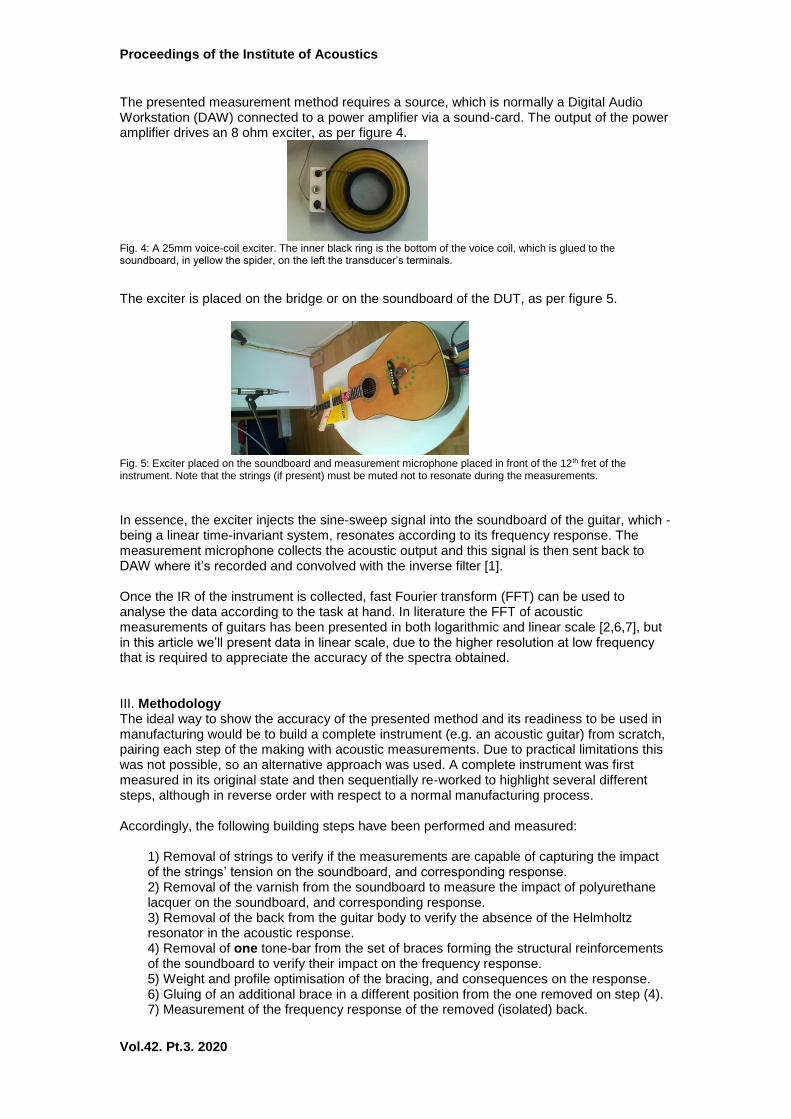
The presented measurement method requires a source, which is normally a Digital Audio Workstation (DAW) connected to a power amplifier via a sound-card. The output of the power amplifier drives an 8 ohm exciter, as per figure 4.
Fig. 4: A 25mm voice-coil exciter. The inner black ring is the bottom of the voice coil, which is glued to the soundboard, in yellow the spider, on the left the transducer’s terminals.
The exciter is placed on the bridge or on the soundboard of the DUT, as per figure 5.
Fig. 5: Exciter placed on the soundboard and measurement microphone placed in front of the 12th fret of the instrument. Note that the strings (if present) must be muted not to resonate during the measurements.
In essence, the exciter injects the sine-sweep signal into the soundboard of the guitar, which - being a linear time-invariant system, resonates according to its frequency response. The measurement microphone collects the acoustic output and this signal is then sent back to DAW where it’s recorded and convolved with the inverse filter [1]. Once the IR of the instrument is collected, fast Fourier transform (FFT) can be used to analyse the data according to the task at hand. In literature the FFT of acoustic measurements of guitars has been presented in both logarithmic and linear scale [2,6,7], but in this article we’ll present data in linear scale, due to the higher resolution at low frequency that is required to appreciate the accuracy of the spectra obtained. III. Methodology The ideal way to show the accuracy of the presented method and its readiness to be used in manufacturing would be to build a complete instrument (e.g. an acoustic guitar) from scratch, pairing each step of the making with acoustic measurements. Due to practical limitations this was not possible, so an alternative approach was used. A complete instrument was first measured in its original state and then sequentially re-worked to highlight several different steps, although in reverse order with respect to a normal manufacturing process. Accordingly, the following building steps have been performed and measured:
1) Removal of strings to verify if the measurements are capable of capturing the impact of the strings’ tension on the soundboard, and corresponding response. 2) Removal of the varnish from the soundboard to measure the impact of polyurethane lacquer on the soundboard, and corresponding response. 3) Removal of the back from the guitar body to verify the absence of the Helmholtz resonator in the acoustic response. 4) Removal of one tone-bar from the set of braces forming the structural reinforcements of the soundboard to verify their impact on the frequency response. 5) Weight and profile optimisation of the bracing, and consequences on the response. 6) Gluing of an additional brace in a different position from the one removed on step (4). 7) Measurement of the frequency response of the removed (isolated) back.
Proceedings of the Institute of Acoustics
Vol.42. Pt.3. 2020
8) Alteration on the bracing pattern of the back and new isolated response captured and compared. 9) Guitar body being closed again and last response captured and compared.
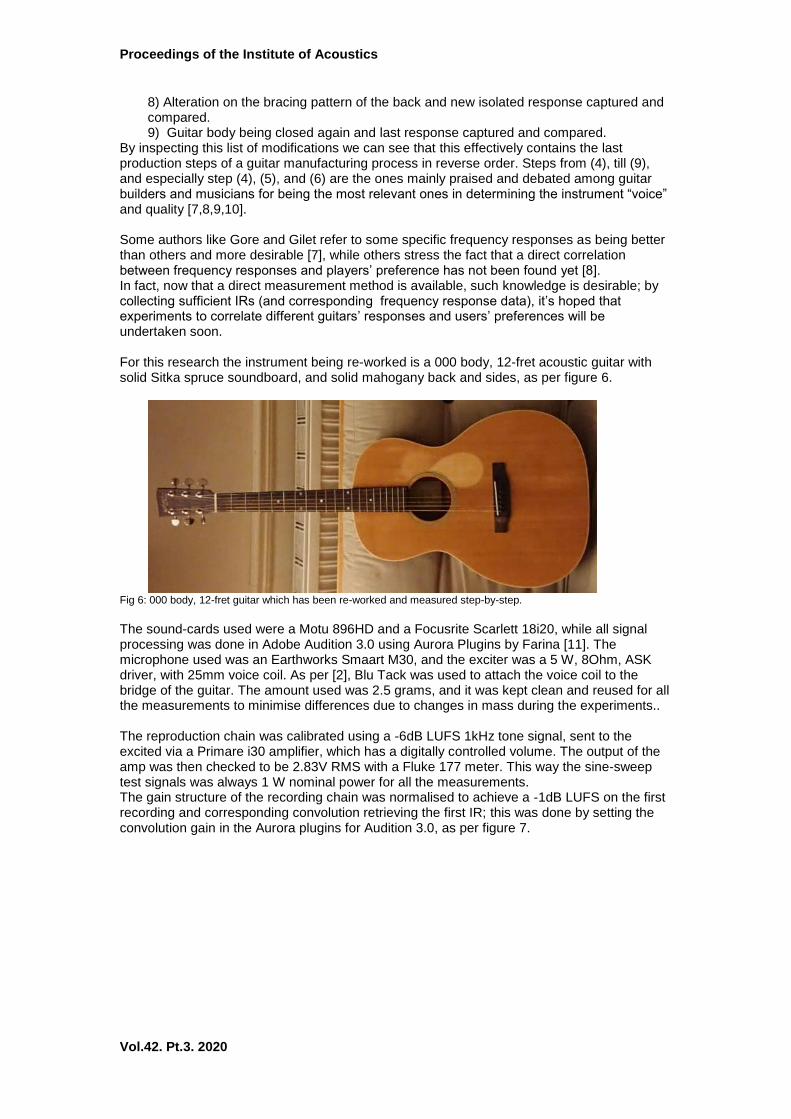
By inspecting this list of modifications we can see that this effectively contains the last production steps of a guitar manufacturing process in reverse order. Steps from (4), till (9), and especially step (4), (5), and (6) are the ones mainly praised and debated among guitar builders and musicians for being the most relevant ones in determining the instrument “voice” and quality [7,8,9,10]. Some authors like Gore and Gilet refer to some specific frequency responses as being better than others and more desirable [7], while others stress the fact that a direct correlation between frequency responses and players’ preference has not been found yet [8]. In fact, now that a direct measurement method is available, such knowledge is desirable; by collecting sufficient IRs (and corresponding frequency response data), it’s hoped that experiments to correlate different guitars’ responses and users’ preferences will be undertaken soon. For this research the instrument being re-worked is a 000 body, 12-fret acoustic guitar with solid Sitka spruce soundboard, and solid mahogany back and sides, as per figure 6.
Fig 6: 000 body, 12-fret guitar which has been re-worked and measured step-by-step.
The sound-cards used were a Motu 896HD and a Focusrite Scarlett 18i20, while all signal processing was done in Adobe Audition 3.0 using Aurora Plugins by Farina [11]. The microphone used was an Earthworks Smaart M30, and the exciter was a 5 W, 8Ohm, ASK driver, with 25mm voice coil. As per [2], Blu Tack was used to attach the voice coil to the bridge of the guitar. The amount used was 2.5 grams, and it was kept clean and reused for all the measurements to minimise differences due to changes in mass during the experiments.. The reproduction chain was calibrated using a -6dB LUFS 1kHz tone signal, sent to the excited via a Primare i30 amplifier, which has a digitally controlled volume. The output of the amp was then checked to be 2.83V RMS with a Fluke 177 meter. This way the sine-sweep test signals was always 1 W nominal power for all the measurements. The gain structure of the recording chain was normalised to achieve a -1dB LUFS on the first recording and corresponding convolution retrieving the first IR; this was done by setting the convolution gain in the Aurora plugins for Audition 3.0, as per figure 7.
Proceedings of the Institute of Acoustics
Vol.42. Pt.3. 2020
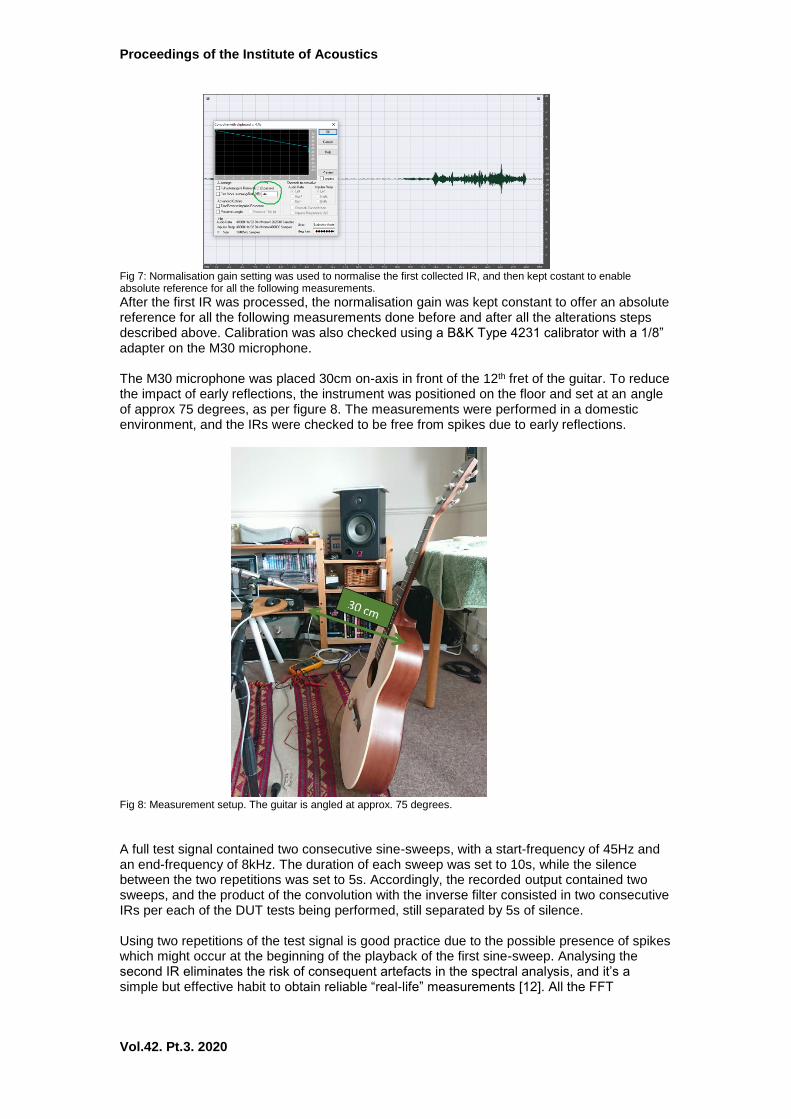
Fig 7: Normalisation gain setting was used to normalise the first collected IR, and then kept costant to enable absolute reference for all the following measurements. After the first IR was processed, the normalisation gain was kept constant to offer an absolute reference for all the following measurements done before and after all the alterations steps described above. Calibration was also checked using a B&K Type 4231 calibrator with a 1/8” adapter on the M30 microphone. The M30 microphone was placed 30cm on-axis in front of the 12th fret of the guitar. To reduce the impact of early reflections, the instrument was positioned on the floor and set at an angle of approx 75 degrees, as per figure 8. The measurements were performed in a domestic environment, and the IRs were checked to be free from spikes due to early reflections.
Fig 8: Measurement setup. The guitar is angled at approx. 75 degrees. A full test signal contained two consecutive sine-sweeps, with a start-frequency of 45Hz and an end-frequency of 8kHz. The duration of each sweep was set to 10s, while the silence between the two repetitions was set to 5s. Accordingly, the recorded output contained two sweeps, and the product of the convolution with the inverse filter consisted in two consecutive IRs per each of the DUT tests being performed, still separated by 5s of silence. Using two repetitions of the test signal is good practice due to the possible presence of spikes which might occur at the beginning of the playback of the first sine-sweep. Analysing the second IR eliminates the risk of consequent artefacts in the spectral analysis, and it’s a simple but effective habit to obtain reliable “real-life” measurements [12]. All the FFT

Proceedings of the Institute of Acoustics
Vol.42. Pt.3. 2020
presented in this paper have been obtained processing the second IR of the captured measurements. IV. Results and Sensitivity analysis. In this section the IRs gathered will be shown as their corresponding FFT, and their capability of being informative to characterise each step of the instrument manufacturing process will be discussed. Each re-work step will be characterised by a “before-and-after” measurement, and for clarity the colour blue will always represent the response before changes were made to the instrument, while the colour red will represent the response after a change was made. All plots show the same frequency range, starting from approx 20Hz and ending at approx 750Hz. The first sensitivity test was aimed to see if any difference between the response of the instrument with or without strings’ tension was measurable.
Fig. 9: FFT plot (linear frequency axis) of the guitar in its original state (blue) and after removing the strings (red). Horizontal division is 3dB.
The horizontal division in the spectral plot is 3dB, and it is possible to appreciate a difference in the region between 220Hz and300Hz, where the blue curve represents the guitar with the strings in standard tuning, ad the red curve is the guitar without strings. It is worth considering that the overall dynamic range of the spectra is more than 50dB, thus making this difference quite subtle, nonetheless this result is accordance with the literature; the peak in the frequency response corresponds to the (0,0) mode of the soundboard [3,7,8,10] for this type of guitar . The second test wanted to quantify the impact of the varnish on the response of the instrument. Now in blue there is the response of the guitar without strings, and in red the response of the guitar without strings and without varnish on the soundboard.
Fig. 10: FFT plot (linear frequency axis) of the guitar with original varnish (blue) and without the varnish (red).

Proceedings of the Institute of Acoustics
Vol.42. Pt.3. 2020
A large change is visible; the frequency of the Helmholtz resonance changed from 114Hz to 108Hz (more than a semitone) as a consequence of a shift in frequency of the (0,0) mode due to changes in mass and stiffness of the soundboard [3,7]. Also a higher modal resonance at 400Hz has moved down to 380Hz, which is the equivalent of more than a semitone too. The third test wanted to check the effects of opening the guitar body removing the back. This re-work step was aimed to cancel the Helmholtz resonance which is the lowest resonance shown by the instrument. Another consequence is the downward shift in frequency of the (0,0) mode of the soundboard. The Helmholtz resonance and the (0,0) mode repel each other [7], and the absence of the former lets the latter shift down in frequency [3,7].
Fig. 11: FFT plot (linear frequency axis) of the guitar without varnish on the soundboard (blue) and the guitar with a removed back (red). Red arrows show the absence of the Helmholtz resonator at 108Hz and the shift in frequency of the (0,0) mode from 220Hz to 202Hz. The absence of the Helmholtz resonator at 108Hz is clear, as well as the frequency down-shift of the (0,0) mode, which went from 220Hz to 202Hz, which is almost a full tone. Further to this other peaks of the response are also greatly attenuated. After removing the back of the guitar there was the opportunity to verify the sensitivity of the measurement technique while “tuning” the soundboard braces. At this point an accurate FEM model of the soundboard and corresponding correlation between changes in the bracing pattern and alteration of the frequency response would have made possible to target an ideal acoustic response [10]. Unfortunately such model was not available for this specific guitar model. Accordingly, a traditional approach of “scalloping”, “shaving” and altering the profile of the braces from rectangular to triangular was attempted and measured after each step. The results were not always going in the direction which some authors praise [7], but they were nonetheless clearly visible. The first modification was to completely remove one tone-bar, as per figure 12.
Proceedings of the Institute of Acoustics
Vol.42. Pt.3. 2020
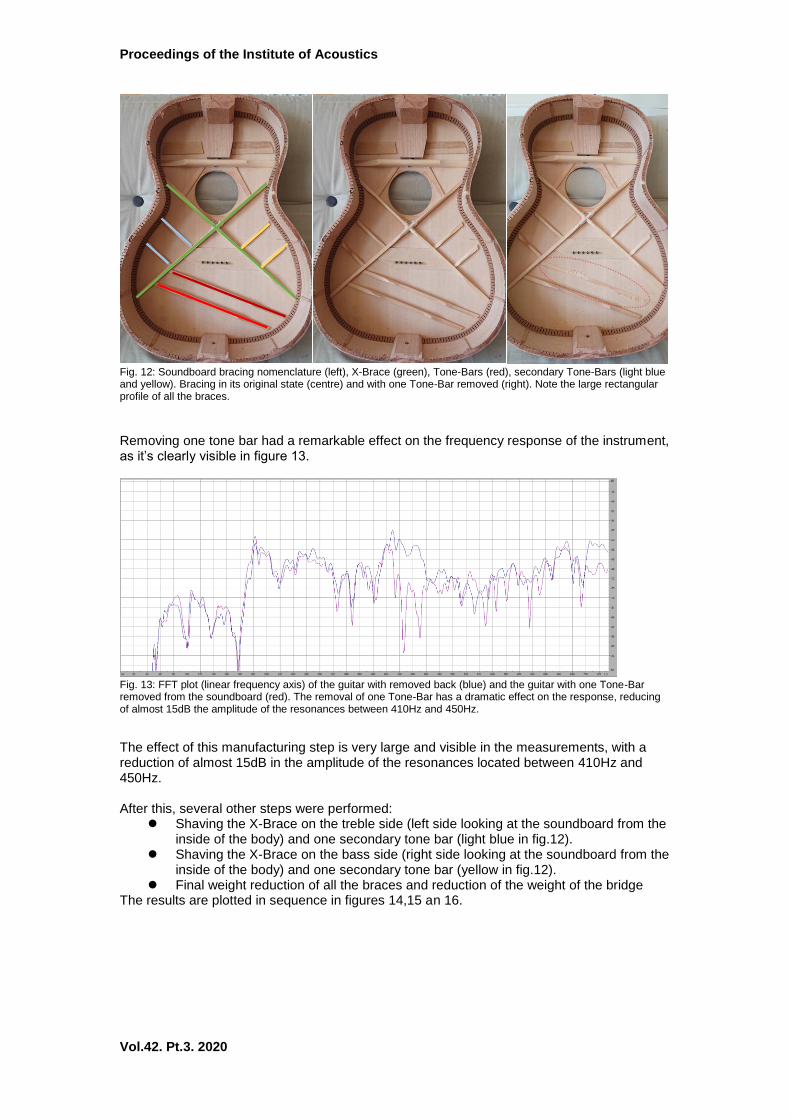
Fig. 12: Soundboard bracing nomenclature (left), X-Brace (green), Tone-Bars (red), secondary Tone-Bars (light blue and yellow). Bracing in its original state (centre) and with one Tone-Bar removed (right). Note the large rectangular profile of all the braces. Removing one tone bar had a remarkable effect on the frequency response of the instrument, as it’s clearly visible in figure 13.
Fig. 13: FFT plot (linear frequency axis) of the guitar with removed back (blue) and the guitar with one Tone-Bar removed from the soundboard (red). The removal of one Tone-Bar has a dramatic effect on the response, reducing of almost 15dB the amplitude of the resonances between 410Hz and 450Hz.
The effect of this manufacturing step is very large and visible in the measurements, with a reduction of almost 15dB in the amplitude of the resonances located between 410Hz and 450Hz. After this, several other steps were performed:
⚫ Shaving the X-Brace on the treble side (left side looking at the soundboard from the inside of the body) and one secondary tone bar (light blue in fig.12).
⚫ Shaving the X-Brace on the bass side (right side looking at the soundboard from the inside of the body) and one secondary tone bar (yellow in fig.12).
⚫ Final weight reduction of all the braces and reduction of the weight of the bridge The results are plotted in sequence in figures 14,15 an 16.

Proceedings of the Institute of Acoustics
Vol.42. Pt.3. 2020
Fig. 14: FFT plot (linear frequency axis) of the guitar without the Tone-Bar (blue) and the guitar with some additional weight reduction applied to the treble side of the X-Brace.
Fig. 15: FFT plot (linear frequency axis) of the guitar with weight reduction applied to the treble side of the X-Brace (blue), and of the guitar with weight reduction applied to both the treble and the bass side of the X-Bar (red).
Fig. 16: FFT plot (linear frequency axis) of the guitar with weight reduction applied to both treble and bass side of the X-Brace (blue), and of the guitar with weight reduction and profile optimisation applied to all braces and bridge.
From these sequence of measurements it is clear that substantial differences can be captured, and such information is sufficient to guide a maker with trained ear or an optimisation algorithm to obtain a desired final response, as demonstrated by Boven in his research [10]. A last set of results will be included here to demonstrate how tuning the back of the guitar with the aid of this measurement technique is substantially identical to tuning a resonant panel loudspeaker. A guitar back is normally braced in a more simple way compared to the soundboard, with four braces laid parallel to each other. Some authors call this pattern “ladder” bracing [7,8], as visible in figure 17.

Proceedings of the Institute of Acoustics
Vol.42. Pt.3. 2020
Gore and Gilet demonstrate that ladder bracing provides the instrument with loudness, but they suggest different patterns to make the back of the guitar contribute to the final response with additional resonances [7], so to say, to enhance its tone and response.
Fig 17: Back with standard ladder bracing pattern (left) and back re-worked with alternative bracing pattern similar to the one used by Gore and Gilet in [7]. In red the excitation point and in green the suspension point.
Before discussing the results, some considerations must be shared. The excitation point influences the modal response of a resonating plate, as highlighted in [2] when discussing the best location for the exciter to inject energy in the soundboard. When measuring the back it is then possible to accidentally place the exciter on a nodal line, and to impair the response of the panel at one or more resonant modes. Furthermore, also the point used to suspend the back during its measurement has an impact on the response; it was decided to place the exciter on a side of the lower bout, while the panel was suspended from a point near the edge of the plate in proximity of the end of the second brace (see fig. 17). The effects of a different bracing pattern are visible in figure 18.
Fig 18: FFT plot (linear frequency axis) of the back with standard ladder bracing pattern (blue), and the back with alternative bracing pattern (red). The large resonance at 191Hz was replaced by two separate ones, the fist at 174Hz and second at 148Hz. A substantial amount of energy was lost between 380Hz and 480Hz, in line with the literature indicating that the traditional bracing patter is “loud”. From a the perspective of a loudspeaker system designer this modification would be considered an improvement, due to the flatter frequency response shown by the modified bracing pattern. Similar consideration could be made if comparing the initial spectrum of the soundboard shown in fig. 11 with the final one of fig.16. Eventually, the back was re-glued and the new complete guitar, without varnish on the soundboard, was measured again. Comparing the original response (without strings) and the

Proceedings of the Institute of Acoustics
Vol.42. Pt.3. 2020
final one (without strings) gives the cumulative difference of a manufacturing process guided by acoustic measurements compared to a traditional “blind” one.
Fig 19: FFT plot (linear frequency axis) of the complete guitar without varnish before the re-work process (blue), and of the complete guitar without varnish after the bracing pattern, weight and profile optimisation (red).
The Helmholtz resonance of the body has moved from 114Hz to 92.3Hz, which is approx. two tones below and closer to the lowest note in the range of the instrument, which is an E2 at 82.4Hz. The (0,0) mode of the soundboard has moved from 220Hz to 202Hz, which is about a whole tone below. The two modal resonances of the back are visible at 148Hz and 178Hz, almost exactly where they were on the free back. This new arrangement of peaks is more balanced and suggests an enhanced bass response, which normally praised by players and listeners [3, 7]. The loss of energy in the region between 360Hz and 460Hz also contributes to a flatter response in the low-midrange and midrange. V. Final conclusions and future work The data retrieved and processed so far indicates that the sine-sweep method as presented in this paper is mature and ready to be fully included in the manufacturing process of musical instruments. With accurate and repeatable measurements we can quantify changes as small as the effect of the tension of the strings on the soundboard, as well as the effects of the varnish on the final tone of the instrument. This is not as trivial, especially if we want to characterise the mysteries surrounding ancient finishing techniques used by praised makers of the like of Stradivari or Guarnieri Del Gesu, or the effect of ageing on the materials. From the manufacturing point of view, further research must be done to estimate how short the sine-sweep test signal could be to minimise measurement time and maximise efficiency in processes where time is key, namely to mass produce instruments. Also, now that the use of the sine-sweep method to retrieve the acoustic response of a musical instrument has been understood, investigation about measuring the impedance curve of the guitar-and-exciter system could be undertaken to refine the lumped element models used in the literature today, and to explore the relationship between such impedance curve and the acoustic impedance of the instrument. This reflection also brings forward the opportunity, or the necessity, to correlate the frequency responses of guitar soundboards with accurate FEM analysis and correct material characterisation. Once this will be done, the use of artificial intelligence to guide wood machining robots to achieve a desired target performance from a soundboard will be desirable and achievable too. For the time being we can surely use the IRs gathered with this method to create useful auralisation of all the manufacturing steps, which can be used to guide makers with trained ears towards their desirable acoustic performance. Another interesting question raises from the analysis of the responses of the different bracing patterns of the back being presented in this paper (fig. 19); the original frequency response is very “peaky”, while the re-worked one is flatter. In literature, loudspeakers which show a flat frequency response are generally praised [13], so why shouldn’t we prefer a similar feature

Proceedings of the Institute of Acoustics
Vol.42. Pt.3. 2020
from a musical instrument? Is it possible that, being the response of traditional instruments everything but flat, the general audience got used to its characteristics and limitations? This advocates that an accurate research about musicians’ preference and its correlation with accurate frequency responses of guitars (or other acoustic instruments) is now possible and desirable. The authors have played and built guitars for many years, and still reckons that the tones they normally prefers are those we heard in the recordings we’re most familiar with. But shouldn’t we challenge our habits when new knowledge is available? Acknowledgements This research would not have been possible without the incredible experience and knowledge of Vince Hockey, who worked all his life building and repairing guitars and showed the most genuine and useful curiosity about the chances to use measurements together with our hearing to perfect an instrument. Another special thanks goes to prof. Angelo Farina, to Dr. Giacomo Squicciarini from Univerisity of Southampton and Dr. Domenico Balsamo from University of Newcastle, who supported the authors in what, seemingly, was just a crazy idea. References [1] A. Farina, “Simultaneous measurement of impulse response and distortion with a swept-sine technique”, paper 5093, AES 108th Convention, 2000. [2] L. Ausiello et Alii, “Guitar soundboard measurements for repeatable acoustic performance manufacturing”, Reproduced Sound 2018, Vol. 40, pt.4, Bristol, 2018. [3] Fletched, Rossing, “Physics of musical instruments”, Springer, 1998. [4] Schimmel “Made in Braunschweig”, https://www.youtube.com/watch?v=Em3oOJLTMks , minute 2:15. [5] N. Giordano, “Mechanical impedance of a piano soundboard”, J. Acoust. Soc. Am. 103, 1998. [6] D.J. Ewins, “Modal Testing: Theory, Practice and Application, Wiley, 2000 [7] T. Gore, G. Gilet, “Contemporary acoustic guitar design and build”, vol. 1, Gore Publishing, 2016 [8] R. M. French, “Engineering the guitar”, p.96, Springer, 2009. [9] D. Bourgeois, “Voicing the steel string guitar”, American Lutherie, n.24, p16, BRB2 p.470, 1990. [10] Boven, “Dynamic response optimization of an acoustic guitar”, master thesis, TUDelft, 2017. [11] Farina, http://pcfarina.eng.unipr.it/Aurora_XP/index.htm [12] Farina, Audio Precision, “Impulse response measurements by exponential sine sweeps”, http://pcfarina.eng.unipr.it/Public/Presentations/AudioPrecision-workshop.pdf , Workshop Casa della Musica, Parma, 2008. [13] J. Eargle, “Loudspeaker Handbook”, Springer, 1997.