Design and construction of a one meter electromagnetic railgun
Upload
khangminh22Category
view
0download
0
Global Electromagnetic Flowmeter Market Report

Table of Contents
▪ Overview
▪ Market Size Assessment through different sources
▪ Trends Analysis
• Product Analysis
▪ Opportunity Analysis
▪ Product/Applications Analysis Comparison charts
▪ Other Comparisons charts
▪ Competitor Analysis from Different angles
▪ SWOT Analysis for Startup
▪ Competitive map / Brand Positioning
▪ Customer Analysis
▪ Survey Based findings on benefits of flow meters for Utility Companies
▪ Benefits of flow meters for end users
▪ Commercial Sources
▪ Various lists of Potential Customer

Overview▪ Market Size Assessment through different
sources▪ Trends Analysis
Global and Regional

▪ Global Electromagnetic Flow MeterMarket is expected to reach US$ 14.5Bnby 2026 from US$ 7.5Bn in 2017 atCAGR of 8.59%.
▪ The electromagnetic flow meter istheoretically an electromagnetic flowmeter or a mag meter.
▪ Such devices are used to measure mass,linear, volume, nonlinear flow rate of aliquid or a gas.
▪ The magnetic flow meter can measurewater-based or conductive volumetricflow.
▪ They are perfect for applications whichneed low maintenance and low-pressuredrop.
Global Electromagnetic Flow Meter Market
https://www.issuewire.com/global-electromagnetic-flow-meter-market-1625344389720962

ELECTROMAGNETIC FLOWMETER MARKET - GROWTH, TRENDS, COVID-19 IMPACT, AND FORECASTS (2021 - 2026)
Market Overview
▪ The electromagnetic flowmeter market was valued at USD 2042.1 million in 2020, and it is expected to reach USD 2743.11 million by2026, registering a CAGR of 5.1% during the period of 2021-2026. The growing need for reliable measurement and monitoring ofindustrial fluids for optimum utilization is driving the market growth. With the increased mining activities, the flow measurement inthe mining sectors has become increasingly challenging over the recent past. Slurries, chunks of rocks, and gravel result in noisy flowsignals and are most abrasive. Corrosive fluids require chemical compatibility of the wetted parts within the flowmeter sensor. Miningcompanies are gradually using the electromagnetic flowmeter to measure slurry flow with certain liners to reduce abrasion and, adensimeter to send data for the electromagnetic flowmeter, to translate into an online mass flow measurement.
▪ Water shortage and the growing population is significantly driving the market growth. According to the Worldwatch Institute’s FamilyPlanning and Environmental Sustainability Assessment (FPESA), the world has been observing a major global trend that points out theongoing growth of the human population. Various scientific evidence proved that this trend has a greater impact on water availabilitythan climate change. According to the study conducted by the researchers at the Aarhus University, about 30-40% of the world is likelyto experience an increasing demand for water and wastewater treatment, leading to water scarcity by 2020. This significantly demandsthe usage of the electromagnetic flowmeter market.
▪ Technological innovations in irrigation drive the market. The world has witnessed an increasing need for water and food In the past 50years, and there are no signs of this trend slowing down. Due to this, innovative agricultural practices are imperative and much needednow more than ever. Modern irrigation, also termed as Irrigation 4.0, is being considered as a quintessential fourth industrialrevolution that combines mechanical, digital and human inputs, and tools. For instance, the installation of flowmeters in the IndusBasin Irrigation System (IBIS) has allowed the real-time control of water distribution in the irrigation canals and a continuous recordingof water deliveries. This has also led to positive impacts on water distribution efficiencies and management with the possibility toimprove, guide, and address water policies in the IBIS district.

ELECTROMAGNETIC FLOWMETER MARKET - GROWTH, TRENDS, COVID-19 IMPACT, AND FORECASTS (2021 - 2026)
Market Overview
▪ The inability to measure non-conductive fluids is restraining the market. While electromagnetic flowmeters havebeen known for their diverse benefits, their inability to measure non-conductive liquids is always likely to be a barrierfor their application in the oil and gas and refining industries. Magmeters are capable of measuring only liquids orliquid slurries that have a minimum conductivity of five µS/cm.
▪ Moreover, the COVID-19 pandemic has affected the oil and gas industry drastically. For instance, Australia's boomingLNG industry stalled after falling in oil prices amid coronavirus. More than USD 80 billion of investment decisions aredelayed due to a collapsed oil price and a geopolitical price war. Despite several user applications of flowmeters inthis segment of the market, the uncertainty of the pandemic, added with BREXIT and the US-China trade war, canimpact the market growth in the foreseen period.
▪ Azbil Corporation continues to hold extensive inventory in the Phoenix AZ location and is continuing to ship productsdaily and continuing the manufacturing and assembly of build-to-order items with normal lead times from the localArizona and Colorado manufacturing centers, which significantly caters to the market growth.
https://www.mordorintelligence.com/industry-reports/electromagnetic-flowmeter-market

ELECTROMAGNETIC FLOWMETER MARKET - GROWTH, TRENDS, COVID-19 IMPACT, AND FORECASTS (2021 - 2026)
Key Market TrendsWater and Wastewater Industry to Witness the Highest Growth
▪ In industrial environments, electromagnetic flowmeter is primarily used in water management. Decades of ongoing research and development in sensorsand signal processing have resulted in sophisticated electromagnetic flowmeters that can be integrated optimally into highly complex applications usingmeasuring, controlling, and regulating technologies.
▪ Further, the US Environmental Protection Agency (EPA) has accelerated investment in the nation's aging water infrastructure. The EPA has issued sevenWIFIA loans to help finance over USD 4 billion in water infrastructure projects.
▪ Also, according to UN-WATER, due to population growth, accelerated urbanization, and economic development, the quantity of wastewater generated andits overall pollution load is increasing globally. The availability of a safe and sufficient amount of water supplies is closely linked to how wastewater ismanaged.
▪ Further, electromagnetic flowmeters are used to measure treated and untreated sewage, processed water, water, and chemicals. Their power usage isrelatively low, with electrical power requirements as low as 15 watts for some models. Therefore, with increasing investments in water infrastructure,electromagnetic flowmeters are also expected to witness a rise in adoption.
▪ Further, investment in new technology is significantly driving the market. For instance, in 2020, McCrometer Inc., a globally recognized flow metermanufacturer, announced the upcoming launch of its newest product, the McMag2000 flow meter. McMag2000 is a saddle-style insertion electromagneticflowmeter, designed for the irrigation and water industries and best suited to applications, like center pivot systems, well monitoring, and surface watermeasurement.
▪ Moreover, companies are continuously investigating to implement electromagnetic flowmeter at hydroelectric power plants and other infrastructure-related facilities. In March 2019, J-Power and Toshiba announced that the companies would have a joint demonstration project monitoring water intakelevels in mountainous areas where it is difficult to access and that are typically out of range of cell phone service or private communication networks byadopting low-power wide-area (LPWA) wireless technology. The companies will continuously investigate to implement this technology at hydroelectricpower plants and other infrastructure-related facilities.
https://www.mordorintelligence.com/industry-reports/electromagnetic-flowmeter-market

https://www.mordorintelligence.com/industry-reports/electromagnetic-flowmeter-market
ELECTROMAGNETIC FLOWMETER MARKET - GROWTH, TRENDS, COVID-19 IMPACT, AND FORECASTS (2021 - 2026)

https://www.mordorintelligence.com/industry-reports/electromagnetic-flowmeter-market
ELECTROMAGNETIC FLOWMETER MARKET - GROWTH, TRENDS, COVID-19 IMPACT, AND FORECASTS (2021 - 2026)

https://www.mordorintelligence.com/industry-reports/electromagnetic-flowmeter-market
Asia-Pacific to Emerge as the Fastest Growing Market
▪ The water and wastewater management industry is dominant in many countries of the Asia-Pacific region, and according to WHO,reducing wastewater generation and implementing on-site sewage and wastewater technology are two strategies that can improvewastewater management.
▪ Singapore’s Tuas Desalination Plant (TDP), the first desalination plant that is owned and operated by PUB, Singapore’s NationalWater Agency, has won international recognition in 2019 for its use of ecologically sustainable technologies in the treatmentprocess.
▪ In February 2019, SUEZ NWS formed a 49/51 joint venture (JV) with Zhuhai Huigang Urban Resources Development Co. Ltd, toinvest in, build, and operate a WWTP with a daily capacity of 25,000 ton, to treat the industrial wastewater generated by theindustrial companies in the petrochemical park of the Zhuhai Gaolan Port Economic Zone.
▪ Further, Nivo Controls Pvt. Ltd, an industrial automation company based in India, recently launched a new sanitary electromagneticflowmeter for hygienic applications. The sanitary magnetic flowmeter is designed to meet the requirements of the dairy, food,beverages, brewery, and pharmaceutical industries for applications that demand hygienic, accurate, and reliable flowmeasurement.
▪ Furthermore, the Water Environment Partnership in Asia (WEPA) also aims to contribute to improving the water environment byoffering information and knowledge necessary for the enhancement of water environment governance. Such factors havesignificantly contributed to the growth in the region.
ELECTROMAGNETIC FLOWMETER MARKET - GROWTH, TRENDS, COVID-19 IMPACT, AND FORECASTS (2021 - 2026)

https://www.mordorintelligence.com/industry-reports/electromagnetic-flowmeter-market
Competitive Landscape
▪ The market is fragmented in nature, with every other vendor providing electromagneticflowmeters in various operating temperature ranges, media pressures, meter sizes, andmaterials of construction. Major players are ABB Ltd, Omega Engineering Inc.,Honeywell International Inc., and Emerson Electric Corporation, along with otheremerging players. Recent developments in the market are -
▪ March 2020 - Emerson introduced Micro Motion ProcessViz, which is a standalone,cost-effective software solution for flow meter process data visualization. It providesinstant visualization of raw process data translates into directly actionable information,helping plant operators in the chemical, food, and beverage, and oil and gas industryreduce the time needed to identify a problem in the flow process.
▪ March 2020 - Hitachi Capital Corporation, Yokogawa Electric Corporation, and AmnimoInc., which is a subsidiary of Yokogawa, entered into a comprehensive partnershipagreement with the goal of providing new services by adding Industrial IoT to eachcompany's technologies and lease equipment. The alliance is expected to provide highvalue-added services, such as the measurement of operating status data and offeringconsultation on the efficient use of equipment.
Major Players▪ ABB Ltd▪ Azbil Corporation▪ Endress+Hausar AG▪ Emerson Electric Corporation▪ Toshiba Corporation
ELECTROMAGNETIC FLOWMETER MARKET - GROWTH, TRENDS, COVID-19 IMPACT, AND FORECASTS (2021 - 2026)

https://www.psmarketresearch.com/market-analysis/smart-water-meter-market
The global smart water meter market was valued at $839.6 million in 2015,and in the forecast period (2016–2025), it is projected to register a CAGR of11.1%. The market is primarily driven by the rising demand for proper waterutilization. The non-water revenues is a nuisance for governments and waterutilities. There is an increasing demand for water management owing to thesurging water-related emergencies.
On the basis of type, the smart water meter market is divided into fluidicoscillator meters, positive displacement meters, velocity meters, single-jetmeters, electromagnetic meters, and multi-jet meters. In terms of volume,the positive displacement category held the largest share, of 28.7%, in 2015.During the forecast period, owing to the growing replacement ofconventional meters with advanced variants, the demand forelectromagnetic water meters are predicted to witness the highest CAGRduring the forecast period.
Further, based on application, the market is divided into water utilities,industrial, and residential, of which the water utilities division held thelargest revenue share in the smart water meter market in 2015. The largestusers of smart water meters are water utilities, which are expected to leadthe market during the forecast period as well. This can be primarilyattributed to the growing need for managing delivery modes of water. Toenhance the water supply and measurement framework, governments ofdifferent nations are installing smart water meters.
Smart Water Meter Market Overview
In terms of value as well as volume, North America held thelargest share in 2015. The smart water meter market in Europeand Asia-Pacific (APAC) is expected to see a CAGR of 12.1% duringthe forecast period. Besides this, the Middle-East and Africa arealso expected to witness rapid development, in terms of revenuecontribution to the market, during the forecast period.

Dynamics of Growth Market Implications
Flowmeter Market to Growth Versatile applications of flow meters in the oil & gas sector are projected to bolster the growth of flow meter market. The market is poised to grow at a steady clip of 5.5% CAGR during the forecast period (2019-2029). Surge in demand for renewable sources of energy such as gas are further fueling the flow meter market.
Advancements in Industry 4.0 Technologies
Manufacturers of magnetic, ultrasonic, and coriolis flow meters should expect tailwinds from the booming shale gas exploration in developed and developing countries. Advancements that aid integration of industry 4.0 technologies such as cloud computing, Internet of Things (IoT), artificial intelligence (AI), and machine learning (ML) with flowmeter systems will create multiplying demand for smart flowmeters through 2029. Innovative flow meters that combine industry 4.0 technologies with gas flow measurement techniques willgarner revenues from developed countries. Major players in the market that shape the competitive landscape are, but not limited to, ABB, Emerson Electric Co., em-tec GmbH, Endress+Hauser Management AG, General Electric, Hitachi, Ltd., Honeywell International, Inc., Höntzsch GmbH, KROHNE Messtechnik GmbH, Siemens, VSE Volumentechnik GmbH, and Yokogawa Electric Corporation.
Power Generation to Capture 29% of Market
Omnipresent wave of digitization across industries creates stupendous demand for electricity. From early adopters such as the US to developing economies of China and India, power generation is a top priority for continued growth. On the back of this heightening demand for electricity, the power generation segment holds a majority share of 29% of the total market value.
Water & wastewater applicationsWater & wastewater applications of flowmeter products account for the second largest market value share of over 1/4th of the entire application landscape. Early adoption of water & wastewater management in developing economies amid stringent industrial pollution regulations positively impact growth during the forecast period.
North AmericaNorth America and Europe, collectively account for more than 56% of global sales. Continuous exploration of oil and gas in developed regions such as the US, Canada have brought fruitful results in the form of new shale gas and oil reserves. Flowmeter applications in measuring oil & gas and power generation outputs will therefore impel product demand in these regions.
South Asia & Oceania
South Asia & Oceania offer the most remunerative growth prospects owing to increasing penetration of technology and rising standard of living. As both these factors ultimately lead to multiplying need for electricity and fuel, demand for flowmeters to measure the production of the same is set for an upward growth trajectory. Water & Wastewater treatment is another fueling factor as developing countries of South Asia and Oceania look for sustainable development practices. Market players are aiming capacity expansions topenetrate developing economies such as India, China, Indonesia, and Africa. Prevalence of gas exploration projects around the world present gainful opportunities. Manufacturers must then invest in research and deployment of precision flow meters custom built for these environments and landscapes.
Innovation to Remain Key Market Imperative amid Rising Competition
Innovative materials for meter parts & liners, product portfolio expansion by adding line sizes, enhanced accuracy, and broader flow ranges are a few important production trends. Gas production applications of flow meters will continue to generate strong demandthrough 2029.
https://www.factmr.com/report/4630/flow-meter-market
Flow Meter Market Forecast, Trend Analysis & Competition Tracking - Global Market Insights 2019 to 2029

Electromagnetic Flow Meters Has Great Scope for Growth WorldwideHere is a projection snapshot from a world-leader company, Itron Measurement Technologies
It portrays the Total Accessible Market (TAM) and Compound Annual Growth Rate (CAGR) worldwide across main business regions
https://investors.itron.com/static-files/46d4cdf9-fe6f-41f1-b216-c53b3df6dc62

U.S. Market Environment is very Conducive for Electromagnetic Flow Meters And Software As A Service
North American market remains strong
▪ Market values advanced network solutions
▪ Utilities operate on a different capital cycle
▪ Regulatory agencies seeing network value
▪ Mature market; Leveraging data for outcomes
▪ Early AMI adaptors readying for refresh
https://investors.itron.com/static-files/46d4cdf9-fe6f-41f1-b216-c53b3df6dc62

Product Analysis▪ Opportunity Analysis▪ Product/Applications Analysis Comparison charts▪ Other Comparison Charts
Global and Regional

https://mms.businesswire.com/media/20171017005865/en/618927/5/Flow_Meter_Market.jpg?download=1

https://www.factmr.com/report/4630/flow-meter-market

https://www.factmr.com/report/4630/flow-meter-market
Global Flow Meter Market: Assessment on Key Segments

Comparison of Different Flow Meters
https://instrumentationtools.com/difference-between-different-types-of-flow-meters/

Comparison of Flow Meters
https://instrumentationtools.com/difference-between-different-types-of-flow-meters/
Flow meter Pipe/size Gas/Liquid AccuracyIdeal for
measuringPrinciple
Orifice 1” – 48” Liquid/Gas 1%Mass flow /
velocityDiff. Pressure
Venturi 6” – up Liquid/Gas 0.50%Mass flow /
velocityDiff. Pressure
Turbine 0.5” – 2” Liquid/Gas 0.30%Mass flow /
velocityRotating blades produce
pulses
Positive Displacement 1” – 24” Liquid 0.50% Mass flow Traps a specific volume
Magnetic 1” – 120” Liquid 0.2 – 1 % Mass flow Faraday’s Law
Ultrasonic 0.5” – 48” Liquid/Gas 1% Mass flow Speed of sound
Vortex 0.5” – 16” Liquid/Gas 1% Velocity Eddies produce pulses
Variable area 0.5” – 3” Liquid/Gas 1% Velocity Diff. Pressure
Coriolis 2” – 150” Liquid 0.50% Mass flow Coriolis principle
Pitot 3” – up Liquid/Gas 2%Mass flow /
velocityDiff. Pressure

Turbine Flow meter Positive Displacement Flow meter
Indirect measurement Direct measurement
Requires upstream/downstream straight lengths
No straight lengths required
Affected by fluid viscosity Free from viscosity effect
For a given small range, a smaller size compared to PD meter
Larger size required to achieve a given flowrate range
Lower operating/maintenance/investment costs
Higher operating/maintenance/investment costs
Comparison between Turbine meter and Positive Displacement meter
https://instrumentationtools.com/difference-between-different-types-of-flow-meters/

Flow Meters Buying Guide
https://www.processcontrolexperts.com/flow-meters-buying-guide/

https://www.lincenergysystems.com/wp-content/uploads/2018/10/flow-meter-cheat-sheet.jpg
Gas Flow Meter Comparison and Gas Flowmeter Selection Guide
Technology Selection of right Flow Meter
Coriolis and thermal mass flow meters
Both measure mass flow and are new gas technology. The Coriolis is used in the fiscal measurement of natural gas, while thermal mass flow meters measure industrial process gas flow.
Rotary and diaphragm gas meters
These are positive displacement or PD meters and are a traditional gas technology used for utility billing applications or custody transfer of natural gas.
Turbine metersare a conventional technology and velocity-type device that measures natural gas for custody transfer applications.
Ultrasonic flowmetersThey are considered a new gas technology, they measure natural gas for custody transfer applications, and they are velocity-type meters.
Vortex gas flow meters,It is another velocity-style meter, measure natural gas primarily in industrial applications as they are a late-comer to custody transfer approval.
Differential pressure flow meters (or DP meter)
They are inferential meters and include the orifice plate, Pitot tube, Venturi meter, and V-Cone meters. They are traditional technology and approved for custody transfer.
RotameterIt is a conventional gas technology used as an industrial flow meter to measure the volumetric flow rate of fluids in a closed tube.

Comparison of liquid flow measurement technologies
https://forumautomation.com/t/comparison-of-different-from-flow-measurement-technologies/1190

https://forumautomation.com/t/comparison-of-different-from-flow-measurement-technologies/1190
Comparison of Gas flow measurement technologies

https://forumautomation.com/t/comparison-of-different-from-flow-measurement-technologies/1190
Technical Specifications Chart: Accuracy, Reputability, Maximum pressure, Maximum temperature, Pressure drop, Turn down ratio, Average cost

Electromagnetic Flow meters require a minimum medium conductivity for the technology to measure flow. This chart provide a general guideline on conductivity of common media
Typical industries where Electromagnetic Flow Meter is used
▪ Water / Waste Water Industry, ▪ Food & Beverages, ▪ Metals, ▪ Brewing/distilling/Wine-making, ▪ HVAC, ▪ Chemical, ▪ Pulp & Paper, ▪ Pharmaceutical, ▪ Mining/Mineral Processing
https://m.made-in-china.com/product/Electromagnetic-Water-Flow-Meter-Sensor-Price-907298675.html

Yokogawa Flow Meter Product Family
https://www.yokogawa.com/solutions/products-platforms/field-instruments/flow-meters/#Overview

Competitor Analysis from Different angles▪ SWOT Analysis for Startup▪ Competitive map / Brand Positioning▪ Analysis of 13 Competitors (Pls see Excel file)
Global and Regional

SWOT Analysis of the Smart Liquid Metering Market
Strengths Weaknesses+ Steady development of advanced metering infrastructure (AMI) is the rising trend in the Smart Water Metering market
+ Initial Costs, installation, maintenance expenses and accuracy
+ Water utilities are expected to create the larger demand for AMI owing to their higher budget for the advancement of the water infrastructure, compared to residential and industrial-sector consumers
+ More promotional budget is required by the startups due to slow adoption rate by companies in the start
+ To curb major losses owing to thefts, spillages, and wrong metering, water utilities are increasingly investing in advanced water metering and upgrading the infrastructure, globally
+ Dominance to major players
+ Mergers, Acquisitions and Joint Ventures + Competitive pricing+Investor confidence on startups is low
Opportunities Threats
+ Communication technology in the smart water meter sector is one of the most important technologies for its functioning
+ Competition from other types of meters (fluidic oscillator meters, positive displacement meters, velocity meters, single-jet meters, and multi-jet eters)
+ IoT provides the largest opportunity for growth + New entrants in the liquid metering market
+ This technology is primarily useful in regions with uncertain rainfall conditions, where it can help organizations properly utilize rainwater
+Safety Concerns in hazardous materials
+ These advantages are aiding in the popularity of such devices in regions such as the MEA
+ Counterfiets/fakes/sub-standard products can disrupt the market
+ the growing demand for water conservation is propelling the popularity of smart water meters in industrial settings
+Threat of new regulations by regime change / new government

https://www.factmr.com/report/4630/flow-meter-market

OperatorCountry of
OriginBreif Intro Related Products
Solutions, Advanced Portfolio Servicing and Maintenance
Coverage Inudstries Key Differentiators
KROHNE Group Germany
KROHNE is a world-leading manufacturer and supplier of solutions in industrial process instrumentation. KROHNE offers supporting products and services for one-stop-shopping and in industries as widespread as oil & gas, water & wastewater, chemical & petrochemical, food & beverage, power, minerals & mining and marine.
+ Flow, level, temperature, pressure, process analytics + Meters, sensors, systems and accessories+ Wide range of measurement technologies
+ Excellent pre- and after-sales service Start-up and commissioning on site+ Checking devices on site thanks to the KROHNE OPTICHECK+ Repair devices on site+ Recalibration at the nearest facility (for example Netherlands, China, Brazil)+ Training for customers at the nearest local facility or on site at the customers facilities.
With presence in around
100 countries, local support is usually
available from just around the corner.
+Chemical + Food & Beverages + Life Sciences + Marine + Metal & Mining + Nuclear + Oil & Gas + Power Generation + Pulp & Paper + Water & Waste Water
+ Rapid and Reliable Pipeline Leak Detection + For all industrial process applications+ From cost-effective mechanical indicators to very advanced flow instrumentation+ Maintenance and service tools, flow computers and other accessories for flow measurement + eLearning course "Electromagnetic flowmeters“
Honeywell Elster - Elster Group
USA
Elster is a world leader in measuring and improving the flow of natural gas, electricity and water in more than 130 countries. With one of the most extensive installed revenue measurement bases in the world and more than 200 million metering modules deployed over the course of the last 10 years alone, Elster is enabling the vital connections between technology and Earth’s energy and resources for our global community.
+ Mechanical Flow Metering + Smart Metering + Electromagnetic Water Meter + Ultrasonic Flow Metering+ Integrated Metering Solutions+ Gas Analysis Equipment+ Volume Converters / Flow + Computers+ Data Loggers+ Data Communication+ Application Software+ Gas Piping Systems
+ Smart Metering + Biogas Solutions The Support process involves: + Hotline Support + System Support + Trainings
Elster’s AMI solutions enable utilities to cost-
effectively deliver, manage, and
conserve the life-essential resources of gas, electricity,
and water. Elster has over 7500 staff and
operations in 38 countries in North
and South America, Europe, and Asia.
+ Chemical + Gas Utilities + Water Utilities +Electricity
+ Ideally suited to both billing and water distribution applications + Pioneering innovation in commercial water metering technology + Data flexibility and quality for remote reading applications + Trainings: We offer special training seminars in English language on request in Mainz-Kastel or organized by our agents in their countries. + Support packages
ABB Switzerland
With ABB's knowledge about flow measurement and management, you have access to over 100 years of flow measurement and control experience to help you save cost and increase profits.
+ Electromagnetic Flowmeter + Coriolis Mass Flowmeters+ Multiphase Flowmeters+ Primary Flow + Differential Pressure Products+ Thermal Mass Flowmeters+ Variable Area Flowmeters+ Vortex flowmeters+ Swirl flowmeters Service + Flow Measurement Products
+ Actuators + Analytical Measurement + Flow Computers & Remote Controllers + Flow Measurement Products + Force Measurement + Level Measurement Products + Positioners + Pressure Measurement Products + Recorders and Controllers + Remote indicators + Temperature Measurement Products
ABB operates in more than
100 countries with about 136,000
employees.
+ Measurement & Analytics + Aluminium + Automotive+ Buildings and Infrastructure.+ Cement + Chemical.+ Data Centers.+ Food and Beverage
+ State of the art technology + Perfect fit for all water andwaste water applications + Smart key based functionality + Versatile and simple configuration + Unparalleled service ability+ Fault-finding Help texts on the display+ Minimized downtime with replaceable electronics cartridges + ABB's Measurement & Analytics business offers online and in-person training + Training is available either in the classroom, at your plant, via webinar
Analysis of 13 Competitors(Please see attached Excel File)

Customer Analysis❑ Necessity of water metering to save water
as precious resource ❑ Benefits of Flow Meters for Utility
Companies/Industrial/Commercial Users❑ Benefit for End Users
Overall

https://www.slideshare.net/SmartH2O/from-smart-water-meters-to-demand-and-customer-relationship-management

Benefits of Flow Meters for end users
https://www.mdpi.com/2073-4441/11/4/838

Benefits of Flow Meters for end users
https://www.mdpi.com/2073-4441/11/4/838

How Utility companies can benefit from Flow MetersBenefits of Smart/Digital Metering to Utility Companies
Category Subcategory Benefit
Operational Cost Savings
Meter Reading
Reduction in Meter Reader charges/Billing CostsReduction in Special Meter ReadsReduction in Estimated BillsReduction in Occupational Health and Safety (OHS) incident costsReduction in vehicle energy costs (GHG emissions)
Reduction in billing and collection costs monthly billing is coupled with eBilling and direct debit collection
Financial Management
Improved revenue forecasting/recoveryCash flow/reduced working capital from Monthly BillingReduce residential nonrevenue water data errors/lossesReduce nonresidential nonrevenue water data errors/lossesReduce nonresidential nonrevenue water data errors/losses
Utility Costs
Reduction in wholesale cost of WaterReduction in network leaks and other NRW causes (e.g., bursts)Better peak water demand managementReduction in water pumping cost (GHG emissions)Reduction in water theftReduction in labour costs associated with leak detection
Meters Deferred meter replacement (through water conservation, targeted replacement)
TarrifsMore flexible tariffs by industryLoad shifting (levellingImprovement in customer service/satisfaction
Capital Cost SavingsPlanning
Improved Network PlanningDeferred network augmentation
RiskReduction in Risk premium/Working Capital CostsIncreased value of asset (service connection)
New Knowledge
New KnowledgeNonresidential customer property useTourism impacts for tourist region (Seasonal/event)Understand Time-of-day use by residential customer segment
New Algorithms
Meter oversizing identifierReduced uncertainty/reduced risk marginImproved forecasting of sewer flowsImproved demand forecasting and revenue projectionDiurnal curves for nonresidential customers by customer typeImproved demand forecasting and revenue projectionImproved demand forecasting and revenue projection
https://www.mdpi.com/2073-4441/11/4/838

Benefits of Flow Meters to end users
https://www.mdpi.com/2073-4441/11/4/838
Benefits of Smart/Digital Metering to Utility Companies / other End Users
Category Subcategory Benefit
Customer Service
Usage Cost
Reduction in cost to customers due to leak alerting
Reduction due to customer awareness/education
Reduction due to customer awareness/education
Reduction due to Monthly Billing
Reduction in Insurance Claims
Complex property/multiunit usage reconciliationFaster and easier reconciliation of bills for properties with multiple accounts
Identify plumbing irregularities in properties with complex plumbing
New Services
Customer selection of Billing Day
Evaporative cooler water use
Nonresidential customer end-use data logging and analytics
New productsCustomised product offers
Disaggregation/Appliance End-use
SecurityIncreased security for home and business owners
Vacant property water use monitoring and alert
New Knowledge
Appliance usage/End-UseIntegration of smart meters with “smart” appliances
Appliance efficiency impact on total demand
Benchmarking
Benchmarking water demand of evaporative coolers
Benchmarking customer segments

Commercial Sources(Lists of Various potential customers for marketing keeping potential use of electromagnetic flow meter in view)
Global
US
UK

List of main Global Utilities (Pls see attached Excel file for Complete list)
Natural gas companies Electricity companies Water companies Steam companies
Barbados - National Petroleum Corporation, Barbados National Oil Company Ltd.
Australia - Lumo Energy, EnergyAustralia, Origin Energy, TRUenergy, SEC Victoria (fmr.), Powercor, Click Energy, AGL, Alinta, Citipower, ETSA Utilities, Western Power, Country Energy, Energex, Integral Energy, ActewAGL, Ergon Energy, Power and Water
Australia - Unitywater, Queensland Urban Utilities American District Steam Company
Brazil - ComgásBangladesh - Summit Group, Power Grid Company of
Bangladesh Ltd, Electricity Generation Company of Bangladesh Ltd
Barbados - Barbados Water Authority Boston Heating Company
Canada - List of Canadian natural gas companies Barbados - Barbados Light and Power Company Ltd. Brazil - Sabesp, Sanepar, Copasa, Semasa Compagnie Parisienne de Chauffage Urbain
China - China Natural Gas, Towngas ChinaBrazil - Eletrobrás, AES Eletropaulo, CPFL
Energia, Celesc, CEMIG, CESP, Copel, Light S.A., CEEE, Energisa
China: Hong Kong - Water Supplies Department Macau - Macao Water
Detroit Thermal
Hong Kong - China Resources Gas, The Hong Kong and China Gas Company
Belgium - ElectrabelFrance - SAUR, Suez Environnement, Veolia
EnvironnementNew York Steam Company, now Con Edison Steam Operations
Egypt - EGAS Canada - List of Canadian electric utilities Greece - EYDAP Trigen Energy Corporation
France - List of French natural gas companiesChina - State Grid Corporation, China Southern Power
GridIreland - Irish Water
Japan - List of Japan natural gas companies Hong Kong - Hongkong Electric, CLP Power Italy - Hera, Seabo
Malaysia - Petronas Macau - Companhia de Electricidade de MacauEgypt - Holding company for water and
wastewater, Alexandria Water Company
Pakistan - Sui Northern Gas Pipelines Limited Sui Southern Gas Company Limited
Cuba - Union ElectricaPhilippines - Maynilad Water Services, Manila Water
Company, Inc., Metropolitan Waterworks and Sewerage System
Taiwan - CPC Corporation Czech Republic - CEZ Group Taiwan - Taiwan Water Corporation
Thailand - PTT Egypt - Egyptian Electricity Holding Company United Kingdom - (Please List in next tab)
United Kingdom - List of British natural gas companies Ethiopia - Ethiopian Electric Power Corporation
United States - List of United States natural gas companies
Finland - Fortum
France - List of French electric utilities
https://en.wikipedia.org/wiki/List_of_public_utilities

List of Water Utilities in various states of USA(Pls see attached Excel file for Complete list)
Alabama Arizona Arkansas California Colorado
Asbury Water Authority Arizona Water Company Central Arkansas Water California American Water Academy Water & Sanitation District
Autauga County Water Authority Mohave County Water Authority Little Rock Water Reclamation Authority California Department of Water Resources Alpensee Water District
Autaugaville Water Authority Phoenix Water Services Department California Water Service Arapahoe Estates Water District
Bakerhill Water Authority Pinal County Water Augmentation Authority Castaic Water Agency Aurora Water
Bear Creek Water Works Board Queen Creek Irrigation Water Delivery District 32 Del Oro Water Company Baca Grande Water & Sanitation District
Beauregard Water Authority Silverbell Irrigation District East Bay Municipal Utility District Bailey Water & Sanitation District
Bellwood Water And Fire Protection Authority Thunderbird Water Delivery District 1 Escondido Utilities Bancroft-Clover Water and Sanitation District
Big Wills Water Authority Tucson Water Fallbrook Public Utility District Baseline Water District
Blount County Water Authority Fresno Irrigation District Bear Creek Water and Sanitation District
Boldo Water And Fire Protection Authority Kern Water Bank AuthorityBennett Bear Creek Farms Water & Sanitation District
https://en.wikipedia.org/wiki/List_of_United_States_water_companies

List of Water Utilities in different regions of UK(Pls see attached Excel file for Complete list)
Water and sewerageCompany Service area Parent Website
Anglian Water East of EnglandConsortium consisting of Canada Pension Plan Investment
Board, Colonial First State Global Asset Management, IFM
Investors and 3i
Official website
Dŵr Cymru Welsh Water Wales Glas Cymru Official websiteNorthumbrian Water North East England Cheung Kong Infrastructure Holdings Official website
Severn Trent Water West Midlands, East Midlands, Chester
As at 1 March 2017, the Company's issued share capital
consists of 239,791,170 ordinary shares of 97 17/19 pence
each with voting rights.
Official website
Southern Water South East England Greensands Holdings Official websiteSouth West Water South West England Pennon Group Official websiteThames Water Greater London, Thames Valley Kemble Water Limited Official website
United Utilities North West England None (listed on London Stock Exchange) Official website
Wessex Water South West England YTL Corporation Official websiteYorkshire Water Yorkshire and the Humber Kelda Group Official websiteHafren Dyfrdwy Wrexham, Powys Severn Trent Official website
Water onlyCompany Supply area Owner Website
Affinity Water
Central
region: Amersham, Barnet, Beaconsfield, Bishop's
Stortford, Harlow, Harrow, Hemel
Hempstead, Letchworth, Luton, Saffron Walden, St
Albans, Staines, Stevenage, Uxbridge, Watford, Wel
wyn Garden City, Woking
Morgan Stanley/M&G Investments Official website
East region: Brightlingsea, Clacton-on-Sea, Frinton-
on-Sea, Harwich, Manningtree, Wivenhoe
Southeast region: Dover, Folkestone, Hythe, Romney
Marsh, Dungeness, Lydd
Albion WaterKnowle Village (Hampshire), Oaklands Hamlet
(Chigwell), Upper Rissington (Gloucestershire)Albion Water Group Limited Official website
https://en.wikipedia.org/wiki/United_Kingdom_water_companies
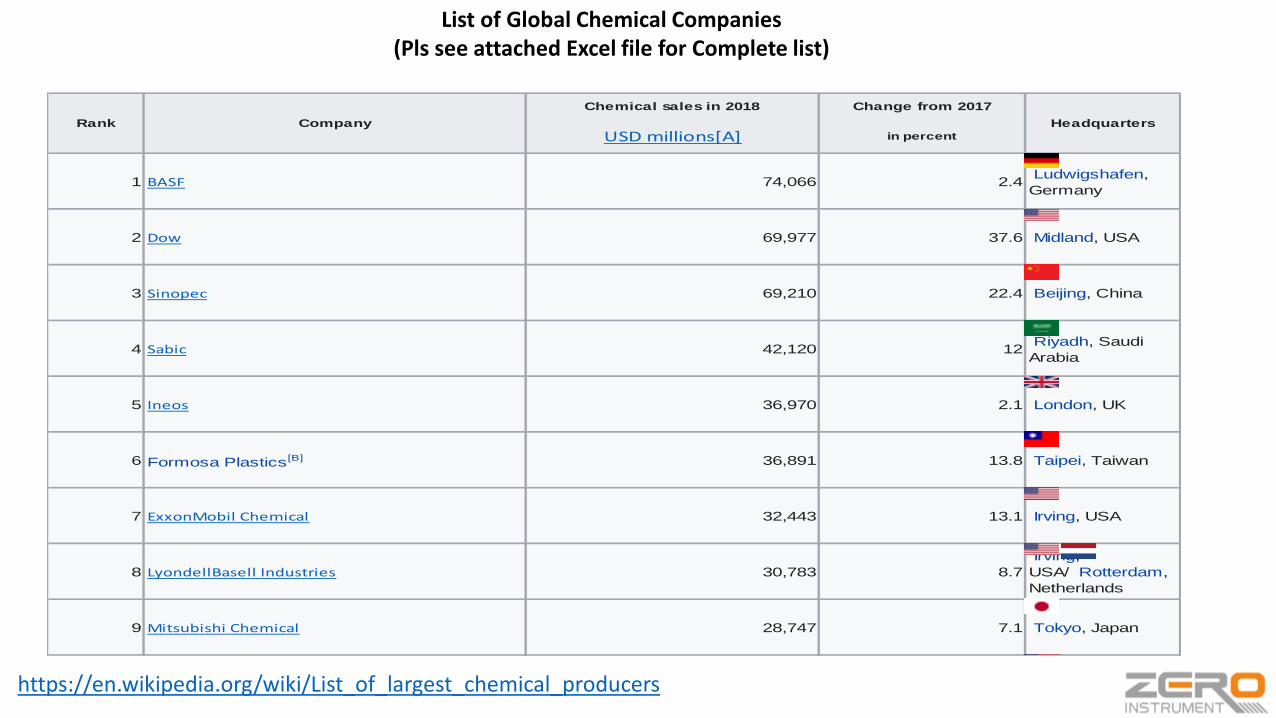
List of Global Chemical Companies(Pls see attached Excel file for Complete list)
Chemical sales in 2018 Change from 2017
USD millions[A] in percent
1 BASF 74,066 2.4 Ludwigshafen,
Germany
2 Dow 69,977 37.6 Midland, USA
3 Sinopec 69,210 22.4 Beijing, China
4 Sabic 42,120 12 Riyadh, Saudi
Arabia
5 Ineos 36,970 2.1 London, UK
6 Formosa Plastics[B] 36,891 13.8 Taipei, Taiwan
7 ExxonMobil Chemical 32,443 13.1 Irving, USA
8 LyondellBasell Industries 30,783 8.7
Irving,
USA/ Rotterdam,
Netherlands
9 Mitsubishi Chemical 28,747 7.1 Tokyo, Japan
Rank Company Headquarters
https://en.wikipedia.org/wiki/List_of_largest_chemical_producers

List of Global Pharmaceutical Companies(Pls see attached Excel file for Complete list)
2019 2018
USD billions USD billions
Johnson & Johnson
NYSE: JNJ
Sinopharm
SEHK: 1099
Roche
SIX: ROG
Bayer
FWB: BAYN
Novartis
NYSE: NVS
Merck & Co.
NYSE: MRK
GlaxoSmithKline
LSE: GSK
AbbVie
NYSE: ABBV
Sanofi
NYSE: SNY
Bristol Myers Squibb
Nasdaq: BMY
Pfizer
NYSE: PFE
Abbott Laboratories
Nasdaq: ABT
12 1 31.90[98] 30.60[99]
11 7 51.75[89] 53.60[90]
10 5 26.15[80] 22.56[81]
9 1 39.28[71] 39.07[72]
8 1 33.27[64] 32.75[65]
7 1 43.92[55] 43.14[56]
6 1 46.84[46] 42.30[47]
5 1 47.45[37] 44.75[38]
4 1 48.02 [28] 45.06[29]
3 1 63.85[19] 56.86[20]
2 1 60.18[10] 48.75[11]
81.60[2]
Rank Chg Company
1 82.06[1]
https://en.wikipedia.org/wiki/List_of_largest_biomedical_companies_by_revenue

2019 Top 100 Food & Beverage Companies(Please see attached Excel File)
https://www.foodengineeringmag.com/2019-top-100-food-beverage-companies
Company Sales (USD, m) Sales (Local Currency, m) Year End
Total Sales: $93,268 Total Sales (SwF): 91,439
Food Sales: $80,195 Food Sales (SwF): 78,622
Total Sales: $64,661 Total Sales ($): 64,661
Food Sales: $64,661 Food Sales ($): 64,661
Total Sales: $54,619 Total Sales ($): 54,619
Food Sales: $54,619 Food Sales ($): 54,619
Total Sales: $49,775 Total Sales (R$): 181,680
Food Sales: $46,790 Food Sales (R$): 170,780
Total Sales: $40,052 Total Sales ($): 40,052
Food Sales: $40,052 Food Sales ($): 40,052
Total Sales: $64,341 Total Sales ($): 64,341
Food Sales: $38,900 Food Sales ($): 38,900
Total Sales: $35,000 Total Sales ($): 35,000
Food Sales: $35,000 Food Sales ($): 35,000
Total Sales: $114,695 Total Sales ($): 114,695
Food Sales: $32,500 Food Sales ($): 32,500
Total Sales: $31,856 Total Sales ($): 31,856
Food Sales: $31,856 Food Sales ($): 31,856
Total Sales: $26,259 Total Sales ($): 26,259
Food Sales: $26,259 Food Sales ($): 26,259
Total Sales: $25,938 Total Sales ($): 25,938
Food Sales: $25,938 Food Sales ($): 25,938
Total Sales: $22,605 Total Sales ($): 22,605
Food Sales: $21,283 Food Sales ($): 21,283
Total Sales: $22,800 Total Sales (¥): 2,517,258
Food Sales: $20,855 Food Sales (¥): 2,302,497Suntory 18-Dec
Mondelez International 18-Dec
Smithfield Foods/WH Group 18-Dec
The Coca-Cola Company 18-Dec
Kraft Heinz Company 18-Dec
Mars 18-Dec
Cargill 18-May
Tyson Foods 18-Oct
Archer Daniels Midland Company 18-Dec
Anheuser-Busch InBev 18-Dec
JBS 18-Dec
Nestlé 18-Dec
PepsiCo, Inc. 18-Dec

List of 90 Food & Beverage Distributors and Facilities in USA(Pls see attached Excel file for Complete list)
S/No. Company Description of Services Revenue Source
1 AVI FOODSYSTEMS, INC.Founded in 1960, AVI has rapidly become the largest independently owned and operated food service company...
$623.43 million
https://www.dnb.com/business-directory/company-profiles.avi_food_systems_inc.71c9c47a3d2a1adfe953d948b799dd48.html#:~:text=AVI%20Food%20Systems%2C%20Inc.%20
has,million%20in%20sales%20(USD).
2 Ameriqual Producer of shelf-stable foods for the United States Department of Defense and military. $273.0Mhttps://www.zippia.com/ameriqual-group-careers-
14809/#:~:text=AmeriQual%20Group%20is%20a%20medium,is%20headquartered%20in%20Evansville%2C%20IN.
3 AramarkARAMARK is a leader in professional services, providing award-winning food services, facilities management...
15.7 billion USDhttps://www.macrotrends.net/stocks/charts/ARMK/aramark/r
evenue
4 Compass GroupCompass Group PLC is the world's 6th largest employer and the leader in food and support services management.
26 Billion
https://www.google.com/search?sa=X&rlz=1C1GCEU_enPK935PK935&hl=en&biw=1138&bih=753&sxsrf=ALeKk03KhFfyew77gzdxykTE1eswCANHIw:1613073550509&q=compass+group+revenue&stick=H4sIAAAAAAAAAONgFuLUz9U3MCoprzBUAjNNiw0sirT4nfNzCxLzKoMzU1LLEyuLFzGqZJRb6Sfn5-SkJpdk5ufp5xelJ-ZlViWCOMVWRallqXmlqYtYRZNBGouLFdKL8ksLFKDiAKJsb5loA
AAA&ved=2ahUKEwil1OWfz-LuAhXPi1wKHdMwDucQxA0wA3oECAUQBA
5 SodexoSodexo is a French food services and facilities management company headquartered in the Paris suburb of Issy-les-Moulineaux. It has 428,237 employees as of 2019 and a presence in 80 countries. For fiscal year 2020 revenues reached €22.0 billion, with a market capitalization of €15.8 billion
22 billion
https://www.google.com/search?sa=X&rlz=1C1GCEU_enPK935PK935&hl=en&biw=1138&bih=753&sxsrf=ALeKk03KhFfyew77gzdxykTE1eswCANHIw:1613073550509&q=sodexo+revenue&stick=H4sIAAAAAAAAAONgFuLUz9U3MCoprzBUAjNNjAoyCrX4nf
NzCxLzKoMzU1LLEyuLFzGqZJRb6Sfn5-SkJpdk5ufp5xelJ-ZlViWCOMVWRallqXmlqYtY-
YrzU1Ir8hWgAgA8ZvhgYQAAAA&ved=2ahUKEwil1OWfz-LuAhXPi1wKHdMwDucQxA0wA3oECAUQBg
6Atlas Food Systems and
ServicesFor over 75 years Atlas has been the industry's leader in vending and dining throughout South Carolina...
$22.46 million
https://www.dnb.com/business-directory/company-profiles.atlas_food_systems_and_services_inc.0dfad3106274c0d10b5f69458ad4b130.html#:~:text=Atlas%20Food%20Systems%20and%20Services%2C%20Inc.%20has%20300%20total%20e
mployees,million%20in%20sales%20(USD).
7 Auntie Anne's Inc.
Auntie Anne’s offers a family-oriented working environment built on communication and mutual respect. There’s hard work that goes into serving and supporting our franchise partners and consumers through a variety of expert positions including construction, customer care, marketing, training, accounting, human resources, purchasing, business consulting, and more. But, there’s a good bit of fun mixed in. After all, we make pretzels so it’s impossible NOT to have fun here...
USD 161.23 Millionhttps://www.dnb.com/business-directory/company-
profiles.auntie_annes_inc.0f878962d73b022fa650d9269d706531.html
https://www.careersinfood.com/food-service-companies-resource-64.htm

List of Top 250 Restaurant Chains in USA(Pls see attached Excel file for Complete list)
Rank Chain2018 U.S. Sales
($000,000)2018 U.S. Units Segment Menu Category
1 McDonald’s $38,524 13,914 Quick Service Burger
2 Starbucks $19,660* 14,606 Quick Service Coffee Cafe
3 Subway $10,410 24,798 Quick Service Sandwich
4 Taco Bell $10,360 6,588 Quick Service Mexican
5 Chick-fil-A $10,180* 2,370 Quick Service Chicken
6 Burger King $9,939 7,330 Quick Service Burger
7 Wendy’s $9,405 5,810 Quick Service Burger
8 Dunkin’ $8,786 9,419 Quick Service Coffee Cafe
9 Domino’s $6,591 5,876 Quick Service Pizza
10 Panera Bread $5,760* 2,074 Fast Casual Bakery Cafe
11 Pizza Hut $5,526 7,482 Quick Service Pizza
12 Chipotle Mexican Grill $4,805 2,452 Fast Casual Mexican
13 Sonic Drive-In $4,447 3,606 Quick Service Burger
14 KFC $4,433 4,074 Quick Service Chicken
15 Applebee’s $4,211 1,693 Casual Dining Varied Menu
16 Olive Garden $4,082 855 Casual Dining Italian/Pizza
17 Arby’s $3,886 3,329 Quick Service Sandwich
18 Little Caesars $3,820* 4,350 Quick Service Pizza
https://www.fsdbco.com/top-250-restaurant-chains-us-2019/

List of Top 100 Independent Restaurants in USA(Pls see attached Excel file for Complete list)
RANK RESTAURANT SALES AVERAGE CHECK CITY STATE MEALS SERVED
1 Joe’s Stone Crab $38,400,000 $87 Miami Beach Fla. 325,530
2 Carmine’s (Times Square) $36,889,370 $37 New York N.Y. 437,566
3 The Boathouse $35,499,910 $43 Orlando (Disney Springs) Fla. 831,375
4 Old Ebbitt Grill $33,291,280 $40 Washington D.C. 1,013,433
5 Lavo Italian Restaurant & Nightclub $27,521,650* $90* New York N.Y. 203,000
6 Smith & Wollensky $25,474,000 $104 New York N.Y. 268,583
7 Gibsons Bar & Steakhouse $25,167,986 $78 Chicago Ill. 350,495
8 Balthazar $25,100,000* $87* New York N.Y. 530,280
9 Bryant Park Grill & Cafe $24,700,000 $75 New York N.Y. 403,429
10 Junior’s $23,661,885 $22 New York N.Y. 914,513
11 Prime 112 $23,600,000 $130 Miami Beach Fla. 204,100
12 Maple & Ash $23,597,660 $85 Chicago Ill. 241,756
13 Vandal $23,537,850* $84* New York N.Y. 209,480
14 Joe’s Seafood, Prime Steak & Stone Crab $22,860,000* $83* Washington D.C. 286,440
15 Angus Barn $22,787,000* $72* Raleigh N.C. 313,910
16 Joe’s Seafood, Prime Steak & Stone Crab $22,642,000* $89* Chicago Ill. 253,760
17 Komodo $22,500,000 $97 Miami Fla. 245,000
18 Joe’s Seafood, Prime Steak & Stone Crab $22,264,200* $77* Las Vegas Nev. 260,000
19 The Hamilton $21,898,952 $38 Washington D.C. 639,759
20 Buddakan $21,240,726 $98 New York N.Y. 223,497
https://www.fsdbco.com/top-100-independent-restaurants-2019/

List of Top 50 Fast Food Chains in USA(Pls see attached Excel file for Complete list)
Rank Company Category U.S. Sales, Billions (2019)1 McDonald's Burger $40.41 2 Starbucks Snack $21.55 3 Chick-fil-A Chicken $11.00 4 Taco Bell Global $11.00 5 Burger King Burger $10.30 6 Subway Sandwich $10.00 7 Wendy's Burger $9.87 8 Dunkin' Snack $9.22 9 Domino's Pizza $7.10
10 Panera Bread Sandwich $5.93 11 Chipotle Global $5.52 12 Pizza Hut Pizza $5.38 13 KFC Chicken $4.82 14 Sonic Drive-In Burger $4.69 15 Arby's Sandwich $3.89 16 Little Caesars Pizza $3.85 17 Panda Express Global $3.80 18 Dairy Queen Snack $3.76
19 Popeyes Louisiana Kitchen Chicken $3.75 20 Jack in the Box Burger $3.51 21 Papa John's Pizza $2.66 22 Whataburger Burger $2.56 23 Jimmy John's Sandwich $2.11 24 Hardee's Burger $2.07 25 Zaxby's Chicken $1.84
https://www.visualcapitalist.com/top-50-fast-food-chains-ranked/

List of Airports in USA(Pls see attached Excel file for Complete list)
AirportAirport Code
Operating Income 5-Year GrowthOperating Income Per Employee
Op Income Per Flight
Op Income Per Enplanement
JOHN F KENNEDY INTL JFK $452,214,911 17% $1,059,051 $1,030 $15.97
NEWARK INTL EWR $432,896,382 30% $1,130,278 $1,042 $23.04
SAN FRANCISCO INTL SFO $422,481,349 59% $298,573 $987 $17.59
LOS ANGELES INTL LAX $403,297,514 212% $127,344 $628 $11.17
MIAMI INTL MIA $368,404,692 85% $309,064 $908 $17.24
MC CARRAN INTL LAS $267,088,941 119% $204,353 $512 $12.21
GENERAL EDWARD LAWRENCE LOGAN BOS $263,625,527 46% $356,733 $726 $16.41
DENVER INTL DEN $250,732,817 31% $196,653 $458 $9.28
WASHINGTON DULLES INTERNATI IAD $241,213,462 65% $266,829 $896 $22.51
Hartsfield-Jackson Atlanta International ATL $214,543,266 13% $187,702 $246 $4.37
DALLAS/FORT WORTH INTL DFW $198,411,916 40% $110,598 $295 $6.11
ORLANDO INTL MCO $190,109,352 29% $304,662 $624 $10.10
SEATTLE-TACOMA INTL SEA $184,751,864 15% $209,707 $484 $8.75
MINNEAPOLIS-ST PAUL INTL MSP $162,243,061 43% $274,523 $401 $8.88
GEORGE BUSH INTERCONTINENTAL IAH $161,976,819 14% $170,323 $318 $7.73
PHOENIX SKY HARBOR INTL PHX $125,085,947 28% $151,253 $287 $5.82
RONALD REAGAN WASHINGTON NATIONAL DCA $122,565,267 34% $193,626 $419 $10.66
PORTLAND INTL PDX $106,754,780 32% $292,479 $510 $13.25
DETROIT METRO WAYNE DTW $101,929,975 27% $164,403 $268 $6.20
LAGUARDIA LGA $94,022,385 17% $324,215 $261 $6.60
CHARLOTTE/DOUGLAS INTL CLT $88,435,993 20% $226,179 $162 $3.99
PHILADELPHIA INTL PHL $87,681,254 38% $83,906 $180 $5.73
TAMPA INTL TPA $86,698,952 32% $143,304 $458 $9.36
INDIANAPOLIS INTL IND $85,576,483 10% $202,308 $560 $21.35
SACRAMENTO METRO SMF $78,792,160 70% $250,930 $276 $17.02
https://www.bizjournals.com/charlotte/feature/power-rankings-airports/dataset/airports-profitability-by-operating-revenue/175/table

List of Hotels in USA(Pls see attached Excel file for Complete list)
https://www.bizjournals.com/charlotte/feature/power-rankings-airports/dataset/airports-profitability-by-operating-revenue/175/table
S/No. Name Country City Rooms
1 The Venetian Resort Las Vegas (The Venetian Las Vegas and The Palazzo) United States Las Vegas 7,092
2 MGM Grand Las Vegas and The Signature United States Las Vegas 6,852
3 CityCenter United States Las Vegas 6,790
4 Wynn Las Vegas and Encore Las Vegas United States Las Vegas 4,750
5 Mandalay Bay, Delano and Four Seasons United States Las Vegas 4,426
6 Luxor Las Vegas United States Las Vegas 4,407
7 Excalibur Hotel and Casino United States Las Vegas 3,981
8 Caesars Palace United States Las Vegas 3,970
9 Bellagio United States Las Vegas 3,933
10 Hilton Hawaiian Village United States Honolulu 3,804
11 Circus Circus Las Vegas United States Las Vegas 3,773
12 Flamingo Las Vegas United States Las Vegas 3,460
13 The Mirage United States Las Vegas 3,044
14 Cosmopolitan of Las Vegas United States Las Vegas 3,027
15 Park MGM United States Las Vegas 3,002
16 Westgate Las Vegas United States Las Vegas 2,956
17 Paris Las Vegas United States Las Vegas 2,916
18 Gaylord Opryland Resort & Convention Center United States Nashville 2,888
19 Treasure Island Hotel and Casino United States Las Vegas 2,884
20 Disney's Pop Century Resort[16] United States Lake Buena Vista 2,880
21 Bally's Las Vegas United States Las Vegas 2,814
22 Borgata United States Atlantic City 2,802
23 Harrah's Atlantic City United States Atlantic City 2,588
24 Harrah's Las Vegas United States Las Vegas 2,540
25 Rio All Suite Hotel and Casino United States Las Vegas 2,522

List of Breweries in UK(Pls see attached Excel file for Complete list)
Source: Google
Brewery Location Ph #
6° North Brewery Stonehaven, Aberdeenshire
71 Brewing Co, 36-40 Bellfield St, Dundee DD1 5HZ, United Kingdom +44 1382 203133
Alechemy unit b, 1 Gregory Rd, Livingston EH54 7DR, United Kingdom +44 1506 413634
The Alpha Project Brewery 133 Lothian Rd, Edinburgh EH3 9AB, United Kingdom +441312290759
Andrews Ales 1 railway cottage, cummetrees DG12 5QG, United Kingdom +441461700387
Arran Brewery Cladach, Brodick, Isle of Arran KA27 8DE, United Kingdom +44 1770 302353
Ayr Brewing Company 5 Racecourse Rd, Ayr KA7 2DG, United Kingdom +44 7834 922142
Barney's Beer 1 Summerhall Pl, Newington, Edinburgh EH9 1PL, United Kingdom +44 7512 253660
Beath Brewing The Rectory, Cowdenbeath KY4 9AP, United Kingdom +44 7792 369678
Beeches Brewery Lochgelly
Bellfield Brewery 46 Stanley Pl, Edinburgh EH7 5TB, United Kingdom +44 131 656 9390
Belhaven Brewery Brewery Ln, Dunbar EH42 1PE, United Kingdom +44 1368 862734
Black Isle Brewery Old Allangrange, Munlochy IV8 8NZ, United Kingdom +44 1463 811871
Black Metal brewery 4, 6 Dryden Road, Loanhead EH20 9LZ, United Kingdom Not Available
Black Wolf brewery 7c, Bandeath Industrial Estate, Throsk, Stirling FK7 7NP, United Kingdom +44 1786 437187
Born in the Borders Brewery Galashiels Transport Interchange, Stirling Street, Galashiels TD1 1BY, United Kingdom +441896751884
Brew Toon 72A St Peter St, Peterhead AB42 1QB, United Kingdom +441779476211

List of Breweries in US(Pls see attached Excel file for Complete list)
Rank Brewery City State
1 D. G. Yuengling and Son Inc Pottsville PA
2 Boston Beer Co Boston, Milton MA, DE
3 Sierra Nevada Brewing Co Chico CA
4 Duvel Moortgat Paso Robles, Kansas City, Cooperstown CA, MO, NY
5 Gambrinus Berkeley, Shiner CA, TX
6 CANarchyLongmont, Tampa, Salt Lake City, Comstock,
Inglewood, Dallas CO, FL, UT, MI, CA, TX
7 Bell's Brewery, Inc Comstock MI
8 Artisanal Brewing Ventures Downingtown, Lakewood, Brooklyn PA, NY, NY
9 Stone Brewing Escondido CA
10 Deschutes Brewery Bend OR
https://www.brewersassociation.org/press-releases/brewers-association-releases-the-top-50-brewing-companies-by-sales-volume-for-2020/

List of Dairy companies in UK(Pls see attached Excel file for Complete list)
Source: Google
Dairy Farm Location Ph #
Bonaly Farm Dairy 8 Dryden Rd, Loanhead EH20 9LZ, United Kingdom +44 131 440 0110
Mossgiel FarmWest Mossgiel Farm, Tarbolton Rd, Mauchline KA5 5LL, United Kingdom +44 1290 550307
Forest Farm The Organic Dairy Kinellar, Aberdeen AB21 0SH, United Kingdom +44 7887 557548
Graham's The Family Dairy Ltd Airthrey Kerse Farm, Bridge of Allan FK9 4RW, United Kingdom +44 1786 833206
Graham's The Family Dairy Ltd 1 Masterton St, Glasgow G21 1HZ, United Kingdom +44 141 333 9877
Graham's The Family Dairy Ltd North Rd, Inverkeithing KY11 1HQ, United Kingdom +44 1383 412586
Dairy UK Ltd Maxwell Ave, Bearsden, Glasgow G61 1HU, United Kingdom +44 141 942 1447
The Ethical Dairy Rainton Farm, Castle Douglas DG7 2DR, United Kingdom +44 1557 814040
Solway Farm Dairies Lochmaben, Lockerbie DG11 1RY, United Kingdom +44 1387 810337
Dunlop Dairy Dunlop Rd, Stewarton KA3 5LP, United Kingdom +44 1560 482494
Kevans Dairy Farm Newton Stewart DG8 8HN, United Kingdom +44 1988 500588
A R Campbell Cuil Farm, Castle Douglas DG7 1QB, United Kingdom +44 1556 502172
Mid Threave Dairy Newton Stewart DG8 0BU, United Kingdom +44 1671 830315

List of Dairy companies in US(Pls see attached Excel file for Complete list)
https://en.wikipedia.org/wiki/List_of_dairy_product_companies_in_the_United_States
List of Milk products manufacturers in USAll American FoodsAlpenrose DairyAlta DenaAlto Dairy CooperativeAurora Organic Dairy – based in Boulder, Colorado, it operates large factory farms, each with thousands of dairy cows, in Colorado and TexasB[edit]The Blue Bell Creameries factory in Brenham, TexasBeatrice FoodsBittersweet Plantation DairyBlue Bell Creameries[2]Blue BunnyBlue Valley Creamery CompanyBorden Milk Co. Creamery and Ice FactoryBorden Milk ProductsBraum'sBrewster DairyBroughton Foods CompanyByrne DairyCapriole Goat CheeseCarnation – founded as an evaporated milk company in 1899CarvelCass-ClayChaseholm Farm CreameryCieloClover Stornetta FarmsCooksville Cheese FactoryCoolhaus
Copyright © 2022 FDOKUMEN