Quantification of miRNA-mRNA Interactions
10
Quantification of miRNA-mRNA Interactions Ander Muniategui 1 , Rube ´ n Nogales-Cadenas 2 , Migue ´l Va ´ zquez 3 , Xabier L. Aranguren 4 , Xabier Agirre 5 , Aernout Luttun 4 , Felipe Prosper 5 , Alberto Pascual-Montano 2 , Angel Rubio 1 * 1 Group of Bioinformatics, CEIT and TECNUN, University of Navarra, San Sebastian, Spain, 2 National Center for Biotechnology-CSIC, Madrid, Spain, 3 Structural Biology and Biocomputing Programme, Spanish National Cancer Research Centre (CNIO), Madrid, Spain, 4 Center for Molecular and Vascular Biology, Katholieke Universiteit Leuven, Leuven, Belgium, 5 Hematology Department and Area of Cell Therapy, Clı ´nica Universidad de Navarra, Foundation for Applied Medical Research, University of Navarra, Pamplona, Spain Abstract miRNAs are small RNA molecules (9 22nt) that interact with their corresponding target mRNAs inhibiting the translation of the mRNA into proteins and cleaving the target mRNA. This second effect diminishes the overall expression of the target mRNA. Several miRNA-mRNA relationship databases have been deployed, most of them based on sequence complementarities. However, the number of false positives in these databases is large and they do not overlap completely. Recently, it has been proposed to combine expression measurement from both miRNA and mRNA and sequence based predictions to achieve more accurate relationships. In our work, we use LASSO regression with non-positive constraints to integrate both sources of information. LASSO enforces the sparseness of the solution and the non-positive constraints restrict the search of miRNA targets to those with down-regulation effects on the mRNA expression. We named this method TaLasso (miRNA-Target LASSO). We used TaLasso on two public datasets that have paired expression levels of human miRNAs and mRNAs. The top ranked interactions recovered by TaLasso are especially enriched (more than using any other algorithm) in experimentally validated targets. The functions of the genes with mRNA transcripts in the top-ranked interactions are meaningful. This is not the case using other algorithms. TaLasso is available as Matlab or R code. There is also a web-based tool for human miRNAs at http://talasso.cnb.csic.es/. Citation: Muniategui A, Nogales-Cadenas R, Va ´zquez M, L. Aranguren X, Agirre X, et al. (2012) Quantification of miRNA-mRNA Interactions. PLoS ONE 7(2): e30766. doi:10.1371/journal.pone.0030766 Editor: Paolo Provero, University of Turin, Italy Received September 2, 2011; Accepted December 21, 2011; Published February 14, 2012 Copyright: ß 2012 Muniategui et al. This is an open-access article distributed under the terms of the Creative Commons Attribution License, which permits unrestricted use, distribution, and reproduction in any medium, provided the original author and source are credited. Funding: The work of AM was supported by the Basque Government (Programas de Formacio ´ n y Perfeccionamiento de Personal Investigador, http://www. hezkuntza.ejgv.euskadi.net/r43-5552/es/contenidos/informacion/dib4/es_2035/bfi_c.html). AP and RNC were partially supported by Spanish Government Grant BIO2010-17527 and the Madrid Government Grant CAM - S2010/BMD-2305. RNC also acknowledges the support of the Juan de la Cierva Spanish Government Research program. The authors acknowledge support from Integromics, S.L., for their support with their software Integromics Biomaker DiscoveryH and RealTime StatminerH. The funders had no role in study design, data collection and analysis, decision to publish, or preparation of the manuscript. Competing Interests: The authors have declared that no competing interests exist. * E-mail: [email protected] Introduction miRNAs are small RNA molecules (9 22nt) that regulate the expression of their corresponding mRNA targets in many eukaryotes. The imperfect base pairing of the miRNAs with the 39-untranslated region (39-UTR) of their targets can either inhibit translation or cause mRNA cleavage [1]. Some authors have recently stated that ‘‘miRNAs predominantly act to decrease target mRNA levels’’ [2]. Although low translational repression with no mRNA destabilization is also possible, the overall effect is the down-regulation of both protein and mRNA concentrations. This deregulation is key in a wide range of biological processes and human diseases [3]. MiRBase [4] is the de facto standard database used to retrieve data related to miRNAs. It currently contains near 1400 human miRNAs (release 17). Considering that each miRNA has a sequence compatible with around 200 target mRNAs, the number of putative interactions is very large. Most of the computational methods developed to identify mRNA-miRNA interactions are based on sequence complementarities of miRNA and its mRNA targets. These algorithms have been used to create databases of interactions, such as miRBase [4], TargetScan [5–7], PicTar [8], miRanda [9] or miRGen [10]. Unfortunately, the number of false predictions using these computational methods is still high [11]. Although there are experimental tools for miRNA target validation, several involved steps must be performed to verify the authenticity of a miRNA target. Therefore, the number of experimentally-validated targets is still very low. For instance, TarBase [12] includes around 1300 experimentally-validated interactions. This number is small if compared with the number of predicted interactions in miRBase (.500000). In recent years, different computational methods for miRNA- mRNA interaction prediction that use expression data to decipher miRNA targets have emerged. Some of them combine this information with sequence based predictions to obtain more reliable miRNA targets. Among them are GenMiR++ [13,14], HOCTAR [15] or MAGIA [16]. The key assumption is that due to the down-regulation effect of miRNAs on its targets, their expression levels must be inversely related, i.e. if a particular miRNA expression increases, the expression of its mRNA targets must decrease. The difference between these methods relies on the way they use this information. For example, GenMiR++ uses a Bayesian framework and states the probabilities of having an interaction PLoS ONE | www.plosone.org 1 February 2012 | Volume 7 | Issue 2 | e30766
Transcript of Quantification of miRNA-mRNA Interactions
Quantification of miRNA-mRNA InteractionsAnder Muniategui1, Ruben Nogales-Cadenas2, Miguel Vazquez3, Xabier L. Aranguren4, Xabier Agirre5,
Aernout Luttun4, Felipe Prosper5, Alberto Pascual-Montano2, Angel Rubio1*
1 Group of Bioinformatics, CEIT and TECNUN, University of Navarra, San Sebastian, Spain, 2 National Center for Biotechnology-CSIC, Madrid, Spain, 3 Structural Biology and
Biocomputing Programme, Spanish National Cancer Research Centre (CNIO), Madrid, Spain, 4 Center for Molecular and Vascular Biology, Katholieke Universiteit Leuven,
Leuven, Belgium, 5 Hematology Department and Area of Cell Therapy, Clınica Universidad de Navarra, Foundation for Applied Medical Research, University of Navarra,
Pamplona, Spain
Abstract
miRNAs are small RNA molecules (9 22nt) that interact with their corresponding target mRNAs inhibiting the translation ofthe mRNA into proteins and cleaving the target mRNA. This second effect diminishes the overall expression of the targetmRNA. Several miRNA-mRNA relationship databases have been deployed, most of them based on sequencecomplementarities. However, the number of false positives in these databases is large and they do not overlap completely.Recently, it has been proposed to combine expression measurement from both miRNA and mRNA and sequence basedpredictions to achieve more accurate relationships. In our work, we use LASSO regression with non-positive constraints tointegrate both sources of information. LASSO enforces the sparseness of the solution and the non-positive constraintsrestrict the search of miRNA targets to those with down-regulation effects on the mRNA expression. We named this methodTaLasso (miRNA-Target LASSO).We used TaLasso on two public datasets that have paired expression levels of human miRNAs and mRNAs. The top rankedinteractions recovered by TaLasso are especially enriched (more than using any other algorithm) in experimentally validatedtargets. The functions of the genes with mRNA transcripts in the top-ranked interactions are meaningful. This is not the caseusing other algorithms.TaLasso is available as Matlab or R code. There is also a web-based tool for human miRNAs at http://talasso.cnb.csic.es/.
Citation: Muniategui A, Nogales-Cadenas R, Vazquez M, L. Aranguren X, Agirre X, et al. (2012) Quantification of miRNA-mRNA Interactions. PLoS ONE 7(2):e30766. doi:10.1371/journal.pone.0030766
Editor: Paolo Provero, University of Turin, Italy
Received September 2, 2011; Accepted December 21, 2011; Published February 14, 2012
Copyright: � 2012 Muniategui et al. This is an open-access article distributed under the terms of the Creative Commons Attribution License, which permitsunrestricted use, distribution, and reproduction in any medium, provided the original author and source are credited.
Funding: The work of AM was supported by the Basque Government (Programas de Formacion y Perfeccionamiento de Personal Investigador, http://www.hezkuntza.ejgv.euskadi.net/r43-5552/es/contenidos/informacion/dib4/es_2035/bfi_c.html). AP and RNC were partially supported by Spanish Government GrantBIO2010-17527 and the Madrid Government Grant CAM - S2010/BMD-2305. RNC also acknowledges the support of the Juan de la Cierva Spanish GovernmentResearch program. The authors acknowledge support from Integromics, S.L., for their support with their software Integromics Biomaker DiscoveryH and RealTimeStatminerH. The funders had no role in study design, data collection and analysis, decision to publish, or preparation of the manuscript.
Competing Interests: The authors have declared that no competing interests exist.
* E-mail: [email protected]
Introduction
miRNAs are small RNA molecules (9 22nt) that regulate the
expression of their corresponding mRNA targets in many
eukaryotes. The imperfect base pairing of the miRNAs with the
39-untranslated region (39-UTR) of their targets can either inhibit
translation or cause mRNA cleavage [1]. Some authors have
recently stated that ‘‘miRNAs predominantly act to decrease target
mRNA levels’’ [2]. Although low translational repression with no
mRNA destabilization is also possible, the overall effect is the
down-regulation of both protein and mRNA concentrations. This
deregulation is key in a wide range of biological processes and
human diseases [3].
MiRBase [4] is the de facto standard database used to retrieve
data related to miRNAs. It currently contains near 1400 human
miRNAs (release 17). Considering that each miRNA has a
sequence compatible with around 200 target mRNAs, the number
of putative interactions is very large. Most of the computational
methods developed to identify mRNA-miRNA interactions are
based on sequence complementarities of miRNA and its mRNA
targets. These algorithms have been used to create databases of
interactions, such as miRBase [4], TargetScan [5–7], PicTar [8],
miRanda [9] or miRGen [10]. Unfortunately, the number of false
predictions using these computational methods is still high [11].
Although there are experimental tools for miRNA target
validation, several involved steps must be performed to verify
the authenticity of a miRNA target. Therefore, the number of
experimentally-validated targets is still very low. For instance,
TarBase [12] includes around 1300 experimentally-validated
interactions. This number is small if compared with the number
of predicted interactions in miRBase (.500000).
In recent years, different computational methods for miRNA-
mRNA interaction prediction that use expression data to decipher
miRNA targets have emerged. Some of them combine this
information with sequence based predictions to obtain more
reliable miRNA targets. Among them are GenMiR++ [13,14],
HOCTAR [15] or MAGIA [16]. The key assumption is that due
to the down-regulation effect of miRNAs on its targets, their
expression levels must be inversely related, i.e. if a particular
miRNA expression increases, the expression of its mRNA targets
must decrease.
The difference between these methods relies on the way they
use this information. For example, GenMiR++ uses a Bayesian
framework and states the probabilities of having an interaction
PLoS ONE | www.plosone.org 1 February 2012 | Volume 7 | Issue 2 | e30766
between a miRNA and its putative targets. HOCTAR [15]
assumes that the expression of intronic miRNAs is strongly
correlated with the expression of the genes where they are located.
Therefore, gene expression can be used as an estimator of intronic
miRNA expression. This approach uses the advantage of a huge
number of samples, for which gene expression is available, to
obtain statistically significant results. In the end, HOCTAR uses
simply the correlation. This measure has been also used by other
authors for miRNA-mRNA target prediction [17–19]. On the
other hand, MAGIA uses the mutual information. A possible
drawback is that it is not possible to distinguish between positive
and negative regulations.
Recently, other methods based on expression data analysis for
miRNA-mRNA interaction prediction have been published
[20,21]. Jayaswal et al. [20] use a two step process that consists
of clustering each expression data for miRNA and mRNA
followed by a t-test to find significant miRNA-mRNA relation-
ships. Li et al. [21] apply Partial Least Squares Regression to a
preselected set of differentially expressed mRNAs and miRNAs.
Adding expression data to sequence based predictions has been
shown to reduce false positive rate [22].
We have developed the TaLasso algorithm that combines the
information of sequence databases with mRNA and miRNA
expression to quantify the down-regulation between miRNAs and
their putative targets. It can be considered as a filter to sequence-
based databases.
Our method is based on the LASSO regression. The norm-1
penalty term of LASSO ensures the number of predicted
interactions is small. In addition, we included non-positive
constraints to the LASSO regression to restrict the predicted
mRNA targets to those with down-regulation effects from
miRNAs. TaLasso uses as initial putative targets the union of
several sequence databases (miRGen [10], miRBase [4], miRanda
(microRNA.org) [9], TarBase [12], miRecords [23], miRWalk
[24] release of 2010). TaLasso was applied to two datasets with
matched samples of mRNA and miRNA expression data.
TaLasso was validated by measuring its ability to predict
experimentally-validated targets and by analysing the biological
relevancy of the predicted interactions. These results were
compared with other methods (GenMiR++ and Pearson correla-
tion). We illustrate that the top interactions predicted by TaLasso
are significantly enriched in validated targets and that this
enrichment is larger than using GenMiR++ or Pearson correla-
tion. Furthermore, the functions of the genes with mRNA
transcripts in the top-ranked interactions are biologically sound
in the context of the experiments being studied. We also show that
including the non-positive constraints improves the specificity of
the prediction using LASSO regression.
Materials and Methods
Given a set of miRNA-mRNA putative interactions and given
their expression values, TaLasso quantifies the down-regulation
effect of each miRNA on its mRNA targets. Due to the biological
complexity underlying mRNA regulation, this quantification is
made by considering several simplifications.
AssumptionsFirst of all, it will be assumed that the miRNAs are the only
regulators of mRNA expression, considering other possible effects
as part of the noise. Therefore, TaLassso –as other methods– is
able to detect only the most prominent interactions.
Secondly, the model assumes that the miRNAs down-regulate
their corresponding mRNA targets. Although the existence of
miRNAs that act as transcription factors [1] have been shown,
they will not be considered in the model.
Thirdly, TaLasso will only quantify the down-regulation effect
on those miRNA-mRNA interactions from an initial set of
putative miRNA-mRNA pairs (i.e. predicted from sequence based
algorithms). Consequently, TaLasso will not be able to recover
those interactions not included in this initial set of putative targets.
Finally, the logarithm of the mRNA expression will be assumed
to be linearly dependent on the logarithm of the expression of its
putative miRNA regulators.
Mathematical modelLet vectors xj = [xj1, xj2, … , xjI]1xI and zk = [zk1, zk2, … , zkI]1xI
be the logarithms of the expression levels of mRNA j and miRNA
k, in samples 1 to I. Consider also that there are J mRNAs and K
miRNAs. Let cjk be an indicator variable whose value is 1 if mRNA
j is a potential target of miRNA k predicted in sequence databases
and 0 otherwise. Then, a linear relationship between the logarithm
of the expressions of each mRNA j and the K miRNAs is assumed
and it is represented by the following linear model,
xj~XK
k~1
bjk:cjk
:zkzx0j zej, ð1Þ
where ej is an error term and xj0 = xj
0 ? [1, 1, … , 1]1xI is the
intercept term, i.e. the expected value of the logarithm of the
expression of mRNA j in the absence of regulation from miRNAs
in samples 1 to I. bjk is the amount of regulation for each miRNA -
mRNA pair, i.e. how much the miRNA down-regulates the target
mRNA. bjk and xj0 are unknown.
Resolution of the linear modelIn many cases, the number of miRNAs that putatively regulate
an mRNA is larger than the number of samples. Therefore
equation (1) is an undetermined system of equations. We propose
to solve Eq (1) for each mRNA using l1-regularized least squares
and adding non-positivity constraints:
minbj ,x
0j
xj{XK
k~1
bjk:cjk
:zk{x0j
����������
2
zlj:XK
k~1
bjk:cjk
�� ��( )
subject to bjkƒ0, for k~1,2, . . . ,K :
ð2Þ
The l1-norm of the penalty term (PK
k~1
bjk:cjk
�� ��) enforces the
sparsity of the solution. It is adjusted with the tuning parameter lj.
The larger the value of this parameter the sparser the solution is.
Non-positivity constraints are added to ensure that the solution
includes only negative relationships between mRNA and miRNA
expressions. This is a convex problem and thus, if an algorithm is
able to find a local minimum, this minimum is guaranteed to be
also global.
Equation (2) is very similar to a LASSO regression problem.
The only differences are that Eq (2) includes a term that must not
be penalized (xj0) and that there are non-positivity constraints.
Some LASSO packages that include inequality restrictions are
available and they can be accommodated to solve this optimiza-
tion problem [25–27].
We have adapted two solvers for this particular problem, one
for Matlab and the other one for R (http://cran.r-project.org/).
TaLasso can be run in either Matlab or R. Matlab code is adapted
from the l1_ls software (http://www.stanford.edu/,boyd/l1_ls/)
Quantification of miRNA-mRNA Interactions
PLoS ONE | www.plosone.org 2 February 2012 | Volume 7 | Issue 2 | e30766
[26]. Some minor changes in the initial Matlab code boosted the
speed two-fold. R code was developed by using the package
Rcplex (http://CRAN.R-project.org/package = Rcplex) [27]. In
this case, the l1-regularized least square problem was converted
into a quadratic problem by expanding the norm-2 factor. Both
packages have comparable performance. Specifically, Matlab
package is 30% faster.
There is no method that provides statistical significance in the
context of regularized Least Squares with constraints. Although
bootstrap could be an alternative, the estimation is inappropriate
due to the bias and is time consuming. We have instead opted to
use the statistics of multiple linear regression to assign to the
solutions of TaLasso their p-vales pstatistical significance. In the
software, we have included a function called significance_beta, in
both R and Matlab codes (see texts S5 and S6 for further
information).
Selection of the l1-penaltyLASSO regression theory states [26] that the possible values of
the tuning parameter lj must lie within the interval [0, ljmax], being
ljmax equal to,
lmaxj ~2:max
kxj:zt
k
� �:cjk
�� ��� �: ð3Þ
If lj is zero, the standard minimum squares solution is obtained.
If lj is ljmax then the optimum solution is the null vector. The value
of lj can be selected by cross validation. It would be possible to
compute lj independently for each mRNA. However, this
approach requires many additional parameters in the model and
it is prone to overfitting. Instead of this, we select lj for every
mRNA as a fraction of a maximum value Lj. In the following, the
variable k = lj/Lj, same for all mRNAs, will be used to denote
these fractions.
TaLasso provides two possible ways to select Lj: the global and
the local methods. In the global method, Lj, is selected as,
Lj~L~ maxj
lmaxj
� Vj ð4Þ
And therefore,
lj~lG~kGL~kG :maxj
lmaxj
� Vj: ð5Þ
The estimation of lG is called global tuning parameter in the rest of
the paper and provides a single penalty term for every mRNA.
In the local method Lj is selected as,
Lj~lmaxj Vj ð6Þ
and therefore,
lLj ~kLlmax
j : ð7Þ
The estimation for ljL in Eq (7) will be referred to as the local
tuning parameter.
In either case we used a single kL or for kG for all mRNAs.
Notice that, although kL is the same for all mRNAs, ljmax is not
and thus, ljL will be different for each mRNA. In our case studies,
global selection outperforms local selection. Results are included in
the text S1.
The values of kG (and kL) were determined by testing the factors
{1/10000, 1/100, 1/50, 1/20, 1/10, 1/5, 1/3, 1/2} using Leave
One Out Cross Validation (LOOCV). This method performs the
optimization using all samples but one and validates the results
with the sample left out. This procedure is repeated for every
sample. The selected value of k is the one that provides the
minimum square error (MSE) in the samples left out training the
algorithm with the other samples, i.e,
mink
MSEkð Þ~ mink
1
I
XI
i~1
ffiffiffiffiffiffiffiffiffiffiffiffiffiffiffiffiffiffiffiffiffiffiffiffiffiffiffiffiffiffiffiffiXJ
j~1
xj,i{xxj,i
�� ��2
2
vuut0@
1A~
~ mink
1
I
XI
i~1
ffiffiffiffiffiffiffiffiffiffiffiffiffiffiffiffiffiffiffiffiffiffiffiffiffiffiffiffiffiffiffiffiffiffiffiffiffiffiffiffiffiffiffiffiffiffiffiffiffiffiffiffiffiffiffiffiffiffiffiffiffiffiffiffiffiffiffiffiXJ
j~1
xj,i{XK
k~1
bbjk:cjk
:zk,i{xx0j,=i
����������
2
2
vuut0@
1A:
ð8Þ
where bbjk and xx0j,?i are the estimations of the down-regulation
and the intercept obtained with TaLasso for the mRNA and
miRNA expression of all samples but i. xxj,i is the predicted
expression value of mRNA j in sample i determined by the values
bbjk. Finally, xj,i and zk,i are the expressions of mRNA j and miRNA
k on sample i.
Results
We have implemented the solvers for Eq (2) in R and Matlab.
Putative and experimental interactions are included in the
downloadable software. We have also developed a convenient
web page that performs this computation. We named them
‘‘TaLasso’’. Therefore, TaLasso is both the web page and the
algorithm adaptations that solve the problem described in Eq. (2).
The result is the amount of down-regulation of a miRNA for their
targets in a particular experiment.
We run TaLasso for two real datasets and validate the results by
studying the enrichment on experimentally-validated targets. We
also analyze the biological relevance of the predicted interactions.
In this section we present these results and include a comparison
between TaLasso, GenMiR++ and correlation methods.
Expression datasetsTaLasso has been tested with two datasets with matched miRNA
and mRNA expression data. The first dataset, which will be referred
as Multi Class Cancer (MCC) dataset, is composed of miRNA
expression data from [28] and mRNA expression data from [29].
This dataset was used in GenMiR++. The second one, which will be
referred to as acute lymphoblastic Leukemia DataSet (LDS), is publicly
available in GEO (GSE14834). It corresponds to expression profiles
published by [30] and is part of a case study used in MAGIA. In
both datasets, the expression values were further normalized by
subtracting from each mRNA or miRNA their median value.
Enrichment on experimentally-validated targetsWe compared TaLasso results with GenMiR++ and the
Pearson correlation. We were not able to reproduce mutual
information results obtained in MAGIA. Nevertheless, it has been
stated that for normal random variables, Mutual Information (MI)
can be estimated as a function of the Spearman or the Pearson
correlation coefficient [31]. Therefore, if normal conditions are
met, the ranking of MI results and the ranking of the absolute
value of correlation are expected to be similar. We have checked
Quantification of miRNA-mRNA Interactions
PLoS ONE | www.plosone.org 3 February 2012 | Volume 7 | Issue 2 | e30766

that correlation performs better than the absolute value of the
correlation.
The comparison of the scoring algorithms is based on
measuring the enrichment of their results on experimentally-
validated interactions. If the top ranked interactions of an
algorithm have more experimentally-validated targets, this algo-
rithm is expected to perform better as more predicted interactions
are validated.
The union of miRBase, miRanda, miRGen, miRecords,
TarBase and miRWalk were used as the initial set of interactions.
Among them, TaRBase (v5), miRecords (May 2010) and miR-
Walk databases were used as reference of experimentally-validated
targets. Whereas the interactions included in TaRBase and
miRecords have been manually curated, those in MiRWalk were
automatically extracted from the literature using text mining
techniques. Therefore, this last database includes less reliable but
more interactions than the other two.
Figure 1 shows the Venn diagram of the number of interactions
provided by each database and the intersections among them. The
number of interactions in any particular experiment is usually
smaller since a particular experiment includes only a subset of the
mRNAs and miRNAs in the databases. Nevertheless, the initial set
of interactions comprises more than half a million putative
interactions. From them, only a few (,1000 or 10000 depending
on the database) correspond to the experimentally-validated
targets.
Applying TaLasso to the MCC and the LDS datasets, b, the
downregulation effect of each miRNA on its targets was obtained.
For both datasets we performed an enrichment analysis using the
results provided by TaLasso, GenMiR++ and Correlation to
mRNAs with at least one experimentally-validated miRNA target.
The aim of this analysis is to compare each of these algorithms in
terms of the number of experimentally-validated interactions.
The enrichment analysis was developed as follows. Firstly, the
interactions were ranked according to the scores provided by each
method. Secondly, taking the top-ranked n interactions, we
counted the number of experimentally-validated targets within
them. With this data, we compute the corresponding p-value using
the hypergeometric distribution. The hypergeometric distribution
is a discrete probability distribution that describes the probability
of obtaining p successes (experimentally-validated interactions)
when n elements (selected interactions) from a finite population
without replacement (the union of all the putative interactions) are
drawn.
These p-values help to compare the algorithms: for a given n
(number of selected interactions) the smaller the p-value, the more
enriched the solution in experimentally-validated interactions is.
We compared the algorithms using two scores: the number of
experimentally validated interactions in the top-500 predicted
interactions and the minimum p-value on the enrichment curves.
In the second case we also provide the number of experimentally-
validated targets (NE) and the amount of predicted interactions
drawn (NT) on that point.
The following subsection shows the enrichment results for the
union of TarBase and miRecords. The enrichment for miRWalk is
included in text S1 and shows a similar trend.
Multi Class Cancer (MCC) expression data. The dataset
used in GenMiR++ is a set of 88 paired cancer and normal
samples with mRNA data from [28] and miRNA expression data
from [28]. The mRNA expression data was measured with
oligonucleotide microarrays Hu6800 and Hu35KsubA GeneChips
(Affymetrix, Santa Clara, CA). On the other hand, the miRNA
expression was obtained using bead-based flow cytometry. The
dataset consists of normal and cancerous counterparts from
bladder, breast, colon, kidney, lung, pancreas, prostate and uterus
samples, ovary cancer, melanoma and mesothelioma samples with
no normal references. We compiled the expression data from
GenMiR++; that consists of 114 human miRNAs and 16063
mRNAs. Gene probe names from Hu6800 and HuK35SubA were
matched with Ensembl. Correspondence was not univocal and the
expression of ensemble ID genes with more than one associated
probe was obtained by calculating their means. The final number
of miRNAs and mRNAs after the intersection of the data with the
databases included in TaLasso are 104 miRNAs and 9559
mRNAs. The total number of putative targets is 133005.
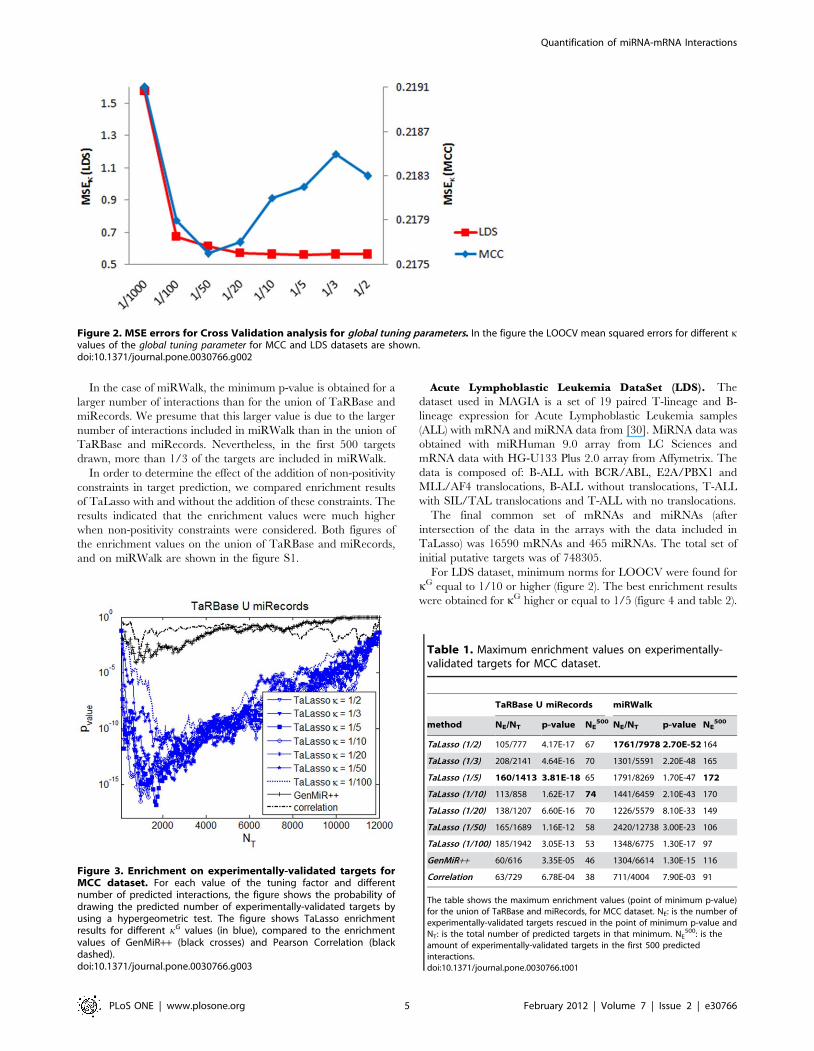
For this dataset, the minimum MSE value for kG corresponds to
1/50 (figure 2) and optimal values for enrichment occur for kG
about 1/10 or larger (figure 3).
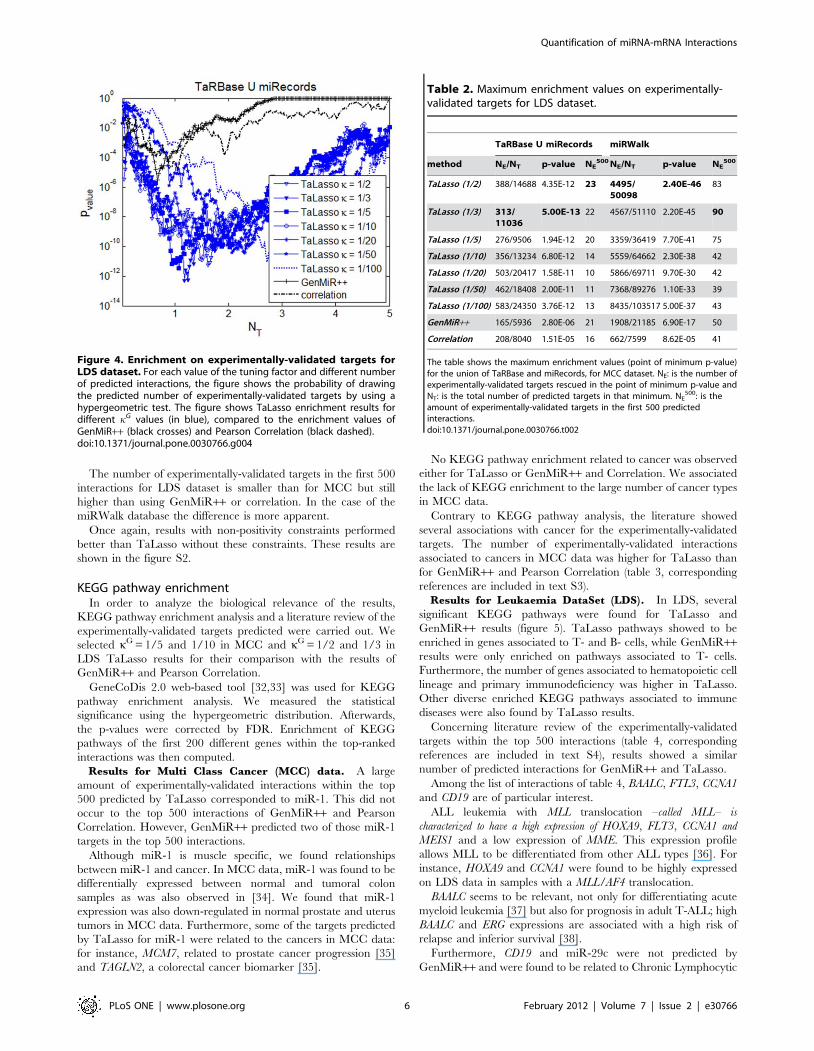
The number of experimentally-validated targets within the first
500 top-ranked targets using kG higher than 1/10 is about 70%
larger than using GenMiR++ or correlation (Table 1). Further-
more, the minimum p-values are lower and maximum enrichment
values are higher for TaLasso than for GenMiR++ and
Correlation.
Figure 1. Shared interactions among the different databases of human miRNA targets that have been used as initial set of putativeinteractions. The overlap among the different databases is small. With reference to databases with experimentally-validated targets, the union ofmiRecords and TarBase includes 623 interactions that are also cited in any of the computationally predicted databases. This number rises to 4372 incase miRWalk is also considered.doi:10.1371/journal.pone.0030766.g001
Quantification of miRNA-mRNA Interactions
PLoS ONE | www.plosone.org 4 February 2012 | Volume 7 | Issue 2 | e30766
In the case of miRWalk, the minimum p-value is obtained for a
larger number of interactions than for the union of TaRBase and
miRecords. We presume that this larger value is due to the larger
number of interactions included in miRWalk than in the union of
TaRBase and miRecords. Nevertheless, in the first 500 targets
drawn, more than 1/3 of the targets are included in miRWalk.
In order to determine the effect of the addition of non-positivity
constraints in target prediction, we compared enrichment results
of TaLasso with and without the addition of these constraints. The
results indicated that the enrichment values were much higher
when non-positivity constraints were considered. Both figures of
the enrichment values on the union of TaRBase and miRecords,
and on miRWalk are shown in the figure S1.
Acute Lymphoblastic Leukemia DataSet (LDS). The
dataset used in MAGIA is a set of 19 paired T-lineage and B-
lineage expression for Acute Lymphoblastic Leukemia samples
(ALL) with mRNA and miRNA data from [30]. MiRNA data was
obtained with miRHuman 9.0 array from LC Sciences and
mRNA data with HG-U133 Plus 2.0 array from Affymetrix. The
data is composed of: B-ALL with BCR/ABL, E2A/PBX1 and
MLL/AF4 translocations, B-ALL without translocations, T-ALL
with SIL/TAL translocations and T-ALL with no translocations.
The final common set of mRNAs and miRNAs (after
intersection of the data in the arrays with the data included in
TaLasso) was 16590 mRNAs and 465 miRNAs. The total set of
initial putative targets was of 748305.
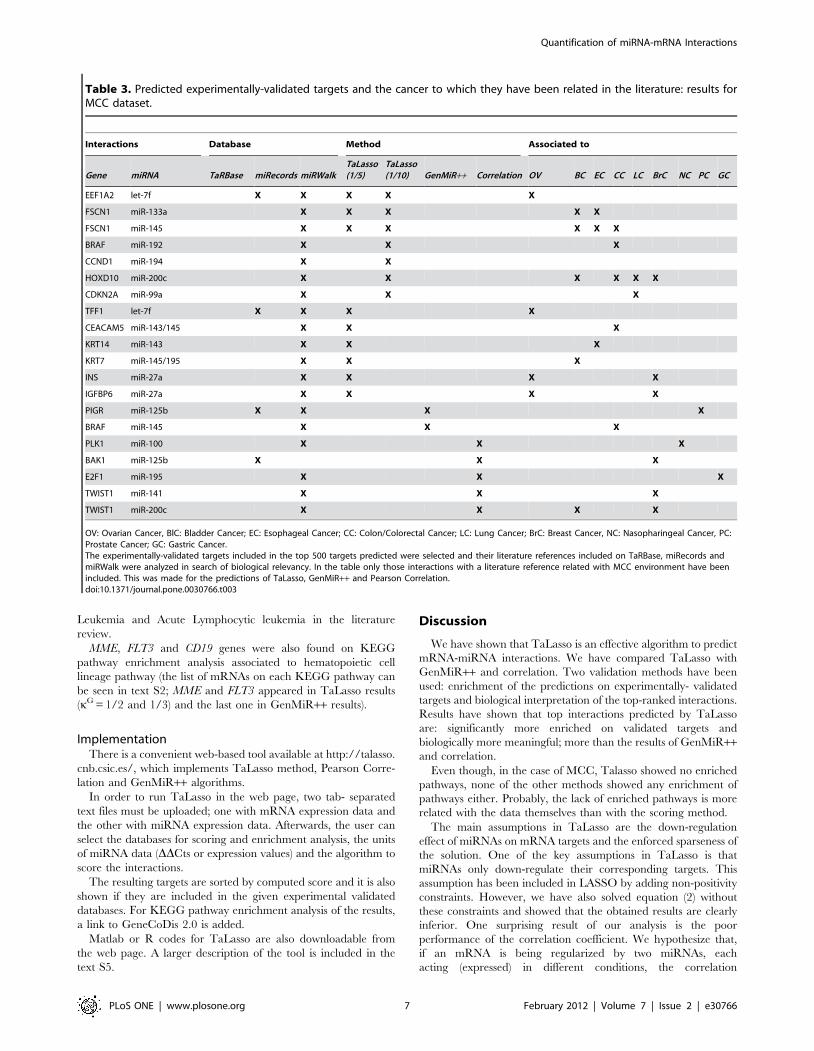
For LDS dataset, minimum norms for LOOCV were found for
kG equal to 1/10 or higher (figure 2). The best enrichment results
were obtained for kG higher or equal to 1/5 (figure 4 and table 2).
Figure 2. MSE errors for Cross Validation analysis for global tuning parameters. In the figure the LOOCV mean squared errors for different kvalues of the global tuning parameter for MCC and LDS datasets are shown.doi:10.1371/journal.pone.0030766.g002
Figure 3. Enrichment on experimentally-validated targets forMCC dataset. For each value of the tuning factor and differentnumber of predicted interactions, the figure shows the probability ofdrawing the predicted number of experimentally-validated targets byusing a hypergeometric test. The figure shows TaLasso enrichmentresults for different kG values (in blue), compared to the enrichmentvalues of GenMiR++ (black crosses) and Pearson Correlation (blackdashed).doi:10.1371/journal.pone.0030766.g003
Table 1. Maximum enrichment values on experimentally-validated targets for MCC dataset.
TaRBase U miRecords miRWalk
method NE/NT p-value NE500 NE/NT p-value NE
500
TaLasso (1/2) 105/777 4.17E-17 67 1761/7978 2.70E-52 164
TaLasso (1/3) 208/2141 4.64E-16 70 1301/5591 2.20E-48 165
TaLasso (1/5) 160/1413 3.81E-18 65 1791/8269 1.70E-47 172
TaLasso (1/10) 113/858 1.62E-17 74 1441/6459 2.10E-43 170
TaLasso (1/20) 138/1207 6.60E-16 70 1226/5579 8.10E-33 149
TaLasso (1/50) 165/1689 1.16E-12 58 2420/12738 3.00E-23 106
TaLasso (1/100) 185/1942 3.05E-13 53 1348/6775 1.30E-17 97
GenMiR++ 60/616 3.35E-05 46 1304/6614 1.30E-15 116
Correlation 63/729 6.78E-04 38 711/4004 7.90E-03 91
The table shows the maximum enrichment values (point of minimum p-value)for the union of TaRBase and miRecords, for MCC dataset. NE: is the number ofexperimentally-validated targets rescued in the point of minimum p-value andNT: is the total number of predicted targets in that minimum. NE
500: is theamount of experimentally-validated targets in the first 500 predictedinteractions.doi:10.1371/journal.pone.0030766.t001
Quantification of miRNA-mRNA Interactions
PLoS ONE | www.plosone.org 5 February 2012 | Volume 7 | Issue 2 | e30766
The number of experimentally-validated targets in the first 500
interactions for LDS dataset is smaller than for MCC but still
higher than using GenMiR++ or correlation. In the case of the
miRWalk database the difference is more apparent.
Once again, results with non-positivity constraints performed
better than TaLasso without these constraints. These results are
shown in the figure S2.
KEGG pathway enrichmentIn order to analyze the biological relevance of the results,
KEGG pathway enrichment analysis and a literature review of the
experimentally-validated targets predicted were carried out. We
selected kG = 1/5 and 1/10 in MCC and kG = 1/2 and 1/3 in
LDS TaLasso results for their comparison with the results of
GenMiR++ and Pearson Correlation.
GeneCoDis 2.0 web-based tool [32,33] was used for KEGG
pathway enrichment analysis. We measured the statistical
significance using the hypergeometric distribution. Afterwards,
the p-values were corrected by FDR. Enrichment of KEGG
pathways of the first 200 different genes within the top-ranked
interactions was then computed.
Results for Multi Class Cancer (MCC) data. A large
amount of experimentally-validated interactions within the top
500 predicted by TaLasso corresponded to miR-1. This did not
occur to the top 500 interactions of GenMiR++ and Pearson
Correlation. However, GenMiR++ predicted two of those miR-1
targets in the top 500 interactions.
Although miR-1 is muscle specific, we found relationships
between miR-1 and cancer. In MCC data, miR-1 was found to be
differentially expressed between normal and tumoral colon
samples as was also observed in [34]. We found that miR-1
expression was also down-regulated in normal prostate and uterus
tumors in MCC data. Furthermore, some of the targets predicted
by TaLasso for miR-1 were related to the cancers in MCC data:
for instance, MCM7, related to prostate cancer progression [35]
and TAGLN2, a colorectal cancer biomarker [35].
No KEGG pathway enrichment related to cancer was observed
either for TaLasso or GenMiR++ and Correlation. We associated
the lack of KEGG enrichment to the large number of cancer types
in MCC data.
Contrary to KEGG pathway analysis, the literature showed
several associations with cancer for the experimentally-validated
targets. The number of experimentally-validated interactions
associated to cancers in MCC data was higher for TaLasso than
for GenMiR++ and Pearson Correlation (table 3, corresponding
references are included in text S3).
Results for Leukaemia DataSet (LDS). In LDS, several
significant KEGG pathways were found for TaLasso and
GenMiR++ results (figure 5). TaLasso pathways showed to be
enriched in genes associated to T- and B- cells, while GenMiR++results were only enriched on pathways associated to T- cells.
Furthermore, the number of genes associated to hematopoietic cell
lineage and primary immunodeficiency was higher in TaLasso.
Other diverse enriched KEGG pathways associated to immune
diseases were also found by TaLasso results.
Concerning literature review of the experimentally-validated
targets within the top 500 interactions (table 4, corresponding
references are included in text S4), results showed a similar
number of predicted interactions for GenMiR++ and TaLasso.
Among the list of interactions of table 4, BAALC, FTL3, CCNA1
and CD19 are of particular interest.
ALL leukemia with MLL translocation –called MLL– is
characterized to have a high expression of HOXA9, FLT3, CCNA1 and
MEIS1 and a low expression of MME. This expression profile
allows MLL to be differentiated from other ALL types [36]. For
instance, HOXA9 and CCNA1 were found to be highly expressed
on LDS data in samples with a MLL/AF4 translocation.
BAALC seems to be relevant, not only for differentiating acute
myeloid leukemia [37] but also for prognosis in adult T-ALL; high
BAALC and ERG expressions are associated with a high risk of
relapse and inferior survival [38].
Furthermore, CD19 and miR-29c were not predicted by
GenMiR++ and were found to be related to Chronic Lymphocytic
Figure 4. Enrichment on experimentally-validated targets forLDS dataset. For each value of the tuning factor and different numberof predicted interactions, the figure shows the probability of drawingthe predicted number of experimentally-validated targets by using ahypergeometric test. The figure shows TaLasso enrichment results fordifferent kG values (in blue), compared to the enrichment values ofGenMiR++ (black crosses) and Pearson Correlation (black dashed).doi:10.1371/journal.pone.0030766.g004
Table 2. Maximum enrichment values on experimentally-validated targets for LDS dataset.
TaRBase U miRecords miRWalk
method NE/NT p-value NE500 NE/NT p-value NE
500
TaLasso (1/2) 388/14688 4.35E-12 23 4495/50098
2.40E-46 83
TaLasso (1/3) 313/11036
5.00E-13 22 4567/51110 2.20E-45 90
TaLasso (1/5) 276/9506 1.94E-12 20 3359/36419 7.70E-41 75
TaLasso (1/10) 356/13234 6.80E-12 14 5559/64662 2.30E-38 42
TaLasso (1/20) 503/20417 1.58E-11 10 5866/69711 9.70E-30 42
TaLasso (1/50) 462/18408 2.00E-11 11 7368/89276 1.10E-33 39
TaLasso (1/100) 583/24350 3.76E-12 13 8435/103517 5.00E-37 43
GenMiR++ 165/5936 2.80E-06 21 1908/21185 6.90E-17 50
Correlation 208/8040 1.51E-05 16 662/7599 8.62E-05 41
The table shows the maximum enrichment values (point of minimum p-value)for the union of TaRBase and miRecords, for MCC dataset. NE: is the number ofexperimentally-validated targets rescued in the point of minimum p-value andNT: is the total number of predicted targets in that minimum. NE
500: is theamount of experimentally-validated targets in the first 500 predictedinteractions.doi:10.1371/journal.pone.0030766.t002
Quantification of miRNA-mRNA Interactions
PLoS ONE | www.plosone.org 6 February 2012 | Volume 7 | Issue 2 | e30766
Leukemia and Acute Lymphocytic leukemia in the literature
review.
MME, FLT3 and CD19 genes were also found on KEGG
pathway enrichment analysis associated to hematopoietic cell
lineage pathway (the list of mRNAs on each KEGG pathway can
be seen in text S2; MME and FLT3 appeared in TaLasso results
(kG = 1/2 and 1/3) and the last one in GenMiR++ results).
ImplementationThere is a convenient web-based tool available at http://talasso.
cnb.csic.es/, which implements TaLasso method, Pearson Corre-
lation and GenMiR++ algorithms.
In order to run TaLasso in the web page, two tab- separated
text files must be uploaded; one with mRNA expression data and
the other with miRNA expression data. Afterwards, the user can
select the databases for scoring and enrichment analysis, the units
of miRNA data (DDCts or expression values) and the algorithm to
score the interactions.
The resulting targets are sorted by computed score and it is also
shown if they are included in the given experimental validated
databases. For KEGG pathway enrichment analysis of the results,
a link to GeneCoDis 2.0 is added.
Matlab or R codes for TaLasso are also downloadable from
the web page. A larger description of the tool is included in the
text S5.
Discussion
We have shown that TaLasso is an effective algorithm to predict
mRNA-miRNA interactions. We have compared TaLasso with
GenMiR++ and correlation. Two validation methods have been
used: enrichment of the predictions on experimentally- validated
targets and biological interpretation of the top-ranked interactions.
Results have shown that top interactions predicted by TaLasso
are: significantly more enriched on validated targets and
biologically more meaningful; more than the results of GenMiR++and correlation.
Even though, in the case of MCC, Talasso showed no enriched
pathways, none of the other methods showed any enrichment of
pathways either. Probably, the lack of enriched pathways is more
related with the data themselves than with the scoring method.
The main assumptions in TaLasso are the down-regulation
effect of miRNAs on mRNA targets and the enforced sparseness of
the solution. One of the key assumptions in TaLasso is that
miRNAs only down-regulate their corresponding targets. This
assumption has been included in LASSO by adding non-positivity
constraints. However, we have also solved equation (2) without
these constraints and showed that the obtained results are clearly
inferior. One surprising result of our analysis is the poor
performance of the correlation coefficient. We hypothesize that,
if an mRNA is being regularized by two miRNAs, each
acting (expressed) in different conditions, the correlation
Table 3. Predicted experimentally-validated targets and the cancer to which they have been related in the literature: results forMCC dataset.
Interactions Database Method Associated to
Gene miRNA TaRBase miRecords miRWalkTaLasso(1/5)
TaLasso(1/10) GenMiR++ Correlation OV BC EC CC LC BrC NC PC GC
EEF1A2 let-7f X X X X X
FSCN1 miR-133a X X X X X
FSCN1 miR-145 X X X X X X
BRAF miR-192 X X X
CCND1 miR-194 X X
HOXD10 miR-200c X X X X X X
CDKN2A miR-99a X X X
TFF1 let-7f X X X X
CEACAM5 miR-143/145 X X X
KRT14 miR-143 X X X
KRT7 miR-145/195 X X X
INS miR-27a X X X X
IGFBP6 miR-27a X X X X
PIGR miR-125b X X X X
BRAF miR-145 X X X
PLK1 miR-100 X X X
BAK1 miR-125b X X X
E2F1 miR-195 X X X
TWIST1 miR-141 X X X
TWIST1 miR-200c X X X X
OV: Ovarian Cancer, BlC: Bladder Cancer; EC: Esophageal Cancer; CC: Colon/Colorectal Cancer; LC: Lung Cancer; BrC: Breast Cancer, NC: Nasopharingeal Cancer, PC:Prostate Cancer; GC: Gastric Cancer.The experimentally-validated targets included in the top 500 targets predicted were selected and their literature references included on TaRBase, miRecords andmiRWalk were analyzed in search of biological relevancy. In the table only those interactions with a literature reference related with MCC environment have beenincluded. This was made for the predictions of TaLasso, GenMiR++ and Pearson Correlation.doi:10.1371/journal.pone.0030766.t003
Quantification of miRNA-mRNA Interactions
PLoS ONE | www.plosone.org 7 February 2012 | Volume 7 | Issue 2 | e30766
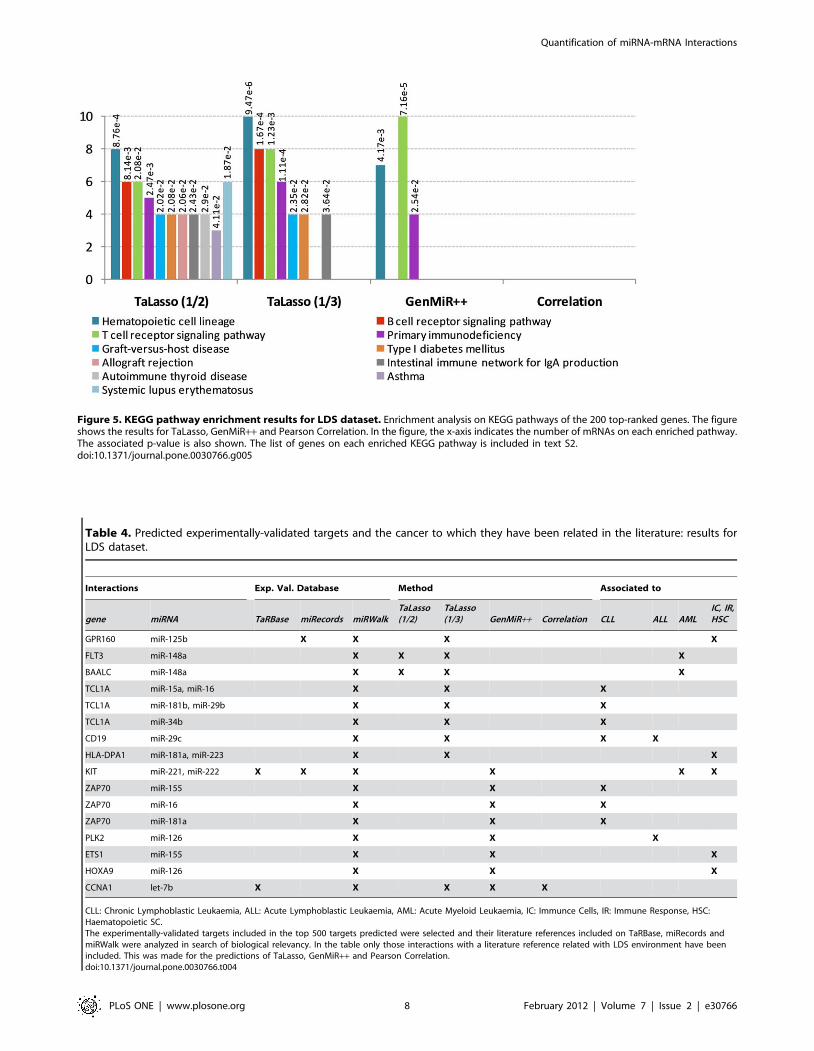
Figure 5. KEGG pathway enrichment results for LDS dataset. Enrichment analysis on KEGG pathways of the 200 top-ranked genes. The figureshows the results for TaLasso, GenMiR++ and Pearson Correlation. In the figure, the x-axis indicates the number of mRNAs on each enriched pathway.The associated p-value is also shown. The list of genes on each enriched KEGG pathway is included in text S2.doi:10.1371/journal.pone.0030766.g005
Table 4. Predicted experimentally-validated targets and the cancer to which they have been related in the literature: results forLDS dataset.
Interactions Exp. Val. Database Method Associated to
gene miRNA TaRBase miRecords miRWalkTaLasso(1/2)
TaLasso(1/3) GenMiR++ Correlation CLL ALL AML
IC, IR,HSC
GPR160 miR-125b X X X X
FLT3 miR-148a X X X X
BAALC miR-148a X X X X
TCL1A miR-15a, miR-16 X X X
TCL1A miR-181b, miR-29b X X X
TCL1A miR-34b X X X
CD19 miR-29c X X X X
HLA-DPA1 miR-181a, miR-223 X X X
KIT miR-221, miR-222 X X X X X X
ZAP70 miR-155 X X X
ZAP70 miR-16 X X X
ZAP70 miR-181a X X X
PLK2 miR-126 X X X
ETS1 miR-155 X X X
HOXA9 miR-126 X X X
CCNA1 let-7b X X X X X
CLL: Chronic Lymphoblastic Leukaemia, ALL: Acute Lymphoblastic Leukaemia, AML: Acute Myeloid Leukaemia, IC: Immunce Cells, IR: Immune Response, HSC:Haematopoietic SC.The experimentally-validated targets included in the top 500 targets predicted were selected and their literature references included on TaRBase, miRecords andmiRWalk were analyzed in search of biological relevancy. In the table only those interactions with a literature reference related with LDS environment have beenincluded. This was made for the predictions of TaLasso, GenMiR++ and Pearson Correlation.doi:10.1371/journal.pone.0030766.t004
Quantification of miRNA-mRNA Interactions
PLoS ONE | www.plosone.org 8 February 2012 | Volume 7 | Issue 2 | e30766
between these miRNAs and the mRNAs will be poor. In the
contrary, TaLasso and GenMiR++ will assign high scores to both
miRNAs since the combination of their expressions explain that of
the mRNA.
TaLasso assumes that the only regulators of mRNA expression
are the miRNAs. This means that in case large numbers of
conditions are considered this assumption is less feasible and thus,
TaLasso will be unable to retrieve subtle miRNA-mRNA
interactions. Even though results for MCC (that include many
different conditions) show enrichment in experimentally validated
interactions; GenMiR++ and Pearson correlation are also able to
recover a significant number of validated interactions.
We compared two different selections of the penalty term: using
the same penalty (global selection) and different penalties (local
selection) for all the mRNAs. Best results were obtained using the
global selection. An intuitive explanation of this could be the
following, adjusting the l1-regularized least-squared problem for
each of the mRNAs, retrieves the most interesting miRNAs
regulators for each mRNA. On the contrary, a global regulari-
zation parameter makes the solutions obtained for each of the
mRNAs comparable between them. Intuitively, a general
regularization parameter makes TaLasso select the best interac-
tions from the whole set of putative interactions.
In conclusion, TaLasso solves an l1-regularized least-squared
convex problem with non-positive restrictions to score putative
targets by using the expression data of mRNAs and miRNAs.
TaLasso results for MCC and LDS datasets show that the
enrichment in experimentally validated targets is larger than using
other known methods. Furthermore, the targets and interactions
obtained by TaLasso are biologically more meaningful.
TaLasso is publicly available as Matlab or R programs. There is
also a web-based tool (http://talasso.cnb.csic.es/).
Just before the submission of this manuscript, we became
aware of a related works by Lu et al. [39] (‘‘A LASSO regression
model for the construction of microRNA target regulatory
networks’’). These authors consider the use of LASSO regres-
sion for deciphering miRNA-mRNA interactions by using
expression data, sequence based predictions, RISC availability
and miRNA co-regulation. The main difference between this
work and this manuscript is that they do not include non-
positivity constraints in their regularized least squares. Here we
have shown that the addition of non-positivity constraints is crucial
for miRNA-mRNA interaction search. We also provide a
convenient web-page to test our model making it more readily
available.
Supporting Information
Figure S1 Comparison of enrichment results on exper-imentally-validated targets with and without non-posi-tivity restrictions: MCC dataset. In the figure, the best
results obtained with TaLasso with (blue) and without (red) the
addition of non-positivity constraints, as well as the results of
GenMiR++ and Pearson Correlation are shown.
(TIF)
Figure S2 Comparison of enrichment results on exper-imentally-validated targets with and without non-posi-tivity restrictions: LDS dataset. In the figure, the best results
obtained with TaLasso with (blue) and without (red) the addition
of non-positivity constraints, as well as the results of GenMiR++and Pearson Correlation are shown.
(TIF)
Text S1 Comparison of the results for TaLasso usingglobal and local tuning parameters with non-positivityconstraints.(DOC)
Text S2 List of the genes enriched in KEGG pathwaysfor the LDS dataset.(DOC)
Text S3 Reference articles for the experimentally-validated targets on the top 500 interactions for MCCdataset.(DOC)
Text S4 Reference articles for the experimentally-validated targets on the top 500 interactions for LDSdataset.(DOC)
Text S5 Implementation guidelines for the softwareand the web-page for running TaLasso.(DOC)
Text S6 Statistical significance of the results obtainedby TaLasso.(DOC)
Author Contributions
Analyzed the data: AM AR. Contributed reagents/materials/analysis
tools: AR AP AL XLA XA AP FP. Wrote the paper: AR AM RNC MV.
Developed the software: AM MV RNC. Carried out the mathematical
aspects: AR AP.
References
1. Wienholds E, Plasterk RH (2005) MicroRNA function in animal development.
FEBS Lett 579(26): 5911–5922.
2. Guo H, Ingolia NT, Weissman JS, Bartel DP (2010) Mammalian microRNAs
predominantly act to decrease target mRNA levels. Nature 466(7308): 835–840.
3. Alvarez-Garcia I, Miska EA (2005) MicroRNA functions in animal development
and human disease. Development 132(21): 4653–4662.
4. Griffiths-Jones S, Saini HK, van Dongen S, Enright AJ (2008) miRBase: Tools
for microRNA genomics. Nucleic Acids Res 36(Database issue): D154–8.
5. Lewis BP, Burge CB, Bartel DP (2005) Conserved seed pairing, often flanked by
adenosines, indicates that thousands of human genes are microRNA targets. Cell
120(1): 15–20.
6. Grimson A, Farh KK, Johnston WK, Garrett-Engele P, Lim LP, et al. (2007)
MicroRNA targeting specificity in mammals: Determinants beyond seed pairing.
Mol Cell 27(1): 91–105.
7. Friedman RC, Farh KK, Burge CB, Bartel DP (2009) Most mammalian
mRNAs are conserved targets of microRNAs. Genome Res 19(1): 92–105.
8. Krek A, Grun D, Poy MN, Wolf R, Rosenberg L, et al. (2005) Combinatorial
microRNA target predictions. Nat Genet 37(5): 495–500.
9. Betel D, Wilson M, Gabow A, Marks DS, Sander C (2008) The microRNA.org
resource: Targets and expression. Nucleic Acids Res 36(Database issue):
D149–53.
10. Megraw M, Sethupathy P, Corda B, Hatzigeorgiou AG (2007) miRGen: A
database for the study of animal microRNA genomic organization and function.
Nucleic Acids Res 35(Database issue): D149–55.
11. Yue D, Liu H, Huang Y (2009) Survey of computational algorithms for
MicroRNA target prediction. Curr Genomics 10(7): 478–492.
12. Papadopoulos GL, Reczko M, Simossis VA, Sethupathy P, Hatzigeorgiou AG
(2009) The database of experimentally supported targets: A functional update of
TarBase. Nucleic Acids Res 37(Database issue): D155–8.
13. Huang JC, Babak T, Corson TW, Chua G, Khan S, et al. (2007) Using
expression profiling data to identify human microRNA targets. Nat Methods
4(12): 1045–1049.
14. Huang JC, Morris QD, Frey BJ (2007) Bayesian inference of MicroRNA targets
from sequence and expression data. J Comput Biol 14(5): 550–563.
15. Gennarino VA, Sardiello M, Avellino R, Meola N, Maselli V, et al. (2009)
MicroRNA target prediction by expression analysis of host genes. Genome Res
19(3): 481–490.
16. Sales G, Coppe A, Bisognin A, Biasiolo M, Bortoluzzi S, et al. (2010) MAGIA, a
web-based tool for miRNA and genes integrated analysis. Nucleic Acids Res 38
Suppl: W352–9.
17. Wang YP, Li KB (2009) Correlation of expression profiles between microRNAs
and mRNA targets using NCI-60 data. BMC Genomics 10: 218.
Quantification of miRNA-mRNA Interactions
PLoS ONE | www.plosone.org 9 February 2012 | Volume 7 | Issue 2 | e30766
18. Jayaswal V, Lutherborrow M, Ma DD, Hwa Yang Y (2009) Identification of
microRNAs with regulatory potential using a matched microRNA-mRNA time-
course data. Nucleic Acids Res 37(8): e60.
19. Ruike Y, Ichimura A, Tsuchiya S, Shimizu K, Kunimoto R, et al. (2008) Global
correlation analysis for micro-RNA and mRNA expression profiles in human
cell lines. J Hum Genet 53(6): 515–523.
20. Jayaswal V, Lutherborrow M, Ma DD, Yang YH (2011) Identification of
microRNA-mRNA modules using microarray data. BMC Genomics 12: 138.
21. Li X, Gill R, Cooper N, Yoo J, Datta S (2011) Modeling microRNA-mRNA
interactions using PLS regression in human colon cancer. BMC Med Genomics
4(44).
22. Saito T, Saetrom P (2010) MicroRNAs–targeting and target prediction.
N Biotechnol 27(3): 243–249.
23. Xiao F, Zuo Z, Cai G, Kang S, Gao X, et al. (2009) miRecords: An integrated
resource for microRNA-target interactions. Nucleic Acids Res 37(Database
issue): D105–10.
24. Shahi P, Loukianiouk S, Bohne-Lang A, Kenzelmann M, Kuffer S, et al. (2006)
Argonaute–a database for gene regulation by mammalian microRNAs. Nucleic
Acids Res 34(Database issue): D115–8.
25. Goeman JJ (2010) L1 penalized estimation in the cox proportional hazards
model. Biom J 52(1): 70–84.
26. Kim S.-J, Koh K, Lusting M, Boyd S, Gorinevsky D (2007) An interior-point
method for large-scale l1-regularized least squares. IEEE Journal on Selected
Topics in Signal Processing 1(4): 606–617.
27. Corrada H, Theussl S (2009) Rcplex: R interface to CPLEX.
28. Lu J, Getz G, Miska EA, Alvarez-Saavedra E, Lamb J, et al. (2005) MicroRNA
expression profiles classify human cancers. Nature 435(7043): 834–838.
29. Ramaswamy S, Tamayo P, Rifkin R, Mukherjee S, Yeang CH, et al. (2001)
Multiclass cancer diagnosis using tumor gene expression signatures. Proc Natl
Acad Sci U S A 98(26): 15149–15154.
30. Fulci V, Colombo T, Chiaretti S, Messina M, Citarella F, et al. (2009)
Characterization of B- and T-lineage acute lymphoblastic leukemia byintegrated analysis of MicroRNA and mRNA expression profiles. Genes
Chromosomes Cancer 48(12): 1069–1082.
31. Cover TM, Thomas JA (2006) Elements of information theory. New York:Wiley. pp 776.
32. Nogales-Cadenas R, Carmona-Saez P, Vazquez M, Vicente C, Yang X, et al.(2009) GeneCodis: Interpreting gene lists through enrichment analysis and
integration of diverse biological information. Nucleic Acids Res 37(Web Server
issue): W317–22.33. Carmona-Saez P, Chagoyen M, Tirado F, Carazo JM, Pascual-Montano A
(2007) GENECODIS: A web-based tool for finding significant concurrentannotations in gene lists. Genome Biol 8(1): R3.
34. Sarver AL, French AJ, Borralho PM, Thayanithy V, Oberg AL, et al. (2009)Human colon cancer profiles show differential microRNA expression depending
on mismatch repair status and are characteristic of undifferentiated proliferative
states. BMC Cancer 9: 401.35. Ren B, Yu G, Tseng GC, Cieply K, Gavel T, et al. (2006) MCM7 amplification
and overexpression are associated with prostate cancer progression. Oncogene25(7): 1090–1098.
36. Armstrong SA, Staunton JE, Silverman LB, Pieters R, den Boer ML, et al.
(2002) MLL translocations specify a distinct gene expression profile thatdistinguishes a unique leukemia. Nat Genet 30(1): 41–47.
37. Zhao H, Wang D, Du W, Gu D, Yang R (2010) MicroRNA and leukemia: Tinymolecule, great function. Crit Rev Oncol Hematol 74(3): 149–155.
38. Baldus CD, Martus P, Burmeister T, Schwartz S, Gokbuget N, et al. (2007) LowERG and BAALC expression identifies a new subgroup of adult acute T-
lymphoblastic leukemia with a highly favorable outcome. J Clin Oncol 25(24):
3739–3745.39. Lu Y, Zhou Y, Qu W, Deng M, Zhang C (2011) A lasso regression model for the
construction of microRNA-target regulatory networks. Bioinformatics.
Quantification of miRNA-mRNA Interactions
PLoS ONE | www.plosone.org 10 February 2012 | Volume 7 | Issue 2 | e30766