
mRNA transcript quantification in archival samples using multiplexed, color-coded probes
10
METHODOLOGY ARTICLE Open Access mRNA transcript quantification in archival samples using multiplexed, color-coded probes Patricia P Reis 1 , Levi Waldron 2 , Rashmi S Goswami 1,8 , Wei Xu 5 , Yali Xuan 1 , Bayardo Perez-Ordonez 6 , Patrick Gullane 7 , Jonathan Irish 7 , Igor Jurisica 2,3,4 and Suzanne Kamel-Reid 1,5,6,8* Abstract Background: A recently developed probe-based technology, the NanoString nCounter™ gene expression system, has been shown to allow accurate mRNA transcript quantification using low amounts of total RNA. We assessed the ability of this technology for mRNA expression quantification in archived formalin-fixed, paraffin-embedded (FFPE) oral carcinoma samples. Results: We measured the mRNA transcript abundance of 20 genes (COL3A1, COL4A1, COL5A1, COL5A2, CTHRC1, CXCL1, CXCL13, MMP1, P4HA2, PDPN, PLOD2, POSTN, SDHA, SERPINE1, SERPINE2, SERPINH1, THBS2, TNC, GAPDH, RPS18) in 38 samples (19 paired fresh-frozen and FFPE oral carcinoma tissues, archived from 1997-2008) by both NanoString and SYBR Green I fluorescent dye-based quantitative real-time PCR (RQ-PCR). We compared gene expression data obtained by NanoString vs. RQ-PCR in both fresh-frozen and FFPE samples. Fresh-frozen samples showed a good overall Pearson correlation of 0.78, and FFPE samples showed a lower overall correlation coefficient of 0.59, which is likely due to sample quality. We found a higher correlation coefficient between fresh-frozen and FFPE samples analyzed by NanoString (r = 0.90) compared to fresh-frozen and FFPE samples analyzed by RQ-PCR (r = 0.50). In addition, NanoString data showed a higher mean correlation (r = 0.94) between individual fresh-frozen and FFPE sample pairs compared to RQ-PCR (r = 0.53). Conclusions: Based on our results, we conclude that both technologies are useful for gene expression quantification in fresh-frozen or FFPE tissues; however, the probe-based NanoString method achieved superior gene expression quantification results when compared to RQ-PCR in archived FFPE samples. We believe that this newly developed technique is optimal for large-scale validation studies using total RNA isolated from archived, FFPE samples. Background A vast collection of formalin-fixed and paraffin- embedded (FFPE) tissue samples are currently archived in anatomical pathology laboratories and tissue banks around the world. These samples are an extremely valu- able source for molecular biology studies, since they have been annotated with varied information on disease states and patient follow-up, such as disease progression in cancer and prognosis/survival data. Although FFPE samples provide an ample source for genetic studies, formalin fixation is known to affect the quality of DNA and RNA extracted from FFPE samples and its downstream applications, such as amplification by the Polymerase Chain Reaction (PCR) or microarrays [1]. Von Ahlfen et al., 2007 [1] described the different fac- tors (e.g. fixation, storage time and conditions) that can influence the integrity of RNA extracted from FFPE tis- sues, and its downstream applications. They showed that differences in storage time and temperature had a large effect on the degree of RNA degradation. In their study, RNA samples extracted within 1 to 3 days after formalin fixation and paraffin embedding maintained their integrity. Similarly, RNA isolated from FFPE sam- ples that were stored at 4°C showed higher quality com- pared to samples stored at room temperature or at 37° C. They also reported that RNA fragmentation occurs gradually over time. It is also known that cDNA synth- esis from FFPE-derived RNA is limited due to the use of * Correspondence: [email protected] 1 Division of Applied Molecular Oncology, Princess Margaret Hospital, Ontario Cancer Institute, University Health Network, Toronto, ON, Canada Full list of author information is available at the end of the article Reis et al. BMC Biotechnology 2011, 11:46 http://www.biomedcentral.com/1472-6750/11/46 © 2011 Reis et al; licensee BioMed Central Ltd. This is an Open Access article distributed under the terms of the Creative Commons Attribution License (http://creativecommons.org/licenses/by/2.0), which permits unrestricted use, distribution, and reproduction in any medium, provided the original work is properly cited.
Transcript of mRNA transcript quantification in archival samples using multiplexed, color-coded probes

METHODOLOGY ARTICLE Open Access
mRNA transcript quantification in archivalsamples using multiplexed, color-coded probesPatricia P Reis1, Levi Waldron2, Rashmi S Goswami1,8, Wei Xu5, Yali Xuan1, Bayardo Perez-Ordonez6,Patrick Gullane7, Jonathan Irish7, Igor Jurisica2,3,4 and Suzanne Kamel-Reid1,5,6,8*
Abstract
Background: A recently developed probe-based technology, the NanoString nCounter™ gene expression system,has been shown to allow accurate mRNA transcript quantification using low amounts of total RNA. We assessedthe ability of this technology for mRNA expression quantification in archived formalin-fixed, paraffin-embedded(FFPE) oral carcinoma samples.
Results: We measured the mRNA transcript abundance of 20 genes (COL3A1, COL4A1, COL5A1, COL5A2, CTHRC1,CXCL1, CXCL13, MMP1, P4HA2, PDPN, PLOD2, POSTN, SDHA, SERPINE1, SERPINE2, SERPINH1, THBS2, TNC, GAPDH, RPS18)in 38 samples (19 paired fresh-frozen and FFPE oral carcinoma tissues, archived from 1997-2008) by bothNanoString and SYBR Green I fluorescent dye-based quantitative real-time PCR (RQ-PCR). We compared geneexpression data obtained by NanoString vs. RQ-PCR in both fresh-frozen and FFPE samples. Fresh-frozen samplesshowed a good overall Pearson correlation of 0.78, and FFPE samples showed a lower overall correlation coefficientof 0.59, which is likely due to sample quality. We found a higher correlation coefficient between fresh-frozen andFFPE samples analyzed by NanoString (r = 0.90) compared to fresh-frozen and FFPE samples analyzed by RQ-PCR(r = 0.50). In addition, NanoString data showed a higher mean correlation (r = 0.94) between individual fresh-frozenand FFPE sample pairs compared to RQ-PCR (r = 0.53).
Conclusions: Based on our results, we conclude that both technologies are useful for gene expressionquantification in fresh-frozen or FFPE tissues; however, the probe-based NanoString method achieved superiorgene expression quantification results when compared to RQ-PCR in archived FFPE samples. We believe that thisnewly developed technique is optimal for large-scale validation studies using total RNA isolated from archived,FFPE samples.
BackgroundA vast collection of formalin-fixed and paraffin-embedded (FFPE) tissue samples are currently archivedin anatomical pathology laboratories and tissue banksaround the world. These samples are an extremely valu-able source for molecular biology studies, since theyhave been annotated with varied information on diseasestates and patient follow-up, such as disease progressionin cancer and prognosis/survival data. Although FFPEsamples provide an ample source for genetic studies,formalin fixation is known to affect the quality of DNAand RNA extracted from FFPE samples and its
downstream applications, such as amplification by thePolymerase Chain Reaction (PCR) or microarrays [1].Von Ahlfen et al., 2007 [1] described the different fac-
tors (e.g. fixation, storage time and conditions) that caninfluence the integrity of RNA extracted from FFPE tis-sues, and its downstream applications. They showedthat differences in storage time and temperature had alarge effect on the degree of RNA degradation. In theirstudy, RNA samples extracted within 1 to 3 days afterformalin fixation and paraffin embedding maintainedtheir integrity. Similarly, RNA isolated from FFPE sam-ples that were stored at 4°C showed higher quality com-pared to samples stored at room temperature or at 37°C. They also reported that RNA fragmentation occursgradually over time. It is also known that cDNA synth-esis from FFPE-derived RNA is limited due to the use of
* Correspondence: [email protected] of Applied Molecular Oncology, Princess Margaret Hospital, OntarioCancer Institute, University Health Network, Toronto, ON, CanadaFull list of author information is available at the end of the article
Reis et al. BMC Biotechnology 2011, 11:46http://www.biomedcentral.com/1472-6750/11/46
© 2011 Reis et al; licensee BioMed Central Ltd. This is an Open Access article distributed under the terms of the Creative CommonsAttribution License (http://creativecommons.org/licenses/by/2.0), which permits unrestricted use, distribution, and reproduction inany medium, provided the original work is properly cited.

formaldehyde during fixation. Formaldehyde induceschemical modification of RNA, characterized by the for-mation of methylene crosslinks between nucleic acidsand protein. These chemical modifications can be par-tially irreversible [2], limiting the application of techni-ques such as reverse transcription, which uses mRNA asa template for cDNA synthesis. A fixation time over 24hours was shown to result in a higher number of irre-versible crosslinks [3,4]. Overall, fixation time andmethod of RNA extraction are the main factors thatdetermine the extent of methylene crosslinks [1].A recently developed probe-based technology, the
NanoString nCounter™ gene expression system, hasbeen shown to allow accurate mRNA expression quanti-fication using low amounts of total RNA [5]. This tech-nique is based on direct measurement of transcriptabundance, by using multiplexed, color-coded probepairs, and is able to detect as little as 0.5 fM of mRNAtranscripts; described in detail in Geiss et al., 2008 [5].In brief, unique pairs of a capture and a reporter probeare synthesized for each gene of interest, allowing ~800genes to be multiplexed, and their mRNA transcriptlevels measured, in a single experiment, for each sample.In addition, in a recent study, mRNA expression levelsobtained using NanoString were more sensitive thanmicroarrays and yielded similar sensitivity when com-pared to two quantitative real-time PCR techniques:TaqMan-based RQ-PCR and SYBR Green I fluorescentdye-based RQ-PCR [5]. Although NanoString and RQ-PCR were shown to produce comparable data in goodquality samples, NanoString is hybridization-based, anddoes not require reverse transcription of mRNA andsubsequent cDNA amplification. This feature of Nano-String technology offers advantages over PCR-basedmethods, including the absence of amplification bias,which may be higher when using fragmented RNA iso-lated from FFPE specimens. In addition, NanoStringassays do not require the use of control samples, sinceabsolute transcript abundance is determined for eachsingle sample and normalized against the expression ofhousekeeping genes in that same sample [5].Although NanoString technology has been optimized
for gene expression analysis using formalin-fixed sam-ples, to our knowledge we are the first to report the useof this technology for mRNA transcript quantificationusing clinical, archival, FFPE cancer tissues. In our pilotstudy, we used the NanoString nCounter™ assay forgene expression analysis of archival oral carcinoma sam-ples. In order to show that mRNA levels obtained byNanoString analysis of FFPE tissues were accurate, wecompared quantification data obtained using RNA iso-lated from paired fresh-frozen and FFPE oral cancer
samples. Our goal was to determine whether this tech-nology could be applied for accurate gene expressionquantification using archived, FFPE oral cancer tissues.We also aimed to compare whether quantification dataobtained by NanoString achieved a higher correlationthan data obtained by SYBR Green I fluorescent dye-based RQ-PCR, using the same paired fresh-frozen andFFPE samples.
MethodsTissue samplesThis study was performed under approval of theResearch Ethics Board at University Health Network. Tis-sues were collected with informed patient consent. Studysamples included primary fresh-frozen and formalin-fixed, paraffin-embedded (FFPE) tumor samples from 19patients with oral squamous cell carcinoma. All patientshad surgery as primary treatment. Fresh-frozen tissueswere collected at the time of surgical resection, and sam-ples were snap frozen and kept in liquid nitrogen untilRNA extraction. RNA from these tumor samples wasextracted and kept at -80C for long term storage. Repre-sentative FFPE tissue sections were obtained from thesame tumor samples. We collected a total of 38 tumorsamples (paired fresh-frozen and FFPE) from 19 patients.In addition, we included the analysis of a commerciallyavailable human universal RNA (pool of cancer cell lines)(Stratagene) and human normal tongue RNA (Strata-gene); these samples were used as quality controls, sincethey are a source of high quality RNA, and have beenpreviously used in other studies [6,7].
RNA extraction and cDNA synthesisTotal RNA was isolated from fresh-frozen tissues usingTrizol reagent (Life Technologies, Inc., Burlington, ON,Canada), followed by purification using the QiagenRNeasy kit and treatment with the DNase RNase-freeset (Qiagen, Valencia, CA, USA). RNA extraction andpurification steps were performed according to the man-ufacturers’ instructions.For FFPE tissues, one tissue section was taken from
each specimen, prior to RNA extraction, stained withhematoxylin and eosin (H&E) and examined by apathologist (B.P-O), to ensure that tissues contained>80% tumor cells. RNA was isolated from five 10 μmsections from FFPE samples, using the RecoverAll™Total Nucleic Acid Isolation Kit (Ambion, Austin, TX,USA), following the manufacturer’s procedures. RNAextracted from both fresh-frozen and FFPE tissues wasassessed for quantity using Nanodrop 1000 (Nanodrop),and for quality using the 2100 Bioanalyzer (AgilentTechnologies, Canada).
Reis et al. BMC Biotechnology 2011, 11:46http://www.biomedcentral.com/1472-6750/11/46
Page 2 of 10

For RQ-PCR experiments, cDNA was synthesizedfrom 1 μg total RNA isolated from fresh-frozen or FFPEtissues, using the M-MLV reverse transcriptase enzymeand according to manufacturer’s protocol (Invitrogen).
Gene expression quantification using multiplexed, color-coded probe pairs (NanoString nCounter™)Genes selected for testing in this technical report arefrequently over-expressed in oral cancer (our own data,currently submitted for publication elsewhere). Probesets for each gene were designed and synthesized byNanoString nCounter™ technologies (Table 1). Probesets of 100 bp in length were designed to hybridize spe-cifically to each mRNA target. Probes contained onecapture probe linked to biotin and one reporter probeattached to a color-coded molecular tag, according tothe nCounter™ code-set design.RNA samples were randomized using a numerical
ID, in order to blind samples for sample type (fresh-frozen or FFPE) and sample pairs. Samples were thensubjected to NanoString nCounter™ analysis by theUniversity Health Network Microarray Centre (http://www.microarrays.ca/) at the Medical Discovery District(MaRS), Toronto, ON, Canada. The detailed protocolfor mRNA transcript quantification analysis, includingsample preparation, hybridization, detection and scan-ning followed the manufacturer’s recommendations,and are available at http://www.nanostring.com/uploads/Manual_Gene_Expression_Assay.pdf/ underhttp://www.nanostring.com/applications/subpage.asp?id=343. We used 100 ng of total RNA isolated fromfresh-frozen tissues, as suggested by the manufacturer.FFPE tissues required a higher amount of total RNA(400 ng) for detection of probe signals. Technical repli-cates of three paired fresh-frozen and FFPE tissueswere included. Data were analyzed using the nCoun-ter™ digital analyzer software, available at http://www.nanostring.com/support/ncounter/.
Quantitative real-time RT-PCRIn addition, we performed RQ-PCR analysis in thesame fresh-frozen and FFPE samples and comparedthis to gene expression data determined by the Nano-String nCounter assay. RQ-PCR analysis was per-formed as previously described, using SYBR Green Ifluorescent dye [8,9]. Gene IDs and primer sequencesare described in Table 2. Primer sequences weredesigned using Primer-BLAST (http://www.ncbi.nlm.nih.gov/tools/primer-blast/). Gene expression levelswere normalized against the average Ct (cycle thresh-old) values for the two internal control genes (GAPDHand RPS18) and calculated relative to a commercially
available normal tongue reference RNA (Stratagene).Ct values were extracted using the SDS 2.3 software(Applied Biosystems). Data analysis was performedusing the ΔΔCt method [10].
Statistical analysisAbsolute mRNA quantification values obtained byNanoString as well as relative expression valuesobtained by RQ-PCR were log2-transformed. Summarystatistics as median, mean, range were provided. Pair-wise Pearson product-moment correlation analysis[11] was applied to test the correlation between geneexpression data obtained by NanoString and RQ-PCRanalysis in fresh-frozen vs. FFPE samples, as well asthe correlation between NanoString and RQ-PCR datain fresh-frozen or FFPE samples. Both overall correla-tion and correlation across sample pairs were calcu-lated. Statistical analyses were performed usingversion 9.2 of the SAS system and user’s guide (SASInstitute, Cary, NC). In addition, Pearson correlationbetween sample pairs was plotted as heatmaps, inorder to visualize the grouping of similar samples.Heatmaps were generated by hierarchical clusteringanalysis, using hclust R function, in R statistical envir-onment [12].
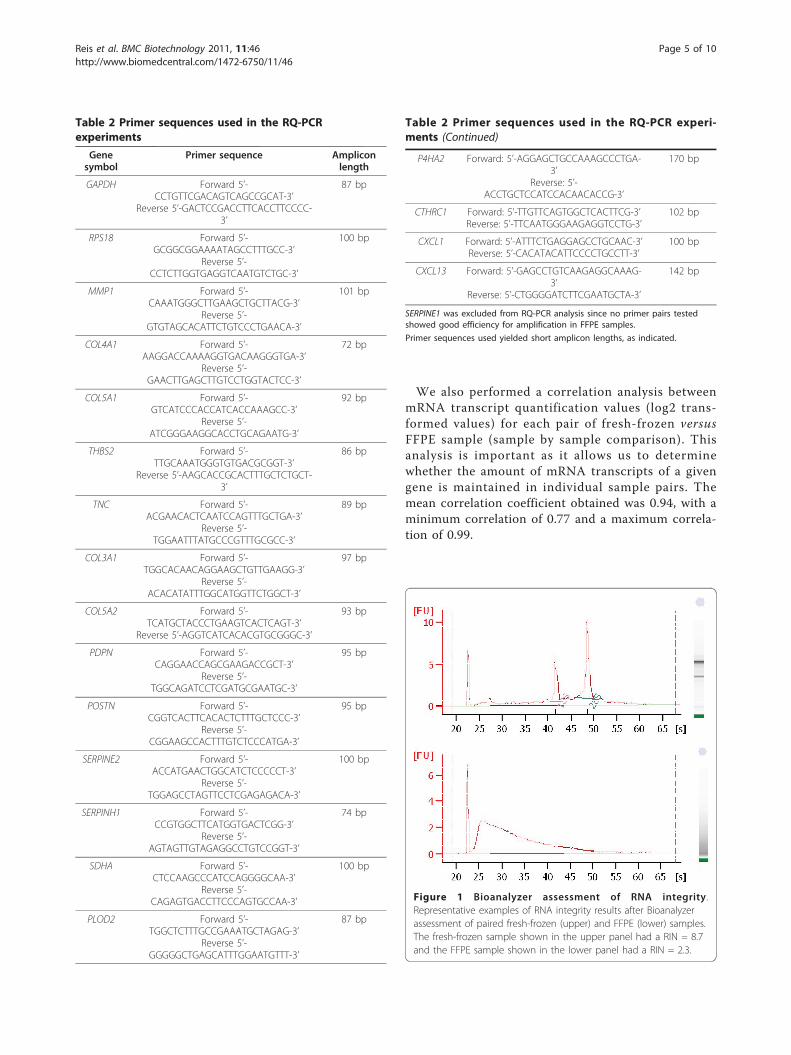
ResultsTechnical data on sample qualityBioanalyzer results for fresh-frozen samples showed amean RNA integrity number (RIN) of 8.3 (range 4.6-9.8), with the majority of fresh-frozen samples (13/19)having a RIN ≥8. FFPE samples were degraded and themean RIN was 2.3 (range 1.5-2.5); this result wasexpected since FFPE samples are archival tissues. Repre-sentative examples of the Bioanalyzer results for onefresh-frozen and one FFPE sample are shown in Figure1. FFPE samples used in our study have been archivedfrom a time period between 1997-2008.
Correlation between mRNA transcript quantification infresh-frozen vs. FFPE samples (NanoString)Raw data quantification values obtained by NanoStringwere log2 transformed, and values derived from the 19paired fresh-frozen and FFPE samples were compared.The pair-wise Pearson product-moment correlation was0.90 (p < 0.0001). The scatter plot and histogram forlog2 values from fresh-frozen and FFPE samples areshown in Figure 2A. Analysis of the three replicate pairs(log2 transformed values) demonstrated a correlation of0.93 (p < 0.0001). In addition, we performed unsuper-vised hierarchical clustering analysis of these data, andheatmaps are shown in Figure 2B.
Reis et al. BMC Biotechnology 2011, 11:46http://www.biomedcentral.com/1472-6750/11/46
Page 3 of 10

Table 1 Probe sets for genes of interest used for Nanostring analysis
Gene Symbol Accession Number Target Region Target Sequence
COL3A1 NM_000090.3 180-280 TTGGCACAACAGGAAGCTGTTGAAGGAGGATGTTCCCATCTTGGTCAGTCCTATGCGGATAGAGATGTCTGGAAGCCAGAACCATGCCAAATATGTGTCT
COL4A1 NM_001845.4 780-880 TGGGCTTAAGTTTTCAAGGACCAAAAGGTGACAAGGGTGACCAAGGGGTCAGTGGGCCTCCAGGAGTAbCCAGGACAAGCTCAAGTTCAAGAAAAAGGAGA
COL5A1 NM_000093.3 6345-6445 GTAAAGGTCATCCCACCATCACCAAAGCCTCCGTTTTTAACAACCTCCAACACGATCCATTTAGAGGCCAAATGTCATTCTGCAGGTGCCTTCCCGATGG
COL5A2 NM_000393.3 4075-4175 GGTTCATGCTACCCTGAAGTCACTCAGTAGTCAGATTGAAACCATGCGCAGCCCCGATGGCTCGAAAAAGCACCCAGCCCGCACGTGTGATGACCTAAAG
CTHRC1 NM_138455.2 685-785 CTGTGGAAGGACTTTGTGAAGGAATTGGTGCTGGATTAGTGGATGTTGCTATCTGGGTTGGCACTTGTTCAGATTACCCAAAAGGAGATGCTTCTACTGG
CXCL1 NM_001511.1 445-545 AGGCCCTGCCCTTATAGGAACAGAAGAGGAAAGAGAGACACAGCTGCAGAGGCCACCTGGATTGTGCCTAATGTGTTTGAGCATCGCTTAGGAGAAGTCT
CXCL13 NM_006419.2 0-100 GAGAAGATGTTTGAAAAAACTGACTCTGCTAATGAGCCTGGACTCAGAGCTCAAGTCTGAACTCTACCTCCAGACAGAATGAAGTTCATCTCGACATCTC
MMP1 NM_002421.3 1117-1217 AAATGGGCTTGAAGCTGCTTACGAATTTGCCGACAGAGATGAAGTCCGGTTTTTCAAAGGGAATAAGTACTGGGCTGTTCAGGGACAGAATGTGCTACAC
P4HA2 NM_001017974.1 1600-1700 TGTGCTTGTGGGCTGCAAGTGGGTCTCCAATAAGTGGTTCCATGAACGAGGACAGGAGTTCTTGAGACCTTGTGGATCAACAGAAGTTGACTGACATCCT
PDPN NM_006474.4 431-531 CTCCAGGAACCAGCGAAGACCGCTATAAGTCTGGCTTGACAACTCTGGTGGCAACAAGTGTCAACAGTGTAACAGGCATTCGCATCGAGGATCTGCCAAC
PLOD2 NM_182943.2 2590-2690 AAACATTGCACTTAATAACGTGGGAGAAGACTTTCAGGGAGGTGGTTGCAAATTTCTAAGGTACAATTGCTCTATTGAGTCACCACGAAAAGGCTGGAGC
POSTN NM_001135935.1 910-1010 AGAGACGGTCACTTCACACTCTTTGCTCCCACCAATGAGGCTTTTGAGAAACTTCCACGAGGTGTCCTAGAAAGGATCATGGGAGACAAAGTGGCTTCCG
SDHA NM_004168.1 230-330 TGGAGGGGCAGGCTTGCGAGCTGCATTTGGCCTTTCTGAGGCAGGGTTTAATACAGCATGTGTTACCAAGCTGTTTCCTACCAGGTCACACACTGTTGCA
SERPINE1 NM_000602.2 2470-2570 TGTGTTCAATAGATTTAGGAGCAGAAATGCAAGGGGCTGCATGACCTACCAGGACAGAACTTTCCCCAATTACAGGGTGACTCACAGCCGCATTGGTGAC
SERPINE2 NM_006216.2 240-340 CGCTGCCTTCCATCTGCTCCCACTTCAATCCTCTGTCTCTCGAGGAACTAGGCTCCAACACGGGGATCCAGGTTTTCAATCAGATTGTGAAGTCGAGGCC
SERPINH1 NM_001235.2 880-980 ATGGTGGACAACCGTGGCTTCATGGTGACTCGGTCCTATACCGTGGGTGTCATGATGATGCACCGGACAGGCCTCTACAACTACTACGACGACGAGAAGG
THBS2 NM_003247.2 4460-4560 AAACATCCTTGCAAATGGGTGTGACGCGGTTCCAGATGTGGATTTGGCAAAACCTCATTTAAGTAAAAGGTTAGCAGAGCAAAGTGCGGTGCTTTAGCTG
TNC NM_002160.1 6885-6985 CAGAAATCTTGAAGGCAGGCGCAAACGGGCATAAATTGGAGGGACCACTGGGTGAGAGAGGAATAAGGCGGCCCAGAGCGAGGAAAGGATTTTACCAAAG
GAPDH NM_002046.3 35-135 TCCTCCTGTTCGACAGTCAGCCGCATCTTCTTTTGCGTCGCCAGCCGAGCCACATCGCTCAGACACCATGGGGAAGGTGAAGGTCGGAGTCAACGGATTT
RPS18 NM_022551.2 110-210 GCGGCGGAAAATAGCCTTTGCCATCACTGCCATTAAGGGTGTGGGCCGAAGATATGCTCATGTGGTGTTGAGGAAAGCAGACATTGACCTCACCAAGAGG
GAPDH and RPS18 were used as internal controls for normalization of Nanostring data.
Reiset
al.BMCBiotechnology
2011,11:46http://w
ww.biom
edcentral.com/1472-6750/11/46
Page4of
10
We also performed a correlation analysis betweenmRNA transcript quantification values (log2 trans-formed values) for each pair of fresh-frozen versusFFPE sample (sample by sample comparison). Thisanalysis is important as it allows us to determinewhether the amount of mRNA transcripts of a givengene is maintained in individual sample pairs. Themean correlation coefficient obtained was 0.94, with aminimum correlation of 0.77 and a maximum correla-tion of 0.99.
Table 2 Primer sequences used in the RQ-PCRexperiments
Genesymbol
Primer sequence Ampliconlength
GAPDH Forward 5’-CCTGTTCGACAGTCAGCCGCAT-3’
Reverse 5’-GACTCCGACCTTCACCTTCCCC-3’
87 bp
RPS18 Forward 5’-GCGGCGGAAAATAGCCTTTGCC-3’
Reverse 5’-CCTCTTGGTGAGGTCAATGTCTGC-3’
100 bp
MMP1 Forward 5’-CAAATGGGCTTGAAGCTGCTTACG-3’
Reverse 5’-GTGTAGCACATTCTGTCCCTGAACA-3’
101 bp
COL4A1 Forward 5’-AAGGACCAAAAGGTGACAAGGGTGA-3’
Reverse 5’-GAACTTGAGCTTGTCCTGGTACTCC-3’
72 bp
COL5A1 Forward 5’-GTCATCCCACCATCACCAAAGCC-3’
Reverse 5’-ATCGGGAAGGCACCTGCAGAATG-3’
92 bp
THBS2 Forward 5’-TTGCAAATGGGTGTGACGCGGT-3’
Reverse 5’-AAGCACCGCACTTTGCTCTGCT-3’
86 bp
TNC Forward 5’-ACGAACACTCAATCCAGTTTGCTGA-3’
Reverse 5’-TGGAATTTATGCCCGTTTGCGCC-3’
89 bp
COL3A1 Forward 5’-TGGCACAACAGGAAGCTGTTGAAGG-3’
Reverse 5’-ACACATATTTGGCATGGTTCTGGCT-3’
97 bp
COL5A2 Forward 5’-TCATGCTACCCTGAAGTCACTCAGT-3’
Reverse 5’-AGGTCATCACACGTGCGGGC-3’
93 bp
PDPN Forward 5’-CAGGAACCAGCGAAGACCGCT-3’
Reverse 5’-TGGCAGATCCTCGATGCGAATGC-3’
95 bp
POSTN Forward 5’-CGGTCACTTCACACTCTTTGCTCCC-3’
Reverse 5’-CGGAAGCCACTTTGTCTCCCATGA-3’
95 bp
SERPINE2 Forward 5’-ACCATGAACTGGCATCTCCCCCT-3’
Reverse 5’-TGGAGCCTAGTTCCTCGAGAGACA-3’
100 bp
SERPINH1 Forward 5’-CCGTGGCTTCATGGTGACTCGG-3’
Reverse 5’-AGTAGTTGTAGAGGCCTGTCCGGT-3’
74 bp
SDHA Forward 5’-CTCCAAGCCCATCCAGGGGCAA-3’
Reverse 5’-CAGAGTGACCTTCCCAGTGCCAA-3’
100 bp
PLOD2 Forward 5’-TGGCTCTTTGCCGAAATGCTAGAG-3’
Reverse 5’-GGGGGCTGAGCATTTGGAATGTTT-3’
87 bp
Table 2 Primer sequences used in the RQ-PCR experi-ments (Continued)
P4HA2 Forward: 5’-AGGAGCTGCCAAAGCCCTGA-3’
Reverse: 5’-ACCTGCTCCATCCACAACACCG-3’
170 bp
CTHRC1 Forward: 5’-TTGTTCAGTGGCTCACTTCG-3’Reverse: 5’-TTCAATGGGAAGAGGTCCTG-3’
102 bp
CXCL1 Forward: 5’-ATTTCTGAGGAGCCTGCAAC-3’Reverse: 5’-CACATACATTCCCCTGCCTT-3’
100 bp
CXCL13 Forward: 5’-GAGCCTGTCAAGAGGCAAAG-3’
Reverse: 5’-CTGGGGATCTTCGAATGCTA-3’
142 bp
SERPINE1 was excluded from RQ-PCR analysis since no primer pairs testedshowed good efficiency for amplification in FFPE samples.
Primer sequences used yielded short amplicon lengths, as indicated.
Figure 1 Bioanalyzer assessment of RNA integrity.Representative examples of RNA integrity results after Bioanalyzerassessment of paired fresh-frozen (upper) and FFPE (lower) samples.The fresh-frozen sample shown in the upper panel had a RIN = 8.7and the FFPE sample shown in the lower panel had a RIN = 2.3.
Reis et al. BMC Biotechnology 2011, 11:46http://www.biomedcentral.com/1472-6750/11/46
Page 5 of 10

Figure 2 Correlation of results obtained from Nanostring analysis of paired fresh-frozen and FFPE tissues. Scatter plot matrix (left panel,A) for the normalized mRNA transcript quantification values obtained by Nanostring analysis of 19 fresh-frozen vs. FFPE sample pairs (n = 38samples). In this analysis, the pair-wise Pearson product-moment correlation coefficient was 0.90 (p < 0.0001). The right panel (B) shows aheatmap analysis for the Pearson correlation of absolute mRNA transcript abundance as determined by Nanostring, for all pair-wisecombinations of samples. These results show a good-high correlation between absolute mRNA transcript quantification data in fresh-frozen vs.FFPE tissues using Nanostring analysis. Fresh-frozen and FFPE tissues are interspersed, and all technical replicates are adjacent in all cases. Geneexpression patterns are highly consistent among the large majority of samples.
Reis et al. BMC Biotechnology 2011, 11:46http://www.biomedcentral.com/1472-6750/11/46
Page 6 of 10

Figure 3 Correlation of results obtained from RQ-PCR analysis of paired fresh-frozen and FFPE tissues. Scatter plot matrix (left panel, A)showing normalized gene expression data obtained by RQ-PCR analysis of the 19 fresh-frozen vs. FFPE sample pairs (n = 38 samples). The pair-wise Pearson product-moment correlation coefficient was 0.50 (p < 0.0001). The right panel (B) shows a heatmap analysis for the Pearsoncorrelation of gene expression abundance as determined by RQ-PCR, for all pair-wise combinations of samples. A low-moderate correlation isobserved between mRNA transcript quantification data in fresh-frozen vs. FFPE tissues, and tissues tend to cluster according to storage method.
Reis et al. BMC Biotechnology 2011, 11:46http://www.biomedcentral.com/1472-6750/11/46
Page 7 of 10

Correlation between gene expression levels in fresh-frozen vs. FFPE samples (RQ-PCR)We also compared gene expression levels determined byRQ-PCR analysis in fresh-frozen versus FFPE samples. Theoverall pair-wise Pearson product-moment correlationcoefficient was 0.53 (p < 0.0001) (Figure 3A). Heatmapanalysis of these data is shown in Figure 3B. A sample-by-sample (fresh-frozen/FFPE sample pair) correlation analysisof RQ-PCR data revealed a mean correlation of 0.54, vary-ing between 0.12 and 0.99, with the majority of samplepairs (12/19) showing a correlation ≥0.50.
Comparison of mRNA quantification data usingNanoString versus RQ-PCRSince all RNA samples isolated from FFPE tissues weredegraded, as confirmed by Bioanalyzer analysis, weexpected that a probe-based assay would generate moreaccurate gene expression quantification data comparedto amplification-based assays, such as RQ-PCR.For each sample type (fresh-frozen or FFPE), we com-
pared mRNA transcript quantification as determined byNanoString analysis and gene expression levels as deter-mined by RQ-PCR. For fresh-frozen tissues, this comparisonanalysis showed that the overall pair-wise Pearson product-moment correlation coefficient was 0.78 (p < 0.0001). Figure4A shows the scatter plot for the Log(NanoString) vs. Log(QPCR) and their histogram in fresh-frozen tissues. Thissame analysis in FFPE samples showed a lower overall corre-lation coefficient of 0.59 (p < 0.0001); 11/19 FFPE samplepairs showed a correlation ≥0.60. Figure 4B shows the scat-ter plot for the Log(NanoString) vs. Log(QPCR) and theirhistogram in FFPE tissues. Unsupervised hierarchical clus-tering analysis of these data was performed and correspond-ing heatmaps are shown in Figure 4C and 4D.
DiscussionIn this pilot study, we showed that NanoString technol-ogy is suitable for accurately detecting and measuringmRNA transcript levels in clinical, archival, FFPE oralcarcinoma samples. Our results demonstrated that thisprobe-based assay (NanoString) achieved a good overallPearson correlation when we compared mRNA transcriptquantification results between paired fresh-frozen andFFPE samples. In addition, correlation coefficients weredetermined in a sample-by-sample comparison, andresults showed that mRNA levels in single sample pairs(fresh-frozen and FFPE) were maintained across the sam-ple pairs when using NanoString technology. When wecompared gene expression levels obtained by RQ-PCR,we obtained a lower overall correlation coefficientbetween fresh-frozen and FFPE tissues, and across sam-ple pairs. These results suggest that mRNA transcriptlevels are more concordant between fresh-frozen andFFPE sample pairs when using NanoString technology.
A recently published study [13] evaluated the perfor-mance of quantitative real-time PCR using TaqManassays (TaqMan Low Density Arrays platform), for geneexpression analysis using paired fresh-frozen and FFPEbreast cancer samples. The investigators found a goodoverall correlation coefficient of 0.81 between fresh-fro-zen and FFPE samples; however, when they comparedindividual sample pairs, they found a low correlation of0.33, with variability of 0.005-0.81. These authors sug-gested that the extensive RNA sample degradation inFFPE samples is likely the cause for the low correlationcoefficients observed across sample pairs [13]. Indeed,Bioanalyzer results for our samples showed that fresh-frozen tissues had a good quality RIN and were suitablefor gene expression analysis, while FFPE tissues weredegraded and had a low RNA integrity number. ThisRNA degradation in FFPE samples also resulted inhigher Ct values initially detectable by RQ-PCR, withloss of amplifiable templates. The low RIN characteristicof FFPE samples did not seem to have an effect on theefficiency of NanoString results, however, when we com-pared quantification values obtained using RNA isolatedfrom fresh-frozen vs. FFPE tissues.Although quantitative PCR-based assays have been
used for gene expression analysis in FFPE samples[13-15], these assays do carry some disadvantages, suchas the need for optimization strategies aimed at redu-cing amplification bias and increasing the number ofdetectable amplicons when using RNA extracted fromFFPE samples. To date, some of the recommended stra-tegies include optimization of the RNA extractionmethod and designing primers able to detect shortamplicons [16]. In our study, primers for RQ-PCRexperiments yielded amplicon lengths between 72-170bp (as detailed in Table 2). Only 2/19 primer pairs yieldamplicons >110 bp in size. Such short amplicons arewell-suited for PCR amplification using FFPE samples.Our results showed that, although we did obtain geneexpression data using RQ-PCR in our FFPE samples,both the overall and the sample-by-sample correlationbetween fresh-frozen and FFPE samples was notablylower for RQ-PCR data than for data obtained usingNanoString. This suggests that this newly developedtechnology, NanoString nCounter™, offers advantagesover RQ-PCR for gene expression analysis in archivalFFPE samples.
ConclusionsWe found that the multiplexed, color-coded probe-based method (NanoString nCounter™) achieved super-ior gene expression quantification results when com-pared to RQ-PCR, when using total RNA extracted fromclinical, archival, FFPE samples. Such technology couldthus be very useful for applications requiring the use of
Reis et al. BMC Biotechnology 2011, 11:46http://www.biomedcentral.com/1472-6750/11/46
Page 8 of 10

Figure 4 Correlation between data obtained from Nanostring and RQ-PCR analysis on fresh-frozen and FFPE tissues. Scatter-plotmatrices examining the correlation between Nanostring and RQ-PCR data in fresh-frozen (A) and FFPE (B) samples. Scatter plot matrices shownormalized quantification values. The pair-wise Pearson product-moment correlation coefficient for Nanostring vs. RQ-PCR data in fresh-frozensamples was r = 0.78 (p < 0.0001); this same analysis revealed a lower correlation coefficient in FFPE samples (r = 0.59) (p < 0.0001). Acorresponding heatmap for the Pearson correlation of gene expression abundance in fresh-frozen (FF) and FFPE samples using Nanostring vs.RQ-PCR is shown to the right of each scatter plot (C and D respectively). These results show a good correlation between Nanostring and RQ-PCRin fresh-frozen samples, and a lower correlation between data obtained using these two different technologies, when using clinical, archival,FFPE tissues.
Reis et al. BMC Biotechnology 2011, 11:46http://www.biomedcentral.com/1472-6750/11/46
Page 9 of 10

clinical archival material, such as large scale validationof gene expression data generated by microarrays forgeneration of tissue specific gene expression signatures.
List of abbreviationsCt: cycle threshold; FFPE: formalin fixed, paraffin embedded; H&E:hematoxylin and eosin; M-MLV RT enzyme: Moloney Murine Leukemia Virusreverse transcriptase enzyme; PCR: polymerase chain reaction; RIN: RNAintegrity number; RQ-PCR: Quantitative real-time PCR; SAS: Statistical analysissystem; SDS: Sequence Detection System;
AcknowledgementsRSG is a Research Fellow of The Terry Fox Foundation through an awardfrom the Canadian Cancer Society Research Institute; received fundingthrough a grant from the Canadian Institute of Health Research (ReferenceNo. STP-53912), and through a University of Toronto Fellowship. This studywas performed with funds from the Ontario Institute for Cancer Research(OICR).
Author details1Division of Applied Molecular Oncology, Princess Margaret Hospital, OntarioCancer Institute, University Health Network, Toronto, ON, Canada. 2Dept. ofComputer Science, University of Toronto, Toronto, ON, Canada. 3OntarioCancer Institute and the Campbell Family Institute for Cancer Research,Toronto, ON, Canada. 4Dept. of Medical Biophysics, University of Toronto,Toronto, ON, Canada. 5Dept. of Biostatistics, Princess Margaret Hospital,Ontario Cancer Institute, University Health Network, Toronto, ON, Canada.6Dept. of Pathology, Toronto General Hospital, Ontario Cancer Institute,Toronto, ON, Canada. 7Dept. of Otolaryngology/Surgical Oncology, PrincessMargaret Hospital, Ontario Cancer Institute, University Health Network,Toronto, ON, Canada. 8Dept. of Laboratory Medicine and Pathobiology,University of Toronto, Toronto, ON, Canada.
Authors’ contributionsPPR, RSG and SKR designed the study. LW and WX performed statistical dataanalyses. PPR wrote the manuscript. PPR and RSG performed datainterpretation. YX performed quantitative PCR assays. RSG, LW, WX, IJ andSKR edited the manuscript. BPO performed histopathological analyses andevaluated all samples. PG and JI provided samples and reviewed themanuscript. All authors read and approved the final manuscript.
Received: 17 January 2011 Accepted: 9 May 2011 Published: 9 May 2011
References1. von Ahlfen S, Missel A, Bendrat K, Schlumpberger M: Determinants of RNA
quality from FFPE samples. PLoS One 2007, 2(12):e1261.2. Masuda N, Ohnishi T, Kawamoto S, Monden M, Okubo K: Analysis of
chemical modification of RNA from formalin-fixed samples andoptimization of molecular biology applications for such samples. NucleicAcids Res 1999, 27(22):4436-4443.
3. Bresters D, Schipper ME, Reesink HW, Boeser-Nunnink BD, Cuypers HT: Theduration of fixation influences the yield of HCV cDNA-PCR productsfrom formalin-fixed, paraffin-embedded liver tissue. J Virol Methods 1994,48(2-3):267-272.
4. Macabeo-Ong M, Ginzinger DG, Dekker N, McMillan A, Regezi JA, Wong DT,Jordan RC: Effect of duration of fixation on quantitative reversetranscription polymerase chain reaction analyses. Mod Pathol 2002,15(9):979-987.
5. Geiss GK, Bumgarner RE, Birditt B, Dahl T, Dowidar N, Dunaway DL, Fell HP,Ferree S, George RD, Grogan T, et al: Direct multiplexed measurement ofgene expression with color-coded probe pairs. Nat Biotechnol 2008,26(3):317-325.
6. Reis PP, Bharadwaj RR, Machado J, Macmillan C, Pintilie M, Sukhai MA,Perez-Ordonez B, Gullane P, Irish J, Kamel-Reid S: Claudin 1 overexpressionincreases invasion and is associated with aggressive histological featuresin oral squamous cell carcinoma. Cancer 2008, 113(11):3169-3180.
7. Cervigne NK, Reis PP, Machado J, Sadikovic B, Bradley G, Galloni NN,Pintilie M, Jurisica I, Perez-Ordonez B, Gilbert R, et al: Identification of a
microRNA signature associated with progression of leukoplakia to oralcarcinoma. Hum Mol Genet 2009, 18(24):4818-4829.
8. Dos Reis PP, Bharadwaj RR, Machado J, Macmillan C, Pintilie M, Sukhai MA,Perez-Ordonez B, Gullane P, Irish J, Kamel-Reid S: Claudin 1 overexpressionincreases invasion and is associated with aggressive histological featuresin oral squamous cell carcinoma. Cancer 2008, 113(11):3169-3180.
9. Reis PP, Tomenson M, Cervigne NK, Machado J, Jurisica I, Pintilie M,Sukhai MA, Perez-Ordonez B, Grenman R, Gilbert RW, et al: Programmedcell death 4 loss increases tumor cell invasion and is regulated by miR-21 in oral squamous cell carcinoma. Mol Cancer 2010, 9:238.
10. Livak KJ, Schmittgen TD: Analysis of relative gene expression data usingreal-time quantitative PCR and the 2(-Delta Delta C(T)) Method. Methods2001, 25(4):402-408.
11. Rodgers JL, Nicewander WA: Thirteen ways to look at the correlationcoefficient. The American Statistician 1988, 42(1):59-66.
12. R Development Core Team: R: A Language and Environment forStatistical Computing. Vienna, Austria; 2008.
13. Sanchez-Navarro I, Gamez-Pozo A, Gonzalez-Baron M, Pinto-Marin A,Hardisson D, Lopez R, Madero R, Cejas P, Mendiola M, Espinosa E, et al:Comparison of gene expression profiling by reverse transcriptionquantitative PCR between fresh frozen and formalin-fixed, paraffin-embedded breast cancer tissues. Biotechniques 2010, 48(5):389-397.
14. Cronin M, Pho M, Dutta D, Stephans JC, Shak S, Kiefer MC, Esteban JM,Baker JB: Measurement of gene expression in archival paraffin-embedded tissues: development and performance of a 92-gene reversetranscriptase-polymerase chain reaction assay. Am J Pathol 2004,164(1):35-42.
15. Paik S, Shak S, Tang G, Kim C, Baker J, Cronin M, Baehner FL, Walker MG,Watson D, Park T, et al: A multigene assay to predict recurrence oftamoxifen-treated, node-negative breast cancer. N Engl J Med 2004,351(27):2817-2826.
16. Antonov J, Goldstein DR, Oberli A, Baltzer A, Pirotta M, Fleischmann A,Altermatt HJ, Jaggi R: Reliable gene expression measurements fromdegraded RNA by quantitative real-time PCR depend on shortamplicons and a proper normalization. Lab Invest 2005, 85(8):1040-1050.
doi:10.1186/1472-6750-11-46Cite this article as: Reis et al.: mRNA transcript quantification in archivalsamples using multiplexed, color-coded probes. BMC Biotechnology 201111:46.
Submit your next manuscript to BioMed Centraland take full advantage of:
• Convenient online submission
• Thorough peer review
• No space constraints or color figure charges
• Immediate publication on acceptance
• Inclusion in PubMed, CAS, Scopus and Google Scholar
• Research which is freely available for redistribution
Submit your manuscript at www.biomedcentral.com/submit
Reis et al. BMC Biotechnology 2011, 11:46http://www.biomedcentral.com/1472-6750/11/46
Page 10 of 10