
Robust watermarking techniques for scalable coded image ...
223
Access to Electronic Thesis Author: Deepayan Bhowmik Thesis title: Robust watermarking techniques for scalable coded image and video Qualification: PhD This electronic thesis is protected by the Copyright, Designs and Patents Act 1988. No reproduction is permitted without consent of the author. It is also protected by the Creative Commons Licence allowing Attributions-Non-commercial-No derivatives. If this electronic thesis has been edited by the author it will be indicated as such on the title page and in the text.
-
Upload
khangminh22 -
Category
Documents
-
view
2 -
download
0
Transcript of Robust watermarking techniques for scalable coded image ...

Access to Electronic Thesis
Author: Deepayan Bhowmik
Thesis title: Robust watermarking techniques for scalable coded image and video
Qualification: PhD
This electronic thesis is protected by the Copyright, Designs and Patents Act 1988. No reproduction is permitted without consent of the author. It is also protected by the Creative Commons Licence allowing Attributions-Non-commercial-No derivatives. If this electronic thesis has been edited by the author it will be indicated as such on the title page and in the text.
ROBUST WATERMARKING
TECHNIQUES FOR SCALABLE
CODED IMAGE AND VIDEO
submitted by
Deepayan Bhowmik
for the degree of
Doctor of Philosophy
of the
Department of Electronic and Electrical Engineering
The University of Sheffield
December, 2010
COPYRIGHT
Attention is drawn to the fact that copyright of this thesis rests with its author. This
copy of the thesis has been supplied on the condition that anyone who consults it is
understood to recognise that its copyright rests with its author and that no quotation
from the thesis and no information derived from it may be published without the
prior written consent of the author.
This thesis may be made available for consultation within the University Library and
may be photocopied or lent to other libraries for the purposes of consultation.
Signature of Author . . . . . . . . . . . . . . . . . . . . . . . . . . . . . . . . . . . . . . . . . . . . . . . . . . . . . . . . . . . . . . . . .
Deepayan Bhowmik

ABSTRACT
In scalable image/video coding, high resolution content is encoded to the highest visual
quality and the bit-streams are adapted to cater various communication channels, dis-
play devices and usage requirements. These content adaptations, which include quality,
resolution and frame rate scaling may also affect the content protection data, such as,
watermarks and are considered as a potential watermark attack. In this thesis, research
on robust watermarking techniques for scalable coded image and video, are proposed
and the improvements in robustness against various content adaptation attacks, such
as, JPEG 2000 for image and Motion JPEG 2000, MC-EZBC and H.264/SVC for
video, are reported. The spread spectrum domain, particularly wavelet-based image
watermarking schemes often provides better robustness to compression attacks due
to its multi-resolution decomposition and hence chosen for this work. A comprehen-
sive and comparative analysis of the available wavelet-based watermarking schemes,
is performed by developing a new modular framework, Watermark Evaluation Bench
for Content Adaptation Modes (WEBCAM). This analysis is used to derive a water-
mark embedding distortion model, that establishes a directly proportional relationship
between the sum of energy of the selected wavelet coefficients and the distortion per-
formance, i.e., mean square error (MSE) in spatial domain. On the other hand, the
improvements on robustness is achieved by modeling the bit plane discarding, which
analyzes the effect of the quantization and de-quantization within the image coder and
ranks the wavelet coefficients and other parameters according to their ability to retain
the watermark data intact under quality scalable coding-based content adaptation. The
work, then, extends these image watermarking models in video watermarking. But a
direct extension of the image watermarking methods into frame by frame video wa-
termarking without considering motion, results in flicker and other motion mismatch
artifacts in the watermarked video. Motion compensated temporal filtering (MCTF)
provides a good framework for accounting the motion. A generalized MCTF-based
spatio-temporal decomposition domain (2D+t+2D) video watermarking framework is
developed to address such issues. Improvements on imperceptibility and robustness are
achieved by embedding the watermark in 2D+t compared to traditional t+2D MCTF
based watermarking schemes. Finally, the research outcomes, discussed above, are
combined to propose a novel concept of scalable watermarking scheme, that generates
a distortion constrained robustness scalable watermarked media code stream which can
be truncated at various points to generate the watermarked image or video with the
desired distortion-robustness requirements.
i

Dedicated to my parents.
ii
ACKNOWLEDGEMENTS
I am grateful to my parents to motivate and encourage me for this long and endur-
ing journey, called PhD. I take this opportunity to express my sincere gratitude to
Dr. Charith Abhayaratne for guiding and sailing me through the entire process. I feel
fortunate to have him as my supervisor who helped me to learn not only the tech-
nical aspects but also the integrity of this degree. I wish to thank UK Engineering
and Physical Sciences Research Council (EPSRC) for funding this work through an
EPSRC-BP Dorothy Hodgkin Postgraduate Award (DHPA). I am specially thankful
to Dr. Sanchita Bandyopadhyay, Dr. Subrata B. Ghosh, Ms. Ritu Sengupta, Mr. Sub-
rato Chatterjee and Dr. Bala Amavasai for their encouragement and support. Finally,
I like to thank Mr. James Screaton for the technical support, Mr. Mathew Oakes
for helping me in proof reading, my colleagues in Visual and Information Engineering
(VIE) lab and the last but not least, my friends in Sheffield.
iii

iv
Contents
List of Figures xiii
List of Tables xxiv
List of Symbols and Acronyms xxvii
Statement of Originality xxvii
1 Introduction 1
1.1 Scalable coded image watermarking . . . . . . . . . . . . . . . . . . . . 2
1.2 Scalable coded video watermarking . . . . . . . . . . . . . . . . . . . . . 3
1.3 Scalable watermarking for image and video . . . . . . . . . . . . . . . . 4
1.4 Thesis organization . . . . . . . . . . . . . . . . . . . . . . . . . . . . . . 4
1.5 Publications and software releases . . . . . . . . . . . . . . . . . . . . . 6
2 Background Overview 9
2.1 Scalable coding-based content adaptation . . . . . . . . . . . . . . . . . 9
2.1.1 Scalable coding modules . . . . . . . . . . . . . . . . . . . . . . . 9
v
2.1.2 Scalable coding technique . . . . . . . . . . . . . . . . . . . . . . 11
2.2 Digital watermarking . . . . . . . . . . . . . . . . . . . . . . . . . . . . . 13
2.2.1 Definition, properties, applications and attacks . . . . . . . . . . 13
2.2.2 Watermarking process . . . . . . . . . . . . . . . . . . . . . . . . 17
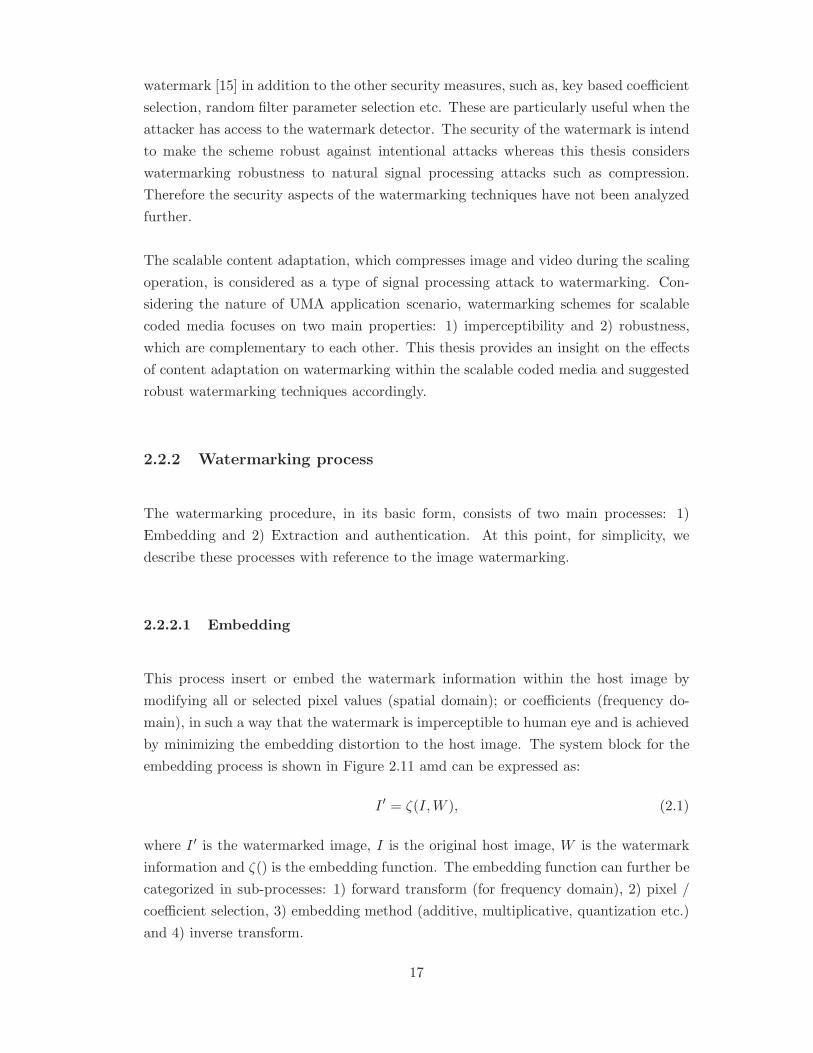
2.2.2.1 Embedding . . . . . . . . . . . . . . . . . . . . . . . . . 17
2.2.2.2 Extraction and authentication . . . . . . . . . . . . . . 19
2.2.3 Wavelet-based watermarking . . . . . . . . . . . . . . . . . . . . 20
2.2.4 Wavelet transform . . . . . . . . . . . . . . . . . . . . . . . . . . 21
2.2.4.1 Filter bank approach . . . . . . . . . . . . . . . . . . . 21
2.2.4.2 Lifting based approach . . . . . . . . . . . . . . . . . . 22
2.2.5 2D wavelet . . . . . . . . . . . . . . . . . . . . . . . . . . . . . . 23
2.2.6 Motion compensated temporal filtering . . . . . . . . . . . . . . . 24
2.3 Conlcusions . . . . . . . . . . . . . . . . . . . . . . . . . . . . . . . . . . 24
3 State-of-the-art 25
3.1 Image watermarking . . . . . . . . . . . . . . . . . . . . . . . . . . . . . 25
3.1.1 Wavelet-based image watermarking . . . . . . . . . . . . . . . . . 25
3.1.1.1 Uncompressed domain watermarking algorithms . . . . 26
3.1.1.2 Joint compression-watermarking algorithms . . . . . . . 26
3.1.2 Dissection of wavelet-based image watermarking algorithms . . . 27
3.1.2.1 Wavelet kernel . . . . . . . . . . . . . . . . . . . . . . . 27
vi
3.1.2.2 Subband . . . . . . . . . . . . . . . . . . . . . . . . . . 28
3.1.2.3 Hosting coefficient . . . . . . . . . . . . . . . . . . . . . 28
3.1.2.4 Embedding method . . . . . . . . . . . . . . . . . . . . 28
3.2 Video watermarking . . . . . . . . . . . . . . . . . . . . . . . . . . . . . 30
3.2.1 Uncompressed and compressed domain video watermarking . . . 30
3.2.1.1 Uncompressed domain algorithms . . . . . . . . . . . . 30
3.2.1.2 Compressed domain algorithms . . . . . . . . . . . . . . 31
3.2.2 Dissection of the video watermarking algorithms . . . . . . . . . 32
3.2.2.1 Frame-by-frame . . . . . . . . . . . . . . . . . . . . . . 32
3.2.2.2 3D decomposed . . . . . . . . . . . . . . . . . . . . . . 33
3.2.2.3 Motion compensated . . . . . . . . . . . . . . . . . . . . 33
3.2.2.4 Bit stream domain . . . . . . . . . . . . . . . . . . . . . 33
3.2.2.5 Motion vector based . . . . . . . . . . . . . . . . . . . . 34
3.3 Conclusions . . . . . . . . . . . . . . . . . . . . . . . . . . . . . . . . . . 34
4 Watermarking Evaluation Bench for Content Adaptation Modes 37
4.1 Introduction . . . . . . . . . . . . . . . . . . . . . . . . . . . . . . . . . . 37
4.2 WEBCAM system architecture . . . . . . . . . . . . . . . . . . . . . . . 39
4.2.1 Watermark embedding tools . . . . . . . . . . . . . . . . . . . . . 40
4.2.2 Content adaptation tools . . . . . . . . . . . . . . . . . . . . . . 42
4.2.3 Watermark extraction and authentication tools . . . . . . . . . . 44
vii
4.2.3.1 Watermark extraction . . . . . . . . . . . . . . . . . . . 44
4.2.3.2 Postprocessing . . . . . . . . . . . . . . . . . . . . . . . 44
4.2.3.3 Watermark authentication . . . . . . . . . . . . . . . . 45
4.3 Experimental simulations and comparative study . . . . . . . . . . . . . 45
4.3.1 Different wavelet-based watermarking algorithm realization . . . 46
4.3.2 Robustness to content adaptation attacks . . . . . . . . . . . . . 46
4.3.2.1 The experimental setup . . . . . . . . . . . . . . . . . . 47
4.3.2.2 The effect of wavelet kernel choice on robustness . . . . 50
4.3.2.3 The effect of subband choice . . . . . . . . . . . . . . . 51
4.3.2.4 The effect of the choice of embedding method and host
coefficient selection . . . . . . . . . . . . . . . . . . . . 53
4.4 Conclusions . . . . . . . . . . . . . . . . . . . . . . . . . . . . . . . . . . 54
5 Embedding distortion analysis and modeling 55
5.1 Introduction . . . . . . . . . . . . . . . . . . . . . . . . . . . . . . . . . . 55
5.2 Embedding distortion model for orthonormal wavelet bases . . . . . . . 56
5.2.1 Preliminaries . . . . . . . . . . . . . . . . . . . . . . . . . . . . . 56
5.2.2 The model . . . . . . . . . . . . . . . . . . . . . . . . . . . . . . 57
5.2.2.1 An example of non-blind model . . . . . . . . . . . . . 60
5.2.2.2 An example of blind embedding model . . . . . . . . . 61
5.2.3 Experimental simulations and result discussion . . . . . . . . . . 61
viii
5.2.3.1 Non-blind model . . . . . . . . . . . . . . . . . . . . . . 62
5.2.3.2 Blind model . . . . . . . . . . . . . . . . . . . . . . . . 62
5.3 Embedding distortion model for non-orthonormal
wavelet bases . . . . . . . . . . . . . . . . . . . . . . . . . . . . . . . . . 65
5.3.1 Preliminaries . . . . . . . . . . . . . . . . . . . . . . . . . . . . . 65
5.3.2 Experimental simulations and discussion . . . . . . . . . . . . . . 67
5.3.2.1 Calculation of the weighting parameters . . . . . . . . . 68
5.3.2.2 Simulations of the propositions . . . . . . . . . . . . . . 69
5.4 Conclusions . . . . . . . . . . . . . . . . . . . . . . . . . . . . . . . . . . 70
6 Robustness analysis and modeling 75
6.1 Introduction . . . . . . . . . . . . . . . . . . . . . . . . . . . . . . . . . . 75
6.2 Quality scalability in content adaptation . . . . . . . . . . . . . . . . . . 76
6.3 Robustness model for non-blind extraction using magnitude alteration . 77
6.3.1 Preliminaries . . . . . . . . . . . . . . . . . . . . . . . . . . . . . 77
6.3.2 The model . . . . . . . . . . . . . . . . . . . . . . . . . . . . . . 78
6.3.3 Examples . . . . . . . . . . . . . . . . . . . . . . . . . . . . . . . 83
6.4 Robustness model for blind extraction using
re-quantization-based modifications . . . . . . . . . . . . . . . . . . . . . 83
6.4.1 Preliminaries . . . . . . . . . . . . . . . . . . . . . . . . . . . . . 83
6.4.2 The model . . . . . . . . . . . . . . . . . . . . . . . . . . . . . . 85
6.4.3 Examples . . . . . . . . . . . . . . . . . . . . . . . . . . . . . . . 88
ix
6.5 Performance evaluation . . . . . . . . . . . . . . . . . . . . . . . . . . . 89
6.5.1 Evaluation of the model for non-blind watermarking . . . . . . . 90
6.5.1.1 Simulations with bit plane discarding . . . . . . . . . . 91
6.5.1.2 Experiments with JPEG 2000 quality scalability . . . . 91
6.5.2 Evaluation of the model for blind watermarking . . . . . . . . . . 93
6.5.2.1 Simulations with bit plane discarding . . . . . . . . . . 95
6.5.2.2 Experiments with JPEG 2000 quality scalability . . . . 96
6.6 Conclusions . . . . . . . . . . . . . . . . . . . . . . . . . . . . . . . . . . 97
7 Motion Compensated Video Watermarking Techniques 99
7.1 Introduction . . . . . . . . . . . . . . . . . . . . . . . . . . . . . . . . . . 99
7.2 Motion compensated 2D+t+2D filtering . . . . . . . . . . . . . . . . . . 102
7.2.1 MMCTF . . . . . . . . . . . . . . . . . . . . . . . . . . . . . . . 102
7.2.2 2D+t+2D framework . . . . . . . . . . . . . . . . . . . . . . . . 104
7.3 Video watermarking in 2D+t+2D spatio-temporal decomposition . . . . 105
7.3.1 Proposed video watermarking scheme . . . . . . . . . . . . . . . 106
7.3.1.1 Embedding . . . . . . . . . . . . . . . . . . . . . . . . . 107
7.3.1.2 Extraction and authentication . . . . . . . . . . . . . . 107
7.3.2 The framework analysis in video watermarking context . . . . . . 109
7.3.2.1 On improving imperceptibility . . . . . . . . . . . . . . 109
7.3.2.2 On motion retrieval . . . . . . . . . . . . . . . . . . . . 111
x
7.4 Experimental results and discussion . . . . . . . . . . . . . . . . . . . . 114
7.4.1 Embedding distortion analysis . . . . . . . . . . . . . . . . . . . 116
7.4.2 Robustness performance evaluation . . . . . . . . . . . . . . . . . 124
7.5 Adopting robustness model in video watermarking . . . . . . . . . . . . 133
7.5.1 Robust video watermarking . . . . . . . . . . . . . . . . . . . . . 133
7.5.2 Experimental results . . . . . . . . . . . . . . . . . . . . . . . . . 133
7.6 Conclusions . . . . . . . . . . . . . . . . . . . . . . . . . . . . . . . . . . 134
8 Distortion Constrained Robustness Scalable Watermarking 137
8.1 Introduction . . . . . . . . . . . . . . . . . . . . . . . . . . . . . . . . . . 137
8.2 Scalable watermarking . . . . . . . . . . . . . . . . . . . . . . . . . . . . 139
8.2.1 Proposed algorithm . . . . . . . . . . . . . . . . . . . . . . . . . 140
8.2.1.1 Tree formation . . . . . . . . . . . . . . . . . . . . . . . 140
8.2.1.2 Embedding . . . . . . . . . . . . . . . . . . . . . . . . . 141
8.2.1.3 Extraction and Authentication . . . . . . . . . . . . . . 143
8.2.2 Scalable watermark system design . . . . . . . . . . . . . . . . . 144
8.2.2.1 Encoding module . . . . . . . . . . . . . . . . . . . . . 144
8.2.2.2 Embedded watermarking module . . . . . . . . . . . . . 146
8.2.2.3 Extractor module . . . . . . . . . . . . . . . . . . . . . 146
8.2.3 Effect of bit plane discarding . . . . . . . . . . . . . . . . . . . . 147
8.3 Experimental results and discussion . . . . . . . . . . . . . . . . . . . . 151
xi
8.3.1 Scalable watermarking for images . . . . . . . . . . . . . . . . . . 152
8.3.1.1 Proof of the concept . . . . . . . . . . . . . . . . . . . . 152
8.3.1.2 Verification of the scheme against bit plane discarding . 153
8.3.1.3 Robustness performance against JPEG 2000 . . . . . . 154
8.3.1.4 Robustness performance comparison with existing method155
8.3.1.5 Application scenario of scalable watermarking . . . . . 158
8.3.2 Scalable watermarking for video . . . . . . . . . . . . . . . . . . 159
8.4 Conclusions . . . . . . . . . . . . . . . . . . . . . . . . . . . . . . . . . . 163
9 Conclusions and future work 169
9.1 Conclusions . . . . . . . . . . . . . . . . . . . . . . . . . . . . . . . . . . 169
9.2 Future work . . . . . . . . . . . . . . . . . . . . . . . . . . . . . . . . . . 172
10 Appendix A 175
References 179
xii
List of Figures
2.1 Universal multimedia usage scenarios using scalable coded content. . . . 10
2.2 The scalable coding-decoding block diagram. . . . . . . . . . . . . . . . 10
2.3 Quality scalable encoding process. . . . . . . . . . . . . . . . . . . . . . 11
2.4 Spatial resolution scalable encoding process. . . . . . . . . . . . . . . . . 12
2.5 Temporal scalable encoding process. . . . . . . . . . . . . . . . . . . . . 12
2.6 Watermarking applications. . . . . . . . . . . . . . . . . . . . . . . . . . 13
2.7 Watermarking properties and associated applications. . . . . . . . . . . 14
2.8 Types of watermarking techniques. . . . . . . . . . . . . . . . . . . . . . 15
2.9 Watermark types. . . . . . . . . . . . . . . . . . . . . . . . . . . . . . . 15
2.10 Attack characterization. . . . . . . . . . . . . . . . . . . . . . . . . . . . 16
2.11 Watermark embedding process. . . . . . . . . . . . . . . . . . . . . . . . 18
2.12 Watermark extraction and authentication process. . . . . . . . . . . . . 20
2.13 The filter bank approach for DWT. . . . . . . . . . . . . . . . . . . . . . 22
2.14 The lifting approach for DWT. . . . . . . . . . . . . . . . . . . . . . . . 22
2.15 2D wavelet transform operation. . . . . . . . . . . . . . . . . . . . . . . 23
xiii

2.16 The block based motion estimation. . . . . . . . . . . . . . . . . . . . . 24
3.1 Uncompressed domain image watermarking and content adaptation attack. 26
3.2 Joint compression-watermarking and content adaptation attack. . . . . . 27
3.3 Re-quantisation-based modification. . . . . . . . . . . . . . . . . . . . . 29
3.4 Uncompressed domain video watermarking and compression / content
adaptation attack. . . . . . . . . . . . . . . . . . . . . . . . . . . . . . . 31
3.5 Generic scheme for joint compression domain video watermarking. . . . 32
4.1 WEBCAM modules and input/output parameter blocks . . . . . . . . . 39
4.2 Flow diagram of the watermark embedding module in WEBCAM. . . . 40
4.3 The FDWT submodule with choices wavelet kernels. . . . . . . . . . . . 41
4.4 The flow diagram content adaptation tools in WEBCAM. . . . . . . . . 43
4.5 Content adaptation at nodes. . . . . . . . . . . . . . . . . . . . . . . . . 43
4.6 Flow diagram of watermark extraction and authentication in WEBCAM. 44
4.7 The test image set. . . . . . . . . . . . . . . . . . . . . . . . . . . . . . . 47
4.8 The test logo set. . . . . . . . . . . . . . . . . . . . . . . . . . . . . . . . 48
4.9 An example of comparing the choice of logo with the same bit count
(8192) being embedded using the intra re-quantization-based embedding
on robustness to - Row 1: Quality scalability attack on full resolution;
and Row 2: Joint resolution-quality scalability attack (half resolution). . 48
xiv

4.10 Capacity-distortion plots. Numbers 1 to 5 represent the five images from
the test image set. Two different category of algorithms: 1) non-blind
(non-HVS based <1,0,0,0>(τ=1)) and 2) blind (intra re-quantization
based), are shown in each row for six different wavelet kernels: HR, D-4,
5/3 9/7, MH and MQ. . . . . . . . . . . . . . . . . . . . . . . . . . . . . 49
4.11 Original and extracted watermark logo and corresponding to different
Hamming distances (HD). . . . . . . . . . . . . . . . . . . . . . . . . . . 50
4.12 An example of evaluating the effect of the wavelet kernel for < 1, 0, 0, 0 >
(τ = 1) direct modification-based embedding on robustness to - Column
1: Quality scalability attack on full resolution; and Column 2: Joint
resolution-quality scalability attack (half resolution). . . . . . . . . . . . 51
4.13 An example of evaluating the effect of the wavelet kernel for intra re-
quantization-based embedding on robustness to - Column 1: Quality
scalability attack on full resolution; and Column 2: Joint resolution-
quality scalability attack (half resolution). . . . . . . . . . . . . . . . . . 51
4.14 An example of evaluating the effect of the subband choice for< 1, 0, 0, 0 >
(τ = 1) direct modification-based embedding on robustness to - Column
1: Quality scalability attack on full resolution; and Column 2: Joint
resolution-quality scalability attack (half resolution). . . . . . . . . . . . 52
4.15 An example of evaluating the effect of the subband choice for intra re-
quantization-based embedding on robustness to - Column 1: Quality
scalability attack on full resolution; and Column 2: Joint resolution-
quality scalability attack (half resolution). . . . . . . . . . . . . . . . . . 52
4.16 An example of evaluating the effect of different embedding methods on
robustness to - Column 1: Quality scalability attack on full resolution;
and Column 2: Joint resolution-quality scalability attack (half resolution). 53
5.1 Watermark embedding (non-blind) performance graph for different sub-
bands. Four different wavelet kernels used here: 1. HR, 2. D4, 3. D8
and 4. D16, respectively. Subbands are shown left to right and top to
bottom: LL3, HL3, LH3, HH3, respectively. . . . . . . . . . . . . . . . . 63
xv
5.2 Watermark embedding (non-blind) performance graph for various wavelets
in different subband. Wavelet kernels are shown left to right and top to
bottom: HR, D4, D8 and D16, respectively. . . . . . . . . . . . . . . . . 64
5.3 Watermark embedding (blind) performance graph for different subbands.
Four different wavelet kernels used here: 1. HR, 2. D4, 3. D8 and 4.
D16, respectively. Subbands are shown left to right and top to bottom:
LL3, HL3, LH3, HH3, respectively. . . . . . . . . . . . . . . . . . . . . . 64
5.4 Watermark embedding (blind) performance graph for various wavelets
in different subband. Wavelet kernels are shown left to right and top to
bottom: HR, D4, D8 and D16, respectively. . . . . . . . . . . . . . . . . 65
5.5 Watermark embedding (non-blind) performance graph for different sub-
bands. Four different wavelet kernels used here: 1. 9/7, 2. 5/3, 3. MH
and 4. MQ, respectively. Subbands are shown left to right and top to
bottom: LL3, HL3, LH3, HH3, respectively. . . . . . . . . . . . . . . . . 71
5.6 Watermark embedding (non-blind) performance graph for various wavelets
in different subband. Wavelet kernels are shown left to right and top to
bottom: 1. 9/7, 2. 5/3, 3. MH and 4. MQ, respectively. . . . . . . . . . 72
5.7 Watermark embedding (blind) performance graph for different subbands.
Four different wavelet kernels used here: 1. 9/7, 2. 5/3, 3. MH and 4.
MQ, respectively. Subbands are shown left to right and top to bottom:
LL3, HL3, LH3, HH3, respectively. . . . . . . . . . . . . . . . . . . . . . 73
5.8 Watermark embedding (blind) performance graph for various wavelets
in different subband. Wavelet kernels are shown left to right and top to
bottom: 1. 9/7, 2. 5/3, 3. MH and 4. MQ, respectively. . . . . . . . . . 74
6.1 The effect of quantization and de-quantization processes in wavelet do-
main considering discarding of N bit planes. . . . . . . . . . . . . . . . . 77
6.2 The range of C capable of robust extraction of b = 1. Row 1 : C ′ ≥ C ′;
Row 2 : C ′ < C ′; Row 3 : The total range. . . . . . . . . . . . . . . . . . 80
6.3 The range of C capable of robust extraction of b = 0. Row 1 : C ′ < C ′;
Row 2 : C ′ ≥ C ′; Row 3 : The total range. . . . . . . . . . . . . . . . . . 82
xvi
6.4 The combined range of C capable of robust extraction of both b = 1 and
b = 0. . . . . . . . . . . . . . . . . . . . . . . . . . . . . . . . . . . . . . 83
6.5 Coefficients’ robustness rank maps for discarding up to N bit planes
shown using 7 gray scales corresponding to N = 0, ...., 6. Left: LL sub-
band; Right: HL subband; Row 1: Embedding b = 1; Row 2: Embedding
b = 0; Row 3: Embedding any value of b. . . . . . . . . . . . . . . . . . 85
6.6 Mapping of coefficients after quantization and de-quantization processes
considering the discarding of N bit planes. . . . . . . . . . . . . . . . . . 86
6.7 Embedding performance of the model for non-blind watermarking con-
sidering different values of N at embedding. Column 1 : Image 1; and
Column 2 : Image 2. . . . . . . . . . . . . . . . . . . . . . . . . . . . . . 90
6.8 Non-blind model evaluation: Robustness performance against discarding
of p bit planes for the embedding models that consider N = 1, 3, 5 (Col-
umn 1 ) and N = 2, 4, 6 (Column 2 ) bit planes to be discarded. N = 0
corresponds to algorithm without model. Row 1 : Image 1; and Row 2 :
Image 2; Row 3 : The entire image set. . . . . . . . . . . . . . . . . . . . 92
6.9 Non-blind model evaluation. a) and b) represent the difference images
|C ′ − C| in for using the embedding model with N = 0 and N = 5,
respectively. c) and d) show the corresponding difference images |C ′−C|at the decoder after discarding p = 5 bit planes. . . . . . . . . . . . . . . 93
6.10 Non-blind model evaluation: Robustness performance against JPEG
2000 quality scalability for the embedding models that consider N =
1, 3, 5 (Column 1 ) and N = 2, 4, 6 (Column 2 ) bit planes to be dis-
carded. N = 0 corresponds to algorithm without model. Row 1 : Image
1; and Row 2 : Image 2; Row 3 : The entire image set. . . . . . . . . . . 94
6.11 Embedding performance of the model for blind watermarking consider-
ing different values of N at embedding for image 3 and image 4. . . . . 95
6.12 Blind model evaluation: Robustness performance against discarding of
p bit planes for the embedding models that consider N = 0, 3, 4, 5 bit
planes to be discarded. Row 1, Column 1 : Image 3; and Row 1, Column
2 : Image 4; Row 2 : The entire image set. . . . . . . . . . . . . . . . . . 96
xvii
6.13 Blind model evaluation: Robustness performance against JPEG 2000
quality scalability for the embedding models that consider N = 0, 3, 4, 5
bit planes to be discarded. Row 1, Column 1 : Image 3; and Row 1,
Column 2 : Image 4; Row 2 : The entire image set. . . . . . . . . . . . . 97
7.1 Pixel connectivity in I2t and I2t+1 frames. . . . . . . . . . . . . . . . . . 103
7.2 Realization of 3-2 temporal schemes using the 2D+t+2D framework with
different parameters: (032). . . . . . . . . . . . . . . . . . . . . . . . . . 105
7.3 Realization of 3-2 temporal schemes using the 2D+t+2D framework with
different parameters: (230). . . . . . . . . . . . . . . . . . . . . . . . . . 106
7.4 Realization of 3-2 temporal schemes using the 2D+t+2D framework with
different parameters: (131). . . . . . . . . . . . . . . . . . . . . . . . . . 106
7.5 Realization of spatial 2D frame-by-frame scheme using the 2D+t+2D
framework with different parameters: (002). . . . . . . . . . . . . . . . . 107
7.6 System blocks for watermark embedding scheme in 2D+t+2D spatio-
temporal decomposition. . . . . . . . . . . . . . . . . . . . . . . . . . . . 108
7.7 System blocks for non-blind watermark extraction scheme in 2D+t+2D
spatio-temporal decomposition. . . . . . . . . . . . . . . . . . . . . . . . 108
7.8 System blocks for blind watermark extraction scheme in 2D+t+2D spatio-
temporal decomposition. . . . . . . . . . . . . . . . . . . . . . . . . . . . 109
7.9 Histogram of coefficients at LLs for 3rd level temporal low and high
frequency frames (GOP 1) for Foreman sequence. Column 1) & 2) rep-
resents LLL and LLH temporal frames, respectively and Row 1), 2) &
3) shows 032, 131 and 230 combinations of 2D+t+2D framework. . . . . 112
7.10 Histogram of coefficients at LLs for 3rd level temporal low and high fre-
quency frames (GOP 1) for Crew sequence. Column 1) & 2) represents
LLL and LLH temporal frames, respectively and Row 1), 2) & 3) shows
032, 131 and 230 combinations of 2D+t+2D framework. . . . . . . . . . 113
7.11 The test video sequence set. . . . . . . . . . . . . . . . . . . . . . . . . . 116
xviii
7.12 Embedding distortion performance for non-blind watermarking on LLL
and LLH temporal subbands for News sequence. a) and c) represents
MSE and b) and d) represents Flicker metric for LLL and LLH, respec-
tively. . . . . . . . . . . . . . . . . . . . . . . . . . . . . . . . . . . . . . 118
7.13 Embedding distortion performance for non-blind watermarking on LLL
and LLH temporal subbands for Foreman sequence. a) and c) repre-
sents MSE and b) and d) represents Flicker metric for LLL and LLH,
respectively. . . . . . . . . . . . . . . . . . . . . . . . . . . . . . . . . . . 119
7.14 Embedding distortion performance for non-blind watermarking on LLL
and LLH temporal subbands for Crew sequence. a) and c) represents
MSE and b) and d) represents Flicker metric for LLL and LLH, respec-
tively. . . . . . . . . . . . . . . . . . . . . . . . . . . . . . . . . . . . . . 120
7.15 Embedding distortion performance for blind watermarking on LLL and
LLH temporal subbands for News sequence. a) and c) represents MSE
and b) and d) represents Flicker metric for LLL and LLH, respectively. 121
7.16 Embedding distortion performance for blind watermarking on LLL and
LLH temporal subbands for Foreman sequence. a) and c) represents
MSE and b) and d) represents Flicker metric for LLL and LLH, respec-
tively. . . . . . . . . . . . . . . . . . . . . . . . . . . . . . . . . . . . . . 122
7.17 Embedding distortion performance for blind watermarking on LLL and
LLH temporal subbands for Crew sequence. a) and c) represents MSE
and b) and d) represents Flicker metric for LLL and LLH, respectively. 123
7.18 Robustness performance of non-blind watermarking scheme for Crew
sequence. Row 1) & 2) show robustness against Motion JPEG 2000 and
MC-EZBC, respectively. Column 1) & 2) represents the embedding on
temporal subbands LLL & LLH, respectively. . . . . . . . . . . . . . . 127
7.19 Robustness performance of non-blind watermarking scheme for Foreman
sequence. Row 1) & 2) show robustness against Motion JPEG 2000 and
MC-EZBC, respectively. Column 1) & 2) represents the embedding on
temporal subbands LLL & LLH, respectively. . . . . . . . . . . . . . . 128
xix
7.20 Robustness performance of non-blind watermarking scheme for News
sequence. Row 1) & 2) show robustness against Motion JPEG 2000 and
MC-EZBC, respectively. Column 1) & 2) represents the embedding on
temporal subbands LLL & LLH, respectively. . . . . . . . . . . . . . . 129
7.21 Robustness performance of blind watermarking scheme for Crew se-
quence. Row 1) & 2) show robustness against Motion JPEG 2000 and
MC-EZBC, respectively. Column 1) & 2) represents the embedding on
temporal subbands LLL & LLH, respectively. . . . . . . . . . . . . . . 130
7.22 Robustness performance of blind watermarking scheme for Foreman se-
quence. Row 1) & 2) show robustness against Motion JPEG 2000 and
MC-EZBC, respectively. Column 1) & 2) represents the embedding on
temporal subbands LLL & LLH, respectively. . . . . . . . . . . . . . . 131
7.23 Robustness performance of blind watermarking scheme for News se-
quence. Row 1) & 2) show robustness against Motion JPEG 2000 and
MC-EZBC, respectively. Column 1) & 2) represents the embedding on
temporal subbands LLL & LLH, respectively. . . . . . . . . . . . . . . 132
7.24 Robustness performance enhancement using bit plane discarding model
(N = 5) of non-blind watermarking scheme for LLH subband. Column
1) & 2) show robustness against Motion JPEG 2000 and MC-EZBC,
respectively. Row 1), 2) & 3) represents the test sequences, Crew, Fore-
man & News, respectively. . . . . . . . . . . . . . . . . . . . . . . . . . . 135
7.25 Robustness performance enhancement using bit plane discarding model
(N = 5) of blind watermarking scheme for LLL subband. Column 1) &
2) show robustness against Motion JPEG 2000 and MC-EZBC, respec-
tively. Row 1), 2) & 3) represents the test sequences, Crew, Foreman &
News, respectively. . . . . . . . . . . . . . . . . . . . . . . . . . . . . . . 136
8.1 Non-uniform hierarchical quantizer in formation of binary tree. . . . . . 141
8.2 Example binary tree. . . . . . . . . . . . . . . . . . . . . . . . . . . . . . 142
8.3 State machine diagram of watermark embedding based on tree-symbol-
association model. . . . . . . . . . . . . . . . . . . . . . . . . . . . . . . 143
xx
8.4 Proposed scalable watermarking layer creation. . . . . . . . . . . . . . . 145
8.5 Code-stream generation. . . . . . . . . . . . . . . . . . . . . . . . . . . . 146
8.6 Effect of bit plane discarding in watermark extraction; λ = 2M and N
is the number of bit plane being discarded. . . . . . . . . . . . . . . . . 148
8.7 Effect of bit plane discarding in watermark extraction for special case of
EZ and EO; λ = 2M and N is the number of bit plane being discarded. 149
8.8 Visual representation of watermarked images at various rate points for
Boat image. . . . . . . . . . . . . . . . . . . . . . . . . . . . . . . . . . . 153
8.9 Visual representation of watermarked images at various rate points for
Barbara image. . . . . . . . . . . . . . . . . . . . . . . . . . . . . . . . . 154
8.10 Visual representation of watermarked images at various rate points for
Blackboard image. . . . . . . . . . . . . . . . . . . . . . . . . . . . . . . 155
8.11 Visual representation of watermarked images at various rate points for
Light House image. . . . . . . . . . . . . . . . . . . . . . . . . . . . . . . 156
8.12 PSNR and robustness vs Φ graph. Row 1: Embedding distortion vs. Φ,
Row 2: Hamming distance vs. Φ. . . . . . . . . . . . . . . . . . . . . . . 157
8.13 PSNR and robustness vs Φ graph. Row 1: Embedding distortion vs. Φ,
Row 2: Hamming distance vs. Φ. . . . . . . . . . . . . . . . . . . . . . . 157
8.14 Robustness against discarding of p bit planes for various d at minimum
and maximum Φ. . . . . . . . . . . . . . . . . . . . . . . . . . . . . . . . 158
8.15 Robustness against JPEG 2000 compression for various d at minimum
and maximum Φ. . . . . . . . . . . . . . . . . . . . . . . . . . . . . . . . 159
8.16 Robustness against JPEG 2000 compression for various Φ at d = 6. . . . 160
8.17 Robustness performance comparison between existing and proposed method
against JPEG 2000 compression with same Φ. . . . . . . . . . . . . . . . 161
xxi
8.18 Application example to use different Φ for various JPEG 2000 compres-
sion ratio to maintain embedding distortion and robustness. . . . . . . . 162
8.19 Embedding distortion performance for proposed watermarking on LLL
temporal subbands for various Φ(d = 6). Row 1), 2) & 3) represents
embedding performances for Crew, Foreman and News sequences, re-
spectively. . . . . . . . . . . . . . . . . . . . . . . . . . . . . . . . . . . . 163
8.20 Embedding distortion performance for proposed watermarking on LLH
temporal subbands for various Φ (d = 6). Row 1), 2) & 3) represents
embedding performances for Crew, Foreman and News sequences, re-
spectively. . . . . . . . . . . . . . . . . . . . . . . . . . . . . . . . . . . . 164
8.21 Robustness performance of proposed watermarking scheme at different Φ
(d = 6) for Crew sequence. Row 1) & 2) show robustness against Motion
JPEG 2000 and MC-EZBC, respectively. Column 1) & 2) represents the
embedding on temporal subbands LLL & LLH, respectively. . . . . . . 165
8.22 Robustness performance of proposed watermarking scheme at different
Φ (d = 6) for Foreman sequence. Row 1) & 2) show robustness against
Motion JPEG 2000 and MC-EZBC, respectively. Column 1) & 2) rep-
resents the embedding on temporal subbands LLL & LLH, respectively. 166
8.23 Robustness performance of proposed watermarking scheme at different Φ
(d = 6) for News sequence. Row 1) & 2) show robustness against Motion
JPEG 2000 and MC-EZBC, respectively. Column 1) & 2) represents the
embedding on temporal subbands LLL & LLH, respectively. . . . . . . 167
10.1 Robustness performance of non-blind watermarking scheme against H.264-
SVC for Crew sequence. Column 1) & 2) represents the embedding on
temporal subbands LLL & LLH, respectively. . . . . . . . . . . . . . . 176
10.2 Robustness performance of non-blind watermarking scheme against H.264-
SVC for Foreman sequence. Column 1) & 2) represents the embedding
on temporal subbands LLL & LLH, respectively. . . . . . . . . . . . . . 176
10.3 Robustness performance of non-blind watermarking scheme against H.264-
SVC for News sequence. Column 1) & 2) represents the embedding on
temporal subbands LLL & LLH, respectively. . . . . . . . . . . . . . . 177
xxii
10.4 Robustness performance of blind watermarking scheme against H.264-
SVC for Crew sequence. Column 1) & 2) represents the embedding on
temporal subbands LLL & LLH, respectively. . . . . . . . . . . . . . . 177
10.5 Robustness performance of blind watermarking scheme against H.264-
SVC for Foreman sequence. Column 1) & 2) represents the embedding
on temporal subbands LLL & LLH, respectively. . . . . . . . . . . . . . 178
10.6 Robustness performance of blind watermarking scheme against H.264-
SVC for News sequence. Column 1) & 2) represents the embedding on
temporal subbands LLL & LLH, respectively. . . . . . . . . . . . . . . 178
xxiii

xxiv
List of Tables
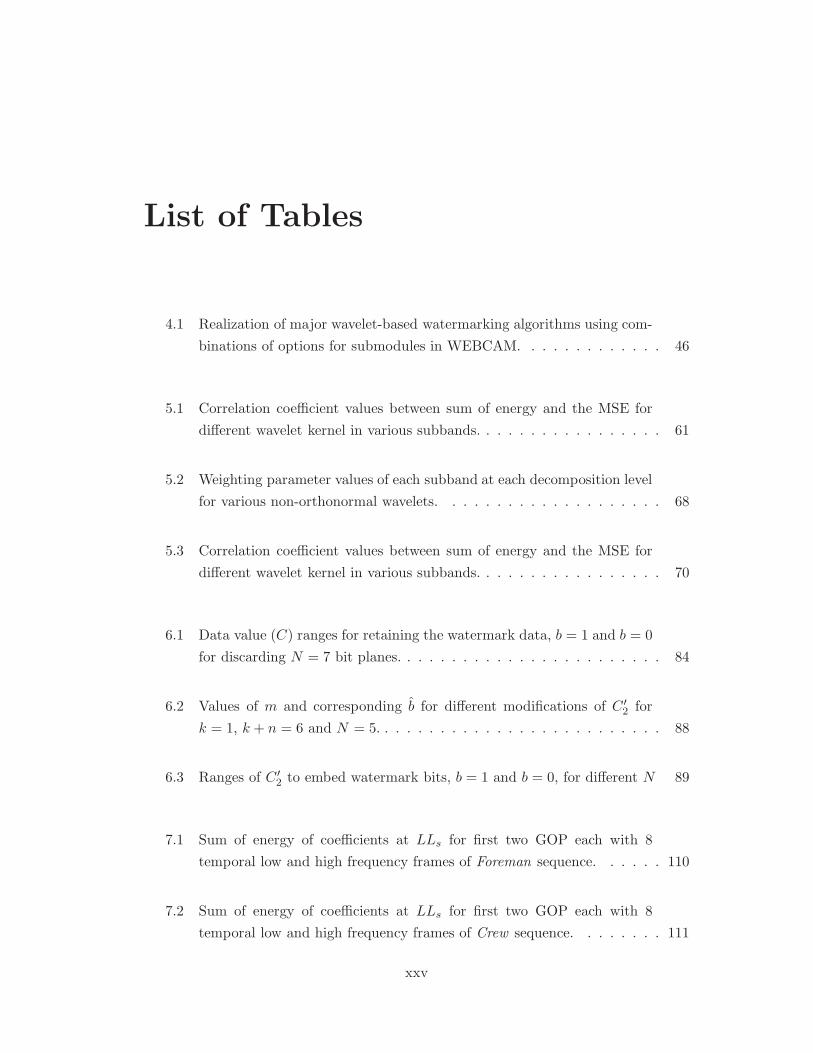
4.1 Realization of major wavelet-based watermarking algorithms using com-
binations of options for submodules in WEBCAM. . . . . . . . . . . . . 46
5.1 Correlation coefficient values between sum of energy and the MSE for
different wavelet kernel in various subbands. . . . . . . . . . . . . . . . . 61
5.2 Weighting parameter values of each subband at each decomposition level
for various non-orthonormal wavelets. . . . . . . . . . . . . . . . . . . . 68
5.3 Correlation coefficient values between sum of energy and the MSE for
different wavelet kernel in various subbands. . . . . . . . . . . . . . . . . 70
6.1 Data value (C) ranges for retaining the watermark data, b = 1 and b = 0
for discarding N = 7 bit planes. . . . . . . . . . . . . . . . . . . . . . . . 84
6.2 Values of m and corresponding b for different modifications of C ′2 for
k = 1, k + n = 6 and N = 5. . . . . . . . . . . . . . . . . . . . . . . . . . 88
6.3 Ranges of C ′2 to embed watermark bits, b = 1 and b = 0, for different N 89
7.1 Sum of energy of coefficients at LLs for first two GOP each with 8
temporal low and high frequency frames of Foreman sequence. . . . . . 110
7.2 Sum of energy of coefficients at LLs for first two GOP each with 8
temporal low and high frequency frames of Crew sequence. . . . . . . . 111
xxv
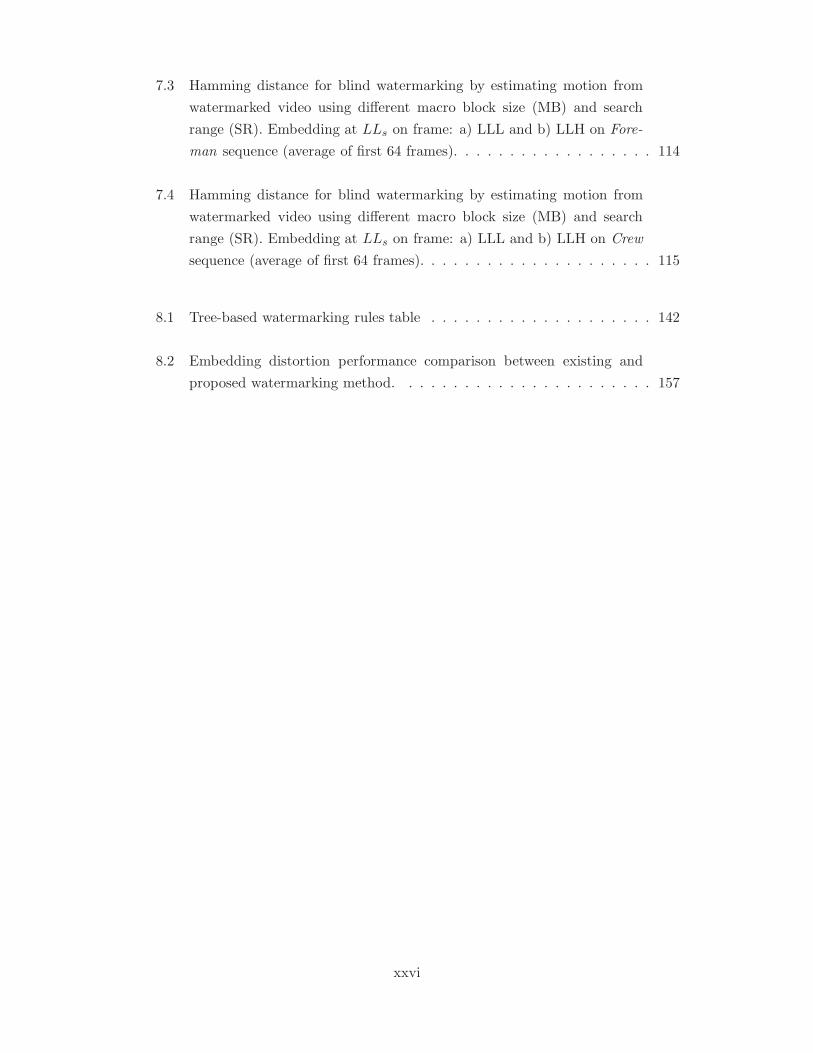
7.3 Hamming distance for blind watermarking by estimating motion from
watermarked video using different macro block size (MB) and search
range (SR). Embedding at LLs on frame: a) LLL and b) LLH on Fore-
man sequence (average of first 64 frames). . . . . . . . . . . . . . . . . . 114
7.4 Hamming distance for blind watermarking by estimating motion from
watermarked video using different macro block size (MB) and search
range (SR). Embedding at LLs on frame: a) LLL and b) LLH on Crew
sequence (average of first 64 frames). . . . . . . . . . . . . . . . . . . . . 115
8.1 Tree-based watermarking rules table . . . . . . . . . . . . . . . . . . . . 142
8.2 Embedding distortion performance comparison between existing and
proposed watermarking method. . . . . . . . . . . . . . . . . . . . . . . 157
xxvi

List of Symbols and Acronyms
Symbols
Symbol Description
Q Quality scalability
S Spatial scalability
T Temporal scalability
ζ() Embedding function
$() Extraction function
I Original host image
I ′ Watermarked image
X × Y Image dimension
W Watermark
W ′ Extracted watermark
Ψ Mother wavelet
C Original wavelet coefficient
C ′ Modified wavelet coefficient
∆ Watermark modification
α Watermarking weight factor for
magnitude alteration based method
τ Watermarking strength
v HVS based weighting parameter
β Fusion strength parameter
δ Quantization step
δ Reconstructed quantization step
γ Watermark weighting parameter for
re-quantization based method
H Hamming Distance
S Similarity Measure
xxvii

Symbol Description
L Length of watermark sequence
x Input signal
y Transformed domain signal
h′(z) Low pass filter coefficients
g′(z) High pass filter coefficients
WΘΥt Wavelet weighting parameter at Θ
subband at Υ decomposition level
Cq Quantized coefficient
C De-quantized coefficient
Q Quantization factor
b Binary bit b ∈ {0, 1}b′ Recovered binary bit b′ ∈ {0, 1}T Threshold parameter in magnitude alteration
based watermark extraction
N Number of bit planes assumed to be discarded
p Number of bit plane actually being discarded
V Vertical displacement of motion block
H Horizontal displacement of motion block
λ Binary tree quantizer
d Depth of binary tree
Φ Embedding distortion rate
xxviii
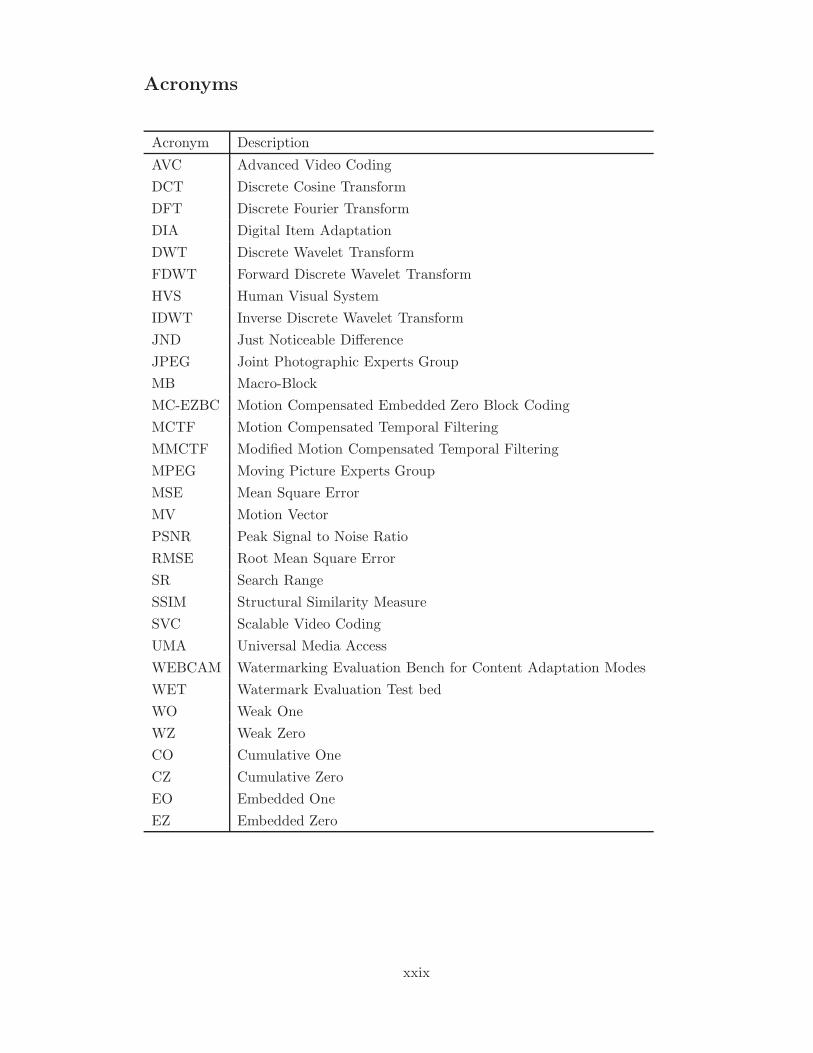
Acronyms
Acronym Description
AVC Advanced Video Coding
DCT Discrete Cosine Transform
DFT Discrete Fourier Transform
DIA Digital Item Adaptation
DWT Discrete Wavelet Transform
FDWT Forward Discrete Wavelet Transform
HVS Human Visual System
IDWT Inverse Discrete Wavelet Transform
JND Just Noticeable Difference
JPEG Joint Photographic Experts Group
MB Macro-Block
MC-EZBC Motion Compensated Embedded Zero Block Coding
MCTF Motion Compensated Temporal Filtering
MMCTF Modified Motion Compensated Temporal Filtering
MPEG Moving Picture Experts Group
MSE Mean Square Error
MV Motion Vector
PSNR Peak Signal to Noise Ratio
RMSE Root Mean Square Error
SR Search Range
SSIM Structural Similarity Measure
SVC Scalable Video Coding
UMA Universal Media Access
WEBCAM Watermarking Evaluation Bench for Content Adaptation Modes
WET Watermark Evaluation Test bed
WO Weak One
WZ Weak Zero
CO Cumulative One
CZ Cumulative Zero
EO Embedded One
EZ Embedded Zero
xxix

xxx

Statement of Originality
The research conducted within the scope of this thesis produced the following novel
and unique contributions towards robust watermarking techniques for scalable coded
image and video:
Chapter 3
– State of the art analysis.
Chapter 4
– Generalization and dissection of wavelet based image watermarking schemes and
the related parameters, i.e., wavelet kernel, subband, host coefficients and embed-
ding methods.
– Design and implementation of the modular and reconfigurable tool repository to
develop WEBCAM framework.
– Providing evaluation platform for comparison of robustness performances against
content adaptation attacks, including JPEG 2000.
– Comprehensive analysis and the comparison of various parametric inputs within
WEBCAM framework.
Chapter 5
– Development of the watermark embedding distortion model.
– Relationships between the mean square error (MSE) and the wavelet coefficients
to be embedded.
– Proof of concept of the model for non-blind and blind watermarking algorithms.
– Proof of concept of the model for orthonormal wavelet transforms.
– Proof of concept of the model for non-orthonormal wavelets by using weighting
parameters for various wavelet kernels in different subbands.
xxxi
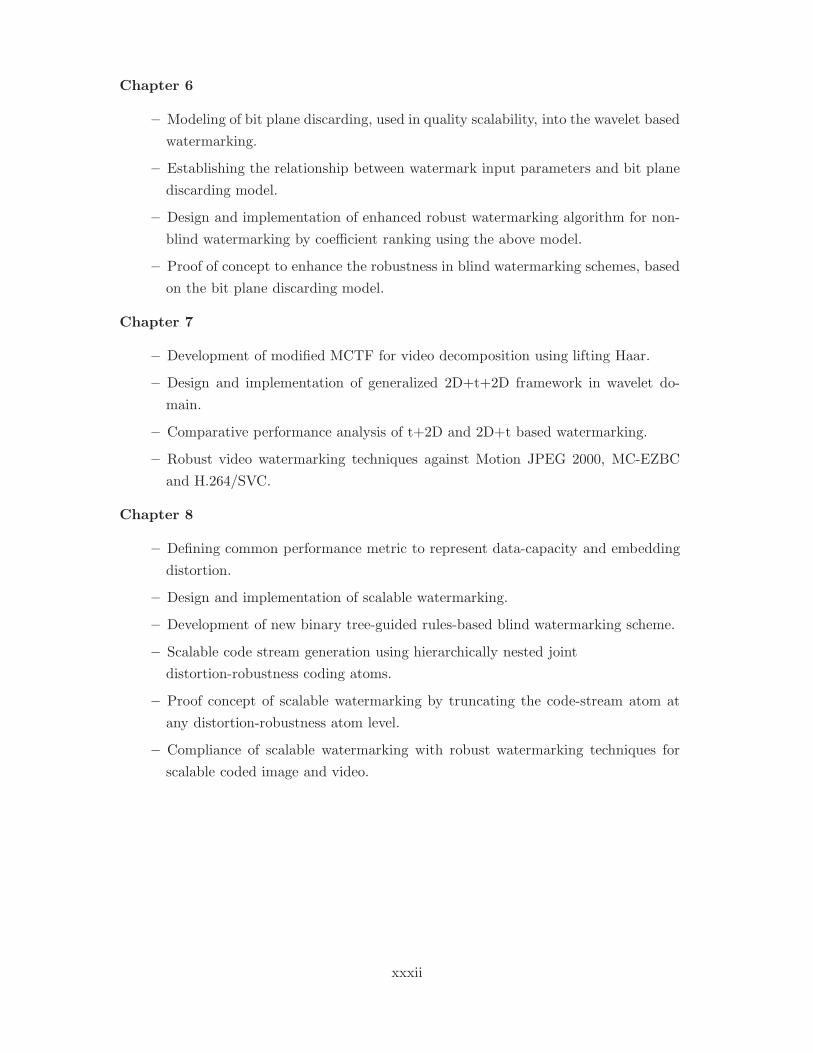
Chapter 6
– Modeling of bit plane discarding, used in quality scalability, into the wavelet based
watermarking.
– Establishing the relationship between watermark input parameters and bit plane
discarding model.
– Design and implementation of enhanced robust watermarking algorithm for non-
blind watermarking by coefficient ranking using the above model.
– Proof of concept to enhance the robustness in blind watermarking schemes, based
on the bit plane discarding model.
Chapter 7
– Development of modified MCTF for video decomposition using lifting Haar.
– Design and implementation of generalized 2D+t+2D framework in wavelet do-
main.
– Comparative performance analysis of t+2D and 2D+t based watermarking.
– Robust video watermarking techniques against Motion JPEG 2000, MC-EZBC
and H.264/SVC.
Chapter 8
– Defining common performance metric to represent data-capacity and embedding
distortion.
– Design and implementation of scalable watermarking.
– Development of new binary tree-guided rules-based blind watermarking scheme.
– Scalable code stream generation using hierarchically nested joint
distortion-robustness coding atoms.
– Proof concept of scalable watermarking by truncating the code-stream atom at
any distortion-robustness atom level.
– Compliance of scalable watermarking with robust watermarking techniques for
scalable coded image and video.
xxxii
Chapter 1
Introduction
Recent years have seen the emergence of scalable coding standards for multimedia
content coding: JPEG 2000 for images [1]; MPEG advanced video coding (AVC)/H.264
scalable video coding (SVC) extension for video [2]; and MPEG-4 scalable profile for
audio [3]. The scalable coders produce scalable bit streams representing content in
hierarchical layers according to audiovisual quality, spatio-temporal resolutions and
regions-of-interests. The bit streams may be accordingly truncated in order to satisfy
variable network data rates, display resolutions, display device resources and usage
preferences. The new bit streams may be transmitted or further adapted or decoded
using a universal decoder which is capable of decoding any original or adapted bit
streams to display or play adapted versions of the original content in terms of quality
or reductions. The multimedia usage framework standard, MPEG-21, standardizes
the operation of a content-agnostic content adaptation engine as the part 7 of the
standard: Digital Item Adaptation (DIA) [4]. Such bit stream truncation-based content
adaptations also affect any content protection data, such as watermarks, embedded in
the original content. This thesis considers the scalable coding based content adaptation
as potential watermark attacks and present novel watermarking techniques, robust to
such attacks particularly quality scalability. Within the scope of the thesis, this work
focuses on the watermarking robustness of scalable coded image and extends those
methods suitably in scalable coded video watermarking.
1
1.1 Scalable coded image watermarking
Influenced by its success in scalable image coding and multi-resolution decomposition
capability, the DWT has been widely used in image watermarking [5–26]. Based on
the embedding methodology, wavelet-based image watermarking can be categorized
into two main classes: uncompressed domain algorithms [5–18] and joint compression-
watermarking algorithms [19–26]. One of the main objectives of the latter class of
algorithms is to accommodate watermarking algorithms within JPEG 2000 based scal-
able image coding as suggested by JPEG 2000 Part 8 (ISO/IEC 15444-8, T.807) Secure
JPEG 2000 (JPSEC) [20] specification to secure JPEG 2000 bit streams. However the
major drawbacks of the compression domain algorithms are its dependency on the
specific coding scheme and the complexity to accommodate the algorithms within the
coding pipeline. Therefore, uncompressed domain watermarking approaches, indepen-
dent of the coding schemes, are considered here.
In order to propose robust watermarking techniques for scalable coded images, the
objectives are broadly categorized as:
O.1 To analyze the existing schemes: The wavelet based watermarking schemes of-
ten share a common model. A comprehensive analysis of the existing schemes is pre-
sented by dissecting commonly used wavelet based watermarking algorithms into modu-
lar tool blocks and fitting them into a common wavelet-based watermarking framework,
Watermark Evaluation Bench for Content Adaptation Modes (WEBCAM). Such analy-
sis helps to develop models for embedding distortion and robust watermarking schemes.
O.2 To model watermarking robustness against scalable compression: To
enhance the robustness against scalable compression such as JPEG 2000, the quanti-
zation process is analyzed in the context of watermarking. However the embedding
distortion performance is also taken into account for the analysis, to balance imper-
ceptibility and robustness. The research findings from these are used to propose a
new scalable watermarking scheme later in this thesis. Hence objective O.2 is further
categorized into following two sub-objectives:
O.2.1 To model embedding distortion: The embedding distortion and the ro-
bustness to scalable image coding are two complementary watermarking require-
ments. In order to increase the robustness often imperceptibility is compromised.
The aim of this objective is to derive a model to find suitable relationships be-
tween the wavelet coefficients and the watermarking distortion in pixel domain.
2

O.2.2 To model quantization vs. watermarking robustness: The robustness
performance deteriorates due to the scalable compression in content adaptation.
The quantization process block within the scalable coding, is often responsible for
the quality scaling. Here we aim to propose improved watermarking robustness
by modeling the effect of quantization on the wavelet coefficients and rank them
accordingly to embed the watermark.
1.2 Scalable coded video watermarking
As a successor of the wavelet based image watermarking, several attempts have been
made to extend these image watermarking algorithms into video watermarking by using
them either on frame-by-frame basis [27–30] or on 3D wavelet decompositions [9,31,32].
However, such video watermark embedding without considering motion, results in
flicker and other motion mismatch artifacts in the watermarked video. Motion compen-
sated temporal filtering (MCTF) provides a better framework for video watermarking
by accounting object motion. Depending on the motion and texture characteristics
of the video and the choice of spatial-temporal sub band for watermark embedding,
MCTF has to be performed either on the spatial domain (t+2D) or in the wavelet
domain (2D+t). In this thesis improved video watermarking schemes are proposed by
offering a generalized motion compensated 2D+t+2D framework for watermark em-
bedding. The watermarking algorithms derived for scalable coded images, as proposed
in O.1 and O.2, are then extended to offer robust video watermarking schemes. Also
an improved MCTF is used by modifying the MCTF update step to follow the motion
trajectory in hierarchical temporal decomposition by using direct motion vector fields
in the update step and implied motion vectors in the prediction step. In summary the
main objectives of the robust video watermarking schemes are
O.3 To prepare 2D+t+2D framework: We aim to prepare a generalized modified
MCTF based 2D+t+2D in order to analyze the motion and texture suitable for video
watermarking.
O.4 To model the video watermarking schemes: The watermarking algorithms de-
rived during robustness model for images are now extended to video watermarking
within the generalized 2D+t+2D framework to offer a unique model for video water-
marking, which is robust to content adaptation attacks, such as, scalable compression
in Motion JPEG 2000, scalable video coder MC-EZBC [33] and H.264/SVC.
3
1.3 Scalable watermarking for image and video
Although, a wide variety of watermarking schemes have been offered to the date, a fun-
damentally traditional concept is still followed in almost all the schemes, including the
robust watermarking techniques, proposed in previous objectives. With the increased
use of scalable coded media, a need is realized for scalable watermarking. However,
a little work has been proposed so far towards scalable watermarking [34–38]. The
final part of this thesis aims to propose a novel concept of scalable watermarking as
opposed to traditional watermarking schemes by creating hierarchically nested joint
distortion-robustness coding atoms. The main objective of this part is:
O.5 To propose scalable watermarking: The research outcomes, proposed in differ-
ent objectives above, are combined to model a novel concept of scalable watermarking
scheme, that can generate a distortion constrained robustness scalable watermarked
media code stream which can be truncated at various points to generate the water-
marked image or video with the desired distortion-robustness requirements.
1.4 Thesis organization
Rest of the thesis is structured in eight different chapters, the contents of which are
summarized as bellow:
Chapter 2 provides the background overview of content adaptation and digital water-
marking. Scalabale coding structure, compression and application scenarios are briefed
within the overview of content adaptation followed by a general discussion on digi-
tal watermarking, including, its properties, applications and attacks. Various wavelet
transforms related to the proposed watermarking schemes are the discussed briefly to
provide sufficient background of the work.
Chapter 3 presents the state-of-the-art analysis of the current literature on watermark-
ing techniques for content adaptation attacks, which includes wavelet domain image
and video watermarking, MCTF based video watermarking, compressed and uncom-
pressed domain watermarking algorithms etc.
Chapter 4 offers a content adaptation test bed framework (WEBCAM), for evaluat-
ing the robustness of wavelet based watermarking. Overall, the framework facilitates
and presents a parametric study of various variables in wavelet based watermarking
4
and proposes a watermark tweezing tool to balance the embedding distortion and the
robustness to scalable coding-based content adaptation using the tools repository.
Chapter 5 presents a model for embedding distortion performance for wavelet based
watermarking. The model derives the relationship between distortion performance
metrics and the watermark embedding parameter, i.e., wavelet coefficients and the
related propositions are made separately for orthonormal and non-orthonormal wavelet
bases.
Chapter 6 addresses the issues related to quality scalable content adaptation and pro-
poses a new embedding criterion to ensure the robustness of the wavelet based image
watermarking schemes for such adaptations. The quality scalable image coding is mod-
eled using wavelet domain bit plane discarding to identify the effect of the quantization
and de-quantization on wavelet coefficients and the data embedded within such coeffi-
cients.
Chapter 7 proposes improved video watermarking schemes by offering a generalized
motion compensated 2D+t+2D framework for watermark embedding. An improved
MCTF is used by modifying the MCTF update step to follow the motion trajectory in
hierarchical temporal decomposition by using direct motion vector fields in the update
step and implied motion vectors in the prediction step. The robust image watermarking
schemes, described in previous chapter, are then extended in this framework to propose
robust video watermarking to content adaptations.
Chapter 8 proposes a novel concept of scalable blind watermarking to generate a dis-
tortion constrained robustness scalable watermarked code stream which consists of
hierarchically nested joint distortion robustness coding atoms. The code stream is gen-
erated using a new wavelet domain binary tree guided rules-based blind watermarking
algorithm. The code stream can be truncated at any distortion-robustness atom level to
generate the watermarked image with the desired distortion-robustness requirements.
Chapter 9 concludes this thesis by summarizing the research outcomes, i.e., analysis,
proposed models and new algorithms on robust watermarking to content adaptation
attacks. Novel contributions of this work are also highlighted here along with the
suggestions on new ideas for future research in this domain.
5

1.5 Publications and software releases
During various stages of the work, some of the research outcomes of this thesis have
been published or are currently under review in the form of software and refereed
publications, which are listed below:
Software Releases
S1. D. Bhowmik and C. Abhayaratne, Watermark Evaluation Bench for Content
Adopted Modes (WEBCAM) v2.0 http://svc.group.shef.ac.uk/webcam.html
Book Chapter
B1. D. Bhowmik and C. Abhayaratne, A generalised model for distortion perfor-
mance analysis of wavelet based watermarking, Lecture Notes in Computer Science,
Springer-Verlag, editor, Proceedings of International Workshop on Digital Watermark-
ing (IWDW ’08), vol. 5450, November 2008, Busan, South Korea, pp. 363-378.
Conference Proceedings
C9. D. Bhowmik and C. Abhayaratne, Distortion constrained robustness scalable image
watermarking. (In preparation)
C8. D. Bhowmik and C. Abhayaratne, Video watermarking using motion compensated
2D+t+2D filtering, in Proceedings of ACM Workshop on Multimedia and Security
(ACM MM&Sec 2010), September 2010, Rome, Italy, pp. 127-136.
C7. D. Bhowmik , C. Abhayaratne and M. Oakes, Robustness analysis of blind water-
marking for quality scalable image compression, in Proceedings of 18th European Signal
Processing Conference (EUSIPCO 2010), August 2010, Denmark, pp. 810-814.
C6. D. Bhowmik and C. Abhayaratne, The effect of quality scalable image compression
on robust watermarking, in Proceedings of Digital Signal Processing (DSP 2009), July
2009, Santorini, Greece, pp. 1-8.
6
C5. D. Bhowmik and C. Abhayaratne, Embedding distortion modeling for wavelet
based watermarking schemes, in Proceedings of Wavelet Applications in Industrial Pro-
cessing VI , SPIE Electronic Imaging 2009, vol. 7248, San Jose, CA, USA, January
2009, pp. 72480K (12 pages).
C4. D. Bhowmik and C. Abhayaratne, A framework for evaluating wavelet-based
watermarking for scalable coded digital item adaptation attacks, in Proceedings of
Wavelet Applications in Industrial Processing VI , SPIE Electronic Imaging 2009, vol.
7248, San Jose, CA, USA, January 2009, pp. 72480M (10 pages).
C3. D. Bhowmik and C. Abhayaratne, Evaluation of watermark robustness to JPEG2000
based content adaptation Attacks, in Proceedings of IET 5th International Conference
on Visual Information Engineering (VIE ’08), July 2008, Xian, China, pp. 789-794.
C2. D. Bhowmik and C. Abhayaratne, A watermark evaluation bench for content
adaptation modes, in Proceedings of IET 4th European Conference on Visual Media
Production (CVMP ’07), November 2007, London, UK, pp. 1.
C1. D. Bhowmik and G. C. K. Abhayaratne, Morphological wavelet domain image wa-
termarking, in Proceedings of 15th European Signal Processing Conference (EUSIPCO
2007), September 2007, Poznan, Poland, pp. 2539-2543.
7

8

Chapter 2
Background Overview
Scalable coding-based content adaptation and wavelet-based image and video water-
marking are two main components of this thesis. This chapter presents an overview of
scalable coding-based content adaptation, digital watermarking and their applications
and wavelet-based watermarking, of relevance to this thesis.
2.1 Scalable coding-based content adaptation
The universal media access (UMA) is an important requirement in modern multimedia
usage chains. The UMA concept envisages seamless delivery of multimedia across the
heterogeneous networks and various devices. This would require catering for differ-
ent network bandwidths, transmission media, device capabilities, memory and power
availability and most importantly the usage preferences. This can only be achieved by
intelligent content-agnostic adaptations based on the scalable coded content represen-
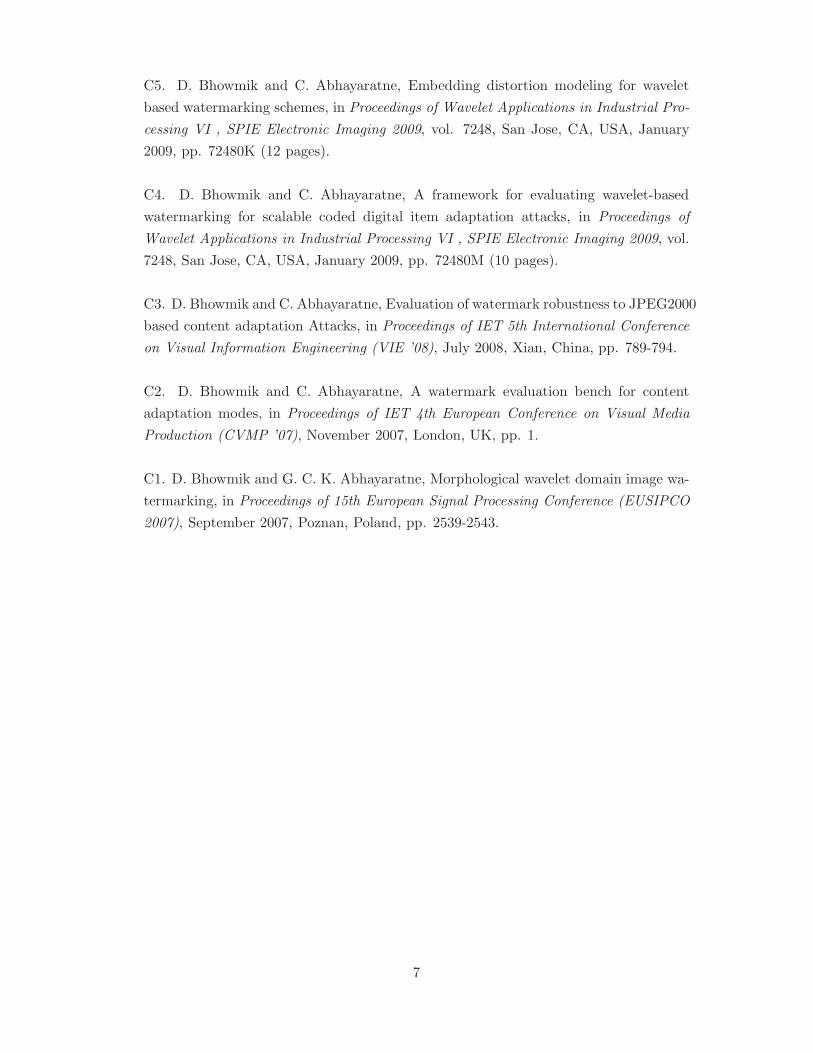
tations. An example of scalable coding-based multimedia usage is shown in Figure 2.1.
2.1.1 Scalable coding modules
In scalable coding the input media is coded in a way that the main host server keeps bit
streams that can be decodable to high quality full resolution content. When the content
needs to be delivered to a less capable display or via a lower bandwidth network, the
9
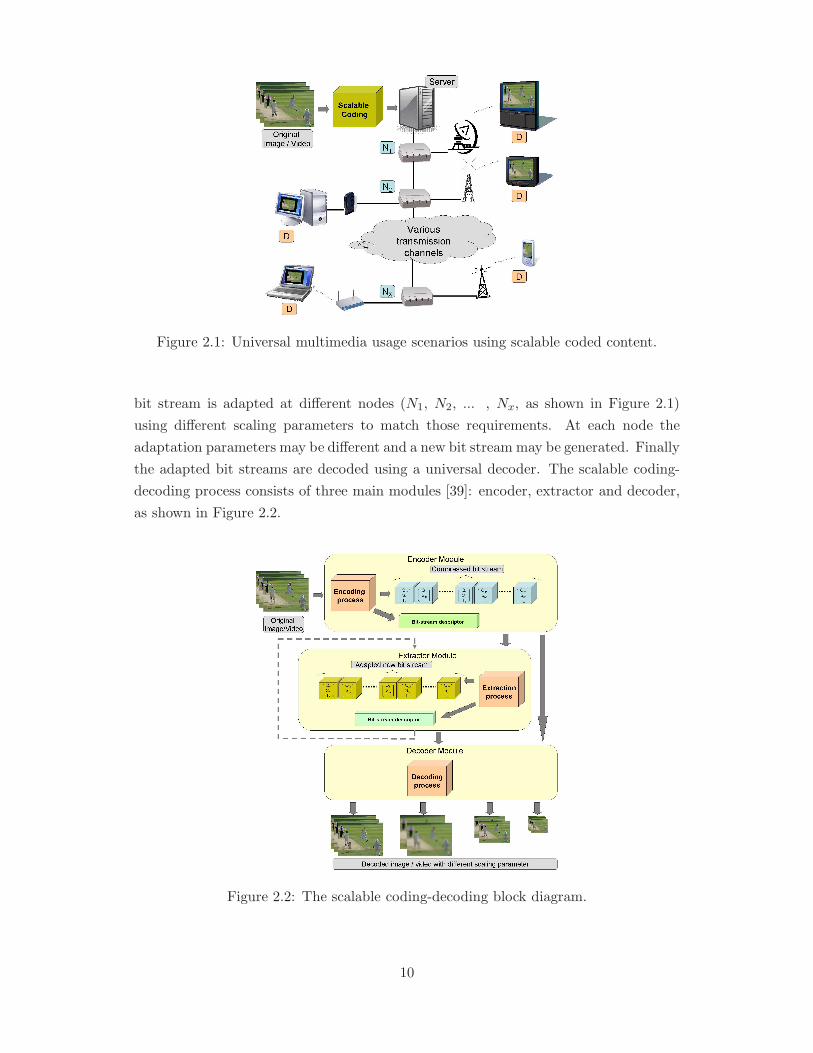
Figure 2.1: Universal multimedia usage scenarios using scalable coded content.
bit stream is adapted at different nodes (N1, N2, ... , Nx, as shown in Figure 2.1)
using different scaling parameters to match those requirements. At each node the
adaptation parameters may be different and a new bit stream may be generated. Finally
the adapted bit streams are decoded using a universal decoder. The scalable coding-
decoding process consists of three main modules [39]: encoder, extractor and decoder,
as shown in Figure 2.2.
Figure 2.2: The scalable coding-decoding block diagram.
10
0
1
0
1
Bit plane 0
Bit plane N
Bit plane N-1
Bit plane N-2
Most significant
Least significant
LH2
HL2
HH2
LH1
HL1
HH1
HH2
HH1
LH2
LH1
HL2HL1
LL2
LL2
Figure 2.3: Quality scalable encoding process.
The encoder module is responsible for producing a full resolution, highest quality
compressed bit stream from the original content. The bit stream generation normally
focuses on three main functionalities: quality scalability (Qi), spatial resolution scal-
ability (Si) and temporal resolution scalability (Ti : for video), where Qi, Si and Ti
represent the scaling parameters for different quality-spatio-temporal layers with the
layer index i. A bit stream descriptor is also generated along with the bit stream
describing the location of these layers in the scalable bit stream.
The extractor module is part of a cross media engine that adapts the bit streams
following the MPEG 21 part-7 DIA specifications. It truncates the scalable bit stream
considering the context and produces the adapted bit-stream, which is also scalable
and can be re-adapted at any following network node by using another extractor, and
its new description.
The decoder module provides an universal decoder to decode any adapted bitstream
to display the adapted content and may have full spatial, quality or temporal resolution
or any combination of a lower resolution.
2.1.2 Scalable coding technique
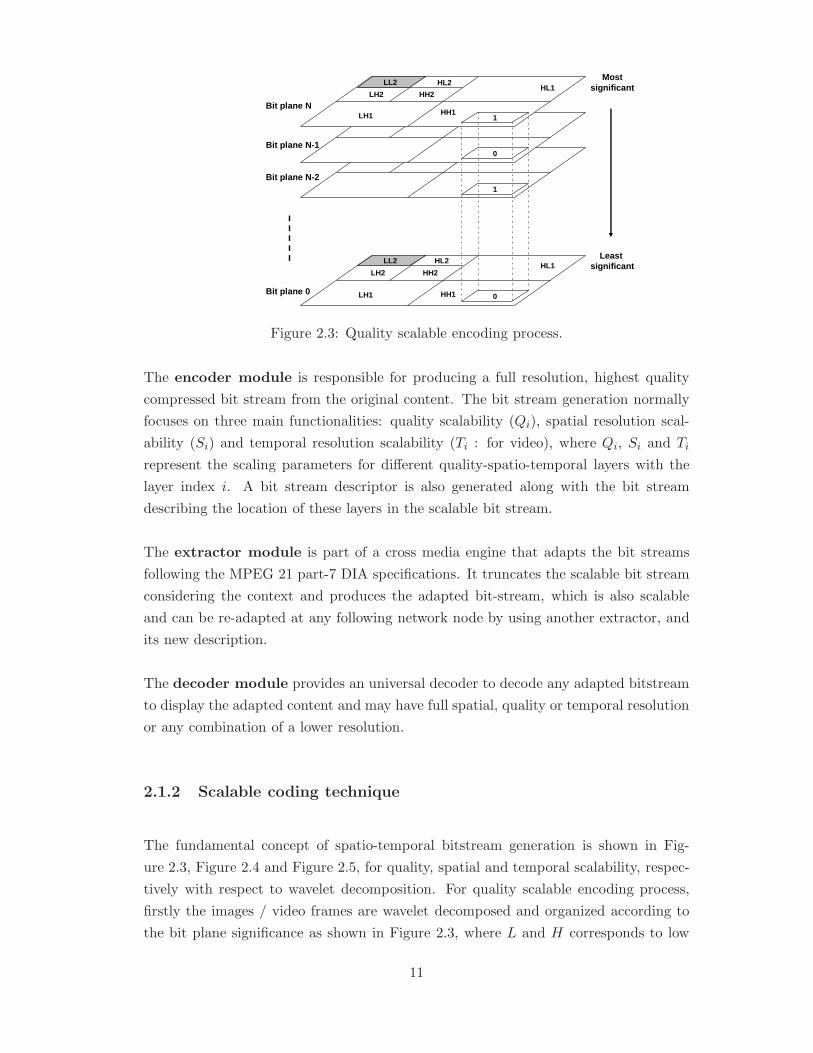
The fundamental concept of spatio-temporal bitstream generation is shown in Fig-
ure 2.3, Figure 2.4 and Figure 2.5, for quality, spatial and temporal scalability, respec-
tively with respect to wavelet decomposition. For quality scalable encoding process,
firstly the images / video frames are wavelet decomposed and organized according to
the bit plane significance as shown in Figure 2.3, where L and H corresponds to low
11
LL1 HL1
LH1 HH1
HH2HL2
LH2LL2
Quarter Resolution
Half Resolution
Full Resolution
Figure 2.4: Spatial resolution scalable encoding process.
pass and high pass frequency decompositions, respectively. During the quality scaling,
bit values from the selected bit planes are considered in a hierarchical order starting
from most significant bit plane to least significant bit plane until the target bit rate is
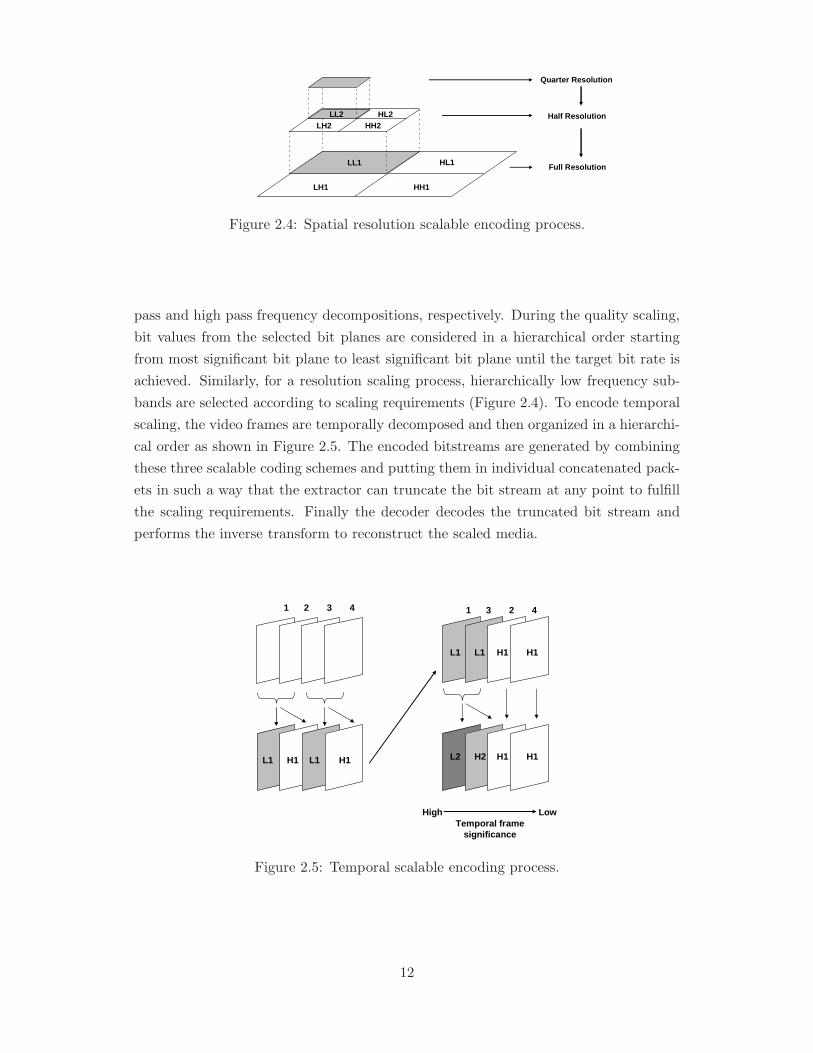
achieved. Similarly, for a resolution scaling process, hierarchically low frequency sub-
bands are selected according to scaling requirements (Figure 2.4). To encode temporal
scaling, the video frames are temporally decomposed and then organized in a hierarchi-
cal order as shown in Figure 2.5. The encoded bitstreams are generated by combining
these three scalable coding schemes and putting them in individual concatenated pack-
ets in such a way that the extractor can truncate the bit stream at any point to fulfill
the scaling requirements. Finally the decoder decodes the truncated bit stream and
performs the inverse transform to reconstruct the scaled media.
1 2 3 4 1 3 2 4
L1 H1 L1 H1
L1 L1 H1 H1
L2 H2 H1 H1
Temporal frame significance
High Low
Figure 2.5: Temporal scalable encoding process.
12
Sl No. Name Description
1 Broadcast monitoringPassive monitoring by the automatic watermark detection of broadcasted watermarked media.
2 Copyright identificationResolving copyright issues of digital media by using watermark information as copyright data.
3 Content authenticationAuthentication of original art work, performance and protection against digital forgery.
4 Access control Access control applications, such as, Pay-TV.5 Copy control Disabling copy of CD / DVD etc. by watermarked permission.
6 Packaging and trackingTransaction tracking and protection against forged consumable items including pharmaceutical products by embedding watermark on packaging.
7Medical record authentication
Authentication of digitally preserved patient's medical record, including blood sample, X-ray, ECG etc.
8Insurance / Banking document authentication
Digital authentication of insurance claim, banking, financial, mortgage and corporate documents.
9 Media piracy control Tracking of the source of media piracy.
10 Ownership identification Supproting legitimate claim, such as, royalty by the media owner.
11 Transaction tracking Tracking of media ownership in a buyer-seller scenario. 12 Meta-data hiding Hiding meta-data within the media instead of a big header.
13 Video summary creationInstant retrieval of video summary by embedding the summary within the host video.
14Video hosting authentication
Piracy control by video authentication at video hosting servers, including youtube, megavideo etc.
Watermarking Applications
Figure 2.6: Watermarking applications.
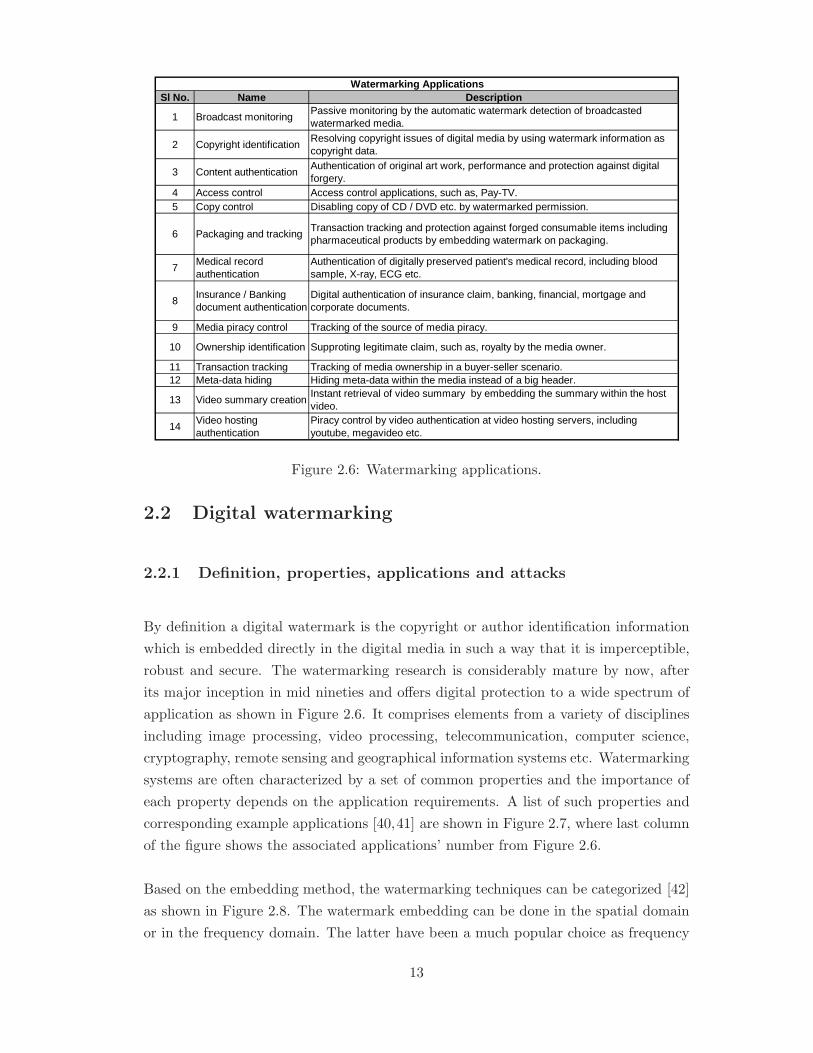
2.2 Digital watermarking
2.2.1 Definition, properties, applications and attacks
By definition a digital watermark is the copyright or author identification information
which is embedded directly in the digital media in such a way that it is imperceptible,
robust and secure. The watermarking research is considerably mature by now, after
its major inception in mid nineties and offers digital protection to a wide spectrum of
application as shown in Figure 2.6. It comprises elements from a variety of disciplines
including image processing, video processing, telecommunication, computer science,
cryptography, remote sensing and geographical information systems etc. Watermarking
systems are often characterized by a set of common properties and the importance of
each property depends on the application requirements. A list of such properties and
corresponding example applications [40,41] are shown in Figure 2.7, where last column
of the figure shows the associated applications’ number from Figure 2.6.
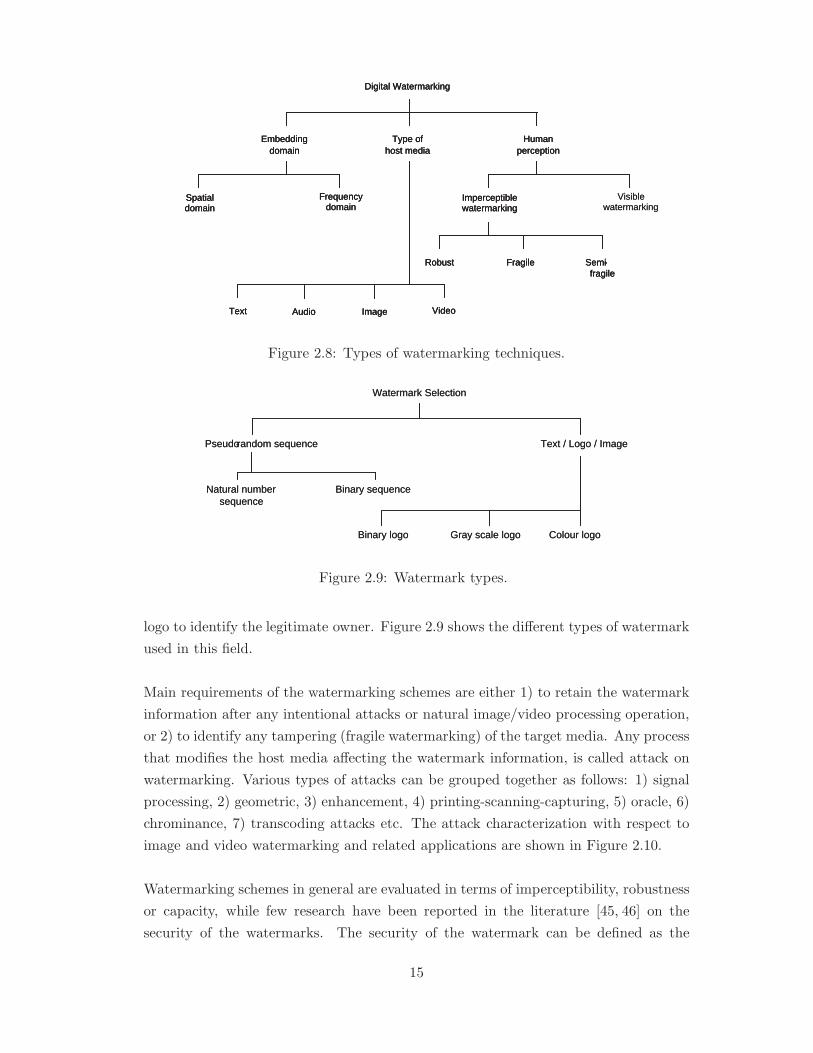
Based on the embedding method, the watermarking techniques can be categorized [42]
as shown in Figure 2.8. The watermark embedding can be done in the spatial domain
or in the frequency domain. The latter have been a much popular choice as frequency
13
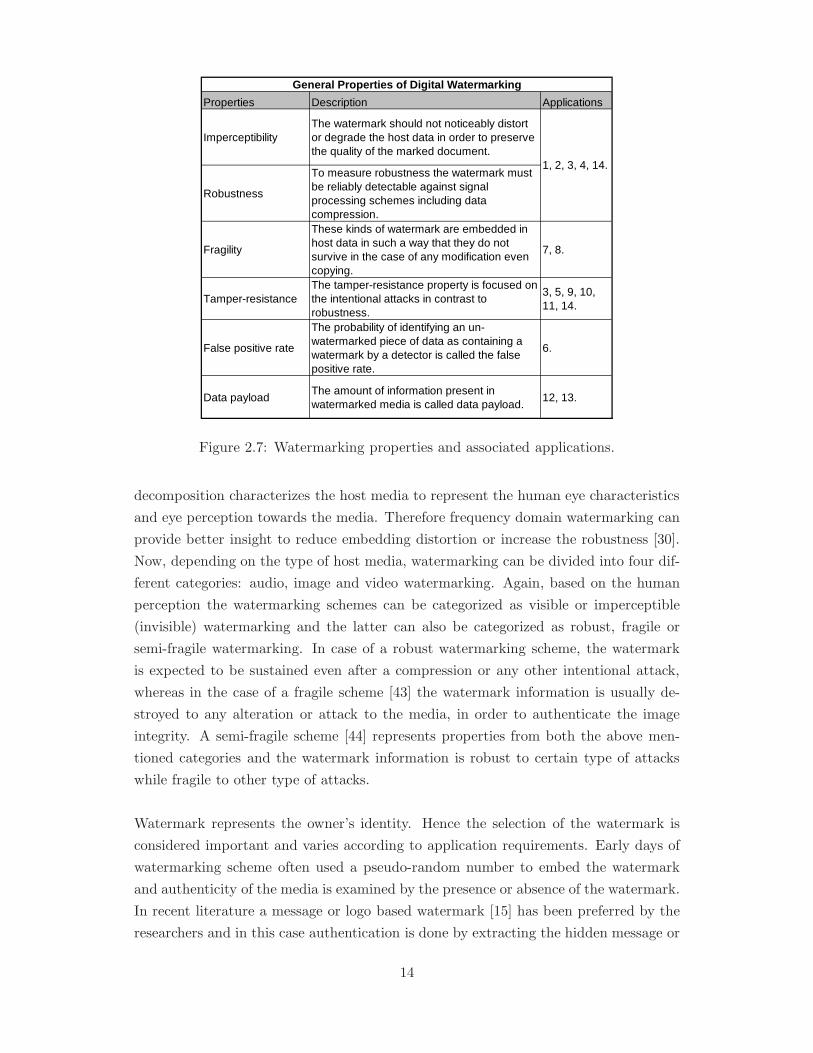
Properties Description Applications
ImperceptibilityThe watermark should not noticeably distort or degrade the host data in order to preserve the quality of the marked document.
Robustness
To measure robustness the watermark must be reliably detectable against signal processing schemes including data compression.
Fragility
These kinds of watermark are embedded in host data in such a way that they do not survive in the case of any modification even copying.
7, 8.
Tamper-resistanceThe tamper-resistance property is focused on the intentional attacks in contrast to robustness.
3, 5, 9, 10, 11, 14.
False positive rate
The probability of identifying an un-watermarked piece of data as containing a watermark by a detector is called the false positive rate.
6.
Data payloadThe amount of information present in watermarked media is called data payload.
12, 13.
General Properties of Digital Watermarking
1, 2, 3, 4, 14.
Figure 2.7: Watermarking properties and associated applications.
decomposition characterizes the host media to represent the human eye characteristics
and eye perception towards the media. Therefore frequency domain watermarking can
provide better insight to reduce embedding distortion or increase the robustness [30].
Now, depending on the type of host media, watermarking can be divided into four dif-
ferent categories: audio, image and video watermarking. Again, based on the human
perception the watermarking schemes can be categorized as visible or imperceptible
(invisible) watermarking and the latter can also be categorized as robust, fragile or
semi-fragile watermarking. In case of a robust watermarking scheme, the watermark
is expected to be sustained even after a compression or any other intentional attack,
whereas in the case of a fragile scheme [43] the watermark information is usually de-
stroyed to any alteration or attack to the media, in order to authenticate the image
integrity. A semi-fragile scheme [44] represents properties from both the above men-
tioned categories and the watermark information is robust to certain type of attacks
while fragile to other type of attacks.
Watermark represents the owner’s identity. Hence the selection of the watermark is
considered important and varies according to application requirements. Early days of
watermarking scheme often used a pseudo-random number to embed the watermark
and authenticity of the media is examined by the presence or absence of the watermark.
In recent literature a message or logo based watermark [15] has been preferred by the
researchers and in this case authentication is done by extracting the hidden message or
14
Visible watermarking
Digital Watermarking
Embedding domain
Type of host media
Human perception
Spatial domain
Frequency domain
Imperceptible watermarking
Robust Fragile Semi - fragile
Text Video Audio Image
Visible watermarking
Digital Watermarking
Embedding domain
Type of host media
Human perception
Spatial domain
Frequency domain
Imperceptible watermarking
Robust Fragile Semi - fragile
Text Video Audio Image
Digital Watermarking
Embedding domain
Type of host media
Human perception
Spatial domain
Frequency domain
Imperceptible watermarking
Robust Fragile Semi - fragile
Text Video Audio Image
Figure 2.8: Types of watermarking techniques.
Watermark Selection
Pseudo - random sequence Text / Logo / Image
Natural number sequence
Binary sequence
Binary logo Gray scale logo Colour logo
Watermark Selection
Pseudo - random sequence Text / Logo / Image
Natural number sequence
Binary sequence
Binary logo Gray scale logo Colour logo
Figure 2.9: Watermark types.
logo to identify the legitimate owner. Figure 2.9 shows the different types of watermark
used in this field.
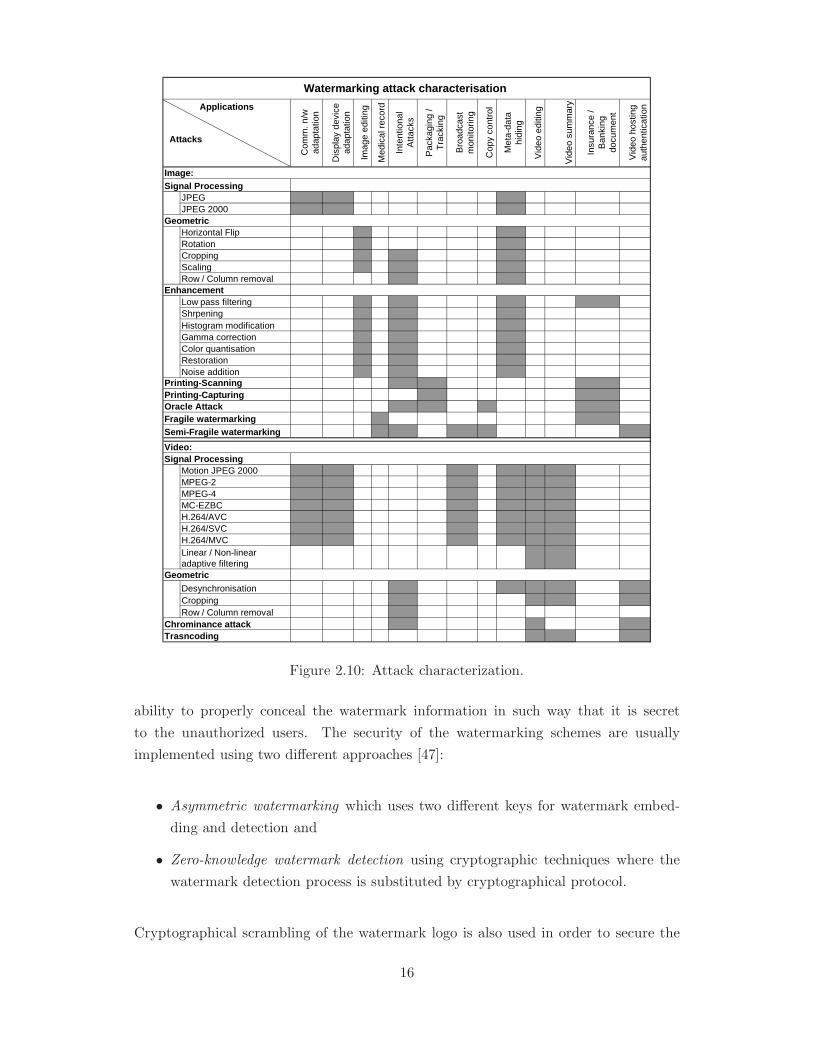
Main requirements of the watermarking schemes are either 1) to retain the watermark
information after any intentional attacks or natural image/video processing operation,
or 2) to identify any tampering (fragile watermarking) of the target media. Any process
that modifies the host media affecting the watermark information, is called attack on
watermarking. Various types of attacks can be grouped together as follows: 1) signal
processing, 2) geometric, 3) enhancement, 4) printing-scanning-capturing, 5) oracle, 6)
chrominance, 7) transcoding attacks etc. The attack characterization with respect to
image and video watermarking and related applications are shown in Figure 2.10.
Watermarking schemes in general are evaluated in terms of imperceptibility, robustness
or capacity, while few research have been reported in the literature [45, 46] on the
security of the watermarks. The security of the watermark can be defined as the
15
Signal ProcessingJPEGJPEG 2000
GeometricHorizontal FlipRotationCroppingScalingRow / Column removal
Low pass filteringShrpeningHistogram modificationGamma correctionColor quantisationRestorationNoise addition
Signal ProcessingMotion JPEG 2000MPEG-2MPEG-4MC-EZBCH.264/AVCH.264/SVCH.264/MVCLinear / Non-linear adaptive filtering
DesynchronisationCroppingRow / Column removal
Watermarking attack characterisation
Video:
Vid
eo h
ostin
g au
then
ticat
ion
Image:
Met
a-da
ta
hidi
ng
Vid
eo e
ditin
g
Vid
eo s
umm
ary
Insu
ranc
e /
Ban
king
do
cum
ent
Inte
ntio
nal
Atta
cks
Pac
kagi
ng /
Tra
ckin
g
Bro
adca
st
mon
itorin
g
Cop
y co
ntro
l
Com
m. n
/w
adap
tatio
n
Dis
play
dev
ice
adap
tatio
n
Imag
e ed
iting
Med
ical
rec
ord
Geometric
Chrominance attackTrasncoding
Oracle AttackFragile watermarking
Applications
Attacks
Semi-Fragile watermarking
Enhancement
Printing-ScanningPrinting-Capturing
Figure 2.10: Attack characterization.
ability to properly conceal the watermark information in such way that it is secret
to the unauthorized users. The security of the watermarking schemes are usually
implemented using two different approaches [47]:
• Asymmetric watermarking which uses two different keys for watermark embed-
ding and detection and
• Zero-knowledge watermark detection using cryptographic techniques where the
watermark detection process is substituted by cryptographical protocol.
Cryptographical scrambling of the watermark logo is also used in order to secure the
16
watermark [15] in addition to the other security measures, such as, key based coefficient
selection, random filter parameter selection etc. These are particularly useful when the
attacker has access to the watermark detector. The security of the watermark is intend
to make the scheme robust against intentional attacks whereas this thesis considers
watermarking robustness to natural signal processing attacks such as compression.
Therefore the security aspects of the watermarking techniques have not been analyzed
further.
The scalable content adaptation, which compresses image and video during the scaling
operation, is considered as a type of signal processing attack to watermarking. Con-
sidering the nature of UMA application scenario, watermarking schemes for scalable
coded media focuses on two main properties: 1) imperceptibility and 2) robustness,
which are complementary to each other. This thesis provides an insight on the effects
of content adaptation on watermarking within the scalable coded media and suggested
robust watermarking techniques accordingly.
2.2.2 Watermarking process
The watermarking procedure, in its basic form, consists of two main processes: 1)
Embedding and 2) Extraction and authentication. At this point, for simplicity, we
describe these processes with reference to the image watermarking.
2.2.2.1 Embedding
This process insert or embed the watermark information within the host image by
modifying all or selected pixel values (spatial domain); or coefficients (frequency do-
main), in such a way that the watermark is imperceptible to human eye and is achieved
by minimizing the embedding distortion to the host image. The system block for the
embedding process is shown in Figure 2.11 amd can be expressed as:
I ′ = ζ(I,W ), (2.1)
where I ′ is the watermarked image, I is the original host image, W is the watermark
information and ζ() is the embedding function. The embedding function can further be
categorized in sub-processes: 1) forward transform (for frequency domain), 2) pixel /
coefficient selection, 3) embedding method (additive, multiplicative, quantization etc.)
and 4) inverse transform.
17
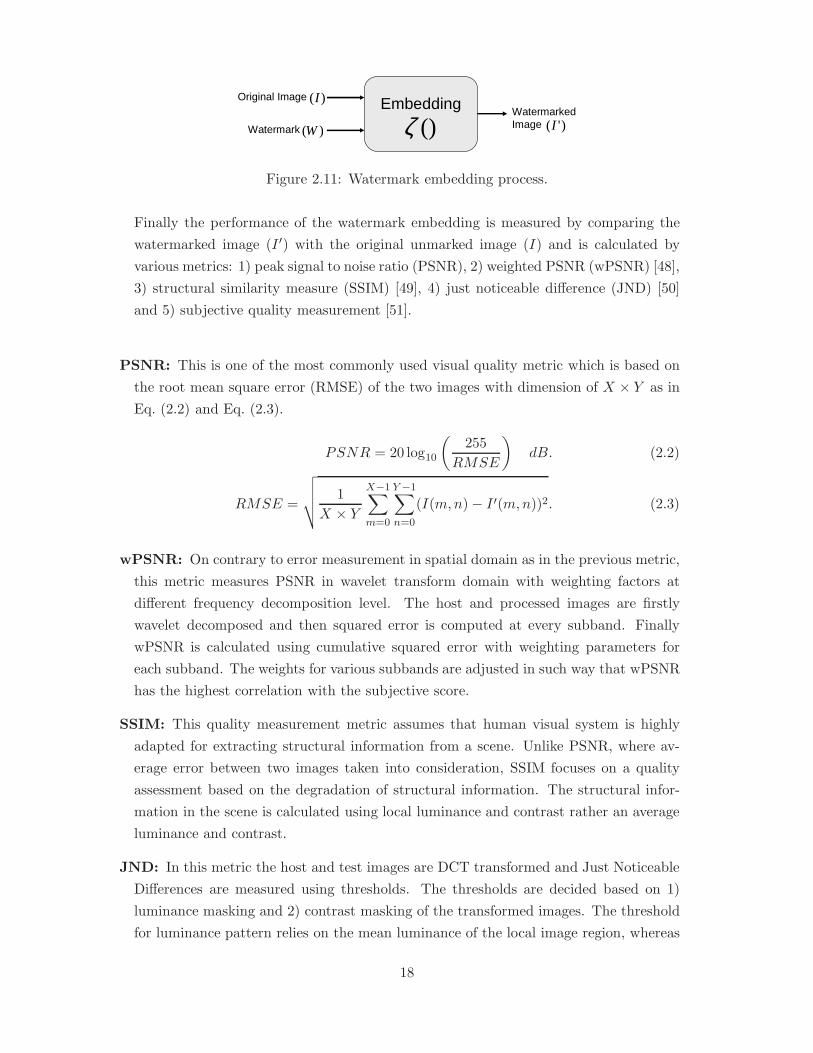
()ζEmbeddingOriginal Image
Watermarked Image
)(I
)'(IWatermark )(W
Figure 2.11: Watermark embedding process.
Finally the performance of the watermark embedding is measured by comparing the
watermarked image (I ′) with the original unmarked image (I) and is calculated by
various metrics: 1) peak signal to noise ratio (PSNR), 2) weighted PSNR (wPSNR) [48],
3) structural similarity measure (SSIM) [49], 4) just noticeable difference (JND) [50]
and 5) subjective quality measurement [51].
PSNR: This is one of the most commonly used visual quality metric which is based on
the root mean square error (RMSE) of the two images with dimension of X × Y as in
Eq. (2.2) and Eq. (2.3).
PSNR = 20 log10
(255
RMSE
)dB. (2.2)
RMSE =
√√√√ 1
X × Y
X−1∑
m=0
Y−1∑
n=0
(I(m,n)− I ′(m,n))2. (2.3)
wPSNR: On contrary to error measurement in spatial domain as in the previous metric,
this metric measures PSNR in wavelet transform domain with weighting factors at
different frequency decomposition level. The host and processed images are firstly
wavelet decomposed and then squared error is computed at every subband. Finally
wPSNR is calculated using cumulative squared error with weighting parameters for
each subband. The weights for various subbands are adjusted in such way that wPSNR
has the highest correlation with the subjective score.
SSIM: This quality measurement metric assumes that human visual system is highly
adapted for extracting structural information from a scene. Unlike PSNR, where av-
erage error between two images taken into consideration, SSIM focuses on a quality
assessment based on the degradation of structural information. The structural infor-
mation in the scene is calculated using local luminance and contrast rather an average
luminance and contrast.
JND: In this metric the host and test images are DCT transformed and Just Noticeable
Differences are measured using thresholds. The thresholds are decided based on 1)
luminance masking and 2) contrast masking of the transformed images. The threshold
for luminance pattern relies on the mean luminance of the local image region, whereas
18
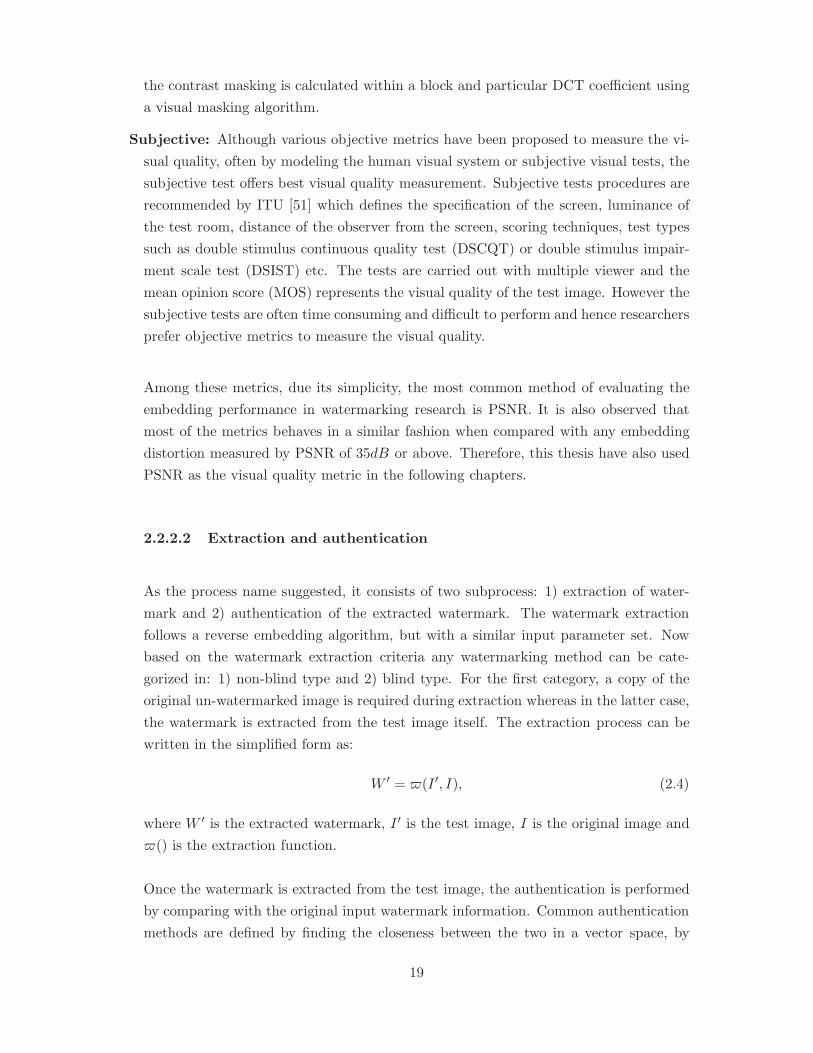
the contrast masking is calculated within a block and particular DCT coefficient using
a visual masking algorithm.
Subjective: Although various objective metrics have been proposed to measure the vi-
sual quality, often by modeling the human visual system or subjective visual tests, the
subjective test offers best visual quality measurement. Subjective tests procedures are
recommended by ITU [51] which defines the specification of the screen, luminance of
the test room, distance of the observer from the screen, scoring techniques, test types
such as double stimulus continuous quality test (DSCQT) or double stimulus impair-
ment scale test (DSIST) etc. The tests are carried out with multiple viewer and the
mean opinion score (MOS) represents the visual quality of the test image. However the
subjective tests are often time consuming and difficult to perform and hence researchers
prefer objective metrics to measure the visual quality.
Among these metrics, due its simplicity, the most common method of evaluating the
embedding performance in watermarking research is PSNR. It is also observed that
most of the metrics behaves in a similar fashion when compared with any embedding
distortion measured by PSNR of 35dB or above. Therefore, this thesis have also used
PSNR as the visual quality metric in the following chapters.
2.2.2.2 Extraction and authentication
As the process name suggested, it consists of two subprocess: 1) extraction of water-
mark and 2) authentication of the extracted watermark. The watermark extraction
follows a reverse embedding algorithm, but with a similar input parameter set. Now
based on the watermark extraction criteria any watermarking method can be cate-
gorized in: 1) non-blind type and 2) blind type. For the first category, a copy of the
original un-watermarked image is required during extraction whereas in the latter case,
the watermark is extracted from the test image itself. The extraction process can be
written in the simplified form as:
W ′ = $(I ′, I), (2.4)
where W ′ is the extracted watermark, I ′ is the test image, I is the original image and
$() is the extraction function.
Once the watermark is extracted from the test image, the authentication is performed
by comparing with the original input watermark information. Common authentication
methods are defined by finding the closeness between the two in a vector space, by
19
()ϖExtractionTest Image Extracted
watermark)'(I )'(W
Original Image(for non-blind type)
)(I Original watermark )(W
Watermark detectiondecision
Authenti-cation
Figure 2.12: Watermark extraction and authentication process.
calculating the similarity correlation or Hamming distance. A complete system diagram
of extraction and authentication process is shown in Figure 2.12.
2.2.3 Wavelet-based watermarking
Embedding watermark information by modifying direct pixel values, can be referred as
the simplest form of the watermarking process. But eventually, the frequency domain
watermarking schemes received more attention due its ability to decompose the media
information in various frequency spaces. Research conducted by Cox et al. [30] indi-
cates that in order to increase the robustness and reliability, the watermark should be
embedded in the significant part such as low frequency components of the host media.
The frequency domain watermarking schemes are exploited using different frequency
domain analysis, namely, discrete Fourier transform (DFT) [52], fractal transform [53],
discrete cosine transform (DCT) [54–56], digital wavelet transform (DWT) [5–11]. Due
to its efficient multi-resolution spatio-frequency representation of signals, the DWT has
become the main transform used in image watermarking.
An extension of image watermarking to video is the easiest option for any video water-
marking scheme. Frame-by-frame video watermarking [27, 30] and 3D wavelet based
video watermarking schemes [9, 32] are available in the literature. However a direct
extension of the image watermarking schemes without consideration of motion, pro-
duces flicker and other motion related mismatch. The watermarking algorithms along
with MCTF, which decomposes motion information, provides a better solution to this
problem [57].
Therefore, this thesis focuses on wavelet based image watermarking research and ex-
tends the outcomes to video watermarking scenario using a motion compensated video
decomposition. But before continuing with the wavelet based watermarking schemes
and MCTF based video watermarking algorithms, here we like to discuss the back-
ground of the wavelet transform, various wavelet implementations and finally MCTF
concept.
20
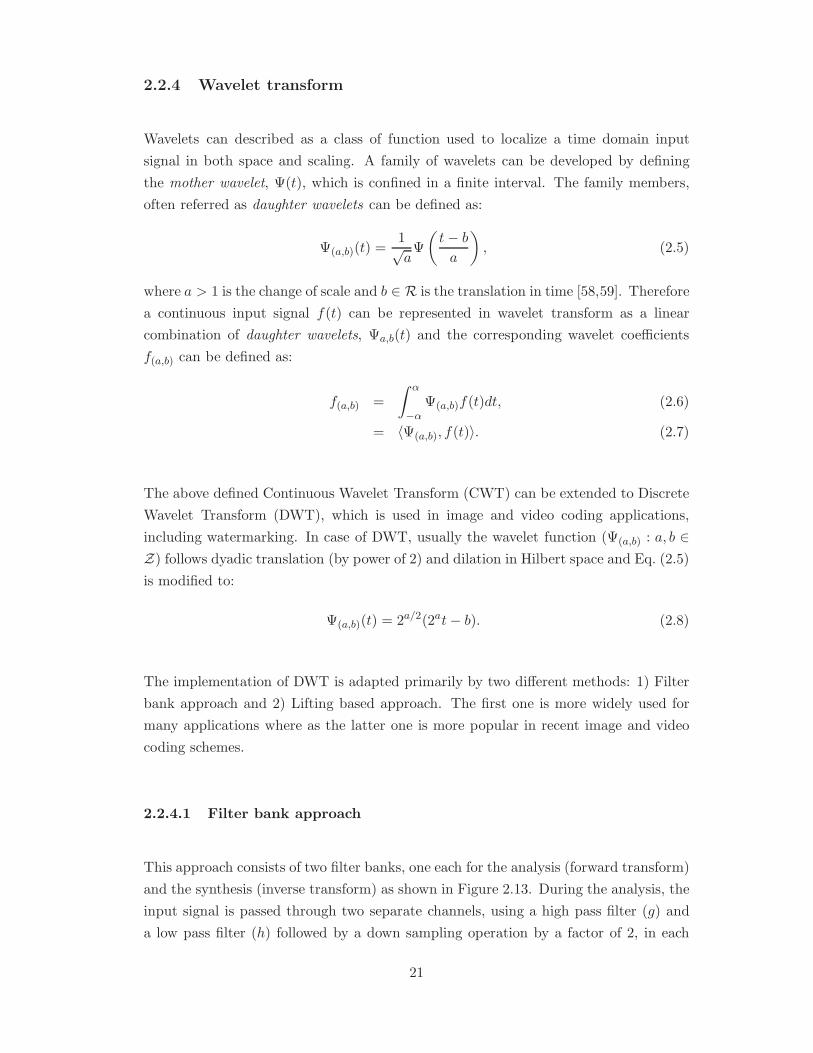
2.2.4 Wavelet transform
Wavelets can described as a class of function used to localize a time domain input
signal in both space and scaling. A family of wavelets can be developed by defining
the mother wavelet, Ψ(t), which is confined in a finite interval. The family members,
often referred as daughter wavelets can be defined as:
Ψ(a,b)(t) =1√aΨ
(t− b
a
), (2.5)
where a > 1 is the change of scale and b ∈ R is the translation in time [58,59]. Therefore
a continuous input signal f(t) can be represented in wavelet transform as a linear
combination of daughter wavelets, Ψa,b(t) and the corresponding wavelet coefficients
f(a,b) can be defined as:
f(a,b) =
∫ α
−αΨ(a,b)f(t)dt, (2.6)
= 〈Ψ(a,b), f(t)〉. (2.7)
The above defined Continuous Wavelet Transform (CWT) can be extended to Discrete
Wavelet Transform (DWT), which is used in image and video coding applications,
including watermarking. In case of DWT, usually the wavelet function (Ψ(a,b) : a, b ∈Z) follows dyadic translation (by power of 2) and dilation in Hilbert space and Eq. (2.5)
is modified to:
Ψ(a,b)(t) = 2a/2(2at− b). (2.8)
The implementation of DWT is adapted primarily by two different methods: 1) Filter
bank approach and 2) Lifting based approach. The first one is more widely used for
many applications where as the latter one is more popular in recent image and video
coding schemes.
2.2.4.1 Filter bank approach
This approach consists of two filter banks, one each for the analysis (forward transform)
and the synthesis (inverse transform) as shown in Figure 2.13. During the analysis, the
input signal is passed through two separate channels, using a high pass filter (g) and
a low pass filter (h) followed by a down sampling operation by a factor of 2, in each
21
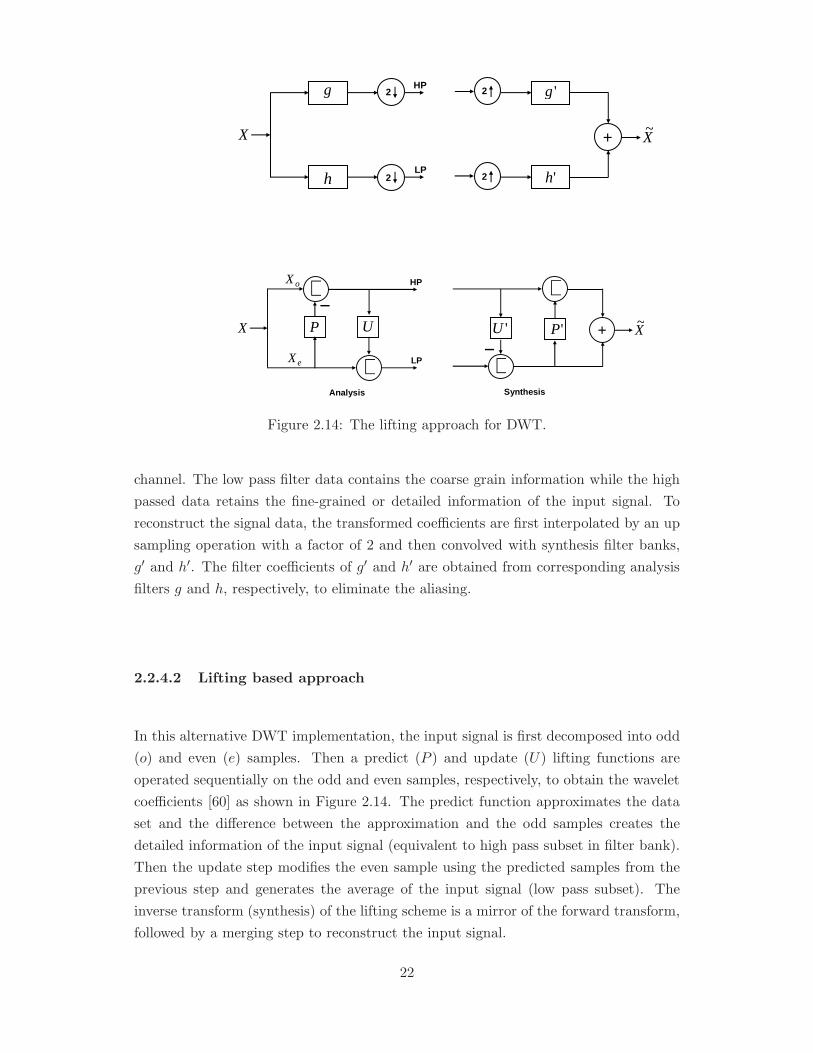
2
2
2
2h
g
'h
'g
X~X +
HP
LP
Analysis Synthesis
Figure 2.13: The filter bank approach for DWT.
PX U
+−
+
oX
eX
HP
LP
'U 'P
+−
+
X~
+
Analysis Synthesis
Figure 2.14: The lifting approach for DWT.
channel. The low pass filter data contains the coarse grain information while the high
passed data retains the fine-grained or detailed information of the input signal. To
reconstruct the signal data, the transformed coefficients are first interpolated by an up
sampling operation with a factor of 2 and then convolved with synthesis filter banks,
g′ and h′. The filter coefficients of g′ and h′ are obtained from corresponding analysis
filters g and h, respectively, to eliminate the aliasing.
2.2.4.2 Lifting based approach
In this alternative DWT implementation, the input signal is first decomposed into odd
(o) and even (e) samples. Then a predict (P ) and update (U) lifting functions are
operated sequentially on the odd and even samples, respectively, to obtain the wavelet
coefficients [60] as shown in Figure 2.14. The predict function approximates the data
set and the difference between the approximation and the odd samples creates the
detailed information of the input signal (equivalent to high pass subset in filter bank).
Then the update step modifies the even sample using the predicted samples from the
previous step and generates the average of the input signal (low pass subset). The
inverse transform (synthesis) of the lifting scheme is a mirror of the forward transform,
followed by a merging step to reconstruct the input signal.
22
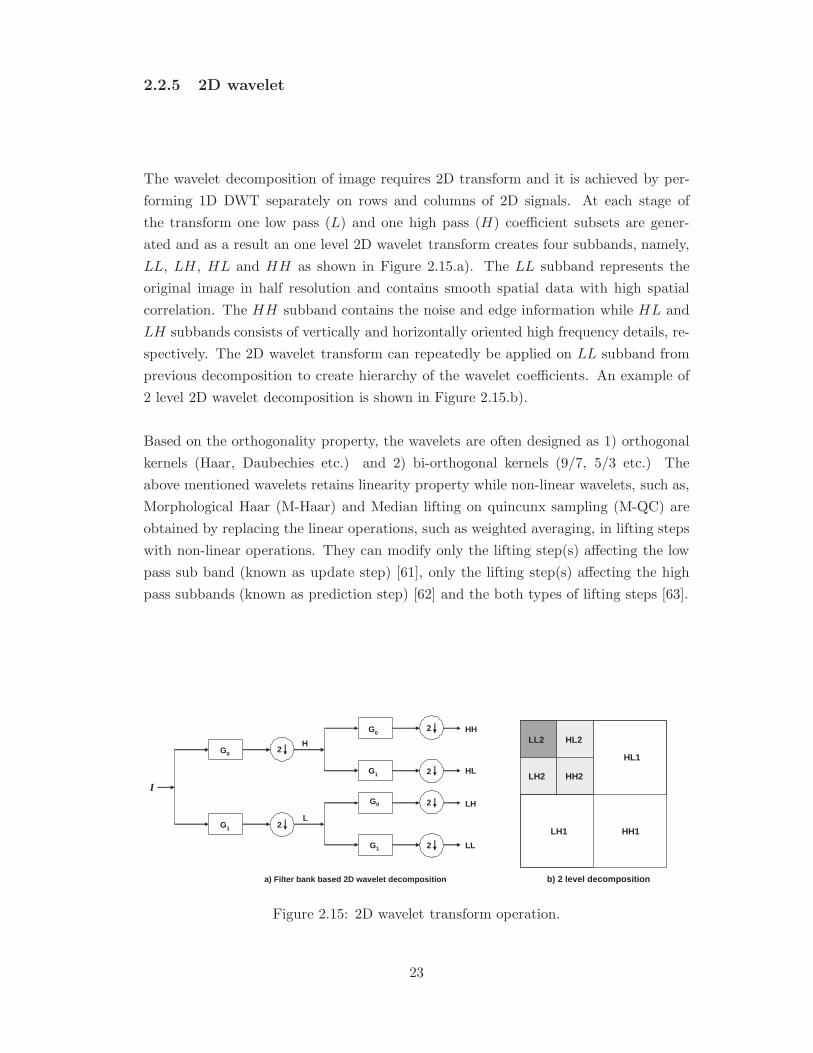
2.2.5 2D wavelet
The wavelet decomposition of image requires 2D transform and it is achieved by per-
forming 1D DWT separately on rows and columns of 2D signals. At each stage of
the transform one low pass (L) and one high pass (H) coefficient subsets are gener-
ated and as a result an one level 2D wavelet transform creates four subbands, namely,
LL, LH, HL and HH as shown in Figure 2.15.a). The LL subband represents the
original image in half resolution and contains smooth spatial data with high spatial
correlation. The HH subband contains the noise and edge information while HL and
LH subbands consists of vertically and horizontally oriented high frequency details, re-
spectively. The 2D wavelet transform can repeatedly be applied on LL subband from
previous decomposition to create hierarchy of the wavelet coefficients. An example of
2 level 2D wavelet decomposition is shown in Figure 2.15.b).
Based on the orthogonality property, the wavelets are often designed as 1) orthogonal
kernels (Haar, Daubechies etc.) and 2) bi-orthogonal kernels (9/7, 5/3 etc.) The
above mentioned wavelets retains linearity property while non-linear wavelets, such as,
Morphological Haar (M-Haar) and Median lifting on quincunx sampling (M-QC) are
obtained by replacing the linear operations, such as weighted averaging, in lifting steps
with non-linear operations. They can modify only the lifting step(s) affecting the low
pass sub band (known as update step) [61], only the lifting step(s) affecting the high
pass subbands (known as prediction step) [62] and the both types of lifting steps [63].
2
2
H
L
2
2
HH
HL
2
2
LH
LL
a) Filter bank based 2D wavelet decomposition
G 0
G 1
G 0
G 0
G 1
G 1
I
HH1
HL1
LH1
HH2 LH2
HL2 LL2
b) 2 level decomposition
Figure 2.15: 2D wavelet transform operation.
23
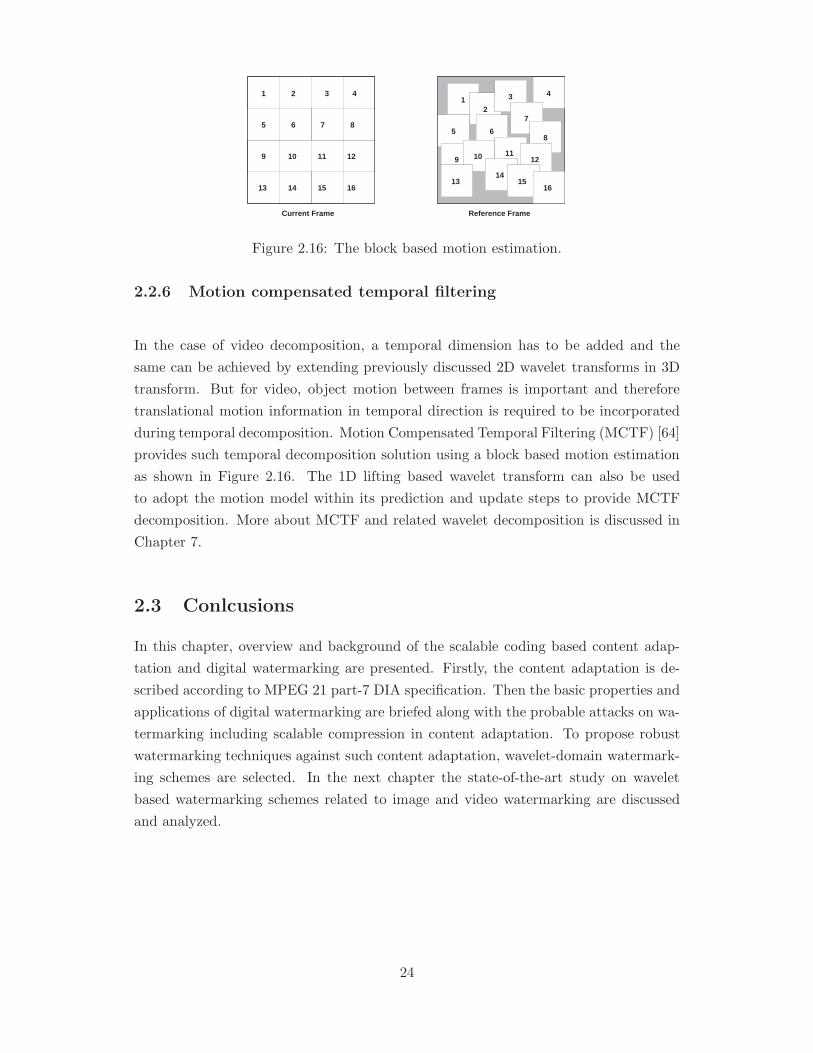
1 2
3 4
5 6
7
8
9 10 11 12
13 14
15 16
1 1 2 2
3 3 4 4
5 5 6 6
7 7
8 8
9 9 10 10 11 11 12 12
13 13 14 14
15 15 16 16
1 2 4
5 6 7 8
9 10 11 12
13 14 15 16
3 1 2 4
5 6 7 8
9 10 11 12
13 14 15 16
3
Reference Frame Current Frame
Figure 2.16: The block based motion estimation.
2.2.6 Motion compensated temporal filtering
In the case of video decomposition, a temporal dimension has to be added and the
same can be achieved by extending previously discussed 2D wavelet transforms in 3D
transform. But for video, object motion between frames is important and therefore
translational motion information in temporal direction is required to be incorporated
during temporal decomposition. Motion Compensated Temporal Filtering (MCTF) [64]
provides such temporal decomposition solution using a block based motion estimation
as shown in Figure 2.16. The 1D lifting based wavelet transform can also be used
to adopt the motion model within its prediction and update steps to provide MCTF
decomposition. More about MCTF and related wavelet decomposition is discussed in
Chapter 7.
2.3 Conlcusions
In this chapter, overview and background of the scalable coding based content adap-
tation and digital watermarking are presented. Firstly, the content adaptation is de-
scribed according to MPEG 21 part-7 DIA specification. Then the basic properties and
applications of digital watermarking are briefed along with the probable attacks on wa-
termarking including scalable compression in content adaptation. To propose robust
watermarking techniques against such content adaptation, wavelet-domain watermark-
ing schemes are selected. In the next chapter the state-of-the-art study on wavelet
based watermarking schemes related to image and video watermarking are discussed
and analyzed.
24

Chapter 3
State-of-the-art
Image and video watermarking can be performed either in the pixel domain or in the
frequency domain. Frequency domain watermarking, more recently wavelet domain
watermarking schemes are preferred due to its increased robustness and reliability by
choosing important frequency components. At the same time scalable image and video
coding schemes, i.e., JPEG 2000, Motion JPEG 2000, MC-EZBC, and H.264/SVC uses
wavelets and related transforms for progressive transmission of media data with low
bit-rate, resolution, quality or a temporal scalability. Therefore an increased interest
in wavelet domain watermarking is noticed in the recent literature. Due to its multi-
resolution anlysis and compliance with image and video coding schemes, DWT is a
natural choice for robust watermarking research for scalable coded image and video, in
this thesis. This chapter discusses about the state-of-the-art researches, published in
this domain.
3.1 Image watermarking
3.1.1 Wavelet-based image watermarking
Due to its ability for efficient multi-resolution spatio-frequency representation of sig-
nals, the DWT has become the major transform for spread spectrum watermarking.
The wavelet domain watermarking algorithms often share a common model. Based
on the embedding methodology, wavelet-based image watermarking can be catego-
rized into two main classes: uncompressed domain algorithms and joint compression-
25
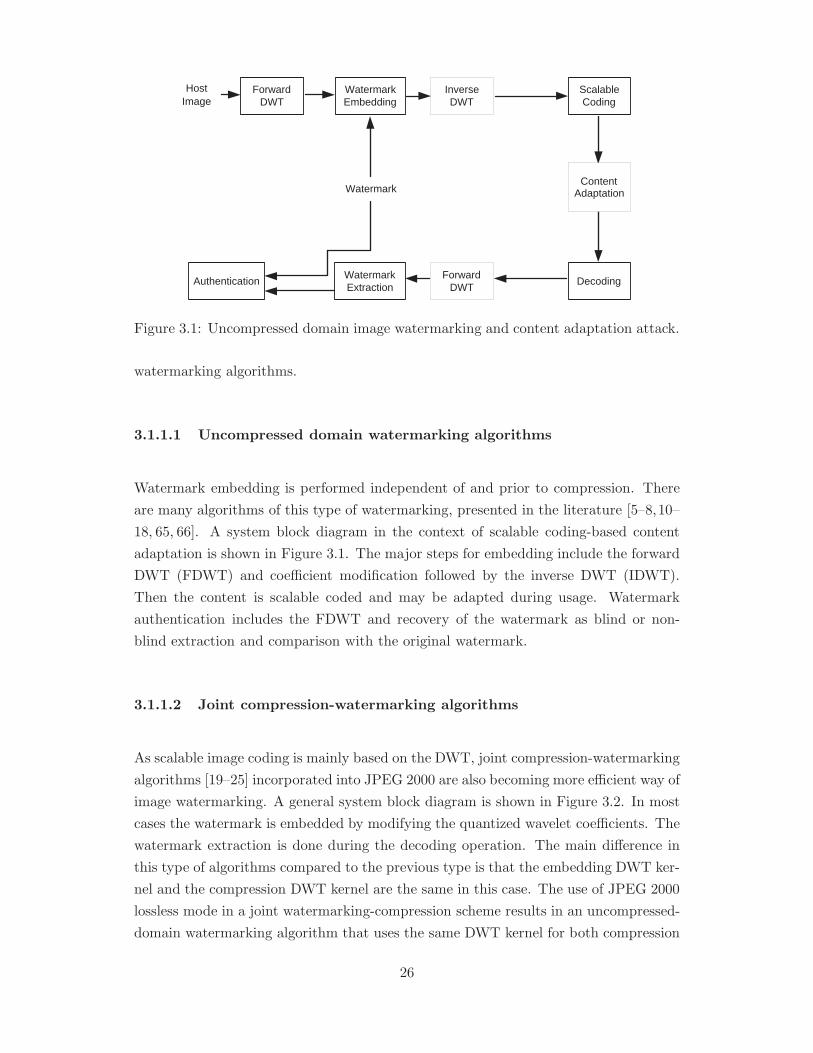
Forward DWT
Host Image
Watermark Embedding
Scalable Coding
Decoding Watermark Extraction
Authentication
Content Adaptation Watermark
Inverse DWT
Forward DWT
Figure 3.1: Uncompressed domain image watermarking and content adaptation attack.
watermarking algorithms.
3.1.1.1 Uncompressed domain watermarking algorithms
Watermark embedding is performed independent of and prior to compression. There
are many algorithms of this type of watermarking, presented in the literature [5–8,10–
18, 65, 66]. A system block diagram in the context of scalable coding-based content
adaptation is shown in Figure 3.1. The major steps for embedding include the forward
DWT (FDWT) and coefficient modification followed by the inverse DWT (IDWT).
Then the content is scalable coded and may be adapted during usage. Watermark
authentication includes the FDWT and recovery of the watermark as blind or non-
blind extraction and comparison with the original watermark.
3.1.1.2 Joint compression-watermarking algorithms
As scalable image coding is mainly based on the DWT, joint compression-watermarking
algorithms [19–25] incorporated into JPEG 2000 are also becoming more efficient way of
image watermarking. A general system block diagram is shown in Figure 3.2. In most
cases the watermark is embedded by modifying the quantized wavelet coefficients. The
watermark extraction is done during the decoding operation. The main difference in
this type of algorithms compared to the previous type is that the embedding DWT ker-
nel and the compression DWT kernel are the same in this case. The use of JPEG 2000
lossless mode in a joint watermarking-compression scheme results in an uncompressed-
domain watermarking algorithm that uses the same DWT kernel for both compression
26

Forward DWT
Host Image Quantisation
Entropy Coding
Bit-stream generator
Watermark Embedding
+
Bit-stream analyser
Entropy Decoding
Watermark Extraction
De- Quantisation
Inverse DWT
Decoded Image
Authentication
Content Adaptation
Figure 3.2: Joint compression-watermarking and content adaptation attack.
and watermark embedding.
3.1.2 Dissection of wavelet-based image watermarking algorithms
In both algorithm types, the watermark embedding algorithm considers different op-
tions for the choice of embedding subbands, for the selection of embedding coefficients
and the modification methodology. In addition to above three parameters for the un-
compressed domain algorithms, the choice of wavelet kernels is also regarded as a design
parameter. In this section the well-known wavelet-based algorithms are dissected in
terms of these four parameters to accumulate different options that have been used so
far in current watermarking algorithms. Currently used different options are listed as
follows:
3.1.2.1 Wavelet kernel
Early work on wavelet-based watermarking used mainly Haar or other Daubechies
family orthogonal wavelets [5–15]. Then with the success of biorthogonal wavelets
in image coding, they have been used in watermarking algorithms [16–18]. Further,
joint compression-watermarking algorithms are also considered as biorthogonal wavelet
domain watermarking. With the introduction of lifting-based wavelet design, lifting-
based integer-to-integer Haar transform [10] and lifting-based non-linear wavelets [16]
have been used in watermarking algorithms. In a recent work [67], the effect of different
wavelet kernels on watermark embedding distortion performance and robustness to
scalable coding-based content adaptation attacks is presented.
27
3.1.2.2 Subband
Wavelet-based watermarking algorithms also vary in terms of the number of wavelet
decomposition levels used and the subbands chosen for watermark embedding. There
have been algorithms using two [5, 6, 10–12], three [16–18] and four [8, 14, 15] levels
of wavelet decompositions. Joint compression-watermarking algorithms used the same
number of levels of decompositions used in the compression algorithm. The choice of
subbands for watermark embedding is often driven by the imperceptibility and robust-
ness criteria. Algorithms intending to meet low embedding distortion and impercepti-
bility requirements use high frequency subbands for embedding [6,7,10–15,20]. On the
other hand, algorithms designed to achieve high robustness against compression use
low frequency subbands for embedding [5, 8, 16]. Finally, algorithms aiming to meet
a balance between these two criterions use all subbands resulting in spread spectrum
embedding [17–19,22].
3.1.2.3 Hosting coefficient
The selection of wavelet coefficients to host the watermark can be classified into three
methods: choosing all coefficients in a subband [11–15,19,21]; using a threshold based
on their magnitude significance [10,17,18,20] or the just noticeable difference (JND) [16];
and based on the median of a 3x1 non-overlapping window, which can be based on the
same subband (Intra-band) [5, 22] or spanning three high frequency subbands in the
same decomposition level (Inter-band) [6, 7]. Some of the all-coefficients-based algo-
rithms use a Human Visual System (HVS)-based mask [13, 14] or a fusion rule-based
mask for refining the selection of host coefficients [15] or key-based random sequence
for ordering host coefficients [8].
3.1.2.4 Embedding method
The host wavelet coefficient modification methods used in wavelet-based watermarking
algorithms can be generalized as follows:
C ′m,n = Cm,n +∆m,n, (3.1)
where C ′m,n is the modified coefficient at (m,n) position, Cm,n is the original value of the
host coefficient and ∆m,n is the amount of modification due to watermark embedding.
The modification methods can be categorized into two classes: modification based on
28
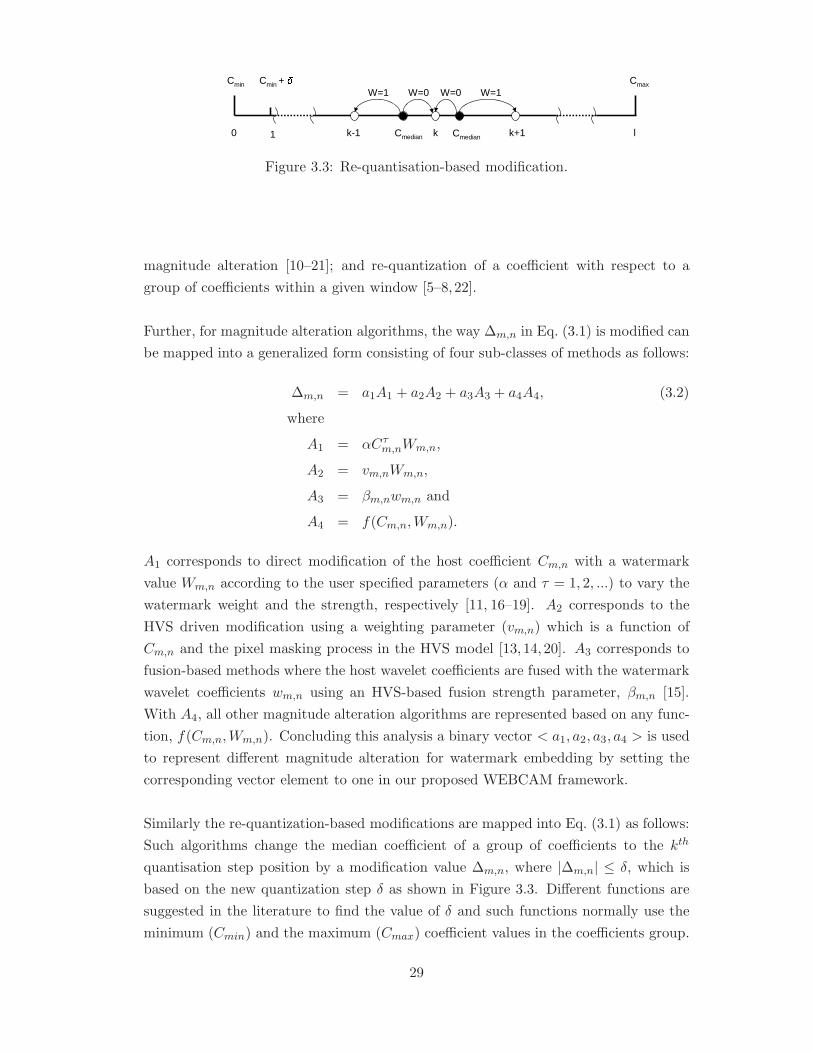
0 1 k-1 k k+1Cmedian l
Cmin + �
CmaxCminW=1 W=0 W=1W=0
Cmedian
Figure 3.3: Re-quantisation-based modification.
magnitude alteration [10–21]; and re-quantization of a coefficient with respect to a
group of coefficients within a given window [5–8,22].
Further, for magnitude alteration algorithms, the way ∆m,n in Eq. (3.1) is modified can
be mapped into a generalized form consisting of four sub-classes of methods as follows:
∆m,n = a1A1 + a2A2 + a3A3 + a4A4, (3.2)
where
A1 = αCτm,nWm,n,
A2 = vm,nWm,n,
A3 = βm,nwm,n and
A4 = f(Cm,n,Wm,n).
A1 corresponds to direct modification of the host coefficient Cm,n with a watermark
value Wm,n according to the user specified parameters (α and τ = 1, 2, ...) to vary the
watermark weight and the strength, respectively [11, 16–19]. A2 corresponds to the
HVS driven modification using a weighting parameter (vm,n) which is a function of
Cm,n and the pixel masking process in the HVS model [13, 14, 20]. A3 corresponds to
fusion-based methods where the host wavelet coefficients are fused with the watermark
wavelet coefficients wm,n using an HVS-based fusion strength parameter, βm,n [15].
With A4, all other magnitude alteration algorithms are represented based on any func-
tion, f(Cm,n,Wm,n). Concluding this analysis a binary vector < a1, a2, a3, a4 > is used
to represent different magnitude alteration for watermark embedding by setting the
corresponding vector element to one in our proposed WEBCAM framework.
Similarly the re-quantization-based modifications are mapped into Eq. (3.1) as follows:
Such algorithms change the median coefficient of a group of coefficients to the kth
quantisation step position by a modification value ∆m,n, where |∆m,n| ≤ δ, which is
based on the new quantization step δ as shown in Figure 3.3. Different functions are
suggested in the literature to find the value of δ and such functions normally use the
minimum (Cmin) and the maximum (Cmax) coefficient values in the coefficients group.
29
They can be generalized into the following form:
δ = f(γ,Cmin, Cmax), (3.3)
where γ is the user defined weighting factor. As ∆m,n depends on the step size δ and
the user defined γ, the modification value ∆m,n is typically a function of Cmin and
Cmax for each group of coefficients. Details of the embedding procedures can be found
in [5] and [7].
The above parametric dissection of state-of-the-art wavelet-based watermarking algo-
rithms, in terms of wavelet kernel, subband, host coefficient and embedding method, is
used to design and implement the tools repository and the modular and reconfigurable
wavelet-based watermarking implementation is presented as WEBCAM framework in
Chapter 4. The comparative study of various input parameters, as mentioned above,
are also performed in Chapter 4 by experimental simulations.
3.2 Video watermarking
3.2.1 Uncompressed and compressed domain video watermarking
Video watermarking at its simplest form can be proposed by extending image water-
marking algorithms in the individual video frames considering the video as a collection
of frames. However frame-by-frame video watermarking without considering the tempo-
ral correlation in video often suffers from flickering problem and poor robustness perfor-
mance against various video processing attacks, such as, collusion, de-synchronization
and compression. Solutions are proposed in the literature by proposing 3D wavelet
decomposition, watermarking in compressed domain etc. Similar to the state of the
art image watermarking techniques, these video watermarking algorithms can be cat-
egorized in 1) Uncompressed domain and 2) Compressed domain algorithms.
3.2.1.1 Uncompressed domain algorithms
Similar to the uncompressed domain image watermarking, the algorithms in this cat-
egory embed the watermark in video before video encoding and the embedding algo-
rithms are independent of the video coding algorithms. Many such algorithms, of-
fered in the literature [9,27,28,30–32,57,68–81], often, extend the image watermarking
30
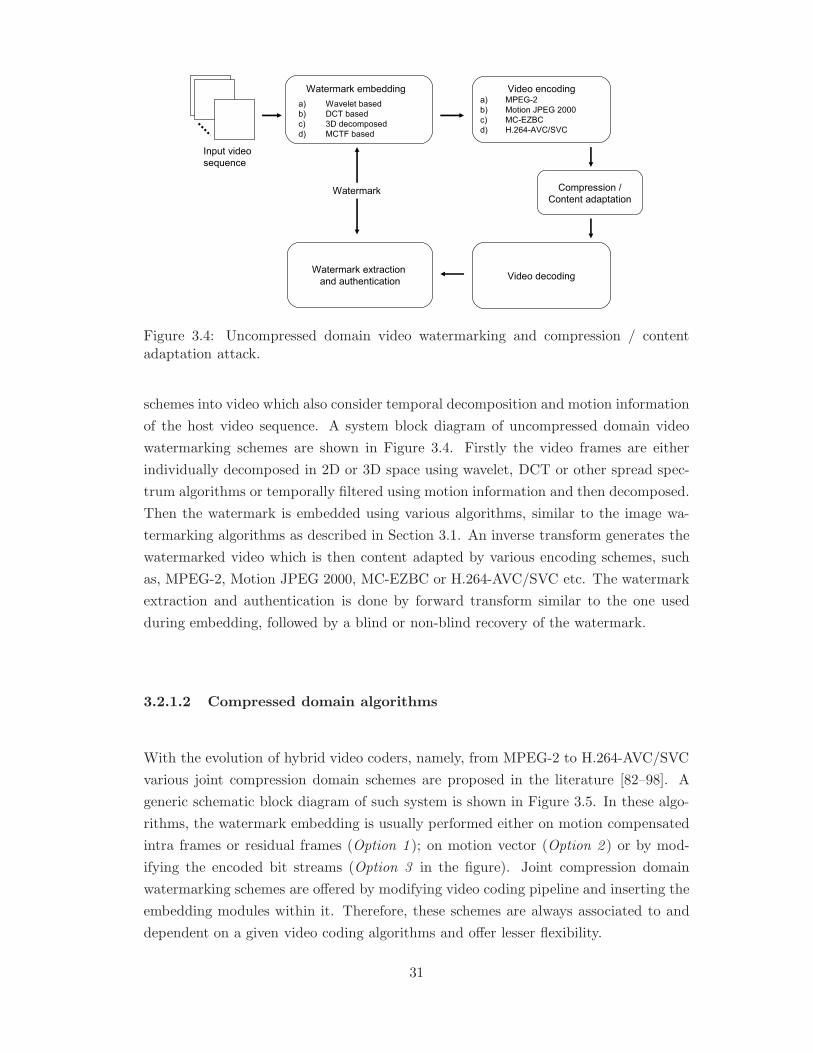
Figure 3.4: Uncompressed domain video watermarking and compression / contentadaptation attack.
schemes into video which also consider temporal decomposition and motion information
of the host video sequence. A system block diagram of uncompressed domain video
watermarking schemes are shown in Figure 3.4. Firstly the video frames are either
individually decomposed in 2D or 3D space using wavelet, DCT or other spread spec-
trum algorithms or temporally filtered using motion information and then decomposed.
Then the watermark is embedded using various algorithms, similar to the image wa-
termarking algorithms as described in Section 3.1. An inverse transform generates the
watermarked video which is then content adapted by various encoding schemes, such
as, MPEG-2, Motion JPEG 2000, MC-EZBC or H.264-AVC/SVC etc. The watermark
extraction and authentication is done by forward transform similar to the one used
during embedding, followed by a blind or non-blind recovery of the watermark.
3.2.1.2 Compressed domain algorithms
With the evolution of hybrid video coders, namely, from MPEG-2 to H.264-AVC/SVC
various joint compression domain schemes are proposed in the literature [82–98]. A
generic schematic block diagram of such system is shown in Figure 3.5. In these algo-
rithms, the watermark embedding is usually performed either on motion compensated
intra frames or residual frames (Option 1 ); on motion vector (Option 2 ) or by mod-
ifying the encoded bit streams (Option 3 in the figure). Joint compression domain
watermarking schemes are offered by modifying video coding pipeline and inserting the
embedding modules within it. Therefore, these schemes are always associated to and
dependent on a given video coding algorithms and offer lesser flexibility.
31
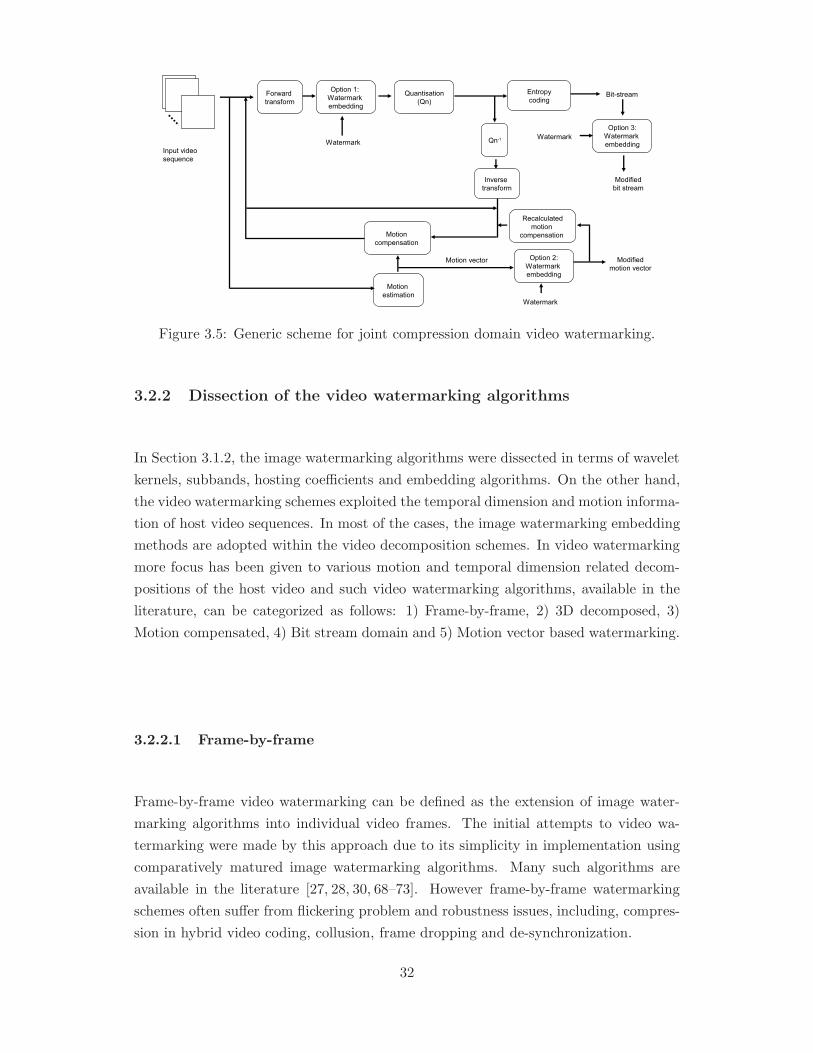
Figure 3.5: Generic scheme for joint compression domain video watermarking.
3.2.2 Dissection of the video watermarking algorithms
In Section 3.1.2, the image watermarking algorithms were dissected in terms of wavelet
kernels, subbands, hosting coefficients and embedding algorithms. On the other hand,
the video watermarking schemes exploited the temporal dimension and motion informa-
tion of host video sequences. In most of the cases, the image watermarking embedding
methods are adopted within the video decomposition schemes. In video watermarking
more focus has been given to various motion and temporal dimension related decom-
positions of the host video and such video watermarking algorithms, available in the
literature, can be categorized as follows: 1) Frame-by-frame, 2) 3D decomposed, 3)
Motion compensated, 4) Bit stream domain and 5) Motion vector based watermarking.
3.2.2.1 Frame-by-frame
Frame-by-frame video watermarking can be defined as the extension of image water-
marking algorithms into individual video frames. The initial attempts to video wa-
termarking were made by this approach due to its simplicity in implementation using
comparatively matured image watermarking algorithms. Many such algorithms are
available in the literature [27, 28, 30, 68–73]. However frame-by-frame watermarking
schemes often suffer from flickering problem and robustness issues, including, compres-
sion in hybrid video coding, collusion, frame dropping and de-synchronization.
32
3.2.2.2 3D decomposed
In order to overcome the weaknesses, as indicated in frame-by-frame video water-
marking, new algorithms are proposed considering the temporal dimension in video
sequences. These algorithms decompose the video by performing spatial 2D trans-
form on individual frames followed by 1D transform in the temporal domain. Various
transforms are proposed in 3D decomposed watermarking schemes, such as, 3D DFT
domain watermarking [74]; 3D DCT domain [75] and more popular multi-resolution 3D
DWT domain watermarking [9, 31,32,76–78]. A multi-level 3D DWT is performed by
recursively applying the above mentioned procedure on low frequency spatio-temporal
subband. Various watermarking methods similar to image watermarking are then ap-
plied to suitable subbands to balance the imperceptibility and robustness. Although 3D
decomposition based methods overcome issues, such as, temporal de-synchronization,
video format conversion, video collusion; 3D decomposition without considering mo-
tion often creates flickering problem and fragile to video compression attacks which
considers motion trajectory during encoding.
3.2.2.3 Motion compensated
Motion compensated decomposition is one of the primary features of the hybrid video
coding schemes, i.e., MPEG-x and H.26x. To offer robust watermarking schemes
against collusion attack and compression attacks in hybrid video coding, motion com-
pensated video watermarking algorithms are proposed in the literature. The account
for motion in these schemes also helps to remove the flicker problem, indicated in the
previous subsections. Various such schemes are proposed in the literature as uncom-
pressed domain [57,79–81] or joint compression domain within MPEG-2 encoder [82–84]
and H.264/AVC encoder [85–87]. In these schemes object motion within the frames
are tracked by motion estimation and motion compensation followed by the transform.
The watermark embedding is usually done on transform coefficients before or after the
quantization process on intra frames or prediction frames.
3.2.2.4 Bit stream domain
In this category the watermark embedding is done on partially decoded bit streams.
Many such algorithms are proposed for MPEG-2 bit streams [88–91] and more recent
H.264/AVC bit stream [92,93]. The major advantage of bit stream domain watermark-
33
ing is that the computational complexity is much lower which leads to a faster water-
mark detection for real time applications. It also prevents the decoding and re-encoding
data loss, when compared to joint compression domain watermarking schemes. In bit
stream domain schemes, usually, the bit-stream is partially decoded by entropy decod-
ing followed by the de-quantization process and the watermark embedding is performed
on the transform coefficients. However any error due to embedding modification in the
bit stream propagates and causes distortion. Various drift compensation algorithms
are suggested in these algorithms to counter such error propagation.
3.2.2.5 Motion vector based
Video watermarking within motion vector can be defined as special case of bit stream
domain watermarking. One of the major motivations of these schemes is that for
any video encoder motion vector is always preserved and encoded with higher priority
and hence less affected by compressions. Therefore any watermark embedding within
motion vector is robust to compression and other attacks. But at the same time any
small change in motion vector can cause a significant distortion in the host video.
However, a careful choice of motion vector to embed the watermark can reduce the
embedding distortion while keeping high robustness. Few such algorithms are proposed
in the literature for MPEG-2 motion vector [94–96] and H.264/AVC motion vector [97,
98]. To avoid significant embedding distortion, in all the cases the watermark capacity
is kept small and various algorithms adopted different methods to select the motion
vectors to be embedded, such as, higher magnitude based [96, 97]; motion estimation
mode selection based [98]; texture based [95] and phase angle based [94].
3.3 Conclusions
In this chapter various image and video watermarking schemes are discussed and
broadly categorized in uncompressed domain and compressed domain. Uncompressed
domain schemes are generally independent of any image and video encoding schemes
and hence more flexible compared to compressed domain algorithms. Therefore in
this thesis we choose to analyze and propose new uncompressed domain image water-
marking and video watermarking schemes based on a motion compensated framework.
From the state of the art analysis, it is evident that although many image watermarking
schemes are proposed towards robustness against JPEG 2000, a little work has been
done on robust video watermarking against scalable coded video and related attacks.
34

Again, within image watermarking schemes a gap is identified to model scalable com-
pression within the watermarking algorithm. Hence, within the scope of this thesis, we
aim to propose improved image watermarking schemes to enhance the robustness and
robust video watermarking techniques to quality scalable content adaptation.
35

36
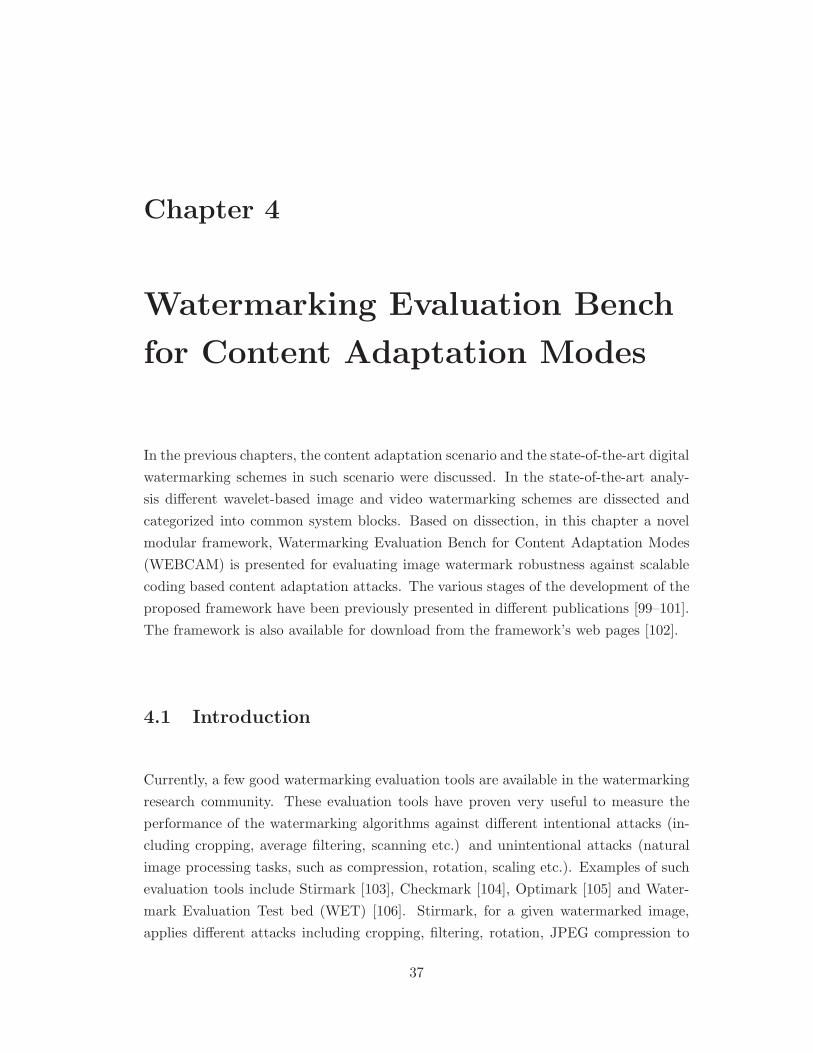
Chapter 4
Watermarking Evaluation Bench
for Content Adaptation Modes
In the previous chapters, the content adaptation scenario and the state-of-the-art digital
watermarking schemes in such scenario were discussed. In the state-of-the-art analy-
sis different wavelet-based image and video watermarking schemes are dissected and
categorized into common system blocks. Based on dissection, in this chapter a novel
modular framework, Watermarking Evaluation Bench for Content Adaptation Modes
(WEBCAM) is presented for evaluating image watermark robustness against scalable
coding based content adaptation attacks. The various stages of the development of the
proposed framework have been previously presented in different publications [99–101].
The framework is also available for download from the framework’s web pages [102].
4.1 Introduction
Currently, a few good watermarking evaluation tools are available in the watermarking
research community. These evaluation tools have proven very useful to measure the
performance of the watermarking algorithms against different intentional attacks (in-
cluding cropping, average filtering, scanning etc.) and unintentional attacks (natural
image processing tasks, such as compression, rotation, scaling etc.). Examples of such
evaluation tools include Stirmark [103], Checkmark [104], Optimark [105] and Water-
mark Evaluation Test bed (WET) [106]. Stirmark, for a given watermarked image,
applies different attacks including cropping, filtering, rotation, JPEG compression to
37
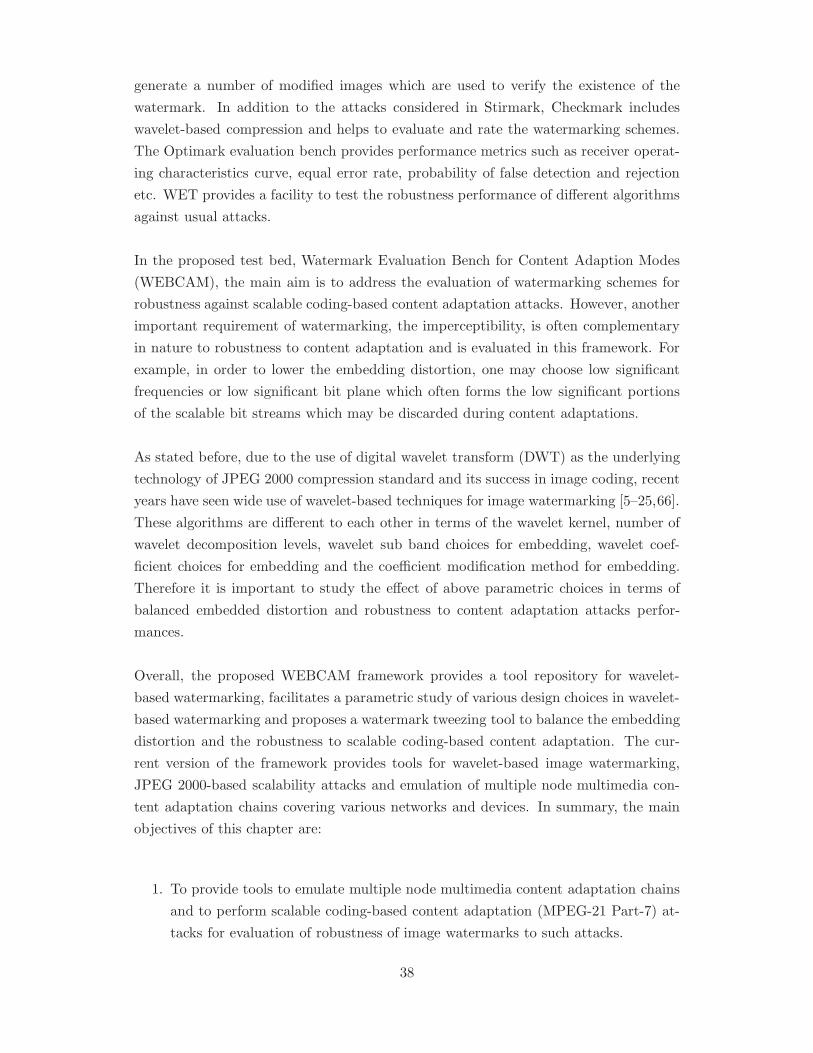
generate a number of modified images which are used to verify the existence of the
watermark. In addition to the attacks considered in Stirmark, Checkmark includes
wavelet-based compression and helps to evaluate and rate the watermarking schemes.
The Optimark evaluation bench provides performance metrics such as receiver operat-
ing characteristics curve, equal error rate, probability of false detection and rejection
etc. WET provides a facility to test the robustness performance of different algorithms
against usual attacks.
In the proposed test bed, Watermark Evaluation Bench for Content Adaption Modes
(WEBCAM), the main aim is to address the evaluation of watermarking schemes for
robustness against scalable coding-based content adaptation attacks. However, another
important requirement of watermarking, the imperceptibility, is often complementary
in nature to robustness to content adaptation and is evaluated in this framework. For
example, in order to lower the embedding distortion, one may choose low significant
frequencies or low significant bit plane which often forms the low significant portions
of the scalable bit streams which may be discarded during content adaptations.
As stated before, due to the use of digital wavelet transform (DWT) as the underlying
technology of JPEG 2000 compression standard and its success in image coding, recent
years have seen wide use of wavelet-based techniques for image watermarking [5–25,66].
These algorithms are different to each other in terms of the wavelet kernel, number of
wavelet decomposition levels, wavelet sub band choices for embedding, wavelet coef-
ficient choices for embedding and the coefficient modification method for embedding.
Therefore it is important to study the effect of above parametric choices in terms of
balanced embedded distortion and robustness to content adaptation attacks perfor-
mances.
Overall, the proposed WEBCAM framework provides a tool repository for wavelet-
based watermarking, facilitates a parametric study of various design choices in wavelet-
based watermarking and proposes a watermark tweezing tool to balance the embedding
distortion and the robustness to scalable coding-based content adaptation. The cur-
rent version of the framework provides tools for wavelet-based image watermarking,
JPEG 2000-based scalability attacks and emulation of multiple node multimedia con-
tent adaptation chains covering various networks and devices. In summary, the main
objectives of this chapter are:
1. To provide tools to emulate multiple node multimedia content adaptation chains
and to perform scalable coding-based content adaptation (MPEG-21 Part-7) at-
tacks for evaluation of robustness of image watermarks to such attacks.
38
WEBCAM
Embedding Process Content Adaptation Extraction and Authentication
Embedding Algorithm
Wavelet Kernel
Subband Selection
Coefficient Selection
Quality Scalability
Resolution Scalability
Channel Parameters
Extraction Algorithm
Authentication
Figure 4.1: WEBCAM modules and input/output parameter blocks
2. To provide a tool repository for wavelet-based watermarking enabling controlled
experimentation for their parametric evaluation, in terms of both embedding
distortion and robustness to content adaptation attacks. This is achieved by dis-
secting commonly used wavelet based watermarking algorithms into modular tool
blocks and fitting them into a common wavelet-based watermarking framework.
3. To facilitate tools for developing new watermarking schemes by choosing various
modules and parameters from this common framework which can also be used as
a research and learning tool for wavelet-based watermarking.
4. To provide a comparative parametric study of wavelet based watermarking algo-
rithms using the framework.
4.2 WEBCAM system architecture
WEBCAM architecture for image consists of three main functional modules: 1) Wa-
termark embedding; 2) Scalable coding-based content adaptation; and 3) Watermark
extraction and authentication. The high-level block diagram of WEBCAM with main
modular input/output parameters is shown in Figure 4.1. WEBCAM can operate on
two modes: as a full system using all three modules or as a scalable coding-based con-
tent adaptation attack emulator for any watermarked image by just using the module 2.
39
Server-side user
Wavelet Kernel: Forward wavelet transformation
Image / video store
Image to be watermarked
Choice of wavelet kernel
No. of decomposition level
Choice of subband
Choice of threshold
Embedding process
Embedding parameters
Watermark logo store
Watermark logo
Inverse wavelet transformation
Watermarked image / video store
Watermarked image
Image viewing Watermarked
image
Watermarked image
Embedding performance evaluation process
PSNR /RMSE
Difference map
Figure 4.2: Flow diagram of the watermark embedding module in WEBCAM.
4.2.1 Watermark embedding tools
Following the dissection of wavelet-based watermarking shown in Chapter 3, the wa-
termark embedding module of WEBCAM facilitates a common framework consisting
of a tool repository for implementing those wavelet-based watermarking algorithms as
well as a research platform for designing new algorithms. The block diagram of the wa-
termark embedding module consisting all input parameters, the sub module functional
blocks, embedding performance evaluation, output parameters and their interconnected
flow is shown in Figure 4.2. The sub modules include the FDWT, watermark embed-
ding, the IDWT, image display and embedding performance evaluation.
The input parameters to this module are three folds: operational; systems-related;
and user-defined. Operational inputs are the host image and the watermark logo.
The systems-related input parameters are related to the tools repository and con-
sist of wavelet kernel choice, number of wavelet decomposition levels, host subband
choice, host coefficient selection method and embedding procedure choice. The user-
defined input parameters include embedding parameters, such as, thresholds, water-
40
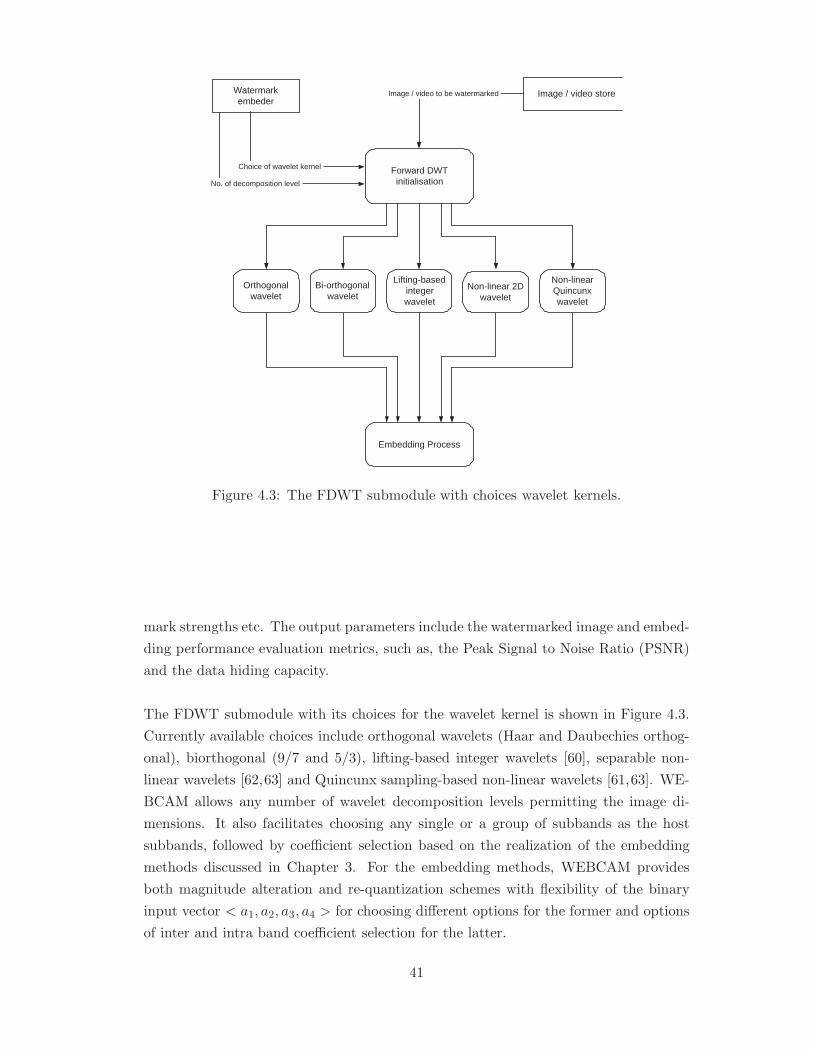
Watermark embeder
Forward DWT initialisation
Image / video store Image / video to be watermarked
No. of decomposition level
Choice of wavelet kernel
Orthogonal wavelet
Embedding Process
Bi-orthogonal wavelet
Lifting-based integer wavelet
Non-linear 2D wavelet
Non-linear Quincunx wavelet
Figure 4.3: The FDWT submodule with choices wavelet kernels.
mark strengths etc. The output parameters include the watermarked image and embed-
ding performance evaluation metrics, such as, the Peak Signal to Noise Ratio (PSNR)
and the data hiding capacity.
The FDWT submodule with its choices for the wavelet kernel is shown in Figure 4.3.
Currently available choices include orthogonal wavelets (Haar and Daubechies orthog-
onal), biorthogonal (9/7 and 5/3), lifting-based integer wavelets [60], separable non-
linear wavelets [62,63] and Quincunx sampling-based non-linear wavelets [61,63]. WE-
BCAM allows any number of wavelet decomposition levels permitting the image di-
mensions. It also facilitates choosing any single or a group of subbands as the host
subbands, followed by coefficient selection based on the realization of the embedding
methods discussed in Chapter 3. For the embedding methods, WEBCAM provides
both magnitude alteration and re-quantization schemes with flexibility of the binary
input vector < a1, a2, a3, a4 > for choosing different options for the former and options
of inter and intra band coefficient selection for the latter.
41
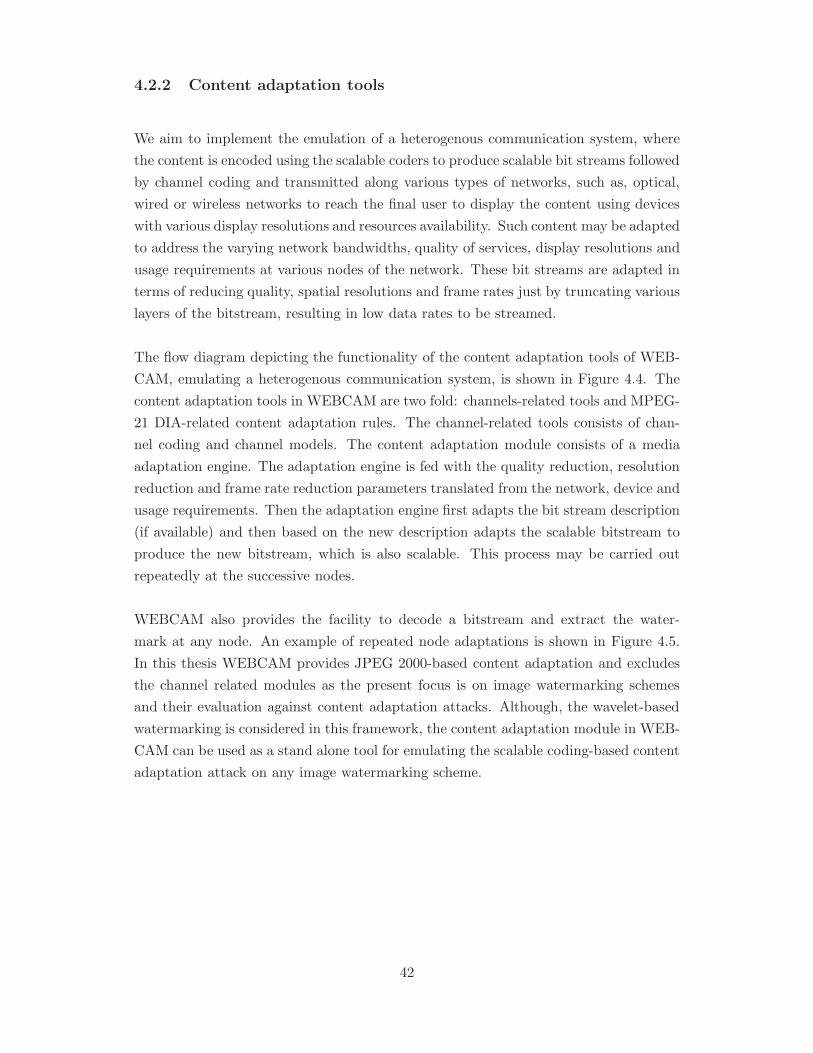
4.2.2 Content adaptation tools
We aim to implement the emulation of a heterogenous communication system, where
the content is encoded using the scalable coders to produce scalable bit streams followed
by channel coding and transmitted along various types of networks, such as, optical,
wired or wireless networks to reach the final user to display the content using devices
with various display resolutions and resources availability. Such content may be adapted
to address the varying network bandwidths, quality of services, display resolutions and
usage requirements at various nodes of the network. These bit streams are adapted in
terms of reducing quality, spatial resolutions and frame rates just by truncating various
layers of the bitstream, resulting in low data rates to be streamed.
The flow diagram depicting the functionality of the content adaptation tools of WEB-
CAM, emulating a heterogenous communication system, is shown in Figure 4.4. The
content adaptation tools in WEBCAM are two fold: channels-related tools and MPEG-
21 DIA-related content adaptation rules. The channel-related tools consists of chan-
nel coding and channel models. The content adaptation module consists of a media
adaptation engine. The adaptation engine is fed with the quality reduction, resolution
reduction and frame rate reduction parameters translated from the network, device and
usage requirements. Then the adaptation engine first adapts the bit stream description
(if available) and then based on the new description adapts the scalable bitstream to
produce the new bitstream, which is also scalable. This process may be carried out
repeatedly at the successive nodes.
WEBCAM also provides the facility to decode a bitstream and extract the water-
mark at any node. An example of repeated node adaptations is shown in Figure 4.5.
In this thesis WEBCAM provides JPEG 2000-based content adaptation and excludes
the channel related modules as the present focus is on image watermarking schemes
and their evaluation against content adaptation attacks. Although, the wavelet-based
watermarking is considered in this framework, the content adaptation module in WEB-
CAM can be used as a stand alone tool for emulating the scalable coding-based content
adaptation attack on any image watermarking scheme.
42
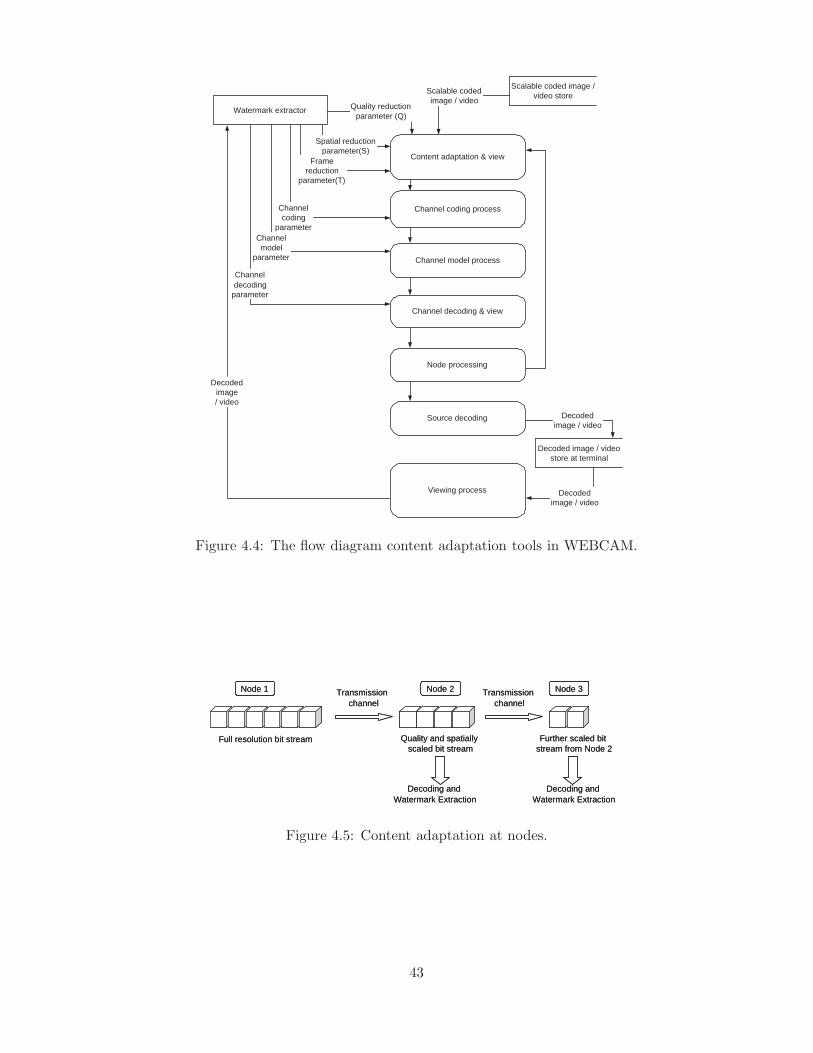
Content adaptation & view
Watermark extractor
Scalable coded image / video store
Quality reduction parameter (Q)
Channel coding
parameter Channel model
parameter
Scalable coded image / video
Decoded image / video store at terminal
Decoded image / video
Spatial reduction parameter(S)
Frame reduction
parameter(T)
Channel coding process
Channel model process
Viewing process Decoded image / video
Decoded image / video
Channel decoding & view
Node processing
Source decoding
Channel decoding
parameter
Figure 4.4: The flow diagram content adaptation tools in WEBCAM.
Node 1 Node 2 Node 3
Full resolution bit stream Quality and spatially scaled bit stream
Further scaled bit stream from Node 2
Decoding and Watermark Extraction
Decoding and Watermark Extraction
Transmission channel
Transmission channel
Node 1 Node 2 Node 3
Full resolution bit stream Quality and spatially scaled bit stream
Further scaled bit stream from Node 2
Decoding and Watermark Extraction
Decoding and Watermark Extraction
Transmission channel
Transmission channel
Figure 4.5: Content adaptation at nodes.
43
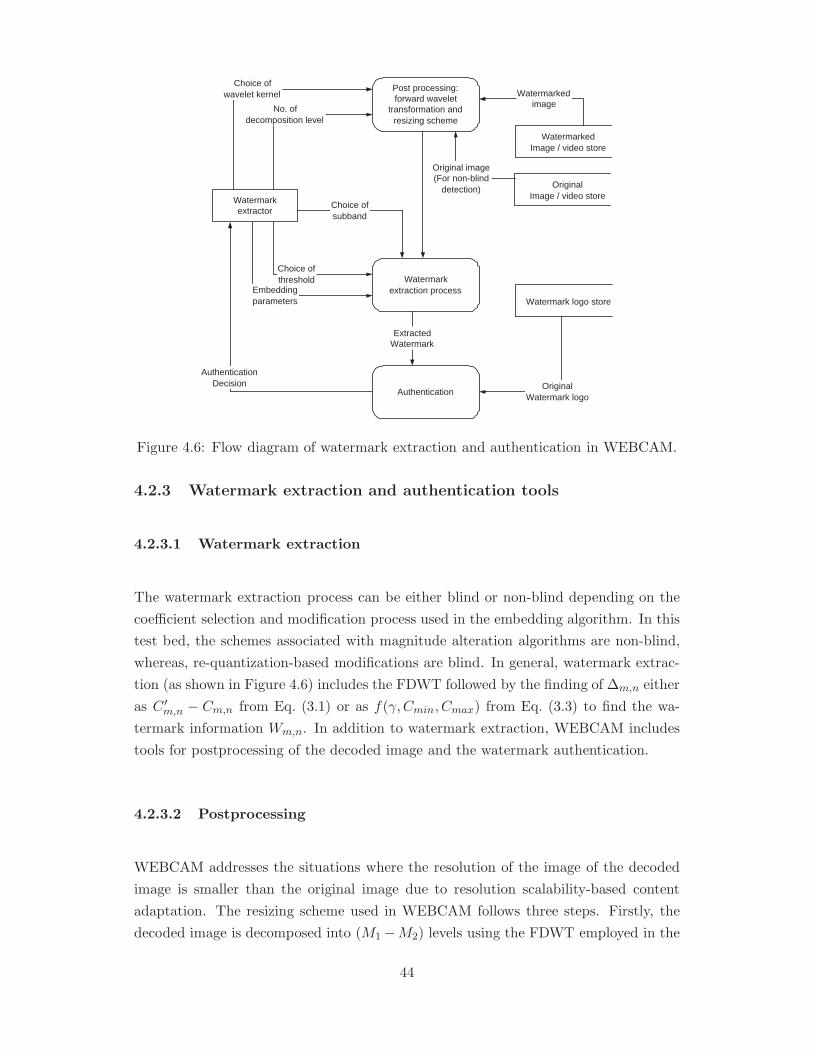
Watermark extractor
Post processing: forward wavelet
transformation and resizing scheme
Watermarked Image / video store
Watermarked image
Choice of wavelet kernel
No. of decomposition level
Choice of subband
Choice of threshold Watermark
extraction process Embedding parameters Watermark logo store
Original Watermark logo
Authentication
Extracted Watermark
Original image (For non-blind
detection) Original Image / video store
Authentication Decision
Figure 4.6: Flow diagram of watermark extraction and authentication in WEBCAM.
4.2.3 Watermark extraction and authentication tools
4.2.3.1 Watermark extraction
The watermark extraction process can be either blind or non-blind depending on the
coefficient selection and modification process used in the embedding algorithm. In this
test bed, the schemes associated with magnitude alteration algorithms are non-blind,
whereas, re-quantization-based modifications are blind. In general, watermark extrac-
tion (as shown in Figure 4.6) includes the FDWT followed by the finding of ∆m,n either
as C ′m,n − Cm,n from Eq. (3.1) or as f(γ,Cmin, Cmax) from Eq. (3.3) to find the wa-
termark information Wm,n. In addition to watermark extraction, WEBCAM includes
tools for postprocessing of the decoded image and the watermark authentication.
4.2.3.2 Postprocessing
WEBCAM addresses the situations where the resolution of the image of the decoded
image is smaller than the original image due to resolution scalability-based content
adaptation. The resizing scheme used in WEBCAM follows three steps. Firstly, the
decoded image is decomposed into (M1 −M2) levels using the FDWT employed in the
44
compression algorithm, where M1 is the number of wavelet decomposition levels used
in the embedding algorithm and M2 is the number of levels discarded due to content
adaptation. Secondly, the normalization of all coefficients are adjusted by multiplying
with 2M2 . Finally the dimensions are extended to those of the original by zero padding
the current matrix and the IDWT is applied to obtain the full resolution image.
4.2.3.3 Watermark authentication
The authentication process verifies the extracted watermark with the original water-
mark. Two commonly used authentication metrics are Hamming Distance (H) (often
referred as Bit Error Rate (BER) in communication systems) and correlation similar-
ity measure (S). The former is widely used for a binary watermark detection while the
latter is commonly used for pseudo-random sequence-based watermark data or for a
gray scale logo [15, 17]. Using these metrics, a watermark is said to be detected if the
Hamming Distance is lower than a specific threshold value or the correlation similarity
measure is higher than a given threshold. WEBCAM is equipped with both of these
metrics which are computed as follows:
H(W,W ′) =1
L
L−1∑
i=0
Wi ⊕W ′i , (4.1)
S(W,W ′) =W.W ′√W ′.W ′
/W.W√W.W
× 100,
=W.W ′√
W ′.W ′√W.W
× 100, (4.2)
where W and W ′ are the original and the extracted watermarks, respectively. L is the
length of the sequence and ⊕ represents the XOR operation between the respective
bits.
4.3 Experimental simulations and comparative study
WEBCAM provides a tools repository for evaluating scalable coding-based content
adaptation attacks, implementing wavelet-based image watermarking schemes by dis-
secting major algorithms into design tools and designing new tools. This section demon-
strates the achievement of objectives with experimental simulations and corresponding
comparative study.
45
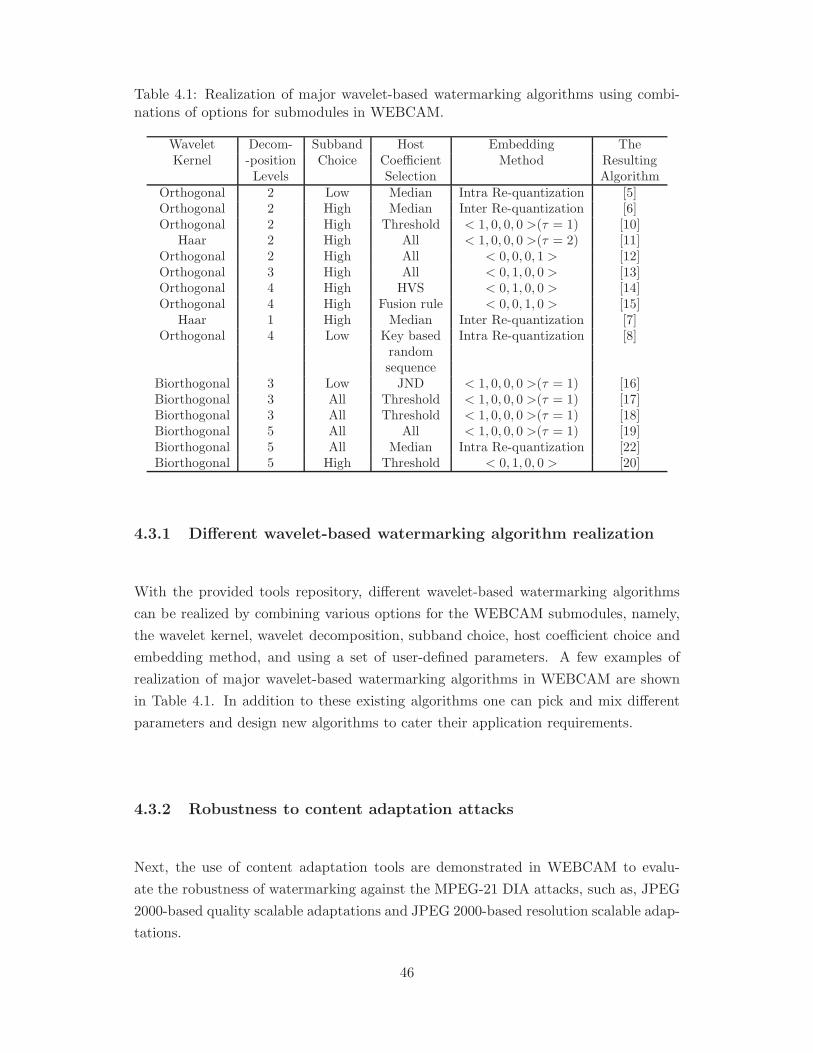
Table 4.1: Realization of major wavelet-based watermarking algorithms using combi-nations of options for submodules in WEBCAM.
Wavelet Decom- Subband Host Embedding TheKernel -position Choice Coefficient Method Resulting
Levels Selection AlgorithmOrthogonal 2 Low Median Intra Re-quantization [5]Orthogonal 2 High Median Inter Re-quantization [6]Orthogonal 2 High Threshold < 1, 0, 0, 0 >(τ = 1) [10]
Haar 2 High All < 1, 0, 0, 0 >(τ = 2) [11]Orthogonal 2 High All < 0, 0, 0, 1 > [12]Orthogonal 3 High All < 0, 1, 0, 0 > [13]Orthogonal 4 High HVS < 0, 1, 0, 0 > [14]Orthogonal 4 High Fusion rule < 0, 0, 1, 0 > [15]
Haar 1 High Median Inter Re-quantization [7]Orthogonal 4 Low Key based Intra Re-quantization [8]
randomsequence
Biorthogonal 3 Low JND < 1, 0, 0, 0 >(τ = 1) [16]Biorthogonal 3 All Threshold < 1, 0, 0, 0 >(τ = 1) [17]Biorthogonal 3 All Threshold < 1, 0, 0, 0 >(τ = 1) [18]Biorthogonal 5 All All < 1, 0, 0, 0 >(τ = 1) [19]Biorthogonal 5 All Median Intra Re-quantization [22]Biorthogonal 5 High Threshold < 0, 1, 0, 0 > [20]
4.3.1 Different wavelet-based watermarking algorithm realization
With the provided tools repository, different wavelet-based watermarking algorithms
can be realized by combining various options for the WEBCAM submodules, namely,
the wavelet kernel, wavelet decomposition, subband choice, host coefficient choice and
embedding method, and using a set of user-defined parameters. A few examples of
realization of major wavelet-based watermarking algorithms in WEBCAM are shown
in Table 4.1. In addition to these existing algorithms one can pick and mix different
parameters and design new algorithms to cater their application requirements.
4.3.2 Robustness to content adaptation attacks
Next, the use of content adaptation tools are demonstrated in WEBCAM to evalu-
ate the robustness of watermarking against the MPEG-21 DIA attacks, such as, JPEG
2000-based quality scalable adaptations and JPEG 2000-based resolution scalable adap-
tations.
46
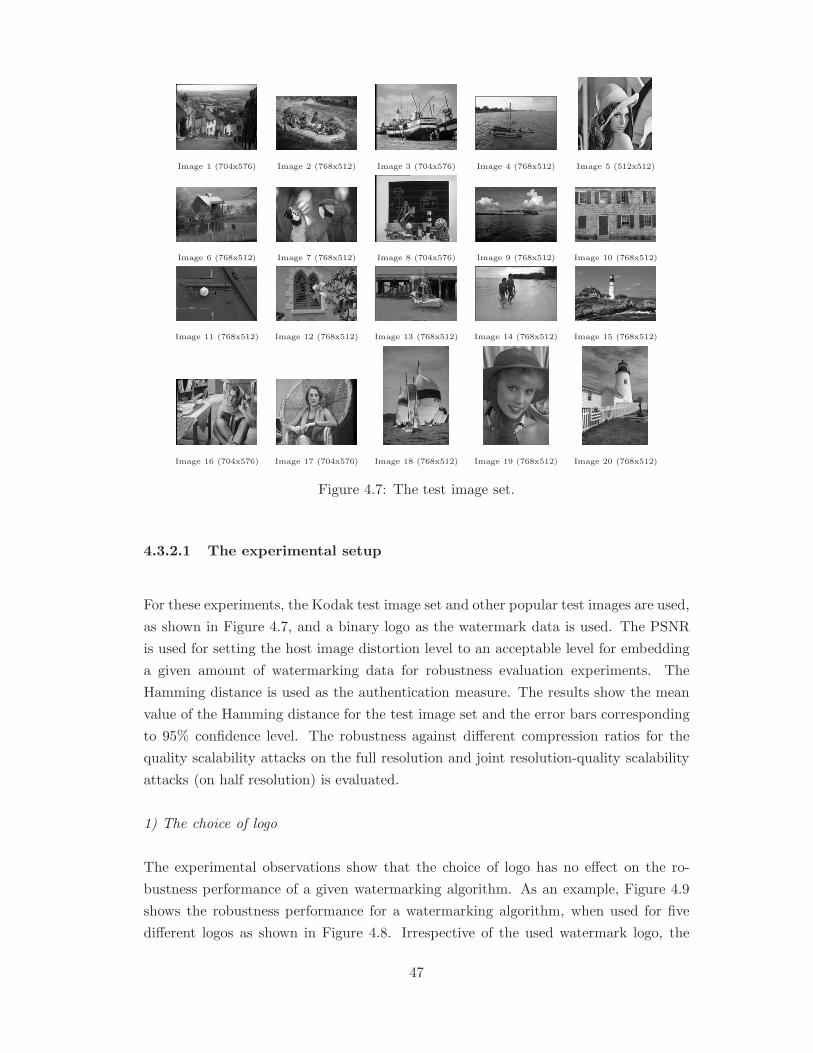
Image 1 (704x576) Image 2 (768x512) Image 3 (704x576) Image 4 (768x512) Image 5 (512x512)
Image 6 (768x512) Image 7 (768x512) Image 8 (704x576) Image 9 (768x512) Image 10 (768x512)
Image 11 (768x512) Image 12 (768x512) Image 13 (768x512) Image 14 (768x512) Image 15 (768x512)
Image 16 (704x576) Image 17 (704x576) Image 18 (768x512) Image 19 (768x512) Image 20 (768x512)
Figure 4.7: The test image set.
4.3.2.1 The experimental setup
For these experiments, the Kodak test image set and other popular test images are used,
as shown in Figure 4.7, and a binary logo as the watermark data is used. The PSNR
is used for setting the host image distortion level to an acceptable level for embedding
a given amount of watermarking data for robustness evaluation experiments. The
Hamming distance is used as the authentication measure. The results show the mean
value of the Hamming distance for the test image set and the error bars corresponding
to 95% confidence level. The robustness against different compression ratios for the
quality scalability attacks on the full resolution and joint resolution-quality scalability
attacks (on half resolution) is evaluated.
1) The choice of logo
The experimental observations show that the choice of logo has no effect on the ro-
bustness performance of a given watermarking algorithm. As an example, Figure 4.9
shows the robustness performance for a watermarking algorithm, when used for five
different logos as shown in Figure 4.8. Irrespective of the used watermark logo, the
47
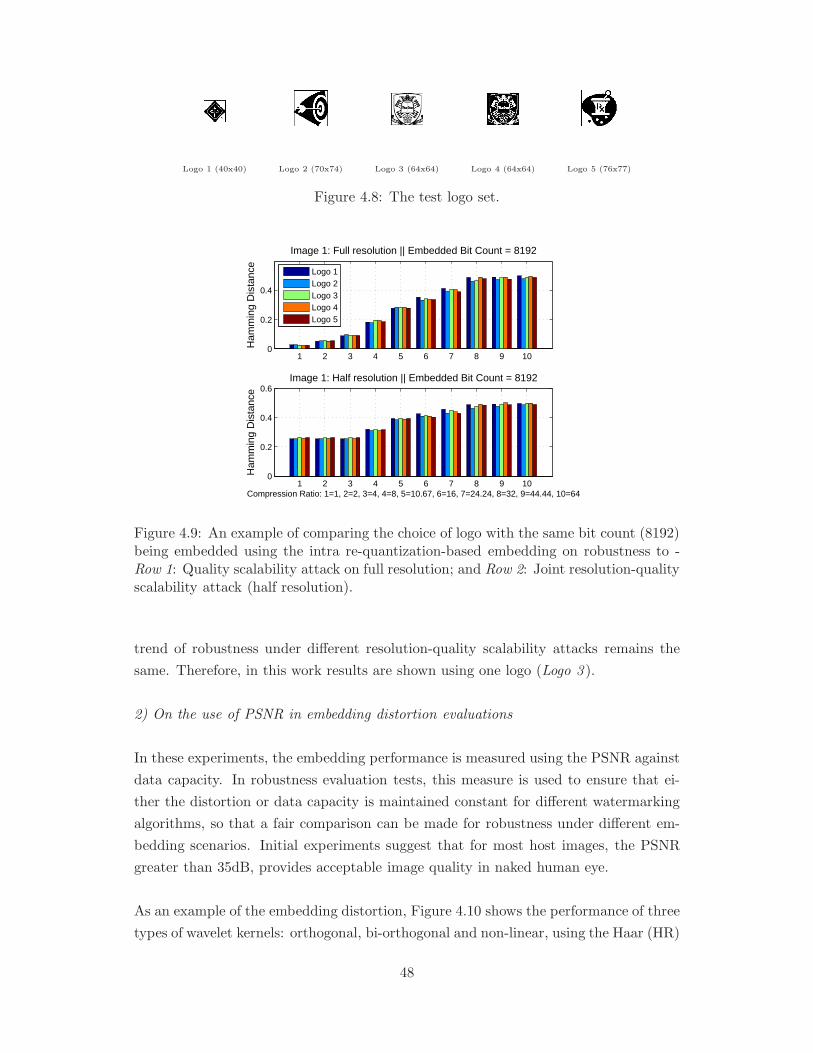
Logo 1 (40x40) Logo 2 (70x74) Logo 3 (64x64) Logo 4 (64x64) Logo 5 (76x77)
Figure 4.8: The test logo set.
1 2 3 4 5 6 7 8 9 100
0.2
0.4
Image 1: Full resolution || Embedded Bit Count = 8192H
amm
ing
Dis
tanc
e
Logo 1Logo 2Logo 3Logo 4Logo 5
1 2 3 4 5 6 7 8 9 100
0.2
0.4
0.6Image 1: Half resolution || Embedded Bit Count = 8192
Ham
min
g D
ista
nce
Compression Ratio: 1=1, 2=2, 3=4, 4=8, 5=10.67, 6=16, 7=24.24, 8=32, 9=44.44, 10=64
Figure 4.9: An example of comparing the choice of logo with the same bit count (8192)being embedded using the intra re-quantization-based embedding on robustness to -Row 1: Quality scalability attack on full resolution; and Row 2: Joint resolution-qualityscalability attack (half resolution).
trend of robustness under different resolution-quality scalability attacks remains the
same. Therefore, in this work results are shown using one logo (Logo 3 ).
2) On the use of PSNR in embedding distortion evaluations
In these experiments, the embedding performance is measured using the PSNR against
data capacity. In robustness evaluation tests, this measure is used to ensure that ei-
ther the distortion or data capacity is maintained constant for different watermarking
algorithms, so that a fair comparison can be made for robustness under different em-
bedding scenarios. Initial experiments suggest that for most host images, the PSNR
greater than 35dB, provides acceptable image quality in naked human eye.
As an example of the embedding distortion, Figure 4.10 shows the performance of three
types of wavelet kernels: orthogonal, bi-orthogonal and non-linear, using the Haar (HR)
48

1 2 3 4 530
35
40
45Non-HVS based <1,0,0,0>(τ=1) || Embedded Bit Count = 6144
PS
NR
HRD-45/39/7MHMQ
1 2 3 4 535
40
45
50Intra re-quantisation based || Embedded Bit Count = 2048
PS
NR
Image number
Figure 4.10: Capacity-distortion plots. Numbers 1 to 5 represent the five images fromthe test image set. Two different category of algorithms: 1) non-blind (non-HVS based<1,0,0,0>(τ=1)) and 2) blind (intra re-quantization based), are shown in each row forsix different wavelet kernels: HR, D-4, 5/3 9/7, MH and MQ.
and Daubechies-4 (D-4) for orthogonal, 5/3 and 9/7 for bi-orthogonal and Morpholog-
ical Haar (MH) and Quincunx domain Morphological (MQ) wavelets for non-linear
types, respectively. The experiment considered two different categories of embedding
algorithms, namely, the non-blind algorithm (non-HVS-based (<1,0,0,0>(τ=1))) and
the blind algorithm (intra re-quantization-based). A comprehensive study on the ef-
fect of wavelet kernel and other parameters on embedding performance is discussed in
Chapter 5.
3) Hamming distance interpretation
The Hamming distance is used as the authentication measure for robustness evaluation.
Figure 4.11 shows the visual quality corresponding to different Hamming distance val-
ues. It is evident from these figures that after about 0.25 Hamming distance, the visual
quality of logos becomes poor and difficult to compare with the original logo. Based
on the visual significance, one can define a threshold value of the Hamming distance to
ensure the extracted watermark is visually comparable with the original logo. Based
on the experiments a generalized threshold of 0.20±0.02 hamming distance can be set.
Using the above discussed experimental set up, three different scenarios are considered
to compare and evaluate the robustness against content adaptation. With the shown
set of experiments, it is also demonstrated how the full features of WEBCAM can be
49
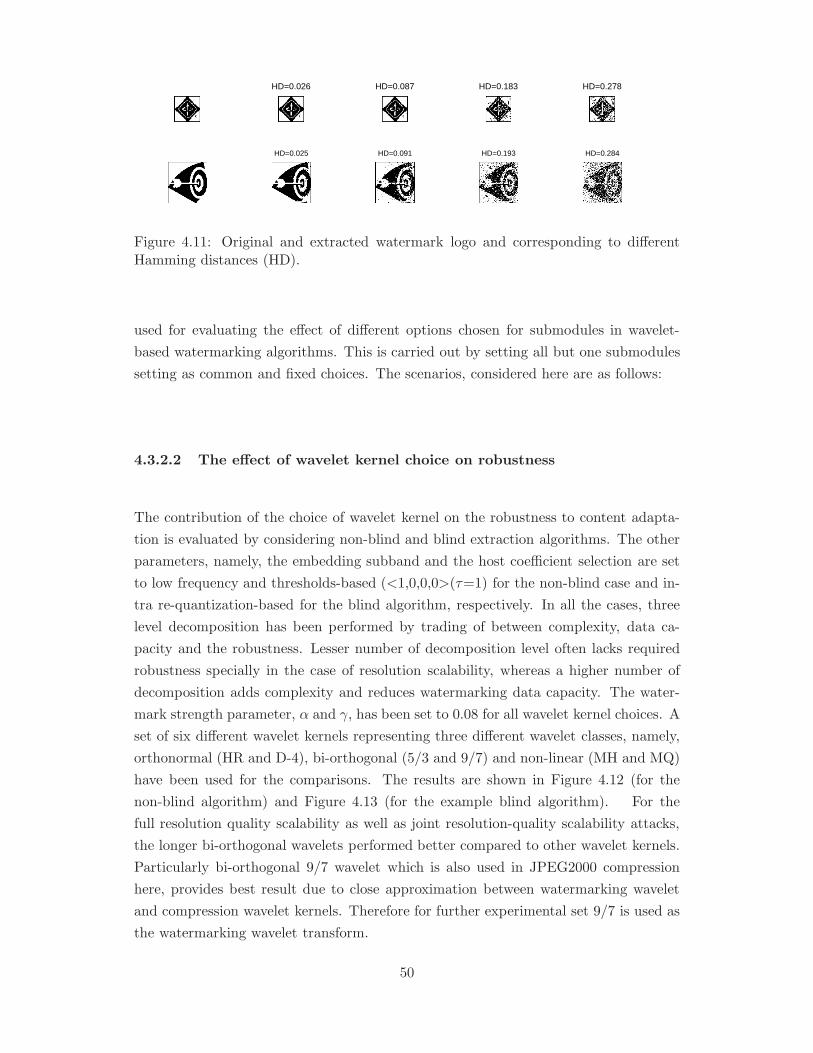
HD=0.026 HD=0.087 HD=0.183 HD=0.278
HD=0.025 HD=0.091 HD=0.193 HD=0.284
Figure 4.11: Original and extracted watermark logo and corresponding to differentHamming distances (HD).
used for evaluating the effect of different options chosen for submodules in wavelet-
based watermarking algorithms. This is carried out by setting all but one submodules
setting as common and fixed choices. The scenarios, considered here are as follows:
4.3.2.2 The effect of wavelet kernel choice on robustness
The contribution of the choice of wavelet kernel on the robustness to content adapta-
tion is evaluated by considering non-blind and blind extraction algorithms. The other
parameters, namely, the embedding subband and the host coefficient selection are set
to low frequency and thresholds-based (<1,0,0,0>(τ=1) for the non-blind case and in-
tra re-quantization-based for the blind algorithm, respectively. In all the cases, three
level decomposition has been performed by trading of between complexity, data ca-
pacity and the robustness. Lesser number of decomposition level often lacks required
robustness specially in the case of resolution scalability, whereas a higher number of
decomposition adds complexity and reduces watermarking data capacity. The water-
mark strength parameter, α and γ, has been set to 0.08 for all wavelet kernel choices. A
set of six different wavelet kernels representing three different wavelet classes, namely,
orthonormal (HR and D-4), bi-orthogonal (5/3 and 9/7) and non-linear (MH and MQ)
have been used for the comparisons. The results are shown in Figure 4.12 (for the
non-blind algorithm) and Figure 4.13 (for the example blind algorithm). For the
full resolution quality scalability as well as joint resolution-quality scalability attacks,
the longer bi-orthogonal wavelets performed better compared to other wavelet kernels.
Particularly bi-orthogonal 9/7 wavelet which is also used in JPEG2000 compression
here, provides best result due to close approximation between watermarking wavelet
and compression wavelet kernels. Therefore for further experimental set 9/7 is used as
the watermarking wavelet transform.
50

0 10 20 30 40 50 60 70
0
0.05
0.1
0.15
0.2
0.25
0.3
0.35
0.4Quality scalability attack on full resolution
Compression Ratio
Ham
min
g D
ista
nce
HRD-45/39/7MHMQ
0 10 20 30 40 50 60 70
0
0.05
0.1
0.15
0.2
0.25
0.3
0.35
0.4Joint resolution-quality scalability attack (half resolution)
Compression Ratio
Ham
min
g D
ista
nce
HRD-45/39/7MHMQ
Figure 4.12: An example of evaluating the effect of the wavelet kernel for < 1, 0, 0, 0 >(τ = 1) direct modification-based embedding on robustness to - Column 1: Qualityscalability attack on full resolution; and Column 2: Joint resolution-quality scalabilityattack (half resolution).
0 10 20 30 40 50 60 700
0.05
0.1
0.15
0.2
0.25
0.3
0.35
0.4
0.45
0.5Quality scalability attack on full resolution
Compression Ratio
Ham
min
g D
ista
nce
HRD-45/39/7MHMQ
0 10 20 30 40 50 60 700
0.05
0.1
0.15
0.2
0.25
0.3
0.35
0.4
0.45
0.5Joint resolution-quality scalability attack (half resolution)
Compression Ratio
Ham
min
g D
ista
nce
HRD-45/39/7MHMQ
Figure 4.13: An example of evaluating the effect of the wavelet kernel for intra re-quantization-based embedding on robustness to - Column 1: Quality scalability attackon full resolution; and Column 2: Joint resolution-quality scalability attack (half reso-lution).
4.3.2.3 The effect of subband choice
The contribution of the choice of subbands for the robustness of a watermarking al-
gorithm is compared by setting all other choices to fixed. In this set of experiments,
the wavelet kernel and decomposition levels are set to 9/7 and three, respectively. Fig-
ure 4.14 shows the robustness performance for non-blind extraction that uses threshold-
based (<1,0,0,0>(τ=1)) embedding method, while Figure 4.15 shows the robustness
performance for blind extraction that uses intra re-quantization-based embedding. In
plots, low, high and all frequency subband selection refers to the lowest frequency
51
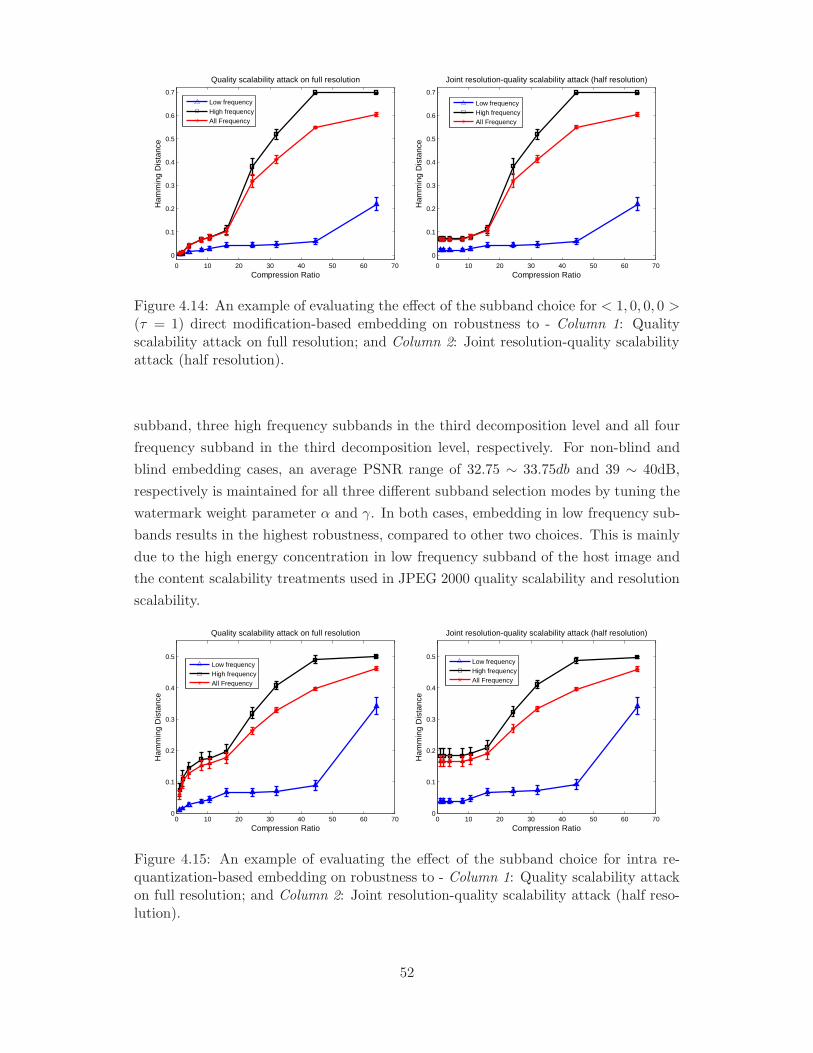
0 10 20 30 40 50 60 70
0
0.1
0.2
0.3
0.4
0.5
0.6
0.7
Quality scalability attack on full resolution
Compression Ratio
Ham
min
g D
ista
nce
Low frequencyHigh frequencyAll Frequency
0 10 20 30 40 50 60 70
0
0.1
0.2
0.3
0.4
0.5
0.6
0.7
Joint resolution-quality scalability attack (half resolution)
Compression Ratio
Ham
min
g D
ista
nce
Low frequencyHigh frequencyAll Frequency
Figure 4.14: An example of evaluating the effect of the subband choice for < 1, 0, 0, 0 >(τ = 1) direct modification-based embedding on robustness to - Column 1: Qualityscalability attack on full resolution; and Column 2: Joint resolution-quality scalabilityattack (half resolution).
subband, three high frequency subbands in the third decomposition level and all four
frequency subband in the third decomposition level, respectively. For non-blind and
blind embedding cases, an average PSNR range of 32.75 ∼ 33.75db and 39 ∼ 40dB,
respectively is maintained for all three different subband selection modes by tuning the
watermark weight parameter α and γ. In both cases, embedding in low frequency sub-
bands results in the highest robustness, compared to other two choices. This is mainly
due to the high energy concentration in low frequency subband of the host image and
the content scalability treatments used in JPEG 2000 quality scalability and resolution
scalability.
0 10 20 30 40 50 60 700
0.1
0.2
0.3
0.4
0.5
Quality scalability attack on full resolution
Compression Ratio
Ham
min
g D
ista
nce
Low frequencyHigh frequencyAll Frequency
0 10 20 30 40 50 60 700
0.1
0.2
0.3
0.4
0.5
Joint resolution-quality scalability attack (half resolution)
Compression Ratio
Ham
min
g D
ista
nce
Low frequencyHigh frequencyAll Frequency
Figure 4.15: An example of evaluating the effect of the subband choice for intra re-quantization-based embedding on robustness to - Column 1: Quality scalability attackon full resolution; and Column 2: Joint resolution-quality scalability attack (half reso-lution).
52
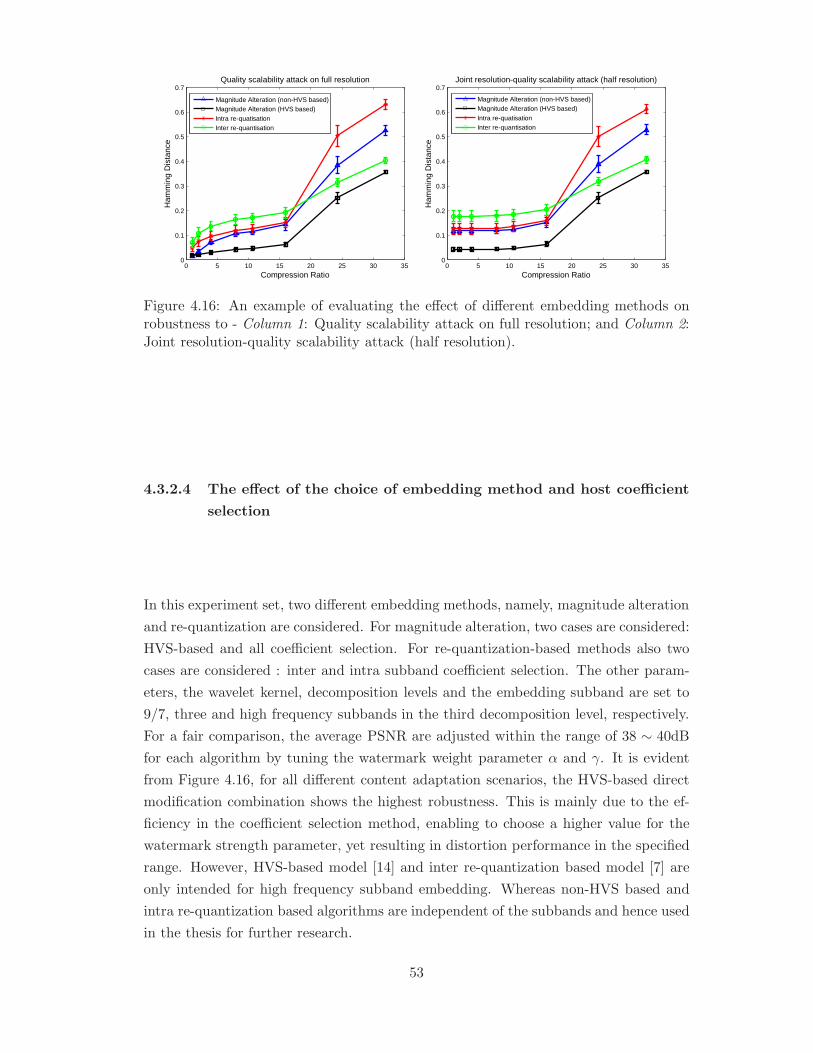
0 5 10 15 20 25 30 350
0.1
0.2
0.3
0.4
0.5
0.6
0.7Quality scalability attack on full resolution
Compression Ratio
Ham
min
g D
ista
nce
Magnitude Alteration (non-HVS based)Magnitude Alteration (HVS based)Intra re-quatisationInter re-quantisation
0 5 10 15 20 25 30 350
0.1
0.2
0.3
0.4
0.5
0.6
0.7Joint resolution-quality scalability attack (half resolution)
Compression Ratio
Ham
min
g D
ista
nce
Magnitude Alteration (non-HVS based)Magnitude Alteration (HVS based)Intra re-quatisationInter re-quantisation
Figure 4.16: An example of evaluating the effect of different embedding methods onrobustness to - Column 1: Quality scalability attack on full resolution; and Column 2:Joint resolution-quality scalability attack (half resolution).
4.3.2.4 The effect of the choice of embedding method and host coefficient
selection
In this experiment set, two different embedding methods, namely, magnitude alteration
and re-quantization are considered. For magnitude alteration, two cases are considered:
HVS-based and all coefficient selection. For re-quantization-based methods also two
cases are considered : inter and intra subband coefficient selection. The other param-
eters, the wavelet kernel, decomposition levels and the embedding subband are set to
9/7, three and high frequency subbands in the third decomposition level, respectively.
For a fair comparison, the average PSNR are adjusted within the range of 38 ∼ 40dB
for each algorithm by tuning the watermark weight parameter α and γ. It is evident
from Figure 4.16, for all different content adaptation scenarios, the HVS-based direct
modification combination shows the highest robustness. This is mainly due to the ef-
ficiency in the coefficient selection method, enabling to choose a higher value for the
watermark strength parameter, yet resulting in distortion performance in the specified
range. However, HVS-based model [14] and inter re-quantization based model [7] are
only intended for high frequency subband embedding. Whereas non-HVS based and
intra re-quantization based algorithms are independent of the subbands and hence used
in the thesis for further research.
53

4.4 Conclusions
Although there are few watermarking toolboxes available in the literature, most of
them rely on various attacks to evaluate the watermarking algorithms. On the con-
trary in this chapter we proposed WEBCAM framework to provide a common con-
trol experimental environment to compare the effect of various input parameters for
various wavelet based algorithms. A modular test bed consisting of a repository of
tools is presented for emulating MPEG-21 DIA content adaptation attacks, wavelet-
based watermarking, extraction and authentication. The parametric dissections of the
wavelet based watermarking algorithms from the previous chapter are used to design
and implement the tools repository and its modular and reconfigurable wavelet-based
watermarking implementation within WEBCAM framework. WEBCAM provides a
formal evaluation platform to compare the performances of different schemes under
a controlled experimental environment for various combinations of choices for those
functional submodules and a comparative study of the same is provided here. It also
facilitates the development of new algorithms and can also be used as an educational
tool for wavelet-based watermarking algorithm design. The content adaptation tools
repository provides a new set of attacks that are emerging in modern multimedia usage
within the heterogeneous networks.
54
Chapter 5
Embedding distortion analysis
and modeling
5.1 Introduction
Embedding performance and robustness are the two main but complementary prop-
erties of robust watermarking applications. The various contributing parameters on
imperceptibility and robustness performances are studied in the previous chapters.
The state of the art review and a generalization of the wavelet based watermarking
schemes are proposed in Chapter 3 and Chapter 4. Though many independent al-
gorithms are available in the literature, a gap has been identified which requires a
generalized mathematical analysis to identify the relationship between distortion per-
formance and various input parameters, responsible for embedding distortion. There
are very little or no research have been done to establish a relationship between an
objective metric for embedding distortion and watermarking input parameters. Few
attempts [107] have been made towards this problem but they mainly focused on their
own algorithms. In this chapter a mathematical model is derived to establish the rela-
tionship between embedding distortion performance metric, such as mean square error
(MSE) and watermarking input parameters including wavelet kernels, subband selec-
tion and coefficient selection. Although many objective metrics are presented in the
literature (as discussed in Chapter 2), most of the watermarking algorithms to date,
due its simplicity, used PSNR to measure the embedding distortion. In this chapter
MSE has been used instead of PSNR to represent the embedding distortion in a linear
scale. However similar mathematical modeling can be developed using other objective
55
metrics and that is considered as a future work in this thesis.
The main objective of the work in this chapter, is to derive a generalized model for
distortion performance analysis of wavelet based watermarking. In order to achieve the
same, first a proposition is made to show the relationship between the noise power in
the transform domain and the input signal domain. Then using the above proposition
a relationship is established between the distortion performance metrics and the input
parameters of a given wavelet based watermarking scheme. The proposed model is
derived in two parts: 1) Initial propositions are made using orthonormal wavelet bases,
which conserves energy in the signal domain as well as in the transform domain; 2)
Extension of the same into non-orthonormal bases, including bi-orthogonal and non-
linear wavelet kernels, to give a universal acceptance of the model.
5.2 Embedding distortion model for orthonormal wavelet
bases
5.2.1 Preliminaries
The embedding distortion performance is measured by MSE, which can be defined as
follows:
Definition 5.2.1 The Mean Square Error (MSE) or average noise power in pixel
domain between original image I and watermarked image I ′ is defined by:
MSE =1
X × Y
X−1∑
m=0
Y−1∑
n=0
(I(m,n)− I ′(m,n))2, (5.1)
where X and Y are the image dimension and m and n indicate each pixel position.
In order to formulate the model the transformation of noise energy from frequency
domain to the signal domain is shown using Parseval’s equality.
Definition 5.2.2 In the Parseval’s Equality, the energy is conserved between an input
signal and the transform domain coefficient in the case of an orthonormal filter bank
wavelet base [59]. Assuming the input signal x[n] with the length of n ∈ Z and the
56
corresponding transformed domain coefficients of y[k] where k ∈ Z, according to energy
conservation theorem,
‖x‖2 = ‖y‖2. (5.2)
5.2.2 The model
Based on these primary definitions the model is built which consists of the following
propositions and its proof.
Proposition 5.2.1 Sum of the noise power in the transform domain is equal to sum
of the noise power in the input signal for orthonormal transforms. If the input signal
noise is defined by ∆x[n] and the noise in transform domain is ∆y[k] then,
∑
n
|∆x[n]|2 =∑
k
|∆y[k]|2, (5.3)
where n ∈ Z is the length of the input signal and k ∈ Z is the length in the transform
domain, respectively.
Proof : As discussed in Chapter 2, DWT can be realized with a filter bank or lifting
scheme based factoring. In both the cases the wavelet decomposition and the recon-
struction can be represented by a polyphase matrix [60]. The inverse DWT can be
defined by a synthesis filter bank using the polyphase matrix M ′(z) =(h′
e(z)g′e(z)
h′
o(z)g′o(z)
)
where h′(z) represents the low pass filter coefficients and g′(z) is the high pass filter
coefficients and the subscripts e and o denote even and odd indexed terms, respectively.
Now the transform domain coefficient y can be re-mapped into input signal x as bellow:
(xe(z)xo(z)
)=(h′
e(z)g′e(z)
h′
o(z)g′o(z)
)(ye(z)yo(z)
). (5.4)
Assuming ∆y is the noise introduced in wavelet domain and ∆x is the modified signal
after the inverse transform, the relationship between the noise in the wavelet coefficient
and the noise in the modified signal can be defined using the following equations. From
Eq. (5.4) we can write
(xe(z)+∆xe(z)xo(z)+∆xo(z)
)=(h′
e(z)g′e(z)
h′
o(z)g′o(z)
)(ye(z)+∆ye(z)yo(z)+∆yo(z)
). (5.5)
57
From Eq. (5.4) and Eq. (5.5) using the Linearity property of the Z-transform of the
filter coefficients and signals in the polyphase matrix we can get,
xe(z) + ∆xe(z) = h′e(z)(ye(z) + ∆ye(z))
+h′o(z)(yo(z) + ∆yo(z)),
h′e(z)ye(z) + h′o(z)yo(z) + ∆xe(z) = h′e(z)ye(z) + h′e(z)∆ye(z)
+h′o(z)yo(z) + h′o(z)∆yo(z),
∆xe(z) = h′e(z)∆ye(z) + h′o(z)∆yo(z). (5.6)
Similarly ∆xo(z) can be obtained and written as
∆xo(z) = g′e(z)∆ye(z) + g′o(z)∆yo(z). (5.7)
Combining Eq. (5.6) and Eq. (5.7), finally we can write the polyphase matrix form of
the noise in the output signal:
(∆xe(z)∆xo(z)
)=(h′
e(z)g′e(z)
h′
o(z)g′o(z)
)(∆ye(z)∆yo(z)
). (5.8)
Recalling the Parseval’s energy conservation theorem as stated in Definition 5.2.2, from
Eq. (5.8) it can be concluded that
∑|∆xe|2 +
∑|∆xo|2 =
∑|∆ye|2 +
∑|∆yo|2 ,
∑
n
|∆x[n]|2 =∑
k
|∆y[k]|2. (5.9)
�.
Using the generalized framework, the Proposition 5.2.1 can be applied to build the
relationship between the modification energy in the coefficient domain to embed the
watermark and the distortion performance metrics. In this model propositions are
made for two different categories of embedding schemes, discussed in Chapter 3.
Proposition 5.2.2 In a wavelet based watermarking scheme, the mean square error
(MSE) of the watermarked image is directly proportional to the sum of the energy of
the modification values of the selected wavelet coefficients. The modification value itself
is a function of the wavelet coefficients and therefore two different cases are proposed
based on the categorization.
Case A: Non-blind model. For the magnitude alteration based embedding method
(non-blind algorithm), the modification is a function of the selected coefficient to be
58
watermarked and the relationship between (MSE) and the selected coefficient (Cm,n)
is expressed as:
MSE ∝∑
|f(Cm,n)|2. (5.10)
Case B. Blind model. For the re-quantization based method (blind algorithm), the
modification is a function of the neighboring wavelet coefficients of the selected me-
dian coefficient to be watermarked and the relationship between MSE and the wavelet
coefficients Cmin and Cmax is expressed as:
MSE ∝∑
|f(Cmin, Cmax)|2. (5.11)
Proof : In a wavelet based watermark embedding scheme the watermark information
is inserted by modifying the wavelet coefficients. This watermark insertion can be
considered as introducing noise in the transform domain. Hence the sum of the energy
of the modification value due to watermark embedding in the wavelet domain is equal
to the sum of the noise energy in the transform domain as stated in Proposition 5.2.1.
From Eq. (3.1) and Eq. (5.3), the energy sum of the modification value ∆m,n can be
defined as: ∑
m,n
|∆m,n|2 =∑
k
|∆y[k]|2. (5.12)
Similarly, the pixel domain distortion performance metrics which is represented by
MSE is considered as the noise error created in the signal due to the noise in wavelet
domain. Therefore, the sum of the noise energy in the input signal is equal to the sum
of the noise error energy MSE in the pixel domain:
MSE.(X × Y ) =∑
n
|∆x[n]|2, (5.13)
where X and Y are the image dimensions. Now the relationship between the distortion
performance metrics MSE of the watermarked image and the coefficient modification
value which is normally a function of the selected wavelet coefficients can be decided
using the Proposition 5.2.1. Thus from Eq. (5.12) and Eq. (5.13) we can write:
MSE.(X × Y ) =∑
m,n
|∆m,n|2, (5.14)
where X and Y are the image dimensions. Hence for any watermarked image, the
average noise power MSE is proportional to the sum of the energy of the modification
values of the selected wavelet coefficients:
MSE ∝∑
m,n
|∆m,n|2. (5.15)
59
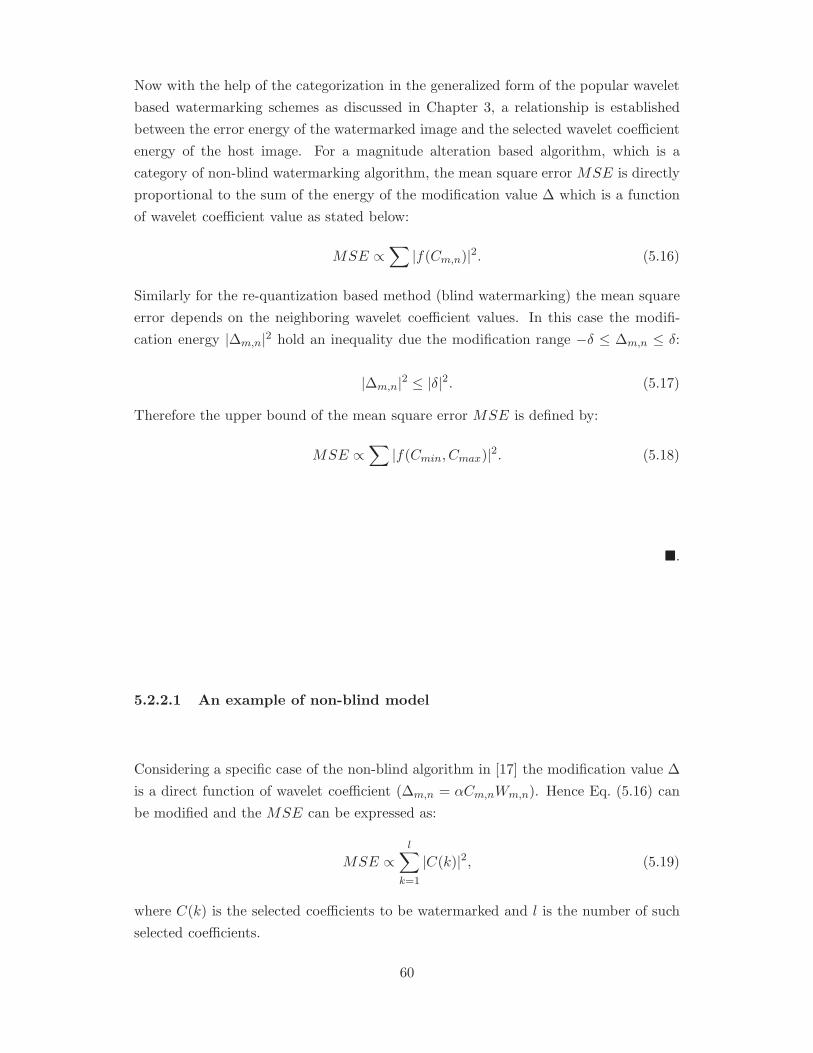
Now with the help of the categorization in the generalized form of the popular wavelet
based watermarking schemes as discussed in Chapter 3, a relationship is established
between the error energy of the watermarked image and the selected wavelet coefficient
energy of the host image. For a magnitude alteration based algorithm, which is a
category of non-blind watermarking algorithm, the mean square error MSE is directly
proportional to the sum of the energy of the modification value ∆ which is a function
of wavelet coefficient value as stated below:
MSE ∝∑
|f(Cm,n)|2. (5.16)
Similarly for the re-quantization based method (blind watermarking) the mean square
error depends on the neighboring wavelet coefficient values. In this case the modifi-
cation energy |∆m,n|2 hold an inequality due the modification range −δ ≤ ∆m,n ≤ δ:
|∆m,n|2 ≤ |δ|2. (5.17)
Therefore the upper bound of the mean square error MSE is defined by:
MSE ∝∑
|f(Cmin, Cmax)|2. (5.18)
�.
5.2.2.1 An example of non-blind model
Considering a specific case of the non-blind algorithm in [17] the modification value ∆
is a direct function of wavelet coefficient (∆m,n = αCm,nWm,n). Hence Eq. (5.16) can
be modified and the MSE can be expressed as:
MSE ∝l∑
k=1
|C(k)|2, (5.19)
where C(k) is the selected coefficients to be watermarked and l is the number of such
selected coefficients.
60

Table 5.1: Correlation coefficient values between sum of energy and the MSE for dif-ferent wavelet kernel in various subbands.
Non-blind model Blind modelHR D4 D8 D16 HR D4 D8 D16
LL3 0.81 0.81 0.81 0.81 0.66 0.68 0.68 0.73LH3 0.93 0.94 0.96 0.97 0.78 0.68 0.61 0.58HL3 0.98 0.99 0.99 0.99 0.78 0.92 0.94 0.97HH3 0.96 0.97 0.98 0.98 0.82 0.81 0.73 0.72LH2 0.98 0.98 0.99 0.99 0.80 0.82 0.75 0.81HL2 0.99 0.99 0.99 0.99 0.92 0.92 0.94 0.97HH2 0.99 0.99 0.99 0.99 0.83 0.80 0.85 0.89LH1 0.99 0.99 0.99 0.99 0.89 0.90 0.89 0.90HL1 0.99 0.99 0.99 0.99 0.84 0.90 0.96 0.94HH1 0.99 0.99 0.99 0.99 0.90 0.91 0.93 0.96
5.2.2.2 An example of blind embedding model
In an blind embedding algorithm suggested in [5], the quantization step δ is defined as:
δ = γCmax + Cmin
2, (5.20)
where γ is the user defined watermark weighting factor. As the modification value ∆
depends on δ, with reference to Eq. (5.18), the relationship between the maximum limit
of MSE and wavelet energy is defined by the following equation:
MSE ∝∑
k
(C(k)max + C(k)min)2, (5.21)
where C(k)max and C(k)min are the neighborhood coefficients of the median value and
k is the number of such selected median value.
5.2.3 Experimental simulations and result discussion
The propositions made in the previous section are verified in the experimental sim-
ulations. The sum of the energy of the selected wavelet coefficients and the MSE of
the watermarked image have been calculated for the test images with a combination
of different input parameters. As the wavelet coefficients varies greatly in different
subbands the performances of all subbands are considered separately after a 3 level
wavelet decomposition. After three level of wavelet decompositions, ten subbands are
61
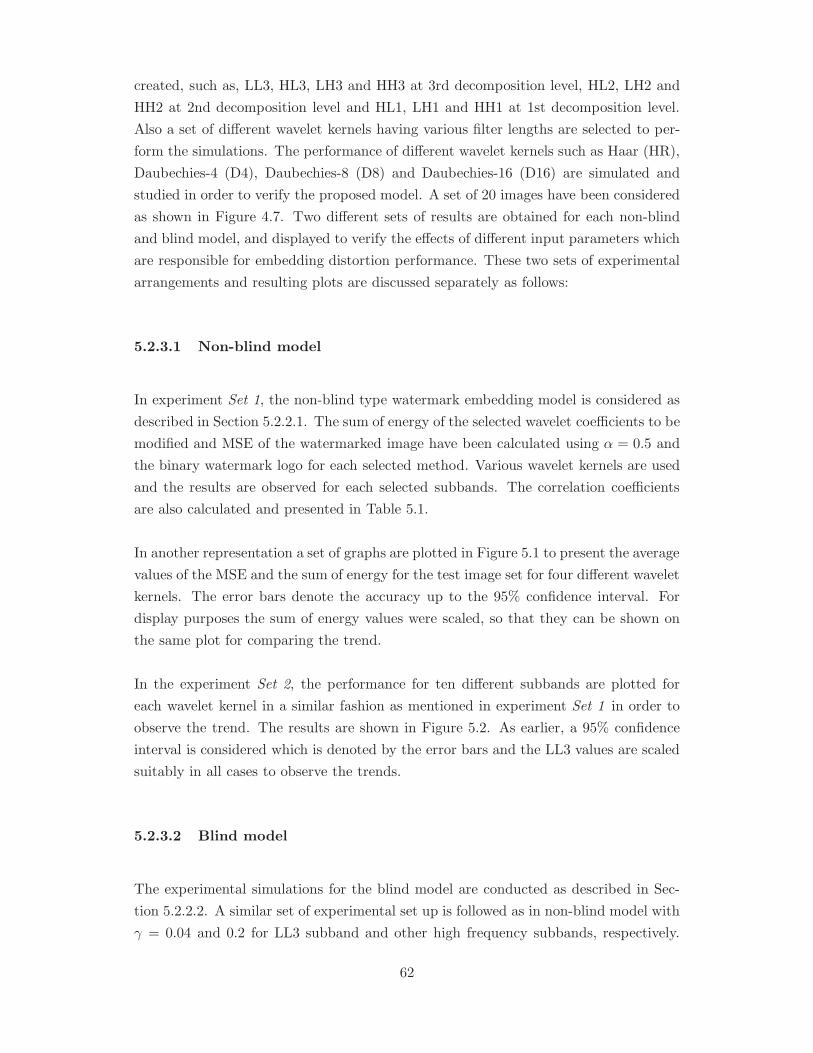
created, such as, LL3, HL3, LH3 and HH3 at 3rd decomposition level, HL2, LH2 and
HH2 at 2nd decomposition level and HL1, LH1 and HH1 at 1st decomposition level.
Also a set of different wavelet kernels having various filter lengths are selected to per-
form the simulations. The performance of different wavelet kernels such as Haar (HR),
Daubechies-4 (D4), Daubechies-8 (D8) and Daubechies-16 (D16) are simulated and
studied in order to verify the proposed model. A set of 20 images have been considered
as shown in Figure 4.7. Two different sets of results are obtained for each non-blind
and blind model, and displayed to verify the effects of different input parameters which
are responsible for embedding distortion performance. These two sets of experimental
arrangements and resulting plots are discussed separately as follows:
5.2.3.1 Non-blind model
In experiment Set 1, the non-blind type watermark embedding model is considered as
described in Section 5.2.2.1. The sum of energy of the selected wavelet coefficients to be
modified and MSE of the watermarked image have been calculated using α = 0.5 and
the binary watermark logo for each selected method. Various wavelet kernels are used
and the results are observed for each selected subbands. The correlation coefficients
are also calculated and presented in Table 5.1.
In another representation a set of graphs are plotted in Figure 5.1 to present the average
values of the MSE and the sum of energy for the test image set for four different wavelet
kernels. The error bars denote the accuracy up to the 95% confidence interval. For
display purposes the sum of energy values were scaled, so that they can be shown on
the same plot for comparing the trend.
In the experiment Set 2, the performance for ten different subbands are plotted for
each wavelet kernel in a similar fashion as mentioned in experiment Set 1 in order to
observe the trend. The results are shown in Figure 5.2. As earlier, a 95% confidence
interval is considered which is denoted by the error bars and the LL3 values are scaled
suitably in all cases to observe the trends.
5.2.3.2 Blind model
The experimental simulations for the blind model are conducted as described in Sec-
tion 5.2.2.2. A similar set of experimental set up is followed as in non-blind model with
γ = 0.04 and 0.2 for LL3 subband and other high frequency subbands, respectively.
62
The correlation coefficients, average pattern graphs for various wavelet kernels and ten
different subbands are presented in Table 5.1, Figure 5.3 and Figure 5.4, respectively.
0.5 1 1.5 2 2.5 3 3.5 4 4.51200
1400
1600
1800
2000
2200
2400
2600
2800Non-blind model: LL3 subband
Wavelets: 1.HR 2.D4 3.D8 4.D16
MS
E a
nd s
cale
d en
ergy
val
ue
MSEEnergy Sum (value scaled)
0.5 1 1.5 2 2.5 3 3.5 4 4.54
5
6
7
8
9
10
11
12Non-blind model: HL3 subband
Wavelets: 1.HR 2.D4 3.D8 4.D16
MS
E a
nd s
cale
d en
ergy
val
ue
MSEEnergy Sum (value scaled)
0.5 1 1.5 2 2.5 3 3.5 4 4.53
4
5
6
7
8
9
10Non-blind model: LH3 subband
Wavelets: 1.HR 2.D4 3.D8 4.D16
MS
E a
nd s
cale
d en
ergy
val
ue
MSEEnergy Sum (value scaled)
0.5 1 1.5 2 2.5 3 3.5 4 4.51
1.2
1.4
1.6
1.8
2
2.2
2.4
2.6Non-blind model: HH3 subband
Wavelets: 1.HR 2.D4 3.D8 4.D16
MS
E a
nd s
cale
d en
ergy
val
ue
MSEEnergy Sum (value scaled)
Figure 5.1: Watermark embedding (non-blind) performance graph for different sub-bands. Four different wavelet kernels used here: 1. HR, 2. D4, 3. D8 and 4. D16,respectively. Subbands are shown left to right and top to bottom: LL3, HL3, LH3,HH3, respectively.
The simulation results show a strong correlation between MSE of the watermarked
image and the energy sum of the selected wavelet coefficients to be modified. It is
observed that for the non-blind model, the correlation coefficient value is more than
0.80 and more than 0.58 in the case of blind model, for different wavelet kernels and
various selected subbands. On the other hand, a similar graph patterns are observed
in Figure 5.1, Figure 5.2, Figure 5.3 and Figure 5.4, which show the proportionality
trend between MSE and the energy sum as proposed in the model. Lower correlation
coefficients are observed for blind model due to the reason that the proportionality
relationship only defines the upper bound in Eq. (5.18) and Eq. (5.21).
63

0 2 4 6 8 10 120
10
20
30
40
50
60Non-blind model: HR wavelet
1.LL3 2.LH3 3.HL3 4.HH3 5.LH2 6.HL2 7.HH2 8.LH1 9.HL1 10.HH1
MS
E a
nd s
cale
d en
ergy
val
ue
MSEEnergy Sum (Scaled)
0 2 4 6 8 10 120
10
20
30
40
50
60Non-blind model: D4 wavelet
1.LL3 2.LH3 3.HL3 4.HH3 5.LH2 6.HL2 7.HH2 8.LH1 9.HL1 10.HH1
MS
E a
nd s
cale
d en
ergy
val
ue
MSEEnergy Sum (Scaled)
0 2 4 6 8 10 120
10
20
30
40
50
60Non-blind model: D8 wavelet
1.LL3 2.LH3 3.HL3 4.HH3 5.LH2 6.HL2 7.HH2 8.LH1 9.HL1 10.HH1
MS
E a
nd s
cale
d en
ergy
val
ue
MSEEnergy Sum (Scaled)
0 2 4 6 8 10 120
20
40
60
80
100
120Non-blind model: D16 wavelet
1.LL3 2.LH3 3.HL3 4.HH3 5.LH2 6.HL2 7.HH2 8.LH1 9.HL1 10.HH1
MS
E a
nd s
cale
d en
ergy
val
ue
MSEEnergy Sum (Scaled)
Figure 5.2: Watermark embedding (non-blind) performance graph for various waveletsin different subband. Wavelet kernels are shown left to right and top to bottom: HR,D4, D8 and D16, respectively.
0.5 1 1.5 2 2.5 3 3.5 4 4.51
2
3
4
5
6
7
8
9Blind model: LL3 subband
Wavelets: 1.HR 2.D4 3.D8 4.D16
MS
E a
nd s
cale
d en
ergy
val
ue
MSEEnergy Sum (value scaled)
0.5 1 1.5 2 2.5 3 3.5 4 4.50.2
0.4
0.6
0.8
1
1.2
1.4
1.6Blind model: HL3 subband
Wavelets: 1.HR 2.D4 3.D8 4.D16
MS
E a
nd s
cale
d en
ergy
val
ue
MSEEnergy Sum (value scaled)
0.5 1 1.5 2 2.5 3 3.5 4 4.50.1
0.2
0.3
0.4
0.5
0.6
0.7
0.8
0.9
1
1.1Blind model: LH3 subband
Wavelets: 1.HR 2.D4 3.D8 4.D16
MS
E a
nd s
cale
d en
ergy
val
ue
MSEEnergy Sum (value scaled)
0.5 1 1.5 2 2.5 3 3.5 4 4.50.04
0.06
0.08
0.1
0.12
0.14
0.16
0.18
0.2
0.22
0.24Blind model: HH3 subband
Wavelets: 1.HR 2.D4 3.D8 4.D16
MS
E a
nd s
cale
d en
ergy
val
ue
MSEEnergy Sum (value scaled)
Figure 5.3: Watermark embedding (blind) performance graph for different subbands.Four different wavelet kernels used here: 1. HR, 2. D4, 3. D8 and 4. D16, respectively.Subbands are shown left to right and top to bottom: LL3, HL3, LH3, HH3, respectively.
64
0 2 4 6 8 10 120
0.5
1
1.5
2
2.5
3
3.5
4
4.5Blind model: HR wavelet
1.LL3 2.LH3 3.HL3 4.HH3 5.LH2 6.HL2 7.HH2 8.LH1 9.HL1 10.HH1M
SE
and
sca
led
ener
gy v
alue
MSEEnergy Sum (Scaled)
0 2 4 6 8 10 120
0.5
1
1.5
2
2.5
3
3.5
4
4.5Blind model: D4 wavelet
1.LL3 2.LH3 3.HL3 4.HH3 5.LH2 6.HL2 7.HH2 8.LH1 9.HL1 10.HH1
MS
E a
nd s
cale
d en
ergy
val
ue
MSEEnergy Sum (Scaled)
0 2 4 6 8 10 120
0.5
1
1.5
2
2.5
3
3.5
4
4.5Blind model: D8 wavelet
1.LL3 2.LH3 3.HL3 4.HH3 5.LH2 6.HL2 7.HH2 8.LH1 9.HL1 10.HH1
MS
E a
nd s
cale
d en
ergy
val
ue
MSEEnergy Sum (Scaled)
0 2 4 6 8 10 120
0.5
1
1.5
2
2.5
3
3.5
4
4.5Blind model: D16 wavelet
1.LL3 2.LH3 3.HL3 4.HH3 5.LH2 6.HL2 7.HH2 8.LH1 9.HL1 10.HH1
MS
E a
nd s
cale
d en
ergy
val
ue
MSEEnergy Sum (Scaled)
Figure 5.4: Watermark embedding (blind) performance graph for various wavelets indifferent subband. Wavelet kernels are shown left to right and top to bottom: HR, D4,D8 and D16, respectively.
5.3 Embedding distortion model for non-orthonormal
wavelet bases
5.3.1 Preliminaries
Recalling Parseval’s Equality inDefinition 5.2.2, Eq. (5.2) is true for orthonormal trans-
forms where energy is conserved between transforms. On the contrary, non-orthonormal
wavelets such as biorthogonal wavelets do not hold conservation of energy. But for a
stable expansion, the transform domain coefficients have to satisfy the Eq. (5.22) [59].
A∑
k
|y[k]|2 ≤ ‖x‖2 ≤ B∑
k
|y[k]|2, (5.22)
where A and B are the orthonormality correction factor.
Based on the discussed propositions and the definitions we shall build the extended
model and make the new propositions. As suggested in Eq. (5.22), for a non-orthonormal
wavelet base an orthonormality correction factor is required and we shall call this as a
65
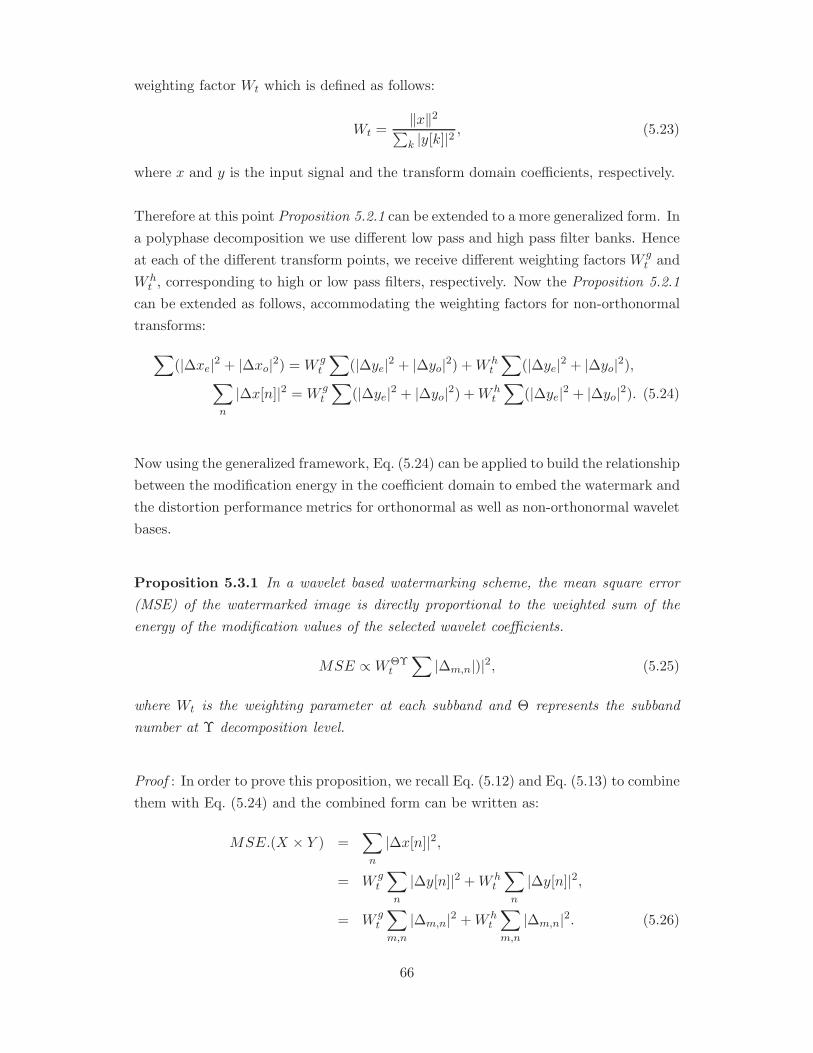
weighting factor Wt which is defined as follows:
Wt =‖x‖2∑k |y[k]|2
, (5.23)
where x and y is the input signal and the transform domain coefficients, respectively.
Therefore at this point Proposition 5.2.1 can be extended to a more generalized form. In
a polyphase decomposition we use different low pass and high pass filter banks. Hence
at each of the different transform points, we receive different weighting factors W gt and
W ht , corresponding to high or low pass filters, respectively. Now the Proposition 5.2.1
can be extended as follows, accommodating the weighting factors for non-orthonormal
transforms:
∑(|∆xe|2 + |∆xo|2) = W g
t
∑(|∆ye|2 + |∆yo|2) +W h
t
∑(|∆ye|2 + |∆yo|2),
∑
n
|∆x[n]|2 = W gt
∑(|∆ye|2 + |∆yo|2) +W h
t
∑(|∆ye|2 + |∆yo|2). (5.24)
Now using the generalized framework, Eq. (5.24) can be applied to build the relationship
between the modification energy in the coefficient domain to embed the watermark and
the distortion performance metrics for orthonormal as well as non-orthonormal wavelet
bases.
Proposition 5.3.1 In a wavelet based watermarking scheme, the mean square error
(MSE) of the watermarked image is directly proportional to the weighted sum of the
energy of the modification values of the selected wavelet coefficients.
MSE ∝ WΘΥt
∑|∆m,n|)|2, (5.25)
where Wt is the weighting parameter at each subband and Θ represents the subband
number at Υ decomposition level.
Proof : In order to prove this proposition, we recall Eq. (5.12) and Eq. (5.13) to combine
them with Eq. (5.24) and the combined form can be written as:
MSE.(X × Y ) =∑
n
|∆x[n]|2,
= W gt
∑
n
|∆y[n]|2 +W ht
∑
n
|∆y[n]|2,
= W gt
∑
m,n
|∆m,n|2 +W ht
∑
m,n
|∆m,n|2. (5.26)
66

Hence for any watermarked image, the average noise power MSE is proportional to
the sum of the weighted energy of the modification values of the selected wavelet
coefficients:
MSE ∝ W gt
∑
m,n
|∆m,n|2 +W ht
∑
m,n
|∆m,n|2. (5.27)
Now in the case of 2-D wavelet decompositions, the wavelet kernel transfer function, for
each subband at each decomposition level are different and so that the weighting factors
are. Hence the ∆ in Eq. (5.27) are associated with a corresponding weighting parameter
for each subband at each decomposition level. We define the weighting parameter as
WΘΥt at each subband and Θ represents the subband number at Υ decomposition level
and therefore Eq. (5.27) can be re-written as:
MSE ∝ WΘΥt
∑|∆m,n|)|2. (5.28)
�.
Therefore, using Eq. (5.28), the Eq. (5.10) and Eq. (5.11) can be extended for non-blind
and blind model to Eq. (5.29) and Eq. (5.30), respectively, as follows:
MSE ∝∑
WΘΥt |f(Cm,n)|2. (5.29)
MSE ∝∑
WΘΥt |f(Cmin, Cmax)|2. (5.30)
Hence the above equation can universally used for various wavelet kernels, where for
orthonormal wavelet kernels the value of the weighting parameters are equal to unity.
For non-orthonormal wavelet kernel, different weighting parameter values are suggested
in next section for different subbands at each decomposition level.
5.3.2 Experimental simulations and discussion
Experimental simulations have been carried out to verify the propositions made in the
previous section. There are two different parts of the experiment conducted: calculation
of the weighting parameters and simulation of the propositions.
67
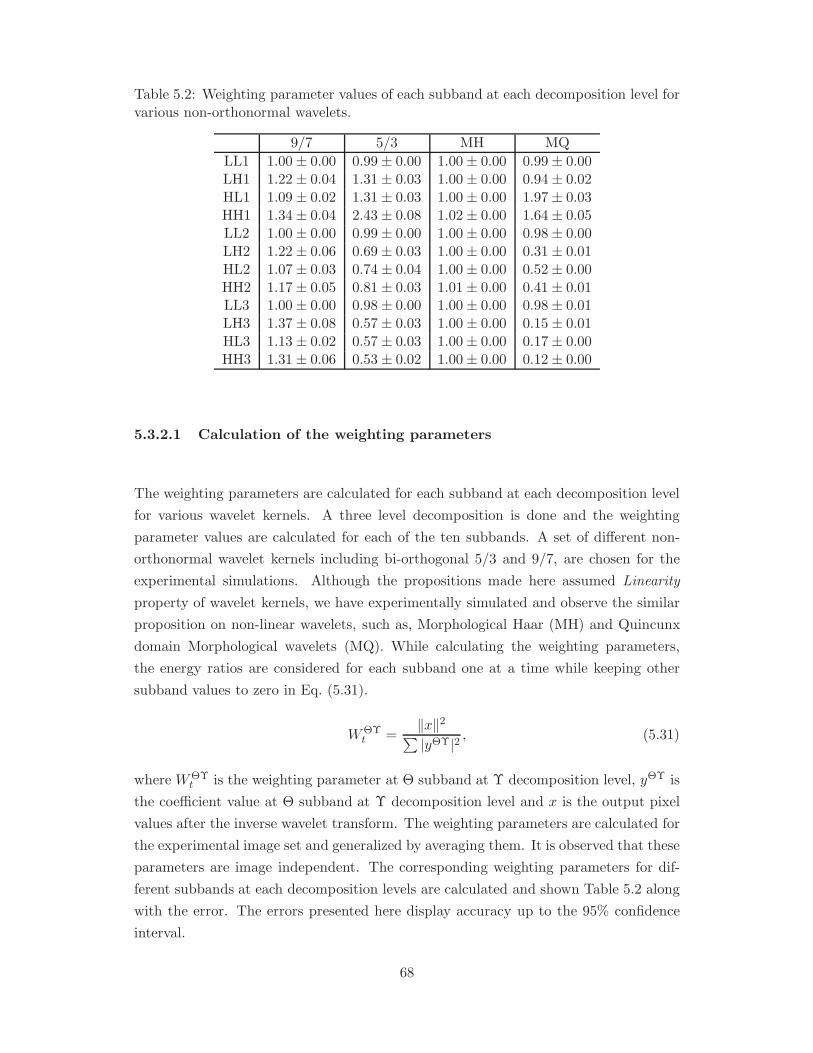
Table 5.2: Weighting parameter values of each subband at each decomposition level forvarious non-orthonormal wavelets.
9/7 5/3 MH MQ
LL1 1.00± 0.00 0.99± 0.00 1.00± 0.00 0.99± 0.00LH1 1.22± 0.04 1.31± 0.03 1.00± 0.00 0.94± 0.02HL1 1.09± 0.02 1.31± 0.03 1.00± 0.00 1.97± 0.03HH1 1.34± 0.04 2.43± 0.08 1.02± 0.00 1.64± 0.05LL2 1.00± 0.00 0.99± 0.00 1.00± 0.00 0.98± 0.00LH2 1.22± 0.06 0.69± 0.03 1.00± 0.00 0.31± 0.01HL2 1.07± 0.03 0.74± 0.04 1.00± 0.00 0.52± 0.00HH2 1.17± 0.05 0.81± 0.03 1.01± 0.00 0.41± 0.01LL3 1.00± 0.00 0.98± 0.00 1.00± 0.00 0.98± 0.01LH3 1.37± 0.08 0.57± 0.03 1.00± 0.00 0.15± 0.01HL3 1.13± 0.02 0.57± 0.03 1.00± 0.00 0.17± 0.00HH3 1.31± 0.06 0.53± 0.02 1.00± 0.00 0.12± 0.00
5.3.2.1 Calculation of the weighting parameters
The weighting parameters are calculated for each subband at each decomposition level
for various wavelet kernels. A three level decomposition is done and the weighting
parameter values are calculated for each of the ten subbands. A set of different non-
orthonormal wavelet kernels including bi-orthogonal 5/3 and 9/7, are chosen for the
experimental simulations. Although the propositions made here assumed Linearity
property of wavelet kernels, we have experimentally simulated and observe the similar
proposition on non-linear wavelets, such as, Morphological Haar (MH) and Quincunx
domain Morphological wavelets (MQ). While calculating the weighting parameters,
the energy ratios are considered for each subband one at a time while keeping other
subband values to zero in Eq. (5.31).
WΘΥt =
‖x‖2∑|yΘΥ|2 , (5.31)
where WΘΥt is the weighting parameter at Θ subband at Υ decomposition level, yΘΥ is
the coefficient value at Θ subband at Υ decomposition level and x is the output pixel
values after the inverse wavelet transform. The weighting parameters are calculated for
the experimental image set and generalized by averaging them. It is observed that these
parameters are image independent. The corresponding weighting parameters for dif-
ferent subbands at each decomposition levels are calculated and shown Table 5.2 along
with the error. The errors presented here display accuracy up to the 95% confidence
interval.
68
5.3.2.2 Simulations of the propositions
The simulations of the proposed embedding distortion model for non-orthonormal
wavelet kernels are performed using a similar set up as used in the simulations of
the embedding models for orthonormal wavelets. The same test image set is used,
with three level wavelet decomposition. Four different non-orthonormal wavelet ker-
nels, namely, bi-orthogonal 9/7 and 5/3 and non-linear Morphological Haar (MH) and
Quincunx domain Morphological wavelets (MQ), are simulated and studied here. For
each simulations, first, results are shown without considering the weighting parameters
(WΘΥt ) and then the corresponding results using weighting parameters from Table 5.2:
Non-blind model: The experimental simulations for non-blind model as described in
Eq. (5.29) is performed and the correlation coefficients are calculated and represented
in Table 5.3. The average values of the MSE and the sum of energy are shown in
Figure 5.5. Column 1 and Column 2 represent the results without and with considering
the weighting parameter, while calculating the energy sum, respectively. The error bars
denote the accuracy up to the 95% confidence interval. For display purposes the sum
of energy value was scaled, so that they can be shown on the same plot for comparing
the trend.
In the other experiment set the subbands are compared and the results are shown in
Figure 5.6. Here Column 1, Column 2 and Column 3 represent the MSE, energy sum
without and with weighting parameters, respectively. As earlier the LL3 values are
scaled suitably in all cases to observe the trends.
Blind model: A similar experimental set, as in non-blind model, is used for the blind
model for non-orthonormal wavelet kernels as described in Eq. (5.30). The correlation
coefficients, average pattern graphs for various wavelet kernels and ten different sub-
bands are presented in Table 5.3, Figure 5.7 and Figure 5.8, respectively, without and
with consideration of the weighting parameters.
It is observed that bi-orthogonal wavelets strongly support the propositions, whereas
an occasional deviation is noticed for MH and MQ wavelet kernels due its non-linear
activity within the transform. However, the general behavioral pattern is maintained in
all four non-orthonormal wavelets, ensures the propositions’ realization in embedding
distortion performance of the generalized watermarking schemes.
69
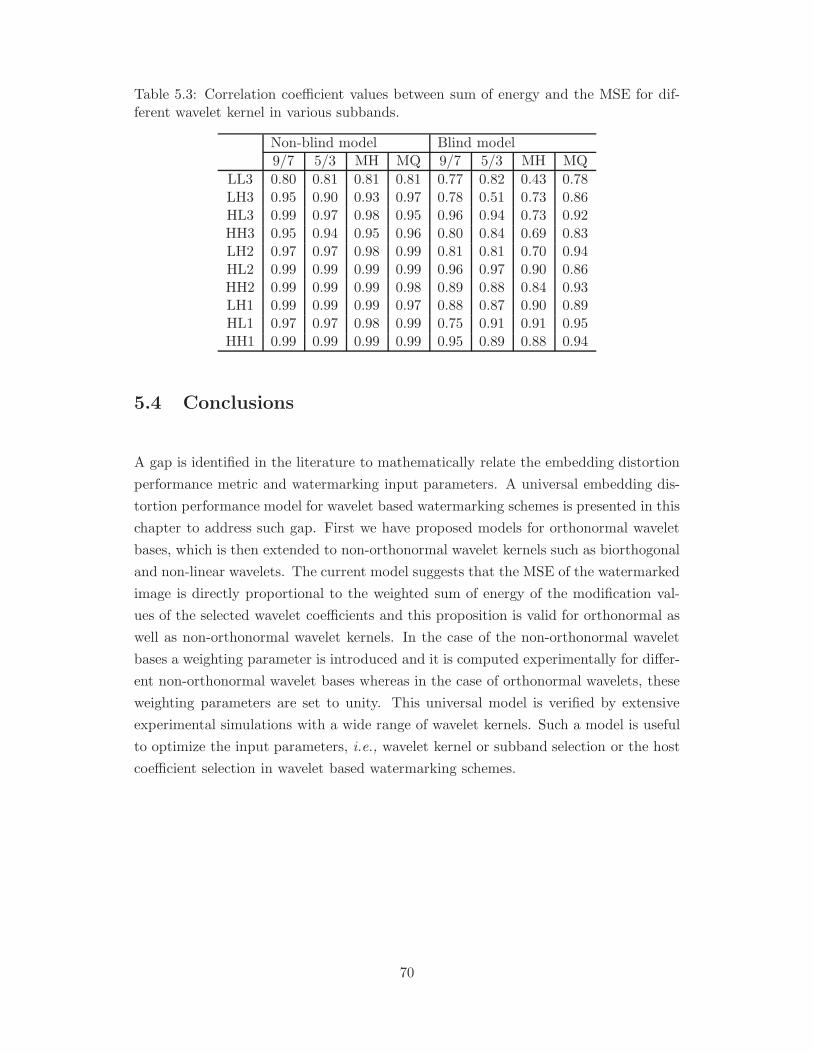
Table 5.3: Correlation coefficient values between sum of energy and the MSE for dif-ferent wavelet kernel in various subbands.
Non-blind model Blind model9/7 5/3 MH MQ 9/7 5/3 MH MQ
LL3 0.80 0.81 0.81 0.81 0.77 0.82 0.43 0.78LH3 0.95 0.90 0.93 0.97 0.78 0.51 0.73 0.86HL3 0.99 0.97 0.98 0.95 0.96 0.94 0.73 0.92HH3 0.95 0.94 0.95 0.96 0.80 0.84 0.69 0.83LH2 0.97 0.97 0.98 0.99 0.81 0.81 0.70 0.94HL2 0.99 0.99 0.99 0.99 0.96 0.97 0.90 0.86HH2 0.99 0.99 0.99 0.98 0.89 0.88 0.84 0.93LH1 0.99 0.99 0.99 0.97 0.88 0.87 0.90 0.89HL1 0.97 0.97 0.98 0.99 0.75 0.91 0.91 0.95HH1 0.99 0.99 0.99 0.99 0.95 0.89 0.88 0.94
5.4 Conclusions
A gap is identified in the literature to mathematically relate the embedding distortion
performance metric and watermarking input parameters. A universal embedding dis-
tortion performance model for wavelet based watermarking schemes is presented in this
chapter to address such gap. First we have proposed models for orthonormal wavelet
bases, which is then extended to non-orthonormal wavelet kernels such as biorthogonal
and non-linear wavelets. The current model suggests that the MSE of the watermarked
image is directly proportional to the weighted sum of energy of the modification val-
ues of the selected wavelet coefficients and this proposition is valid for orthonormal as
well as non-orthonormal wavelet kernels. In the case of the non-orthonormal wavelet
bases a weighting parameter is introduced and it is computed experimentally for differ-
ent non-orthonormal wavelet bases whereas in the case of orthonormal wavelets, these
weighting parameters are set to unity. This universal model is verified by extensive
experimental simulations with a wide range of wavelet kernels. Such a model is useful
to optimize the input parameters, i.e., wavelet kernel or subband selection or the host
coefficient selection in wavelet based watermarking schemes.
70
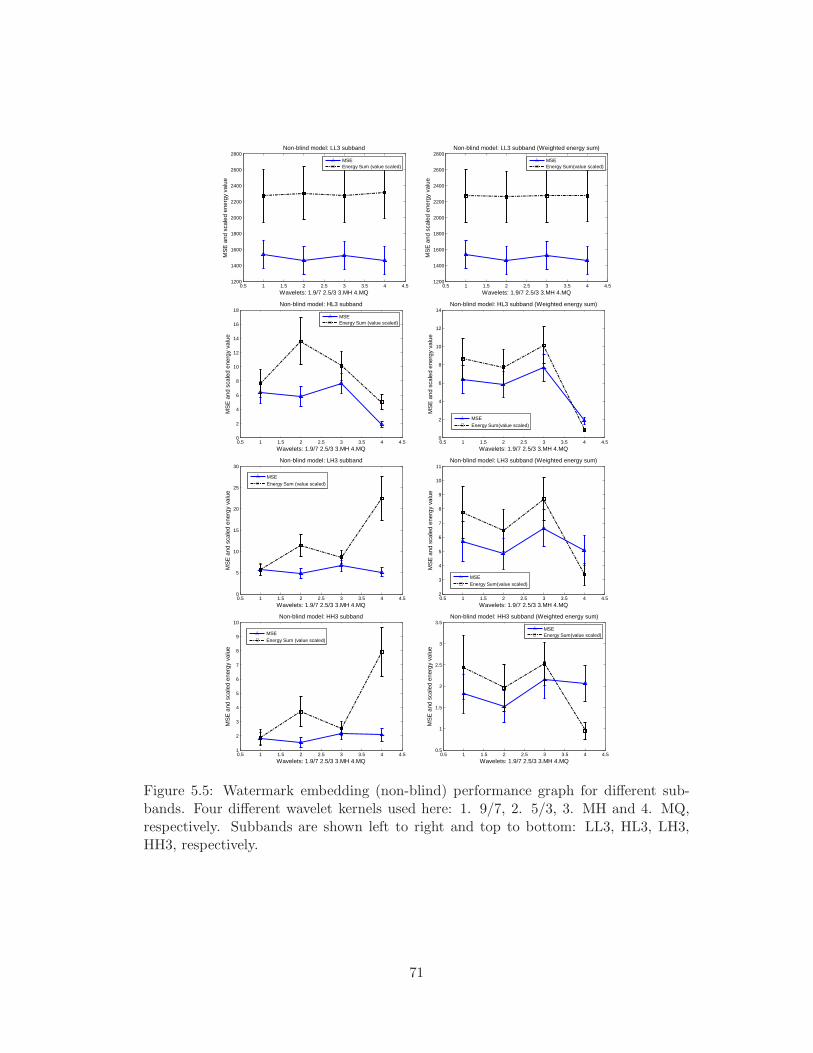
0.5 1 1.5 2 2.5 3 3.5 4 4.51200
1400
1600
1800
2000
2200
2400
2600
2800Non-blind model: LL3 subband
Wavelets: 1.9/7 2.5/3 3.MH 4.MQ
MS
E a
nd s
cale
d en
ergy
val
ue
MSEEnergy Sum (value scaled)
0.5 1 1.5 2 2.5 3 3.5 4 4.51200
1400
1600
1800
2000
2200
2400
2600
2800Non-blind model: LL3 subband (Weighted energy sum)
Wavelets: 1.9/7 2.5/3 3.MH 4.MQ
MS
E a
nd s
cale
d en
ergy
val
ue
MSEEnergy Sum(value scaled)
0.5 1 1.5 2 2.5 3 3.5 4 4.50
2
4
6
8
10
12
14
16
18Non-blind model: HL3 subband
Wavelets: 1.9/7 2.5/3 3.MH 4.MQ
MS
E a
nd s
cale
d en
ergy
val
ue
MSEEnergy Sum (value scaled)
0.5 1 1.5 2 2.5 3 3.5 4 4.50
2
4
6
8
10
12
14Non-blind model: HL3 subband (Weighted energy sum)
Wavelets: 1.9/7 2.5/3 3.MH 4.MQ
MS
E a
nd s
cale
d en
ergy
val
ue
MSEEnergy Sum(value scaled)
0.5 1 1.5 2 2.5 3 3.5 4 4.50
5
10
15
20
25
30Non-blind model: LH3 subband
Wavelets: 1.9/7 2.5/3 3.MH 4.MQ
MS
E a
nd s
cale
d en
ergy
val
ue
MSEEnergy Sum (value scaled)
0.5 1 1.5 2 2.5 3 3.5 4 4.52
3
4
5
6
7
8
9
10
11Non-blind model: LH3 subband (Weighted energy sum)
Wavelets: 1.9/7 2.5/3 3.MH 4.MQ
MS
E a
nd s
cale
d en
ergy
val
ue
MSEEnergy Sum(value scaled)
0.5 1 1.5 2 2.5 3 3.5 4 4.51
2
3
4
5
6
7
8
9
10Non-blind model: HH3 subband
Wavelets: 1.9/7 2.5/3 3.MH 4.MQ
MS
E a
nd s
cale
d en
ergy
val
ue
MSEEnergy Sum (value scaled)
0.5 1 1.5 2 2.5 3 3.5 4 4.50.5
1
1.5
2
2.5
3
3.5Non-blind model: HH3 subband (Weighted energy sum)
Wavelets: 1.9/7 2.5/3 3.MH 4.MQ
MS
E a
nd s
cale
d en
ergy
val
ue
MSEEnergy Sum(value scaled)
Figure 5.5: Watermark embedding (non-blind) performance graph for different sub-bands. Four different wavelet kernels used here: 1. 9/7, 2. 5/3, 3. MH and 4. MQ,respectively. Subbands are shown left to right and top to bottom: LL3, HL3, LH3,HH3, respectively.
71
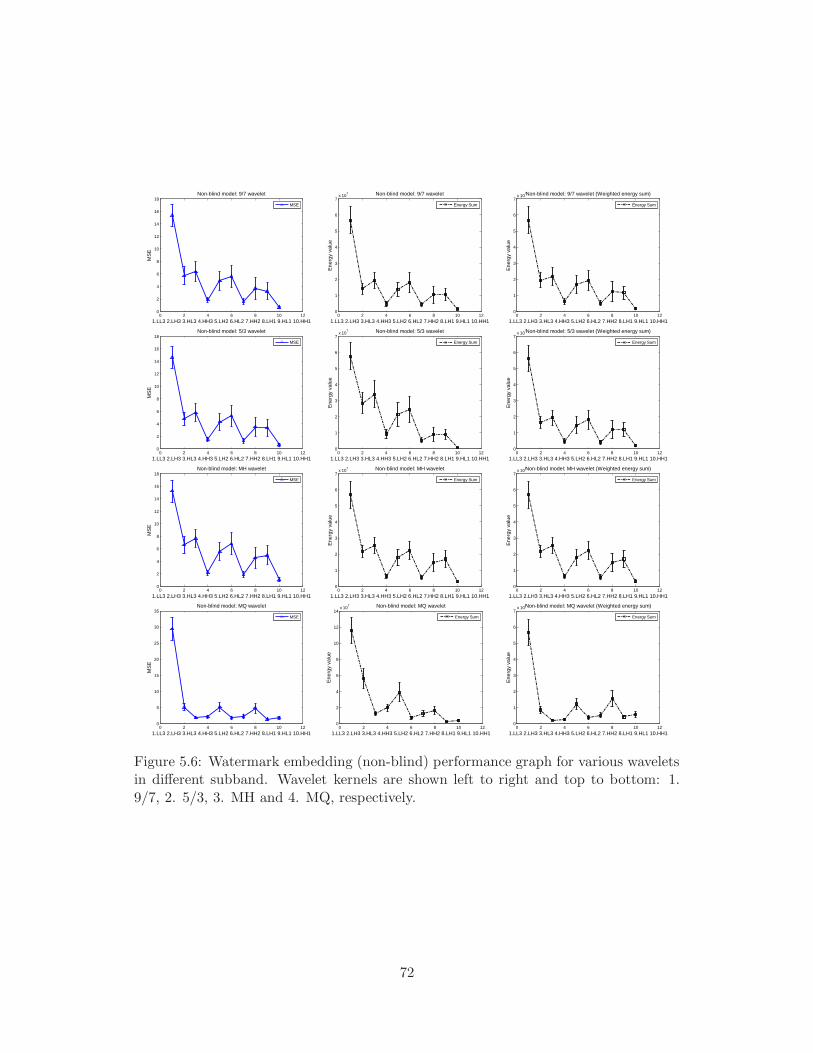
0 2 4 6 8 10 120
2
4
6
8
10
12
14
16
18Non-blind model: 9/7 wavelet
1.LL3 2.LH3 3.HL3 4.HH3 5.LH2 6.HL2 7.HH2 8.LH1 9.HL1 10.HH1
MS
E
MSE
0 2 4 6 8 10 120
1
2
3
4
5
6
7x 10
7 Non-blind model: 9/7 wavelet
1.LL3 2.LH3 3.HL3 4.HH3 5.LH2 6.HL2 7.HH2 8.LH1 9.HL1 10.HH1
Ene
rgy
valu
e
Energy Sum
0 2 4 6 8 10 120
1
2
3
4
5
6
7x 10
7Non-blind model: 9/7 wavelet (Weighted energy sum)
1.LL3 2.LH3 3.HL3 4.HH3 5.LH2 6.HL2 7.HH2 8.LH1 9.HL1 10.HH1
Ene
rgy
valu
e
Energy Sum
0 2 4 6 8 10 120
2
4
6
8
10
12
14
16
18Non-blind model: 5/3 wavelet
1.LL3 2.LH3 3.HL3 4.HH3 5.LH2 6.HL2 7.HH2 8.LH1 9.HL1 10.HH1
MS
E
MSE
0 2 4 6 8 10 120
1
2
3
4
5
6
7x 10
7 Non-blind model: 5/3 wavelet
1.LL3 2.LH3 3.HL3 4.HH3 5.LH2 6.HL2 7.HH2 8.LH1 9.HL1 10.HH1
Ene
rgy
valu
e
Energy Sum
0 2 4 6 8 10 120
1
2
3
4
5
6
7x 10
7Non-blind model: 5/3 wavelet (Weighted energy sum)
1.LL3 2.LH3 3.HL3 4.HH3 5.LH2 6.HL2 7.HH2 8.LH1 9.HL1 10.HH1
Ene
rgy
valu
e
Energy Sum
0 2 4 6 8 10 120
2
4
6
8
10
12
14
16
18Non-blind model: MH wavelet
1.LL3 2.LH3 3.HL3 4.HH3 5.LH2 6.HL2 7.HH2 8.LH1 9.HL1 10.HH1
MS
E
MSE
0 2 4 6 8 10 120
1
2
3
4
5
6
7x 10
7 Non-blind model: MH wavelet
1.LL3 2.LH3 3.HL3 4.HH3 5.LH2 6.HL2 7.HH2 8.LH1 9.HL1 10.HH1
Ene
rgy
valu
e
Energy Sum
0 2 4 6 8 10 120
1
2
3
4
5
6
7x 10
7Non-blind model: MH wavelet (Weighted energy sum)
1.LL3 2.LH3 3.HL3 4.HH3 5.LH2 6.HL2 7.HH2 8.LH1 9.HL1 10.HH1
Ene
rgy
valu
e
Energy Sum
0 2 4 6 8 10 120
5
10
15
20
25
30
35Non-blind model: MQ wavelet
1.LL3 2.LH3 3.HL3 4.HH3 5.LH2 6.HL2 7.HH2 8.LH1 9.HL1 10.HH1
MS
E
MSE
0 2 4 6 8 10 120
2
4
6
8
10
12
14x 10
7 Non-blind model: MQ wavelet
1.LL3 2.LH3 3.HL3 4.HH3 5.LH2 6.HL2 7.HH2 8.LH1 9.HL1 10.HH1
Ene
rgy
valu
e
Energy Sum
0 2 4 6 8 10 120
1
2
3
4
5
6
7x 10
7Non-blind model: MQ wavelet (Weighted energy sum)
1.LL3 2.LH3 3.HL3 4.HH3 5.LH2 6.HL2 7.HH2 8.LH1 9.HL1 10.HH1
Ene
rgy
valu
e
Energy Sum
Figure 5.6: Watermark embedding (non-blind) performance graph for various waveletsin different subband. Wavelet kernels are shown left to right and top to bottom: 1.9/7, 2. 5/3, 3. MH and 4. MQ, respectively.
72
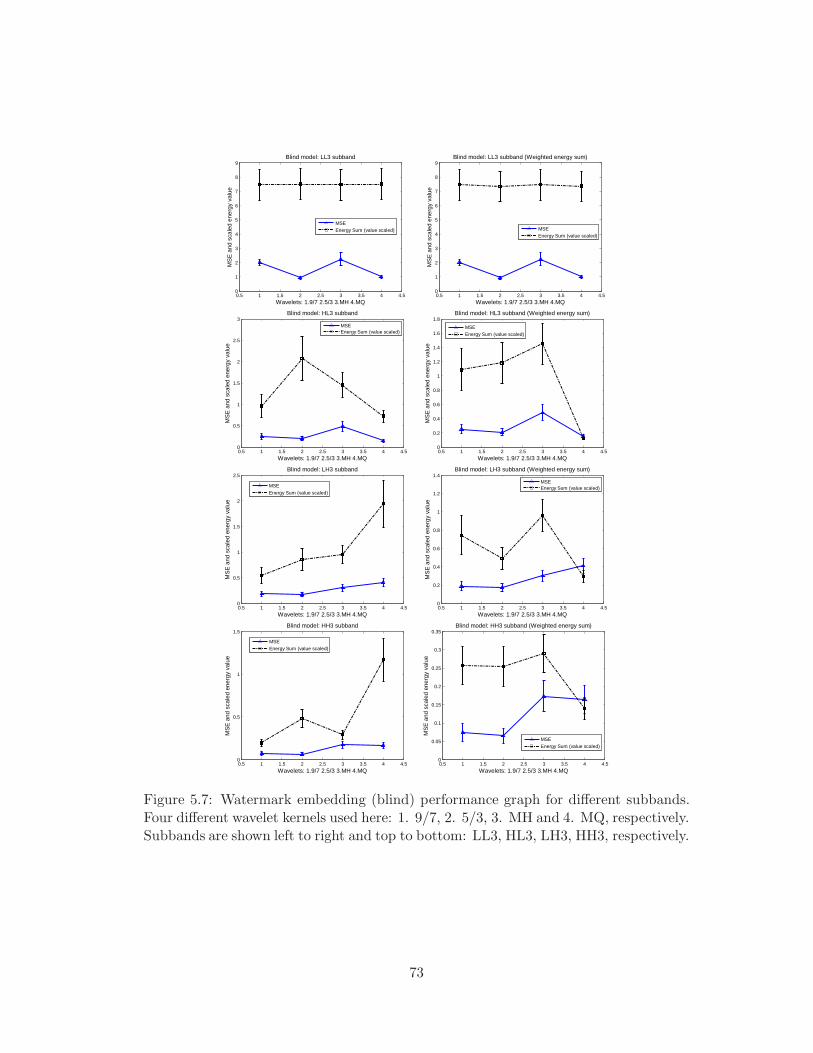
0.5 1 1.5 2 2.5 3 3.5 4 4.50
1
2
3
4
5
6
7
8
9Blind model: LL3 subband
Wavelets: 1.9/7 2.5/3 3.MH 4.MQ
MS
E a
nd s
cale
d en
ergy
val
ue
MSEEnergy Sum (value scaled)
0.5 1 1.5 2 2.5 3 3.5 4 4.50
1
2
3
4
5
6
7
8
9Blind model: LL3 subband (Weighted energy sum)
Wavelets: 1.9/7 2.5/3 3.MH 4.MQ
MS
E a
nd s
cale
d en
ergy
val
ue
MSEEnergy Sum (value scaled)
0.5 1 1.5 2 2.5 3 3.5 4 4.50
0.5
1
1.5
2
2.5
3Blind model: HL3 subband
Wavelets: 1.9/7 2.5/3 3.MH 4.MQ
MS
E a
nd s
cale
d en
ergy
val
ue
MSEEnergy Sum (value scaled)
0.5 1 1.5 2 2.5 3 3.5 4 4.50
0.2
0.4
0.6
0.8
1
1.2
1.4
1.6
1.8Blind model: HL3 subband (Weighted energy sum)
Wavelets: 1.9/7 2.5/3 3.MH 4.MQ
MS
E a
nd s
cale
d en
ergy
val
ue
MSEEnergy Sum (value scaled)
0.5 1 1.5 2 2.5 3 3.5 4 4.50
0.5
1
1.5
2
2.5Blind model: LH3 subband
Wavelets: 1.9/7 2.5/3 3.MH 4.MQ
MS
E a
nd s
cale
d en
ergy
val
ue
MSEEnergy Sum (value scaled)
0.5 1 1.5 2 2.5 3 3.5 4 4.50
0.2
0.4
0.6
0.8
1
1.2
1.4Blind model: LH3 subband (Weighted energy sum)
Wavelets: 1.9/7 2.5/3 3.MH 4.MQ
MS
E a
nd s
cale
d en
ergy
val
ue
MSEEnergy Sum (value scaled)
0.5 1 1.5 2 2.5 3 3.5 4 4.50
0.5
1
1.5Blind model: HH3 subband
Wavelets: 1.9/7 2.5/3 3.MH 4.MQ
MS
E a
nd s
cale
d en
ergy
val
ue
MSEEnergy Sum (value scaled)
0.5 1 1.5 2 2.5 3 3.5 4 4.50
0.05
0.1
0.15
0.2
0.25
0.3
0.35Blind model: HH3 subband (Weighted energy sum)
Wavelets: 1.9/7 2.5/3 3.MH 4.MQ
MS
E a
nd s
cale
d en
ergy
val
ue
MSEEnergy Sum (value scaled)
Figure 5.7: Watermark embedding (blind) performance graph for different subbands.Four different wavelet kernels used here: 1. 9/7, 2. 5/3, 3. MH and 4. MQ, respectively.Subbands are shown left to right and top to bottom: LL3, HL3, LH3, HH3, respectively.
73
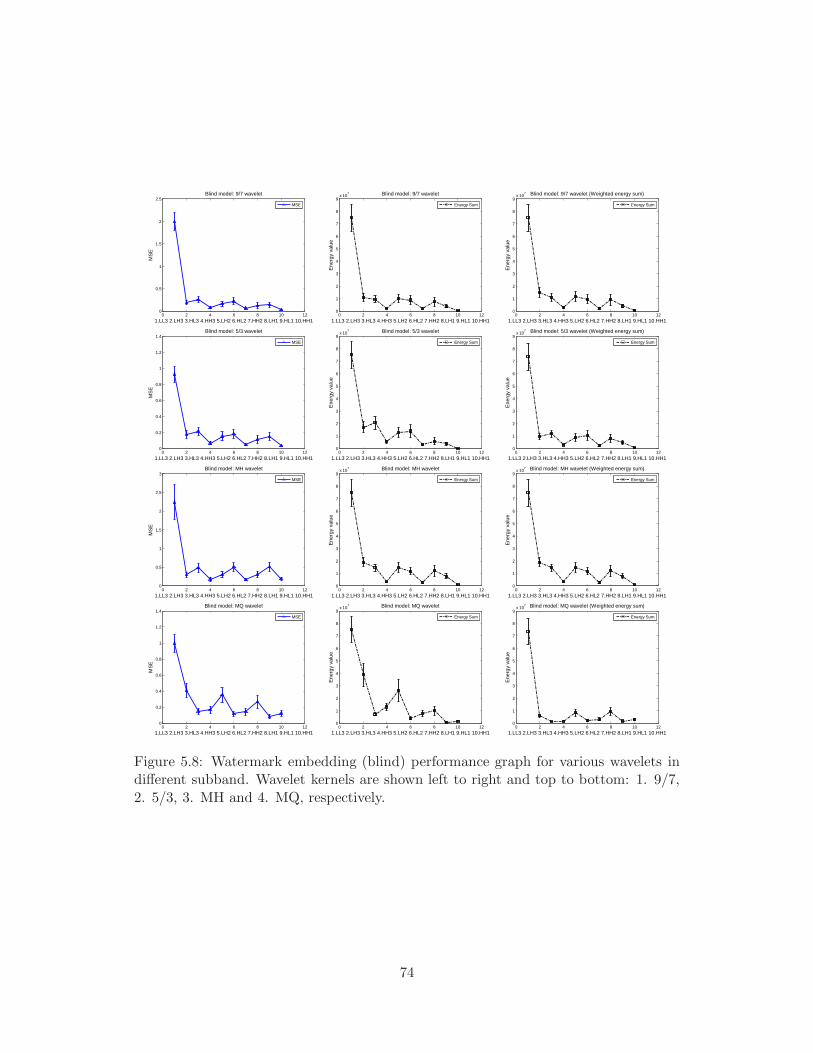
0 2 4 6 8 10 120
0.5
1
1.5
2
2.5Blind model: 9/7 wavelet
1.LL3 2.LH3 3.HL3 4.HH3 5.LH2 6.HL2 7.HH2 8.LH1 9.HL1 10.HH1
MS
E
MSE
0 2 4 6 8 10 120
1
2
3
4
5
6
7
8
9x 10
7 Blind model: 9/7 wavelet
1.LL3 2.LH3 3.HL3 4.HH3 5.LH2 6.HL2 7.HH2 8.LH1 9.HL1 10.HH1
Ene
rgy
valu
e
Energy Sum
0 2 4 6 8 10 120
1
2
3
4
5
6
7
8
9x 10
7 Blind model: 9/7 wavelet (Weighted energy sum)
1.LL3 2.LH3 3.HL3 4.HH3 5.LH2 6.HL2 7.HH2 8.LH1 9.HL1 10.HH1
Ene
rgy
valu
e
Energy Sum
0 2 4 6 8 10 120
0.2
0.4
0.6
0.8
1
1.2
1.4Blind model: 5/3 wavelet
1.LL3 2.LH3 3.HL3 4.HH3 5.LH2 6.HL2 7.HH2 8.LH1 9.HL1 10.HH1
MS
E
MSE
0 2 4 6 8 10 120
1
2
3
4
5
6
7
8
9x 10
7 Blind model: 5/3 wavelet
1.LL3 2.LH3 3.HL3 4.HH3 5.LH2 6.HL2 7.HH2 8.LH1 9.HL1 10.HH1
Ene
rgy
valu
e
Energy Sum
0 2 4 6 8 10 120
1
2
3
4
5
6
7
8
9x 10
7 Blind model: 5/3 wavelet (Weighted energy sum)
1.LL3 2.LH3 3.HL3 4.HH3 5.LH2 6.HL2 7.HH2 8.LH1 9.HL1 10.HH1
Ene
rgy
valu
e
Energy Sum
0 2 4 6 8 10 120
0.5
1
1.5
2
2.5
3Blind model: MH wavelet
1.LL3 2.LH3 3.HL3 4.HH3 5.LH2 6.HL2 7.HH2 8.LH1 9.HL1 10.HH1
MS
E
MSE
0 2 4 6 8 10 120
1
2
3
4
5
6
7
8
9x 10
7 Blind model: MH wavelet
1.LL3 2.LH3 3.HL3 4.HH3 5.LH2 6.HL2 7.HH2 8.LH1 9.HL1 10.HH1
Ene
rgy
valu
e
Energy Sum
0 2 4 6 8 10 120
1
2
3
4
5
6
7
8
9x 10
7 Blind model: MH wavelet (Weighted energy sum)
1.LL3 2.LH3 3.HL3 4.HH3 5.LH2 6.HL2 7.HH2 8.LH1 9.HL1 10.HH1
Ene
rgy
valu
e
Energy Sum
0 2 4 6 8 10 120
0.2
0.4
0.6
0.8
1
1.2
1.4Blind model: MQ wavelet
1.LL3 2.LH3 3.HL3 4.HH3 5.LH2 6.HL2 7.HH2 8.LH1 9.HL1 10.HH1
MS
E
MSE
0 2 4 6 8 10 120
1
2
3
4
5
6
7
8
9x 10
7 Blind model: MQ wavelet
1.LL3 2.LH3 3.HL3 4.HH3 5.LH2 6.HL2 7.HH2 8.LH1 9.HL1 10.HH1
Ene
rgy
valu
e
Energy Sum
0 2 4 6 8 10 120
1
2
3
4
5
6
7
8
9x 10
7 Blind model: MQ wavelet (Weighted energy sum)
1.LL3 2.LH3 3.HL3 4.HH3 5.LH2 6.HL2 7.HH2 8.LH1 9.HL1 10.HH1
Ene
rgy
valu
e
Energy Sum
Figure 5.8: Watermark embedding (blind) performance graph for various wavelets indifferent subband. Wavelet kernels are shown left to right and top to bottom: 1. 9/7,2. 5/3, 3. MH and 4. MQ, respectively.
74
Chapter 6
Robustness analysis and
modeling
6.1 Introduction
Scalable image coding consists of multi-resolution decomposition of images, such as,
the discrete wavelet transform (DWT), followed by hierarchical layered representation
considering the scalability requirements. For the quality scalability driven content
adaptations, the corresponding insignificant quality layers are discarded. Such content
adaptations result in loss of watermark data embedded within the affected coefficients,
thus, diminishing the robustness of the watermarking schemes. The watermarking
literature often focuses only on the robustness to attacks, such as, image processing,
JPEG-based compression and geometric adaptations [107]. This chapter proposes a
novel approach enhancing the robustness of wavelet-based image watermarking for
scalable coding-based content adaptation attacks.
As discussed in Chapter 3, based on the embedding methodology, wavelet-based image
watermarking can be categorized into two main classes: uncompressed domain algo-
rithms [5–18] and joint compression-watermarking algorithms [19–26]. One of the main
objectives of the latter class of algorithms is to enhance the robustness to JPEG 2000-
based compression, although in most cases the effect of full capabilities of JPEG 2000
compression and associated content adaptations has not been considered in the pro-
posed solutions. However, JPEG 2000 Part 8 (ISO/IEC 15444-8, T.807) Secure JPEG
2000 (JPSEC) [20] specifies the framework, concepts, and methodology for securing
75
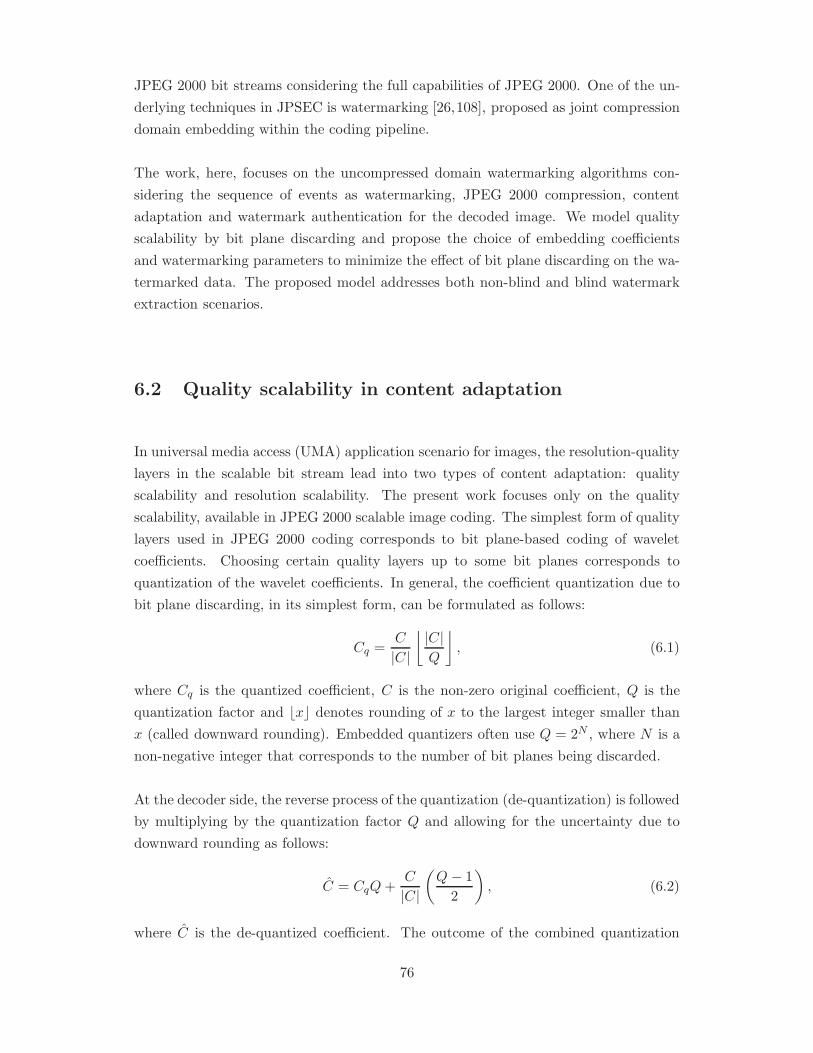
JPEG 2000 bit streams considering the full capabilities of JPEG 2000. One of the un-
derlying techniques in JPSEC is watermarking [26,108], proposed as joint compression
domain embedding within the coding pipeline.
The work, here, focuses on the uncompressed domain watermarking algorithms con-
sidering the sequence of events as watermarking, JPEG 2000 compression, content
adaptation and watermark authentication for the decoded image. We model quality
scalability by bit plane discarding and propose the choice of embedding coefficients
and watermarking parameters to minimize the effect of bit plane discarding on the wa-
termarked data. The proposed model addresses both non-blind and blind watermark
extraction scenarios.
6.2 Quality scalability in content adaptation
In universal media access (UMA) application scenario for images, the resolution-quality
layers in the scalable bit stream lead into two types of content adaptation: quality
scalability and resolution scalability. The present work focuses only on the quality
scalability, available in JPEG 2000 scalable image coding. The simplest form of quality
layers used in JPEG 2000 coding corresponds to bit plane-based coding of wavelet
coefficients. Choosing certain quality layers up to some bit planes corresponds to
quantization of the wavelet coefficients. In general, the coefficient quantization due to
bit plane discarding, in its simplest form, can be formulated as follows:
Cq =C
|C|
⌊ |C|Q
⌋, (6.1)
where Cq is the quantized coefficient, C is the non-zero original coefficient, Q is the
quantization factor and bxc denotes rounding of x to the largest integer smaller than
x (called downward rounding). Embedded quantizers often use Q = 2N , where N is a
non-negative integer that corresponds to the number of bit planes being discarded.
At the decoder side, the reverse process of the quantization (de-quantization) is followed
by multiplying by the quantization factor Q and allowing for the uncertainty due to
downward rounding as follows:
C = CqQ+C
|C|
(Q− 1
2
), (6.2)
where C is the de-quantized coefficient. The outcome of the combined quantization
76

Nk 2).1( − Nk 2.Nk 2).1( +
2
122).1()1(
−+−=−
NN
k kC2
122.
−+=N
Nk kC
C
Figure 6.1: The effect of quantization and de-quantization processes in wavelet domainconsidering discarding of N bit planes.
and de-quantization processes is
C =C
|C|
(⌊ |C|Q
⌋Q+
Q− 1
2
). (6.3)
Thereby, one can show that the original coefficient values in the range kQ ≤ C <
(k + 1)Q, where k ∈ {0,±1,±2, ...}, are quantized using N bit plane discarding, i.e.,
Q = 2N , are mapped to C = Ck, which is the center value of the region marked by kQ
and (k + 1)Q as shown in Figure 6.1. Thus, the center value, Ck, is given by
Ck = k2N +k
|k|
(2N − 1
2
). (6.4)
This relationship is further exploited in Section 6.3 and Section 6.4 in order to model
the watermark robustness to bit-plane discarding driven quality scalable decoding in
content adaptations.
6.3 Robustness model for non-blind extraction using mag-
nitude alteration
6.3.1 Preliminaries
For magnitude alteration algorithms Eq. (3.1) and Eq. (3.2) are combined considering
< 1, 0, 0, 0 > (τ = 1), ignoring the index subscripts (m,n), to get
C ′ = C + αCwb,
= C(1 + αwb), (6.5)
77
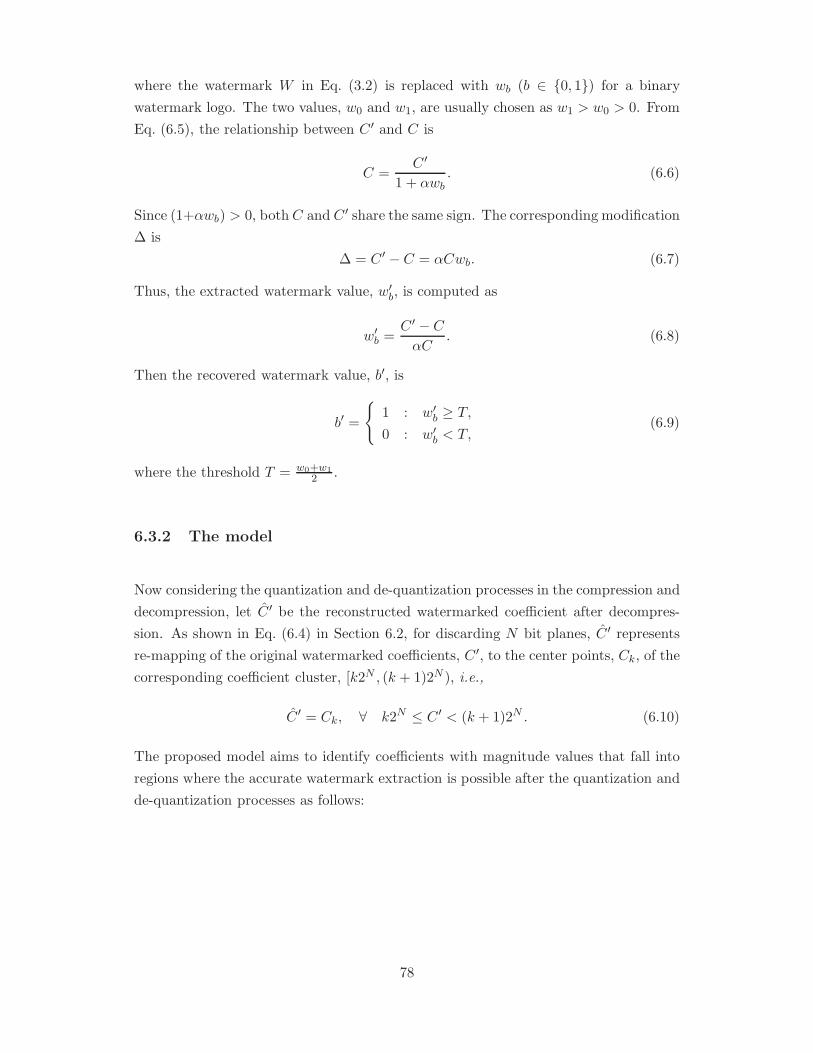
where the watermark W in Eq. (3.2) is replaced with wb (b ∈ {0, 1}) for a binary
watermark logo. The two values, w0 and w1, are usually chosen as w1 > w0 > 0. From
Eq. (6.5), the relationship between C ′ and C is
C =C ′
1 + αwb. (6.6)
Since (1+αwb) > 0, both C and C ′ share the same sign. The corresponding modification
∆ is
∆ = C ′ − C = αCwb. (6.7)
Thus, the extracted watermark value, w′b, is computed as
w′b =C ′ − C
αC. (6.8)
Then the recovered watermark value, b′, is
b′ =
{1 : w′b ≥ T,
0 : w′b < T,(6.9)
where the threshold T = w0+w12 .
6.3.2 The model
Now considering the quantization and de-quantization processes in the compression and
decompression, let C ′ be the reconstructed watermarked coefficient after decompres-
sion. As shown in Eq. (6.4) in Section 6.2, for discarding N bit planes, C ′ represents
re-mapping of the original watermarked coefficients, C ′, to the center points, Ck, of the
corresponding coefficient cluster, [k2N , (k + 1)2N ), i.e.,
C ′ = Ck, ∀ k2N ≤ C ′ < (k + 1)2N . (6.10)
The proposed model aims to identify coefficients with magnitude values that fall into
regions where the accurate watermark extraction is possible after the quantization and
de-quantization processes as follows:
78
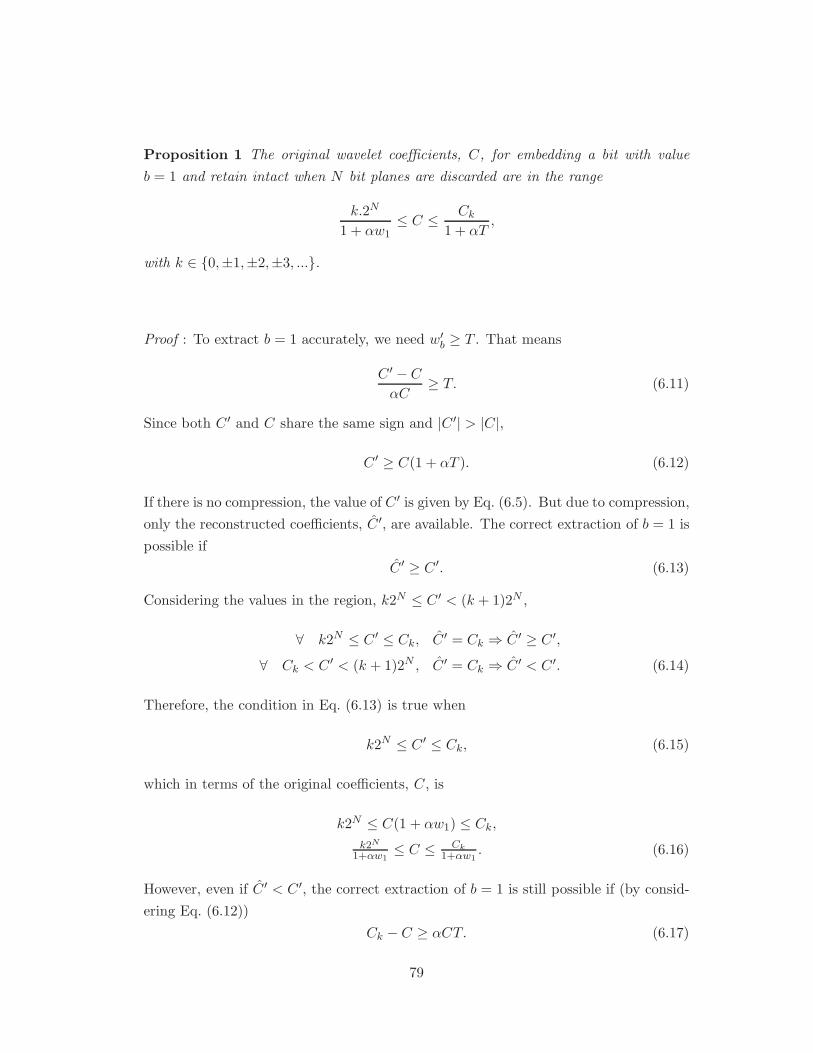
Proposition 1 The original wavelet coefficients, C, for embedding a bit with value
b = 1 and retain intact when N bit planes are discarded are in the range
k.2N
1 + αw1≤ C ≤ Ck
1 + αT,
with k ∈ {0,±1,±2,±3, ...}.
Proof : To extract b = 1 accurately, we need w′b ≥ T . That means
C ′ − C
αC≥ T. (6.11)
Since both C ′ and C share the same sign and |C ′| > |C|,
C ′ ≥ C(1 + αT ). (6.12)
If there is no compression, the value of C ′ is given by Eq. (6.5). But due to compression,
only the reconstructed coefficients, C ′, are available. The correct extraction of b = 1 is
possible if
C ′ ≥ C ′. (6.13)
Considering the values in the region, k2N ≤ C ′ < (k + 1)2N ,
∀ k2N ≤ C ′ ≤ Ck, C ′ = Ck ⇒ C ′ ≥ C ′,
∀ Ck < C ′ < (k + 1)2N , C ′ = Ck ⇒ C ′ < C ′. (6.14)
Therefore, the condition in Eq. (6.13) is true when
k2N ≤ C ′ ≤ Ck, (6.15)
which in terms of the original coefficients, C, is
k2N ≤ C(1 + αw1) ≤ Ck,
k2N
1+αw1≤ C ≤ Ck
1+αw1. (6.16)
However, even if C ′ < C ′, the correct extraction of b = 1 is still possible if (by consid-
ering Eq. (6.12))
Ck − C ≥ αCT. (6.17)
79
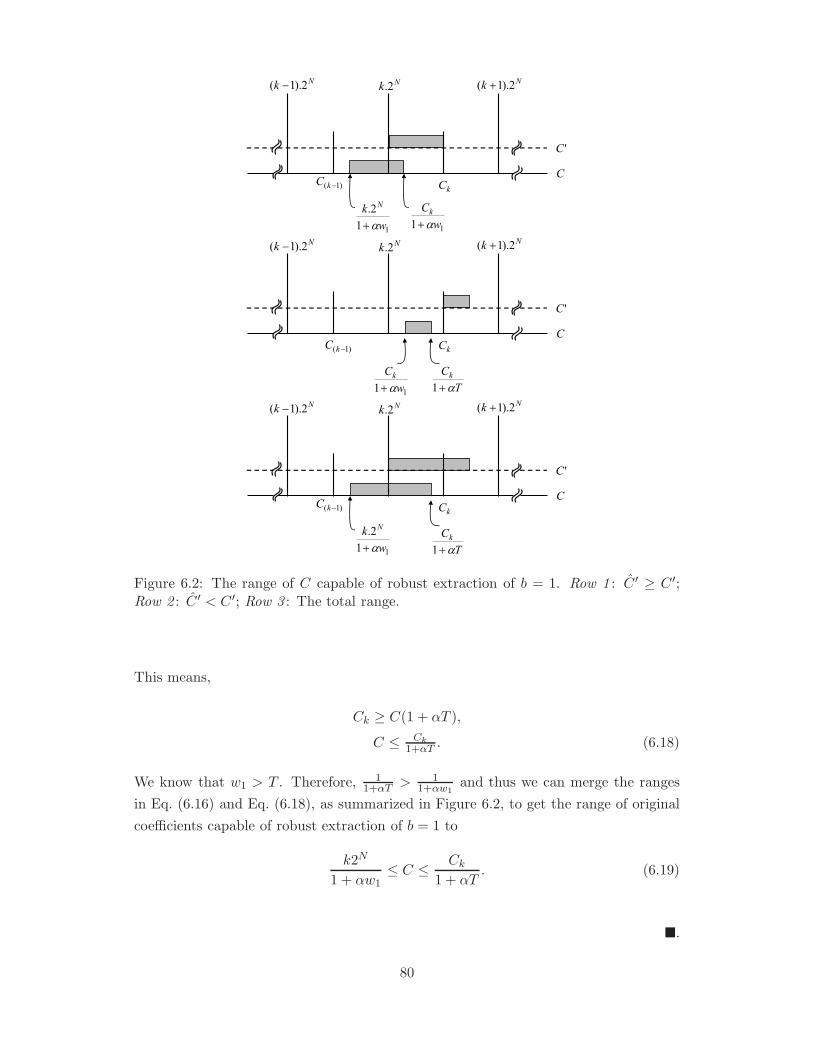
Figure 6.2: The range of C capable of robust extraction of b = 1. Row 1 : C ′ ≥ C ′;Row 2 : C ′ < C ′; Row 3 : The total range.
This means,
Ck ≥ C(1 + αT ),
C ≤ Ck
1+αT . (6.18)
We know that w1 > T . Therefore, 11+αT > 1
1+αw1and thus we can merge the ranges
in Eq. (6.16) and Eq. (6.18), as summarized in Figure 6.2, to get the range of original
coefficients capable of robust extraction of b = 1 to
k2N
1 + αw1≤ C ≤ Ck
1 + αT. (6.19)
�.
80
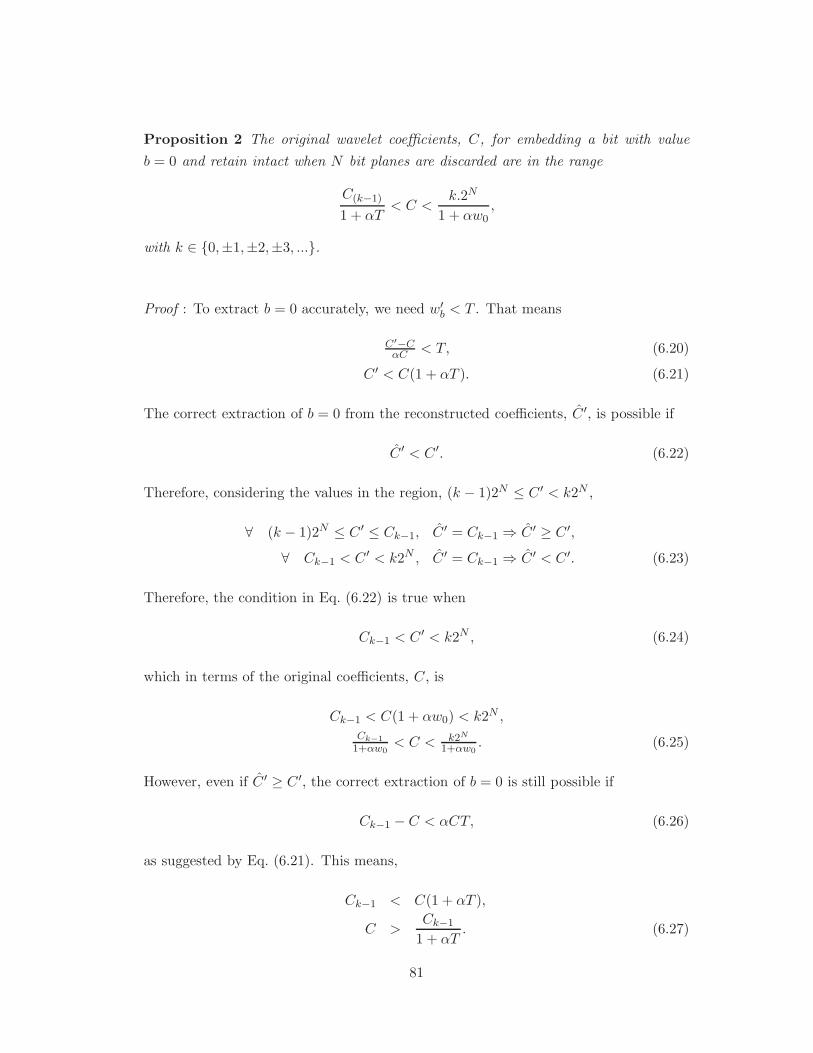
Proposition 2 The original wavelet coefficients, C, for embedding a bit with value
b = 0 and retain intact when N bit planes are discarded are in the range
C(k−1)
1 + αT< C <
k.2N
1 + αw0,
with k ∈ {0,±1,±2,±3, ...}.
Proof : To extract b = 0 accurately, we need w′b < T . That means
C′−CαC < T, (6.20)
C ′ < C(1 + αT ). (6.21)
The correct extraction of b = 0 from the reconstructed coefficients, C ′, is possible if
C ′ < C ′. (6.22)
Therefore, considering the values in the region, (k − 1)2N ≤ C ′ < k2N ,
∀ (k − 1)2N ≤ C ′ ≤ Ck−1, C ′ = Ck−1 ⇒ C ′ ≥ C ′,
∀ Ck−1 < C ′ < k2N , C ′ = Ck−1 ⇒ C ′ < C ′. (6.23)
Therefore, the condition in Eq. (6.22) is true when
Ck−1 < C ′ < k2N , (6.24)
which in terms of the original coefficients, C, is
Ck−1 < C(1 + αw0) < k2N ,
Ck−1
1+αw0< C < k2N
1+αw0. (6.25)
However, even if C ′ ≥ C ′, the correct extraction of b = 0 is still possible if
Ck−1 − C < αCT, (6.26)
as suggested by Eq. (6.21). This means,
Ck−1 < C(1 + αT ),
C >Ck−1
1 + αT. (6.27)
81
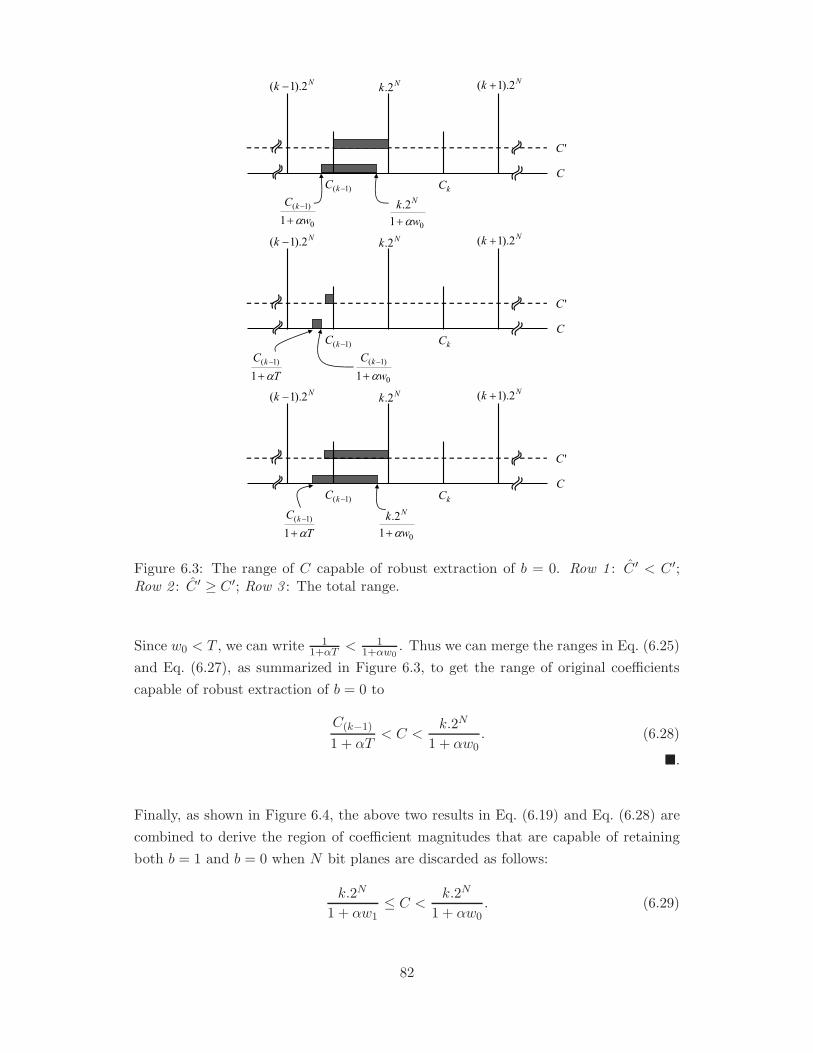
Figure 6.3: The range of C capable of robust extraction of b = 0. Row 1 : C ′ < C ′;Row 2 : C ′ ≥ C ′; Row 3 : The total range.
Since w0 < T , we can write 11+αT < 1
1+αw0. Thus we can merge the ranges in Eq. (6.25)
and Eq. (6.27), as summarized in Figure 6.3, to get the range of original coefficients
capable of robust extraction of b = 0 to
C(k−1)
1 + αT< C <
k.2N
1 + αw0. (6.28)
�.
Finally, as shown in Figure 6.4, the above two results in Eq. (6.19) and Eq. (6.28) are
combined to derive the region of coefficient magnitudes that are capable of retaining
both b = 1 and b = 0 when N bit planes are discarded as follows:
k.2N
1 + αw1≤ C <
k.2N
1 + αw0. (6.29)
82
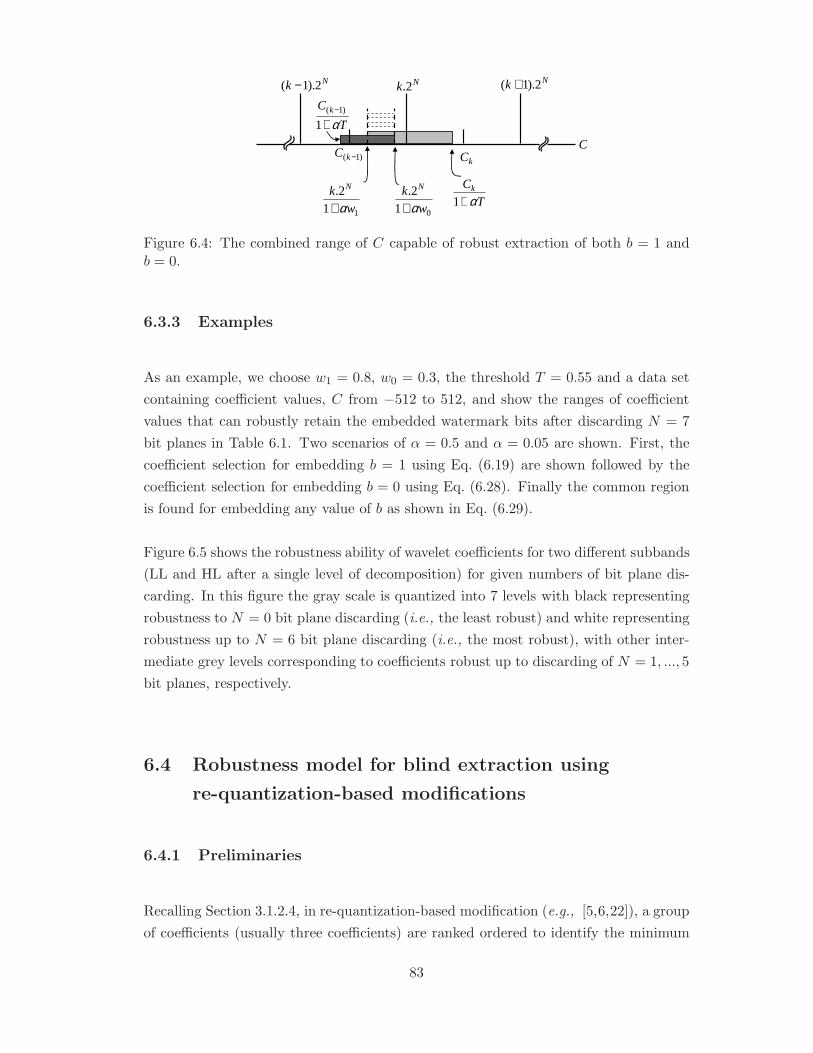
Nk 2).1( − Nk 2.Nk 2).1( +
)1( −kCkC
112.
w
k N
α+ T
Ck
α+101
2.w
k N
α+
T
C k
α+−
1)1(
C
Figure 6.4: The combined range of C capable of robust extraction of both b = 1 andb = 0.
6.3.3 Examples
As an example, we choose w1 = 0.8, w0 = 0.3, the threshold T = 0.55 and a data set
containing coefficient values, C from −512 to 512, and show the ranges of coefficient
values that can robustly retain the embedded watermark bits after discarding N = 7
bit planes in Table 6.1. Two scenarios of α = 0.5 and α = 0.05 are shown. First, the
coefficient selection for embedding b = 1 using Eq. (6.19) are shown followed by the
coefficient selection for embedding b = 0 using Eq. (6.28). Finally the common region
is found for embedding any value of b as shown in Eq. (6.29).
Figure 6.5 shows the robustness ability of wavelet coefficients for two different subbands
(LL and HL after a single level of decomposition) for given numbers of bit plane dis-
carding. In this figure the gray scale is quantized into 7 levels with black representing
robustness to N = 0 bit plane discarding (i.e., the least robust) and white representing
robustness up to N = 6 bit plane discarding (i.e., the most robust), with other inter-
mediate grey levels corresponding to coefficients robust up to discarding of N = 1, ..., 5
bit planes, respectively.
6.4 Robustness model for blind extraction using
re-quantization-based modifications
6.4.1 Preliminaries
Recalling Section 3.1.2.4, in re-quantization-based modification (e.g., [5,6,22]), a group
of coefficients (usually three coefficients) are ranked ordered to identify the minimum
83
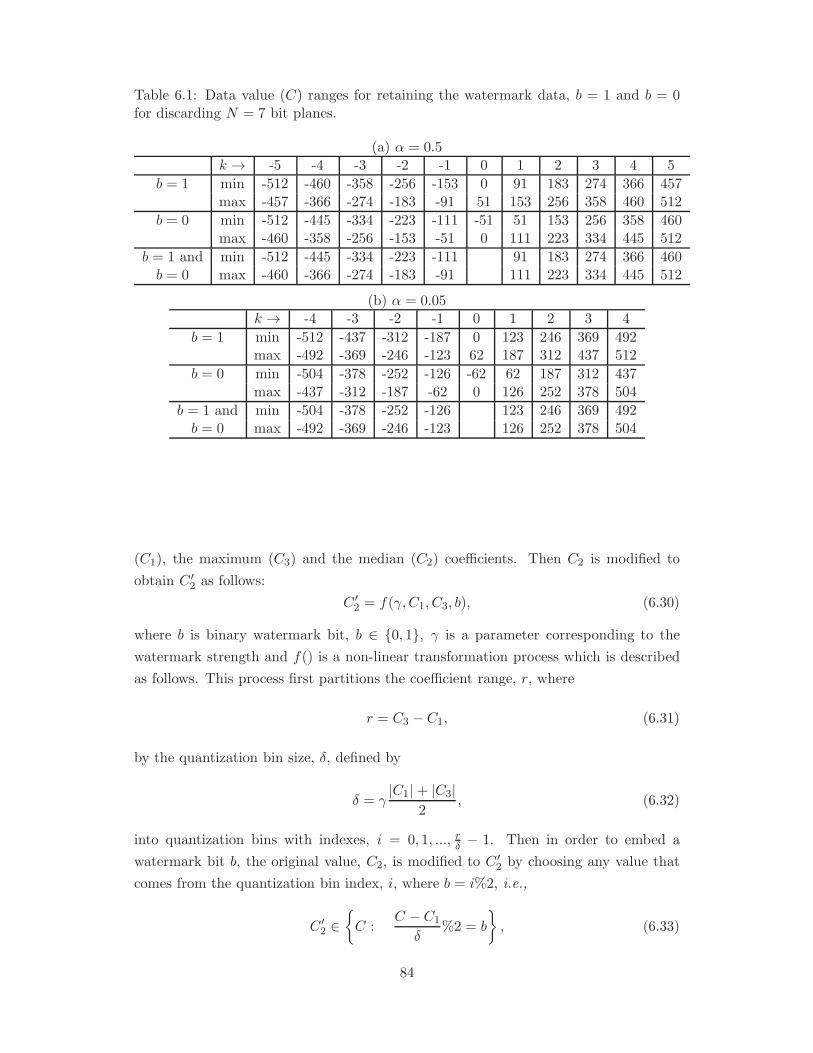
Table 6.1: Data value (C) ranges for retaining the watermark data, b = 1 and b = 0for discarding N = 7 bit planes.
(a) α = 0.5
k → -5 -4 -3 -2 -1 0 1 2 3 4 5
b = 1 min -512 -460 -358 -256 -153 0 91 183 274 366 457max -457 -366 -274 -183 -91 51 153 256 358 460 512
b = 0 min -512 -445 -334 -223 -111 -51 51 153 256 358 460max -460 -358 -256 -153 -51 0 111 223 334 445 512
b = 1 and min -512 -445 -334 -223 -111 91 183 274 366 460b = 0 max -460 -366 -274 -183 -91 111 223 334 445 512
(b) α = 0.05k → -4 -3 -2 -1 0 1 2 3 4
b = 1 min -512 -437 -312 -187 0 123 246 369 492max -492 -369 -246 -123 62 187 312 437 512
b = 0 min -504 -378 -252 -126 -62 62 187 312 437max -437 -312 -187 -62 0 126 252 378 504
b = 1 and min -504 -378 -252 -126 123 246 369 492b = 0 max -492 -369 -246 -123 126 252 378 504
(C1), the maximum (C3) and the median (C2) coefficients. Then C2 is modified to
obtain C ′2 as follows:
C ′2 = f(γ,C1, C3, b), (6.30)
where b is binary watermark bit, b ∈ {0, 1}, γ is a parameter corresponding to the
watermark strength and f() is a non-linear transformation process which is described
as follows. This process first partitions the coefficient range, r, where
r = C3 − C1, (6.31)
by the quantization bin size, δ, defined by
δ = γ|C1|+ |C3|
2, (6.32)
into quantization bins with indexes, i = 0, 1, ..., rδ − 1. Then in order to embed a
watermark bit b, the original value, C2, is modified to C ′2 by choosing any value that
comes from the quantization bin index, i, where b = i%2, i.e.,
C ′2 ∈{C :
C − C1
δ%2 = b
}, (6.33)
84
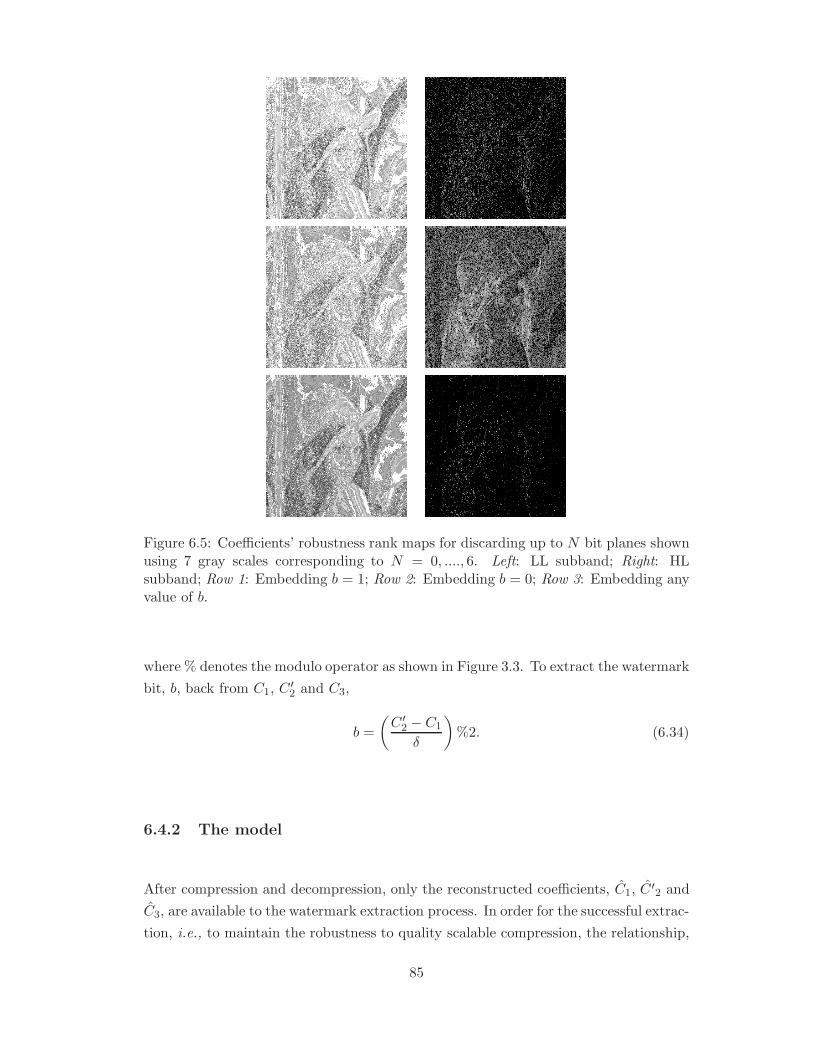
Figure 6.5: Coefficients’ robustness rank maps for discarding up to N bit planes shownusing 7 gray scales corresponding to N = 0, ...., 6. Left: LL subband; Right: HLsubband; Row 1: Embedding b = 1; Row 2: Embedding b = 0; Row 3: Embedding anyvalue of b.
where % denotes the modulo operator as shown in Figure 3.3. To extract the watermark
bit, b, back from C1, C′2 and C3,
b =
(C ′2 − C1
δ
)%2. (6.34)
6.4.2 The model
After compression and decompression, only the reconstructed coefficients, C1, C ′2 and
C3, are available to the watermark extraction process. In order for the successful extrac-
tion, i.e., to maintain the robustness to quality scalable compression, the relationship,
85
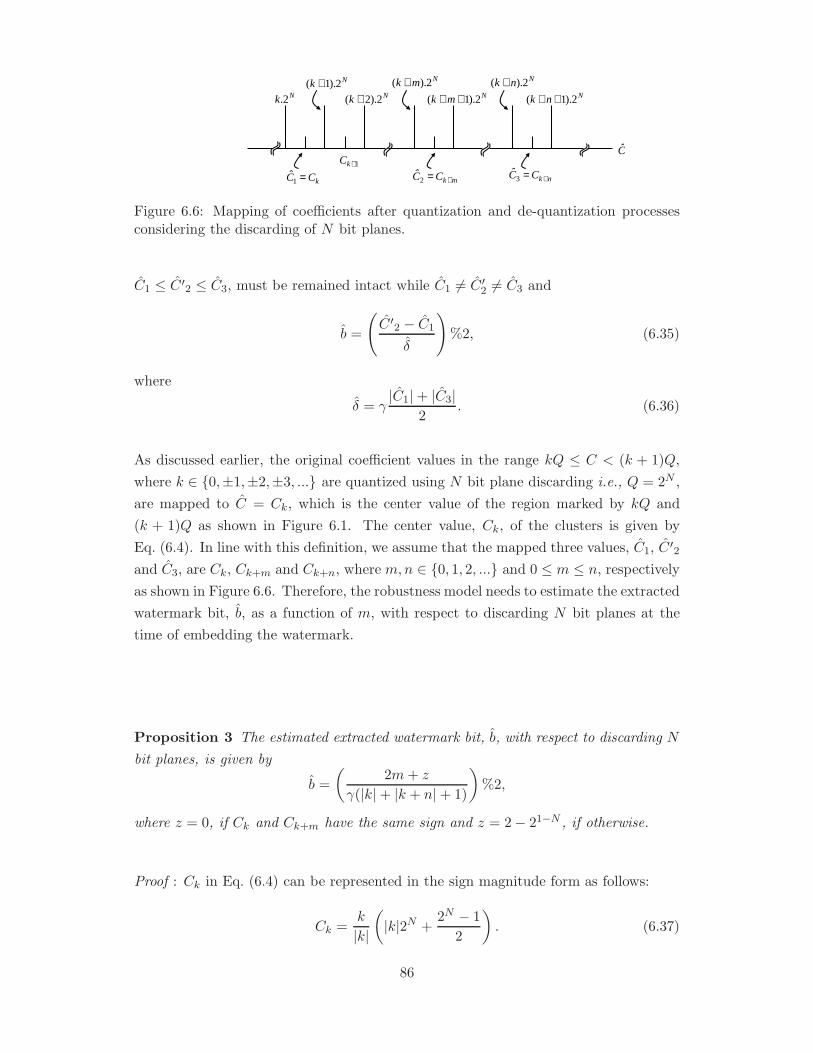
Nk 2.
Nk 2).1( +Nk 2).2( +
1+kC
Nmk 2).( +Nmk 2).1( ++
mkCC +=2ˆ
Nnk 2).( +Nnk 2).1( ++
nkCC +=3ˆ
C
kCC =1ˆ
Figure 6.6: Mapping of coefficients after quantization and de-quantization processesconsidering the discarding of N bit planes.
C1 ≤ C ′2 ≤ C3, must be remained intact while C1 6= C ′2 6= C3 and
b =
(C ′2 − C1
δ
)%2, (6.35)
where
δ = γ|C1|+ |C3|
2. (6.36)
As discussed earlier, the original coefficient values in the range kQ ≤ C < (k + 1)Q,
where k ∈ {0,±1,±2,±3, ...} are quantized using N bit plane discarding i.e., Q = 2N ,
are mapped to C = Ck, which is the center value of the region marked by kQ and
(k + 1)Q as shown in Figure 6.1. The center value, Ck, of the clusters is given by
Eq. (6.4). In line with this definition, we assume that the mapped three values, C1, C ′2
and C3, are Ck, Ck+m and Ck+n, where m,n ∈ {0, 1, 2, ...} and 0 ≤ m ≤ n, respectively
as shown in Figure 6.6. Therefore, the robustness model needs to estimate the extracted
watermark bit, b, as a function of m, with respect to discarding N bit planes at the
time of embedding the watermark.
Proposition 3 The estimated extracted watermark bit, b, with respect to discarding N
bit planes, is given by
b =
(2m+ z
γ(|k|+ |k + n|+ 1)
)%2,
where z = 0, if Ck and Ck+m have the same sign and z = 2− 21−N , if otherwise.
Proof : Ck in Eq. (6.4) can be represented in the sign magnitude form as follows:
Ck =k
|k|
(|k|2N +
2N − 1
2
). (6.37)
86

With reference to Eq. (6.36), the reconstructed watermark quantization step value, δ,
after discarding N bit planes can now be defined as:
δ = γ|C1|+ |C3|
2,
= γ|Ck|+ |Ck+n|
2,
=γ
2
(|k|2N +
2N − 1
2+ |k + n|2N +
2N − 1
2
),
= γ2N−1(|k|+ |k + n|+ 1)− γ
2, (6.38)
The usual values of γ are in the range, 0.05 ≤ γ ≤ 0.1. Therefore, γ2 << γ2N−1(|k| +
|k + n|+ 1). thus, Eq. (6.38) can be re-written as
δ = γ2N−1(|k|+ |k + n|+ 1). (6.39)
Using Eq. (6.37) and Eq. (6.39) in Eq. (6.35), the estimated extracted watermark bit,
b, with respect to discarding N bit planes, can be formulated as,
b =
(C2 − C1
δ
)%2,
=
(Ck+m − Ck
δ
)%2,
=
(k+m)2N+ (k+m)
|k+m|(2N−1)
2 −k2N− k|k|
(2N−1)2
γ2N−1(|k|+ |k + n|+ 1)
%2,
=
m2N +
((k+m)|k+m| − k
|k|
)(2N−1
2
)
γ2N−1(|k|+ |k + n|+ 1)
%2,
=
2m+
((k+m)|k+m| −
k|k|
) (1− 2−N
)
γ(|k| + |k + n|+ 1)
%2. (6.40)
Now considering the two cases: k and k +m have the same sign (Case 1) and k and
k +m have different signs (Case 2),
b =
(2m
γ(|k|+|k+n|+1)
)%2 : Case 1,(
2m+2−21−N
γ(|k|+|k+n|+1)
)%2 : Case 2.
(6.41)
�.
Thus, using Eq. (6.41), it is possible to predict b for a given number of discarded bit
87
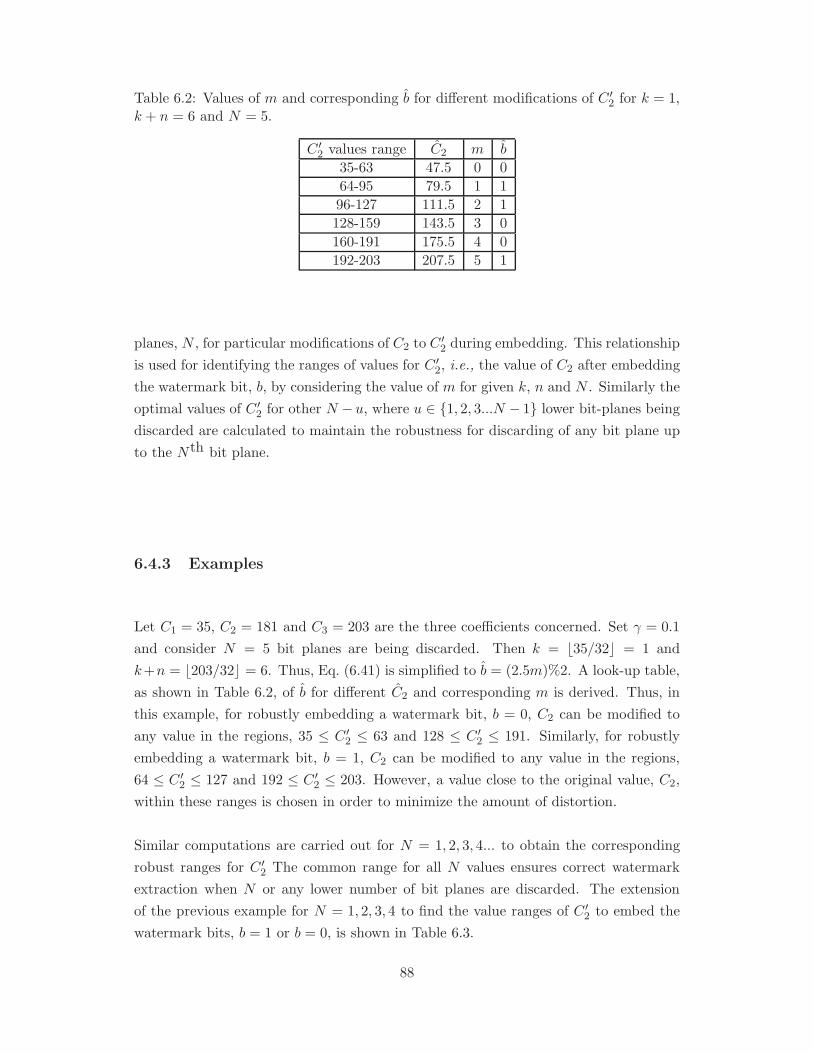
Table 6.2: Values of m and corresponding b for different modifications of C ′2 for k = 1,k + n = 6 and N = 5.
C ′2 values range C2 m b
35-63 47.5 0 0
64-95 79.5 1 1
96-127 111.5 2 1
128-159 143.5 3 0
160-191 175.5 4 0
192-203 207.5 5 1
planes, N , for particular modifications of C2 to C′2 during embedding. This relationship
is used for identifying the ranges of values for C ′2, i.e., the value of C2 after embedding
the watermark bit, b, by considering the value of m for given k, n and N . Similarly the
optimal values of C ′2 for other N −u, where u ∈ {1, 2, 3...N − 1} lower bit-planes being
discarded are calculated to maintain the robustness for discarding of any bit plane up
to the Nth bit plane.
6.4.3 Examples
Let C1 = 35, C2 = 181 and C3 = 203 are the three coefficients concerned. Set γ = 0.1
and consider N = 5 bit planes are being discarded. Then k = b35/32c = 1 and
k+n = b203/32c = 6. Thus, Eq. (6.41) is simplified to b = (2.5m)%2. A look-up table,
as shown in Table 6.2, of b for different C2 and corresponding m is derived. Thus, in
this example, for robustly embedding a watermark bit, b = 0, C2 can be modified to
any value in the regions, 35 ≤ C ′2 ≤ 63 and 128 ≤ C ′2 ≤ 191. Similarly, for robustly
embedding a watermark bit, b = 1, C2 can be modified to any value in the regions,
64 ≤ C ′2 ≤ 127 and 192 ≤ C ′2 ≤ 203. However, a value close to the original value, C2,
within these ranges is chosen in order to minimize the amount of distortion.
Similar computations are carried out for N = 1, 2, 3, 4... to obtain the corresponding
robust ranges for C ′2 The common range for all N values ensures correct watermark
extraction when N or any lower number of bit planes are discarded. The extension
of the previous example for N = 1, 2, 3, 4 to find the value ranges of C ′2 to embed the
watermark bits, b = 1 or b = 0, is shown in Table 6.3.
88
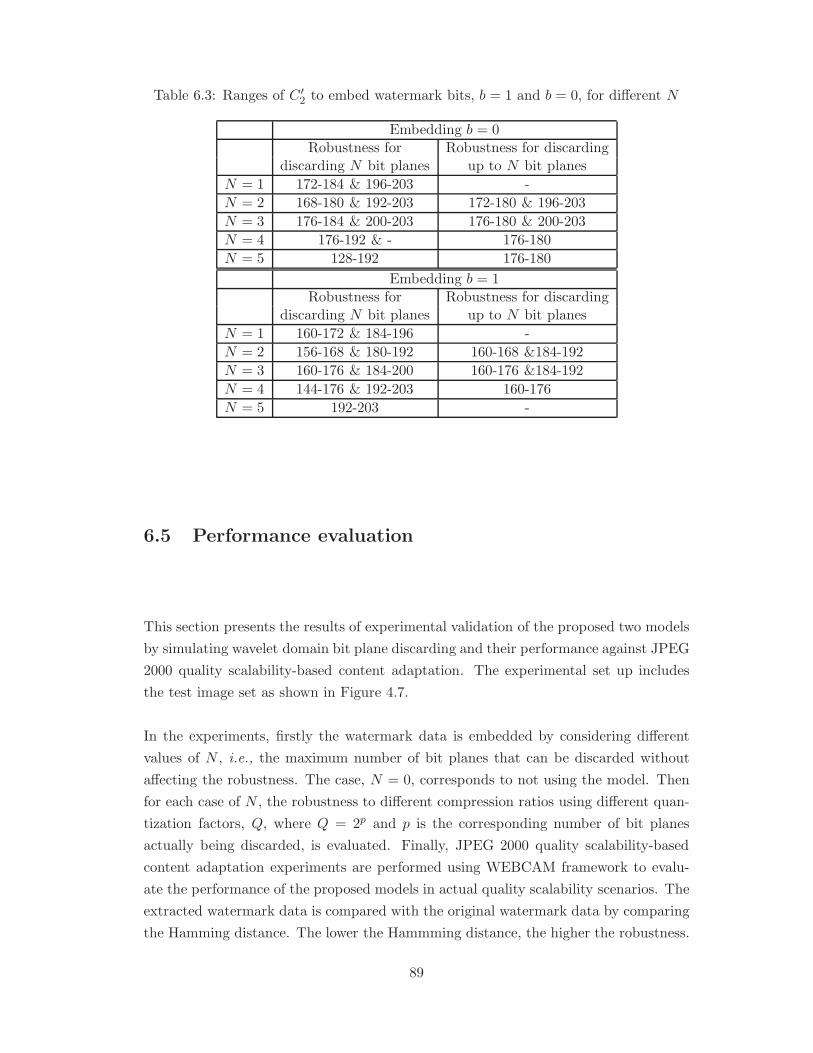
Table 6.3: Ranges of C ′2 to embed watermark bits, b = 1 and b = 0, for different N
Embedding b = 0Robustness for Robustness for discarding
discarding N bit planes up to N bit planes
N = 1 172-184 & 196-203 -
N = 2 168-180 & 192-203 172-180 & 196-203
N = 3 176-184 & 200-203 176-180 & 200-203
N = 4 176-192 & - 176-180
N = 5 128-192 176-180
Embedding b = 1Robustness for Robustness for discarding
discarding N bit planes up to N bit planes
N = 1 160-172 & 184-196 -
N = 2 156-168 & 180-192 160-168 &184-192
N = 3 160-176 & 184-200 160-176 &184-192
N = 4 144-176 & 192-203 160-176
N = 5 192-203 -
6.5 Performance evaluation
This section presents the results of experimental validation of the proposed two models
by simulating wavelet domain bit plane discarding and their performance against JPEG
2000 quality scalability-based content adaptation. The experimental set up includes
the test image set as shown in Figure 4.7.
In the experiments, firstly the watermark data is embedded by considering different
values of N , i.e., the maximum number of bit planes that can be discarded without
affecting the robustness. The case, N = 0, corresponds to not using the model. Then
for each case of N , the robustness to different compression ratios using different quan-
tization factors, Q, where Q = 2p and p is the corresponding number of bit planes
actually being discarded, is evaluated. Finally, JPEG 2000 quality scalability-based
content adaptation experiments are performed using WEBCAM framework to evalu-
ate the performance of the proposed models in actual quality scalability scenarios. The
extracted watermark data is compared with the original watermark data by comparing
the Hamming distance. The lower the Hammming distance, the higher the robustness.
89
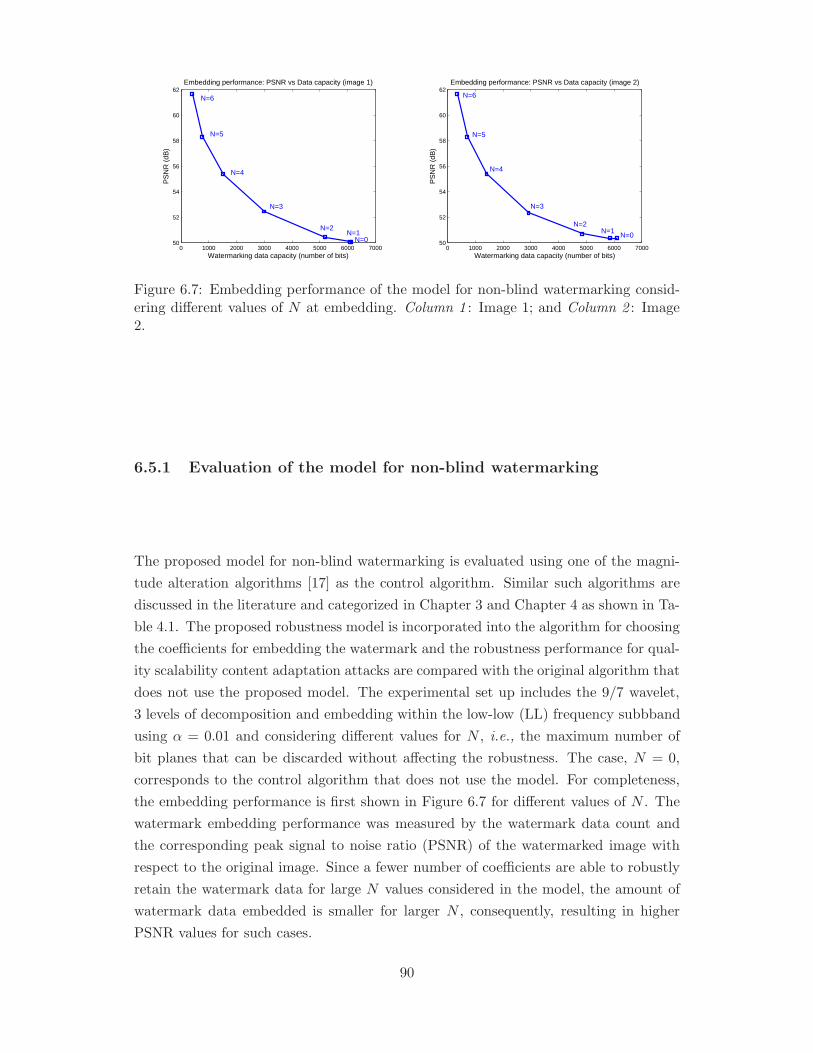
0 1000 2000 3000 4000 5000 6000 700050
52
54
56
58
60
62
Watermarking data capacity (number of bits)
PS
NR
(dB
)
Embedding performance: PSNR vs Data capacity (image 1)
N=0N=1
N=2
N=3
N=4
N=5
N=6
0 1000 2000 3000 4000 5000 6000 700050
52
54
56
58
60
62
Watermarking data capacity (number of bits)
PS
NR
(dB
)
Embedding performance: PSNR vs Data capacity (image 2)
N=0N=1
N=2
N=3
N=4
N=5
N=6
Figure 6.7: Embedding performance of the model for non-blind watermarking consid-ering different values of N at embedding. Column 1 : Image 1; and Column 2 : Image2.
6.5.1 Evaluation of the model for non-blind watermarking
The proposed model for non-blind watermarking is evaluated using one of the magni-
tude alteration algorithms [17] as the control algorithm. Similar such algorithms are
discussed in the literature and categorized in Chapter 3 and Chapter 4 as shown in Ta-
ble 4.1. The proposed robustness model is incorporated into the algorithm for choosing
the coefficients for embedding the watermark and the robustness performance for qual-
ity scalability content adaptation attacks are compared with the original algorithm that
does not use the proposed model. The experimental set up includes the 9/7 wavelet,
3 levels of decomposition and embedding within the low-low (LL) frequency subbband
using α = 0.01 and considering different values for N , i.e., the maximum number of
bit planes that can be discarded without affecting the robustness. The case, N = 0,
corresponds to the control algorithm that does not use the model. For completeness,
the embedding performance is first shown in Figure 6.7 for different values of N . The
watermark embedding performance was measured by the watermark data count and
the corresponding peak signal to noise ratio (PSNR) of the watermarked image with
respect to the original image. Since a fewer number of coefficients are able to robustly
retain the watermark data for large N values considered in the model, the amount of
watermark data embedded is smaller for larger N , consequently, resulting in higher
PSNR values for such cases.
90
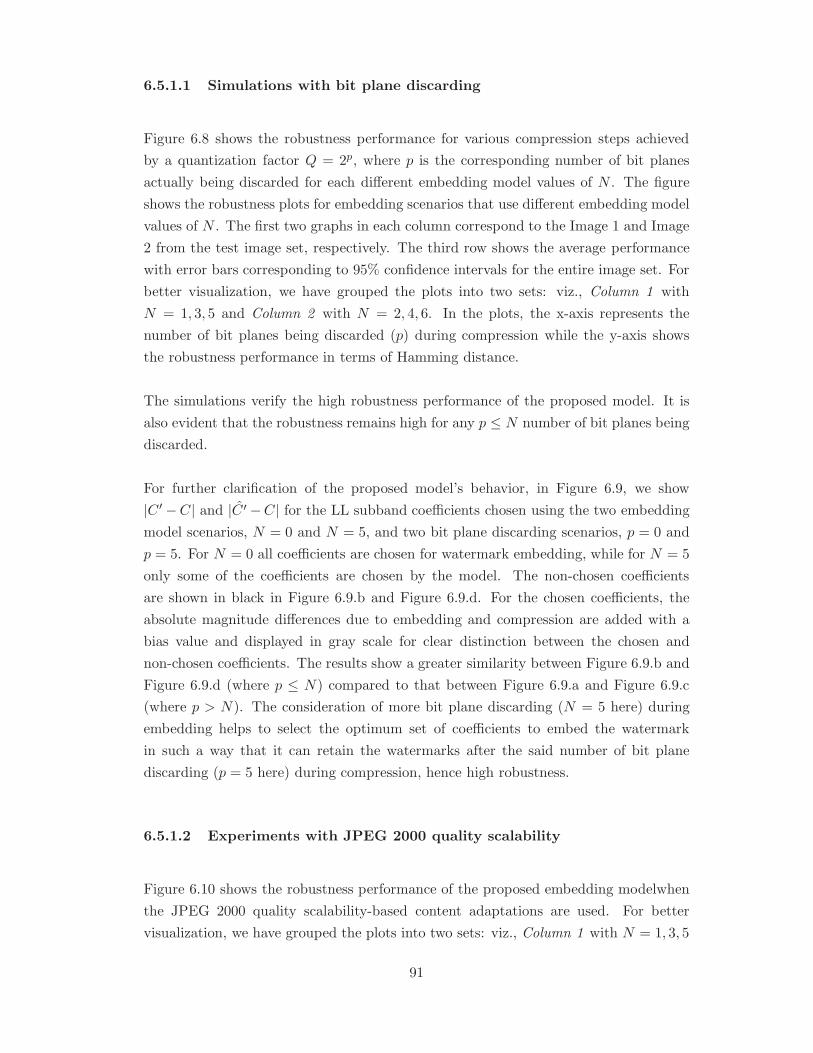
6.5.1.1 Simulations with bit plane discarding
Figure 6.8 shows the robustness performance for various compression steps achieved
by a quantization factor Q = 2p, where p is the corresponding number of bit planes
actually being discarded for each different embedding model values of N . The figure
shows the robustness plots for embedding scenarios that use different embedding model
values of N . The first two graphs in each column correspond to the Image 1 and Image
2 from the test image set, respectively. The third row shows the average performance
with error bars corresponding to 95% confidence intervals for the entire image set. For
better visualization, we have grouped the plots into two sets: viz., Column 1 with
N = 1, 3, 5 and Column 2 with N = 2, 4, 6. In the plots, the x-axis represents the
number of bit planes being discarded (p) during compression while the y-axis shows
the robustness performance in terms of Hamming distance.
The simulations verify the high robustness performance of the proposed model. It is
also evident that the robustness remains high for any p ≤ N number of bit planes being
discarded.
For further clarification of the proposed model’s behavior, in Figure 6.9, we show
|C ′ −C| and |C ′ −C| for the LL subband coefficients chosen using the two embedding
model scenarios, N = 0 and N = 5, and two bit plane discarding scenarios, p = 0 and
p = 5. For N = 0 all coefficients are chosen for watermark embedding, while for N = 5
only some of the coefficients are chosen by the model. The non-chosen coefficients
are shown in black in Figure 6.9.b and Figure 6.9.d. For the chosen coefficients, the
absolute magnitude differences due to embedding and compression are added with a
bias value and displayed in gray scale for clear distinction between the chosen and
non-chosen coefficients. The results show a greater similarity between Figure 6.9.b and
Figure 6.9.d (where p ≤ N) compared to that between Figure 6.9.a and Figure 6.9.c
(where p > N). The consideration of more bit plane discarding (N = 5 here) during
embedding helps to select the optimum set of coefficients to embed the watermark
in such a way that it can retain the watermarks after the said number of bit plane
discarding (p = 5 here) during compression, hence high robustness.
6.5.1.2 Experiments with JPEG 2000 quality scalability
Figure 6.10 shows the robustness performance of the proposed embedding modelwhen
the JPEG 2000 quality scalability-based content adaptations are used. For better
visualization, we have grouped the plots into two sets: viz., Column 1 with N = 1, 3, 5
91
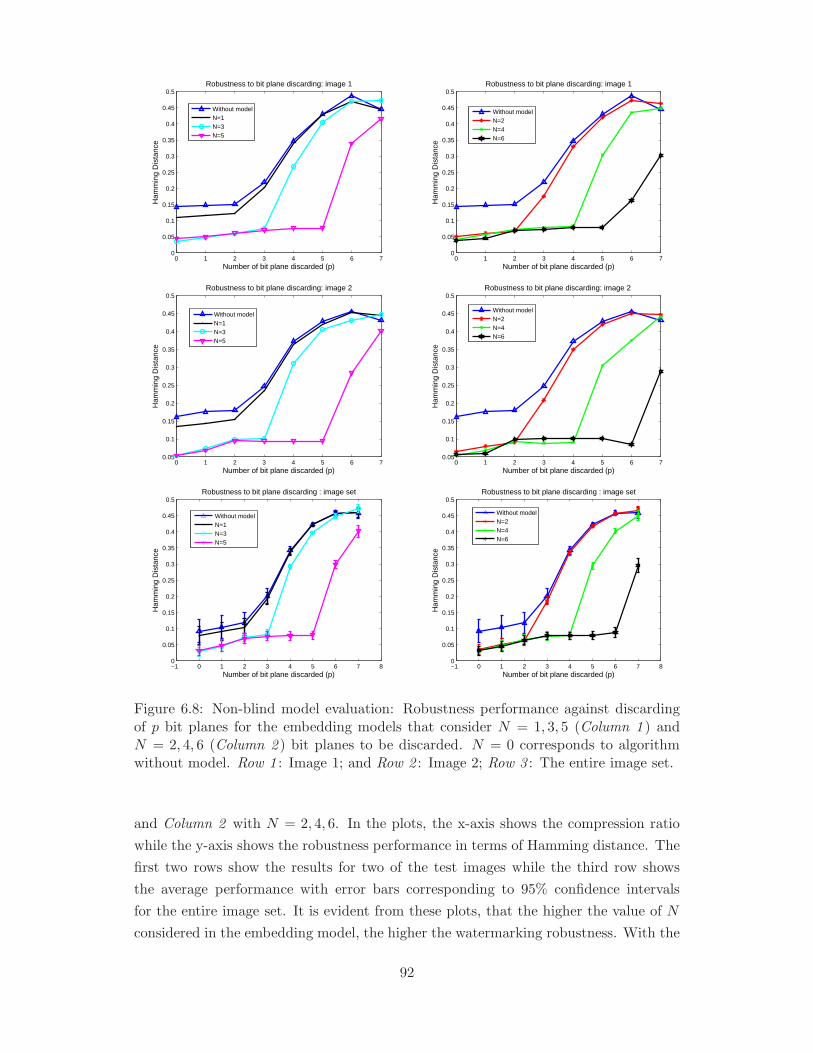
0 1 2 3 4 5 6 70
0.05
0.1
0.15
0.2
0.25
0.3
0.35
0.4
0.45
0.5Robustness to bit plane discarding: image 1
Number of bit plane discarded (p)
Ham
min
g D
ista
nce
Without modelN=1N=3N=5
0 1 2 3 4 5 6 70
0.05
0.1
0.15
0.2
0.25
0.3
0.35
0.4
0.45
0.5Robustness to bit plane discarding: image 1
Number of bit plane discarded (p)
Ham
min
g D
ista
nce
Without modelN=2N=4N=6
0 1 2 3 4 5 6 70.05
0.1
0.15
0.2
0.25
0.3
0.35
0.4
0.45
0.5Robustness to bit plane discarding: image 2
Number of bit plane discarded (p)
Ham
min
g D
ista
nce
Without modelN=1N=3N=5
0 1 2 3 4 5 6 70.05
0.1
0.15
0.2
0.25
0.3
0.35
0.4
0.45
0.5Robustness to bit plane discarding: image 2
Number of bit plane discarded (p)
Ham
min
g D
ista
nce
Without modelN=2N=4N=6
−1 0 1 2 3 4 5 6 7 80
0.05
0.1
0.15
0.2
0.25
0.3
0.35
0.4
0.45
0.5Robustness to bit plane discarding : image set
Number of bit plane discarded (p)
Ham
min
g D
ista
nce
Without modelN=1N=3N=5
−1 0 1 2 3 4 5 6 7 80
0.05
0.1
0.15
0.2
0.25
0.3
0.35
0.4
0.45
0.5Robustness to bit plane discarding : image set
Number of bit plane discarded (p)
Ham
min
g D
ista
nce
Without modelN=2N=4N=6
Figure 6.8: Non-blind model evaluation: Robustness performance against discardingof p bit planes for the embedding models that consider N = 1, 3, 5 (Column 1 ) andN = 2, 4, 6 (Column 2 ) bit planes to be discarded. N = 0 corresponds to algorithmwithout model. Row 1 : Image 1; and Row 2 : Image 2; Row 3 : The entire image set.
and Column 2 with N = 2, 4, 6. In the plots, the x-axis shows the compression ratio
while the y-axis shows the robustness performance in terms of Hamming distance. The
first two rows show the results for two of the test images while the third row shows
the average performance with error bars corresponding to 95% confidence intervals
for the entire image set. It is evident from these plots, that the higher the value of N
considered in the embedding model, the higher the watermarking robustness. With the
92
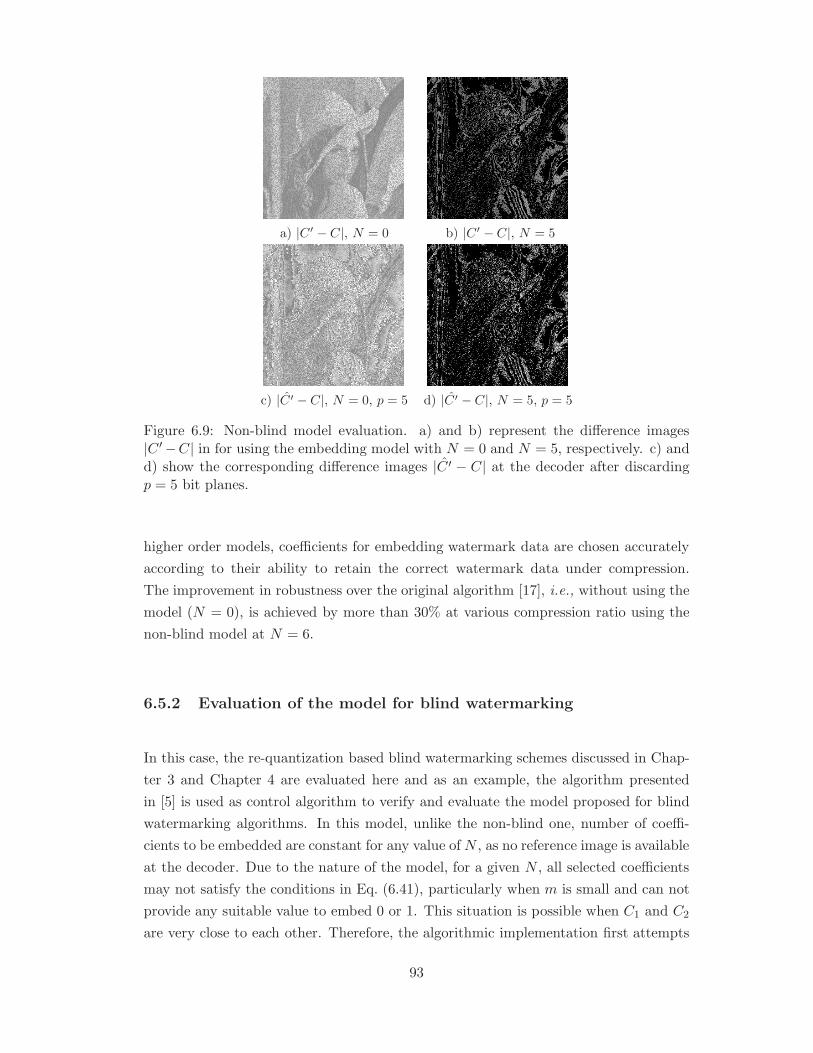
a) |C′ − C|, N = 0 b) |C′ − C|, N = 5
c) |C′ − C|, N = 0, p = 5 d) |C′ − C|, N = 5, p = 5
Figure 6.9: Non-blind model evaluation. a) and b) represent the difference images|C ′−C| in for using the embedding model with N = 0 and N = 5, respectively. c) andd) show the corresponding difference images |C ′ − C| at the decoder after discardingp = 5 bit planes.
higher order models, coefficients for embedding watermark data are chosen accurately
according to their ability to retain the correct watermark data under compression.
The improvement in robustness over the original algorithm [17], i.e., without using the
model (N = 0), is achieved by more than 30% at various compression ratio using the
non-blind model at N = 6.
6.5.2 Evaluation of the model for blind watermarking
In this case, the re-quantization based blind watermarking schemes discussed in Chap-
ter 3 and Chapter 4 are evaluated here and as an example, the algorithm presented
in [5] is used as control algorithm to verify and evaluate the model proposed for blind
watermarking algorithms. In this model, unlike the non-blind one, number of coeffi-
cients to be embedded are constant for any value of N , as no reference image is available
at the decoder. Due to the nature of the model, for a given N , all selected coefficients
may not satisfy the conditions in Eq. (6.41), particularly when m is small and can not
provide any suitable value to embed 0 or 1. This situation is possible when C1 and C2
are very close to each other. Therefore, the algorithmic implementation first attempts
93
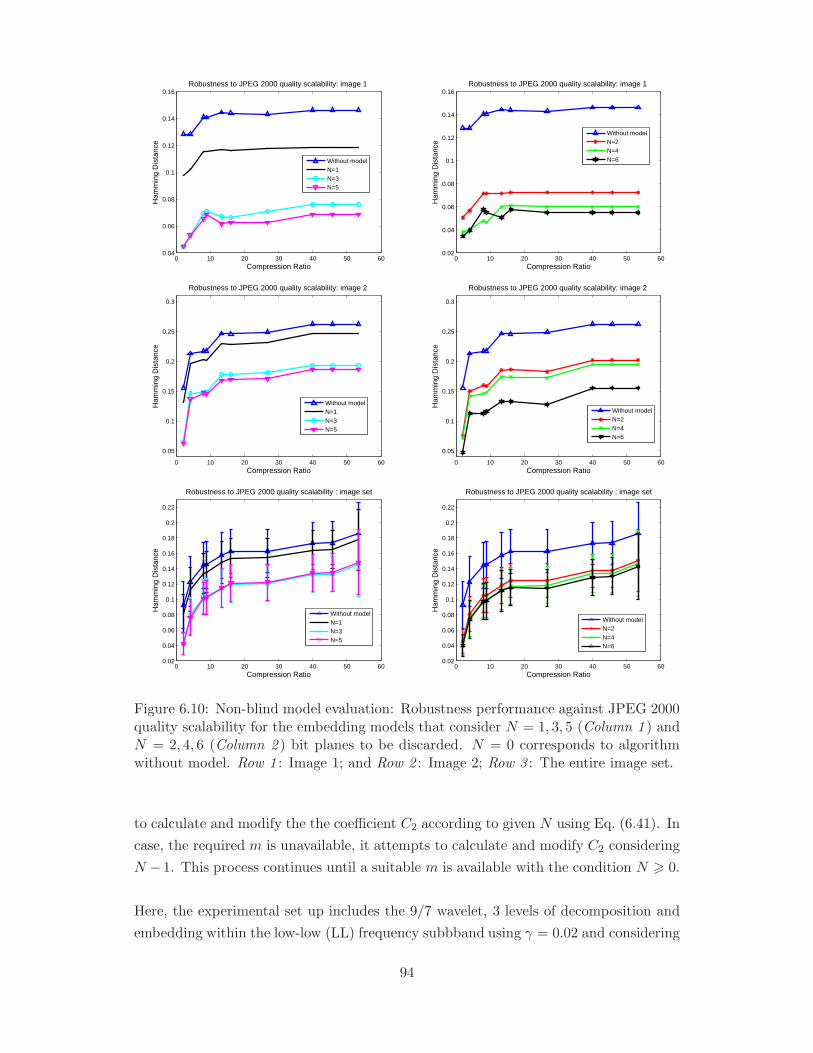
0 10 20 30 40 50 600.04
0.06
0.08
0.1
0.12
0.14
0.16Robustness to JPEG 2000 quality scalability: image 1
Compression Ratio
Ham
min
g D
ista
nce
Without modelN=1N=3N=5
0 10 20 30 40 50 600.02
0.04
0.06
0.08
0.1
0.12
0.14
0.16Robustness to JPEG 2000 quality scalability: image 1
Compression Ratio
Ham
min
g D
ista
nce
Without modelN=2N=4N=6
0 10 20 30 40 50 60
0.05
0.1
0.15
0.2
0.25
0.3
Robustness to JPEG 2000 quality scalability: image 2
Compression Ratio
Ham
min
g D
ista
nce
Without modelN=1N=3N=5
0 10 20 30 40 50 60
0.05
0.1
0.15
0.2
0.25
0.3
Robustness to JPEG 2000 quality scalability: image 2
Compression Ratio
Ham
min
g D
ista
nce
Without modelN=2N=4N=6
0 10 20 30 40 50 600.02
0.04
0.06
0.08
0.1
0.12
0.14
0.16
0.18
0.2
0.22
Robustness to JPEG 2000 quality scalability : image set
Compression Ratio
Ham
min
g D
ista
nce
Without modelN=1N=3N=5
0 10 20 30 40 50 600.02
0.04
0.06
0.08
0.1
0.12
0.14
0.16
0.18
0.2
0.22
Robustness to JPEG 2000 quality scalability : image set
Compression Ratio
Ham
min
g D
ista
nce
Without modelN=2N=4N=6
Figure 6.10: Non-blind model evaluation: Robustness performance against JPEG 2000quality scalability for the embedding models that consider N = 1, 3, 5 (Column 1 ) andN = 2, 4, 6 (Column 2 ) bit planes to be discarded. N = 0 corresponds to algorithmwithout model. Row 1 : Image 1; and Row 2 : Image 2; Row 3 : The entire image set.
to calculate and modify the the coefficient C2 according to given N using Eq. (6.41). In
case, the required m is unavailable, it attempts to calculate and modify C2 considering
N − 1. This process continues until a suitable m is available with the condition N > 0.
Here, the experimental set up includes the 9/7 wavelet, 3 levels of decomposition and
embedding within the low-low (LL) frequency subbband using γ = 0.02 and considering
94

0 1 2 3 4 5 6 34
36
38
40
42
44
46
48
50 Embedding performance of blind model: Image 3 and Image 4
N
PS
NR
(dB
)
Image 3 (Watermark Count = 2112)
Image 4 (Watermark Count = 2048)
Figure 6.11: Embedding performance of the model for blind watermarking consideringdifferent values of N at embedding for image 3 and image 4.
different values for N , i.e., the maximum number of bit planes that can be discarded
without affecting the robustness. The case, N = 0, corresponds to the control algo-
rithm that does not use the model. In this case also for completeness, the embedding
performance is first shown in Figure 6.11 for different values of N . In this type of
blind watermarking, the modification value often increases with the higher N values
whilst keeping the same watermark bit count. As a result more embedding distortion
is introduced as shown in Figure 6.11. Hence the optimal N can be decided depending
on tolerable PSNR value for a given application.
6.5.2.1 Simulations with bit plane discarding
Figure 6.12 shows the robustness performance for various compression steps achieved
by a quantization factor Q = 2p, where p is the corresponding number of bit planes
actually being discarded for each different embedding model values of N . The first two
graphs correspond to the Image 3 and Image 4 from the test image set, respectively.
The third graph shows the average performance with error bars corresponding to 95%
confidence intervals for the entire image set. The simulations verify the enhanced
robustness performance of the proposed model. It is also evident that the robustness
remains high for any p ≤ N number of bit planes being discarded.
95
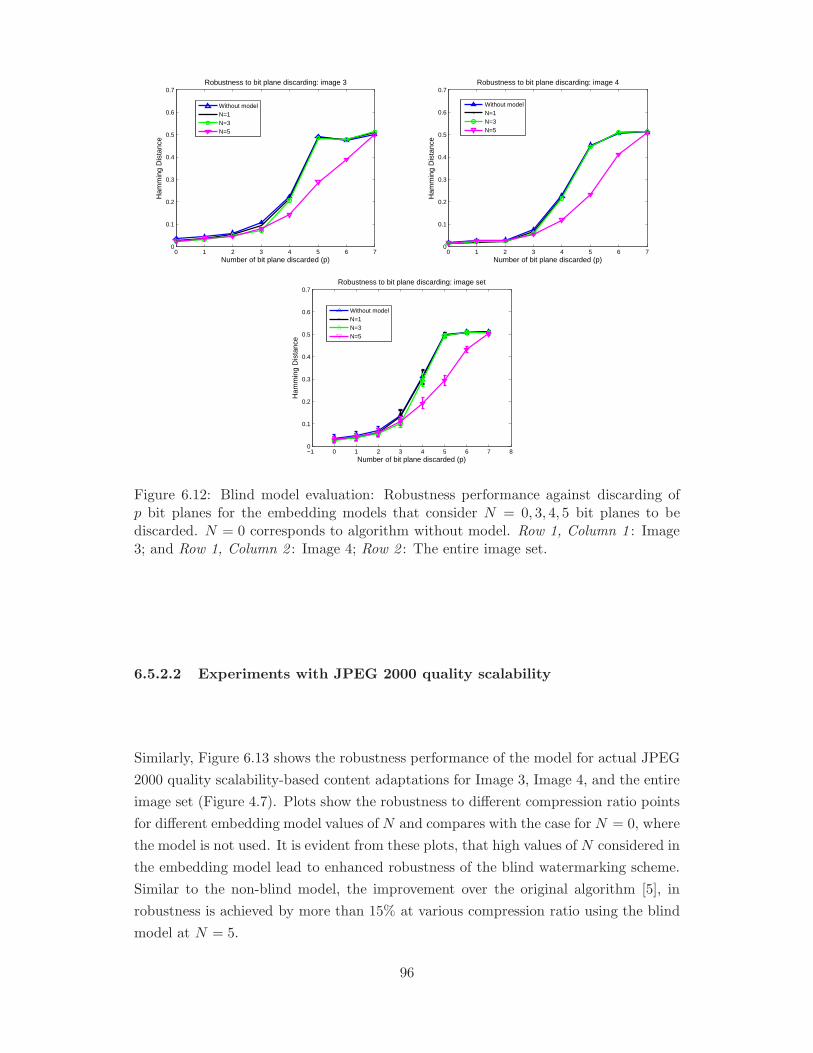
0 1 2 3 4 5 6 70
0.1
0.2
0.3
0.4
0.5
0.6
0.7Robustness to bit plane discarding: image 3
Number of bit plane discarded (p)
Ham
min
g D
ista
nce
Without modelN=1N=3N=5
0 1 2 3 4 5 6 70
0.1
0.2
0.3
0.4
0.5
0.6
0.7Robustness to bit plane discarding: image 4
Number of bit plane discarded (p)
Ham
min
g D
ista
nce
Without modelN=1N=3N=5
−1 0 1 2 3 4 5 6 7 80
0.1
0.2
0.3
0.4
0.5
0.6
0.7Robustness to bit plane discarding: image set
Number of bit plane discarded (p)
Ham
min
g D
ista
nce
Without modelN=1N=3N=5
Figure 6.12: Blind model evaluation: Robustness performance against discarding ofp bit planes for the embedding models that consider N = 0, 3, 4, 5 bit planes to bediscarded. N = 0 corresponds to algorithm without model. Row 1, Column 1 : Image3; and Row 1, Column 2 : Image 4; Row 2 : The entire image set.
6.5.2.2 Experiments with JPEG 2000 quality scalability
Similarly, Figure 6.13 shows the robustness performance of the model for actual JPEG
2000 quality scalability-based content adaptations for Image 3, Image 4, and the entire
image set (Figure 4.7). Plots show the robustness to different compression ratio points
for different embedding model values of N and compares with the case for N = 0, where
the model is not used. It is evident from these plots, that high values of N considered in
the embedding model lead to enhanced robustness of the blind watermarking scheme.
Similar to the non-blind model, the improvement over the original algorithm [5], in
robustness is achieved by more than 15% at various compression ratio using the blind
model at N = 5.
96
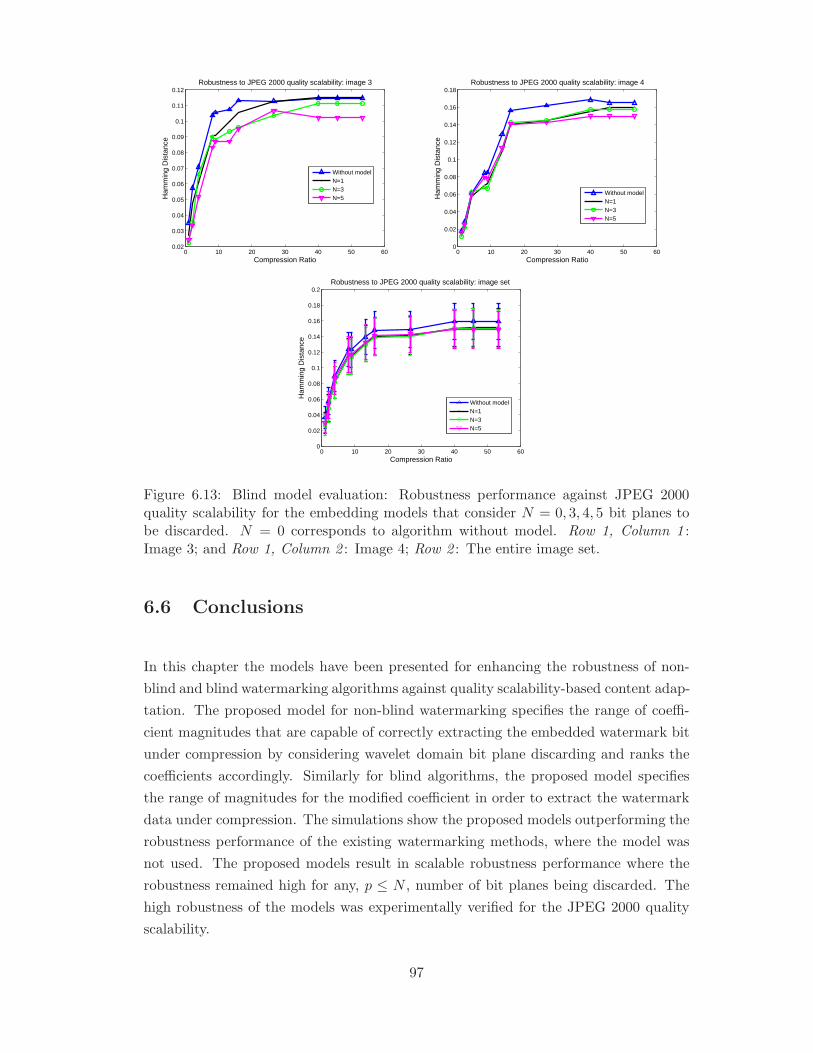
0 10 20 30 40 50 600.02
0.03
0.04
0.05
0.06
0.07
0.08
0.09
0.1
0.11
0.12Robustness to JPEG 2000 quality scalability: image 3
Compression Ratio
Ham
min
g D
ista
nce
Without modelN=1N=3N=5
0 10 20 30 40 50 600
0.02
0.04
0.06
0.08
0.1
0.12
0.14
0.16
0.18Robustness to JPEG 2000 quality scalability: image 4
Compression Ratio
Ham
min
g D
ista
nce
Without modelN=1N=3N=5
0 10 20 30 40 50 600
0.02
0.04
0.06
0.08
0.1
0.12
0.14
0.16
0.18
0.2Robustness to JPEG 2000 quality scalability: image set
Compression Ratio
Ham
min
g D
ista
nce
Without modelN=1N=3N=5
Figure 6.13: Blind model evaluation: Robustness performance against JPEG 2000quality scalability for the embedding models that consider N = 0, 3, 4, 5 bit planes tobe discarded. N = 0 corresponds to algorithm without model. Row 1, Column 1 :Image 3; and Row 1, Column 2 : Image 4; Row 2 : The entire image set.
6.6 Conclusions
In this chapter the models have been presented for enhancing the robustness of non-
blind and blind watermarking algorithms against quality scalability-based content adap-
tation. The proposed model for non-blind watermarking specifies the range of coeffi-
cient magnitudes that are capable of correctly extracting the embedded watermark bit
under compression by considering wavelet domain bit plane discarding and ranks the
coefficients accordingly. Similarly for blind algorithms, the proposed model specifies
the range of magnitudes for the modified coefficient in order to extract the watermark
data under compression. The simulations show the proposed models outperforming the
robustness performance of the existing watermarking methods, where the model was
not used. The proposed models result in scalable robustness performance where the
robustness remained high for any, p ≤ N , number of bit planes being discarded. The
high robustness of the models was experimentally verified for the JPEG 2000 quality
scalability.
97

98
Chapter 7
Motion Compensated Video
Watermarking Techniques
So far in this thesis, we have discussed, analyzed and proposed models to enhance the
watermarking robustness for images and evaluated the performances against scalable
compression, i.e., JPEG 2000. In this chapter the research findings are extended in
video watermarking scenario. Inline with the thesis objectives, this chapter focuses on
robust watermarking techniques for scalable coded video compression, such as, Motion
JPEG 2000, wavelet based MC-EZBC [33] and more recent H.264/SVC. In order to
account the motion information, we have proposed Motion Compensated Temporal
Filtering (MCTF) based video watermarking algorithms here. Firstly the generalized
MCTF based video watermarking schemes are proposed and evaluated and then robust-
ness models, derived in Chapter 6 are applied within MCTF framework for enhanced
robustness in video watermarking.
7.1 Introduction
MCTF has been successfully used in wavelet based scalable video coding reseach [33,
109]. The idea of MCTF is evolved from 3D subband wavelet decomposition, which
is merely an extension of spatial domain transform into temporal domain [110]. But
3D wavelet decomposition alone does not decouple motion information and it is ad-
dressed by using temporal filtering along the motion trajectories. This MCTF based
video decomposition technique motivates a new avenue in transform domain video wa-
99
termarking.
Often video watermarking schemes are developed by extending image watermarking
algorithms. Transform domain, especially, wavelet based image watermarking has been
very successful in imperceptibility as well as robustness performance against various
image processing attacks. As a successor of the same, several attempts have been made
to extend these image watermarking algorithms into video watermarking by using them
either on a frame-by-frame basis [27–30] or based on 3D wavelet decompositions [9,31,
32].
The frame-by-frame video watermarking considers embedding on selected frames lo-
cated at fixed intervals to make them robust against frame dropping based temporal
adaptations of video. In this case each frame is treated separately as an individual
image, hence any image watermarking algorithm can be adopted to achieve the in-
tended robustness. But frame-by-frame watermarking schemes often perform poorly
in terms of robustness against various video processing attacks including temporal
desynchronization, video collusion, video compression attacks etc. In order to address
these issues, the video temporal dimension is exploited by the spread spectrum domain
i.e. DCT and more recently wavelet based 3D decomposition of the host video. In 3D
wavelet-based watermarking approaches [9,31,32], video is composed into 3D subbands
by using separable 3D wavelet transform with shorter mother wavelets, such as Haar.
Unfortunately, such naive subband decomposition-based embedding strategies, that do
not consider the motion element of the sequence when embedding the watermark, often
result in unpleasant flickering visual artifacts. The amount of flickering in watermarked
sequences varies according to the texture, color and motion characteristics of the video
content as well as the watermark strength and the choice of frequency subband used
for watermark embedding. At the same time, these schemes are also fragile to video
compression attacks which consider motion trajectory during compression coding.
The aim of this chapter is to address the consideration of motion and texture charac-
teristics of the video sequence for extending image watermarking techniques into video.
The new proposed approach is evolved from the MCTF based wavelet domain video
decomposition concept, as briefed at the beginning of the chapter. Few attempts have
already been made to investigate the effect of motion in video watermarking attempts
on incorporating motion compensation into video watermarking [57, 79, 80]. In these
investigations the sequence is first temporally decomposed into Haar wavelet subbands
using MCTF and then spatially decomposed using the 2D DCT transform resulting
in the decomposition scheme widely known as t+2D. Here we aim to advance further
by investigating along the line of MCTF based wavelet coding to improve the robust-
100
ness while keeping the imperceptibility or vice versa. Apparent problems of direct use
of MCTF and t+2D decompositions in watermarking are three-fold and alternative
solutions are offered to address the same.
1. In scalable video coding research it has been evident that video with different
texture and motion characteristics leading to its spatial and temporal features
perform differently on t+2D domain [33] and its alternative 2D+t domain [111],
where MCTF is performed on the 2D wavelet decomposition domain. Further,
in 3D subband decomposition for video watermarking, the consideration of mo-
tion, thus the use of MCTF, is only required for subbands where the watermarks
are embedded. Therefore fixed architectures, such as t+2D or 2D+t, add un-
necessary complexity in terms of motion estimation and compensation into the
watermarking algorithm.
2. The conventional MCTF is focused on achieving higher compression and thus
gives more attention on the prediction lifting step in MCTF. However, for wa-
termarking it is necessary to follow the motion trajectory of content into low
frequency temporal subband frames, in order to avoid motion mismatch in the
update step of MCTF when these frames are modified due to watermark embed-
ding.
3. t+2D structure offers better energy compaction in the low frequency temporal
subband, while keeping majority coefficient values to very small or nearly zero in
high frequency temporal subbands. This is very useful during compression but
leaves very little room for watermark embedding in high frequency temporal sub-
bands. Therefore, for a robust algorithm most of the MCTF domain watermark-
ing schemes, as mentioned before, embed the watermark in the low-pass temporal
frames. On the other hand 2D+t provides more energy in high frequency sub-
bands, which enables the possibility to embed and recover the watermark robustly
using high-pass temporal frames which improves the overall imperceptibility of
the watermarked video.
To overcome these shortcomings, MCTF based 3D wavelet decomposition schemes are
proposed for video sequences and a flexible 2D+t+2D generalized motion compensated
temporal-spatial subband decomposition scheme is offered using a modified motion
compensated temporal filtering (MMCTF) scheme for video watermarking. Using the
proposed decompositions within the framework we study and analyze the merits and
the demerits of watermark embedding using various combinations of 2D+t+2D struc-
ture and propose new video watermarking schemes to improve the imperceptibility
101
and the robustness performance against scalable coded video attacks, such as, Motion
JPEG 2000, MC-EZBC and H.264-SVC. The issues related to motion estimation from
watermarked video without any prior knowledge of original motion information are also
addressed in the case of a blind watermarking method.
7.2 Motion compensated 2D+t+2D filtering
The generalised spatio-temporal decomposition scheme consists of two modules: 1)
MCTF and 2) 2D spatial frequency decomposition. To capture the motion information
accurately, the commonly used lifting based MCTF is modified by tracking inter-frame
pixel connectivity and the 2D wavelet transform is used for spatial decomposition. In
this section the modified motion compensated temporal filtering (MMCTF) is described
first and then the 2D+t+2D general framework is proposed based on MMCTF.
7.2.1 MMCTF
The MMCTF scheme is formulated by giving more focus into the motion trajectory-
based update step as follows. Let It be the video sequence, where t is the time index in
display order. We consider two consecutive frames I2t and I2t+1, as the current frame
(c) and the reference frame (r), respectively, following the video coding terminology.
The I2t frame is partitioned into non-overlapping blocks and for each block, vertical
and horizontal displacements are quantified and represented as motion vector fields
Vc→r and Hc→r, respectively. In the I2t frame, each block can be one of two types,
namely inter and intra blocks, where the motion is only estimated for the former block
type only. Similarly, as far as the I2t+1 frame is concerned any pixel can be one of
three types, namely, one-to-one connected, one-to-many connected and unconnected
(as shown in Figure 7.1), depending on their connectivity to pixels in the I2t frame
following the implied motion vector vector fields Vc←r and Hc←r, which are simply the
directional inverse of the original motion vector fields, Vc→r and Hc→r.
Considering these block and pixel classifications, the lifting steps for pixels at positions
[m,n] in frames I2t and I2t+1 (i.e., I2t[m,n] and I2t+1[m,n]) performing the temporal
motion compensated Haar wavelet transform are defined as follows:
102
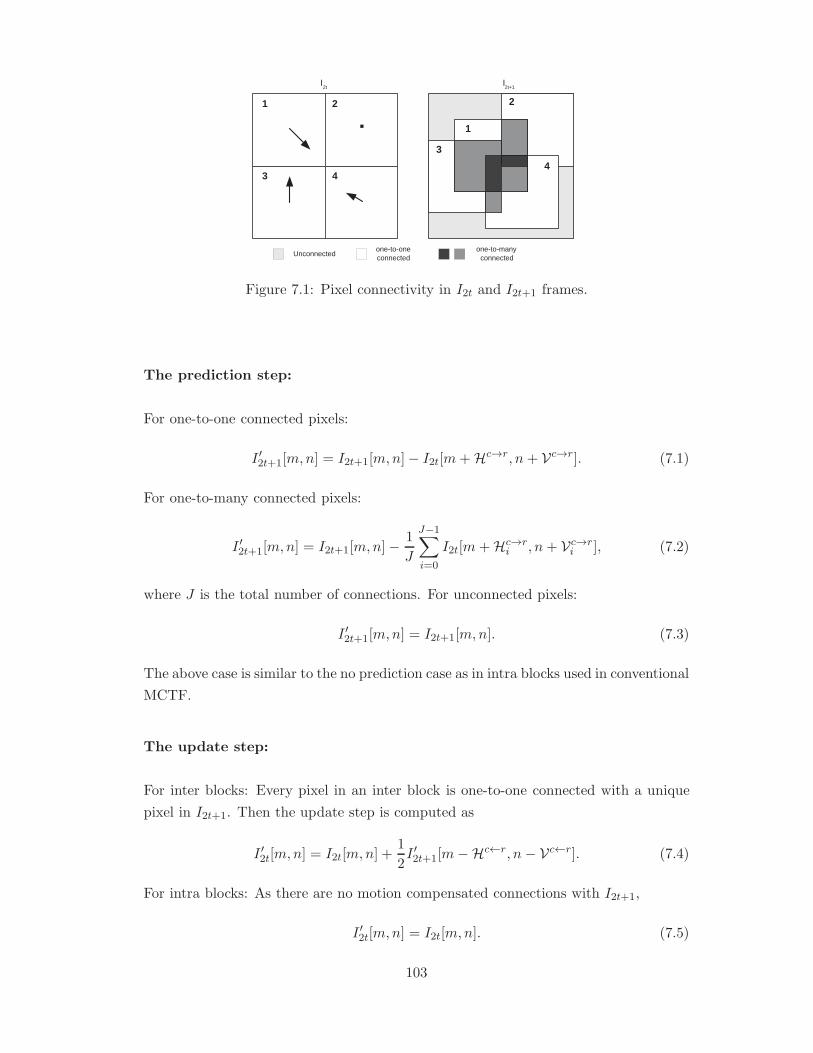
1 2
3 4
1
2
3
4
I 2t
I 2t+1
Unconnected one-to-one connected
one-to-many connected
Figure 7.1: Pixel connectivity in I2t and I2t+1 frames.
The prediction step:
For one-to-one connected pixels:
I ′2t+1[m,n] = I2t+1[m,n]− I2t[m+Hc→r, n+ Vc→r]. (7.1)
For one-to-many connected pixels:
I ′2t+1[m,n] = I2t+1[m,n]− 1
J
J−1∑
i=0
I2t[m+Hc→ri , n+ Vc→r
i ], (7.2)
where J is the total number of connections. For unconnected pixels:
I ′2t+1[m,n] = I2t+1[m,n]. (7.3)
The above case is similar to the no prediction case as in intra blocks used in conventional
MCTF.
The update step:
For inter blocks: Every pixel in an inter block is one-to-one connected with a unique
pixel in I2t+1. Then the update step is computed as
I ′2t[m,n] = I2t[m,n] +1
2I ′2t+1[m−Hc←r, n− Vc←r]. (7.4)
For intra blocks: As there are no motion compensated connections with I2t+1,
I ′2t[m,n] = I2t[m,n]. (7.5)
103

Finally these lifting steps are followed by the normalization step.
I ′′2t[m,n] =√2I ′2t[m,n], (7.6)
I ′′2t+1[m,n] =1√2I ′2t+1[m,n]. (7.7)
The temporally decomposed frames I ′′2t and I ′′2t+1 are the first level low and high pass
frames and are denoted as L and H temporal subbands. These steps are repeated for
all frames in L to obtain LL and LH sub bands and continued to obtain the desired
number of temporal decomposition levels. For the inverse transform, the order of
operation of steps is reversed and the first operand in lifting steps is changed to subject
variable in above equations.
7.2.2 2D+t+2D framework
As discussed earlier in Section 7.1, in a 3D video decomposition scheme, t+2D is
achieved by performing temporal decomposition followed by a spatial transform where
as in case of 2D+t, the temporal filtering is done after the spatial 2D transform. Due
to its own merit and demerit, it is required to analyse both the combinations in order
to enhance the video watermarking performance. A common flexible reconfigurable
framework, which allows to create such possible combinations, are particularly useful
for applications like video watermarking. Here the 2D+t+2D framework is proposed by
combining the modified motion compensated temporal filtering with spatial 2D wavelet
transformation.
Let (s1ts2) be the number of decomposition levels used in the 2D+t+2D subband
decomposition to obtain a 3D subband decomposition with motion compensated t
temporal levels and s spatial levels, where s = s1 + s2. In such a scheme, first the
2D Discrete Wavelet Transform (DWT) is applied for an s1 level decomposition. As
a result a new sequence is formed by the low frequency spatial LL subband of all
frames. Then the sequence of spatial LL subbands are temporally decomposed using
the MMCTF into t temporal levels. Finally each of the temporal transformed spatial
LL subbands are further spatially decomposed into s2 wavelet levels.
For a t-s motion compensated temporal subband decomposition, the values of s1 and s2
are determined by considering the context of the choice of temporal-spatial subbands
used for watermark embedding. For example, (032) and (230) parameter combinations
result in t+2D and 2D+t motion compensated 3D subband decompositions, respec-
104

(032)0 1 2 3 4 5 6 7
0 1 3 5 7
0 2 4 6
0 4
H
LH
LLH LLL
Video Sequence
1st temporal level
2nd temporal level
3rd temporal level
2 4 6
Figure 7.2: Realization of 3-2 temporal schemes using the 2D+t+2D framework withdifferent parameters: (032).
tively. The same amount subband decomposition levels can be obtained by also using
the parameter combination (131) using the proposed generalized scheme implementa-
tion. The combination (002) allows 2D decomposition of all frames for frame by frame
watermark embedding. The realization of these examples are shown in Figure 7.2,
Figure 7.3, Figure 7.4 and Figure 7.5. We use the notation (LLL, LLH, LH, H) to
denote the temporal subbands after a 3 level decomposition. The use of this framework
is described in combination with watermarking algorithms, in the next section.
7.3 Video watermarking in 2D+t+2D spatio-temporal de-
composition
We propose a new video watermarking scheme by extending the wavelet based im-
age watermarking algorithms into 2D+t+2D framework. At this point we recall the
generalized wavelet based image watermarking schemes as described in Chapter 3 and
Chapter 4. In this section those watermarking algorithms are extended into MCTF
based framework to propose new video watermarking schemes. Then various combina-
tions in the proposed video decomposition framework are analyzed to decide on unique
video embedding parameters, such as, 1) choice of temporal subband selection and 2)
motion estimation parameters to retrieve the motion information from watermarked
video.
105
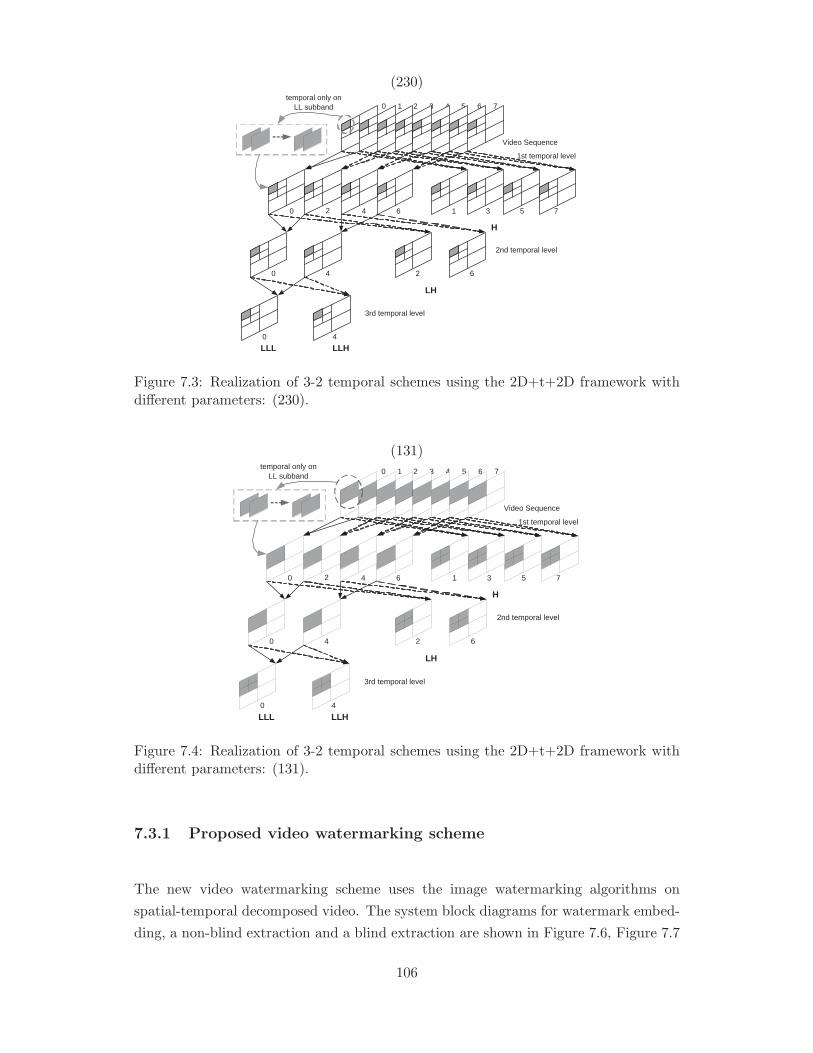
(230)
0 1 2 3 4 5 6 7
0 1 3 5 7
0 2 4 6
0 4
H
LH
LLH LLL
Video Sequence
2nd temporal level
3rd temporal level
2 4 6
temporal only on LL subband
1st temporal level
Figure 7.3: Realization of 3-2 temporal schemes using the 2D+t+2D framework withdifferent parameters: (230).
(131)
0 1 2 3 4 5 6 7
0 1 3 5 7
0 2 4 6
0 4
H
LH
LLH LLL
Video Sequence
2nd temporal level
3rd temporal level
2 4 6
temporal only on LL subband
1st temporal level
Figure 7.4: Realization of 3-2 temporal schemes using the 2D+t+2D framework withdifferent parameters: (131).
7.3.1 Proposed video watermarking scheme
The new video watermarking scheme uses the image watermarking algorithms on
spatial-temporal decomposed video. The system block diagrams for watermark embed-
ding, a non-blind extraction and a blind extraction are shown in Figure 7.6, Figure 7.7
106
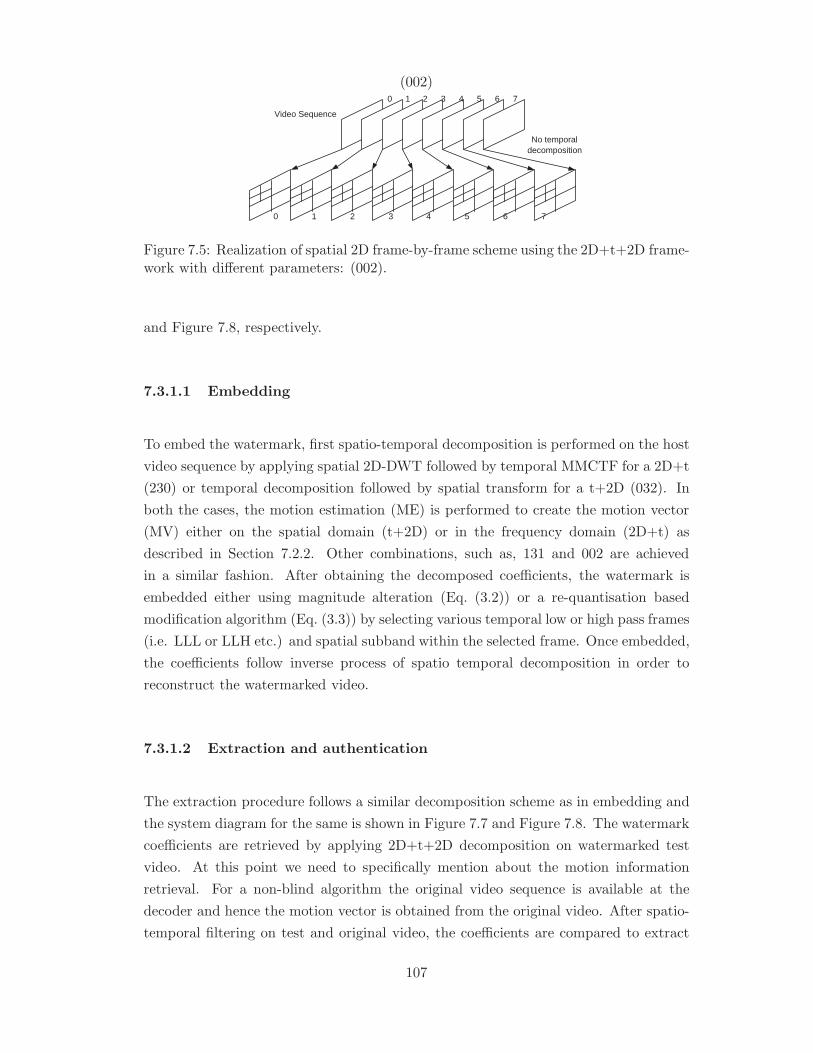
(002)0 1 2 3 4 5 6 7
Video Sequence
0 1 2 3 4 5 6 7
No temporal decomposition
Figure 7.5: Realization of spatial 2D frame-by-frame scheme using the 2D+t+2D frame-work with different parameters: (002).
and Figure 7.8, respectively.
7.3.1.1 Embedding
To embed the watermark, first spatio-temporal decomposition is performed on the host
video sequence by applying spatial 2D-DWT followed by temporal MMCTF for a 2D+t
(230) or temporal decomposition followed by spatial transform for a t+2D (032). In
both the cases, the motion estimation (ME) is performed to create the motion vector
(MV) either on the spatial domain (t+2D) or in the frequency domain (2D+t) as
described in Section 7.2.2. Other combinations, such as, 131 and 002 are achieved
in a similar fashion. After obtaining the decomposed coefficients, the watermark is
embedded either using magnitude alteration (Eq. (3.2)) or a re-quantisation based
modification algorithm (Eq. (3.3)) by selecting various temporal low or high pass frames
(i.e. LLL or LLH etc.) and spatial subband within the selected frame. Once embedded,
the coefficients follow inverse process of spatio temporal decomposition in order to
reconstruct the watermarked video.
7.3.1.2 Extraction and authentication
The extraction procedure follows a similar decomposition scheme as in embedding and
the system diagram for the same is shown in Figure 7.7 and Figure 7.8. The watermark
coefficients are retrieved by applying 2D+t+2D decomposition on watermarked test
video. At this point we need to specifically mention about the motion information
retrieval. For a non-blind algorithm the original video sequence is available at the
decoder and hence the motion vector is obtained from the original video. After spatio-
temporal filtering on test and original video, the coefficients are compared to extract
107
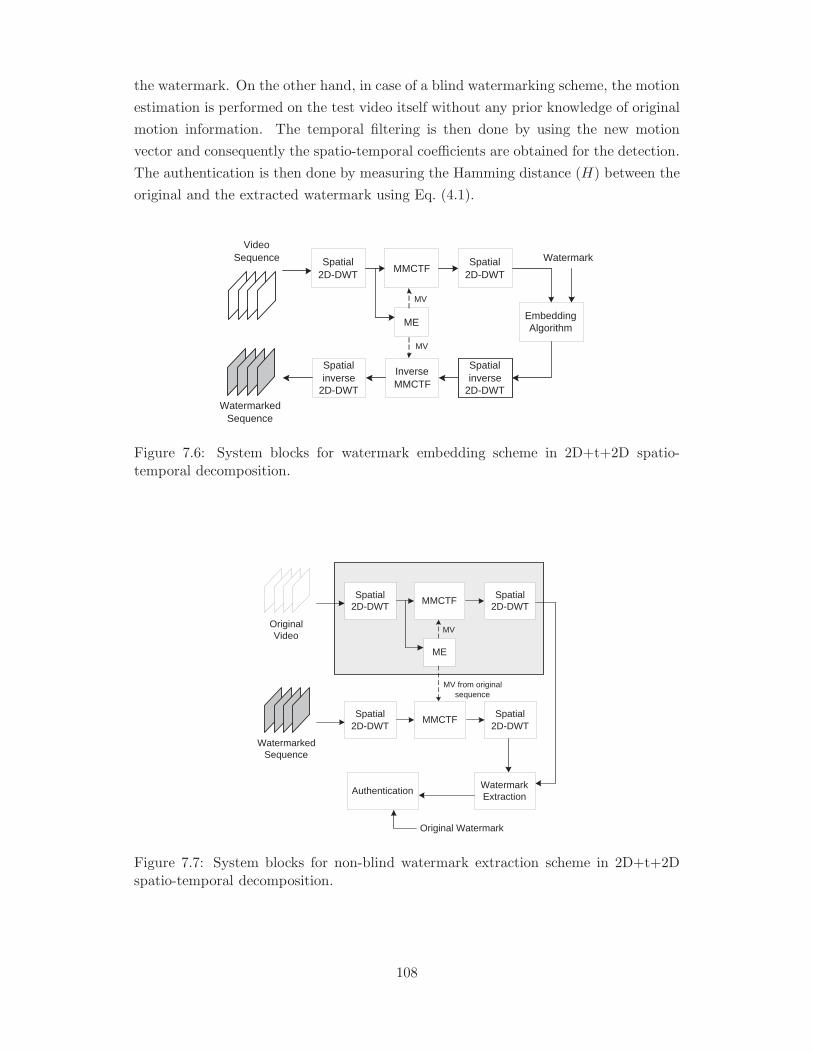
the watermark. On the other hand, in case of a blind watermarking scheme, the motion
estimation is performed on the test video itself without any prior knowledge of original
motion information. The temporal filtering is then done by using the new motion
vector and consequently the spatio-temporal coefficients are obtained for the detection.
The authentication is then done by measuring the Hamming distance (H) between the
original and the extracted watermark using Eq. (4.1).
Watermarked Sequence
Spatial inverse
2D-DWT
Video Sequence Spatial
2D-DWT MMCTF
ME
Spatial 2D-DWT
Watermark
Embedding Algorithm
Inverse MMCTF
MV
Spatial inverse
2D-DWT
MV
Figure 7.6: System blocks for watermark embedding scheme in 2D+t+2D spatio-temporal decomposition.
Watermarked Sequence
Spatial 2D-DWT
MMCTF Spatial
2D-DWT
Original Watermark
Watermark Extraction
Authentication
Original Video
Spatial 2D-DWT
MMCTF
ME
Spatial 2D-DWT
MV
MV from original sequence
Figure 7.7: System blocks for non-blind watermark extraction scheme in 2D+t+2Dspatio-temporal decomposition.
108
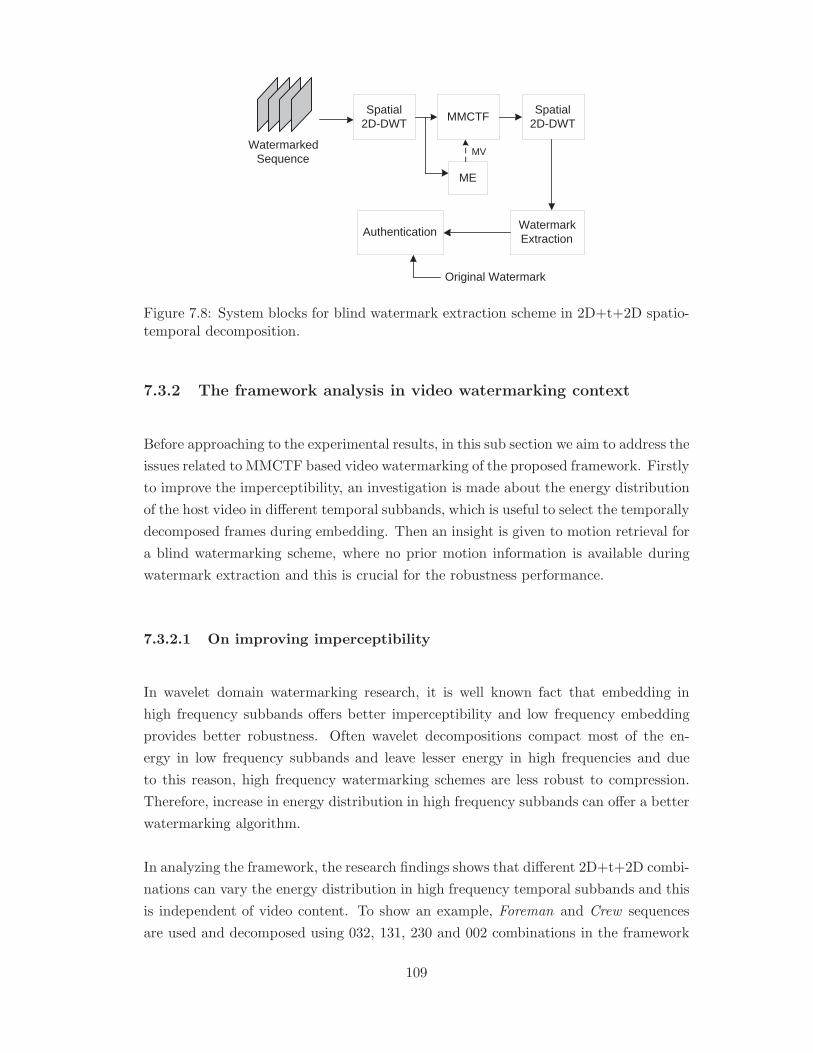
Watermarked Sequence
Spatial 2D-DWT
MMCTF
ME
Spatial 2D-DWT
Original Watermark
Watermark Extraction
MV
Authentication
Figure 7.8: System blocks for blind watermark extraction scheme in 2D+t+2D spatio-temporal decomposition.
7.3.2 The framework analysis in video watermarking context
Before approaching to the experimental results, in this sub section we aim to address the
issues related to MMCTF based video watermarking of the proposed framework. Firstly
to improve the imperceptibility, an investigation is made about the energy distribution
of the host video in different temporal subbands, which is useful to select the temporally
decomposed frames during embedding. Then an insight is given to motion retrieval for
a blind watermarking scheme, where no prior motion information is available during
watermark extraction and this is crucial for the robustness performance.
7.3.2.1 On improving imperceptibility
In wavelet domain watermarking research, it is well known fact that embedding in
high frequency subbands offers better imperceptibility and low frequency embedding
provides better robustness. Often wavelet decompositions compact most of the en-
ergy in low frequency subbands and leave lesser energy in high frequencies and due
to this reason, high frequency watermarking schemes are less robust to compression.
Therefore, increase in energy distribution in high frequency subbands can offer a better
watermarking algorithm.
In analyzing the framework, the research findings shows that different 2D+t+2D combi-
nations can vary the energy distribution in high frequency temporal subbands and this
is independent of video content. To show an example, Foreman and Crew sequences
are used and decomposed using 032, 131, 230 and 002 combinations in the framework
109
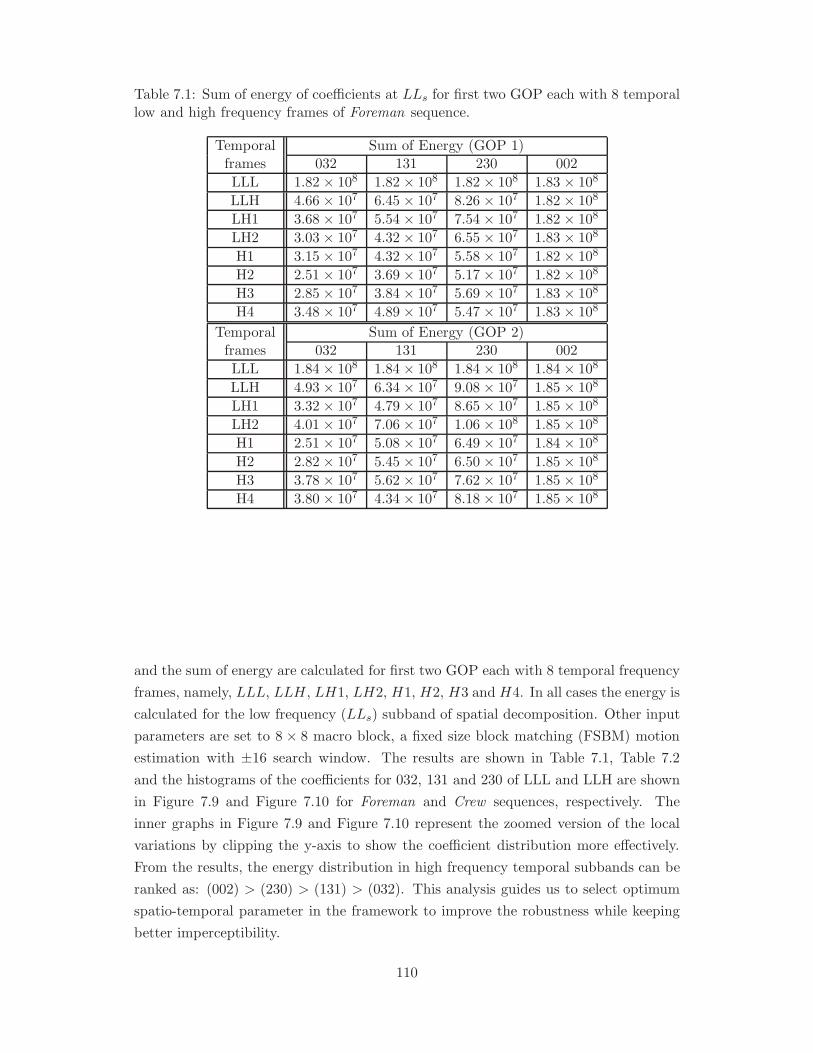
Table 7.1: Sum of energy of coefficients at LLs for first two GOP each with 8 temporallow and high frequency frames of Foreman sequence.
Temporal Sum of Energy (GOP 1)frames 032 131 230 002
LLL 1.82 × 10⁸ 1.82 × 10⁸ 1.82 × 10⁸ 1.83 × 10⁸
LLH 4.66 × 10⁷ 6.45 × 10⁷ 8.26 × 10⁷ 1.82 × 10⁸
LH1 3.68 × 10⁷ 5.54 × 10⁷ 7.54 × 10⁷ 1.82 × 10⁸
LH2 3.03 × 10⁷ 4.32 × 10⁷ 6.55 × 10⁷ 1.83 × 10⁸
H1 3.15 × 10⁷ 4.32 × 10⁷ 5.58 × 10⁷ 1.82 × 10⁸
H2 2.51 × 10⁷ 3.69 × 10⁷ 5.17 × 10⁷ 1.82 × 10⁸
H3 2.85 × 10⁷ 3.84 × 10⁷ 5.69 × 10⁷ 1.83 × 10⁸
H4 3.48 × 10⁷ 4.89 × 10⁷ 5.47 × 10⁷ 1.83 × 10⁸
Temporal Sum of Energy (GOP 2)frames 032 131 230 002
LLL 1.84 × 10⁸ 1.84 × 10⁸ 1.84 × 10⁸ 1.84 × 10⁸
LLH 4.93 × 10⁷ 6.34 × 10⁷ 9.08 × 10⁷ 1.85 × 10⁸
LH1 3.32 × 10⁷ 4.79 × 10⁷ 8.65 × 10⁷ 1.85 × 10⁸
LH2 4.01 × 10⁷ 7.06 × 10⁷ 1.06 × 10⁸ 1.85 × 10⁸
H1 2.51 × 10⁷ 5.08 × 10⁷ 6.49 × 10⁷ 1.84 × 10⁸
H2 2.82 × 10⁷ 5.45 × 10⁷ 6.50 × 10⁷ 1.85 × 10⁸
H3 3.78 × 10⁷ 5.62 × 10⁷ 7.62 × 10⁷ 1.85 × 10⁸
H4 3.80 × 10⁷ 4.34 × 10⁷ 8.18 × 10⁷ 1.85 × 10⁸
and the sum of energy are calculated for first two GOP each with 8 temporal frequency
frames, namely, LLL, LLH, LH1, LH2, H1, H2, H3 and H4. In all cases the energy is
calculated for the low frequency (LLs) subband of spatial decomposition. Other input
parameters are set to 8 × 8 macro block, a fixed size block matching (FSBM) motion
estimation with ±16 search window. The results are shown in Table 7.1, Table 7.2
and the histograms of the coefficients for 032, 131 and 230 of LLL and LLH are shown
in Figure 7.9 and Figure 7.10 for Foreman and Crew sequences, respectively. The
inner graphs in Figure 7.9 and Figure 7.10 represent the zoomed version of the local
variations by clipping the y-axis to show the coefficient distribution more effectively.
From the results, the energy distribution in high frequency temporal subbands can be
ranked as: (002) > (230) > (131) > (032). This analysis guides us to select optimum
spatio-temporal parameter in the framework to improve the robustness while keeping
better imperceptibility.
110
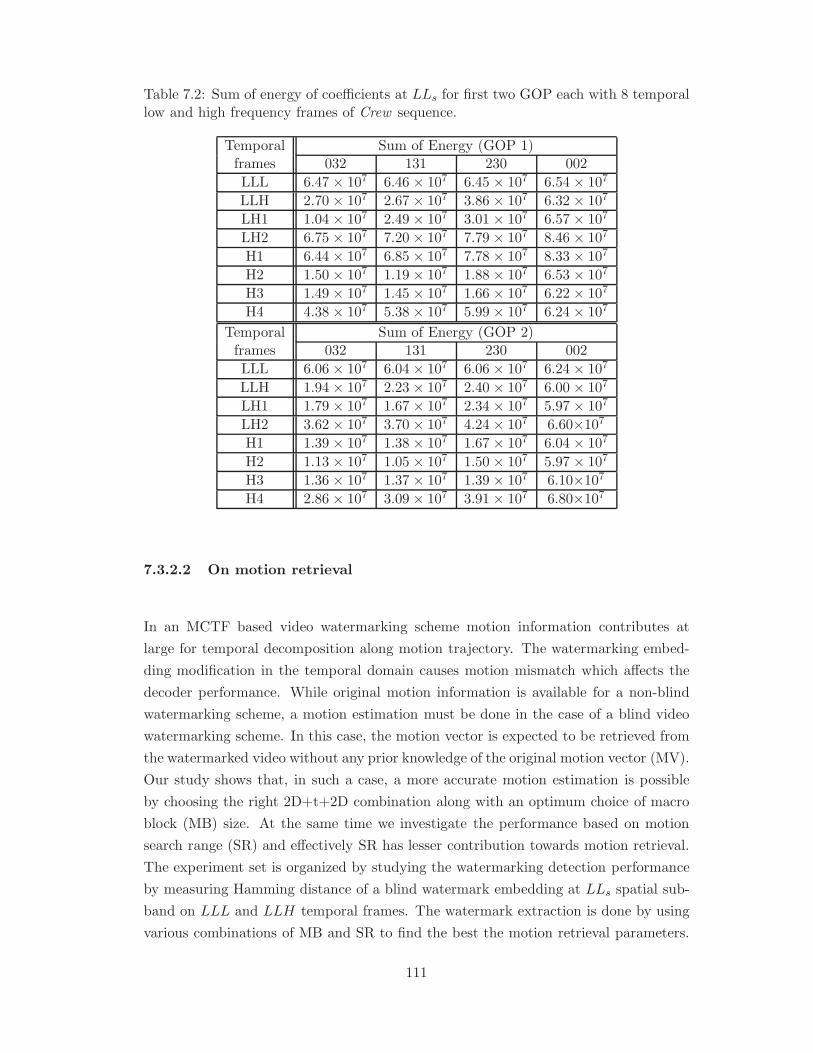
Table 7.2: Sum of energy of coefficients at LLs for first two GOP each with 8 temporallow and high frequency frames of Crew sequence.
Temporal Sum of Energy (GOP 1)frames 032 131 230 002
LLL 6.47 × 10⁷ 6.46 × 10⁷ 6.45 × 10⁷ 6.54 × 10⁷
LLH 2.70 × 10⁷ 2.67 × 10⁷ 3.86 × 10⁷ 6.32 × 10⁷
LH1 1.04 × 10⁷ 2.49 × 10⁷ 3.01 × 10⁷ 6.57 × 10⁷
LH2 6.75 × 10⁷ 7.20 × 10⁷ 7.79 × 10⁷ 8.46 × 10⁷
H1 6.44 × 10⁷ 6.85 × 10⁷ 7.78 × 10⁷ 8.33 × 10⁷
H2 1.50 × 10⁷ 1.19 × 10⁷ 1.88 × 10⁷ 6.53 × 10⁷
H3 1.49 × 10⁷ 1.45 × 10⁷ 1.66 × 10⁷ 6.22 × 10⁷
H4 4.38 × 10⁷ 5.38 × 10⁷ 5.99 × 10⁷ 6.24 × 10⁷
Temporal Sum of Energy (GOP 2)frames 032 131 230 002
LLL 6.06 × 10⁷ 6.04 × 10⁷ 6.06 × 10⁷ 6.24 × 10⁷
LLH 1.94 × 10⁷ 2.23 × 10⁷ 2.40 × 10⁷ 6.00 × 10⁷
LH1 1.79 × 10⁷ 1.67 × 10⁷ 2.34 × 10⁷ 5.97 × 10⁷
LH2 3.62 × 10⁷ 3.70 × 10⁷ 4.24 × 10⁷ 6.60×10⁷
H1 1.39 × 10⁷ 1.38 × 10⁷ 1.67 × 10⁷ 6.04 × 10⁷
H2 1.13 × 10⁷ 1.05 × 10⁷ 1.50 × 10⁷ 5.97 × 10⁷
H3 1.36 × 10⁷ 1.37 × 10⁷ 1.39 × 10⁷ 6.10×10⁷
H4 2.86 × 10⁷ 3.09 × 10⁷ 3.91 × 10⁷ 6.80×10⁷
7.3.2.2 On motion retrieval
In an MCTF based video watermarking scheme motion information contributes at
large for temporal decomposition along motion trajectory. The watermarking embed-
ding modification in the temporal domain causes motion mismatch which affects the
decoder performance. While original motion information is available for a non-blind
watermarking scheme, a motion estimation must be done in the case of a blind video
watermarking scheme. In this case, the motion vector is expected to be retrieved from
the watermarked video without any prior knowledge of the original motion vector (MV).
Our study shows that, in such a case, a more accurate motion estimation is possible
by choosing the right 2D+t+2D combination along with an optimum choice of macro
block (MB) size. At the same time we investigate the performance based on motion
search range (SR) and effectively SR has lesser contribution towards motion retrieval.
The experiment set is organized by studying the watermarking detection performance
by measuring Hamming distance of a blind watermark embedding at LLs spatial sub-
band on LLL and LLH temporal frames. The watermark extraction is done by using
various combinations of MB and SR to find the best the motion retrieval parameters.
111
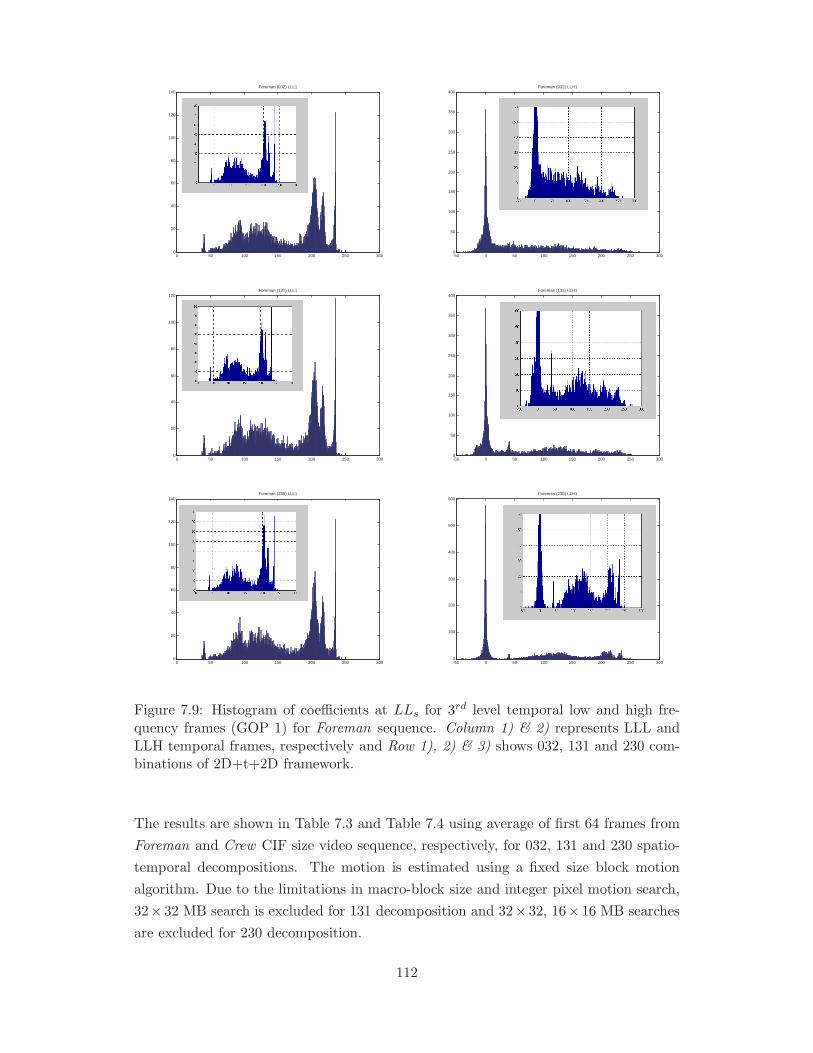
0 50 100 150 200 250 300 0
20
40
60
80
100
120
140 Foreman (032) LLL1
-50 0 50 100 150 200 250 300 0
50
100
150
200
250
300
350
400 Foreman (032) LLH1
0 50 100 150 200 250 300 0
20
40
60
80
100
120 Foreman (131) LLL1
-50 0 50 100 150 200 250 300 0
50
100
150
200
250
300
350
400 Foreman (131) LLH1
0 50 100 150 200 250 300 0
20
40
60
80
100
120
140 Foreman (230) LLL1
-50 0 50 100 150 200 250 300 0
100
200
300
400
500
600 Foreman (230) LLH1
Figure 7.9: Histogram of coefficients at LLs for 3rd level temporal low and high fre-quency frames (GOP 1) for Foreman sequence. Column 1) & 2) represents LLL andLLH temporal frames, respectively and Row 1), 2) & 3) shows 032, 131 and 230 com-binations of 2D+t+2D framework.
The results are shown in Table 7.3 and Table 7.4 using average of first 64 frames from
Foreman and Crew CIF size video sequence, respectively, for 032, 131 and 230 spatio-
temporal decompositions. The motion is estimated using a fixed size block motion
algorithm. Due to the limitations in macro-block size and integer pixel motion search,
32× 32 MB search is excluded for 131 decomposition and 32× 32, 16× 16 MB searches
are excluded for 230 decomposition.
112
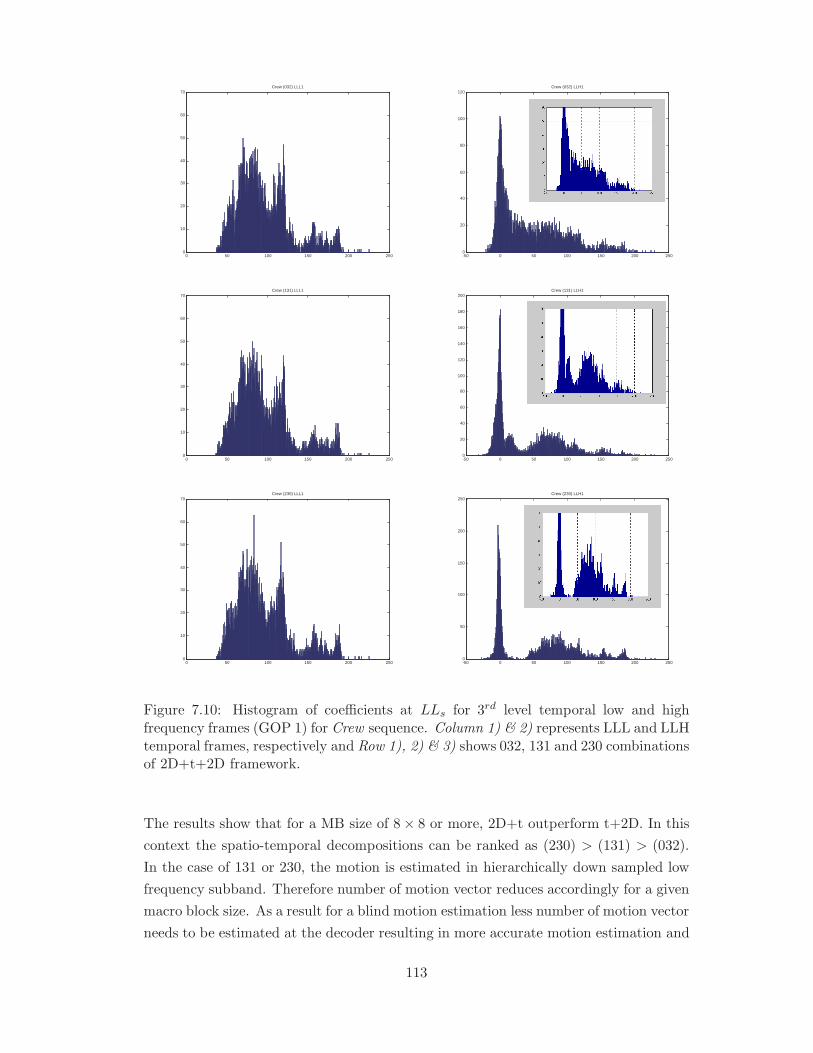
0 50 100 150 200 250 0
10
20
30
40
50
60
70 Crew (032) LLL1
-50 0 50 100 150 200 250 0
20
40
60
80
100
120 Crew (032) LLH1
0 50 100 150 200 250 0
10
20
30
40
50
60
70 Crew (131) LLL1
-50 0 50 100 150 200 250 0
20
40
60
80
100
120
140
160
180
200 Crew (131) LLH1
0 50 100 150 200 250 0
10
20
30
40
50
60
70 Crew (230) LLL1
-50 0 50 100 150 200 250 0
50
100
150
200
250 Crew (230) LLH1
Figure 7.10: Histogram of coefficients at LLs for 3rd level temporal low and highfrequency frames (GOP 1) for Crew sequence. Column 1) & 2) represents LLL and LLHtemporal frames, respectively and Row 1), 2) & 3) shows 032, 131 and 230 combinationsof 2D+t+2D framework.
The results show that for a MB size of 8× 8 or more, 2D+t outperform t+2D. In this
context the spatio-temporal decompositions can be ranked as (230) > (131) > (032).
In the case of 131 or 230, the motion is estimated in hierarchically down sampled low
frequency subband. Therefore number of motion vector reduces accordingly for a given
macro block size. As a result for a blind motion estimation less number of motion vector
needs to be estimated at the decoder resulting in more accurate motion estimation and
113
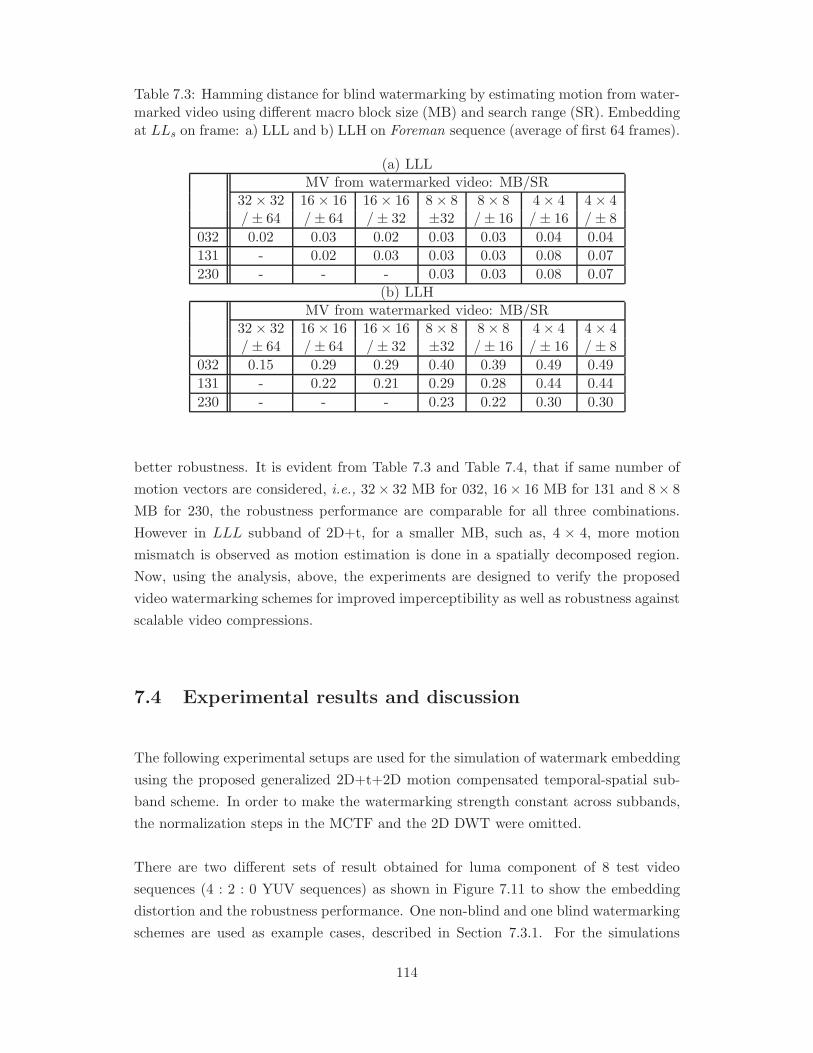
Table 7.3: Hamming distance for blind watermarking by estimating motion from water-marked video using different macro block size (MB) and search range (SR). Embeddingat LLs on frame: a) LLL and b) LLH on Foreman sequence (average of first 64 frames).
(a) LLLMV from watermarked video: MB/SR
32× 32 16× 16 16× 16 8× 8 8× 8 4× 4 4× 4/± 64 /± 64 /± 32 ±32 /± 16 /± 16 /± 8
032 0.02 0.03 0.02 0.03 0.03 0.04 0.04
131 - 0.02 0.03 0.03 0.03 0.08 0.07
230 - - - 0.03 0.03 0.08 0.07
(b) LLHMV from watermarked video: MB/SR
32× 32 16× 16 16× 16 8× 8 8× 8 4× 4 4× 4/± 64 /± 64 /± 32 ±32 /± 16 /± 16 /± 8
032 0.15 0.29 0.29 0.40 0.39 0.49 0.49
131 - 0.22 0.21 0.29 0.28 0.44 0.44
230 - - - 0.23 0.22 0.30 0.30
better robustness. It is evident from Table 7.3 and Table 7.4, that if same number of
motion vectors are considered, i.e., 32× 32 MB for 032, 16× 16 MB for 131 and 8× 8
MB for 230, the robustness performance are comparable for all three combinations.
However in LLL subband of 2D+t, for a smaller MB, such as, 4 × 4, more motion
mismatch is observed as motion estimation is done in a spatially decomposed region.
Now, using the analysis, above, the experiments are designed to verify the proposed
video watermarking schemes for improved imperceptibility as well as robustness against
scalable video compressions.
7.4 Experimental results and discussion
The following experimental setups are used for the simulation of watermark embedding
using the proposed generalized 2D+t+2D motion compensated temporal-spatial sub-
band scheme. In order to make the watermarking strength constant across subbands,
the normalization steps in the MCTF and the 2D DWT were omitted.
There are two different sets of result obtained for luma component of 8 test video
sequences (4 : 2 : 0 YUV sequences) as shown in Figure 7.11 to show the embedding
distortion and the robustness performance. One non-blind and one blind watermarking
schemes are used as example cases, described in Section 7.3.1. For the simulations
114
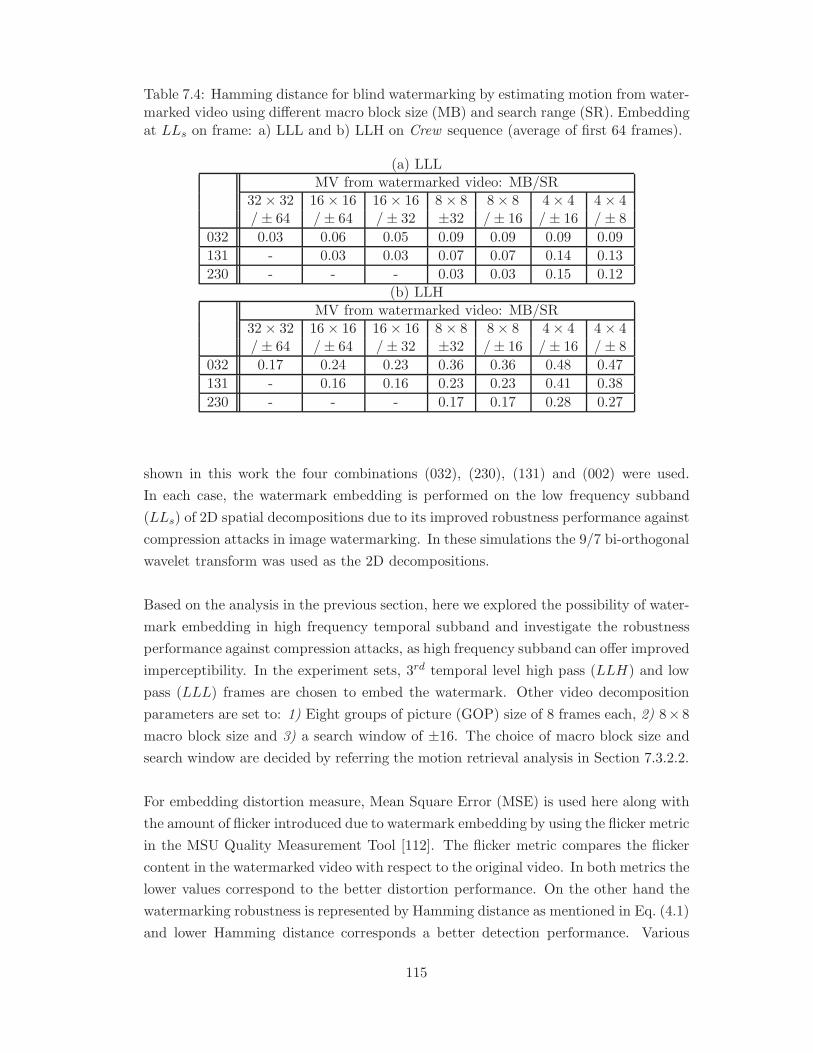
Table 7.4: Hamming distance for blind watermarking by estimating motion from water-marked video using different macro block size (MB) and search range (SR). Embeddingat LLs on frame: a) LLL and b) LLH on Crew sequence (average of first 64 frames).
(a) LLLMV from watermarked video: MB/SR
32× 32 16× 16 16× 16 8× 8 8× 8 4× 4 4× 4/± 64 /± 64 /± 32 ±32 /± 16 /± 16 /± 8
032 0.03 0.06 0.05 0.09 0.09 0.09 0.09
131 - 0.03 0.03 0.07 0.07 0.14 0.13
230 - - - 0.03 0.03 0.15 0.12
(b) LLHMV from watermarked video: MB/SR
32× 32 16× 16 16× 16 8× 8 8× 8 4× 4 4× 4/± 64 /± 64 /± 32 ±32 /± 16 /± 16 /± 8
032 0.17 0.24 0.23 0.36 0.36 0.48 0.47
131 - 0.16 0.16 0.23 0.23 0.41 0.38
230 - - - 0.17 0.17 0.28 0.27
shown in this work the four combinations (032), (230), (131) and (002) were used.
In each case, the watermark embedding is performed on the low frequency subband
(LLs) of 2D spatial decompositions due to its improved robustness performance against
compression attacks in image watermarking. In these simulations the 9/7 bi-orthogonal
wavelet transform was used as the 2D decompositions.
Based on the analysis in the previous section, here we explored the possibility of water-
mark embedding in high frequency temporal subband and investigate the robustness
performance against compression attacks, as high frequency subband can offer improved
imperceptibility. In the experiment sets, 3rd temporal level high pass (LLH) and low
pass (LLL) frames are chosen to embed the watermark. Other video decomposition
parameters are set to: 1) Eight groups of picture (GOP) size of 8 frames each, 2) 8× 8
macro block size and 3) a search window of ±16. The choice of macro block size and
search window are decided by referring the motion retrieval analysis in Section 7.3.2.2.
For embedding distortion measure, Mean Square Error (MSE) is used here along with
the amount of flicker introduced due to watermark embedding by using the flicker metric
in the MSU Quality Measurement Tool [112]. The flicker metric compares the flicker
content in the watermarked video with respect to the original video. In both metrics the
lower values correspond to the better distortion performance. On the other hand the
watermarking robustness is represented by Hamming distance as mentioned in Eq. (4.1)
and lower Hamming distance corresponds a better detection performance. Various
115
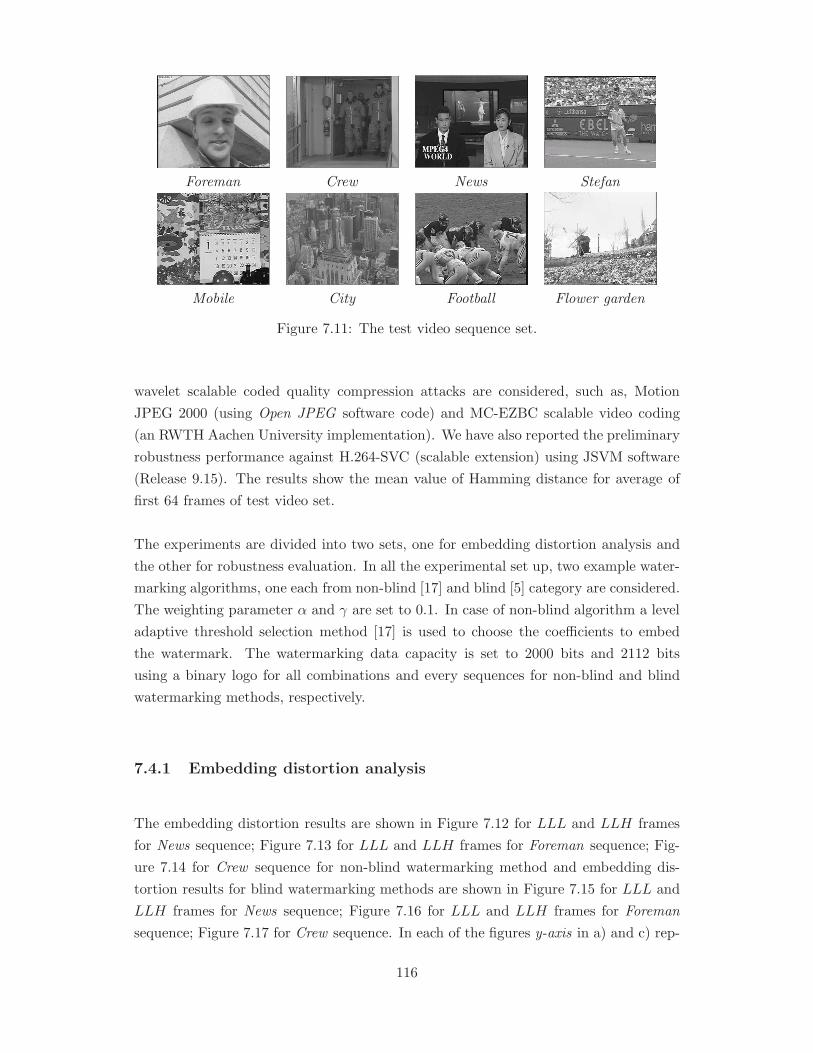
Foreman Crew News Stefan
Mobile City Football Flower garden
Figure 7.11: The test video sequence set.
wavelet scalable coded quality compression attacks are considered, such as, Motion
JPEG 2000 (using Open JPEG software code) and MC-EZBC scalable video coding
(an RWTH Aachen University implementation). We have also reported the preliminary
robustness performance against H.264-SVC (scalable extension) using JSVM software
(Release 9.15). The results show the mean value of Hamming distance for average of
first 64 frames of test video set.
The experiments are divided into two sets, one for embedding distortion analysis and
the other for robustness evaluation. In all the experimental set up, two example water-
marking algorithms, one each from non-blind [17] and blind [5] category are considered.
The weighting parameter α and γ are set to 0.1. In case of non-blind algorithm a level
adaptive threshold selection method [17] is used to choose the coefficients to embed
the watermark. The watermarking data capacity is set to 2000 bits and 2112 bits
using a binary logo for all combinations and every sequences for non-blind and blind
watermarking methods, respectively.
7.4.1 Embedding distortion analysis
The embedding distortion results are shown in Figure 7.12 for LLL and LLH frames
for News sequence; Figure 7.13 for LLL and LLH frames for Foreman sequence; Fig-
ure 7.14 for Crew sequence for non-blind watermarking method and embedding dis-
tortion results for blind watermarking methods are shown in Figure 7.15 for LLL and
LLH frames for News sequence; Figure 7.16 for LLL and LLH frames for Foreman
sequence; Figure 7.17 for Crew sequence. In each of the figures y-axis in a) and c) rep-
116
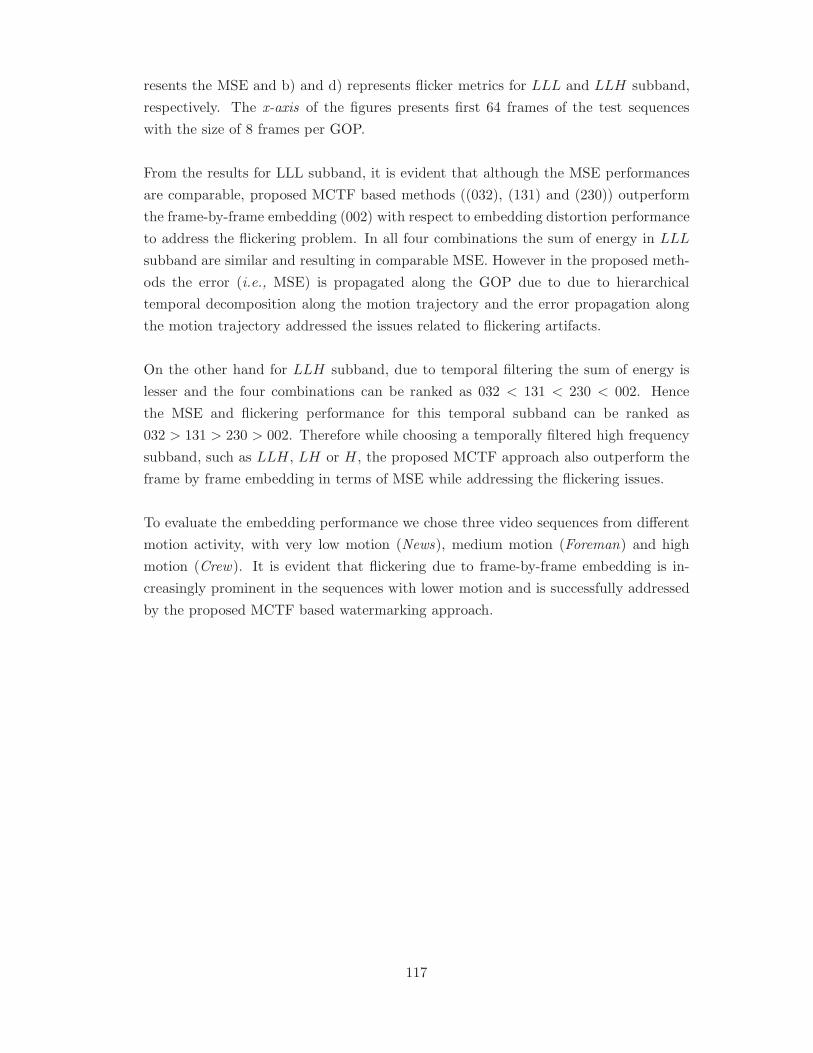
resents the MSE and b) and d) represents flicker metrics for LLL and LLH subband,
respectively. The x-axis of the figures presents first 64 frames of the test sequences
with the size of 8 frames per GOP.
From the results for LLL subband, it is evident that although the MSE performances
are comparable, proposed MCTF based methods ((032), (131) and (230)) outperform
the frame-by-frame embedding (002) with respect to embedding distortion performance
to address the flickering problem. In all four combinations the sum of energy in LLL
subband are similar and resulting in comparable MSE. However in the proposed meth-
ods the error (i.e., MSE) is propagated along the GOP due to due to hierarchical
temporal decomposition along the motion trajectory and the error propagation along
the motion trajectory addressed the issues related to flickering artifacts.
On the other hand for LLH subband, due to temporal filtering the sum of energy is
lesser and the four combinations can be ranked as 032 < 131 < 230 < 002. Hence
the MSE and flickering performance for this temporal subband can be ranked as
032 > 131 > 230 > 002. Therefore while choosing a temporally filtered high frequency
subband, such as LLH, LH or H, the proposed MCTF approach also outperform the
frame by frame embedding in terms of MSE while addressing the flickering issues.
To evaluate the embedding performance we chose three video sequences from different
motion activity, with very low motion (News), medium motion (Foreman) and high
motion (Crew). It is evident that flickering due to frame-by-frame embedding is in-
creasingly prominent in the sequences with lower motion and is successfully addressed
by the proposed MCTF based watermarking approach.
117
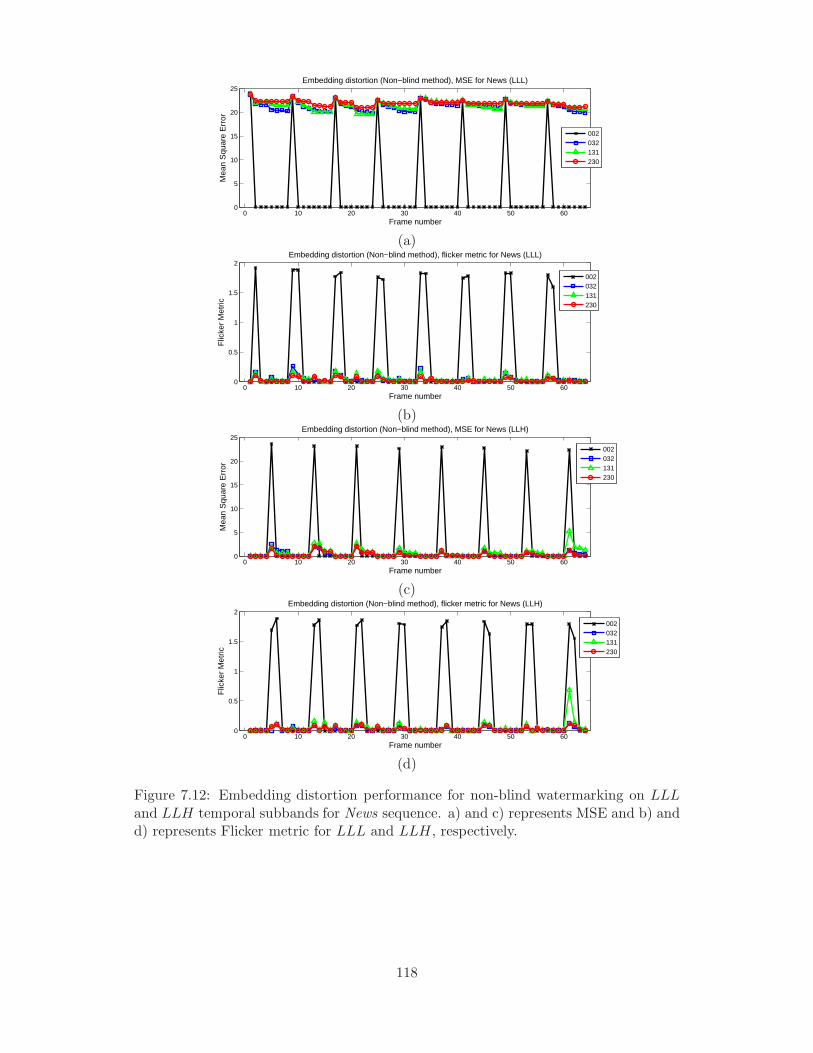
0 10 20 30 40 50 600
5
10
15
20
25
Frame numberM
ean
Squ
are
Err
or
Embedding distortion (Non−blind method), MSE for News (LLL)
002032131230
(a)
0 10 20 30 40 50 600
0.5
1
1.5
2
Frame number
Flic
ker
Met
ric
Embedding distortion (Non−blind method), flicker metric for News (LLL)
002032131230
(b)
0 10 20 30 40 50 600
5
10
15
20
25
Frame number
Mea
n S
quar
e E
rror
Embedding distortion (Non−blind method), MSE for News (LLH)
002032131230
(c)
0 10 20 30 40 50 600
0.5
1
1.5
2
Frame number
Flic
ker
Met
ric
Embedding distortion (Non−blind method), flicker metric for News (LLH)
002032131230
(d)
Figure 7.12: Embedding distortion performance for non-blind watermarking on LLLand LLH temporal subbands for News sequence. a) and c) represents MSE and b) andd) represents Flicker metric for LLL and LLH, respectively.
118
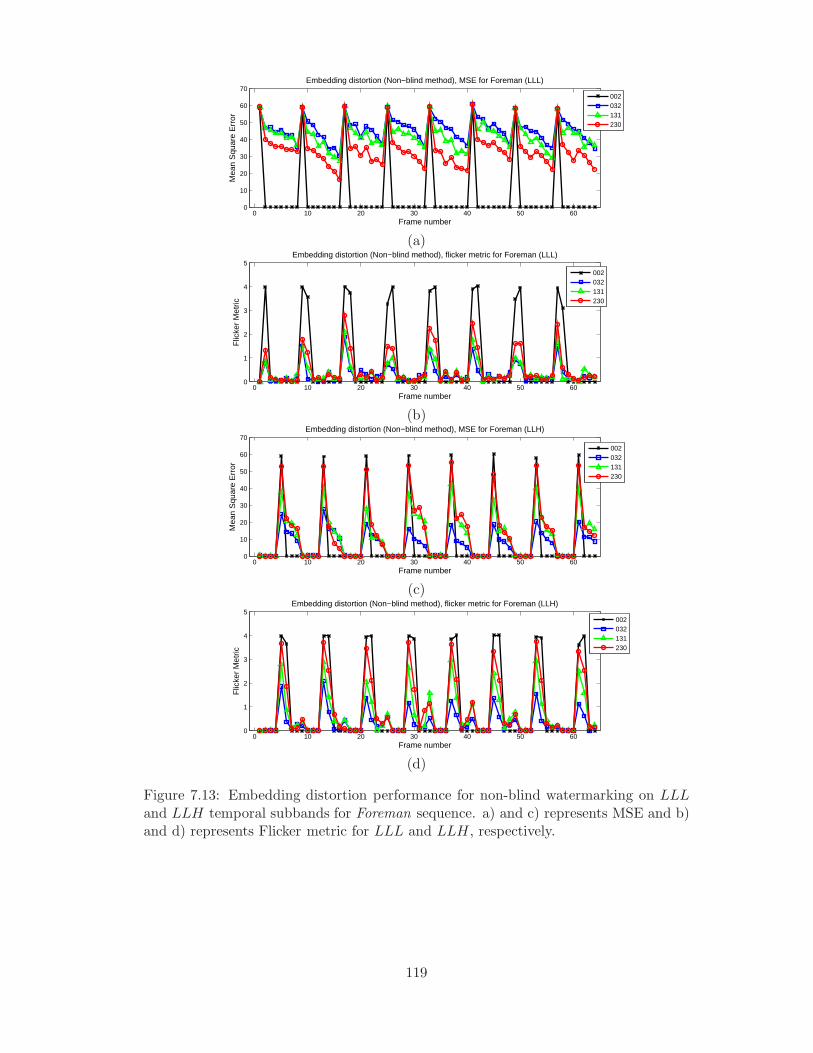
0 10 20 30 40 50 600
10
20
30
40
50
60
70
Frame numberM
ean
Squ
are
Err
or
Embedding distortion (Non−blind method), MSE for Foreman (LLL)
002032131230
(a)
0 10 20 30 40 50 600
1
2
3
4
5
Frame number
Flic
ker
Met
ric
Embedding distortion (Non−blind method), flicker metric for Foreman (LLL)
002032131230
(b)
0 10 20 30 40 50 600
10
20
30
40
50
60
70
Frame number
Mea
n S
quar
e E
rror
Embedding distortion (Non−blind method), MSE for Foreman (LLH)
002032131230
(c)
0 10 20 30 40 50 600
1
2
3
4
5
Frame number
Flic
ker
Met
ric
Embedding distortion (Non−blind method), flicker metric for Foreman (LLH)
002032131230
(d)
Figure 7.13: Embedding distortion performance for non-blind watermarking on LLLand LLH temporal subbands for Foreman sequence. a) and c) represents MSE and b)and d) represents Flicker metric for LLL and LLH, respectively.
119

0 10 20 30 40 50 600
5
10
15
20
Frame numberM
ean
Squ
are
Err
or
Embedding distortion (Non−blind method), MSE for Crew (LLL)
002032131230
(a)
0 10 20 30 40 50 600
0.5
1
1.5
Frame number
Flic
ker
Met
ric
Embedding distortion (Non−blind method), flicker metric for Crew (LLL)
002032131230
(b)
0 10 20 30 40 50 600
5
10
15
20
25
30
Frame number
Mea
n S
quar
e E
rror
Embedding distortion (Non−blind method), MSE for Crew (LLH)
002032131230
(c)
0 10 20 30 40 50 600
0.5
1
1.5
2
2.5
Frame number
Flic
ker
Met
ric
Embedding distortion (Non−blind method), flicker metric for Crew (LLH)
002032131230
(d)
Figure 7.14: Embedding distortion performance for non-blind watermarking on LLLand LLH temporal subbands for Crew sequence. a) and c) represents MSE and b) andd) represents Flicker metric for LLL and LLH, respectively.
120
0 10 20 30 40 50 600
1
2
3
4
5
6
Frame number
Mea
n S
quar
e E
rror
Embedding distortion (blind method), MSE for News (LLL)
002032131230
(a)
0 10 20 30 40 50 600
0.05
0.1
0.15
0.2
Frame number
Flic
ker
Met
ric
Embedding distortion (blind method), flicker metric for News (LLL)
002032131230
(b)
0 10 20 30 40 50 600
1
2
3
4
5
6
Frame number
Mea
n S
quar
e E
rror
Embedding distortion (blind method), MSE for News (LLH)
002032131230
(c)
0 10 20 30 40 50 600
0.05
0.1
0.15
0.2
Frame number
Flic
ker
Met
ric
Embedding distortion (blind method), flicker metric for News (LLH)
002032131230
(d)
Figure 7.15: Embedding distortion performance for blind watermarking on LLL andLLH temporal subbands for News sequence. a) and c) represents MSE and b) and d)represents Flicker metric for LLL and LLH, respectively.
121
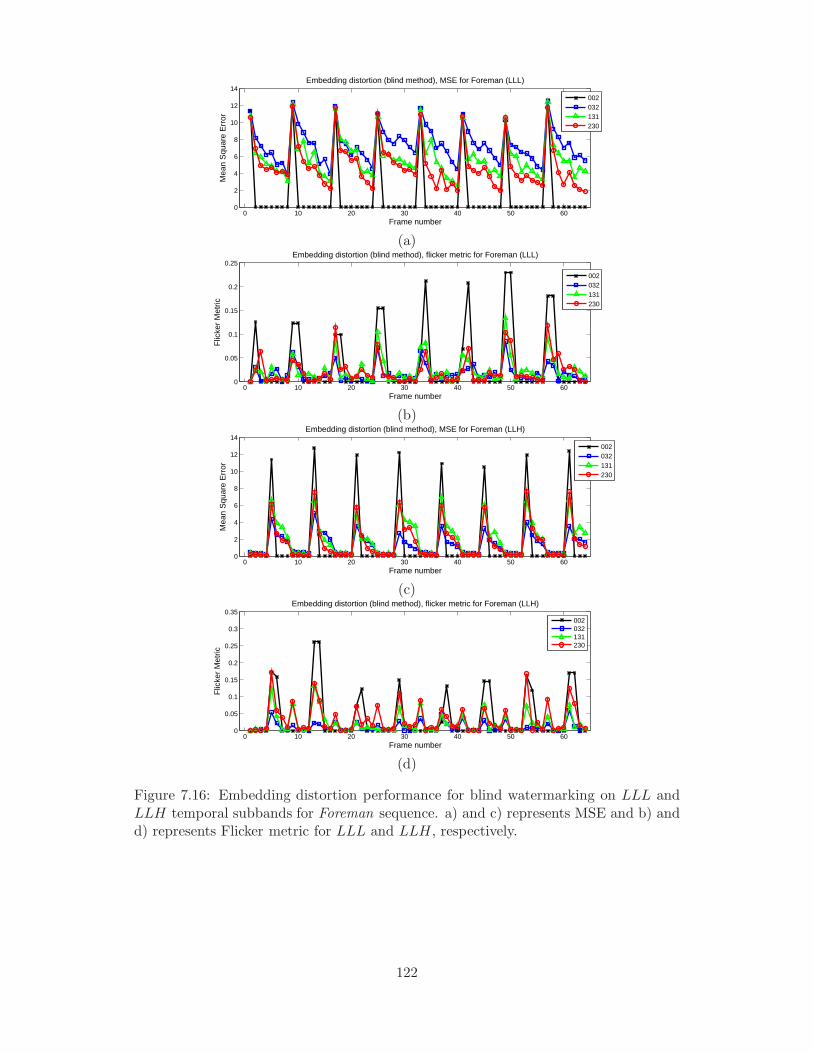
0 10 20 30 40 50 600
2
4
6
8
10
12
14
Frame numberM
ean
Squ
are
Err
or
Embedding distortion (blind method), MSE for Foreman (LLL)
002032131230
(a)
0 10 20 30 40 50 600
0.05
0.1
0.15
0.2
0.25
Frame number
Flic
ker
Met
ric
Embedding distortion (blind method), flicker metric for Foreman (LLL)
002032131230
(b)
0 10 20 30 40 50 600
2
4
6
8
10
12
14
Frame number
Mea
n S
quar
e E
rror
Embedding distortion (blind method), MSE for Foreman (LLH)
002032131230
(c)
0 10 20 30 40 50 600
0.05
0.1
0.15
0.2
0.25
0.3
0.35
Frame number
Flic
ker
Met
ric
Embedding distortion (blind method), flicker metric for Foreman (LLH)
002032131230
(d)
Figure 7.16: Embedding distortion performance for blind watermarking on LLL andLLH temporal subbands for Foreman sequence. a) and c) represents MSE and b) andd) represents Flicker metric for LLL and LLH, respectively.
122
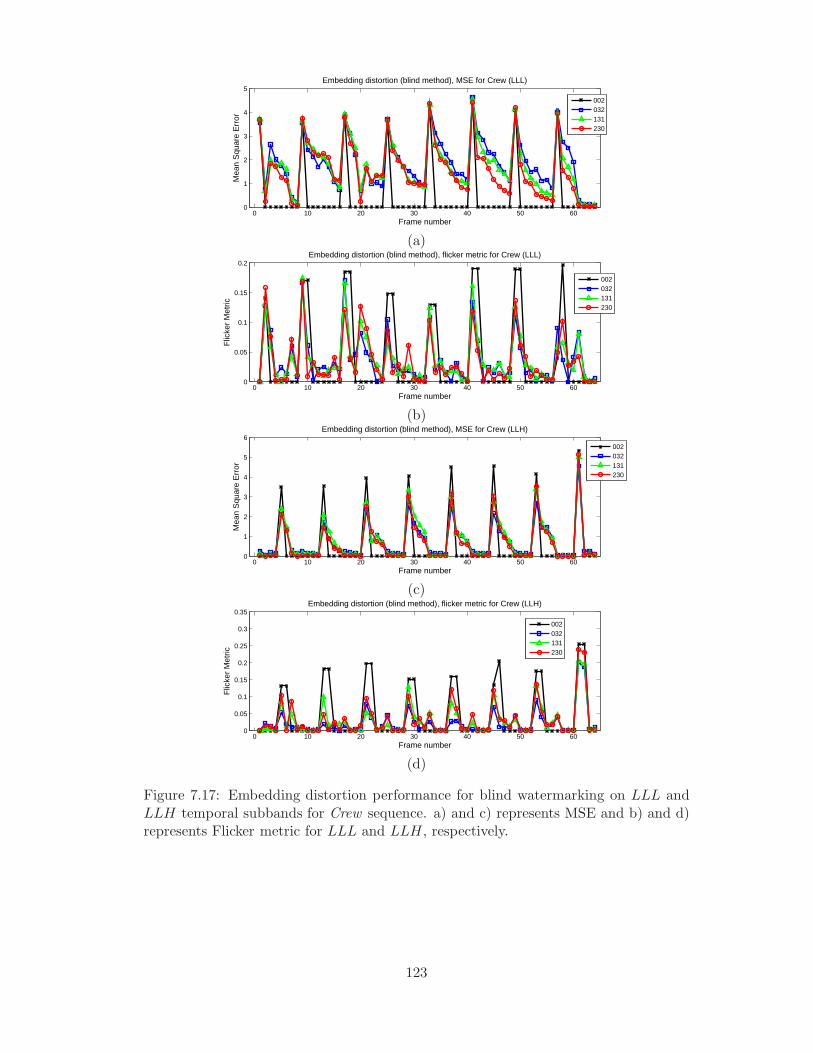
0 10 20 30 40 50 600
1
2
3
4
5
Frame number
Mea
n S
quar
e E
rror
Embedding distortion (blind method), MSE for Crew (LLL)
002032131230
(a)
0 10 20 30 40 50 600
0.05
0.1
0.15
0.2
Frame number
Flic
ker
Met
ric
Embedding distortion (blind method), flicker metric for Crew (LLL)
002032131230
(b)
0 10 20 30 40 50 600
1
2
3
4
5
6
Frame number
Mea
n S
quar
e E
rror
Embedding distortion (blind method), MSE for Crew (LLH)
002032131230
(c)
0 10 20 30 40 50 600
0.05
0.1
0.15
0.2
0.25
0.3
0.35
Frame number
Flic
ker
Met
ric
Embedding distortion (blind method), flicker metric for Crew (LLH)
002032131230
(d)
Figure 7.17: Embedding distortion performance for blind watermarking on LLL andLLH temporal subbands for Crew sequence. a) and c) represents MSE and b) and d)represents Flicker metric for LLL and LLH, respectively.
123
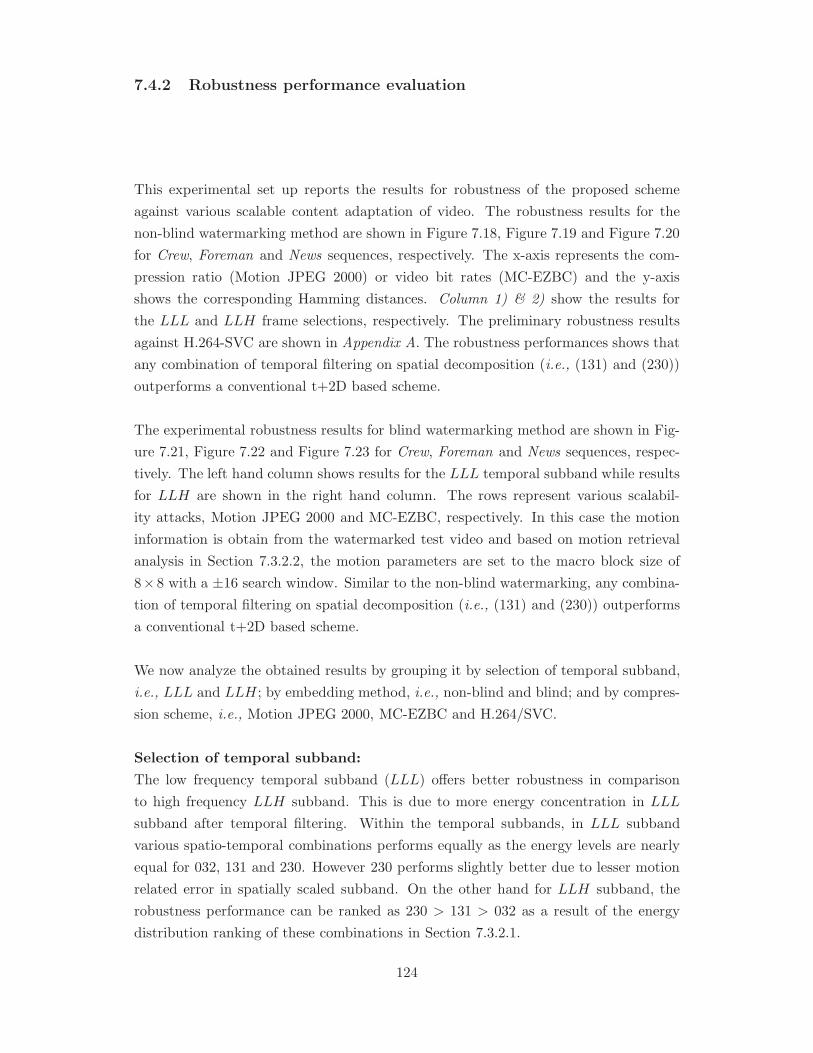
7.4.2 Robustness performance evaluation
This experimental set up reports the results for robustness of the proposed scheme
against various scalable content adaptation of video. The robustness results for the
non-blind watermarking method are shown in Figure 7.18, Figure 7.19 and Figure 7.20
for Crew, Foreman and News sequences, respectively. The x-axis represents the com-
pression ratio (Motion JPEG 2000) or video bit rates (MC-EZBC) and the y-axis
shows the corresponding Hamming distances. Column 1) & 2) show the results for
the LLL and LLH frame selections, respectively. The preliminary robustness results
against H.264-SVC are shown in Appendix A. The robustness performances shows that
any combination of temporal filtering on spatial decomposition (i.e., (131) and (230))
outperforms a conventional t+2D based scheme.
The experimental robustness results for blind watermarking method are shown in Fig-
ure 7.21, Figure 7.22 and Figure 7.23 for Crew, Foreman and News sequences, respec-
tively. The left hand column shows results for the LLL temporal subband while results
for LLH are shown in the right hand column. The rows represent various scalabil-
ity attacks, Motion JPEG 2000 and MC-EZBC, respectively. In this case the motion
information is obtain from the watermarked test video and based on motion retrieval
analysis in Section 7.3.2.2, the motion parameters are set to the macro block size of
8×8 with a ±16 search window. Similar to the non-blind watermarking, any combina-
tion of temporal filtering on spatial decomposition (i.e., (131) and (230)) outperforms
a conventional t+2D based scheme.
We now analyze the obtained results by grouping it by selection of temporal subband,
i.e., LLL and LLH; by embedding method, i.e., non-blind and blind; and by compres-
sion scheme, i.e., Motion JPEG 2000, MC-EZBC and H.264/SVC.
Selection of temporal subband:
The low frequency temporal subband (LLL) offers better robustness in comparison
to high frequency LLH subband. This is due to more energy concentration in LLL
subband after temporal filtering. Within the temporal subbands, in LLL subband
various spatio-temporal combinations performs equally as the energy levels are nearly
equal for 032, 131 and 230. However 230 performs slightly better due to lesser motion
related error in spatially scaled subband. On the other hand for LLH subband, the
robustness performance can be ranked as 230 > 131 > 032 as a result of the energy
distribution ranking of these combinations in Section 7.3.2.1.
124
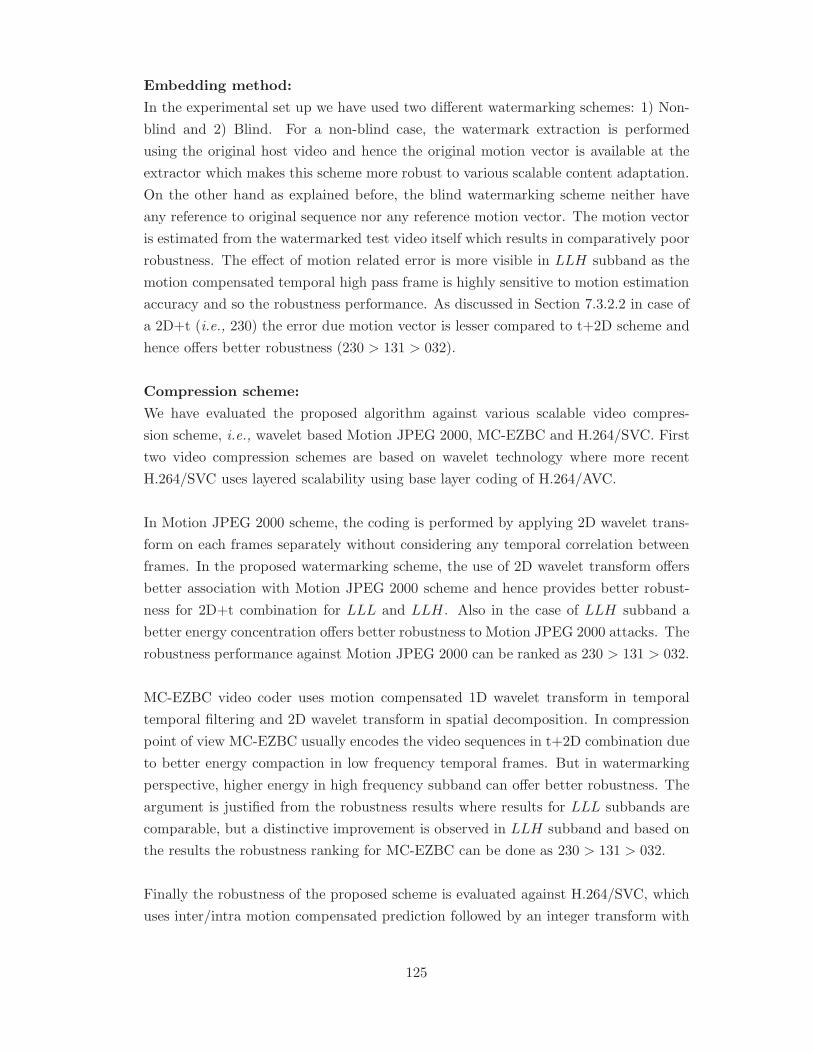
Embedding method:
In the experimental set up we have used two different watermarking schemes: 1) Non-
blind and 2) Blind. For a non-blind case, the watermark extraction is performed
using the original host video and hence the original motion vector is available at the
extractor which makes this scheme more robust to various scalable content adaptation.
On the other hand as explained before, the blind watermarking scheme neither have
any reference to original sequence nor any reference motion vector. The motion vector
is estimated from the watermarked test video itself which results in comparatively poor
robustness. The effect of motion related error is more visible in LLH subband as the
motion compensated temporal high pass frame is highly sensitive to motion estimation
accuracy and so the robustness performance. As discussed in Section 7.3.2.2 in case of
a 2D+t (i.e., 230) the error due motion vector is lesser compared to t+2D scheme and
hence offers better robustness (230 > 131 > 032).
Compression scheme:
We have evaluated the proposed algorithm against various scalable video compres-
sion scheme, i.e., wavelet based Motion JPEG 2000, MC-EZBC and H.264/SVC. First
two video compression schemes are based on wavelet technology where more recent
H.264/SVC uses layered scalability using base layer coding of H.264/AVC.
In Motion JPEG 2000 scheme, the coding is performed by applying 2D wavelet trans-
form on each frames separately without considering any temporal correlation between
frames. In the proposed watermarking scheme, the use of 2D wavelet transform offers
better association with Motion JPEG 2000 scheme and hence provides better robust-
ness for 2D+t combination for LLL and LLH. Also in the case of LLH subband a
better energy concentration offers better robustness to Motion JPEG 2000 attacks. The
robustness performance against Motion JPEG 2000 can be ranked as 230 > 131 > 032.
MC-EZBC video coder uses motion compensated 1D wavelet transform in temporal
temporal filtering and 2D wavelet transform in spatial decomposition. In compression
point of view MC-EZBC usually encodes the video sequences in t+2D combination due
to better energy compaction in low frequency temporal frames. But in watermarking
perspective, higher energy in high frequency subband can offer better robustness. The
argument is justified from the robustness results where results for LLL subbands are
comparable, but a distinctive improvement is observed in LLH subband and based on
the results the robustness ranking for MC-EZBC can be done as 230 > 131 > 032.
Finally the robustness of the proposed scheme is evaluated against H.264/SVC, which
uses inter/intra motion compensated prediction followed by an integer transform with
125
similar properties of DCT transform. Although the watermarking and video coding
scheme does not share any common technology or transform, the results provide ac-
ceptable robustness. However for a blind watermarking scheme in LLH subband,
proposed schemes performs poorly due to blind motion estimation. Similar to previous
robustness results, based on energy distribution and motion retrieval argument, here
the spatio-temporal combinations can be ranked as 230 > 131 > 032. In a specific
example case H.264/SVC usually gives preference to intra prediction to the sequences
with low global or local motion, as in News sequence and hence exception in robustness
performance to H.264/SVC is noticed for the proposed scheme.
Based on the above discussion, due to the close association between the proposed
scheme and MC-EZBC, the robustness of the proposed scheme offers best performance
against MC-EZBC based content adaptation. To conclude this discussion, we suggest
that, a choice of 2D+t based watermarking scheme improves the imperceptibility and
the robustness performance in a video watermarking scenario for a non-blind as well as
a blind watermarking algorithm. In the next section we extend the image watermarking
robustness model into video watermarking framework to propose watermarking with
enhanced robustness against scalable compression.
126

5 10 15 20 25 30 35 40 45 500
0.02
0.04
0.06
0.08
0.1
0.12
Compression ratio
Ham
min
g di
stan
ce
Robustness (non-blind) against Motion JPEG 2000 (LLL): Crew
032131230
5 10 15 20 25 30 35 40 45 500
0.02
0.04
0.06
0.08
0.1
0.12
0.14
Compression ratio
Ham
min
g di
stan
ce
Robustness (non-blind) against Motion JPEG 2000 (LLH): Crew
032131230
0500100015002000250030000
0.02
0.04
0.06
0.08
0.1
0.12
0.14
0.16
0.18
0.2
Bit rate (kbps)
Ham
min
g di
stan
ce
Robustness (non-blind) against MC-EZBC (LLL): Crew
032131230
0500100015002000250030000
0.05
0.1
0.15
0.2
0.25
0.3
0.35
Bit rate (kbps)
Ham
min
g di
stan
ce
Robustness (non-blind) against MC-EZBC (LLH): Crew
032131230
Figure 7.18: Robustness performance of non-blind watermarking scheme for Crew se-quence. Row 1) & 2) show robustness against Motion JPEG 2000 and MC-EZBC,respectively. Column 1) & 2) represents the embedding on temporal subbands LLL &LLH, respectively.
127
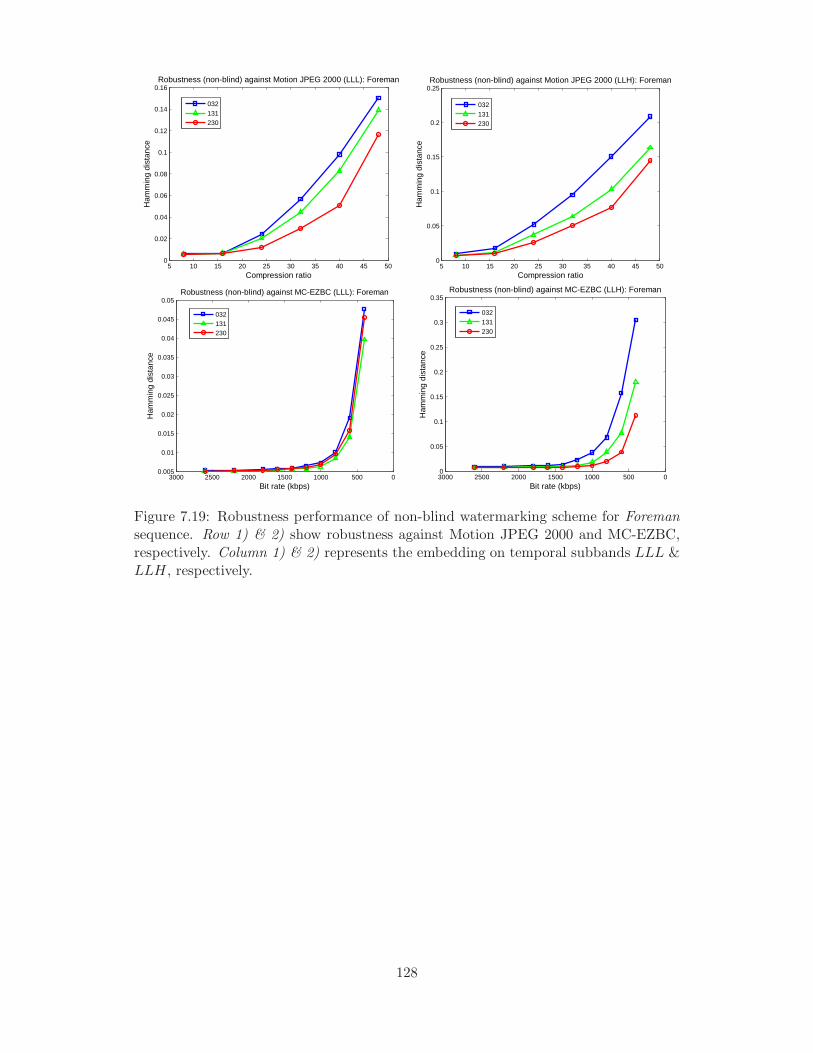
5 10 15 20 25 30 35 40 45 500
0.02
0.04
0.06
0.08
0.1
0.12
0.14
0.16
Compression ratio
Ham
min
g di
stan
ce
Robustness (non-blind) against Motion JPEG 2000 (LLL): Foreman
032131230
5 10 15 20 25 30 35 40 45 500
0.05
0.1
0.15
0.2
0.25
Compression ratio
Ham
min
g di
stan
ce
Robustness (non-blind) against Motion JPEG 2000 (LLH): Foreman
032131230
0500100015002000250030000.005
0.01
0.015
0.02
0.025
0.03
0.035
0.04
0.045
0.05
Bit rate (kbps)
Ham
min
g di
stan
ce
Robustness (non-blind) against MC-EZBC (LLL): Foreman
032131230
0500100015002000250030000
0.05
0.1
0.15
0.2
0.25
0.3
0.35
Bit rate (kbps)
Ham
min
g di
stan
ce
Robustness (non-blind) against MC-EZBC (LLH): Foreman
032131230
Figure 7.19: Robustness performance of non-blind watermarking scheme for Foremansequence. Row 1) & 2) show robustness against Motion JPEG 2000 and MC-EZBC,respectively. Column 1) & 2) represents the embedding on temporal subbands LLL &LLH, respectively.
128
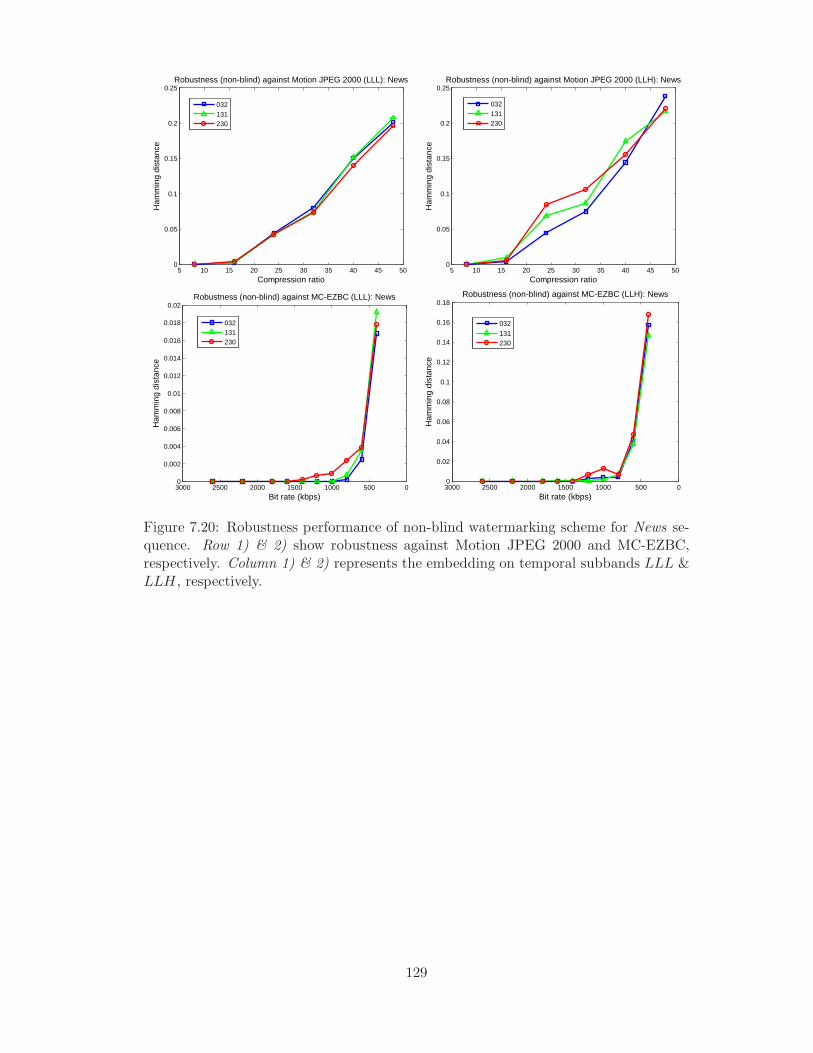
5 10 15 20 25 30 35 40 45 500
0.05
0.1
0.15
0.2
0.25
Compression ratio
Ham
min
g di
stan
ce
Robustness (non-blind) against Motion JPEG 2000 (LLL): News
032131230
5 10 15 20 25 30 35 40 45 500
0.05
0.1
0.15
0.2
0.25
Compression ratio
Ham
min
g di
stan
ce
Robustness (non-blind) against Motion JPEG 2000 (LLH): News
032131230
0500100015002000250030000
0.002
0.004
0.006
0.008
0.01
0.012
0.014
0.016
0.018
0.02
Bit rate (kbps)
Ham
min
g di
stan
ce
Robustness (non-blind) against MC-EZBC (LLL): News
032131230
0500100015002000250030000
0.02
0.04
0.06
0.08
0.1
0.12
0.14
0.16
0.18
Bit rate (kbps)
Ham
min
g di
stan
ce
Robustness (non-blind) against MC-EZBC (LLH): News
032131230
Figure 7.20: Robustness performance of non-blind watermarking scheme for News se-quence. Row 1) & 2) show robustness against Motion JPEG 2000 and MC-EZBC,respectively. Column 1) & 2) represents the embedding on temporal subbands LLL &LLH, respectively.
129
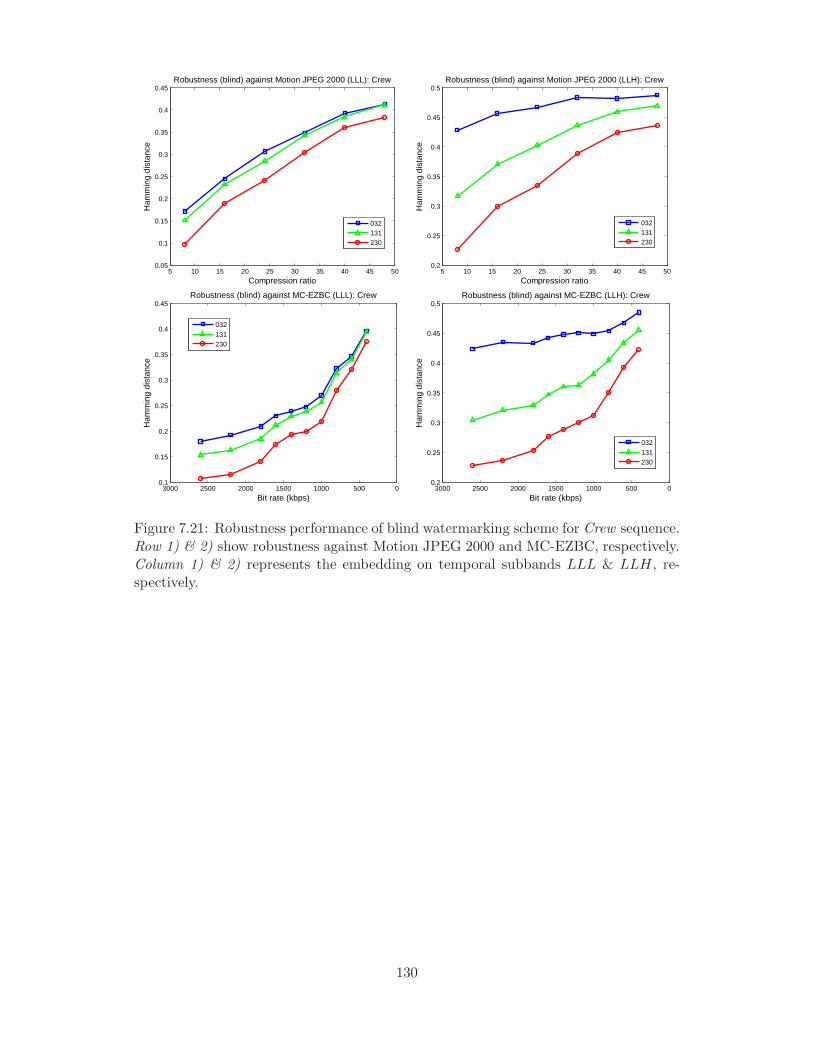
5 10 15 20 25 30 35 40 45 500.05
0.1
0.15
0.2
0.25
0.3
0.35
0.4
0.45
Compression ratio
Ham
min
g di
stan
ce
Robustness (blind) against Motion JPEG 2000 (LLL): Crew
032131230
5 10 15 20 25 30 35 40 45 500.2
0.25
0.3
0.35
0.4
0.45
0.5
Compression ratio
Ham
min
g di
stan
ce
Robustness (blind) against Motion JPEG 2000 (LLH): Crew
032131230
0500100015002000250030000.1
0.15
0.2
0.25
0.3
0.35
0.4
0.45
Bit rate (kbps)
Ham
min
g di
stan
ce
Robustness (blind) against MC-EZBC (LLL): Crew
032131230
0500100015002000250030000.2
0.25
0.3
0.35
0.4
0.45
0.5
Bit rate (kbps)
Ham
min
g di
stan
ce
Robustness (blind) against MC-EZBC (LLH): Crew
032131230
Figure 7.21: Robustness performance of blind watermarking scheme for Crew sequence.Row 1) & 2) show robustness against Motion JPEG 2000 and MC-EZBC, respectively.Column 1) & 2) represents the embedding on temporal subbands LLL & LLH, re-spectively.
130

5 10 15 20 25 30 35 40 45 500.05
0.1
0.15
0.2
0.25
0.3
0.35
0.4
Compression ratio
Ham
min
g di
stan
ce
Robustness (blind) against Motion JPEG 2000 (LLL): Foreman
032131230
5 10 15 20 25 30 35 40 45 500.25
0.3
0.35
0.4
0.45
0.5
Compression ratio
Ham
min
g di
stan
ce
Robustness (blind) against Motion JPEG 2000 (LLH): Foreman
032131230
0500100015002000250030000.05
0.1
0.15
0.2
0.25
0.3
Bit rate (kbps)
Ham
min
g di
stan
ce
Robustness (blind) against MC-EZBC (LLL): Foreman
032131230
0500100015002000250030000.25
0.3
0.35
0.4
0.45
0.5
Bit rate (kbps)
Ham
min
g di
stan
ce
Robustness (blind) against MC-EZBC (LLH): Foreman
032131230
Figure 7.22: Robustness performance of blind watermarking scheme for Foreman se-quence. Row 1) & 2) show robustness against Motion JPEG 2000 and MC-EZBC,respectively. Column 1) & 2) represents the embedding on temporal subbands LLL &LLH, respectively.
131

5 10 15 20 25 30 35 40 45 500.1
0.15
0.2
0.25
0.3
0.35
0.4
0.45
0.5
Compression ratio
Ham
min
g di
stan
ce
Robustness (blind) against Motion JPEG 2000 (LLL): News
032131230
5 10 15 20 25 30 35 40 45 500.38
0.4
0.42
0.44
0.46
0.48
0.5
Compression ratio
Ham
min
g di
stan
ce
Robustness (blind) against Motion JPEG 2000 (LLH): News
032131230
0500100015002000250030000.05
0.1
0.15
0.2
0.25
0.3
Bit rate (kbps)
Ham
min
g di
stan
ce
Robustness (blind) against MC-EZBC (LLL): News
032131230
0500100015002000250030000.36
0.38
0.4
0.42
0.44
0.46
0.48
0.5
Bit rate (kbps)
Ham
min
g di
stan
ce
Robustness (blind) against MC-EZBC (LLH): News
032131230
Figure 7.23: Robustness performance of blind watermarking scheme for News sequence.Row 1) & 2) show robustness against Motion JPEG 2000 and MC-EZBC, respectively.Column 1) & 2) represents the embedding on temporal subbands LLL & LLH, re-spectively.
132
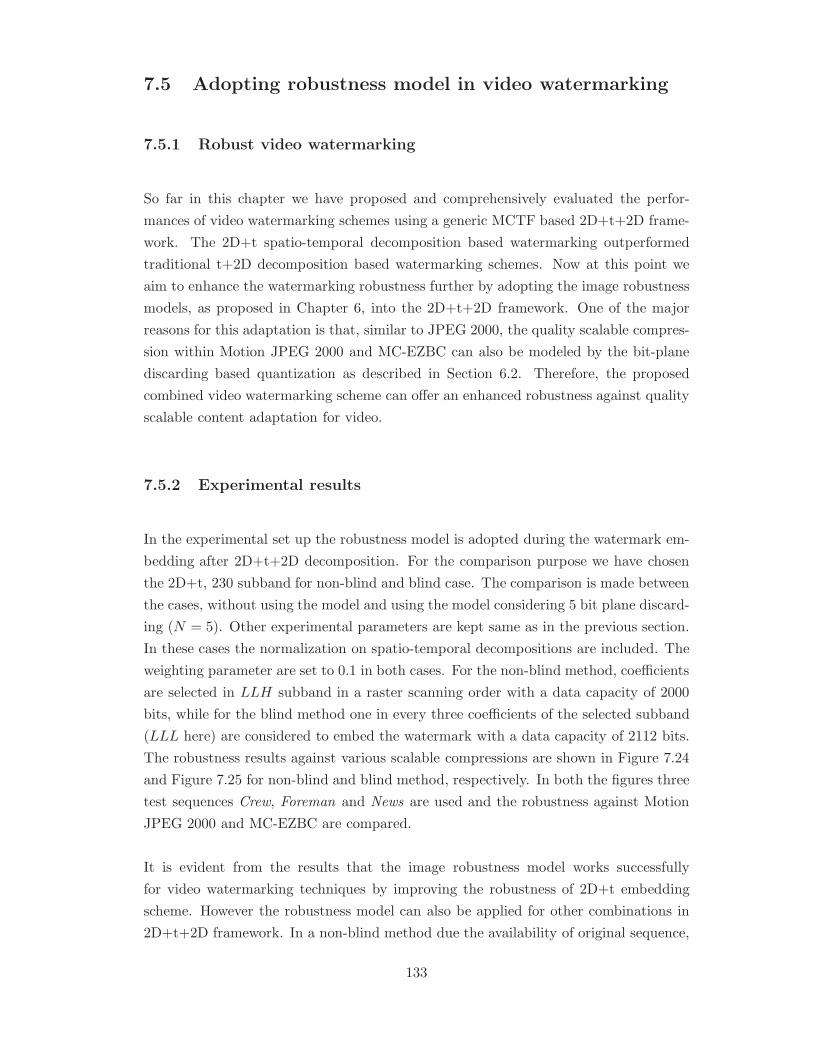
7.5 Adopting robustness model in video watermarking
7.5.1 Robust video watermarking
So far in this chapter we have proposed and comprehensively evaluated the perfor-
mances of video watermarking schemes using a generic MCTF based 2D+t+2D frame-
work. The 2D+t spatio-temporal decomposition based watermarking outperformed
traditional t+2D decomposition based watermarking schemes. Now at this point we
aim to enhance the watermarking robustness further by adopting the image robustness
models, as proposed in Chapter 6, into the 2D+t+2D framework. One of the major
reasons for this adaptation is that, similar to JPEG 2000, the quality scalable compres-
sion within Motion JPEG 2000 and MC-EZBC can also be modeled by the bit-plane
discarding based quantization as described in Section 6.2. Therefore, the proposed
combined video watermarking scheme can offer an enhanced robustness against quality
scalable content adaptation for video.
7.5.2 Experimental results
In the experimental set up the robustness model is adopted during the watermark em-
bedding after 2D+t+2D decomposition. For the comparison purpose we have chosen
the 2D+t, 230 subband for non-blind and blind case. The comparison is made between
the cases, without using the model and using the model considering 5 bit plane discard-
ing (N = 5). Other experimental parameters are kept same as in the previous section.
In these cases the normalization on spatio-temporal decompositions are included. The
weighting parameter are set to 0.1 in both cases. For the non-blind method, coefficients
are selected in LLH subband in a raster scanning order with a data capacity of 2000
bits, while for the blind method one in every three coefficients of the selected subband
(LLL here) are considered to embed the watermark with a data capacity of 2112 bits.
The robustness results against various scalable compressions are shown in Figure 7.24
and Figure 7.25 for non-blind and blind method, respectively. In both the figures three
test sequences Crew, Foreman and News are used and the robustness against Motion
JPEG 2000 and MC-EZBC are compared.
It is evident from the results that the image robustness model works successfully
for video watermarking techniques by improving the robustness of 2D+t embedding
scheme. However the robustness model can also be applied for other combinations in
2D+t+2D framework. In a non-blind method due the availability of original sequence,
133
the motion vector was unaffected by the robustness model and hence outperformed the
cases which did not consider the model. On the other hand, in a blind case, the use
of robustness model increases the embedding distortion (as described in Chapter 6)
resulting in distortion in motion vector too, which in turn, reduces the robustness im-
provement in this case. Ideally, the robustness model assumes same spatio-temporal
decomposition parameters in embedding as well compression algorithm, where in this
experimental set, the embedding scheme is used independent of the compression al-
gorithms. Therefore we can conclude that the robustness enhancement model can
perform more efficiently when used within the compression algorithms, which uses bit
plane discarding model and preserve motion vector information.
7.6 Conclusions
In this chapter, a flexible generalized motion compensated temporal-spatial subband
decomposition scheme, based on the MMCTF for video watermarking is presented.
The MCTF was modified by taking into account the motion trajectory into obtain-
ing an efficient update step. The embedding distortion performance evaluated using
both MSE and flicker difference metric, shows superior performance for the MMCTF
driven 2D+t+2D subband domain watermarking as opposed to frame-by-frame 2D
wavelet domain watermarking which does not take motion into account. The proposed
subband decomposition also provides low complexity as MCTF is performed only on
subbands where the watermark is embedded. The robustness performance against scal-
able coding based compressions attacks, including Motion JPEG 2000, MC-EZBC and
preliminary results for H.264-SVC (scalable extension), are also evaluated. The pro-
posed 2D+t based video watermarking scheme within 2D+t+2D filtering framework
outperforms conventional t+2D watermarking schemes in a non-blind as well as a blind
watermarking scenario. This video watermarking technique is further extended using
the image robustness model to enhance the robustness against scalable compression.
134
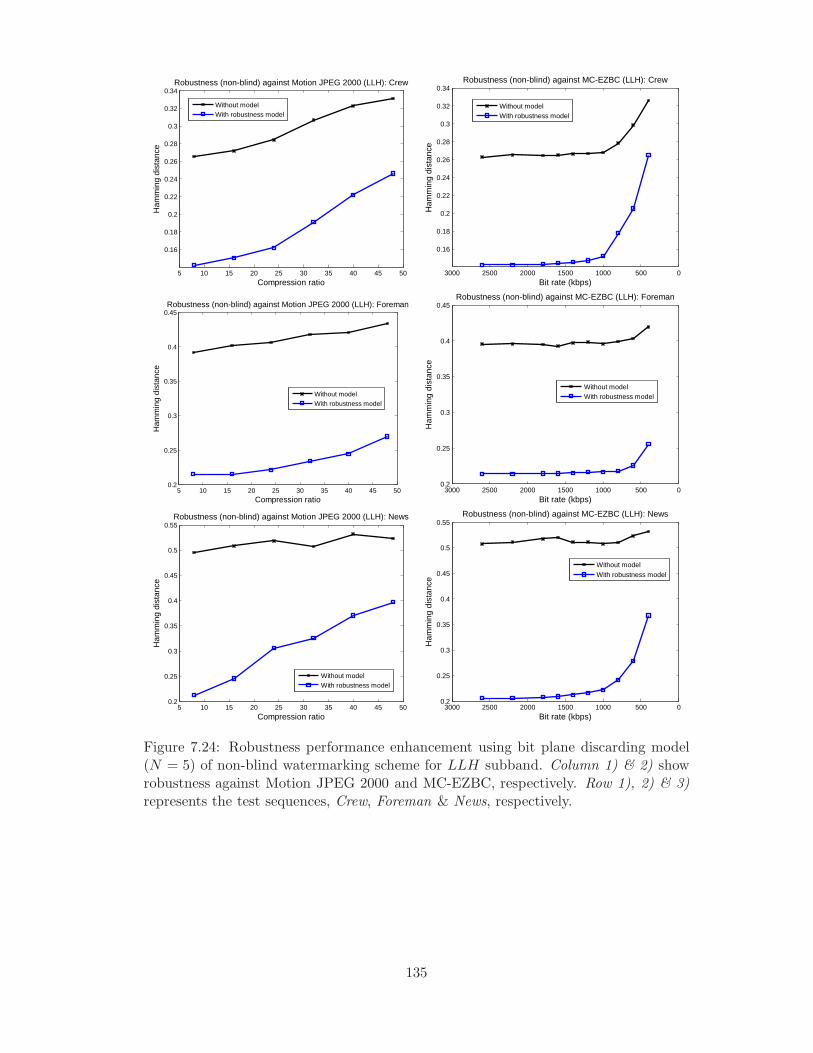
5 10 15 20 25 30 35 40 45 50
0.16
0.18
0.2
0.22
0.24
0.26
0.28
0.3
0.32
0.34
Compression ratio
Ham
min
g di
stan
ce
Robustness (non-blind) against Motion JPEG 2000 (LLH): Crew
Without modelWith robustness model
050010001500200025003000
0.16
0.18
0.2
0.22
0.24
0.26
0.28
0.3
0.32
0.34
Bit rate (kbps)
Ham
min
g di
stan
ce
Robustness (non-blind) against MC-EZBC (LLH): Crew
Without modelWith robustness model
5 10 15 20 25 30 35 40 45 500.2
0.25
0.3
0.35
0.4
0.45
Compression ratio
Ham
min
g di
stan
ce
Robustness (non-blind) against Motion JPEG 2000 (LLH): Foreman
Without modelWith robustness model
0500100015002000250030000.2
0.25
0.3
0.35
0.4
0.45
Bit rate (kbps)
Ham
min
g di
stan
ce
Robustness (non-blind) against MC-EZBC (LLH): Foreman
Without modelWith robustness model
5 10 15 20 25 30 35 40 45 500.2
0.25
0.3
0.35
0.4
0.45
0.5
0.55
Compression ratio
Ham
min
g di
stan
ce
Robustness (non-blind) against Motion JPEG 2000 (LLH): News
Without modelWith robustness model
0500100015002000250030000.2
0.25
0.3
0.35
0.4
0.45
0.5
0.55
Bit rate (kbps)
Ham
min
g di
stan
ce
Robustness (non-blind) against MC-EZBC (LLH): News
Without modelWith robustness model
Figure 7.24: Robustness performance enhancement using bit plane discarding model(N = 5) of non-blind watermarking scheme for LLH subband. Column 1) & 2) showrobustness against Motion JPEG 2000 and MC-EZBC, respectively. Row 1), 2) & 3)represents the test sequences, Crew, Foreman & News, respectively.
135

5 10 15 20 25 30 35 40 45 500.1
0.15
0.2
0.25
0.3
0.35
0.4
0.45
0.5
Compression ratio
Ham
min
g di
stan
ce
Robustness (blind) against Motion JPEG 2000 (LLL): Crew
Without modelWith robustness model (N=5)
0500100015002000250030000.1
0.15
0.2
0.25
0.3
0.35
0.4
0.45
0.5
Bit rate (kbps)
Ham
min
g di
stan
ce
Robustness (blind) against MC-EZBC (LLL): Crew
Without modelWith robustness model (N=5)
5 10 15 20 25 30 35 40 45 500.1
0.15
0.2
0.25
0.3
0.35
0.4
0.45
0.5
Compression ratio
Ham
min
g di
stan
ce
Robustness (blind) against Motion JPEG 2000 (LLL): Foreman
Without modelWith robustness model (N=5)
0500100015002000250030000.05
0.1
0.15
0.2
0.25
0.3
0.35
0.4
Bit rate (kbps)
Ham
min
g di
stan
ce
Robustness (blind) against MC-EZBC (LLL): Foreman
Without modelWith robustness model (N=5)
5 10 15 20 25 30 35 40 45 500.1
0.15
0.2
0.25
0.3
0.35
0.4
0.45
0.5
Compression ratio
Ham
min
g di
stan
ce
Robustness (blind) against Motion JPEG 2000 (LLL): News
Without modelWith robustness model (N=5)
0500100015002000250030000.05
0.1
0.15
0.2
0.25
0.3
0.35
0.4
Bit rate (kbps)
Ham
min
g di
stan
ce
Robustness (blind) against MC-EZBC (LLL): News
Without modelWith robustness model (N=5)
Figure 7.25: Robustness performance enhancement using bit plane discarding model(N = 5) of blind watermarking scheme for LLL subband. Column 1) & 2) showrobustness against Motion JPEG 2000 and MC-EZBC, respectively. Row 1), 2) & 3)represents the test sequences, Crew, Foreman & News, respectively.
136
Chapter 8
Distortion Constrained
Robustness Scalable
Watermarking
In the previous chapters of this thesis we discussed about the embedding distortion
and the robustness to quality scalable image and video coding, which are two com-
plementary watermarking requirements. In this chapter we introduce a novel concept
of scalable blind watermarking to generate a distortion-constrained robustness scalable
watermarked image code-stream which consists of hierarchically nested joint distortion-
robustness coding atoms.
8.1 Introduction
Inspired by image coding standard JPEG2000 and video coding scheme MC-EZBC,
this work addresses two long due watermarking questions: 1) Can we define a wa-
termark embedding-rate vs. overall embedding-distortion curve? and 2) Can we
formulate a scalable embedding-robustness relationship graph which can provide hier-
archically improved robustness against an image or video processing or compression
scheme? In answering these questions, we recall the state of the art analysis in Chap-
ter 3, where various traditional wavelet based image and video watermarking schemes
are generalized and dissected into a set of processes. The performance metrics are
defined into two categories: 1) Embedding performance (measured by data-capacity
137
and embedding-distortion such as PSNR) and 2) Robustness (measured by similarity
correlation or Hamming distance (Bit Error Rate)). In these traditional watermarking
methods, these metrics are often mutually exclusive and therefore measured and rep-
resented separately. On the contrary these metrics influence each other’s performance
and in this chapter we aim to combine them to propose a distortion constrained ro-
bustness scalable watermarking scheme. Therefore it is also important to formulate a
common mutually inclusive space for the performance measures.
The concept of scalable watermarking is particularly useful for watermarking for scal-
able coded image and video where the watermark can also be scaled according to the
heterogenous network capacity and end user’s requirement for a target application. For
example, for a high bandwidth network and a high resolution display, highly imper-
ceptible but less robust watermarked image or video can be transmitted, as in this
scenario, highly imperceptible media is desirable and the watermark can be extracted
reliably due to lesser compression, whereas, for a low capacity network and low reso-
lution display, the distribution server can choose highly robust watermarking stream,
where, due to higher compression the watermarking imperceptibility is less important
but high robustness is required for a reliable watermark extraction. Similarly, based on
any other combinations of the network’s capability and user’s requirement, the scalable
watermarked media code-stream can be truncated and distributed accordingly.
With the increased use of scalable coded media, such scalable watermarking concept is
very important, but a little or no work has been proposed so far in the current literature.
Available most common such algorithms are proposed either as joint progressive scal-
able watermarking and coding scheme [34,35] or efficient coefficient selection methods
which are robust against resolution or quality scalable attacks [36,37]. These algorithms
primarily focused on two main robustness issues [38]: 1) detection of watermark after
acceptable scalable compression and 2) graceful improvement of extracted watermark
as more quality or resolution layers received at the image decoder.
On the contrary, we propose a novel scalable watermarking concept, based on distortion
constrained watermarked code-stream to generate watermarked image / video with de-
sired distortion robustness requirements. This work addresses the tow-fold problem of
1) obtaining the least distortion at a given watermark embedding rate and 2) achieving
the best robustness in a scalable fashion by hierarchically encoding lower and higher
embedded code-atoms, respectively. In designing the algorithm, we have considered
the propositions for embedding distortion in Chapter 5, i.e., in order to minimize the
distortion, the coefficient modification must be minimized; and the concept of qual-
ity scalability using bit plane discarding model (as discussed in Chapter 6) in order
138
to improve the robustness against scalable content adaptation. The objectives of the
proposed scheme, are:
• Creating a common performance metric to represent data-capacity and embed-
ding distortion.
• Proposing a new watermarking algorithm which incorporates the bit plane dis-
carding model, used in quality scaling based content adaptation in scalable coded
image and video.
• Obtaining best robustness at a given embedding distortion rate.
• Scalable embedded code-stream generation using hierarchically nested joint distortion-
robustness coding atoms.
• The code-stream should be allowed to be truncated at any distortion-robustness
atom level to generate the watermarked image with the desired distortion-robustness
requirements.
To fulfill the requirements of the said objectives, we introduced a new wavelet domain
binary tree guided rules-based blind watermarking algorithm. The universal blind ex-
tractor of this algorithm is capable of extracting watermark data from the watermarked
images, created using any truncated code-stream. The code-stream mentioned in this
chapter refers to the joint watermarked wavelet coefficient stream.
As no such idea has been explored yet in the literature, in order to quantify the work
in this chapter we have introduced a new embedding distortion metric and reported
the robustness results in a hierarchical fashion to support the claim. However, further
evaluation can be done in future according to the potential applications such as in
authentication of multimedia streaming.
8.2 Scalable watermarking
In this section, the design and development of the proposed scalable watermarking
scheme is discussed. Firstly, the new wavelet domain binary tree guided watermarking
algorithm is discussed and then it is used in developing the scalable watermarking
system.
139
8.2.1 Proposed algorithm
In proposing the new algorithm we aim to address two issues related to the main theme
of the thesis, robust watermarking techniques for scalable coded image and video: 1) a
robust watermarking technique which considers bit plane discarding model in scalable
compression and 2) scalability of the watermarking. As discussed earlier the traditional
watermarking algorithms fail to comply with the design requirements of the proposed
scalable watermarking scheme. Therefore we introduce a new watermarking algorithm
which satisfies the above mentioned requirements by creating watermarked image /
video code-stream atoms and allows quantitative embedding-distortion measurement
at individual atom level.
The proposed wavelet-based algorithm follows a similar system block diagrams as shown
in Figure 3.1. The watermark embedding is performed on the coefficients generated
after FDWT. The embedding algorithm follows a non-uniform quantization based index
modulation. The embedding process is divided into two parts: 1) Quantized binary
tree formation and 2) Watermark embedding by index modulation.
8.2.1.1 Tree formation
In this step, all selected coefficients are recursively quantized to form a binary tree.
Firstly the selected wavelet coefficient (C) is indexed (bi) as 0 or 1 using an initial
quantizer λ:
bi =
⌊ |C|λ/2i
⌋%2, i ∈ 0, 1, 2, 3..., (8.1)
where % denotes the modulo operation.
Assuming n =⌊|C|λ
⌋, we can identify the position of C between the quantized cluster
(n) and (n + 1) which can alternatively described as bit plane clusters as shown in
Figure 8.1. The selected coefficient C is then further quantized more precisely within a
smaller cluster using a smaller quantizer λ/2 and corresponding index is calculated as:
b1 =⌊|C|λ/2
⌋%2. The index tree formation is continued recursively by scaling λ value by
2, until λ/2i ≥ 1. During this tree formation process the Sign of the coefficients are
preserved separately.
Now based on the calculated index value at various quantization step a binary tree
140
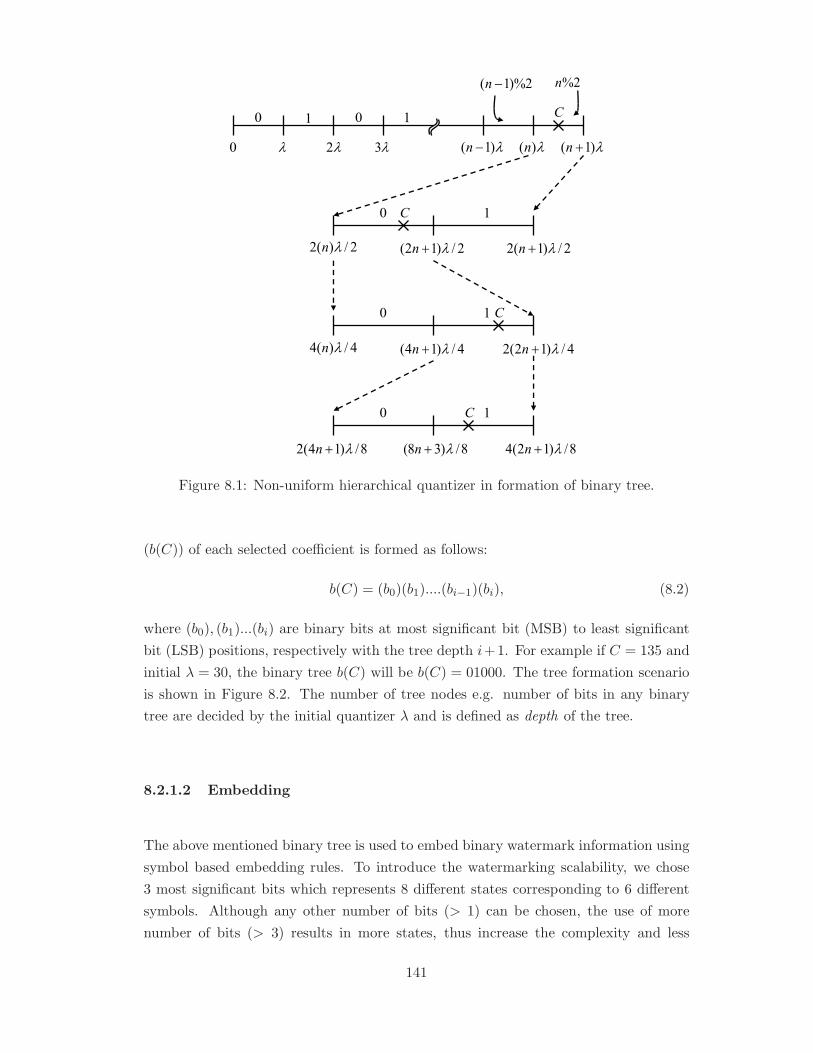
Figure 8.1: Non-uniform hierarchical quantizer in formation of binary tree.
(b(C)) of each selected coefficient is formed as follows:
b(C) = (b0)(b1)....(bi−1)(bi), (8.2)
where (b0), (b1)...(bi) are binary bits at most significant bit (MSB) to least significant
bit (LSB) positions, respectively with the tree depth i+1. For example if C = 135 and
initial λ = 30, the binary tree b(C) will be b(C) = 01000. The tree formation scenario
is shown in Figure 8.2. The number of tree nodes e.g. number of bits in any binary
tree are decided by the initial quantizer λ and is defined as depth of the tree.
8.2.1.2 Embedding
The above mentioned binary tree is used to embed binary watermark information using
symbol based embedding rules. To introduce the watermarking scalability, we chose
3 most significant bits which represents 8 different states corresponding to 6 different
symbols. Although any other number of bits (> 1) can be chosen, the use of more
number of bits (> 3) results in more states, thus increase the complexity and less
141
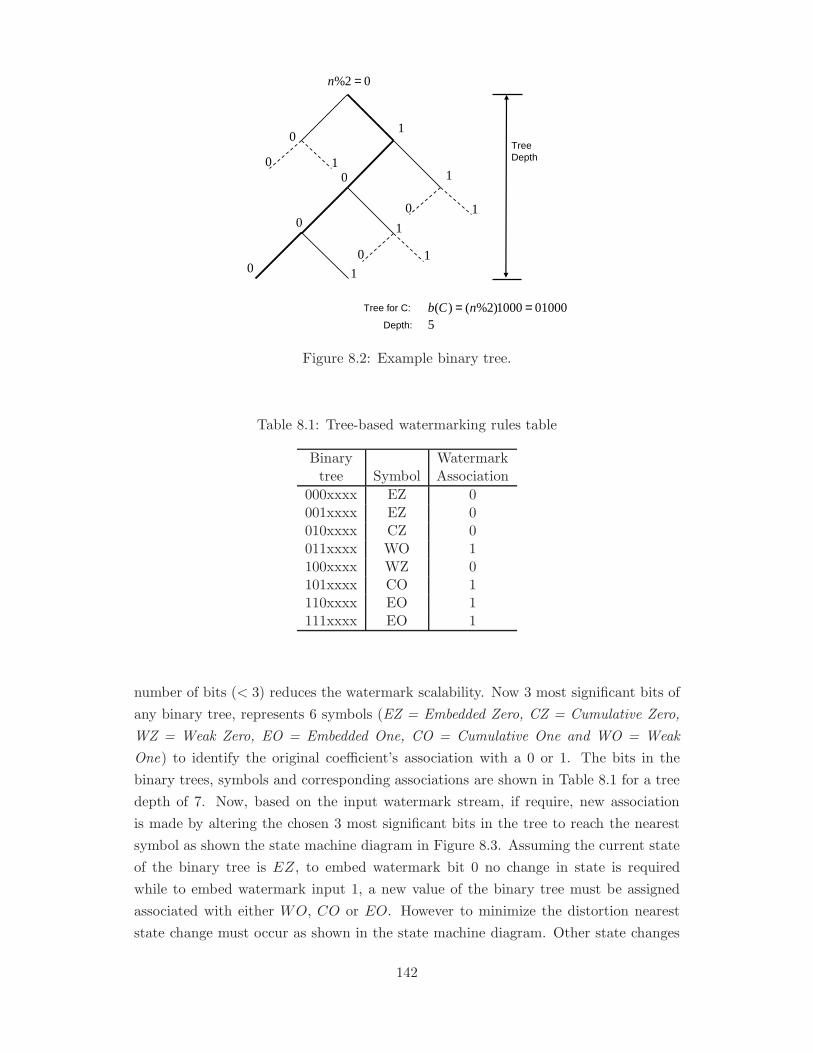
01
02% =n
0 10 1
0 1
0
1
Tree for C: 010001000)2%()( == nCb
TreeDepth
Depth: 5
0
1
0 1
Figure 8.2: Example binary tree.
Table 8.1: Tree-based watermarking rules table
Binary Watermarktree Symbol Association
000xxxx EZ 0001xxxx EZ 0010xxxx CZ 0011xxxx WO 1100xxxx WZ 0101xxxx CO 1110xxxx EO 1111xxxx EO 1
number of bits (< 3) reduces the watermark scalability. Now 3 most significant bits of
any binary tree, represents 6 symbols (EZ = Embedded Zero, CZ = Cumulative Zero,
WZ = Weak Zero, EO = Embedded One, CO = Cumulative One and WO = Weak
One) to identify the original coefficient’s association with a 0 or 1. The bits in the
binary trees, symbols and corresponding associations are shown in Table 8.1 for a tree
depth of 7. Now, based on the input watermark stream, if require, new association
is made by altering the chosen 3 most significant bits in the tree to reach the nearest
symbol as shown the state machine diagram in Figure 8.3. Assuming the current state
of the binary tree is EZ, to embed watermark bit 0 no change in state is required
while to embed watermark input 1, a new value of the binary tree must be assigned
associated with either WO, CO or EO. However to minimize the distortion nearest
state change must occur as shown in the state machine diagram. Other state changes
142
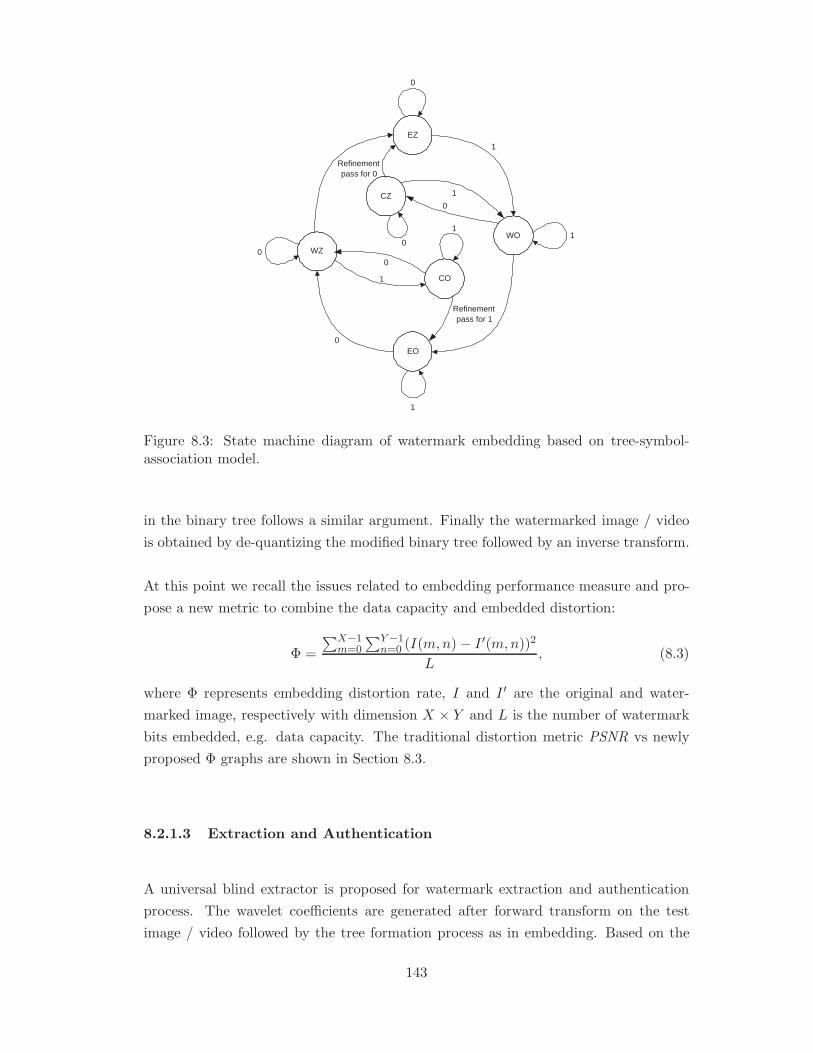
EZ
CZ
WZ
EO
CO
WO
1
1 1
0 0
1
0
0
1
0
0
1
Refinement pass for 0
Refinement pass for 1
Figure 8.3: State machine diagram of watermark embedding based on tree-symbol-association model.
in the binary tree follows a similar argument. Finally the watermarked image / video
is obtained by de-quantizing the modified binary tree followed by an inverse transform.
At this point we recall the issues related to embedding performance measure and pro-
pose a new metric to combine the data capacity and embedded distortion:
Φ =
∑X−1m=0
∑Y−1n=0 (I(m,n)− I ′(m,n))2
L, (8.3)
where Φ represents embedding distortion rate, I and I ′ are the original and water-
marked image, respectively with dimension X × Y and L is the number of watermark
bits embedded, e.g. data capacity. The traditional distortion metric PSNR vs newly
proposed Φ graphs are shown in Section 8.3.
8.2.1.3 Extraction and Authentication
A universal blind extractor is proposed for watermark extraction and authentication
process. The wavelet coefficients are generated after forward transform on the test
image / video followed by the tree formation process as in embedding. Based on the
143
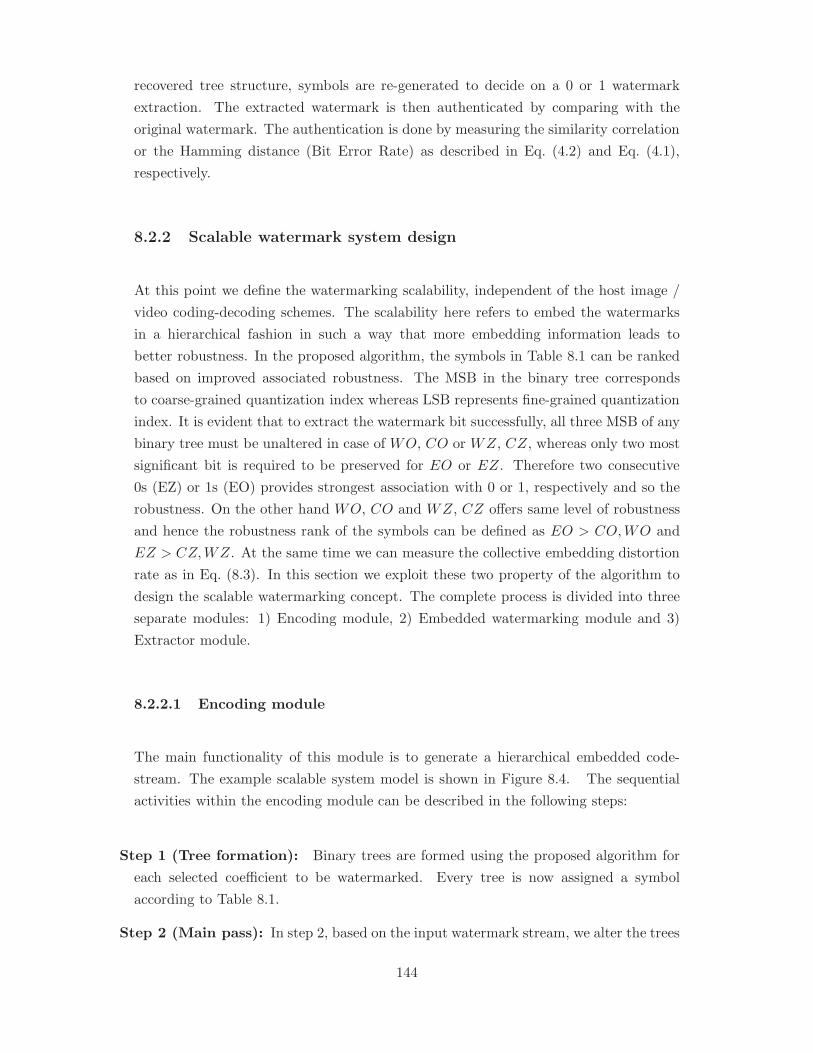
recovered tree structure, symbols are re-generated to decide on a 0 or 1 watermark
extraction. The extracted watermark is then authenticated by comparing with the
original watermark. The authentication is done by measuring the similarity correlation
or the Hamming distance (Bit Error Rate) as described in Eq. (4.2) and Eq. (4.1),
respectively.
8.2.2 Scalable watermark system design
At this point we define the watermarking scalability, independent of the host image /
video coding-decoding schemes. The scalability here refers to embed the watermarks
in a hierarchical fashion in such a way that more embedding information leads to
better robustness. In the proposed algorithm, the symbols in Table 8.1 can be ranked
based on improved associated robustness. The MSB in the binary tree corresponds
to coarse-grained quantization index whereas LSB represents fine-grained quantization
index. It is evident that to extract the watermark bit successfully, all three MSB of any
binary tree must be unaltered in case of WO, CO or WZ, CZ, whereas only two most
significant bit is required to be preserved for EO or EZ. Therefore two consecutive
0s (EZ) or 1s (EO) provides strongest association with 0 or 1, respectively and so the
robustness. On the other hand WO, CO and WZ, CZ offers same level of robustness
and hence the robustness rank of the symbols can be defined as EO > CO,WO and
EZ > CZ,WZ. At the same time we can measure the collective embedding distortion
rate as in Eq. (8.3). In this section we exploit these two property of the algorithm to
design the scalable watermarking concept. The complete process is divided into three
separate modules: 1) Encoding module, 2) Embedded watermarking module and 3)
Extractor module.
8.2.2.1 Encoding module
The main functionality of this module is to generate a hierarchical embedded code-
stream. The example scalable system model is shown in Figure 8.4. The sequential
activities within the encoding module can be described in the following steps:
Step 1 (Tree formation): Binary trees are formed using the proposed algorithm for
each selected coefficient to be watermarked. Every tree is now assigned a symbol
according to Table 8.1.
Step 2 (Main pass): In step 2, based on the input watermark stream, we alter the trees
144
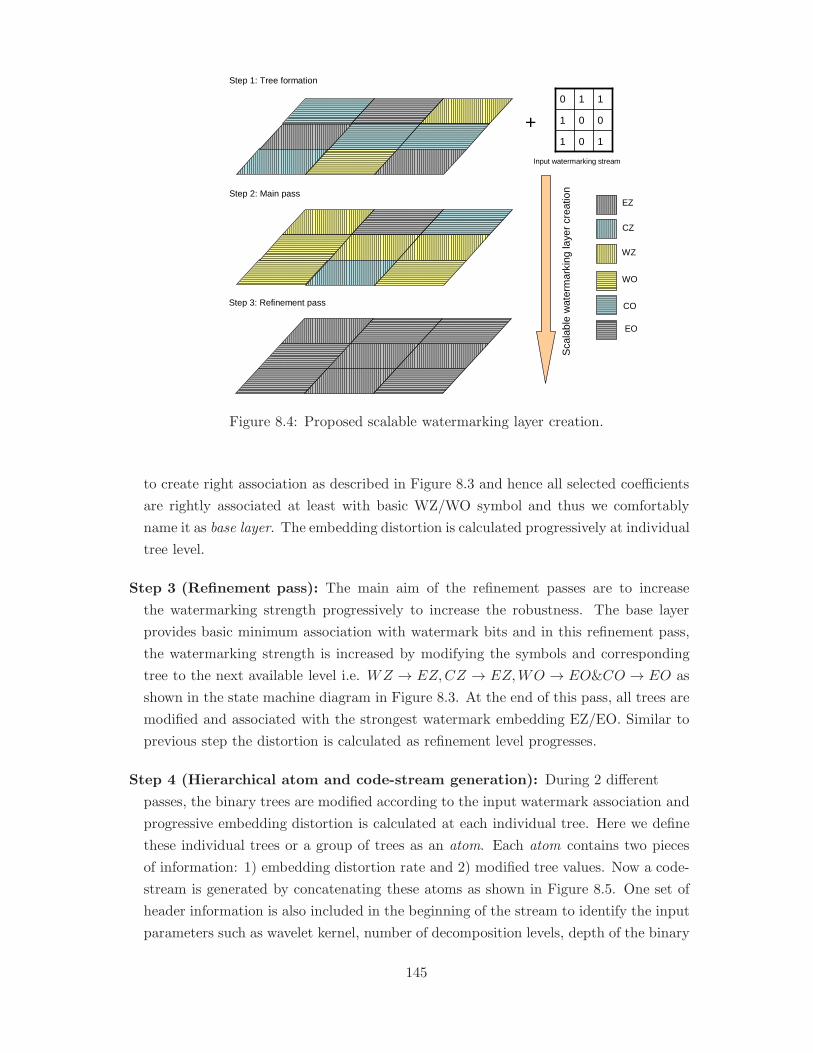
101
001
110
+
Input watermarking stream
EZ
CZ
WZ
EO
CO
WO
Sca
labl
e w
ater
mar
king
laye
r cr
eatio
n
Step 1: Tree formation
Step 2: Main pass
Step 3: Refinement pass
Figure 8.4: Proposed scalable watermarking layer creation.
to create right association as described in Figure 8.3 and hence all selected coefficients
are rightly associated at least with basic WZ/WO symbol and thus we comfortably
name it as base layer. The embedding distortion is calculated progressively at individual
tree level.
Step 3 (Refinement pass): The main aim of the refinement passes are to increase
the watermarking strength progressively to increase the robustness. The base layer
provides basic minimum association with watermark bits and in this refinement pass,
the watermarking strength is increased by modifying the symbols and corresponding
tree to the next available level i.e. WZ → EZ,CZ → EZ,WO → EO&CO → EO as
shown in the state machine diagram in Figure 8.3. At the end of this pass, all trees are
modified and associated with the strongest watermark embedding EZ/EO. Similar to
previous step the distortion is calculated as refinement level progresses.
Step 4 (Hierarchical atom and code-stream generation): During 2 different
passes, the binary trees are modified according to the input watermark association and
progressive embedding distortion is calculated at each individual tree. Here we define
these individual trees or a group of trees as an atom. Each atom contains two pieces
of information: 1) embedding distortion rate and 2) modified tree values. Now a code-
stream is generated by concatenating these atoms as shown in Figure 8.5. One set of
header information is also included in the beginning of the stream to identify the input
parameters such as wavelet kernel, number of decomposition levels, depth of the binary
145
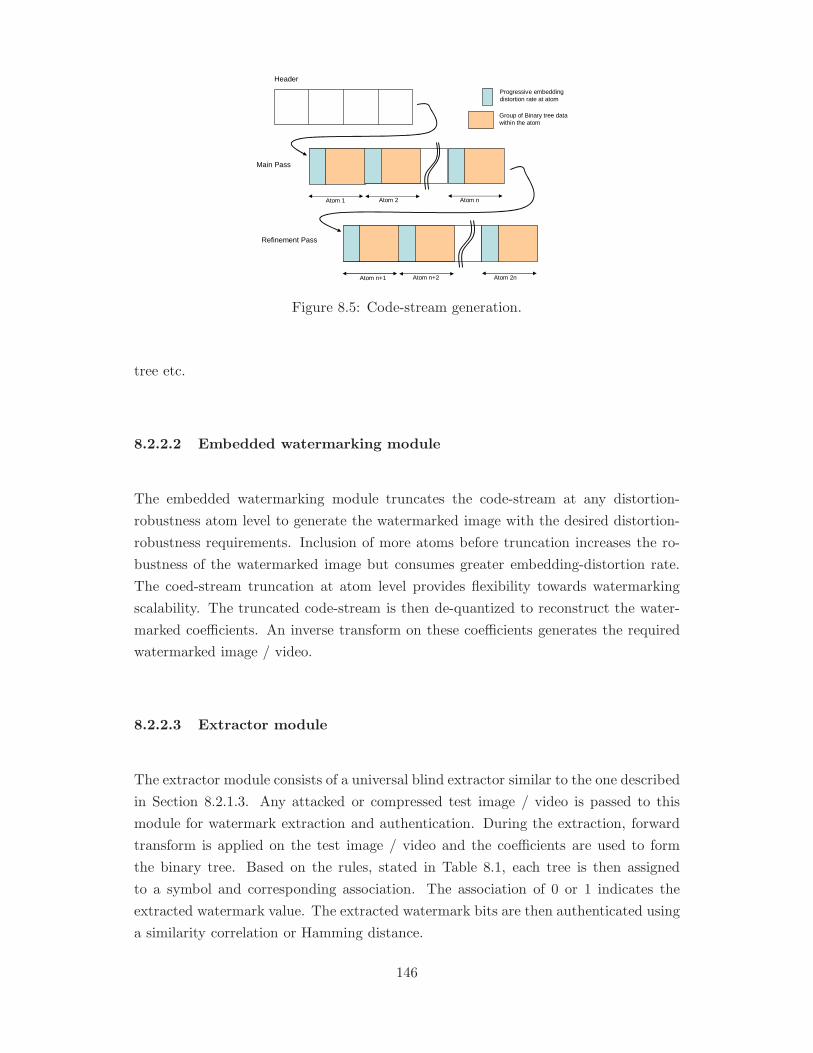
Header
Main Pass
Atom 1 Atom 2 Atom n
Refinement Pass
Atom n+1 Atom n+2 Atom 2n
Progressive embedding distortion rate at atom
Group of Binary tree data within the atom
Figure 8.5: Code-stream generation.
tree etc.
8.2.2.2 Embedded watermarking module
The embedded watermarking module truncates the code-stream at any distortion-
robustness atom level to generate the watermarked image with the desired distortion-
robustness requirements. Inclusion of more atoms before truncation increases the ro-
bustness of the watermarked image but consumes greater embedding-distortion rate.
The coed-stream truncation at atom level provides flexibility towards watermarking
scalability. The truncated code-stream is then de-quantized to reconstruct the water-
marked coefficients. An inverse transform on these coefficients generates the required
watermarked image / video.
8.2.2.3 Extractor module
The extractor module consists of a universal blind extractor similar to the one described
in Section 8.2.1.3. Any attacked or compressed test image / video is passed to this
module for watermark extraction and authentication. During the extraction, forward
transform is applied on the test image / video and the coefficients are used to form
the binary tree. Based on the rules, stated in Table 8.1, each tree is then assigned
to a symbol and corresponding association. The association of 0 or 1 indicates the
extracted watermark value. The extracted watermark bits are then authenticated using
a similarity correlation or Hamming distance.
146
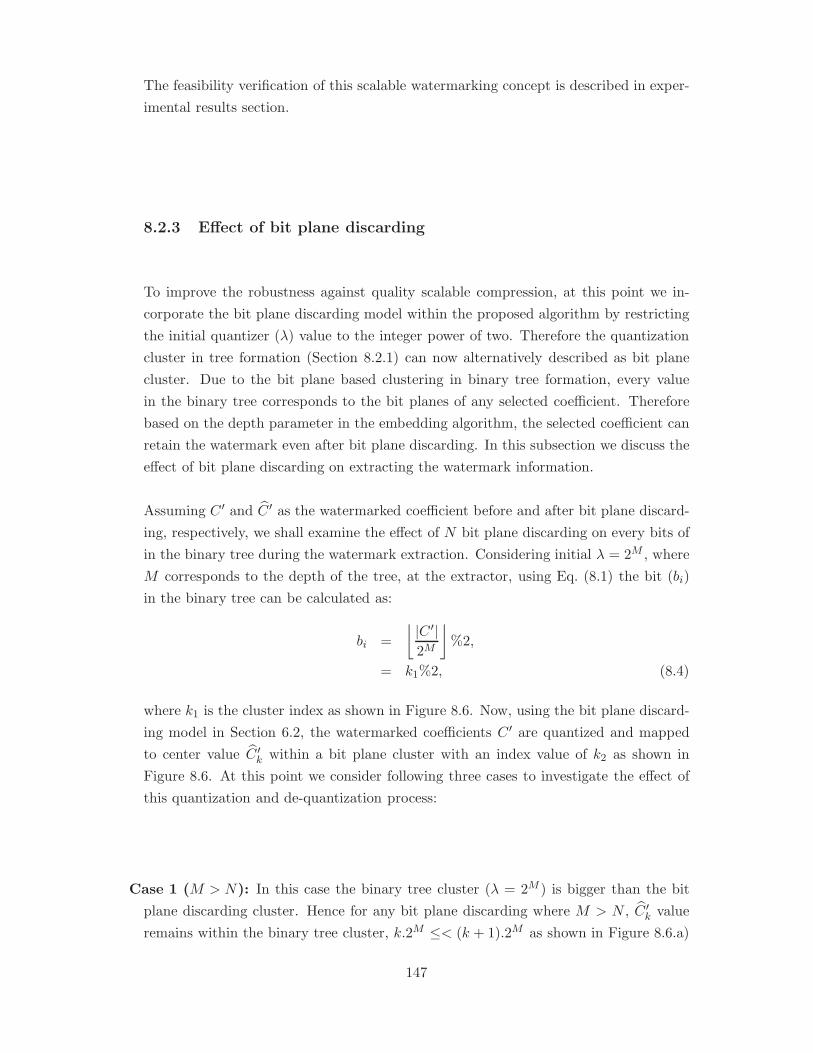
The feasibility verification of this scalable watermarking concept is described in exper-
imental results section.
8.2.3 Effect of bit plane discarding
To improve the robustness against quality scalable compression, at this point we in-
corporate the bit plane discarding model within the proposed algorithm by restricting
the initial quantizer (λ) value to the integer power of two. Therefore the quantization
cluster in tree formation (Section 8.2.1) can now alternatively described as bit plane
cluster. Due to the bit plane based clustering in binary tree formation, every value
in the binary tree corresponds to the bit planes of any selected coefficient. Therefore
based on the depth parameter in the embedding algorithm, the selected coefficient can
retain the watermark even after bit plane discarding. In this subsection we discuss the
effect of bit plane discarding on extracting the watermark information.
Assuming C ′ and C ′ as the watermarked coefficient before and after bit plane discard-
ing, respectively, we shall examine the effect of N bit plane discarding on every bits of
in the binary tree during the watermark extraction. Considering initial λ = 2M , where
M corresponds to the depth of the tree, at the extractor, using Eq. (8.1) the bit (bi)
in the binary tree can be calculated as:
bi =
⌊ |C ′|2M
⌋%2,
= k1%2, (8.4)
where k1 is the cluster index as shown in Figure 8.6. Now, using the bit plane discard-
ing model in Section 6.2, the watermarked coefficients C ′ are quantized and mapped
to center value C ′k within a bit plane cluster with an index value of k2 as shown in
Figure 8.6. At this point we consider following three cases to investigate the effect of
this quantization and de-quantization process:
Case 1 (M > N): In this case the binary tree cluster (λ = 2M ) is bigger than the bit
plane discarding cluster. Hence for any bit plane discarding where M > N , C ′k value
remains within the binary tree cluster, k.2M ≤< (k + 1).2M as shown in Figure 8.6.a)
147
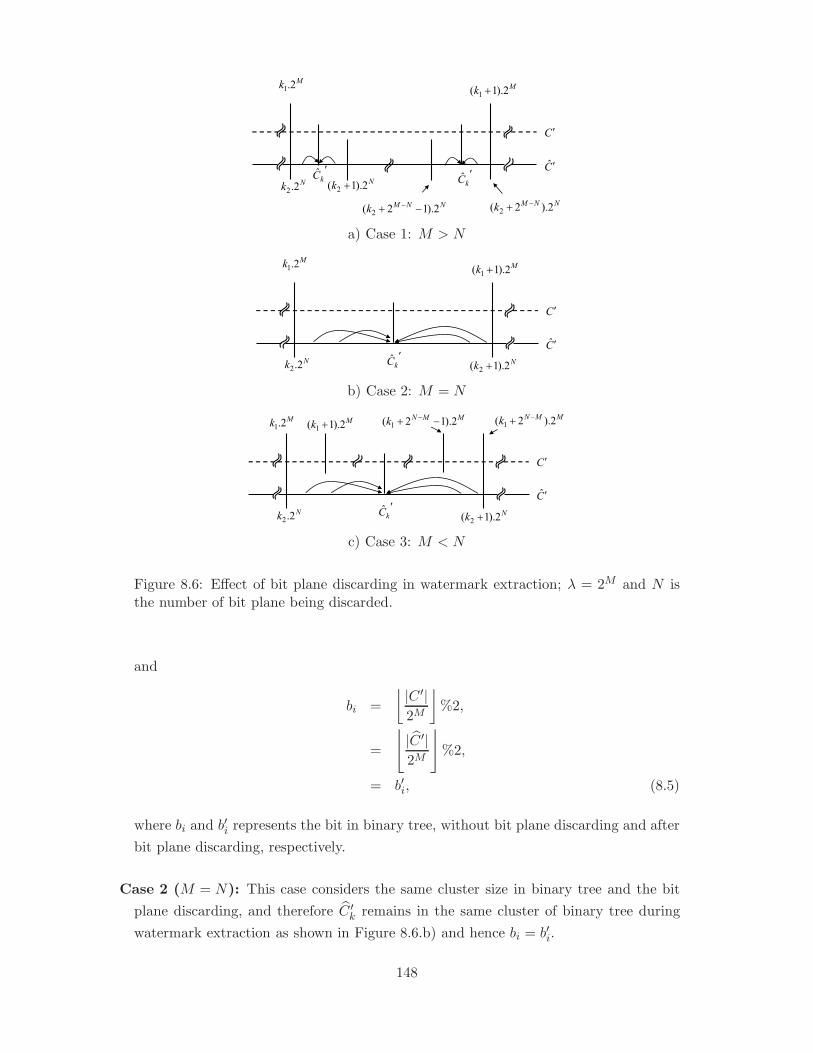
a) Case 1: M > N
b) Case 2: M = N
c) Case 3: M < N
Figure 8.6: Effect of bit plane discarding in watermark extraction; λ = 2M and N isthe number of bit plane being discarded.
and
bi =
⌊ |C ′|2M
⌋%2,
=
⌊|C ′|2M
⌋%2,
= b′i, (8.5)
where bi and b′i represents the bit in binary tree, without bit plane discarding and after
bit plane discarding, respectively.
Case 2 (M = N): This case considers the same cluster size in binary tree and the bit
plane discarding, and therefore C ′k remains in the same cluster of binary tree during
watermark extraction as shown in Figure 8.6.b) and hence bi = b′i.
148
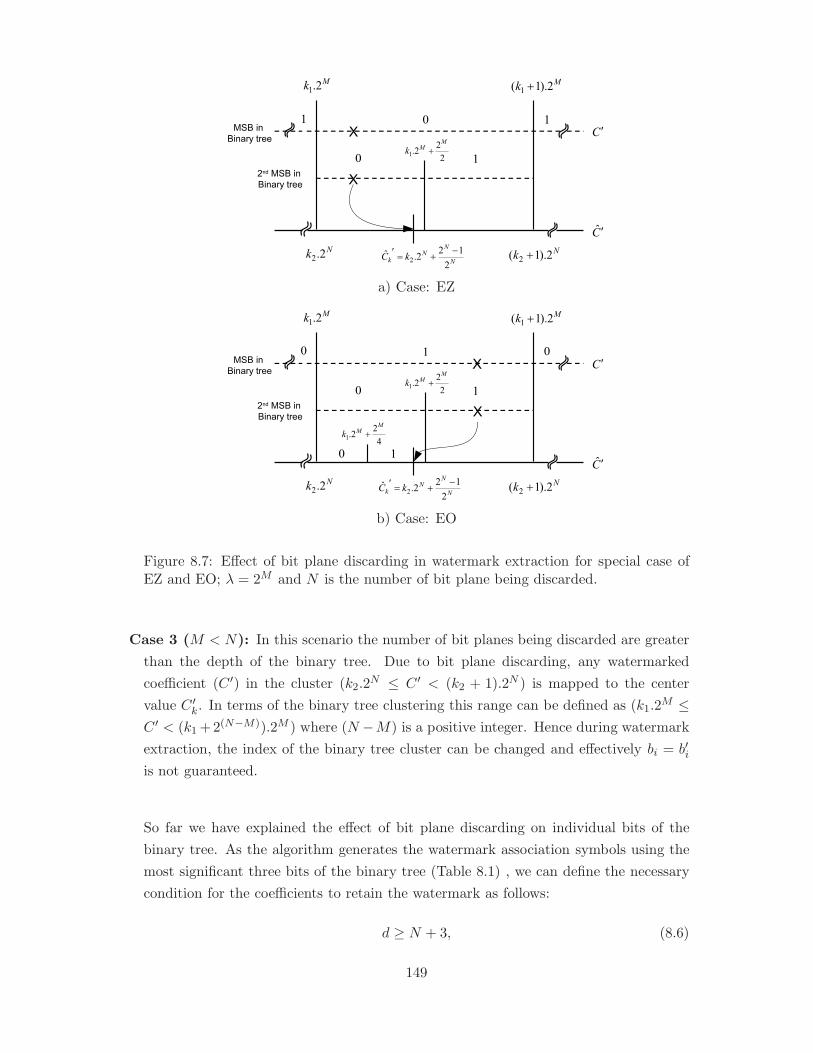
a) Case: EZ
b) Case: EO
Figure 8.7: Effect of bit plane discarding in watermark extraction for special case ofEZ and EO; λ = 2M and N is the number of bit plane being discarded.
Case 3 (M < N): In this scenario the number of bit planes being discarded are greater
than the depth of the binary tree. Due to bit plane discarding, any watermarked
coefficient (C ′) in the cluster (k2.2N ≤ C ′ < (k2 + 1).2N ) is mapped to the center
value C ′k. In terms of the binary tree clustering this range can be defined as (k1.2M ≤
C ′ < (k1+2(N−M)).2M ) where (N −M) is a positive integer. Hence during watermark
extraction, the index of the binary tree cluster can be changed and effectively bi = b′iis not guaranteed.
So far we have explained the effect of bit plane discarding on individual bits of the
binary tree. As the algorithm generates the watermark association symbols using the
most significant three bits of the binary tree (Table 8.1) , we can define the necessary
condition for the coefficients to retain the watermark as follows:
d ≥ N + 3, (8.6)
149
where d is the depth of the binary tree and N is the number of bit plane assumed to
be discarded.
But, after 2nd refinement pass in the code-stream all modified coefficients are associated
with either EZ and EO and in that case only most significant two bits are required
to be preserved and hence when the embedding considers highest robustness criteria,
Eq. (8.6) becomes:
d ≥ N + 2. (8.7)
However, in this case, 2nd most significant bit (MSB) in the binary tree needs not be
preserved where, MSB is preserved along with the support decision from 3rd MSB,
i.e., EZ and EO are allowed to be extracted as CZ and CO, respectively. Now we will
examine the effect of bit plane discarding in such cases when d = N + 1.
Case EZ:
Considering λ = 2M , in this case after 2nd refinement pass, the coefficients (C ′) are
associated to embedded zero (EZ→00x), i.e., k1.2M ≤ C ′ <
(k1 +
2M
2
)where k1%2 =
0, as shown in Figure 8.7.a). After N bit plane discarding C ′ is modified to the center
value Ck =(k2.2
N + 2N−12
). For M = N (i.e., d = N + 1), k2 becomes k1 and
therefore:
Ck =(k2.2
N + 2N−12
)<(k1.2
M + 2M
2
)⇒ Ck <
(k1.2
M + 2M
2
),
∀ k1.2M < Ck <
(k1.2
M + 2M
2
), (8.8)
results in 2nd MSB remains 0 in the binary tree. Hence after (d = N +1) bit plane dis-
carding, the coefficient association with EZ remains same and watermark information
can be successfully recovered.
Case EO:
Referring Figure 8.7.b), for embedded one (EO→11x), the condition for coefficient
association becomes(k1 +
2M
2
)≤ C ′ < (k1 + 1).2M where k1%2 = 1. Similar to the
previous case, after N bit plane discarding C ′ is modified to the center value of the
corresponding cluster Ck =(k2.2
N + 2N−12
). Considering M = N , similar to Eq. (8.8)
we can write:
k1.2M < Ck <
(k1.2
M +2M
2
). (8.9)
Therefore first two MSB of the binary tree now changed as 11x→10x. At this point we
150
aim to extract 3rd MSB (b′) which can be retrieved as:
b′ =
0 : if k1.2M ≤ Ck <
(k1.2
M + 2M
4
),
1 : if(k1.2
M + 2M
4
)≤ Ck <
(k1.2
M + 2M
2
).
(8.10)
Now considering M = N ⇒ 2N−12 > 2M
4 and Eq. (8.9) becomes
(k1.2
M +2M
4
)< Ck <
(k1.2
M +2M
2
). (8.11)
Combining, Eq. (8.10) and Eq. (8.11), the extracted 3rd MSB becomes b = 1 and
hence 11x→101. Therefore after d = N + 1 bit plane discarding, the coefficient asso-
ciation with EO becomes CO and the watermark information cam still be successfully
extracted.
Combining the above mentioned cases, we can modify Eq. (8.7) and conclude that for
EZ or EO the relationship between the embedding depth d and maximum number of
bit plane discarding N is as follows:
d ≥ N + 1. (8.12)
Therefore, using the above mentioned conditions, proposed new algorithm ensures the
reliable detection of watermark against quality scalable compressions which uses bit
plane discarding model. We have verified these conditions using experimental simula-
tions in Section 8.3.
8.3 Experimental results and discussion
This section provides the experimental verification of the proposed scalable watermark-
ing scheme, for images as well as video and evaluates its robustness to scalable content
adaptation attacks. As a proof of concept of the proposed scheme, firstly, we have
simulated various experimental set on image watermarking and later extended it to
MCTF based video watermarking.
151
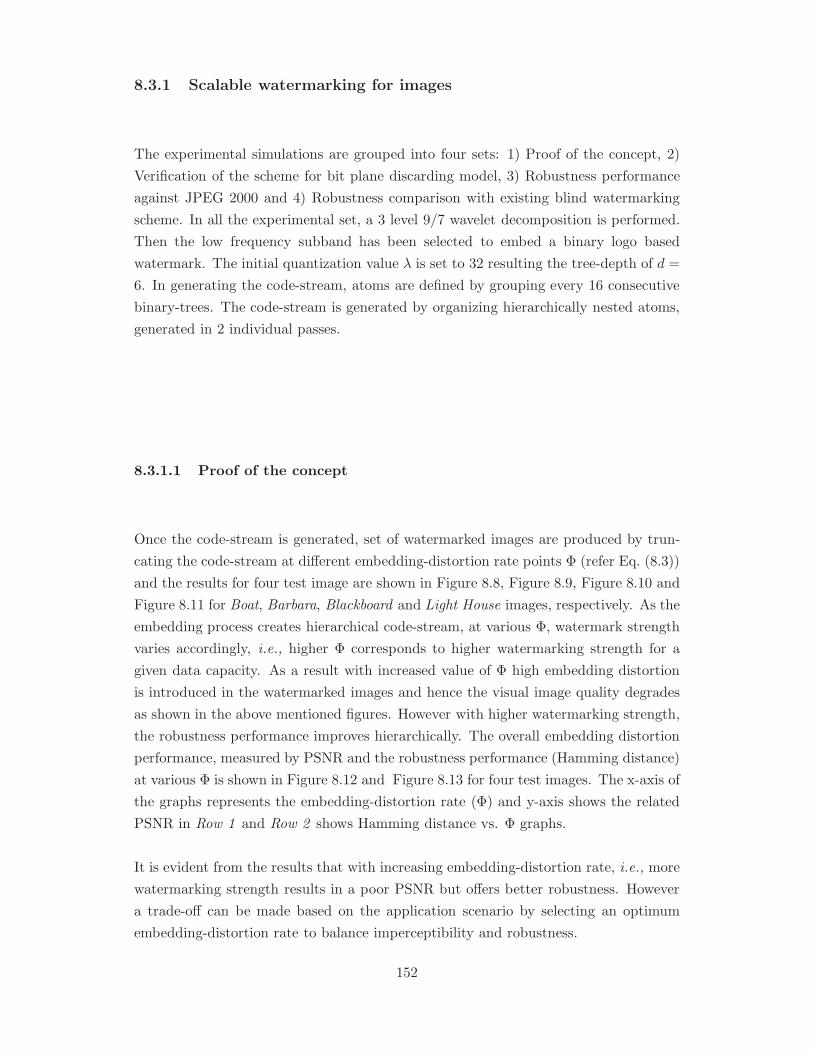
8.3.1 Scalable watermarking for images
The experimental simulations are grouped into four sets: 1) Proof of the concept, 2)
Verification of the scheme for bit plane discarding model, 3) Robustness performance
against JPEG 2000 and 4) Robustness comparison with existing blind watermarking
scheme. In all the experimental set, a 3 level 9/7 wavelet decomposition is performed.
Then the low frequency subband has been selected to embed a binary logo based
watermark. The initial quantization value λ is set to 32 resulting the tree-depth of d =
6. In generating the code-stream, atoms are defined by grouping every 16 consecutive
binary-trees. The code-stream is generated by organizing hierarchically nested atoms,
generated in 2 individual passes.
8.3.1.1 Proof of the concept
Once the code-stream is generated, set of watermarked images are produced by trun-
cating the code-stream at different embedding-distortion rate points Φ (refer Eq. (8.3))
and the results for four test image are shown in Figure 8.8, Figure 8.9, Figure 8.10 and
Figure 8.11 for Boat, Barbara, Blackboard and Light House images, respectively. As the
embedding process creates hierarchical code-stream, at various Φ, watermark strength
varies accordingly, i.e., higher Φ corresponds to higher watermarking strength for a
given data capacity. As a result with increased value of Φ high embedding distortion
is introduced in the watermarked images and hence the visual image quality degrades
as shown in the above mentioned figures. However with higher watermarking strength,
the robustness performance improves hierarchically. The overall embedding distortion
performance, measured by PSNR and the robustness performance (Hamming distance)
at various Φ is shown in Figure 8.12 and Figure 8.13 for four test images. The x-axis of
the graphs represents the embedding-distortion rate (Φ) and y-axis shows the related
PSNR in Row 1 and Row 2 shows Hamming distance vs. Φ graphs.
It is evident from the results that with increasing embedding-distortion rate, i.e., more
watermarking strength results in a poor PSNR but offers better robustness. However
a trade-off can be made based on the application scenario by selecting an optimum
embedding-distortion rate to balance imperceptibility and robustness.
152
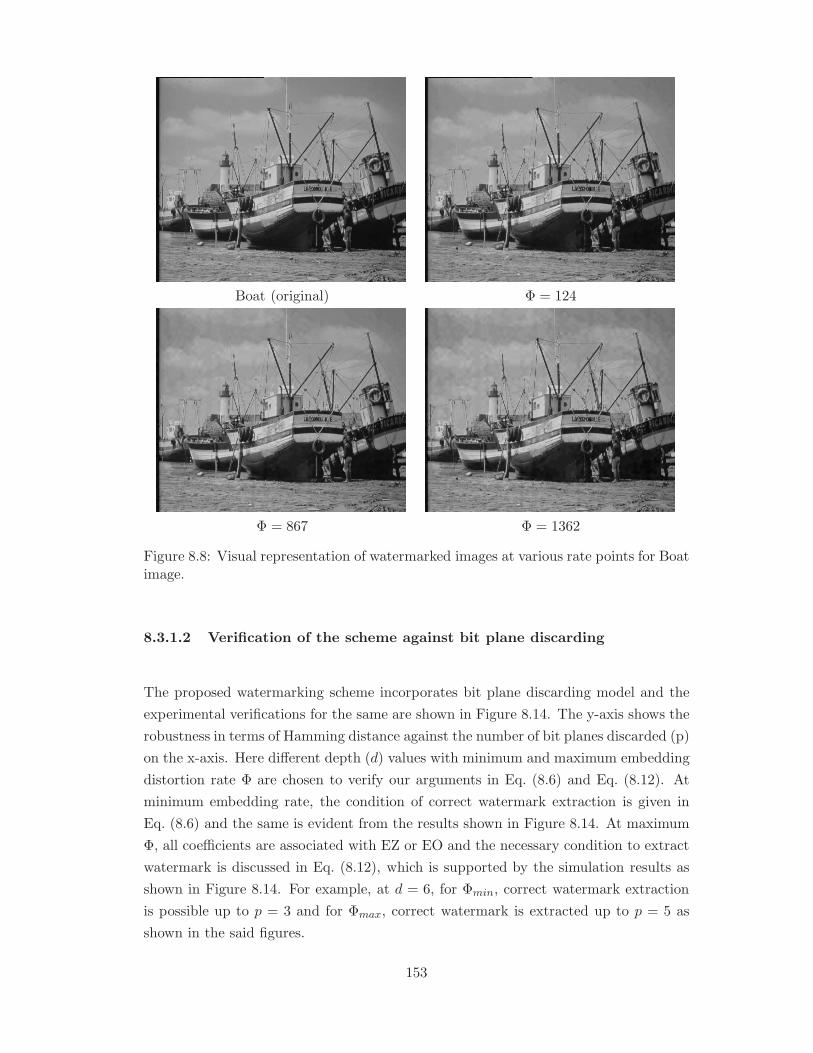
Boat (original) Φ = 124
Φ = 867 Φ = 1362
Figure 8.8: Visual representation of watermarked images at various rate points for Boatimage.
8.3.1.2 Verification of the scheme against bit plane discarding
The proposed watermarking scheme incorporates bit plane discarding model and the
experimental verifications for the same are shown in Figure 8.14. The y-axis shows the
robustness in terms of Hamming distance against the number of bit planes discarded (p)
on the x-axis. Here different depth (d) values with minimum and maximum embedding
distortion rate Φ are chosen to verify our arguments in Eq. (8.6) and Eq. (8.12). At
minimum embedding rate, the condition of correct watermark extraction is given in
Eq. (8.6) and the same is evident from the results shown in Figure 8.14. At maximum
Φ, all coefficients are associated with EZ or EO and the necessary condition to extract
watermark is discussed in Eq. (8.12), which is supported by the simulation results as
shown in Figure 8.14. For example, at d = 6, for Φmin, correct watermark extraction
is possible up to p = 3 and for Φmax, correct watermark is extracted up to p = 5 as
shown in the said figures.
153
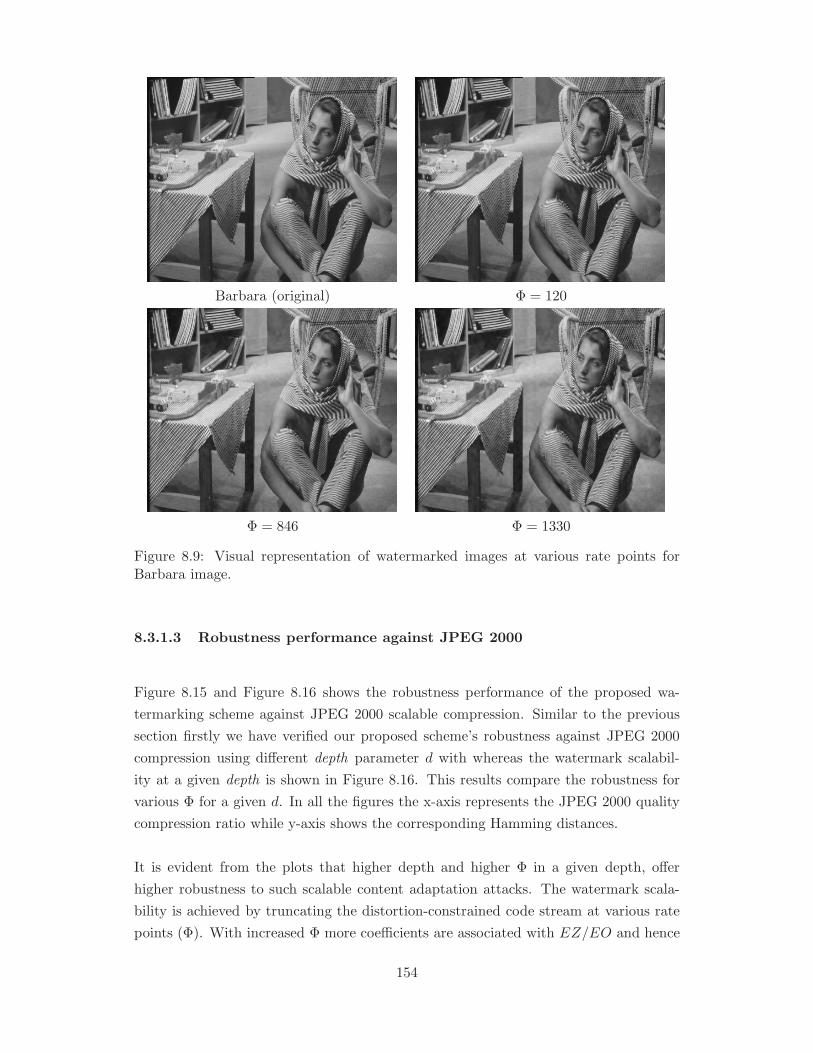
Barbara (original) Φ = 120
Φ = 846 Φ = 1330
Figure 8.9: Visual representation of watermarked images at various rate points forBarbara image.
8.3.1.3 Robustness performance against JPEG 2000
Figure 8.15 and Figure 8.16 shows the robustness performance of the proposed wa-
termarking scheme against JPEG 2000 scalable compression. Similar to the previous
section firstly we have verified our proposed scheme’s robustness against JPEG 2000
compression using different depth parameter d with whereas the watermark scalabil-
ity at a given depth is shown in Figure 8.16. This results compare the robustness for
various Φ for a given d. In all the figures the x-axis represents the JPEG 2000 quality
compression ratio while y-axis shows the corresponding Hamming distances.
It is evident from the plots that higher depth and higher Φ in a given depth, offer
higher robustness to such scalable content adaptation attacks. The watermark scala-
bility is achieved by truncating the distortion-constrained code stream at various rate
points (Φ). With increased Φ more coefficients are associated with EZ/EO and hence
154
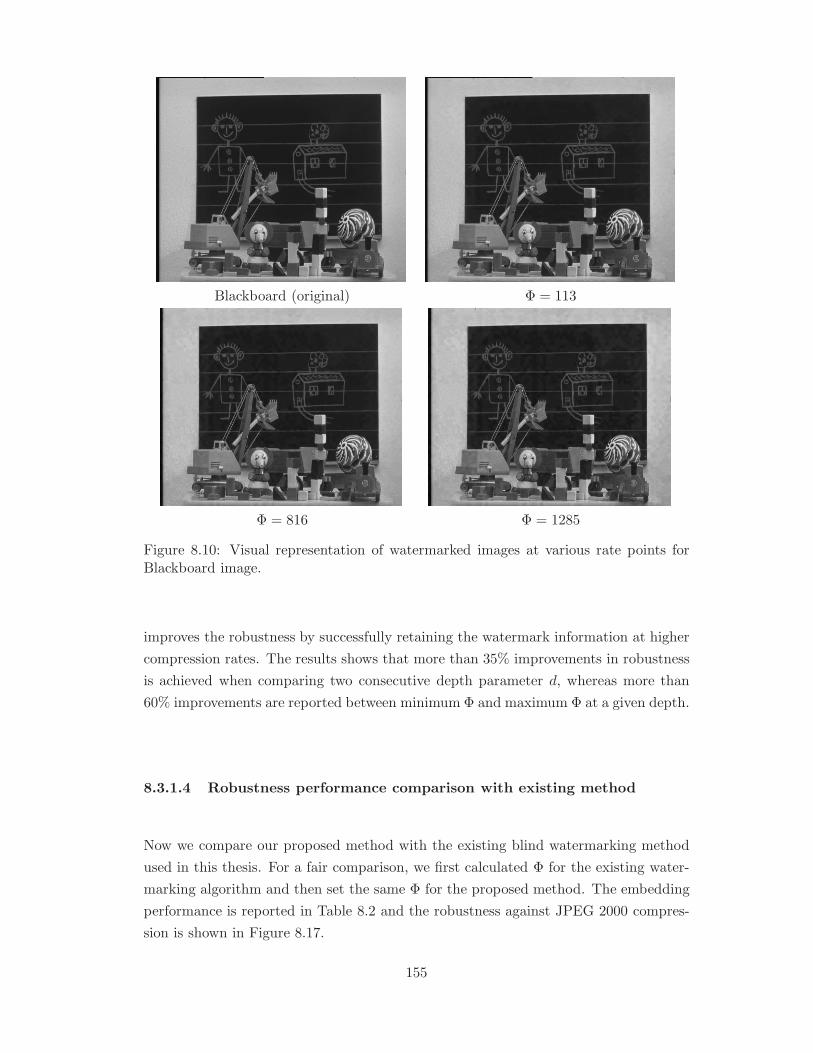
Blackboard (original) Φ = 113
Φ = 816 Φ = 1285
Figure 8.10: Visual representation of watermarked images at various rate points forBlackboard image.
improves the robustness by successfully retaining the watermark information at higher
compression rates. The results shows that more than 35% improvements in robustness
is achieved when comparing two consecutive depth parameter d, whereas more than
60% improvements are reported between minimum Φ and maximum Φ at a given depth.
8.3.1.4 Robustness performance comparison with existing method
Now we compare our proposed method with the existing blind watermarking method
used in this thesis. For a fair comparison, we first calculated Φ for the existing water-
marking algorithm and then set the same Φ for the proposed method. The embedding
performance is reported in Table 8.2 and the robustness against JPEG 2000 compres-
sion is shown in Figure 8.17.
155
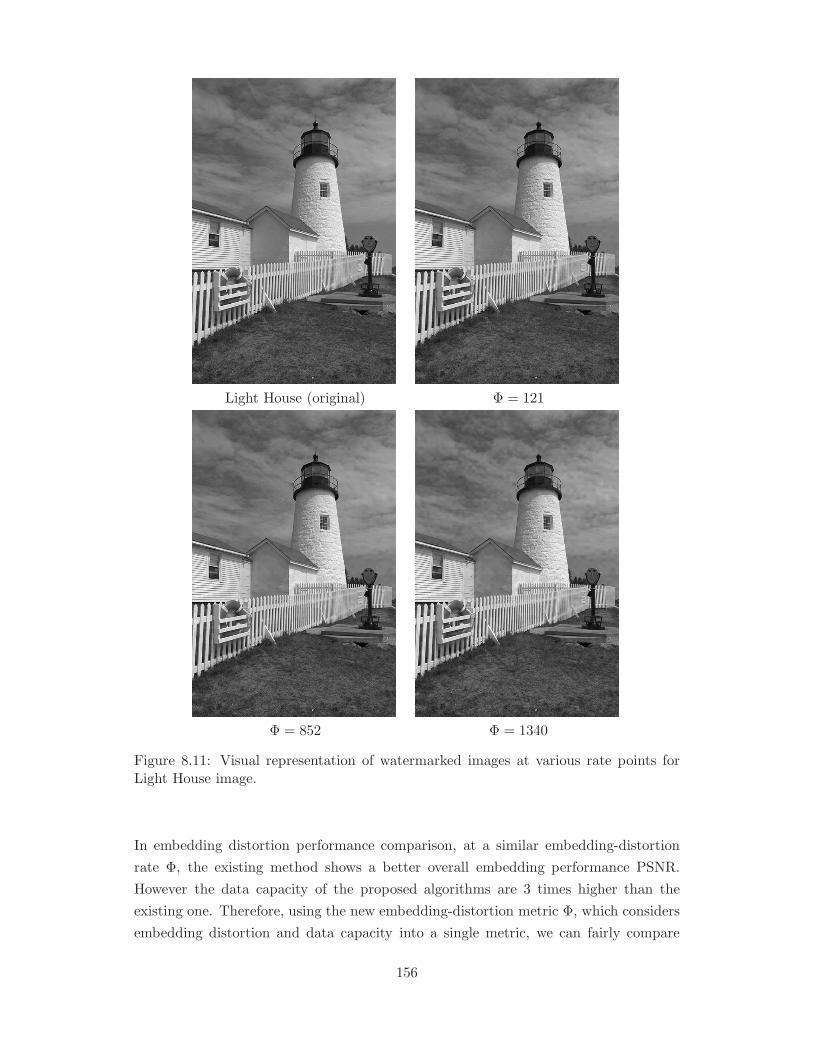
Light House (original) Φ = 121
Φ = 852 Φ = 1340
Figure 8.11: Visual representation of watermarked images at various rate points forLight House image.
In embedding distortion performance comparison, at a similar embedding-distortion
rate Φ, the existing method shows a better overall embedding performance PSNR.
However the data capacity of the proposed algorithms are 3 times higher than the
existing one. Therefore, using the new embedding-distortion metric Φ, which considers
embedding distortion and data capacity into a single metric, we can fairly compare
156
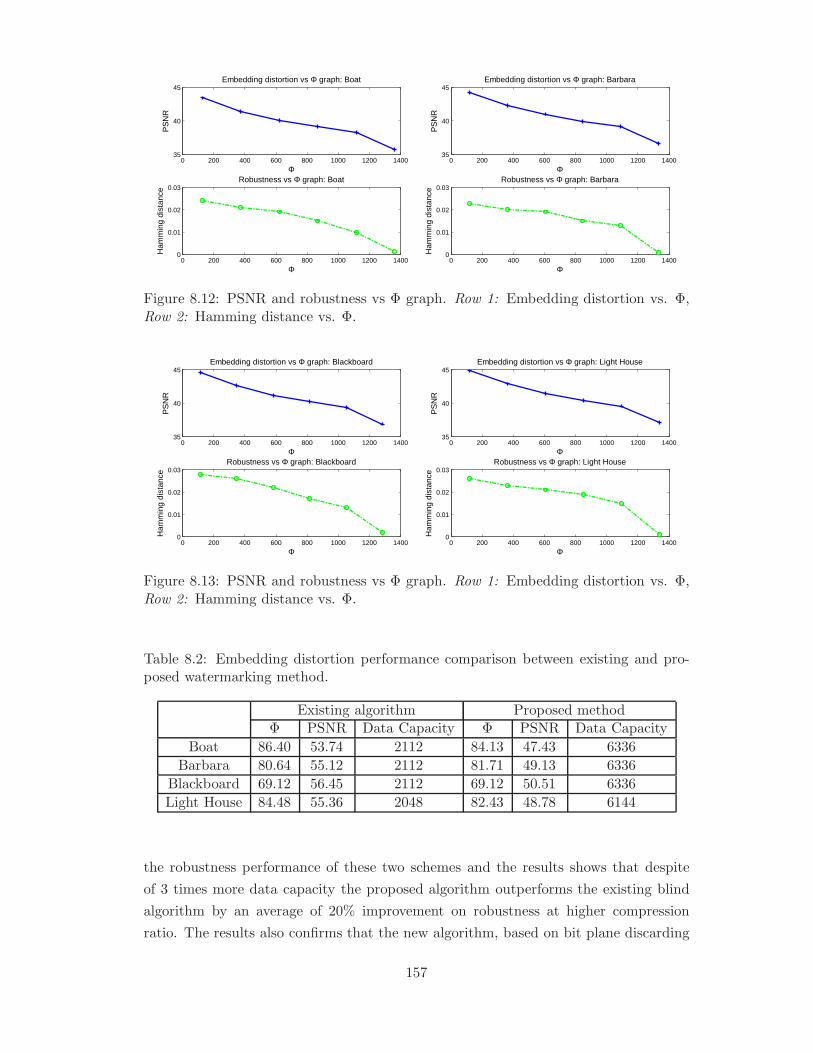
0 200 400 600 800 1000 1200 140035
40
45
ΦP
SN
R
Embedding distortion vs Φ graph: Boat
0 200 400 600 800 1000 1200 14000
0.01
0.02
0.03
Φ
Ham
min
g di
stan
ce
Robustness vs Φ graph: Boat
0 200 400 600 800 1000 1200 140035
40
45
Φ
PS
NR
Embedding distortion vs Φ graph: Barbara
0 200 400 600 800 1000 1200 14000
0.01
0.02
0.03
Φ
Ham
min
g di
stan
ce
Robustness vs Φ graph: Barbara
Figure 8.12: PSNR and robustness vs Φ graph. Row 1: Embedding distortion vs. Φ,Row 2: Hamming distance vs. Φ.
0 200 400 600 800 1000 1200 140035
40
45
Φ
PS
NR
Embedding distortion vs Φ graph: Blackboard
0 200 400 600 800 1000 1200 14000
0.01
0.02
0.03
Φ
Ham
min
g di
stan
ce
Robustness vs Φ graph: Blackboard
0 200 400 600 800 1000 1200 140035
40
45
Φ
PS
NR
Embedding distortion vs Φ graph: Light House
0 200 400 600 800 1000 1200 14000
0.01
0.02
0.03
Φ
Ham
min
g di
stan
ce
Robustness vs Φ graph: Light House
Figure 8.13: PSNR and robustness vs Φ graph. Row 1: Embedding distortion vs. Φ,Row 2: Hamming distance vs. Φ.
Table 8.2: Embedding distortion performance comparison between existing and pro-posed watermarking method.
Existing algorithm Proposed methodΦ PSNR Data Capacity Φ PSNR Data Capacity
Boat 86.40 53.74 2112 84.13 47.43 6336
Barbara 80.64 55.12 2112 81.71 49.13 6336
Blackboard 69.12 56.45 2112 69.12 50.51 6336
Light House 84.48 55.36 2048 82.43 48.78 6144
the robustness performance of these two schemes and the results shows that despite
of 3 times more data capacity the proposed algorithm outperforms the existing blind
algorithm by an average of 20% improvement on robustness at higher compression
ratio. The results also confirms that the new algorithm, based on bit plane discarding
157
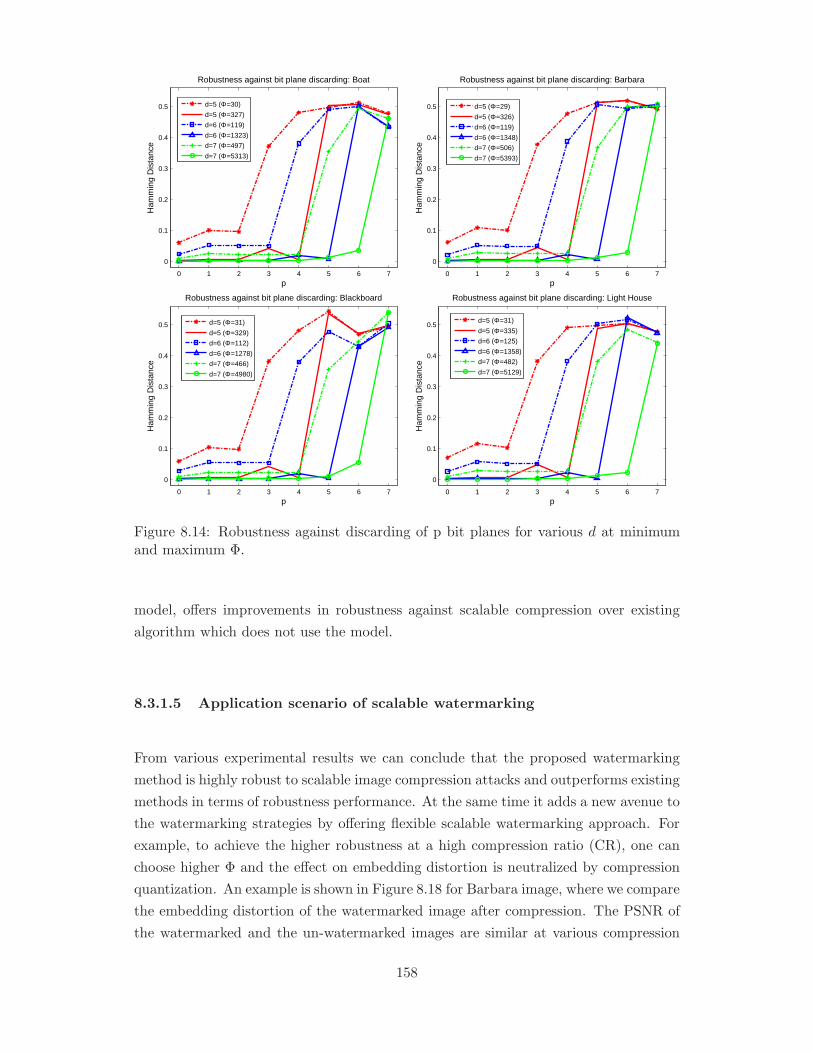
0 1 2 3 4 5 6 7
0
0.1
0.2
0.3
0.4
0.5
p
Ham
min
g D
ista
nce
Robustness against bit plane discarding: Boat
d=5 (Φ=30)
d=5 (Φ=327)
d=6 (Φ=119)
d=6 (Φ=1323)
d=7 (Φ=497)
d=7 (Φ=5313)
0 1 2 3 4 5 6 7
0
0.1
0.2
0.3
0.4
0.5
p
Ham
min
g D
ista
nce
Robustness against bit plane discarding: Barbara
d=5 (Φ=29)
d=5 (Φ=326)
d=6 (Φ=119)
d=6 (Φ=1348)
d=7 (Φ=506)
d=7 (Φ=5393)
0 1 2 3 4 5 6 7
0
0.1
0.2
0.3
0.4
0.5
p
Ham
min
g D
ista
nce
Robustness against bit plane discarding: Blackboard
d=5 (Φ=31)
d=5 (Φ=329)
d=6 (Φ=112)
d=6 (Φ=1278)
d=7 (Φ=466)
d=7 (Φ=4980)
0 1 2 3 4 5 6 7
0
0.1
0.2
0.3
0.4
0.5
p
Ham
min
g D
ista
nce
Robustness against bit plane discarding: Light House
d=5 (Φ=31)
d=5 (Φ=335)
d=6 (Φ=125)
d=6 (Φ=1358)
d=7 (Φ=482)
d=7 (Φ=5129)
Figure 8.14: Robustness against discarding of p bit planes for various d at minimumand maximum Φ.
model, offers improvements in robustness against scalable compression over existing
algorithm which does not use the model.
8.3.1.5 Application scenario of scalable watermarking
From various experimental results we can conclude that the proposed watermarking
method is highly robust to scalable image compression attacks and outperforms existing
methods in terms of robustness performance. At the same time it adds a new avenue to
the watermarking strategies by offering flexible scalable watermarking approach. For
example, to achieve the higher robustness at a high compression ratio (CR), one can
choose higher Φ and the effect on embedding distortion is neutralized by compression
quantization. An example is shown in Figure 8.18 for Barbara image, where we compare
the embedding distortion of the watermarked image after compression. The PSNR of
the watermarked and the un-watermarked images are similar at various compression
158

0 10 20 30 40 50
0
0.05
0.1
0.15
0.2
0.25
0.3
0.35
JPEG2000 compression Ratio
Ham
min
g D
ista
nce
Robustness against JPEG2000: Boat
d=5 (Φ=30)
d=5 (Φ=327)
d=6 (Φ=119)
d=6 (Φ=1323)
d=7 (Φ=497)
d=7 (Φ=5313)
0 10 20 30 40 50
0
0.05
0.1
0.15
0.2
0.25
0.3
0.35
JPEG2000 compression Ratio
Ham
min
g D
ista
nce
Robustness against JPEG2000: Barbara
d=5 (Φ=29)
d=5 (Φ=326)
d=6 (Φ=119)
d=6 (Φ=1348)
d=7 (Φ=506)
d=7 (Φ=5393)
0 10 20 30 40 50
0
0.05
0.1
0.15
0.2
0.25
0.3
0.35
JPEG2000 compression Ratio
Ham
min
g D
ista
nce
Robustness against JPEG2000: Blackboard
d=5 (Φ=31)
d=5 (Φ=329)
d=6 (Φ=112)
d=6 (Φ=1278)
d=7 (Φ=466)
d=7 (Φ=4980)
0 10 20 30 40 50
0
0.05
0.1
0.15
0.2
0.25
0.3
0.35
0.4
JPEG2000 compression Ratio
Ham
min
g D
ista
nce
Robustness against JPEG2000: Light House
d=5 (Φ=31)
d=5 (Φ=335)
d=6 (Φ=125)
d=6 (Φ=1358)
d=7 (Φ=482)
d=7 (Φ=5129)
Figure 8.15: Robustness against JPEG 2000 compression for various d at minimumand maximum Φ.
points, while the watermarked image offers authenticity of the image with desired
robustness, i.e., Hamming distance (HD).
8.3.2 Scalable watermarking for video
In this section we have used the proposed scalable watermarking scheme for video
watermarking. Here the watermarking code-stream is generated using the 2D+t+2D
decomposed host video, as described in Chapter 7. In this case the binary tree is formed
using the motion compensated filtered coefficients. Similar to the image watermarking
of the proposed algorithm, the watermarked video is generated at a given embedding
distortion rate (Φ) either at individual frame level or in every GOP. For the experimen-
tal set here we have calculated Φ for every GOP with a size of 8 frames per GOP. The
watermark extraction procedure is similar to the image section. First the test video
is decomposed using the 2D+t+2D frame with a blind motion estimation without any
159
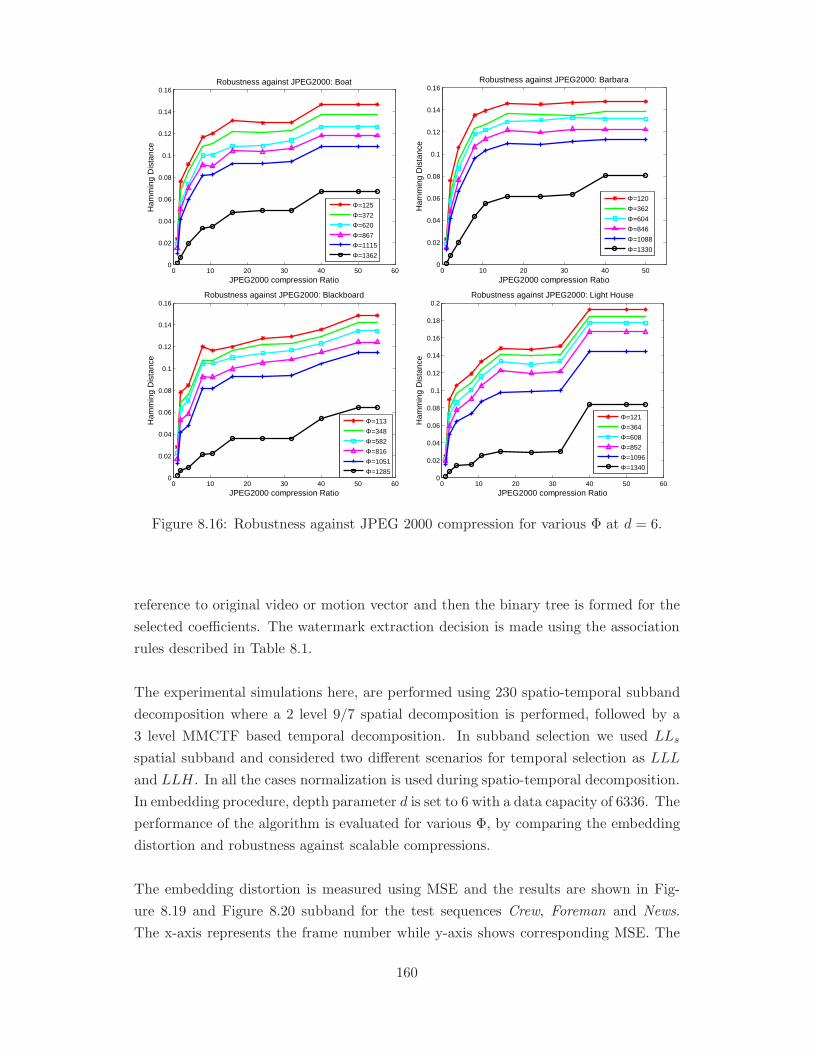
0 10 20 30 40 50 600
0.02
0.04
0.06
0.08
0.1
0.12
0.14
0.16
JPEG2000 compression Ratio
Ham
min
g D
ista
nce
Robustness against JPEG2000: Boat
Φ=125
Φ=372
Φ=620
Φ=867
Φ=1115
Φ=1362
0 10 20 30 40 500
0.02
0.04
0.06
0.08
0.1
0.12
0.14
0.16
JPEG2000 compression Ratio
Ham
min
g D
ista
nce
Robustness against JPEG2000: Barbara
Φ=120
Φ=362
Φ=604
Φ=846
Φ=1088
Φ=1330
0 10 20 30 40 50 600
0.02
0.04
0.06
0.08
0.1
0.12
0.14
0.16
JPEG2000 compression Ratio
Ham
min
g D
ista
nce
Robustness against JPEG2000: Blackboard
Φ=113
Φ=348
Φ=582
Φ=816
Φ=1051
Φ=1285
0 10 20 30 40 50 600
0.02
0.04
0.06
0.08
0.1
0.12
0.14
0.16
0.18
0.2
JPEG2000 compression Ratio
Ham
min
g D
ista
nce
Robustness against JPEG2000: Light House
Φ=121
Φ=364
Φ=608
Φ=852
Φ=1096
Φ=1340
Figure 8.16: Robustness against JPEG 2000 compression for various Φ at d = 6.
reference to original video or motion vector and then the binary tree is formed for the
selected coefficients. The watermark extraction decision is made using the association
rules described in Table 8.1.
The experimental simulations here, are performed using 230 spatio-temporal subband
decomposition where a 2 level 9/7 spatial decomposition is performed, followed by a
3 level MMCTF based temporal decomposition. In subband selection we used LLs
spatial subband and considered two different scenarios for temporal selection as LLL
and LLH. In all the cases normalization is used during spatio-temporal decomposition.
In embedding procedure, depth parameter d is set to 6 with a data capacity of 6336. The
performance of the algorithm is evaluated for various Φ, by comparing the embedding
distortion and robustness against scalable compressions.
The embedding distortion is measured using MSE and the results are shown in Fig-
ure 8.19 and Figure 8.20 subband for the test sequences Crew, Foreman and News.
The x-axis represents the frame number while y-axis shows corresponding MSE. The
160
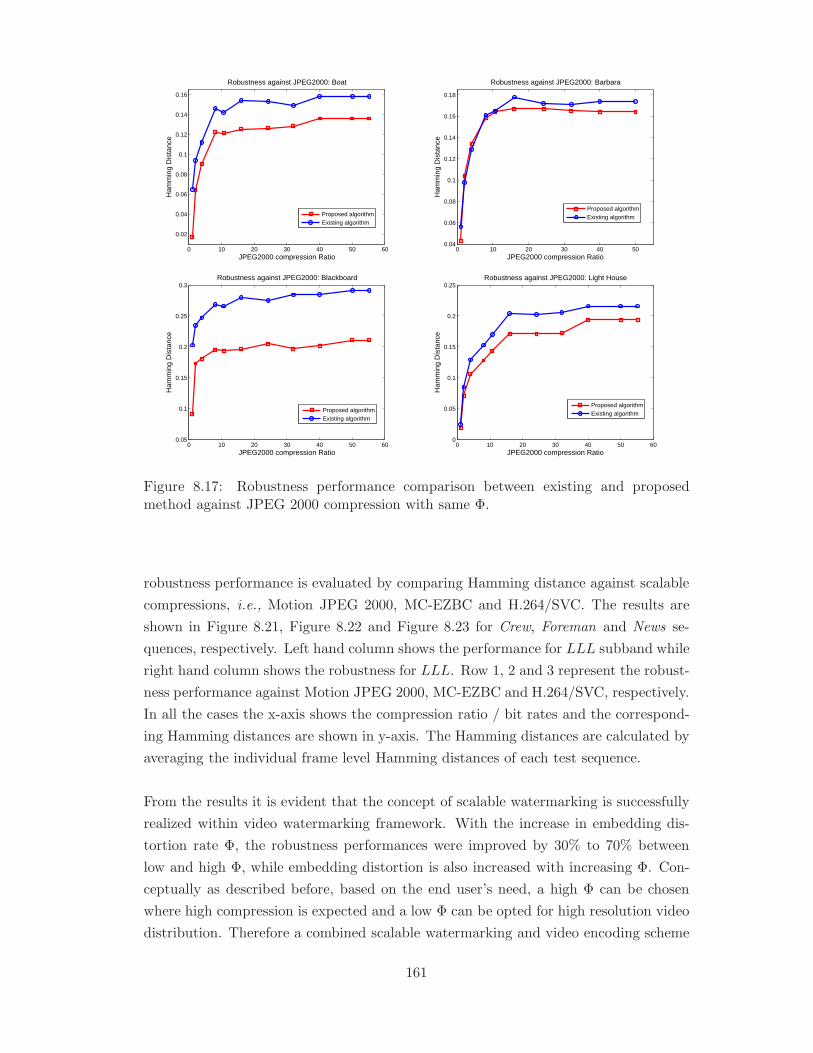
0 10 20 30 40 50 60
0.02
0.04
0.06
0.08
0.1
0.12
0.14
0.16
JPEG2000 compression Ratio
Ham
min
g D
ista
nce
Robustness against JPEG2000: Boat
Proposed algorithmExisting algorithm
0 10 20 30 40 500.04
0.06
0.08
0.1
0.12
0.14
0.16
0.18
JPEG2000 compression Ratio
Ham
min
g D
ista
nce
Robustness against JPEG2000: Barbara
Proposed algorithmExisting algorithm
0 10 20 30 40 50 600.05
0.1
0.15
0.2
0.25
0.3
JPEG2000 compression Ratio
Ham
min
g D
ista
nce
Robustness against JPEG2000: Blackboard
Proposed algorithmExisting algorithm
0 10 20 30 40 50 600
0.05
0.1
0.15
0.2
0.25
JPEG2000 compression Ratio
Ham
min
g D
ista
nce
Robustness against JPEG2000: Light House
Proposed algorithmExisting algorithm
Figure 8.17: Robustness performance comparison between existing and proposedmethod against JPEG 2000 compression with same Φ.
robustness performance is evaluated by comparing Hamming distance against scalable
compressions, i.e., Motion JPEG 2000, MC-EZBC and H.264/SVC. The results are
shown in Figure 8.21, Figure 8.22 and Figure 8.23 for Crew, Foreman and News se-
quences, respectively. Left hand column shows the performance for LLL subband while
right hand column shows the robustness for LLL. Row 1, 2 and 3 represent the robust-
ness performance against Motion JPEG 2000, MC-EZBC and H.264/SVC, respectively.
In all the cases the x-axis shows the compression ratio / bit rates and the correspond-
ing Hamming distances are shown in y-axis. The Hamming distances are calculated by
averaging the individual frame level Hamming distances of each test sequence.
From the results it is evident that the concept of scalable watermarking is successfully
realized within video watermarking framework. With the increase in embedding dis-
tortion rate Φ, the robustness performances were improved by 30% to 70% between
low and high Φ, while embedding distortion is also increased with increasing Φ. Con-
ceptually as described before, based on the end user’s need, a high Φ can be chosen
where high compression is expected and a low Φ can be opted for high resolution video
distribution. Therefore a combined scalable watermarking and video encoding scheme
161
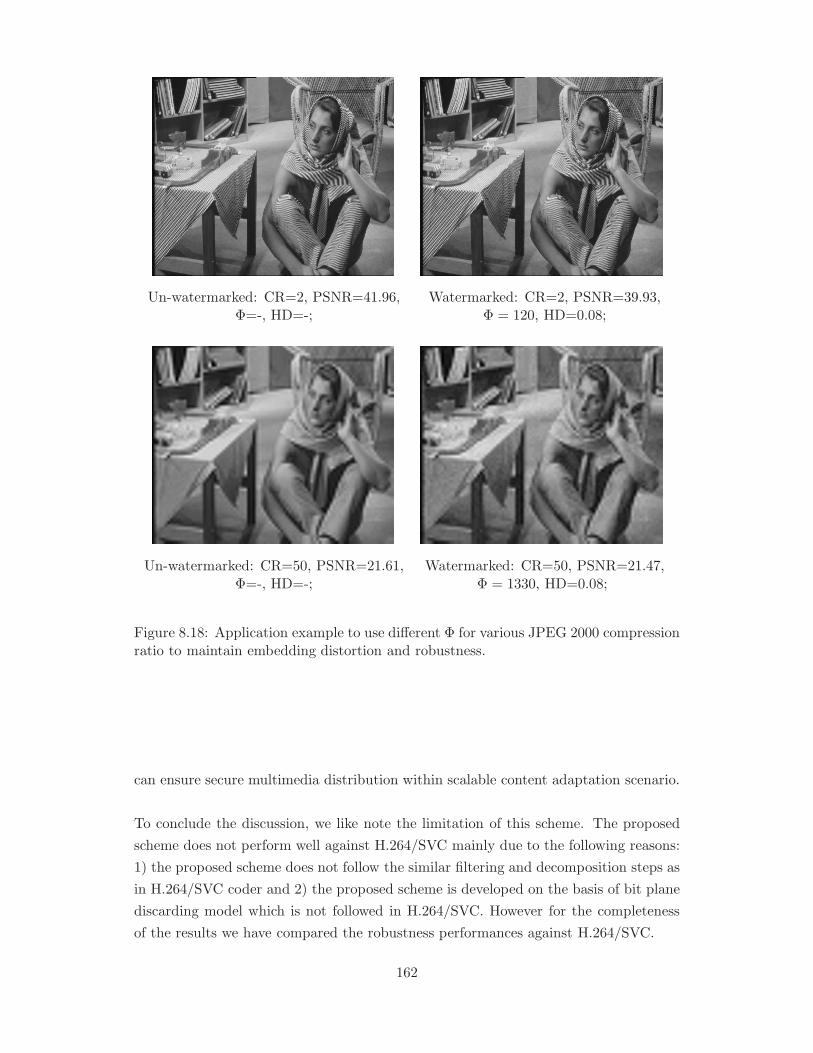
Un-watermarked: CR=2, PSNR=41.96, Watermarked: CR=2, PSNR=39.93,Φ=-, HD=-; Φ = 120, HD=0.08;
Un-watermarked: CR=50, PSNR=21.61, Watermarked: CR=50, PSNR=21.47,Φ=-, HD=-; Φ = 1330, HD=0.08;
Figure 8.18: Application example to use different Φ for various JPEG 2000 compressionratio to maintain embedding distortion and robustness.
can ensure secure multimedia distribution within scalable content adaptation scenario.
To conclude the discussion, we like note the limitation of this scheme. The proposed
scheme does not perform well against H.264/SVC mainly due to the following reasons:
1) the proposed scheme does not follow the similar filtering and decomposition steps as
in H.264/SVC coder and 2) the proposed scheme is developed on the basis of bit plane
discarding model which is not followed in H.264/SVC. However for the completeness
of the results we have compared the robustness performances against H.264/SVC.
162
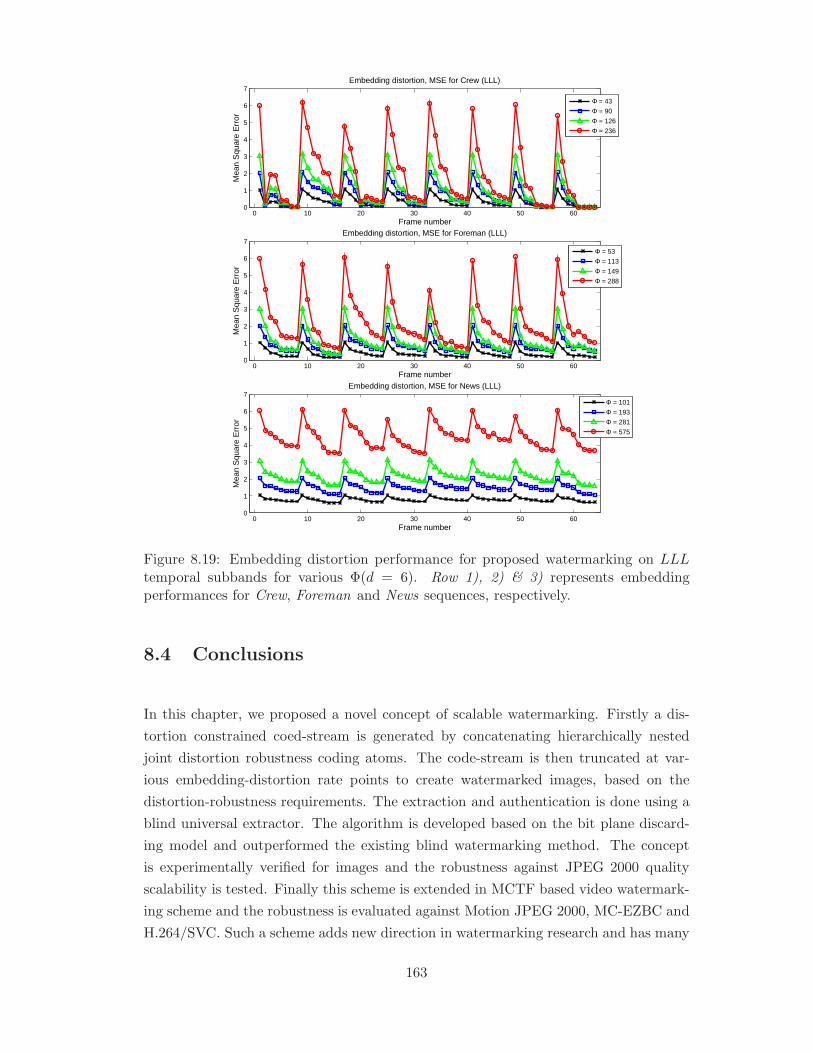
0 10 20 30 40 50 600
1
2
3
4
5
6
7
Frame number
Mea
n S
quar
e E
rror
Embedding distortion, MSE for Crew (LLL)
Φ = 43
Φ = 90
Φ = 126
Φ = 236
0 10 20 30 40 50 600
1
2
3
4
5
6
7
Frame number
Mea
n S
quar
e E
rror
Embedding distortion, MSE for Foreman (LLL)
Φ = 53
Φ = 113
Φ = 149
Φ = 288
0 10 20 30 40 50 600
1
2
3
4
5
6
7
Frame number
Mea
n S
quar
e E
rror
Embedding distortion, MSE for News (LLL)
Φ = 101
Φ = 193
Φ = 281
Φ = 575
Figure 8.19: Embedding distortion performance for proposed watermarking on LLLtemporal subbands for various Φ(d = 6). Row 1), 2) & 3) represents embeddingperformances for Crew, Foreman and News sequences, respectively.
8.4 Conclusions
In this chapter, we proposed a novel concept of scalable watermarking. Firstly a dis-
tortion constrained coed-stream is generated by concatenating hierarchically nested
joint distortion robustness coding atoms. The code-stream is then truncated at var-
ious embedding-distortion rate points to create watermarked images, based on the
distortion-robustness requirements. The extraction and authentication is done using a
blind universal extractor. The algorithm is developed based on the bit plane discard-
ing model and outperformed the existing blind watermarking method. The concept
is experimentally verified for images and the robustness against JPEG 2000 quality
scalability is tested. Finally this scheme is extended in MCTF based video watermark-
ing scheme and the robustness is evaluated against Motion JPEG 2000, MC-EZBC and
H.264/SVC. Such a scheme adds new direction in watermarking research and has many
163
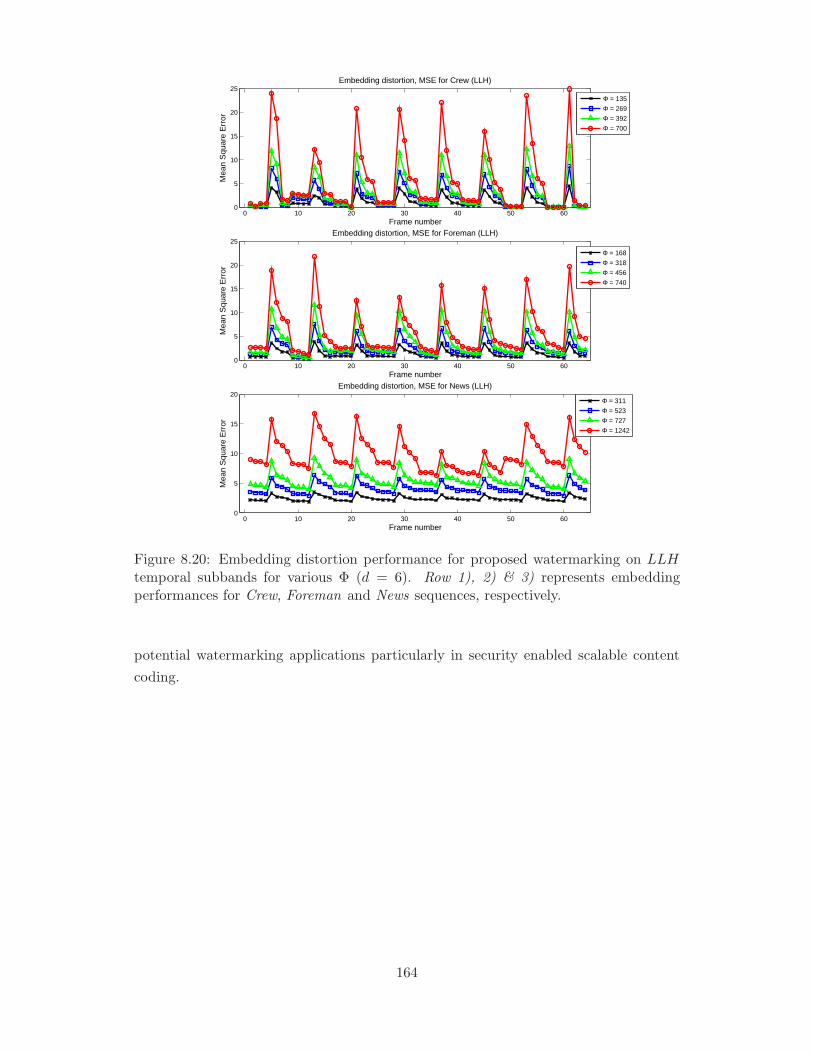
0 10 20 30 40 50 600
5
10
15
20
25
Frame numberM
ean
Squ
are
Err
or
Embedding distortion, MSE for Crew (LLH)
Φ = 135
Φ = 269
Φ = 392
Φ = 700
0 10 20 30 40 50 600
5
10
15
20
25
Frame number
Mea
n S
quar
e E
rror
Embedding distortion, MSE for Foreman (LLH)
Φ = 168
Φ = 318
Φ = 456
Φ = 740
0 10 20 30 40 50 600
5
10
15
20
Frame number
Mea
n S
quar
e E
rror
Embedding distortion, MSE for News (LLH)
Φ = 311
Φ = 523
Φ = 727
Φ = 1242
Figure 8.20: Embedding distortion performance for proposed watermarking on LLHtemporal subbands for various Φ (d = 6). Row 1), 2) & 3) represents embeddingperformances for Crew, Foreman and News sequences, respectively.
potential watermarking applications particularly in security enabled scalable content
coding.
164
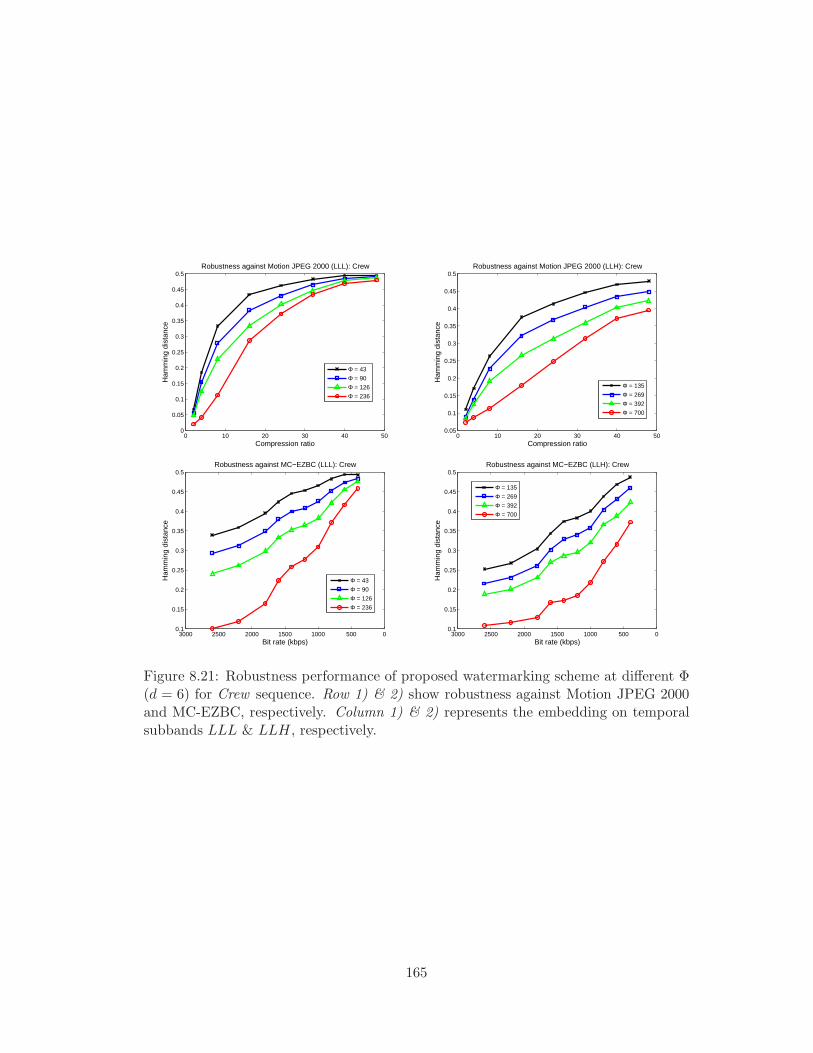
0 10 20 30 40 500
0.05
0.1
0.15
0.2
0.25
0.3
0.35
0.4
0.45
0.5
Compression ratio
Ham
min
g di
stan
ce
Robustness against Motion JPEG 2000 (LLL): Crew
Φ = 43
Φ = 90
Φ = 126
Φ = 236
0 10 20 30 40 500.05
0.1
0.15
0.2
0.25
0.3
0.35
0.4
0.45
0.5
Compression ratioH
amm
ing
dist
ance
Robustness against Motion JPEG 2000 (LLH): Crew
Φ = 135
Φ = 269
Φ = 392
Φ = 700
0500100015002000250030000.1
0.15
0.2
0.25
0.3
0.35
0.4
0.45
0.5
Bit rate (kbps)
Ham
min
g di
stan
ce
Robustness against MC−EZBC (LLL): Crew
Φ = 43
Φ = 90
Φ = 126
Φ = 236
0500100015002000250030000.1
0.15
0.2
0.25
0.3
0.35
0.4
0.45
0.5
Bit rate (kbps)
Ham
min
g di
stan
ce
Robustness against MC−EZBC (LLH): Crew
Φ = 135
Φ = 269
Φ = 392
Φ = 700
Figure 8.21: Robustness performance of proposed watermarking scheme at different Φ(d = 6) for Crew sequence. Row 1) & 2) show robustness against Motion JPEG 2000and MC-EZBC, respectively. Column 1) & 2) represents the embedding on temporalsubbands LLL & LLH, respectively.
165
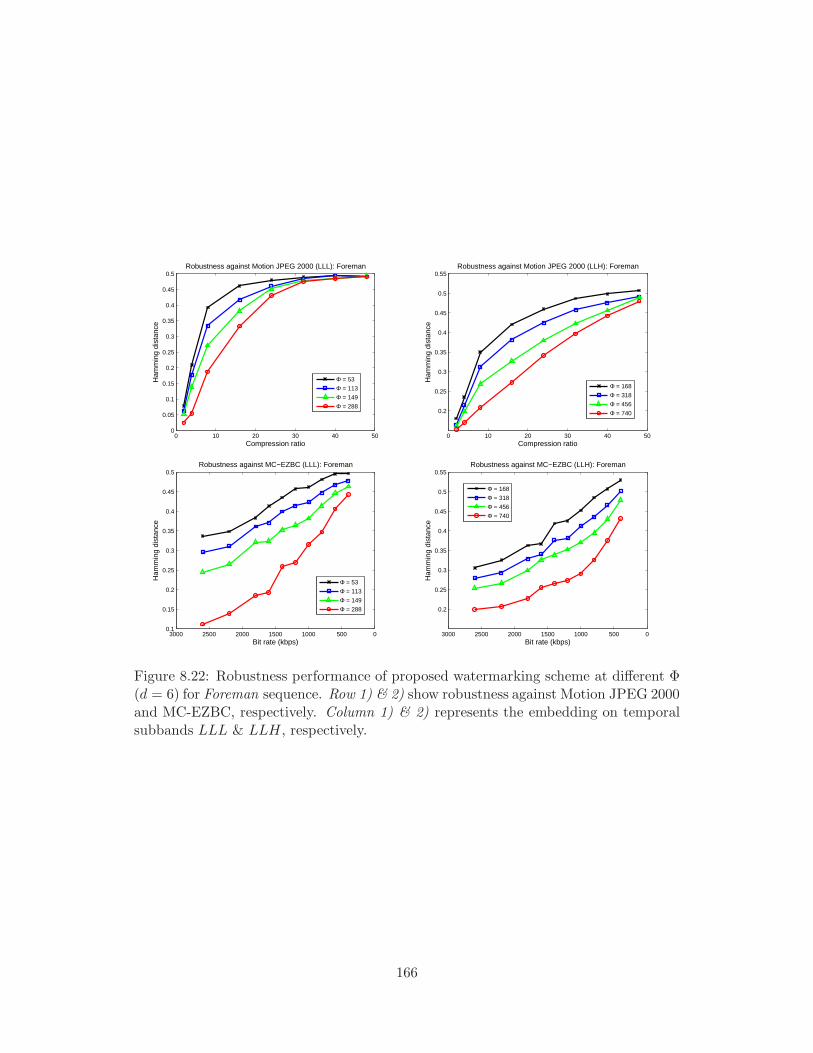
0 10 20 30 40 500
0.05
0.1
0.15
0.2
0.25
0.3
0.35
0.4
0.45
0.5
Compression ratio
Ham
min
g di
stan
ce
Robustness against Motion JPEG 2000 (LLL): Foreman
Φ = 53
Φ = 113
Φ = 149
Φ = 288
0 10 20 30 40 50
0.2
0.25
0.3
0.35
0.4
0.45
0.5
0.55
Compression ratio
Ham
min
g di
stan
ce
Robustness against Motion JPEG 2000 (LLH): Foreman
Φ = 168
Φ = 318
Φ = 456
Φ = 740
0500100015002000250030000.1
0.15
0.2
0.25
0.3
0.35
0.4
0.45
0.5
Bit rate (kbps)
Ham
min
g di
stan
ce
Robustness against MC−EZBC (LLL): Foreman
Φ = 53
Φ = 113
Φ = 149
Φ = 288
050010001500200025003000
0.2
0.25
0.3
0.35
0.4
0.45
0.5
0.55
Bit rate (kbps)
Ham
min
g di
stan
ce
Robustness against MC−EZBC (LLH): Foreman
Φ = 168
Φ = 318
Φ = 456
Φ = 740
Figure 8.22: Robustness performance of proposed watermarking scheme at different Φ(d = 6) for Foreman sequence. Row 1) & 2) show robustness against Motion JPEG 2000and MC-EZBC, respectively. Column 1) & 2) represents the embedding on temporalsubbands LLL & LLH, respectively.
166
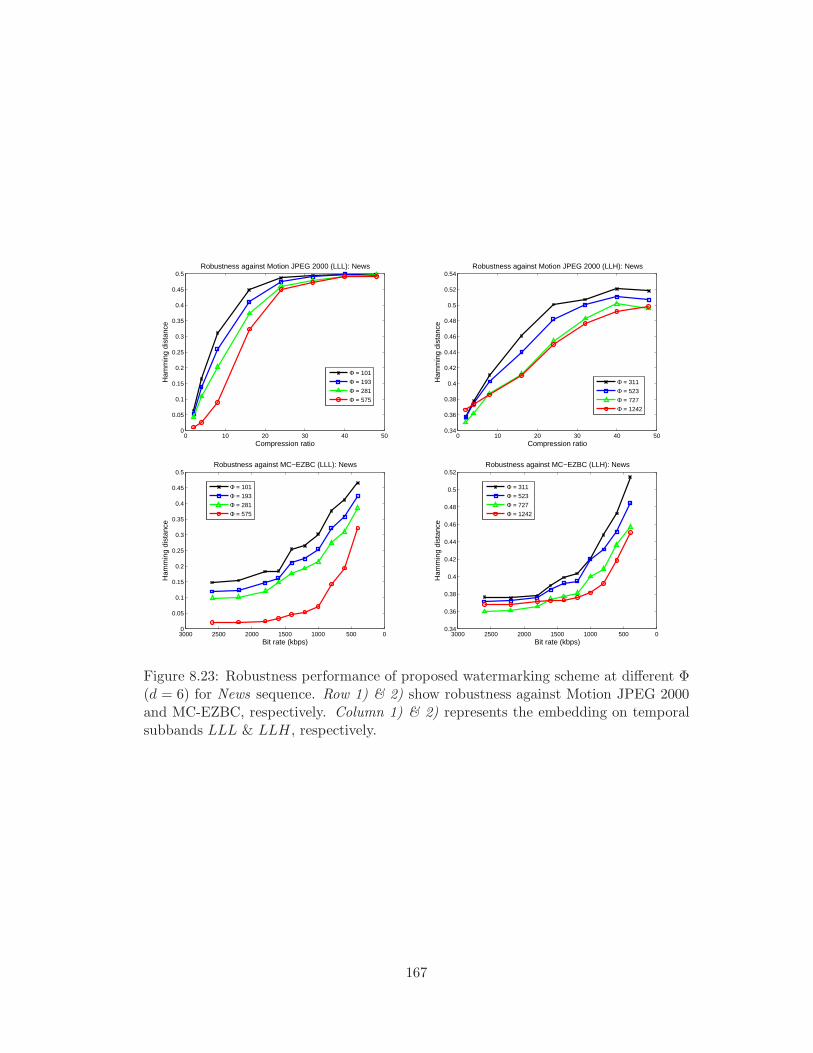
0 10 20 30 40 500
0.05
0.1
0.15
0.2
0.25
0.3
0.35
0.4
0.45
0.5
Compression ratio
Ham
min
g di
stan
ce
Robustness against Motion JPEG 2000 (LLL): News
Φ = 101
Φ = 193
Φ = 281
Φ = 575
0 10 20 30 40 500.34
0.36
0.38
0.4
0.42
0.44
0.46
0.48
0.5
0.52
0.54
Compression ratioH
amm
ing
dist
ance
Robustness against Motion JPEG 2000 (LLH): News
Φ = 311
Φ = 523
Φ = 727
Φ = 1242
0500100015002000250030000
0.05
0.1
0.15
0.2
0.25
0.3
0.35
0.4
0.45
0.5
Bit rate (kbps)
Ham
min
g di
stan
ce
Robustness against MC−EZBC (LLL): News
Φ = 101
Φ = 193
Φ = 281
Φ = 575
0500100015002000250030000.34
0.36
0.38
0.4
0.42
0.44
0.46
0.48
0.5
0.52
Bit rate (kbps)
Ham
min
g di
stan
ce
Robustness against MC−EZBC (LLH): News
Φ = 311
Φ = 523
Φ = 727
Φ = 1242
Figure 8.23: Robustness performance of proposed watermarking scheme at different Φ(d = 6) for News sequence. Row 1) & 2) show robustness against Motion JPEG 2000and MC-EZBC, respectively. Column 1) & 2) represents the embedding on temporalsubbands LLL & LLH, respectively.
167

168
Chapter 9
Conclusions and future work
The aim of this thesis was to present robust watermarking techniques for scalable coded
image and video. In Section 9.1, we conclude our contributions and in Section 9.2, we
suggest future research directions in this domain.
9.1 Conclusions
In order to achieve the final goal first we have generalized the image watermarking
schemes related to scalable coding, i.e., wavelet based algorithms. The scalable-coding
based content adaptations were considered as a potential watermark attack and a con-
tent adaptation test bed framework, for evaluating the robustness of wavelet based
watermarking, was presented in Chapter 4. The modular framework, Watermark Eval-
uation Bench for Content Adaption Modes (WEBCAM), consists of a repository of tools
for emulating MPEG-21 DIA content adaptation attacks, wavelet-based watermarking,
extraction and authentication. In this framework we used the parametric dissections
of the wavelet based watermarking algorithms to implement the tools repository and
its modular and reconfigurable wavelet-based watermarking implementation within the
framework. WEBCAM provides a formal evaluation platform to compare the perfor-
mances of different schemes under a controlled experimental environment for various
combinations of choices for those functional submodules. It also facilitates the develop-
ment of new algorithms and can also be used as an educational tool for wavelet-based
watermarking algorithm design. The content adaptation tools repository provides a
new set of attacks that are emerging in modern multimedia usage within the heteroge-
neous networks. With the use of this proposed frameworks, a comprehensive study was
169
carried out based on various parametric inputs such as, wavelet kernel selection, sub-
band selection, embedding methods, coefficient selection etc. The robustness against
scalable content adaptation was evaluated in order to identify and understand the effect
of the responsible parameters.
The imperceptibility and the robustness performance are two main properties of any
watermarking scheme and are complementary to each other. While focusing on ro-
bustness issues in this thesis, firstly we characterized the embedding distortion perfor-
mances and categorized the responsible input parameters. In Chapter 5, a universal
embedding distortion performance model was presented for wavelet based watermark-
ing schemes. Models were proposed for orthonormal wavelet bases, which is extended to
non-orthonormal wavelet kernels such as biorthogonal and non-linear wavelets. These
models suggested that the MSE of the watermarked image is directly proportional to
the weighted sum of energy of the modification values of the selected wavelet coeffi-
cients and this proposition is valid for orthonormal as well as non-orthonormal wavelet
kernels. In the case of the non-orthonormal wavelet bases a weighting parameter is
introduced and it is computed experimentally for different non-orthonormal wavelet
bases whereas in the case of orthonormal wavelets, these weighting parameters are set
to unity. The claims of the models were verified by extensive experimental simulations
for non-blind and blind type of watermarking schemes for a wide range of wavelet
kernels.
In order to propose robust watermarking techniques, in Chapter 6 we have investigated
the compression process of scalable coding schemes. However within the scope of this
thesis we have focused only on the quality scalability attacks. The quality scalable
image coding (i.e., JPEG 2000) is modeled using wavelet domain bit plane discarding
to identify the effect of the quantization and de-quantization on wavelet coefficients
and the data embedded within such coefficients. The relationship is then established
between the watermark extraction rule, using the reconstructed coefficients, and the
embedding rule, using the original coefficients, to rank the wavelet coefficients and other
parameters according to their ability to retain the watermark data intact under quality
scalable coding-based content adaptation. Using such relationships we have presented
models for enhancing the robustness of non-blind and blind watermarking algorithms
against quality scalability-based content adaptation. The proposed model for non-
blind watermarking specifies the range of coefficient magnitudes that are capable of
correctly extracting the embedded watermark bit under compression by considering
wavelet domain bit plane discarding and ranks the coefficients accordingly. Similarly for
blind algorithms, the proposed model specifies the range of magnitudes for the modified
coefficient in order to extract the watermark data under compression. The simulations
170

showed that the proposed models outperform the robustness performance of the existing
watermarking methods, where the model was not used. The high robustness of the
models was experimentally verified for the JPEG 2000 quality scalability.
In the next phase of the thesis, research on video watermarking techniques were carried
out. In Chapter 7, we have investigated various video watermarking schemes and pro-
posed a novel MCTF based video decomposition architecture suitable for video water-
marking techniques. The proposed scheme overcame the weaknesses (motion related
flickers) of frame-by-frame video watermarking and offers improved spatio-temporal
decomposition considering object motion into it. Depending on motion and texture
characteristics of the video and the choice of spatial-temporal sub band for watermark
embedding, MCTF has to be performed either on the spatial domain (t+2D) or in the
wavelet domain (2D+t). In this work we proposed an improved video watermarking
schemes by offering a generalized motion compensated 2D+t+2D framework for wa-
termark embedding. An improved MCTF is used by modifying the MCTF update step
to follow the motion trajectory in hierarchical temporal decomposition by using direct
motion vector fields in the update step and implied motion vectors in the prediction
step. The embedding distortion performance evaluated using both MSE and flicker dif-
ference metric showed superior performance for the MMCTF driven 2D+t+2D subband
domain watermarking as opposed to frame-by-frame 2D wavelet domain watermark-
ing which does not take motion into account. The proposed subband decomposition
also provides low complexity as MCTF is performed only on subbands where the wa-
termark is embedded. In terms of watermarking methods, we have comprehensively
evaluated the performances of both non-blind and blind watermarking methods. The
robustness performance against scalable coding based compressions attacks, including
Motion JPEG 2000, MC-EZBC and H.264-SVC (scalable extension) were evaluated.
In conclusion within the proposed 2D+t+2D filtering framework, 2D+t based video
watermarking scheme outperformed conventional t+2D based watermarking schemes
in a non-blind as well as a blind watermarking scenario. To offer further improvements,
we have extended our robustness models for image watermarking, into the proposed
video watermarking scheme, resulting in better robustness performance against various
scalable compressions.
Finally, we proposed a novel concept of scalable blind image watermarking in Chapter 8.
Firstly we established the concept for image watermarking and then extended the same
for video watermarking. The proposed scheme generates a distortion-constrained ro-
bustness scalable watermarked media (i.e., image or video) code stream which consists
of hierarchically nested joint distortion-robustness coding atoms. The code stream is
generated using a new wavelet domain binary tree guided rules-based blind watermark-
171

ing algorithm. The code stream is then truncated at any distortion-robustness atom
level to generate the watermarked image / video with the desired distortion-robustness
requirements. A universal blind extractor enables the extracting of watermark data
from the watermarked media created using any truncated code stream. The algorithm
is developed based on the bit plane discarding model and outperformed the existing
blind watermarking method. The concept was experimentally verified for images and
the robustness against JPEG 2000 quality scalability was tested. The scheme is further
extended in MCTF based video watermarking scheme and the robustness was evalu-
ated against Motion JPEG 2000, MC-EZBC and H.264/SVC. Such a scheme allows
incorporating watermarking within scalable content coding and adds new direction in
watermarking research which has many potential watermarking applications particu-
larly in security enabled scalable media production and distribution.
9.2 Future work
The research discussed in this thesis indicates many direction to pursue further research
in this domain. Here we have summarized some of them as follows:
– Modeling transmission channel related error and its effect on watermarking robustness
for scalable coded media. Combining such a research with research outcomes in this
thesis, can provide a complete solution to digital right management in live streaming
or multimedia content sharing.
– Further improvement to WEBCAM framework to propose optimized parameter set
and embedding algorithm, based on the input image or applications. This can be
done by comparing the parameter sets for the given input image in order to offer best
embedding performance or most robustness.
– Mathematical modeling similar to Chapter 5 between various embedding performance
metrics, such as, JND, SSIM or wPSNR, and watermarking input parameters in order to
obtain best parameter set which can offer improved visual quality and better robustness.
– Robust watermarking techniques for Region Of Interest (ROI) based image and video
coding can provide the right balance between imperceptibility and robustness. A visual
attention model based watermarking technique can be a possible way to achieve the
same.
– Developing watermarking based authentication applications in JPEG 2000 streaming,
e.g., controlled distribution of copyrighted images to mobile, portable devices, computer
172
etc.
– Research on compression domain watermarking techniques for H.264/SVC. Using a
similar approach presented in this thesis, a robustness model can be proposed in order
to enhance the robustness against H.264/SVC based content adaptation.
– Developing real time watermarking based authentication scheme using bit stream do-
main watermarking for H.264/SVC etc. Such schemes are useful in multimedia content
distribution including user authentication for pay-TV.
– Developing joint compression domain scalable watermarking based image and video
coding schemes that offers scalability in media distribution while resolving digital right
management (DRM) issues. Such an application development is possible using the
scalable watermarking scheme suggested in this thesis.
173

174
Chapter 10
Appendix A
Priliminary robustness results of MCTF based video water-
marking schemes against H.264-SVC scalable compression
175
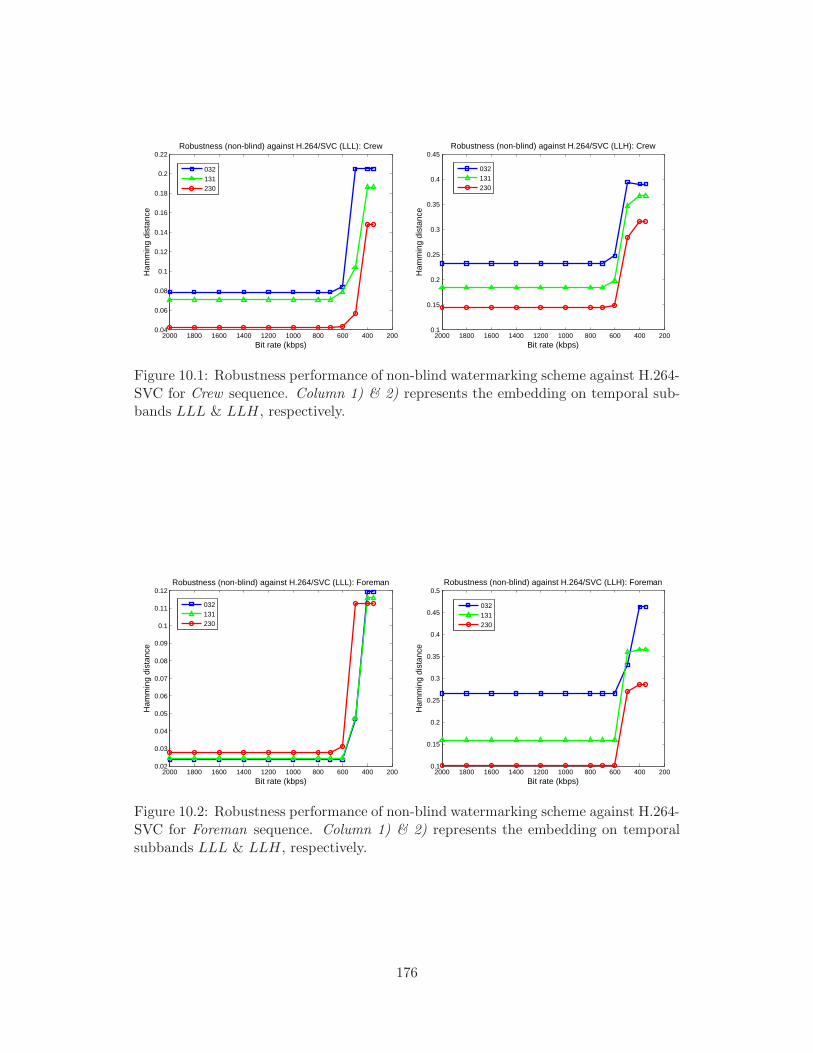
2004006008001000120014001600180020000.04
0.06
0.08
0.1
0.12
0.14
0.16
0.18
0.2
0.22
Bit rate (kbps)
Ham
min
g di
stan
ceRobustness (non-blind) against H.264/SVC (LLL): Crew
032131230
2004006008001000120014001600180020000.1
0.15
0.2
0.25
0.3
0.35
0.4
0.45
Bit rate (kbps)
Ham
min
g di
stan
ce
Robustness (non-blind) against H.264/SVC (LLH): Crew
032131230
Figure 10.1: Robustness performance of non-blind watermarking scheme against H.264-SVC for Crew sequence. Column 1) & 2) represents the embedding on temporal sub-bands LLL & LLH, respectively.
2004006008001000120014001600180020000.02
0.03
0.04
0.05
0.06
0.07
0.08
0.09
0.1
0.11
0.12
Bit rate (kbps)
Ham
min
g di
stan
ce
Robustness (non-blind) against H.264/SVC (LLL): Foreman
032131230
2004006008001000120014001600180020000.1
0.15
0.2
0.25
0.3
0.35
0.4
0.45
0.5
Bit rate (kbps)
Ham
min
g di
stan
ce
Robustness (non-blind) against H.264/SVC (LLH): Foreman
032131230
Figure 10.2: Robustness performance of non-blind watermarking scheme against H.264-SVC for Foreman sequence. Column 1) & 2) represents the embedding on temporalsubbands LLL & LLH, respectively.
176

2004006008001000120014001600180020000.048
0.05
0.052
0.054
0.056
0.058
0.06
0.062
Bit rate (kbps)
Ham
min
g di
stan
ceRobustness (non-blind) against H.264/SVC (LLL): News
032131230
2004006008001000120014001600180020000.16
0.17
0.18
0.19
0.2
0.21
0.22
0.23
Bit rate (kbps)
Ham
min
g di
stan
ce
Robustness (non-blind) against H.264/SVC (LLH): News
032131230
Figure 10.3: Robustness performance of non-blind watermarking scheme against H.264-SVC for News sequence. Column 1) & 2) represents the embedding on temporalsubbands LLL & LLH, respectively.
2004006008001000120014001600180020000.3
0.32
0.34
0.36
0.38
0.4
0.42
Bit rate (kbps)
Ham
min
g di
stan
ce
Robustness (blind) against H.264/SVC (LLL): Crew
032131230
2004006008001000120014001600180020000.43
0.44
0.45
0.46
0.47
0.48
0.49
0.5
Bit rate (kbps)
Ham
min
g di
stan
ce
Robustness (blind) against H.264/SVC (LLH): Crew
032131230
Figure 10.4: Robustness performance of blind watermarking scheme against H.264-SVCfor Crew sequence. Column 1) & 2) represents the embedding on temporal subbandsLLL & LLH, respectively.
177

2004006008001000120014001600180020000.2
0.22
0.24
0.26
0.28
0.3
0.32
0.34
Bit rate (kbps)
Ham
min
g di
stan
ceRobustness (blind) against H.264/SVC (LLL): Foreman
032131230
2004006008001000120014001600180020000.42
0.43
0.44
0.45
0.46
0.47
0.48
0.49
0.5
0.51
Bit rate (kbps)
Ham
min
g di
stan
ce
Robustness (blind) against H.264/SVC (LLH): Foreman
032131230
Figure 10.5: Robustness performance of blind watermarking scheme against H.264-SVC for Foreman sequence. Column 1) & 2) represents the embedding on temporalsubbands LLL & LLH, respectively.
200400600800100012001400160018002000
0.29
0.295
0.3
0.305
0.31
0.315
0.32
0.325
Bit rate (kbps)
Ham
min
g di
stan
ce
Robustness (blind) against H.264/SVC (LLL): News
032131230
2004006008001000120014001600180020000.462
0.464
0.466
0.468
0.47
0.472
0.474
0.476
0.478
0.48
Bit rate (kbps)
Ham
min
g di
stan
ce
Robustness (blind) against H.264/SVC (LLH): News
032131230
Figure 10.6: Robustness performance of blind watermarking scheme against H.264-SVCfor News sequence. Column 1) & 2) represents the embedding on temporal subbandsLLL & LLH, respectively.
178
References
[1] D. S. Taubman and M. W. Marcellin, JPEG2000 Image Compression Fundamen-
tals, Standards and Practice. USA: Springer, 2002.
[2] H. Schwarz, D. Marpe, and T. Wiegand, “Overview of the scalable video coding
extension of the H.264/AVC standard,” IEEE Trans. Circ. and Syst. for Video
Tech, vol. 17, no. 9, pp. 1103–1120, Sept. 2007.
[3] S. Kandadai and C. D. Creusere, “Scalable audio compression at low bitrates,”
IEEE Trans. Audio, Speech, and Language Processing, vol. 16, no. 5, pp. 969–979,
July 2008.
[4] A. Vetro, “MPEG-21 digital item adaptation: enabling universal multimedia
access,” IEEE Multimedia, vol. 11, no. 1, pp. 84–87, Jan.-March 2004.
[5] L. Xie and G. R. Arce, “Joint wavelet compression and authentication water-
marking,” in Proc. IEEE ICIP, vol. 2, 1998, pp. 427–431.
[6] F. Huo and X. Gao, “A wavelet based image watermarking scheme,” in Proc.
IEEE ICIP, 2006, pp. 2573–2576.
[7] D. Kundur and D. Hatzinakos, “Digital watermarking using multiresolution
wavelet decomposition,” in Proc. IEEE ICASSP, vol. 5, 1998, pp. 2969–2972.
[8] C. Jin and J. Peng, “A robust wavelet-based blind digital watermarking algo-
rithm,” Information Technology Journal, vol. 5, no. 2, pp. 358–363, 2006.
[9] P. Campisi, “Video watermarking in the 3D-DWT domain using quantization-
based methods,” in Proc. IEEE MMSP, 2005, pp. 1–4.
[10] H. Tao, J. Liu, and J. Tian, “Digital watermarking technique based on integer
Harr transforms and visual properties,” in Proc. SPIE Image Compression and
Encryption Tech., vol. 4551, no. 1, 2001, pp. 239–244.
179
[11] X. Xia, C. G. Boncelet, and G. R. Arce, “Wavelet transform based watermark
for digital images,” Optic Express, vol. 3, no. 12, pp. 497–511, Dec. 1998.
[12] X. C. Feng and Y. Yang, “A new watermarking method based on DWT,” in Proc.
Int’l Conf. on Computational Intelligence and Security, Lect. Notes in Comp. Sci.
(LNCS), vol. 3802, 2005, pp. 1122–1126.
[13] Q. Gong and H. Shen, “Toward blind logo watermarking in JPEG-compressed
images,” in Proc. Int’l Conf. on Parallel and Distributed Comp., Appl. and Tech.,
(PDCAT), 2005, pp. 1058–1062.
[14] M. Barni, F. Bartolini, and A. Piva, “Improved wavelet-based watermarking
through pixel-wise masking,” IEEE Trans. Image Processing, vol. 10, no. 5, pp.
783–791, May 2001.
[15] D. Kundur and D. Hatzinakos, “Toward robust logo watermarking using mul-
tiresolution image fusion principles,” IEEE Trans. Multimedia, vol. 6, no. 1, pp.
185–198, Feb. 2004.
[16] Z. Zhang and Y. L. Mo, “Embedding strategy of image watermarking in wavelet
transform domain,” in Proc. SPIE Image Compression and Encryption Tech.,
vol. 4551, no. 1, 2001, pp. 127–131.
[17] J. R. Kim and Y. S. Moon, “A robust wavelet-based digital watermarking using
level-adaptive thresholding,” in Proc. IEEE ICIP, vol. 2, 1999, pp. 226–230.
[18] S. Marusic, D. B. H. Tay, G. Deng, and P. Marimuthu, “A study of biorthogonal
wavelets in digital watermarking,” in Proc. IEEE ICIP, vol. 3, Sept. 2003, pp.
II–463–6.
[19] T.-S. Chen, J. Chen, and J.-G. Chen, “A simple and efficient watermarking tech-
nique based on JPEG2000 codec,” in Proc. Int’l Symp. on Multimedia Software
Eng., 2003, pp. 80–87.
[20] F. Dufaux, S. J. Wee, J. G. Apostolopoulos, and T. Ebrahimi, “JPSEC for secure
imaging in JPEG2000,” in Proc. SPIE Appl. of Digital Image Processing XXVII,
vol. 5558, no. 1, 2004, pp. 319–330.
[21] Y.-S. Seo, M.-S. Kim, H.-J. Park, H.-Y. Jung, H.-Y. Chung, Y. Huh, and J.-D.
Lee, “A secure watermarking for JPEG2000,” in Proc. IEEE ICIP, vol. 2, 2001,
pp. 530–533.
[22] P. Meerwald, “Quantization watermarking in the JPEG2000 coding pipeline,” in
Proc. Int’l Working Conf. on Comms. and Multimedia Security, 2001, pp. 69–79.
180

[23] Q. Sun and S. Chang, “A secure and robust digital signature scheme for
JPEG2000 image authentication,” IEEE Trans. Multimedia, vol. 7, no. 3, pp.
480–494, June 2005.
[24] R. Grosbois, P. Gerbelot, and T. Ebrahimi, “Authentication and access control
in the JPEG2000 compressed domain,” in Proc. SPIE Appl. of Digital Image
Processing XXIV, vol. 4472, no. 1, 2001, pp. 95–104.
[25] M. A. Suhail, M. S. Obaidat, S. S. Ipson, and B. Sadoun, “A comparative study
of digital watermarking in JPEG and JPEG2000 environments,” Information
Sciences, vol. 151, pp. 93–105, 2003.
[26] R. Grosbois and T. Ebrahimi, “Watermarking in the JPEG 2000 domain,” in
Proc. IEEE MMSP, 2001, pp. 339 –344.
[27] F. Hartung and B. Girod, “Watermarking of uncompressed and compressed
video,” Signal Processing, vol. 66, no. 3, pp. 283–301, 1998.
[28] G. Dorr and J.-L. Dugelay, “A guide tour of video watermarking,” Signal Pro-
cessing: Image Communication, vol. 18, no. 4, pp. 263–282, 2003.
[29] W. Zhu, Z. Xiong, and Y.-Q. Zhang, “Multiresolution watermarking for images
and video,” IEEE Trans. Circ. and Syst. for Video Tech, vol. 9, no. 4, pp. 545–
550, Jun 1999.
[30] I. J. Cox, J. Kilian, F. T. Leighton, and T. Shamoon, “Secure spread spectrum
watermarking for multimedia,” IEEE Trans. Image Processing, vol. 6, no. 12, pp.
1673–1687, Dec. 1997.
[31] Y. Li, X. Gao, and J. Hongbing, “A 3D wavelet based spatial-temporal approach
for video watermarking,” in Proc. IEEE Int’l Conf. on Comput. Intelligence and
Multimedia App. (ICCIMA), 2003, pp. 260–265.
[32] S.-J. Kim, S.-H. Lee, K.-S. Moon, W.-H. Cho, I.-T. Lim, K.-R. Kwon, and K.-I.
Lee, “A new digital video watermarking using the dual watermark images and
3D DWT,” in Proc. IEEE Region 10 TENCON, vol. 1, 2004, pp. 291–294.
[33] S. Choi and J. W. Woods, “Motion-compensated 3-D subband coding of video,”
IEEE Trans. Image Processing, vol. 8, no. 2, pp. 155–167, Feb. 1999.
[34] T. P.-C. Chen and T. Chen, “Progressive image watermarking,” in Proc. IEEE
ICME, vol. 2, 2000, pp. 1025 –1028.
[35] P.-C. Su, H.-J. M. Wang, and C.-C. J. Kuo, “An integrated approach to im-
age watermarking and JPEG-2000 compression,” The Journal of VLSI Signal
Processing, vol. 27, no. 1, pp. 35–53, Feb. 2001.
181
[36] D. Bhowmik and C. Abhayaratne, “The effect of quality scalable image com-
pression on robust watermarking,” in Proc. Int’l Workshop on Digital Signal
Processing, 2009, pp. 1–8.
[37] P. Meerwald and A. Uhl, “Scalability evaluation of blind spread-spectrum image
watermarking,” in Proc. Int’l Workshop on Digital Watermarking (IWDW ’08),
Lect. Notes in Comp. Sci. (LNCS), vol. 5450, 2008, pp. 61–75.
[38] A. Piper, R. Safavi-Naini, and A. Mertins, “Resolution and quality scalable
spread spectrum image watermarking,” in Proc. 7th workshop on Multimedia
and Security: MM&Sec’05, 2005, pp. 79–90.
[39] N. Sprljan, M. Mrak, G. C. K. Abhayaratne, and E. Izquierdo, “A scalable cod-
ing framework for efficient video adaptation,” in Proc. Int’l Workshop on Image
Analysis for Multimedia Interactive Services (WIAMIS), 2005.
[40] I. J. Cox, M. L. Miller, and J. A. Bloom, Digital watermarking. San Francisco,
CA, USA: Morgan Kaufmann Publishers Inc., 2002.
[41] M. Barni and F. Bartolini, Watermarking Systems Engineering (Signal Processing
and Communications, 21). Boca Raton, FL, USA: CRC Press, Inc., 2004.
[42] S. P. Mohanty, “Digital watermarking : A tuto-
rial review,” Available: http://www.cse.unt.edu/ smo-
hanty/research/OtherPublications/MohantyWatermarkingSurvey1999.pdf
[Accessed: Apr. 2010]., University of North Texas, Texas, USA, Tech. Rep.,
1999.
[43] J. Fridrich, M. Goljan, and A. C. Baldoza, “New fragile authentication watermark
for images,” in Proc. IEEE ICIP, vol. 1, 2000, pp. 446 –449.
[44] C. Y. Lin and S. F. Chang, “Semifragile watermarking for authenticating JPEG
visual content,” in Proc. SPIE Security, Steganography, and Watermarking of
Multimedia Contents, vol. 3971, no. 1, 2000, pp. 140–151.
[45] M. Barni, F. Bartolini, and T. Furon, “A general framework for robust water-
marking security,” Signal Processing, vol. 83, pp. 2069–2084, Oct. 2003.
[46] F. Cayre, C. Fontaine, and T. Furon, “Watermarking security: theory and prac-
tice,” IEEE Trans. Signal Processing, vol. 53, no. 10, pp. 3976 – 3987, Oct. 2005.
[47] A. Adelsbach, S. Katzenbeisser, and A. R. Sadeghi, “Cryptography meets wa-
termarking: Detecting watermarks with minimal or zero knowledge disclosure,”
in Proc. European Signal Processing Conference (EUSIPCO), vol. 1, 2004, pp.
446–449.
182
[48] O. Kwon and C. Lee, “Objective method for assessment of video quality using
wavelets,” in Proc. IEEE Int’l Symp. on Industrial Electronics (ISIE 2001).,
vol. 1, 2001, pp. 292–295.
[49] Z. Wang, A. C. Bovik, H. R. Sheikh, and E. P. Simoncelli, “Image quality assess-
ment: from error visibility to structural similarity,” IEEE Trans. Image Process-
ing, vol. 13, no. 4, pp. 600–612, April 2004.
[50] A. B. Watson, “Visual optimization of DCT quantization matrices for individual
images,” in Proc. American Institute of Aeronautics and Astronautics (AIAA)
Computing in Aerospace, vol. 9, 1993, pp. 286–291.
[51] H. G. Koumaras, “Subjective video quality assessment methods for multimedia
applications,” Geneva, Switzerland, Tech. Rep. ITU-R BT.500-11, april 2008.
[52] M. Ramkumar, A. N. Akansu, and A. A. Alatan, “A robust data hiding scheme
for image using DFT,” in Proc. IEEE ICIP, 1999, pp. 211–215.
[53] J. L. Dugelay and S. Roche, “Fractal transform based large digital watermark
embedding and robust full blind extraction,” in Proc. IEEE int’l conf. on Multi-
media & Computing Systems (ICMCS), vol. 2, 1999, pp. 1003–1004.
[54] A. Bors and I. Pitas, “Image watermarking using DCT domain constraints,” in
Proc. IEEE ICIP, 1996, pp. 231–234.
[55] M. A. Suhail and M. S. Obaidat, “Digital watermarking-based DCT and JPEG
model,” IEEE transactions on instrumentation and measurement, vol. 52, no. 5,
pp. 1640–1647, Oct 2003.
[56] J. R. Hernandez, M. Amado, and F. Perez-Gonzalez, “DCT-domain watermark-
ing techniques for still images: detector performance analysis and a new struc-
ture,” IEEE Trans. Image Processing, vol. 9, no. 1, pp. 55 –68, jan 2000.
[57] P. Vinod and P. K. Bora, “Motion-compensated inter-frame collusion attack on
video watermarking and a countermeasure,” IEE Proceedings on Information
Security, vol. 153, no. 2, pp. 61 – 73, June 2006.
[58] G. Strang and T. Nguyen, Wavelets and Filter Banks, 2nd ed. USA: Wellesley-
CambridgePress, 1997.
[59] M. Vetterli and J. Kovacevic, Wavelets and subband coding. Upper Saddle River,
NJ, USA: Prentice-Hall, Inc., 1995.
[60] I. Daubechies and W. Sweldens, “Factoring wavelet transforms into lifting steps,”
Journal of Fourier Anal. Appl., vol. 4, no. 3, pp. 245–267, 1998.
183
[61] H. Heijmans and J. Goutsias, “Nonlinear multiresolution signal decomposition
schemes: Part II: Morphological wavelets,” IEEE Trans. Image Processing, vol. 9,
no. 11, pp. 1897–1913, Nov. 2000.
[62] F. J. Hampson and J.-C. Pesquet, “A nonlinear subband decomposition with
perfect reconstruction,” in Proc. IEEE ICASSP, vol. 3, 1996, pp. 1523–1526.
[63] G. C. K. Abhayaratne and H. Heijmans, “A novel morphological subband decom-
position scheme for 2D+t wavelet video coding,” in Proc. Int’l Symp. on Image
and Signal Processing and Analysis, vol. 1, 2003, pp. 239–244.
[64] J.-R. Ohm, “Three-dimensional subband coding with motion compensation,”
IEEE Trans. Image Processing, vol. 3, no. 5, pp. 559 –571, Sep. 1994.
[65] P. Campisi, A. Neri, and M. Visconti, “Wavelet-based method for high-frequency
subband watermark embedding,” in Proc. SPIE Multimedia Sys. and Appl. III,
vol. 4209, 2001, pp. 344–353.
[66] P. Meerwald and A. Uhl, “A survey of wavelet-domain watermarking algorithms,”
in Proc. SPIE Security and Watermarking of Multimedia Contents III, vol. 4314,
2001, pp. 505–516.
[67] D. Bhowmik and C. Abhayaratne, “Morphological wavelet domain image water-
marking,” in Proc. European Signal Processing Conference (EUSIPCO), 2007,
pp. 2539–2543.
[68] F. Hartung and M. Kutter, “Multimedia watermarking techniques,” Proceedings
of the IEEE, vol. 87, no. 7, pp. 1079 –1107, Jul 1999.
[69] T. Kalker, G. Depovere, J. Haitsma, and M. J. Maes, “Video watermarking
system for broadcast monitoring,” in SPIE Conference Series, vol. 3657, 1999,
pp. 103–112.
[70] H. Inoue, A. Miyazaki, T. Araki, and T. Katsura, “A digital watermark method
using the wavelet transform for video data,” in Proc. IEEE ISCAS, vol. 4, Jul
1999, pp. 247–250.
[71] G. Depovere, T. Kalker, J. Haitsma, M. Maes, L. de Strycker, P. Termont, J. Van-
dewege, A. Langell, C. Alm, P. Norman, G. O’Reilly, B. Howes, H. Vaanholt,
R. Hintzen, P. Donnelly, and A. Hudson, “The VIVA project: digital watermark-
ing for broadcast monitoring,” in Proc. IEEE ICIP, vol. 2, 1999, pp. 202–205.
[72] M. P. Mitrea, T. B. Zaharia, F. J. Preteux, and A. Vlad, “Video watermarking
based on spread spectrum and wavelet decomposition,” in Wavelet Applications
in Industrial Processing II, vol. 5607, no. 1. SPIE, 2004, pp. 156–164.
184

[73] S. N. Merchant, A. Harchandani, S. Dua, H. Donde, and I. Sunesara, “Water-
marking of video data using integer-to-integer discrete wavelet transform,” in
Proc. IEEE TENCON, vol. 3, 2003, pp. 939 – 943.
[74] F. Deguillaume, G. Csurka, J. J. O’Ruanaidh, and T. Pun, “Robust 3D DFT
video watermarking,” in Proc. Security and Watermarking of Multimedia Con-
tents, SPIE, vol. 3657, no. 1, 1999, pp. 113–124.
[75] J. H. Lim, D. J. Kim, H. T. Kim, and C. S. Won, “Digital video watermarking
using 3D-DCT and intracubic correlation,” in Proc. SPIE Security and Water-
marking of Multimedia Contents III, vol. 4314, no. 1, 2001, pp. 64–72.
[76] D.-W. Xu, “A blind video watermarking algorithm based on 3D wavelet trans-
form,” in Proc. Int’l Conf. on Computational Intelligence and Security, vol. 0,
2007, pp. 945–949.
[77] Z. Huai-yu, L. Ying, andW. Cheng-ke, “A blind spatial-temporal algorithm based
on 3D wavelet for video watermarking,” in Proc. IEEE ICME, vol. 3, 2004, pp.
1727 – 1730.
[78] P. Campisi and A. Neri, “Video watermarking in the 3D-DWT domain using
perceptual masking,” in Proc. IEEE ICIP, vol. 1, 2005, pp. 997–1000.
[79] P. Vinod, G. Doerr, and P. K. Bora, “Assessing motion-coherency in video wa-
termarking,” in Proc. ACM Multimedia and Security, 2006, pp. 114–119.
[80] P. Meerwald and A. Uhl, “Blind motion-compensated video watermarking,” in
Proc. IEEE ICME, 2008, pp. 357–360.
[81] K. Su, D. Kundur, and D. Hatzinakos, “Statistical invisibility for collusion-
resistant digital video watermarking,” IEEE Trans. Multimedia, vol. 7, no. 1,
pp. 43 – 51, Feb 2005.
[82] S. J. Weng, T. T. Lu, and P. C. Chang, “Key-based video watermarking system
on MPEG-2,” in Proc. SPIE Security and Watermarking of Multimedia Contents
V, vol. 5020, no. 1, 2003, pp. 516–525.
[83] E. Hauer and M. Steinebach, “Robust digital watermark solution for intercoded
frames of MPEG video data,” in Proc. SPIE Security, Steganography, and Wa-
termarking of Multimedia Contents VII, vol. 5681, no. 1, 2005, pp. 381–390.
[84] Y. Y. Chung and F. F. Xu, “A secure digital watermarking scheme for MPEG-2
video copyright protection,” in Proc. IEEE Int’l Conf. on Video and Signal Based
Surveillance, AVSS, 2006, pp. 84 –84.
185
[85] J. Zhang, A. T. S. Ho, G. Qiu, and P. Marziliano, “Robust video watermarking
of H.264/AVC,” IEEE Trans. Circuits and Systems II: Express Briefs, vol. 54,
no. 2, pp. 205–209, Feb 2007.
[86] M. Noorkami and R. M. Mersereau, “Compressed-domain video watermarking
for H.264,” in Proc. IEEE ICIP, vol. 2, 2005, pp. 890–893.
[87] G. Z. Wu, Y. J. Wang, and W. H. Hsu, “Robust watermark embedding/detection
algorithm for H.264 video,” SPIE Journal of Electronic Imaging, vol. 14, no. 1,
p. 013013, 2005.
[88] F. Hartung and B. Girod, “Digital watermarking of MPEG-2 coded video in the
bitstream domain,” in Proc. IEEE ICASSP, vol. 4, 1997, pp. 2621 –2624.
[89] H. Liu, F. Shao, and J. Huang, “A MPEG-2 video watermarking algorithm with
compensation in bit stream,” in Digital Rights Management. Technologies, Is-
sues, Challenges and Systems, ser. Lect. Notes in Comp. Sc. Springer Berlin /
Heidelberg, 2006, vol. 3919, pp. 123–134.
[90] S. Biswas, S. R. Das, and E. M. Petriu, “An adaptive compressed MPEG-2 video
watermarking scheme,” IEEE Trans. Instrumentation and Measurement, vol. 54,
no. 5, pp. 1853 – 1861, 2005.
[91] B. G. Mobasseri and M. P. Marcinak, “Watermarking of MPEG-2 video in com-
pressed domain using VLC mapping,” in Proc. 7th workshop on Multimedia and
Security: MM&Sec’05, 2005, pp. 91–94.
[92] S. Sakazawa, Y. Takishima, and Y. Nakajima, “H.264 native video watermarking
method,” in Proc. IEEE ISCAS, 2006, p. 4 pp.
[93] L. Zhang, Y. Zhu, and L. M. Po, “A novel watermarking scheme with compen-
sation in bit-stream domain for H.264/AVC,” in Proc. IEEE ICASSP, 2010, pp.
1758 –1761.
[94] J. Zhang, J. Li, and L. Zhang, “Video watermark technique in motion vector,” in
Proc. XIV Brazilian Symposium on Computer Graphics and Image Processing,
2001, pp. 179 –182.
[95] Z. Liu, H. Liang, X. Niu, and Y. Yang, “A robust video watermarking in motion
vectors,” in Proc. 7th Int’l Conf. on Signal Processing, ICSP, vol. 3, 2004, pp.
2358 – 2361.
[96] K.-W. Kang, K. S. Moon, G. S. Jung, and J. N. Kim, “An efficient video wa-
termarking scheme using adaptive threshold and minimum modification on mo-
tion vectors,” in Image Analysis and Recognition, ser. Lect. Notes in Comp. Sc.
Springer Berlin / Heidelberg, 2005, vol. 3656, pp. 294–301.
186

[97] N. Mohaghegh and O. Fatemi, “H.264 copyright protection with motion vector
watermarking,” in Proc. Int’l Conf. on Audio, Language and Image Processing,
ICALIP, 2008, pp. 1384 –1389.
[98] W. Pei, Z. Zhendong, and L. Li, “A video watermarking scheme based on mo-
tion vectors and mode selection,” in Proc. Int’l Conf. on Computer Science and
Software Engineering, vol. 5, 2008, pp. 233 –237.
[99] D. Bhowmik and C. Abhayaratne, “A watermark evaluation bench for content
adaptation modes,” in Proc. IET Int’l Conf. on Visual Media Production, 2007,
pp. 1–1.
[100] ——, “Evaluation of watermark robustness to JPEG2000 based content adapta-
tion attacks,” in Proc. IET Int’l Conf. on Visual Info. Eng. (VIE ’08), 2008, pp.
789–794.
[101] ——, “A framework for evaluating wavelet based watermarking for scalable coded
digital item adaptation attacks,” in Proc. SPIE Wavelet Appl. in Industrial Pro-
cessing VI, vol. 7248, no. 1, 2009, p. 72480M (10 pages).
[102] ——. Watermarking Evaluation Bench for Content Adaptation Modes (WE-
BCAM). Available: http://svc.group.shef.ac.uk/webcam.html [Accessed: Jan.
2010].
[103] F. A. Petitcolas, M. Steinebach, F. Raynal, J. Dittmann, C. Fontaine, and
N. Fates, “Public automated web-based evaluation service for watermarking
schemes: StirMark benchmark,” in Proc. IEEE ICIP, vol. 4314, 2001, pp. 575–
584.
[104] S. Pereira, S. Voloshynovskiy, M. Madueno, S. M.-Maillet, and T. Pun, “Second
generation benchmarking and application oriented evaluation,” in Proc. Int’l.
Information Hiding Workshop, Lect. Notes in Comp. Sci. (LNCS), vol. 2137,
2001, pp. 340–353.
[105] V. Solachidis, A. Tefas, N. Nikolaidis, S. Tsekeridou, A. Nikolaidis, and I. Pitas,
“A benchmarking protocol for watermarking methods,” in Proc. IEEE ICIP,
vol. 3, 2001, pp. 1023–1026.
[106] O. Guitart, H. C. Kim, and E. J. Delp-III, “Watermark evaluation testbed,”
SPIE Journal of Electronic Imaging, vol. 15, p. 041106 (13 pages), 2006.
[107] M. Ejima and A. Miyazaki, “On the evaluation of performance of digital wa-
termarking in the frequency domain,” in Proc. IEEE ICIP, vol. 2, 2001, pp.
546–549.
187
[108] T. Ebrahimi and R. Grosbois, “Secure JPEG 2000-JPSEC,” in Proc. IEEE
ICASSP, vol. 4, 2003, pp. 716–719.
[109] S.-T. Hsiang and J. W. Woods, “Embedded video coding using invertible mo-
tion compensated 3-D subband/wavelet filter bank,” Signal Processing: Image
Communication, vol. 16, pp. 705–724, May 2001.
[110] C. I. Podilchuk, N. S. Jayant, and N. Farvardin, “Three-dimensional subband
coding of video,” IEEE Trans. Image Processing, vol. 4, no. 2, pp. 125 –139, Feb.
1995.
[111] Y. Andreopoulos, A. Munteanu, J. Barbarien, M. van der Schaar, J. Cornelis,
and P. Schelkens, “In-band motion compensated temporal filtering,” Signal Pro-
cessing: Image Communication, vol. 19, no. 7, pp. 653–673, Aug. 2004.
[112] V. G. MSU Graphics & Media Lab. MSU quality measurement tool. Available:
http://www.compression.ru/video/ [Accessed: Jan. 15, 2010].
188