ASSESSING THE QUANTIFICATION OF SOY PROTEIN IN ...
144
University of Nebraska - Lincoln University of Nebraska - Lincoln DigitalCommons@University of Nebraska - Lincoln DigitalCommons@University of Nebraska - Lincoln Dissertations, Theses, & Student Research in Food Science and Technology Food Science and Technology Department 11-2020 ASSESSING THE QUANTIFICATION OF SOY PROTEIN IN ASSESSING THE QUANTIFICATION OF SOY PROTEIN IN INCURRED MATRICES USING TARGETED LC-MS/MS INCURRED MATRICES USING TARGETED LC-MS/MS Jenna Krager University of Nebraska-Lincoln, [email protected] Follow this and additional works at: https://digitalcommons.unl.edu/foodscidiss Part of the Food Chemistry Commons Krager, Jenna, "ASSESSING THE QUANTIFICATION OF SOY PROTEIN IN INCURRED MATRICES USING TARGETED LC-MS/MS" (2020). Dissertations, Theses, & Student Research in Food Science and Technology. 111. https://digitalcommons.unl.edu/foodscidiss/111 This Article is brought to you for free and open access by the Food Science and Technology Department at DigitalCommons@University of Nebraska - Lincoln. It has been accepted for inclusion in Dissertations, Theses, & Student Research in Food Science and Technology by an authorized administrator of DigitalCommons@University of Nebraska - Lincoln.
-
Upload
khangminh22 -
Category
Documents
-
view
0 -
download
0
Transcript of ASSESSING THE QUANTIFICATION OF SOY PROTEIN IN ...

University of Nebraska - Lincoln University of Nebraska - Lincoln
DigitalCommons@University of Nebraska - Lincoln DigitalCommons@University of Nebraska - Lincoln
Dissertations, Theses, & Student Research in Food Science and Technology Food Science and Technology Department
11-2020
ASSESSING THE QUANTIFICATION OF SOY PROTEIN IN ASSESSING THE QUANTIFICATION OF SOY PROTEIN IN
INCURRED MATRICES USING TARGETED LC-MS/MS INCURRED MATRICES USING TARGETED LC-MS/MS
Jenna Krager University of Nebraska-Lincoln, [email protected]
Follow this and additional works at: https://digitalcommons.unl.edu/foodscidiss
Part of the Food Chemistry Commons
Krager, Jenna, "ASSESSING THE QUANTIFICATION OF SOY PROTEIN IN INCURRED MATRICES USING TARGETED LC-MS/MS" (2020). Dissertations, Theses, & Student Research in Food Science and Technology. 111. https://digitalcommons.unl.edu/foodscidiss/111
This Article is brought to you for free and open access by the Food Science and Technology Department at DigitalCommons@University of Nebraska - Lincoln. It has been accepted for inclusion in Dissertations, Theses, & Student Research in Food Science and Technology by an authorized administrator of DigitalCommons@University of Nebraska - Lincoln.

ASSESSING THE QUANTIFICATION OF SOY PROTEIN IN INCURRED
MATRICES USING TARGETED LC-MS/MS
by
Jenna Krager
A THESIS
Presented to the Faculty of
The Graduate College at the University of Nebraska
In Partial Fulfillment of Requirements
For the Degree of Master of Science
Major: Food Science & Technology
Under the Supervision of Professors Melanie L. Downs and Joseph L. Baumert
Lincoln, Nebraska
November, 2020

ASSESSING THE QUANTIFICATION OF SOY PROTEIN IN INCURRED
MATRICES USING TARGETED LC-MS/MS
Jenna Krager, M.S.
University of Nebraska, 2020
Advisors: Melanie L. Downs and Joseph L. Baumert
Soy-derived ingredients are commonly added as auxiliary components to a
diverse range of food products. The versatile end-applications of commercially processed
soy ingredients is concerning for the safety of allergic consumers. Immunological
detection of soy proteins in food matrices has some drawbacks, including loss of epitope
binding and matrix masking. Therefore, the aim of this study was to assess naturally
incurred matrices with an existing liquid-chromatography tandem mass spectrometry
(LC-MS/MS) workflow to determine the recovery of total soy protein.
The existing LC-MS/MS workflow was time intensive. The peptide responses of
five soy protein targets were compared between two dilution methods and two trypsin
digestion conditions. The tryptic digestion was shortened by 3 hours from the addition of
subsequent additions of trypsin at 1:100 (trypsin:protein) to a single addition at 1:50.
External standards were prepared with an optimized serial dilution method after
reconstitution (AR). This workflow requires less time and reagents. Three peptides, LSA,
VFD, and NIL, had reproducible peptide responses among all conditions and thus were
chosen as the final quantifying peptides.
Absolute quantification of total soy protein was achieved with a combination of
internal and external standards. Several replicates of external standards were prepared for

the optimized serial dilution (AR). The variation of the external standard peptide
responses was insignificant among replicate standard curves whether prepared on the
same day or different days. Therefore, all replicate curves were able to be pooled into an
average, or “master” standard curve. The total soy protein in incurred bread and
frankfurter matrices was then estimated from the master curve. Several factors were
assessed for the effect on protein recovery: soy ingredient type and concentration, heat
treatment, and matrix. The effect of the matrix was determined to have the most
appreciable impact on protein recovery. The lowest percent protein recoveries, less than
50%, were calculated for all uncooked matrices. The cooked matrices had percent
recoveries between 50-150 % for both matrices. Soy ingredient type was also an issue for
texturized vegetable protein (TVP), where total soy protein recoveries were low and
variable among replicate extracts. With the LC/MS-MS method, detection of TVP was
low but above the limit of detection. Further work is needed on the total soy protein
recoveries of these matrices with immunochemical methods.

i
ACKNOWLEDGMENTS
I would first like to thank my advisors Dr. Melanie Downs and Dr. Joe Baumert
for their support and valuable input throughout my research. I am grateful to have had the
opportunity to learn mass spectrometry, a method I wasn’t even aware of before my
graduate studies. I am also grateful to Dr. Steve Taylor and Dr. Joe Baumert who gave
me the opportunity to work as an undergraduate student in the FARRP research lab. I am
especially thankful to be able to continue my education and pursue a master’s with the
help of my co-advisors.
I am appreciative of my committee members Dr. Steve Taylor and Dr. Phil
Johnson for their interest in the project and valuable input. I would also like to thank the
scientists in the FARRP analytical lab: Lynn, Deb, and Sean. Thank you, Lynn, for
training me on how to use ELISA.
Thank you to the scientists in my lab who have helped me throughout this project:
Dr. Shyamali Jayasena, Dr. Justin Marsh, and Dr. Bini Ramachandran. I am indebted to
Dr. Shyamali Jayasena who has not only taken the time to develop my lab skills when I
first entered the lab but has also made me a better thinker and writer. Thank you,
Shyamali, for your never ending patience, especially when I had no lab experience, as
well as your friendship. I am also grateful for the help of Dr. Justin Marsh. Thank you
for always taking the time to answer my questions and giving valuable input. I would also
like to thank Shimin Chen for her help and answering my many questions about the
project.

ii
I am especially grateful to Pat Gergen, who was the first FARRP member I
worked with as an undergraduate. Thank you Pat for your help and immense support
throughout my undergraduate and graduate career.
The incurred matrices were prepared with the help of Julie Nordlee. Thank you,
Julie, for taking the time to thoroughly train me and answer my questions. I am very
grateful for your mentorship. And thank you Russell Parde, who helped me prepare the
frankfurter matrices.
Thank you to all of my lab mates, new and old, who have had a significant impact
on my time at UNL: Tengfei, Morganne, Jess, Dr. Abby Burrows, Dr. Vera Cao, Lee,
Niloofar, Liyun, Olivia, and Sara. Thank you to my family and friends for your support
throughout my graduate research. And to my sisters, who I am especially grateful for
letting me be my most authentic self: and enjoy.

iii
TABLE OF CONTENTS
ACKNOWLEDGMENTS ................................................................................................. i
TABLE OF CONTENTS ................................................................................................ iii
LIST OF TABLES ........................................................................................................... vi
LIST OF FIGURES ........................................................................................................ vii
CHAPTER 1: LITERATURE REVIEW
I. INTRODUCTION ........................................................................................................... 1
II. SOYBEANS ................................................................................................................... 1
A. Raw Commodity ...................................................................................................... 1
B. Soy-Derived Functional Ingredients ........................................................................ 4
III. SOY PROTEIN ............................................................................................................. 7
A. Glycinin.................................................................................................................... 9
B. β-Conglycinin ........................................................................................................ 10
IV. FOOD SENSITIVITIES ............................................................................................. 11
A. Food Intolerance .................................................................................................... 13
B. Non-IgE Mediated ................................................................................................. 14
C. IgE-mediated .......................................................................................................... 15
V. ALLERGEN REGULATION ...................................................................................... 18
VI. ALLERGEN DETECTION METHODS ................................................................... 23
A. DNA-Based Methods ............................................................................................. 24
B. Protein-Based Methods .......................................................................................... 25
Enzyme-Linked Immunosorbent Assays ......................................................... 25
Mass Spectrometry .......................................................................................... 30
VII. QUANTITATIVE METHODS FOR FOOD ALLERGENS .................................... 36
VIII. SUMMARY ............................................................................................................. 38
IX. REFERENCES ........................................................................................................... 40

iv
CHAPTER 2: STANDARD CURVE OPTIMIZATION AND SELECTION OF
ROBUST QUANTIFYING PEPTIDES FOR AN EXISTING TARGETED LC-
MS/MS
I. ABSTRACT .................................................................................................................. 50
II. INTRODUCTION ........................................................................................................ 52
III. Materials and Method ................................................................................................. 54
A. Materials ................................................................................................................ 54
B. Targeted LC-MS/MS Workflow ............................................................................ 54
C. Digestion ................................................................................................................ 56
D. SDS-PAGE ........................................................................................................... 57
E. Standard Curve Preparation ................................................................................... 57
F. Dilution Method ..................................................................................................... 60
G. Analysis.................................................................................................................. 60
IV. RESULTS AND DISCUSSION ................................................................................. 61
A. Digestion ................................................................................................................ 61
B. Carrier Protein Concentration ................................................................................ 70
C. Selection of dilution method .................................................................................. 76
D. Selection of robust quantifying peptides .................................................................. 83
V. SUMMARY ................................................................................................................. 85
VI. REFERENCES ........................................................................................................... 87
CHAPTER 3: QUANTIFICATION OF SOY DERIVED INGREDIENTS IN MODEL FOOD MATRICES WITH AN OPTIMIZED LC-MS/MS EXTERNAL STANDARD CALIBRATION WORKFLOW
I. ABSTRACT .................................................................................................................. 90
II. INTRODUCTION ........................................................................................................ 92
III. METHOD AND MATERIALS .................................................................................. 93
A. Materials ................................................................................................................ 93
B. Incurred Matrices ................................................................................................... 94
White Bread ..................................................................................................... 95
Frankfurter ....................................................................................................... 97

v
C. Standard Curve....................................................................................................... 98
D. Targeted LC-MS/MS Workflow .............................................................................. 99
IV. RESULTS AND DISCUSSION ............................................................................... 101
A. Detection ................................................................................................................ 101
B.Standard Curve ........................................................................................................ 106
Variation of Peptide Response ..................................................................... 107
Variation of Linear Slopes ............................................................................ 109
C. Percent Recovery of Total Soy Protein in Model Foods ..................................... 115
D. Effect of Matrix and Heat on Protein Recovery .................................................. 121
Model Bread Matrix ......................................................................................... 129
Model Frankfurter Matrix ............................................................................ 129
E. Ingredient Effects ................................................................................................. 128
V. SUMMARY ............................................................................................................... 129
VI. REFERENCES ......................................................................................................... 129
131

vi
LIST OF TABLES
CHAPTER 1
Table 1-1. Percent total protein recovery of six soy -derived ingredient extracts as
measured by two commercial soy ELISA kits .................................................................. 29
CHAPTER 2
Table 2-1. Target soy peptides .......................................................................................... 56
Table 2-2. Estimated background protein concentration at each step in the sample
preparation workflow ........................................................................................................ 70
Table 2-3. The lowest total soy protein concentration (mg/kg) determined to have a
positive target peptide detection with AR or AE methods ............................................... 71
Table 2-4. Linear regression analysis of external standards prepared by two dilution
methods (AR and AE) with two digestion conditions (2 ug and 4 ug trypsin) ................. 77
CHAPTER 3
Table 3-1. Experimental design for the reproducibility of standard curves prepared with
the AR method of dilution ................................................................................................ 99
Table 3-2. Mean square of peptide response ratios for each concentration of the external
standard curve using one-way ANOVA ......................................................................... 108
Table 3-3. Variance estimations of the random replicate effects within group and across
groups on the linear regression model ............................................................................ 112
Table 3-4. Adjusted total soy protein concentrations of white bread matrices after heat
treatment ......................................................................................................................... 116
Table 3-5. Adjusted total soy protein concentrations of white bread matrices after heat
treatment ......................................................................................................................... 117

vii
LIST OF FIGURES
CHAPTER 1
Figure 1-1. Schematic of selected commercially-processed soy ingredients ..................... 6
CHAPTER 2
Figure 2-1. Two dilution methods for external standard preparation ............................... 58
Figure 2-2. SDS-PAGE of a digested 20 mg/kg total soy protein NRSF extract at 9 time
points over a total of 20 hours........................................................................................... 62
Figure 2-3. Light peptide abundance of five quantifying peptides from 0.5 to 20 hours of
digestion using trypsin at 1:50 (w/w)................................................................................ 65
Figure 2-4. Correlation of light peptide abundance from 0.5 to 20 hours digestion ........ 68
Figure 2-5. The peptide response of each concentration of external standards prepared
with the AR method diluted in 0.05, 0.1, 0.25, and 0.5 ug/uL background NFDM. ........ 74
Figure 2-6. Variation of standard curves of two dilution methods (AE and AR) and two
digestion conditions (2 ug and 4 ug trypsin). .................................................................... 79
Figure 2-7. Percent coefficient of variation (CV) and average total peak area of
quantifying heavy peptides for all standard curves........................................................... 82
CHAPTER 3
Figure 3-1. Count of positive detections for five target peptides in incurred bread
matrices. .......................................................................................................................... 102
Figure 3-2. Count of positive detections for target peptides in frankfurter matrices ...... 103
Figure 3-3. External standard curves prepared with the AR method of dilution ............ 110
Figure 3-4. Residual plot of the linear regression at each external standard concentration
(1, 2, 5, 10, 20, 50 and 100 mg/kg total soy protein) measured for the peptide LSA ..... 113
Figure 3-5. The total soy protein concentration of incurred samples was estimated using
linear slope values of the pooled standard curve ............................................................ 114
Figure 3-6. Percent recovery of the total soy protein concentration (mg/kg) in bread and
frankfurter incurred matrices .......................................................................................... 119

1
CHAPTER 1: LITERATURE REVIEW
I. INTRODUCTION
Soybeans have been cultivated and consumed for thousands of years in a variety
of standalone products. More recently, the protein fractions have been concentrated to
create several soy-derived ingredients. The end-applications of the protein-rich
ingredients vary depending upon the biological (e.g. enzyme activity) and chemical (e.g.
emulsification) functionalities. Soy protein is also capable of triggering allergic reactions.
The presence of low total protein levels, milligram amounts, is enough to trigger an
allergic reaction in the most sensitive individuals. Therefore, accurate detection and
quantification of soy proteins is important for the safety of allergic consumers. The
presence and concentration of soy protein can be determined by several DNA- and
protein-based methods. However, it is challenging to detect soy protein especially after
product manufacturing. There is a need for robust allergen detection methods capable of
accurate quantitative recovery for highly denatured proteins in complex food matrices. In
this review, mass spectrometry (MS) is presented as a protein-based analytical method
capable of improving the detecting and quantifying highly processed soy ingredients
compared to other commonly used analytical methods.
II. SOYBEANS
A. Raw Commodity
The taxonomical classification of legumes is referred to by several names:
Fabaceae, Leguminosae, or pea family. Legumes are characterized as mature seeds
surrounded by a protective pod (1). The surrounding pods can range in color from black,
brown, or tan (2). Each pod can contain up to four seeds with seed coat colors ranging
from black, brown, green, or yellow (2). The pod is commonly removed before

2
consumption. Fabaceae contains many important food crops including beans, lentils,
peas, chickpeas, peanuts, and soybeans (1). A common agricultural characteristic of
legumes is the ability to fix nitrogen in the soil, with soybeans contributing most of the
nitrogen fixed compared to other legumes grown worldwide (3). This is due to a
symbiotic relationship with the bacteria Bradyrhizobium japicum.
Soybeans are classified in the subgenus Soja, within the genus Glycine (4). It is
unclear how many taxa are classified as part of this subgenus. The United Stated
Department of Agriculture (USDA) Natural Resources Conservation Center indicates
five and other sources list fewer (4). The modern cultivated soybean is descended from a
wild-type soybean crop, Glycine soja, with taxonomical evidence of the first
domestication in China (5). The natural genetic variation over the course of hundreds of
years has since given rise to domesticated soybeans, Glycine max.
Soybeans were first introduced to the western hemisphere in the southern and
eastern parts of the United States and Canada. The USDA Natural Resrouces
Conservation Center lists the species of soybean that is cultivated as a major food crop
worldwide: Glycine max (L.) Merr. The U.S. has been a top producer of soybeans
worldwide since the 1960s accounting for more than 50 % of the production up until the
1980s (6). The USDA Natural Resources Conservation Center lists two cultivars of
Glycine max (L.) Merr.: Bobwhite and Quail Haven. There are many more soybean
cultivars cited elsewhere in the literature without specific taxonomical designations (7).
Foreign trade statistics provided by the U.S. Department of Commerce of major
oil seed crops estimate soybeans to have the largest production, import, export,
consumption, and thus profit, in the world (8). The total trade value is estimated at two

3
billion U.S. dollars (1). There has been an overall steady increase in the metric tons of
soybean exported from the U.S., as well as soybean protein and oil, from 2011-2018 (8).
Despite the low levels of sulfur containing amino acids, soybeans have been considered
as a quality source of protein compared to animal-based proteins such as eggs and milk
(9, 10). Heat treatments have shown to increase the digestibility by inactivating anti-
nutritional factors, such as lectins and trypsin inhibitor proteins (11). Therefore, soybeans
have an increasingly high value for domestic and worldwide trade as a quality and
inexpensive protein source.
Legume food crops are split into two groups known as pulse and non-pulse crops.
The distinction between the two groups is the part of the crop that is harvested. Pulse
crops are grown with the intent to harvest only the seed (12). Soybeans have been
categorized as non-pulse crops because historically they have been grown for the oil
fraction. Soybeans are composed of mostly protein (38 %) followed by oil (18 %),
soluble carbohydrates (15 %) and fiber (15 %) (13). Soybean cultivars can be selected for
high oil or high protein contents (14). The protein and oil content in the soybean seed
have been observed to inversely correlate with each other (15). The different
concentrations of oil and protein are influenced by agricultural factors (e.g. drought),
geographical factors (e.g. region specific climates), and selective breeding (15, 16).
The oil fraction is made up of mostly unsaturated 18-carbon chain triglycerides
(17). A novel application of soybeans is that the oil fraction has been converted to
biofuel, with over one billion gallons projected to be produced each year (18). Soybean
and peanut oil are the only U.S. export commodities projected to not decrease in value as
the global competition in the world trade market increases (18).

4
The protein fraction of soybeans is equally as profitable as the oil fraction. In the
early 1900s, the US shifted interest from soybean oil production to the harvest of the
protein fraction, specifically for animal feed (19). Today this shift remains apparent as
only a small portion of the total soybean protein harvested is intended for human
consumption (19). However, the supply of animal-based protein is challenging in a
limited environmental capacity and to meet the demands of the increasing growth of the
global population. A solution to find more sustainable protein sources may cause a
worldwide shift to more frequent plant-based protein consumption, especially for
soybeans (20).
B. Soy-Derived Functional Ingredients
As a result of hundreds of years of cultivation, soybeans have been used to
prepare a variety of foods, and thus, have become entrenched in cultures around the
word. The native soybean can be processed in many traditional and novel ways to create
a variety of soy-derived products. Fermented soybean foods (sufu, tempeh, miso, natto,
soy sauce) are custom dishes in Eastern Asian countries. More recently, soybeans have
processed into vegetarian alternatives for dairy (soy-based beverages) and meat (imitation
of fibrous texture) products. The rise in demand for vegetarian and vegan alternatives has
influenced novel soy-derived foods to be introduced into the market. For example,
texturized vegetable protein (TVP) is a fibrous product, similar in texture to animal
protein, made possible by high pressure and temperature extrusion processing (21).
Additionally, proteases can be added to hydrolyze proteins for functionality,
hypoallergenicity, or reduction in the bitter, beany taste that is characteristic of beans
(22).

5
Soybeans may be consumed due to the highly publicized health benefits. In the
U.S., a health claim, approved for packaged food products since 1999, indicated that
regular soy consumption results in the lowing of the risk of cardiovascular disease (23).
Health benefits have been associated with the different bioactive molecules in the
soybean protein fraction such as isoflavones, lignans, phytic acid, and sterols (24). There
is a long list of potential health effects tied to the progressively studied isoflavones
including lowering the risk of several types of cancers, obesity, and osteoporosis (24).
There is ongoing research investigating the health effects of isoflavones as estrogen-
mimicking compounds to alleviate menopausal symptoms (25).
Soybeans are unique compared to other oil seed crops because of the high oil and
protein content. Soybeans have a higher protein content compared to other food legumes,
as well as other protein-rich foods, such as eggs, milk, beef, and chicken (10). The
industrialization of soybean products is in part due to the fact that they contain the
highest protein content on a dry basis (35-40%) compared to other food legumes (1).
Soybean protein is added as a minor ingredient to a range of food products for desirable
organoleptic and functional properties.
Soy-derived protein ingredients can be grouped into three general categories
based on the final protein concentration: flours (50% protein), concentrates (70%
protein), and isolates (90% protein). The protein fraction of the seed is concentrated in a
general workflow. The soybean pods and hulls are removed, the seeds are finely ground,
and the oil is extracted with a non-polar solvent (e.g. hexane). The resulting defatted soy
flakes can be directly marketed as soy flour or heat treated to different degrees and
marketed as toasted soy flour. Protein can be concentrated further using alkaline
6
extractions, isoelectric precipitation, or centrifugation to produce soy protein concentrates
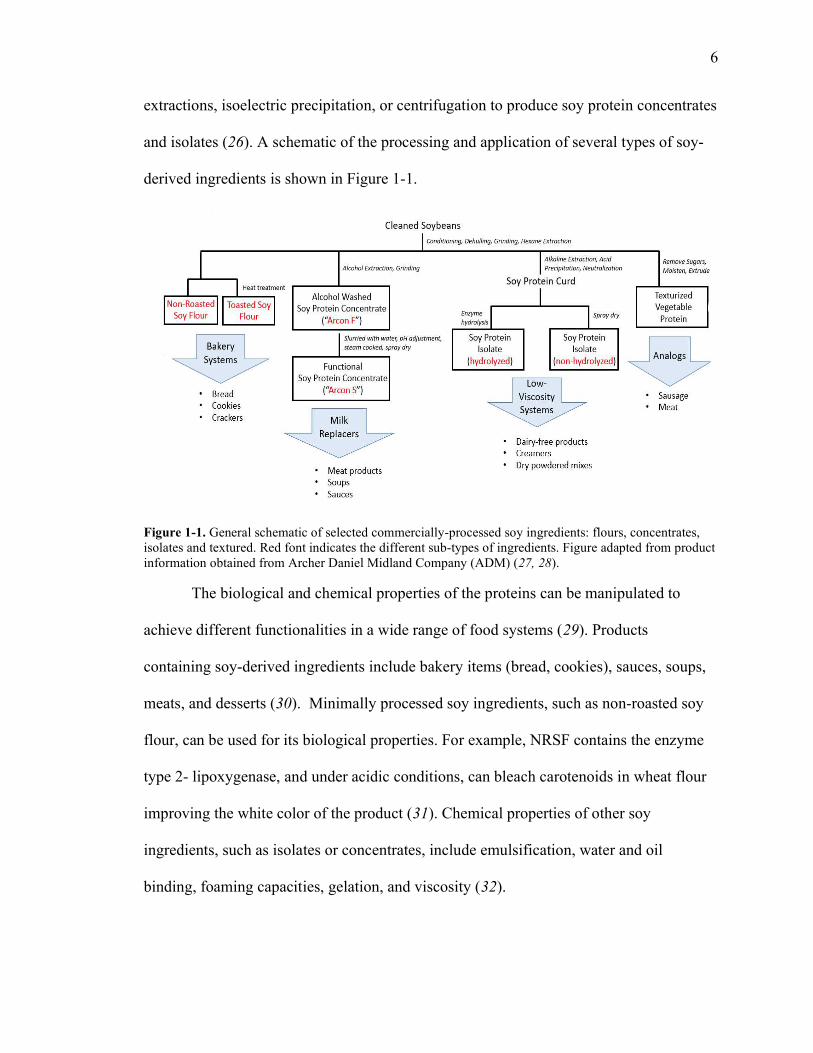
and isolates (26). A schematic of the processing and application of several types of soy-
derived ingredients is shown in Figure 1-1.
Figure 1-1. General schematic of selected commercially-processed soy ingredients: flours, concentrates, isolates and textured. Red font indicates the different sub-types of ingredients. Figure adapted from product information obtained from Archer Daniel Midland Company (ADM) (27, 28).
The biological and chemical properties of the proteins can be manipulated to
achieve different functionalities in a wide range of food systems (29). Products
containing soy-derived ingredients include bakery items (bread, cookies), sauces, soups,
meats, and desserts (30). Minimally processed soy ingredients, such as non-roasted soy
flour, can be used for its biological properties. For example, NRSF contains the enzyme
type 2- lipoxygenase, and under acidic conditions, can bleach carotenoids in wheat flour
improving the white color of the product (31). Chemical properties of other soy
ingredients, such as isolates or concentrates, include emulsification, water and oil
binding, foaming capacities, gelation, and viscosity (32).

7
The widespread use of soybeans is attributed to numerous factors including low
agricultural cost, high nutritive value, perceived health benefits from short and long-term
consumption, and protein functionalities for a wide range of food products. However, an
increased consumption of the oil seed crop is not necessarily devoid of any consequences.
Soybeans are recognized as a major food allergen worldwide. As the use of soy-derived
protein ingredients increases, the quality of life for soy allergic individuals is decreased
without reliable food allergen quantification methods.
III. SOY PROTEIN
There are several forms of nomenclature for soy proteins based on the physical,
taxonomical, and immunological characteristics. In early research of soy protein
characterization, molecular weight was a physical characteristic used to resolve a
heterogeneous mixture of biological molecules in a sample (32). Analytical methods can
measure proteins based on the molecular weight of macromolecules, such as SDS-PAGE,
size exclusion chromatography, and mass spectrometry (MS). Ultracentrifugation is a
method used to characterize proteins by the rate of sedimentation. This is related to the
size of the molecule and can be expressed in sedimentation coefficients (Svedberg units)
(33, 34). In early soybean protein characterization, four major fractions were identified
and measured at 15S, 11S, 7S, and 2S which constitute approximately 5-11%, 31-52%,
35-37% and 8-22% of the total protein respectively (29, 35). The heterogeneity in the
expression of specific proteins are based on the cultivar (36). Therefore, the total
percentages of proteins discussed here are an approximation. A major limitation in
molecular weight-based identification is the generalization of protein groups with actual
fundamentally different biological, structural, and immunoreactivity characteristics.

8
There are even differences between proteins coded from the same gene. These protein
variants are referred to as isoforms or “protein species” and differ based on the types of
post-transitional modifications made after translation of the protein from mRNA (37).
Clearly, categorizing proteins based solely on the sedimentation coefficients is not very
informative to understanding the immunochemical mechanisms of allergens and does not
account for other important biological determinants.
The biological functions of these proteins can be generally categorized as
metabolic, structural, or storage proteins (38). Seed storage proteins are estimated to
make up over 70% of the total protein fraction in soybeans (39). More recently they have
been described as nutrient reservoir proteins (InterPro O22120). The most abundant
proteins within this fraction are known as β-conglycinin and glycinin from the 7S and
11S protein fractions, respectively. These proteins serve as a nitrogen source for
developing seed embryos (40). The nitrogen source becomes available to the seeding
after germination when the proteins are hydrolyzed into peptides and amino acids (41).
Seed storage proteins are common targets for food allergen detection methods because of
their high abundance and allergenicity.
Analysis of proteins at the genetic level is based on evolutionary and structural
similarities. This may be more informative for answering questions associated with the
degree of allergenicity between protein groups (42). Proteins can be grouped into families
and superfamilies based on the percentage of amino acid sequence similarity and
biological function (43). The major soy proteins have been classified into several groups
including cupins (β-conglycinin and glycinin), prolamins (2S albumin), and
pathogenesis-related proteins (Kunitz-type protease inhibitor). Additionally, soybean

9
proteins have genetic variability between the cultivated type (Glycine max) and the wild
type (Glycine soya) that may give rise to proteins with different biological functionalities
(44).
The Allergen Nomenclature Sub-committee formed jointly by the World Health
Organization (WHO) and the International Union of Immunological Societies (IUIS)
created a naming system for allergenic proteins. These names are based on the taxonomic
classification (e.g. Glycine max) followed by a successive number based on the time of
identification as an allergen (e.g. Gly m 1). According to IUIS, there are currently
allergen designations for eight soy proteins (Gly m 1-8) and there are 17 variants of these
proteins (e.g. Gly m 1.0101). Proteins subunits from β-conglycinin have been identified
as major allergens: Gly m Bd 60K, Gly m Bd 30K, and Gly m Bd 28K (45, 46). Gly m
Bd 60K is part of the alpha subunit and is considered as the major allergenic protein from
β-conglycinin (47).
Glycinin, β-conglycinin, and protease inhibitors are considered the major
allergenic soy proteins (48). There are several online databases housing thousands of
other protein accessions for allergens including Allergome and AllergenOnline (49, 50).
According to Croote et al., β-conglycinin, glycinin, and 2S albumin have publicly
available MS data (51). Therefore, classification based on the seed storage protein
nomenclature will be used in this review.
A. Glycinin
The major protein in the 11S fraction and the most abundant seed storage protein
in soybean is known as glycinin (52). It is classified as a legumin protein and lacks post-
transitional modifications that are present in β-conglycinin (e.g. glycoslylation). Glycinin

10
is made up of several protein subunits. Each subunit consists of an acidic and basic
polypeptide linked by disulfide bonds. The subunits can be classified as G1, G2, G3, G4,
and G5 with an overall sequence similarity of 42-45 % (44). As the primary sequence of
the protein subunits was further studied, the subunits were grouped based on the percent
of sequence similarity. Group 1 consists of subunits A1aB1b, A1bB2, A2B1a and Group
II consists of subunits A3B4, A5A4B3 with sequence similarity of each group between
82-86% (44).
The hexameric protein consists of different combinations of these five possible
protein subunits. In the quaternary structure, the subunits converge in a barrel-like
formation. Three subunits (consisting of a basic and acidic polypeptide) form a disk-like
shape. Two of the disks interact non-covalently with one another to form a stacked
structure (53).
B. β-Conglycinin
The major protein in the 7S fraction is β-conglycinin, a type of glycoprotein also
known as a vicilin. The quaternary structure is composed of three proteins, or subunits,
that form a disk-like shape (43). The protein subunits are classified as alpha, alpha prime,
and beta with molecular weights of 68 kDa, 72 kDa, and 52 kDa respectively (39). The
different combinations of subunits form a trimeric protein that can range in size from
150-200 kDa (54). The primary sequence lacks sulfur containing amino acids and thus
disulfide bonds do not stabilize the secondary structure. The subunits are more
susceptible to denaturation by heat and pH changes compared to glycinin and protease
inhibitors (48). The beta subunit is classified as a bicupin because of the two conserved
regions of β-sheet folding at the core of the tertiary structure. The beta subunit has two

11
known isoforms as designated by Gly m 5.0301 and Gly m 5.0302. The core regions of
the amino acid sequences share sequence similarity. The highest similarity between alpha
and alpha’ (86.8 %), followed by alpha and beta (75.5 %), and alpha’ and beta (71.4 %)
(54).
IV. FOOD SENSITIVITIES
Antigens are any substance determined to be foreign by the immune system.
Common examples of antigens are microorganisms including fungi, helminths, bacteria,
and viruses. Some antigens have evolved to combat the immune system with
sophisticated methods (e.g. HIV) to deceive cells. The evolution of foreign invaders has
pushed the evolution of human immune systems. An evolutionary race between antigenic
substances and immune cells, to some extent, contributes to an immune system composed
of a complex network of cells and biological chemical signals that work together to
recognize and eliminate antigens. The types of cells and the mechanisms with which the
immune system responds typically fall into two branches, referred to as innate and
adaptive immunity.
Innate immunity is the initial barrier of protection of the immune system. This
branch of the immune system relies on the commonalities of antigens, such as pattern
recognition receptors on bacteria, to recognize foreign invaders (55). The types of cells
involved, broadly categorized as granulocytes, are basophils, eosinophils and neutrophils
(56). The collective cell response is the same for a range of antigens. Adaptive immunity
is a more complex system of cells that actively recognize a reoccurring or persistent
foreign invader. The cells involved in adaptive immunity are the B and T lymphocytes
which recognize foreign protein expressed on antigen presenting cells (APCs) (57). This

12
branch of immunity becomes more specific and efficient after an initial exposure to the
antigen. In other words, these memory cells accumulate over the course of an infection
and mount a stronger immune response. The longer the system is fighting the foreign
invader the more tailored the immune response becomes as mutations on the surface
protein receptors of B and T lymphocytes increase specificity through V(D)J
rearrangement (58). Immune cells specific to an antigen can remain present in the
immune system for up to several years, serving as a source of memory in the event of
reinfection. While this is effective at mounting an immune response to a harmful
substance, the immune system may mount a response against substances usually
considered harmless such as food.
An immune response actively mounted against a substance that is generally
considered nonthreatening is a hypersensitivity reaction. The overstimulation of the
immune system can be categorized into four types of hypersensitivity reactions (59).
Type 1 reactions are mediated by IgE antibodies and is the immune mechanism for food
allergy reactions. This type of reaction is triggered by the crosslinking of IgE antibodies
linked to surface receptors (FceR) on mast cells and basophil cells from the binding of a
foreign protein. Symptoms are caused by the release of potent mediator molecules (e.g.
histamine) from an immune cell biological cascade, also known as degranulation. The
mediator compounds are biological chemicals that are vasoactive, capable of increasing
blood flow to the infection site and acting as a recruitment signal to initiate other cells to
congregate and respond. Type II is an IgG and IgM response to complement, a type of
protein which activates immune cells, associated with autoimmune diseases. Type III is
an inflammatory response caused by deposited antigen-antibody complexes. Type IV is

13
an immune response generated from potent mediator molecules (i.e. cytokines) released
by sensitized T cells. Although there are categories of hypersensitivity reactions the
reaction is more likely part of a spectrum. The type of reaction depends upon many
factors including the symptoms, including severity, time of manifestation (immediate and
delayed hypersensitivity) and the cell types mediating the immune reaction (60).
Hypersensitivity reactions triggered by food are known collectively as food
sensitivities (61). Food sensitivities are broadly categorized as food intolerances and food
allergies. The distinguishing factor is the type of response, either caused by non-
immunological or immunological mechanisms respectively (62). The type of food allergy
can be defined by the type of immunological mechanisms: cell-mediated and IgE-
mediated reactions (61). A common example of a cell-mediated food allergy is celiac
disease, where long-term exposure to gluten causes inflammation in the digestive tract.
Food allergies, such as to peanut, are IgE-mediated and require total avoidance of the
offending food (61).
A. Food Intolerance
A food intolerance is a reproducible, non-immunological adverse reaction after
the ingestion of a food or food component (63). It is the most common type of adverse
reaction to a food and limited amounts of the offending food can be tolerated (62). An
idiosyncratic response is an adverse response with an unknown mechanism (e.g. sulfite
sensitivity). Metabolic food disorders can affect the cells responsible for the metabolism
of a food component, usually decreasing the nutritive value. This incomplete digestion
can cause mild effects, such as discomfort, or more severe and life-long complications,
such as malnutrition.

14
One of the most common metabolic disorders is lactose intolerance, which affects
the breakdown of milk sugar into monosaccharides. Lactose is a natural disaccharide
found in milk composed of glucose and galactose. The monosaccharides are linked by a
β-1,4-glycosidic linkage. Lactose intolerance occurs when an individual has an overall
decreased activity of the enzyme β-galactosidase (lactase) to effectively break down the
sugar into the constituent monosaccharides (64). Inadequate absorption of the
disaccharide results in fermentation by bacteria in the gut into lactic acid and other by-
products such as carbon dioxide, methane and hydrogen gas. This imbalance results in
uncomfortable symptoms such as flatulence or diarrhea (64). Genetic predisposition,
relative consumption of milk products, and age influence the decrease in activity of
lactase among different populations. Therefore, some ethnic groups are more susceptible
than others (65).
B. Non-IgE Mediated
Cell-mediated reactions to foods are also known as a delayed hypersensitivity
reactions. A common example is celiac disease, which affects 0.5-1% of the total
population (66). This is a chronic condition where the ingestion of gluten will trigger
inflammation in the gastrointestinal tract, specifically in the small intestine, damaging the
villi over time. Gluten-containing cereals including wheat, rye, and barley must be
avoided. The adverse digestive symptoms, such as diarrhea, are a consequence of
incomplete absorption in the small intestine.
Early introduction of soybeans or cow’s milk can result in a non-IgE mediated
reaction known as food protein-induced enterocolitis syndrome (FPIES). Infants
experience vomiting, diarrhea, and dehydration after the consumption of soy- or milk-

15
based formulas (67). The gastrointestinal symptoms can be resolved from removing soy
or milk from the diet, and the condition can be outgrown into adulthood in a few months
to years (68).
C. IgE-mediated
Food allergy can be defined as reactions that are IgE-mediated, cell-mediated
(non-IgE-mediated), or exhibit both types of mechanisms (mixture of IgE- and non-IgE
mediated) (69). A food allergy is a reoccurring immunological response after the
exposure of a certain food substance (63). A “true” food allergy is an IgE-mediated
immune response triggered after the ingestion of an allergenic food and can also be an
exercise-induced response (61). Theoretically, all food proteins have the potential to
trigger an allergenic response, and over 160 different allergenic foods have been
identified (70). The range of symptoms as defined by the anatomical systems of the body
affected include: respiratory (shortness of breath), gastrointestinal (vomiting, diarrhea),
cutaneous (hives) and the cardiovascular system (weak pulse).
A fatal reaction, known as anaphylactic shock, is general or systemic.
Anaphylaxis (Greek for against protection) was first defined jointly by Paul Portier and
Charles Richet by observing an increase in the severity of reaction in dogs (71).
Epinephrine can be administered, through hand-held devices called epinephrine
autoinjectors, in an emergency situation for temporary alleviation during a severe
reaction. The diagnosis of anaphylaxis differs among medical professionals and affects
the reporting and response to patients with symptoms (72). The Joint Task Force of the
American Academy of Allergy, Asthma and Immunology and the American College of

16
Allergy, Asthma, and Immunology have defined anaphylaxis as the life-threatening and
unanticipated symptoms of an IgE-mediated allergic reaction (73).
IgE antibodies are part of adaptive immunity and play a role in cell memory. Cells
involved as part of the adaptive immune system are able to increase specificity to a
specific antigen and mount an immune response over several exposures. The same
mechanism is observed in IgE-mediated immune responses to food allergens. The
exposure to an allergenic food protein is known as sensitization (57). In this stage, the
food protein stimulates cells of the adaptive immune system, B and T lymphocytes, to
start the production of IgE antibodies (57). IgE antibodies will then be present on the
surface of mast cells and basophil cells (74). Epitopes are regions on a protein, or antigen,
which bind to the specialized light chain on the antibody (75, 76). More specifically, an
allergenic epitope is a protein region with the ability to initiate an allergic reaction (77).
A subsequent exposure to an allergen is known as elicitation. In this phase, IgE
antibodies reactive to specific allergenic proteins are present on the surface of mast cells
and basophil cells (57). Binding of the protein must occur on at least two antibodies. This
cross-linking activates the immune cells to initiate a biological cascade releasing
mediator molecules (histamine, prostaglandins, tryptase, and inflammatory cytokines)
(78). These mediator molecules have been historically associated with the fight against
large parasites such as helminths (57). Therefore, these are potent biological molecules
evolutionarily intended to kill large microorganisms, too large for phagocytosis. This
release of chemicals initiates more intense immune responses including vascular
permeability, smooth muscle contraction, and stimulation of nerve endings (78).

17
Soybean protein has been well-documented to cause IgE-mediated
hypersensitivity reactions in sensitive individuals (79, 80). To date, there is no cure for
food allergy and the individual is usually advised to adhere to a complete avoidance diet
to one or multiple allergenic foods. The first case of documented soy allergy occurred in
the 1930s in a soy flour factory (81). The workers were exposed to respiratory allergens
later identified as Gly m 1 and Gly m 2 (82). Allergic individuals can be sensitive to a
specific soy protein or several (28). The allergenicity may be a product of certain
characteristics such as abundance, resistance to harsh environmental conditions (pH,
temperature, enzymes), and structural characteristics (21). Soy protein in processed food
has been documented as the cause of fatal anaphylaxis reactions such as in hamburger,
sausage on pizza, crab sticks, and kebabs (83, 84).
There is evidence that small amounts of allergenic protein can be tolerated by
allergic individuals (85). Long-term oral immunotherapy trials under professional care
attempt to desensitize allergic patients by gradually exposing them to larger doses of
allergens (86). Quantitative risk assessment methods estimate levels of allergenic protein
that will likely not cause adverse reactions for 95-99% of the allergenic population (87).
Data from double-blind placebo-controlled food challenges, which were first proposed in
1976, continue to the gold standard to diagnose a food hypersensitivity (62, 88).
In spite of the research progress, individuals must continue to adhere to a strict
diet, free of any traces of the offending food. There is currently no cure for food allergies,
and due to the potentially fatal reactions from exposure of small amounts of the offending
food, complete avoidance continues to be the primary treatment of allergic individuals.

18
This makes the reliability, sensitivity, and reproducibility of allergen detection methods
important to maintain consumer safety.
V. ALLERGEN REGULATION
Food allergies are a worldwide health concern, and the prevalence seems to be
increasing (80). The prevalence of food allergies is 2-2.5% worldwide, with a higher
prevalence in children ranging from 5-8% (74). Soybeans are one of the most common
food allergies and require labeling on foods worldwide (89). Soy is known to have a
higher eliciting dose compared to other food allergies (such as peanut) and children
diagnosed with soy allergy commonly outgrow the allergy (90). Soy allergy prevalence is
estimated to below 1% in the total population and 1.4-2.7 % among children (28, 77).
The WHO and the Food and Agriculture Organization (FAO) jointly created
guidelines outlining a set of voluntary food standards for the labeling of food allergens
(91). The work is intended to be applied internationally. The guideline encompasses the
labeling of foods associated with causing food sensitivity reactions including food
intolerances and IgE-mediated food allergies. However, these are only guidelines and
legal jurisdiction lies with the national regulatory bodies because food allergen
prevalence differs internationally. The different consumption patterns of different
populations may be a factor in the different proportion of allergy prevalence to specific
foods. The increased consumption of a food within a population is correlated with an
increased prevalence of that specific food allergy. Although countries have different rates
of food allergies, the source of variation may be a result of the differences of the study
designs which report the prevalence rather than true differences among the populations
(92).

19
In the United States, the Food, Drug and Cosmetic Act of 1906 was pivotal in the
establishment of government oversight in the production of consumer goods with the
intent of consumer protection. The Nutrition Labeling and Education Act (NLEA) of
1990 was an extension of the Food, Drug, and Cosmetic Act and required for the first
time a nutrition facts panel to be presented on packaged foods in the US (93). The
required information on the nutrition facts panel includes information on total fat,
saturated fat, cholesterol, sodium, total carbohydrates, complex carbohydrates, sugars,
total protein, and dietary fiber as well as certain vitamins and minerals (93). The scope of
NLEA extends beyond the nutrition information and regulates health claims to avoid
misleading consumers. Since this law was enacted, US national regulatory bodies
continue to modify and add on requirements to food labels in order to provide consumers
with the most complete and accurate information.
In 2004, the Food Allergen Labeling and Consumer Protection Act (FALCPA)
was the first law enacted that required the labeling of allergenic foods to be included as
part of the ingredient labeling (93). Additionally, the scope includes not only packaged
food but also dietary supplements, infant formula, and medical foods (93). In the U.S.,
the allergenic foods required on the label were at least in part determined from the
majority, 90%, of all allergic reactions to foods in the population (93). The group of
allergenic foods is collectively known as the “Big Eight” and is as follows: crustacean
shellfish, tree nuts, fish, wheat, milk, eggs, peanuts, and soybeans. Some of these
allergenic foods are actually a diverse collection of species specifically tree nuts, finfish,
and crustacean shellfish. Common names within an allergenic food group can be declared
(e.g. bass, flounder, or cod). Any nationally mandated allergenic food or ingredients

20
derived from these foods must listed as part of the ingredients statement, including the
common name (e.g. milk following sodium caseinate), or in a separate “contains”
statement. As of 2019, the Illinois General Assembly passed legislation requiring the
labeling sesame seeds on packaged foods (94), but this requirement is not recognized at
the national level.
It is well known and has been previously discussed that the protein fraction of
foods causes allergic reactions. Therefore, when other portions of the food are used, such
as the oil fraction, the allergenic potential is uncertain. In the case of soybeans, the oil
fraction is a valuable commodity. Vegetable oils can be mechanically separated, in
equipment such as an expeller-press, or chemically extracted, using a non-polar solvent
(95). The oil fraction will contain some amount of protein and will be higher in the
mechanically separated oil (unrefined oils) (96). Highly refined oils have many more
processing steps that remove water soluble substances such as proteins and
carbohydrates. The process includes a series of thermal and chemical treatments such as
degumming, neutralization, bleaching, and deodorization to improve organoleptic
properties and shelf stability (97). The low protein content of highly refined oils has
sparked research in the allergic potential of these allergen-derived ingredients (98). One
study demonstrated the safe ingestion of all soybean oil products by oral food challenges
of three types of soybean oils, partially hydrogenated, non-hydrogenated, and cold-
pressed soybean oil, to patients with a history of allergic reactions to soy (99). Other
studies have found similar results for highly refined peanut oils (100). FALCPA does not
require labeling of highly refined oils derived from the major allergens or any ingredients
derived from these oils (93).

21
Some allergen-derived ingredients can be exempt from the labeling requirements
if there is substantial evidence of low allergenic risk. Ingredients derived from allergenic
foods can become exempt through a petition process which requires substantial scientific
evidence of the safety of the ingredient. There are two methods which a company can
take to exempt an ingredient from labeling by submitting a petition or notification. A
petition provides scientific evidence to support the hypothesis that it is not a risk to
sensitive individuals. The notification provides scientific evidence of the absence of
allergenic protein in the product. To date, there have been only two approvals for soy-
derived products, both of which were for soy lecithin, when used in specific applications.
Lecithin is part of the oil fraction, chemically defined as a phospholipid, and can contain
low amounts of protein (95). In 2007, the Solae company was approved to use soy
lecithin as a “processing aid”. Many functions were listed including release agent, anti-
stick, and preventions of oil absorption. In 2015, Archer Daniels Midland Company
(ADM) was approved to use soy lecithin as a “releasing agent”. One of the major
functions of the processing aid listed was as a release agent, preventing products from
sticking to equipment or clumping.
Around the world, a mandated list of allergenic foods is required to be explicitly
stated on packaged food labels. These allergens are determined by the appropriate
regulatory bodies. The Big Eight are a group of regulated allergenic foods in the USA,
Canada, Australia, New Zealand, and the European Union (89). Buckwheat has been
identified as a major allergen in Japan and South Korea (101). Europe recognizes
additional allergenic foods which list mustard, celery, lupine, sesame seeds, sulfites, and

22
gluten-containing cereals as major allergens. This list was expanded to included mollusks
and lupine (102).
Allergic consumers rely on the accuracy of food labels to avoid foods containing
allergenic ingredients. Unintentional allergens in a packed food product are considered
misbranded and can be subjected to a mandatory food recall under Section 403 of the
FD&C Act. The current legislation is not based on estimated threshold levels of food
allergens and is therefore considered a zero-tolerance policy (103). However, proving a
level of zero allergenic foods would be impossible and certainly would not be
measurable. This remains a challenge in a globalized food industry where the sharing of
equipment at each step in the processing system can increase the risk of cross-
contamination (95). A zero level of allergens in large facilities is difficult to control
because of cross contact between product lines and rework (104). Additionally, fatal
accidents can happen outside of packaged food products such as in restaurants, schools,
travel, or large gatherings (105, 106). An allergic individual must manage the avoidance
diet in all social settings, restaurants, schools, and planes, which leads to increased
anxiety (77). Food products with allergenic foods added as substitutions for more
expensive ingredients may be the biggest risk for consumers. The intentional addition of
allergenic sources of protein, such as soybeans, may happen if it is being substituted as a
cheaper ingredient in a product. For example, soybeans may be used to adulterate animal-
based products and are thus excluded from the label (107).
A study done on the accuracy of food labels, specifically false or misleading
claims, on packaged foods found 21-28% of the products (domestic and imported
respectively) to be outside of the FDA regulations (108). Among these foods, one of the

23
most common sources of the violation was undeclared ingredients (108). Interestingly,
this same problem applies to the labeling compliance of food allergens. Allergenic foods
found in mislabeled products are classified as undeclared allergens and is the primary
cause of food recalls in the US (109).
The consumer, business, and regulatory risks associated with undeclared allergens
have influenced the increased use of precautionary allergen labeling (PAL). These are
labels with statements such as “may contain”, “processed in the same facility as”, or
“processed on the same equipment as”. However, this often confuses the consumer
leading to more risky behavior and higher anxiety thus lowering the quality of life for
these individuals (110). A risk assessment tool known as Voluntary Incidental Trace
Allergen Labeling (VITAL) was developed to decrease the use of PAL statements.
VITAL includes guidelines on the quantitative risk of unintended food allergens. VITAL
uses double-blind placebo control food challenge threshold clinical data to predict finite
levels of allergic protein tolerated by a specific portion of the allergic population (111,
112). The overall goal is to minimize the use of PAL statements if the unintended
allergen is below this threshold.
VI. ALLERGEN DETECTION METHODS
The cross-contact among different food products makes for a unique challenge in
the detection of low amounts of allergenic protein. The current methods of detection
differ primarily based on the target analytes: protein or DNA. Method accuracy depends
upon the composition and processing of the sample food matrix and verification with
incurred reference materials (113). In general, sensitivity, specificity, and ease of use are
among the most important requirements for an allergen assay (114). There is a need for

24
accurate and robust methods capable of detecting and quantifying residual amounts of
allergenic protein in complex food matrices. The general types of quantification methods
discussed here are DNA-based and protein-based.
A. DNA-Based Methods
Polymerase chain reaction (PCR) is a detection method that amplifies a target
region of DNA to identify a certain food or group of foods. Target sequences may be
from nuclear, mitochondrial, and chloroplast sections. The amplification response is
measured from fluorescent nucleotide tags which produces a sigmoidal curve:
background, exponential, linear, plateau (115). The standard curve is the linear portion of
that response in DNA derived from a calibrant material. Absolute quantification of
sequence biomarkers in real-time PCR is determined by the linear amplification range
and efficacy is assessed with the R2 value and slope (115).
PCR methods for soybeans in incurred food matrices have reported LOD ranging
from 0.16-10 ppm (mg soy/kg matrix) (116). However, this is not a widely applied
method in the food industry because PCR does not directly measure the allergenic
component of foods. Commercially processed soy ingredients are concentrated from the
protein fraction of the native bean and contain lower amounts of DNA (113). DNA may
be damaged from the food processing environment, such as elevated in heat or change in
pH. The total DNA extraction of several soy-derived ingredients found the total amount
of DNA was highest in soy flours, the ingredient which was the most similar to the native
soybean (117). The most processed soy-derived ingredients, soy protein isolate and
toasted soy flour, had comparably lower total DNA levels, and soy fiber had no

25
measurable DNA (117). Therefore, protein-based methods may be more appropriate for
the detection of soybeans and soy-derived ingredients.
B. Protein-Based Methods
Enzyme-Linked Immunosorbent Assays
Immunochemical detection methods are the most widely applied methods for
allergen analysis in the food industry (118). Enzyme-linked immunosorbent assay
(ELSIA) is a protein analysis method that relies on the affinity between antibodies and
specific antigens to measure concentrations of analytes in a sample. There are several
protocols of ELISA assays differing in the steps at which the antibodies and the substrate
are combined such as indirect, direct competitive, antibody-sandwich, double antibody-
sandwich, direct cellular, and indirect cellular (119). The most popularized and
recognizable formats of ELISA include direct, indirect, sandwich, competitive with
labeled antibody, and competitive with labeled antigen (120). The sandwich ELISA
format is the most widely used for commercial food allergen analysis.
Commercialized ELISAs are sandwich assay kits with many advantages such as
rapid analysis, minimal training, and large sample size capabilities. The workflow has
similar steps for different commercialized kits and the protocol steps are well known.
Sandwich ELISA starts with an antibody-coated microwell plate. The antibody is of class
A (from chicken eggs) or G (from sera of animals such as rabbits or from mouse
monoclonal antibody cultures). The antibody coated and absorbed onto the wells is
known as the capture antibody. A capture antibody is the first to bind to the target
antigen. After the antibody-antigen complex is formed, a second antibody is added and
binds to the same antigen. This antibody is the primary antibody. This primary antibody

26
is complexed with an enzyme. The absorbance from the enzymatic reaction occurring
after the addition of a substrate is measured at a certain wavelength. The concentration of
protein, or concentration to a reference material (e.g. NRSF), in unknown samples is then
interpolated from a standard curve. The more intense the color, the higher the
concentration of analytes. The intensity of the resulting color follows a similar pattern to
DNA-based methods with a background, exponential, linear, and plateau regions.
Commercial kits are commonly coupled with proprietary analysis software that converts
the spectrophotometer units to a final protein concentration. Conversion factors are
sometimes provided to calculate the concentration of ingredients (e.g. soy protein isolate)
depending upon the reference material used in the standard curve. Although
commercialized ELISAs have many advantages, the lack of standardization among
different kits due to differing sample preparation, reporting results (total protein vs
specific proteins), and reference proteins is a major limitation to comparing results (121).
Another immunoassay that has been popularized due to its portable nature and
fast results is lateral flow devices (LFDs), commonly known as dipsticks. LFDs are a
semi-quantitative method composed of antibodies immobilized on handheld devices with
similar advantages to commercial ELISA kits such as fast results and easy handling (89).
These can be easily be transferred to food manufacturing settings and current work has
investigated the qualitative results for presence or absence of allergens in processed food
products and especially on equipment surfaces after cleaning (122-124). ELISA formats
have also been adapted to detect DNA components, knowns as enzyme-linked
oligonucleotide assay (ELOSA), and methods have been developed for lupine, gluten,
peanut, and egg (123).

27
ELISA faces a challenge known as cross-reactivity. Cross-reactivity is the shared
affinity of an allergenic epitope between two or more homologous proteins. Soybeans are
part of the legume family among other commonly consumed food crops such as peanut,
lima beans, pea, garbanzo bean, and green bean all which may have homologous protein
regions. In the development of an ELISA method, foods containing no known traces of
the target analytes are tested for a positive response to determine cross-reactivity. An
ELISA format using β-conglycinin as the target protein showed cross-reactivity (false
positive) results for chickpeas in a sandwich ELISA, and for several tree nuts (walnut,
Brazil nut, pecan nut), chickpea, chicken, and cocoa in a competitive ELISA (125).
Chickpea was also shown to be cross-reactive for two commercial ELISA kits: Tepnel
Biosystems kit and ELISA Systems kit (126). The drawbacks for soy ELISA kits are
food matrix interferences and cross-reactivity.
As mentioned previously, ELISA depends on the affinity between an antibody
and a protein. The loss of the native integrity of the allergenic epitopes, linear or
conformational, will decrease the accuracy of the ELISA assay. The potential loss of
native epitopes on proteins will cause two major issues with ELISA results in weakened
immune-recognition. The protein may be subjected to many forms of food processing
before it interacts with the antibody. Food products can be subjected to a variety of
processing techniques: thermal (e.g. moist and dry), hydrolysis (e.g. fermentation),
pressure, and physical (e.g. mashing) treatments, which all cause some degree of
denaturation (127). The constituents within a food undergo different chemical reactions
such as browning reactions (Maillard reaction, non-enzymatic) that can change the
chemical composition of the proteins. The decrease in immunoreactivity of fermented soy

28
products has been shown with tempeh, miso, and yogurt (128). The potential loss of
epitopes from the hydrolysis of soy proteins into peptides decreased the
immunoreactivity 77-89% when compared to unfermented soybean meal (128).
Processing changes the structure of proteins, leading to aggregation and protein-protein
interactions (129). The extraction of these processed proteins may be lowered and
decreases the proteins that are available for analysis.
The robustness of a method depends upon the effectiveness of the target protein
extraction. This may be especially limiting for the detection of residual amounts of
protein in more complex food matrices. The protein recovery of Gly m Bd 28 K was
determined to be significant in highly processed products (soy protein isolate and soy
milk) but undetectable in others (sausage and hamburger) (130). An ELISA method
developed with monoclonal antibodies raised against Gly m Bd 30k showed lower
recovery of the protein in high fat foods such as sausages because of the interaction
between the protein and oil bodies (131). Protein extracted from several soy products,
including sausage, sweet potato cake, and tomato sauce, at 10 ppm total soluble soy
protein showed recoveries from 89.7-98.7% (131).
Preliminary experiments, as part of an undergraduate research project, compared
the extraction of six different soy ingredients in reducing and non-reducing buffers
(unpublished). The soy ingredients extracted were non-roasted soy flour, toasted soy
flour, hydrolyzed and non-hydrolyzed soy protein isolate, and two types of soy protein
concentrate (Arcon S and Arcon F). The effectiveness of the extraction of soluble
proteins was dependent upon the temperature (60 and 100 C) and time (10, 15, and 20
minutes) of extraction. Extracted soy protein was quantified with two commercial soy

29
ELISA kits: Veratox Soy Allergen ELISA (range of quantification 2.5-25ppm) and the r-
Biopharm RIDASCREEN ® FAST Soya ELISA (range of quantification 2.5-20 ppm soy
protein). The protein recovery was higher in buffers with reducing agents compared to
buffers without, as shown in Table 1-1.
Table 1-1. Percent total protein recovery of six soy -derived ingredient extracts as measured by two commercial soy ELISA kits.
AExtracts measured by r-Biopharm RIDASCREEN® FAST Soya ELISA BExtracts measured by Neogen Veratox® Soy Allergen ELISA
The Veratox ELISA failed to recognize the highly processed ingredients such as
toasted soy flour and hydrolyzed soy protein. The toasted soy flour had the same protein
concentration as the non-roasted soy flour, demonstrating the potential risk of “hidden”
soy proteins which are often subjected to some form of processing. Both ELISA kits had
low percent recoveries of the hydrolyzed protein products. This is likely from the native
epitopes of the protein being destroyed during processing as mentioned previously.
Additionally, sandwich ELISAs require the recognition of two protein epitopes, which
Soy-Derived Ingredient
Initial Total Protein
Concentration (Dumas)
Extracts in 0.01 M PBS with 0.1 M Sodium Sulfite & 1% SDSA
Extracts in 0.01 M PBSB
60 °C for 20 min
100 °C for 10 min
60 °C for 15 min
100 °C for 10 min
Non-Roasted Soy Flour
52 31 110 160 4.5
Toasted Soy Flour
51 158 129 2 5
Hydrolyzed SPI 90 15 9 0.5 0.5
Non-Hydrolyzed SPI
90 172 146 80 7.5
SPC (Arcon F) 66 141 104 40 5
SPC (Arcon S) 70 93 106 12 2

30
lowers in highly processed foods. The low recovery of the direct extraction of highly
processed soy indicates equal or less recovery of these ingredients in highly complex
food matrices containing only a residual amount of protein that has undergone some form
of processing.
Mass Spectrometry
The sequencing of entire genomes has been extensively studied in a field known
as genomics (132, 133). Over many years, entire genome sequences from single-celled
organisms to more complex life forms, such as soybeans have become available (134).
Following was a natural progression to determine the expression of an entire set of
proteins within an organism, defined as proteomics (135). However, compared to
genomics, proteomics has many unanswered research questions because the number of
proteins expressed is not equal to the number of genes they are encoded from. Proteins
expressed in an organism can change depending on the environment. The dynamic nature
of proteins expressed at a given time in an organism presents a unique challenge. Mass
spectrometry (MS)-based methods have been used as proteomic tools for characterizing
and measuring large sets of proteins.
MS is a chemical technique that does not rely on the interaction between
antibodies and proteins. More specifically, it is the analysis of the relationship between
mass and energy. The transition of molecules from a ground state, the lowest state of
energy, to an excited state requires energy. MS first ionizes analytes then filters the
product ions into a series, or spectrum, depending upon the charge and mass. The relative
abundance of these ions is dependent upon the chemical structure of an analyte, sample
preparation (e.g. digestion) and the sample purity (136). The mass spectra can be

31
searched against a sequence database to identify peptides that are present (136). This is a
form of identification, like a fingerprint. MS-based methods rely on the specificity of
both parent and product ion spectra for the detection and identification of target analytes,
such as proteins.
MS was not a tool used to study large biological molecules up until the 1990s
because of the conventional ionization techniques (137). Proteins are nonvolatile and
thermally unstable and were unable to be ionized into gaseous particle (138). The widely
used ionization techniques, referred to as “hard ionization”, introduce energy high
enough to fragment the peptide bonds, rendering spectra from a peptide or protein less
useful for identification purposes. Novel ionization techniques, such as matrix-assisted
laser desorption ionization (MALDI) and electrospray ionization (ESI), were developed
and successfully applied as “soft” ionization for intact proteins and even intact
microorganisms (139). Soft ionization techniques allowed new research opportunities for
MS-based analysis of large biological analytes.
MS instruments all consist of three main components: an ionizer, a mass analyzer,
and a detector. Conventionally, analytes were first introduced into the ionizer as gaseous
particles. Soft ionization techniques can introduce samples in liquid or solid forms.
Electrospray ionization (ESI) is a common type of ionizer for protein analysis. ESI has
many advantages, such as a sensitivity (because of nanoliter flow rates), ability to
produce multiple charges on a single molecule, and online-coupling to a liquid
chromatography system that allows a continuous ionization flow (140). Peptides are first
introduced in a liquid form as an aerosol stream. As the droplets travel to the inlet of the
mass analyzer, desolvation can take place in either a vacuum or in a flow of inert gas

32
(141). A voltage is then applied resulting in free ions (141). Another common ionization
source for the analysis of large biological molecules is matrix-assisted laser
desorption/ionization (MALDI). In this workflow, the sample is ionized from a solid,
crystallized form. Metal ions can be added to the solid matrix and ionized simultaneously
with the protein (137). Energy is introduced to small sections of the sample by using a
laser, commonly ultraviolet light, that excites molecules and produces gaseous, ionized
peptides (142). MALDI typically produces low-charged (often singly-charged) species,
expressed as [M + H]+, and is often more useful for studying proteins rather than peptides
(143).
The mass analyzer filters volatilized, ionized particles in time and space based on
the mass to charge (m/z) ratios. The types of mass analyzers have varying resolutions,
mass accuracy, sensitivity, and scan rates and are applied depending on the research
setting (144). Common types of mass analyzers are time-of-flight (TOF), quadrupole (Q),
Orbitrap, linear ion trap, (LIT) and Fourier-transform ion cyclotron resonance (FT-ICR).
Orbitrap mass analyzers, especially the high resolution and accurate mass (HR/AM)
measurements, have been applied to quantitative and qualitative workflows (145). Mass
analyzers differ based on the separation of ions in space such as the type of energy
applied (magnetic, electrostatic) and the measurement (continuous or pulsed) (146). A
single analyzer, or a hybrid of two or more types of analyzers, can be used. The use of
two mass analyzers in succession is referred to as tandem MS, or written shorthand as
MS/MS.
Lastly, the detector measures the relative abundances of the m/z ratios of the
ionized fragments. As fragment ions are scanned, the signal intensity is proportional to

33
the rate at which ion species are detected. Electron capture detectors measure ion
abundance by the rate at which ions are sensed by the detector. The ions are sensed by an
amplification of electrons, creating an electrical current that is translated into an ion
spectrum (147).
There are two general workflows for protein-based MS methods. A common MS
approach, known as “bottom up”, infers the presence or concentration of proteins by
measuring peptide (148). The other approach, known as “top down”, measures intact
protein masses directly, both with and without fragmentation, and can generate
information on the primary structure (149). The most common route for allergen
quantification has been through the bottom up method (150).
In a bottom-up workflow, MS-based detection of peptides does not rely on the
structural integrity of the protein. Therefore, MS methods are able to have harsher
extraction techniques (use of detergents, chaotropic, and reducing agents) compared to
ELISA. Peptide fragments are fractionated by methods such as gel electrophoresis or
liquid chromatography (151). Techniques to enrich the protein in a sample prior to
fractionation have improved the detection of low abundant proteins (152). Enzymatic or
chemical protein digestion then generates peptides. In-gel digestion was the pioneering
method that has since been used less frequently in place of fractionation using liquid
chromatography and direct digestion of sample peptides in solution. MS directly coupled
with liquid chromatography systems (LC-MS) has high sensitivity for the detection of
minute amounts of target peptides (153). This is especially advantageous for target
peptides with low abundance in complex food matrices. Liquid chromatographic

34
separation of peptides followed by a tandem fragmentation of peptides and fragments of
peptides is referred in shorthand notation as LC-MS/MS.
The sensitivity of MS-based methods may be compromised at later sample
preparation steps when the protein in the sample may be at low ppm (µg/mL)
concentrations. Loss of sample protein by nonspecific binding of peptides to equipment is
expected, especially for hydrophobic peptides on plastic surfaces (154). To minimize this
effect an alternative source of protein is added to the sample preparation to preferentially
bind to the surroundings and minimize sample loss. This protein is known as a carrier
protein. Currently, there are no recommendations for the concentration of carrier protein
to add to a sample for the greatest sample recovery (155).
MS is a technique with high-throughput and multiplexing analytic capabilities for
monitoring and characterizing thousands of proteins (144). It is a crucial tool to study an
entire set of proteins expressed in an organism, known as the proteome, and in the study
of food proteins, known as ‘foodomics’. Technological advancements, growth of protein
sequence databases (Uniprot, BLAST) and allergen databases (AllergenOnline) and
public availability of analysis software (e.g. Skyline) have all aided in the increased
application of MS-based methods for clinical, pharmaceutical, and food-processing
settings.
Proteins are identified by the unique spectrum of fragment ions that is based on
the intensities and m/z ratios. In targeted MS, peptide transitions are pre-selected, and the
mass-to-charge ratio profile of these peptides can be determined through a combination
of in-silico and experimental observations. Once a list of the most robust target peptides
has been selected, the transitions of the fragments are monitored. The ability to monitor

35
more than one protein in a single run is one major advantage of MS-based methods
compared to immunological methods. Selected reaction monitoring (SRM) (sometimes
known as Multiple Reaction Monitoring (MRM)) pre-selects specific fragments of a
peptide to monitor. Monitoring only selected fragments can increase speed and limit the
noise in the peptide response because of the narrow parameters used to isolate the
fragment. Parallel reaction monitoring (PRM) measures all fragments of a peptide within
the experimental parameters. These fragments are measured in tandem so the intensities
of multiple fragments can be monitored. Therefore, the fragment ions are monitored
either by prior selection of specific transitions (SRM) or measuring all peptide fragments
in tandem with fragment selection occurring during data processing (PRM).
SRM has been the gold standard for proteomic workflows for food allergens due
to the high sensitivity and selectivity (150). SRM has been the method of choice for
protein analysis, and only recently have PRM methods gained popularity because of the
equivalent performance of detection of peptides compared to SRM methods. PRM can
have selectivity, dynamic range, and sensitivity advantages compared to SRM methods
(145, 156, 157). A series of studies measuring transitions with SRM compared to PRM
has shown equal and better sensitivity and selectivity of fragment ions with PRM,
especially on high resolution accurate mass (HR/AM) spectrometers (138, 142, 143).
PRM acquisition on a HR/AM Orbitrap instrument had similar quantitative parameters
(dynamic range, linearity, and precision) when compared to SRM on a QqQ instrument
(158). PRM was also shown to provide more selectivity for targeted proteins in a
complex matrix background (144).

36
VII. QUANTITATIVE METHODS FOR FOOD ALLERGENS
MS-based methods in the context of food, known as foodomics, aims to improve
consumer health (159). MS has emerged as a method for the identification,
characterization, and detection of food allergens (160). As mentioned previously,
immunoassays are the primary analysis method of food allergens. However, MS has
some advantages compared to antibody-based method including sensitivity, pre-
fractionation prior to peptide detection to improve detection of proteins at low
abundance, and a direct measure of the peptide of interest whereas ELISA indirectly
measures the response through a chemical reaction (i.e. an enzyme and a substrate).
MS-based methods are time intensive for sample preparation and data analysis as
well as require expensive equipment. This hurdle must be overcome in order to apply this
method for routine allergen analysis. For analysis, one of the disadvantages of MS
proteomics, as mentioned previously, is the imbalance of the number of genes to proteins
is due to different protein isoforms (37). Protein modifications vary in vivo, such as
glycosylation, phosphorylation, acetylation, and in vitro chemical modifications are
possible during the sample preparation such as carbamidomethylation (161). These
modifications will change the physical and chemical properties of the protein. This can
affect the detection of a target protein because a change in mass due to these
modifications will affect the m/z. In contrast, this can be an advantage if there are shared
sequences among the same protein species (e.g. Gly m 5 isoforms). Therefore, the
detection of a single peptide indicates the presence of all the protein variants.
Quantification methodology of MS-based methods measure signal intensities of
sample and standard peptides. Isotopically-labeled peptides are the gold standard for

37
quantification methods. Heavy peptides are identical to the target peptide except for
atoms with extra neutrons compared to the most abundant found in nature (e.g. carbon-12
and carbon-13). Heavy peptides are synthetically made by tagging or incorporating
isotopic atoms (e.g. 15N, 13C, 18O) or isotopic amino acids (e.g. (15N)methionine) (162).
The isotopic atoms are incorporated into proteins using several methods: metabolic
stable-isotope labeling (isotopically enriched or depleted cell media), isotope tagging
(reagents containing isotopes), and stable-isotope incorporation (18O incorporated after
proteolysis) (144). The difference in mass results in unique isotopic distribution of
spectra, and the ratio between the intensities of the two species can be measured. The use
of an internal standard or heavy-labeled peptide can be used to compare the response of
protein abundance in samples (163). Other methods of quantification omit the use of
heavy peptides. Label-free quantification relies on the relative abundance of peptides
between samples that are under different conditions (164).
Absolute quantification (AQUA) of sample peptides can be determined with
isotopically labeled peptides (165). The ratio of the response of sample (“light”) peptides
to the isotopic (“heavy”) peptides can be plotted as a linear curve. An external calibration
curve can be plotted using a series of known protein concentrations and the ratio of the
target peptide to a heavy-isotopically labeled internal standard. The linear response of
target soy peptides have been used to estimate the recovery of soy protein in multiple
incurred matrices (chocolate, cookie, ham, etc.) (166).
Linear dynamic range is one of the most important concepts in developing a
quantitative method. The linearity of a calibration curve may be affected at higher
concentrations as the ion detector reaches its saturation limit. The response of the mass

38
spectrometer is expected to be linear. The variance of the peptide response may be more
variable at higher or lower concentrations. In one study researchers found that variability
in higher peptide intensities was correlated with higher variances (167). There seems to
be evidence of a correlation between concentration and variance. Linearity may not
always be clear between two methods. A correlation coefficient, or R2, is often reported
in data to demonstrate the viability of a standard curve. Although R2 measures the
correlation of data points, it does not measure the agreement of the data to the linear
regression. This may make residuals more useful when determining the behavior of
linearly correlated data (168).
MS methods for the detection of soy protein have been gaining traction. There is a
larger gap between the methods for the detection of soy protein and the quantification of
soy protein. Quantitative LC-MS/MS methods have been developed for soybeans as part
of multiplexing experiments. Several soy protein peptide markers have been detected in
incurred food matrices including meat, cookies, bread, and chocolate (169). Additionally,
the detection of extensively processed proteins, such as hydrolyzed proteins for
hypoallergenic or functional products, likely have destroyed epitopes that are
unrecognizable by antibodies. MS methods may offer better detection and quantification
of these highly processed ingredients that still have allergenic potential. However, the
detection of target peptides in routine analysis of soy remains a challenge due to variation
of the concentration of proteins across processed soy ingredients (36).
VIII. SUMMARY
Food allergy is a life-long immunological response managed in daily life by a
complete avoidance diet. These strict diets require accurate and complete food labels to

39
prevent any accidental exposure to allergenic proteins. The current legislation reflects this
zero-tolerance threshold. However, proving zero is neither more protective nor more
practical because sensitive individuals have finite threshold levels. The presence of
undeclared allergens in packaged food products is more easily determined compared to
the risk associated with the quantity present.
Food processing affects the extraction and immunoreactivity of target proteins.
The methodology of commercially available immunological methods depends on
antibody-antigen binding. The epitopes of these proteins may be destroyed during food
processing but remain allergenic. MS-based methods do not rely on the integrity of
proteins and have shown to be capable of detecting highly processed food ingredients in
incurred matrices. These detection methods have comparable sensitivity to ELISA with
multiplexing abilities. The quantification of processed ingredients in relevant food
products using MS-based methods still needs to be determined.

40
IX. REFERENCES
1. M. Duranti, Grain legume proteins and nutraceutical properties. Fitoterapia 77, 67-82 (2006).
2. J. W. Burton, Soyabean (Glycine max (L.) Merr.). Field Crops Research 53, 171-186 (1997).
3. D. F. Herridge, M. B. Peoples, R. M. Boddey, Global inputs of biological nitrogen fixation in agricultural systems. Plant and Soil 311, 1-18 (2008).
4. S. Federhen, The NCBI taxonomy database. Nucleic Acids Research 40, D136-D143 (2012).
5. Y.-H. Li et al., Genetic diversity in domesticated soybean (Glycine max) and its wild progenitor (Glycine soja) for simple sequence repeat and single-nucleotide polymorphism loci. 188, 242-253 (2010).
6. T. Masuda, P. D. Goldsmith, World soybean production: area harvested, yield, and long-term projections. International food agribusiness management review 12, 1-20 (2009).
7. H.-M. Lam et al., Resequencing of 31 wild and cultivated soybean genomes identifies patterns of genetic diversity and selection. Nature Genetics 42, 1053-1059 (2010).
8. USDA, Oilseeds: World Markets and Trade (2020). 9. B. Machovina, K. J. Feeley, W. J. Ripple, Biodiversity conservation: The key is
reducing meat consumption. Science of The Total Environment 536, 419-431 (2015).
10. H. B. Krishnan, Engineering Soybean for Enhanced Sulfur Amino Acid Content. Crop Science 45, 454 (2005).
11. I. H. Han, B. G. Swanson, B.-K. Baik, Protein digestibility of selected legumes treated with ultrasound and high hydrostatic pressure during soaking. Cereal Chemistry Journal 84, 518-521 (2007).
12. F. Roy, J. Boye, B. Simpson, Bioactive proteins and peptides in pulse crops: Pea, chickpea and lentil. Food research international 43, 432-442 (2010).
13. S. K. Vanga, A. Singh, V. Raghavan, Review of conventional and novel food processing methods on food allergens. Critical Reviews in Food Science and Nutrition 57, 2077-2094 (2017).
14. X. P. Xu et al., Integrated and comparative proteomics of high-oil and high-protein soybean seeds. Food Chemistry 172, 105-116 (2015).
15. J. Chung et al., The Seed Protein, Oil, and Yield QTL on Soybean Linkage Group I. Crop Science 43, 1053 (2003).
16. A. A. Mahmoud et al., Effect of Six Decades of Selective Breeding on Soybean Protein Composition and Quality: A Biochemical and Molecular Analysis. 54, 3916-3922 (2006).
17. S. Damodaran, K. L. Parkin, O. R. Fennema, Fennema's food chemistry. (CRC press, 2007).
18. Interagency Agricultural Projections Committee, USDA Agricultural Projections to 2029 (2019).

41
19. G. L. Hartman, E. D. West, T. K. Herman, Crops that feed the World 2. Soybean—worldwide production, use, and constraints caused by pathogens and pests. Food Security 3, 5-17 (2011).
20. M. A. Asgar, A. Fazilah, N. Huda, R. Bhat, A. A. Karim, Nonmeat protein alternatives as meat extenders and meat analogs. Comprehensive Reviews in Food Science and Food Safety 9, 513-529 (2010).
21. M. López-Pedrouso, J. M. Lorenzo, M. Gagaoua, D. Franco, Current Trends in Proteomic Advances for Food Allergen Analysis. Biology 9, 247 (2020).
22. O. L. Tavano, Protein hydrolysis using proteases: An important tool for food biotechnology. Journal of Molecular Catalysis B: Enzymatic 90, 1-11 (2013).
23. F. L. H. C. S. P. C. H. Disease, Food and Drug Administration, HHS. final rule. Federal Register 64, (1999).
24. G. Rizzo, L. Baroni, Soy, soy foods and their role in vegetarian diets. Nutrients 10, 43 (2018).
25. S. Levis, N. Strickman-Stein, D. R. Doerge, J. Krischer, Design and baseline characteristics of the Soy Phytoestrogens As Replacement Estrogen (SPARE) study — A clinical trial of the effects of soy isoflavones in menopausal women. Contemporary Clinical Trials 31, 293-302 (2010).
26. K. Liu, Soybeans as functional foods and ingredients. (AOCS press Champaign, IL, 2004).
27. H. W. Hoogenkamp, Soy protein and formulated meat products. (Cabi Publishing, 2004).
28. P. M. Matricardi et al., EAACI molecular allergology user's guide. Pediatric Allergy and Immunology 27, 1-250 (2016).
29. J. E. Kinsella, Functional properties of soy proteins. Journal of the American Oil Chemists' Society 56, 242-258 (1979).
30. L. L'Hocine, J. I. Boye, Allergenicity of soybean: new developments in identification of allergenic proteins, cross-reactivities and hypoallergenization technologies. Crit Rev Food Sci Nutr 47, 127-143 (2007).
31. T. Baysal, A. Demirdöven, Lipoxygenase in fruits and vegetables: A review. Enzyme and Microbial Technology 40, 491-496 (2007).
32. C. J. J. A. O. C. S. Morr, Functionality of oilseed and legume protein. 67, 265-271 (1990).
33. P. Schuck, Size-Distribution Analysis of Macromolecules by Sedimentation Velocity Ultracentrifugation and Lamm Equation Modeling. Biophysical Journal 78, 1606-1619 (2000).
34. T. Svedberg, K. O. Pedersen, The Ultracentrifuge. (Oxford : Clarendon Press, 1940), pp. 478.
35. W. J. Wolf, Soybean proteins. Their functional, chemical, and physical properties. Journal of Agricultural Food Chemistry 18, 969-976 (1970).
36. N. L. Houston et al., Quantitation of soybean allergens using tandem mass spectrometry. Journal of proteome research 10, 763-773 (2011).
37. P. R. Jungblut, H. G. Holzhütter, R. Apweiler, H. Schlüter, The speciation of the proteome. Chemistry Central Journal 2, 16 (2008).

42
38. M. C. García, M. Torre, M. L. Marina, F. Laborda, A. R. Rodriquez, Composition and characterization of soyabean and related products. Critical Reviews in Food Science and Nutrition 37, 361-391 (1997).
39. M. Hidayat, M. Sujatno, N. Sutadipura, Setiawan, A. Faried, β-Conglycinin Content Obtained from Two Soybean Varieties Using Different Preparation and Extraction Methods. HAYATI Journal of Biosciences 18, 37-42 (2011).
40. E. Derbyshire, D. J. Wright, D. Boulter, Legumin and vicilin, storage proteins of legume seeds. Phytochemistry 15, 3-24 (1976).
41. Y. Wu, W. Wang, J. Messing, Balancing of sulfur storage in maize seed. BMC Plant Biology 12, 77 (2012).
42. C. Radauer, M. Bublin, S. Wagner, A. Mari, H. Breiteneder, Allergens are distributed into few protein families and possess a restricted number of biochemical functions. Journal of Allergy and Clinical Immunology 121, 847-852.e847 (2008).
43. H. Breiteneder, C. Radauer, A classification of plant food allergens. J Allergy Clin Immunol 113, 821-830; quiz 831 (2004).
44. T. Fukuda et al., Molecular analysis and physicochemical properties of electrophoretic variants of wild soybean Glycine soja storage proteins. Journal of Agricultural and Food Chemistry 53, 3658-3665 (2005).
45. X. Sun, X. Shan, Z. Yan, Y. Zhang, L. Guan, Prediction and characterization of the linear IgE epitopes for the major soybean allergen β-conglycinin using immunoinformatics tools. Food and Chemical Toxicology 56, 254-260 (2013).
46. M. He, J. Xi, Identification of an IgE epitope of soybean allergen Gly m Bd 60K. LWT 133, 110131 (2020).
47. T. Ogawa, N. Bando, H. Tsuji, K. Nishikawa, K. Kitamura, α-Subunit ofβ-Conglycinin, an allergenic protein recognized by IgE antibodies of soybean-sensitive patients with atopic dermatitis. Bioscience, Biotechnology, and Biochemistry 59, 831-833 (1995).
48. S. J. Koppelman, C. M. M. Lakemond, R. Vloosqijk, S. L. Hefle, Detection of soy proteins in processed foods: literature overview and new experimental work. Journal of AOAC International 87, 1398-1407 (2004).
49. A. Mari et al., Bioinformatics applied to allergy: Allergen databases, from collecting sequence information to data integration. The Allergome platform as a model. Cellular Immunology 244, 97-100 (2006).
50. R. E. Hileman et al., Bioinformatic methods for allergenicity assessment using a comprehensive allergen database. International Archives of Allergy Immunology 128, 280-291 (2002).
51. D. Croote, S. R. Quake, Food allergen detection by mass spectrometry: the role of systems biology. npj Systems Biology and Applications 2, 16022 (2016).
52. A. L. Capriotti et al., Protein profile of mature soybean seeds and prepared soybean milk. Journal of Agricultural and Food Chemistry 62, 9893-9899 (2014).
53. K. Nishinari, Y. Fang, S. Guo, G. O. Phillips, Soy proteins: A review on composition, aggregation and emulsification. Food hydrocolloids 39, 301-318 (2014).

43
54. N. Maruyama et al., Structure−physicochemical function relationships of soybean β-conglycinin constituent subunits. Journal of Agricultural and Food Chemistry 47, 5278-5284 (1999).
55. T. R. Sampson, S. D. Saroj, A. C. Llewellyn, Y.-L. Tzeng, D. S. Weiss, A CRISPR/Cas system mediates bacterial innate immune evasion and virulence. Nature 497, 254-257 (2013).
56. D. A. Kimbrell, B. Beutler, The evolution and genetics of innate immunity. Nature Reviews Genetics 2, 256-267 (2001).
57. J. A. Owen, J. Punt, S. A. Stranford, Kuby immunology. (WH Freeman New York, 2013).
58. D. G. Schatz, Y. Ji, Recombination centres and the orchestration of V(D)J recombination. Nature Reviews Immunology 11, 251-263 (2011).
59. P. Gell, R. R. A. Coombs, The classification of allergic reactions underlying disease. Clinical aspects of immunology, 317-337 (1963).
60. T. V. Rajan, The Gell–Coombs classification of hypersensitivity reactions: a re-interpretation. Trends in Immunology 24, 376-379 (2003).
61. S. L. Taylor, S. Hefle, Allergic reactions and food intolerances. Nutritional Toxicology, 93-121 (2002).
62. H. A. Sampson, Food allergy. Part 1: Immunopathogenesis and clinical disorders. 103, 717-728 (1999).
63. J. A. Boyce et al., Guidelines for the Diagnosis and Management of Food Allergy in the United States: Summary of the NIAID-Sponsored Expert Panel Report. Journal of the American Academy of Dermatology 64, 175-192 (2011).
64. K. Grimshaw, 14 Food Hypersensitivity. Clinical Paediatric Dietetics, 259 (1994).
65. M. B. Heyman, Lactose Intolerance in Infants, Children, and Adolescents. PEDIATRICS 118, 1279-1286 (2006).
66. E. F. S. A. EFSA, Scientific opinion on the evaluation of allergenic foods and food ingredients for labelling purposes. EFSA Journal 12, (2014).
67. S. H. Sicherer, Food protein-induced enterocolitis syndrome: clinical perspectives. Journal of pediatric gastroenterology nutritional Toxicology 30, S45-S49 (2000).
68. S. L. T. J.L. Kabourek, Soyfoods and Allergies: Separating fact and fiction. The Soy Connection 11, 1-6 (2003).
69. A. Muraro et al., EAACI Food Allergy and Anaphylaxis Guidelines: diagnosis and management of food allergy. Allergy 69, 1008-1025 (2014).
70. S. L. Hefle, J. A. Nordlee, S. L. Taylor, Allergenic foods. Critical Reviews in Food Science Nutritional Toxicology 36, 69-89 (1996).
71. C. D. May, The ancestry of allergy: Being an account of the original experimental induction of hypersensitivity recognizing the contribution of Paul Portier. Journal of Allergy and Clinical Immunology 75, 485-495 (1985).
72. L. M. Webb, P. Lieberman, Anaphylaxis: a review of 601 cases. 97, 39-43 (2006). 73. H. A. Sampson et al., Second symposium on the definition and management of
anaphylaxis: Summary report—Second National Institute of Allergy and Infectious Disease/Food Allergy and Anaphylaxis Network symposium. Journal of Allergy and Clinical Immunology 117, 391-397 (2006).

44
74. H. A. Sampson, Update on food allergy. J Allergy Clin Immunol 113, 805-819; quiz 820 (2004).
75. S. C. Bischoff, Role of mast cells in allergic and non-allergic immune responses: comparison of human and murine data. Nature Reviews Immunology 7, 93-104 (2007).
76. F. A. Redegeld et al., Immunoglobulin-free light chains elicit immediate hypersensitivity-like responses. Nature Medicine 8, 694-701 (2002).
77. H. A. Sampson et al., Food allergy: A practice parameter update—2014. Journal of Allergy and Clinical Immunology 134, 1016-1025.e1043 (2014).
78. L. Fu, B. J. Cherayil, H. Shi, Y. Wang, Y. Zhu. (Springer Singapore, 2019), pp. 1-11.
79. J. H. Savage, A. J. Kaeding, E. C. Matsui, R. A. Wood, The natural history of soy allergy. Journal of Allergy and Clinical Immunology 125, 683-686 (2010).
80. S. H. Sicherer, H. A. Sampson, Food allergy. Journal of Allergy and Clinical Immunology 125, S116-S125 (2010).
81. W. Duke, Soy bean as a possible important source of allergy. Journal of Allergy 5, 300-302 (1934).
82. R. González, L. Zapatero, F. Caravaca, J. Carreira, Identification of soybean proteins responsible for respiratory allergies. International Archives of Allergy Immunology 95, 53-57 (1991).
83. I. M. Yman et al., Analysis of food proteins for verification of contamination or mislabelling. 6, 167-172 (1994).
84. J. W. Yunginger et al., Laboratory investigation of deaths due to anaphylaxis. Journal of Forensic Science 36, 857-865 (1991).
85. R. H. Klein Entink et al., Food allergy population thresholds: An evaluation of the number of oral food challenges and dosing schemes on the accuracy of threshold dose distribution modeling. Food and Chemical Toxicology 70, 134-143 (2014).
86. A. W. Burks et al., ICON: Food allergy. Journal of Allergy and Clinical Immunology 129, 906-920 (2012).
87. C. Bindslev-Jensen, D. Briggs, M. Osterballe, Can we determine a threshold level for allergenic foods by statistical analysis of published data in the literature? Allergy 57, 741-746 (2002).
88. A. J. MacGinnitie, M. C. Young, The role of food challenges in clinical practice. The Journal of Allergy Clinical Immunology: In Practice 6, 353-360 (2018).
89. A. J. van Hengel, Food allergen detection methods and the challenge to protect food-allergic consumers. Analytical Bioanalytical Chemistry 389, 111-118 (2007).
90. S. H. Sicherer, H. A. Sampson, Food allergy: A review and update on epidemiology, pathogenesis, diagnosis, prevention, and management. Journal of Allergy and Clinical Immunology 141, 41-58 (2018).
91. C. A. Commission, J. F. W. C. A. Commission, J. F. W. F. S. Programme, Codex alimentarius. (Bernan Assoc, 2001), vol. 9.
92. R. J. Rona et al., The prevalence of food allergy: A meta-analysis. Journal of Allergy and Clinical Immunology 120, 638-646 (2007).
93. Food allergen labeling and consumer protection act of 2004 (2004). 94. (2019).

45
95. S. L. Taylor et al., Factors affecting the determination of threshold doses for allergenic foods: how much is too much? Journal of Allergy Clinical Immunology 109, 24-30 (2002).
96. D. Anderson, A. Hossain, F. Shahidi, A primer on oils processing technology. Bailey's industrial oil fat products, 1-47 (2005).
97. S. L. Taylor, S. L. Hefle, Ingredient and labeling issues associated with allergenic foods. Allergy 56, 64-69 (2001).
98. R. W. R. Crevel, M. A. T. Kerkhoff, M. M. G. Koning, Allergenicity of refined vegetable oils. 38, 385-393 (2000).
99. R. Bush, S. Taylor, J. Nordlee, W. Busse, Soybean oil is not allergenic to soybean-sensitive individuals. Journal of Allergy and Clinical Immunology 76, 242-245 (1985).
100. W. M. Blom et al., Assessing food allergy risks from residual peanut protein in highly refined vegetable oil. Food and Chemical Toxicology 106, 306-313 (2017).
101. S. M. Gendel, Comparison of international food allergen labeling regulations. Regulatory Toxicology and Pharmacology 63, 279-285 (2012).
102. (2006). 103. T. W. Group, Approaches to establish thresholds for major food allergens and for
gluten in food. Journal of Food Protection 71, 1043-1088 (2008). 104. L. Bucchini, A. Guzzon, R. Poms, H. Senyuva, Analysis and critical comparison
of food allergen recalls from the European Union, USA, Canada, Hong Kong, Australia and New Zealand. Food Additives & Contaminants: Part A 33, 760-771 (2016).
105. S. H. Sicherer, T. Mahr, Management of Food Allergy in the School Setting. PEDIATRICS 126, 1232-1239 (2010).
106. S. H. Sicherer, T. J. Furlong, J. Desimone, H. A. Sampson, Self-reported allergic reactions to peanut on commercial airliners☆☆☆. 104, 186-189 (1999).
107. N. Z. Ballin, Authentication of meat and meat products. Meat Science 86, 577-587 (2010).
108. Food labeling: FDA needs to better leverage resources, improve oversight, and effectively use available data to help consumers select healthy foods (September 2008).
109. S. M. Gendel, J. Zhu, Analysis of US Food and Drug Administration food allergen recalls after implementation of the food allergen labeling and consumer protection act. Journal of food protection 76, 1933-1938 (2013).
110. A. Dunngalvin et al., Precautionary allergen labelling: perspectives from key stakeholder groups. Allergy 70, 1039-1051 (2015).
111. S. L. Taylor et al., Establishment of Reference Doses for residues of allergenic foods: Report of the VITAL Expert Panel. Food and Chemical Toxicology 63, 9-17 (2014).
112. B. C. Remington et al., Updated population minimal eliciting dose distributions for use in risk assessment of 14 priority food allergens. Food and Chemical Toxicology 139, 111259 (2020).
113. G. M. Sharma, S. E. Khuda, C. H. Parker, A. C. Eischeid, M. Pereira, Detection of allergen markers in food: Analytical methods. Food and Drug Administration Papers, 6, (2017).

46
114. R. Krska, E. Welzig, S. Baumgartner, Immunoanalytical detection of allergenic proteins in food. Analytical and Bioanalytical Chemistry 378, 63-65 (2004).
115. P. S. Adams, Data analysis and reporting. Real Time PCR, 39-61 (2006). 116. W. Mayer, M. Schuller, M. Viehauser, R. Hochegger, Quantification of the
allergen soy (Glycine max) in food using digital droplet PCR (ddPCR). European Food Research Technology 245, 499-509 (2019).
117. N. Gryson, K. Messens, K. Dewettinck, PCR detection of soy ingredients in bread. European Food Research and Technology 227, 345-351 (2008).
118. P. Schubert-Ullrich et al., Commercialized rapid immunoanalytical tests for determination of allergenic food proteins: an overview. Analytical and Bioanalytical Chemistry 395, 69-81 (2009).
119. P. Hornbeck, Enzyme‐linked immunosorbent assays. Current protocols in immunology 1, 2.1. 1-2.1. 22 (1992).
120. G. N. Konstantinou. (Springer New York, 2017), pp. 79-94. 121. S. Jayasena et al., Comparison of six commercial ELISA kits for their specificity
and sensitivity in detecting different major peanut allergens. J Agric Food Chem 63, 1849-1855 (2015).
122. S. Baumgartner et al., Towards the development of a dipstick immunoassay for the detection of trace amounts of egg proteins in food. European Food Research and Technology 214, 168-170 (2002).
123. M. Khedri, M. Ramezani, H. Rafatpanah, K. Abnous, Detection of food-born allergens with aptamer-based biosensors. TrAC Trends in Analytical Chemistry 103, 126-136 (2018).
124. O. Stephan, N. Moller, S. Lehmann, T. Holzhauser, S. Vieths, Development and validation of two dipstick type immunoassays for determination of trace amounts of peanut and hazelnut in processed foods. European Food Research and Technology 215, 431-436 (2002).
125. I. Segura-Gil et al., Development of sandwich and competitive ELISA formats to determine β-conglycinin: Evaluation of their performance to detect soy in processed food. Food Control 103, 78-85 (2019).
126. L. L'Hocine, J. I. Boye, C. Munyana, Detection and quantification of soy allergens in food: Study of two commercial enzyme‐linked immunosorbent assays. Journal of food science 72, C145-C153 (2007).
127. L. Monaci, A. Visconti, Immunochemical and DNA-based methods in food allergen analysis and quality assurance perspectives. Trends in Food Science & Technology 21, 272-283 (2010).
128. Y. S. Song, J. Frias, C. Martinez-Villaluenga, C. Vidal-Valdeverde, E. G. De Mejia, Immunoreactivity reduction of soybean meal by fermentation, effect on amino acid composition and antigenicity of commercial soy products. Food Chemistry 108, 571-581 (2008).
129. T. Cucu et al., Effect of partial hydrolysis on the hazelnut and soybean protein detectability by ELISA. Food Control 30, 497-503 (2013).
130. N. Bando et al., Quantitative Analysis of Gly m Bd 28K in Soybean Products by a Sandwich Enzyme Linked Immunosorbent Assay. Journal of Nutritional Science and Vitaminology 44, 655-664 (1998).

47
131. N. Morishita et al., Reliable Enzyme-Linked Immunosorbent Assay for the Determination of Soybean Proteins in Processed Foods. Journal of Agricultural and Food Chemistry 56, 6818-6824 (2008).
132. R. Fleischmann et al., Whole-genome random sequencing and assembly of Haemophilus influenzae Rd. Science 269, 496-512 (1995).
133. C. Venter, S. H. Sicherer, M. Greenhawt, Management of Peanut Allergy. The Journal of Allergy and Clinical Immunology: In Practice 7, 345-355.e342 (2019).
134. J. Schmutz et al., Genome sequence of the palaeopolyploid soybean. Nature 463, 178-183 (2010).
135. M. R. Wilkins et al., Progress with Proteome Projects: Why all Proteins Expressed by a Genome Should be Identified and How To Do It. Biotechnology and Genetic Engineering Reviews 13, 19-50 (1996).
136. B. Thiede et al., Peptide mass fingerprinting. Methods 35, 237-247 (2005). 137. G. Montaudo, R. P. Lattimer, Mass spectrometry of polymers. (CRC press, 2001). 138. J. R. Yates, C. I. Ruse, A. Nakorchevsky, Proteomics by Mass Spectrometry:
Approaches, Advances, and Applications. Annual Review of Biomedical Engineering 11, 49-79 (2009).
139. C. Fenselau, P. A. Demirev, Characterization of intact microorganisms by MALDI mass spectrometry. 20, 157-171 (2001).
140. M. R. Emmett, R. M. Caprioli, Micro-electrospray mass spectrometry: ultra-high-sensitivity analysis of peptides and proteins. Journal of the American Society for Mass Spectrometry 5, 605-613 (1994).
141. J. B. Fenn, M. Mann, C. K. Meng, S. F. Wong, C. M. Whitehouse, Electrospray ionization–principles and practice. Mass Spectrometry Reviews 9, 37-70 (1990).
142. D. Lin, D. L. Tabb, J. R. Yates, Large-scale protein identification using mass spectrometry. Biochimica et Biophysica Acta (BBA) - Proteins and Proteomics 1646, 1-10 (2003).
143. J. H. Gross. (Springer International Publishing, 2017), pp. 779-829. 144. R. Aebersold, M. Mann, Mass spectrometry-based proteomics. Nature 422, 198
(2003). 145. S. Gallien et al., Targeted Proteomic Quantification on Quadrupole-Orbitrap Mass
Spectrometer. Molecular & Cellular Proteomics 11, 1709-1723 (2012). 146. Q. Hu et al., The Orbitrap: a new mass spectrometer. Journal of mass
spectrometry 40, 430-443 (2005). 147. M. Walsh, Determination of nitroaromatic, nitramine, and nitrate ester explosives
in soil by gas chromatography and an electron capture detector. Talanta 54, 427-438 (2001).
148. V. Cunsolo, V. Muccilli, R. Saletti, S. Foti, Mass spectrometry in food proteomics: a tutorial. Journal of Mass Spectrometry 49, 768-784 (2014).
149. G. E. Reid, S. A. McLuckey, 'Top down' protein characterization via tandem mass spectrometry. Journal of Mass Spectrometry 37, 663-675 (2002).
150. L. Monaci, E. De Angelis, N. Montemurro, R. Pilolli, Comprehensive overview and recent advances in proteomics MS based methods for food allergens analysis. TrAC Trends in Analytical Chemistry 106, 21-36 (2018).

48
151. G. L. Corthals, V. C. Wasinger, D. F. Hochstrasser, J. C. Sanchez, The dynamic range of protein expression: a challenge for proteomic research. Electrophoresis: An International Journal 21, 1104-1115 (2000).
152. J. R. Wiśniewski, A. Zougman, N. Nagaraj, M. Mann, Universal sample preparation method for proteome analysis. Nature methods 6, 359 (2009).
153. I. Neverova, J. E. Van Eyk, Role of chromatographic techniques in proteomic analysis. Journal of Chromatrography B 815, 51-63 (2005).
154. K. Maes, I. Smolders, Y. Michotte, A. Van Eeckhaut, Strategies to reduce aspecific adsorption of peptides and proteins in liquid chromatography–mass spectrometry based bioanalyses: An overview. Journal of Chromatography A 1358, 1-13 (2014).
155. A. N. Hoofnagle et al., Recommendations for the Generation, Quantification, Storage, and Handling of Peptides Used for Mass Spectrometry–Based Assays. Clinical Chemistry 62, 48-69 (2016).
156. S. Gallien, A. Bourmaud, S. Y. Kim, B. Domon, Technical considerations for large-scale parallel reaction monitoring analysis. Journal of proteomics 100, 147-159 (2014).
157. S. Gallien, E. Duriez, K. Demeure, B. Domon, Selectivity of LC-MS/MS analysis: implication for proteomics experiments. Journal of proteomics 81, 148-158 (2013).
158. A. C. Peterson et al., Parallel reaction monitoring for high resolution and high mass accuracy quantitative, targeted proteomics. 11, 1475-1488 (2012).
159. M. Herrero, C. Simó, V. García-Cañas, E. Ibáñez, A. Cifuentes, Foodomics: MS-based strategies in modern food science and nutrition. Mass Spectrometry Reviews 31, 49-69 (2012).
160. J. Heick, M. Fischer, B. Pöpping, First screening method for the simultaneous detection of seven allergens by liquid chromatography mass spectrometry. Journal of Chromatography A 1218, 938-943 (2011).
161. J. Reimer et al., Effect of cyclization of N-terminal glutamine and carbamidomethyl-cysteine (residues) on the chromatographic behavior of peptides in reversed-phase chromatography. Journal of Chromatography A 1218, 5101-5107 (2011).
162. J. Lill, Proteomic tools for quantitation by mass spectrometry. Mass Spectrometry Reviews 22, 182-194 (2003).
163. S.-E. Ong, M. Mann, Mass spectrometry–based proteomics turns quantitative. Nature Chemical Biology 1, 252-262 (2005).
164. W. Zhu, J. W. Smith, C.-M. Huang, Mass Spectrometry-Based Label-Free Quantitative Proteomics. Journal of Biomedicine and Biotechnology 2010, 1-6 (2010).
165. D. S. Kirkpatrick, S. A. Gerber, S. P. Gygi, The absolute quantification strategy: a general procedure for the quantification of proteins and post-translational modifications. Methods 35 35, 265-273 (2005).
166. M. Planque et al., Development of a strategy for the quantification of food allergens in several food products by mass spectrometry in a routine laboratory. Food Chemistry 274, 35-45 (2019).

49
167. A. M. Almeida, M. M. Castel-Branco, A. C. Falcão, Linear regression for calibration lines revisited: weighting schemes for bioanalytical methods. Journal of Chromatography B 774, 215-222 (2002).
168. J. M. Bland, D. G. Altman, Measuring agreement in method comparison studies. Statistical Methods in Medical Research 8, 135-160 (1999).
169. A. Leitner, F. Castro-Rubio, M. L. Marina, W. Lindner, Identification of marker proteins for the adulteration of meat products with soybean proteins by multidimensional liquid chromatography−tandem mss sectrometry. Journal of Proteome Research 5, 2424-2430 (2006).

50
CHAPTER 2
STANDARD CURVE OPTIMIZATION AND SELECTION OF ROBUST
QUANTIFYING PEPTIDES FOR AN EXISTING TARGETED LC-MS/MS
METHOD
I. ABSTRACT
Soybeans are an important oilseed crop. The protein fraction can be concentrated
into different functional ingredients. These ingredients are commonly added as auxiliary
components to a diverse range of food products. The potential for the cross-contract
between soybeans and other various food products is concerning because of the
widespread use of these protein-rich ingredients. This presents a unique analytical
challenge that requires a robust quantification method capable of detecting processed soy
proteins in complex food matrices.
External standards can be used as part of a quantification workflow for food
allergens using mass spectrometry (MS). An existing targeted LC-MS/MS method
developed by Chen et. al (2019) was modified to shorten the total sample preparation
time. Internal standards were spiked into samples to normalize the peptide response. The
ratio of the external to internal standards was used as the measured peptide response of
each dilution method. Optimal digestion time and trypsin concentration were modified
for shorter sample preparation steps. Two dilution methods, after extraction (AE) and
after reconstitution (AR), were compared to optimize the external standard preparation.
The peptide response was measured using linear regression analysis (slope, R2), variance,
and linearity.

51
The AR method was determined to be the more robust method. AR external
standards had linearity from 1-400 mg/kg total soy protein and similar peptide responses
between different digestion conditions and background protein concentrations. The
quantifying peptides with later elution in the RP-HPLC chromatography gradient were
determined to have greater variability in peptide response than earlier eluting peptides.
The greater variability of the heavy peptide standards for the hydrophobic peptides
suggests the hydrophilic peptides are more suitable for quantification. Future work will
focus on quantifying soy protein using the AR method and hydrophilic peptides.

52
II. INTRODUCTION
Soybeans are one of the most common causes of food allergies in the United
States. The prevalence of soy allergy in North America is estimated at 0.4% of children
and 0.3% of adults (1). Allergic consumers rely on accurate food labels for complete
avoidance of the offending food. Research suggests a measurable amount of protein can
be tolerated by allergic individuals (2). Therefore, quantifying the possible presence of
soy protein in a range of food products is important for allergen risk assessment.
Immunoassays have been the most widely used technique to detect and quantify
soy proteins for quality control purposes. Enzyme-linked immunosorbent assays
(ELISAs) have many analytical advantages such as the ease of use, fast results,
sensitivity, and sampling capacity (3). However, the challenge with ELISA is the reliance
on the integrity of antibodies and proteins (4). This limits sample preparation steps as
well as the detection of highly processed target proteins. DNA-based methods, namely
polymerase chain reaction (PCR), are less commonly used because these assays target
DNA, rather than protein. Similar to immunoassays, food processing can damage DNA
and weaken detection (5). The major drawback of both methods is detecting processed
target analytes.
Mass spectrometry (MS)-based methods have emerged as a method for food
allergen analysis. Although MS methods do not rely on the integrity of the protein,
process-induced modification can hinder detection and quantification. However,
comparatively MS may more effective for the detection of food proteins after extensive
processing (6). Sensitivity is increased by coupling to liquid chromatography systems,
fractionating the sample before analysis (7). Selectivity can be increased with parallel

53
reaction monitoring (PRM) workflow because many proteins can be monitored at the
same time (8).
Quantification methods may use external standards, internal standards, or a
combination of both. Internal standards in targeted MS workflows are identical to the
sample targets except with the addition of isotopically-labeled atoms (“heavy” peptides)
and are considered the gold standard for absolute quantification (9, 10). The sample
peptide responses are then normalized to the heavy peptide responses to control for
instrumental variation.
The major drawback to MS-based methods is the intensive time needed for the
sample preparation and data analysis. ELISA is more easily applied to food processing
settings because of the availability of commercialized kits and the minimal training
required. There remains a need for more adaptable MS methods intended for food
industry use. Therefore, this work intends to optimize a sample preparation workflow for
targeted LC-MS/MS of soy protein and apply the workflow for robust quantification.
The method optimized is a quantitative targeted LC-MS/MS developed for the
absolute quantification of soy protein (11). The method was developed to be used to
quantify soy protein in a wide range of complex food matrices. Sample preparation time
can be significantly shortened by optimizing the dilution of the standard curve. The first
objective of this work is to compare the existing dilution of external standards to a
streamlined method. The most robust standard curve preparation method was determined
by the sensitivity, linear dynamic range, and variance. The second objective of this work
was to determine the most robust quantifying peptides to be used in future quantitative

54
studies. In future work, the most robust peptides will be used to quantify soy protein in
model food matrices.
III. Materials and Method
A. Materials
Urea was purchased from Bio-Rad. Trizma base, iodoacetamide (IAA), and
ammonium bicarbonate were purchased from Sigma. Dithiothreitol (DTT) and
polyvinylpolypyrrolidone (PVP) were purchased from Acros Organics. Trypsin was
purchased from Promega. The protein assay used was the Pierce 660 nm protein assay
(cat # 2260). The albumin standard (for the protein assay) and trifluoroacetic acid (TFA)
were purchased from Thermo Scientific. Formic acid, acetonitrile, and MS-grade water
were purchased from Fisher Scientific. External standards were diluted using MiniSorp
polyethylene tubes purchased from Thermo Scientific. Centrifugal filters for filter-aided
sample preparation were Amicon 10 kDa filters purchased from Millipore. Reconstituted
samples were transferred to polypropylene LC vials for MS analysis. Non-fat dry milk
was purchased from a local grocery store in Lincoln, NE. The non-roasted soy flour
(NRSF) was kindly provided by Archer Daniel Midlands Company.
B. Targeted LC-MS/MS Workflow
Sample preparation for parallel reaction monitoring (PRM) liquid chromatography-
tandem mass spectrometry (LC-MS/MS) analysis was followed as previously described
in Chen et al, 2019. Briefly, 1 g of each sample was extracted in 20 mL buffer containing
50 mM TRIS-HCl (pH 8.6), 20 mM DTT, 6 M urea, and 0.5 % NFDM. A final
concentration of 1.0% PVPP (w/v) was added directly added to bind to polyphenols

55
present in the sample. After centrifugation, the protein concentration of extracts was
estimated with the 660 nm assay (Pierce 660 Protein Assay, Thermo Scientific). Bovine
serum albumin (BSA) was used as the reference standard. Samples were then reduced
with 100 mM DTT (starting concentration) and alkylated with 100 mM IAA (starting
concentration) for 20 min in the dark. Sequencing Grade Modified Trypsin was added on
a weight basis for overnight digestion at a final concentration of 1:50 (µg trypsin to µg
protein) (Promega, cat # V5111). Protein was enriched using filter-aided sample
preparation (FASP). Samples were digested on Amicon 10 kDa centrifugal filters
(Millipore, cat # UFC501096) and centrifuged at 14,000 g for 15 min prior to desalting
with Pierce C18 spin columns (max 30 µg protein) (Thermo Scientific, # 89870).
Samples were freeze dried at -80 °C overnight then stored at -20 °C until further analysis.
A total of five absolute quantification (AQUA) peptides were synthetically made and
obtained from Thermo Scientific (Table 2-1). The isotope modifications were on the C-
terminal lysine (13C615N2) and C-terminal arginine (13C6
15N4). These are referred to as
internal standards. All heavy peptides were mixed in equal concentrations to prepare a 5
fmol/µL solution. All samples were reconstituted in 0.1% formic acid (FA) and 3% ACN
then spiked 1:1 (v/v) with the heavy peptide mixture. All samples were injected at a
volume of 5 µL and eluted over a 60-minute gradient. The first 5 minutes of the
chromatography gradient was 98% (solvent A) (0.1% formic acid in water), peptides
were then eluted over a 20-40 % gradient (solvent B) (0.1% formic acid in acetonitrile)
for 30 minutes followed by a methanol wash for 10 minutes, and a final wash with 98 %
(solvent A) for 10 minutes. Data was collected in targeted mode on a Q Exactive™ Plus
Orbitrap™ mass spectrometer. Precursors were monitored with a full MS1 scan from

56
400-2000 m/z at a resolution of 17,500, ACG target of 3 × 10⁶, and maximum IT of 50
ms. In tandem, pre-selected fragment ions were monitored with PRM scans at a
resolution of 140,000, ACG at 2 × 10⁵, automatic max IT, and with an isolation window
at 1.4 m/z with 0.4 offset. Raw data files were then imported in Skyline (version 20.1) for
further analysis (12).
Table 2-1. Target soy peptides.
Quantifying Peptide Protein
Accession No.
Mass to Charge (m/z)1
Positive Charge State (z)
Retention Time Window (min)
Start End LITLAIPVNKPGR P13916 464.6293 3 19.66 24.66
NILEASYDTK P13916 577.2904 2 10.9 15.9 LSAQYGSLR P04405 497.7694 2 8.07 13.07
SQSDNFEYVSFK P04405 725.8279 2 16.85 21.85 VFDGELQEGR P04776 575.2804 2 8.97 13.97
1Experimental m/z (11)
C. Digestion
Modifications to the existing digestion protocol were compared (11). The existing
method consists of subsequent additions of trypsin at 1:100 (trypsin: protein) (w/w). The
first addition is followed by a 3-hour digestion, and the next addition is followed by an
overnight digestion. Complete digestion with a single addition of trypsin at 1:50 was
investigated. A 1:20 (w/v) NRSF extract was diluted in blank extraction buffer (0.5%
NFDM) to a final concentration of 20 mg/kg total soy protein. Digestion of light peptides
was observed with 9 subsamples over a 20-hour time period. These subsamples (based on
hour) were as follows: 0, 0.5, 1, 2, 3, 4, 14, 16, 18, and 20. Replicate digest samples were
prepared for each time point (18 samples total).

57
D. SDS-PAGE
One digest replicate at each time point was retained on the centrifugal filters and
frozen at -20 C to stop digestion. These samples were brought to room temperature
before analysis by sodium dodecyl sulfate- polyacrylamide gel electrophoresis (SDS-
PAGE). One part sample was mixed with 5 parts of 6x Laemmli buffer and heated at 95
°C for 8 min. Samples were loaded into Mini-Protean TGX Precast 4-20% gradient gels.
The gel was run at 200 V for 45 min in Tris/Glycine buffer, prepared as recommended by
the manufacturer. Precision Plus Protein molecular weight markers (10-250 kDa) were
used to determine the size of the protein bands and loaded at the appropriate volume.
Each sample was loaded with equal volumes (12 µL). Two staining solutions were
applied to the same gel following the manufacturer’s instructions (Bio-Rad). The destain
procedure was followed according the manufacturer. Coomassie Brilliant Blue R-250
Staining Solution was first applied overnight followed by a 2-hour destain. Silver
Staining solution was then applied.
E. Standard Curve Preparation
The reference material for the external standards is non-roasted soy flour (NRSF)
obtained from Archer Daniel Midland Company (ADM) (Decatur, IL, USA). The initial
protein concentration of NRSF was determined to be 51.5% and was determined using
the LECO Dumas method. A 1:20 (w/v) extract of NRSF was extracted and centrifuged
at 13,000 g for 10 minutes. The supernatant of the NRSF extract was then serially diluted
in blank extraction buffer (without PVPP). The concentration of soy protein in each
dilution was based on the total soy protein concentration on a weight basis (mg total soy

58
protein/ kg NRSF). Two methods of dilution at different steps in the sample preparation
were compared (Figure 2-1). Each external standard is then spiked 1:1 (v/v) with internal
standards (4 fmol/µL). Each sample was then injected in duplicate and analyzed using the
LC-MS/MS workflow as described previously.
Figure 2-1. Two dilution methods for external standard preparation. After extraction (AE) serially dilutes samples immediately after extraction. The standards are then processed in tandem with a blank sample of extraction buffer (0.5 % NFDM). After reconstitution (AR) dilutes a single, higher concentration of total soy protein. This sample is then processed in tandem with a concentrated milk buffer (3 % NFDM) as a blank. The concentrated milk buffer is then used as a diluent for the external standards after reconstitution.

59
The methods are referred to based on the step in which serial dilution takes place:
after extraction (AE) and after reconstitution (AR). Each method dilutes to the same
theoretical total soy protein concentration (mg/kg). In the AE method, the NRSF
supernatant is serially diluted in extraction buffer (0.5 % NFDM) into seven total soy
protein concentrations (1, 2, 5, 10, 50, 100 mg/kg total soy protein) prior to digestion.
These external standards are then processed in tandem through the end of the sample
workflow without any modifications to the sample preparation. In the AR method, the
NRSF extract is diluted to a single higher concentration (500 mg soy protein/kg NRSF).
In tandem, a solution identical to the extraction buffer is prepared containing a higher
concentration of NFDM (3 %) referred to as the concentrated milk buffer (CMB). The
external standards and CMB sample are prepared in tandem. Small C18 spin columns
(max 30 µg) were used for cleanup for the external standards. A large Pierce C18 spin
column (max 5 mg ) was used for the CMB to maximize the digested milk protein
recovered for reconstitution (cat# 89852). The concentrated soy sample was reconstituted
in 20 µL 0.1% FA and 3 % ACN prior to dilution with CMB.
The CMB is reconstituted to a known protein concentration. The background
protein concentration for maximum light peptide recovery is unknown. Therefore, several
background protein concentrations were compared: 0.05, 0.1, 0.25, and 0.5 µg/µL (µg
digested milk protein/ µL reconstitution buffer). Replicate 500 mg/kg total soy protein
samples were then diluted to the same seven total soy protein concentrations as the AE
method with the different background protein concentrations. The AR external standards
were determined to have theoretically equivalent total protein concentrations compared to
the AE method.

60
F. Dilution Method
The maximum external standard in the existing protocol is 100 mg/kg total soy
protein. The linearity of the two external standard dilution methods were compared with
higher concentrations of total soy protein. For each method, ten dilutions of total soy
protein were prepared. The dilutions for AE included 1, 2, 5, 10, 20, 50, 100, 200, 300,
and 400 mg/kg. The dilutions for AR included 1, 2, 5, 10, 20, 50, 100, 150, 300, and 400
mg/kg. The AR method was prepared with one different concentration because of the
limited starting volume after reconstitution. Therefore, 150 mg/kg was substituted for 200
mg/kg for sufficient volume to dilute down to 1 mg/kg.
Two digestion conditions of the external standards were compared. A higher
amount of trypsin was compared to investigate any variability from the possible
underestimation of the protein content. The two amounts of trypsin added for digestion
was based on either the 660 nm assay (2 µg) or a theoretical maximum (4 µg). Both are
based on a final digestion ratio of 1:50. Replicate standard curves of the dilution methods
were prepared and digested with the two amounts of trypsin for a total of four external
standard curves.
G. Analysis
Raw files were imported into Skyline for chromatography-based quantification
analysis (version 20.1) (12). A set of pre-determined acceptance criteria was applied
manually to each target peptide chromatogram in Skyline: average mass error < 2 ppm,
dotp value >0.85, and a qualitative check for all three predetermined co-eluting
fragments. Because multiple protein fragments are measured, the dotp value was part of

61
the criteria set to measure the similarity between the relative intensities of the peptide
fragments to the predicted intensities. Peaks that fulfilled the entire set of criteria were
considered a positive detection. These positive detection peaks were used to calculate the
ratio of light peptide to heavy peptide peak areas in Skyline. Results from Skyline include
linear regression analysis (slope, R2 values) and peptide abundance (total peak area, ratio
of total peak areas). Skyline reports were exported into several supporting software
packages including Excel, SAS (version 9.4), and GraphPad Prism (version 8.0.0).
IV. RESULTS AND DISCUSSION
A. Digestion
Digestion efficiency is important to quantification workflows for the complete
and consistent generation of target peptides. The optimal time and trypsin concentration
for complete digestion of external standards has yet to be investigated for this method.
The existing protocol digests samples with subsequent additions of trypsin at 1:100. A
single addition of a higher ratio of trypsin to protein will streamline the protocol by
eliminating the 3-hour incubation period between subsequent additions of trypsin. The
first objective was to investigate the light peptide generation from a single addition of
trypsin at a ratio of 1:50. A single extract of 20 mg/kg soy protein over the period of 20
hours was observed to determine the necessity of an overnight digestion.
The progression of the protein digestion was determined by the disappearance of
higher molecular weight proteins. The digestion of higher molecular weight proteins was
determined using SDS-PAGE. This was observed both by the generation of lower

62
molecular weight protein bands and the disappearance of higher molecular weight protein
bands as shown in Figure 2-2.
Figure 2-2. SDS-PAGE of a digested 20 mg/kg total soy protein NRSF extract at 9 time points over a total of 20 hours. Each lane is loaded with equal volumes of 12 µL of sample in 6x Laemmli Buffer. The M lane is the protein ladder. The 0 lane is the extract before digestion. The digestion time points (in hours) are labeled from 0.5-20. The gel on the left was stained overnight with Coomassie Blue Staining Solution (R-250) (Bio-Rad). The same gel is pictured on the right and stained following the Silver Staining procedure (Bio-Rad).
It is evident that there was an immediate disappearance of all higher molecular
weight protein bands above 25 kDa immediately after 30 minutes of digestion. Some
abundant higher MW bands remain in the extract time points between 10-25 kDa. The
protein bands in this range had a general decrease in staining intensity as the digestion
time progressed from 30 minutes to 20 hours. Coomassie blue staining solution has a
sensitivity for micrograms of protein and is useful to visualize proteins at a higher
abundance in the extract. The protein bands stained were suspected to be from the NFDM
protein present in the buffer. The theoretical maximum soy protein concentration is
estimated as 0.001 µg/µL. The protein concentration of blank extraction buffer (0.5%

63
NFDM) is estimated at 0.975 µg/µL with the 660 nm assay. Therefore, the milk protein
concentration is approximately 1000-fold higher than the soy protein concentration in a
20 mg/kg total soy protein NRSF extract. The gel stained with Coomassie blue staining
solution provides evidence of the complete digestion of milk protein. However, soy
protein may have different rates of digestion and needs to be further investigated.
Analysis of lower abundant proteins that may originate from soy was observed
with a more sensitive staining procedure. The gel stained with silver staining solution is
sensitive enough to detect nanograms of protein. The SDS-PAGE gel does not allow the
observation of protein bands below 10 kDa, which may be indicative of target peptide
generation. Although, it does provide evidence of complete digestion of all extracted
proteins above 20 kDa. The stained gel showed an indigestible band around 20 kDa. The
identification of the protein band is unclear based solely on the molecular weight. The
centrifugal filters have a cutoff at 10 kDa, so the indigestible protein band will be
retained on the filter. Interestingly, the trypsin inhibitor protein is approximately 20kDa.
Partially digested trypsin inhibitor proteins are possible but were not considered a
concern. The harsh extraction conditions, chaotropic and reducing agents, likely disrupt
the structure of most proteins, and the temperature may inactivate the trypsin inhibitor
activity. Therefore, the indigestible protein band at 20 kDa was not a concern for the
detection of target soy proteins.
The length of time allowed for digestion can compromise the abundance of light
peptides in the sample. Enough time must be allowed for the complete digestion of
proteins. Continuing digestion after the complete generation of peptides can result in the
degradation of peptides in the sample. Additionally, overnight digestion is the longest

64
step in the sample preparation workflow, and shortening this step can streamline the
overall sample preparation time. The digest replicate retained on the centrifugal filter was
analyzed with SDS-PAGE for complete digestion of higher molecular weight proteins.
The flow through of the other digest replicate was processed at each time point (30
minutes-20 hours) to the end of the LC-MS/MS workflow.
LC-MS/MS measured the change in target peptide abundance over the course of
the digestion as shown in Figure 2-3. The abundance of light peptides was measured by
the total peak area of the target fragments at each time point. A single data point
represents the average of the total peak area for duplicate injections. The highest rate of
digestion was within the first four hours of trypsin digestion. The increase in light peptide
abundance plateaued overnight from 4-14 hours, with a maximum light peptide
abundance at 18 hours for three of the five quantifying peptides. A slight decrease in
intensity was seen for all peptides after 20 hours of digestion. This type of digestion
kinetics, a slow increase to the maximum abundance from 16-18 hours, followed by
degradation has been observed previously (13). The longer digestion time may result in
enzyme degradation (nonspecific cleavages) or chemical modifications (carbamylation
from urea) to the protein resulting in a decreased abundance (14). The maximum increase
in intensity at 18 hours followed by a slight decrease was observed for all peptides.
Therefore, 18 hours of digestion was interpreted as the optimal digestion time.

65
Figure 2-3. Light peptide abundance of five quantifying peptides from 0.5 to 20 hours of digestion using trypsin at 1:50 (w/w). Each data point represents the mean of duplicate injections. The error bars represent the standard error of the mean of the technical replicates.
The two peptides with slight changes in peptide intensities over the 20 hour
digestion were SQS and VFD. The intensity of the total peak area of VFD increased 1.2
fold between 30 minutes and 18 hours. There seems to be an immediate digestion at 30
minutes, followed by a maximum peptide peak area intensity at 4 hours. The decrease in
intensity from 4 hours to 18 hours may be from some degradation of the high
concentration of peptide in solution. SQS had an immediate digestion, however, the
abundance at 30 minutes was only positively detected in one of the duplicate injections.
This peptide had a slight decrease in light peptide total peak area intensity from 30
minutes compared to 18 hours. A likely factor for the observed fluctuation for both VFD
and SQS is the small sample size. The slight changes in peptide abundance may be more
of a reflection of sampling error rather than a true indication of peptide degradation. A
0 5 10 15 200
200000
400000
600000
800000
Time (hours)
Lig
ht
Pep
tid
e A
bu
nd
ance
(T
ota
l Pea
k A
rea)
LIT LSAQ NIL SQSD VFD

66
single replicate was measured with a duplicate injection. Therefore, the variation of the
total peptide peak area intensities between 30 minutes and 20 hours may be larger
because there was only one replicate measured.
Three peptides had a steady increase in intensity from 30 minutes to 18 hours:
LIT, LSA, and NIL. The abundance increased in varying orders of magnitude for each
peptide as follows: NIL by 7-fold, LIT by 3-fold, and LSA by 2-fold over the course of
digestion from 30 minutes to 18 hours. The abundance of LIT was determined to be near
the limit of detection until after 2 hours of digestion because only one replicate from each
injection gave a positive detection. Peptides NIL and LSA were positively detected in
both replicate injections after 30 minutes.
NRSF is the least processed soy ingredient investigated and most closely
resembles the native soybean. Therefore, the abundance of the light peptides may be
explained by the initial concentration of protein in soybeans. All target peptides are from
the seed storage proteins β-conglycinin and glycinin, with glycinin having a higher
concentration in the native soybean (15). Interestingly, NIL is from the protein β-
conglycinin and at a higher total peak area than two peptides from glycinin, LSA and
SQS. Therefore, the peptide response in the sample may be more based on the
accessibility of the peptide to trypsin digestion.
Peptides from the same protein subunit had different rates of digestion. The
greater abundances of certain peptides compared to others within the same protein
subunit may be explained from the variation of protein isoforms. LIT and NIL are part of
the same alpha subunit in β-conglycinin with a higher abundance of NIL. LIT is present
in one isoform (Gly-m-5.0101) and NIL is present in two isoforms (Gly-m-5.0101 and

67
Gly-m-5.0201) (15). Another possible difference between the peptide digestions is the
presence of post-transitional modifications. β-conglycinin is a glycosylated protein which
lowers the digestion efficiency (13). SQS and LSA are part of the same glycinin basic
subunit B1a with a higher abundance for LSA. However, SQS is present in three isoforms
(Gly-m-6.0101, Gly-m-6.0201, and Gly-m-6.0301) and LSA is present in one isoform
(Gly-m-6.0201) (15). The different abundances of peptides from same protein suggests
the digestion to be peptide specific. In the case of glycinin subunit B1a, LSA may be
preferentially digested compared to SQS. However, the rate at which the proteins are
digested may suggest otherwise if they increase proportionally at the same rate. Protein-
based digestion was investigated with the correlation between the increases in abundance
of target peptides over time (Figure 2-4).

68
Figure 2-4. Correlation of light peptide abundance from 0.5 to 20 hours digestion. The correlation was measured between the target peptides in the same protein subunit, β-conglycinin subunit alpha (A), glycinin subunit B1a (B), or within the same protein, glycinin (C, D).
The generation of light peptides was determined to be either protein or peptide
dependent. The digestion of the two target peptides from β-conglycinin had evidence of
protein-dependent digestion with a linear correlation of 0.94. Both target peptides
increased in intensity from 30 minutes to 18 hours with a slight decrease at 20 hours. The
high correlation suggests digestion rates are similar for the protein. This was expected
because both peptides are present in the protein isoform Gly-m-5.0101 (15). The
digestion of the two target peptides from glycinin subunit B1a, SQS and LSA, had a poor
correlation of 0.18. These peptides are both present in the isoforms Gly-m-6.0201 and
Gly-m-6.0301, indicating the digestion is peptide specific. The peptides within the
A. β-conglycinin, α subunit
9000
0
10000
0
11000
0
12000
0
13000
0
14000
0
1500
00
0
100000
200000
300000
400000
SQS
LS
AQ
R2 = 0.177
9000
0
10000
0
11000
0
12000
0
13000
0
14000
0
1500
00
0
200000
400000
600000
800000
1000000
SQS
VF
D
R2 = 0.421
1000
00
2000
00
3000
00
0
200000
400000
600000
800000
1000000
LSAQ
VF
D
R2 = 0.535
0
2000
0
4000
0
6000
0
8000
0
1000
00
0
100000
200000
300000
400000
500000
LIT
NIL
R2 = 0.945
B. Glycinin, B1a subunit
C. Glycinin D. Glycinin

69
glycinin B1a subunit had poor correlation to the peptide in the glycinin A1a subunit,
VFD. The correlation between SQS and VFD was slightly lower than the correlation
between VFD and LSA with correlations of 0.42 and 0.53 respectively. The poor
correlation between peptides within the same subunit and peptides within the same
protein further suggests the digestion of peptides from glycinin are peptide dependent.
Agger et. al (2010) observed similar peptide dependent digestion abundances from the
correlation between peptides within the same protein (16).
The digestion step is crucial to the generation of light peptides in the sample. The
complete digestion of target proteins depends upon the properties of the protein
(accessibility to enzyme, protease inhibitor), time, concentration of trypsin, denaturing
solvents (detergents, chaotropic agents), among other factors (17, 18). The rapid increase
in the light peptide generation in the first four hours is reflected in both the dramatic
decrease of higher molecular weight bands in the SDS-PAGE gel and the abundance of
the light peptide measured by LC-MS/MS. Overnight digestion remains necessary to
generate the maximum peptide abundance, especially for three of the target peptides.
From preliminary digestion experiments, it was determined that subsequent additions of
trypsin were equivalent to a single addition of trypsin for the light peptide generation.
The single addition of 1:50 trypsin ratio and a maximum overnight digestion time of 18
hours was determined to be the parameters for complete digestion. These digestion
conditions will be applied to the sample preparation workflow of the external standards.
The peptide dependent digestion requires the further investigation of complete digestion
of proteins in complex matrices, especially with other food proteins present, to determine
if these parameters are sufficient for unknown samples.

70
B. Carrier Protein Concentration
A carrier protein minimizes nonspecific adsorption losses of peptides throughout
the MS workflow (19). This is especially important with samples containing low protein
concentrations of target peptides. NFDM is added to the extraction buffer (0.5 %) to act
as a carrier protein. Theoretically, at low concentrations of total soy protein, the milk
protein present in the buffer will preferentially bind to the hydrophobic plastic surfaces
and minimize nonspecific protein absorption of soy peptides. Currently, there are no
recommendations on the carrier protein concentration in samples to minimize the loss of
nonspecific binding (20). Therefore, background milk protein concentrations were
compared to investigate nonspecific protein losses of external standards diluted with the
AR method. The initial concentration of background protein was 1.5 µg/µL. This was
based on the background milk protein determined to be in the blank extraction buffer as
shown in Table 2-2.
Table 2-2. Estimated background protein concentration at each step in the sample preparation workflow.
Initial Protein Concentration
(µg/µL)A
Protein Added to Digestion
(µg)
After Digestion (µg/µL)
Before Desalting (µg/µL)
C18 Column (30 µg)
After Reconstitution
(µg/µL)
0.975 102.375 0.511875 0.383906 51.05953 1.5 ABased on the 660 nm assay
The light peptide performance of the AR curve diluted in 1.5 µg/µL background
protein was compared to the AE curve. Three curves were prepared for analysis: replicate
curves prepared with the AR method (AR_1 and AR_2) and one replicate with the AE
method. Seven concentrations of total soy protein were serially diluted in both methods
(1, 2, 5, 10, 20, 50, and 100 mg/kg total soy protein). The lowest concentration that was

71
determined to have a positive target peptide detection in each curve is shown in Table 2-
3.
Table 2-3. The lowest total soy protein concentration (mg/kg) determined to have a positive target peptide detection with AR or AE methods.
Peptide External Standard Curve
AR_1 AR_2 AE mg/kg1 Slope mg/kg Slope mg/kg Slope
LITLAIPVNKPGR 5 0.090 5 0.099 10 0.030 LSAQYGSLR 1 0.024 5 0.023 5 0.024 NILEASYDTK 1 0.021 1 0.021 1 0.019
SQSDNFEYVSFK 2 0.060 2 0.065 2 0.054 VFDGELQEGR 1 0.023 1 0.024 1 0.019
1mg/kg total soy protein
Three quantifying peptides had consistent detection at the lowest concentration
for all curves: SQS, VFD and NIL. The most sensitive peptides, VFD and NIL, had a
positive light target peptide detection at the lowest total soy protein concentration
reference sample for all three curves. The other peptides, LIT and LSA, had variable
detection between the two dilution methods. The peptide LIT was positively identified at
5 mg/kg in reference standards prepared AR and at 10 mg/kg in reference standards
prepared AE. However, the AR 5 mg/kg reference standards with positive identification
had only one replicate injection with a positive identification. Therefore, there is not
sufficient evidence that the AR method has a higher sensitivity. It is more likely the total
soy protein concentration is near the limit of detection for that particular peptide. The
same trend was observed for the peptide LSA. One sample injection was positively
identified in the AR_1 sample, while both injections at 5 mg/kg in the AR_2 and AE
reference curves were positively identified. Considering the limit of detection of the
peptides, the dilution methods gave similar sensitivity results. The slopes values for the
more hydrophobic peptides, LIT and SQS, were determined to have a larger divergence

72
in slopes among the digestion conditions and dilution methods. Higher abundances of
these peptides were observed in the AR method because of the higher slope values. The
increase in light peptide abundance in the AR method may be from the starting
concentration of soy protein. As seen in the digestion, these peptides are at the lowest
abundance in the sample. The AE method may be more prone to losses of these peptides
at each step of the sample preparation. The AR method starts with a higher concentration
of total soy protein which may increase the recovery for dilution. Therefore, the AR
method was determined to be robust for further sample preparation analysis because of
the similar sensitivity to the AE method and the increased peptide response of two
quantifying peptides.
AR external standards require a certain volume for complete dilution. A larger
volume requires more protein to achieve the desired background protein concentration.
The current concentration of background protein, 1.5 µg/µL, required a higher
concentration of NFDM as a starting sample (3%) for sufficient protein recovery after
reconstitution. At this concentration, the digestion required 20 times more trypsin
compared to the blank extraction buffer (0.5% NFDM) for a 1:50 digestion. The
parameters for C18 also required adjustment to recover enough protein to prepare 1.5
µg/µL solution after reconstitution. Higher capacity C18 columns (5 mg) were used to
increase the total protein. The CMB not be a truly representative blank of the AR external
standards because of the differences in digestion and desalting conditions. Therefore,
lower concentrations of background NFDM were investigated.
A blank extraction buffer sample with a starting concentration of 0.1 % NFDM
was reconstituted to 0.05, 0.1, 0.25, and 0.5 µg/µL. Four replicate concentrated soy

73
protein samples (500 mg/kg) were diluted each with a different background protein
concentration. The same dilution was carried out but only 1, 5, 10, 50, and 100 mg/kg
concentrations were measured which were representative of the light peptide responses of
an entire standard curve. Figure 2-5 shows the ratio of the light to heavy peptide
responses at each concentration for each peptide in replicate external standards prepared
with the AR method with different concentrations of diluent background protein.
Duplicate injections were averaged and treated as a single data point with error bars
indicating the standard error of the mean for the technical replicates.

74
Figure 2-5. The mean peptide response of each concentration of external standards prepared with the AR method and diluted in 0.05, 0.1, 0.25, and 0.5 µg/µL background milk protein digest. SEM bars are shown for all points unless the range is smaller than the point on the graph.

75
Interestingly, the 0.05 µg/µL milk background had the highest peptide responses
for all five quantifying peptides at 50 mg/kg, as well as at least one of the highest peptide
responses for all of the other external standard concentrations. This was unexpected
because higher concentrations of carrier protein may be more protective for hydrophobic
peptides (19). The peptide performance was not considered to be dependent upon the
concentration of background protein. At each concentration, light peptide responses were
similar for all quantifying peptides regardless of the protein concentration. The lowest
peptide response for NIL was observed for samples diluted in 0.05 and 0.25 µg/µL.
Although this is near the limit of detection for this peptide and was considered random.
The lowest concentration of background protein, 0.05 µg/µL, is considered the
most efficient for the current method. The maximum protein recovery expected is 30 µg
because of the binding capacity of the C18 columns. The recovery of 30 µg milk protein
produces a sufficient volume at 0.05 µg/µL to dilute out AR standards which can be
obtained using the smaller C18 spin columns. As calculated previously, the recovery of
30 µg can be achieved with a background NFDM of 0.5%. These parameters prepare a
blank sample that is more representative of the background protein in the NRSF external
standards.
AR standards diluted in 0.05 µg/µL milk protein concentration digest was
determined to produce robust peptide responses. The NFDM diluent can be prepared
from a starting concentration of 0.5 % NFDM. Sufficient protein recovery is possible
with the lower capacity C18 columns (30 µg) and requires lower amounts of trypsin
compared to a higher stating concentration of NFDM (3%). These conditions allow the
NFDM diluent to be more representative of the background protein of the external

76
standards. This preparation method of AE samples was considered more robust than the
AR method because of the sensitivity and the streamlines sample preparation workflow.
C. Selection of dilution method
The accuracy of external calibration curves has a significant influence on the
absolute quantification of unknown samples in MS workflows (21). The robustness of
peptide responses were compared for the two standard curve methods, AE and AR. The
sample preparation workflow used was as previously described with the following
modifications: a single addition of trypsin (1:50) followed by an 18-hour overnight
digestion (11). The external standard dilutions were prepared for AE as previously
described. The AR external standards were diluted in 0.05 µg/µL background milk
protein following reconstitution. In the previously mentioned workflow, trypsin was
added at a ratio of 1:50 based off of the 660 nm assay of the protein extracts. However, a
majority of the protein in the buffer is milk protein which masks the concentration of soy
protein, even at high total soy protein concentrations (500 mg/kg). Therefore, total
protein amounts estimated for 1 mg/kg and 500 mg/kg are the same. An underestimation
of the protein at the higher soy protein concentrations will result in an incomplete
digestion. This will skew the peptide response according to the type of dilution method
used. Trypsin amounts were estimated for a 1:50 of a theoretical maximum total soy
protein. This digestion condition was analyzed to assess any variability due to possible
underestimation of total protein, especially for the higher concentrated soy protein
samples (500 mg/kg). Therefore, two amounts of trypsin were used, one based on the 660

77
nm assay and one based on a theoretical maximum, to digest replicate standard curves
prepared for each method.
Samples were injected in duplicate. The ratio of the total peaks areas of light to
heavy peptide were averaged for each technical replicate. Each sample average was
treated as a single data point. Standard curves were plotted with the total peak area ratios
from 1 mg/kg to 400 mg/kg total soy protein. A linear regression line was fit to each
curve and R2 value were calculated in Skyline (Table 2-4). A higher R2 value was
observed more frequently for the AR method compared to the AE method. The lower R2
values calculated for the AE method are likely representative of the sample to sample
variation. This is expected because each external standard is carried through each step of
the sample preparation with increasing variability from each step (22). The AR method
has a higher correlation because the sample to sample variation is the same because all
external standards are diluted from the same sample. A majority of variation in the AR
curves is likely from the error in the serial dilution.
Table 2-4. Linear regression analysis of external standards prepared by two dilution methods (AR and AE) with two digestion conditions (2 µg and 4 µg trypsin).
Peptide AR AE
2 µg 4 µg 2 µg 4 µg Slope R2 Slope R2 Slope R2 Slope R2
LITLAIPVNKPGR 0.033 0.980 0.025 0.989 0.010 0.920 0.018 0.906 LSAQYGSLR 0.024 0.985 0.022 0.986 0.021 0.983 0.027 0.996 NILEASYDTK 0.029 0.987 0.025 0.991 0.030 0.979 0.036 0.996
SQSDNFEYVSFK 0.105 0.982 0.086 0.995 0.050 0.966 0.075 0.980 VFDGELQEGR 0.022 0.986 0.022 0.987 0.019 0.968 0.027 0.995

78
The greater amount of trypsin was expected to improve the light peptide response
from the concentrated soy protein sample. However, the slopes of the AR method
between the two digestion conditions were closer in value compared to the AE method.
This was unexpected because there is a 5-fold higher soy protein concentration in the
highest starting dilution of the AR method compared to the AE method. As mentioned
previously, the AR method is expected to have a higher sample to sample correlation
because of the absence of the variability introduced at each step of the sample preparation
workflow. The higher range of slope values between the two digestion conditions of the
AE method is likely from the variation in the sample workflow, rather than a more
complete digestion of the protein. As expected, the greatest variability was with the more
hydrophobic peptides, LIT and SQS. This may be because of the low abundance of these
peptides in the starting sample.
Figure 2-6 shows the spread of the light to heavy peptide ratios for each method,
AE and AR, from 1 to 400 mg/kg. All standard curves (4 total) were plotted and linear
lines were fit to each, as can be seen in the upper left hand corner of each graph. There is
a 400-fold difference between the lowest external standard (1 mg/kg) and the highest
external standard (400 mg/kg). This wide range makes it difficult to obverse the variation
for the lower total soy protein dilutions (1-100 mg/kg) when plotted as a curve.
Therefore, the variation of the peptide response at each external standard concentration
was shown as a boxplot.

79
Figure 2-6. Variation of standard curves of two dilution methods (AE and AR) and two digestion conditions (2 µg and 4 µg). Curves were fit with linear regression slopes as shown in the upper left-hand corner of each graph. External standard concentrations (1-100 mg/kg) for each quantifying peptide were analyzed by the spread of peptide responses (ratio of light to heavy peptide total peak areas) within each method. The spread of ratios at each standard concentration is represented by box plots for the two dilution methods (AE and AR).

80
The hydrophilic peptides (NIL, LSA, and VFD) had narrower variation between
and within digestion methods compared to the hydrophobic peptides (LITR and SQS).
The AR method had a narrower variation at all external standard concentrations for the
peptide NIL. LSA and VFD had similar variation between methods. The AE method had
less variation at higher soy protein concentrations (10-100 mg/kg) using the more
hydrophobic peptides, LIT and SQS. The greater spread in the hydrophobic peptides
between digestion conditions and within methods indicate a more robust quantification
for the hydrophilic peptides. The spread of the data for the AE method is greater than the
AR method at higher concentrations of total soy protein as indicated by the greater
divergence of AE standard curves from 1 to 400 mg/kg. This can be seen in the peptide
VFD. There is a higher variation of AR peptide responses at 100 mg/kg, however, the
standard curves plotted out to 400 mg/kg were narrower for the AR method compared to
the AE method. This indicates a more robust linear response of AR curves. A general
trend observed for all variables was a direct correlation between the increase in total soy
protein concentration and the increase in the spread of data. One study assessing the
reproducibility of a quantitative assay found a decrease in CV with an increase in analyte
concentration in intra- and inter-laboratory measurements (23). An indirect correlation
between external concentration and variance can also be observed (24). The variance
from the current data set may be an artifact of the statistical analysis. Ordinary least
square regression (OLS) is more affected by outliers compared to other weighted forms
of regression (25). This may influence the spread of the standard curves of the AE
method, which are more variable because of the sample to sample variation. The
statistical analysis then favors the AE method, where there is a higher correlation among

81
standards. Other forms of regression may be considered because of the high influence of
the upper values of the calibration curve if fit with an OLS regression. Transformation of
the data may stabilize the variance, some studies plot the curves by an x and y log
transformation (26).
The higher variability of the hydrophobic peptides, LIT and SQS, may be
explained by the variability in the heavy peptide response. The light peptide response is
normalized in the samples by the heavy peptide total peak area. A higher instability of the
heavy peptide will greatly influence the final regression line. This variation was
measured from heavy peptide responses of all injections within one standard curve as
well as the overall data set. All standard curves were acquired within the same instrument
calibration status. Every injection with a positively detected heavy peptide total peak area
was calculated as part of the coefficient of variation (CV). A percent CV less than 20 was
considered acceptable (24). The percent CV was plotted alongside the corresponding
average heavy peptide peak areas (Figure 2-7).

82
Figure 2-7. Percent coefficient of variation (CV) and average total peak area of quantifying heavy peptides for all standard curves. Circles correspond to percent CV values and bars correspond to the average total peak area for each positive injection within each standard curve and the overall sample set. Samples sizes within a curve was n=20 (except for SQSDNFEYVSFK with n=18 for AE_2 µg and n=19 for AE_4 µg) and all values n =80 (except for SQSDNFEYVSFK with n=77).
The heavy peptides from the three hydrophilic peptides, NIL, LSA, and VFD,
seemed to produce the most stable response (< 20 %). The average heavy peptide total
peak area within a curve was consistent compared to the average of all injections. The
same trend was observed for the percent CV within a curve compared to the overall CV.
The hydrophobic peptides, LIT and SQS, showed greater instability. These peptides had
larger CV values within a curve as well as larger variations for the entire acquisition. The
CV values were less than or equal to 20% within a curve but range from 30-40% overall.
Interestingly, there was a general trend of an increase of variance as the time of

83
acquisition increases for all peptides. However, the variability of the heavy peptide
increases faster for the hydrophobic peptides. It is possible these peptides are less stable
over time after reconstitution in the autosampler. The variation from the hydrophobic
peptides may be evidence of instability of the light peptide.
D. Selection of robust quantifying peptides
A common source for variability of the peptide response is bias in the ionization
of peptides with electron spray ionization (ESI). There is preferential ionization of
hydrophobic, basic, and larger MW peptides (27). This may not contribute much to the
variability of the external standards because the sample background consists of the blank
extraction buffer containing digested milk protein. It is unknown whether the
hydrophobic milk peptides, present at a higher concentration than target soy peptides,
could preferentially ionize compared to the target peptide.
A more likely source of variation is the hydrophobicity of peptides. Nonspecific
binding of hydrophobic peptides throughout the sampling preparation results in loss of
peptides due to the contact with hydrophobic surfaces (plastic) (28). This can continue
after reconstitution and negatively affect the chromatographic elution of peptides from
the reverse-phase (RP) LC column. The hydrophobic peptide targets elute after 10
minutes on the acetonitrile gradient and the hydrophilic peptides elute before 10 minutes.
“Sticky peptides” are peptides with nonspecific binding to parts of the LC system (e.g.
autosampler, column) that result in the loss of signal and can “carryover” to other
samples in the queue (28). LIT is the most hydrophobic quantifying peptide composed of
64 % of nonpolar amino acid residues. In comparison, LSA, SQS, and NIL are composed

84
of more than 75 % polar residues. Interestingly, one of the more robust peptides, VFD is
composed of 50 % nonpolar amino acid residues. This peptide is one of the most
sensitive with consistent positive detection down to 1 mg/kg total soy protein. However,
there is high abundance in the sample which is evident even after 30 minutes of digestion.
The high peptide abundance likely influences the sensitivity of the peptide. It may be
more likely to be detected at low total soy protein concentrations because of initially high
abundance at the start of dilution and is therefore less affected by losses to nonspecific
binding.
SQS can be considered one of the more hydrophobic peptides because it elutes
later in the RP chromatography gradient. The final light peptide abundance is low, after
18-hour digestion, and as the dilution decreases the total soy protein concentration this
peptide may fall below the limit of detection for the LC-MS/MS method. This peptide
has higher sensitivity compared to LIT with consistent detection as low as 2 mg/kg total
soy protein. Considering the high performance of VFD and SQS, the hydrophobicity does
not fully explain the loss of sensitivity and increase in variability of the peptide LIT.
One study by Houston et al, (2011) studied 10 soy allergens for the development
of an absolute quantification of soy allergens in different soybean varieties (29). The
peptide LIT was found to have a low peak area and designated as a qualifier instead of a
quantifier (29). A major limitation of this LC-MS/MS is the optimization of peptide
performance using one set of ingredients. The abundance of the different soy proteins as
well as the abundance of the individual protein subunits varies among soybean varieties
(30). This could limit the universal application of this method on soy ingredients
manufactured by different suppliers and made from raw ingredients obtained during

85
growing seasons from other cultivars. In a study by Plaque et. al, LIT was a peptide
marker for the detection and quantification of soybean protein in different commercial
food products including chocolate, ice cream, tomato sauce, and cookies (31). It has been
observed that LIT has the same limit of detection, 5 mg/kg, for our experiment as
observed in more complex matrices (31, 32). Therefore, the variability of LIT in our
method may a combination of physiological and chemical properties. It may a sticky
peptide that does not consistently elute into the retention time window. The similarity in
physiochemical properties of the light and heavy peptides may indicate instability of the
heavy peptide. The low abundance may be below the limit of detection for this LC-
MS/MS workflow because of the initial low light peptide generation and additional
nonspecific binding losses. The variance of the method is expected and has been shown
in the development of other quantitative workflows (33).
V. SUMMARY
The external standards diluted with the AR method were determined to have
comparable results to the existing method AE. The AR method successfully streamlines
the protocol by reducing the sample load from nine to two with sensitive and robust
peptide responses. The higher sample to sample variance of external standards prepared
with AE may be a consequence of a complex sample preparation workflow, such as
digestion efficiency and desalting, rather than the instrumental variation (23). The most
robust quantifying peptides were determined to be the more hydrophilic peptides. This
was determined from a combination of factors such as low abundance, losses from
nonspecific binding, and peptide instability after reconstitution. These combined losses
may result in hydrophobic peptide responses below the limit of detection for this method.

86
Future work aims to quantify the variation between day and within day external standard
preparation. A finalized standard curve will then be used to quantify soy protein in model
incurred matrices.

87
VI. REFERENCES 1. S. H. Sicherer, H. A. Sampson, Food allergy. Journal of Allergy and Clinical
Immunology 125, S116-S125 (2010). 2. A. Bureau, Summary of the 2019 VITAL Scientific Expert Panel
Recommendations. (2019). 3. R. E. Poms, C. L. Klein, E. Anklam, Methods for allergen analysis in food: a
review. Food Addit Contam 21, 1-31 (2004). 4. A. J. van Hengel, Food allergen detection methods and the challenge to protect
food-allergic consumers. Analytical Bioanalytical Chemistry 389, 111-118 (2007).
5. G. M. Sharma, S. E. Khuda, C. H. Parker, A. C. Eischeid, M. Pereira, Detection of allergen markers in food: Analytical methods. Food and Drug Administration Papers, 6, (2017).
6. L. Monaci, E. De Angelis, N. Montemurro, R. Pilolli, Comprehensive overview and recent advances in proteomics MS based methods for food allergens analysis. TrAC Trends in Analytical Chemistry 106, 21-36 (2018).
7. I. Neverova, J. E. Van Eyk, Role of chromatographic techniques in proteomic analysis. Journal of Chromatrography B 815, 51-63 (2005).
8. A. C. Peterson et al., Parallel reaction monitoring for high resolution and high mass accuracy quantitative, targeted proteomics. 11, 1475-1488 (2012).
9. S.-E. Ong, M. Mann, Mass spectrometry–based proteomics turns quantitative. Nature Chemical Biology 1, 252-262 (2005).
10. K. B. Scott, I. V. Turko, K. W. Phinney, Quantitative performance of internal standard platforms for absolute protein quantification using multiple reaction monitoring-mass spectrometry. Analytical Chemistry 87, 4429-4435 (2015).
11. S. Chen, C. T. Yang, M. L. Downs, Detection of six commercially processed soy ingredients in an incurred food matrix using parallel reaction monitoring. Journal of Proteome Research 18, 995-1005 (2019).
12. L. K. Pino et al., The Skyline ecosystem: Informatics for quantitative mass spectrometry proteomics. Mass spectrometry reviews, (2017).
13. M. S. Lowenthal, Y. Liang, K. W. Phinney, S. E. Stein, Quantitative bottom-up proteomics depends on digestion conditions. Analytical Chemistry 86, 551-558 (2014).
14. E. I. Chen, D. Cociorva, J. L. Norris, J. R. Yates, Optimization of mass spectrometry-compatible surfactants for shotgun proteomics. Journal of Proteome Research 6, 2529-2538 (2007).
15. D. Croote, S. R. Quake, Food allergen detection by mass spectrometry: the role of systems biology. npj Systems Biology and Applications 2, 16022 (2016).
16. S. A. Agger, L. C. Marney, A. N. Hoofnagle, Simultaneous Quantification of Apolipoprotein A-I and Apolipoprotein B by Liquid-Chromatography–Multiple- Reaction–Monitoring Mass Spectrometry. Clinical Chemistry 56, 1804-1813 (2010).
17. T. Glatter et al., Large-scale quantitative assessment of different in-solution protein digestion protocols reveals superior cleavage efficiency of tandem Lys-C/trypsin proteolysis over trypsin digestion. Journal of Proteome Research 11, 5145-5156 (2012).

88
18. J. L. Proc et al., A quantitative study of the effects of chaotropic agents, surfactants, and solvents on the digestion efficiency of human plasma proteins by trypsin. Journal of Proteome Research 9, 5422-5437 (2010).
19. H. John, M. Walden, S. Schafer, S. Genz, W.-G. Forssmann, Analytical procedures for quantification of peptides in pharmaceutical research by liquid chromatography-mass spectrometry. Analytical and Bioanalytical Chemistry 378, 883-897 (2004).
20. A. N. Hoofnagle et al., Recommendations for the Generation, Quantification, Storage, and Handling of Peptides Used for Mass Spectrometry–Based Assays. Clinical Chemistry 62, 48-69 (2016).
21. C. M. Shuford et al., Absolute protein quantification by mass spectrometry: not as simple as advertised. Analytical Chemistry 89, 7406-7415 (2017).
22. I. Van Den Broek et al., Quantifying protein measurands by peptide measurements: where do errors arise? Journal of Proteome Research 14, 928-942 (2015).
23. T. A. Addona et al., Multi-site assessment of the precision and reproducibility of multiple reaction monitoring–based measurements of proteins in plasma. Nature Biotechnology 27, 633-641 (2009).
24. V. Paez et al., AOAC SMPR® 2016.002. Journal of AOAC INTERNATIONAL 99, 1122-1124 (2016).
25. D. R. Mani, S. E. Abbatiello, S. A. Carr, Statistical characterization of multiple-reaction monitoring mass spectrometry (MRM-MS) assays for quantitative proteomics. BMC Bioinformatics 13, S9 (2012).
26. H. Keshishian, T. Addona, M. Burgess, E. Kuhn, S. A. Carr, Quantitative, multiplexed assays for low abundance proteins in plasma by targeted mass spectrometry and stable isotope dilution. Molecular & Cellular Proteomics 6, 2212-2229 (2007).
27. B. Domon et al., Quantitative Proteomics. (Royal Society of Chemistry, 2014). 28. K. Maes, I. Smolders, Y. Michotte, A. Van Eeckhaut, Strategies to reduce
aspecific adsorption of peptides and proteins in liquid chromatography–mass spectrometry based bioanalyses: An overview. Journal of Chromatography A 1358, 1-13 (2014).
29. N. L. Houston et al., Quantitation of soybean allergens using tandem mass spectrometry. Journal of proteome research 10, 763-773 (2011).
30. S. Natarajan, D. Luthria, H. Bae, D. Lakshman, A. Mitra, Transgenic soybeans and soybean protein analysis: an overview. Journal of Agricultural and Food Chemistry 61, 11736-11743 (2013).
31. M. Planque et al., Advances in ultra-high performance liquid chromatography coupled to tandem mass spectrometry for sensitive detection of several food allergens in complex and processed foodstuffs. Journal of Chromatography A 1464, 115-123 (2016).
32. M. Planque et al., Liquid chromatography coupled to tandem mass spectrometry for detecting ten allergens in complex and incurred foodstuffs. Journal of Chromatography A 1530, 138-151 (2017).

89
33. E. Kuhn et al., Quantification of C-reactive protein in the serum of patients with rheumatoid arthritis using multiple reaction monitoring mass spectrometry and 13C-labeled peptide standards. 4, 1175-1186 (2004).

90
CHAPTER 3
QUANTIFICATION OF SOY DERIVED INGREDIENTS IN MODEL FOOD
MATRICES WITH AN OPTIMIZED LC-MS/MS EXTERNAL STANDARD
CALIBRATION WORKFLOW
I. ABSTRACT
The detection and quantification of soy protein is important for accurate food
labels and to prevent the presence of undeclared soy proteins. Heat processing and matrix
interactions affect the accuracy of protein-based allergen detection methods. The
sensitivity of ELISA methods is compromised if the protein epitopes are destroyed during
processing. Therefore, an MS-based method was evaluated for the recovery of total soy
proteins in incurred matrices.
MS-based quantification of total soy protein was assessed using a combination of
external and internal standards. The reproducibility of the external standard curves was
investigated. Variation was compared within a set of replicates and among all sets of
replicates prepared on separate days. The replicate standard curves were then pooled and
calculated as an average. A set of incurred samples was prepared using bread and
frankfurters as model food matrices. Several soy derived ingredients were used to spike
the matrices at varying levels of total soy protein. The total soy protein of incurred bread
and frankfurter samples was then estimated using the pooled standard curve and the
percent protein recovery was determined.
The variation of replicate standard curves between groups and among all groups
was not significant. The slopes obtained from replicate standards run in different group

91
sets were minimal, indicating a standard curve is not required to be run with every sample
set. The most influential factor on the percent protein recovery in incurred samples was
the effect of the matrix on the soy protein. The lowest percent protein recoveries, less
than 50%, were calculated for uncooked matrices. The cooked matrices had percent
recoveries between 50-150 % for all total soy protein levels. Other factors, such as type
of ingredient and heat, were not as significant in protein recovery.

92
II. INTRODUCTION
Soybeans are the cause of one of the most common food allergies
worldwide (1). Allergic consumers rely on the accuracy of food labels to avoid foods
containing soy protein. In the U.S., the addition of soybeans, or soy-derived ingredients,
in any packaged food product must be included in the ingredients statement as required
under the Food Allergen Labeling and Consumer Protection Act (FALCPA) (2).
Quantitative risk assessment methods estimate finite levels of allergenic protein
considered safe for a portion of the allergenic population (3, 4). A risk assessment tool
known as Voluntary Incidental Trace Allergen Labeling (VITAL) estimates these finite
levels for individual allergens to implement more effective precautionary allergen
labeling (5, 6).
Soy protein detection and quantification is a unique analytical challenge because
of the widespread application of soy protein in food products. The differences in the end-
applications of soy-derived ingredients require a protein assay able to detect a wide range
of denatured proteins. Process-induced modifications of soy proteins can negatively
affect the sensitivity and specificity of protein-based allergen detection methods. The
type of heat treatment, constituents within a food, and type of soy-derived ingredient
interact and drive different chemical reactions, further modifying the structure and
physicochemical properties of proteins into numerous by-products (7). These
modifications decrease the extractability of proteins and affect the overall detection and
quantification. Immunological methods may be particularly susceptible due to limitations
in the extraction conditions and the loss of epitope binding (8). MS-based methods have

93
been developed for the detection of soy proteins in food matrices, but further work is
needed on the quantification and recovery of food allergens (9, 10).
Matrix effects on the accuracy of protein assays are commonly studied with spike-
and-recovery methods (10). A spike can be defined as an addition of a known amount of
protein to a food matrix. “Naturally” incurred samples more accurately model the effects
of the interactions between the components of a food matrix with target proteins as would
be expected in industrial processing (11). The detection of target soy peptides has been
verified previously with several soy ingredients in a naturally incurred cookie matrix
(12). The quantification of the same soy ingredients, as well as texturized proteins, at
different total soy protein levels is yet to be evaluated using this method. The objective of
this work was to investigate the quantification of several soy-derived ingredients in
model food matrices with an optimized LC-MS/MS external standard calibration
workflow.
III. METHOD AND MATERIALS
A. Materials
Several types of soy-derived ingredients were obtained from Archer Daniel
Midland Company (ADM): soy protein isolate (SPI), soy protein concentrate (SPC),
texturized vegetable protein (TVP), toasted soy flour (TSF) and non-roasted soy flour
(NRSF). Varieties of these ingredients include hydrolyzed and non-hydrolyzed SPI and
two commercial types of SPC: “Arcon S”, which is a functional soy protein concentrate
and “Arcon F”, which is an alcohol-washed protein concentrate. The total protein content

94
of each soy ingredient was determined using the LECO Dumas method on a LECO FP-
528 Protein/Nitrogen Determinator.
B. Incurred Matrices
Ingredients used to prepare model foods were purchased from a local grocery
store in Lincoln, NE. Soy-free all-purpose baking flour manufactured in a facility without
soybeans was kindly provided by Julie Nordlee. All ingredients used were tested for the
absence of soy using Veratox Soy ELISA kit before use. Blank samples were prepared
for both matrices.
Soy protein spikes were prepared in carrier ingredients based on the total soy
protein content. Spikes were added to model foods to incur at desired final total protein
concentrations (mg soy protein/kg matrix). The total weight of the carrier ingredient (e.g.
flour, salt) was adjusted to account for the soy protein spike to maintain consistency
between the blank and incurred matrices. A 10,000 mg total soy protein/kg carrier
ingredient (mg/kg total soy protein) was prepared for higher concentration of incursion.
This spike was then diluted on a weight basis to prepare lower spike concentrations. The
lower concentrated spikes (2,000 or 1,000 mg/kg) were prepared to avoid adding minute
amount of spike to achieve low levels of total soy protein concentrations. The preparation
of spike materials and verification of homogeneity was followed as previously described
(12). Appropriate amounts of each soy-derived ingredient and all-purpose baking flour
were mixed for 25 minutes in a KitchenAid mixer on medium speed. Following mixing,
the spike was spread evenly on a flat surface and six subsamples were taken from the
corners and center. The variation of the soy-in-flour spike was then assessed using the

95
Veratox Soy ELISA kit. Homogeneity was confirmed with a percent coefficient of
variation less than 20%. Lower total soy protein spike levels prepared in the same manner
were assumed to be homogeneous.
Two model food matrices were chosen based on the end-application of the soy-
derived ingredients as described by the manufacturer. Additionally, a higher fat matrix
(frankfurter) and higher carbohydrate matrix (bread) were incurred to survey the possible
matrix effects on the detection and quantification of soy protein (13).
White Bread
The first model food matrix prepared was white bread. Three total soy protein
levels were incurred in replicate batches. The soy protein spikes were added based on the
total weight of the uncooked matrix: 1, 10, and 100 mg soy protein/kg matrix. Three soy-
derived ingredients were used as spike materials: NRSF, SPC (Arcon S), and TSF. The
10,000 mg soy protein/kg flour spikes were prepared by adding appropriate amounts of
each soy ingredient with wheat flour. After confirming the homogeneity, the 10,000
mg/kg spikes were diluted on a weight basis with wheat flour to prepare 1,000 mg/kg
spikes. All spikes were prepared following the same procedure (12).
The texture of the bread depends upon the percent of flour and water. Therefore,
the formulation was calculated on a percent flour basis (14). The bread formulation
consisted of 390 g of wheat flour with other ingredients incorporated on a percent flour
basis as follows: 2.9% vegetable oil, 4 % granulated sugar, 2.1 % iodized salt, 1.8 %
active dry yeast, and 66.7% water. The total flour is adjusted to account for the
appropriate amount of soy-in-flour spike.

96
Model bread matrices were prepared in a Breadman (TR777SPR) on setting 3, the
recommended setting for basic white bread (total time: 3 hours and 20 minutes). The
Breadman is a closed system which performs mixing, proofing, and baking at specific
temperatures. Opening the instrument at any time during processing can cause
temperature variation. Therefore, a pair of uncooked and cooked batches were prepared
in tandem as separate batches to avoid operator-induced temperature fluctuations. These
batches were then considered a pair of identical uncooked and cooked matrices. A pair of
uncooked and cooked batches were prepared in duplicate at each level. A total of four
batches, two uncooked and two cooked, were prepared for each ingredient at each
concentration (n=12 batches for each ingredient).
Incurred batches were prepared sequentially from the lowest to the highest
concentration of total soy protein. All batches were prepared for each soy protein
ingredient spike consecutively to avoid carryover of the ingredients. A blank batch was
prepared after the highest incurred concentration of each ingredient. Cooked batches were
mixed (20 minutes), proofed (2 hours), and baked (1 hour). Total weights of batches
before and after cooking were recorded to determine total moisture loss. Cooked loaves
were allowed to cool to RT before storage at -20 °C. The replicate cooked loaves at each
spike level were stored as follows: one loaf was ground using a food processor
(KitchenAid), and one loaf was cut into approximately 1-inch-slices. The sliced matrix
was separated into the inner crumb and crust, and each component was ground separately
using an Osterizer blender (model no. 6640, Sunbeam Products, Inc.) in glass canning
jars. Uncooked batches were mixed and proofed, then immediately removed from the
Breadman. These batches were allowed to cool at 4 °C before storage. The dough batches

97
were separated into one inch subunits and kept at -20 °C overnight. For MS sample
preparation, the subunits of dough were pounded into smaller pieces using a hammer,
kept at -80 °C for 30 minutes, and then pounded again into finer pieces. The final dough
pieces were kept at -20 °C until further analysis.
Frankfurter
The second model food prepared was a frankfurter. The formulation used is as
described: 89.5% ground beef (90% lean), 8% water, 1% granulated sugar, and 2%
iodized salt (15). The ground beef was pre-weighed, stored at -20 °C, and thawed
overnight at 4 °C prior to use. Two total soy protein levels were spiked based on the total
weight of the uncooked matrix: 10 and 50 mg soy protein/kg matrix. The ingredients used
as soy protein spikes were NRSF, SPC (Arcon S), SPI (non-hydrolyzed), and TVP. The
TVP flakes were ground into finer particles using a food processor (KitchenAid) prior to
use. Two spike levels were prepared using TVP and SPI: 50 and 10 mg/kg. One spike
level was prepared using NRSF and SPC: 10 mg/kg. Soy ingredients were mixed with
appropriate amounts of iodized salt to make 10,000 mg/kg spikes. Soy-in-salt spikes were
homogenized in a coffee grinder (Mr.Coffee) with four pulses (approximately 20
seconds) on auto settings with scrapping between each pulse. The verification of
homogeneity is the same procedure as described previously. The 10,000 mg/kg spikes
were further diluted on a weight basis to prepare 2,000 mg/kg spikes using the same
method. The total salt in the frankfurters was adjusted to account for the soy in salt spike
additions.
The salt, sugar, and soy-in-salt spike were all mixed with water prior to adding to
the meat base. The meat base was emulsified using a bowl chopper (Manica CM-14) on

98
the highest speed for 5 minutes. Ingredients were poured into the chopper as a
homogenous solution after 1 minute. The meat and water solution were mixed for the
remaining 4 minutes. The meat base was immediately stuffed into 50 mL falcon tubes
using a Delta prime jerky gun (1 lb capacity). A portion of the raw frankfurter was
removed from each tube so that the remaining weight was approximately 50 g (weight of
frankfurter and the falcon tube). The raw portion was stored at – 20 °C until further
analysis. The frankfurters were then cooked in a water bath at 40 °C for 30 minutes,
transferred to another water bath at 80°C for 30 minutes, and kept in a cold room at 4°C
for 30 minutes (16). The frankfurters were weighed before (50 g) and after cooking to
determine water loss. The cooked frankfurters were ground using the same procedure as
with the bread samples and stored at -20°C until further analysis.
C. Standard Curve
The standard curve method of preparation used is referred to as “After
Reconstitution” (AR). This refers to the step at which standards are diluted and has been
previously described in Chapter 2. Seven concentrations of total soy protein were serially
diluted from a higher concentration sample into 1, 2, 5, 10, 20, 50, and 100 mg/kg total
soy protein.
The reproducibility of the AR method of standard curve preparation within a
single sample preparation workflow and between different sample preparation workflows
was investigated. The variability within a set of replicates and among sets of replicates
was determined using triplicate extracts and triplicate experimental repetitions (Table 3-
1). Three replicate extracts of NRSF, 1:20 (w/v), were extracted and serially diluted using

99
the AR method. This experiment was repeated in triplicate on different days. Triplicate
NRSF extracts were prepared in tandem and each set is referred to as a group. The entire
replication has a sample size of nine standard curves. Reagents were all prepared at the
same concentrations and volumes for each set of replicates. All samples within one group
were digested using a single vial of trypsin at a final concentration of 1:50 (w/w).
Table 3-1. Experimental design for the reproducibility of standard curves prepared with the AR method of dilution.
Group (Set of three replicates)
1 2 3
NRSF Extract (1:20) Extraction Replicate
1 11A 12 13 2 21 22 23 3 31 32 33
ACombination of numbers represent a standard curve replicate one part of group 1.
External standard curves were measured for three quantifying peptides: LSA,
NIL, and VFD. Isotopically-labeled peptides were added as an internal standard. The
ratio of the total peak areas of the external standard to the internal standard for each
peptide was measured. Each external standard was injected in duplicate and the peptide
response was averaged. All average peptide responses for the replicate standard curves
was then plotted to determine an overall average slope. This overall average slope was
used to interpolate the quantification of incurred samples.
D. Targeted LC-MS/MS Workflow
The targeted LC-MS/MS method has been previously described in Chapter 2. The
digestion conditions optimized for sample preparation was experimentally determined
using NRSF. Considering the digestion is peptide-dependent, the high concentration of
protein in the incurred matrices was reason enough to confirm the complete digestion of

100
target peptides in more complex samples. The complete digestion of incurred matrices at
1:50 was confirmed by comparing the same two digestion methods tested on the
digestion of NRSF. The digestion conditions differ based on the additions of trypsin
either two additions of 1:100 (w/w) or a single addition of 1:50 (w/w).
The quantification of total soy protein in incurred matrices was determined on
duplicate extracts of each level of incurred matrix. Blank matrices were run with the
respective incurred samples to confirm the absence of target soy peptides and interfering
background signal. Incurred samples were injected from the lowest to the highest total
soy protein level and were randomized within each total soy protein concentration. The
average peptide response for each sample was averaged. The samples were then
interpolated from the “master” standard curve to determine the experimental
quantification of total soy protein (mg total soy protein/ kg matrix) for each quantifying
peptide. The expected total soy protein for each matrix was adjusted to account for water
loss after heat treatment. A percent recovery was then calculated using the quantified
total soy protein to the expected total soy protein (adjusted) using the following equation:
× 100% = Percent of Total Soy Protein Recovery
Quantification values were pooled for all peptides to assess reporting a single
value for each incurred matrix. This value was calculated from either the average or
maximum quantification value of all quantifying peptides.

101
IV. RESULTS AND DISCUSSION
The commercially-processed soy ingredients used in this study were obtained
from one manufacturer (ADM). According to the common uses of these ingredients,
NRSF, TSF, and SPC (Arcon S) are commonly used in baking products such as crackers.
These ingredients were then incurred into matrices likely to be processed in the same
facility, such as bread. Therefore, bread was chosen as a model food matrix for the
incursion of these ingredients. Soy protein ingredients, such as soy flours, TVP, SPC and
SPI, are added to frankfurters and other sausage-like products for a range of functional
properties including texturizers, water and fat binding, flavor binding and gel formation
(17). The manufacturer lists common uses of SPI, SPC, and TVP as functional
ingredients of many meat products (military meat, sausages, etc.). Therefore, frankfurters
were chosen as a model food matrix for the incursion of these ingredients.
A. Detection
Each incurred level of total soy protein for every matrix was extracted in
duplicate and injected in duplicate (technical replicates) (n=4). Three quantifying and two
qualifying peptides were monitored. Each peptide peak was then manually inspected in
Skyline. A positive detection was determined with a set of predetermined criteria: i) dotp
> 0.85, average mass error < 2 ppm, and presence of all three pre-determined co-eluting
fragments. The maximum count of peptide peaks with a positive detection for all peptides
is n=20. The total count of positive detections was determined using four injections and
five peptides for each total soy protein level in bread (Figure 3-1) and in frankfurter
(Figure 3-2).

102
Figure 3-1. Count of positive detections for five target peptides in incurred bread matrices. The sample size is n=4 for each ingredient-matrix combination. Cooked matrices are labeled as whole loaf (WL) or slices (S). Positive detection is confirmed if all predetermined criteria are met: i) average mass ppm < 2 ii) dotp <0.85 iii) co-eluting fragment peaks. Each graph groups samples by the soy-derived ingredient used for incursion. Graphs pictured on the left (A-C) represent the total counts of light peptide detection. Graphs pictured on the right (D-F) represent the total count of quantifiable samples with positive detection of both light and heavy peptides.
A.) D.)
E.)
F.)
B.)
C.)

103
Figure 3-2. Count of positive detections for five target peptides in incurred frankfurter matrices. Sample size is n=4 for each ingredient-matrix combination. The soy-derived ingredients are non-roasted soy flour (NRSF), soy protein concentrate (SPC), soy protein isolate (SPI), and texturized vegetable protein (TVP). Each ingredient is grouped by level (10 or 50 mg/kg) and heat treatment (uncooked and cooked). Positive detection is confirmed if all predetermined criteria are met: i) average mass ppm < 2 ii) dotp <0.85 iii) co-eluting peaks. Panel A represents the total counts of light peptide detection for each ingredient and incurred matrix. Panel B represents the total count of quantifiable samples with a positive detection of both light and heavy peptides.
Three concentrations were analyzed for the bread matrices: 1, 10 and 100 mg/kg.
The maximum count of light peptide detection (n=20) was observed most frequently for
samples incurred with 100 mg/kg total soy protein in model bread. This was consistent
across all soy-derived ingredients. Lower counts of detection at 100 mg/kg is specifically
observed for the peptide NIL falling out of the predetermined specifications.
Interestingly, the peptide intensity is high with co-eluting fragments and a high dotp
value. For this specific peptide, higher intensities of the light or heavy peptide have been
associated with higher mass errors, between 2 and 3 ppm. The exact phenomenon for this
effect is unknown and the issue has been consistently observed for this peptide. However,
a count of 3 out of 4 injections indicates a positive peptide peak was confidently detected
in at least one of the duplicate injections for each replicate extract. Therefore, a duplicate
injection for each sample is necessary to avoid false negatives due to random or
B.) A.)

104
instrumental errors. A single positive peptide detection is calculated as the average
peptide response for a sample.
The 10 mg/kg and 1 mg/kg total soy protein levels in incurred bread had lower
counts of positive light peptide detection compared to the 100 mg/kg bread matrix. This
was expected because the detection limit of LSA, LIT, and SQS is around 5-10 mg/kg
total soy protein in the standard curve concentrations. The lower counts of positive light
peptide detection are a result of low peptide intensities with missing fragment ions, as
well as at least one other criterion out of specification. At 1 mg/kg only the two most
sensitive peptides are detected: NIL and VFD. Specifically, the peptide VFD can be
detected in all injections in the cooked matrices for both extraction replicates spiked with
NRSF and TSF. The peptide NIL was detected likewise at 1 mg/kg in the cooked
matrices for SPC. Overall, the method had higher counts of positive peptide detection in
the 1 mg/kg cooked matrices compared to the 1 mg/kg uncooked matrices.
The detection of light peptides was dependent upon the concentration of total soy
protein present for both matrices. Two total soy protein levels were analyzed in model
frankfurter matrices: 50 and 10 mg/kg. A general decline in the count of positive
detection peaks is seen in a concentration-dependent manner for the qualifying peptides
LIT and SQS. The most robust peptides were determined to be VFD and NIL and were
detected in all injections for all samples. The quantifying peptides, LSA, NIL, and VFD,
were consistently detected at 10 and 50 mg/kg in the cooked and uncooked frankfurters.
Lower counts of the qualifying peptides, LIT and SQS, were observed in the
frankfurters. At 10 mg/kg, the cooked and uncooked matrices of the frankfurter and bread

105
had 100% light peptide detection of NIL and VFD. The positive peptide count for each
ingredient type was equal in both matrices. For example, NRSF positive light peptide
counts were the same at 10 mg/kg in bread as they were at 10 mg/kg in frankfurters. This
indicates the suitability of these peptides for quantification for different matrices.
The most reliable quantifying peptides are LSA, NIL, and VFD as discussed in
Chapter 2. Briefly, the detection of these three light peptides are reproducible at low
mg/kg levels (1-5 mg/kg) of total soy protein level and have a higher linear dynamic
range compared to the peptides LIT and SQSD. Additionally, the LIT and SQS heavy
peptide internal standards have higher instability over time in the autosampler. This
instability was inferred by comparing the total count of light peptide detection to the total
count of quantifiable samples. Quantifiable samples represent the samples with positive
identification of both the heavy and light peptide peaks. The incurred samples are
acquired from the lowest (1 or 10 mg/kg) to highest (50 or 100 mg/kg) total soy protein
concentration. Therefore, the higher concentration peptide samples will have the longest
wait period between reconstitution and injection. For LIT, the light peptide intensity is
unaffected by the wait period, whereas the heavy peptide will decrease in intensity
causing the fragment ions to fall below the limit of detection. This decreases the number
of quantifiable samples of LIT despite the high count of positive light peptide detections.
For example, at 100 mg/kg the LIT light peptide is detected in all four injections for the
sliced bread matrix, and the heavy peptide is detected in 0-25 % of the injections. A
similar trend was observed at 50 mg/kg in the frankfurter matrices where light peptide
detection was 100 % in the cooked matrices but only 50 % of samples were quantifiable.

106
These samples are then unable to be quantified. Therefore, the peptides LIT and SQS are
better suited as qualifiers.
B. Standard Curve
Each standard curve was prepared from the serial dilution of a single extract of
NRSF as described in Chapter 2. Briefly, a single aliquot of each extract was diluted
1000-fold to a final concentration of 500 mg/kg total soy protein prior to reduction and
alkylation. Several aliquots of blank extraction buffer (0.5 % NFDM) were prepared
alongside the standards. All samples were carried through digestion and C18 cleanup
before the final freeze/dry step. The serial dilution (1, 2, 5, 10, 20, 50, and 100 mg/kg
total soy protein) is carried out after reconstitution (AR). The reconstituted 0.5 % NFDM,
final protein concentration of 0.05 µg/µL, served as the diluent for the dilution of external
standards. The variability of the dilution method was estimated by preparing replicate
standard curves within a group of replicates and among all groups prepared on separate
days. The source of variability for the AR method was determined with triplicate NRSF
extracts. Each extract of NRSF, 1:20 (w/v), was prepared with the LC-MS/MS workflow
in tandem and serially diluted AR into a single standard curve (1, 2, 5, 10, 20, 50, and
100 mg/kg total soy protein). A set of triplicate extracts is referred to as a group. This
experimental method was then repeated in triplicate (Group 1, Group 2, and Group 3). A
total of nine standard curves, three in each group, were compared.
The variability of standard curves within a group (three standard curves total) was
compared to variability among standard curves between all groups (nine standard curves
total). The first objective of the experimental design was to determine whether the source
of variability between the peptide responses at each external standard concentration

107
within a group is more significant than among groups. Standard curves were then pooled,
and an average regression line was fit for all replicates. The second objective was to
determine the significance of the variability of the slopes on the quantification of known
incurred samples.
Variation of Peptide Response
The variation of the peptide response between standard curves prepared on
different days was evaluated. The peptide response of three quantifying peptides, LSA,
NIL, and VFD, was measured in tandem for each external standard curve dilution (1-100
mg/kg). For the purposes of statistical analysis, the total soy protein levels are fixed
treatments and are assumed to be randomly assigned. For each total soy protein
concentration, the peptide response ratio is assumed to have a normal distribution.
Therefore, the variance of each total soy protein concentration among replicates within a
group and between all replicates for all groups were calculated using the mean square
(MS) following one-way ANOVA (Table 3-2).

108
Table 3-2. Mean square of peptide response ratios for each concentration of the external standard curve using one-way ANOVA.
Peptide Source of Variation
Mean Square of Peptide Response
Total Soy Protein Concentration (mg/kg)
2 5 10 20 50 100
LSA
WithinA 6.66E-05 8.53E-05 3.15E-04 1.44E-03 1.52E-02 6.83E-02
AcrossB 1.47E-05 4.72E-04 1.70E-03 4.05E-03 3.33E-02 2.66E-01
F Test NS NS S NS NS NS
NIL
Within 1.03E-04 5.67E-04 1.12E-03 7.23E-03 5.48E-02 1.97E-01
Across 5.05E-05 8.12E-05 8.44E-04 3.23E-03 3.38E-03 3.42E-02
F Test NS NS NS NS NS NS
VFD
Within 8.53E-05 3.97E-04 7.11E-04 3.81E-03 2.99E-02 6.65E-02
Across 4.02E-05 3.42E-04 4.57E-04 2.68E-03 1.31E-02 1.30E-01
F Test NS NS NS NS NS NS
AWithin group variation (n=3) BAmong group variation (n=3) CCritical F value = F, 0.05, 2, 6 = 5.143 DNon significant as determined by the F test (within/among) ESignificant as determined by the F test (within/among)
The lowest total soy protein level was excluded because of missing peptide ratio
responses. Additionally, the 1 mg/kg value is expected to vary because it is near the limit
of detection for the method. An F test can be used to determine if two variances are
significantly different between standard curve concentrations (18). The significance of
the variation for within day (between replicates) was compared to the variance among
groups (between days) using an F test with a critical p-value of 0.05. The F test for within
group variation divided by among group variation was determined to be not significant.
All mg/kg levels for all three peptides were found to have equivalent variation for peptide
responses for within day and among groups. An exception was 10 mg/kg for the peptide

109
LSA, which found a significant difference between the variability between replicates and
days. This was not concerning because of the non-significance of the six other total soy
protein concentrations among replicates and between groups. It is assumed that the equal
variance of the other concentrations will control for the significant variation at the 10
mg/kg level for this peptide. It is concluded by the F test that the variance between the
peptide responses at each total soy protein concentration run within the same group and
different groups is not significantly different. Therefore, peptide response from each
concentration among replicate standard curves within a group and among groups do not
vary significantly.
Variation of Linear Slopes
The next objective was to determine the variability of the slopes among all groups
for each peptide. Three replicate standard curves, representing three quantitative peptides,
were plotted for each replicate. The peptide response was measured as the ratio of the
total peak areas of the light peptide to the heavy peptide. Each external standard dilution
was injected in duplicate and the average peptide response was calculated. The average
values were then used to plot a standard curve. Standard curves are plotted as follows:
the x-axis corresponds to the external standard dilution (mg/kg total soy protein) and the
y-axis corresponds to the peptide response (ratio). A final regression line was fit to a
curve with all standard curve replicates (n=9 for each concentration except for 1 mg/kg).
The peptide response is expected to increase in a concentration-dependent manner.
Therefore, the standard curves were fit using an ordinary linear regression model. This
final standard curve was used to interpolate the incurred samples to determine the protein
recovery (Figure 3-3).

110
A.
B.

111
C.
Figure 3-3. External standard curves prepared with the after reconstitution (AR) method of dilution. Each peptide response was graphed separately and is represented in each panel LSAQYGSLR (A), NILEASYDTK (B), and VFDGELQEGR (C). Each group consists of triplicate standard curves labeled as “Replicate 1”, “Replicate 2”, and “Replicate 3”. The bottom graph in each panel shows the pooled standard curve (n=9 replicates). The black line shows the best fit average curve, and the red lines show the 95% confidence intervals.

112
The random effects of within group and among group on the linear regression
model were determined for each peptide (Table 3-3). Within day and across day are
considered random variables. The variance components are several orders of magnitude
less than one, indicating a small impact of these random effects on the linear regression
of standard curve replicates. For future experiments, the standard curve may not be
required to be prepared in tandem with every sample because preparing samples on
different days will not result in higher variability than samples prepared in tandem. The
standard curve can be representative of the variation of a set of unknown samples if
prepared on a different day. This is important for streamlining the method because of the
time intensive sample preparation and MS acquisition time contributed by the standards.
Table 3-3. Variance estimations of the random replicate effects within group and across groups on the linear regression model.
Variance Estimate Standard Deviation Random Effect LSA NIL VFD LSA NIL VFD
Within 0.0025 0.0072 0A 0.051 0.085 0.062 Across 0.0041 0 0.322 0.064 0 0.0191
Residual Error 0.0155 0.02 0.719 0.124 0.142 0.105 AStandard deviation of the variance estimate BValues reported as 0 were < 1 × 10⁻⁶
The linear regression model was first fit to the data without forcing the line
through x=0 or y=0. The 95 % confidence interval of the y-intercept and x-intercept both
included 0. Since the 95% confidence interval included 0, it was concluded these
intercept values were not significantly different from 0. The final regression model was
fit with an ordinary linear regression slope that was forced through x=0 and y=0. Linear
regression slopes were then tested for any significant differences within groups. Several
replicate group slopes were determined to be significantly different. This significant slope
variation can be explained by a residual analysis. As can be seen in Figure 3-4, there is an

113
increase in the variation of the peptide response as the concentrations increases. All
peptides had this variation from a linear regression fit.
Figure 3-4. Residual plot of the linear regression at each external standard concentration (1, 2, 5, 10, 20, 50 and 100 mg/kg total soy protein) measured for the peptide LSA.
Although the slopes may be statistically significantly different, it is not
necessarily significant for the purpose of the method. The significance between the slopes
of the final quantification value for the incurred samples was then investigated. To test
the effect of the different slopes on the quantification of unknown samples, three slope
values were used to estimate soy protein in the incurred samples. The three slope values
were obtained from the final standard curve of each peptide. The low and high range of
slope values from the 95% confidence interval and the best-fit value from the pooled
standard curve. The slope values tested for each peptide were as follows: LSA (0.0217,
0.0224, 0.0231). NIL (0.0364, 0.0369, 0.0375), and VFD (0.0287, 0.0291, 0.0295). The
estimated quantitative values of each extract from the three slopes is shown in Figure 3-5.

114
Figure 3-5. The total soy protein concentration of incurred samples was estimated using linear slope values of the pooled standard curve. Three slope values were used to estimate total soy protein: the best fit average and the high and low range of the 95 % confidence interval of the best fit line. Duplicate extracts were estimated and each is graphed in a separate color. All incurred samples have 10 mg/kg total soy
protein.
A.
B.

115
The three estimated quantitative values appear almost superimposed with one
another when quantifying a single extract. There is a higher variation among replicate
extracts compared to the slope values for the estimated quantitation. Therefore, the
variance between the slopes across days was determined to not affect the final
quantification value. These predictive values were in a narrow enough range to conclude
that the slopes are not significantly different for the purpose of the method. The protein
recovery of the incurred samples was then calculated using quantification values from the
average slope value.
C. Percent Recovery of Total Soy Protein in Model Foods
Cooked and uncooked matrices were evaluated to determine the effect of heat
treatments on the recovery of soy protein. Total soy protein was spiked into the matrix
based on the total uncooked weight. The total soy protein for uncooked and cooked bread
matrices was then adjusted to account for water loss during proofing and baking (Table 3-
4). The uncooked frankfurters have no water loss, and the total protein concentration was
only adjusted for the cooked frankfurters (Table 3-5).

116
Table 3-4. Adjusted total soy protein concentrations of white bread matrices after heat treatment. Total Soy Protein
Concentration (ppmA)
Cooked Matrix Sample Preparation
Pair of heat treated matrices
Soy-Derived Ingredient
NRSFB TSFC SPCD
1
WLE Uncooked 1.08 1.09 1.11
Cooked 1.20 1.17 1.20
SF Uncooked 1.09 1.08 1.10
Cooked 1.18 1.21 1.19
10
WL Uncooked 10.03 10.05 10.17
Cooked 11.01 10.88 10.88
S Uncooked 10.02 10.12 10.12
Cooked 10.95 10.99 10.87
100
WL Uncooked 100.14 101.58 101.23
Cooked 109.62 109.02 109.23
S Uncooked 100.68 101.38 101.44
Cooked 110.98 109.21 109.64
Appm = mg total soy protein/ kg matrix B Non-roasted soy flour CToasted soy flour DSoy Protein Concentrate (Arcon S) EWhole Loaf FSlices

117
Table 3-5. Adjusted total soy protein concentrations of white bread matrices after heat treatment.
Total Soy Protein Concentration
(ppmA) Replicate
Pair of heat treated matrices
Soy-Derived Ingredient
NRSFB SPCC TVPD SPIE
10
1 Uncooked 10 10 10 10
Cooked 12.32 11.31 13.34 12.27
2 Uncooked 10 10 10 10
Cooked 11.83 12.22 13.01 12.36
50
1 Uncooked N/A N/A 50 50
Cooked N/A N/A 67.81 60.34
2 Uncooked N/A N/A 50 50
Cooked N/A N/A 66.68 62.74
Appm = mg total soy protein/ kg matrix B Non-roasted soy flour CSoy protein concentrate (Arcon S) DTexturized vegetable protein ESoy protein isolate (non-hydrolyzed)
Each sample was extracted and injected in duplicate (n=4). The average of the
peptide ratios from each duplicate injection were calculated for one extract. Therefore,
three peptide quantitative values were estimated for each extract, resulting in a total of six
soy protein concentration estimates for each incurred matrix. In an attempt to reduce the
complexity of the results, the estimated values were condensed into a single quantitative
value. A single result is easier to interpret in a routine quality control analysis. ELISA is
one of the most widespread protein assays for quality control purposes in the food
industry. The main advantages are the ease of use during sample preparation and data
analysis. ELISA kits have software that requires minimal user expertise to understand
results. Therefore, it is important to try to streamline MS-based methods, so lab personnel

118
are not required to have extensive expertise for interpretation of the results. This MS
method consists of quantification results expressed as total soy protein from three
peptides. The results can be condensed into one final quantitative value using these three
peptide responses. The final result was condensed either by taking the average or the
maximum of all the quantitative results for each extract (Figure 3-6).

119
Figure 3-6. Percent recovery of the total soy protein concentration (mg/kg) in bread and frankfurter incurred matrices. The estimated total protein concentration was determined for each quantifying peptide using the best fit average slope. The average and maximum of all peptide estimations was then calculated for each extract. Each bar is the mean percent recovery of the duplicate extracts and error is represented as the standard error of the mean.

120
Three forms of bread were quantified: dough, inner, and crust. The dough matrices
correspond to the replicate batches prepared in tandem with the sliced bread. Only a
single injection for 1 mg/kg dough incurred with SPC was able to be quantified. Dough
samples with higher total soy protein levels were able to be quantified at 10 and 100
mg/kg. At each level, the protein recovery of the dough, for all ingredients, was
appreciably lower compared to the cooked matrices.
Overall, the cooked matrices had higher percent recoveries in bread at every
incursion level compared to the uncooked. At 1 mg/kg, all inner and crust samples were
able to be quantified for all injections. At 10 mg/kg, the inner portions of bread had
slightly higher recoveries than the crust counterparts. A higher recovery of soy protein in
the inner was expected and has been observed in previous studies (19). Interestingly, at
100 mg/kg the crust had higher protein recoveries for NRSF and TSF samples. Percent
protein recoveries reported by the maximum and average had a relatively small
difference. The cooked matrix fell between 50-120% recoveries and the uncooked
matrices were between 25-35 % recoveries.
Two forms of frankfurter were quantified: uncooked and cooked. Similar to the
bread matrices, higher percent protein recoveries were estimated for the cooked matrices.
NRSF had the lowest total percent recoveries for the cooked and uncooked matrices. The
largest variation was observed for the replicate extracts of TVP, as can be seen by the
error in the 10 mg/kg cooked matrix. This variation was from dramatic difference in
estimation between the replicate extracts. This may be explained by the dispersibility or
solubility of TVP in the frankfurter matrix. The other soy ingredients, such as SPI or

121
SPC, are processed to increase the solubility. Therefore, there may be less variation
among replicates for SPI and SPC compared to TVP.
D. Effect of Matrix and Heat on Protein Recovery
Uncooked and cooked matrices were evaluated to determine the effect of heating
on the detection and quantification of target soy peptides. Heat can cause structural
modifications to food proteins. These changes decrease protein extractability because of
protein aggregation and can introduce variability to results depending upon the extraction
method (8). Heat can also drive chemical modifications of food proteins. A well-known
chemical reaction, known as the Maillard reaction, between proteins and reducing sugars
is driven by heat. This reaction induces chemical changes such as the cross-linking of
proteins (7). Because of these principles, the uncooked matrices were expected to have
higher protein recoveries compared to the cooked matrices. Interestingly, the opposite
was observed, and higher protein recoveries were calculated for both uncooked bread and
frankfurter models within each total soy protein spike level. Therefore, the matrix was
determined to be the most influential factor on protein recovery and will be further
discussed.
Model Bread Matrix
The decreased protein recoveries in the uncooked compared to the cooked bread
is most likely from the strength of the glutinous matrix (20). Gluten consists of two major
classes of proteins, gliadin and glutenin, which contribute strength and elasticity,
respectively, to the structure of wheat bread dough (21). These proteins form a three
dimensional network after the addition of water and mixing. Covalent bonds between the
proteins stabilize the polymer network with several types of intra- and intermolecular

122
crosslinking bonds between side chains (disulfide bonds) or amino acids (tyrosine bonds)
(22). Other non-covalent bonds (e.g. hydrogen bonding) contribute to the structure of
gluten and overall viscoelastic properties of dough (21). The decrease in total soy protein
recovery of uncooked bread matrices may be from the strong elastic network of proteins
that may remain intact during extraction, which prevents complete protein extraction.
The total protein extraction in gluten may be lower even in MS-compatible
buffers. Gluten proteins are not readily solubilized in aqueous buffers. Increased
solubility of gluten proteins has been observed in ethanol buffers containing reducing
agents at higher extraction temperatures (23). Although MS-compatible buffers have
harsher extraction techniques containing chaotropic agents (urea) and reducing agents
(dithiothreitol), the gluten may not be completely solubilized. A comparison of total
protein extracted in different MS-compatible buffers found lower total protein recoveries
of gluten compared to other proteins (24). Soy protein was shown to be highly soluble in
buffers (e.g. urea), from 88-95 % total protein extracted, compared to gluten under the
same extraction conditions, from 8-39 % total protein extracted (24). A decrease in the
total protein extraction may explain the overall decrease in the total soy protein recovery
of the dough matrices. However, not all soy proteins may be affected the same because of
peptide specific interactions with the matrix. The recovery of milk proteins in a model
glutinous matrix using ELISA found a higher recovery of casein protein in the cooked
matrix compared to the uncooked matrix (25). In contrast, other milk proteins tested, such
as β-lactoglobulin, had higher recoveries in the uncooked glutinous matrix compared to
the cooked (25). For the bread matrix, similar low protein recoveries were obtained for all
quantifying peptides, representing the proteins beta-conglycinin and glycinin.

123
The digestion conditions for this method were optimized using extracts of NRSF
as the reference material. Additionally, two additions of 1:100 (trypsin:protein) was
determined to generate similar peptide responses compared to a single addition of 1:50.
However, the low peptide responses in the dough matrices may suggest gluten is not
completely digested with trypsin. Trypsin is an endoprotease present in the digestive tract
which specifically cleaves peptide bonds after lysine and arginine from the carboxyl end,
except after proline. Gluten is known to be resistant to proteases in the digestive tract,
causing chronic adverse immune responses for people with celiac disease (26). Proline is
an amino acid that does not contain a side group contributing to unique secondary
structure configurations. Proteins with high concentrations of proline are hypothesized to
be resistant to digestion because of the steric hinderance influenced by the unique folding
(27). Proteins in gluten have documented to be resistant to trypsin digestion because of
the high concentration of proline residues (28). In MS workflows, a cocktail of digestive
enzymes including trypsin, chymotrypsin, and pepsin are commonly used to increase the
number of peptides during digestion for higher coverage of the protein (29). Therefore,
only a single proteolytic enzyme may not effectively digest gluten proteins especially for
the detection of residual amounts of total soy protein (1 mg/kg).
The cooked matrix may have a weakened protein network which allows an easier
release of proteins. Air is incorporated into the gluten matrix during proofing, and after
cooking the protein network expands as it entraps air (30). The gluten network may be
weakened by other components in bread such as the swelling of starch granules (20). The
expansion of the protein network increases the surface area available for solubilization by
the buffer and may allow accessibility of trypsin for more complete digestion. Therefore,

124
extraction and digestion efficiency are increased in cooked matrix by a weakened protein
network, which allows an easier release of proteins, larger solvation space for the
extraction buffer, and more accessibility to sites that may not be available in the
uncooked matrix.
The viscoelastic form of the uncooked matrix seemed to contribute to the
decreased extraction of soy protein in uncooked dough. The cooked bread samples were
able to be effectively ground into uniform and small particle sizes, as determined
visually. The bread particles were able to disperse uniformly in the extraction buffer after
thorough mixing. The dough samples started as a more heterogeneous material. The
uncooked samples were unable to be blended in a food processor due to the viscoelastic
texture. Instead, dough subunits were “homogenized” with physical force into smaller
pieces. These pieces were larger and more heterogeneous in size compared to the cooked
matrix. As gluten heats, the protein elasticity increases and adsorbs to the walls of the
equipment, such as test tubes. This prevents uniform distribution of the matrix in the
buffer. This phenomenon was especially evident following extraction. After extraction,
the warm dough matrix would coagulate at the bottom of the tube, preventing
redistribution even after a 40-minute shaking step. Another physical form of the dough
was tested by grinding the dough samples in a Freezer/Mill (SPEX 6850). This resulted
in sample particles that were finer and more homogenous compared to the cooked sample
particles. Preliminary analysis of the peptide recoveries between the two physical forms
of dough concluded there was no improved detection of any target peptide. Therefore,
although the Freezer/Mill physical form of the uncooked dough was smaller and more

125
homogenous, the rheological behavior of gluten still inhibits the extraction and detection
of soy protein.
The low recoveries of soy protein in the uncooked dough matrix is likely from
combined factors including the partial protein solubilization and incomplete digestion of
gluten proteins. The gluten structure may remain intact during extraction and decreases
the total availability of protein in solution. The physical structure of gluten, especially
after heating, prevents the homogenous solubilization of dough pieces during extraction.
The decreased particle size of the dough matrix did improve the extraction of total soy
protein from the incurred matrices. The increased extraction temperatures cause the
dough matrix to stick to equipment and prevents uniform distribution of sample in the
extraction buffer. The cooked matrix was more effectively homogenized in buffer and the
weakened gluten structure during cooking improve protein extraction and downstream
detection. Future work should include other measures to weaken the gluten protein
network before analysis.
Model Frankfurter Matrix
Sausages, hotdogs, bologna, and frankfurters are all commonly consumed
meat products. Frankfurters are a type of meat product that originated from Germany and
are characterized by the type of meat used or spices incorporated (31). The detection of
soy proteins in adulterated meat products has been extensively studied (9, 32, 33). For
MS-based methods, many detection methods have been developed focusing on soy
protein peptide markers in meat products for food fraud purposes (34-36). There remains
a need for the quantification of soy protein in meat products for the purpose of food
allergen risk assessments.

126
The cooked matrices were expected to have lower total protein recoveries due to
the heat denaturation of proteins. Previous work by Montowska et al., compared the
effect of heat on the total protein extraction of slices of different types of meat and found
a correlation between lower total protein extraction of meat samples with longer thermal
processing due to protein aggregation (33). Interestingly, similar to the bread matrices,
the cooked frankfurter matrices analyzed in the current study had slightly higher percent
recoveries of total soy protein compared to the uncooked matrices. The physical
limitations discussed for the lower percent protein recoveries in uncooked bread may also
play a significant role in the extraction of the uncooked frankfurter. The cooked
frankfurter was able to be ground using a food processor into finer, homogenous
particles. These particles were then able to be distributed uniformly in the extraction
buffer after mixing. The uncooked frankfurter was pre-weighed before cooking and
directly extracted. The final physical form of the sample was a single large mass that did
not evenly distribute in the buffer. It is probable that the buffer may not be effectively
penetrating the sample matrix and solvating the protein as effectively compared to the
ground cooked particles.
Frankfurters are emulsions between meat proteins, water, and fat, in combination
with salt, seasonings and other processing agents (e.g. nitrite, phosphate) (37). The
combination of salt, water, and shearing force all act to solubilize and swell meat
proteins. The resulting product forms a three-dimensional protein network with a gel-like
texture that entraps and stabilizes fat in the meat emulsion (38). The main stabilizing
interaction between the proteins is disulfide bonds, although noncovalent bonds (e.g.
hydrogen bonding) are also present (39). Crosslinking of the proteins is stabilized by

127
other chemical bonds, specifically ɛ-N-(γ-Glutamyl)lysine bonds in raw meat (7). The
strength of the gel-like protein network may not be effectively disrupted during extraction
for the detection of soy protein in the uncooked samples.
The high fat composition of the uncooked frankfurter may also interfere with the
MS protein assay. A small liquid fraction of the frankfurter, containing water and fat, is
expelled from the emulsion after cooking. For discussion purposes, this fraction is
referred to as “purge”. The total protein content of the purge could not be determined by
the 660 nm assay. The high fat content in the sample extracts may have been
incompatible with the assay reagents. Additionally, the downstream analysis of the
sample by LC-MS/MS found no positive detections of any target peptide peaks for all
purge samples. After cooking, the fat expelled in the purge fraction lowers the total fat
content in the cooked frankfurter matrices. Therefore, while it may seem like there is a
higher protein recovery in the cooked frankfurters, it may be a result of less interference
of fat on the detection of soy peptides.
NRSF and SPC were both incurred at 10 mg/kg in bread and frankfurter samples.
For both matrices, VFD and NIL were the most consistently detected peptides with all
injections of incurred frankfurter matrices determined to have a positive detection. The
cooked bread matrices had overall higher recoveries of total soy protein for each
ingredient compared to the cooked frankfurters. The opposite trend was seen in the
uncooked matrices. A direct comparison of NRSF and SPC is challenging due to the
numerous physical and chemical characteristics of the matrices which interfere with
complete extraction of the total soy protein. However, the comparison does provide
evidence of the matrix to be the primary factor affecting protein recovery.

128
E. Ingredient effects
The effect of protein recovery based on the type of ingredient was less apparent
compared to the effect of the matrix. The detection of target peptides in bread incurred at
1 mg/kg was comparable across the ingredients, with 100 % detection of cooked matrices
for at least one peptide. TSF has the lowest solubility compared to all the ingredients
according to the manufacturer. The heat treatment throughout ingredient processing was
expected to lower the extractability of TSF. This explains the slightly lower protein
recoveries of the TSF incurred matrices at 1, 10, and 100 mg/kg.
The protein recoveries of SPC was slightly higher at 100 and 10 mg/kg compared
to TSF and NRSF. According to the manufacturer information, SPC is a functional soy
protein ingredient that has been alcohol-washed and pH-adjusted to improve the
solubility. This brand of SPC is used as an emulsifier in soup and meat products because
of the solubility properties. The high solubility of SPC was evident because of the
detection of soy peptides in dough at 1 mg/kg. As discussed previously, the other
ingredients were not detected in all injections at this level because of the inability to
effectively extract protein from the matrix.
TVP had lower counts of positive peptide detection compared to the other soy
ingredients. Interestingly, one of the replicate extracts at 10 mg/kg total soy protein
showed low peptide responses for both the uncooked and cooked matrix. The other
replicate extract, from a separate frankfurter, showed higher peptide responses that were
comparable to other 50 mg/kg incurred matrices. This indicates TVP may have lower
dispersion compared to the other ingredients in the meat base. This may cause a
heterogeneous distribution in the incurred product where some subsamples may contain

129
higher concentrations of TVP. This explains the higher recovery of one of the replicate
extracts and the very low recovery of the second. The low peptide recoveries were
confirmed as positive detections and were above the limit of quantification (peptide
response from the 1 mg/kg external standard). It is possible these proteins may be from
cross-contamination from other high protein samples prepared in tandem, but this is
unlikely because of the absence of any target peptide peaks in the blank samples. TVP is
an extruded soy protein product with a fibrous texture which mimics the mouthfeel of
muscle (37). This ingredient may be partially insoluble, effecting the homogeneity in the
starting material and thus affecting the extraction of protein for MS analysis. This may
explain the large variation between replicate extracts of TVP incurred frankfurters.
V. SUMMARY
The factors affecting the accuracy of the MS-based protein assay was the type of
soy ingredient, heat treatment, matrix composition, and total soy protein level. In some
cases, the lower total protein concentrations had higher percent recoveries compared to
the higher incursion levels. This may be a result of the limit of solvation of the buffer
rather than the extraction efficiency of the ingredient. The bread matrices had lower
recoveries of soy protein in uncooked matrices for all soy ingredients. The cooked
matrices had percent recoveries between 50-150 % for all total soy protein levels. The
frankfurter matrices had similar protein recoveries for cooked and uncooked matrices,
with the largest variation among the TVP extracts. The relatively high sample recoveries
is an example of how MS-based methods can be advantageous over ELISA methods. As
discussed in Chapter 1, preliminary analysis of the protein recovery of these soy-derived
ingredients using ELISA was dependent upon the processing of the ingredient. Direct

130
extracts of TSF showed total soy protein recoveries as low as 2 % in the Veratox Soy
ELISA. Processing-induced changes are expected in the structure of the protein and
immunological-based methods rely on the structural integrity of a protein epitope for
optimal protein binding. The ability of this method to detect highly processed soy
ingredients, among other matrix and ingredient factors, allows for a more accurate
determination of the risk of the soy protein in complex foods. Further risk assessment
analysis is needed for a more accurate determination.

131
VI. REFERENCES
1. S. M. Gendel, Comparison of international food allergen labeling regulations. Regulatory Toxicology and Pharmacology 63, 279-285 (2012).
2. Food allergen labeling and consumer protection act of 2004 (2004). 3. C. Bindslev-Jensen, D. Briggs, M. Osterballe, Can we determine a threshold level
for allergenic foods by statistical analysis of published data in the literature? Allergy 57, 741-746 (2002).
4. T. W. Group, Approaches to establish thresholds for major food allergens and for gluten in food. Journal of Food Protection 71, 1043-1088 (2008).
5. S. L. Taylor et al., Establishment of Reference Doses for residues of allergenic foods: Report of the VITAL Expert Panel. Food and Chemical Toxicology 63, 9-17 (2014).
6. A. Bureau, Summary of the 2019 VITAL Scientific Expert Panel Recommendations. (2019).
7. J. A. Gerrard, Protein–protein crosslinking in food: methods, consequences, applications. Trends in Food Science & Technology 13, 391-399 (2002).
8. C. K. Faeste, K. E. Lovberg, H. Lindvik, E. Egaas, Extractability, stability, and allergenicity of egg white proteins in differently heat-processed foods. Journal of AOAC International 90, 427 (2007).
9. A. Leitner, F. Castro-Rubio, M. L. Marina, W. Lindner, Identification of marker proteins for the adulteration of meat products with soybean proteins by multidimensional liquid chromatography−tandem mss sectrometry. Journal of Proteome Research 5, 2424-2430 (2006).
10. J. Heick, M. Fischer, B. Pöpping, First screening method for the simultaneous detection of seven allergens by liquid chromatography mass spectrometry. Journal of Chromatography A 1218, 938-943 (2011).
11. S. L. Taylor, J. A. Nordlee, L. M. Niemann, D. M. J. A. Lambrecht, B. Chemistry, Allergen immunoassays—considerations for use of naturally incurred standards. 395, 83-92 (2009).
12. S. Chen, C. T. Yang, M. L. Downs, Detection of six commercially processed soy ingredients in an incurred food matrix using parallel reaction monitoring. Journal of Proteome Research 18, 995-1005 (2019).
13. M. M. Phillips, K. E. Sharpless, S. A. Wise, Standard reference materials for food analysis. Analytical and Bioanalytical Chemistry 405, 4325-4335 (2013).
14. A. Mondal, A. J. J. o. F. E. Datta, Bread baking–a review. 86, 465-474 (2008). 15. P. W. Lee, S. L. Hefle, S. L. Taylor, Sandwich enzyme-linked immunosorbent
assay (ELISA) for detection of mustard in foods. Journal of Food Science 73, T62-T68 (2008).
16. J. A. Posthuma, F. D. Rasmussen, G. A. Sullivan, Effects of nitrite source, reducing compounds, and holding time on cured color development in a cured meat model system. LWT - Food Science and Technology 95, 47-50 (2018).
17. J. Belloque, M. C. García, M. Torre, M. L. Marina, Analysis of soyabean proteins in meat products: a review. Critical Reviews in Food Science and Nutrition 42, 507-532 (2002).

132
18. A. M. Almeida, M. M. Castel-Branco, A. C. Falcão, Linear regression for calibration lines revisited: weighting schemes for bioanalytical methods. Journal of Chromatography B 774, 215-222 (2002).
19. D. Croote, I. Braslavsky, S. R. Quake, Addressing complex matrix interference improves multiplex food allergen detection by targeted LC–MS/MS. Analytical Chemistry 91, 9760-9769 (2019).
20. B. Lagrain, P. Leman, H. Goesaert, J. A. Delcour, Impact of thermostable amylases during bread making on wheat bread crumb structure and texture. Food Research International 41, 819-827 (2008).
21. H. Wieser, Chemistry of gluten proteins. Food Microbiology 24, 115-119 (2007). 22. K. A. Tilley et al., Tyrosine Cross-Links: Molecular Basis of Gluten Structure
and Function. Journal of Agricultural and Food Chemistry 49, 2627-2632 (2001). 23. G. M. Sharma, S. E. Khuda, C. H. Parker, A. C. Eischeid, M. Pereira, Detection
of allergen markers in food: Analytical methods. Food and Drug Administration Papers, 6, (2017).
24. A. Gomaa, J. Boye, Simultaneous detection of multi-allergens in an incurred food matrix using ELISA, multiplex flow cytometry and liquid chromatography mass spectrometry (LC–MS). Food Chemistry 175, 585-592 (2015).
25. M. L. Downs, S. L. Taylor, Effects of thermal processing on the enzyme-linked immunosorbent assay (ELISA) detection of milk residues in a model food matrix. Journal of agricultural food chemistry 58, 10085-10091 (2010).
26. P. Ferranti, G. Mamone, G. Picariello, F. Addeo, Mass spectrometry analysis of gliadins in celiac disease. Journal of Mass Spectrometry 42, 1531-1548 (2007).
27. D. F. Cunningham, B. O'Connor, Proline specific peptidases. Biochimica et Biophysica Acta (BBA) - Protein Structure and Molecular Enzymology 1343, 160-186 (1997).
28. M. L. Colgrave, K. Byrne, C. A. Howitt, Food for thought: Selecting the right enzyme for the digestion of gluten. Food Chemistry 234, 389-397 (2017).
29. J. A. Sealey-Voyksner, C. Khosla, R. D. Voyksner, J. W. Jorgenson, Novel aspects of quantitation of immunogenic wheat gluten peptides by liquid chromatography–mass spectrometry/mass spectrometry. Journal of Chromatography A 1217, 4167-4183 (2010).
30. M. G. Scanlon, M. C. Zghal, Bread properties and crumb structure. Food Research International 34, 841-864 (2001).
31. J. Fernández-López et al., Chia (Salvia hispanica L.) products as ingredients for reformulating frankfurters: Effects on quality properties and shelf-life. Meat Science 156, 139-145 (2019).
32. A. Macedo-Silva, M. Shimokomaki, A. J. Vaz, Y. Y. Yamamoto, A. Tenuta-Filho, Textured soy protein quantification in commercial hamburger. Journal of Food Composition and Analysis 14, 469-478 (2001).
33. M. Montowska, M. R. Alexander, G. A. Tucker, D. A. Barrett, Authentication of processed meat products by peptidomic analysis using rapid ambient mass spectrometry. Food Chemistry 187, 297-304 (2015).
34. B. Hoffmann, S. Münch, F. Schwägele, C. Neusüß, W. Jira, A sensitive HPLC-MS/MS screening method for the simultaneous detection of lupine, pea, and soy proteins in meat products. Food Control 71, 200-209 (2017).

133
35. F. Castro-Rubio, M. C. García, R. Rodríguez, M. L. Marina, Simple and inexpensive method for the reliable determination of additions of soybean proteins in heat-processed meat products: An alternative to the AOAC official method. Journal of Agricultural and Food Chemistry 53, 220-226 (2005).
36. M. Criado, F. Castro-Rubio, C. García-Ruiz, M. C. García, M. L. Marina, Detection and quantitation of additions of soybean proteins in cured-meat products by perfusion reversed-phase high-performance liquid chromatography. Journal of Separation Science 28, 987-995 (2005).
37. H. W. Hoogenkamp, Soy protein and formulated meat products. (Cabi Publishing, 2004).
38. E. Dickinson, Emulsion gels: The structuring of soft solids with protein-stabilized oil droplets. Food Hydrocolloids 28, 224-241 (2012).
39. Y. Wu, W. Wang, J. Messing, Balancing of sulfur storage in maize seed. BMC Plant Biology 12, 77 (2012).