Modeling inactivation of Salmonella during spray drying of soy ...
121
MODELING INACTIVATION OF SALMONELLA DURING SPRAY DRYING OF SOY PROTEIN ISOLATE By Philip Steinbrunner A THESIS Submitted to Michigan State University in partial fulfillment of the requirements for the degree of Biosystems Engineering – Master of Science 2019
-
Upload
khangminh22 -
Category
Documents
-
view
0 -
download
0
Transcript of Modeling inactivation of Salmonella during spray drying of soy ...
MODELING INACTIVATION OF SALMONELLA DURING SPRAY DRYING OF SOY
PROTEIN ISOLATE
By
Philip Steinbrunner
A THESIS
Submitted to
Michigan State University
in partial fulfillment of the requirements
for the degree of
Biosystems Engineering – Master of Science
2019

ABSTRACT
MODELING INACTIVATION OF SALMONELLA DURING SPRAY DRYING OF SOY
PROTEIN ISOLATE
By
Philip Steinbrunner
Foodborne illness outbreaks linked to spray dried foods like infant formula and protein
powders demonstrate a need for greater understanding of bacterial inactivation kinetics during
spray drying. However, despite extensive research regarding the mechanisms of the spray drying
process, the survival of bacteria during spray drying is not well understood. Therefore, the
objectives were to: (1) measure the inactivation rates of Salmonella within a spray drying
droplet, (2) develop a model that relates droplet drying kinetics to Salmonella inactivation rate,
and (3) assess the survivability of Salmonella and Enterococcus faecium throughout a pilot-scale
spray dryer. In the first study, a thin layer of soy protein slurry inoculated with Salmonella was
dried in a convection oven using actual spray drying conditions to measure the inactivation rate
of Salmonella within droplets. Thereafter, a heat-mass coupled droplet drying model and
secondary bacterial inactivation models using droplet temperature and moisture content were
developed. Lastly, the survival and spatial distribution of Salmonella and Enterococcus faecium
throughout a pilot-scale spray dryer were evaluated at various process temperatures. Bacterial
inactivation rate was successfully modeled, with the best fitting secondary model including
parameters for both droplet temperature and moisture content, which were coupled with the
droplet drying model and validated. Although the spray drying process was able to reduce both
organisms, survivors were found both in the final powder as well as the interior dryer surfaces,
which indicates a potential health risk if the spray dryer is contaminated.
iii
ACKNOWLEDGMENTS
The work presented in this thesis would not have been possible without the help of many
people along the way. Thus, I would like to thank these people for their support in helping me
reach this goal.
First, thank you to Dr. Jeong for advising me during both my undergraduate and graduate
research. His constant support and guidance were what made my work possible, and I greatly
appreciate all the opportunities and advice he has given me over the years. Additionally, I would
like to thank to my committee members, Dr. Marks, Dr. Ryser, and Dr. Dolan, for additional
help and guidance with research problems along the way.
I would also like to acknowledge the immense help given to me by my coworkers during
my time at MSU. My lab managers Mike James and Nicole Hall offered great laboratory
expertise and were always willing to help with my research when needed. My fellow graduate
students (Nurul Ahmad, Ian Hildebrandt, Pichamon Limcharoenchat, Francisco Garces-Vega,
and Beatriz Mazon) were excellent sources of expertise in many varying research subjects and
were great sources of comradery and kindness when I felt discouraged. I also greatly appreciate
all the work done by the undergraduate students in the lab – I know how much work goes on
behind the scenes to keep our lab running, and this effort means a great deal to me.
I would like to thank my friends and family, especially my parents, for their undying
support and belief in my abilities. Their love was much needed in difficult times, and I am glad I
could always count on them to encourage me to keep working and not give up.
Finally, I would like to thank my wife, Victoria Steinbrunner. She has always been the
first person I turn to throughout my graduate studies and has offered invaluable love and support

iv
through all the difficult times of graduate school. I am grateful for her never giving up on me and
responding to all my frustration, discouragement, and anxiety with love and understanding. I
could not have reached this point without her.
The work presented in this thesis was supported by USDA NIFA Agriculture and Food
Research Initiative (AFRI) grant number 2017-67017-26528 entitled “Developing Salmonella
Control Strategies for Spray-Dried Powders.”

v
TABLE OF CONTENTS
LIST OF TABLES ........................................................................................................................ vii
LIST OF FIGURES ..................................................................................................................... viii
KEY TO SYMBOLS ...................................................................................................................... x
1. INTRODUCTION ................................................................................................................... 1 1.1. Spray Drying Process and Products ................................................................................. 1
1.2. Food Safety Impact and Regulation ................................................................................. 2
1.3. Objectives ......................................................................................................................... 3
2. LITERATURE REVIEW ........................................................................................................ 5
2.1. Spray Drying Process ....................................................................................................... 5 2.1.1. Feed material pre-treatment ...................................................................................... 5 2.1.2. Atomization............................................................................................................... 6
2.1.3. Droplet drying ........................................................................................................... 9 2.1.4. Particle residence time ............................................................................................ 11
2.2. Droplet Drying Kinetics Modeling ................................................................................ 13 2.2.1. Introduction ............................................................................................................. 13 2.2.2. Experimental methods and results .......................................................................... 18
2.2.3. Theoretical methods and results.............................................................................. 21 2.2.4. Conclusions ............................................................................................................. 22
2.3. Bacterial Inactivation Modeling ..................................................................................... 23 2.3.1. Introduction ............................................................................................................. 23
2.3.2. Spray drying inactivation studies ............................................................................ 24 2.3.3. Low-moisture inactivation studies .......................................................................... 30
2.3.4. Surrogate organisms................................................................................................ 32 2.3.5. Conclusion .............................................................................................................. 33
2.4. Summary ........................................................................................................................ 33
3. MODELING BACTERIAL INACTIVATION KINETICS DURING THIN-FILM DRYING
OF SOY PROTEIN POWDER SOLUTION ................................................................................ 34
3.1. Introduction .................................................................................................................... 34 3.2. Objectives ....................................................................................................................... 34
3.3. Materials and Methods ................................................................................................... 34 3.3.1. Spray dryer air temperature measurement .............................................................. 34 3.3.2. Materials and properties .......................................................................................... 36 3.3.3. Lab-scale oven simulation ...................................................................................... 38
3.4. Results and Discussion ................................................................................................... 41
3.4.1. Spray dryer chamber temperature results ............................................................... 41 3.4.2. Thin-layer drying droplet inactivation results ......................................................... 43
3.5. Conclusion ...................................................................................................................... 47

vi
4. SIMULATED DROPLET DRYING KINETICS AND APPLICATION OF BACTERIAL
INACTIVATION MODELS ........................................................................................................ 48
4.1. Introduction .................................................................................................................... 48 4.2. Objectives ....................................................................................................................... 48 4.3. Materials and Methods ................................................................................................... 49
4.3.1. Droplet drying modeling methods .......................................................................... 49 4.3.2. Bacterial inactivation modeling methods................................................................ 51
4.3.3. Model evaluation and selection .............................................................................. 53 4.4. Results and Discussion ................................................................................................... 54
4.4.1. Droplet drying simulation results............................................................................ 54 4.4.2. Inactivation modeling ............................................................................................. 56
4.5. Conclusion ...................................................................................................................... 61
5. PILOT-SCALE VALIDATION OF COMBINED SPRAY DRYING AND BACTERIAL
INACTIVATION MODELS ........................................................................................................ 62
5.1. Introduction .................................................................................................................... 62
5.2. Objectives ....................................................................................................................... 62 5.3. Materials and Methods ................................................................................................... 62
5.3.1. Materials and properties .......................................................................................... 62
5.3.2. Inactivation study methods ..................................................................................... 63 5.3.3. Spray dryer operational safety ................................................................................ 66
5.4. Results and Discussion ................................................................................................... 67 5.4.1. General properties ................................................................................................... 67 5.4.2. Effect of sampling location ..................................................................................... 67
5.4.3. Effect of inlet air temperature ................................................................................. 75 5.4.4. Comparison of survival between organisms ........................................................... 75
5.4.5. Validation of inactivation model ............................................................................ 76 5.5. Conclusion ...................................................................................................................... 79
6. CONCLUSIONS ................................................................................................................... 80
6.1. Overall Conclusions ....................................................................................................... 80 6.2. Commercialization Potential .......................................................................................... 81 6.3. Future Work ................................................................................................................... 81
6.3.1. Experimental work .................................................................................................. 81 6.3.2. Modeling improvements ......................................................................................... 83
APPENDIX ................................................................................................................................... 85
REFERENCES ............................................................................................................................. 99

vii
LIST OF TABLES
Table 1. Average drying chamber air temperature (°C ± standard deviation) measured at 7, 45,
and 90 cm from the chamber ceiling (top, middle, bottom, and average of entire
chamber, respectively) during normal spray drying operation at inlet air temperatures
(Tinlet) of 180, 200, and 220°C. ....................................................................................... 42
Table 2. D-values (± 95% confidence intervals) for Salmonella Enteritidis PT30 in soy protein
isolate inoculated onto nylon mesh discs treated in a convection oven at 80-200°C. .... 45
Table 3. Boundary and initial conditions used in the simulated droplet drying model. ............... 51
Table 4. Parameter estimates and model evaluation for secondary models of Salmonella
inactivation in drying soy protein isolate droplets, using Tref = 77°C and Xref = 1 kg
H2O/kg total. ................................................................................................................... 57
Table 5. Inactivation of E. faecium and Salmonella (± 95% confidence interval) in soy protein
isolate powder sampled from the primary and secondary collectors after spray drying at
various inlet air temperatures. Initial concentrations of E. faecium and Salmonella in the
inoculated soy protein solution with 95% confidence interval were 9.73 ± 0.18 and 8.86
± 0.18 CFU/g solids. ....................................................................................................... 69
Table 6. Population of E. faecium and Salmonella (± 95% confidence interval) in soy protein
isolate powder swab samples from the nozzle shield, drying chamber, cyclone, and
exhaust pipe after spray drying at various inlet air temperatures. .................................. 72

viii
LIST OF FIGURES
Figure 1. Theoretical characteristic drying curve and cross-section of a droplet of dissolved
solids in water (Mezhericher, Levy, and Borde 2015). .................................................. 14
Figure 2. FT80 Tall-form Spray Drier housed in the Biosafety Level 2 pilot plant facility at
Michigan State University. ............................................................................................. 35
Figure 3. Separation of a 10% w/w soy protein isolate (SPI) solution into watery and paste-like
phases after blending. ..................................................................................................... 37
Figure 4. Nylon mesh on a wire rack before inoculation and drying in a convection oven (top),
side view cross-section representation of droplets suspended in a single-layer within the
nylon mesh (bottom). ...................................................................................................... 39
Figure 5. Nylon mesh attached to wire rack placed inside a convection oven sampling port.
Arrows indicate the direction of heated airflow. ............................................................ 40
Figure 6. Survival of Salmonella Enteritidis PT30 in soy protein isolate inoculated on nylon
mesh disc after low (80-110°C, top) and high-temperature (180-200°C, bottom)
treatment in a convection oven. ...................................................................................... 44
Figure 7. Droplet temperature (Td) and moisture content (X) of simulated droplets of diameter 10,
20, 40, 80, 160, and 320 µm at air temperatures of 80°C (top) and 200°C (bottom) using
the drying model described in section 4.3.1. .................................................................. 55
Figure 8. Scaled sensitivity coefficients and predicted log reductions for Eq. (17) and (20) using
an air temperature of 80°C, and droplet diameter of 160 µm after optimizing parameter
estimates. ........................................................................................................................ 56
Figure 9. Measured bacterial inactivation, model prediction, and 95% confidence and prediction
intervals using Eq. (20) (markers, solid lines, dashed lines, and dotted lines,
respectively) for inactivation of Salmonella in a 160 µm diameter soy protein droplet
during drying at various temperatures (80-200°C) ......................................................... 59
Figure 10. Residual analysis for observed versus predicted survival of Salmonella in a 160 µm
diameter soy protein droplet during drying at various temperatures (80-200°C) using
Eq. (20). .......................................................................................................................... 60
Figure 11. Diagram of the sampling locations within the FT80 Tall Form Spray Dryer used in the
pilot-scale validation study. ............................................................................................ 65
Figure 12. Typical appearance of fine soy protein powder accumulated in the secondary collector
after spray drying. ........................................................................................................... 70

ix
Figure 13. Typical appearance of accumulated coarse soy protein powder in the primary collector
after spray drying. ........................................................................................................... 70
Figure 14. Top-down view of the spray drying chamber with deposited soy protein powder after
spray drying. ................................................................................................................... 71
Figure 15. Nozzle shield with deposited soy protein powder after spray drying. ........................ 74
Figure 16. Cyclone connecting pipe with deposited soy protein powder after spray drying........ 74
Figure 17. Predicted inactivation of Salmonella in a droplet drying at constant air temperatures of
104, 119, and 132°C using Eq. (20) (lines) and observed inactivation (with 95%
confidence intervals) of Salmonella in powdered soy protein isolate in the
primary/secondary collectors of the pilot scale spray dryer after drying at inlet air
temperatures of 180 and 200°C for their assumed residence times (markers). .............. 78

x
KEY TO SYMBOLS
A surface area of droplet (m2)
a fitting parameter
aw water activity
b fitting parameter
cp specific heat of droplet material (J/kgK)
D decimal reduction time (s)
Dref reference decimal reduction time (s)
Ed inactivation energy (J/mol)
f dimensionless moisture content (f = 1 during constant rate drying period, f < 1 during
falling rate drying period)
h heat transfer coefficient (W/m2∙K)
hm mass transfer coefficient (m/s)
k0 reference inactivation rate constant (s-1)
kd inactivation rate constant (s-1)
m mass of droplet (kg)
ms mass of solids in droplet (kg)
n evaporation hindering shape factor (convex drying rate if n < 1, concave drying rate if n >
1)
N bacterial load (CFU/g)
N0 initial bacterial load (CFU/g)
Nu Nusselt number
Pr Prandtl number
pv,∞ ambient vapor concentration (kg/m3)
pv,sat saturated surface vapor concentration (kg/m3)

xi
R universal gas constant (J/mol∙K)
Re Reynolds number
RH relative humidity
Sc Schmidt number
Sh Sherwood number
t time (s)
T temperature (K)
Ta air temperature (K)
Td droplet temperature (K)
Tref reference temperature (K)
Twb wet bulb temperature (K)
X moisture content of droplet, wet basis (kg H2O/kg total)
Xcr critical moisture content of droplet, wet basis (kg H2O/kg total)
Xeq equilibrium moisture content of droplet, wet basis (kg H2O/kg total)
zTd Temperature change required for one log change in decimal reduction time (°C)
zX Moisture content change required for one log change in decimal reduction time (kg
H2O/kg total)
ΔEV apparent activation energy (J)
ΔHevap latent heat of vaporization (J/kg)
ψ interface moisture content fractionality (ψ approaches 1 when droplet surface is saturated
with water, approaches 0 as droplet reaches equilibrium moisture)

1
1. INTRODUCTION
1.1. Spray Drying Process and Products
Spray drying is a process used to manufacture food, pharmaceutical, and industrial powders
by atomizing a liquid solution into droplets within a chamber containing high-temperature, high-
velocity air to rapidly evaporate moisture, forming very fine particles from a solid-liquid mixture
or slurry. This process is commonly used to manufacture low-moisture food powders such as
powdered milk, various protein powders, instant coffee and tea, dried flavorings, and
encapsulated probiotic cultures (Chegini and Taheri 2013; Slavutsky et al. 2017).
Spray drying is favored over other drying methods (freeze drying, drum drying, conveyor
drying) for many products due to its unique drying characteristics (Handscomb 2008). Although
spray drying uses high-temperature air, droplets experience very short residence times (< 10 s)
and relatively low wet-bulb temperatures, so heat-sensitive products can be dried without
reduction in quality (Sinnott 2005; Kuye et al. 2009; Zbicinski, Strumillo, and Delag 2002).
Thus, spray drying can be used to encapsulate desired products like probiotic microorganisms in
carrier materials. This allows manufacturers of probiotic products to dry microorganisms and
extend their shelf life while maintaining high cell viability (Slavutsky et al. 2017; Tang and Li
2013). Because spray drying is a high-temperature drying process, it also has the potential to
inactivate undesirable microorganisms that may lead to spoilage or contamination in the finished
dry product (Lievense et al. 1990).
The market for spray dried foods has grown substantially in recent years. Global production
of dry milk powders grew from 3.7 million tons in 2009 to 4.5 million tons in 2013, with spray
drying being the most common method of production (Lagrange, Whitsett, and Burris 2015).
One of the fastest growing dry milk products is infant formula, for which global sales volume

2
grew by 40.8% between 2008 and 2013, and is projected to continue at a rate of 9% annually
between 2016 and 2020 (Affertsholt and Pedersen 2017; Baker et al. 2016). Additionally, the
global soy protein market value has been projected to increase from $4.8 billion in 2015 to $7.8
billion in 2024 (Transparency Market Research 2018). Global revenue from spray dried whey
protein powder was $8.2 billion in 2015 (Zion Market Research 2016).
1.2. Food Safety Impact and Regulation
Salmonella is a common cause of foodborne illness worldwide, with an estimated 1.4
million cases, 415 fatalities, and cost of $3.1 billion per year in the United States alone (Roos,
2010). Infection by Salmonella causes symptoms typical of gastroenteritis, including fever,
nausea, vomiting, abdominal pain, and diarrhea (Centers for Disease Control and Prevention
2019). In severe infections, symptoms can lead to dehydration and hospitalization. As is true of
many foodborne illnesses, all people are vulnerable to infection by Salmonella, but illness is
more frequent and severe in the elderly, very young, and immunocompromised populations.
Salmonella spp. is commonly associated with poultry, eggs, and produce, but has been
increasingly linked to outbreaks in low-moisture products such as almonds and pine nuts
(Centers for Disease Control and Prevention 2004, 2011), nut butters (Centers for Disease
Control and Prevention 2014, 2017a, 2016c), flour (Centers for Disease Control and Prevention
2016a), and dried coconut (Centers for Disease Control and Prevention 2018). Several spray-
dried products have also been the subject of recalls due to bacterial contamination, including
meal-replacement shake powder (Centers for Disease Control and Prevention 2016b), and infant
formula (Brouard et al. 2007; Cahill et al. 2008; Usera et al. 1996; Van Acker et al. 2001;
Forsythe 2005). Outbreaks linked to spray-dried foods are most often caused by either
Salmonella or Cronobacter sakazakii, and while most infected people recover on their own,

3
some severe infections due to these pathogens can be fatal (Drudy et al. 2006; Centers for
Disease Control and Prevention 2017b). Beyond health impacts, foodborne illnesses have a
tremendous economic impact, with the total burden of all foodborne illness in the United States
estimated to have had a total burden of $77.7 billion in 2012 (Scharff 2012).
These outbreaks and economic burdens have led the US government to pass the Food Safety
Modernization Act (FSMA) in 2011, with the main goal of improving food safety nationwide
and transforming government food safety regulation from being reactive to preventative (Strauss
2011). A major portion of this prevention-based approach is the mandate for written preventative
control plans that include evaluation of food safety hazards, implementation of control steps put
in place to reduce those hazards, and validation and verification of the controls’ effectiveness
(U.S. Food and Drug Administration 2011). Therefore, a greater understanding of the efficacy of
food processing techniques is needed to both meet these new regulations and improve food
safety.
1.3. Objectives
Increased food safety regulation, as well as the health and economic impacts of foodborne
illness, have led to an increased research effort focused on bacterial inactivation and survival in
low-moisture food processing and storage (Osaili et al. 2008; Podolak et al. 2010;
Limcharoenchat, James, and Marks 2019; Uesugi, Danyluk, and Harris 2006; Danyluk, Uesugi,
and Harris 2005; Smith and Marks 2015; Ceylan and Bautista 2015; Farakos, Frank, and
Schaffner 2013; Farakos et al. 2014; Villa-Rojas et al. 2013). Spray drying is one such process,
being that it is used for manufacturing low-moisture food powders and involves complex drying
mechanics. Although spray drying uses hot air, its fundamental principle is evaporative drying
which is not enough to achieve pasteurization. Therefore, potential contamination of spray

4
drying systems, as evidenced by previous outbreaks and recalls, can pose a health risk for
consumers. Nevertheless, bacterial inactivation and survival kinetics during spray drying are not
currently well understood in the literature. If the reduction of bacteria can be maximized by
modifying process conditions while still achieving quality goals, then final products will be
improved through additional safety. Therefore, research on modeling bacterial inactivation
during spray drying is highly valuable for understanding the risks involved with the process in
the event of bacterial contamination, and will ultimately help the food industry to validate the
safety of spray dried food products, remain compliant with new safety regulations, and reduce
the risk of outbreaks. With this motivation in mind, the research that follows included the
following objectives:
1. To model the inactivation kinetics of Salmonella in droplets via a thin layer of
Salmonella-inoculated soy protein slurry under conditions relevant to spray drying.
2. To develop a droplet drying model to simulate droplet properties during spray drying
and a bacterial inactivation model that incorporates the effects of such properties on
inactivation rate.
3. To validate the previously developed bacterial inactivation model using a pilot-scale
spray dryer and compare the survival of Salmonella and Enterococcus faecium during
the spray drying process under various processing conditions.

5
2. LITERATURE REVIEW
2.1. Spray Drying Process
The spray drying process consists of several key steps: pre-treatment of the feed solution,
atomization of the feed solution, mixing of droplets in the hot air stream and subsequent droplet
drying, and separation of powder from the drying air (Kuye et al. 2009). Considerable research
has been conducted in an effort to understand how these steps impact dryer operation and
product quality. Thus, previous research regarding these steps will now be reviewed along with
the most relevant information for the objectives of this thesis.
2.1.1. Feed material pre-treatment
The characteristics of the feed material have a significant impact on the drying process
and quality of the final powder product. The solids content of a liquid feed is one such critical
factor that affects feed rate, droplet and particle size (droplets are frequently defined as particles
once they have dried to the point of solid crust formation), and overall drying efficiency. Each
food product has an optimal solids content for use as a liquid feed in spray drying which
generally ranges from 10% (soy protein isolate) to 65% solids (coffee creamer) (Armfield
Engineering Teaching Equipment 2013; Masters 1972). This product-specific optimum value is
based on the desired final product texture (increase in solids content leads to increased droplet
size) as well as drying efficiency (higher solids content leads to high viscosity, which may be
difficult to pump and atomize without the use of specialized rotary atomizers) (Kuye et al. 2009).
Many liquid feed mixtures are concentrated by evaporation of water, often by boiling the liquid
under a vacuum before spray drying to increase the concentration of solids (Rotronic 2015;
Ramirez, Patel, and Blok 2006).

6
In the industry, liquid feeds are typically pasteurized in an attempt to eliminate all
pathogenic microorganisms before spray drying (Chegini and Taheri 2013; Coperion 2015; Scott
et al. 2007; Ramirez, Patel, and Blok 2006; Rotronic 2015; Mullane et al. 2008). However,
protecting a pasteurized food from recontamination can be difficult, as environmental bacteria
are frequently present in food processing facilities and are extremely difficult to control.
Mullane et. al. (2008) studied the environmental prevalence of Cronobacter sakazakii in
a powdered milk protein facility in an attempt to better understand how previous powdered milk
products have become contaminated (Mullane et al. 2008). The results showed that all air filters
in the facility were positive for Cronobacter sakazakii, along with swabs from the drying air
outlet, which contacted the dried milk powder. Mullane et. al (2007) also completed another
similar study to detect and identify Cronobacter sakazakii in a powdered infant formula facility
(Mullane et al. 2007). Cronobacter was detected in multiple areas of the facility including the
bag-filling platform, dryer floor, and packing vacuum. These studies show the difficulties of
maintaining a processing environment free of bacterial contamination, and the risk of
recontamination for liquid feed intended for spray drying after pasteurization.
2.1.2. Atomization
Liquid feeds that have been pre-treated are pumped into the atomizer, where the feed is
split into small droplets with diameters generally in the range of 50-350 µm (Masters 1972; Kuye
et al. 2009). There are two main types of atomizers used in spray drying. The first is the rotary
atomizer, which spins the liquid feed on a disc rotating at high angular velocity to break up the
flow into small droplets of mean diameters of 20-275 μm. This type of atomizer is capable of
atomization at high feed rates, but is only applicable in dryers with sufficiently large chambers,
as droplets are propelled outward and must have enough radial space to redirect the droplets

7
away from the wall (Kuye et al. 2009). The alternative is the pneumatic nozzle atomizer, which
uses pressurized gas to disrupt a narrow stream of liquid feed. This produces a conical spray of
small droplets with mean diameters of 15-350 μm, depending on the properties of the feed,
pressurized gas, and dimensions of the nozzle (Masters 1972). Though this type of atomizer
cannot atomize at feed rates as high as rotary atomizers, they are more common in lab and pilot-
scale spray dryers that do not have the required chamber diameter to properly utilize a rotary
atomizer.
There are two options for the orientation of atomization within the drying chamber: co-
current or counter-current. In co-current atomization, the liquid feed is atomized at the top of the
chamber and droplets travel downward in the same direction as the inlet air. In counter-current
atomization, liquid feed is atomized from the lower portion of the chamber in an upward
direction, with inlet air being supplied either upwards or downwards (Armfield Engineering
Teaching Equipment 2013; Jaskulski, Wawrzyniak, and Zbicinski 2015; Jaskulski, Wawrzyniak,
and Zbiciński 2018). This orientation increases the residence time for particles in the drying
chamber, as the particles are sprayed upward, then fall downward into collectors after being
sufficiently dried. This is useful for feeds with low solids content due to their longer required
drying times. However, counter-current drying is only suitable for thermally stable products, as
particles are more likely to burn and undergo quality degradation due to longer exposure to high
temperature inlet air. Therefore, most spray dried food products are dried using co-current
atomization (Masters 1972; Kuye et al. 2009).
The size of droplets produced by the atomizer is a highly variable parameter that is
dependent on both atomizer design and operation as well as the properties of the liquid feed
being atomized. Several factors can strongly impact the size of atomized droplets. Droplet size

8
decreases proportionally with increased atomizer pressure or rotational speed (using pressure or
rotary atomizers, respectively), and increases proportionally with feed rate and feed viscosity
(Kuye et al. 2009). Because the size of droplets of various materials created under different
atomization conditions varies widely and has a large impact on their drying kinetics and powder
properties, spray dryer droplet size has been researched extensively.
Experimental efforts have provided data regarding droplet size distributions for various
spray dried products. LiCari and Potter (1970) measured the distribution of spray dried skim
milk particles using a pneumatic nozzle at varying atomizing air pressures, and found average
particle diameters of 9.43, 7.67, and 6.10 µm at atomizing pressures of 5.27, 7.03, and 8.79
kg/cm2 (LiCari and Potter 1970b). However, initial wet droplet size was not measured in this
experiment. Zbicinski, Strumillo, and Delag (2002) reported mean diameter of 44.9 µm for
atomized maltodextrin droplets during the drying process using a laser measuring device
(Zbicinski, Strumillo, and Delag 2002).
Spray drying simulation studies often utilize a distribution of droplet sizes to assess the
effects of variable droplet size on other conditions within the simulation. These simulations
frequently use the Rosin-Rammler distribution for creating a continuous distribution of droplet
sizes. This distribution has been found to apply well to the break-up of flowing liquid in spray
dryer atomization (Djamarani and Clark 1997). Mezhericher, Levy, and Borde (2015) used
droplet diameters of 10-138 µm in computational fluid dynamics (CFD) simulations by assuming
the diameters obey the Rosin-Rammler distribution to study droplet drying and particle
trajectories for a silica suspension (Mezhericher, Levy, and Borde 2015). Jin and Chen (2009)
used the Rosin-Rammler distribution with minimum, mean, and maximum diameters of 100,
200, and 500 µm, respectively, for their study in applying the reaction engineering droplet drying

9
approach in CFD spray drying simulations of milk powder (Jin and Chen 2009). Kieviet and
Kerkhof (1995) measured the size of dried maltodextrin particles after spray drying (134 µm
mean diameter), then fitted the data to a Rosin-Rammler distribution (Kieviet and Kerkhof
1995). This method allows for the creation of a complete distribution of droplet sizes using a
small set of experimental data.
Several models of varying complexity have been developed to estimate average droplet
size based on atomization and feed properties. Models for pneumatic nozzles often involve
combinations of properties like surface tension, density, and viscosity of feed, relative flow rates
and velocities of air and feed, and dimensions of the nozzle in order to estimate average droplet
size (Kuye et al. 2009; Masters 1972; Dobry et al. 2009). These models have only been validated
as accurate for a few products and can be unreliable without such validation.
As the previously described experimental, theoretical, and simulated results have shown,
droplet size varies widely based on atomization conditions and feed properties, and can be
difficult to accurately measure without specialized equipment. In general, the best approach is to
obtain droplet size data from the atomizer manufacturer and confirm the results for the intended
conditions using an appropriate model and data from the literature (Masters 1972).
2.1.3. Droplet drying
The atomizer sprays the droplets into the main cylindrical chamber of the spray dryer,
where drying takes place. To create an environment suitable for droplet drying, air is filtered,
heated to a high temperature (170-240°C), and blown into the main chamber using fans (Masters
1972; Ozmen and Langrish 2003; Kieviet et al. 1997). This swirling air creates a vortex of highly
convective air that supplies the energy needed to rapidly evaporate the moisture in the atomized
droplets.

10
While the inlet air temperature can be precisely controlled, the air temperature will drop
rapidly and form a fairly constant temperature profile once entering the drying chamber. This
temperature drop is due to evaporative cooling of the droplets being dried, as well as heat losses
through the walls of the chamber. This temperature drop has been observed in multiple drying
studies, with differences between inlet and outlet air temperature as large as 132°C (Doyle,
Meske, and Marth 1985; Miller, Goepfert, and Amundson 1972; Birchal et al. 2006; LiCari and
Potter 1970a). CFD simulations have been helpful in profiling the air temperatures within the
drying chamber, as such temperature profiles can be difficult to accurately measure using
experimental methods. This is because of the rapidly changing air temperatures that occur near
the atomizer, where evaporation from droplets rapidly cools the heated inlet air. Harvie,
Langrish, and Fletcher (2002) used CFD to simulate spray drying of skim milk and reported the
air temperature profile within the drying chamber (Harvie, Langrish, and Fletcher 2002). This
simulation showed a high temperature (~217°C) where inlet air enters the drying chamber, but
rapid cooling as the air moves downward in the chamber. Most of the air inside the chamber
ranged from 97-127°C. Overall, studies involving measurement of air temperature within the
drying chamber agree that temperature decreases rapidly as air moves away from the inlet, both
vertically and radially (Montazer-Rahmati and Ghafele-Bashi 2007; Kieviet and Kerkhof 1997).
This creates zones of varying air temperatures that are experienced by circulating particles,
making predictions of environmental temperature difficult for droplet drying models.
After particles have dried to the equilibrium moisture level, hot air then carries the dried
particles into the cyclone separation stage, where the particles fall into a collector or conveying
system, depending on the scale of the operation (Masters 1972). Drying air exits the cyclone and

11
is filtered before being exhausted to the environment or recycled back into the system to be used
again as heating air (Masters 1972).
2.1.4. Particle residence time
Droplets remain in the drying chamber until they reach their equilibrium moisture
content, which is dependent on both dryer design and conditions, feed composition, and droplet
properties. After reaching the equilibrium moisture content, particles spend varying amounts of
time swirling inside the drying chamber before dropping into a collector (Mezhericher, Levy,
and Borde 2015). Similar to droplet size, particle residence time varies widely based on dryer
design, drying conditions, and properties of the liquid feed and droplets. This residence time has
been studied using a variety of methods, both experimental and theoretical.
Kieviet and Kerkhof (1995) experimentally measured residence time by injecting a tracer
material into a maltodextrin solution being pumped into a pilot-scale co-current spray dryer and
measuring the concentration of the tracer in the final product over time (Kieviet and Kerkhof
1995). This resulted in a roughly log-normal distribution of particle residence times with a
median of 58.5 s, minimum of less than 3 s and a maximum time of over 10 min. However, it
was reported that concentration of the tracer became more difficult to measure accurately as
treatment time increased and contributed to a high variance overall. This method was not able to
correlate residence time with particle size, which varied between ~53-250 µm diameter.
Zbicinski, Strumillo, and Delag (2002) experimentally tested the residence time of
baker’s yeast and maltodextrin under varying atomization and drying temperature conditions
(Zbicinski, Strumillo, and Delag 2002). Drying air temperatures varied from 175-220°C, air
velocities varied from 0.6-1.5 m/s, and feed concentrations for maltodextrin and baker’s yeast
varied from 10% to 30%. These conditions gave a distribution of average residence times, with a

12
minimum of ~2 s and maximum of ~5 s. The results also showed that residence time is reduced
with increased temperature and air velocity, and increases at higher air to liquid atomization
ratios.
Masters (1972) presented a rough calculation to determine the minimum particle
residence time by assuming it to be equal to the average residence time of air (Masters 1972).
This can be calculated by dividing the volume of the drying chamber by the flow rate of air into
the drying chamber. This is only a rough estimate of minimum particle residence time, and it was
noted that most particles have a much greater residence time than this due to recirculating air
flow patterns and particles remaining suspended on dryer walls or in low air velocity sections of
the drying chamber. It is also mentioned that dryer designs can range in residence times from 5 s
up to several minutes, but for co-current dryers a normal residence time is in the range of 20-40
s.
Kuye et. al. (2009) recommended a set of equations to estimate particle residence times
based on feed, droplet, and drying air properties (Kuye et al. 2009). These equations were used to
calculate the residence time of starch particles in a pilot-scale spray dryer and were reported in
the range of ~1.5-2.5 s. Mezhericher also simulated drying of silica suspension droplets in an
industrial-scale spray dryer using computational fluid dynamics (CFD) software (Mezhericher,
Levy, and Borde 2015). Results from this simulation gave an averaged particle residence time in
the range of 1.0-3.9 s, depending on the modeling parameters and initial droplet diameter.
The wide range of particle residence times is likely due to a few different factors. Each
experimental test was carried out on a unique spray dryer, leading to much variability in terms of
the size of the drying chamber, airflow patterns within the chamber, temperature and humidity
conditions, droplet size, and droplet composition. These conditions are unique to each test and

13
can greatly impact residence times. Additionally, due to the complexity of spray drying as a
process, wide distributions can be observed for residence time even within a single dryer. This
makes comparisons between dryers difficult and leads to the conclusion that residence time
should be measured or estimated for each unique system and set of operating conditions.
Despite the complexity of the process, the operating principles of spray drying are well
understood, and the properties of droplet size, drying temperature, and particle residence time
have been well researched. These principles can be used to better understand and model the
drying process for individual droplets.
2.2. Droplet Drying Kinetics Modeling
2.2.1. Introduction
The field of drying kinetics seeks to describe complex drying processes using a series of
heat and mass transfer equations. Droplet drying kinetics modeling is used to describe attributes
of liquid droplets such as temperature, moisture content, crust formation, and stickiness during
the process of drying into solid particles. There are several methods used to model droplet drying
kinetics, the most common methods being the characteristic drying curve method (CDC), the
reaction engineering approach (REA), and deterministic analytical models (Mezhericher, Levy,
and Borde 2010; Mondragon et al. 2013).
The characteristic drying curve approach assumes that droplet drying occurs in two
distinct periods: the constant rate drying period, where the droplet moisture content is above a
critical moisture which is specific to each feed material, and the falling rate drying period, where
the droplet moisture content is below the critical moisture (Figure 1) (Mezhericher, Levy, and
Borde 2010).

14
Figure 1. Theoretical characteristic drying curve and cross-section of a droplet of dissolved
solids in water (Mezhericher, Levy, and Borde 2015).
This model is represented in the following form:
𝑑𝑋
𝑑𝑡= 𝑓
𝐴ℎ
𝑚𝑠∆𝐻𝑒𝑣𝑎𝑝
(𝑇𝑎 − 𝑇𝑤𝑏) (1)
𝑓 =𝑋 − 𝑋𝑒𝑞
𝑋𝑐𝑟 − 𝑋𝑒𝑞, 𝑋 ≤ 𝑋𝑐𝑟 (2)
𝑓 = 1, 𝑋 > 𝑋𝑐𝑟 (3)
where X, Xeq, and Xcr are the moisture content, equilibrium moisture content, and critical
moisture content of the droplet, respectively, t is time, f is a dimensionless moisture content, A is
the surface are of the droplet, h is the heat transfer coefficient, ms is the mass of solids in the
droplet, ΔHevap is the latent heat of vaporization of water, Ta is the air temperature, and Twb is the
wet bulb temperature.

15
During the constant rate drying period, moisture content is greater than the critical
moisture value, and evaporation of moisture is unhindered and occurs at a constant rate. The
temperature of droplets made of solids suspended in liquids does not exceed the wet bulb
temperature during this stage (Chen and Lin 2005). However, the temperature of droplets made
of solids dissolved in solutions follows a smooth curve that can exceed the wet bulb temperature
during this stage (Mezhericher, Levy, and Borde 2015). When the droplet moisture content
reaches the critical moisture level, an initial solid crust is formed around the exterior of the
droplet that inhibits evaporation, and the droplet enters the falling rate drying period
(Mezhericher, Levy, and Borde 2015). During this period, drying rate decreases proportionally
with droplet moisture content due the growth of the dry crust surrounding the wet core which
inhibits vapor diffusion (Cheong, Jeffreys, and Mumford 1986; Mezhericher, Levy, and Borde
2008). The temperature of the particle also increases above the wet bulb temperature in this stage
(Mezhericher, Levy, and Borde 2015). The particle continues drying in the falling rate period
until it reaches the equilibrium moisture content, where mass transfer between the particle and
the environment reaches equilibrium.
A common assumption when using the CDC model for food products is that a droplet’s
initial moisture content is equal to the critical moisture content, which means the entire drying
process occurs during the falling rate period (Woo et al. 2008; Langrish and Kockel 2001). This
assumption is acceptable since these products generally have a very short or non-existent first
drying period where droplet temperature cannot exceed the wet bulb temperature, making the
CDC model highly suitable (Mondragon et al. 2013).
The reaction engineering approach assumes there is a required activation energy
necessary for moisture removal to occur in drying droplets, and considers the vapor

16
concentration gradient to be the driving force for drying (Mondragon et al. 2013). This model is
represented in the following form:
𝑑𝑚
𝑑𝑡=
ℎ𝑚𝐴
𝑚𝑠(𝜓𝑝𝑣,𝑠𝑎𝑡(𝑇𝑑) − 𝑝𝑣,∞) (4)
𝜓 = exp (−∆𝐸𝑉
𝑅𝑇𝑎) (5)
where m is the mass of the droplet, t is time, hm is the mass transfer coefficient, A is the surface
area of the droplet, ms is the mass of solids in the droplet, ψ is the interface moisture content
fractionality, pv,sat is the saturated surface vapor concentration, Td is the droplet temperature, pv,∞
is the ambient vapor concentration, ΔEV is the apparent activation energy, R is the universal gas
constant, and Ta is the air temperature.
The activation energy is close to zero when surface moisture is high and increases as
moisture content decreases due to the increased energy required to diffuse moisture through the
solid outer crust. This activation energy is specific to each material being dried, making this
approach ideal for materials that have already been researched extensively (Woo et al. 2008;
Woo, Mujumdar, and Daud 2010; Mezhericher, Levy, and Borde 2010; Chen and Lin 2005).
Deterministic analytical models simultaneously solve continuity, momentum, energy, and
species conservation differential equations with initial and boundary conditions determined by
droplet properties and drying conditions (Mondragon et al. 2013). These models accurately
reflect experimental data, at the cost of greater complexity than the CDC or REA models. This
complexity is due to the moving boundaries of the shrinking droplet surface and the interface
between the wet core and solid crust, as well as the required knowledge of parameters such as
particle porosity, thermal and mass diffusivity of droplets, and critical moisture content
(Mezhericher, Levy, and Borde 2010; Mondragon et al. 2013). Due to the complexity of these

17
models and the computational resources required to use them, the CDC or REA models are
utilized for most applications.
A common heat transfer model is typically used for droplet temperature regardless of the
moisture content model, following the form (Woo et al. 2008):
𝑚𝑐𝑝
𝑑𝑇𝑑
𝑑𝑡= ℎ𝐴(𝑇𝑎 − 𝑇𝑑) − ∆𝐻𝑒𝑣𝑎𝑝𝑚𝑠
𝑑𝑋
𝑑𝑡 (6)
where m is the mass of the droplet, cp is the specific heat of the droplet material, Td is the droplet
temperature, t is time, h is the heat transfer coefficient, A is the droplet surface area, Ta is the air
temperature, Td is the droplet temperature, ΔHevap is the latent heat of vaporization of water, ms is
the mass of solids in the droplet, and X is the moisture content of the droplet.
This model assumes a homogeneous temperature profile throughout the droplet. The heat
and mass transfer coefficients used in the heat transfer or drying rate models are calculated using
the Ranz-Marshall correlations (Woo et al. 2008):
𝑁𝑢 = 2 + 0.6𝑅𝑒12𝑃𝑟
13 (7)
𝑆ℎ = 2 + 0.6𝑅𝑒12𝑆𝑐
13
(8)
where Nu, Re, Pr, Sh, and Sc are the Nusselt, Reynolds, Prandtl, Sherwood, and Schmidt
numbers, respectively.
While droplet drying models follow these general methods, usage of each model can vary
in complexity based on the assumptions that are made, as well as the initial and boundary
conditions applied to the droplets and their environments. Several of these assumptions are
commonly used in droplet drying kinetics modeling to simplify calculations and reduce
computational resource requirements. One such common assumption is temperature
homogeneity within the droplet. This assumption is based on the Biot number for drying droplets

18
being very small (< 0.1) due to the diameter of a droplet generally being in the range of 50-150
µm (Chen 2005; Chen and Peng 2005). This assumption significantly simplifies the modeling
process at the cost of differentiating the temperature profile between the wet core and solid crust.
Another common assumption is homogeneous moisture content throughout individual droplets.
While using this assumption is not accurate for droplets that contain a wet core and solid crust, it
opts to use the average moisture content of a droplet in order to simplify the modeling process
(Chen and Patel 2007; Che and Chen 2010; Chen 2008; Chen and Lin 2005).
2.2.2. Experimental methods and results
Although much of droplet drying modeling is theoretical, there have been numerous
attempts at understanding droplet drying kinetics experimentally. Three main methodologies
have been used for experimental single droplet drying studies: free-falling droplets in a tower,
droplets suspended in air using aerodynamic or acoustic fields, and droplets suspended on the tip
of a filament (Fu, Woo, and Chen 2012). Of these, the most commonly used for accurate
measurement of temperature and moisture content changes during droplet drying is the filament
method.
Charlesworth and Marshall (1960) developed a methodology using the filament method,
which was later used and modified in multiple studies on droplet drying (Cheong, Jeffreys, and
Mumford 1986; Charlesworth and Marshall 1960; Lin and Chen 2002; Che and Chen 2010).
These studies involve suspending a slurry droplet on a filament within a chamber that supplies
hot drying air. A thermocouple is placed inside the filament to measure the droplet core
temperature while drying. The droplet’s mass change during drying is measured based on the
change in the filament’s deflection compared to a standard curve of known weights, and this
change in mass of water within the droplet can then be correlated with the moisture content of

19
the droplet. Physical restrictions based on the size of the filament require the droplet diameter to
be ~1.5 mm or larger, which is substantially larger than droplets created by spray dryer
atomizers. However, this methodology allows for simultaneous collection of temperature and
moisture content data during droplet drying, which is highly valuable for the advancement of
droplet drying modeling. In this study, droplets containing inorganic salts similarly showed
distinct periods of constant temperature, while droplets containing coffee extract had smooth
temperature curves without stalling at the wet bulb temperature, indicating only one drying
period (Charlesworth and Marshall 1960). This supports the commonly used assumption that
dissolved solutions of food products have very short or nonexistent constant rate drying periods.
Cheong, Jeffreys, and Mumford (1986) used the filament method to observe the
temperature and moisture content characteristics of drying droplets containing suspended sodium
sulfate decahydrate at various air temperatures (Cheong, Jeffreys, and Mumford 1986). The core
temperature results at various drying air temperatures showed a general trend – upon exposure to
air drying, droplets initially cooled to the wet bulb temperature. Droplet temperature then rose to
the melting point of sodium sulfate decahydrate (~33°C), at which point the core temperature
dropped due to absorption of heat by the crystal. Core temperature then rose again, plateauing at
the drying air temperature. These results are similar to the trend found by Charlesworth and
Marshall for droplets containing suspended inorganic materials (Charlesworth and Marshall
1960).
Lin and Chen (2002) used a modified version of this methodology to study the drying
kinetics of milk droplets (Lin and Chen 2002; Chen and Lin 2005). The system was modified by
adding a camera to measure the change in droplet weight based on deflection of the filament, as
well as the change in droplet diameter during drying. The droplets observed in this study were of

20
similar diameter to the previous study (~1.5 mm) but showed substantially different trends in
droplet temperature during drying. While droplets containing insoluble solids displayed distinct
drying periods (droplet core temperature plateaued at the wet-bulb temperature, dropped at
melting point of solute, then finally plateaued at air temperature), droplets containing dissolved
solids displayed smooth sigmoidal curves from wet bulb to ambient air temperature, without
indication of temperature plateaus during drying. This finding also agrees with the results of
Charlesworth and Marshall (Charlesworth and Marshall 1960). When comparing the fit of the
REA and CDC models to the experimental data collected in this study, the REA had an overall
better fit at the cost of increased knowledge required regarding the activation energy for each
material tested.
Adhikari, Howes, Bhandari, and Troung (2003) used the glass filament method to
observe temperature and moisture profiles as well as stickiness properties of drying droplets
containing carbohydrates and organic acids (Adhikari et al. 2003). This data was used by Woo et.
al (2008) to compare the accuracy of the CDC and REA models (Woo et al. 2008). The results
showed that the CDC model overestimated the drying rate of the droplets in the experimental
data by inaccurately following a linear drop in drying rate during the falling rate period. A
modified CDC model was proposed to better fit the drying rate curve, which added a shape
parameter to the evaporation hindering factor to allow for a nonlinear change in the drying rate
during the falling rate period:
𝑓 = [𝑋 − 𝑋𝑒𝑞
𝑋𝑐𝑟 − 𝑋𝑒𝑞]
𝑛
, 𝑋 ≤ 𝑋𝑐𝑟 (9)
where f is the dimensionless moisture content, X, Xeq, and Xcr are the moisture content,
equilibrium moisture content, and critical moisture contents of the droplet, respectively, and n is
the evaporation hindering shape factor.

21
Using this modified model, the drying rate change will be convex if n is less than 1, and
concave if n is greater than 1. This parameter should be fit for each material, but it was theorized
that convex falling rates are suitable for materials that form a solid crust due to their increased
inhibition of vapor diffusion as the crust thickens. This modified model had a better fit to the
experimental data as compared to the standard CDC model, and was comparable to the accuracy
of the REA model.
2.2.3. Theoretical methods and results
Droplet drying models have also been used extensively for theoretical purposes. This
research is largely used to incorporate droplet drying information into computational fluid
dynamics (CFD) models of spray drying systems.
Woo et. al. (2008) used CFD simulation of a spray drying system to compare the
characteristics of three droplet drying models: CDC, modified CDC, and REA (Woo et al. 2008).
The results indicated that the CDC and REA models were similar, while the modified CDC
model was different from the other models in terms of final moisture content. However, these
were only comparisons between the characteristics of the models and cannot be validated, as no
experimental data for the drying curve of droplets this size (19.2 – 65.8 µm) was collected. In
addition, these simulations revealed that varying ambient conditions in specific regions of the
dryer (air temperature, velocity, and humidity) had little effect on the drying curves of droplets
traveling through the dryer.
Mezhericher, Levy, and Border (2015) utilized the CDC drying model in various CFD
simulations to study drying properties of droplets containing a silica suspension such as particle
residence time, temperature, and moisture content as a factor of particle diameter, as well as
droplet-droplet and particle-particle collisions during the drying process (Mezhericher, Levy, and

22
Borde 2015). These models estimate that spray dried silica droplets experience an average
residence time ratio of approximately 3:1:12 for each drying period. This means that a theoretical
silica droplet with a particle residence time of 16 s would spend 3 s in the constant rate drying
period, 1 s in the falling rate drying period, and 12 s as a dry particle at equilibrium moisture
content before exiting the drying chamber. The notably long period of time spent at equilibrium
moisture was not observed in previous particle residence time studies. This ratio is likely not
entirely accurate for particles containing a dissolved solid solution, however, based on the very
short or nonexistent first drying period observed in experimental drying data of these particles.
Jaskulski, Wawrzyniak, and Zbicinski (2015) created a three-dimensional CFD model of
a spray dryer using the CDC method to predict agglomeration in maltodextrin and detergent
particles (Jaskulski, Wawrzyniak, and Zbicinski 2015; Jaskulski, Wawrzyniak, and Zbiciński
2018). The Guggenheim-Anderson-de Boer (GAB) model was used with previous experimental
data to determine the equilibrium moisture content in the maltodextrin study. The CDC model
showed good agreement with experimental data for particle moisture content of both products.
2.2.4. Conclusions
Overall, both the CDC and REA methods have been shown to fit well to experimental
data and appear to be good options for modeling droplet drying during spray drying. Previous
use of these models suggests that the REA method is preferred for products with properties that
are well understood and have been extensively researched, while the CDC requires less prior
knowledge of a product’s properties for acceptable use. The largest problem with validation of
these models is the lack of experimental drying data for droplets on the scale of spray dried
droplets (~50-150 µm), due to the difficulty of creating and measuring the properties of such
small droplets.

23
Several useful assumptions have been used in droplet drying models for particles made
up of dissolved food solids, such as the assumption of homogeneous temperature and moisture
content within a particle, and the assumption that food droplets begin the drying process at their
critical moisture content and do not have a constant rate drying period. These assumptions can
greatly simplify the modeling process for food droplet drying.
Droplet drying models combined with CFD modeling can provide valuable estimations of
droplet properties like residence time, moisture content, and temperature at all times during the
spray drying process. Such properties would be difficult or impossible to measure to the same
degree using experimental methods. However, these results should be validated using the closest
possible experimental results.
2.3. Bacterial Inactivation Modeling
2.3.1. Introduction
Bacterial inactivation models have been extensively researched in the food safety field to
predict the survival of pathogenic bacteria for various processing techniques and environmental
conditions. Inactivation models relate the survival of bacteria within a food to the critical
parameters of that food and the environment. These models are represented as primary models,
which determine bacterial inactivation over time, and secondary models, which determine the
effect of processing condition variables (temperature, moisture content, surface moisture, etc.) on
the inactivation rate parameter in the primary model. Bacterial inactivation rate is often described
using decimal reduction times (or D-values) and z-values. D-values are defined as the time
required for a 1-log (or 90%) reduction in bacterial population at a given condition, while z-
values are defined as the change in a processing condition required for a 1-log change in D-
value. Z-values have been estimated in previous secondary models for various processing

24
conditions, such as treatment temperature, moisture content, water activity, and surface moisture
(Jeong, Marks, and Orta-Ramirez 2009; Casulli 2016).
Important variables within a food or its environment that have been researched for their
impact on bacterial inactivation include treatment temperature, water activity (aw), and humidity
(Jeong, Marks, and Orta-Ramirez 2009; Casulli 2016; Farakos, Frank, and Schaffner 2013;
Mattick et al. 2001). Developing and validating these models allows food processors to better
understand their process and be confident in the safety of the food being produced.
Since the final moisture content of spray dried foods is generally very low (~2-5% wet
basis), the final product can be classified as a low-moisture food powder. Other low-moisture
foods that have been researched for bacterial inactivation modeling include almonds
(Limcharoenchat, James, and Marks 2019; Jeong, Marks, and Orta-Ramirez 2009; Villa-Rojas et
al. 2013), pistachios (Casulli 2016), wheat flour (Smith et al. 2016), and milk powder (Lian et al.
2015), among many others. However, because the beginning product is a liquid solution, spray
drying involves highly dynamic moisture and is unique from many other low-moisture
processing techniques.
2.3.2. Spray drying inactivation studies
Research related to bacterial inactivation during low-moisture food processing is active
and has produced an extensive understanding of processes such as dry roasting, oil roasting,
blanching (Almond Board of California 2017), steaming (Chang et al. 2010; Cenkowski et al.
2007), chemical immersion (DiPersio, Kendall, and Sofos 2004), gas treatment (Almond Board
of California 2008; Oztekin, Zorlugenc, and Zorlugenc 2006), and irradiation (Jeong et al. 2012;
Osaili et al. 2008; Prakash et al. 2010; Cuervo, Lucia, and Castillo 2016; Karagoz, Moreira, and
Castell-Perez 2014). However, research on the safety of the spray drying process is scarce, and

25
there is much still unknown about bacterial survival during the process. Nevertheless, the
research that has been conducted related to the survival of bacteria during spray drying will be
reviewed in the following section.
LiCari and Potter (1970) studied the survival of multiple strains of Salmonella during
spray drying and storage of skim milk powder (LiCari and Potter 1970a; LiCari and Potter
1970b). Pasteurized and condensed skim milk was inoculated with Salmonella and dried in a co-
current pilot-scale spray dryer equipped with a pneumatic nozzle. The controlled conditions of
drying included outlet air temperature (set at 65.6, 93.3, and 121.1°C) and particle size controlled
by the atomization air pressure (set at 5.27, 7.03, and 8.79 kg/cm2). Reduction in bacteria was
quantified in the dried milk as colony forming units per gram of powder (CFU/g), and was found
to be within the range of 0.6-4.9 log, depending on the drying conditions and bacterial strain
used. Increased temperature proportionally reduced Salmonella, but the dried particle size had no
significant effect on bacterial reduction. While significant reductions were observed for all
drying conditions, no conditions were able to eliminate Salmonella.
The treated milk powders were also stored at varying temperatures (25, 35, 45, and 55°C)
for up to 8 weeks to determine the long-term survival of Salmonella. Rapid death was observed
during the first two weeks of storage, with a reduced rate observed afterwards. In this study,
Salmonella was recovered after 8 weeks of storage regardless of storage conditions.
Miller, Goepfert, and Amundson (1972) completed a similar study on the survival of both
Salmonella and E. coli during spray drying of skim milk, whole milk, whey, whole egg, egg
white, egg yolk, and Torula yeast (Miller, Goepfert, and Amundson 1972). These products were
inoculated with bacteria and dried in a portable spray dryer equipped with a rotary atomizer at
various inlet air temperatures (165 and 225°C, giving 93 and 67°C outlet air temperature,

26
respectively). The dried powders were then collected for enumeration of surviving bacteria. Skim
milk showed a similar reduction in Salmonella compared to the previous study, with spray
drying achieving 1.1-6.0 log reductions depending on the drying conditions and bacterial strain.
Higher temperatures resulted in significantly lower moisture content in the powdered product, as
well as greater reduction of Salmonella. Whey powder had very similar survival to skim milk
after spray drying at 225°C (3.5 and 3.3 log reductions, respectively).
Doyle, Meske, and Marth (1985) completed a similar study on the survival of Listeria
monocytogenes in nonfat milk during spray drying and subsequent storage (Doyle, Meske, and
Marth 1985). Skim milk was inoculated with L. monocytogenes and spray dried in a portable
spray dryer at an inlet air temperature of 165°C (outlet air temperature of 67°C). The dried milk
was collected, enumerated for surviving Listeria, and additional treated samples were stored for
up to 16 weeks at 25°C. The results showed an approximate 1-1.5 log reduction in L.
monocytogenes due to spray drying, lower than the reduction of E. coli or Salmonella in skim
milk under similar drying conditions (LiCari and Potter 1970a; Miller, Goepfert, and Amundson
1972). Both strains tested decreased by > 4 logs after 16 weeks at room temperature.
Arku et. al (2008) studied the survival of Cronobacter sakazakii during the spray drying
of powdered infant formula (Arku et al. 2008). Reconstituted skim milk was inoculated with high
and low concentrations of Cronobacter sakazakii (~7 and 2 log CFU/g solids, respectively),
spray dried at an outlet temperature of 90°C, with the resulting powder sampled for survivors.
Results showed that while the bacterial population significantly decreased (~2.5 log CFU/g
solids), surviving Cronobacter was found in all milk powder samples that were inoculated at the
high concentration, and in some samples inoculated at the low concentration. These results are

27
similar to previous studies for spray dried products, and it was emphasized that introduction of
Cronobacter into the spray drying process must be avoided.
In addition to research on pathogenic bacterial survival during spray drying, a significant
amount of research has been conducted on the retention of beneficial microorganisms and
bioactive materials during spray drying. These materials include various drugs, nutraceuticals,
biochemicals, and biologically active materials such as enzymes, proteins, antibodies, and
vitamins, which are commonly spray dried to preserve their activity for a longer shelf-life at low
cost (Chen and Patel 2007; Huang et al. 2017). While the goal of spray drying these materials is
to preserve as much of the microbial viability as possible, the results found from these studies
can still be applied to pathogen inactivation and the field of food safety (Goderska and Czarnecki
2008).
Lievense et. al. (1990) assessed the inactivation of Lactobacillus plantarum during
fluidized bed drying by incorporating a drying kinetics model with a thermal inactivation model
(Lievense et al. 1990). The results of the study showed that inactivation of L. plantarum was due
mainly to dehydration during the initial constant rate drying stage. In the falling rate stage, when
temperature increases rapidly above the wet bulb temperature, thermal inactivation becomes
more impactful than dehydration. Thus, a model was created that determined the inactivation rate
constant for L. plantarum at each time step of drying based on the temperature and moisture
content of the fluid. The model parameters were fitted using experimental data on the
inactivation of L. plantarum under various drying conditions. Although this model worked well
with fluidized bed drying, its application to droplet drying during the spray drying process is
limited.

28
Li et. al (2006) created a probiotic bacteria inactivation model for use in single droplet
drying (Li et al. 2006). This model describes the inactivation of microorganisms with first-order
reaction kinetics, using the form:
𝑑(𝑁/𝑁0)
𝑑𝑡= −𝑘𝑑(𝑁/𝑁0) (10)
where N is the bacterial load, N0 is the initial bacterial load, t is time, and kd is the inactivation
rate constant.
In this equation, the inactivation rate constant kd is temperature dependent according to
the Arrhenius equation:
𝑘𝑑 = 𝑘0exp (−𝐸𝑑
𝑅𝑇) (11)
where kd is the inactivation rate constant, k0 is the reference inactivation rate constant, Ed is the
inactivation energy, R is the universal gas constant, and T is the temperature.
In addition to temperature dependency, the droplet’s current moisture content is
incorporated into the calculation of the inactivation rate constant by using the following equation
(Meerdink and VantRiet 1995):
𝑘𝑑 = 𝑘0exp (𝑎𝑋 −𝐸𝑑 + 𝑏𝑋
𝑅𝑇) (12)
where kd is the inactivation rate constant, k0 is the reference inactivation rate constant, a and b
are fitting parameters, X is the droplet moisture content, Ed is the inactivation energy, R is the
universal gas constant, and T is the temperature.
This model was fitted to experimental data for milk droplet drying at air temperatures of
70, 90, and 110°C using the filament method. These droplets were inoculated with
Bifidobacterium infantis or Streptococcus thermophilus, and survivors were enumerated after the
droplets were dried. Since Eq. (12) fit the bacterial survival data poorly, additional parameters

29
were added to the model in order to make the inactivation rate constant dependent on the drying
rate and/or heating rate (Chen and Patel 2007; Li et al. 2006). The following equations were
formed:
𝑘𝑑 = 𝑘0 (1 + 𝑏 ∙ |𝑑𝑋
𝑑𝑡| ) exp (−
𝐸𝑑
𝑅𝑇) (13)
𝑘𝑑 = 𝑘0 (1 + 𝑎 ∙ |𝑑𝑇
𝑑𝑡| ) ∙ (1 + 𝑏 ∙ |
𝑑𝑋
𝑑𝑡| ) exp (−
𝐸𝑑
𝑅𝑇) (14)
𝑘𝑑 = 𝑘0 (1 + 𝑎 ∙ |𝑑𝑋
𝑑𝑡| + 𝑏 ∙ |
𝑑𝑋
𝑑𝑡|
2
) exp (−𝐸𝑑
𝑅𝑇) (15)
where kd is the inactivation rate constant, k0 is the reference inactivation rate constant, a and b
are fitting parameters, X is the droplet moisture content, t is time, Ed is the inactivation energy, R
is the universal gas constant, and T is the temperature.
These equations for inactivation can be coupled with heat and mass transfer equations to
determine the inactivation rate at any given temperature, heating rate, moisture content, and
drying rate condition within a droplet. These models were fitted to the previously mentioned
bacterial survival data and compared to see which model had the best fit. Based on this approach,
Eq. (15), which included parameters for changing drying rate, had the best overall fit. The
parameter for heating rate added in Eq. (14) did not significantly improve the fit of the model, so
it was ignored. For the two probiotic bacteria strains tested, the most relevant parameters for
modeling inactivation were droplet temperature and drying rate.
While some research has been done on bacterial survival during the spray drying process,
there is still much unknown. All previous studies involving pathogenic bacterial inactivation
have been concerned only with the survival of bacteria in the final powdered product after
drying, but little is known about the survival of bacteria remaining within the spray dryer.
Additionally, no attempt has been made to combine pathogenic bacterial inactivation modeling

30
with droplet drying kinetics modeling, which would be highly relevant for ensuring spray drying
safety.
2.3.3. Low-moisture inactivation studies
As described in the previous section, droplet temperature, heating rate, moisture content,
and drying rate have been the most researched variables studied for their effect on bacterial
inactivation during spray drying. Other variables such as water activity, process humidity,
surface moisture, and food composition have been researched in laboratory settings and found to
have significant effects on bacterial inactivation in low-moisture foods (Jeong, Marks, and Orta-
Ramirez 2009; Smith et al. 2016). Therefore, a review of the understanding of each of these
variables is important to determine their applicability to modeling bacterial inactivation during
spray drying.
Water activity is defined as the ratio of vapor pressure of water in a food to vapor
pressure of pure water, and foods with water activity below 0.85 are generally considered to be
low-moisture foods (Beuchat et al. 2013; Caurie 2011). Water activity is an important factor in
bacterial growth and survival, and growth of Salmonella has been found to be inhibited below
water activity of ~0.92 (Stencl 1999). Though inhibited under these conditions, Salmonella is
capable of surviving 8 weeks or longer in low-moisture foods (Lian et al. 2015; Farakos, Frank,
and Schaffner 2013). Additionally, its thermal resistance has been found to increase with
decreasing water activity in a variety of low-moisture foods. Studies using multiple Salmonella
serovars (Mattick et al. 2001), Salmonella in whey protein powder, non-fat dry milk, peanut
meal, cocoa powder, and wheat flour (Farakos, Frank, and Schaffner 2013), and Salmonella in
almond kernel flour (Villa-Rojas et al. 2013) all found that thermal resistance increased
significantly with decreasing water activity under isothermal conditions. Thermal resistance of

31
Salmonella in powdered foods is extremely high at water activities of 0.2 and below (Archer et
al. 1998). This is in the lower range of water activity that spray dried powders reach during
drying, so even though they begin the process as a liquid at very high water activity, this
information is relevant for spray dried powders (Stencl 1999).
Dynamic moisture conditions of a food product can also influence bacterial inactivation
rates. Models that take complex moisture phenomena (surface moisture content, pre-treatment
desiccation rate, drying rate) into account can significantly improve the accuracy of previous
models that only consider overall moisture content of a food product. Jeong, Marks, and Orta-
Ramirez (2009) created a bacterial inactivation model with an added parameter to account for
surface moisture rather than overall moisture content of almonds being roasted in a moist-air
convection oven (Jeong, Marks, and Orta-Ramirez 2009). Smith and Marks tested the effect of
rapid desiccation (0.6 to 0.3 aw) and hydration (0.3 to 0.6 aw) just before isothermal treatment on
thermal resistance of Salmonella in wheat flour (Smith and Marks 2015). Neither desiccation nor
hydration had a significant effect on thermal resistance. However, these results may not be
applicable to spray drying as droplets begin the drying process at a much higher water activity
than 0.6, and the desiccation process occurs during treatment in spray drying as opposed to
before treatment as in this study. As mentioned previously, Li et. al. found that a model
containing droplet drying rate (15) had a better fit to experimental data of milk drying (Li et al.
2006). The spray drying of droplets yields highly dynamic moisture conditions during both the
constant and falling drying rate stages. Therefore, the impact of dynamic moisture conditions on
thermal resistance of Salmonella will likely play a large role in the modeling of Salmonella
inactivation during spray drying.

32
Solids content of liquid foods should also be considered for potential effects on
inactivation of Salmonella. Increased solids content has been shown to increase Salmonella’s
resistance to thermal inactivation in milk concentrates at isothermal conditions (Dega,
Amundson, and Goepfert 1972). This is likely correlated with the effect of increased resistance at
low moisture, as a higher solids content in the feed solution will lead to lower overall moisture
content in the milk. Because liquids intended for spray drying frequently undergo an evaporation
process to concentrate the solids within the liquid, understanding the effect that the solids content
has on moisture content and bacterial resistance could be beneficial (Kuye et al. 2009).
2.3.4. Surrogate organisms
Surrogate organisms are non-pathogenic organisms with similar characteristics to a
pathogen of concern. In research involving bacterial inactivation, this means that a surrogate
organism has similar inactivation kinetics to the pathogen, and so it can be used to predict the
inactivation of the pathogen in various processes. Once an organism has been determined to be a
suitable surrogate for a pathogen, food manufacturers can validate their processes by introducing
the surrogate into a product, determining its survival through the process, and finally predicting
the survival of the pathogen of concern based on the survival of the surrogate. This way the
manufacturer never has to purposefully contaminate their process with a pathogen, which would
cause major safety risks (Kopit et al. 2014).
Enterococcus faecium (E. faecium) is a commonly used surrogate organism for
Salmonella Enteritidis phage type 30 (SE PT30) in low-moisture foods due to its similar thermal
tolerance (Kopit et al. 2014). Its inactivation kinetics and suitability as a surrogate have been
tested in several low-moisture food products, including almonds (Jeong, Marks, and Ryser
2011), pet food (Ceylan and Bautista 2015), and an extruded meal mixture (Bianchini et al.

33
2014). While E. faecium has been determined to be a suitable surrogate for Salmonella in a
variety of similar food products and processes, it should still be validated for its applicability to
spray drying before it is implemented in a commercial process.
2.3.5. Conclusion
Many models are available to predict bacterial inactivation for various microbial reduction
processes. Each model has pros and cons, and model selection is an important step in accurately
predicting bacterial inactivation during droplet drying. While there are many factors that can
impact bacterial inactivation during spray drying, the literature has indicated a few critical
variables related to droplet conditions: droplet temperature, heating rate, moisture content, and
drying rate. By fitting a model containing these variables to experimental inactivation data, the
optimal model for predicting inactivation in a drying droplet can be developed.
2.4. Summary
Spray drying is an efficient and unique food manufacturing technology, but its efficacy for
pathogenic bacterial inactivation is not fully understood. While knowledge about spray dryer
design and operation allows for a general understanding of the process, dryer properties can
differ greatly and will have a large impact on drying conditions that should be evaluated for each
unique process. Similarly, while bacterial inactivation during various processes has been well-
researched, the survival and inactivation of bacteria during the spray drying process has some
significant knowledge gaps. Understanding these inactivation kinetics through a combination of
both bacterial inactivation and droplet drying modeling can lead to an integrated model that
predicts the inactivation of pathogens during spray drying. Such a model can be used to improve
dryer design, operation, and safety of spray dried foods.

34
3. MODELING BACTERIAL INACTIVATION KINETICS DURING THIN-FILM
DRYING OF SOY PROTEIN POWDER SOLUTION
3.1. Introduction
Obtaining data for bacterial inactivation as a function of drying time and temperature is the
first step in developing a complete process model for predicting bacterial survival in a spray
drying system. However, due to the complexity of the spray drying process, it is not feasible to
locate and retrieve particles of specific residence times while the system is running. Therefore, a
simulated spray drying process that can be more easily controlled and accessed during operation
is imperative to collect such data. In this study, a convection oven was used to simulate spray
drying conditions, such as air temperature, humidity, and velocity. Samples of droplets
inoculated with Salmonella were placed inside the oven for specified times under controlled
conditions to obtain data representing bacterial inactivation during drying. This simulation
attempted to replicate the conditions of an actual spray drying process experienced by a droplet,
with the inactivation data collected representing inactivation within droplets during spray drying.
3.2. Objectives
The objective of this study was to quantify the inactivation kinetics of Salmonella under
simulated spray drying conditions.
3.3. Materials and Methods
3.3.1. Spray dryer air temperature measurement
To determine proper treatment temperatures for the spray dryer simulation, the air
temperature profile within a pilot-scale spray dryer was measured during operation. These
measurements were carried out using an FT80 Tall Form Spray Drier (Armfield Inc., Clarksburg,
NJ) (Figure 2). This dryer includes an air heater that supplies inlet air at temperatures in the

35
range of 25-250°C. Air pressure within the drying chamber was controlled by both the inlet and
exhaust fans, which were set to constant speeds to maintain a slight negative pressure in the
drying chamber (0 to -1 mbar). A pneumatic nozzle was used to atomize feed droplets from the
top of the drying chamber in a co-current manner. The compressed air in the nozzle used to
atomize the liquid feed in the nozzle was set to 0.8 bar for all experiments, giving an average
droplet diameter of ~55 µm in a hollow cone arrangement (DeMaria 2019). This nozzle was
surrounded by a shield that allowed inlet air to enter the main drying chamber in an annular
fashion around the nozzle. Sensors built into the dryer measured and displayed the current inlet
and exhaust air temperatures, exhaust air relative humidity, chamber air pressure, and differential
air pressure between the cyclone and chamber.
Figure 2. FT80 Tall-form Spray Drier housed in the Biosafety Level 2 pilot plant facility at
Michigan State University.

36
This dryer was fitted with an ultra-low flow variable-flow peristaltic pump (Cole-Parmer,
Vernon Hills, IL) to pump the liquid concentrate into the dryer nozzle. The variable speed on the
pump was set to 38 on a scale from 0-100, which provided a flow rate of ~10 mL/min to the
nozzle. This low speed was chosen to allow for maximum drying while maintaining a steady
stream into the nozzle.
Three K-type thermocouples were taped to the drying chamber walls of the pilot-scale
spray dryer at distances of 7, 45, and 90 cm from the chamber ceiling. The spray dryer was then
operated at an inlet air temperature 180, 200, and 220°C (±1°C) using filtered water as the drying
medium with a feed rate of ~10 mL/min and nozzle pressure of 0.8 bar. These conditions
replicate those used in the pilot-scale spray drying study (chapter 5), with the exception of using
water instead of soy protein isolate (SPI) solution, which was done to prevent powder deposition
on the thermocouples that could cause errors in data collection. The dryer was run under these
conditions for 20 min, which was sufficiently long for the temperature to stabilize, with
measurements recorded every 2 s. Data from the final 200 s of each inlet air temperature were
used for statistical analysis, as the air had reached equilibrium and represents the conditions of
the dryer after the appropriate warm-up period.
3.3.2. Materials and properties
Salmonella Enteritidis Phage Type 30 was chosen for all experiments because of its
frequent usage in many low-moisture food safety studies (Smith and Marks 2015; Cuervo, Lucia,
and Castillo 2016; Limcharoenchat et al. 2018; Shachar and Yaron 2006; Limcharoenchat,
James, and Marks 2019; Danyluk, Uesugi, and Harris 2005). This strain was originally obtained
from Dr. Linda Harris (University of California – Davis) and kept in vials at -80°C in Tryptic
Soy Broth (TSB) (Difco, Becton Dickinson, Sparks, MD) containing 20% glycerol. After two

37
24h/37°C transfers in TSB, this strain was used to inoculate unflavored SPI (NOW Foods,
Bloomingdale, IL), which was stored at 4°C in a sealed canister.
A 10% w/w SPI slurry was created by adding 90 mL of water to 10 g of unflavored SPI
and blended in a laboratory blender (Waring, Torrington, CT) for 5 min (Figure 3). This was
done to create a slurry similar to the liquid feed used in industrial spray drying (Miller, Goepfert,
and Amundson 1972). The slurry was then stirred at 200 RPM on a stir plate for 24 h to fully
hydrate the protein, resulting in a more homogenous mixture without phase separation (Tang and
Li 2013). On the day of testing, 6 mL of the inoculated TSB culture (~109 CFU/mL) was
pipetted into the slurry and stirred at 200 RPM for 5 min to achieve a population of ~107
CFU/mL).
Figure 3. Separation of a 10% w/w soy protein isolate (SPI) solution into watery and paste-like
phases after blending.

38
3.3.3. Lab-scale oven simulation
For each sample, 0.04 mL of inoculated SPI slurry was pipetted onto the surface of a
nylon mesh filter disc (25 mm disc diameter, 160 µm mesh opening size, 43% open area, 109
mesh count, 80 µm thread diameter, part number CMND-160) (Component Supply Company,
Sparta, TN) and spread using a plastic spreader to allow maximum absorption into the mesh
openings. This amount of inoculum completely filled the voids in the mesh with minimal extra
inoculum. Therefore, the disc can be considered a single layer of droplets of inoculated SPI
slurry with a diameter equal to the void size (160 µm), which approximates the size of a droplet
formed by a pneumatic nozzle atomizer used in spray drying. The disc was placed on a small
wire rack and clipped into place to allow maximum contact between the air and disc (Figure 4).
Treatment was carried out in a lab-scale, computer-controlled, moist-air convection oven
under controlled temperature and air velocity conditions. Humidity was not controlled by steam
injection for this experiment, as the humidity conditions within the oven (<1% relative humidity)
were similar to those inside the pilot-scale spray dryer used in chapter 5. The disc and cage were
placed into a lab-scale convection oven with the surface of the disc parallel to the direction of
airflow for the treatment time (0-60 s), attempting to replicate the conditions experienced by
drying droplets with varied residence times (Figure 5).

39
Figure 4. Nylon mesh on a wire rack before inoculation and drying in a convection oven (top),
side view cross-section representation of droplets suspended in a single-layer within the nylon
mesh (bottom).

40
Figure 5. Nylon mesh attached to wire rack placed inside a convection oven sampling port.
Arrows indicate the direction of heated airflow.
After heating, the disc was removed from the oven and placed into a plastic bag
containing 4 mL of chilled 0.1% buffered peptone water (BPW) (Difco) to rapidly chill the disc
and prevent any further bacterial inactivation. Bags were then sonicated for 2 min to recover the
bacteria (FS30, Fisher Scientific, Waltham, MA), serially diluted, and plated on modified Tryptic
Soy Agar (Difco) supplemented with 0.6% (w/v) yeast extract (Difco), ferric citrate (0.05%)
(Sigma Aldrich, St. Louis, MO), and sodium thiosulfate (0.03%) (Sigma Aldrich), also known as
mTSA. After 48 h of incubation at 37°C, all black colonies were counted as Salmonella (Jeong,
Marks, and Orta-Ramirez 2009). After the experiment, meshes were sanitized by immersion in a
75% ethanol solution for 30 min before reuse.

41
Initial temperature conditions for the convection oven were set at 180, 190 or 200°C
(referred to as high temperature treatments) with treatment times of 0, 5, 10, 15, 20, and 25 s.
These temperatures were chosen because they are common inlet air temperatures used in spray
drying (Armfield Engineering Teaching Equipment 2013; LiCari and Potter 1970a; Tang and Li
2013). However, as discussed in section 2.1.3, air temperature rapidly drops upon entering the
drying chamber. This lower temperature air is the environment to which drying droplets are
exposed in the drying chamber, so these high temperature treatments do not accurately describe
the environment for such droplets. To account for this, a second experiment was conducted with
oven temperatures set at 80, 95 and 110°C (referred to as low temperature treatments) and
extended treatment times of 0, 10, 20, 30, 40, 50, and 60 s in order to achieve meaningful
inactivation for modeling purposes. These temperatures were chosen based on the results
discussed in section 3.4.1.
3.4. Results and Discussion
3.4.1. Spray dryer chamber temperature results
While the inlet air temperatures used in this study were in the range of 180-220°C, air
temperatures inside the drying chamber were substantially lower (Table 1). Drying chamber
temperatures with inlet air temperatures of 180-220°C were 98-136°C, depending on the location
within the chamber. Differences in inlet air temperatures created proportionally smaller
differences in air temperature within the dryer. Thus, a 40°C difference in inlet air temperature
(between 180°C and 220°C inlet air temperature) led to a ~28°C difference in air temperature
within each location in the drying chamber. This temperature drop is due mostly to evaporative
cooling due to droplet drying, as well as environmental heat loss through the chamber walls. The
magnitude of the drop between the inlet and outlet temperatures observed in this dryer is similar

42
to that found in previous studies that compared inlet and outlet air temperatures of portable and
pilot-scale spray dryer units (LiCari and Potter 1970a; Doyle, Meske, and Marth 1985; Miller,
Goepfert, and Amundson 1972; Birchal et al. 2006).
The general trend between chamber locations shows that air temperature is lowest at the
top of the drying chamber and increases moving downward in the chamber. This was as expected
since the greatest amount of evaporative cooling occurs where the nozzle meets the inlet air, near
the top of the chamber. Variability in temperature at each location was small, indicating that
regions of air temperature are constant. While the drying chamber is the most important area
within the spray dryer for temperature profiling, further experimentation could be done to
measure air temperature in each relevant location within the dryer (primary/secondary collector,
cyclone, exhaust).
Table 1. Average drying chamber air temperature (°C ± standard deviation) measured at 7, 45,
and 90 cm from the chamber ceiling (top, middle, bottom, and average of entire chamber,
respectively) during normal spray drying operation at inlet air temperatures (Tinlet) of 180, 200,
and 220°C.
TInlet Top Middle Bottom Average
180 98.7 ± 1.3A* 105.0 ± 1.5B 108.3 ± 1.9C 104.0 ± 4.3
200 114.7 ± 1.1A 119.6 ± 1.6B 123.4 ± 1.3C 119.3 ± 3.8
220 126.3 ± 2.3A 132.3 ± 1.7B 136.0 ± 2.1C 131.6 ± 4.5
*Within a row, means with common superscript letters were not significantly different (α =
0.05).
These results show that droplets experience constantly changing air temperatures while
the air currents carry droplets within the drying chamber. Because of this, tracking air

43
temperature around a droplet to predict bacterial inactivation over time is difficult without a
complex CFD model.
The low-temperature treatment was carried out using oven temperatures of 80, 95, and
110°C which were representative of the temperature profile within the drying chamber with inlet
air at 180°C. Further experiments could repeat the methodologies described previously using
oven temperatures in the range of 110-136°C to gather data for spray drying with inlet air
temperature up to 220°C.
3.4.2. Thin-layer drying droplet inactivation results
High-temperature treatment showed significant inactivation of Salmonella over 25 s
(Figure 6, Table 2). However, there was no significant difference (P > 0.05) between inactivation
rate at temperatures of 180, 190, and 200°C with some samples at 15 and 20 s, and all samples at
25 s being below detection limits (3.4 log CFU/g). Samples were visibly dry after 5 s and were
brittle after 10 s regardless of the treatment temperature. This observation indicates that the
falling rate drying period is very short for these droplets, with most of their treatment time spent
as a dry particle at equilibrium temperature.
44
Figure 6. Survival of Salmonella Enteritidis PT30 in soy protein isolate inoculated on nylon
mesh disc after low (80-110°C, top) and high-temperature (180-200°C, bottom) treatment in a
convection oven.
0
1
2
3
4
5
6
7
8
9
0 10 20 30 40 50 60
Su
rviv
ors
(L
og
CF
U/g
)
Time (s)
80°C
95°C
110°C
0
1
2
3
4
5
6
7
8
9
0 10 20 30 40 50 60
Su
rviv
ors
(L
og
CF
U/g
)
Time (s)
180°C
190°C
200°C

45
Table 2. D-values (± 95% confidence intervals) for Salmonella Enteritidis PT30 in soy protein
isolate inoculated onto nylon mesh discs treated in a convection oven at 80-200°C.
Air temperature (°C) D-value* (s)
80 17.2 ± 3.1A
95 13.8 ± 2.8A
110 8.0 ± 3.2B
180 4.6 ± 1.3B
190 4.9 ± 1.6B
200 5.2 ± 3.4AB
*Within a column, means with common superscript letters were not significantly different (α =
0.05).
Only one data point was above the limit of detection at 20 s with none found at 25 s. This
is due to the extreme conditions causing more rapid inactivation than expected, as well as a high
limit of detection. Due to the small amount of inoculum used to inoculate each sample, a
comparatively high dilution factor was required to produce enough liquid for plating, and thus
the limit of detection is quite high using this methodology (3.4 log CFU/g). This issue could be
solved in future experiments by treating multiple inoculated meshes as a single sample to
increase the amount of inoculum treated per sample, and thereby decrease the limit of detection.
Low-temperature treatment similarly showed significant bacterial inactivation during 60 s
(Figure 6, Table 2). While D-values are reported assuming a log-linear inactivation model, the
data suggest that there could be a decrease in inactivation rate after 40 s of treatment. This tailing
effect could be further investigated by extending the treatment time beyond 60 s. While the
population decreased below the limit of detection at 110°C after 40 s, survivors were recovered
from samples at 80 and 95°C after 60 s and could potentially persist longer. Similar to the high-

46
temperature treatments, meshes were visibly dry and were brittle after treatment times of 10-20 s
regardless of treatment temperature.
Based on the inactivation data, air temperature was a significant factor (P ≤ 0.05)
affecting the inactivation rate of Salmonella in SPI solution inoculated on the nylon mesh (Table
2). The D-values at various air temperatures can be used to represent the inactivation of bacteria
in droplets in various temperature regions within a spray dryer, which can be utilized for
predicting the dynamic inactivation rate during spray drying.
Regarding source error, variability of the data is fairly high due to the very short
treatment times including the time required to remove a sample from the oven to stop
inactivation by chilling the mesh. Small differences (1-2 s) in the time taken to remove samples
could cause substantial differences in inactivation due to the relatively short treatment time.
Another potential source of error using this methodology may come from the contact between
the inoculated nylon mesh and the metal rack used to hold the mesh inside the oven. Heat
transfer between this metal rack and the mesh is different than that between the air and mesh, and
thus any portion of the mesh in contact with the metal likely had a different bacterial inactivation
rate than intended. While this area was relatively small compared to the surface area of the entire
mesh, an improved experimental design could ensure that the inoculated portion of the mesh disc
is only in contact with air.
Due to the miniscule amount of liquid involved in this experiment, data regarding changes in
moisture content data could not be collected. Obtaining accurate measurements of such small
changes in mass was not possible using the nylon mesh approach, as the changes in mass (< 0.04
g) between a wet and dry sample were too small to accurately measure. This difficulty is similar
to the limitations of droplet drying studies using the glass filament method previously described

47
in section 2.2.2. Future experiments could involve drying multiple meshes at a time to increase
the combined mass of each sample and make changes in moisture content more measurable.
3.5. Conclusion
In this study, air temperature within the pilot-scale spray dryer chamber was measured to
profile the temperature distribution within the dryer. An experimental methodology for
measuring the inactivation of Salmonella within drying droplets was developed and tested to
measure inactivation at varying air temperatures. Consequently, the decimal reduction time and
the temperature dependence for Salmonella were successfully quantified with the simulated
spray dried droplets.

48
4. SIMULATED DROPLET DRYING KINETICS AND APPLICATION OF
BACTERIAL INACTIVATION MODELS
4.1. Introduction
While both droplet drying kinetics and bacterial inactivation modeling have been researched
extensively, very little work has been done on the combination of the two – modeling of bacterial
inactivation occurring within drying droplets. In order to find out how best to model such
processes, multiple models were tested for their fit to the experimental data collected in chapter
3. These models varied in the drying droplet variables (droplet temperature and moisture content)
that could impact bacterial inactivation.
Ideally, simultaneous inactivation kinetics and droplet drying experimental data could be
collected and used to identify the most relevant drying kinetics parameters that impact
inactivation. However, collection of such data (droplet temperature and moisture content) for
atomized droplets is difficult, and experimental efforts to measure such values have not been
successful for droplets smaller than ~1 mm. Therefore, drying models that have been previously
validated in the literature based on data from these large-scale droplet drying experiments were
used to develop a simplified heat-mass transfer model for an ideal droplet representative of those
created during spray drying. The data generated from this model were then combined with the
bacterial inactivation data collected in chapter 3 to create an inactivation model that could
account for the effect of droplet drying parameters on inactivation rate.
4.2. Objectives
The objective of this study was to simulate droplet drying kinetics data using previously
validated drying models and use the data to develop a bacterial inactivation model that
incorporates the effect of droplet drying parameters on inactivation rate.

49
4.3. Materials and Methods
4.3.1. Droplet drying modeling methods
The CDC model described in Eq. (1(3) was used for modeling droplet drying due to its
relative simplicity compared to other models as well as its use in previous droplet drying
modeling studies, where it was found to fit experimental data well. The standard CDC model
was utilized in this approach as opposed to the modified CDC model. This model was chosen
because the modified CDC model was shown to have mixed results regarding improvement of
droplet drying models, and therefore the simpler option in the standard CDC model was chosen.
Several assumptions were utilized to make the simulated droplet drying model possible.
The appropriate use and justification for these assumptions from the literature can be found in
section 2.2. First, the initial droplet moisture content was assumed to be equal to the critical
moisture value at which crust formation begins. Temperature and moisture content profiles
within individual droplets were considered to be uniform, and the environmental drying variables
(air temperature, relative humidity, wet bulb temperature) were kept constant. This differs from
droplet drying models that utilize CFD modeling, as the surrounding environment conditions
constantly change in models for full-scale spray dryers. However, in a previous study no
significant difference in drying kinetics was observed based on the use of constant or varying
dryer conditions, such as air temperature, humidity, and velocity, so this assumption can be used
for modeling a simulated drying experiment in an oven (Woo et al. 2008). Additionally, while
heat capacity and heat of vaporization of water within a droplet change with temperature, they
were kept constant for this modeling process to simplify the model and because this detail was
not noted in previous studies on droplet drying models. Finally, the heat transfer coefficient used

50
for the convection oven was taken from a previously published study using the same oven, but a
flat plate rather than an ellipsoidal surface for estimation (Garcés-Vega 2017).
Critical moisture content was set at the initial moisture content, of 9 kg H2O/kg solids for
a 10% w/w solids solution of soy protein isolate. Equilibrium moisture content was set at 0.07 kg
H2O/kg based on the average equilibrium moisture content of soy protein powder dried in the
pilot-scale spray dryer described in chapter 3. Relative humidity was set to 1%, based on the
humidity measurements done in the lab-scale oven experiment in chapter 3. The density of the
feed solution was determined and used to calculate both the mass of a droplet as well as the mass
of solids within a droplet. Wet bulb temperature within the drying chamber was calculated based
on the air temperature and relative humidity within the oven using the following equation (Stull
2011):
𝑇𝑤𝑏 = 𝑇𝑎 tan−1[0.151977(𝑅𝐻 + 8.313659)1/2] + tan−1(𝑇𝑎 + 𝑅𝐻)
− tan−1(𝑅𝐻 − 1.676331)
+ 0.00391838(𝑅𝐻)3/2 tan−1(0.023101𝑅𝐻) − 4.686035
(16)
where Twb is the wet bulb temperature, Ta is the air temperature, and RH is the relative humidity.
The remaining parameters used in the droplet drying model are listed in Table 3.

51
Table 3. Boundary and initial conditions used in the simulated droplet drying model.
Parameter Value
Air temperature (°C) 80-200
Droplet diameter (µm) 10-320
Critical moisture content (kg H2O/kg solids) 9
Equilibrium moisture content (kg H2O/kg solids) 0.07
Relative humidity (%) 1
Density of feed solution (kg/m3) 1044
Mass of droplet (kg)* 4.37˟10-12
Mass of solids in droplet (kg)* 1.97˟10-13
Heat of vaporization of water (J/kg)* 2.43˟106
Heat capacity of water (J/kg*K) 4120
Heat transfer coefficient (W/m2*K) 104.5
*Value given for a droplet with 160 µm diameter
Using the parameters described above and Eq. (1) and ((6), the system of ordinary
differential equations was solved with the “ode45” function in MATLAB R2018b (MathWorks,
Natick, MA) (Appendix A). This gave simultaneous moisture content and temperature data for a
simulated droplet under the given conditions.
4.3.2. Bacterial inactivation modeling methods
Drying droplet simulations were carried out for each condition used in chapter 3 to
determine survival of Salmonella in a convection oven. Each bacterial survival data point was
matched with the temperature and moisture content of a simulated droplet under the same

52
conditions at that time point, which allowed for inactivation modeling as a function of droplet
temperature and/or moisture content. The primary model used in this study was the log-linear
bacterial survival model (Eq. (17).
log𝑁(𝑡)
𝑁0= −
𝑡
𝐷 (17)
where N(t) is the bacterial load at time t, N0 is the initial bacterial load, t is time, and D is decimal
reduction time.
Multiple secondary models were tested to determine the best-fitting model for bacterial
inactivation within drying droplets. These models are similar to the modified MSU model for
inactivation of Salmonella during moist-air convection heating, which included a parameter for
surface moisture proposed by Jeong et. al (Jeong, Marks, and Orta-Ramirez 2009). The variables
used in these models are droplet temperature, moisture content, and the combination of the two
(Eq. (18 - (20).
𝐷𝑇𝑑(𝑡) = 𝐷𝑟𝑒𝑓 × 10
𝑇𝑟𝑒𝑓−𝑇𝑑(𝑡)
𝑧𝑇𝑑 (18)
𝐷𝑋(𝑡) = 𝐷𝑟𝑒𝑓 × 10𝑋𝑟𝑒𝑓−𝑋(𝑡)
𝑧𝑋 (19)
𝐷𝑇𝑑,𝑋(𝑡) = 𝐷𝑟𝑒𝑓 × 10
𝑇𝑟𝑒𝑓−𝑇𝑑(𝑡)
𝑧𝑇𝑑+
𝑋𝑟𝑒𝑓−𝑋(𝑡)
𝑧𝑋 (20)
where DTd, DX, and DTd,X are the decimal reduction times at droplet temperature Td, moisture
content X, and both droplet temperature Td and moisture content X, respectively. Dref is the
decimal reduction time at reference droplet temperature and moisture content, Tref and Xref. zTd
and zX are the changes in droplet temperature and moisture content, respectively, required to
enact a 1-log change in decimal reduction time.

53
Reference values for temperature and moisture content (Tref and Xref) were set to 77°C
and 1 kg H2O/kg solids, respectively. Each model was fitted to the experimental data using the
”nlinfit” and “fitnlm” functions within MATLAB (Appendix A), which generated parameter
estimates, parameter uncertainty, and fit statistics for the model.
4.3.3. Model evaluation and selection
Before testing the fit of the models described in Eq. (18 - (20), the scaled sensitivity
coefficients (SSCs) of each model were plotted to determine whether the parameters were able to
be estimated separately. Models with SSCs that were large (maximum SSC >5% of the scale of
the dependent variable) and uncorrelated were deemed acceptable for parameter estimation. In
the case of models where the scale of SSCs was too low to simultaneously estimate parameters,
parameters were estimated individually. This was done by setting the values of parameters with
SSCs deemed too small to a range of fixed values to estimate and determine the other parameter
values at the minimum root-mean squared error (RMSE) as the best fitting estimates.
The predicted inactivation data generated from these models were fitted to the
experimental inactivation data collected in chapter 3 to determine the fit of each model, and
ultimately determine the optimal model for the droplet drying process. Models were evaluated
for their fit by calculating the RMSE:
𝑅𝑀𝑆𝐸 =
√∑ ((log
𝑁(𝑡)𝑁0
)𝑎𝑐𝑡𝑢𝑎𝑙,𝑖
− (log𝑁(𝑡)
𝑁0)
𝑝𝑟𝑒𝑑𝑖𝑐𝑡𝑒𝑑,𝑖)
2
𝑛𝑖=1
𝑛 − 𝑝
(21)
The RMSE is a measure of how well a model predicts the trends present in the observed
data, with a low RMSE indicating that the model fits the data well. In predictive microbiology, a
RMSE of approximately 1-log CFU/g or less has previously been deemed acceptable when the
observed data yields a ~5-log CFU/g reduction (Farakos et al. 2014; Casulli 2016).

54
The Akaike Information Criterion (AICc) was used to determine the most likely correct
model for the data provided. This criterion is improved by the goodness-of-fit of the model and
penalized based on the number of parameters included in the model, with the lowest score
indicating the best model. The AICc for each model was compared and used to determine the
most likely correct model for bacterial inactivation during droplet drying.
4.4. Results and Discussion
4.4.1. Droplet drying simulation results
The standard CDC drying model described by Eq. (1(3) and the initial conditions
described in section 4.3.1 were used to simulate the temperature and moisture content of drying
droplets using controlled air temperatures from the thin film inactivation experiment (Figure 7).
This model creates temperature and moisture content curves, which converge at the air
temperature and equilibrium moisture content values (Figure 7). Various droplet sizes were
simulated to illustrate the distribution of droplet sizes created by the atomizer and the effect of
droplet size on drying time, but only droplets of 160 µm diameter were used for inactivation
modeling, as that was the droplet size contained within the thin film in the convection oven
drying study.
As expected, the time required to reach equilibrium moisture content decreased as the air
temperature increased and droplet size decreased. Time for a 160 µm diameter droplet to reach
equilibrium was ~25 and 15 s at air temperatures of 80 and 200°C, respectively. This gives an
approximate range for the drying time of a similarly sized droplet in a spray dryer with an inlet
air temperature of 200°C, as such a droplet would be very briefly exposed to 200°C air after
being atomized, then a range of air temperatures between 80 and 200°C afterwards.

55
Figure 7. Droplet temperature (Td) and moisture content (X) of simulated droplets of diameter 10,
20, 40, 80, 160, and 320 µm at air temperatures of 80°C (top) and 200°C (bottom) using the
drying model described in section 4.3.1.
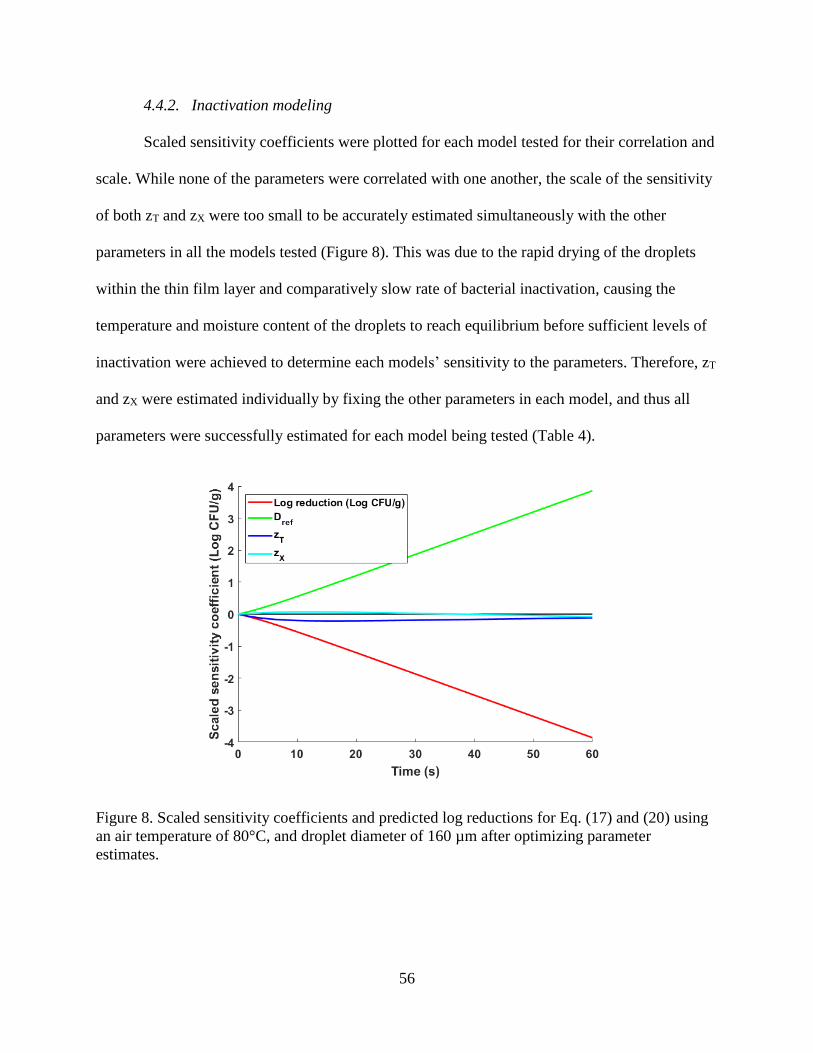
56
4.4.2. Inactivation modeling
Scaled sensitivity coefficients were plotted for each model tested for their correlation and
scale. While none of the parameters were correlated with one another, the scale of the sensitivity
of both zT and zX were too small to be accurately estimated simultaneously with the other
parameters in all the models tested (Figure 8). This was due to the rapid drying of the droplets
within the thin film layer and comparatively slow rate of bacterial inactivation, causing the
temperature and moisture content of the droplets to reach equilibrium before sufficient levels of
inactivation were achieved to determine each models’ sensitivity to the parameters. Therefore, zT
and zX were estimated individually by fixing the other parameters in each model, and thus all
parameters were successfully estimated for each model being tested (Table 4).
Figure 8. Scaled sensitivity coefficients and predicted log reductions for Eq. (17) and (20) using
an air temperature of 80°C, and droplet diameter of 160 µm after optimizing parameter
estimates.

57
Table 4. Parameter estimates and model evaluation for secondary models of Salmonella
inactivation in drying soy protein isolate droplets, using Tref = 77°C and Xref = 1 kg H2O/kg total.
Equation Parameter Estimate* RMSE (log CFU/g) AICc
(18)
Dref (s) 14.7 ± 1.1
0.67 150.5
zT (°C) 174.7 ± 20.2
(19)
Dref (s) 13.1 ± 1.6
1.01 209.4
zX (kg H2O/kg solids) 22.0 ± 24.5
(20)
Dref (s) 14.8 ± 1.1
0.66 148.4 zT (°C) 170.9 ± 20.1
zX (kg H2O/kg solids) 17.3 ± 15.5
*Error represented as 95% confidence interval for the parameter estimate.
Parameter estimates for both zT and zX in all evaluated models were large compared to the
range of droplet temperatures and moisture contents observed in the drying droplet simulations.
This could indicate that Salmonella is not very sensitive to changing temperatures or moisture
levels. Another possible explanation is that the expected decrease in thermal resistance of
Salmonella due to increasing droplet temperatures is effectively negated by the increased
resistance due to decreasing moisture content. This would explain the general linearity of the
inactivation data even under dynamic temperature and moisture conditions for treatment times
from 0-60 s (Figure 9). However, based on trends toward negative residuals in the middle
treatment times (15-40 s) and positive residuals at the end of treatment (50-60 s) illustrated by
Figure 10, it appears that the model could be further improved. This is especially visible in the
observed inactivation values at 80, 95, and 110°C, where the inactivation rate appears to
decrease towards the end of treatment. This trend could be due to a crust formation effect that

58
occurs when droplets reach their critical moisture content, which may decrease bacterial
inactivation in the falling rate drying period. While the CDC droplet drying model in Eq. (1(3)
takes this into account using the dimensionless moisture content parameter f, an additional crust
formation parameter could be added to the inactivation model in Eq. (20) to further emphasize
the importance of crust formation on inactivation rate.

59
Figure 9. Measured bacterial inactivation, model prediction, and 95% confidence and prediction intervals using Eq. (20) (markers,
solid lines, dashed lines, and dotted lines, respectively) for inactivation of Salmonella in a 160 µm diameter soy protein droplet during
drying at various temperatures (80-200°C)

60
Figure 10. Residual analysis for observed versus predicted survival of Salmonella in a 160 µm
diameter soy protein droplet during drying at various temperatures (80-200°C) using Eq. (20).
The most likely correct model for Salmonella inactivation in drying droplets of a soy protein
isolate solution was Eq. (20) based on its low AICC value. This model performed slightly better
than Eq. (18) even with the penalty to AICc due to the addition of parameter zX. However, the
large uncertainty associated with zX in Eq. (19 - (20) indicates that it is likely not a strong
predictor of inactivation rate, and perhaps the use of other parameters related to droplet drying
properties could improve the model further. Parameters that account for properties such as drying

61
rate, heating rate, and crust formation could better illustrate the factors that are important related
to bacterial inactivation in drying droplets and lead to a better fitting model.
4.5. Conclusion
Drying droplet properties (droplet temperature, moisture content, and drying rate) were
simulated using the standard CDC model and conditions measured from the convection oven in
chapter 3. This was done as such data was not able to be collected experimentally. These
simulated drying kinetics data were then paired with the bacterial survival data collected from
chapter 3 to develop models that consider the effects of such kinetics on bacterial inactivation
during drying. Secondary models involving the parameters droplet temperature and moisture
content were fitted to the inactivation data and evaluated for their goodness-of-fit. The optimal
model was determined to be a model that considers both droplet temperature and moisture
content. This model can be validated using survival data collected from pilot-scale spray drying
of inoculated feeds.

62
5. PILOT-SCALE VALIDATION OF COMBINED SPRAY DRYING AND BACTERIAL
INACTIVATION MODELS
5.1. Introduction
Modeling and simulation work are important in understanding the factors and mechanisms
that impact bacterial inactivation during droplet drying. However, the models need to be
validated with a larger-scale operation with the same complexities as an industrial-scale system.
For this validation, experiments were carried out with a solution of soy protein isolate inoculated
with Salmonella Enteritidis PT30, Salmonella spp. being a pathogen of concern in spray drying,
and Enterococcus faecium, a commonly used non-pathogenic surrogate for Salmonella in low-
moisture foods. This inoculated solution was then dried in a pilot-scale spray dryer using a range
of common inlet air conditions for such products. Samples from various locations within the
dryer were evaluated for the survival of these bacteria in order to provide an understanding of
bacterial survival within the entire system, including the powdered product. These results can
then be used to provide a mathematical and biological tool to predict contamination risks within
spray drying systems.
5.2. Objectives
This study was conducted to validate the previous simulation and modeling work by testing
the survival of both Salmonella and Enterococcus faecium in a pilot-scale spray dryer.
5.3. Materials and Methods
5.3.1. Materials and properties
Experiments were carried out using the same FT80 Tall Form Spray Drier (Armfield Inc.,
Clarksburg, NJ) and operating conditions described in section 3.3.1. Spraying Systems Co.
provided data for a similar nozzle used under similar conditions to those in this thesis (DeMaria

63
2019). According to the data provided, atomization of a 15% w/w suspension of HPMC-based
OPADRY® YS-1-7003 (Colorcon, Harleysville, PA) at a feed rate of 10 mL/min and atomizing
air pressure of 0.8 bar (14.5 psi) would yield an average droplet diameter of ~50-55 µm.
While neither of these droplet size estimations completely reflect those used in this
experiment, they are the best estimations that can be obtained without collecting our own data for
the system being used. For the purposes of this thesis, the data provided for atomization of the
OPADRY® solution were used to represent the droplet size created by the atomizer in the
experiment, as it most closely fit the atomization and feed conditions used, and was closer to
previous experimental data and estimations as opposed to the data for atomization of water
(Zbicinski, Strumillo, and Delag 2002; Mezhericher, Levy, and Borde 2015).
5.3.2. Inactivation study methods
Salmonella Enteritidis Phage Type 30 and Enterococcus faecium NRRL B-2354 were
subjected to two 24h/37°C transfers in tryptic soy broth (TSB) to achieve a highly concentrated
inoculum (~109 CFU/mL). A 10% w/w SPI slurry was created by adding 450 mL of water to 50
g of unflavored soy protein isolate (NOW Foods, Bloomingdale, IL) and blending in a laboratory
blender (Waring, Torrington, CT) for 5 min. The slurry was then stirred at 200 RPM on a stir
plate for 24 h to fully hydrate the protein and obtain a more homogenous mixture. On the day of
testing, 6 mL of inoculated TSB was pipetted into the slurry and stirred at 200 RPM for 5 min to
blend (~107 CFU/mL). The inoculated slurry was stirred at 200 RPM when pumped into the
nozzle to prevent phase separation.
To prepare the spray dryer for each experiment, the air heater and inlet/exhaust fans were
set to the operative conditions for approximately 20 min to allow the dryer conditions (inlet air
temperature, air pressure, humidity) to reach steady state without air or liquid input from the

64
nozzle. Once steady state was reached, compressed air was supplied to the nozzle, and the
peristaltic pump began supplying liquid feed. The dryer was then allowed to run until all of the
liquid feed solution was dried (~1 hr for 500 mL), stopping as needed to clear any clogs in the
nozzle or feed line.
After running the liquid solution, the spray dryer was shut down for disassembly, sample
collection, and cleaning. Samples were taken from the following locations: feed solution
(control), nozzle shield, top, middle, and bottom of the drying chamber walls (7, 45, and 90 cm
from the drying chamber ceiling, respectively), primary and secondary collectors, cyclone, and
exhaust pipe (Figure 11). These locations were chosen based on varying air temperatures,
humidity, and particle residence times. The control sample consisted of 5 mL of the inoculated
liquid feed, which was reserved to determine the starting bacterial concentration in the feed
solution. Samples from the primary (1-5 g) and secondary collectors (15-25 g) consisted of the
powder accumulated within. All other sampling locations had their surfaces swabbed using
Sterile Dry Sponge Probes (Nasco, Fort Atkinson, WI) wetted with 20 mL of BPW. Swabbing
was done in a 10x10 cm area where a semi-flat surface was available (top, middle, and bottom of
the drying chamber), and around the perimeter of the sampling location where the diameter of
the piping was too small for this type of swabbing (nozzle shield, cyclone, and exhaust pipe).

65
Figure 11. Diagram of the sampling locations within the FT80 Tall Form Spray Dryer used in the
pilot-scale validation study.
Control samples were serially diluted with 0.1% BPW and plated on the appropriate
media for the microorganism being identified. Powder samples were diluted 1:10 by mass with
BPW, stomached twice for 90 s each, serially diluted with BPW, and plated on the appropriate
media. Swab samples were similarly stomached twice for 90 s, serially diluted with BPW, and
plated on the appropriate media.
The media used for plating these samples was dependent on the microorganism being
recovered. For E. faecium, the medium used was Tryptic Soy Agar (Difco) supplemented with
yeast extract (0.6%) (Difco), ferric citrate (0.05%) (Sigma Aldrich, St. Louis, MO), and esculin
hydrate (0.025%) (Acros Organics, Morris, NJ), also known as eTSA (Isenberg, Goldberg, and
Sampson 1970). For Salmonella, the medium used was mTSA. Both media are nonselective and

66
differential. The plates were incubated for 48 h at 37°C after which all black colonies on mTSA
and eTSA were counted as Salmonella or E. faecium, respectively. Only those counts between 25
and 250 colonies per plate were used (Food and Drug Administration 1998).
5.3.3. Spray dryer operational safety
To contain any airborne bacteria inside the Biosafety Level 2 Pilot Plant facility at
Michigan State University, the spray dryer used in this study was placed inside a portable clean
room structure (McMaster-Carr, Aurora, OH) with heavy vinyl plastic curtains surrounding each
side. These curtains were taped to the laboratory walls to form a seal from the rest of the
laboratory. This portable clean room was equipped with a HEPA air filter followed by an exhaust
fan blowing outwards. Thus, a negative air pressure was maintained inside the room to prevent
airborne particles from escaping, while also filtering potentially dangerous microorganisms
before the fan expelled air into the rest of the lab. The spray dryer exhaust pipe was positioned
directly under this ceiling fan such that all air exiting the dryer was exhausted into the fan. An
inline HEPA box filter (HVACQuick, Medford, OR) was installed onto the end of the exhaust
pipe to filter microorganisms from the air exiting the dryer.
According to recommendations from MSU EHS (Environmental Health and Safety,
Michigan State University), personal protective equipment was worn while inside the clean
room. This included N95 respirators (3M, St. Paul, MN), disposable Tyvek coveralls with a hood
and booties (DuPont, Midland, MI), and double layered nitrile gloves sealed to coveralls with
duct tape, and a face shield. Once drying of the inoculated feed began, no entry or exit from the
clean room was allowed until cleaning was completed to prevent contamination of the general
lab space.
67
To ensure that this containment system was working properly, each experimental spray
drying run included environmental sampling both inside and outside the clean room. Plates of the
appropriate media for the microorganism being tested were opened and placed on the ground in
multiple locations within the clean room and in the general laboratory area for the entirety of the
spray dryer operation to determine if any bacteria were escaping the room. Similarly, each inner
wall in the clean room was swabbed in a 10x10 cm area after completion of spray drying and
plated on the appropriate media to determine whether any bacteria had escaped the dryer and
attached to the walls.
5.4. Results and Discussion
5.4.1. General properties
The average initial concentrations of E. faecium and Salmonella in the inoculated soy
protein solution were 9.73 ± 0.18 and 8.86 ± 0.18 CFU/g solids (with 95% confidence level),
respectively. The moisture content of the spray dried soy protein powder was measured at each
inlet air temperature and averaged 0.07 kg H2O/kg solids, which was used for all droplet drying
modeling as the equilibrium moisture content of dried particles. No counts of Salmonella were
found on environmental samples, indicating that the containment system worked properly.
5.4.2. Effect of sampling location
Populations of E. faecium in the soy powder product (primary and secondary collectors)
were significantly reduced (P < 0.05) for all inlet air temperatures (Table 5). No significant
difference (P ≥ 0.05) was found in the survival of E. faecium or SE PT30 between these two
sampling locations. There are two main differences between the powders in these locations:
particle size and residence time. Although the particle size of the dried powder was not
measured, the particles sampled from the secondary collector were much finer than the particles

68
in the primary collector (Figure 12 and Figure 13), which is consistent with the literature
regarding dryers with multiple collectors (Masters 1972; Djamarani and Clark 1997). While
particles in the secondary collector are smaller and therefore require less drying time to reach a
dry state, they also must travel a greater distance to reach the collector than the larger particles in
the primary collector. No studies have measured the difference in residence times between
particles in the primary versus secondary collectors. Therefore, the effect of the difference in
residence time between the particles was not considered for the two sampling locations having
similar bacterial survival.

69
Table 5. Inactivation of E. faecium and Salmonella (± 95% confidence interval) in soy protein isolate powder sampled from the
primary and secondary collectors after spray drying at various inlet air temperatures. Initial concentrations of E. faecium and
Salmonella in the inoculated soy protein solution with 95% confidence interval were 9.73 ± 0.18 and 8.86 ± 0.18 CFU/g solids.
Bacterial inactivation (Log CFU/g solids)*
E. faecium SE PT30
Location 180°C 200°C 220°C 180°C 200°C
Primary collector 2.83 ± 0.43AB** 2.51 ± 0.32 A 2.52 ± 0.43A 3.64 ± 0.48B 2.40 ± 1.77AB***
Secondary collector 2.33 ± 0.09A 2.33 ± 0.32A 2.38 ± 0.59A 4.11 ± 0.37B 4.15 ± 0.38B
* Values given as mean bacterial inactivation ± 95% confidence interval (3 replications, except where noted).
** Means sharing a common symbol (A, B, C) were not significantly different (α = 0.05).
***Two replications due to missed dilutions.

70
Figure 12. Typical appearance of fine soy protein powder accumulated in the secondary collector
after spray drying.
Figure 13. Typical appearance of accumulated coarse soy protein powder in the primary collector
after spray drying.

71
No significant difference was found in the survival of E. faecium or SE PT30 in the
powder deposits of the top, middle, and bottom of the drying chamber (Table 6). Although air
temperature differed in each region (Table 1), these differences between the air temperature
profiles were considered insufficient to significantly affect bacterial inactivation in the wall
deposits. Also, deposition rate was likely not a factor in any differences in survival in wall
deposits, as the amount of powder buildup was fairly consistent throughout the drying chamber
(Figure 14).
Figure 14. Top-down view of the spray drying chamber with deposited soy protein powder after
spray drying.

72
Table 6. Population of E. faecium and Salmonella (± 95% confidence interval) in soy protein isolate powder swab samples from the
nozzle shield, drying chamber, cyclone, and exhaust pipe after spray drying at various inlet air temperatures.
Population (Log CFU/cm2)*
E. faecium SE PT30
Location 180°C 200°C 220°C 180°C 200°C
Nozzle 1.19 ± 0.05A** < limit*** < limit < limit < limit
Chamber top 2.72 ± 1.19AB** 2.41 ± 0.56AB 2.11 ± 1.16AB 2.59 < limit
Chamber middle 3.07 ± 0.36AB 2.73 ± 0.52AB 1.68 ± 1.82A < limit < limit
Chamber bottom 3.50 ± 0.12AB 2.56 ± 0.58AB 2.19 ± 1.66AB 2.09 < limit
Cyclone 3.99 ± 0.34B 3.32 ± 0.06AB 1.96 ± 0.58AB < limit < limit
Exhaust < limit < limit < limit < limit < limit
* Values given as mean bacterial concentration ± 95% confidence interval
** Means sharing a common symbol (A, B) were not significantly different (α = 0.05)
*** All collected samples were below the limit of detection (0.8 CFU/cm2).

73
Results from these sampling locations are difficult to fully interpret, however, due to the
varying residence times for the deposits and their extended exposure to high temperatures.
Powder that adheres to the dryer walls early during a drying run will be exposed to the drying
conditions for most of the run time (~50 min), while powder that adheres at the end will be
minimally treated. As such, the layers of particles that exist within the deposited powder likely
experienced different exposures to the treatment and therefore varied bacterial survival. Thus,
surface swabbing yields a composite sample having the higher concentration in the top-most,
minimally treated powder. This variation within the deposit could be further investigated by
drying a much larger amount of feed in order to build a thicker layer of powder on the dryer
walls, and sampling layers from different depths to see if position within the built-up powder
influences bacterial survival.
While some samples taken from the cyclone, exhaust, and nozzle areas had E. faecium
and SE PT30 concentrations below the detection limit (0.8 log CFU/cm2), each location had
samples with at least one surviving colony forming unit (Food and Drug Administration 1998).
This limit of detection was determined based on a minimum count of 25 colonies from a swab of
the cylindrical sampling areas of the cyclone, exhaust, and nozzle. The conditions in these areas
make survival and recovery of bacteria difficult (high temperature air in the nozzle area, low
powder deposition in the cyclone and exhaust pipe), but E. faecium still survived and was
recoverable by swab (Figure 15 and Figure 16). This means that E. faecium was survived to
some extent at all sampling locations. While previous studies have reported survival of
Salmonella, E. coli, and Listeria monocytogenes in spray dried milk, these results show that E.
faecium is capable of surviving at multiple locations within a dryer, not just in the final powder

74
product (LiCari and Potter 1970a; Miller, Goepfert, and Amundson 1972; Doyle, Meske, and
Marth 1985).
Figure 15. Nozzle shield with deposited soy protein powder after spray drying.
Figure 16. Cyclone connecting pipe with deposited soy protein powder after spray drying.
It is impractical to compare survival in these spray dryer deposits to that of the inoculated
feed solution or the powder sampled from the collectors due to the difference in sampling

75
methods, and thereby units of concentration (CFU/g solids versus CFU/cm2) for each location.
Therefore, results for these swab samples were not reported in log reductions.
5.4.3. Effect of inlet air temperature
Inlet air temperature was a significant factor (P < 0.05) in survival of E. faecium in the
middle region of the drying chamber and the cyclone, but nowhere else in the process. For SE
PT30, inlet air temperature was not a significant survival factor (P < 0.05) in any sampling
location. It is possible that higher inlet air temperatures could have a more substantial impact on
bacterial inactivation, but such temperatures could have adverse effects on powder quality or
drying efficiency as they are out of the range of recommended drying temperatures for many
spray dried products (Armfield Engineering Teaching Equipment 2013; Masters 1972).
This finding conflicts with the results found in chapter 3, where air temperature in the
convection oven had a significant effect on the inactivation rate for Salmonella in droplets of soy
protein isolate solution. This could be due to the difference in air temperatures surrounding the
droplets – in the convection oven study, air temperature was kept constant in a range from 80 to
200°C. However, in this study the air temperature surrounding droplets varied during the process
of droplet drying, with average drying chamber temperatures of 104 to 132°C using inlet air
temperatures of 180 to 220°C. Considering the large value for zT estimated for Eq. ((20)
(170.9°C), the differences in air temperatures within the drying chamber at the inlet air
temperatures tested were likely insufficient to yield significant differences in inactivation during
drying of droplets in this process.
5.4.4. Comparison of survival between organisms
Survival of SE PT30 in the soy protein powder sampled from the primary/secondary
collectors was significantly lower (P < 0.05) than that of E. faecium during spray drying (Table

76
5). Similarly, while E. faecium survivors were found at all surface swab sampling locations and
inlet air temperatures, SE PT30 decreased below the detection limits (0.8 CFU/cm2) in most
samples at inlet temperatures of 180 and 200°C (Table 6). Surrogate organisms for process
validation are generally preferred to have greater thermal resistance than the selected pathogen of
concern in order to create a conservative predictor of pathogen inactivation. Therefore, this
observation indicates that E. faecium has potential for usage as a surrogate organism for SE PT30
in soy protein powder during spray drying. The use of this surrogate should be further validated
under a greater variety of processing conditions such as inlet air temperature, feed rate,
atomization pressure, and feed material before it is used as a reliable surrogate for various spray
drying processes.
5.4.5. Validation of inactivation model
Ideally, the data collected in this study can be used as a scale-up validation of the
bacterial inactivation model developed in chapter 4. This can only be completed to a certain
extent, however, as much of the information required to conduct a complete validation is still
unknown. For instance, no data for residence time or droplet temperature have been collected for
droplets drying in the convection oven used in chapter 3 or the pilot-scale spray dryer used in
this study. Therefore, only a preliminary validation of the applicability of the bacterial
inactivation model described in chapter 4 to a pilot-scale spray drying process can be completed.
To complete such a validation, drying droplets were simulated using the CDC model
described in chapter 4. Several assumptions were made to complete this simulation. First,
parameters that are unknown about the spray dryer used in this study were assumed to be the
same as for the convection oven used in chapter 3. It was also assumed that the air temperature
within the spray dryer chamber was the average of the measured air temperatures described in

77
Table 1 (104, 119, and 132°C average air temperature at inlet air temperature of 180, 200, and
220°C, respectively), as the actual air temperature experienced by a drying droplet during spray
drying was not measured experimentally. The droplet diameter was assumed to be 55 µm, based
on the data provided in section 5.3.1. The residence time for the particles accumulated in the
primary and secondary collectors was assumed to be equal to the time required for a simulated
droplet under the same conditions to reach the equilibrium moisture content (0.07 kg H2O/kg
solids). This assumption is required because no data for residence time of particles was collected
in this study, so the residence time for this process is unknown.
The data for droplet temperature and moisture content were entered into Eq. (20) to
obtain predicted Salmonella inactivation data for each condition (Figure 17). The observed data
for Salmonella inactivation in particles collected in the primary and secondary collectors was
plotted at the estimated residence time with these predicted curves to illustrate the differences
between predicted and observed data.

78
Figure 17. Predicted inactivation of Salmonella in a droplet drying at constant air temperatures of
104, 119, and 132°C using Eq. (20) (lines) and observed inactivation (with 95% confidence
intervals) of Salmonella in powdered soy protein isolate in the primary/secondary collectors of
the pilot scale spray dryer after drying at inlet air temperatures of 180 and 200°C for their
assumed residence times (markers).
Based on the differences between the predicted lines and the observed data points in Figure
17, the inactivation model based on experimental data underpredicts inactivation during pilot-
scale drying. However, this model is based on a small data set and many assumptions. For
instance, if 75 percent of a particles’ residence time is spent as a dry particle, as has been
previously theorized, and thus the time required to reach equilibrium moisture content is only 25
percent of residence time, then the assumption for residence time used in this validation is
invalid (Mezhericher, Levy, and Borde 2015). In this case, the residence time for these particles
would instead be approximately four times longer than estimated in this validation (~1 minute),
which would make the predicted inactivation much closer to the observed experimental data
values.
79
5.5. Conclusion
In this study, a pilot-scale spray dryer was used to evaluate the survival of Salmonella and E.
faecium in soy protein isolate during spray drying using varying inlet air temperatures.
Significant bacterial reductions were observed in the soy protein powder that accumulated in the
primary and secondary collectors as well as that adhering to the inner surfaces of the spray dryer.
Inlet air temperature had an insignificant effect on bacterial inactivation in most sampling
locations. Inactivation of Salmonella was significantly greater than E. faecium in the final
powder product, indicating that E. faecium could be used as a conservative surrogate organism
under these conditions. However, a more thorough surrogate evaluation should be conducted
before E. faecium is used as a surrogate for SE PT30 in spray drying process under all
conditions. The spray drying process was not able to eliminate all bacteria present regardless of
inlet air temperature, sampling location, or organism tested. This confirms that the spray drying
process cannot be a pasteurization step and caution should be taken to prevent contamination of
spray dryers during food manufacturing. Finally, a preliminary validation of the bacterial
inactivation model developed in chapter 4 showed that given the assumptions used in the
modeling portions of this study, the inactivation model underpredicted inactivation of bacteria
during the pilot-scale spray drying process.

80
6. CONCLUSIONS
6.1. Overall Conclusions
Survival of Salmonella during drying of a thin layer of droplets was observed at various
oven air temperatures. Increases in air temperature around the drying droplets resulted in
increased reduction of Salmonella, with D-values for droplets dried in 80-200°C air in the range
of 4.6-17.2 s (Tref = 77°C, Xref = 1 kg H2O/kg total). Additionally, the temperature profile of a
pilot-scale spray dryer was measured, and regions of varied temperatures substantially below the
inlet air temperature were observed. This information indicated that spray drying would be
unlikely to decrease Salmonella more than 2-3 log reductions of Salmonella based on the D-
values observed and the short residence times of droplets within spray dryers.
These bacterial inactivation data were then paired with a droplet drying model to evaluate
the effects of droplet temperature and moisture content on inactivation rate. Droplet temperature
and moisture content were projected for a simulated drying droplet using conditions replicating
those used in the thin-layer droplet bacterial survival study. Three secondary models for bacterial
inactivation rate were fitted to those inactivation data, and the most likely correct model was
determined to be one that considers both droplet temperature and moisture content.
A pilot-scale spray dryer was used to determine the survival of Salmonella and the potential
surrogate organism E. faecium during spray drying of soy protein isolate at various inlet air
temperatures. Inlet air temperature was not a significant factor in the survival of either organism,
and while bacterial survival within soy protein powder varied between sampling locations,
surviving bacteria were found in all locations of the dryer. E. faecium was found to have
significantly greater survival than Salmonella in the spray dried soy protein powder, indicating
that it could potentially be used as a viable surrogate organism for the spray drying process.

81
Finally, when these bacterial survival data were used to validate the model of bacterial
inactivation during droplet drying, the model underpredicted inactivation during the spray drying
process.
6.2. Commercialization Potential
The work completed in this thesis could be helpful in several ways for food manufacturers
that utilize spray drying in their processes. It confirms previous results regarding bacterial
survival during spray drying of various food products, and indicates that those results apply to
soy protein isolate as well. Manufacturers may use this information to understand that spray
drying can be useful to enact some bacterial inactivation in the case of a contaminated product,
such as accidentally under-pasteurized or environmentally contaminated feed material. This
information could also be used to identify better cleaning protocols, by changing the frequency
of cleaning and targeting of specific areas of high contamination risk. Finally, the pilot-scale
study can be used to inform operating conditions that aim to ensure product quality while also
maximizing microbial safety.
6.3. Future Work
6.3.1. Experimental work
There are many opportunities for improvement and future work involving the thin film
droplet drying method. First, an apparatus that is capable of measuring the temperature and
moisture content of droplets during the drying process simultaneously with bacterial inactivation
data would be highly valuable for the validation of the work presented in this thesis.
Additionally, further experiments could use a variety of treatment conditions to test their effect
on drying kinetics and bacterial survival, including process humidity, air velocity, feed material,

82
and solids content of liquid feed. This would expand the applicability of these lab-scale results to
a wider variety of pilot and industrial-scale spray drying processes.
Given the inability to simultaneously estimate the parameters zT and zX, future
experiments using the thin-film droplet drying method could be modified. The experiment could
be run at lower temperatures for longer times in order to lengthen the period during which the
effect of temperature and moisture content could be modeled more effectively. This could
include drying temperatures that are below those relevant to actual spray drying processes
(<80°C), but would extend the inactivation and drying curves created over a much longer time.
This would be useful by collecting more useable data to be used for estimating both D and z-
values, which could then be applied to faster drying conditions.
The pilot-scale spray drying conditions could be expanded upon similarly to the thin-film
droplet drying experiment. Numerous processing conditions and feed properties could be tested
for their effect on bacterial survival, such as drying chamber pressure, feed rate, atomization
pressure, feed material, and solids content of feed. Along with bacterial survival data, quality of
the powders produced during the spray drying process could be tested to determine the
processing conditions that produce acceptable products.
In addition to bacterial inactivation, there is potential for bacterial growth to occur within
spray dryers. If insufficient drying conditions lead to accumulation of feed material with
sufficiently high moisture content on the inner surfaces of the dryer, any surviving bacterial
population could grow. To test this experimentally, powdered foods such as soy protein isolate
could be inoculated with bacteria and kept at a certain aw and temperature in a humidity-
controlled environment. Samples of this powder could be taken over time to determine if such
conditions were sufficient to allow for bacterial growth. A model of bacterial growth as affected

83
by environmental temperature and moisture content could be created based on the collected data.
Such a model could be used to inform the use of various cleaning methods to introduce less
water into the system, as well as setting up minimum standards for powder moisture content and
temperature conditions to prevent bacterial growth during operation.
6.3.2. Modeling improvements
The models provided in this thesis could be further improved in several ways. First, with
more data collection and model complexity, certain assumptions could be eliminated. For
example, by collecting droplet moisture content and temperature data in real-time with
inactivation data, the use of simulated droplet drying data could be validated. This would involve
some new droplet drying experimental apparatus, as previous studies have not been able to
observe the drying properties of to-scale droplets created by spray dryer atomizers. Second,
assumptions such as the exclusion of an initial drying phase or temperature and moisture content
homogeneity within a droplet could be eliminated with more data on the drying kinetics of the
specific product being tested, as well as more complex models that can account for profiles of
droplet properties. Additional droplet drying kinetics models (REA, deterministic) could be used
and compared to the CDC model to see which is the best fit for the given droplet drying data.
Similarly, additional secondary models that include parameters such as drying rate and heating
rate of droplets could be tested for their potential improvement of inactivation modeling. Finally,
the fit of the log-linear primary model could be compared with that of the Weibull primary
model, which is another primary inactivation model commonly used in predictive microbiology.
The next step in the application of both bacterial inactivation and droplet drying models
is their use in CFD modeling. Once bacterial and droplet properties is understood at the single
droplet scale, those models can be coupled with the air flow data from a simulated spray dryer

84
using CFD software. As mentioned in sections 2.1 and 2.2 of this thesis, a substantial amount of
research has already been completed on the use of CFD to track properties of the spray drying
process. These CFD models can incorporate the bacterial inactivation models developed in this
thesis to create a holistic process model of spray drying encompassing bacterial survival
throughout the system. Such a model could utilize the data collected in chapter 5 of this thesis for
validation.

85
APPENDIX

86
MATLAB Code for Droplet Drying Simulation and Inactivation Modeling
%% Drying Droplet Properties and Inactivation Kinetics Modeling %% Housekeeping clear %clear all variables close all hidden %clear figures format compact clc %% Initial variables Xinit = 9; %Dry basis Tinit = 20+273; %Room temperature [K] X_T_init = [Xinit; Tinit]; %for droplet drying kinetics forward problem % Ta = [80 95 110 180 190 200]; %Use these temperatures for convection oven drying droplet
simulation. Ta = [104 119.3 131.6]; %Use these temperatures for pilot scale spray dryer validation. % Ta = [80 200]; %Use these temperatures for plotting droplet drying at 80 and 200C. Ta = Ta+273; %Convert to Kelvin % D = [160]; %Use for convection oven parameter estimation. D = [55]; %Use for pilot scale spray dryer validation % D = [10 20 40 80 160 320]; %Use for distribution of simulated droplet sizes. D = D.*10^(-6); %Convert to um tfinal = 60; %All experiments/simulations go to 60 seconds. inac_data = xlsread('mesh_inactivation_data.xlsx', 'Log Reductions'); %Read in inactivation data
from mesh experiment global sim_data x_all sim_data = inac_data; %Will include simulated droplet data along with experimental inactivation
data y80 = inac_data(1:18,3); y95 = inac_data(19:35,3); y110 = inac_data(36:46,3); %Makes plotting
easier y180 = inac_data(47:57,3); y190 = inac_data(58:67,3); y200 = inac_data(68:73,3); %% FORWARD PROBLEM: Generate droplet drying data, plot SSC's fnameFOR=@DropletForward; %% Compile Td, X, dX/dt data for each droplet simulation into x_all xs=linspace(0,tfinal,601)'; %xs are the times for SSCs to make a smooth curve. ns=length(xs);%length of xs for plotting ypredInit=fnameFOR(X_T_init,xs,Ta(1),D(1)); %Simulate drying properties only at one specified Ta
and D xs=[xs ypredInit(1:ns) ypredInit(ns+1:2*ns) ypredInit(2*ns+1:3*ns)]; %Add those drying properties
for this one case to xs. x_all = xs(:,1); %x_all will contain all simulated droplet properties. for i=1:length(Ta) for j = 1:length(D) ypredInit=fnameFOR(X_T_init,xs,Ta(i),D(j)); DryingCond(:,6*(i-1)+j) = [Ta(i); D(j);zeros(length(xs(:,1))-2,1)]; %Need to fix if
change Temp x_all = [x_all xs(:,1) DryingCond(:,6*(i-1)+j)]; %Add time column between each condition x_all = [x_all ypredInit(1:ns) ypredInit(ns+1:2*ns) ypredInit(2*ns+1:3*ns)]; for k=1:length(inac_data) if sim_data(k,1) == (Ta(i)-273) %Copies T,X,dX/dt data for that time interval for that
droplet into the sim_data matrix sim_data(k,4) = ypredInit(10*(sim_data(k,2))+1); sim_data(k,5) = ypredInit(10*(sim_data(k,2))+1+ns); sim_data(k,6) = ypredInit(10*(sim_data(k,2))+1+2*ns); end end end end x_all(:,1) = []; %x_all contains all temp and MC data for droplets dried, separated by a column
containing time data between temperatures. %Column1 = time, column2 = X, column3 = Td, column4 = dX/dt, and so on. xobs = [sim_data(:,2) sim_data(:,4) sim_data(:,5) sim_data(:,6)]; %Contains time, X, Td, and
dX/dt x80 = xobs(1:18,1); x95 = xobs(19:35,1); x110 = xobs(36:46,1); x180 = xobs(47:57,1); x190 = xobs(58:67,1); x200 = xobs(68:73,1); % Times for each temperature
data set. yobs = sim_data(:,3); %Contains observed log reduction data %% Plot Td and X for droplets at Ta = 80C, 200C

87
%If plotting for 80C and 200C at Droplet diameter 10,20,40,80,160,320um, %then use the following settings for Ta and D in "Initial Variables" section. %Ta = [80 200]; %D = [10 20 40 80 160 320]; % cmap = ['r' 'm' 'y' 'g' 'c' 'b']'; % for i=1:length(Ta) % figure % hold on % set(gca, 'fontsize',14,'fontweight','bold'); % PlotTitle = ['Simulated drying droplet, Ta = ',num2str(Ta(i)),'K']; % title(PlotTitle) % xlabel('Time (s)') % yyaxis left % ylabel('Droplet temperature (K)'); % yyaxis right % ylabel('Moisture Content (kg H2O/kg solids)') % for j=1:length(D) % yyaxis left % plot(x_all(:,1),x_all(:,30*(i-1)+5*j-1),'-','color',cmap(j,:),'LineWidth',2) % yyaxis right % plot(x_all(:,1),x_all(:,30*(i-1)+5*j-2),'--','color',cmap(j,:),'LineWidth',2) % end % legend('Td (D=10um)','Td (D=20um)','Td (D=40um)','Td (D=80um)','Td (D=160um)','Td
(D=320um)','X (D=10um)','X (D=20um)','X (D=40um)','X (D=80um)','X (D=160um)','X
(D=320um)','Location','Best') % end %% Option to write T/X/dX data to Excel spreadsheet for plotting % filename_out = 'Matlab_created_drying_data2.xlsx'; % excel_data = array2table(x_all); % writetable(excel_data, filename_out); %% PICK SECONDARY MODEL FOR INVERSE PROBLEM HERE %Set up reference values for inverse problem global Tref Xref dXdtref Tref = 350; Xref = 1; %Initial parameter guesses beta0(1)= 12; %Dref beta0(2)= 200; %zT beta0(3)= 5; %zX %Uncomment the line for the model you want to use in the inverse problem. %------------------------------------------------------------------------ % fnameINV=@inv_T; beta0=[beta0(1) beta0(2)]; p=length(beta0); % fnameINV=@inv_X; beta0=[beta0(1) beta0(3)]; p=length(beta0); fnameINV=@inv_T_X; beta0=[beta0(1) beta0(2) beta0(3)]; p=length(beta0);
%% Scaled sensitivity coefficients before running inverse problem Xp=SSC_V3(beta0,xs,fnameINV); %% Can check correlation between any 2 parameters by dividing and plotting them rat12=Xp(:,1)./Xp(:,2); if p == 3 rat13=Xp(:,1)./Xp(:,3); rat23=Xp(:,2)./Xp(:,3); end if p == 4 rat14=Xp(:,1)./Xp(:,4); rat24=Xp(:,2)./Xp(:,4); rat34=Xp(:,3)./Xp(:,4); end %Now plot the ratios between parameter SSC's figure hold on plot(xs(1:ns),rat12,'r') if p == 3 plot(xs(1:ns),rat13,'g') plot(xs(1:ns),rat23,'y') end if p == 4 plot(xs(1:ns),rat14,'b') plot(xs(1:ns),rat24,'m') plot(xs(1:ns),rat34,'c') end

88
title('Checking parameter correlation before running inverse problem') %% plot SSC's for Log CFU/g cmap = ['r' 'g' 'b' 'c' 'y' 'm']'; figure hold on set(gca, 'fontsize',14,'fontweight','bold'); ypred=fnameINV(beta0,xs); h2(1)=plot(xs(1:ns),ypred(1:ns),'-','color',cmap(1,:),'LineWidth',2); %plot the predicted C to
compare to SSCs for i=1:p h2(i+1) = plot(xs(1:ns),Xp(1:ns,i),'-','color',cmap(i+1,:),'LineWidth',2); end if p == 2 %Set appropriate # of legend entries based on # of parameters in model legend('Log CFU/g','\beta_1','\beta_2') end if p == 3 legend('Log CFU/g','\beta_1','\beta_2','\beta_3') end if p == 4 legend('Log CFU/g','\beta_1','\beta_2','\beta_3','\beta_4') end xlabel('Time (s)'); ylabel('SSC (Log CFU/g)'); grid on %% INVERSE PROBLEM: Bacterial inactivation parameter estimates %nlinfit returns parameters, residuals, Jacobian (sensitivity coefficient matrix), %covariance matrix, and mean square error. ode45 is solved many times %iteratively % xobs(1,2)=stdC;xobs(1,3)=stdT;%send the y stdev into the function for regression
[beta,resids,J,COVB,mse] = nlinfit(xobs,yobs,fnameINV,beta0); mdl = fitnlm(xobs,yobs,fnameINV,beta0); %Replace nlinfit with fitnlm AICc = mdl.ModelCriterion.AICc rmse=sqrt(mse) %mean square error = SS/(n-p) total for weighted least squares n=length(xobs); nn=n(1); p=length(beta); beta condX=cond(J); %must be < 1 million detXTX=det(J'*J); % must not be near zero, the larger, the better %rmse for each scaled dependent variable rCFU=resids(1:n); rmseCFU=sqrt(rCFU'*rCFU/(n-1)); %% Model evaluation (R, Parameter CIs, Plot ypred vs yactual, Mean of resids, Residual scatter
plot/histogram) %R is the correlation matrix for the parameters, sigma is the standard error vector [R,sigma]=corrcov(COVB); relerr=sigma'./beta %Confidence intervals for parameters ci=nlparci(beta,resids,J) % %Computed ypredicted & plot vs actual data % ypred=fnameINV(beta,xs); %Mean of the residuals meanr=mean(resids) %Residual scatter plot x3=[xobs; xobs;]; figure hold on h4=plot(x3(1:n), resids(1:n), 'square','Markerfacecolor', 'b'); YLine = [0 0]; XLine = [0 max(xobs(:,1))]; plot (XLine, YLine,'R'); %plot a straight red line at zero ylabel('Observed y/\sigma - Predicted y/\sigma','fontsize',14,'fontweight','bold'); xlabel('time (min)','fontsize',14,'fontweight','bold'); %Residual histogram figure h=histogram(resids); hold on set(gca, 'fontsize',14,'fontweight','bold'); xlabel('Observed y/\sigma - Predicted y/\sigma','fontsize',16,'fontweight','bold') ylabel('Frequency','fontsize',16,'fontweight','bold') %% (1) Estimate parameters separately (Using model w/ zT) fnameINV=@inv_Tp_wF; %Inverse problem w/ temperature fixed parameter and forward problem
included.

89
beta0fixed=beta0(1); betas(1)=beta0(1); xobs_all = [sim_data; ones(length(x_all(:,1))-length(xobs(:,1)),6)]; xobs_all = [x_all xobs_all]; yobs_all = [yobs(:,1); zeros(length(x_all(:,1))-length(yobs(:,1)),1)]; ind = 1; modnum=1; betaopt=[]; %Once the parameter has been optimized, set zT_fixed so it does not loop. %Then parameter CI's can be estimated. for zT_fixed=174.7:0.5:174.7 %Try z_T at range of values to estimate Dref, test RMSE of model.
Have now minimized to 174.7, so dont need to loop anymore. [beta,resids,J,COVB,mse] = nlinfit(xobs,yobs,@(beta,t)fnameINV(beta,t,zT_fixed), betas); rmse=sqrt(mse); rmsep(ind)=rmse; zT_fixedp(ind)=zT_fixed; Drefp(ind) = beta; betas=beta; ind=ind+1; end % Plot the RMSE curve for each fixed parameter value to find optimum Dref: % figure % hold on % plot(zT_fixedp,rmsep,'r-') % set(gca, 'fontsize',14,'fontweight','bold'); % xlabel('zT') % ylabel('RMSE (log CFU/g)') % Optimum values: [rmse_opt(modnum) ind_opt]=min(rmsep); Dref_opt(modnum) = Drefp(ind_opt); zT_opt(modnum) = zT_fixedp(ind_opt); ci_Dref(modnum,:) = nlparci(beta,resids,J); %Now swap Dref in as fixed variable to get estimate of zT error Dref_fixed = Dref_opt(modnum); betas = zT_opt(modnum); fnameINV=@inv_Tp_Dfixed; [beta,resids,J,COVB,mse] = nlinfit(xobs,yobs,@(beta,t)fnameINV(beta,t,Dref_fixed), betas); ci_zT(modnum,:) = nlparci(beta,resids,J); %Use model w/o fixed parameters to get AIC: fnameINV=@inv_T_simple; betaopt = [Dref_opt(modnum) zT_opt(modnum)]; mdl1 = fitnlm(xobs,yobs,fnameINV,betaopt); %Replace nlinfit with fitnlm AICc1 = mdl1.ModelCriterion.AICc %% (2) Estimate parameters separately (Using model w/ zX) fnameINV=@inv_Xp_wF; beta0fixed=beta0(1); betas(1)=beta0(1); xobs_all = [sim_data; ones(length(x_all(:,1))-length(xobs(:,1)),6)]; xobs_all = [x_all xobs_all]; yobs_all = [yobs(:,1); zeros(length(x_all(:,1))-length(yobs(:,1)),1)]; ind = 1; modnum=2; betaopt=[]; for zX_fixed=22:0.1:22 %test RMSE of model. Have now minimized to 22.0, so dont need to loop
anymore. [beta,resids,J,COVB,mse] = nlinfit(xobs,yobs,@(beta,t)fnameINV(beta,t,zX_fixed), betas); rmse=sqrt(mse); rmsep(ind)=rmse; zX_fixedp(ind)=zX_fixed; Drefp(ind) = beta; betas=beta; ind=ind+1; end % Plot the RMSE curve for each fixed parameter value to find optimum Dref: % figure % hold on % plot(zX_fixedp,rmsep,'r-') % set(gca, 'fontsize',14,'fontweight','bold'); % xlabel('zX') % ylabel('RMSE (log CFU/g)') % Optimum values:

90
[rmse_opt(modnum) ind_opt]=min(rmsep); Dref_opt(modnum) = Drefp(ind_opt); zX_opt(modnum) = zX_fixedp(ind_opt); ci_Dref(modnum,:) = nlparci(beta,resids,J); %Now swap Dref in as fixed variable to get estimate of zX error Dref_fixed = Dref_opt(modnum); betas = zX_opt(modnum); fnameINV=@inv_Xp_Dfixed; [beta,resids,J,COVB,mse] = nlinfit(xobs,yobs,@(beta,t)fnameINV(beta,t,Dref_fixed), betas); ci_zX(modnum,:) = nlparci(beta,resids,J); %Use model w/o fixed parameters to get AIC: fnameINV=@inv_X_simple; betaopt = [Dref_opt(modnum) zX_opt(modnum)]; mdl2 = fitnlm(xobs,yobs,fnameINV,betaopt); %Replace nlinfit with fitnlm AICc2 = mdl2.ModelCriterion.AICc %% (3) Estimate parameters separately (Using model w/ zT & zX) fnameINV=@inv_T_Xp_wF; beta0fixed=beta0(1); betas(1)=beta0(1); xobs_all = [sim_data; ones(length(x_all(:,1))-length(xobs(:,1)),6)]; xobs_all = [x_all xobs_all]; yobs_all = [yobs(:,1); zeros(length(x_all(:,1))-length(yobs(:,1)),1)]; i=1; j=1; ind=1; modnum=3; betaopt=[];
for zT_fixed=170.9:0.1:170.9 %test RMSE of model. for zX_fixed=17.3:0.1:17.3 %Has been optimized to 17.3 [beta,resids,J,COVB,mse] = nlinfit(xobs,yobs,@(beta,t)fnameINV(beta,t,zT_fixed,zX_fixed),
betas); rmse=sqrt(mse); rmsep(ind)=rmse; zX_fixedp(ind)=zX_fixed; zT_fixedp(ind)=zT_fixed; Drefp(ind) = beta; betas=beta; j=j+1; ind=ind+1; end i=i+1; end % Plot the RMSE curve for each fixed parameter value to find optimum Dref: % figure % hold on % plot3(zT_fixedp,zX_fixedp,rmsep) % set(gca, 'fontsize',14,'fontweight','bold'); % xlabel('zT') % ylabel('zX') % zlabel('RMSE (log CFU/g)') %Optimum values: [rmse_opt(modnum) ind_opt]=min(rmsep); Dref_opt(modnum) = Drefp(ind_opt); zT_opt(modnum) = zT_fixedp(ind_opt); zX_opt(modnum) = zX_fixedp(ind_opt); ci_Dref(modnum,:) = nlparci(beta,resids,J); %Now swap Dref in as fixed variable to get estimate of zX error Dref_fixed = Dref_opt(modnum); betas = [zT_opt(modnum) zX_opt(modnum)]; fnameINV=@inv_T_Xp_Dfixed; [beta,resids,J,COVB,mse] = nlinfit(xobs,yobs,@(beta,t)fnameINV(beta,t,Dref_fixed), betas); ci_mod3 = nlparci(beta,resids,J); %Use model w/o fixed parameters to get AIC: fnameINV=@inv_T_X_simple; betaopt = [Dref_opt(modnum) zT_opt(modnum) zX_opt(modnum)]; mdl3 = fitnlm(xobs,yobs,fnameINV,betaopt); %Replace nlinfit with fitnlm AICc3 = mdl3.ModelCriterion.AICc %Compile CI's and calculate +/- for each ci_zt(2,:) = [0 0]; ci_zT(3,:) = ci_mod3(1,:);

91
ci_zX(3,:) = ci_mod3(2,:); ci95Dref = [(Dref_opt(1)-ci_Dref(1,1)) (Dref_opt(2)-ci_Dref(2,1)) (Dref_opt(3)-ci_Dref(3,1))]; ci95zT = [(zT_opt(1)-ci_zT(1,1)) (zT_opt(2)-ci_zT(2,1)) (zT_opt(3)-ci_zT(3,1))]; ci95zX = [(zX_opt(1)-ci_zX(1,1)) (zX_opt(2)-ci_zX(2,1)) (zX_opt(3)-ci_zX(3,1))];
%% Plot yobs vs ypred for best AIC model (with CI and PI), all data together %Best AIC model is model 3, parameters are Dref, zT, and zX fnameINV = @inv_T_X_simple; [beta,resids,J,COVB,mse] = nlinfit(xobs,yobs,fnameINV,betaopt); ci_dummy=nlparci(beta, resids, J); [ypred, delta] = nlpredci(fnameINV,xobs,betaopt,resids,J,0.05,'on','curve'); %confidence band for
regression line [ypred, deltaob] =nlpredci(fnameINV,xobs,betaopt,resids,J,0.05,'on','observation');%prediction
band for individual points CBu = ypred+delta; CBl = ypred-delta; PBu = ypred+deltaob; PBl = ypred-deltaob; % Plot all temperatures together: figure hold on set(gca, 'fontsize',14,'fontweight','bold'); cmap = ['r' 'g' 'b' 'c' 'y' 'm' 'k' ]'; xlabel('Time (s)') ylabel('Log reductions (Log CFU/g)') %First, plot observed data as points. plot(x80,y80,'or') plot(x95,y95,'om') plot(x110,y110,'oy') plot(x180,y180,'og') plot(x190,y190,'oc') plot(x200,y200,'ob') %Now plot predicted data as lines. plot(x80,ypred(1:18),'-r') plot(x95,ypred(19:35),'-m') plot(x110,ypred(36:46),'-y') plot(x180,ypred(47:57),'-g') plot(x190,ypred(58:67),'c') plot(x200,ypred(68:73),'b')
%Plot each temperature individually as subplots: figure %80C subplot(3,2,1); hold on set(gca, 'fontsize',12,'fontweight','bold'); xlabel('Time (s)') ylabel('Log reductions (log CFU/g)') axis([0 60 -8 4]) title(['80' char(176) 'C']) plot(x80,y80,'ok') plot(x80,ypred(1:18),'-k') plot(x80,CBu(1:18),'--k') plot(x80,CBl(1:18),'--k') plot(x80,PBu(1:18),':k') plot(x80,PBl(1:18),':k') %95C subplot(3,2,2); hold on set(gca, 'fontsize',12,'fontweight','bold'); xlabel('Time (s)') ylabel('Log reductions (log CFU/g)') axis([0 60 -8 4]) title(['95' char(176) 'C']) plot(x95,y95,'ok') plot(x95,ypred(19:35),'-k') plot(x95,CBu(19:35),'--k') plot(x95,CBl(19:35),'--k') plot(x95,PBu(19:35),':k') plot(x95,PBl(19:35),':k')

92
%110C subplot(3,2,3); hold on set(gca, 'fontsize',12,'fontweight','bold'); xlabel('Time (s)') ylabel('Log reductions (log CFU/g)') axis([0 60 -8 4]) title(['110' char(176) 'C']) plot(x110,y110,'ok') plot(x110,ypred(36:46),'-k') plot(x110,CBu(36:46),'--k') plot(x110,CBl(36:46),'--k') plot(x110,PBu(36:46),':k') plot(x110,PBl(36:46),':k') %180C subplot(3,2,4); hold on set(gca, 'fontsize',12,'fontweight','bold'); xlabel('Time (s)') ylabel('Log reductions (log CFU/g)') axis([0 60 -8 4]) title(['180' char(176) 'C']) plot(x180,y180,'ok') plot(x180,ypred(47:57),'-k') plot(x180,CBu(47:57),'--k') plot(x180,CBl(47:57),'--k') plot(x180,PBu(47:57),':k') plot(x180,PBl(47:57),':k') %190C subplot(3,2,5); hold on set(gca, 'fontsize',12,'fontweight','bold'); xlabel('Time (s)') ylabel('Log reductions (log CFU/g)') axis([0 60 -8 4]) title(['190' char(176) 'C']) plot(x190,y190,'ok') plot(x190,ypred(58:67),'-k') plot(x190,CBu(58:67),'--k') plot(x190,CBl(58:67),'--k') plot(x190,PBu(58:67),':k') plot(x190,PBl(58:67),':k') %200C subplot(3,2,6); hold on set(gca, 'fontsize',12,'fontweight','bold'); xlabel('Time (s)') ylabel('Log reductions (log CFU/g)') axis([0 60 -8 4]) title(['200' char(176) 'C']) plot(x200,y200,'ok') plot(x200,ypred(68:73),'-k') plot(x200,CBu(68:73),'--k') plot(x200,CBl(68:73),'--k') plot(x200,PBu(68:73),':k') plot(x200,PBl(68:73),':k')
%% Run SSC's again using optimized parameters fnameINV = @inv_T_X; modnum = 3; p=3; beta = [Dref_opt(modnum) zT_opt(modnum) zX_opt(modnum)]; Xp=SSC_V3(beta,xs,fnameINV); %can check correlation between any 2 betas by dividing and plotting them rat12=Xp(:,1)./Xp(:,2); if p == 3 rat13=Xp(:,1)./Xp(:,3); rat23=Xp(:,2)./Xp(:,3); end if p == 4 rat14=Xp(:,1)./Xp(:,4);

93
rat24=Xp(:,2)./Xp(:,4); rat34=Xp(:,3)./Xp(:,4); end figure hold on plot(xs(1:ns),rat12,'r') if p == 3 plot(xs(1:ns),rat13,'g') plot(xs(1:ns),rat23,'y') end if p == 4 plot(xs(1:ns),rat14,'b') plot(xs(1:ns),rat24,'m') plot(xs(1:ns),rat34,'c') end title('Checking parameter correlation after running inverse problem') %% plot X' for Log CFU/g %plot for C cmap = ['r' 'g' 'b' 'c' 'y' 'm' 'k' ]'; figure hold on set(gca, 'fontsize',14,'fontweight','bold'); %plot C vs t to know the total span ypred=fnameINV(beta,xs); zeroline = zeros(length(xs(:,1)),1); plot(xs(1:ns),zeroline(:),'color','k','LineWidth',1.5,'HandleVisibility','off') h2(1)=plot(xs(1:ns),ypred(1:ns),'-','color',cmap(1,:),'LineWidth',2); %plot the predicted C to
compare to SSCs for i=1:p h2(i+1) = plot(xs(1:ns),Xp(1:ns,i),'-','color',cmap(i+1,:),'LineWidth',2); end if p == 2 %Set appropriate # of legend entries based on # of parameters in model legend('Log reduction (Log CFU/g)','D_ref','z_T','Location','Best') end if p == 3 legend('Log reduction (Log CFU/g)','D_r_e_f','z_T','z_X','Location','Best') end if p == 4 legend('Log reduction (Log CFU/g)','D_ref','z_T','z_X','\beta_4','Location','Best') end xlabel('Time (s)'); ylabel('Scaled sensitivity coefficient (Log CFU/g)'); grid off %% Model validation %To use: Change Ta and D in Initial variables section to the average drying %chamber temperatures and 55um. Click run (you will get errors early, that is OK). %Then run this section. global Tref Xref dXdtref Tref = 350; Xref = 1; dXdtref = -1; %Plot predicted lines at validation temperatures: beta_val = [14.8 170.9 17.3] y_val = inv_T_X_val(beta_val, x_all); y_val(:,4:6)=[]; figure hold on set(gca, 'fontsize',14,'fontweight','bold'); xlabel('Time (s)') ylabel('Log reductions (Log CFU/g)') plot(xs(:,1),y_val(:,1),'-b','LineWidth',2) plot(xs(:,1),y_val(:,2),'-g','LineWidth',2) plot(xs(:,1),y_val(:,3),'-r','LineWidth',2) %Plot pilot-scale spray dryer data: res_time(1) = 17.2; res_time(2) = 15.2; res_time(3) = 14.8; data_val = [-3.64 0.48; -4.11 0.52; -2.40 1.77; -4.15 0.38]; errorbar(res_time(1),data_val(1,1),data_val(1,2),'bo') errorbar(res_time(1),data_val(2,1),data_val(2,2),'bs') errorbar(res_time(2),data_val(3,1),data_val(3,2),'go') errorbar(res_time(2),data_val(4,1),data_val(4,2),'gs')

94
legend('T_a_v_g=104C', 'T_a_v_g=119C', 'T_a_v_g=132C','Primary, T_i_n_l_e_t=180C','Secondary,
T_i_n_l_e_t=180C','Primary, T_i_n_l_e_t=200C','Secondary, T_i_n_l_e_t=200C')
%% Forward problem functions function Xp=SSC_V3(beta,x,yfunc) %Computes scaled sensitivity coefficients =Xp, nxp matrix %% X' = scaled sensitivity coefficients using forward-difference % This is a forward problem with known approximate parameters d=0.001; ypred=yfunc(beta,x); for i = 1:length(beta) %scaled sens coeff for forward problem betain = beta; %reset beta betain(i) = beta(i)*(1+d); yhat{i} = yfunc(betain,x); SSC{i} = (yhat{i}-ypred)/d;%scaled sens coeff for ith parameter Xp(:,i)=SSC{i}; %extract from cell array to 2D array end end
function y = DropletForward(beta,t,Ta,D) %t column 1 are the times %y1 is X, y2 is Td, y3 is dX/dt %Parameters from our drying experiment: Xcr = 9; %Critical moisture content, dry basis [kg H2O/kg solids] 10% solids w/w Ta_C = Ta-273; %Air temp [C] r = D/2; %Average droplet radius [m] A = 4*pi()*r^2; %Average droplet surface area [m^2] V = 4/3*pi()*r^3; %Average droplet volume [m^3] n = 1; %Modified CDC model parameter that allows a convex drying rate rather than linear rho_feed = 1044; %Density of feed, measured for 10% w/w SPI mix [kg/m^3] rho_H2O = 997; %Density of water [kg/m^3] md = rho_feed*V; ms = md-rho_H2O*V; Xeq = 0.07; %Equilibrium moisture content, dry basis, measured for powder after drying at 180C
inlet air temp [kg H2O/kg solids] RH = 0.01; %Relative humidity [fraction] h_heat = 104.5 ; %Heat transfer coefficient [W/m^2*K] Twb = 273+Ta_C*atan(0.151977*(RH+8.313659)^(1/2))+atan(Ta_C+RH)-atan(RH-
1.676331)+0.00391838*(RH)^(3/2)*atan(0.023101*RH)-4.686035; %Wet bulb temp [K], from Stull 2011 Hvap = -2430*10^3; %Heat of vaporization of water cp = 4120; %Specific heat of water [J/kg*K] %Generate droplet drying data now: tspan=t(:,1); %we want y at every t [t,y]=ode45(@droplet,tspan,beta); function dy = droplet(t,y) %Computes dT/dt and dX/dt at each time point f = @(X)((X-Xeq)/(Xcr-Xeq))^n; dy(1)= f(y(1))*(A*h_heat/ms/Hvap)*(Ta-Twb); dy(2)= (h_heat*A*(Ta-y(2))-Hvap*ms*dy(1))/(md*cp); dy=dy'; end y1=y(:,1); y2=y(:,2);%predicted values (y1=X, y2=Td) for i=1:(length(t)-1) %Calculates drying rate as X(t+1)-X(t) for each time point y3(i)=y1(i+1)-y1(i); %y3=dX/dt end y3(length(t)) = 0; %Final timepoint drying rate is 0 y3=y3'; y=[y1;y2;y3]; %put the y's into a column and return the values end %% Inactivation model functions %Barebones models: function y = inv_T(beta,t) global Tref sim_data x_all; time = t(:,1); X = t(:,2); Td = t(:,3); delta = 1/10; % Each time step is 1/10 of a second, using xs=linspace(0,60,601); for i=1:length(time) DV(i) = beta(1).*(10.^((Tref-Td(i))./beta(2))); y(i) = -1.*delta.*trapz(1./DV); end

95
y=y'; end function y = inv_X(beta,t) global Xref sim_data x_all; time = t(:,1); X = t(:,2); Td = t(:,3); delta = 1/10; % Each time step is 1/10 of a second, using xs=linspace(0,60,601); for i=1:length(time) DV(i) = beta(1).*(10.^((Xref-X(i))./beta(2))); y(i) = -1.*delta.*trapz(1./DV); end y=y'; end function y = inv_T_X(beta,t) global Tref Xref sim_data x_all; time = t(:,1); X = t(:,2); Td = t(:,3); delta = 1/10; % Each time step is 1/10 of a second, using xs=linspace(0,60,601); for i=1:length(time) DV(i) = beta(1).*(10.^((Tref-Td(i))./beta(2))+((Xref-X(i))./beta(3))); y(i) = -1.*delta.*trapz(1./DV); end y=y'; end
%Functions for Dref estimation using fixed other parameters: function y = inv_Tp_wF(beta,t,zT_fixed) global Tref sim_data x_all; %Now calculate smooth inactivation curve for simulated droplet xobs = t; y_all = zeros(601,6); delta = 1/10; % Each time step is 1/10 of a second, using xs=linspace(0,60,601); for i=1:length(x_all(1,:))/5 %Each Ta gets a loop for j=1:length(x_all(:,1)) %Each timestep within x_all DV(j,i) = beta(1).*(10.^((Tref-x_all(j,5*(i-1)+4))./zT_fixed)); %Calculate D-value at
each condition y_all(j,i) = -1.*delta.*trapz(1./DV(1:j,i)); %Integrate all D-values up to that
timepoint to get total inactivation end end %Now need to assign the correct y_all to yobs as yobs for i=1:length(xobs(:,1)) %For each observed data point for j = 1:length(x_all(1,:))/5 %Loop through all simulated air temperatures to check for
a match if sim_data(i,1)+273 == x_all(1,5*(j-1)+2) obsTime = sim_data(i,2); obsTimeIndex = obsTime*10+1; y(i)=y_all(obsTimeIndex,j); end end end y=y'; end function y = inv_Xp_wF(beta,t,zX_fixed) global Xref sim_data x_all; %Calculate smooth inactivation curve for simulated droplet xobs = t; y_all = zeros(601,6); delta = 1/10; % Each time step is 1/10 of a second, using xs=linspace(0,60,601); for i=1:length(x_all(1,:))/5 %Each Ta gets a loop for j=1:length(x_all(:,1)) %Each timestep within x_all DV(j,i) = beta(1).*(10.^((Xref-x_all(j,5*(i-1)+3))./zX_fixed)); y_all(j,i) = -1.*delta.*trapz(1./DV(1:j,i)); end end %Now need to assign the correct y_all to yobs as yobs for i=1:length(xobs(:,1)) %For each observed data point for j = 1:length(x_all(1,:))/5 %Loop through all simulated air temperatures to check for
a match
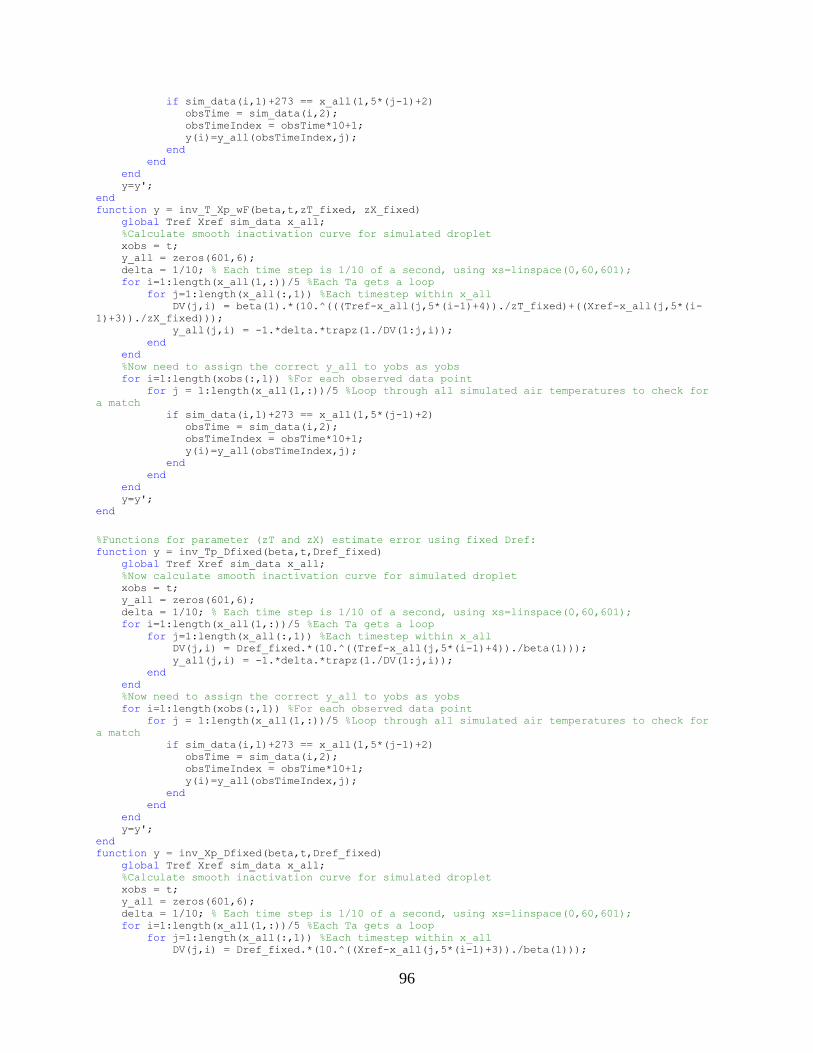
96
if sim_data(i,1)+273 == x_all(1,5*(j-1)+2) obsTime = sim_data(i,2); obsTimeIndex = obsTime*10+1; y(i)=y_all(obsTimeIndex,j); end end end y=y'; end function y = inv_T_Xp_wF(beta,t,zT_fixed, zX_fixed) global Tref Xref sim_data x_all; %Calculate smooth inactivation curve for simulated droplet xobs = t; y_all = zeros(601,6); delta = 1/10; % Each time step is 1/10 of a second, using xs=linspace(0,60,601); for i=1:length(x_all(1,:))/5 %Each Ta gets a loop for j=1:length(x_all(:,1)) %Each timestep within x_all DV(j,i) = beta(1).*(10.^(((Tref-x_all(j,5*(i-1)+4))./zT_fixed)+((Xref-x_all(j,5*(i-
1)+3))./zX_fixed))); y_all(j,i) = -1.*delta.*trapz(1./DV(1:j,i)); end end %Now need to assign the correct y_all to yobs as yobs for i=1:length(xobs(:,1)) %For each observed data point for j = 1:length(x_all(1,:))/5 %Loop through all simulated air temperatures to check for
a match if sim_data(i,1)+273 == x_all(1,5*(j-1)+2) obsTime = sim_data(i,2); obsTimeIndex = obsTime*10+1; y(i)=y_all(obsTimeIndex,j); end end end y=y'; end
%Functions for parameter (zT and zX) estimate error using fixed Dref: function y = inv_Tp_Dfixed(beta,t,Dref_fixed) global Tref Xref sim_data x_all; %Now calculate smooth inactivation curve for simulated droplet xobs = t; y_all = zeros(601,6); delta = 1/10; % Each time step is 1/10 of a second, using xs=linspace(0,60,601); for i=1:length(x_all(1,:))/5 %Each Ta gets a loop for j=1:length(x_all(:,1)) %Each timestep within x_all DV(j,i) = Dref_fixed.*(10.^((Tref-x_all(j,5*(i-1)+4))./beta(1))); y_all(j,i) = -1.*delta.*trapz(1./DV(1:j,i)); end end %Now need to assign the correct y_all to yobs as yobs for i=1:length(xobs(:,1)) %For each observed data point for j = 1:length(x_all(1,:))/5 %Loop through all simulated air temperatures to check for
a match if sim_data(i,1)+273 == x_all(1,5*(j-1)+2) obsTime = sim_data(i,2); obsTimeIndex = obsTime*10+1; y(i)=y_all(obsTimeIndex,j); end end end y=y'; end function y = inv_Xp_Dfixed(beta,t,Dref_fixed) global Tref Xref sim_data x_all; %Calculate smooth inactivation curve for simulated droplet xobs = t; y_all = zeros(601,6); delta = 1/10; % Each time step is 1/10 of a second, using xs=linspace(0,60,601); for i=1:length(x_all(1,:))/5 %Each Ta gets a loop for j=1:length(x_all(:,1)) %Each timestep within x_all DV(j,i) = Dref_fixed.*(10.^((Xref-x_all(j,5*(i-1)+3))./beta(1)));

97
y_all(j,i) = -1.*delta.*trapz(1./DV(1:j,i)); end end %Now need to assign the correct y_all to yobs as yobs for i=1:length(xobs(:,1)) %For each observed data point for j = 1:length(x_all(1,:))/5 %Loop through all simulated air temperatures to check for
a match if sim_data(i,1)+273 == x_all(1,5*(j-1)+2) obsTime = sim_data(i,2); obsTimeIndex = obsTime*10+1; y(i)=y_all(obsTimeIndex,j); end end end y=y'; end function y = inv_T_Xp_Dfixed(beta,t,Dref_fixed) global Tref Xref sim_data x_all; %Calculate smooth inactivation curve for simulated droplet xobs = t; y_all = zeros(601,6); delta = 1/10; % Each time step is 1/10 of a second, using xs=linspace(0,60,601); for i=1:length(x_all(1,:))/5 %Each Ta gets a loop for j=1:length(x_all(:,1)) %Each timestep within x_all DV(j,i) = Dref_fixed.*(10.^(((Tref-x_all(j,5*(i-1)+4))./beta(1))+((Xref-x_all(j,5*(i-
1)+3))./beta(2)))); y_all(j,i) = -1.*delta.*trapz(1./DV(1:j,i)); end end %Now need to assign the correct y_all to yobs as yobs for i=1:length(xobs(:,1)) %For each observed data point for j = 1:length(x_all(1,:))/5 %Loop through all simulated air temperatures to check for
a match if sim_data(i,1)+273 == x_all(1,5*(j-1)+2) obsTime = sim_data(i,2); obsTimeIndex = obsTime*10+1; y(i)=y_all(obsTimeIndex,j); end end end y=y'; end
%Functions for getting AIC values: function y = inv_T_simple(beta,t) global Tref Xref sim_data x_all; %Now calculate smooth inactivation curve for simulated droplet xobs = t; y_all = zeros(601,6); delta = 1/10; % Each time step is 1/10 of a second, using xs=linspace(0,60,601); for i=1:length(x_all(1,:))/5 %Each Ta gets a loop for j=1:length(x_all(:,1)) %Each timestep within x_all DV(j,i) = beta(1).*(10.^((Tref-x_all(j,5*(i-1)+4))./beta(2))); y_all(j,i) = -1.*delta.*trapz(1./DV(1:j,i)); end end %Now need to assign the correct y_all to yobs as yobs for i=1:length(xobs(:,1)) %For each observed data point for j = 1:length(x_all(1,:))/5 %Loop through all simulated air temperatures to check for
a match if sim_data(i,1)+273 == x_all(1,5*(j-1)+2) obsTime = sim_data(i,2); obsTimeIndex = obsTime*10+1; y(i)=y_all(obsTimeIndex,j); end end end y=y'; end function y = inv_X_simple(beta,t) global Tref Xref sim_data x_all;

98
%Calculate smooth inactivation curve for simulated droplet xobs = t; y_all = zeros(601,6); delta = 1/10; % Each time step is 1/10 of a second, using xs=linspace(0,60,601); for i=1:length(x_all(1,:))/5 %Each Ta gets a loop for j=1:length(x_all(:,1)) %Each timestep within x_all DV(j,i) = beta(1).*(10.^((Xref-x_all(j,5*(i-1)+3))./beta(2))); y_all(j,i) = -1.*delta.*trapz(1./DV(1:j,i)); end end %Now need to assign the correct y_all to yobs as yobs for i=1:length(xobs(:,1)) %For each observed data point for j = 1:length(x_all(1,:))/5 %Loop through all simulated air temperatures to check for
a match if sim_data(i,1)+273 == x_all(1,5*(j-1)+2) obsTime = sim_data(i,2); obsTimeIndex = obsTime*10+1; y(i)=y_all(obsTimeIndex,j); end end end y=y'; end function y = inv_T_X_simple(beta,t) global Tref Xref sim_data x_all; %Calculate smooth inactivation curve for simulated droplet xobs = t; y_all = zeros(601,6); delta = 1/10; % Each time step is 1/10 of a second, using xs=linspace(0,60,601); for i=1:length(x_all(1,:))/5 %Each Ta gets a loop for j=1:length(x_all(:,1)) %Each timestep within x_all DV(j,i) = beta(1).*(10.^(((Tref-x_all(j,5*(i-1)+4))./beta(2))+((Xref-x_all(j,5*(i-
1)+3))./beta(3)))); y_all(j,i) = -1.*delta.*trapz(1./DV(1:j,i)); end end %Now need to assign the correct y_all to yobs as yobs for i=1:length(xobs(:,1)) %For each observed data point for j = 1:length(x_all(1,:))/5 %Loop through all simulated air temperatures to check for
a match if sim_data(i,1)+273 == x_all(1,5*(j-1)+2) obsTime = sim_data(i,2); obsTimeIndex = obsTime*10+1; y(i)=y_all(obsTimeIndex,j); end end end y=y'; end
%Function for validation function y = inv_T_X_val(beta,t) global Tref Xref sim_data x_all; %Calculate smooth inactivation curve for simulated droplet xobs = t; y_all = zeros(601,6); delta = 1/10; % Each time step is 1/10 of a second, using xs=linspace(0,60,601); for i=1:length(x_all(1,:))/5 %Each Ta gets a loop for j=1:length(x_all(:,1)) %Each timestep within x_all DV(j,i) = beta(1).*(10.^(((Tref-x_all(j,5*(i-1)+4))./beta(2))+((Xref-x_all(j,5*(i-
1)+3))./beta(3)))); y_all(j,i) = -1.*delta.*trapz(1./DV(1:j,i)); end end y=y_all; end

99
REFERENCES

100
REFERENCES
Adhikari, B, T Howes, BR Bhandari, and V Troung. 2003. "Surface stickiness of drops of
carbohydrate and organic acid solutions during convective drying: Experiments and
modeling." Drying Technology 21 (5): 839-873. https://doi.org/10.1081/DRT-120021689.
Affertsholt, T, and D Pedersen. 2017. "Infant formula: a young & dynamic market." The World
of Food Ingredients. https://www.3abc.dk/wp-content/uploads/2017/06/Infant-Formula-
A-Young-and-Dynamic-Market.pdf.
Almond Board of California. 2008. "Guidelines for validation of propylene oxide
pasteurization." Accessed 3 October, 2018.
http://www.almonds.com/sites/default/files/content/attachments/ppo-validation-
guidelines.pdf.
Almond Board of California. 2017. "Processing safe product - pasteurization." Accessed 25
October, 2018. http://www.almonds.com/processors/processing-safe-
product?mobile=1#pasteurization.
Archer, J, ET Jervis, J Bird, and JE Gaze. 1998. "Heat resistance of Salmonella Weltevreden in
low-moisture environments." Journal of Food Protection 61 (8): 969-973.
https://doi.org/10.4315/0362-028X-61.8.969.
Arku, B, N Mullane, E Fox, SA Fanning, and K Jordan. 2008. "Enterobacter sakazakii survives
spray drying." International Journal of Dairy Technology 61 (1): 102-108.
https://doi.org/10.1111/j.1471-0307.2008.00375.
Armfield Engineering Teaching Equipment. 2013. Tall Form Spray Drier/Chiller Instruction
Manual.
Baker, P, J Smith, L Salmon, S Friel, G Kent, A Iellamo, JP Dadhich, and MJ Renfrew. 2016.
"Global trends and patterns of commercial milk-based formula sales: is an unprecedented
infant and young child feeding transition underway?" Public Health Nutrition 19 (14):
2540-2550. https://doi.org/10.1017/S1368980016001117.
Beuchat, LR, E Komitopoulou, H Beckers, RP Betts, F Bourdichon, S Fanning, HM Joosten, and
BH Ter Kuile. 2013. "Low-water activity foods: increased concern as vehicles of
foodborne pathogens." Journal of Food Protection 76 (1): 150-172.
https://doi.org/10.4315/0362-028X.JFP-12-211.
Bianchini, A, J Stratton, S Weier, T Hartter, B Plattner, G Rokey, G Hertzel, L Gompa, B
Martinez, and KM Eskridge. 2014. "Use of Enterococcus faecium as a surrogate for
Salmonella enterica during extrusion of a balanced carbohydrate-protein meal." Journal
of Food Protection 77 (1): 75-82. https://doi.org/10.4315/0362-028X.JFP-13-220.

101
Birchal, VS, L Huang, AS Mujumdar, and ML Passos. 2006. "Spray dryers: Modeling and
simulation." Drying Technology 24 (3): 359-371.
https://doi.org/10.1080/07373930600564431.
Brouard, C, E Espié, F Weill, A Kérouanton, A Brisabois, A Forgue, V Vaillant, and H de Valk.
2007. "Two consecutive large outbreaks of Salmonella enterica serotype Agona
infections in infants linked to the consumption of powdered infant formula." Pediatric
Infectious Disease Journal 26 (2): 148-152.
https://doi.org/10.1097/01.inf.0000253219.06258.23.
http://dx.doi.org/10.1097/01.inf.0000253219.06258.23.
Cahill, SM, IK Wachsmuth, MD Costarrica, and PK Ben Embarek. 2008. "Powdered infant
formula as a source of Salmonella infection in infants." Clinical Infectious Diseases 46
(2): 268-273. https://doi.org/10.1086/524737.
Casulli, KE. 2016. "Improving pathogen-reduction validation methods for pistachio processing."
Master of Science, Biosystems Engineering, Michigan State University.
http://gateway.proquest.com/openurl?url_ver=Z39.88-
2004&rft_val_fmt=info:ofi/fmt:kev:mtx:dissertation&res_dat=xri:pqm&rft_dat=xri:pqdis
s:10242278. https://d.lib.msu.edu/etd/4306.
Caurie, M. 2011. "Bound water: its definition, estimation and characteristics." International
Journal of Food Science and Technology 46 (5): 930-934. https://doi.org/10.1111/j.1365-
2621.2011.02581.x.
Cenkowski, S, C Pronyk, D Zmidzinska, and WE Muir. 2007. "Decontamination of food
products with superheated steam." Journal of Food Engineering 83 (1): 68-75.
https://doi.org/10.1016/j.jfoodeng.2006.12.002.
Centers for Disease Control and Prevention. 2004. "Outbreak of Salmonella Serotype Enteritidis
Infections Associated with Raw Almonds - United States and Canada, 2003 - 2004."
Accessed 6 February, 2019.
https://www.cdc.gov/mmwr/preview/mmwrhtml/mm5322a8.htm.
Centers for Disease Control and Prevention. 2011. "Multistate Outbreak of Human Salmonella
Enteritidis Infections Linked to Turkish Pine Nuts (Final Update)." Accessed October 18,
2018. https://www.cdc.gov/salmonella/2011/pine-nuts-11-17-2011.html.
Centers for Disease Control and Prevention. 2014. "Multistate Outbreak of Salmonella
Braenderup Infections Linked to Nut Butter Manufactured by nSpired Natural Foods, Inc.
(Final Update), 2014." Accessed 1 May, 2018.
https://www.cdc.gov/salmonella/braenderup-08-14/index.html.
Centers for Disease Control and Prevention. 2016a. "Multistate Outbreak of Shiga toxin-
producing Escherichia coli Infections Linked to Flour." Accessed 6 February, 2018.
https://www.cdc.gov/ecoli/2016/o121-06-16/.

102
Centers for Disease Control and Prevention. 2016b. "Multistate Outbreak of Salmonella Virchow
Infections Linked to Garden of Life RAW Meal Organic Shake & Meal Products (Final
Update)". Accessed 6 February, 2018. https://www.cdc.gov/salmonella/virchow-02-
16/index.html.
Centers for Disease Control and Prevention. 2016c. "Salmonella Paratyphi B variant L(+) tartrate
(+) Infections Linked to Sprouted Nut Butter Spreads, 2015." Accessed 1 May, 2018.
https://www.cdc.gov/salmonella/paratyphi-b-12-15/index.html.
Centers for Disease Control and Prevention. 2017a. "O157:H7 Infections Linked to I.M. Healthy
Brand SoyNut Butter." Accessed 1 May, 2018. https://www.cdc.gov/ecoli/2017/o157h7-
03-17/index.html.
Centers for Disease Control and Prevention. 2017b. "Salmonella Homepage." Accessed 31
October, 2018. https://www.cdc.gov/salmonella/index.html.
Centers for Disease Control and Prevention. 2018. "Salmonella Infections Linked to Dried
Coconut, 2018." Accessed 1 May, 2019. https://www.cdc.gov/salmonella/typhimurium-
03-18/index.html.
Centers for Disease Control and Prevention. 2019. "Salmonella Homepage." Accessed July 30,
2019. https://www.cdc.gov/salmonella/.
Ceylan, E, and DA Bautista. 2015. "Evaluating Pediococcus acidilactici and Enterococcus
faecium NRRL B-2354 as thermal surrogate microorganisms for Salmonella for in-plant
validation studies of low-moisture pet food products." Journal of Food Protection 78 (5):
934-939. https://doi.org/10.4315/0362-028X.JFP-14-271.
Chang, SS, AR Han, JI Reyes‐De‐Corcuera, JR Powers, and DH Kang. 2010. "Evaluation of
steam pasteurization in controlling Salmonella serotype Enteritidis on raw almond
surfaces." Letters in Applied Microbiology 50 (4): 393-398.
https://doi.org/10.1111/j.1472-765X.2010.02809.x.
Charlesworth, DH, and WR Marshall. 1960. "Evaporation from drops containing dissolved
solids." AIChE Journal 6 (1): 9-23. https://doi.org/10.1002/aic.690060104.
Che, LM, and XD Chen. 2010. " A simple nongravimetric technique for measurement of
convective drying kinetics of single droplets." Drying Technology 28 (1): 73-77.
https://doi.org/10.1080/07373930903430744.
Chegini, G, and M Taheri. 2013. "Whey Powder: Process Technology and Physical Properties: A
Review." Middle-East Journal of Scientific Research 13 (10): 1377-1387.
https://doi.org/10.5829/idosi.mejsr.2013.13.10.1239.
Chen, XD. 2005. "Air drying of food and biological materials - Modified Biot and Lewis number
analysis." Drying Technology 23 (9-11): 2239-2248.
https://doi.org/10.1080/07373930500212750.

103
Chen, XD. 2008. "The basics of a reaction engineering approach to modeling air-drying of small
droplets or thin-layer materials." Drying Technology 26 (6): 627-639.
https://doi.org/10.1080/07373930802045908.
Chen, XD, and SXQ Lin. 2005. "Air drying of milk droplet under constant and time-dependent
conditions." AIChE Journal 51 (6): 1790-1799. https://doi.org/10.1002/aic.10449.
Chen, XD, and KC Patel. 2007. "Micro-organism inactivation during drying of small droplets or
thin-layer slabs - A critical review of existing kinetics models and an appraisal of the
drying rate dependent model." Journal of Food Engineering 82 (1): 1-10.
https://doi.org/10.1016/j.jfoodeng.2006.12.013.
Chen, XD, and XF Peng. 2005. "Modified Biot number in the context of air drying of small
moist porous objects." Drying Technology 23 (1-2): 83-103.
https://doi.org/10.1081/DRT-200047667.
Cheong, HW, GV Jeffreys, and CJ Mumford. 1986. "A receding interface model for the drying
of slurry droplets." AIChE Journal 32 (8): 1334-1346.
https://doi.org/10.1002/aic.690320811.
Coperion. 2015. "Spray Drying Process for Dairy Powders and Infant/Baby Formulas." Accessed
December 9, 2018. https://www.coperion.com/en/news-media/newsletter/2015/food-in-
focus-edition-08/spray-drying-process-for-dairy-powders-and-infantbaby-formulas/.
Cuervo, MP, LM Lucia, and A Castillo. 2016. "Efficacy of traditional almond decontamination
treatments and electron beam irradiation against heat-resistant Salmonella Strains."
Journal of Food Protection 79 (3): 369-375. https://doi.org/10.4315/0362-028X.JFP-15-
059.
Danyluk, MD, AR Uesugi, and LJ Harris. 2005. "Survival of Salmonella Enteritidis PT 30 on
inoculated almonds after commercial fumigation with propylene oxide." Journal of Food
Protection 68 (8): 1613-1622. https://doi.org/10.4315/0362-028X-68.8.1613.
Dega, CA, CH Amundson, and JM Goepfert. 1972. "Heat resistance of Salmonellae in
concentrated milk." Applied Microbiology 23 (2): 415-420.
https://www.ncbi.nlm.nih.gov/pmc/articles/PMC380354/
DeMaria, Dominic. 2019. "Spray Dryer Atomization." Email communication with Spraying
Systems Co. representative.
DiPersio, PA, PA Kendall, and JN Sofos. 2004. "Inactivation of Listeria monocytogenes during
drying and storage of peach slices treated with acidic or sodium metabisulfite solutions."
Food Microbiology 21 (6): 641-648. https://doi.org/10.1016/j.fm.2004.03.011.
Djamarani, KM, and IM Clark. 1997. "Characterization of particle size based on fine and coarse
fractions." Powder Technology 93 (2): 101-108. https://doi.org/10.1016/S0032-
5910(97)03233-6.

104
Dobry, DE, DM Settell, JM Baumann, RJ Ray, LJ Graham, and RA Beyerinck. 2009. "A model-
based methodology for spray-drying process development." Journal of Pharmaceutical
Innovation 4 (3): 133-142. https://doi.org/10.1007/s12247-009-9064-4.
Doyle, MP, LM Meske, and EH Marth. 1985. "Survival of Listeria-monocytogenes during the
manufacture and storage of nonfat dry milk." Journal of Food Protection 48 (9): 740-
742. https://doi.org/10.4315/0362-028X-48.9.740.
Drudy, D, NR Mullane, T Quinn, PG Wall, and S Fanning. 2006. "Enterobacter sakazakii: An
emerging pathogen in powdered infant formula." Clinical Infectious Diseases 42 (7):
996-1002. https://doi.org/10.1086/501019.
Farakos, SMS, JF Frank, and DW Schaffner. 2013. "Modeling the influence of temperature,
water activity and water mobility on the persistence of Salmonella in low-moisture
foods." International Journal of Food Microbiology 166 (2): 280-293.
https://doi.org/10.1016/j.ijfoodmicro.2013.07.007.
Farakos, SMS, JW Hicks, JG Frye, and JF Frank. 2014. "Relative survival of four serotypes of
Salmonella enterica in low-water activity whey protein powder held at 36 and 70 degrees
C at various water activity levels." Journal of Food Protection 77 (7): 1198-1200.
https://doi.org/10.4315/0362-028X.JFP-13-327.
Food and Drug Administration. 1998. Bacteriological Analytical Manual.
Forsythe, SJ. 2005. "Enterobacter sakazakii and other bacteria in powdered infant milk formula."
Maternal and Child Nutrition 1 (1): 44-50. https://doi.org/10.1111/j.1740-
8709.2004.00008.x.
Fu, N, MW Woo, and XD Chen. 2012. "Single droplet drying technique to study drying kinetics
measurement and particle functionality: a review." Drying Technology 30 (15): 1771-
1785. https://doi.org/10.1080/07373937.2012.708002.
Garcés-Vega, F. 2017. "Quantifying water effects on thermal inactivation of Salmonella in low-
moisture foods." Doctor of Philosophy, Biosystems Engineering, Michigan State
University. https://d.lib.msu.edu/etd/4798.
Goderska, K, and Z Czarnecki. 2008. "Influence of microencapsulation and spray drying on the
viability of Lactobacillus and Bifidobacterium strains." Polish Journal of Microbiology
57 (2): 135-140. http://www.pjm.microbiology.pl/archive/vol5722008135.pdf.
Handscomb, CS. 2008. "Simulating droplet drying and particle formation in spray towers."
Doctor of Philosophy, Chemical Engineering, King's College.
https://como.cheng.cam.ac.uk/dissertations/csh33-PhDThesis.pdf.
Harvie, DJE, TAG Langrish, DF Fletcher. 2006. "What is important in the simulation of spray
dryer performance and how do current CFD models perform?" Applied Mathematical
Modelling 30 (11): 1281-1292. https://doi.org/10.1016/j.apm.2006.03.006

105
Huang, S, ML Vignolles, XD Chen, Y Le Loir, G Jan, P Schuck, and R Jeantet. 2017. "Spray
drying of probiotics and other food-grade bacteria: A review." Trends in Food Science &
Technology 63: 1-17. https://doi.org/10.1016/j.tifs.2017.02.007.
Isenberg, HD, D Goldberg, and J Sampson. 1970. "Laboratory studies with a selective
Enterococcus medium." Applied Microbiology 20 (3): 433-436.
https://aem.asm.org/content/20/3/433.short.
Jaskulski, M, P Wawrzyniak, and I Zbicinski. 2015. "CFD model of particle agglomeration in
spray drying." Drying Technology 33 (15-16): 1971-1980.
https://doi.org/10.1080/07373937.2015.1081605.
Jaskulski, M, P Wawrzyniak, and I Zbiciński. 2018. "CFD simulations of droplet and particle
agglomeration in an industrial counter-current spray dryer." Advanced Powder
Technology 29 (7): 1724-1733. https://doi.org/10.1016/j.apt.2018.04.007.
Jeong, S, BP Marks, and A Orta-Ramirez. 2009. "Thermal inactivation kinetics for Salmonella
Enteritidis PT30 on almonds subjected to moist-air convection heating." Journal of Food
Protection 72 (8): 1602-1609. https://doi.org/10.4315/0362-028X-72.8.1602
Jeong, S, BP Marks, and ET Ryser. 2011. "Quantifying the performance of Pediococcus sp.
(NRRL B-2354: Enterococcus faecium) as a nonpathogenic surrogate for Salmonella
Enteritidis PT30 during moist-air convection heating of almonds." Journal of Food
Protection 74 (4): 603-609. https://doi.org/10.4315/0362-028X.JFP-10-416.
Jeong, S, BP Marks, ET Ryser, and JB Harte. 2012. "The effect of X-ray irradiation on
Salmonella inactivation and sensory quality of almonds and walnuts as a function of
water activity." International Journal of Food Microbiology 153 (3): 365-371.
https://www.ncbi.nlm.nih.gov/pubmed/22189022.
Jin, Y, and XD Chen. 2009. "Numerical study of the drying process of different sized particles in
an industrial-scale spray dryer." Drying Technology 27 (3): 371-381.
https://doi.org/10.1080/07373930802682957.
Karagoz, I, RG Moreira, and ME Castell-Perez. 2014. "Radiation D-10 values for Salmonella
Typhimurium LT2 and an Escherichia coli cocktail in pecan nuts (Kanza cultivar)
exposed to different atmospheres." Food Control 39: 146-153.
https://doi.org/10.1016/j.foodcont.2013.10.041.
Kieviet, FG, and PJAM Kerkhof. 1997. "Air flow, temperature and humidity patterns in a co-
current spray dryer: Modelling and measurements." Drying Technology 15 (6-8): 1763-
1773. https://doi.org/10.1080/07373939708917325.
Kieviet, FG, J VanRaaij, PPEA DeMoor, and PJAM Kerkhof. 1997. "Measurement and
modelling of the air flow pattern in a pilot-plant spray dryer." Chemical Engineering
Research & Design 75 (A3): 321-328. https://doi.org/10.1205/026387697523778.

106
Kieviet, Frank, and PJAM Kerkhof. 1995. "Measurements of Particle Residence Time
Distributions in A Co-Current Spray Dryer." Drying Technology 13 (5-7): 1241-1248.
https://doi.org/10.1080/07373939508917019.
Kopit, LM, EB Kim, RJ Siezen, LJ Harris, and ML Marco. 2014. "Safety of the surrogate
microorganism Enterococcus faecium NRRL B-2354 for use in thermal process
validation." Applied and Environmental Microbiology 80 (6): 1899-1909.
https://doi.org/10.1128/AEM.03859-13.
Kuye, A, D Ayo, K Okpala, T Folami, F Chukwuma, A Ahmed, and S Mumah. 2009. Design of
Spray Dryers. Abuja: Raw Materials Research and Development Council.
Lagrange, V, D Whitsett, and C Burris. 2015. "Global market for dairy proteins." Journal of
Food Science 80 Suppl 1: A16-22. https://doi.org/10.1111/1750-3841.12801.
Langrish, TAG, and TK Kockel. 2001. "The assessment of a characteristic drying curve for milk
powder for use in computational fluid dynamics modelling." Chemical Engineering
Journal 84 (1): 69-74. https://doi.org/10.1016/S1385-8947(00)00384-3.
Li, XM, SXQ Lin, XD Chen, LZ Chen, and D Pearce. 2006. "Inactivation kinetics of probiotic
bacteria during the drying of single milk droplets." Drying Technology 24 (6): 695-701.
https://doi.org/10.1080/07373930600684890.
Lian, F, W Zhao, RJ Yang, YL Tang, and W Katiyo. 2015. "Survival of Salmonella enteric in
skim milk powder with different water activity and water mobility." Food Control 47: 1-
6. https://doi.org/10.1016/j.foodcont.2014.06.036.
LiCari, JJ, and NN Potter. 1970a. "Salmonella survival during spray drying and subsequent
handling of skimmilk powder. II. Effects of drying conditions." Journal of Dairy Science
53 (7): 871-876. https://doi.org/10.3168/jds.S0022-0302(70)86310-X.
LiCari, JJ, and NN Potter. 1970b. "Salmonella survival during spray drying and subsequent
handling of skimmilk powder. III. Effects of storage temperature on Salmonella and dried
milk properties." Journal of Dairy Science 53 (7): 877-882.
https://doi.org/10.3168/jds.S0022-0302(70)86311-1
Lievense, LC, MAM Verbeek, G Meerdink, and K van't Riet. 1990a. "Inactivation of
Lactobacillus plantarum during drying. I. Measurement and modelling of the drying
process." Chemical Engineering Science 47 (1): 87-97. https://doi.org/10.1016/0009-
2509(92)80203-O
Limcharoenchat, P, SE Buchholz, MK James, NO Hall, ET Ryser, and BP Marks. 2018.
"Inoculation protocols influence the thermal resistance of Salmonella Enteritidis PT 30 in
fabricated almond, wheat, and date products." Journal of Food Protection 81 (4): 606-
613. https://doi.org/10.4315/0362-028X.JFP-17-297.

107
Limcharoenchat, P, MK James, and BP Marks. 2019. "Survival and thermal resistance of
Salmonella Enteritidis PT 30 on almonds after long-term storage." Journal of Food
Protection 82 (2): 194-199. https://doi.org/10.4315/0362-028X.JFP-18-152.
Lin, SXQ, and XD Chen. 2002. "Improving the glass-filament method for accurate measurement
of drying kinetics of liquid droplets." Chemical Engineering Research & Design 80 (A4):
401-410. https://doi.org/10.1205/026387602317446443
Masters, K. 1972. Spray Drying Handbook. 5 ed. New York: Longman Scientific & Technical.
Mattick, KL, F Jorgensen, P Wang, J Pound, MH Vandeven, LR Ward, JD Legan, HM Lappin-
Scott, and TJ Humphrey. 2001. "Effect of challenge temperature and solute type on heat
tolerance of Salmonella serovars at low water activity." Applied and Environmental
Microbiology 67 (9): 4128-4136. https://doi.org/10.1128/AEM.67.9.4128-4136.2001.
Meerdink, G, and K van't Riet. 1995. "Prediction of product quality during spray drying." Food
and Bioproducts Processing 73 (C4): 165-170.
Mezhericher, M, A Levy, and I Borde. 2008. "Modelling of particle breakage during drying."
Chemical Engineering and Processing 47 (8): 1410-1417.
https://doi.org/10.1016/j.cep.2007.06.018.
Mezhericher, M, A Levy, and I Borde. 2010. "Theoretical models of single droplet drying
kinetics: a review." Drying Technology 28 (2): 278-293.
https://doi.org/10.1080/07373930903530337.
Mezhericher, M, A Levy, and I Borde. 2015. "Multi-scale multiphase modeling of transport
phenomena in spray-drying processes." Drying Technology 33 (1): 2-23.
https://doi.org/10.1080/07373937.2014.941110.
Miller, DL, JM Goepfert, and CH Amundson. 1972. "Survival of Salmonellae and Escherichia
coli during the spray drying of various food products." Journal of Food Science 37: 828-
831. https://doi.org/10.1111/j.1365-2621.1972.tb03680.x
Mondragon, R, JE Julia, L Hernandez, and JC Jarque. 2013. "Modeling of drying curves of silica
nanofluid droplets dried in an acoustic levitator using the reaction engineering approach
(REA) model." Drying Technology 31 (4): 439-451.
https://doi.org/10.1080/07373937.2012.738753.
Montazer-Rahmati, MM, and SH Ghafele-Bashi. 2007. "Improved differential modeling and
performance simulation of slurry spray dryers as verified by industrial data." Drying
Technology 25 (9): 1451-1462. https://doi.org/10.1080/07373930701536817.
Mullane, NR, B Healy, J Meade, P Whyte, PG Wall, and S Fanning. 2008. "Dissemination of
Cronobacter spp. (Enterobacter sakazakii) in a powdered milk protein manufacturing
facility." Applied and Environmental Microbiology 74 (19): 5913-5917.
https://doi.org/10.1128/AEM.00745-08.

108
Mullane, NR, P Whyte, PG Wall, T Quinn, and S Fanning. 2007. "Application of pulsed-field
gel electrophoresis to characterise and trace the prevalence of Enterobacter sakazakii in
an infant formula processing facility." International Journal of Food Microbiology 116
(1): 73-81. https://doi.org/10.1016/j.ijfoodmicro.2006.12.036.
Osaili, TM, AA Al-Nabulsi, RR Shaker, MM Ayyash, AN Olaimat, ASA Al-Hasan, KM
Kadora, and RA Holley. 2008. "Effects of extended dry storage of powdered infant milk
formula on susceptibility of Enterobacter sakazakii to hot water and ionizing radiation."
Journal of Food Protection 71 (5): 934-939. https://doi.org/10.4315/0362-028x-71.5.934.
Ozmen, L, and TAG Langrish. 2003. "An experimental investigation of the wall deposition of
milk powder in a pilot-scale spray dryer." Drying Technology 21 (7): 1253-1272.
https://doi.org/10.1081/DRT-120023179.
Oztekin, S, B Zorlugenc, and FK Zorlugenc. 2006. "Effects of ozone treatment on microflora of
dried figs." Journal of Food Engineering 75 (3): 396-399.
https://doi.org/10.1016/j.jfoodeng.2005.04.024.
Podolak, R, E Enache, W Stone, DG Black, and PH Elliott. 2010. "Sources and risk factors for
contamination, survival, persistence, and heat resistance of Salmonella in low-moisture
foods." Journal of Food Protection 73 (10): 1919-1936. https://doi.org/10.4315/0362-
028x-73.10.1919.
Prakash, A, FT Lim, C Duong, F Caporaso, and D Foley. 2010. "The effects of ionizing
irradiation on Salmonella inoculated on almonds and changes in sensory properties."
Radiation Physics and Chemistry 79 (4): 502-506.
https://doi.org/10.1016/j.radphyschem.2009.10.007.
Ramirez, CA, M Patel, and K Blok. 2006. "From fluid milk to milk powder: Energy use and
energy efficiency in the European dairy industry." Energy 31 (12): 1984-2004.
https://doi.org/10.1016/j.energy.2005.10.014.
Roos, R. 2010. "USDA estimates E coli, Salmonella costs at $3.1 billion." Accessed 15 May,
2019. http://www.cidrap.umn.edu/news-perspective/2010/05/usda-estimates-e-coli-
salmonella-costs-31-billion
Rotronic. 2015. "Milk Powder Production." Accessed 13 May, 2018.
https://www.rotronic.com/en-us/rotronic-cases-read?id=364/.
Scharff, RL. 2012. "Economic burden from health losses due to foodborne illness in the United
States." Journal of Food Protection 75 (1): 123-131. https://doi.org/10.4315/0362-
028X.JFP-11-058.
Scott, SA, JD Brooks, J Rakonjac, KMR Walker, and SH Flint. 2007. "The formation of
thermophilic spores during the manufacture of whole milk powder." International
Journal of Dairy Technology 60 (2): 109-117. https://doi.org/10.1111/j.1471-
0307.2007.00309.x.
http://www.cidrap.umn.edu/news-perspective/2010/05/usda-estimates-e-coli-salmonella-costs-31-billion

109
Shachar, D, and S Yaron. 2006. "Heat tolerance of Salmonella enterica serovars Agona,
Enteritidis, and Typhimurium in peanut butter." Journal of Food Protection 69 (11):
2687-2691. https://doi.org/10.4315/0362-028x-69.11.2687.
Sinnott, RK 2005. Coulson and Richardson's Chemical Engineering Volume 6 - Chemical
Engineering Design. 4 ed. Vol. 6. Elsevier.
Slavutsky, AM, MC Chavez, CS Favaro-trindade, and MA Bertuzzi. 2017. "Encapsulation of
Lactobacillus Acidophilus in a pilot-plant spray-dryer. Effect of process parameters on
cell viability." Journal of Food Process Engineering 40 (2).
https://doi.org/10.1111/jfpe.12394.
Smith, DF, IM Hildebrandt, KE Casulli, KD Dolan, and BP Marks. 2016. "Modeling the effect
of temperature and water activity on the thermal resistance of Salmonella Enteritidis PT
30 in Wheat Flour." Journal of Food Protection 79 (12): 2058-2065.
https://doi.org/10.4315/0362-028X.JFP-16-155.
Smith, DF, and BP Marks. 2015. "Effect of rapid product desiccation or hydration on thermal
resistance of Salmonella enterica serovar Enteritidis PT 30 in wheat flour." Journal of
Food Protection 78 (2): 281-286. https://doi.org/10.4315/0362-028X.JFP-14-403.
Stencl, J. 1999. "Water activity of skimmed milk powder in the temperature range of 20-45
degrees C." Acta Veterinaria 68 (3): 209-215. https://doi.org/10.2754/avb199968030209.
Strauss, DM. 2011. "An analysis of the FDA Food Safety Modernization Act: Protection for
consumers and boon for business." Food and Drug Law Journal 66 (3): 353-376.
https://www.researchgate.net/publication/260127947_An_analysis_of_the_FDA_Food_S
afety_Modernization_Act_Protection_for_consumers_and_boon_for_business.
Stull, R. 2011. "Wet-bulb temperature from relative humidity and air temperature." Journal of
Applied Meteorology and Climatology 50 (11): 2267-2269.
https://doi.org/10.1175/JAMC-D-11-0143.1.
Tang, CH, and XR Li. 2013. "Microencapsulation properties of soy protein isolate and storage
stability of the correspondingly spray-dried emulsions." Food Research International 52
(1): 419-428. https://doi.org/10.1016/j.foodres.2012.09.010.
Transparency Market Research. 2018. "Global Soy Protein Market to reach US$ 7.78 Bn by
2024, Rise of Functional Food Sector to Fuel Demand for Soy Protein Market." Accessed
February 14. https://globenewswire.com/news-release/2018/11/30/1659983/0/en/Global-
Soy-Protein-Market-to-reach-US-7-78-Bn-by-2024-Rise-of-Functional-Food-Sector-to-
Fuel-Demand-for-Soy-Protein-Market-TMR.html.
U.S. Food and Drug Administration. 2011. "Background on the FDA Food Safety Modernization
Act (FSMA)." Accessed 4 November, 2018.
https://www.fda.gov/Food/GuidanceRegulation/FSMA/ucm239907.htm.

110
Uesugi, AR, MD Danyluk, and LJ Harris. 2006. "Survival of Salmonella enteritidis phage type
30 on inoculated almonds stored at -20, 4, 23, and 35 degrees C." Journal of Food
Protection 69 (8): 1851-1857. https://doi.org/10.4315/0362-028x-68.8.1613.
Usera, MA, A Echeita, A Aladuena, MC Blanco, R Reymundo, MI Prieto, O Tello, R Cano, D
Herrera, and F Martinez-Navarro. 1996. "Interregional foodborne salmonellosis outbreak
due to powdered infant formula contaminated with lactose-fermenting Salmonella
Virchow." European Journal of Epidemiology 12 (4): 377-381.
https://doi.org/10.1007/BF00145301.
Van Acker, J, F De Smet, G Muyldermans, A Bougatef, A Naessens, and S Lauwers. 2001.
"Outbreak of necrotizing enterocolitis associated with Enterobacter sakazakii in
powdered milk formula." Journal of Clinical Microbiology 39 (1): 293-297.
https://doi.org/10.1128/JCM.39.1.293-297.2001.
Villa-Rojas, R, J Tang, SJ Wang, MX Gao, DH Kang, JH Mah, P Gray, ME Sosa-Morales, and
A Lopez-Malo. 2013. "Thermal inactivation of Salmonella Enteritidis PT 30 in almond
kernels as Influenced by water activity." Journal of Food Protection 76 (1): 26-32.
https://doi.org/10.4315/0362-028X.JFP-11-509.
Woo, MW, WRW Daud, AS Mujumdar, MZM Talib, WZ Hua, and SM Tasirin. 2008.
"Comparative study of droplet drying models for CFD modelling." Chemical
Engineering Research & Design 86 (9A): 1038-1048.
https://doi.org/10.1016/j.cherd.2008.04.003.
Woo, MW, WRW Daud, AS Mujumdar, ZH Wu, MZM Talib, and SM Tasirin. 2008. "CFD
evaluation of droplet drying models in a spray dryer fitted with a rotary atomizer."
Drying Technology 26 (10): 1180-1198. https://doi.org/10.1080/07373930802306953.
Woo, MW, AS Mujumdar, and WRW Daud. 2010. Spray Drying: Operation, Deposition, and
CFD Modelling. Saarbrucken, Germany: VDM Verlag Dr. Muller Aktiengesellschaft &
Co. KG.
Zbicinski, I, C Strumillo, and A Delag. 2002. "Drying kinetics and particle residence time in
spray drying." Drying Technology 20 (9): 1751-1768. https://doi.org/10.1081/DRT-
120015412.
Zion Market Research. 2016. "Whey Protein Market (Whey Protein Concentrate (WPC), Whey
Protein Isolate (WPI) and Hydrolyzed Whey Protein (HWP))for Dietary Supplement,
Pharmaceutical and Clinical Nutrition, Bakers and Confectionaries, Snacks and Dairy
Products and Others Application-Global Industry Perspective, Comprehensive Analysis,
Size, Share, Growth, Segment, Trends and Forecast, 2015 – 2021." Accessed 4
November, 2018. https://www.zionmarketresearch.com/market-analysis/whey-protein-
market.