Slk19p Is a Centromere Protein That Functions to Stabilize Mitotic Spindles
Upload
khangminh22Category
view
0download
0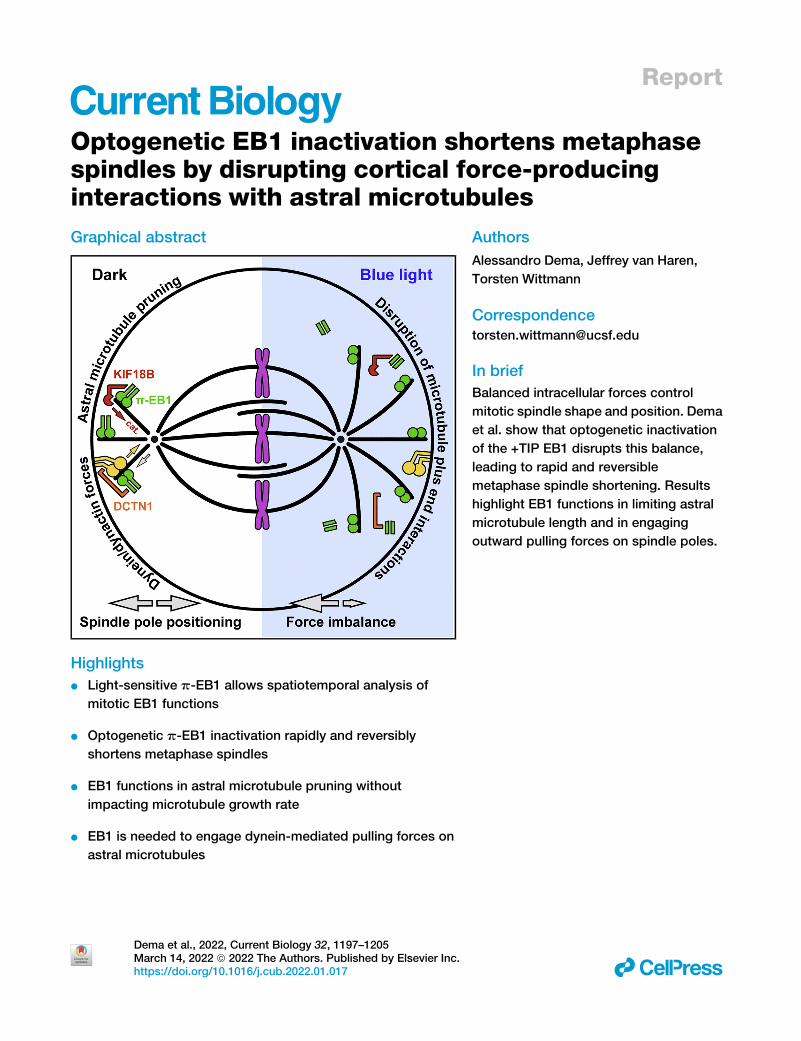
Report
Optogenetic EB1 inactivat
ion shortens metaphasespindles by disrupting cortical force-producinginteractions with astral microtubulesGraphical abstract
Highlights
d Light-sensitive p-EB1 allows spatiotemporal analysis of
mitotic EB1 functions
d Optogenetic p-EB1 inactivation rapidly and reversibly
shortens metaphase spindles
d EB1 functions in astral microtubule pruning without
impacting microtubule growth rate
d EB1 is needed to engage dynein-mediated pulling forces on
astral microtubules
Dema et al., 2022, Current Biology 32, 1197–1205March 14, 2022 ª 2022 The Authors. Published by Elsevier Inc.https://doi.org/10.1016/j.cub.2022.01.017
Authors
Alessandro Dema, Jeffrey van Haren,
Torsten Wittmann
In brief
Balanced intracellular forces control
mitotic spindle shape and position. Dema
et al. show that optogenetic inactivation
of the +TIP EB1 disrupts this balance,
leading to rapid and reversible
metaphase spindle shortening. Results
highlight EB1 functions in limiting astral
microtubule length and in engaging
outward pulling forces on spindle poles.
ll

OPEN ACCESS
llReport
Optogenetic EB1 inactivation shortens metaphasespindles by disrupting cortical force-producinginteractions with astral microtubulesAlessandro Dema,1 Jeffrey van Haren,2 and Torsten Wittmann1,3,4,*1Department of Cell & Tissue Biology, University of California, San Francisco, 513 Parnassus Avenue, San Francisco, CA 94143, USA2Department of Cell Biology, Erasmus MC, Rotterdam, the Netherlands3Twitter: @WittmannTorsten4Lead contact*Correspondence: [email protected]
https://doi.org/10.1016/j.cub.2022.01.017
SUMMARY
Chromosome segregation is accomplished by themitotic spindle, a bipolarmicromachine built primarily frommicrotubules. Different microtubule populations contribute to spindle function: kinetochore microtubulesattach and transmit forces to chromosomes, antiparallel interpolar microtubules support spindle structure,and astral microtubules connect spindle poles to the cell cortex.1,2 In mammalian cells, end-binding (EB) pro-teins associate with all growing microtubule plus ends throughout the cell cycle and serve as adaptors fordiverse +TIPs that control microtubule dynamics and interactions with other intracellular structures.3
Because binding of many +TIPs to EB1 and thus microtubule-end association is switched off by mitoticphosphorylation,4–6 the mitotic function of EBs remains poorly understood. To analyze how EB1 andassociated +TIPs on different spindle microtubule populations contribute to mitotic spindle dynamics, weuse a light-sensitive EB1 variant, p-EB1, that allows local, acute, and reversible inactivation of +TIP associ-ation with growing microtubule ends in live cells.7 We find that acute p-EB1 photoinactivation results in rapidand reversible metaphase spindle shortening and transient relaxation of tension across the central spindle.However, in contrast to interphase, p-EB1 photoinactivation does not inhibit microtubule growth in meta-phase but instead increases astral microtubule length and number. Yet in the absence of EB1 activity, astralmicrotubules fail to engage the cortical dynein/dynactin machinery, and spindle poles move away from re-gions of p-EB1 photoinactivation. In conclusion, our optogenetic approach reveals mitotic EB1 functionsthat remain hidden in genetic experiments, likely due to compensatory molecular systems regulating verte-brate spindle dynamics.
RESULTS AND DISCUSSION
p-EB1 photoinactivation reversibly shortensmetaphasespindlesTo test how acute inactivation of end-binding protein 1 (EB1)-
mediated recruitment ofmicrotubule (MT) plus-end-tracking pro-
teins (+TIPs) affects mitotic spindle organization and dynamics,
we utilized our previously published H1299 cell line in which
endogenous EB1 and EB3 are removed by CRISPR/Cas9
genome editing and replaced by stable expression of blue-
light-sensitive p-EB1.7p-EB1 has its N- and C-terminal domains
separated by a LOV2/Zdk1module, resulting in rapid and revers-
ible dissociation of the p-EB1 N-terminal MT- and C-terminal +
TIP-binding activities in response to blue light. As expected,
mCherry-Zdk1-EB1C associates with growing plus ends of
both spindle and astral MTs in the dark and rapidly dissociates
from MT ends upon blue light exposure (Figure 1A).
Given that EB1 RNAi inDrosophila S2 cells yields shorter spin-
dles8 and a fraction of mCherry-Zdk1-EB1C remains at the spin-
dle poles during blue light exposure independent of MT binding,9
Current Biology 32, 1197–1205, MaThis is an open access article under the CC BY-N
we analyzed spindle length in response to acute p-EB1 inactiva-
tion. Spindles immediately started to shorten in blue light (Fig-
ure 1B; Video S1), indicating an immediate disruption of spindle
length maintenance, yet the rate by which spindle length can
adjust is limited by spindle and cytoplasm material properties.2
On average, the spindle shortening response was well fitted by
a first-order exponential decay, which can describe the relaxa-
tion response of a viscoelastic material, with a half-life of �40 s
(Figure 1C). Using exponential fitting of individual spindle time-
lapse sequences to calculate new steady-state lengths during
blue light exposure, we found that spindles shortened by
�30% (Figure 1D). In contrast to this metaphase spindle short-
ening, p-EB1 photoinactivation did not block anaphase spindle
elongation (Figure 1E; Video S2). We therefore arrested and en-
riched cells in metaphase with the proteasome inhibitor MG132
that prevents sister chromatid separation.10 p-EB1 photoinacti-
vation induced spindle shortening in these metaphase-arrested
spindles with similar kinetics (Figures 1C and 1D). However,
compared with spindles in cycling cells, MG132-arrested spin-
dles remained slightly longer during blue light, possibly because
rch 14, 2022 ª 2022 The Authors. Published by Elsevier Inc. 1197C-ND license (http://creativecommons.org/licenses/by-nc-nd/4.0/).
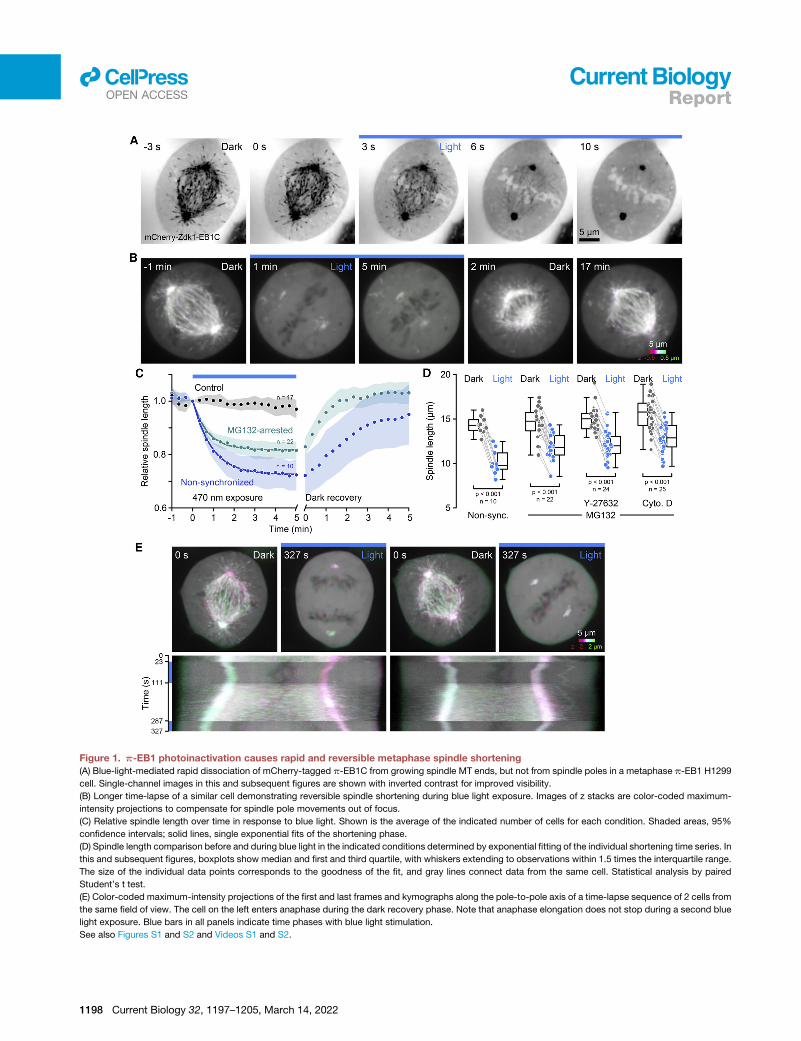
Figure 1. p-EB1 photoinactivation causes rapid and reversible metaphase spindle shortening
(A) Blue-light-mediated rapid dissociation of mCherry-tagged p-EB1C from growing spindle MT ends, but not from spindle poles in a metaphase p-EB1 H1299
cell. Single-channel images in this and subsequent figures are shown with inverted contrast for improved visibility.
(B) Longer time-lapse of a similar cell demonstrating reversible spindle shortening during blue light exposure. Images of z stacks are color-coded maximum-
intensity projections to compensate for spindle pole movements out of focus.
(C) Relative spindle length over time in response to blue light. Shown is the average of the indicated number of cells for each condition. Shaded areas, 95%
confidence intervals; solid lines, single exponential fits of the shortening phase.
(D) Spindle length comparison before and during blue light in the indicated conditions determined by exponential fitting of the individual shortening time series. In
this and subsequent figures, boxplots show median and first and third quartile, with whiskers extending to observations within 1.5 times the interquartile range.
The size of the individual data points corresponds to the goodness of the fit, and gray lines connect data from the same cell. Statistical analysis by paired
Student’s t test.
(E) Color-coded maximum-intensity projections of the first and last frames and kymographs along the pole-to-pole axis of a time-lapse sequence of 2 cells from
the same field of view. The cell on the left enters anaphase during the dark recovery phase. Note that anaphase elongation does not stop during a second blue
light exposure. Blue bars in all panels indicate time phases with blue light stimulation.
See also Figures S1 and S2 and Videos S1 and S2.
llOPEN ACCESS
1198 Current Biology 32, 1197–1205, March 14, 2022
Report

llOPEN ACCESSReport
this population is skewed toward metaphase spindles arrested
just before anaphase onset or due to proteasome-dependent
changes in protein abundance or phosphorylation blocked by
MG132 that we did not investigate further.11
Nevertheless, because of the more consistent response, we
used theMG132 block inmost subsequent experiments. Spindle
shortening was reversible, and with or without MG132, spindles
returned to their original length after blue light exposure
(Figures 1C and 1E). In addition, spindles in control cells not ex-
pressing p-EB1 did not respond to blue light, demonstrating that
spindle shortening was not due to phototoxicity (Figures 1C and
S2A) but instead is a specific effect of acute EB1 inhibition.
Neither inhibition of actomyosin contractility with the Rho-kinase
inhibitor Y27632 or a low dose of cytochalasin D that inhibits
actin polymerization dynamics inmitosis12 altered the shortening
response (Figure 1D), implying that +TIP-mediated spindle
length maintenance is predominantly MT driven. Localized
p-EB1 photoinactivation also suggested that both astral and
spindle MTs contribute to spindle length maintenance (Fig-
ure S1A), although we cannot exclude diffusion of photoinacti-
vated p-EB1 through the cell. Interestingly, spindles in cells
expressing neither EB1 nor EB3 were not shorter than in control
cells (Figure S1C), indicating that genetic loss of EB1 can be
compensated and highlights the necessity of acute perturbation
to reveal mitotic EB1 functions.
EB1 activity is required for astral microtubule lengthcontrolInhibition of MT dynamics with paclitaxel results in rapid spin-
dle shortening, possibly by inhibition of kinetochore (KT)-asso-
ciated MT assembly while maintaining MT depolymerization
near the spindle poles.13–15 In H1299 cells, the kinetics and
extent of spindle shortening either with paclitaxel (Figure S1B)
or by p-EB1 photoinactivation were remarkably similar.
Because p-EB1 photoinactivation inhibits MT growth in inter-
phase,7 we next asked how p-EB1 photoinactivation affected
MT dynamics in mitotic cells. Computational tracking of the
fluorescently tagged N terminus of p-EB1, which remains on
MT ends during blue light exposure, revealed that the MT
growth rate in metaphase was substantially lower than in inter-
phase.7 In addition, and in contrast to interphase, the meta-
phase MT growth rate was only minimally reduced by p-EB1
photoinactivation (dark: 15.1 ± 2.3 mm/min; blue light: 14.3 ±
2.4 mm/min; Figure 2A; Video S3) and not statistically signifi-
cantly different at the 99% significance level. This indicates
that EB1-dependent mechanisms that sustain fast growth of
cell-body MTs in interphase are absent in mitosis but also
shows that a decrease in MT growth cannot explain the
observed spindle shortening phenotype.
To test how EB1 supports spindle MT organization indepen-
dent of growth rate changes, we observed mCherry-tubulin dy-
namics in p-EB1-expressing cells. To our surprise and opposite
to MT growth inhibition, blue light exposure induced an increase
of MTs originating from the spindle poles resulting in an overall
‘‘hairy’’ appearance even before spindle shortening became
apparent (Figure 2C; Video S4). This was reversible, andMTs ex-
tending into the surrounding cytoplasm disappeared once blue
light exposure was terminated. Because the high background
of soluble mCherry-tubulin in mitosis makes it difficult to resolve
astral MT ends in live cells, we quantified this effect by
comparing spindle MTs in cells fixed in the dark and during
blue light exposure. In these experiments, in which a lower
dose of blue light was delivered to the whole coverslip using a
custom-designed LED ring,16 spindle shortening remained
reversible after 20 min of blue light exposure (Figure S2A).
Remarkably, compared with cells kept in the dark, both the num-
ber and length of astral MTs increased dramatically during blue
light exposure with many astral MTs extending to the cell cortex
(Figure 2D). While we cannot exclude that unbundling of antipar-
allel central spindle MTs contributes to this hairy spindle pheno-
type,17 the observed increase in astral MT length is very similar to
the RNAi phenotype of KIF18B,18,19 a MT-destabilizing kinesin
implicated in astral MT length control in metaphase.19,20
KIF18B binds to EB1 through an SxIP motif,20 and indeed, in
H1299 p-EB1 cells, KIF18B-mScarlet associated with growing
astral MT ends in the dark but was rapidly lost from spindle
MTs during blue light exposure (t1/2 = 1.3 s; Figure 2E). Thus,
although in vitro KIF18B can bind MTs independent of EB1,21
our results demonstrate that KIF18B-mediated astral MT pruning
inmetaphase requires EB1. In addition to KIF18B, another catas-
trophe-promoting kinesin, KIF2C (MCAK), contributes to mitotic
MT length control20 and similarly dissociated from growing MT
ends as a result of p-EB1 photodissociation, although KIF2C re-
mained bound to KTs independent of EB1 (Figure S3A). Such in-
hibition of catastrophe-promoting activities is further consistent
with an increased dwell time of growing astral MT ends at the
cortex (Figure 2B).
EB1 is required to engage cortical pulling forces inmetaphaseSpindle position is controlled by forces acting on astral MTs by
dynein/dynactin localized to the cell cortex.22 Transition from
end-on MT interactions with this cortical force-generating ma-
chinery in metaphase to lateral dynein/dynactin binding along
the side of astral MTs in anaphase is thought to increase
dynein-mediated forces partially driving anaphase spindle elon-
gation. Indeed, producing lateral MT attachment by flattening
cells in metaphase increases spindle length,23 the opposite of
the spindle shortening we observe when inhibiting p-EB1.
Consistent with the hypothesis that p-EB1 photoinactivation
disrupts astral MT interactions with cortical dynein/dynactin in
metaphase, blue light exposure of only one spindle pole in
H1299 p-EB1 cells resulted in asymmetric spindle shortening
in which the blue-light-illuminated pole moved away from the
cell cortex while the non-illuminated pole remained unaffected
(Figure 3A; Video S5). In addition, while spindle orientation
fluctuated randomly in the dark, asymmetric p-EB1 photoinac-
tivation on opposite sides of the pole-to-pole axis near each
spindle pole resulted in a spindle-rotation bias away from
blue-light-exposed regions (Figure 3B). Although spindle orien-
tation continued to fluctuate randomly after blue light exposure,
on average, spindles remained in their new positions. Because
in these experiments, spindle rotation stopped once spindle
poles had moved away from the blue-light-exposed regions,
to test if spindles could be rotated further, we slowly moved
wedge-shaped p-EB1 photoinactivation regions on a circular
path around the cell cortex. This experiment was technically
difficult, and only approximately a third of the cells responded
Current Biology 32, 1197–1205, March 14, 2022 1199
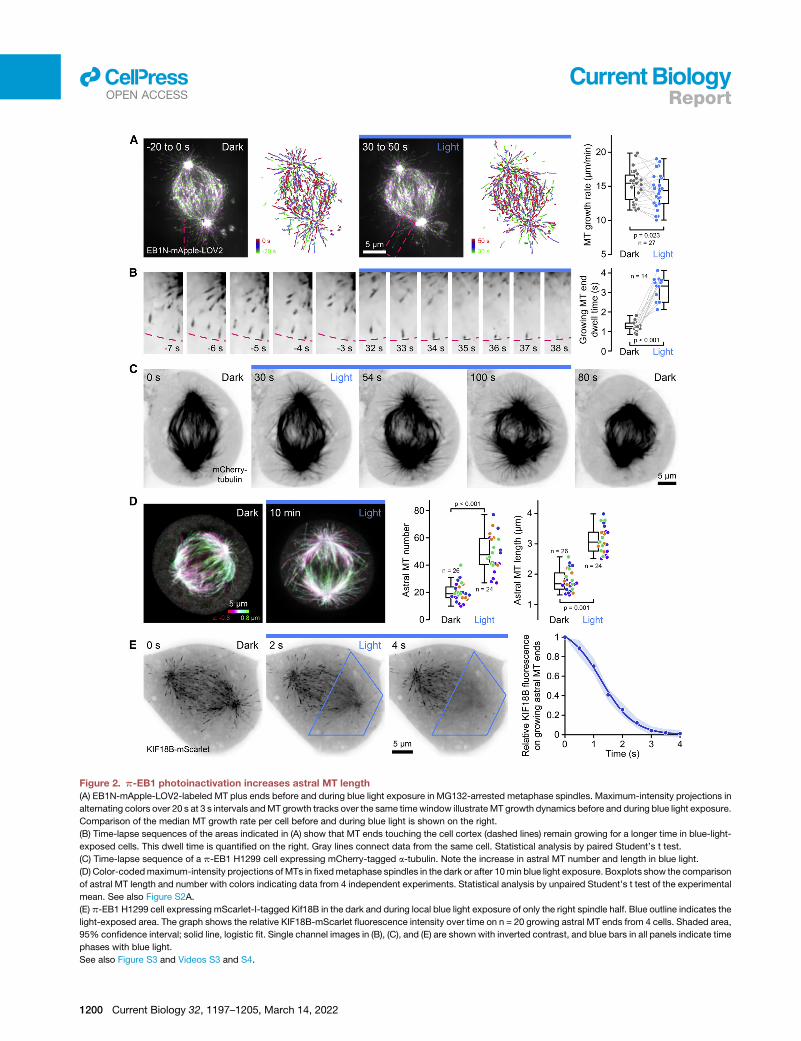
Figure 2. p-EB1 photoinactivation increases astral MT length
(A) EB1N-mApple-LOV2-labeled MT plus ends before and during blue light exposure in MG132-arrested metaphase spindles. Maximum-intensity projections in
alternating colors over 20 s at 3 s intervals andMT growth tracks over the same timewindow illustrate MT growth dynamics before and during blue light exposure.
Comparison of the median MT growth rate per cell before and during blue light is shown on the right.
(B) Time-lapse sequences of the areas indicated in (A) show that MT ends touching the cell cortex (dashed lines) remain growing for a longer time in blue-light-
exposed cells. This dwell time is quantified on the right. Gray lines connect data from the same cell. Statistical analysis by paired Student’s t test.
(C) Time-lapse sequence of a p-EB1 H1299 cell expressing mCherry-tagged a-tubulin. Note the increase in astral MT number and length in blue light.
(D) Color-codedmaximum-intensity projections of MTs in fixedmetaphase spindles in the dark or after 10min blue light exposure. Boxplots show the comparison
of astral MT length and number with colors indicating data from 4 independent experiments. Statistical analysis by unpaired Student’s t test of the experimental
mean. See also Figure S2A.
(E) p-EB1 H1299 cell expressing mScarlet-I-tagged Kif18B in the dark and during local blue light exposure of only the right spindle half. Blue outline indicates the
light-exposed area. The graph shows the relative KIF18B-mScarlet fluorescence intensity over time on n = 20 growing astral MT ends from 4 cells. Shaded area,
95% confidence interval; solid line, logistic fit. Single channel images in (B), (C), and (E) are shown with inverted contrast, and blue bars in all panels indicate time
phases with blue light.
See also Figure S3 and Videos S3 and S4.
llOPEN ACCESS
1200 Current Biology 32, 1197–1205, March 14, 2022
Report
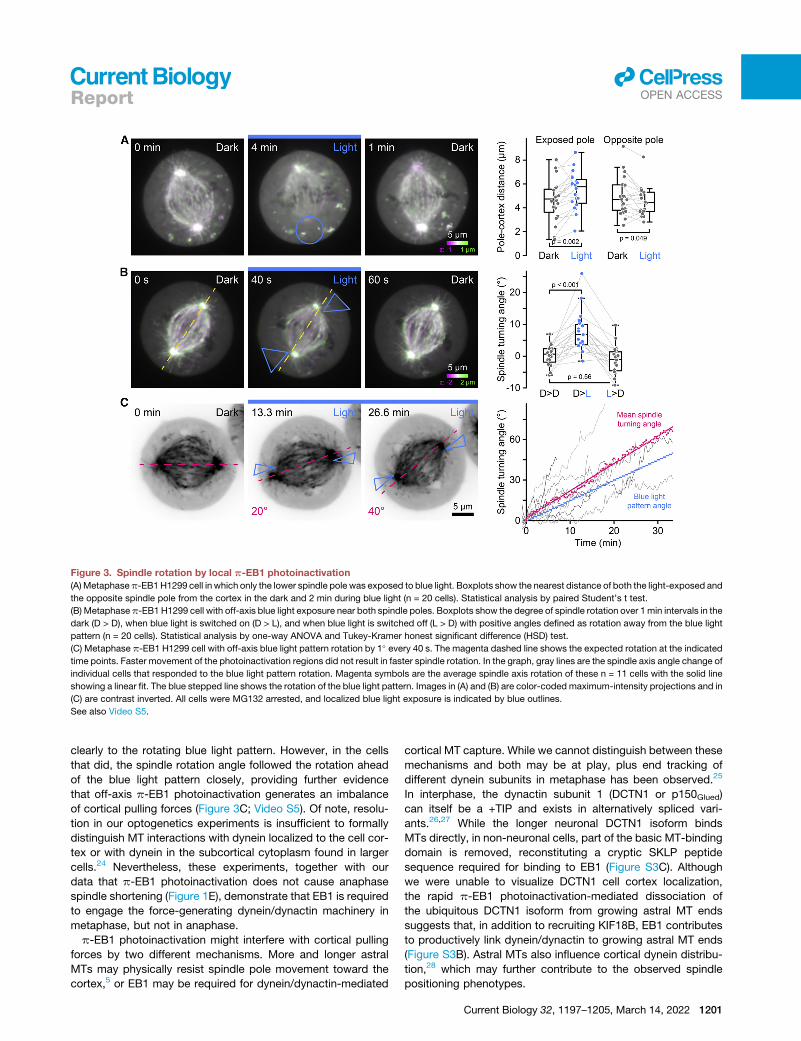
Figure 3. Spindle rotation by local p-EB1 photoinactivation
(A)Metaphasep-EB1H1299 cell in which only the lower spindle pole was exposed to blue light. Boxplots show the nearest distance of both the light-exposed and
the opposite spindle pole from the cortex in the dark and 2 min during blue light (n = 20 cells). Statistical analysis by paired Student’s t test.
(B) Metaphasep-EB1 H1299 cell with off-axis blue light exposure near both spindle poles. Boxplots show the degree of spindle rotation over 1min intervals in the
dark (D > D), when blue light is switched on (D > L), and when blue light is switched off (L > D) with positive angles defined as rotation away from the blue light
pattern (n = 20 cells). Statistical analysis by one-way ANOVA and Tukey-Kramer honest significant difference (HSD) test.
(C) Metaphase p-EB1 H1299 cell with off-axis blue light pattern rotation by 1� every 40 s. The magenta dashed line shows the expected rotation at the indicated
time points. Faster movement of the photoinactivation regions did not result in faster spindle rotation. In the graph, gray lines are the spindle axis angle change of
individual cells that responded to the blue light pattern rotation. Magenta symbols are the average spindle axis rotation of these n = 11 cells with the solid line
showing a linear fit. The blue stepped line shows the rotation of the blue light pattern. Images in (A) and (B) are color-coded maximum-intensity projections and in
(C) are contrast inverted. All cells were MG132 arrested, and localized blue light exposure is indicated by blue outlines.
See also Video S5.
llOPEN ACCESSReport
clearly to the rotating blue light pattern. However, in the cells
that did, the spindle rotation angle followed the rotation ahead
of the blue light pattern closely, providing further evidence
that off-axis p-EB1 photoinactivation generates an imbalance
of cortical pulling forces (Figure 3C; Video S5). Of note, resolu-
tion in our optogenetics experiments is insufficient to formally
distinguish MT interactions with dynein localized to the cell cor-
tex or with dynein in the subcortical cytoplasm found in larger
cells.24 Nevertheless, these experiments, together with our
data that p-EB1 photoinactivation does not cause anaphase
spindle shortening (Figure 1E), demonstrate that EB1 is required
to engage the force-generating dynein/dynactin machinery in
metaphase, but not in anaphase.
p-EB1 photoinactivation might interfere with cortical pulling
forces by two different mechanisms. More and longer astral
MTs may physically resist spindle pole movement toward the
cortex,5 or EB1 may be required for dynein/dynactin-mediated
cortical MT capture. While we cannot distinguish between these
mechanisms and both may be at play, plus end tracking of
different dynein subunits in metaphase has been observed.25
In interphase, the dynactin subunit 1 (DCTN1 or p150Glued)
can itself be a +TIP and exists in alternatively spliced vari-
ants.26,27 While the longer neuronal DCTN1 isoform binds
MTs directly, in non-neuronal cells, part of the basic MT-binding
domain is removed, reconstituting a cryptic SKLP peptide
sequence required for binding to EB1 (Figure S3C). Although
we were unable to visualize DCTN1 cell cortex localization,
the rapid p-EB1 photoinactivation-mediated dissociation of
the ubiquitous DCTN1 isoform from growing astral MT ends
suggests that, in addition to recruiting KIF18B, EB1 contributes
to productively link dynein/dynactin to growing astral MT ends
(Figure S3B). Astral MTs also influence cortical dynein distribu-
tion,28 which may further contribute to the observed spindle
positioning phenotypes.
Current Biology 32, 1197–1205, March 14, 2022 1201

Figure 4. p-EB1 photoinactivation induces transient relaxation of inter-KT tension
(A) Time-lapse sequence of a metaphase p-EB1 H1299 cell expressing mCherry-CENPA to label KTs. MTs are labeled with SiR-tubulin. Yellow arrowheads
highlight a KT pair that visibly shortens during blue light exposure.
(B) Distance between sister KTs inp-EB1 H1299metaphase spindles in the dark and at indicated times during blue light exposure. Gray lines connect data points
from the same cells but note that not all cells were followed through all time points. Statistical analysis by one-way ANOVA and Tukey-Kramer HSD test indicating
significant KT-KT distance shortening only at 3 min.
(C) Comparison of distance between sister KTs in the dark and after 3 min of local blue light exposure of only a few KT pairs. Statistical analysis by paired
Student’s t test.
(D) Timing of progression through mitosis in p-EB1 H1299 in the dark or exposed to blue light. Blue shaded areas show the kernel density distribution of all
observed cells from 3 independent experiments. Statistical analysis by unpaired Student’s t test of the experimental mean (dark blue symbols). See Figure S2B for
example time-lapse sequences.
(E) Examples of chromosome segregation (yellow arrowhead) and alignment defects in p-EB1 H1299 cells exposed to blue light either starting at meta- or
prophase as indicated compared with control cells that remained in the dark.
llOPEN ACCESS Report
p-EB1 photoinactivation transiently relaxes inter-kinetochore tensionIn metaphase, the two KTs of correctly attached chromatid pairs
are pulled toward opposite spindle poles, and the distance be-
tween sister KTs can serve as relative readout of tension across
the central spindle.6,29 Thus, to test how loss of cortical pulling
on astral MTs is transmitted through the spindle, we asked
how sister KT pairs responded to p-EB1 photoinactivation.
1202 Current Biology 32, 1197–1205, March 14, 2022
Even though this inter-KT distance fluctuates substantially over
time, KT pairs in p-EB1 cells frequently appeared to shorten
and twist away from the spindle axis during blue light exposure
(Figure 4A). Because it was difficult to accurately follow individ-
ual sister KT pairs over time, we instead measured the length
of as many KT pairs as could be identified in single optical sec-
tions at specific time points during blue light exposure. At 3 min,
the average KT-KT distance was significantly reduced by �13%
llOPEN ACCESSReport
(dark: 0.83 ± 0.11 mm; blue light: 0.72 ± 0.11 mm; Figure 4B), indi-
cating that spindles acutely relax in response to disengaging
cortical pulling forces. However, this relaxation was transient,
and normal KT-KT distance was quickly restored in the absence
of EB1 activity, demonstrating an adaptive response of EB1-in-
dependent force-generating mechanisms. In addition, KT pairs
did not shorten in response to localized p-EB1 photoinactivation
of only a small KT population on one side of the spindle (Fig-
ure 4C). Together, this implies that EB1 is not directly involved
in generating tension across KT pairs even though it is localized
to growing ends of KT-MT bundles.30 However, several EB1-
dependent +TIPs, including KIF2C, CLASP1/2,6 and Astrin-
SKAP,31 localize to KTs, and indeed p-EB1 photoinactivation
impaired accurate chromosome segregation consistent with a
role of these +TIPs in KT-MT attachment error correction.32
81% of cells (17 out of 21) exhibited chromosome segregation
errors when blue light exposure was started at metaphase
compared with 31% of control cells (18 out of 58) in the dark
(Figure 4E).
Because the duration from nuclear envelope breakdown to
completion of metaphase increased �3-fold when p-EB1
H1299 cells were exposed to a prolonged lower blue light dose
throughout the cell cycle (Figures 4D and S2B), we last asked
how p-EB1 photoinactivation affected spindle assembly. When
blue light exposure was started during prophase, spindles re-
mained very small, and chromosomes frequently failed to align
but instead surrounded a central mini spindle (Figure 4E). While
this is consistent with an inhibition of cortical pulling forces, it
also indicates additional defects in prometaphase spindle pole
separation, although EB1 interactions with the antiparallel MT-
sliding machinery that drives central spindle elongation are not
known.33
Because accurate chromosome segregation is fundamental to
life, redundant systems ensuremitotic spindle fidelity, consistent
with the mild mitotic phenotypes of genetic EB1 removal in
Drosophila8,34 and the absence of dramatic spindle defects in
vertebrate cells lacking EB1 and EB3 (Figure S1C).35 In contrast,
acute optogenetic p-EB1 inactivation reveals EB1 functions that
remain hidden in genetic experiments although chromosome
segregation defects have been observed in EB1-depleted
cells.36 However, it should be noted that p-EB1 dissociation
products may have additional dominant effects and therefore
more dramatic consequences than EB1 removal alone. For
example, the EB1 C-terminal half could interfere with cortical
MT capture, although mCherry-Zdk1-EB1C does not localize
to the cortex in blue light. Notably, although MT growth was
linked to spindle length,37,38 p-EB1 photoinactivation-mediated
spindle shortening was not accompanied by a MT growth rate
decrease. Instead, we think that acute EB1 inhibition causes
an imbalance of forces acting on spindle poles that actively
drives spindle shortening. To our knowledge, such fast and
reversible spindle length change has not previously been re-
ported. Spindles do not shorten during optogenetic inactivation
of the MT-bundling protein PRC1.39 Consistent with pulling on
astral MTs, spindles move toward optogenetically recruited
NuMa,40 but also, in these experiments, spindle length did not
change, indicating that spindle tension persists. Spindles re-
mained short inp-EB1 H1299 cells in blue light and only returned
to their original length when EB1 activity is reinstated, in
agreement with slower developmental scaling mechanisms
that act through controlling component or MT-nucleation site
availability.38,41,42 In conclusion, our results highlight the impor-
tance of EB1-mediated MT end interactions in regulating spindle
length and position and that, in addition to ensuring accurate
chromosome segregation,43 have important roles in asymmetric
developmental cell divisions.44
STAR+METHODS
Detailed methods are provided in the online version of this paper
and include the following:
d KEY RESOURCES TABLE
d RESOURCE AVAILABILITY
B Lead contact
B Materials availability
B Data and code availability
d EXPERIMENTAL MODEL AND SUBJECT DETAILS
B Cell lines and cell culture
d METHOD DETAILS
B Molecular cloning
B Live cell microscopy and p-EB1 photoinactivation
B Immunofluorescence
B Image analysis
d QUANTIFICATION AND STATISTICAL ANALYSIS
SUPPLEMENTAL INFORMATION
Supplemental information can be found online at https://doi.org/10.1016/j.
cub.2022.01.017.
ACKNOWLEDGMENTS
We thank Marvin Tanenbaum and Michael Davidson for plasmids, Tim Allertz
and Samuel Luchsinger Morcelle for help with cloning, Shima Rahgozar for
help with cell culture, and the Dumont lab and all members of the HSW-6 com-
munity for productive discussions. This work was supported by National Insti-
tutes of Health grants R21 CA224194, R01 NS107480, S10 RR026758, and
S10 OD028611 to T.W.
AUTHOR CONTRIBUTIONS
Conceptualization, A.D., J.v.H., and T.W.; methodology, A.D., J.v.H., and
T.W.; software, T.W.; investigation, A.D. and J.v.H.; writing – original draft,
A.D. and T.W.; writing – review & editing, A.D., J.v.H., and T.W.; funding acqui-
sition, T.W.; supervision, T.W.
DECLARATION OF INTERESTS
The authors declare no competing interests.
Received: September 28, 2021
Revised: December 9, 2021
Accepted: January 7, 2022
Published: January 27, 2022
REFERENCES
1. Pavin, N., and Toli�c, I.M. (2016). Self-Organization and Forces in the
Mitotic Spindle. Annu. Rev. Biophys. 45, 279–298.
2. Elting, M.W., Suresh, P., and Dumont, S. (2018). The Spindle: Integrating
Architecture and Mechanics across Scales. Trends Cell Biol. 28, 896–910.
Current Biology 32, 1197–1205, March 14, 2022 1203
llOPEN ACCESS Report
3. van Haren, J., and Wittmann, T. (2019). Microtubule Plus End Dynamics -
Do We Know How Microtubules Grow?: Cells boost microtubule growth
by promoting distinct structural transitions at growing microtubule ends.
BioEssays 41, e1800194.
4. van der Vaart, B., Manatschal, C., Grigoriev, I., Olieric, V., Gouveia, S.M.,
Bjeli�c, S., Demmers, J., Vorobjev, I., Hoogenraad, C.C., Steinmetz, M.O.,
and Akhmanova, A. (2011). SLAIN2 links microtubule plus end-tracking
proteins and controls microtubule growth in interphase. J. Cell Biol. 193,
1083–1099.
5. Singh, D., Schmidt, N., Muller, F., Bange, T., and Bird, A.W. (2021).
Destabilization of Long Astral Microtubules via Cdk1-Dependent
Removal of GTSE1 from Their Plus Ends Facilitates Prometaphase
Spindle Orientation. Curr. Biol. 31, 766–781.e8.
6. Pemble, H., Kumar, P., van Haren, J., and Wittmann, T. (2017). GSK3-
mediated CLASP2 phosphorylation modulates kinetochore dynamics.
J. Cell Sci. 130, 1404–1412.
7. van Haren, J., Charafeddine, R.A., Ettinger, A., Wang, H., Hahn, K.M., and
Wittmann, T. (2018). Local control of intracellular microtubule dynamics by
EB1 photodissociation. Nat. Cell Biol. 20, 252–261.
8. Goshima, G., Wollman, R., Stuurman, N., Scholey, J.M., and Vale, R.D.
(2005). Length control of the metaphase spindle. Curr. Biol. 15, 1979–
1988.
9. Louie, R.K., Bahmanyar, S., Siemers, K.A., Votin, V., Chang, P., Stearns,
T., Nelson, W.J., and Barth, A.I.M. (2004). Adenomatous polyposis coli
and EB1 localize in close proximity of the mother centriole and EB1 is a
functional component of centrosomes. J. Cell Sci. 117, 1117–1128.
10. Kumar, P., Chimenti, M.S., Pemble, H., Schonichen, A., Thompson, O.,
Jacobson, M.P., and Wittmann, T. (2012). Multisite phosphorylation dis-
rupts arginine-glutamate salt bridge networks required for binding of cyto-
plasmic linker-associated protein 2 (CLASP2) to end-binding protein 1
(EB1). J. Biol. Chem. 287, 17050–17064.
11. Kabeche, L., and Compton, D.A. (2013). Cyclin A regulates kinetochore
microtubules to promote faithful chromosome segregation. Nature 502,
110–113.
12. Moore, A.S., Coscia, S.M., Simpson, C.L., Ortega, F.E., Wait, E.C.,
Heddleston, J.M., Nirschl, J.J., Obara, C.J., Guedes-Dias, P., Boecker,
C.A., et al. (2021). Actin cables and comet tails organizemitochondrial net-
works in mitosis. Nature 591, 659–664.
13. Waters, J.C., Mitchison, T.J., Rieder, C.L., and Salmon, E.D. (1996). The
kinetochore microtubule minus-end disassembly associated with pole-
ward flux produces a force that can do work. Mol. Biol. Cell 7, 1547–1558.
14. Dumont, S., and Mitchison, T.J. (2009). Force and length in the mitotic
spindle. Curr. Biol. 19, R749–R761.
15. Shirasu-Hiza, M., Perlman, Z.E., Wittmann, T., Karsenti, E., andMitchison,
T.J. (2004). Eg5 causes elongation of meiotic spindles when flux-associ-
ated microtubule depolymerization is blocked. Curr. Biol. 14, 1941–1945.
16. van Haren, J., Adachi, L.S., and Wittmann, T. (2020). Optogenetic control
of microtubule dynamics. In Methods in Molecular Biology (Humana
Press), pp. 211–234.
17. Thomas, E.C., Ismael, A., and Moore, J.K. (2020). Ase1 domains dynami-
cally slow anaphase spindle elongation and recruit Bim1 to the midzone.
Mol. Biol. Cell 31, 2733–2747.
18. Stout, J.R., Yount, A.L., Powers, J.A., Leblanc, C., Ems-McClung, S.C.,
and Walczak, C.E. (2011). Kif18B interacts with EB1 and controls astral
microtubule length during mitosis. Mol. Biol. Cell 22, 3070–3080.
19. Walczak, C.E., Zong, H., Jain, S., and Stout, J.R. (2016). Spatial regulation
of astral microtubule dynamics by Kif18B in PtK cells. Mol. Biol. Cell 27,
3021–3030.
20. Tanenbaum, M.E., Macurek, L., van der Vaart, B., Galli, M., Akhmanova,
A., and Medema, R.H. (2011). A complex of Kif18b and MCAK promotes
microtubule depolymerization and is negatively regulated by Aurora ki-
nases. Curr. Biol. 21, 1356–1365.
1204 Current Biology 32, 1197–1205, March 14, 2022
21. McHugh, T., Gluszek, A.A., and Welburn, J.P.I. (2018). Microtubule end
tethering of a processive kinesin-8 motor Kif18b is required for spindle
positioning. J. Cell Biol. 217, 2403–2416.
22. Kiyomitsu, T. (2019). The cortical force-generatingmachinery: how cortical
spindle-pulling forces are generated. Curr. Opin. Cell Biol. 60, 1–8.
23. Guild, J., Ginzberg, M.B., Hueschen, C.L., Mitchison, T.J., and Dumont, S.
(2017). Increased lateral microtubule contact at the cell cortex is sufficient
to drive mammalian spindle elongation. Mol. Biol. Cell 28, 1975–1983.
24. Xie, J., and Minc, N. (2020). Cytoskeleton Force Exertion in Bulk
Cytoplasm. Front. Cell Dev. Biol. 8, 69.
25. Schmidt, R., Fielmich, L.E., Grigoriev, I., Katrukha, E.A., Akhmanova, A.,
and van den Heuvel, S. (2017). Two populations of cytoplasmic dynein
contribute to spindle positioning in C. elegans embryos. J. Cell Biol. 216,
2777–2793.
26. Dixit, R., Levy, J.R., Tokito, M., Ligon, L.A., and Holzbaur, E.L.F. (2008).
Regulation of dynactin through the differential expression of p150Glued
isoforms. J. Biol. Chem. 283, 33611–33619.
27. Zhapparova, O.N., Bryantseva, S.A., Dergunova, L.V., Raevskaya, N.M.,
Burakov, A.V., Bantysh, O.B., Shanina, N.A., and Nadezhdina, E.S.
(2009). Dynactin subunit p150Glued isoforms notable for differential inter-
action with microtubules. Traffic 10, 1635–1646.
28. Tame, M.A., Raaijmakers, J.A., van den Broek, B., Lindqvist, A., Jalink, K.,
and Medema, R.H. (2014). Astral microtubules control redistribution of
dynein at the cell cortex to facilitate spindle positioning. Cell Cycle 13,
1162–1170.
29. Elting, M.W., Prakash, M., Udy, D.B., and Dumont, S. (2017). Mapping
Load-Bearing in the Mammalian Spindle Reveals Local Kinetochore
Fiber Anchorage that Provides Mechanical Isolation and Redundancy.
Curr. Biol. 27, 2112–2122.e5.
30. Tirnauer, J.S., Canman, J.C., Salmon, E.D., and Mitchison, T.J. (2002).
EB1 targets to kinetochores with attached, polymerizing microtubules.
Mol. Biol. Cell 13, 4308–4316.
31. Kern, D.M., Monda, J.K., Su, K.C., Wilson-Kubalek, E.M., and
Cheeseman, I.M. (2017). Astrin-SKAP complex reconstitution reveals its
kinetochore interaction with microtubule-bound Ndc80. eLife 6, e26866.
32. Manning, A.L., Bakhoum, S.F., Maffini, S., Correia-Melo, C., Maiato, H.,
and Compton, D.A. (2010). CLASP1, astrin and Kif2b form a molecular
switch that regulates kinetochore-microtubule dynamics to promote
mitotic progression and fidelity. EMBO J. 29, 3531–3543.
33. Vuku�si�c, K., Ponjavi�c, I., BuCa, R., Risteski, P., and Toli�c, I.M. (2021).
Microtubule-sliding modules based on kinesins EG5 and PRC1-depen-
dent KIF4A drive human spindle elongation. Dev. Cell 56, 1253–1267.e10.
34. Rogers, S.L., Rogers, G.C., Sharp, D.J., and Vale, R.D. (2002). Drosophila
EB1 is important for proper assembly, dynamics, and positioning of the
mitotic spindle. J. Cell Biol. 158, 873–884.
35. Yang, C., Wu, J., de Heus, C., Grigoriev, I., Liv, N., Yao, Y., Smal, I.,
Meijering, E., Klumperman, J., Qi, R.Z., and Akhmanova, A. (2017). EB1
and EB3 regulate microtubule minus end organization and Golgi
morphology. J. Cell Biol. 216, 3179–3198.
36. Draviam, V.M., Shapiro, I, Aldridge, B, and Sorger, P.K. (2006).
Misorientation and reduced stretching of aligned sister kinetochores pro-
mote chromosome missegregation in EB1- or APC-depleted cells. EMBO
J. 25, 2814–2827.
37. Reber, S.B., Baumgart, J., Widlund, P.O., Pozniakovsky, A., Howard, J.,
Hyman, A.A., and Julicher, F. (2013). XMAP215 activity sets spindle length
by controlling the total mass of spindle microtubules. Nat. Cell Biol. 15,
1116–1122.
38. Rieckhoff, E.M., Berndt, F., Elsner, M., Golfier, S., Decker, F., Ishihara, K.,
and Brugu�es, J. (2020). Spindle Scaling Is Governed by Cell Boundary
Regulation of Microtubule Nucleation. Curr. Biol. 30, 4973–4983.e10.
39. Jagri�c, M., Risteski, P., Martin�ci�c, J., Milas, A., and Toli�c, I.M. (2021).
Optogenetic control of PRC1 reveals its role in chromosome alignment
on the spindle by overlap length-dependent forces. eLife 10, e61170.

llOPEN ACCESSReport
40. Okumura, M., Natsume, T., Kanemaki, M.T., and Kiyomitsu, T. (2018).
Dynein-Dynactin-NuMA clusters generate cortical spindle-pulling forces
as a multi-arm ensemble. eLife 7, e36559.
41. Good, M.C., Vahey, M.D., Skandarajah, A., Fletcher, D.A., and Heald, R.
(2013). Cytoplasmic volume modulates spindle size during embryogen-
esis. Science 342, 856–860.
42. Hazel, J., Krutkramelis, K., Mooney, P., Tomschik, M., Gerow, K., Oakey,
J., and Gatlin, J.C. (2013). Changes in cytoplasmic volume are sufficient to
drive spindle scaling. Science 342, 853–856.
43. Goshima, G., and Scholey, J.M. (2010). Control of mitotic spindle length.
Annu. Rev. Cell Dev. Biol. 26, 21–57.
44. Sunchu, B., and Cabernard, C. (2020). Principles and mechanisms of
asymmetric cell division. Dev. 147, dev167650.
45. Wittmann, T., and van Haren, J. (2018). Generation of cell lines with light-
controlled microtubule dynamics. Protoc. Exch. https://doi.org/10.1038/
protex.2017.155.
46. Boersma, S., Khuperkar, D., Verhagen, B.M.P., Sonneveld, S., Grimm,
J.B., Lavis, L.D., and Tanenbaum, M.E. (2019). Multi-Color Single-
Molecule Imaging Uncovers Extensive Heterogeneity in mRNA
Decoding. Cell 178, 458–472.e19.
47. Stehbens, S., Pemble, H., Murrow, L., and Wittmann, T. (2012). Imaging
intracellular protein dynamics by spinning disk confocal microscopy.
Methods Enzymol. 504, 293–313.
48. Stehbens, S.J., Paszek, M., Pemble, H., Ettinger, A., Gierke, S., and
Wittmann, T. (2014). CLASPs link focal-adhesion-associated microtubule
capture to localized exocytosis and adhesion site turnover. Nat. Cell Biol.
16, 561–573.
49. Schindelin, J., Arganda-Carreras, I., Frise, E., Kaynig, V., Longair, M.,
Pietzsch, T., Preibisch, S., Rueden, C., Saalfeld, S., Schmid, B., et al.
(2012). Fiji: an open-source platform for biological-image analysis. Nat.
Methods 9, 676–682.
Current Biology 32, 1197–1205, March 14, 2022 1205
llOPEN ACCESS Report
STAR+METHODS
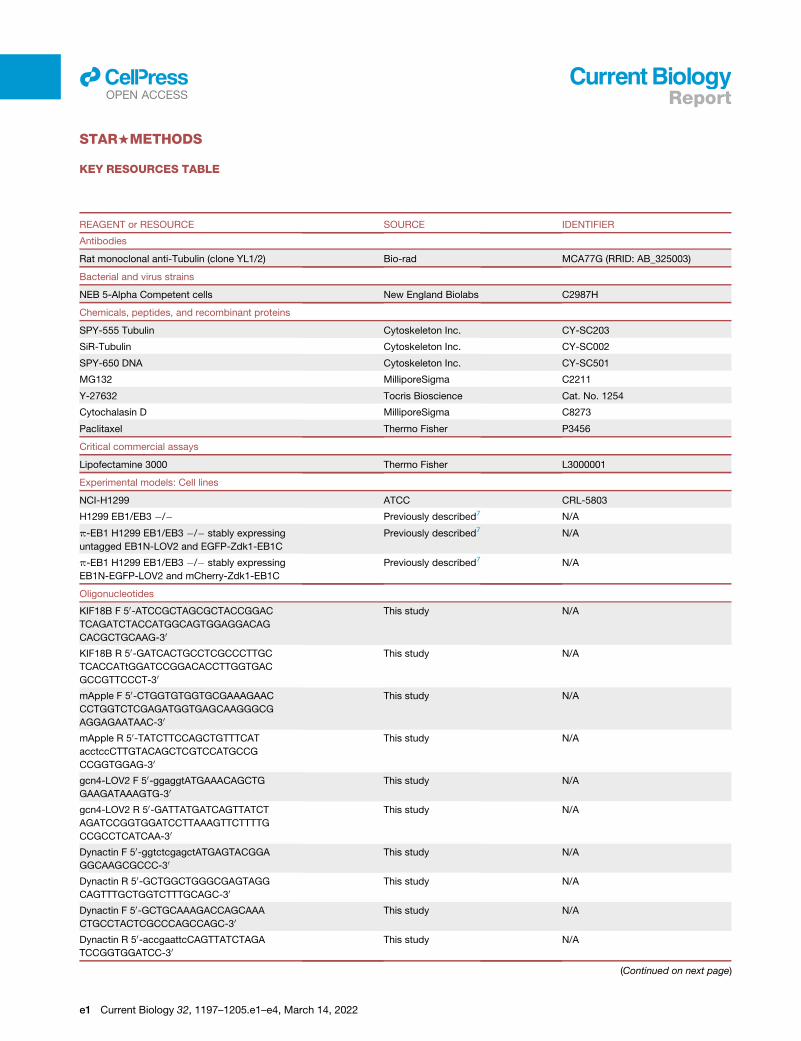
KEY RESOURCES TABLE
REAGENT or RESOURCE SOURCE IDENTIFIER
Antibodies
Rat monoclonal anti-Tubulin (clone YL1/2) Bio-rad MCA77G (RRID: AB_325003)
Bacterial and virus strains
NEB 5-Alpha Competent cells New England Biolabs C2987H
Chemicals, peptides, and recombinant proteins
SPY-555 Tubulin Cytoskeleton Inc. CY-SC203
SiR-Tubulin Cytoskeleton Inc. CY-SC002
SPY-650 DNA Cytoskeleton Inc. CY-SC501
MG132 MilliporeSigma C2211
Y-27632 Tocris Bioscience Cat. No. 1254
Cytochalasin D MilliporeSigma C8273
Paclitaxel Thermo Fisher P3456
Critical commercial assays
Lipofectamine 3000 Thermo Fisher L3000001
Experimental models: Cell lines
NCI-H1299 ATCC CRL-5803
H1299 EB1/EB3 �/� Previously described7 N/A
p-EB1 H1299 EB1/EB3 �/� stably expressing
untagged EB1N-LOV2 and EGFP-Zdk1-EB1C
Previously described7 N/A
p-EB1 H1299 EB1/EB3 �/� stably expressing
EB1N-EGFP-LOV2 and mCherry-Zdk1-EB1C
Previously described7 N/A
Oligonucleotides
KIF18B F 50-ATCCGCTAGCGCTACCGGAC
TCAGATCTACCATGGCAGTGGAGGACAG
CACGCTGCAAG-30
This study N/A
KIF18B R 50-GATCACTGCCTCGCCCTTGC
TCACCATtGGATCCGGACACCTTGGTGAC
GCCGTTCCCT-30
This study N/A
mApple F 50-CTGGTGTGGTGCGAAAGAAC
CCTGGTCTCGAGATGGTGAGCAAGGGCG
AGGAGAATAAC-30
This study N/A
mApple R 50-TATCTTCCAGCTGTTTCAT
acctccCTTGTACAGCTCGTCCATGCCG
CCGGTGGAG-30
This study N/A
gcn4-LOV2 F 50-ggaggtATGAAACAGCTG
GAAGATAAAGTG-30This study N/A
gcn4-LOV2 R 50-GATTATGATCAGTTATCT
AGATCCGGTGGATCCTTAAAGTTCTTTTG
CCGCCTCATCAA-30
This study N/A
Dynactin F 50-ggtctcgagctATGAGTACGGA
GGCAAGCGCCC-30This study N/A
Dynactin R 50-GCTGGCTGGGCGAGTAGG
CAGTTTGCTGGTCTTTGCAGC-30This study N/A
Dynactin F 50-GCTGCAAAGACCAGCAAA
CTGCCTACTCGCCCAGCCAGC-30This study N/A
Dynactin R 50-accgaattcCAGTTATCTAGA
TCCGGTGGATCC-30This study N/A
(Continued on next page)
e1 Current Biology 32, 1197–1205.e1–e4, March 14, 2022
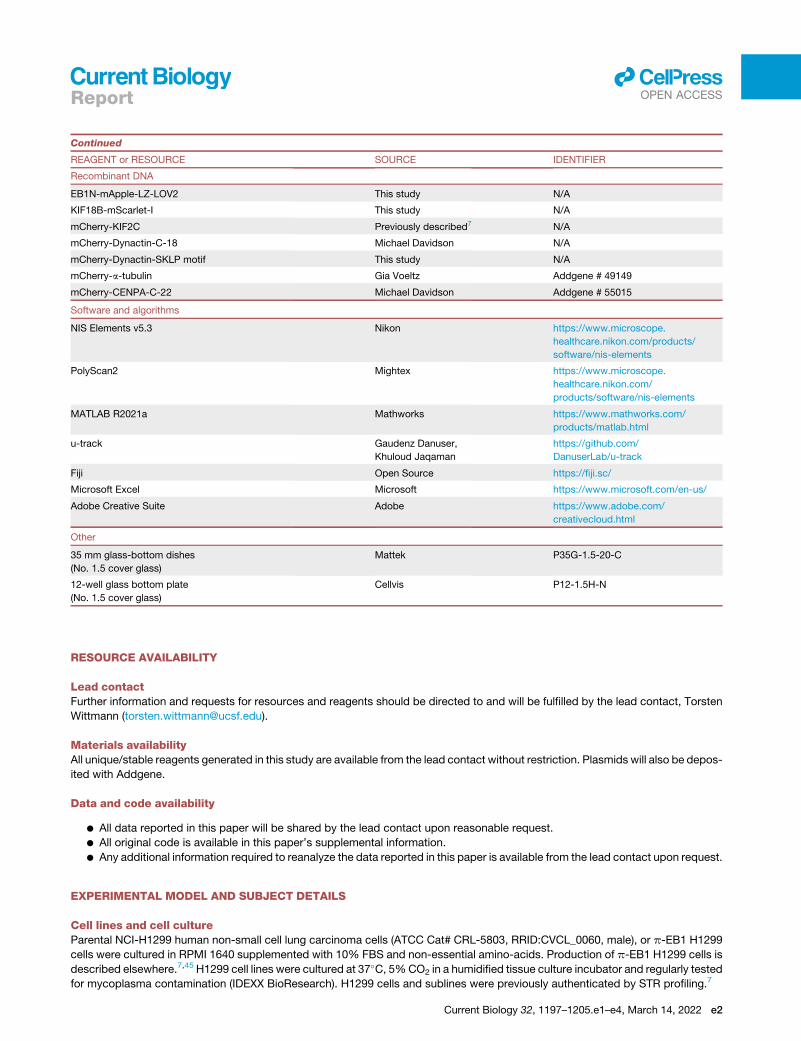
Continued
REAGENT or RESOURCE SOURCE IDENTIFIER
Recombinant DNA
EB1N-mApple-LZ-LOV2 This study N/A
KIF18B-mScarlet-I This study N/A
mCherry-KIF2C Previously described7 N/A
mCherry-Dynactin-C-18 Michael Davidson N/A
mCherry-Dynactin-SKLP motif This study N/A
mCherry-a-tubulin Gia Voeltz Addgene # 49149
mCherry-CENPA-C-22 Michael Davidson Addgene # 55015
Software and algorithms
NIS Elements v5.3 Nikon https://www.microscope.
healthcare.nikon.com/products/
software/nis-elements
PolyScan2 Mightex https://www.microscope.
healthcare.nikon.com/
products/software/nis-elements
MATLAB R2021a Mathworks https://www.mathworks.com/
products/matlab.html
u-track Gaudenz Danuser,
Khuloud Jaqaman
https://github.com/
DanuserLab/u-track
Fiji Open Source https://fiji.sc/
Microsoft Excel Microsoft https://www.microsoft.com/en-us/
Adobe Creative Suite Adobe https://www.adobe.com/
creativecloud.html
Other
35 mm glass-bottom dishes
(No. 1.5 cover glass)
Mattek P35G-1.5-20-C
12-well glass bottom plate
(No. 1.5 cover glass)
Cellvis P12-1.5H-N
llOPEN ACCESSReport
RESOURCE AVAILABILITY
Lead contactFurther information and requests for resources and reagents should be directed to and will be fulfilled by the lead contact, Torsten
Wittmann ([email protected]).
Materials availabilityAll unique/stable reagents generated in this study are available from the lead contact without restriction. Plasmids will also be depos-
ited with Addgene.
Data and code availability
d All data reported in this paper will be shared by the lead contact upon reasonable request.
d All original code is available in this paper’s supplemental information.
d Any additional information required to reanalyze the data reported in this paper is available from the lead contact upon request.
EXPERIMENTAL MODEL AND SUBJECT DETAILS
Cell lines and cell cultureParental NCI-H1299 human non-small cell lung carcinoma cells (ATCC Cat# CRL-5803, RRID:CVCL_0060, male), or p-EB1 H1299
cells were cultured in RPMI 1640 supplemented with 10% FBS and non-essential amino-acids. Production of p-EB1 H1299 cells is
described elsewhere.7,45 H1299 cell lines were cultured at 37�C, 5%CO2 in a humidified tissue culture incubator and regularly tested
for mycoplasma contamination (IDEXX BioResearch). H1299 cells and sublines were previously authenticated by STR profiling.7
Current Biology 32, 1197–1205.e1–e4, March 14, 2022 e2

llOPEN ACCESS Report
METHOD DETAILS
Molecular cloningThe KIF18B coding sequence was amplified by PCR from 24xMoonTag-kif18b-24xPP7 (Addgene plasmid #12860446 was a gift from
Marvin Tanenbaum) and cloned into KpnI and BamHI sites of pCMV-CKAP5-mScarlet-I7 by Gibson Assembly thereby replacing the
CKAP5 ORF with KIF18B.
pEB1N-mApple-LZ-LOV2 was cloned by inserting the mApple and LZ-LOV2 coding sequences into the XhoI and BamHI sites of
EB1N-mCherry-LZ-LOV27 by Gibson Assembly. mApple and LZ-LOV2 coding sequences were amplified using primers detailed in
the key resource table.
mCherry-Dynactin-C-18, representing the neuronal DCTN1 isoform, was obtained from the UCSF Michael Davidson plasmid
collection. The alternatively spliced ubiquitous DCTN1 isoformwas generated by PCR amplification of the dynactin coding sequence
upstream and downstream of the SKLP motif sequence using mCherry-Dynactin-C18 as a template. Resulting PCR amplicons were
joined by overlap extension PCR using the two outermost primers. The final PCR product was digested with XhoI and EcoRI and
ligated into the XhoI/EcoRI sites of plasmid pBio-mCherry-C1.
All constructs were verified by sequencing and primer sequences are included in the key resources table.
Live cell microscopy and p-EB1 photoinactivationFor microscopy, cells were plated in glass-bottom dishes (Mattek). Cells were arrested in metaphase with 10 mM MG132
(MilliporeSigma) shortly before imaging andwere used for amaximumof 4 h after MG132 addition. 10 mMY27632 (Tocris Bioscience)
was added 2 h before imaging to inhibit ROCK. 100 nM Cytochalasin D (MilliporeSigma) was added 1 h before imaging to inhibit
f-actin polymerization dynamics. 5 mM paclitaxel (Thermo Fisher) was added during imaging. Spy555-tubulin (Cytoskeleton. Inc)
was added to the medium 30 min before cell imaging at a 1:2000 dilution from a stock prepared according to the manufacturer’s
directions. SiR-tubulin (Cytoskeleton. Inc) was employed in a similar fashion at a 300 nM final concentration. Transfection was per-
formed with Lipofectamine 3000 (Thermo Fisher) according to manufacturer’s protocol.
Spindle shortening and position experiments were done on a Yokogawa CSU-X1 spinning disk confocal microscopy on a micro-
scope system essentially as described,47 but upgraded with a more sensitive Prime BSI sCMOS camera (Teledyne Photometrics)
with a 60x 1.49 NA oil immersion lens (Nikon). On this microscope, a Polygon 1000 digital micromirror device (Mightex) equipped
with a 470 nm LED is coupled into an auxiliary eyepiece camera port on a Ti-E inverted microscope stand (Nikon).16 Using an 80/20
beamsplitter in the emission lightpath this allows simultaneous confocal imaging and p-EB1 photoinactivation. Blue light exposure
regions were drawn on the fly with the PolyScan2 software (Mightex) using a still acquisition as template, except to induce pro-
longed spindle rotation. In the spindle rotation experiment, a sequence of small triangular regions on opposite sides of the spindle
pole axis was pre-programmed in PolyScan2 and rotated around the cell center by 1� every 40 s. For fast time-lapse imaging with
acquisition frequencies at or above 1 Hz, blue light exposure was directly triggered by the camera with a 40 ms delay after camera
exposure and 10 ms blue light pulses. In experiments with slower time lapse acquisition, the Polygon was triggered with an Arduino
microcontroller at 1-2 Hz.
All other Imaging of intracellular dynamics was performed on a newer Yokogawa CSU-W1/SoRa spinning disk confocal system in
SoRamode on a Ti2 invertedmicroscope stand (Nikon), and images acquiredwith anORCAFusion BT sCMOS camera (Hamamatsu)
with 2x2 binning to reduce photobleaching. EB1N-mApple-LOV2 imaging experiments tomeasureMTgrowth rates had three phases
(20 s image acquisition without blue light exposure, 30 s blue light exposure without image acquisition, and finally 20 s image acqui-
sition with blue light) with images acquired every 0.5 s to capture equilibriumMT dynamics before and during blue light exposure. This
system was similarly equipped with a Polygon 1000 (Mightex) through an auxiliary filter turret and LAPP illuminator (Nikon) and inte-
grated control of imaging and photoactivation was through NIS Elements v5.3 software (Nikon).
Lastly, bulk blue light exposure of cells in glass-bottom 12-well plates (Cellvis) for long-term multi-point imaging of cell cycle pro-
gression and for analyzing spindle structure in fixed cells was done with a custom-built Arduino-controlled 470 nm LED cube.16 In all
cases, the minimal blue light dose to achieve p-EB1 photoinactivation was determined by observing dissociation of fluorescently
labeled p-EB1 C-terminal constructs from growing MT ends.7
ImmunofluorescenceMicrotubule staining was performed as described.48 In brief, cells grown on coverslips were washed in PBS, fixed in 0.25% glutar-
aldehyde in 80 mM K-PIPES, 1 mM EGTA, 1 mM MgCl2, then quenched three times in 0.1% NaBH4 in PBS. Fixed cells were per-
meabilized with 0.3% Triton X-100 in PBS, then blocked in 1% BSA in PBS, and stained with rat anti a-tubulin (Biorad, MCA77G)
diluted 1:750 in 0.1% Triton X-100, 1% BSA in PBS.
Image analysisSpindle length and rotation measurements as well as astral MT number and length quantifications were performed manually in Fiji.49
Spindle length was determined by measuring the pole-to-pole distance in optical sections and equilibrium spindle length during blue
light exposure was determined by fitting the spindle length time-lapse data for each cell with a single exponential decay function us-
ing the Curve Fitting toolbox in MATLAB (Mathworks, Inc.).
e3 Current Biology 32, 1197–1205.e1–e4, March 14, 2022
llOPEN ACCESSReport
MT growth rates were measured with u-track essentially as described7 with the exception that Poisson-distributed shot noise was
removed prior to tracking using the NIS Elements v5.3 Denoise.ai neural net (Nikon). In side-by-side comparisons, this resulted in
substantial improvement of MT growth track quality. Frame-to-frame MT growth rates were extracted from the tracking results using
a custom MATLAB script (instantaneous_vg.m; see Methods S1) and the median of all these instantaneous velocities per cell was
calculated to minimize the impact of outlier tracking errors. The u-track particle tracking package for MATLAB is available from
the Danuser Lab at http://www.utsouthwestern.edu/labs/danuser/software/.
Sub-resolution distances between sister KTs6 were measured with a custom MATLAB script (KT_profile.m; see Methods S1), in
which two Gaussian functions are fitted along an intensity profile across interactively selected KT pairs in single optical sections.
Images in figures and videos were processed with NIS Elements v5.3 Denoise.ai (Nikon) to reduce shot noise. No non-linear
contrast adjustments were made, and images are shown in pseudo-color or contrast-inverted as indicated in the figure legends.
QUANTIFICATION AND STATISTICAL ANALYSIS
Details of statistical analysis including the type of test, p values and numbers of biological replicates are provided within the relevant
figures and figure legends. All statistical analysis was done inMATLAB (Mathworks, Inc.)., and graphswere produced inMATLAB and
in Excel (Microsoft). In all figures, boxplots show median, first and third quartile, with whiskers extending to observations within 1.5
times the interquartile range. No randomization, stratification or sample size estimation strategies have been employed. Unless indi-
cated otherwise in the text, all data points from a given experiment were analyzed, and a p < 0.01 is considered statistically signif-
icant. For every experiment reported, at least 3 biological replicates with similar results were performed.
Current Biology 32, 1197–1205.e1–e4, March 14, 2022 e4
Current Biology, Volume 32
Supplemental Information
Optogenetic EB1 inactivation shortens metaphase
spindles by disrupting cortical force-producing
interactions with astral microtubules
Alessandro Dema, Jeffrey van Haren, and Torsten Wittmann

Figure S1. Spindle shortening by local π-EB1 photoinactivation or paclitaxel treatment. Related to Figure 1. (A) Spindle length comparison in π-EB1 H1299 cells before and during localized blue light exposure either on the metaphase plate or the cell cortex. Blue outlines indicate the light-exposed regions. (B) Rapid spindle shortening in response to 5 µM paclitaxel treatment in H1299 cells. All experiments were in MG132 metaphase-arrested cells and images are shown with inverted contrast. The size of the data points shows the goodness of the exponential fit. Grey lines connect data points from the same cell. Statistical analysis by paired Student’s t-test in A and B. (C) Comparison of spindle length and distance between sister KTs in control H1299 cells, H1299 cells in which both EB1 and EB3 were deleted by CRISPR/Cas9 genome editing and EB1/3 -/- cells expressing π-EB1 without blue light exposure. Statistical analysis by one-way ANOVA and Tukey-Kramer HSD test indicating no significant difference between these conditions.

Figure S2. Spindle shortening in response to longer blue light exposure at lower dose. Related to Figures 1, 2 and 4. (A) Reversible spindle shortening in MG132-arrested π-EB1 H1299 cells exposed to blue light using a custom-designed 470 nm LED array. Shown are images before, immediately after 20 min of blue light exposure, and after 30 min recovery in the dark. Quantification shows the same time points in π-EB1 H1299 cells and in control H1299 cells expressing EB3-mCherry. Grey lines connect data points from the same cell. Statistical analysis by one-way ANOVA and Tukey-Kramer HSD test. (B) Examples of π-EB1 H1299 cell progression through mitosis in the dark and during blue light exposure using the LED array. MTs were labeled with SPY555-tubulin. Blue bars in all panels indicate time phases with blue light stimulation.
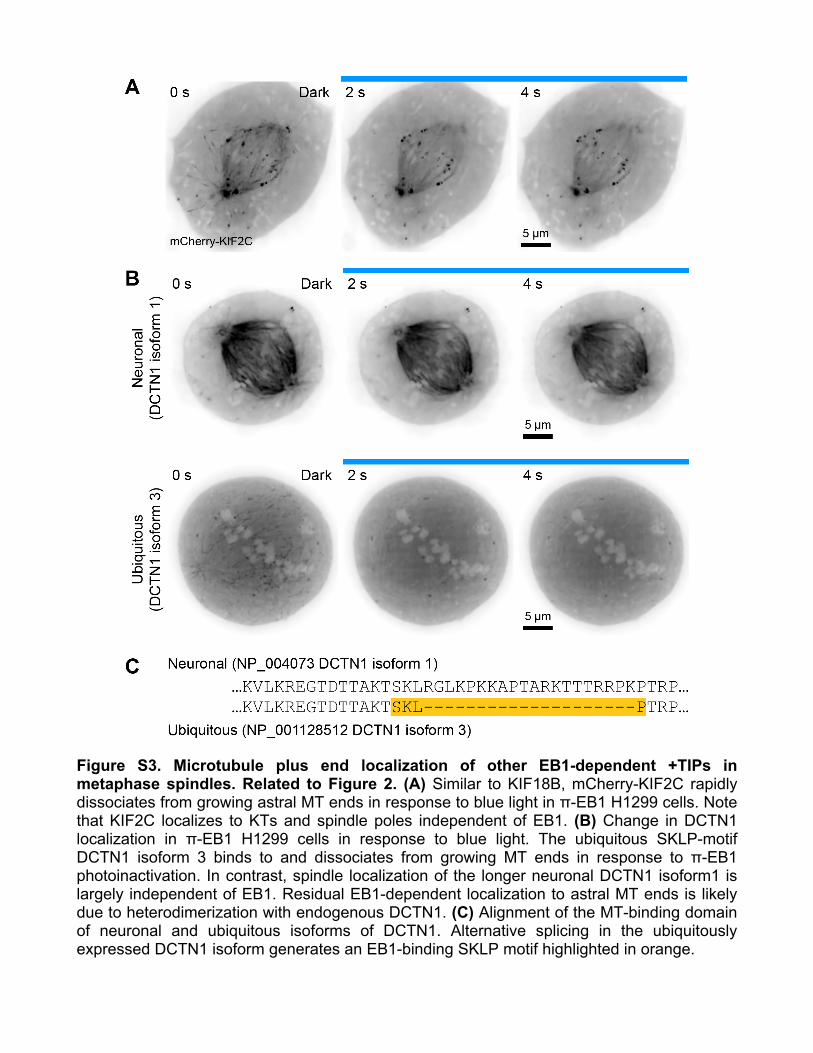
Figure S3. Microtubule plus end localization of other EB1-dependent +TIPs in metaphase spindles. Related to Figure 2. (A) Similar to KIF18B, mCherry-KIF2C rapidly dissociates from growing astral MT ends in response to blue light in π-EB1 H1299 cells. Note that KIF2C localizes to KTs and spindle poles independent of EB1. (B) Change in DCTN1 localization in π-EB1 H1299 cells in response to blue light. The ubiquitous SKLP-motif DCTN1 isoform 3 binds to and dissociates from growing MT ends in response to π-EB1 photoinactivation. In contrast, spindle localization of the longer neuronal DCTN1 isoform1 is largely independent of EB1. Residual EB1-dependent localization to astral MT ends is likely due to heterodimerization with endogenous DCTN1. (C) Alignment of the MT-binding domain of neuronal and ubiquitous isoforms of DCTN1. Alternative splicing in the ubiquitously expressed DCTN1 isoform generates an EB1-binding SKLP motif highlighted in orange.
Copyright © 2022 FDOKUMEN