Roughness feature of metaphase chromosome spreads and nuclei for automated cell proliferation...
7
Roughness feature of metaphase chromosome spreads and nuclei for automated cell proliferation analysis G. Corkidi 1 L. Vega 1 J. Marquez 3 E. Rojas a P. Ostrosky-Wegman 2 llrnage Processing Laboratory, Centro de Instrumentos, UNAM, Distrito Federal, Mexico 2Genetic Toxicology Laboratory, Instituto de Investigaciones Biom~dicas, UNAM, Distrito Federal, Mexico 3Image Department, Ecole Nationale Sup&ieure des T~16communications, Paris, France Abstract--As a step towards automation of mitotic index estimation for cell proliferation studies, a roughness feature of surface-intensity images is introduced: the mean depth- width ratio of extrema (MDWRE). This feature allows identification of variable-shaped metaphases and interphase nuclei in the presence of many artefacts (one metaphase per hundreds of nuclei and thousands of artefacts). The texture of the cytological objects (seen as rough surfaces) is quantified by scanning, in one dimension, the lines contained in a closed contour. MDWRE proves to be suitable for image magnifications by a factor of as low as ten, making faster scanning of slides possible. The use of this feature gives + 14%, +65%, + 133% and + 133% better performance figures than classical textural features derived from co-occurrence matrices, such as contrast, energy, entropy and angular second moment, respectively, and + 51% better than the relative extrema density (RED). The MDWRE per object and the shape of the histogram of the depth--width ratio of grey-level roughs have been shown to be very useful as textural features for the classification of metaphase images. KeywordsmMitotic index, Image texture classification, Roughness, Cell proliferation, Quan- titative microscopy Med. Biol. Eng. Comput., 1998, 36, 679-685 1 Introduction STUDIES ON the proliferation of animal and human cells or tissues have contributed significantly to the understanding and development of procedures used in cellular and molecular biology. Proliferation studies are increasing in medical chem- istry, pharmacology, genetics, reproductive biology and oncol- ogy. The development, at rapid and unprecedented rates, of products used in industry, pharmaceuticals and cosmetics and even of food additives has created the need for fast and effective methods to evaluate effects on cellular proliferation (BARILE, 1994). An intervening concept is the mitotic index (MI), which is the percentage of cells that are in the process of division. It has been used for years and has proven to be a good endpoint to evaluate and compare cell proliferation rates, and it is a good parameter for cytotoxicity evaluation because it is simple, meaningful and easy to reproduce (ROIAS et aL, 1992). The determination of the MI is usually made by light-microscope analysis of slide preparations. The analyst identifies and counts 2000 cells per slide and reports the percentage of mitotic shapes found among the interphase nuclei. Image-processing techniques allow a computer program to discriminate mitotic shapes and nuclei by their size, shape and Correspondence should be addressed to: Dr G. Corkidi-Blanco; email: [email protected] First received 5 December 1997and in final form 20 April 1998 IFMBE: 1998 photometric and textural characteristics. However, full auto- mation of this process is an ambitious task because it has to take into account the following considerations: (a) there may exist very few mitotic shapes among hundreds of nuclei and among thousands of artefacts, favouring a high probability of false positives, i.e. objects erroneously identi- fied as mitosis (b) as the magnification of the microscope must be as low as possible (to reduce the total number of fields to analyse), the resolution of each shape should not exceed 50 x 50 pixels, with images of 512 x480 pixels at tenfold magnification and visual fields of 610 x477 p.m (c) mitotic shapes are very variable, as the chromosomes may be highly dispersed or conglomerated, giving rise to an heterogeneous texture appearance. Several approaches and systems known as metaphase finders have been proposed. The first attempts to semi-automate metaphase finding using a closed circuit TV camera were reported in 1974 (JOHNSON and GOFORTH, 1974; GREEN and NEURATH, 1974). More recent works report the use of com- mercial metaphase finders and their performance (CASTLE- MAN, 1992; WEBER et al., 1992; PIPER et al., 1994). GARZA- JINICH et al. (1992) describe a supervised size and circularity- factor criterion to detect metaphases. VROLIJK et al. (1994) describe a textural-based discrimination method for metaphase finding using an edgeness feature. Although significant progress has been made in automatic metaphase-finding technology, the total time spent on the analysis of slides and greater accuracy still represent important challenges to bio- medical engineers. Medical & Biological Engineering & Computing November 1998 679
-
Upload
independent -
Category
Documents
-
view
0 -
download
0
Transcript of Roughness feature of metaphase chromosome spreads and nuclei for automated cell proliferation...
Roughness feature of metaphase chromosome spreads and nuclei for automated cell proliferation analysis
G. Corkidi 1 L. Vega 1 J. Marquez 3 E. Rojas a P. Os t rosky -Wegman 2
llrnage Processing Laboratory, Centro de Instrumentos, UNAM, Distrito Federal, Mexico 2Genetic Toxicology Laboratory, Instituto de Investigaciones Biom~dicas, UNAM, Distrito Federal, Mexico
3Image Department, Ecole Nationale Sup&ieure des T~16communications, Paris, France
Abstract- -As a step towards automation of mitotic index estimation for cell proliferation studies, a roughness feature of surface-intensity images is introduced: the mean depth- width ratio of extrema (MDWRE). This feature allows identification of variable-shaped metaphases and interphase nuclei in the presence of many artefacts (one metaphase per hundreds of nuclei and thousands of artefacts). The texture of the cytological objects (seen as rough surfaces) is quantified by scanning, in one dimension, the lines contained in a closed contour. MDWRE proves to be suitable for image magnifications by a factor of as low as ten, making faster scanning of slides possible. The use of this feature gives + 14%, +65%, + 133% and + 133% better performance figures than classical textural features derived from co-occurrence matrices, such as contrast, energy, entropy and angular second moment, respectively, and + 51% better than the relative extrema density (RED). The MDWRE per object and the shape of the histogram of the depth--width ratio of grey-level roughs have been shown to be very useful as textural features for the classification of metaphase images.
KeywordsmMitotic index, Image texture classification, Roughness, Cell proliferation, Quan- titative microscopy
Med. Biol. Eng. Comput., 1998, 36, 679-685
1 Introduction
STUDIES ON the proliferation of animal and human cells or tissues have contributed significantly to the understanding and development of procedures used in cellular and molecular biology. Proliferation studies are increasing in medical chem- istry, pharmacology, genetics, reproductive biology and oncol- ogy. The development, at rapid and unprecedented rates, of products used in industry, pharmaceuticals and cosmetics and even of food additives has created the need for fast and effective methods to evaluate effects on cellular proliferation (BARILE, 1994).
An intervening concept is the mitotic index (MI), which is the percentage of cells that are in the process of division. It has been used for years and has proven to be a good endpoint to evaluate and compare cell proliferation rates, and it is a good parameter for cytotoxicity evaluation because it is simple, meaningful and easy to reproduce (ROIAS et aL, 1992). The determination of the MI is usually made by light-microscope analysis of slide preparations. The analyst identifies and counts 2000 cells per slide and reports the percentage of mitotic shapes found among the interphase nuclei.
Image-processing techniques allow a computer program to discriminate mitotic shapes and nuclei by their size, shape and
Correspondence should be addressed to: Dr G. Corkidi-Blanco; email: [email protected] First received 5 December 1997 and in final form 20 April 1998
�9 IFMBE: 1998
photometric and textural characteristics. However, full auto- mation of this process is an ambitious task because it has to take into account the following considerations:
(a) there may exist very few mitotic shapes among hundreds of nuclei and among thousands of artefacts, favouring a high probability of false positives, i.e. objects erroneously identi- fied as mitosis (b) as the magnification of the microscope must be as low as possible (to reduce the total number of fields to analyse), the resolution of each shape should not exceed 50 x 50 pixels, with images of 512 x480 pixels at tenfold magnification and visual fields of 610 x477 p.m (c) mitotic shapes are very variable, as the chromosomes may be highly dispersed or conglomerated, giving rise to an heterogeneous texture appearance.
Several approaches and systems known as metaphase finders have been proposed. The first attempts to semi-automate metaphase finding using a closed circuit TV camera were reported in 1974 (JOHNSON and GOFORTH, 1974; GREEN and NEURATH, 1974). More recent works report the use of com- mercial metaphase finders and their performance (CASTLE- MAN, 1992; WEBER et al., 1992; PIPER et al., 1994). GARZA- JINICH et al. (1992) describe a supervised size and circularity- factor criterion to detect metaphases. VROLIJK et al. (1994) describe a textural-based discrimination method for metaphase finding using an edgeness feature. Although significant progress has been made in automatic metaphase-finding technology, the total time spent on the analysis of slides and greater accuracy still represent important challenges to bio- medical engineers.
Medical & Biological Engineering & Computing November 1998 679
We have devised and tested a new feature: the mean depth-width ratio of extrema (MWDRE). Working at tenfold magnification and visual fields of 610 x 477 gin, the MDWRE feature allows the identification of variable-shaped mitosis and interphase nuclei in the presence of many artefacts. This feature relates closely to and extends another textural feature, the relative density of extrema (RED) (ROSENFELD and TROY, 1970; HARALICK and SHAPIRO, 1992), the differ- ence being its specific sensitivity to extrema shape and distribution. The performance of this feature was compared with that of classical textural features such as RED and those derived from grey-level co-occurrence matrices: contrast, entropy, energy and angular second moment (HARALICK, 1979).
2 Stereologicai approach to texture feature extraction
Noise and low resolution of metaphase images add to their textured (or 'rough') appearance. At very low resolutions, chromosome pattern information is almost invisible, and shape feature discrimination becomes less reliable than a texture- based analysis. To understand the problem, we have to bear in mind that texture feature extraction has been subjected to statistical and structural approaches (JAIN, 1989).
The structural approach would be, in fact, the proper choice for texture feature-based discrimination of conglomerated metaphases, because their texture is characterised by specific primitives: the chromosomes following a placement rule. This rule may be, in general, deterministic or random, giving rise to 'strong' or 'weak' textures (JAIN, 1989).
Chromosome placement may follow a Poisson-like random distribution, if the conditions of stationarity, non-overlapping and independent scattering (STOYAN et al., 1987) are verified for a metaphase spread. Nevertheless, our primitives (also known as 'texels' in the structural approach) are not well identified, as the required resolution reduces chromosome shapes to blurred dots of very few pixels. In addition, noise, mechanical deformations, illumination conditions and some overlapping may tum the structural character of the observed texture into an ill-defined problem as resolution decreases.
However, we can still analyse metaphase fields as a sub- sampled structural texture and consider the available dots or 'roughs' as point or feature samples in the stereological sense.
Stereology quantification comprises sampling and estima- tion methods familiar to microscopists and morphology- related scientists. It is based on relationships between N- dimensional features and N- or lower-dimensional measures (WEIBEL, 1979a) in any sampled subsets, such as point grids, lines, sections etc., to estimate object mean size, area density or other measures. A pertinent example of a stereological parameter is NL, the number of intersections of features (particles, grey-level valleys, crests or roughs) per unit length of test line on a two-dimensional sample of material. Test lines may be random or one sweeping test line, i.e. a test line displaced parallel to itself under the assumption of isotropic and stationary random distribution of features (WEIBEL, 1979b). This is a reasonable assumption for chro- mosomes inside a metaphase in slide preparations, and so we chose parallel test line sampling of the entire object area.
In our application, we are not interested in the derived estimations from stereological parameters (mean size of chro- mosomes, for example), but in their distribution shape itself as a characteristic texture feature. In this paper, the mean depth-- width ratio of the two-dimensional extrema features of meta-
680
phase images is estimated, in the stereological sense, by sampling row or column intensity profiles, as explained in Section 5.
3 Materials and methods
3.1 Culture preparation
For the sample preparations, 0.5 ml of heparinised human blood are added to 6.0ml RPMI-1640 culture medium, sup- plemented with glutamine (2 mmot) and non-essential amino- acids (0.1 mmol), in the presence of bromodeoxiuridine 32 gmol. 2.8% phytohemagglutinin is used to stimulate lym- phocyte growth.
Cultures are incubated at 37 ~ for 72 h. Two hours before fixation of cells, colcemid (2 gg per culture) is added to stop cycling cells in mitosis. Fixation is done with Camoy solution (methanol-acetic acid 3:1) after incubating cells in KCL 0.075 mol for 30 min.
3.2 Slide preparation
The quality of slides is a critical point for obtaining a digital image suitable for automated analysis. Therefore fresh solutions should be used in fixation: cell pellets must be thoroughly washed as many times as needed, to eliminate cell debris. Pellets are resuspended in 0.5 ml fresh Camoy solution and dropped onto cold alcohol-moistened slides. Staining is done according to the fluorescence plus giemsa (FPG) method (PERRY and WOLFF, 1974). This is a classical method to stain cells that is widely used in genetic toxicology. It enables us to determine mitotic index, cell cycle kinetics and sister chromatid exchange, from the same slide. Only the lymphocytes that are activated by the use of the mitogen phytohemagglutinin (stimulated nuclei) are capable of going through mitosis (ROJAS e t al., 1992; 1993). With the FPG method, the appearance of the stained stimulated nuclei is smaller and paler than that of the non-stimulated nuclei.
3.3 Sample test sets
Twenty-two slides from different experiments and six donors were randomly chosen to create three test sets com- posed of 97 nuclei, 76 metaphases and 94 artefacts randomly selected (Fig. 5). Artefacts on a slide image present wide variations in shape, size and texture. Features change within the sample preparation and even within different batches of the same sample. This indeterminacy makes artefact discrimi- nation one of the most complex tasks and the main source of errors (false positives, mainly) in automated mitotic index estimation. Moreover, we have found in our preparations that the probability of artefacts is extremely high (one metaphase per hundreds of nuclei and thousands of artefacts). Fortu- nately, a large percentage of these artefacts were outside the size range of the metaphases and nuclei we wanted to score, and it was possible to apply an outlier exclusion criterion.
When the probability distribution of a measure is Gaussian, its standard deviation cr provides criteria for outlier identifica- tion. For our cell proliferation analysis, we have implemented a simple artefact rejection procedure. It consists of discarding those segmented objects (as explained later in Section 4) that have area values far from the mean area of the objects of interest (nuclei and metaphases). To eliminate the maximum number of artefacts, while maintaining a low probability of excluding objects of interest, we decided to eliminate all objects that exceed the lower and upper limits [mean nuclei area - 3 ~r, mean metaphase area +3 ~]. This simple procedure
Medical & Biological Engineering & Computing November 1998
enables us to filter out an average of 81.3% (4-7.3%) of the artefacts per analysed field. Nevertheless, the remaining arte- facts are the most difficult to discriminate, as many of them may be similar to the objects of interest.
3.4 Digital-imaging environment
All original computer algorithms for microscope-image processing were implemented within the Imagenia-2000 ana- lyser environment* (CoRKIDI et al., 1992). Software routines include a set of automatic scanning schedules of up to eight slides for optic microscopy, and Multi-control 2000 drivers for the motorised stages,t specially adapted to the microscope:~. Image acquisition uses a COHU 48000 B&W video CCD camera and an image-processing and grabbing board, the Matrox PIP-1024, with 512 x 480-pixel resolution. Computer programs were developed in Microsoft C language and linked with image-processing libraries from the Matrox board and the Imagenia-2000 software. Statistical analysis (one-factor Ana- lysis of Variance, Anova) was performed with Microsoft Excel 5.0.
4 Image segmentation
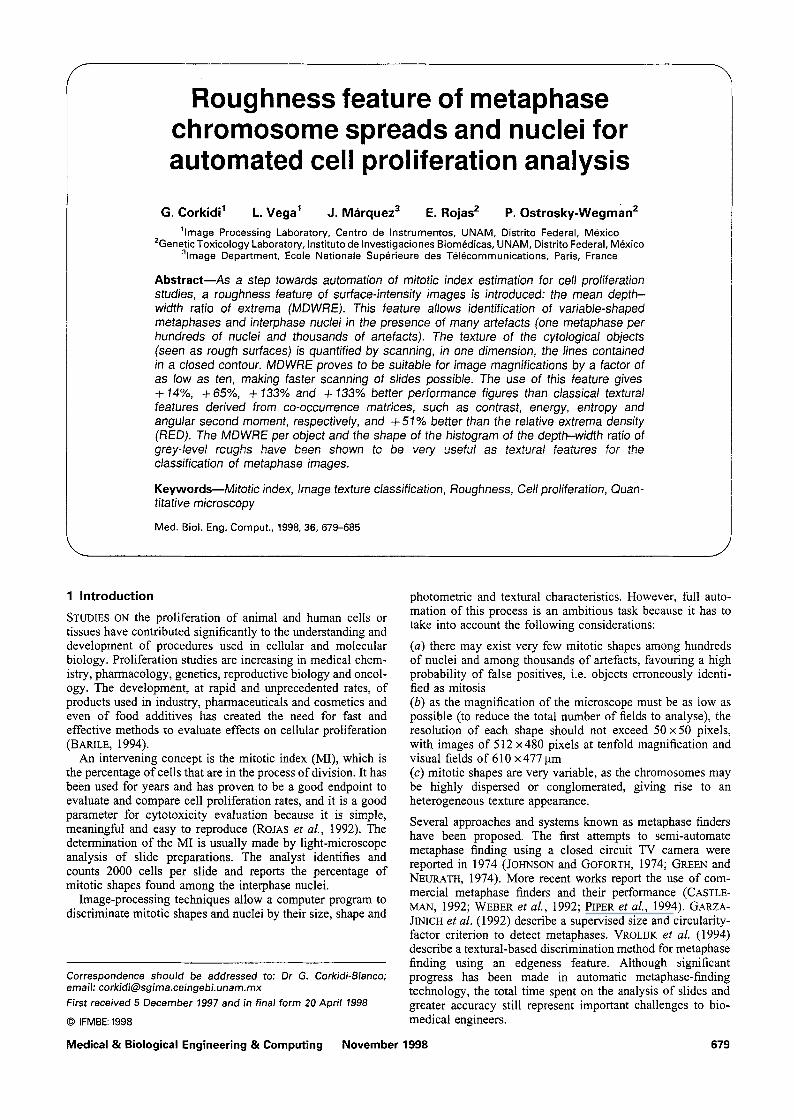
For cell proliferation study purposes, there are five distinct classes of object considered in the slide preparations: stimu- lated nuclei (SN), non-stimulated nuclei (nSN), scattered metaphase spreads (SM), conglomerated metaphase spreads (CM) and artefacts (AF). To appreciate the different object classes, we show in Fig. 1 an example set of metaphase spreads, from very scattered to very compact, a set of stimulated and non-stimulated nuclei (considered as artefacts for mitotic index estimation purposes) and a set of artefacts. Fig. 2 shows an example of a real microscopic field including all object classes. Mitotic index (MI) is then defined as
MI = (NsM + NCM)/NsN (1)
where N indicates the number of objects of the class con- cemed.
Fig. 1 Sample of different kinds of object to be analyse& SM1- SMe: scattered metaphase spreads; CM3-CM4: conglomer- ated metaphase spreads; SN1-SN4: stimulated nuclei; nSN1-nSN4: non-stimulated nuclei; AF1-AFs: artefacts
*Biocom, France tMarzhauser, Germany tOlympus BH2
Medical & Biological Engineering & Computing
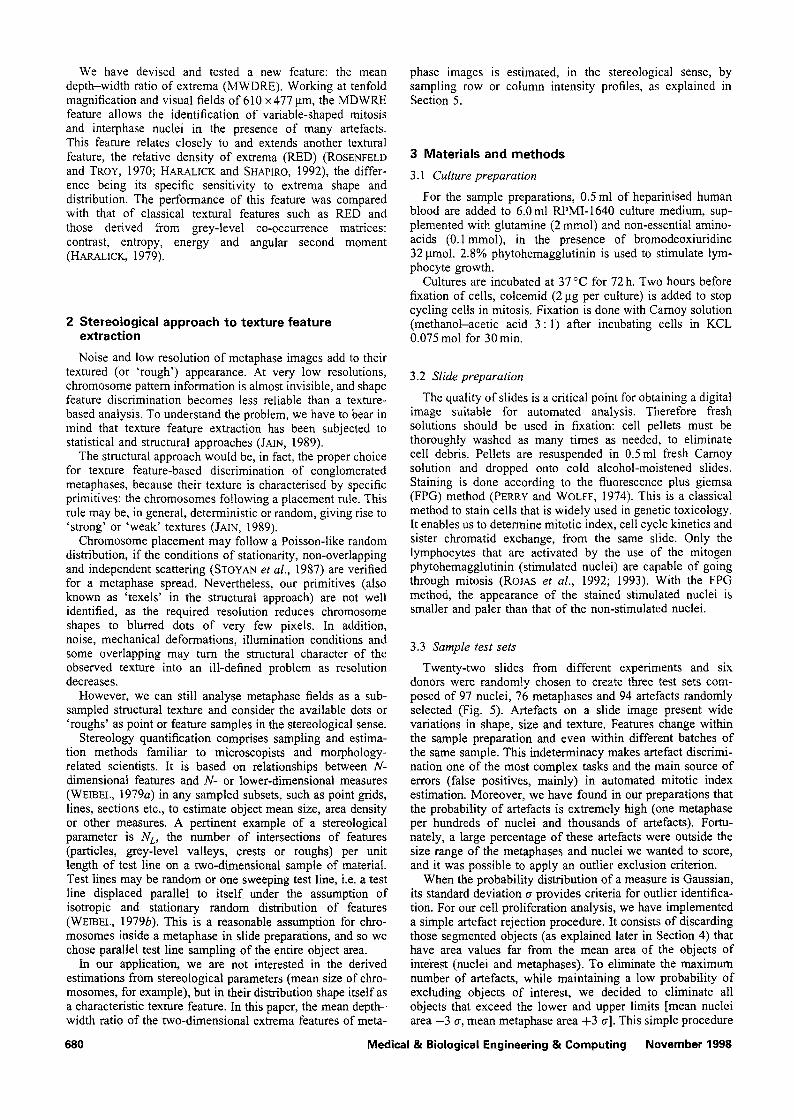
Fig. 2 Example of real microscopic field including all kinds of object to be classified." 1 SM scattered metaphase spread; 2 CM conglomerated metaphase spread; 3 SN stimulated nuclei; 4 AF artefact; 5 nSN non-stimulated nuclei
While trying to direct image segmentation by minimising the within-group variance (OTSU, 1979), we found two pro- blems:
(i) many of the stimulated nuclei are not detected because they are brighter than the calculated threshold (see Section 3.2)
(ii) the chromosomes of the scattered metaphases are segmented as single objects instead of a conglomerate.
Problem (i) relates to handling a combination of non-linear responses of different components (CCD camera, slide stain- ing, illumination and display) for convenient image formation. The standard solution is to apply a gamma correction to the image brightness values, to enhance human perception. Unfor- tunately, this correction is seldom optimised for many linear- intensity algorithms required in image processing (POYTON, 1996; HEMMINGER et al., 1994). Although a custom gamma correction by software can be further applied to simplify the image segmentation procedures on linear-intensity images, a polynomial approximation is equally effective. In addition, it can be designed to darken the stimulated nuclei without altering the mean grey-level intensity of the background, to avoid background artefact segmentation.
Thus, to solve problem (i), we applied a fourth-power function to each pixel value of the image. This polynomial proved to be a satisfactory approximation to a precise gamma linearisation, enhancing, at the same time, dark-object thresh- olding. We defined the following transfer function, to be applied using look-up tables:
f ( x ) = ax 4 (2)
where x represents the input grey-level, f ( x ) represents the output value after transformation, and a is a constant. Let Maxg~ be the maximum grey-level of the image, and xM be the value at the mode of the grey-level histogram of the image. Normalising with respect to Maxg~q, thenf(xM) = 1, and
a = 1/(XM/maXgrey) 4 = (maXgrey/XM) 4 (3)
To solve problem (ii) detection of the chromosomes as a single conglomerate was achieved by means of a grey-level morpho- logical �9 operation, recursive dilation (SERRA, 1989). The number of iterations needed depends on the degree of scatter- ing of the prototype metaphase spreads and also depends on microscope magnification. In our case, with tenfold magnifi- cation, the optimum number of iterations needed was two. The extracted contour of the resulting conglomerate was overlaid
November 1998 681

on the original scattered image, where the roughness feature calculation was then performed.
5 MDWRE feature
In general, most shape-detection methods and standard morphometric parameters rely on well-defined object recogni- tion and cannot be directly applied to textural images, where the objects to be detected and measured are not satisfactorily represented with contours. Moreover, the low-resolution recta- phase image (50 x 50 pixels) and the other restrictions detailed in Section 1 prevented the use of the multi-resolution, fractal and feature space approaches currently used for texture dis- crimination. Our stereological-inspired approach was to quan- tify the texture roughness of low-resolution images by estimating the density of particular two-dimensional extrema ('roughs'), using scanline samples as explained in the follow- ing.
HARALICK and SHAPIRO (1992) describe a simple and effective texture feature proposed by ROSENFELD and TROY (1970): the number of extrema per unit area in horizontal scans for a texture measure, or relative extrema density (RED). Nevertheless, discrimination between mitotic shapes in the presence of a high percentage of artefacts requires a more robust feature, sensitive to differences in the spatial distribution of specific extrema. Given that chromosomes in metaphase images can be seen at low resolution as narrow and deep extrema in densitometric profiles, we can interpret these extrema as 'roughs' of the background material. This inter- pretation is consistent with a stereological approach, i.e. the use of one-dimensional samples to estimate two-dimensional features, and prompted us to study the mean value and the shape of the distribution of the depth-width ratio of selected extrema as particular features of roughness. Both proved to be very useful as distinctive signatures of mitotic chromosome clusters and interphase nuclei.
A rough can be characterised in one-dimensional scans by depth (grey-level intensity) and width (separation between extrema) (HARALICK and SHAPIRO,1992). Whereas RED-like features count selected peaks, we devised a different estimate of the extrema density of the object area by considering depth- weight ratios of all valleys in all scans. Depths weighted by the inverse width of each valley permitted selective filtering of specific ratios, making MDWRE tunable to chromosome- induced texture at very low resolutions. Thus, we measured the horizontal (for width) and vertical (for depth) projections of vectors A and B at each valley of the profile (Fig. 3), and summed their ratios in all scans. The depth selection 'window' consisted in testing the following conditions:
(a) the ratio between the min/max vertical rough projections should be greater than 0.6 (approximate value where the human eye distinguishes a rough) (b) the average vertical projection should be greater than a pre- established threshold of noise t/.
In this way, we define the MDWRE as
N
MDWRE = 1IN ~ fi pdwi (4) i = 1
where
pdwi = ((Vproj a~ + Vproj s)/2)/(Hproj A, + Hproj s,)
and
1 if (rain{ Vproj ~,, Vproj n~ } / max{ Vp~oj A,, Vp~oj s~ }) > 0.6
f = and ((Vp~ojA, + Vp~ojS,)/2 ) > rl
0 otherwise
where N is the total number of one-dimensional extrema (roughs) of the object, H roj and Vp~oj are the horizontal and
�9 . P
vertical projections of A and B, respectively, and r/ is a predetermined threshold of image noise. In the particular case of this study, as the images are digitised with a standard TV frame grabber, the number of one-dimensional scanlines for an object of interest exactly corresponds to the TV lines contained in the object. Fig. 4 shows the relative minima of roughs (black points) detected in a metaphase spread (M), a nucleus (N) and an artefact (AF).
6 Application to cell proliferation study
To evaluate the performance of MDWRE in the cell pro- liferation study described in Section 1, we extracted this feature, together with classical ones (Table 1), from the three test sets described in Section 3.3. Results are sum- marised in Fig. 5: Fig. 5a shows the true positives subset of stimulated nuclei, and Fig. 5b shows the corresponding mis- classified subset (detected as artefacts). Fig. 5c shows the true positives subset of compact and scattered metaphases, and Fig. 5d shows the corresponding misclassified subset (detected as artefacts). Finally, Fig. 5e shows the true positives subset of artefacts, and Fig. 5f shows the corresponding misclassified subset (false positives).
We have defined the texture feature's performance (perfor- mance, Table 1) as the total number of true positives minus the total number of false positives, divided by the total number of objects. Comparison of performances included MDWRE, RED and the most meaningful measures from grey-level co-
Fig. 3
682
Geometric description of MDWRE feature Fig. 4 Detected relative minima of roughs (black points) in three
kinds of object: metaphase (M), nucleus (N) and artefact(AF)
Medical & Biological Engineering & Computing November 1998
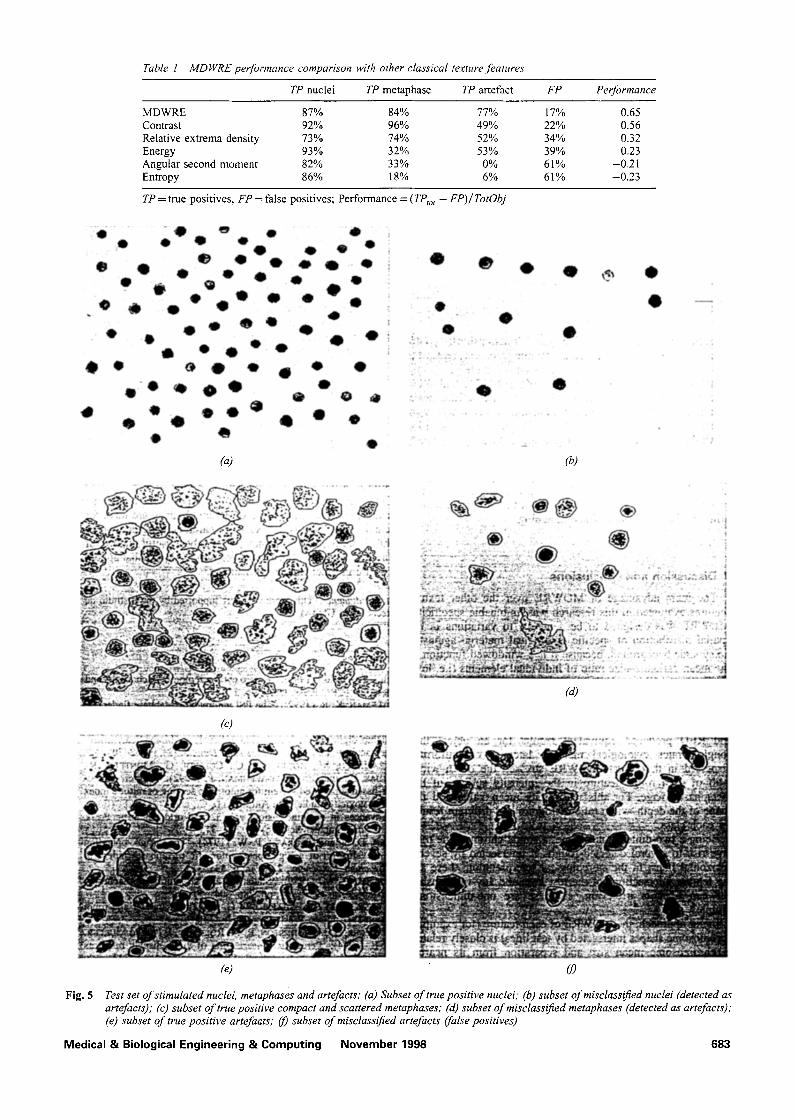
Table 1 MDWRE perfofvnance comparison with other classical texture features
TP nuclei TP metaphase TP artefact FP Performance
MDWRE 87% 84% 77% 17% 0.65 Contrast 92% 96% 49% 22% 0.56 Relative extrema density 73% 74% 52% 34% 0.32 Energy 93% 32% 53% 39% 0.23 Angular second moment 82% 33% 0% 61% -0.2 l Entropy 86% 18% 6% 61% -0.23
TP = true positives, FP = false positives; Performance = (TPto t - FP)/TotObj
(c)
(a)
(e) 69
Fig. 5 Test set of stimulated nuclei, metaphases and artefacts: (a) Subset of true positive n,tclei; (b) subset of misclassified nuclei (detected as artefacts); (c) subset of true positive compact and scattered metaphases; (d) subset o f misclassified metaphases (detected as artefacts); (e) subset of true positive artefaats; 09 subset of misclassified artefacts (false positives)
Medical & Biological Engineering & Computing November 1998 683

1.0
=~ 0.8
e= 0.6
E 0 . 4
8 0 .2
\
0 l ' = - - r " - - "" ~ " ='- - \ 0 1.0 0.2 0.4 0.6 0.8
normal ised MDWRE
Fig. 6 Normalised mean probability of MDWRE in sample of( )
occurrence matrices (0 ~ angular relationship): contrast, energy, entropy and angular second moment (HARALICK, 1979). The performance comparison is made in Table 1. MDWRE gave +14%, +51%, +65%, +133% and +133% better performance figures than contrast, RED, energy, entropy and angular second moment, respectively (signifi- cance level p<0.001 , with 2/259 degrees of freedom). MDWRE takes the same processing time as RED, whereas the grey-level co-occurrence parameters take 15 times longer.
Fig. 6 shows the shape of the mean probability distribution of MDWRE for each class: the metaphase spreads (top), the artefacts (centre) and the nuclei (bottom). The classification of objects using these histograms uses to a Chi-squared test as a criterion for distribution shape matching.
7 Discussion and conclusions
The main advantage of MDWRE over the other texture features evaluated in this research was its tunable specificity: MDWRE was designed to be sensitive to variations in the spatial distribution of specific cytological material against a noisy slide background, because it is a windowed function of the mean darkness-size ratio of individual elements (i.e. low- resolution and blurred chromosomes or other objects). For example, Fig. 5c shows that the spatial distribution, size and darkness of chromosomes are more uniform than those of the artefacts of Fig. 5e. The grey-level co-occurrence parameters and RED produced equivalent results for an object that conglomerates cytological material laterally or uniformly dispersed in the object. MDWRE stressed the depth-width ratio of each rough feature in the intensity surface of the metaphase image. For this reason, its mean value and the shape of the depth--width ratio histogram had different results for each class.
Being a two-dimensional shape, a single chromosome may give rise to several detected roughs if intersected by several horizontal lines. In the stereological interpretation, these are the feature intersections of the test line, and any relationship between lines is irrelevant, as these are one-dimensional samples.
In our approach, the MDWRE of each feature (for example, chromosome shapes intersected by test lines) is closely related to chromosome mean size and separation from its nearest neighbours. In consequence, metaphase spreads with high- contrast extrema and homogeneous spatial distribution of chromosomes produced a higher MDWRE value than arte- facts, which usually have a lower contrast and heterogeneous distribution of peak features. As the nucleus image has a
684
smoother surface (a dominant dark flat inner surface, implying low-contrast roughs), its MDWRE value was the lowest value compared with mitotic shapes and artefacts. We took advan- tage of these features to differentiate mitotic shapes and nuclei from artefacts.
Concerning the non-stimulated nuclei, MDWRE did not allow them to be discriminated from the stimulated nuclei, as their texture is very similar. In fact, these non-stimulated nuclei should be considered as artefacts for mitotic index estimation purposes (see Section 3.2). Nevertheless, as the non-stimulated nuclei are homogeneously smaller and darker than the stimulated nuclei, it was easy to discriminate them using standard morphometric and photometric parameters (area, form factor, mean grey-level etc.).
Being a mean value, MDWRE does not capture the fine roughness details of each object. This fine roughness informa- tion appears in the complete MDWRE mean probability- distribution curves per object class (Fig. 6). We can observe in Fig. 6 that the three mean distributions for nuclei, recta- phases and artefacts have significantly different shapes. In combination with the MDWRE value and other standard morphometric features, these shape distribution characteristics turned out to be very valuable for the final classification.
It is important to recognise that increasing image magnifi- cation (x20 or x63) substantially reduces the difficulties encountered when solving this pattern recognition problem with regard to cytological objects, but the scanning and processing times for slide preparation are then greatly increased. We have already made, in the present research, a significant effort to work with tenfold magnification.
Concerning the classification problem itself, we believe that its characteristics and the kind of datum obtained are ideal for a neural network-based analysis. Research is being conducted in this direction. MDWRE may prove to be a useful feature for the automatic recognition of low-resolution objects that appear as texture in other image applications.
Acknowledgments This work was part supported by the Instituto de Biotecnologia, UNAM.
References
BARILE, F. A. (Ed.) (1994): 'In vitro cytotoxicology. Mechanisms and methods' (CRC Press, USA) pp. 1-222
CASTLEMAN, K. R. (1992): 'The PSI automatic metaphase finder', jr. Radiat. Res., 33, (Suppl.), pp. 124-8
CORK1DI, G., and MARQUEZ, J. (1992): 'Microestaci6n de procesa- miento digital de imfigenes para aplicaciones biomrdicas: instru- mentaci6n y metodologias', Instrum. Dev., 3, (2), pp 62-70
GARZA-JINICH, M., RODRIGUEZ, C., CORKIDI, G., MONTERO, R., ROJAS, E., and OSTROSKY-WEGMAN, P. (1992): 'A microcompu- ter-based supervised system for automatic scoring of mitotic index in citotoxicity studies', in ARCHIBALD, C., and PETRIU, E. (Eds.): 'Advances in machine vision, vol. 32', (World Scientific Press, series in Computer Science) pp. 301-313
GREEN, D. K. and NEURATH, P. W. (1974): 'The design, operation and evaluation of a high speed automatic metaphase finder', J. Histochem. Cytochem., 22, (7), pp. 531-535
HARALICK, R. M. (1979): 'Statistical and structural approaches to texture', Proc. IEEE, 67, pp. 786-804
HARALICK, R. M., and SHAPIRO, L. G. (1992): 'Computer and robot vision I' (Addison-Wesley) pp. 471--473
H'EMMINGER, B. M., JOHNSTON, R. E., ROLLAND, J. P., and MULLER, K. E. (1994): 'Perceptual linearization of video display monitors for medical image presentation', SPIE Proc., 2164, pp. 222
JAIN, A. K. (1989): 'Fundamentals of digital image processing' (Prentice Hall), pp. 394400
JOHNSON, E. T. and GOFORTH, L. J. (1974): 'Metaphase spread detection and focus using closed circuit television', J. Histochem. Cytochem., 22, (7), pp. 536-545
Medical & Biological Engineering & Computing November 1998
OTSU, N. (1979): 'A threshold selection method from gray-level histograms',. IEEE Trans., SMC-9, pp. 62-66
PERRY, P., and WOLFF, S. (1974): 'New giemsa method for differ- ential staining of sister-chromatids', Nature, 251, pp.156-158
PIPER J., POGGENSEE, M., HILL W., JENSEN, R., JI, L., POOLE, I., STARK, M., and SUDAR, D. (1994): 'Automatic fluorescence metaphase finder speeds translocation scoring in FISH painted chromosomes', Cytometry 1, 16(1), pp. 7-16
POYTON, C. H. (1996): 'A technical introduction to digital video', (John Wiley & Sons, New York), pp. 91-114
ROJAS, E., MONTERO, R., HERRERA, L. A., SORDO, M., GONSEBATT, M. E., RODRIGUEZ, R., and OSTROSKY-WEGMAN, P. (1992): 'Are mitotic index and lymphocyte proliferation kinetic reproducible endpoints in genetic toxicology testing?', Mutation Res., 282, pp. 283-286
ROJAS, E., HERRERA, L. A., SORDO, M., GONSEBATT, M. E., MONTERO, R., RODRIGUEZ, R., and OSTROSKY-WEGMAN, P. (1993): 'Mitotic index and lymphocyte proliferation kinetics for identification of antineoplastic activity', Anti-cancer Drugs, 4, (6), pp. 637-640
ROSENFELD, A., and TROY, E. (1970): 'Visual texture analysis'. Technical Report, University of Maryland, College Park, pp. 70-- 116
SERRA, J. (1989): 'Image analysis and mathematical morphology' (Academic Press), pp. 43-49
STOYAN, D., KENDALL, W. S., and MECKE, J. (1987): 'Stochastic geometry and its applications' (Wiley), pp. 42-56
VROLIJK, J., SLOOS, W. C., DARROUDI, F., NATARAJAN, A. T., and TANKE, H. J. (1994): 'A system for fluorescence metaphase finding and scoring of chromosomal translocations visualized by in situ hybridization', Int. J. Radiat. Biol., 66, (3), pp. 287-95
WEBER, J., SCHEID, W., and TRAUT, H. (1992): 'Time-saving in biological dosimetry by using the automatic metaphase finder Metafer2', Mutat. Res., 272, (1), pp. 31-34
WEIBEL, E. R. (1979a): 'Stereological methods, vol. I' (Academic Press), pp. 2-13
WEIBEL, E. R. (1979b): 'Stereological methods, vol. II' (Academic Press), pp. 47-54
Author's biography
GABRIEL CORKIDI was born in Mexico City, in 1956. He graduated in Electronic Communica- tions Engineering at the Universidad Iberoamer- icana, in Mexico City, in 1980. He obtained his DEA and Doctorate from the Universit~ de Paris XII in Biomedical Image Processing (G~nie Bio- logique et M~dical), in 1987 and 1989, respec- tively. He is currently an Investigator at Centro de Instrumentos of the Universidad Nacional
AutOnoma de M~xico (UNAM). His current research interests include biomedical machine vision and pattern recognition.
Medical & Biological Engineering & Computing November 1998 685