Evaluation of Salmonella Enteritidis and Escherichia coli ...
115
Graduate Theses, Dissertations, and Problem Reports 2020 Evaluation of Salmonella Enteritidis and Escherichia coli O157:H7 Evaluation of Salmonella Enteritidis and Escherichia coli O157:H7 Volatile Organic Compound Analysis for Food Safety Monitoring: Volatile Organic Compound Analysis for Food Safety Monitoring: a Preliminary Study a Preliminary Study Jessica E. Lemley West Virginia University, [email protected] Follow this and additional works at: https://researchrepository.wvu.edu/etd Part of the Biochemistry Commons, and the Food Microbiology Commons Recommended Citation Recommended Citation Lemley, Jessica E., "Evaluation of Salmonella Enteritidis and Escherichia coli O157:H7 Volatile Organic Compound Analysis for Food Safety Monitoring: a Preliminary Study" (2020). Graduate Theses, Dissertations, and Problem Reports. 7708. https://researchrepository.wvu.edu/etd/7708 This Thesis is protected by copyright and/or related rights. It has been brought to you by the The Research Repository @ WVU with permission from the rights-holder(s). You are free to use this Thesis in any way that is permitted by the copyright and related rights legislation that applies to your use. For other uses you must obtain permission from the rights-holder(s) directly, unless additional rights are indicated by a Creative Commons license in the record and/ or on the work itself. This Thesis has been accepted for inclusion in WVU Graduate Theses, Dissertations, and Problem Reports collection by an authorized administrator of The Research Repository @ WVU. For more information, please contact [email protected].
-
Upload
khangminh22 -
Category
Documents
-
view
0 -
download
0
Transcript of Evaluation of Salmonella Enteritidis and Escherichia coli ...

Graduate Theses, Dissertations, and Problem Reports
2020
Evaluation of Salmonella Enteritidis and Escherichia coli O157:H7 Evaluation of Salmonella Enteritidis and Escherichia coli O157:H7
Volatile Organic Compound Analysis for Food Safety Monitoring: Volatile Organic Compound Analysis for Food Safety Monitoring:
a Preliminary Study a Preliminary Study
Jessica E. Lemley West Virginia University, [email protected]
Follow this and additional works at: https://researchrepository.wvu.edu/etd
Part of the Biochemistry Commons, and the Food Microbiology Commons
Recommended Citation Recommended Citation Lemley, Jessica E., "Evaluation of Salmonella Enteritidis and Escherichia coli O157:H7 Volatile Organic Compound Analysis for Food Safety Monitoring: a Preliminary Study" (2020). Graduate Theses, Dissertations, and Problem Reports. 7708. https://researchrepository.wvu.edu/etd/7708
This Thesis is protected by copyright and/or related rights. It has been brought to you by the The Research Repository @ WVU with permission from the rights-holder(s). You are free to use this Thesis in any way that is permitted by the copyright and related rights legislation that applies to your use. For other uses you must obtain permission from the rights-holder(s) directly, unless additional rights are indicated by a Creative Commons license in the record and/ or on the work itself. This Thesis has been accepted for inclusion in WVU Graduate Theses, Dissertations, and Problem Reports collection by an authorized administrator of The Research Repository @ WVU. For more information, please contact [email protected].

Evaluation of Salmonella Enteritidis and Escherichia coli O157:H7 Volatile Organic Compound
Analysis for Food Safety Monitoring: a Preliminary Study
Jessica E. Lemley
A thesis submitted to the
Davis College of Agriculture, Natural Resources and Design
at West Virginia University
in partial fulfillment of the requirements
for the degree of
Master of Science
in
Nutritional and Food Science
Jacek Jaczynski Ph.D., Chair
Michael Gutensohn Ph. D
Kristen Matak Ph. D
Cangliang Shen Ph. D
Division of Animal and Nutritional Sciences
Morgantown, West Virginia
2020
Keywords: Volatile Organic Compounds, Headspace Gas chromatography-Mass Spectrometry,,
Food Safety, Liquid Egg, Ground Beef
Copyright 2020 Jessica Lemley

ii
Abstract
Evaluation of Salmonella enterica serotype Enteritidis and Escherichia coli O157:H7
volatile organic compounds for food safety monitoring: a Preliminary Study
Jessica E. Lemley
Food borne illness has the potential to impact every point of production from producers
to consumers. Food product recalls are common due to the presence of food borne illness
causing bacteria. Detection of volatile organic compounds (VOC) have the potential to reduce
the number of illnesses and recalls through application of additional monitoring of food products
like those most commonly recalled. The objective of this research was to 1) explore the use of
closed-loop headspace analysis coupled with gas chromatography-mass spectrometry (GC-MS)
on food borne illness causing bacteria and 2) examine the VOC profile of Escherichia coli
serotype O157:H7 in both tryptic soy broth (TSB) and ground beef. Escherichia coli JM109,
Escherichia coli DH5α, and Salmonella enterica serotype Enteritidis ATCC 13076 were chosen
to determine potential of bacteria to produce compounds not observed in their controls. A
closed-loop headspace analysis was utilized to collect headspace VOCs through the use of glass
absorbent filters filled with Alltech HaySep-Q™ PoraPak-Q™ that were then eluted with
dichloromethane. Eluted VOC samples were analyzed by GC-MS. Results of analysis were
evaluated for peak differences. Both E. coli strains grown in TSB produced typical indole peaks
during 2 different lengths (24 hours and 5 hours) of VOC collection in addition to four and five
peaks from E. coli JM109 and E. coli DH5α, respectively, that were not observed in their
controls. S. Enteritidis grown under optimal conditions in liquid egg produced a profile in which
seven compounds were detected in the inoculated liquid egg, but not observed in control after a
6-hour VOC collection. A 2-hour collection series produced inconsistent results suggesting that

iii
a collection of 2 hours may require a more sensitive GC-MS analysis or headspace collection.
Escherichia coli serotype O157:H7 ATCC 43985 grown in TSB and ground beef were subjected
to headspace VOC collection utilizing the closed-loop system for analysis. E. coli O157:H7
VOC analysis displayed 34 peaks of interest with 4 of these peaks not being detected in the
control of sterile TSB at retention times of 8.722, 9.402, 20.919, and 30.777. Ground beef
inoculated with E. coli O157:H7 displayed 48 peaks of interest with 22 compounds only
appearing in the bacteria inoculated ground beef and not the control of uninoculated ground beef.
This study has contributed to the foundation of VOC application within food safety and can be
used to guide future research utilizing this methodology.

iv
Acknowledgments
This project was funded by the US Department of Agriculture Hatch #H-684 and H-722.
Funding from Paul G. Moe Memorial and Janet Reed Endowment for Human Foods and
Nutrition were awarded through West Virginia University Enhancement Grant opportunities.
I would like to thank my advisor, Dr. Jacek Jaczynski, for the opportunity to continue my
education under his guidance as well as helping me to cultivate my interest in food science. I
appreciate his support within my research and during our class, which made my graduate school
career enjoyable.
I would also like to thank my committee members, Dr. Michael Gutensohn, Dr. Kristen Matak
and Dr. Cangliang Shen for their support, interest and advice throughout my time at West
Virginia University. I also truly appreciate the faculty and staff in the Animal and Nutritional
Sciences Department for enhancing my education. I would also like to extend my thanks to PhD
candidate Fumin Wang for help with running samples and operating GC-MS analysis.
Word cannot describe how grateful I am to the two undergraduate students who have volunteered
and worked alongside me. Their hard work, fresh ideas and dedication helped to bring this
research to light.
Lastly, I would like to express my gratitude to my family, my boyfriend and loved ones.
Without your support and encouragement this thesis and degree would not exist for me. Thank
you.

v
Table of Contents
Abstract ..................................................................................................................................... ii
Acknowledgments ..................................................................................................................... iv
Table of Contents ........................................................................................................................v
List of Tables ............................................................................................................................ vi
List of Figures .......................................................................................................................... vii
Chapter I .....................................................................................................................................1
Introduction .............................................................................................................................1
Chapter II ....................................................................................................................................7
Review of Literature ................................................................................................................7
Chapter III ................................................................................................................................ 31
Chapter IV ................................................................................................................................ 68

vi
List of Tables
Chapter III
Table 1. E. coli JM109 VOC compounds observed from a 24-hour VOC collection in tryptic soy
broth. These compounds were not identified in the control of sterile tryptic soy broth.
Compounds have been displayed with observed peak retention time (RT). Starting bacterial
concentration was a mean and standard deviation of 9.01±0.12 log CFU mL-1
tryptic soy broth.
Table 2. E. coli DH5α VOC compounds observed from a 24-hour VOC collection in tryptic soy
broth. These compounds were not observed in the control of tryptic soy broth. Compounds have
been displayed with observed peak retention time (RT). Starting bacterial concentration was a
mean and standard deviation of 8.81±0.19 log CFU mL-1
tryptic soy broth.
Table 3. E. coli DH5α VOC compounds observed from a 5-hour VOC collection in tryptic soy
broth. These compounds were not observed in the control of tryptic soy broth. Compounds have
been displayed with observed peak retention time (RT). Starting bacterial concentration was a
mean and standard deviation of 8.93±0.07 log CFU mL-1
tryptic soy broth.
Table 4. VOC compounds seen from S. Enteritidis inoculated liquid egg that did not appear in
the control of liquid egg. Starting bacteria concentration of this VOC collection was 4.02±0.08
log CFU ml-1
liquid egg. Compounds have been displayed with observed peak retention time
(RT).
Table 5. The bacteria concentration reported as mean and standard deviation (STDEV) of log
CFU mL-1 of S. Enteritidis in liquid egg every 2 hours of the VOC collection series for 8 hours.
Table 6. Unique, inconsistent compounds that appeared in S. Enteritidis inoculated liquid egg 2-
hour series that did not appear in the control of uninoculated egg. Compounds have been
displayed with observed peak retention time (RT).
Chapter IV
Table 1. VOC peak identification and peak area presented as peak area/hour/Log CFU mL-1
for
E coli O157:H7 grown in tryptic soy broth (TSB).
Table 2. VOC peak identification and peak area presented as peak area/hour/Log CFU g-1
ground beef for E coli O157:H7 grown in ground beef.

vii
List of Figures
Chapter III
Figure 1. The early methodology for collecting VOCs from 24-hour cultures utilizing a closed-
loop headspace VOC collection system held at room temperature under a biosafety cabinet. This
system utilizes a glass filter to trap headspace VOCs and Teflon tubing to prevent potential
interruption of VOC collection.
Figure 2. The closed-loop headspace collection system with a close up of the glass volatile
collection trap filter with Alltech HayeSep-Q™ PoraPak-Q™ chemical absorbent at the top
right. The Pyrex glass desiccator was placed on a standard stir plate with a glass beaker and stir
bar to provide gentle agitation. A rubber seal, hollow metal rod and Teflon tubing were used to
connect this system to the air pump and power supply. This system was utilized within a large
incubator for temperature control.
Figure 3. 24-hour VOC collection of uninoculated and E. coli JM109 tryptic soy broth. Starting
bacteria concentration is reported as a mean ± standard deviation of 9.01±0.12 log CFU mL-1
of
tryptic soy broth.
Figure 4. 24-hour VOC collection of uninoculated and E. coli JM109 tryptic soy broth with the
with the tentatively identified compound lupeol acetate labeled.
Figure 5. 24-hour VOC collection of uninoculated and E. coli JM109 tryptic soy broth with the
tentatively identified compound delta-dodecanolactone compound labeled.
Figure 6. Chromatograph from the 24-hour VOC collection of uninoculated and E. coli DH5ɑ
inoculated tryptic soy broth. Starting bacteria concentration is reported as a mean ± standard
deviation of 8.81±0.19 log CFU mL-1
of tryptic soy broth. The tentatively identified indole is
labeled.
Figure 7. Chromatograph from the 24-hour VOC collection of uninoculated and E. coli DH5ɑ
inoculated tryptic soy broth with tentatively identified compound 3-oxo-α-ionone labeled.
Figure 8. Chromatograph from the 24-hour VOC collection of uninoculated and E. coli DH5ɑ
inoculated tryptic soy broth with tentatively identified (x)-pentatriacont-17-ene labeled.
Figure 9. Chromatograph from the 5-hour VOC collection of uninoculated and E. coli DH5ɑ
inoculated tryptic soy agar. E. coli TSB was inoculated 24 hours prior to the start of the VOC
collection. Starting bacteria concentration is reported as a mean ± standard deviation of
8.93±0.07 log CFU mL-1
of tryptic soy broth. The tentatively identified compound indole was
labeled.
Figure 10. Chromatograph from the 5-hour VOC collection of uninoculated and E. coli DH5ɑ
inoculated tryptic soy agar. Tentatively identified compound 1-heptatriacontanol peaks are
denoted with a *.

viii
Figure 11. Chromatograph from the 5-hour VOC collection of uninoculated and E. coli DH5ɑ
inoculated tryptic soy agar. Tentatively identified compound 1,5-diphenyl-3-(3-
cyclopentylpropyl)pentane has been labeled.
Figure 12. Chromatograph from a 6-hour VOC collection of S. Enteritidis inoculated liquid egg
coupled with an uninoculated sample of liquid egg. Bacteria concentration at the start of this
collection is reported as mean ± standard deviation of 5.22±0.66 log CFU mL-1
of liquid egg.
Figure 13. Chromatograph from a 6-hour VOC collection of S. Enteritidis inoculated liquid egg
coupled with an uninoculated sample of liquid egg with 1,1,2,2-tetrafluorethane, 4-amino-1-
pentanol all labeled. The peaks labeled *1 and *2 are 2-nitrobutane and 5-
(cyclohexylmethyl)pyrrolidine-2-one respectively.
Chapter IV
Figure 1. Growth of E. coli O157:H7 in tryptic soy broth over 10 hours at 37°C and shaken at
150 rpm. Starting and ending bacteria concentration reported as mean ± standard deviation of
5.45±0.51 and 9.48±0.35 log CFU ml-1 of tryptic soy broth, respectively.
Figure 2. VOC chromatograph from the control of uninoculated tryptic soy broth and sample 1
of E. coli O157:H7 inoculated tryptic soy broth collected for 6 hours. Starting bacteria
concentration reported as mean ± standard deviation of 6.07±0.52 log CFU mL-1
tryptic soy
broth. The internal standard naphthalene present at retention time of 18.45 is labeled IS on the
graph.
Figure 3. VOC chromatograph from the control of uninoculated tryptic soy broth and sample 2
of E. coli O157:H7 inoculated tryptic soy broth collected for 6 hours. Starting bacteria
concentration reported as mean ± standard deviation of 6.07±0.52 log CFU mL-1
tryptic soy
broth. The internal standard naphthalene present at retention time of 18.45 is labeled IS on the
graph.
Figure 4. VOC chromatograph from the control of uninoculated tryptic soy broth and sample 3
of E. coli O157:H7 inoculated tryptic soy broth collected for 6 hours. Starting bacteria
concentration reported as mean ± standard deviation of 6.07±0.52 log CFU mL-1
tryptic soy
broth. The internal standard naphthalene present at retention time of 18.45 is labeled IS on the
graph.
Figure 5. VOC chromatograph from the control of uninoculated tryptic soy broth and all 3
samples of E. coli O157:H7 inoculated tryptic soy broth collected for 6 hours. This
chromatograph is showing peaks from all samples and control tentatively identified as 2,5-
dimethyl pyrazine.
Figure 6. VOC chromatograph from the control of uninoculated tryptic soy broth and all 3
samples of E. coli O157:H7 inoculated tryptic soy broth collected for 6 hours. This
chromatograph is displaying the peak from all samples and control tentatively identified as 1-
heptatriacotanol marked with an *.

ix
Figure 7. VOC chromatograph from the control of uninoculated beef and sample 1 of E. coli
O157:H7 inoculated tryptic soy broth collected for 6 hours. Starting and ending bacteria
concentration reported as mean ± standard deviation of 5.68±0.15 log CFU g-1
and 8.17±0.23 log
CFU g-1
of beef respectively. The internal standard naphthalene present at retention time of
18.45 is labeled IS on the graph.
Figure 8. VOC chromatograph from the control of uninoculated beef and sample 2 of E. coli
O157:H7 inoculated tryptic soy broth collected for 6 hours. Starting and ending bacteria
concentration reported as mean ± standard deviation of 5.68±0.15 log CFU g-1
and 8.17±0.23 log
CFU g-1
of beef respectively. The internal standard naphthalene present at retention time of
18.45 is labeled IS on the graph.
Figure 9. VOC chromatograph from the control of uninoculated beef and sample 3 of E. coli
O157:H7 inoculated tryptic soy broth collected for 6 hours. Starting and ending bacteria
concentration reported as mean ± standard deviation of 5.68±0.15 log CFU g-1
and 8.17±0.23 log
CFU g-1
of beef respectively. The internal standard naphthalene present at retention time of
18.45 is labeled IS on the graph.
Figure 10. VOC chromatograph from the control of uninoculated beef and all 3 samples of E.
coli O157:H7 inoculated beef collected for 6 hours. This chromatograph is displaying the peak
from all samples and control tentatively identified as dodecane.
Figure 11. VOC chromatograph from the control of uninoculated beef and all 3 samples of E.
coli O157:H7 inoculated beef collected for 6 hours. This chromatograph is displaying the peak
from all samples and control tentatively identified as butylated hydroxytoluene or as an unknown
compound.
Figure 12. Closed-loop headspace VOC collection system. Uninoculated and inoculated ground
beef samples during a 6 hour VOC collection.

1
Chapter I
Introduction
An estimated 9.4 million illnesses and 1,351 deaths occur within the United States each
year due to foodborne illness raising questions about the safety of our food (Scallan et al. 2011).
The U.S. Food and Drug Administration has listed over 100 recalls on food and drink products
due to actual and potential bacterial contamination in 2018 and 2019 (Affairs 2019). Multistate
outbreaks and recalls can have negative consequences leaving consumers questioning for years if
a product is safe to consume. A product-harm crisis such as bacterial contamination, also known
as product recall, has the potential to negatively impact a company through immediate loss in
sales, loss in effectiveness of marketing strategies, and a now negative outlook from consumers
on any brands that are owned by the same firm or associations (Van Heerde, Helsen, and
Dekimpe 2007). When prevention fails, early detection of bacteria is key in preventing illness
and loss of product. Bacterial contamination detection currently takes 24 hours for a positive
result and then an additional 3 days for further identification and confirmation (Zhu and Hill
2013). Specific volatile organic compounds (VOC) and their patterns and clusters have the
potential to allow for early, rapid detection of bacteria possibly down to species (Veselova,
Plyuta, and Khmel 2019). VOCs have the potential to be used for monitoring food products
during production and manufacturing to alert for the need for further microbiological testing.
VOCs are small organic compounds that are volatile under typical temperature and
pressure conditions; furthermore, these compounds are often responsible for odor. Examples of
VOCs include the aroma provided by different wines, flowers and even decomposition. The
VOCs released by bacteria are primary and secondary metabolites produced during metabolism
and for communication purposes (Chen et al. 2017). Expected bacterial compound production

2
includes fatty acid derivatives, terpenes, aromatic compounds, as well as sulfur and nitrogen
containing compounds (Veselova, Plyuta, and Khmel 2019). Investigation of VOCs and species
specific bacterial VOCs useful for identification can become applicable in many fields including
medical diagnosis, agricultural improvement, environmental contamination, food monitoring and
food safety (Boots et al. 2014; Chen et al. 2017; Taiti et al. 2015; Veselova, Plyuta, and Khmel
2019; Wood et al. 2006). There are numerous ways of collecting and differentiating VOCs. The
most common way reported in literature is that of headspace solid phase micro-extraction
coupled with gas chromatography (SPME/GC-MS). Other collection systems include secondary
electrospray ionization-mass spectrometry (SESI-MS) and proton-transfer time-of-flight mass
spectrometry (PTR-ToF-MS) (Taiti et al. 2015; Zhu et al. 2010).
VOCs have been monitored as part of environmental soil science and health. Its
application within food science generally falls into two categories: food monitoring and food
safety. Food monitoring applications would use volatile compounds, not necessarily from
bacteria, to examine the quality of the food matrix product. Examples may include products that
are known for their aroma like wine, cheese and the ripening of fruit. Food safety would
examine the potential use of VOCs to identify bacteria on food products thus declaring them
unsafe or adulterated. Characterization of the compounds produced by bacteria is just the first
step in the use of VOCs in an applicable manner to monitoring food supplies for spoilage and
foodborne illness causing bacteria.
Monitoring VOCs released from food has the potential to lead to food quality monitoring
of products such as milk and the post-harvest ripening of imported fruit (Decimo et al. 2018;
Taiti et al. 2015). Food quality and processing has become and will continue as a critical aspect
of today’s consumer market. Restaurants and businesses have moved to advertise quality of

3
ingredients and have changed menu offerings to draw in potential consumers. VOCs are being
examined as a tool in providing those quality, fresh ingredients that may be prone to spoilage due
to their fresh nature. VOC detection may be used to identify potentially harmful bacteria in food
products and can potentially streamline microbiological testing through bacteria identification or
directing when further microbiological testing should be completed saving time and resources.
For example, the FSIS of the USDA suggests sampling at least one 2-pound sample of ground
beef per production lot (USDA, 2019). In the raw beef product sampling inspection methods
sampling frequencies are stated to vary by production facility size as well as production volume
(Inspection Methods Training n.d.). VOCs need to be examined for the potential to easily
analyze food products more fully to aid in the prevention of adulterated or unsafe products being
released for consumption. The aim of this research is to evaluate current studies regarding the
use of VOCs to detect pathogenic bacteria associated with food products and the potential use of
VOCs in detecting foodborne illness causing bacteria.

4
References
Affairs, Office of Regulatory. 2019. “Recalls, Market Withdrawals, & Safety Alerts.” FDA.
http://www.fda.gov/safety/recalls-market-withdrawals-safety-alerts (July 1, 2019).
Bhattacharjee, Paramita, Suranjan Panigrahi, Dongquig Lin, Catherine M. Logue, Julie S.
Sherwood, Curt Doetkott, and Martin Marchello. 2011. “A Comparative Qualitative
Study of the Profile of Volatile Organic Compounds Associated with Salmonella
Contamination of Packaged Aged and Fresh Beef by HS-SPME/GC-MS.” Journal of
Food Science and Technology 48(1): 1–13.
Boots, A W, A Smolinska, J J B N van Berkel, R R R Fijten, E E Stobberingh, M L L Boumans,
E J Moonen, E F M Wouters, J W Dallinga, and F J Van Schooten. 2014. “Identification
of Microorganisms Based on Headspace Analysis of Volatile Organic Compounds by
Gas Chromatography–Mass Spectrometry.” Journal of Breath Research 8(2): 027106.
Chen, Juan, Junni Tang, Hui Shi, Cheng Tang, and Rong Zhang. 2017. “Characteristics of
Volatile Organic Compounds Produced from Five Pathogenic Bacteria by Headspace-
Solid Phase Micro-Extraction/Gas Chromatography-Mass Spectrometry.” Journal of
Basic Microbiology 57(3): 228–37.
Decimo, Marilù, Marίa C, Juan A Ordóñez, Ivano De Noni, and Milena Brasca. 2018. “Volatile
Organic Compounds Associated with Milk Spoilage by Psychrotrophic Bacteria.”
International Journal of Dairy Technology 71(3): 593–600.

5
“Inspection Methods Training.”
https://www.fsis.usda.gov/wps/portal/fsis/topics/inspection/workforce-training/regional-
on-site-training/inspection-methods/inspection-methods (January 25, 2020).
Scallan, Elaine, Patricia M. Griffin, Fredrick J. Angulo, Robert V. Tauxe, and Robert M.
Hoekstra. 2011. “Foodborne Illness Acquired in the United States—Unspecified Agents.”
Emerging Infectious Diseases 17(1): 16–22.
Taiti, Cosimo, Corrado Costa, Paolo Menesatti, Stefania Caparrotta, Nadia Bazihizina, Elisa
Azzarello, William Antonia Petrucci, Elisa Masi, and Edgardo Giordani. 2015. “Use of
Volatile Organic Compounds and Physicochemical Parameters for Monitoring the Post-
Harvest Ripening of Imported Tropical Fruits.” European Food Research and
Technology 241(1): 91–102.
United States Food and Drug Administration. Food Safety and Inspection Service. 2019. Raw
Beef Product Sampling.
Van Heerde, Harald, Kristiaan Helsen, and Marnik G. Dekimpe. 2007. “The Impact of a Product-
Harm Crisis on Marketing Effectiveness.” Marketing Science 26(2): 230–45.
Veselova, M. A., V. A. Plyuta, and I. A. Khmel. 2019. “Volatile Compounds of Bacterial Origin:
Structure, Biosynthesis, and Biological Activity.” Microbiology 88(3): 261–74.
Wood, William L., Daniel J Higbee, Melanie Gooldy, Scott Glogowski, Rich Fitzpatrick,
Richard J Karalus, Troy D. Wood, and David J. Mangino. 2006. “Analysis of Volatile
Bacterial Metabolites by Gas Chromatography--Mass Spectrometry.” Spectroscopy
21(6): 20–28.

6
Zhu, Jiangjiang, Heather D. Bean, Yin-Ming Kuo, and Jane E. Hill. 2010. “Fast Detection of
Volatile Organic Compounds from Bacterial Cultures by Secondary Electrospray
Ionization-Mass Spectrometry.” Journal of Clinical Microbiology 48(12): 4426–31.
Zhu, Jiangjiang, and Jane E. Hill. 2013. “Detection of Escherichia Coli via VOC Profiling Using
Secondary Electrospray Ionization-Mass Spectrometry (SESI-MS).” Food Microbiology
34(2): 412–17.

7
Chapter II
Review of Literature
Volatile Organic Compounds
This review of literature will examine resources in an effort to guide future research
dedicated to the use of volatile organic compounds for the application of using VOCs as a way to
detect potential bacterial contamination of food products. This review will look into VOC
production from bacteria, analysis of those compounds, influences upon VOC production that
may impact the use of VOC in food safety and past studies examining profiles of bacterial VOCs
from food products.
VOC Production
Bacterial VOCs are metabolites released by bacteria during growth and maintenance
processes through metabolic pathways (Tait et al. 2014b). Secondary metabolites that may be
used for communication between cells and with the environment can also be considered bacterial
volatile compounds (Chen et al. 2017; Vaishnav et al. 2017). These compounds are
disseminated through the environment from the bacteria including air, liquid media or even soil
(Veselova, Plyuta, and Khmel 2019). Bacterial VOCs can induce bacterial sporulation, suppress
the growth of the surrounding microbial community, and even induce factors of virulence
(Audrain et al. 2015; Veselova, Plyuta, and Khmel 2019). Volatiles can be defined as
compounds that have a low molecular weight, less than 300 Daltons, in addition to a high vapor
pressure allowing for the evaporation of the compound into the environment (Vaishnav et al.
2017). Common and well-known VOCs include the aromas produced by bacteria fermentation
seen in wine along with cheese production that help to produce desired flavors (Schulz and

8
Dickschat 2007). VOCs in food production have been studied like that in wine production which
aims to create a desirable aroma that influences the overall flavor and final product (Panighel and
Flamini 2014). Generally catabolic pathways are the metabolic processes that produce these
volatile compounds which include pathways like glycolysis which is the breakdown of glucose
or lipolysis known as the hydrolysis of triglycerides to produce glycerol and fatty acids.
Expected Bacteria Produced Compounds
Alkenes, alcohols, ketones, terpenes, benzoids, pyrazines, acids and esters are the
dominant compounds produced by bacteria (Veselova, Plyuta, and Khmel 2019). These
compounds can fall into five general categories including fatty acid derivatives, terpenes,
aromatic compounds, sulfur containing compounds, and nitrogen containing compounds. Fatty
acid derivatives encompasses a wide range of compounds from hydrocarbons to acids and esters
and are generally intermediates of fatty acid metabolism (Veselova, Plyuta, and Khmel 2019).
Terpenes are compounds produced through biosynthesis pathways including the methylerythritol
4-phosphate (MEP) pathway producing monoterpenes and sesquiterpenes both of which have
previously been reported as bacteria VOC (Schulz and Dickschat 2007; Veselova, Plyuta, and
Khmel 2019). Metabolites that are aromatic compounds are derived from the degradation
pathways of L-phenylalanine and L-tyrosine. Sulfur containing organic compounds are
generally seen in fermented products such as cheese and wine with bacteria producing
compounds that include dimethyl sulfide, dimethyl disulfide and dimethyl trisulfide. There are
three major pathways bacteria can use to produce sulfur containing compounds and they include
dimethylsulfoniopropionate (by marine bacteria generally), methylation of inorganic sulfide
(generally in freshwater habitats), and the L-methionine catabolic pathway which produces a

9
range of sulfur compounds by cheese ripening bacteria and lactic acid bacteria (Audrain et al.
2015; Schulz and Dickschat 2007). The last major grouping of bacteria produced volatile
compounds are the nitrogen containing organic compounds. Indole is an example of a nitrogen
containing VOC in which production has been well documented in Escherichia coli species. E.
coli utilize the enzyme tryptophanase which can reversibly use tryptophan to produce indole,
pyruvate and ammonia influenced by environmental factors (Veselova, Plyuta, and Khmel
2019). It should also be noted that bacteria can also produce inorganic compounds such as
hydrogen sulfide, ammonia and nitric oxide (Audrain et al. 2015; Veselova, Plyuta, and Khmel
2019). Produced bacterial VOC tends to change with environmental influences including media
and cultivation methods which in turn influence metabolic processes. Different bacterial species
may also be more adept at producing certain compounds for example cyanobacteria are known to
produce longer and branched hydrocarbons (Audrain et al. 2015).
VOC Collection and Analysis
In addition to the numerous compounds bacteria can produce, there are numerous ways to
collect and analyze these compounds. Closed-loop stripping systems with gas chromatography-
mass spectrometry (GC-MS), solid-phase microextraction (SPME) followed by GC-MS, thermal
desorption, ion-molecule reaction-MS, secondary electrospray ionization-MS, proton-transfer-
reaction time-of-flight MS (PTR-ToF-MS) are all methods used to capture and analyze VOCs
released from bacteria that have been seen in scientific literature. In the sample of experimental
papers discussed in this review, SPME with GC-MS has been the most common method. Plant
studies evaluating VOCs commonly use a closed-loop system in which volatile compounds are

10
trapped and extracted for analysis with GC-MS or directed airflow systems (Vaishnav et al.
2017).
Generally, with all of the systems available to collect volatile organic compounds, the
main principle remains the same in collection. Whether a trapping system, solid phase
microextraction, or even magnetic stir-bar sorptive extraction using polydimethylsiloxane, all of
these systems use an absorptive surface that interacts with and traps the volatiles released from
the interested sample (Sparkman, Penton, and Kitson 2011). Once the collection of VOCs takes
place, the samples are then analyzed by gas chromatography coupled with mass spectrometry.
Oftentimes with the adsorptive surfaces of VOC collection systems, the VOCs are removed and
enter the GC-MS analysis system through increased temperature or elution with organic solvents
to disrupt the VOC-adsorptive surface interface. Some absorptive surfaces like the closed-loop
stripping apparatus filters in which the headspace is pumped through, an organic solvent is used
to disrupt the interaction between the filter and the collected VOC. This produces a liquid VOC
sample that can then be injected for GC-MS analysis.
GC-MS offers a way to evaluate metabolites through identification and has been
used for years reliably while covering several classes of compounds (Lisec et al. 2006). GC-MS
analyses, though generally coupled together in a lot of cases, are two separate processes that
provide VOC analysis, also known as metabolite profiling (Lindon, Nicholson, and Holmes
2019). Gas chromatography is the first step in which the contents of the VOC sample are
separated in a heated column and carrier gas such as helium or hydrogen (Sparkman, Penton, and
Kitson 2011). The heated injection and heated column promotes the migration of compounds as
they vaporize from the sample and begin to separate based on the volatility and polarity of the
compound. Moving from the mobile phase into a stationary phase within the column, the

11
characteristics of the compound determine separation. The faster a compound is traveling within
the column the earlier the compound will leave the column resulting in a shorter retention time
for that compound appearing within the data output (Lindon, Nicholson, and Holmes 2019).
Mass spectrometry, in this case, follows GC in which the separated compounds still being carried
by the carrier gas are injected into the MS generally under temperature controlled conditions
(Sparkman, Penton, and Kitson 2011). Generally, each MS consists of 3 parts, an ion source in
which the ions are transferred into the MS, a mass analyzer which will separate ions based on
their mass and charge and finally an ion detector (Sauer and Kliem 2010). Mass spectrometry
produces the data output known as a mass spectra for each compound previously separated then
analyzed. A chromatograph is also a common output that includes the mass spectra but graphs
the analyzed compounds by intensity and retention time (Sparkman, Penton, and Kitson 2011).
From there software reference libraries designed for compound identification can be used to
potentially identify compounds of interest. An authentic standard for comparison can then be
used for further identification of the compound (Lisec et al. 2006). Beyond compound
identification, analysis can then take many forms including the quantification of compounds of
interest also using a known internal standard.
Influence of Media
Of the reviewed literature, multiple influences upon the production of bacterial volatiles
have become apparent including the media used to culture bacteria, the presence of a mixed
culture system, and the growth phase of the bacterial community. Media may influence VOC
production based on the available nutrients to the bacteria to utilize during metabolism. A study
evaluating volatiles released by Chondromyces crocatus grown on two different media cultures

12
of either VY/2 agar or CY agar with the first specific to yeast and the second containing peptone
from casein (Schulz, Fuhlendorff, and Reichenbach 2004). Both media were treated the same
and incubated in the dark at 30°C. VOCs were collected from the headspace and analyzed by a
GC-MS. Their results showed considerable variation between the two media with
sesquiterpenoids more present using the peptone medium and pyrazines more associated with the
yeast medium (Schulz, Fuhlendorff, and Reichenbach 2004). Though Chondromyces crocatus is
a common bacteria species found within the soil, the differences seen within this study must be
kept in mind for any food matrix and differences between products moving forward.
Different media would impact released VOCs due to the starting substrate for bacterial
metabolism. Bacteria adapt to their surroundings and the resources available influencing their
speed of growth, proliferation, and overall metabolism. An objective of Tait et al’s
“Identification of Volatile Organic Compounds Produced by Bacteria Using HS-SPME-GC-MS”
was to evaluate the effect of media upon bacterial VOC profiles of E. coli, S. aureus and
Klebsiella pneumoniae. Three broth media were used for this study including brain heart
infusion, tryptone soya and enteric fermentation base. Bacteria were incubated for 18 hours at
37°C without shaking before being subjected to the headspace solid-phase microextraction gas
chromatography-mass spectrometry collection and analysis (Tait et al. 2014b). Results showed
comparable VOC profiles between the BHI and TS broths attributed to similar composition.
VOC profile for E. coli and the other two bacteria were significantly different in EF when
compared to the other broth types (Tait et al. 2014b). Ratiu and colleagues also looked at E. coli
(ATCC 8739) grown in three different broth media of tryptic soy broth (TSB), Mueller Hinton
(MH) medium and minimal salts (M9) medium enriched with glucose while using headspace
SPME coupled with GC-MS to analyze volatile profiles (Ratiu et al. 2017). E coli was

13
inoculated to the three broth types with an optical density 1 at 600nm. After 24 hours and for
each day following optical density was recorded and remained about the same throughout the 72-
hour experiment suggesting 2100x106 CFU ml
-1, 1800x10
6 CFU ml
-1, and 1350x10
6 CFU ml
-1
for TSB, MH and M9 respectively. The SPME fiber was exposed for 45 minutes to the culture at
37°C after 24, 48 and 72 hours (Ratiu et al. 2017). Results suggested that each media produced
characteristic VOCs including indole production highest in TSB, pyrazines characteristic of MH
with M9 producing a VOC profile including primary and secondary alcohols and ketones.
Overall, different compounds can be seen to be produced in three different media tested with 24
compounds unique to one media (Ratiu et al. 2017).
The next study evaluated media’s influence on VOCs in food modeling medium of meat
extract, vegetable extract and apple extract media testing Escherichia coli O157:H7,
Staphylococcus aureus and Salmonella enterica serotype Typhimurium (Zhu and Hill 2013).
Results reported the production of unique VOC profiles containing consistent compounds with
similar intensities for each bacteria across the three media. No comparison was discussed
between different media profiles for the same bacteria, but visual differences can be seen in the
chromatographs (Zhu and Hill 2013). This study, however, shows that core peaks can be
identified for bacteria across media and could be suggested for use of bacterial identification.
Media influence was also explored in another publication by Zhu and Hill that looked at the
growth of Pseudomonas aeruginosa on a variety of media including TSB, LB-Lennox, a
synthetic cystic fibrosis media and MOPS media (Zhu et al. 2010). The PCA plot demonstrating
growth on different media did present a cluster at the center of the plot. The VOC spectra
produced on TSB showed some variability suggesting that the method of secondary electrospray
ionization-mass spectrometry may be used to determine bacteria despite media (Zhu et al. 2010).

14
Zhu et al. 2010 still notes that different media may have the potential to impact VOC profiles.
Differences in VOC profiles in food matrices potentially may be seen through the relative
intensity between similar samples. An example of this in relation to food safety may be
considered in beef products. The fat content of ground beef in different products may impact the
potential for differing profiles of volatiles for those products.
VOC Influence of Mixed Cultures
A second potential influence to be addressed is the VOCs collected from mixed bacterial
cultures. The nature of environmental samples and the ubiquity of bacteria make it unrealistic to
expect only one bacteria species or strain when collecting and identifying VOCs. Once a
bacterial VOC profile on a desired media has been solidified the use of mixed culture VOC
collection can help to mimic a more realistic sample that could be obtained. For example, 70%
of raw ground beef samples tested positive for coliforms, 17.5% for E. coli (not E. coli
O157:H7), 25% Listeria spp. and 5% of samples for Listeria monocytogenes (Pao and Ettinger
2009). Pao and Ettinger also noted psychrotrophs, yeasts and molds within the local raw beef
samples as well as locally frozen beef and internet ordered beef samples. Fresh ground beef has
been shown to host a number of bacteria in addition to molds and yeast creating a complex food
matrix that will need to be kept in mind moving forward.
To investigate complex microbial mixture environments, Zhu et al. examined the VOC
profile of three different ratio mixed culture systems of S. aureus and P. aeruginosa. The VOC
profile was more representative of the bacteria that had a higher presence with the 1:1 ratio
displaying expected mix of VOCs from each bacteria involved. Results displaying a linear trend
of VOC production suggest that for these two bacteria a mixed culture did not influence VOC

15
production (Zhu et al. 2010). The limitations of this study are that it was limited to two bacteria
species and was completed in tryptic soy broth suggesting that more studies in different media
and more varied bacteria should be tested.
Chen et al. also performed mixed culture VOC analysis consisting of S. aureus and E.
coli O157:H7. 3-methyl-butannal and 3-methyl-butanoic acid both decreased in maximum
signal intensities for S. aureus VOC production when comparing the mixed to the mono culture.
Indole intensities from E. coli O157:H7 were similar when comparing the two experimental
groups (Chen et al. 2017). This conflicts with the results presented by Zhu et al. that suggested a
linear relationship of VOCs and mixed cultures. This could be due to the presence of different
bacteria in question and their interactions within the growth medium. These studies discussing
mixed culture influence were completed using tryptic soy broth (TSB).
VOC Influence of Growth Phase
A third impact can be considered the growth phase of the bacteria. The 4 phases of
growth in which different metabolic processes would occur for bacteria are lag, log, stationary
and death phases (Debnath et al. 2012). Lag phase is the slowest rate of growth where the
bacteria adapt to their environment followed by exponential growth. Following the exponential
growth of log phase bacteria reach stationary phase in which population numbers are sustained
due to competition for available nutrients (Debnath et al. 2012). The last phase is the death
phase in which nutrients are depleted leading to a decline of the bacteria population. Each of
these phases would be influenced by the external environment and secondary metabolites
released by the bacteria transferring to the VOCs the bacteria may release as well as affecting
growth of microorganisms within the micro community (Veselova, Plyuta, and Khmel 2019).

16
Kunze et al. and Bunge et al. have both shown influence of growth phase upon the VOC
profile recorded utilizing standard laboratory mediums. Kunze et al. used lysogeny broth to
determine E. coli and P. aeruginosa growth curves establishing growth curves in which four
times representative of the first three of the four growth phases. The four time points were 45,
105, 225, and 450 minutes after inoculation and 90, 270, 440, and 760 minutes for E. coli and P.
aeruginosa respectively (Kunze et al. 2013). Synthetic air was used to keep environmental
contamination as low as possible. Gas samples were taken for 10 seconds, analyzed using multi-
capillary column-ion mobility spectrometry and substances were identified using a database that
included reference data. Multiple differences were detected within the VOC profiles including
5-methylheptan-3-on, nonanal, 2-phenylacetaldehyde, and unknown P_720_16 intensities
decreasing in both cultures after inoculation. Azane increased intensity in both cultures over
time. For E. coli unknown substance P_642_48 had the highest intensity during early active
growth but then continued to fall as the bacteria monoculture increased. This same compound
increased regularly for P. aeruginosa. Kunze et al., although not continuously recording VOC
profiles of growing cultures, did present results that represent an active growing culture moving
through the four phases of microbial growth and that different VOC profiles are present within
that culture. One limitation to this is the overlapping of phases after the VOC collection has
taken place. This could influence the intensity of compounds present. To move forward with
this design, but decrease the overlapping of VOC profiles more sampling points along the
bacterial growth curve is suggested.
The second of the two growth phase studies by Bunge et al. openly challenges VOC
studies that only include one VOC measurement collection due to the different compounds
potentially produced at different phases of growth. Complex media suggested by the

17
microorganism retailer was used to support the growth of E. coli, Shigella flexneri, S. enterica
serotype enterica and yeast Candida tropicalis. 12 minute long headspace VOC measurements
were taken continuously for 24 hours with 36 minute interval between samples (Bunge et al.
2008). Of the 12 minute sample, the first 5 minutes was discarded to reduce the influence of
carryover from the previous sample and processed using proton transfer reaction-mass
spectrometry (Bunge et al. 2008). With an interval of only 36 minutes Bunge and associates
were able to more accurately measure the VOC profile over a 24-hour period of microbial
growth with the majority of microbial culture measurements taken during stationary phase.
Compounds they were not able to identify were referred to as their mass number reported as
atomic mass unit (amu). S. enterica serotype enterica saw the increase of compound 89 amu
with the progression of time in all inoculated samples while compound 73 amu did not appear
until incubation time reached 9 hours. S. flexneri developed an acetaldehyde peak before visual
signs of microbial growth were reported and not seen again after 6 hours. Indole, compound 118
amu, production from E. coli increased quickly after 3 hours peaking near hour 6 and gradually
declining. Starting optical density measured at 660 nm was 0.01 and shown as just below 1 x 10⁸
cells per mL of broth (Bunge et al. 2008). To accurately show the different profiles over 24
hours of growth starting at a smaller dilution would provide more information on the VOC
profiles in different phases of growth. This study does portray methodology that allows for
continuous monitoring of released volatiles from a microorganism which can, if utilized further,
provide key insight into early volatile production of bacteria. This study has also displayed that
single time VOC analysis of a bacteria without the consideration of phase of bacteria may not
appropriately capture VOCs one may be interested in. This concept must be kept in mind
18
moving forward when utilizing VOCs to potentially predict conditions of food products during
production.
Raw chicken and beef strip loins were examined in 3 different studies evaluating VOC
response in storage conditions for ten and four days respectively. Klein and colleagues
examined VOCs from chicken inoculated with P. fluorescens or E. coli under modified
atmosphere packaging (MAP) utilizing thermal desorption-gas chromatography-mass
spectrometry analysis. MAP conditions contained 70% oxygen and 30% carbon dioxide and
held within a standard refrigerator (Klein et al. 2018). During the evaluation of P. fluorescens
different concentrations of compounds were seen when compared to the uninoculated chicken
breast. Dimethyl disulfide (DMDS) and 3-hydroxy-2-butanone began to increase peak area after
day 3 of the study and continued to rise throughout the remaining 10 days. S-methyl thioacetate
did not start to increase until day 8. Pent-1-ene, ethyl acetate and dimethyl sulfide also showed
increases over the 10 day study (Klein et al. 2018). For E. coli only 3-methylbutanal was
observed starting at day 2 and seen to increase and then remain steady after day 6. 2-methyl-1-
butanol, 2-methyl-1-propanol, 3-methyl-1-butanol and DMDS were first seen on day 6 of storage
and increased for the remainder for the study. Dimethyl trisulfide and s-methyl thioacetate were
first seen on day 7 and 8 respectively and continued to increase for the remaining days in storage
(Klein et al. 2018). This 10 day study presents the change in VOCs under consumer purchased
refrigerated conditions demonstrating the production of VOCs under refrigeration conditions that
may transfer to food production. Sensitivity and specificity of VOC measurements will be major
factors when evaluating high volumes of a food product with potential for a very low bacterial
presence.

19
Packaged aged and fresh beef were also examined over multiple days after inoculation
with an avirulent strain of S. typhimurium by Bhattacharjee and colleagues incubated at 20°C for
four days. Inoculation of the beef was approximately 103-10
4 CFU per gram of beef and
analyzed using SPME GC-MS to obtain the VOC profile (Bhattacharjee et al. 2011). There were
four positively correlated compounds for fresh beef and 5 positively correlated compounds for
age beef that increased with rising bacteria population. The results of this study exhibit a change
in VOC profile during bacterial growth. The temperature held at 20°C represented the potential
for the meat to increase up to during processing (Bhattacharjee et al. 2011). To get a more
accurate representation of VOCs during production refrigeration or processing temperatures
should be used to more accurately mimic food processing.
Like that of the laboratory media studies discussed previously, Chen and colleagues
evaluated the VOC of E. coli O157:H7 on irradiated pork over 20 hours with a starting
incubation of about 1.4 log10 CFU per gram of pork. This study incubated inoculated pork at
35°C for 20 hours analyzing VOCs using headspace SPME GC-MS (Chen et al. 2016). Before
the SPME fiber was inserted into the sample vial the sample was incubated at 80°C for 10
minutes and the fiber was left to collect VOCs from the headspace for 30 minutes remaining at
80°C (Chen et al. 2016). The increase in sample temperature would yield the best and high
volatile intensities than remaining at 35°C. Though these measurements may be optimal they are
not under conditions seen in food processing and manufacturing and must be kept in mind when
suggesting this technology for further use. Indole was measured in the inoculated pork samples,
but did not appear in the uninoculated control. Indole, in this study, increased with increasing
incubation time with an especially sharp increase after 14 hours of incubation (Chen et al. 2016).
2-Tridecanone follows a similar trend as indole through increasing greatly around 14 hours of

20
incubation. 1-Nonanone and 2-heptanone begin to increase around hour 8 and 10 respectively
peaking at hour 16 followed by a decline in peak area for the rest of the experiment. Both 1-
hexanol and 1-octanol peaked between 10 and 12 hours of incubation followed by a decline.
These compounds were not seen produced in the uninoculated pork (Chen et al. 2016). This
study supports the temporality of VOCs and the fluctuations associated with different growth
phases.
Bacterial volatile compounds have been seen to vary depending on multiple factors
including nutrient source, the presence of other bacteria and phase of growth for the targeted
microorganism. With the standardization of methodology and established volatile profiles VOC
have the potential to benefit agriculture and food production through identifying pathogenic
bacteria through the detection of one or several compounds released during microbial growth.
VOC Application using Food Products
Food products tested for bacterial VOCs of foodborne illness causing bacteria mainly
include that of chicken (Arnold and Senter 1998; Klein et al. 2018), beef (Abdallah et al. 2013;
Bhattacharjee et al. 2011; Cevallos‐Cevallos, Danyluk, and Reyes‐De‐Corcuera 2011) and pork
(Chen et al. 2016). Food modeling media have also been used to simulate potential VOC
profiles (Zhu and Hill 2013). Application of VOCs in a sensor for meat production has the
potential to guide testing procedures and potentially identify bacteria present within the product.
This would allow for an increased monitoring over a larger amount of product than the
microbiological testing of a randomly selected sample. Meat, however, is not the only food
known to carry foodborne illness causing bacteria. Recently enoki mushrooms and curry powder

21
were recalled due to the potential for L. monocytogenes and Salmonella, respectively (Nutrition
2020a, 2020b).
Keshun Yu and colleagues investigated the VOC production from E. coli O157:H7
inoculated strawberries. Strawberries were inoculated with E. coli O157:H7 concentration of 107
CFU/mL and allowed to dry for 1-hour prior to headspace VOC collection at room temperature
for up to 72 hours using Super-Q absorbent filter, solvent extract followed by GC-MS analysis
(Yu et al. 2000). Indole proved to be a main compound seen in VOC collection using BHI broth
but did not appear when evaluating the inoculated strawberries. The compounds seen were those
released from the strawberry. The next step to their experiment was to evaluate the strawberry’s
ability to absorb volatile compounds as suggested by a previous paper (Yu et al. 2000). When
testing indole, the strawberry decreased the compound by 97% over an 18-hour test period.
Overall, strawberries were found to decrease between 86% and 99% of 10 volatile compounds
(Yu et al. 2000). This study helps to shed some light on another way in which the media or food
product tested can interact with the volatile compounds not just produce their own.
Listeria monocytogenes in different milk samples were evaluated for enzyme-generated
VOC by Emma Tait and colleagues for bacterial detection. Headspace SPME with GC-MS was
used to analyze enzyme-generated VOC from Listeria enrichment broth (LEB) inoculated with
100 µl of 1-1.5x10⁷ CFU bacterial suspension followed by the addition of 0.9mL of one of seven
milk samples and enzyme substrate. The LEB, enzyme substrates, milk and bacteria mixture
were incubated overnight at 37°C before being analyzed for VOCs (Tait et al. 2014a). This
experiment targeted specifically the products of bacterial enzymes that would utilize 2-
nitrophenyl-β-D-glucoside and 2-(3-fluorophenyl) to produce 2-nitrophenol and 3-fluoroaniline
respectively (Tait et al. 2014a). Uninoculated milk did not produce these targeted VOCs but did

22
so in the seven milk types tested when inoculated with L. monocytogenes. Other bacterial
species tested showed that 3 species also released the two targeted VOCs and suggests that
because the two VOCs may be present in an unknown sample does not specifically point to L.
monocytogenes as the bacteria (Tait et al. 2014a). The study utilized processes already known to
about pathogenic bacteria to develop a potential system for bacterial identification. Future
studies looking at specific target bacteria may utilize enzymatic knowledge to potentially move
forward with selecting potential VOCs as targeted VOCs. Though this may help to direct some
VOC detection for foodborne illness causing bacteria enzymatic utilization of substrates can
provide false positives as in this study with the three bacteria that could also utilize the substrates
to produce the targeted VOC.
Establishment of VOC profiles for food matrix and varying pathogenic bacteria can help
to further the goal of utilizing VOCs for the identification of potentially harmful food products
due to the presence of bacteria. Meat has been the main focus for VOC potential, but other food
products like that of fruits, vegetables and beverages may also benefit from this science and
developing technology. VOC monitoring in fruit and vegetable products should be approached
with a food/VOC interaction in mind as seen in the study examining strawberries where VOCs
were readily absorbed by the strawberries (Yu et al. 2000).
Conclusion
Many studies have worked to and achieved the objective of furthering research into VOC
use to identify foodborne illness causing bacteria. To continue this trend of positive VOC
movement there are several factors that should be considered when moving forward with studies.
Internal and external standards are needed to provide peak area normalization and relative

23
comparison for data analysis as well as the solidification of compound identity. Food matrices,
like that of ground beef, have background flora that are introduced during processing. This must
be kept in mind when evaluating VOCs because of the potential for mixed cultures to interfere
with VOC production in some cases. Further media and food testing for VOC profiles need to be
completed to understand the dynamic relationship between VOC production and nutrients
present to ensure food product variability would not impact VOC release in the event of food
product monitoring. Moving forward, the VOC profile must be established on targeted food
products then compared to the VOC profiles when conditions match that of food processing to
provide the most comprehensive view of VOCs for that food product. Overall, there have been a
few studies that have displayed promising results and methodology that can be built upon to
pursue the use of VOC for bacterial identification in food products.

24
References
Abdallah, Soad A, Laila A Al-Shatti, Ali F Alhajraf, Noura Al-hammad, and Bashayer Al-
Awadi. 2013. “The Detection of Foodborne Bacteria on Beef: The Application of the
Electronic Nose.” SpringerPlus 2(1): 687.
Affairs, Office of Regulatory. 2019. “Recalls, Market Withdrawals, & Safety Alerts.” FDA.
http://www.fda.gov/safety/recalls-market-withdrawals-safety-alerts (July 1, 2019).
Arnold, Judy W, and Samuel D Senter. 1998. “Use of Digital Aroma Technology and SPME
GC-MS to Compare Volatile Compounds Produced by Bacteria Isolated from Processed
Poultry.” Journal of the Science of Food and Agriculture 78(3): 343–48.
Audrain, Bianca, Mohamed A. Farag, Choong-Min Ryu, and Jean-Marc Ghigo. 2015. “Role of
Bacterial Volatile Compounds in Bacterial Biology.” FEMS Microbiology Reviews
39(2):222-33.
Bhattacharjee, Paramita, Suranjan Panigrahi, Dongquig Lin, Catherine M. Logue, Julie S.
Sherwood, Curt Doetkott, and Martin Marchello. 2011. “A Comparative Qualitative
Study of the Profile of Volatile Organic Compounds Associated with Salmonella
Contamination of Packaged Aged and Fresh Beef by HS-SPME/GC-MS.” Journal of
Food Science and Technology 48(1): 1–13.
Boots, A W, A Smolinska, J J B N van Berkel, R R R Fijten, E E Stobberingh, M L L Boumans,
E J Moonen, E F M Wouters, J W Dallinga, and F J Van Schooten. 2014. “Identification
of Microorganisms Based on Headspace Analysis of Volatile Organic Compounds by
Gas Chromatography–Mass Spectrometry.” Journal of Breath Research 8(2): 027106.

25
Bunge, M., N. Araghipour, T. Mikoviny, J. Dunkl, R. Schnitzhofer, A. Hansel, F. Schinner, A.
Wisthaler, R. Margesin, and T. D. Mark. 2008. “On-Line Monitoring of Microbial
Volatile Metabolites by Proton Transfer Reaction-Mass Spectrometry.” Applied and
Environmental Microbiology 74(7): 2179–86.
Cevallos‐Cevallos, Juan Manuel, Michelle D. Danyluk, and José I. Reyes‐De‐Corcuera. 2011.
“GC-MS Based Metabolomics for Rapid Simultaneous Detection of Escherichia Coli
O157:H7, Salmonella Typhimurium, Salmonella Muenchen, and Salmonella Hartford in
Ground Beef and Chicken.” Journal of Food Science 76(4): M238–46.
Chen, Juan, Junni Tang, Cheng Tang, Hui Shi, Huaiyin Gu, and Xiaozhu Lu. 2016. “Growth and
Volatile Compounds of Escherichia Coli O157:H7 on Irradiated Pork.” Journal of Food
Quality 39(6): 766–72.
Chen, Juan, Junni Tang, Hui Shi, Cheng Tang, and Rong Zhang. 2017. “Characteristics of
Volatile Organic Compounds Produced from Five Pathogenic Bacteria by Headspace-
Solid Phase Micro-Extraction/Gas Chromatography-Mass Spectrometry.” Journal of
Basic Microbiology 57(3): 228–37.
Debnath, Mousumi, G. B. Prasad, Prakash S. Bisen, and Prakash S. Bisen. 2012. Microbes:
Concepts and Applications. Somerset, UNITED STATES: John Wiley & Sons,
Incorporated. http://ebookcentral.proquest.com/lib/wvu/detail.action?docID=848522
(June 5, 2020).

26
Decimo, Marilù, Marίa C, Juan A Ordóñez, Ivano De Noni, and Milena Brasca. 2018. “Volatile
Organic Compounds Associated with Milk Spoilage by Psychrotrophic Bacteria.”
International Journal of Dairy Technology 71(3): 593–600.
“Inspection Methods Training.”
https://www.fsis.usda.gov/wps/portal/fsis/topics/inspection/workforce-training/regional-
on-site-training/inspection-methods/inspection-methods (January 25, 2020).
Klein, Daniel, Stephan Maurer, Ulrike Herbert, Judith Kreyenschmidt, and Peter Kaul. 2018.
“Detection of Volatile Organic Compounds Arising from Chicken Breast Filets Under
Modified Atmosphere Packaging Using TD-GC/MS.” Food Analytical Methods 11(1):
88–98.
Kunze, Nils, Stephan Maurer, Ulrike Herbert, Judith Kreyenschmidt, and Peter Kaul. 2013.
“Detection and Validation of Volatile Metabolic Patterns over Different Strains of Two
Human Pathogenic Bacteria during Their Growth in a Complex Medium Using Multi-
Capillary Column-Ion Mobility Spectrometry (MCC-IMS).” Applied Microbiology and
Biotechnology 97(8): 3665–76.
Lindon, John C., Jermey K. Nicholson, and Elaine Holmes. 2019. The Handbook of Metabolic
Phenotyping. Amsterdam, Netherlands: Elsevier.
http://search.ebscohost.com/login.aspx?direct=true&scope=site&db=nlebk&AN=172465
1 (January 27, 2020).

27
Lisec, Jan, Nicolas Schauer, Joachim Kopka, Lothar Willmitzer, and Alisdair R. Fernie. 2006.
“Gas Chromatography Mass Spectrometry–Based Metabolite Profiling in Plants.” Nature
Protocols 1(1): 387–96.
Nutrition, Center for Food Safety and Applied. 2020a. “H&C Food Inc. Recalls Enoki
Mushroom Because of Possible Health Risk.” U.S. Food and Drug Administration.
https://www.fda.gov/safety/recalls-market-withdrawals-safety-alerts/hc-food-inc-recalls-
enoki-mushroom-because-possible-health-risk (June 10, 2020).
Nutrition, Center for Food Safety and Applied. 2020b. “New Hoque and Sons, Inc. Recalls
Radhuni Curry Powder Because of Possible Health Risk.” U.S. Food and Drug
Administration. https://www.fda.gov/safety/recalls-market-withdrawals-safety-
alerts/new-hoque-and-sons-inc-recalls-radhuni-curry-powder-because-possible-health-
risk (June 11, 2020).
Panighel, Annarita, and Riccardo Flamini. 2014. “Applications of Solid-Phase Microextraction
and Gas Chromatography/Mass Spectrometry (SPME-GC/MS) in the Study of Grape and
Wine Volatile Compounds.” Molecules 19(12): 21291–309.
Pao, S., and M. R. Ettinger. 2009. “Comparison of the Microbial Quality of Ground Beef and
Ground Beef Patties from Internet and Local Retail Markets.” Journal of Food Protection
72(8): 1722–26.
Ratiu, Ileana-Andreea, Tomasz Ligor, Victor Bocos-Bintintan, Hossam Al-Suod, Tomasz
Kowalkowski, Katarzyna Rafińska, and Bofus Buszewski. 2017. “The Effect of Growth

28
Medium on an Escherichia Coli Pathway Mirrored into GC/MS Profiles.” Journal of
Breath Research 11(3): 036012.
Sauer, Sascha, and Magdalena Kliem. 2010. “Mass Spectrometry Tools for the Classification and
Identification of Bacteria.” Nature Reviews Microbiology 8(1): 74–82.
Scallan, Elaine, Patricia M. Griffin, Fredrick J. Angulo, Robert V. Tauxe, and Robert M.
Hoekstra. 2011. “Foodborne Illness Acquired in the United States—Unspecified Agents.”
Emerging Infectious Diseases 17(1): 16–22.
Schulz, Stefan, and Jeroen S. Dickschat. 2007. “Bacterial Volatiles: The Smell of Small
Organisms.” Natural Product Reports 24(4): 814.
Schulz, Stefan, Jens Fuhlendorff, and Hans Reichenbach. 2004. “Identification and Synthesis of
Volatiles Released by the Myxobacterium Chondromyces Crocatus.” Tetrahedron
60(17): 3863–72.
Sparkman, O. David, Zelda Penton, and Fulton G. Kitson. 2011. Gas Chromatography and Mass
Spectrometry: A Practical Guide. San Diego, United States: Elsevier Science &
Technology. http://ebookcentral.proquest.com/lib/wvu/detail.action?docID=670206 (July
20, 2020).
Tait, Emma, John D. Perry, Stephen P. Stanforth, and John R. Dean. 2014a. “Bacteria Detection
Based on the Evolution of Enzyme-Generated Volatile Organic Compounds:
Determination of Listeria Monocytogenes in Milk Samples.” Analytica Chimica Acta
848: 80–87.

29
Tait, Emma, John D. Perry, Stephen P. Stanforth, and John R. Dean. 2014b. “Identification of
Volatile Organic Compounds Produced by Bacteria Using HS-SPME-GC–MS.” Journal
of Chromatographic Science 52(4): 363–73.
Taiti, Cosimo, Corrado Costa, Paolo Menesatti, Stefania Caparrotta, Nadia Bazihizina, Elisa
Azzarello, William Antonia Petrucci, Elisa Masi, and Edgardo Giordani. 2015. “Use of
Volatile Organic Compounds and Physicochemical Parameters for Monitoring the Post-
Harvest Ripening of Imported Tropical Fruits.” European Food Research and
Technology 241(1): 91–102.
United States Food and Drug Administration. Food Safety and Inspection Service. 2019. Raw
Beef Product Sampling.
Vaishnav, Anukool, Ajit Varma, Narendra Tuteja, and Devendra Choudhary. 2017.
“Characterization of Bacterial Volatiles and Their Impact on Plant Health Under Abiotic
Stress.” In Volatiles and Food Security, Springer Nature Singapore Pte Ltd., 15–23.
Van Heerde, Harald, Kristiaan Helsen, and Marnik G. Dekimpe. 2007. “The Impact of a Product-
Harm Crisis on Marketing Effectiveness.” Marketing Science 26(2): 230–45.
Veselova, M. A., V. A. Plyuta, and I. A. Khmel. 2019. “Volatile Compounds of Bacterial Origin:
Structure, Biosynthesis, and Biological Activity.” Microbiology 88(3): 261–74.
Wood, William L., Daniel J Higbee, Melanie Gooldy, Scott Glogowski, Rich Fitzpatrick,
Richard J Karalus, Troy D. Wood, and David J. Mangino. 2006. “Analysis of Volatile
Bacterial Metabolites by Gas Chromatography--Mass Spectrometry.” Spectroscopy
21(6): 20–28.

30
Yu, Keshun, Thomas R. Hamilton-Kemp, Douglas D. Archbold, Randall W. Collins, and
Melissa C. Newman. 2000. “Volatile Compounds from Escherichia Coli O157:H7 and
Their Absorption by Strawberry Fruit.” Journal of Agricultural and Food Chemistry
48(2): 413–17.
Zhu, Jiangjiang, Heather D. Bean, Yin-Ming Kuo, and Jane E. Hill. 2010. “Fast Detection of
Volatile Organic Compounds from Bacterial Cultures by Secondary Electrospray
Ionization-Mass Spectrometry.” Journal of Clinical Microbiology 48(12): 4426–31.
Zhu, Jiangjiang, and Jane E. Hill. 2013. “Detection of Escherichia Coli via VOC Profiling Using
Secondary Electrospray Ionization-Mass Spectrometry (SESI-MS).” Food Microbiology
34(2): 412–17.

31
Chapter III
Volatile organic compound methodology development using Escherichia coli DH5, Escherichia
coli JM109, and Salmonella enterica serotype Enteritidis
Jessica Lemely, Avery Fleeharty, De’Anthony Morris, Michael Gutensohn, Kristen Matak,
Cangliang Shen, Jacek Jaczynski*
West Virginia University, Division of Animal and Nutritional Science, P.O. Box 6108,
Morgantown WV 26506-6108, USA
*All correspondence should be addressed to Dr. Jacek Jaczynski (tel: 304-293-1893; email:

32
Abstract
The sensitivity of a closed-loop headspace collection and analysis of volatile organic
compounds (VOC) produced from Escherichia coli JM109, Escherichia coli DH5α, and
Salmonella enterica serotype Enteritidis ATCC 13076 was determined using gas
chromatography-mass spectrometry (GC-MS). Glass volatile collection trap filters with Alltech
HaySep-Q™ PoraPak-Q™ chemical absorbent were eluted with dichloromethane before analysis
with GC-MS. E. coli strains produced typical and well known compound indole detected during
different collection lengths. Four peaks were detected from E. coli JM109 with peak retention
times 4.389, 20.341, 20.984 (indole), and 22.525. E. coli DH5α presented five peaks at 4.378,
6.909, 9.191, 20.967 (indole), and 33.277. These peaks were not identified in the control of
sterile tryptic soy broth. The VOC profile was collected analyzed from S. Enteritidis grown
optimally in liquid egg to further explore the use of VOC analysis for food safety. Seven
compounds were detected in a 6-hour collection that were not seen in the uninoculated liquid egg
control. A 2-hour collection series of S. Enteritidis produced mixed results with unique, but
inconsistent compounds as well as a lack of most peaks identified in the 6-hour collection.
These mixed results suggest that the collection system may not be sensitive enough to be utilized
for 2-hour collections of S. Enteritidis in liquid egg.
Keywords: closed-loop headspace collection, volatile organic compounds, gas chromatography-
mass spectrometry, Escherichia coli, indole, Salmonella Enteritidis, liquid egg

33
Introduction
Product recalls, illness and death occurs yearly for food products within the United States
(Scallan et al. 2011). Recalls can have lasting impacts upon a company including loss of sales,
decreased effectiveness of marketing, and an overall negative consumer outlook on the company
and any associated companies (Van Heerde, Helsen, and Dekimpe 2007). Early detection of
adulterated products prior to reaching the consumer has the potential to lower the number of
recalls, illness and deaths seen. Exploring volatile organic compounds (VOC) may provide an
opportunity to develop technology for detection of compounds released by bacteria with
applications in food safety. Bacterial VOCs are primary and secondary metabolites released
from bacteria during metabolism (Chen et al. 2017). Compounds generally released by bacteria
can fall into five general categories including fatty acid derivatives, terpenes, aromatic
compounds, sulfur containing compounds, and nitrogen containing compounds (Veselova, Puta,
and Khmel 2019).
Like the numerous compounds bacteria are capable of producing, there are also numerous
ways to collect those compounds including headspace collection. Independent of the trapping
system used, VOC collection systems typically use an absorptive surface that interacts with and
traps the volatiles released from the interested sample (Sparkman, Penton, and Kitson 2011).
The VOCs are then released from these collection systems usually with either heat or an organic
solvent. Common headspace collection systems include the use of the solid-phase
microextraction fiber (Arnold and Senter 1998; Bhattacharjee et al. 2011; Cevallos-Cevallos,
Danyluk, and Reyes-De-Corcuera 2011; Chen et al. 2016, 2017; Tait et al. 2014). One study that
evaluated headspace of four bacteria used desorption tubes that contained carbograph
1TD/Carbopack X from Markes International to trap VOC (Boots et al. 2014). Like the previous
study, another study which examined strawberries utilized filters that contained Super-Q

34
absorbent from Alltech which allowed VOC to be trapped over an 18-hour period before eluting
the absorbent with a hexane and methylene chloride solution (Yu et al. 2000). This methodology
coupled with gas chromatography-mass spectrometry (GC-MS) has been used successfully to
identify volatiles in plants and microbial-plant interactions (Vaishnav et al. 2017).
GC-MS is an established, sensitive method for evaluating collected metabolites (Lindon,
Nicholson, and Holmes 2019). Once a sample is injected into a GC unit, oftentimes at a high
temperature, the compounds are separated along a column. Those separated compounds are then
introduced into the mass spectrometer which separates the ions of a compound providing the
final data output as a mass spectra (Lisec et al. 2006). GC-MS has been ranked highly in its
ability to produce quality results with libraries, like the NIST spectrum reference library, for
analysis of results (Lindon, Nicholson, and Holmes 2019). The aim of this study was to
investigate the potential use of VOC headspace collection utilizing a closed-loop stripping
apparatus coupled with GC-MS analysis of bacterial VOCs and application in food borne illness
causing bacteria.
Materials and Methods
Inoculum Prep
Escherichia coli JM109 and Escherichia coli DH5ɑ were both retrieved from laboratory
stock frozen in glycerol and stored at -80°C. Frozen cultures were aseptically transferred into
sterile tryptic soy broth (TSB) and incubated at 37°C for 24 hours. Stock tryptic soy agar (TSA)
streak plates were made from the inoculated TSB for each E. coli JM109 and E. coli DH5ɑ.
Salmonella enterica serotype Enteritidis ATCC13076 was obtained from the American Type
Culture Collection. The dehydrated pellet was aseptically rehydrated following ATCC guides
using TSB. Once established, bacteria stock cultures in TSB were stored at 4°C. At least twice a

35
month all bacteria stock cultures were transferred to fresh, sterile TSB and TSA and grown at
37°C for 24 hours before storage again at 4°C to maintain cultures.
24 hours prior to VOC collection, the stock culture was used to inoculate 50mL TSB with
a 10 µL loop of the selected bacteria. The inoculated broth was then placed on a 150 rpm shaker
for 24 hours and incubated at 37°C. For studies involving S. Enteritidis the 24-hour culture was
diluted using 0.1 % Buffered Peptone Water (BPW) to desired starting concentration. Once
diluted, the tube was centrifuged at 5,000 rpm for 10 minutes and supernatant was discarded
leaving the remaining bacteria pellet for use. At the start of each VOC collection bacteria
concentration was determined using the spread plating technique utilizing a tenfold dilution into
0.1% BPW onto either TSA for E. coli strains or xylose lysine deoxycholate (XLD) agar plates
for S. Enteritidis.
VOC Collection
Early Methodology of E. coli VOC Sample Collection
24 hours after inoculation of 50 mL TSB with desired E. coli the culture was transferred
to a sterile 250 mL glass beaker. 50 mL of uninoculated TSB was added to a separate sterile
beaker for use as a control. Both beakers were placed into the closed-loop, headspace stripping
apparatus for VOC collection as viewed in Figure 1. This collection utilized glass volatile
collection trap filters with Alltech HayeSep-Q™ PoraPak-Q™ chemical absorbent. The top
right of Figure 2 displays the glass volatile collection trap utilized. This collection took place at
room temperature under a sterile biosafety cabinet for 24 and 5 hours as displayed in Figure 1.
For the two, 24 hour VOC collections of E. coli JM109 and DH5ɑ, the starting bacterial
concentrations reported as mean ± standard deviation were 9.01±0.12 log CFU mL-1
TSB and

36
8.81±0.19 log CFU mL-1
TSB respectively. 8.93±0.07 log CFU mL-1
TSB was the starting
concentration for the third VOC collection of DH5ɑ that lasted for only 5-hours.
Final VOC Collection System
Volatiles released by the bacteria and media were collected using a closed-loop stripping
apparatus held at 37°C to provide optimal growth conditions for the bacteria. Glass volatile
collection trap filters with Alltech HayeSep-Q™ PoraPak-Q™ chemical absorbent were used to
trap volatile compounds released from samples. Filters were cleaned between each use and prior
to first use after purchase by running 5 volumes of dichloromethane to remove any potential
VOCs from previous VOC collections. Teflon tubing was used to connect air pumps and
desiccators to avoid the potential absorbance of VOCs that could occur with typical plastic
tubing.
S. Enteritidis in Liquid Egg VOC Sample collection
Large grade A Kroger brand eggs were purchased from Kroger Patterson Drive,
Morgantown WV one day prior to the expected VOC collection. On the day of the expected
VOC collection, eggs were dipped into 70% ethanol and allowed to dry under UV within a
sterile hood. Eggs were flipped 30 minutes into drying to expose all sides to UV. Once dry, 5
eggs were cracked and the contents were added to a Whirl-Pak® bag. The bag was stomached
for 60 seconds to mix the egg thoroughly. 190mL of liquid egg was then measured into a control
and experimental flask each. 1mL of the mixed egg from the experimental flask was added to
the S. Enteritidis bacteria dilution tube for resuspension of the bacteria pellet then used to
inoculate the flask. A sample of liquid egg in the experiment was plated onto XLD media prior
to test to confirm Salmonella spp. were not present.

37
40 mL of liquid egg from each flask was transferred aseptically into a sterile 250mL
beaker equipped with a stir bar. Each beaker was placed into the closed-loop headspace VOC
collection apparatus for 6-hours for collection under gentle agitation using a stir plate. Starting
bacterial concentration reported as of the 6-hour VOC collection was 4.02±0.08 log CFU mL-1
of
egg.
A second VOC collection of S. Enteritidis in liquid egg followed the same starting
conditions as the 6-hour collection. This collection took place over 8-hours with the VOC filter
being replaced every two hours. During the filter replacement after 2 hours, the 40 mL of liquid
egg control and experimental samples were also replaced. The replaced samples came from the
initially inoculated 190 mL liquid egg at the start of the VOC collection period. For the duration
of the experiment, the inoculated and uninoculated control of liquid egg were kept in an
incubator shaker at 37°C and 150 rpm. Bacteria concentration was taken from the initial 190 mL
inoculated flask at the time of the filter and egg replacement. Three replicates were completed
for this study. Starting bacterial concentration reported as mean ± standard deviation for the 8-
hour study was 4.92±0.19 log CFU mL-1
of egg.
Analysis
VOC Analysis
VOC filters were removed from the system after the collection period and eluted with
260µL of dichloromethane into labeled auto sampler vials and stored in a freezer until processed.
These VOC GC-MS samples and blank samples of dichloromethane were analyzed by a TRACE
1310 gas chromatograph system coupled with a TSQ 8000 Triple Quadrupole mass spectrometer
(Thermo Fisher Scientific, Waltham, MA, USA). 2 µL of each sample were injected, volatilized
at 220°C in a SSL injector module and separated using a TraceGOLD TG-5MS GC column (30

38
m length, 0.25 mm I.D., 0.25 μm film; Thermo Fisher Scientific, Pittsburgh, PA, USA). Column
temperature was held at 40°C for 3 minutes and then ramped at 5°C/min to 120°C, 10°C/min to
180°C and 20°C/min to 300°C which was held constant for 2 minutes. Helium was used as a
carrier gas flowing at 1.3 mL/min. Masses were scanned utilizing a full-scan mode with the
abundance or peak area of each measured under total ion chromatogram (TIC).
Chromatograph Interpretation
After analysis by the GC-MS was completed and the dichloromethane background was
subtracted, chromatograph intensity and retention time was exported in Microsoft Excel and
visually examined for peaks in all samples. Peaks were noted and tentatively identified using
NIST 09 standard reference database (Stein et al. 2011 ; Xcalibur 2.2 2011). Peaks that were not
confidently identified are labeled as unknown.
Results and Discussion
VOC Collection System Progression
The VOC collection system was developed from methodology for collecting VOCs from
plants through collaboration (Gutensohn and Dudareva 2016). The first collections took place at
room temperature with 24-hour bacteria cultures to get an understanding of potential compounds
that could be used to uniquely identify each bacterium (Figure 1). E. coli JM109 and DH5ɑ
were first chosen to work with due to their non-pathogenic properties prior to utilizing biosafety
level 2 designated organisms. Obstacles faced and surpassed include condensation within
collection desiccators, utilization of stir plates for gentle agitation, and creating optimal growth
conditions for bacteria by moving the system into a large incubator. Optimal growth conditions
for bacteria were eventually chosen to ensure optimal VOC output from metabolic
processes. Optimal VOC output will provide insight into compounds when studying VOC at
39
food processing temperatures. Figure 2 displays the final set up of the dedicator and stir plate
that was held within an incubator to control temperature and ensure gentle agitation.
VOC Collections of E. coli DH5ɑ and E. coli JM109
Four peaks were detected within the collection period for E. coli JM109 by their peak
retention time; tentative identification includes lupeol acetate at 4.389, delta-dodecanolactone at
20.341, indole at 20.984 and an unknown compound at 22.525 (Table 1). Five peaks were
detected within the collection period for E. coli DH5ɑ by their peak retention time; tentative
identification includes pleiocarpamine at 4.378 and 6.909, 3-oxo-ɑ-ionone at 9.191, indole at
20.967 and (x)-pentatriacont-17-ene at 33.277 (Table 2). These compounds were identified in
the inoculated TSB but not the sterile control TSB. Table 3 displays the 10 peaks of interest
from the 5-hour collection of E. coli DH5ɑ. Five of these 10 peaks were identified as
compounds of interest in the sterile control, but was not observed to have a peak in exported
excel chromatographs. An unknown compound at 10.981, indole at 20.937, and trielaidin at
33.810 and 34.107 were all observed in the inoculated broth, but did not identify using the NIST
reference library within the control.
Indole was observed in all three collections of both E. coli DH5ɑ and JM109 strains with
retention time peaks of 20.98, 20.97 and 20.94 as seen in Figures 4, 5, and 6. Indole VOC
production from E. coli species has been seen in multiple studies on food products and different
media including TSB (Arnold and Senter 1998; Boots et al. 2014; Bunge et al. 2008; Chen et al.
2016, 2017; Kunze et al. 2013; Ratiu et al. 2017; Tait et al. 2014; Yu et al. 2000; Zhu et al.
2010). Using headspace SPME coupled with GC-MS Tait and others reported Escherichia coli
NCTC 10418 producing indole in both tryptone soya broth and brain hear infusion broth, but not
in difco enteric fermentation base broth (Tait et al. 2014). Two different ATCC type Escherichia

40
coli O157:H7 and a non pathogenic E. coli ATCC 15597 were reported to produced indole at
higher concentrations than other observed compounds after being grown in brain heart infusion
broth then transferred to plate count agar for headspace VOC collection (Yu et al. 2000). Also
utilizing TSB, like this experiment, Arnold and Senter reported only E. coli produced indole of
the 7 bacteria analyzed for VOCs (Arnold and Senter 1998). These studies support our results of
the two E. coli strains producing indole. Indole is produced from E. coli through the tryptophan
pathway in which tryptophan is converted to indole, pyruvate, and ammonia (Han et al. 2011).
Steady production of indole during the growth of E. coli is not seen, but instead the highest
amount of indole produced occurs between logarithmic and stationary growth phases (Gaimster
and Summers 2015). It would make sense that we are seeing a high intensity of indole with the
VOC sample due to the 24-hour culture age in which we do not expect a great increase of
growth.
VOC Collections of S. Enteritidis in Liquid Egg
The preliminary collection of VOCs produced by E. coli strains were taken when
bacterial concentrations were approximately 8.9±0.10 log CFU ml-1
of TSB. The successful
detection of compounds from E. coli VOC collections at high bacteria concentrations progressed
to the next step of decreasing bacterial concentration for S. Enteritidis collections to see if
volatiles could still be collected. With the potential influence of growth phase, as seen in our E.
coli collections, capturing VOCs during active growth may lead to different compounds as well
as in a closer to the bacteria concentration that may be seen in contaminated food products.
Liquid egg was also used instead of standard laboratory media to further investigate the potential
for application within food safety. The 6-hour VOC collection of S. Enteritidis in liquid egg had
a bacteria concentration of 4.02±0.08 log CFU ml-1
liquid egg. Table 4 displays the seven

41
compounds seen in inoculated liquid egg and not in the uninoculated liquid egg. No previous
studies have seen these compounds, and to our knowledge there have been no VOC studies of S.
Enteritidis in liquid egg. Media has the ability to influence VOCs that are produced through
limiting the availability of nutrients bacteria need for metabolic activities (Arnold and Senter
1998; Bhattacharjee et al. 2011; Cevallos‐Cevallos, Danyluk, and Reyes‐De‐Corcuera 2011;
Chen et al. 2017; Ratiu et al. 2017; Tait et al. 2014; Zhu et al. 2010). Tait and associates
examined the VOC profile of three different bacteria grown in each of the three media chosen
and reported that there were similar VOC profiles between the brain heart infusion broth and
tryptone soya broths but presented significantly different in the enteric fermentation base broth
(Tait et al. 2014). Ratiu and colleagues also examined the influence of media on VOC
production for E. coli grown in tryptic soy broth, Mueller Hinton broth and a minimal salts (M9)
broth enriched with glucose. Reported results suggest that each E. coli inoculated media
produced unique compounds when compared between the three (Ratiu et al. 2017). With the
documented influence of media upon bacterial VOC production it is not surprising that S.
Enteritidis inoculated liquid egg has produced compounds that were not seen in the literature
reviewed.
The unique peaks detected within the 6-hour VOC collection of S. Enteritidis in liquid
egg were compared to the chromatographs produced during the 2-hour collection series to see if
these compounds could be identified. Table 6 displays the starting bacteria concentration for
each 2-hour collection with the first collection starting at 4.92±0.19 log CFU ml-1
. Peak 4.164
tentatively identified as 1,1,2,2-tetrafluoroethane in the 6-hour collection did not appear in the
any of the 2-hour collection series. Peaks at the retention time of 4.480 and 5.49 did appear in
two of the three replicates with different tentative identifications. Peak 7.518 tentatively

42
identified as 2-nitrobutane did identify as the same compound in all three replicate controls of
uninoculated liquid egg. This suggests that this compound may not be unique to S. Enteritidis
VOC production. The software used to identify the peaks was unable to recognize the peaks at
11.596 or 11.722 in the 6-hour collection (Stein et al. 2011 ; Xcalibur 2.2 2011). The peak at
11.249 was seen in one of the three replicates but had a different compound identification. The
lack of identifiable peaks from the 6-hour collection to the 2-hour collection series suggests that
the VOC collection system in place may not be sensitive enough to utilize for such a short
collection period. Table 6 does identify inconsistent compounds that may be relative with future
studies in a more sensitive collection system. These compounds were not seen in the control of
uninoculated liquid egg.
Conclusion
This study has met its aim of determining that this methodology can be used reliably to
collect VOC from two difference E. coli strains as seen through the regular collection of indole
during a short collection period. Specific VOCs were also produced by S. Enteritidis grown in
liquid egg, but more replicates are needed to identify and confirm consistent compounds. To
fully capture and identify the signature VOCs produced by bacteria a more sensitive system or a
modification of analysis by the GC-MS is needed.
Some limitations that occurred during this study include tentative identification utilizing
the NIST reference library, multiple same-compound identifications, and the potential that
compounds chemically converted upon injection. Tentative identification using a reference
library can only provide a probability that a compound matches the reference library.
Identification must further be confirmed utilizing external standards and compared to the
compound in question. Due to the probability that a compound matches the reference library it is

43
possible for multiple compounds of interest to identify as the same compound. The GC-MS
separates compounds by size and then by charge so these compounds are not the same compound
but may have very similar structures with slight differences that would cause them to show up at
a different retention time and will need to be confirmed through the use of external standards
with additional VOC samples. For future studies, GC-MS analysis may want to include tandem
sampling to increase the ability to identify compounds seen in systems like S. Enteritidis in egg.
44
References
Arnold, Judy W, and Samuel D Senter. 1998. “Use of Digital Aroma Technology and SPME
GC-MS to Compare Volatile Compounds Produced by Bacteria Isolated from Processed
Poultry.” Journal of the Science of Food and Agriculture 78(3): 343–48.
Bhattacharjee, Paramita, Suranjan Panigrahi, Dongquig Lin, Catherine M. Logue, Julie S.
Sherwood, Curt Doetkott, and Martin Marchello. 2011. “A Comparative Qualitative
Study of the Profile of Volatile Organic Compounds Associated with Salmonella
Contamination of Packaged Aged and Fresh Beef by HS-SPME/GC-MS.” Journal of
Food Science and Technology 48(1): 1–13.
Boots, A W, A Smolinska, J J B N van Berkel, R R R Fijten, E E Stobberingh, M L L Boumans,
E J Moonen, E F M Wouters, J W Dallinga, and F J Van Schooten. 2014. “Identification
of Microorganisms Based on Headspace Analysis of Volatile Organic Compounds by
Gas Chromatography–Mass Spectrometry.” Journal of Breath Research 8(2): 027106.
Bunge, M., N. Araghipour, T. Mikoviny, J. Dunkl, R. Schnitzhofer, A. Hansel, F. Schinner, A.
Wisthaler, R. Margesin, and T. D. Mark. 2008. “On-Line Monitoring of Microbial
Volatile Metabolites by Proton Transfer Reaction-Mass Spectrometry.” Applied and
Environmental Microbiology 74(7): 2179–86.
Cevallos‐Cevallos, Juan Manuel, Michelle D. Danyluk, and José I. Reyes‐De‐Corcuera. 2011.
“GC-MS Based Metabolomics for Rapid Simultaneous Detection of Escherichia Coli
O157:H7, Salmonella Typhimurium, Salmonella Muenchen, and Salmonella Hartford in
Ground Beef and Chicken.” Journal of Food Science 76(4): M238–46.
45
Chen, Juan, Junni Tang, Cheng Tang, Hui Shi, Huaiyin Gu, and Xiaozhu Lu. 2016. “Growth and
Volatile Compounds of Escherichia Coli O157:H7 on Irradiated Pork.” Journal of Food
Quality 39(6): 766–72.
Chen, Juan, Junni Tang, Hui Shi, Cheng Tang, and Rong Zhang. 2017. “Characteristics of
Volatile Organic Compounds Produced from Five Pathogenic Bacteria by Headspace-
Solid Phase Micro-Extraction/Gas Chromatography-Mass Spectrometry.” Journal of
Basic Microbiology 57(3): 228–37.
Debnath, Mousumi, G. B. Prasad, Prakash S. Bisen, and Prakash S. Bisen. 2012. Microbes:
Concepts and Applications. Somerset, UNITED STATES: John Wiley & Sons,
Incorporated. http://ebookcentral.proquest.com/lib/wvu/detail.action?docID=848522
(June 5, 2020).
Gaimster, Hannah, and David Summers. 2015. “Regulation of Indole Signalling during the
Transition of E. Coli from Exponential to Stationary Phase” ed. Marie-Joelle Virolle.
PLOS ONE 10(9): e0136691.
Gutensohn, M., and N. Dudareva. 2016. “Chapter Thirteen - Tomato Fruits—A Platform for
Metabolic Engineering of Terpenes.” In Methods in Enzymology, Synthetic Biology and
Metabolic Engineering in Plants and Microbes Part B: Metabolism in Plants, ed. Sarah
E. O’Connor. Academic Press, 333–59.
http://www.sciencedirect.com/science/article/pii/S0076687916001245 (June 25, 2019).
Han, Thi Hiep, Jin Hyung Lee, Moo Hwan Cho, Thomas K. Wood, and Jintae Lee. 2011.
“Environmental Factors Affecting Indole Production in Escherichia Coli.” Research in
Microbiology 162(2): 108–16.

46
Klein, Daniel, Stephan Maurer, Ulrike Herbert, Judith Kreyenschmidt, and Peter Kaul. 2018.
“Detection of Volatile Organic Compounds Arising from Chicken Breast Filets Under
Modified Atmosphere Packaging Using TD-GC/MS.” Food Analytical Methods 11(1):
88–98.
Kunze, Nils, Stephan Maurer, Ulrike Herbert, Judith Kreyenschmidt, and Peter Kaul. 2013.
“Detection and Validation of Volatile Metabolic Patterns over Different Strains of Two
Human Pathogenic Bacteria during Their Growth in a Complex Medium Using Multi-
Capillary Column-Ion Mobility Spectrometry (MCC-IMS).” Applied Microbiology and
Biotechnology 97(8): 3665–76.
Lindon, John C., Jeremy K. Nicholson, and Elaine. Holmes. 2019. The Handbook of Metabolic
Phenotyping. Amsterdam, Netherlands: Elsevier.
http://search.ebscohost.com/login.aspx?direct=true&scope=site&db=nlebk&db=nlabk&A
N=1724651 (January 27, 2020).
Lisec, Jan, Nicolas Schauer, Joachim Kopka, Lothar Willmitzer, and Alisdair R. Fernie. 2006.
“Gas Chromatography Mass Spectrometry–Based Metabolite Profiling in Plants.” Nature
Protocols 1(1): 387–96.
Ratiu, Ileana-Andreea, Tomasz Ligor, Victor Bocos-Bintintan, Hossam Al-Suod, Tomasz
Kowalkowski, Katarzyna Rafińska, and Bofus Buszewski. 2017. “The Effect of Growth
Medium on an Escherichia Coli Pathway Mirrored into GC/MS Profiles.” Journal of
Breath Research 11(3): 036012.

47
Scallan, Elaine, Patricia M. Griffin, Fredrick J. Angulo, Robert V. Tauxe, and Robert M.
Hoekstra. 2011. “Foodborne Illness Acquired in the United States—Unspecified Agents.”
Emerging Infectious Diseases 17(1): 16–22.
Sparkman, O. David, Zelda Penton, and Fulton G. Kitson. 2011. Gas Chromatography and Mass
Spectrometry: A Practical Guide. San Diego, United States: Elsevier Science &
Technology. http://ebookcentral.proquest.com/lib/wvu/detail.action?docID=670206 (July
20, 2020).
Stein, S., Y. Mirokhin, G. Mallard, A. Mikaia, P. Neta, D. Sparkman, E. White, X. Yang, V.
Zaikin, and D. Zhu. (2011). NIST Mass Spectral Search Program (2.0g) [Computer
software]. FairCom Corporation.
Tait, Emma, John D. Perry, Stephen P. Stanforth, and John R. Dean. 2014. “Identification of
Volatile Organic Compounds Produced by Bacteria Using HS-SPME-GC–MS.” Journal
of Chromatographic Science 52(4): 363–73.
Vaishnav, Anukool, Ajit Varma, Narendra Tuteja, and Devendra Choudhary. 2017.
“Characterization of Bacterial Volatiles and Their Impact on Plant Health Under Abiotic
Stress.” In Volatiles and Food Security, Springer Nature Singapore Pte Ltd., 15–23.
Van Heerde, Harald, Kristiaan Helsen, and Marnik G. Dekimpe. 2007. “The Impact of a Product-
Harm Crisis on Marketing Effectiveness.” Marketing Science 26(2): 230–45.
Veselova, M. A., V. A. Plyuta, and I. A. Khmel. 2019. “Volatile Compounds of Bacterial Origin:
Structure, Biosynthesis, and Biological Activity.” Microbiology 88(3): 261–74.

48
Xcalibur 2.2 (2.2 SP1.48). (2011). [Computer software]. Thermo Fisher Scientific Inc.
Yu, Keshun, Thomas R. Hamilton-Kemp, Douglas D. Archbold, Randall W. Collins, and
Melissa C. Newman. 2000. “Volatile Compounds from Escherichia Coli O157:H7 and
Their Absorption by Strawberry Fruit.” Journal of Agricultural and Food Chemistry
48(2): 413–17.
Zhu, Jiangjiang, Heather D. Bean, Yin-Ming Kuo, and Jane E. Hill. 2010. “Fast Detection of
Volatile Organic Compounds from Bacterial Cultures by Secondary Electrospray
Ionization-Mass Spectrometry.” Journal of Clinical Microbiology 48(12): 4426–31.

49
Tables and Figures
Table 1. E. coli JM109 VOC compounds observed from a 24-hour VOC collection in tryptic soy
broth. These compounds were not identified in the control of sterile tryptic soy broth.
Compounds have been displayed with observed peak retention time (RT). Starting bacterial
concentration was a mean and standard deviation of 9.01±0.12 log CFU mL-1
tryptic soy broth.
Peak RT Tentative Compound ID
4.389 Lupeol acetate
20.341 Delta-dodecanolactone
20.984 Indole
22.525 Unknown

50
Table 2. E. coli DH5α VOC compounds observed from a 24-hour VOC collection in tryptic soy
broth. These compounds were not observed in the control of tryptic soy broth. Compounds have
been displayed with observed peak retention time (RT). Starting bacterial concentration was a
mean and standard deviation of 8.81±0.19 log CFU mL-1
tryptic soy broth.
Peak RT Tentative Compound ID
4.378 Pleiocarpamine
6.909 Pleiocarpamine
9.191 3-Oxo-a-ionone
20.967 Indole
33.277 (z)-Pentatriacont-17-ene

51
Table 3. E. coli DH5α VOC compounds observed from a 5-hour VOC collection in tryptic soy
broth. These compounds were not observed in the control of tryptic soy broth. Compounds have
been displayed with observed peak retention time (RT). Starting bacterial concentration was a
mean and standard deviation of 8.93±0.07 log CFU mL-1
tryptic soy broth.
Peak RT Tentative Compound ID
4.372 Pleiocarpamine*
7.984 Pleiocarpamine*
10.981 Unknown
15.716 1,5-Diphenyl-3-(3-cyclopentylpropyl)pentane
20.937 Indole
29.590 1-Heptatriacontanol*
31.036 1-Heptatriacontanol*
32.648 1-Heptatriacontanol*
33.810 Trielaidin
34.107 Trielaidin
* Indicates that this compound, though seen as a peak within the inoculated tryptic soy broth and
not in the control of sterile broth, this compound was identified for the control at the same
retention time.

52
Table 4. VOC compounds seen from S. Enteritidis inoculated liquid egg that did not appear in
the control of liquid egg. Starting bacteria concentration of this VOC collection was 4.02±0.08
log CFU ml-1
liquid egg. Compounds have been displayed with observed peak retention time
(RT).
Peak RT Tentative ID
4.164 1,1,2,2-Tetrafluoroethane
4.480 1,1,2,2-Tetrafluoroethane
5.491 4-Amino-1-pentanol
7.518 2-Nitrobutane
11.249 2-Amino-5-Methylhexane
11.596 5-(Cyclohexylmethyl)pyrrolidin-2-one
11.722 Unknown

53
Table 5. The bacteria concentration reported as mean and standard deviation (STDEV) of log
CFU mL-1 of S. Enteritidis in liquid egg every 2 hours of the VOC collection series for 8 hours.
Hour Mean log CFU/mL STDEV
0 4.92 0.19
2 5.06 0.51
4 6.03 0.87
6 8.06 0.60
8 8.44 0.85

54
Table 6. Unique, inconsistent compounds that appeared in S. Enteritidis inoculated liquid egg 2-
hour series that did not appear in the control of uninoculated egg. Compounds have been
displayed with observed peak retention time (RT).
Peak RT Tentative ID Sample Hour
7.147 Diacetone alcohol 0
15.722 2,3,4-Trimethyloxetane 0
18.554 2-Ethyl-3,5-dimethylpyrazine 0
24.127 2-Butyl-1-methylpyrrolidine 0
4.494 1-Chloro-1,2,3-butanetriene 2
28.576 4-Aminopentan-1-ol 2
6.929 2-Cyclopropylethanol 4
10.167 (3,3--Dimethylbutyl)oxirane 4
7.797 2-Nitrobutane 6
14.787 2-Methyl-1-Nitropropane 6
16.174 Unknown 6
20.411 2,5-Di(tert-amyl)hydroquinone 6
22.617 Unknown 6
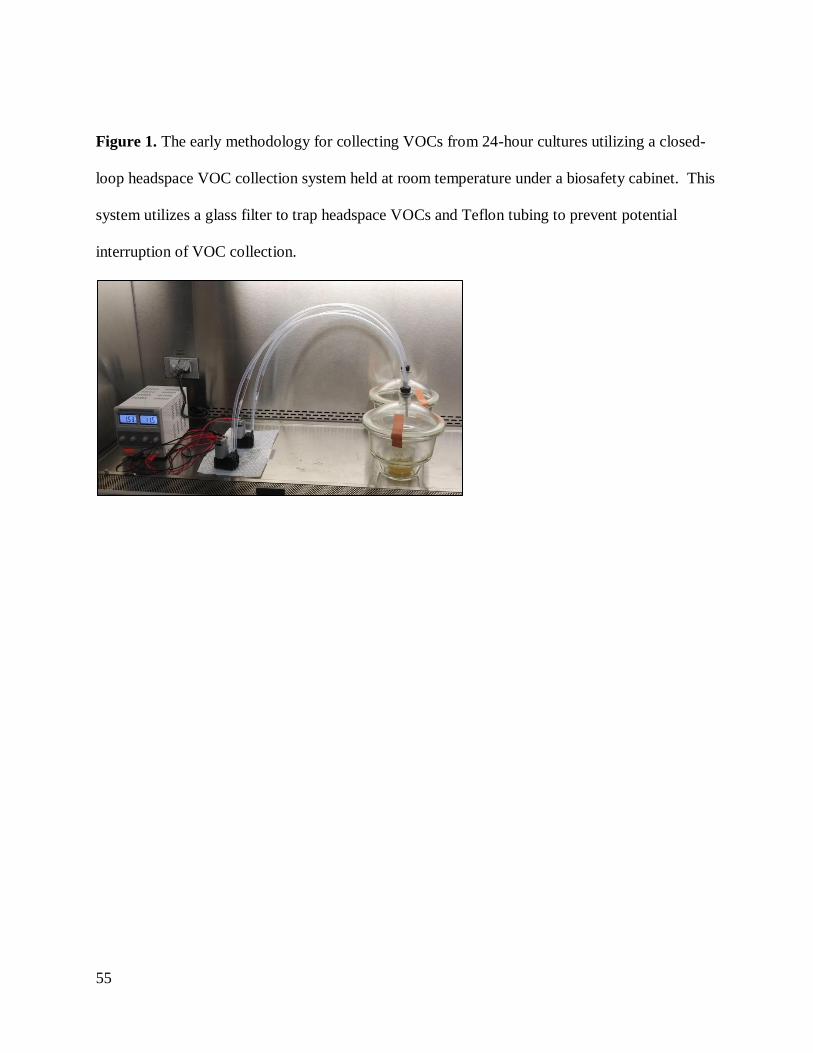
55
Figure 1. The early methodology for collecting VOCs from 24-hour cultures utilizing a closed-
loop headspace VOC collection system held at room temperature under a biosafety cabinet. This
system utilizes a glass filter to trap headspace VOCs and Teflon tubing to prevent potential
interruption of VOC collection.

56
Figure 2. The closed-loop headspace collection system with a close up of the glass volatile
collection trap filter with Alltech HayeSep-Q™ PoraPak-Q™ chemical absorbent at the top
right. The Pyrex glass desiccator was placed on a standard stir plate with a glass beaker and stir
bar to provide gentle agitation. A rubber seal, hollow metal rod and Teflon tubing were used to
connect this system to the air pump and power supply. This system was utilized within a large
incubator for temperature control.

57
Figure 3. 24-hour VOC collection of uninoculated and E. coli JM109 tryptic soy broth. Starting
bacteria concentration is reported as a mean ± standard deviation of 9.01±0.12 log CFU mL-1
of
tryptic soy broth.

58
Figure 4. 24-hour VOC collection of uninoculated and E. coli JM109 tryptic soy broth with the
with the tentatively identified compound lupeol acetate labeled.

59
Figure 5. 24-hour VOC collection of uninoculated and E. coli JM109 tryptic soy broth with the
tentatively identified compound delta-dodecanolactone compound labeled.

60
Figure 6. Chromatograph from the 24-hour VOC collection of uninoculated and E. coli DH5ɑ
inoculated tryptic soy broth. Starting bacteria concentration is reported as a mean ± standard
deviation of 8.81±0.19 log CFU mL-1
of tryptic soy broth. The tentatively identified indole is
labeled.

61
Figure 7. Chromatograph from the 24-hour VOC collection of uninoculated and E. coli DH5ɑ
inoculated tryptic soy broth with tentatively identified compound 3-oxo-α-ionone labeled.
3-oxo- α-ionone

62
Figure 8. Chromatograph from the 24-hour VOC collection of uninoculated and E. coli DH5ɑ
inoculated tryptic soy broth with tentatively identified (x)-pentatriacont-17-ene labeled.

63
Figure 9. Chromatograph from the 5-hour VOC collection of uninoculated and E. coli DH5ɑ
inoculated tryptic soy agar. E. coli TSB was inoculated 24 hours prior to the start of the VOC
collection. Starting bacteria concentration is reported as a mean ± standard deviation of
8.93±0.07 log CFU mL-1
of tryptic soy broth. The tentatively identified compound indole was
labeled.

64
Figure 10. Chromatograph from the 5-hour VOC collection of uninoculated and E. coli DH5ɑ
inoculated tryptic soy agar. Tentatively identified compound 1-heptatriacontanol peaks are
denoted with a *.

65
Figure 11. Chromatograph from the 5-hour VOC collection of uninoculated and E. coli DH5ɑ
inoculated tryptic soy agar. Tentatively identified compound 1,5-diphenyl-3-(3-
cyclopentylpropyl)pentane has been labeled.
1,5-diphenyl-3-(3-cyclopentylpropyl)pentane

66
Figure 12. Chromatograph from a 6-hour VOC collection of S. Enteritidis inoculated liquid egg
coupled with an uninoculated sample of liquid egg. Bacteria concentration at the start of this
collection is reported as mean ± standard deviation of 5.22±0.66 log CFU mL-1
of liquid egg.

67
Figure 13. Chromatograph from a 6-hour VOC collection of S. Enteritidis inoculated liquid egg
coupled with an uninoculated sample of liquid egg with 1,1,2,2-tetrafluorethane, 4-amino-1-
pentanol all labeled. The peaks labeled *1 and *2 are 2-nitrobutane and 5-
(cyclohexylmethyl)pyrrolidine-2-one respectively.

68
Chapter IV
Volatile Organic Compounds from Escherichia coli Grown in Ground Beef and Tryptic Soy
Broth
Jessica Lemely, Avery Fleeharty, De’Anthony Morris, Michael Gutensohn, Kristen Matak,
Cangliang Shen, Jacek Jaczynski*
West Virginia University, Division of Animal and Nutritional Science, P.O. Box 6108,
Morgantown WV 26506-6108, USA
*All correspondence should be addressed to Dr. Jacek Jaczynski (tel: 304-293-1893; email:

69
Abstract
Volatile organic compounds (VOC) have been investigated for use of bacterial
identification across different media and applications. Utilizing a headspace closed-loop
stripping VOC collection coupled with gas chromatography-mass spectrometry (GC-MS), this
study aimed to evaluate the VOC profile of Escherichia coli serotype O157:H7 ATCC 43985
grown in both tryptic soy broth and ground beef. Fresh beef was ground in house under sanitary
conditions to reduce the presence of background flora. Glass volatile collection trap filters with
Alltech HaySep-Q™ PoraPak-Q™ chemical absorbent were eluted with dichloromethane before
being analyzed with a GC-MS. E. coli O157:H7 grown in TSB produced a profile of 34 peaks of
interest with four of these peaks not being detected in the control of sterile TSB at retention
times 8.722, 9.402, 20.919, and 30.777. When grown in ground beef a profile of 48 peaks of
interest was determined with 22 compounds appearing only in E. coli O157:H7 inoculated
ground beef. Tentative identification of detected compounds was performed using the NIST 09
reference library. Multiple compounds have been seen in previous studies solidifying the use of
this methodology for VOC collection with more steps that can be taken in the future to increase
identification abilities.
Key words: volatile organic compounds, Escherichia coli O157:H7, food microbiology, ground
beef, headspace gas chromatography-mass spectrometry

70
Introduction
Despite the safe food supply the United States is known for there have already been over
100 recalls up through the end of June, 2020 posted by the Food and Drug Administration and an
increasing instance of shiga like toxin producing Escherichia coli as reported by the Center for
Disease Control and Protection (Affairs 2020; Tack et al. 2020). Bacteria volatile organic
compounds (VOCs) may have the potential to help mediate illness and recalls. Use of VOCs
have been examined for applications in medical diagnosis, agriculture improvement,
environmental contamination, food monitoring and food safety (Boots et al. 2014; Chen et al.
2017; Tahiti et al. 2015; Veselova, Puta, and Khmel 2019; Wood et al. 2006). Though
influences like media, mixed culture and growth phase have been seen in the literature, there are
still gaps in knowledge when looking at VOC application within the food industry.
VOCs are primary and secondary metabolites that are released by bacteria during growth
and proliferation (Chen et al. 2017). Common classes of compounds that bacteria release include
fatty acid derivatives, terpenes, aromatic compounds, sulfur containing compounds, and nitrogen
containing compounds (Veselova, Puta, and Khmel 2019). Generally, these compounds are
produced by catabolic pathways in which compounds are broken down for use (Veselova,
Plyuta, and Khmel 2019). There are various ways to collect VOCs including headspace stripping
apparatus and headspace solid phase microextraction. These systems utilize a surface that
interacts with the VOCs trapping them (Sparkman, Penton, and Kitson 2011). The trapped
VOCs are released through the use of organic solvents or heat which disrupt that VOC-surface
interaction. Collections are largely paired with gas chromatography-mass spectrometry (GC-
MS) for analysis. Headspace closed-loop stripping apparatus coupled with analysis by GC-MS

71
has been successfully used to identify volatiles in plants and microbial-plant interactions
(Vaishnav et al. 2017).
Exploring this technology and science for improved food safety VOCs have been
collected from samples including chicken (Arnold and Senter 1998; Klein et al. 2018), beef
(Abdallah et al. 2013; Bhattacharjee et al. 2011; Cevallos‐Cevallos, Danyluk, and
Reyes‐De‐Corcuera 2011) and pork (Chen et al. 2016). VOCs have the potential to guide food
production monitoring through identifying VOC biomarkers that are released from bacteria
(Veselova, Plyuta, and Khmel 2019). Application and development of this science could lead to
the increased monitoring of products like ground beef and thus lowering potential for recalls and
food borne illness in consumers.
The purpose of this study is to detect VOCs produced by Escherichia coli by utilizing a
closed-loop VOC collection apparatus followed by analysis and identification with gas
chromatography-mass spectrometry in both ground beef and tryptic soy broth (TSB). The aim of
this study is to characterize the specific VOC profile of Escherichia coli serotype O157:H7 and
potentially discover any compounds that may be of interest for food safety applications. This
preliminary study will be used to help direct future research through offering insights into
limitations and modifications that could improve future collection, analysis and identification of
VOCs from food products.
Materials and Methods
Preparation of Inoculum
Escherichia coli serotype O157:H7 ATCC 43895 was obtained from the American Type
Culture Collection. The dehydrated pellet was rehydrated following ATCC procedures using
Tryptic Soy Broth (TSB) and aseptic technique. Once established, bacteria were stored at 4°C in

72
TSB. At least twice a month, bacteria cultures were transferred to new media. One 10 µL loop
from the previous bacteria culture was used to inoculate sterile TSB and grown at 37°C for 24
hours before storage again at 4°C to maintain working stock culture.
24 hours prior to VOC collection or growth study, a single 10 µL loop of stock culture
was used to inoculate 10 mL TSB. The inoculated TSB was placed on a shaker set to 150 rpm
for 24 hours incubated at 37°C. The 24-hour bacteria culture was added to 0.1% buffered
peptone water (BPW) using a 10-fold dilution technique to obtain a desired starting
concentration of around 104 cells per mL of media. Once diluted, the tube was centrifuged at
5,000 rpm for 10 minutes and supernatant was discarded leaving the remaining bacteria pellet for
use. A control dilution tube of 10mL BPW was included in the centrifuge. The supernatant was
discarded from both the bacteria containing tube and the uninoculated control tube. To ensure
there was minimal differences between the control and experimental groups, the uninoculated
control tube was treated in the same manner as the bacteria containing tube. Bacteria
concentration was determined using the spread plating technique prior to VOC collection. A
tenfold dilution into 0.1% buffered peptone water (BPW) was performed prior to plating onto
tryptic soy agar (TSA) plates.
Preliminary Growth Study
After discarding the supernatant, the bacteria pellet was resuspended in 1mL of TSB prior
to the inoculation of three flasks of 189mL sterile TSB for a final total volume of 190 mL. The
starting concentration for this growth study was 5.45±0.5 log CFU ml-1
TSB. Inoculated flasks
were stored in an incubator shaker set to 37°C at 150 rpm for 10 hours. At the time of
inoculation and every hour following for 10 hours bacteria concentration was determined using
10-fold dilutions into 0.1% BPW and spread plating technique onto TSA. TSA plates were

73
incubated, inverted for 24-48 hours at 37°C prior to counting colony forming units (CFU). 10
hours was the timeframe chosen to capture the growth that would take place during VOC
collection from a starting concentration around 5 log CFU mL-1
. This experiment was performed
with three replicates that included control plates testing media prior to inoculation.
Figure 1 displays the growth exhibited by E. coli O105:H7 inoculated TSB. The growth
study was started with a bacteria concentration of 5.45±0.51 log CFU ml-1
TSB and finished with
9.48±0.35 log CFU ml-1
TSB for a total growth of about 4 log. This growth study was done with
this starting concentration and for the length of time to capture the growth during E. coli
O157:H7 VOC collection. The growth of 4 log suggests active growth and thus the VOC
collection took place during logarithmic phase of growth (Debnath et al. 2012). As seen in
previous VOC studies, the growth phase can impact the production and types of volatiles that are
being released (Bunge et al. 2008; Kunze et al. 2013).
Sample preparation and VOC Collection
Tryptic Soy Broth 1mL of TSB was added to each dilution tube and used to resuspend the
bacteria pellet and as a control. Each dilution tube was used to inoculate experimental and
control flasks of 189mL of sterile TSB to be used for VOC collection. Starting bacteria
concentration of VOC collection was 6.07±0.52 log CFU ml-1
.
Ground Beef A large chuck roast was purchased from Kroger Patterson Drive, Morgantown WV
within the use by date. Utensils and a kitchen grinder were dipped in 70% ethanol and placed in
a sterile biosafety cabinet under UV light until dry and flipped over after 30 minutes to expose
all surfaces to UV light. The outer 1.5 cm of the roast was removed and discarded. The
remaining roast was ground in the sterile biosafety cabinet and frozen to be used later. Ground

74
beef was thawed the day of the VOC collection. 380g of beef was split between the control and
the experimental group. Centrifuged control and E. coli O157:H7 dilution tubes were each
resuspended in 1mL of 0.1% BPW and then added to each of the 190g of beef. Both control and
inoculated beef were mixed by hand for 10 minutes. Starting bacteria concentration was
5.68±0.15 log CFU g-1
.
VOC Collection Volatiles released by the bacteria and media were collected using a closed-loop
stripping apparatus held at 37°C to provide optimal growth conditions for the bacteria. Glass
volatile collection trap filters with Alltech HayeSep-Q™ PoraPak-Q™ chemical absorbent were
used to trap volatile compounds released from samples. Filters were cleaned between each use
by running 5 volumes of dichloromethane to remove any potential VOCs from previous trails.
Teflon tubing was used to connect air pumps and desiccators to avoid the potential absorbance of
VOCs that could occur with typical plastic tubing.
40mL of inoculated and uninoculated TSB were placed into sterile glass beakers
equipped with magnetic stir bars. The beakers were placed into the VOC desiccator for
collection lasting 6 hours. Gentle agitation was provided from the stir plate located underneath
the desiccator. For tests involving beef, 20g of inoculated beef was added to 3 sterile petri dishes
to produce 3 experimental groups and 20g of uninoculated control beef was added to a 4th petri
dish. The petri dishes were placed into outwardly labeled desiccators to collect VOCs for 6
hours at 37°C.
After 6 hours, the VOC filters were removed from the system and eluted with 260µL of
dichloromethane into labeled autosampler vials. VOC GC-MS samples were stored in a freezer
until prepped for analysis. Prior to analysis by GC-MS, 20µL from a 1:40 dilution of

75
naphthalene was added to each control and replicate of both VOC beef and broth samples.
Naphthalene was chosen for the internal standard after preliminary analysis determined that no
peaks of interest would be interrupted by using this standard.
Analysis
Preliminary Growth Study CFU plate counts were transformed into log CFU mL-1
TSB. Log
CFU mL-1
TSB were used to produce a mean with standard deviation and graphed with
Microsoft Excel.
GC-MS Protocol A TRACE 1310 gas chromatograph system coupled with a TSQ 8000 Triple
Quadrupole mass spectrometer (Thermo Fisher Scientific, Waltham, MA, USA). 2 µL of each
sample were injected, volatilized at 220°C in a SSL injector module and separated using a
TraceGOLD TG-5MS GC column (30 m length, 0.25 mm I.D., 0.25 μm film; Thermo Fisher
Scientific, Pittsburgh, PA, USA). Column temperature was held at 40°C for 3 minutes and then
ramped at 5°C/min to 120°C, 10°C/min to 180°C and 20°C/min to 300°C which was held
constant for 2 minutes. Helium was used as a carrier gas flowing at 1.3 mL/min. Masses were
scanned utilizing a full-scan mode with the abundance or peak area of each measured under total
ion chromatogram (TIC). In addition to the sample, blank samples of dichloromethane were
included with each run to be used to subtract the background of dichloromethane prior to
analysis.
Chromatograph Interpretation After analysis by the GC-MS was completed and the background
of dichloromethane was removed, chromatograph intensity and retention time was exported in
Microsoft Excel and visually examined for peaks in all samples. Peaks were noted and

76
tentatively identified using NIST 09 standard reference database (Stein et al. 2011; Xcalibur 2.2
2011). Peaks that were identifiable were labeled as unknown. Tentative compound
identification was assigned if 2 or more samples identified the same compounds. For peaks with
two identifications that can be applicable due to probability comparison both identifications were
included. Peak area was exported from the chromatograph using Xcalibur 2.2 software.
Normalization was done through the division of the peak area of the internal standard, divided
again by the number of hours of the VOC collection, six, and finally divided by the average log
bacteria concentration to produce area VOC/hour/log CFU. Only the starting bacteria
concentration was collected for the 6-hour collection in tryptic soy broth. This starting
concentration was used in peak area unlike the averaged log CFU of the starting and ending log
CFU of VOC collected from ground beef.
Results and Discussion
Broth VOC Collection
Thirty-four peaks of interest were determined when comparing the chromatographs. Of
those thirty-four peaks, four peaks were not detected by the software within the control: an
unknown compound at both retention times of 8.722 and 20.919, 2,5-dimethyl pyrazine at 9.402,
and 1-heptatriacotanol at 30.777. Two of these four compounds, 2,5-dimethyl pyrazine
(retention time 9.402) and 1-heptatriacotanol (retention time at 30.777), only samples appeared
in all three inoculated samples. 2,5-Dimethyl pyrazine has been identified in headspace
collections with bacteria growth on TSB previously. (Cevallos-Cevallos, Danyluk, and Reyes-
De-Corcuera 2011). In a previous study, 2,5-dimethyl pyrazine was found to be produced from
enriched media due to the Maillard reaction (Cevallos-Cevallos, Danyluk, and Reyes-De-Corcera
2011). Cevallos-Cevallos and others found a significant difference in concentration between

77
their control and Escherichia coli K12 samples which is consistent with our current findings in
that our bacteria samples produced this compound, but was lacking in our control. (Cevallos-
Cevallos, Danyluk, and Reyes-De-Corcuera 2011). 1-Heptatriacontanol, a 37 long carbon chain
molecule, was tentatively identified four times within this study, yet is not reported in the
literature. Due to the nature of GC-MS analysis in addition to the tentative identification
utilizing the NIST reference library it is likely that one of these identified compounds could be 1-
heptatriacontanol. Other peaks tentatively identified as 1-heptatriacontanol may have similar
structures that the reference library would identify as 1-heptatriacontanol slight differences
causing them to show up at different retention times.
Of the thirty-four peaks of interest identified by this study, eight of these compounds
were also identified in previous studies including 2,5-dimethyl pyrazine discussed earlier.
Benzaldehyde was seen to have a peak area of 1.82x10⁻⁴
for the control and 1.30x10⁻³
, 4.6010-4
and 2.18x10⁻⁴
. One sample did show a higher peak area than the control which is not supported
by the decrease shown in all organisms by (Boots et al. 2014; Yu et al. 2000). Dimethyl
trisulfied had a smaller peak area in the control than that of the experimental groups. Ratiu et al.
and Yu et al. found the presence of dimethyltrisulfide in samples tested with Ratiu et al.
displaying an increase from Staphylococcus aureus and Yu et all showing no significant
difference between their E. coli strains and the control due to high variability in samples. 2-
Ethyl-3,5-dimethylpyrazine followed a similar trend as benzaldehyde in which 1 experimental
group showed a higher peak area than that of the control and other two samples. Cevallos-
Cevallos and colleagues saw varied peak areas across their mixed, Salmonella typhimurium and
E. coli O157:H7 cultures. 2-Nonanone is variable across literature in the bacteria that present
this VOC (Boots et al. 2014; Chen et al. 2016, 2017; Ratiu et al. 2017; Yu et al. 2000; Zhu et al.
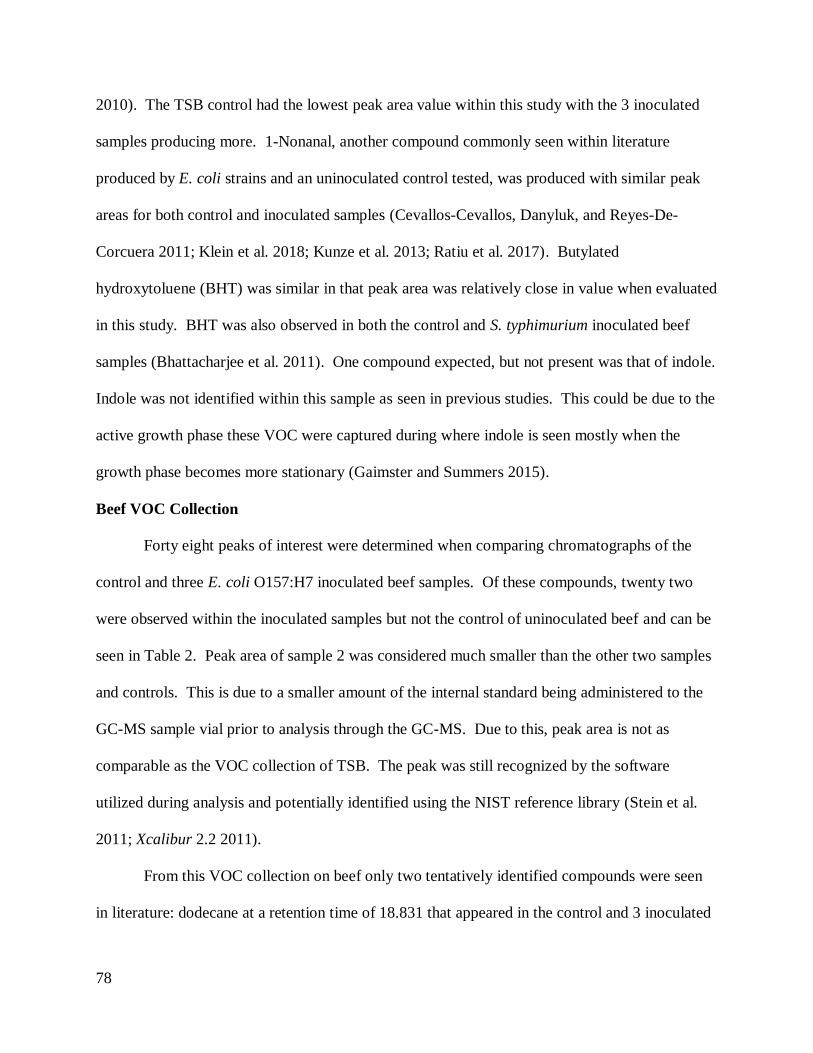
78
2010). The TSB control had the lowest peak area value within this study with the 3 inoculated
samples producing more. 1-Nonanal, another compound commonly seen within literature
produced by E. coli strains and an uninoculated control tested, was produced with similar peak
areas for both control and inoculated samples (Cevallos-Cevallos, Danyluk, and Reyes-De-
Corcuera 2011; Klein et al. 2018; Kunze et al. 2013; Ratiu et al. 2017). Butylated
hydroxytoluene (BHT) was similar in that peak area was relatively close in value when evaluated
in this study. BHT was also observed in both the control and S. typhimurium inoculated beef
samples (Bhattacharjee et al. 2011). One compound expected, but not present was that of indole.
Indole was not identified within this sample as seen in previous studies. This could be due to the
active growth phase these VOC were captured during where indole is seen mostly when the
growth phase becomes more stationary (Gaimster and Summers 2015).
Beef VOC Collection
Forty eight peaks of interest were determined when comparing chromatographs of the
control and three E. coli O157:H7 inoculated beef samples. Of these compounds, twenty two
were observed within the inoculated samples but not the control of uninoculated beef and can be
seen in Table 2. Peak area of sample 2 was considered much smaller than the other two samples
and controls. This is due to a smaller amount of the internal standard being administered to the
GC-MS sample vial prior to analysis through the GC-MS. Due to this, peak area is not as
comparable as the VOC collection of TSB. The peak was still recognized by the software
utilized during analysis and potentially identified using the NIST reference library (Stein et al.
2011; Xcalibur 2.2 2011).
From this VOC collection on beef only two tentatively identified compounds were seen
in literature: dodecane at a retention time of 18.831 that appeared in the control and 3 inoculated

79
samples and peak 25.402 as either an unknown compound or butylated hydroxytoluene (BHT)
that appeared as tentative identifications and only within inoculated sample. Though BHT did
not appear in the control for this study it was reported in both uninoculated fresh and aged beef
samples in which the authors suggested the source of this compound was potentially the
Styrofoam trays used (Bhattacharjee et al. 2011). Their results suggest that this compound,
because it was not seen in the control, is the second unknown identification. Dodecane was
identified in both E. coli and Pseudomonas aeruginosa cultivated in lysogeny broth medium
(Kunze et al. 2013). Many compounds seen within this study remain unknown. Increased
replicates that may produce better profiles could lead to increased tentative identification for
these compounds. This study only used 20 grams of ground beef per sample and control.
Increasing this to 40 grams or higher could also help to solidify compounds and tentative
identification through presumably increasing peak area of compounds overcoming interference
that may influence tentative compound identification.
Conclusions
Analysis limitations within this study include the limited identification of compounds
using an experimental reference library which produces theoretical results. Tentative
identifications need to be further confirmed using external standards to ensure the identification
of the compound. This study included both unknown compounds and tentatively identified
compounds. There were also times that the same compound identification appeared in more than
one peak. Though the compounds may be related through similar backbone structures, these are
not the same compound due to the GC-MS separation of compounds first by size and then by
charge. Samples analyzed by the GC-MS in this study were stored in a freezer up to two months
before analysis. During those two months chemicals had the potential to interact with each other

80
and the air within the sample potentially altering compounds detected. The samples were also
injected into the GC-MS at a temperature of 220°C which has the potential to alter compounds
viewed after analysis.
Experimental limitations include the lack of growth curve of E. coli O157:H7 and thus an
average of the starting and ending concentration was used to divide peak area to provide VOC
peak area per log CFU for ground beef. This does not accurately incorporate the non linear
growth of bacteria and is thus a limitation to this study in both the beef and TSB VOC
collections. Another limitation that may be present is the interaction between VOCs released
from E. coli O157:H7 and the ground beef. In a previous study where the VOCs interacted with
the sample where VOC compounds were absorbed by the food product (Yu et al. 2000). Ground
beef, with the lipid content, may prevent the volatilization of some compounds due to the
compound’s interactions with the lipid present. In addition to the interaction between bacteria
produced VOCs there is also potential for the beef to absorb VOCs from the packaging and
slowly release this over time especially with the influence of increased temperature. A final
limitation to note would be that the VOC trap was held inside the incubator used to control the
temperature for this experiment. This particular VOC filter is often used at room temperature
and thus may not allow for the complete capture of VOCs.
Despite limitations, this study met the aim of evaluating the VOC profile of E. coli
O157:H7 grown in both TSB and ground beef. In both experiments there were compounds seen
in only the inoculated samples depicting the potential for VOC collection as a tool to monitor
food production. This study lays the foundation for future studies further identifying and
solidifying consistent compound produced from E. coli O157:H7.
Future Study Directions

81
This study is a great start in the evaluation of VOC with food safety application in mind.
Moving forward, more replications are needed with a more sensitive system to obtain higher
intensities of compounds for better identification using the NIST reference library. This may
also be obtained using larger inoculated samples as the present study only sampled 20 g of
ground beef. Cold injection, injecting more than 2 µL, or utilizing tandem analysis settings for
GC-MS analysis can also help with identification of the true compounds. For future replicates at
increased temperatures it should be considered to move the filter outside of the incubator so it is
not held at a higher temperature potentially influencing the VOC collection.
In addition to specific measures that can be different, once a VOC profile at optimal
temperature is solidified moving the system into a temperature controlled system mimicking
processing temperatures can give greater insight into if these VOC will be produced in amounts
that can be recognized at a lower temperature. Moving beyond ground beef, meat products are
not the only products that can carry foodborne illness causing bacteria and thus may benefit from
VOC monitoring. Extending this study to fruit and vegetables would help provide a more
overarching picture of VOC potential within the food production industry.
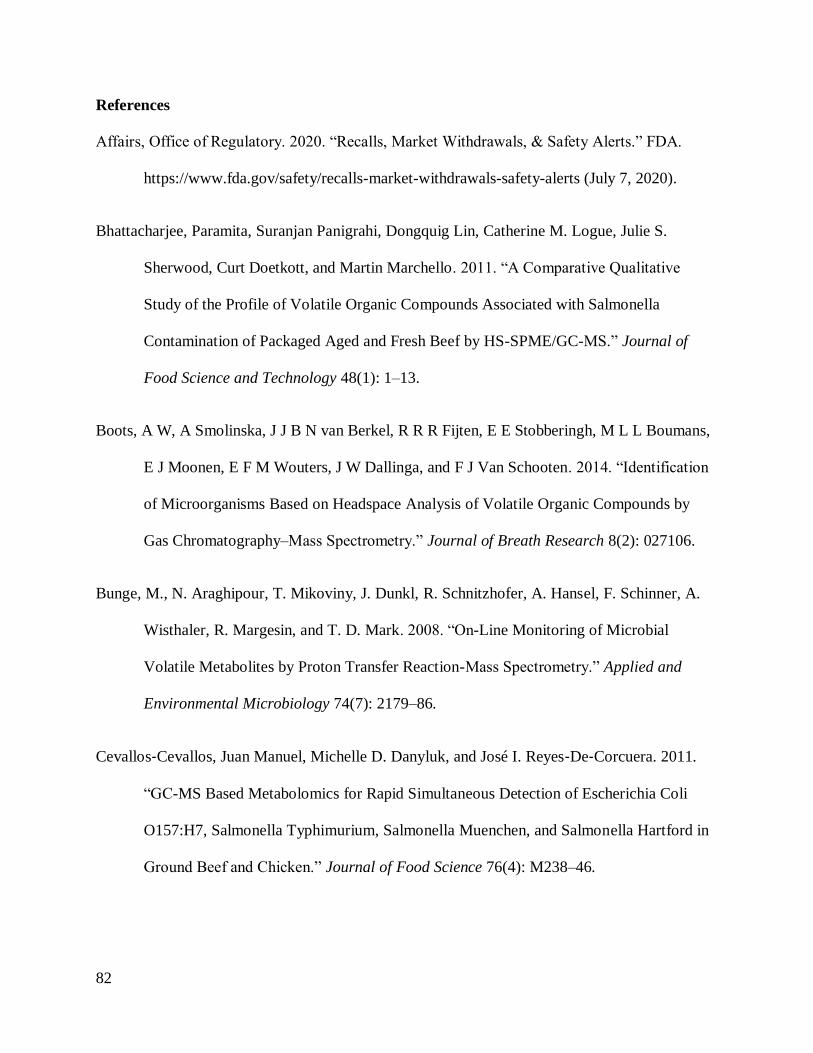
82
References
Affairs, Office of Regulatory. 2020. “Recalls, Market Withdrawals, & Safety Alerts.” FDA.
https://www.fda.gov/safety/recalls-market-withdrawals-safety-alerts (July 7, 2020).
Bhattacharjee, Paramita, Suranjan Panigrahi, Dongquig Lin, Catherine M. Logue, Julie S.
Sherwood, Curt Doetkott, and Martin Marchello. 2011. “A Comparative Qualitative
Study of the Profile of Volatile Organic Compounds Associated with Salmonella
Contamination of Packaged Aged and Fresh Beef by HS-SPME/GC-MS.” Journal of
Food Science and Technology 48(1): 1–13.
Boots, A W, A Smolinska, J J B N van Berkel, R R R Fijten, E E Stobberingh, M L L Boumans,
E J Moonen, E F M Wouters, J W Dallinga, and F J Van Schooten. 2014. “Identification
of Microorganisms Based on Headspace Analysis of Volatile Organic Compounds by
Gas Chromatography–Mass Spectrometry.” Journal of Breath Research 8(2): 027106.
Bunge, M., N. Araghipour, T. Mikoviny, J. Dunkl, R. Schnitzhofer, A. Hansel, F. Schinner, A.
Wisthaler, R. Margesin, and T. D. Mark. 2008. “On-Line Monitoring of Microbial
Volatile Metabolites by Proton Transfer Reaction-Mass Spectrometry.” Applied and
Environmental Microbiology 74(7): 2179–86.
Cevallos‐Cevallos, Juan Manuel, Michelle D. Danyluk, and José I. Reyes‐De‐Corcuera. 2011.
“GC-MS Based Metabolomics for Rapid Simultaneous Detection of Escherichia Coli
O157:H7, Salmonella Typhimurium, Salmonella Muenchen, and Salmonella Hartford in
Ground Beef and Chicken.” Journal of Food Science 76(4): M238–46.

83
Chen, Juan, Junni Tang, Cheng Tang, Hui Shi, Huaiyin Gu, and Xiaozhu Lu. 2016. “Growth and
Volatile Compounds of Escherichia Coli O157:H7 on Irradiated Pork.” Journal of Food
Quality 39(6): 766–72.
Chen, Juan, Junni Tang, Hui Shi, Cheng Tang, and Rong Zhang. 2017. “Characteristics of
Volatile Organic Compounds Produced from Five Pathogenic Bacteria by Headspace-
Solid Phase Micro-Extraction/Gas Chromatography-Mass Spectrometry.” Journal of
Basic Microbiology 57(3): 228–37.
Debnath, Mousumi, G. B. Prasad, Prakash S. Bisen, and Prakash S. Bisen. 2012. Microbes:
Concepts and Applications. Somerset, UNITED STATES: John Wiley & Sons,
Incorporated. http://ebookcentral.proquest.com/lib/wvu/detail.action?docID=848522
(June 5, 2020).
Gaimster, Hannah, and David Summers. 2015. “Regulation of Indole Signalling during the
Transition of E. Coli from Exponential to Stationary Phase” ed. Marie-Joelle Virolle.
PLOS ONE 10(9): e0136691.
Klein, Daniel, Stephan Maurer, Ulrike Herbert, Judith Kreyenschmidt, and Peter Kaul. 2018.
“Detection of Volatile Organic Compounds Arising from Chicken Breast Filets Under
Modified Atmosphere Packaging Using TD-GC/MS.” Food Analytical Methods 11(1):
88–98.
Kunze, Nils, Stephan Maurer, Ulrike Herbert, Judith Kreyenschmidt, and Peter Kaul. 2013.
“Detection and Validation of Volatile Metabolic Patterns over Different Strains of Two
Human Pathogenic Bacteria during Their Growth in a Complex Medium Using Multi-

84
Capillary Column-Ion Mobility Spectrometry (MCC-IMS).” Applied Microbiology and
Biotechnology 97(8): 3665–76.
Ratiu, Ileana-Andreea, Tomasz Ligor, Victor Bocos-Bintintan, Hossam Al-Suod, Tomasz
Kowalkowski, Katarzyna Rafińska, and Bofus Buszewski. 2017. “The Effect of Growth
Medium on an Escherichia Coli Pathway Mirrored into GC/MS Profiles.” Journal of
Breath Research 11(3): 036012.
Sparkman, O. David, Zelda Penton, and Fulton G. Kitson. 2011. Gas Chromatography and Mass
Spectrometry: A Practical Guide. San Diego, United States: Elsevier Science &
Technology. http://ebookcentral.proquest.com/lib/wvu/detail.action?docID=670206 (July
20, 2020).
Stein, S., Y. Mirokhin, G. Mallard, A. Mikaia, P. Neta, D. Sparkman, E. White, X. Yang, V.
Zaikin, and D. Zhu. (2011). NIST Mass Spectral Search Program (2.0g) [Computer
software]. FairCom Corporation.
Tack DM, Ray L, Griffin PM, et al. 2020. “Preliminary Incidence and Trends of Infections with
Pathogens Transmitted Commonly Through Food — Foodborne Diseases Active
Surveillance Network, 10 U.S. Sites, 2016–2019.” MMWR. Morbidity and Mortality
Weekly Report 69. https://www.cdc.gov/mmwr/volumes/69/wr/mm6917a1.htm (July 6,
2020).
Taiti, Cosimo, Corrado Costa, Paolo Menesatti, Stefania Caparrotta, Nadia Bazihizina, Elisa
Azzarello, William Antonia Petrucci, Elisa Masi, and Edgardo Giordani. 2015. “Use of
Volatile Organic Compounds and Physicochemical Parameters for Monitoring the Post-

85
Harvest Ripening of Imported Tropical Fruits.” European Food Research and
Technology 241(1): 91–102.
United States Food and Drug Administration. Food Safety and Inspection Service. 2019. Raw
Beef Product Sampling.
Vaishnav, Anukool, Ajit Varma, Narendra Tuteja, and Devendra Choudhary. 2017.
“Characterization of Bacterial Volatiles and Their Impact on Plant Health Under Abiotic
Stress.” In Volatiles and Food Security, Springer Nature Singapore Pte Ltd., 15–23.
Veselova, M. A., V. A. Plyuta, and I. A. Khmel. 2019. “Volatile Compounds of Bacterial Origin:
Structure, Biosynthesis, and Biological Activity.” Microbiology 88(3): 261–74.
Wood, William L., Daniel J Higbee, Melanie Gooldy, Scott Glogowski, Rich Fitzpatrick,
Richard J Karalus, Troy D. Wood, and David J. Mangino. 2006. “Analysis of Volatile
Bacterial Metabolites by Gas Chromatography--Mass Spectrometry.” Spectroscopy
21(6): 20–28.
Xcalibur 2.2 (2.2 SP1.48). (2011). [Computer software]. Thermo Fisher Scientific Inc.
Yu, Keshun, Thomas R. Hamilton-Kemp, Douglas D. Archbold, Randall W. Collins, and
Melissa C. Newman. 2000. “Volatile Compounds from Escherichia Coli O157:H7 and
Their Absorption by Strawberry Fruit.” Journal of Agricultural and Food Chemistry
48(2): 413–17.

86
Zhu, Jiangjiang, Heather D. Bean, Yin-Ming Kuo, and Jane E. Hill. 2010. “Fast Detection of
Volatile Organic Compounds from Bacterial Cultures by Secondary Electrospray
Ionization-Mass Spectrometry.” Journal of Clinical Microbiology 48(12): 4426–31.

87
Tables and Figures
Table 1. VOC peak identification and peak area presented as peak area/hour/Log CFU mL-1
for
E coli O157:H7 grown in tryptic soy broth (TSB). Compounds have been displayed with
observed peak retention time (RT).
Peak RT Tentative ID Peak Area VOC/Hour/Log CFU mL-1
TSB
Control S1 S2 S3
4.538 Isooctyl Alcohol 4.10E-05 5.08E-03 1.31E-04 4.75E-05
6.552 Hexamethylcyclotrisilozxane 1.16E-04 2.09E-04 X X
8.722 Unknown X 4.73E-04 3.32E-04 X
9.402 2,5-Dimethyl Pyrazine X 4.87E-04 1.59E-04 6.63E-05
11.049 Benzaldehyde 1.82E-04 1.30E-03 4.60E-04 2.18E-04
11.304 Dimethyl Trisulfide 3.86E-05 2.73E-03 6.02E-04 1.29E-04
12.283 Octamethyl cyclotetrasiloxan 5.22E-04 X 3.31E-04 8.04E-04
12.457 Unknown 3.15E-04 7.01E-04 4.09E-04 4.08E-04
13.198 2-Chlorcyclohexanol 1.41E-04 2.54E-04 1.65E-04 2.00E-04
13.313 Unknown 1.54E-03 6.43E-05 8.23E-04 2.11E-03
13.868 Phenylacetaldehyde 8.47E-04 2.24E-03 6.74E-04 1.17E-03
14.161 Unknown 1.93E-05 3.81E-04 1.44E-04 6.73E-05

88
14.647 Unknown 8.13E-05 4.01E-04 2.14E-04 2.20E-04
14.831 3,7-Dimethyloctan-1,7-diol 3.45E-04 4.66E-04 6.15E-04 4.97E-04
15.028 2-Ethyl-3,5-dimethylpyrazin 5.17E-04 1.34E-03 8.21E-04 9.17E-04
15.426 2-Nonanone 1.07E-05 1.58E-03 3.93E-04 1.14E-04
15.651 Unknown 4.01E-04 5.24E-05 2.18E-04 1.02E-03
15.828 1-Nonanal 2.36E-03 1.40E-03 1.42E-03 2.71E-03
17.569 Unknown 2.09E-04 1.49E-04 1.63E-04 2.65E-04
17.804 Unknown 2.47E-04 1.09E-04 2.30E-04 2.89E-04
19.362 Unknown 1.81E-04 5.95E-05 3.32E-04 X
19.729 1,2-Benzisothiazole or
Benzothiazole
1.47E-03 1.37E-03 1.68E-03 1.73E-03
20.919 Unknown X 9.46E-04 1.54E-03 X
20.984 Unknown 1.35E-03 X X 1.54E-03
21.600 Unknown 1.88E-03 1.81E-03 2.79E-03 2.82E-03
21.960 Unknown 2.01E-03 4.19E-04 1.54E-03 3.51E-03
25.402 Butylated Hydroxytoluene 1.75E-02 1.77E-03 2.09E-02 3.69E-02
26.879 2,6-Bis(1,1-dimethylethyl-4- 8.28E-02 2.54E-03 2.04E-03 1.18E-01

89
(1-oxopropyl)phenol or 4-sec-
butyl-2,6-di-tert-butylphenol
27.175 2,5-di-tert-Amylbenzoquinone 1.28E-02 2.96E-04 3.40E-02 6.65E-02
28.932 1-Heptatriacotanol 1.31E-03 X X 6.67E-04
29.613 2,5-Di-tert-Pentylhydrochinon 1.90E-02 3.30E-03 2.29E-02 4.57E-02
30.777 1-Heptatriacotanol or Phorbol X 5.72E-03 2.33E-03 5.55E-03
31.290 1-Heptatriacotanol 1.34E-03 3.58E-03 4.27E-03 2.48E-03
33.164 1-Heptatriacotanol 1.13E-04 2.74E-02 X X
Peak area is given as VOC produced/hour/Log CFU mL-1
.

90
Table 2. VOC peak identification and peak area presented as peak area/hour/Log CFU g-1
ground beef for E coli O157:H7 grown in ground beef. Compounds have been displayed with
observed peak retention time (RT).
Peak RT Tentative ID Peak Area VOC/Hour/Log CFU g-1
Beef
Control S1 S2 S3
6.185 Unknown 6.61E-06 3.99E-05 3.95E-13 1.59E-04
13.321 Unknown 8.60E-05 2.23E-04 1.07E-11 3.52E-04
15.654 Unknown X 1.22E-04 2.10E-11 3.47E-04
16.300 Unknown 2.30E-05 3.37E-05 3.46E-12 7.67E-05
16.413 Unknown 5.51E-05 X 8.48E-12 1.75E-04
16.865 Unknown X 1.05E-04 1.10E-11 2.81E-04
17.243 1,1-
Bis(dodecyloxy)hexadecane
X X 3.79E-12 1.34E-04
17.375 Unknown 5.30E-04 3.62E-03 7.20E-11 2.99E-03
17.913 1,1-
Bis(dodecyloxy)hexadecane
3.11E-05 4.61E-05 5.96E-12 1.19E-04
18.831 Dodecane 7.71E-05 5.77E-06 3.39E-13 2.41E-05
19.256 Unknown X X 1.94E-11 4.31E-04

91
19.470 Unknown X X 6.33E-12 1.26E-04
19.974 Unknown 1.11E-05 1.97E-05 9.14E-12 2.39E-04
20.304 2-Methylhexadecan-1-ol 3.42E-05 8.93E-05 4.72E-12 1.97E-04
20.379 Delta-Dodecanolactone or
2-Oxohexamethylenimine
X X 2.28E-10 1.60E-03
20.807 Unknown X X 4.51E-11 1.46E-03
21.443 Unknown X 5.26E-04 1.92E-10 9.56E-03
21.831 Unknown 2.16E-05 1.53E-05 3.37E-11 1.30E-03
22.403 Unknown X X 5.70E-11 2.54E-03
22.508 Unknown X 8.03E-05 4.30E-11 1.97E-03
22.559 Unknown X 5.35E-05 3.51E-11 1.54E-03
22.668 2,6,10-trimethyltetradecane 1.27E-04 1.21E-04 4.18E-11 1.27E-04
22.753 2,6,10-trimethyltetradecane 8.36E-06 6.00E-05 8.36E-11 4.15E-03
22.889 2-Bromododecane or 4-
Methyldocosane
X 1.32E-04 7.46E-11 3.19E-03
23.001 2,6,10-trimethyltetradecane 2.09E-04 1.74E-04 1.10E-10 4.90E-03
23.436 Tetradecane or 2,6,10-
trimethyltetradecane
2.43E-04 4.50E-04 3.05E-10 1.59E-02

92
23.515 Unknown X 3.70E-05 3.72E-11 1.87E-03
23.722 Unknown 1.27E-05 2.93E-05 2.99E-11 1.46E-03
24.042 Unknown 2.43E-04 2.95E-04 5.77E-11 2.69E-03
24.324 Unknown 9.23E-06 1.99E-04 3.38E-11 1.86E-03
24.637 1-Heptatriacotanol OR
2,6,10-trimethyltetradecane
X X 8.46E-11 4.41E-03
24.668 Unknown 3.46E-04 3.47E-04 X X
24.790 tert-Hexadecanethiol 7.27E-04 1.20E-03 9.77E-11 4.04E-03
25.402 Unknown or Butylated
hydroxytoluene
X 1.39E-03 1.27E-10 4.28E-03
25.498 1-Heptatriacotanol X X 1.04E-11 3.18E-04
25.739 Unknown 1.88E-04 X 5.59E-11 2.23E-03
25.804 1-Heptatriacotanol or Tert-
hexadecyl mercaptan
X X 2.98E-11 7.58E-04
25.875 Unknown X X 3.93E-11 1.38E-03
25.950 Unknown X X 6.67E-11 2.36E-03
26.049 1-Heptatriacotanol X X 3.02E-11 X

93
26.096 1-Heptatriacotanol 4.42E-04 5.00E-04 4.54E-11 3.35E-03
26.385 Unknown X X 1.60E-10 7.31E-03
26.868 4-sec-Butyl-2,6-di-tert-
butylphenol OR 2,6-
Bis(1,1-dimethylethyl-4-(1-
oxopropyl)phenol
1.14E-03 9.33E-04 2.38E-09 4.67E-02
27.175 2,5-di-tert-
Amylbenzoquinone
2.61E-04 3.21E-03 4.31E-11 1.15E-03
28.573 Unknown 1.66E-04 1.61E-04 8.25E-11 2.38E-03
29.617 2,5-di(tert-
amyl)Hydroquinone
1.13E-03 5.28E-03 9.78E-11 1.63E-03
32.906 4-methoxybut-1-ene 1.39E-05 6.59E-05 5.11E-12 X
Peak area is given as VOC produced/hour/Log CFU g-1
.

94
Figure 1. Growth of E. coli O157:H7 in tryptic soy broth over 10 hours at 37°C and shaken at
150 rpm. Starting and ending bacteria concentration reported as mean ± standard deviation of
5.45±0.51 and 9.48±0.35 log CFU ml-1 of tryptic soy broth, respectively.

95
Figure 2. VOC chromatograph from the control of uninoculated tryptic soy broth and sample 1
of E. coli O157:H7 inoculated tryptic soy broth collected for 6 hours. Starting bacteria
concentration reported as mean ± standard deviation of 6.07±0.52 log CFU mL-1
tryptic soy
broth. The internal standard naphthalene present at retention time of 18.45 is labeled IS on the
graph.
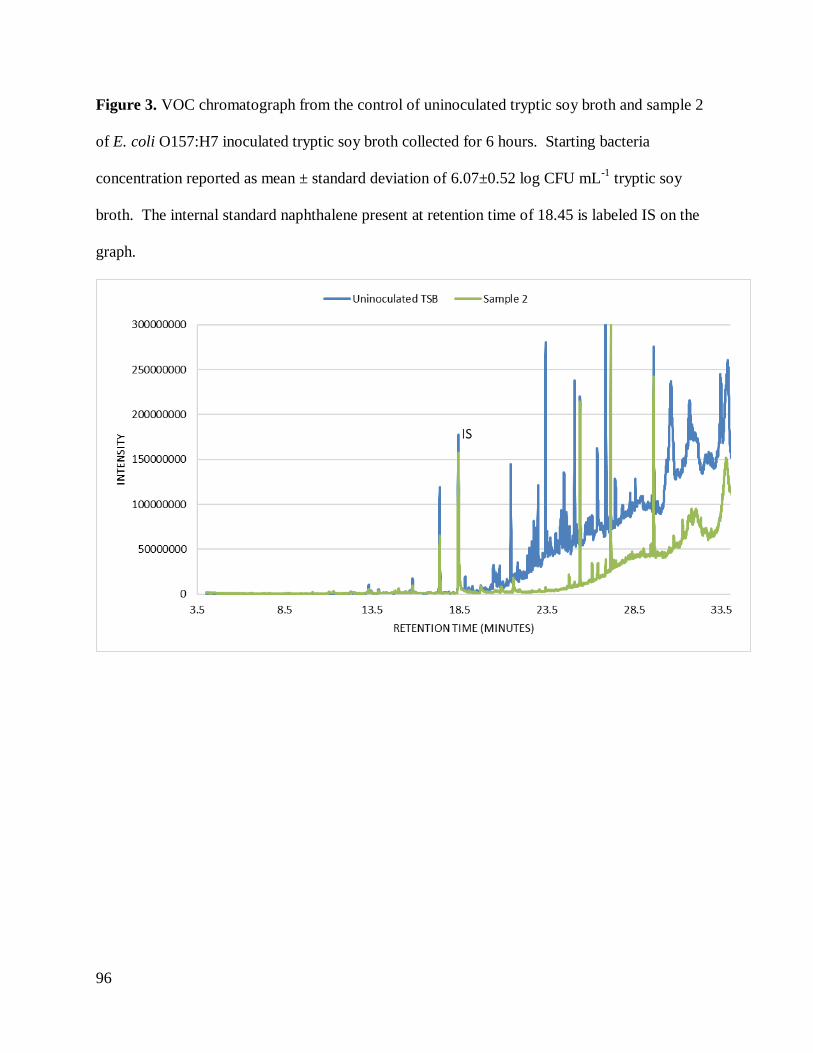
96
Figure 3. VOC chromatograph from the control of uninoculated tryptic soy broth and sample 2
of E. coli O157:H7 inoculated tryptic soy broth collected for 6 hours. Starting bacteria
concentration reported as mean ± standard deviation of 6.07±0.52 log CFU mL-1
tryptic soy
broth. The internal standard naphthalene present at retention time of 18.45 is labeled IS on the
graph.
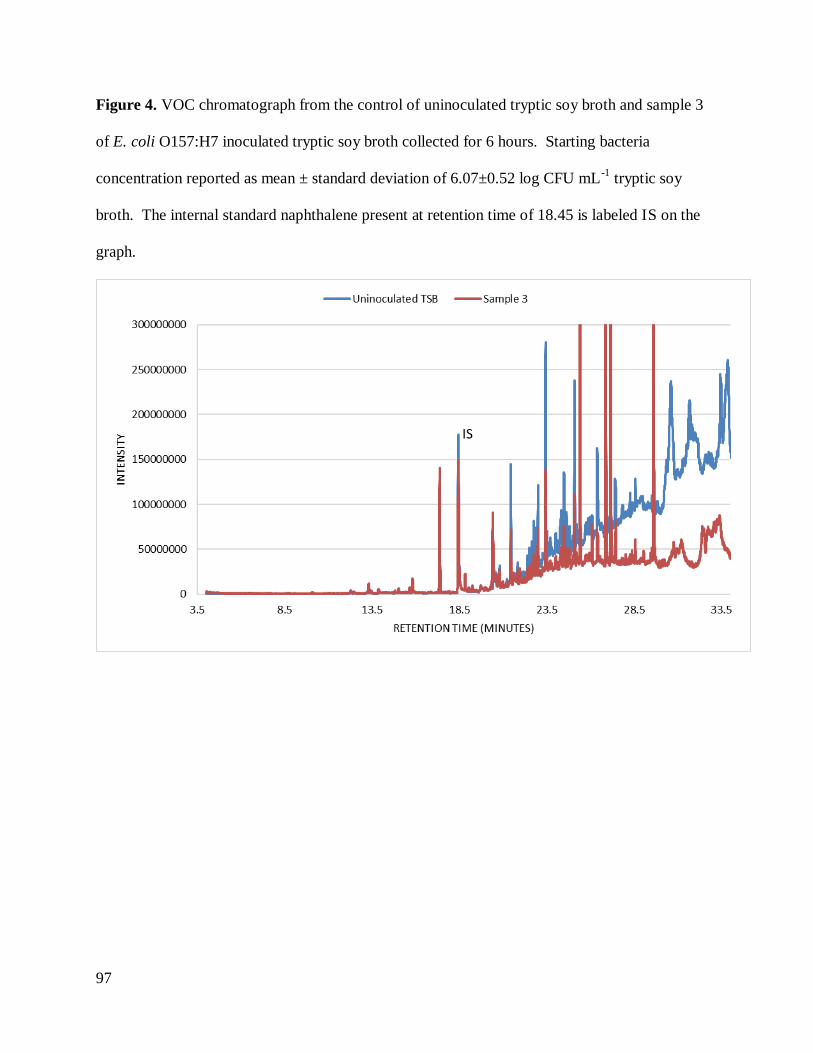
97
Figure 4. VOC chromatograph from the control of uninoculated tryptic soy broth and sample 3
of E. coli O157:H7 inoculated tryptic soy broth collected for 6 hours. Starting bacteria
concentration reported as mean ± standard deviation of 6.07±0.52 log CFU mL-1
tryptic soy
broth. The internal standard naphthalene present at retention time of 18.45 is labeled IS on the
graph.
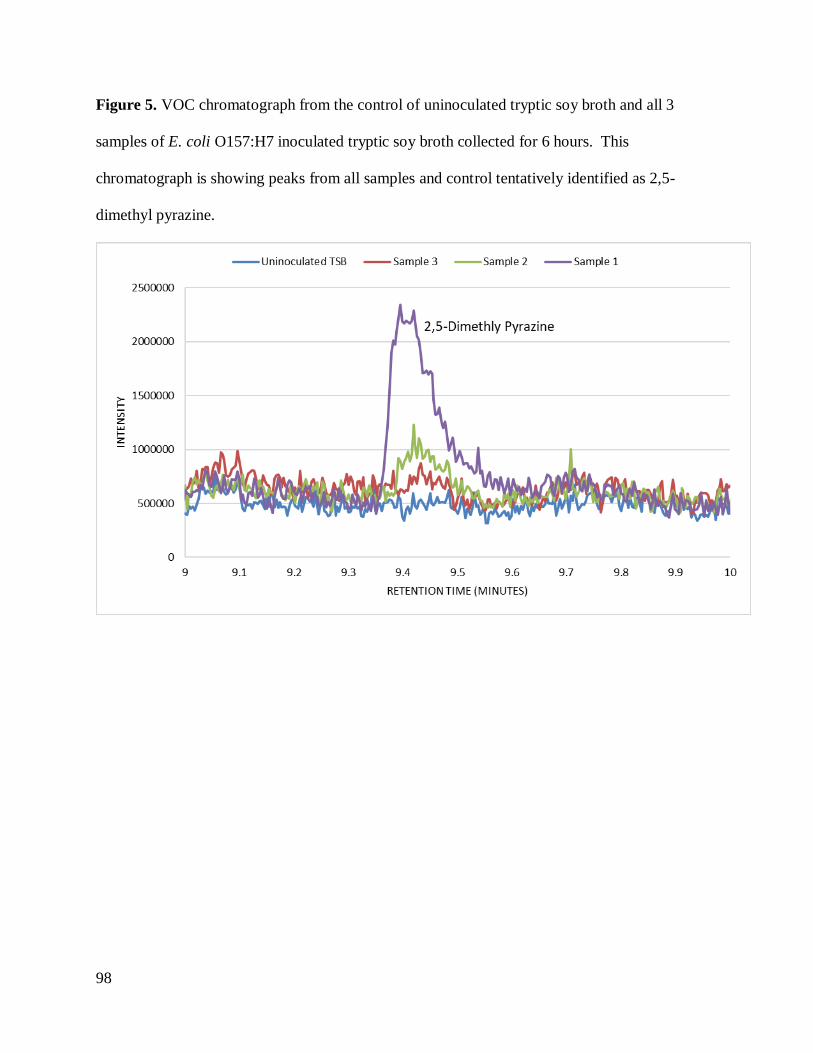
98
Figure 5. VOC chromatograph from the control of uninoculated tryptic soy broth and all 3
samples of E. coli O157:H7 inoculated tryptic soy broth collected for 6 hours. This
chromatograph is showing peaks from all samples and control tentatively identified as 2,5-
dimethyl pyrazine.

99
Figure 6. VOC chromatograph from the control of uninoculated tryptic soy broth and all 3
samples of E. coli O157:H7 inoculated tryptic soy broth collected for 6 hours. This
chromatograph is displaying the peak from all samples and control tentatively identified as 1-
heptatriacotanol marked with an *.

100
Figure 7. VOC chromatograph from the control of uninoculated beef and sample 1 of E. coli
O157:H7 inoculated tryptic soy broth collected for 6 hours. Starting and ending bacteria
concentration reported as mean ± standard deviation of 5.68±0.15 log CFU g-1
and 8.17±0.23 log
CFU g-1
of beef respectively. The internal standard naphthalene present at retention time of
18.45 is labeled IS on the graph.

101
Figure 8. VOC chromatograph from the control of uninoculated beef and sample 2 of E. coli
O157:H7 inoculated tryptic soy broth collected for 6 hours. Starting and ending bacteria
concentration reported as mean ± standard deviation of 5.68±0.15 log CFU g-1
and 8.17±0.23 log
CFU g-1
of beef respectively. The internal standard naphthalene present at retention time of
18.45 is labeled IS on the graph.

102
Figure 9. VOC chromatograph from the control of uninoculated beef and sample 3 of E. coli
O157:H7 inoculated tryptic soy broth collected for 6 hours. Starting and ending bacteria
concentration reported as mean ± standard deviation of 5.68±0.15 log CFU g-1
and 8.17±0.23 log
CFU g-1
of beef respectively. The internal standard naphthalene present at retention time of
18.45 is labeled IS on the graph.
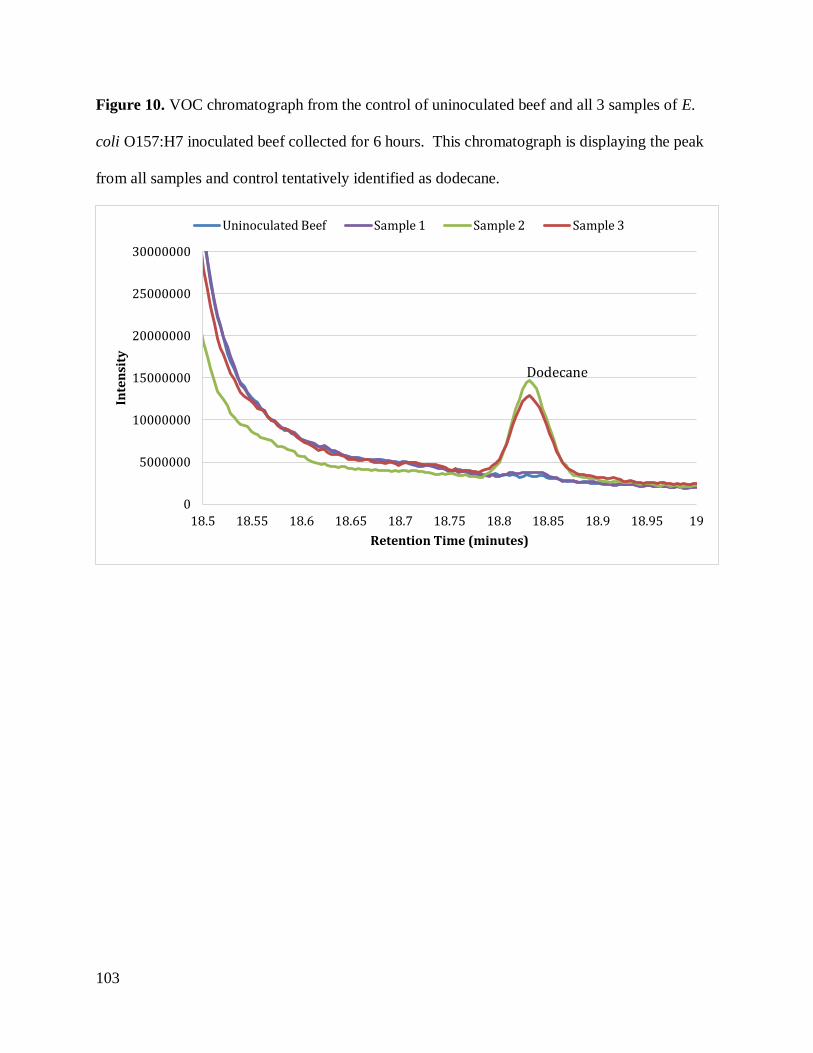
103
Figure 10. VOC chromatograph from the control of uninoculated beef and all 3 samples of E.
coli O157:H7 inoculated beef collected for 6 hours. This chromatograph is displaying the peak
from all samples and control tentatively identified as dodecane.
0
5000000
10000000
15000000
20000000
25000000
30000000
18.5 18.55 18.6 18.65 18.7 18.75 18.8 18.85 18.9 18.95 19
Inte
nsi
ty
Retention Time (minutes)
Uninoculated Beef Sample 1 Sample 2 Sample 3
Dodecane

104
Figure 11. VOC chromatograph from the control of uninoculated beef and all 3 samples of E.
coli O157:H7 inoculated beef collected for 6 hours. This chromatograph is displaying the peak
from all samples and control tentatively identified as butylated hydroxytoluene or as an unknown
compound.

105
Figure 12. Closed-loop headspace VOC collection system. Uninoculated and inoculated ground
beef samples during a 6 hour VOC collection.