Characterisation and UV inactivation of bacteriophages ...
250
Characterisation and UV inactivation of bacteriophages infecting human-specific Bacteroides strain GB-124 David Diston A thesis submitted in partial fulfilment of the requirements of the University of Brighton for the degree of Doctor of Philosophy September 2010 School of Environment and Technology University of Brighton United Kingdom
-
Upload
khangminh22 -
Category
Documents
-
view
1 -
download
0
Transcript of Characterisation and UV inactivation of bacteriophages ...

Characterisation and UV inactivation of
bacteriophages infecting human-specific
Bacteroides strain GB-124
David Diston
A thesis submitted in partial fulfilment of the
requirements of the University of Brighton for the
degree of Doctor of Philosophy
September 2010
School of Environment and Technology
University of Brighton
United Kingdom
ii
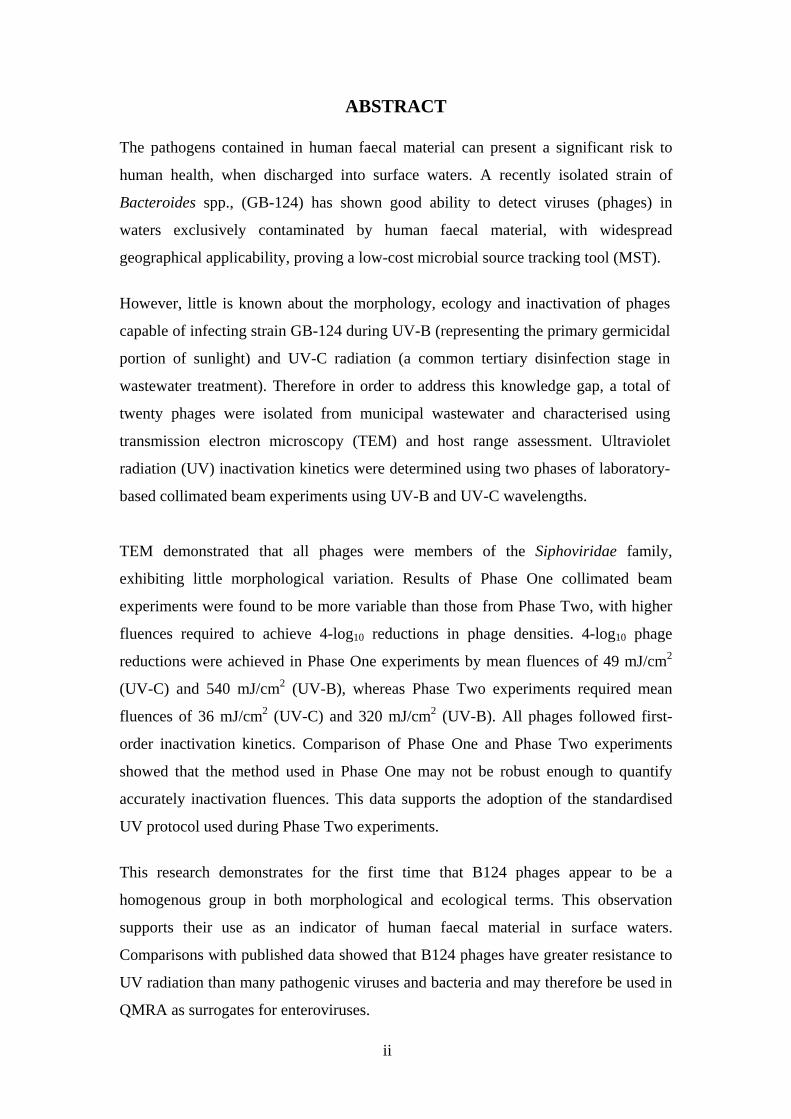
ABSTRACT
The pathogens contained in human faecal material can present a significant risk to
human health, when discharged into surface waters. A recently isolated strain of
Bacteroides spp., (GB-124) has shown good ability to detect viruses (phages) in
waters exclusively contaminated by human faecal material, with widespread
geographical applicability, proving a low-cost microbial source tracking tool (MST).
However, little is known about the morphology, ecology and inactivation of phages
capable of infecting strain GB-124 during UV-B (representing the primary germicidal
portion of sunlight) and UV-C radiation (a common tertiary disinfection stage in
wastewater treatment). Therefore in order to address this knowledge gap, a total of
twenty phages were isolated from municipal wastewater and characterised using
transmission electron microscopy (TEM) and host range assessment. Ultraviolet
radiation (UV) inactivation kinetics were determined using two phases of laboratory-
based collimated beam experiments using UV-B and UV-C wavelengths.
TEM demonstrated that all phages were members of the Siphoviridae family,
exhibiting little morphological variation. Results of Phase One collimated beam
experiments were found to be more variable than those from Phase Two, with higher
fluences required to achieve 4-log10 reductions in phage densities. 4-log10 phage
reductions were achieved in Phase One experiments by mean fluences of 49 mJ/cm2
(UV-C) and 540 mJ/cm2 (UV-B), whereas Phase Two experiments required mean
fluences of 36 mJ/cm2 (UV-C) and 320 mJ/cm2 (UV-B). All phages followed first-
order inactivation kinetics. Comparison of Phase One and Phase Two experiments
showed that the method used in Phase One may not be robust enough to quantify
accurately inactivation fluences. This data supports the adoption of the standardised
UV protocol used during Phase Two experiments.
This research demonstrates for the first time that B124 phages appear to be a
homogenous group in both morphological and ecological terms. This observation
supports their use as an indicator of human faecal material in surface waters.
Comparisons with published data showed that B124 phages have greater resistance to
UV radiation than many pathogenic viruses and bacteria and may therefore be used in
QMRA as surrogates for enteroviruses.

iii
CONTENTS
Page Abstract ii Contents iii -iv List of Tables v – vii List of Figures viii - x Acknowledgements xi Author’s Declaration xii Chapter One: Introduction 1 – 20 1.1 Aim 1 1.2 Waterborne disease burden 2 1.3 Waterborne pathogens 5 1.4 Pollution source and routes of transmission 9 1.5 Risk, mitigation and traditional microbial source 15
tracking methods
Chapter Two: Bacteriophage characteristics and their 21 - 63 use in MST and QMRA studies
2.1 General characteristics of phages 21 2.2 Using phages as indicators of faecal pollution 35 2.3 Using phages infecting Bacteroides spp., as 44
indicators of human faecal material 2.4 Quantitative microbial risk assessment (QMRA) 62 Chapter Three: Phage ecology and UV inactivation 64 - 92 3.1 Phage ecology 64 3.2 UV inactivation technologies 66 3.3 Collimated Beam apparatus set-ups 71 3.4 Microorganism inactivation kinetics 76 3.5 Applications of UV technologies 80 3.6 Environmental UV related microorganism inactivation 81 3.7 Rationale of study 89 3.8 Aims and objectives of research project 91 Chapter Four: Materials and methods 93 - 114 4.1 Isolation of bacteriophages infecting GB-124 93 4.2 Phage characterisation 99 4.3 Construction of collimated beam UV apparatus 100 4.4 UV Inactivation Methods 108 Chapter Five: Results of isolation and characterisation 115 - 127 of B124 phages 5.1 Phage isolation 115 5.2 Transmission Electron Microscopy 119 5.3 B124 phage host range 125
iv
Chapter Six: Results of Phase One UV inactivation 128 - 147 experiments 6.1 Phase One UV-C inactivation kinetics of B124 phages 128 6.2 Phase One UV-B inactivation kinetics of B124 phages 139 6.3 Relationship between UV-B and UV-C inactivation 147
rates of B124 phages during Phase One experiments Chapter Seven: Results of Phase Two UV inactivation 148 - 160 experiments 7.1. Phase Two UV-C inactivation kinetics of B124 phages 149 7.2. Phase Two UV-B inactivation kinetics of B124 phages 154 7.3. Relationship between UV-B and UV-C inactivation 158
kinetics of B124 phages during Phase Two experiments 7.4 Comparison of Phase One and Phase Two experiments 160
Chapter Eight: Discussion, conclusions and further Work 161 - 190 8.1 Phage homogeneity 161 8.2 Issues arising from different UV methodologies 166 8.3 Comparison of B124 phages UV-C inactivation 170
kinetics to those of other microorganisms 8.4 Comparison of B124 phage UV-B inactivation 175
kinetics to those of microorganisms 8.5 The use of Collimated Beam experiments to 177
inform QMST and QMRA studies 8.6 Conclusions 186 8.7 Recommendations for future work 188 References 191 – 226 Appendix I – Inactivation data reported in the literature 227 – 237

v
LIST OF TABLES Page Table 1.1 Pathogens associated with waterborne disease 6 - 7
and illness
Table 1.2 Typical pathogen and index organism concentrations 12 in untreated municipal wastewater
Table 1.3 Classification of MST methods 18 Table 2.1 Classification and selected properties of phages 23 Table 2.2 Constant dimensions in Caudovirales 27 Table 2.3 Selected Bacteroides phages found in the literature 46 Table 2.4 Isolation of Bacteroides phages using twelve Bacteroides 49
host strains Table 2.5 HSP-40 phage densities in a range of environments 50 Table 2.6 HSP-40 and RYC-2056 phage densities in urban 54
wastewater samples in a variety of countries Table 2.7 Mean levels of phages in three types of French water 56 Table 2.8 Genetic characteristics of GB-124 58 Table 2.9 Levels of phages infecting GB-124 in WwTW final 59
effluent Table 2.10 Levels of phages detected from various reference 61
sources by RYC-2056 and GB-124 Table 3.1 Typical operational characteristics for UV lamps used 67
in WwTW Table 3.2 Low pressure UV-C irradiation methods reported in 74 - 75
the literature Table 3.3 Low pressure UV-B irradiation methods presented in 75
the literature Table 3.4 Inactivation of microorganisms by low pressure UV-B 79
radiation Table 3.5 The LT2ESWTR dose requirements in mJ/cm2 80

vi
Table 3.6 UV-B fluences measured at different depths through 85 the water column at King George Island, Antarctica
Table 5.1 Titres and plaque size of B124 phages during isolation 116
process
Table 5.2 Morphological characteristics of B124 bacteriophages 122 Table 5.3 Host range of B124 phages using HSP-40 and RYC-2056 127 Table 6.1 Pearson product-moment correlation values for log10 129
PFU/100μl and UV-C fluence during Phase One experiments
Table 6.2 Fluence required using UV-C for each log10 reduction 136
of phage specimens during Phase One experiments Table 6.3 Identification of phage groups based on SD of k (UV-C) 136
during Phase One experiments Table 6.4 Identification of phage groups based on SD of 4-log10 138
reduction value (UV-C) during Phase One experiments Table 6.5 Pearson product-moment correlation values for log10 139
PFU/100μl and UV-B fluence during Phase One experiments
Table 6.6 Fluence required using UV-B for each log10 reduction of 145
phage specimens during Phase One experiments Table 6.7 Identification of phage groups based on SD of k (UV-B) 145
during Phase One experiments Table 6.8 Identification of phage groups based on SD of 4-log10 146
reduction value (UV-B) during Phase One experiments Table 7.1 Pearson product-moment correlation values for log10 150
PFU/100μl and UV-C during Phase Two experiments Table 7.2 Fluence required for each log10 reduction of phage 152
specimens during Phase Two UV-C irradiation Table 7.3 Identification of phage groups based on SD of k (UV-C) 152
during Phase Two experiments Table 7.4 Identification of phage groups based on SD of 4-log10 153
reduction value (UV-C) during Phase Two experiments Table 7.5 Pearson product-moment correlation values for log10 154
PFU/100μl and UV-B during Phase Two experiments

vii
Table 7.6 Fluence required for each log10 reduction of phage 156 specimens during Phase Two UV-B irradiation
Table 7.7 Identification of phage groups based on SD of k (UV-C) 156
during Phase Two experiments Table 7.8 Identification of phage groups based on SD of 4-log10 157
reduction value (UV-B) during Phase Two experiments Table 7.9 Relationship between k for phage specimens during 158
UV-B and UV-C irradiation during Phase Two experiments
Table 7.10 Relationship between 4-log10 reduction fluence for phage 159
specimens during UV-B and UV-C irradiation during Phase Two experiments
Table 7.11 Comparison of Phase One (P1) and Phase Two (P2) 160
4-log10 reduction fluences Table 8.1 Phages and viruses with similar UV-C inactivation 172
kinetics to B124 phages Table 8.2 Exposure times for target fluences using UV-B fluence 181
rate values detailed in the literature

viii
LIST OF FIGURES Page Figure 1.1 Water-related environmental routes by which infectious 10
agents are transmitted to susceptible individuals Figure 2.1 Major phage groups organised by nature of genetic 24
material Figure 2.2 Components of phages belonging to the Caudovirale 27
order Figure 2.3 TEM of B. fragilis phage ATCC 51466 showing both 28
kinked and straight tailed virions Figure 2.4 Tail variation of somatic coliphages isolated from 29
municipal wastewater Figure 2.5 Levels of GB-124 phages, SC, FC and enterococci in 60
a range of samples Figure 3.1 Formation of thymine cyclobutane dimers 69 Figure 3.2 UV-B fluence rate recorded in Seoul, South Korea during 83
a sunny February day Figure 4.1 Examples of bench scale devices for conducting UV 100
experiments Figure 4.2 Electrical diagram of custom-built UV box 101 Figure 4.3 UV box exterior and interior 102 Figure 4.4 UV bulb arrangement 102 Figure 4.5 Lamps and switches on UV box 103 Figure 4.6 Spectral output of UV-C and UV-B bulbs 104 Figure 4.7 UV-B bulb fluence rate, compartment temperature and 106
bulb compartment temperature during preliminary experiment
Figure 4.8 UV-C bulb fluence rate, compartment temperature and 107
bulb compartment temperature during preliminary experiment
Figure 5.1 Example of plaques caused by phage infecting 117
GB-124 present in municipal wastewater

ix
Figure 5.2 Positively stained B124-1 siphovirus showing ‘curly’ 120 tail and straight tail
Figure 5.3 Positively stained B124-3 siphovirus showing ‘curved’ 120
tail and ‘kinked’ tail Figure 5.4 Negatively stained B124-12 siphovirus showing ‘curved’ 121
tail and straight tail Figure 5.5 B124-17 straight-tailed siphovirus showing negative 121
staining and positive staining Figure 5.6 Phage B124-21 with head damage/shrinkage, and 123
showing long wavy tail Figure 5.7 Phage B124-22 with head damage and disassociated 124
tails and false Podoviridae B124-57 Figure 6.1 Dose-response curves of B124-1, B124-2, B124-3, 131
B124-4 and B124-10 phages during Phase One UV-C inactivation experiments
Figure 6.2 Dose-response curves of B124-12, B124-14, B124-17, 132
B124-20 and B124-21 phages during Phase One UV-C inactivation experiments
Figure 6.3 Dose-response curves of B124-22, B124-25, B124-26, 133
B124-29 and B124-30 phages during Phase One UV-C inactivation experiments
Figure 6.4 Dose-response curves of B124-31, B124-35, B124-45, 134
B124-54 and B124-57 phages during Phase One UV-C inactivation experiments
Figure 6.5 Dose-response curves of B124-1, B124-2, B124-3, 141
B124-4 and B124-10 phages during Phase One UV-B inactivation experiments
Figure 6.6 Dose-response curves of B124-12, B124-14, B124-17, 142
B124-20 and B124-21 phages during Phase One UV-B inactivation experiments
Figure 6.7 Dose-response curves of B124-22, B124-25, B124-26, 143
B124-29 and B124-30 phages during Phase One UV-B inactivation experiments
Figure 6.8 Dose-response curves of B124-31, B124-35, B124-45, 144
B124-54 and B124-57 phages during Phase One UV-B inactivation experiments
Figure 6.9 Relationship between 4-log10 reduction B124-phage 147

x
fluence requirements for UV-B and UV-C radiation during Phase One experiments
Figure 7.1 Dose-response curves of phages B124-1, B124-10, 151
B124-12, B124-21, B124-29 B124- 35 and B124-54 during Phase Two UV-C inactivation experiments
Figure 7.2 Dose-response curves of phages B124-1, B124-10, 155
B124-12, B124-21, B124-29 B124- 35 and B124-54 during Phase Two UV-B inactivation experiments
Figure 7.3 Relationship between UV-C and UV-B fluences 159
required for log10 reduction in B124 phage titres

xi
ACKNOWLEDGEMENTS In no particular order, I’d like to acknowledge the assistance of many people who helped and supported me throughout this PhD. Firstly, Dr M. Muniesa (University of Barcelona, Spain) for advice and providing Bacteroides strain HSP-40, Mr Ian Mayor-Smith (Southern Water, UK) for access to wastewater treatment works and information regarding UV disinfection practices, Professor J.R. Bolton (Bolton Photosciences) for providing the UVCalc spreadsheet, statistical assistance and advice regarding collimated beam apparatus, Dr W.A.M. Hijnen (Kiwa Water Research, The Netherlands) for advice regarding statistical interpretation of UV fluence data, Dr Julian Thorpe (Sussex University, UK) for assistance with the Transmission Electron Microscopy and Mrs Cinzia Dedi (University of Brighton, UK) for helping with numerous pieces of equipment, and Mr Konrad Günter for electrical assistance when building the UV irradiation apparatus. I’d like to acknowledge other members of the Environment and Public Health Research Unit, Miss Sarah Purnell, Mr Diogo Trajano, Mrs Lakshmi Yaliwal, Dr Jon Caplin, Dr Daniel Nnane and Mrs Christine Sinclair for their help and advice. Special thanks must be given to my supervisors, Dr H.D. Taylor and Dr J.E. Ebdon (both University of Brighton, UK), who provided invaluable guidance and advice throughout the project, and Professor Callum Firth (University of Brighton, UK) who helped fund the project. Finally, I’d like to thank Annina Diston and my parents Margaret and William W. Diston for all their support and encouragement over the last three years.

xii
DECLARATION I declare that the research contained in this thesis, unless otherwise formally indicated within the text, is the original work of the author. The thesis has not been previously submitted to this or any other university for a degree, and does not incorporate any material already submitted for a degree. Signed........................................ Dated..........................................

1
CHAPTER ONE
1. INTRODUCTION
1.1 Aim
The aim of the following study was to fill critical knowledge gaps regarding the
use of bacterial viruses (bacteriophages or phages) as indicators of human faecal
material within aquatic systems. A recently isolated Bacteroides strain (GB-124)
has been shown to detect phages exclusively in human faecal material, and in
waters subject to human faecal contamination, but no research has been
undertaken into the ecology, or homogeneity of the phage group. If phages
infecting GB-124 are to be used within Microbial Source Tracking (MST) studies,
in Quantitative Microbial Risk Assessment (QMRA), or as surrogate organisms of
selected pathogens, their behaviour within waterbodies and throughout wastewater
treatment should be assessed. This study elucidates the morphology and ecology
of phages infecting GB-124 and describes their inactivation characteristics during
UV-B (representing the primary germicidal portion of sunlight) and UV-C
radiation (a common tertiary disinfection stage in wastewater treatment).
This introductory chapter describes the risks associated with microbially-
contaminated drinking and recreational waters, and some of the dominant pathogens
responsible for the global water-related disease burden. This is followed by an
overview of the concept of MST and the role that it can play in waterborne disease
hazard management.

2
1.2 Waterborne disease burden
This study was undertaken in the context of global efforts to increase provision of
improved drinking water supply, especially in less economically developed countries
(LEDC). Provision of drinking water containing levels of pathogenic microorganisms
low enough to avoid infectious disease, is an essential requirement for human
wellbeing. Moreover, access to a secure, clean drinking water source is widely
considered to be a basic human right (WHO, 2003a). Through bathing, drinking, and
other domestic uses, water is a highly effective vehicle by which human populations
can be exposed to disease causing pathogens. Approximately 1.8 million fatalities (90
% of which are among under 5 year olds in developing countries) per annum are
caused by diarrhoeal diseases. 88 % of these fatalities are thought to be caused by
inadequate sanitation, poor hygiene and unsafe water (Anon, 2008a).
Although harder to quantify, the economic impacts of poor water quality are also
considerable; it has been estimated (Given et al., 2006) that US $21 to $51 million is
lost annually in southern California as a result of swimming-related gastroenteritis
resulting from exposure to (faecally) contaminated waters.
At the United Nations Millennium Summit in 2000, the UN set eight Millennium
Development Goals (MDG) to be achieved by 2015. Two of these relate directly to
health impacts of poor water quality, and others are considered to be related
indirectly. Goal Four aims to reduce child mortality by two thirds (deaths are mainly
attributed to water-related illness) and Goal Seven aims to reduce the number of
people without access to safe drinking water by 50% from 2000 levels. Adoption of
these goals reflects the emphasis placed on human illness and disease related to, or

3
associated with, water of poor microbial quality.
There is great disparity in the quality of drinking and recreational waters between
LEDC and more economically development countries (MEDC). Illness resulting from
ingestion of waterborne pathogens (primarily bacterial, protozoan and viral) in MEDC
was dramatically reduced during the 20th Century, mainly as a result of chlorination of
drinking water and advances in wastewater treatment (Perceval et al., 2004).
However, in LEDC, drinking water disinfection is not as widespread, delivery
systems are not as intensively maintained, and wastewater treatment is poor or absent
(especially in rural areas). By 2050, it is estimated that the global population will be
8.9 billion, with population decreases in MEDC and population increases in LEDC
(Anon, 2004a). Poorly funded, and less well-organised water infrastructures in LEDC
are likely to come under greater pressure, putting many more lives at risk.
Outbreaks of disease from drinking water in MEDC have been reported (Short, 1988;
Stanwell-Smith, 1994), as have outbreaks resulting from the use of recreational waters
(Sellwood and Dadswell, 1991; Palmateer et al., 1991; Fleisher, et al., 1996), but the
latter are more difficult to substantiate, with freshwater usage being more closely
linked to viral outbreaks than seawater (Percival et al., 2004). Infections resulting
from contaminated drinking water include Shigella spp., Campylobacter spp., and
those resulting from recreational water use include Pseudomonas spp., and Legionella
spp. (Moe 1997). Contaminated shellfish may also cause subsequent infection in
humans (Scoging, 1991).

4
Estimates of waterborne disease outbreaks in MEDC are often contested: in the US, it
has been estimated that 7,100,000 people (range 400, 000 to 27, 000, 000) annually
contract mild infections, whilst 560,000 (520,000 to 690,000) contract moderate to
severe infections with an annual mortality of 1200 (Morris and Levin, 1995). Other
estimates include 627,800 to 1,479,200 people annually contracting gastroenteritis at
beaches in Los Angeles (USA; Given et al., 2006)). The wide range shown for each of
these two figures indicates the difficulty of accurate estimation. However, what is
apparent is that water-borne diseases represent a significant burden on health and a
barrier to economic growth and development.

5
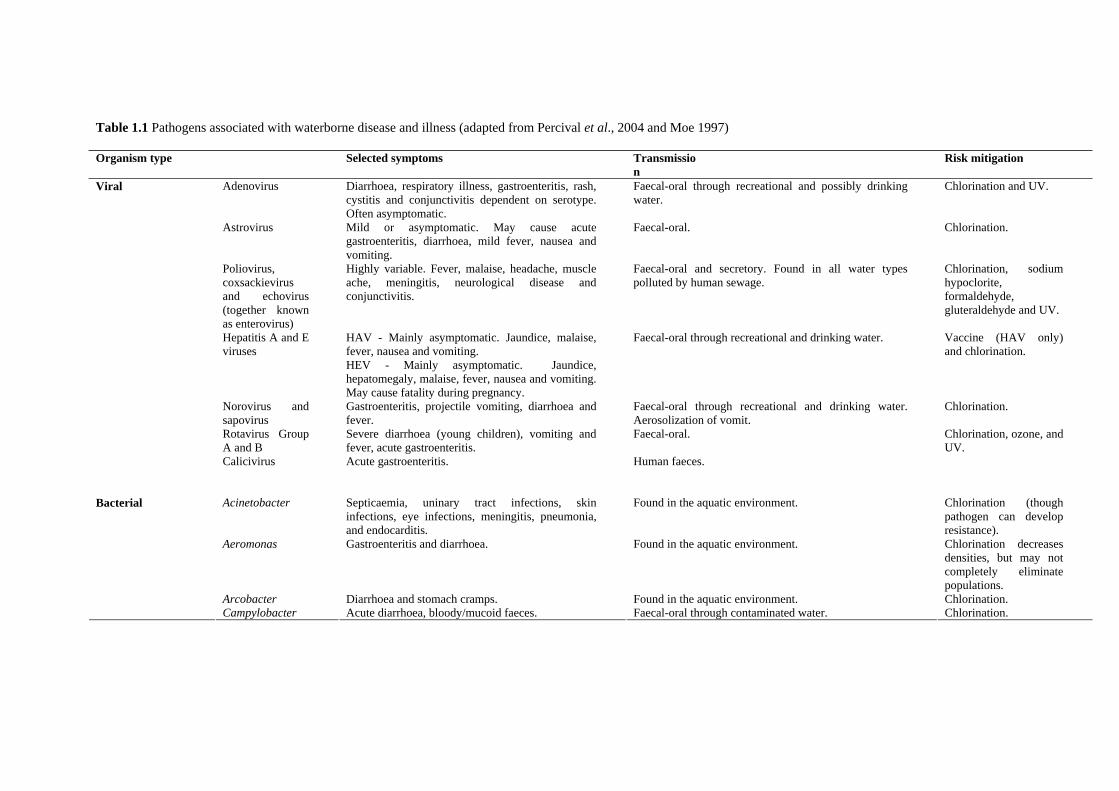
1.3 Waterborne pathogens
In poorly treated wastewaters, and waters used for drinking and recreation, there may
be present a wide variety of pathogenic organisms capable of causing infectious
disease (Table 1.1) and it is estimated there may be more than 100 different types of
pathogenic viruses in waterbodies polluted by human faecal material (Melnick and
Gerba, 1980; Havelaar et al., 1993; Leclerc et al., 2000). Providing they are not
inactivated, pathogens shed by infected persons during bathing, bowel movements or
the washing of soiled bed sheets and clothing (Moe, 1997), may be transported
through surface and sub-surface aquatic systems until they come into contact with a
new host.
Waterborne infections are those caused by ingestion of faecally contaminated water,
physical contact with faecally contaminated water (through bathing or other water-
based activity) or consumption of food that has been exposed to faecally contaminated
water (Hurst, 1997). In MEDC, secondary treatment of wastewater will not inactivate
or completely remove viruses, but as shown in Table 1.1, chlorination is an effective
means of disinfection. As a result of poor water treatment infrastructure and reduced
disinfection of drinking water, pathogens may be present in significant numbers in
both drinking and recreational waters in LEDC. Rural areas in LEDC may not be
connected to the mains water network and access to safe, clean water may be limited.
Such water scarcity may bring unsuitable water resources into use.
6
Table 1.1 Pathogens associated with waterborne disease and illness (adapted from Percival et al., 2004 and Moe 1997)
Organism type
Selected symptoms Transmission
Risk mitigation
Adenovirus Diarrhoea, respiratory illness, gastroenteritis, rash, cystitis and conjunctivitis dependent on serotype. Often asymptomatic.
Faecal-oral through recreational and possibly drinking water.
Chlorination and UV.
Astrovirus Mild or asymptomatic. May cause acute gastroenteritis, diarrhoea, mild fever, nausea and vomiting.
Faecal-oral. Chlorination.
Poliovirus, coxsackievirus and echovirus (together known as enterovirus)
Highly variable. Fever, malaise, headache, muscle ache, meningitis, neurological disease and conjunctivitis.
Faecal-oral and secretory. Found in all water types polluted by human sewage.
Chlorination, sodium hypoclorite, formaldehyde, gluteraldehyde and UV.
Hepatitis A and E viruses
HAV - Mainly asymptomatic. Jaundice, malaise, fever, nausea and vomiting. HEV - Mainly asymptomatic. Jaundice, hepatomegaly, malaise, fever, nausea and vomiting. May cause fatality during pregnancy.
Faecal-oral through recreational and drinking water. Vaccine (HAV only) and chlorination.
Norovirus and sapovirus
Gastroenteritis, projectile vomiting, diarrhoea and fever.
Faecal-oral through recreational and drinking water. Aerosolization of vomit.
Chlorination.
Rotavirus Group A and B
Severe diarrhoea (young children), vomiting and fever, acute gastroenteritis.
Faecal-oral. Chlorination, ozone, and UV.
Viral
Calicivirus
Acute gastroenteritis. Human faeces.
Acinetobacter Septicaemia, uninary tract infections, skin infections, eye infections, meningitis, pneumonia, and endocarditis.
Found in the aquatic environment. Chlorination (though pathogen can develop resistance).
Aeromonas Gastroenteritis and diarrhoea. Found in the aquatic environment. Chlorination decreases densities, but may not completely eliminate populations.
Arcobacter Diarrhoea and stomach cramps. Found in the aquatic environment. Chlorination.
Bacterial Campylobacter Acute diarrhoea, bloody/mucoid faeces. Faecal-oral through contaminated water. Chlorination.

7
Table 1.1 (cont.) Pathogens associated with waterborne disease and illness (adapted from Percival et al., 2004 and Moe 1997)
Organism type
Selected symptoms Transmission Risk mitigation
Cyanobacteria Dermatitis, gastroenteritis, and toxins produced may cause death although this has not been reported.
Found in the aquatic environment, especially eutrophic lakes. Prevention by reducing nutrients is best action.
Escherichia coli Diarrhoea, dysentery, meningitis, and in some cases acute kidney failure and death.
Contaminated water. Chlorination and other disinfectants.
Helicobacter pylori Mostly asymptomatic, but may lead to peptic ulcer disease and gastric cancer.
Thought to be contaminated drinking water. Not known.
Legionella spp. Pontiac fever and Legionnaires disease. Found in the aquatic environment. Heat and chlorine. The Mycobacterium avium complex
Pulmonary disease and cervical lymphadentis. Found in the aquatic environment. Chlorination.
Salmonella spp. Gastroenteritis, enteric fever and septicaemia. Faecally contaminated water. Chlorination.
Shigella spp. Dysentery, fever and malaise. Faecal-Oral. Chlorination. Vibrio cholerae Asymptomatic to deadly. Vomiting and
diarrhoea. Found in surface and drinking water where disease is endemic. Chlorination.
Bacteria (cont.)
Yersina spp.
Gastroenteritis, fever and diarrhoea. Faecal-Oral. Chlorination.
Acanthamoeba spp. Fatal granulomatous and eye infections. Present in the aquatic environment. Not known. Balantidium coli Usually asymptomatic, diarrhoea, nausea and
dysentery. Feacal-Oral. Boiling.
Cryptosporidium spp. Diarrhoea, abdominal pain, fever, nausea and vomiting.
Present in the aquatic environment. Ozone and UV.
Cyclospora cayeyanensis Explosive diarrhoea, nausea, vomiting, cramps and fatigue.
Present in wastewater. Coagulation and filtration during water treatment.
Entamoeba histolytica May be asymptomatic. Fever, dysentery, diarrhoea.
Faecally contaminated water. Hyperchlorination and iodination.
Protozoan
Giardia duodenalis May be asymptomatic. Nausea, malaise, diarrhoea and vomiting.
Faecal-oral through contaminated drinking/recreational waters. Chemical disinfectants.

8
The number of organisms required to cause illness (termed the infectious dose) varies
between pathogens. The infectious dose also varies from person to person, depending
on the individual’s immune response and general health. Viruses and protozoa
generally have low infectious doses: often, fewer than fifty infectious units, oocysts,
cysts or plaque forming units (Moe, 1997) are required to cause illness. For some
enteric viruses, the infectious dose may be as low as one plaque forming unit
(Percival et al., 2004). In terms of microbial water quality, this low infectious dose
and environmental persistence makes them of great concern; as any waterborne virion
is a potential hazard (Berg, 1967). For other enteric bacterial pathogens, infectious
doses of 102 to 108 CFU/ml have been reported (Moe, 1997).
The consequences of infection by waterborne pathogens range from asymptomatic to
fatal (Table 1.1). Mild to severe gastroenteritis is common, as are skin and other
infections, diarrhoea (leading to dehydration), and conjunctivitis. Rotavirus infection
(via faeco-oral route) is the most common cause of gastroenteritis worldwide
(Parashar et al., 1998; Oh et al., 2003). Although the majority of water-related disease
outbreaks are minor, some waterborne pathogens are deadly; enteric adenoviruses
(serotypes 40 and 41) kill 50% of immuno-compromised individuals infected, whilst
hepatitis E virus (HEV) has been reported as having a high mortality rate (around
30%) in pregnant women in LEDC (Hunter, 1997). Quantification of water-related
illness is a problem in both MEDC and LEDC. Moreover, it is likely that the majority
of waterborne disease outbreaks are not reported. As a result, it is often difficult to
directly relate illness and water exposure, and targeted epidemiological studies are
often needed in order to do so.

9
1.4 Pollution source and routes of transmission
The source and transmission routes of waterborne pathogens vary greatly. The main
route of infection is faecal-oral (Percival et al., 2004), though as Figure 1.1 illustrates,
the route from shedder to susceptible host may be highly complex. Pathogens may be
transmitted by human-to-human contact (e.g., contact with faecally contaminated
hands), ingesting food contaminated by either faeces or faecally contaminated water,
or faecally contaminated fomites. However, the most important pathway with regards
to this study is human reservoir → wastewater → surface water → domestic
use/recreation → new human host. Amongst numerous other factors, the rate and
success of faeco-oral transmission depends on the number of shedders in a catchment
(determines density of pathogens in water), infectious dose required to initiate illness
and exposure to the contaminated water source. These data help in the formulation of
Quantitative Microbial Risk Assessments (discussed further in Section 2.4).
Faecal material within waterbodies close to human settlements is primarily derived
from two sources, point source [PS; e.g., wastewater treatment works (WwTW)
effluents – mostly human origin and usually attributable to a single outlet] or diffuse
source (DS; e.g., field runoff – livestock origin, tending to be a composite of
numerous smaller inputs dispersed over a greater area). Contamination of recreational
and resource waters by human or animal faecal material may promote the
transmission of bacterial, protozoan and viral pathogens, with human and animal
faecal material presenting different health risks to water users (Jofre et al., 1986;
Araujo et al., 1997a, 1997b).

10
Figure 1.1 Water-related environmental routes by which infectious agents are transmitted to susceptible individuals (Hurst, 1997)
Animal pathogen reservoirs
Human pathogen reservoirs
Wastewater
Ground waterLand surfaceSurface water
Domestic use
Recreation Shellfish Aerosols Crops Domestic use
Aerosols
New human host

11
Human faecal pollution is associated with human-specific pathogens such as Shigella
spp., Salmonella, hepatitis, poliovirus, adenovirus, reovirus, norovirus and rotaviruses
(Knott, 1981; Scott et al., 2002; Field et al., 2003). Animal faecal material is
associated with Salmonella spp., Escherichia coli (notably O157:H7),
Cryptosporidium parvum, and Giardia lamblia (Field et al., 2003). Viruses are
usually host-specific and the primary source of viruses capable of infecting humans is
human faeces (IAWPRC, 1991; Field and Samadpour, 2007). The risk of pathogen
transference from diffuse animal sources to human hosts (zoonotic infections) is
thought to be low. Where insufficiently treated, or even untreated, WwTW effluents
are discharged into water systems, the potential for infection of downstream users by
pathogens is evident (typical pathogens present in untreated municipal wasters are
presented in Table 1.2).
The ratio between PS and DS varies both spatially and temporally within, and
between, river catchments. Factors such as topography, land-use, hydrology and
population density all influence the PS:DS ratio. Pathogen load of both PS and DS
microbial pollution varies geographically, annually and seasonally depending on
number of infected individuals contributing to the sewage. Viruses are usually found
in lower densities than bacteria (Percival et al., 2004), but as they have a lower
infectious dose, fewer organisms are required to initiate infection. Aside from
microbial health risks, both DS and PS pollution can promote eutrophication of
receiving waterbodies, often leading to decreases in water quality and loss of floral
and faunal biodiversity.

12
Table 1.2 Typical pathogen and index organism concentrations in untreated municipal wastewater (adapted from WHO, 2003b; Percival et al., 2004; da Silva et al., 2007; Villar et al., 2007)
Pathogen Disease/role Numbers per 100 ml (PFU/cfu/genome copies)
Campylobacter spp. Gastroenteritis 1 x 10⁴ – 1 x 10⁵ Clostridium perfringens spores
Index organism 6 x 10⁴ to 8 x 10⁴
Escherichia coli Index organism (except specific strains)
1 x 10⁶ to 1 x 10⁷
Faecal streptococci/intestinal enterococci
Index organism 4.7 x 10³ to 4 x 10⁵
Salmonella spp. Gastroenteritis 0.2 to 8 x 10³
Bacteria
Shigella spp. Bacillary dysentery
0.1 to 1 x 10³
HAV Mainly asymptomatic. Jaundice, malaise, fever, nausea and vomiting.
Present in 92% wastewater samples (Real-time PCR; n = 50). No quantitative data available.
Viruses
Norovirus Gastroenteritis, projectile vomiting, diarrhoea and fever.
Genotype 1 = 6 × 10⁵ Genotype 2 = 3 × 10⁵
Polioviruses Index organism (vaccine strains), poliomyelitis
1.80 x 10² to 5 x 10⁵
Rotaviruses Diarrhoea, vomiting
4 x 10² to 8.5 x 10⁴
Cryptosporidium parvum oocysts
Diarrhoea 0.1 to 3.9 x 101
Entamoeba histolytica
Amoebic dysentery
0.4
Parasitic protozoa
Giardia lamblia cysts Diarrhoea 1.25 x 101 to 2 x 10⁴
Ascaris spp. Ascariasis 0.5 to 1.1 x 101
Ancylostoma spp. and Necator sp.
Anaemia 0.6 to 1.9 x 101 Helminths
Trichuris spp. Diarrhoea 1 to 4

13
Numerous methods of reducing pollution from both PS and DS pollution are currently
carried out in the UK. Methods to minimise impacts of diffuse pollution include run-
off strips and field edge buffer (riparian) zones reducing the amount of faecal material
deposited directly into waterbodies. Methods to minimise impact of PS pollution tend
to be more stringent, and often result from EU Directives being transposed into UK
law.
The EU Directives that are most relevant to this study are:
- The Urban Wastewater Treatment Directive (91/271/EEC; UWWTD)
The UWWTD requires the introduction of secondary biological treatment at WwTW
greater than 10,000 population equivalent (p.e.) and also the introduction of tertiary
nutrient removal at WwTW greater than 10,000 p.e. discharging into designated
Sensitive Areas. Two hundred and fifty million pounds were allocated to the
installation of such schemes during Asset Management Planning Stage 3 (AMP3),
which ran from 2000-2005 (Water UK website, 2007). Although not all tertiary
treatment methods are specifically aimed at reducing pathogen levels in wastewater
(e.g., phosphate nutrient stripping), tertiary treatment (such as UV disinfection) may
inactivate or remove pathogens rendering them ineffective; and
- The Water Framework Directive (2000/60/EC; WFD)
The adoption of the EU Water Framework Directive (WFD: 2000/60/EC) in October
2000, incorporates many existing directives, streamlining legislation and increasing
management efficiency. Prescriptions outlined in the UWWTD are still applicable to
UK waterbodies, whilst new objectives have been incorporated. The WFD is based
around River Basin Management Plans (RBMP) aiming to protect all waterbodies in
the basin from pollution and degradation. MST may prove a useful tool in identifying

14
sources of contamination, allowing effective remediation methods to be implemented
whilst aiding ‘good ecological status’.
The UK water industry spends significant amounts of money on capital projects, such
as the introduction of further WwTW process stages, to improve the quality of UK
water. Spending during the last five year management period (2005 to 2010) was
projected to be £3.6 billion (OFWAT, 2008).
Resulting from the transposition of EU Directives into national law, disinfection of
final wastewater effluents using ultraviolet radiation is becoming increasingly
common in Europe. This is also the case in the US. The efficiency and effectiveness
of using UV as a disinfectant is discussed in further detail in Chapter Three. In
LEDC, environmental legislation is not as well-developed, especially at river basin
scale, and this may result in less, or inadequate, control over faecal pollution of
waterbodies and increased risk to downstream users.

15
1.5 Risk, mitigation and traditional microbial source tracking methods
As pathogens are generally host-specific (Sinton et al., 1998; Percival et al., 2004), in
order to assess and manage risk to human populations, it is necessary to distinguish
accurately the source of faecal material (Jagals, 1995; Scott et al., 2002; Field et al.,
2003; Gerba, 2006). Accurate identification of faecal pollution allows the
implementation of targeted remediation strategies, benefitting both the water user and
the taxpayer by an efficient allocation of resources.
Detection of the wide variety of viral and bacterial pathogens shown in Tables 1.1
and 1.2, is time-consuming, expensive, and in some cases unachievable in all but
highly specialised laboratories, so indicator organisms of human or animal faecal
material are often employed, highlighting the potential presence of viral and bacterial
pathogens (Wyn-Jones and Sellwood, 2001). MST involves the use of chemical,
phenotypic, genotypic or microbiological methods to define the origin of faecal
material (Scott et al., 2002). Rather than attempt to monitor the levels of all
waterborne pathogens, it is more cost-effective to monitor a number of selected non-
pathogenic surrogate organisms, referred to as faecal indicator organisms (FIO).
When FIO are detected in water samples, it may be assumed pathogenic organisms
may also be present. FIO are shed in high numbers by the majority of individuals,
and are continually present in pooled faecal material. Pathogens are only shed by
infected individuals and will be present at lower levels in pooled sewage. No ‘perfect’
indicator organism has been found to indicate the presence of all pathogens in all
environments, but a number have shown great promise. MST using indicator
organisms may prove particularly useful in highlighting sources of long-term

16
pollution, but less useful when identifying isolated short-term sporadic waterborne
disease events.
MST methods are based on the assumption that there is a characteristic within target
faeces (e.g., phages, bacteria etc.) that indisputably identifies it as belonging to a
particular host, which, after excretion, is detectable in water (Field and Samadpour,
2007). The ideal indicator of faecal material should have numerous qualities,
including, but not limited to:
- presence in host faeces only;
- inability to replicate in natural waters;
- possession of a simple, reliable, rapid and inexpensive assay method, not
requiring the culturing of isolates;
- not requiring a large reference strain library; and
- simple methods of sample collection and storage.
(Borrego et al., 1987; Havelaar, 1993; Field et al., 2003).
If the indicator employed is to be used as a surrogate of enteroviruses, rather than a
general indicator of human or animal faecal pollution, it must possess additional
qualities:
- have similar replication/inactivation kinetics to enteroviruses, particularly
during wastewater treatment; and
- be present in greater numbers than enteroviruses in faecally polluted
waters;
(Borrego et al., 1987; Havelaar, 1993)

17
In order to be an effective surrogate organism, consistent ecological behaviour and
response to environmental pressures should be demonstrated. For bacteriophage
based MST, this means host bacteria should detect a homogeneous phage group.
One of the first studies that may be interpreted as using MST was carried out in 1905
(Gordon, 1905). This study examined differential fermentation characteristics of
streptococci isolated from human and animal (cow and horse) faeces. Streptococci
isolated from human faeces fermented mannitol and not raffinose, whilst the inverse
was observed for streptococci isolated from animal faeces. Since this pioneering
study, numerous MST methods have been developed (Table 1.3).
Using faecal indicator bacteria (FIB) as diagnostic agents of faecal material source is
a well established technique for assessing potential health risks of a waterbody. FIB
used in MST studies include faecal coliforms, total coliforms, Escherichia coli, faecal
streptococci, Clostridium perfringens and enterococci (Fujioka, 2002). However, FIB
may not accurately reflect the environmental behaviour of enteric pathogens (Jofre et
al., 1986; Gerba, 2006), especially human enteric viruses (Berg et al., 1973). For
example, faecal coliforms are unsuitable indicators of faecal pollution because of low
survival rates in challenging environments and interference by microbial flora such as
Proteus, Bacillus, Sarcina, Pseudomonas, Micrococcus, Flavobacterium,
Actinomyces and selected yeasts (Geldreich and Clarke, 1971).
Using streptococci in MST studies is also problematic; certain species such as
Streptococcus bovis, S. equinus, and S. avium are unable to survive for long once
expelled from animals (Borrego et al., 1990).

18
Table 1.3 Classification of MST methods (Cimenti et al., 2007)
Type Examples Pathogen monitoring
Human enteric viruses (enterovirus, adenovirus, Norovirus virus) Eggs of helminths (intestinal worms)
Culture Faecal coliforms/faecal streptococci (FC-FS ratio) Faecal streptococci species identification FC-FS ratio shift Bifidobacteria spp. (sorbitol-fermenting Bifidobacteria) Rhodococcus coprophilus Bacteroides spp. Pseudomonas aeruginosa Phages of Bacteroides fragilis F-RNA phage subgroup Streptococcus bovis
Phenotypic Antibiotic resistance analysis (ARA) or multiple antibiotics resistance analysis (MAR) Serogrouping Carbon utilisation profile
Genetic Ribotyping Amplified fragment length polymorphism (AFLP) Pulse-field gel electrophoresis (PFGE) Repetitive PCR (rep-PCR) Denaturating gradient gel electrophoresis (DGGE) Host-specific molecular markers (LH-PCR; T-RFLP)
Chemical Faecal stanols Fluorescent whitening agents Sodium tripolyphosphate Long-chain alkylbenzenes Caffeine Musk fragrances Estrogens Human pharmaceuticals Animal growth promoters
Berg et al (1973) showed that although more than 99.99 % of faecal coliforms, total
coliforms and faecal streptococci were routinely destroyed during wastewater
treatment (using chlorination), removal rates of unspecified enteroviruses was
between 89 to 99 %. Salmonella has also been shown to have lower inactivation rates

19
than faecal coliforms (Borrego et al., 1990). Such situations may lead to inaccurate
assessments of microbial quality of waterbodies, resulting in an underestimation of
risk to water users. Indeed, there have been recorded enteroviral epidemics in
waterbodies judged safe by FIB enumeration (Geldreich, 1978; Borrego et al., 1987),
indicating their failings as diagnostic health protection tools.
It has been demonstrated that enteroviruses are able to survive for long periods in
natural waters (Akin et al., 1975), thus any substitute indicator must possess similar,
or greater persistence.
Other drawbacks of FIB include water column multiplication (Solo-Gabriele et al.,
2000), non-faecal sources (Scott et al., 2002) and lack of human/animal
discriminatory power (Field et al., 2003); it is evident that FIB alone are unable to
determine source of pollution (Jofre et al., 1986).
In conjunction with FIB, other methods have been proposed (Table 1.3). Antibiotic
resistance patterns of faecal coliforms and streptococci have been used; however these
methods require large numbers of isolates, tending to be both time consuming and
labour intensive. There is also uncertainty regarding the accuracy of these techniques
(Field et al., 2003; Field and Samadpour, 2007). Culture independent techniques are
becoming more widespread in MST (Santo Domingo et al., 2007). These include
using PCR to detect Bacteroides specific 16S marker sequences (Bernhard and Field,
2000), Bifidobacterium spp., or Clostridium perfringens (Savichtcheva and Okabe,
2007), and other DNA fingerprinting methods (Field and Samadpour, 2007).

20
Molecular methods of identifying faecal material are developing continuously (Field
and Samadpour, 2007; Field et al., 2003; Meays et al., 2004; Santo Domingo et al.,
2007), but the high level of expertise required and specialised laboratory equipment
needed prohibit their use in many situations. Moreover, methods based on the
detection of nucleic acids are of higher cost than most culture base indicators, and
may produce false-negative/false positive results (Sobsey et al., 1998). As sensitivity
of molecular techniques improves, these ‘false’ results may be reduced.
Using phages as indicators of human faecal material, and potentially surrogates for
particular pathogens, is a rapid and inexpensive way of determining source of faecal
material, applicable in all but the most basic laboratories, by operators with basic
training. The introduction of international standard methods for three phage types
(Anon, 2001a, b and c) has provided clear protocols allowing comparison of data
obtained in different studies, and has improved the quality of phage based MST
studies. The following chapter provides information on phage biology and the
development of their use as indicators of human specific pollution, addressing some
of the problems outlined above regarding ‘traditional’ FIO.

21
CHAPTER TWO
2. Bacteriophage characteristics and their use in MST and
QMRA studies
2.1 General characteristics of phages
Phages are parasitic supramolecular viruses (Wurtz, 1992) capable of infecting
prokaryotic organisms (Ackermann and DuBow, 1987a). Thought to be the most
abundant organism on earth (possibly 1030 to 1032 in total), phages play a pivotal role
in regulating both microbial and higher ecosystems (Kutter and Sulakvelidze, 2005).
Phages were independently discovered twice, in quick succession, by Frederick W.
Twort and Felix d’Hérelle working independently, in 1915 and 1917, respectively
(Twort, 1915; d’Hérelle, 1917); Twort observed the glassy transformation of
“Micrococcus” colonies, which he proposed was viral in nature (caused by T4 phage;
Ackermann and DuBow, 1987a) whilst d’Hérelle described lysis (destruction of host
cell) of Shigella cultures in broth. It was d’Hérelle who actively pursued phage
research, naming them bacteriophages (‘bacteria eater’ in Latin). D’Hérelle also
proposed that their method of multiplication was intracellular and briefly introduced
the concept of phage therapy (Ackermann, 2003). An exhaustive history of the
discovery and development of phage research would neither be possible nor desirable
in this thesis, but a brief summary is given in Section 2.1.2. For more detailed
summaries see Adams, 1959; Ackermann and DuBow, 1987a; or Summers, 2005.
Phages are found in the majority of bacterial families (Ackermann and DuBow,
1987a; Ackermann, 1999) with over 140 bacterial genera known to have associated
phages. They are the largest known viral group (Ackermann, 2003) and are found in

22
diverse hosts: spirochetes, eubacteria, exo- and endospore formers, cyanobacteria,
anaerobes, aerobes, mycoplasmas and chlamydias amongst others, and are delineated
into 30 genera, 13 families and 1 order (Table 2.1 and Figure 2.1).
As of 2003, approximately 5100 phage ‘species’ have been viewed using electron
microscopy, and it is thought that there are many more phages to be discovered
(Ackermann, 2003). There are six basic types of phages: tailed, filamentous, and
cubic (with either single or double stranded DNA or RNA as genetic material).
Taxonomy and classification of bacteriophages below family level is contentious, and
is an ongoing concern. Classification is carried out using the “polythetic species
concept” (i.e., species are classified by property set (morphological, genetic etc.), of
which, some may be absent in a particular member (Van Regenmortel, 2000).
Taxonomic names are derived from either Greek or Latin (orders = virales; families =
virivae; genera = virus). At present, tailed phage genera have only vernacular names
(i.e., T4 like, λ-like etc.).

23
Table 2.1 Classification and selected properties of phages (adapted from Ackermann, 2003 and Grabow, 2001)
C = circular L = linear T = super-helical S =segmented ss = single-stranded ds = double-stranded
Shape Nucleic acid Order (in bold) and families
Genera Examples Members Morphological Characteristics
Tailed dsDNA (L) Caudovirales Myoviridae Siphoviridae Podoviridae
15663
T4, P1, Mu λ, T5 T7, P22
495012433011696
Contractile tail. Long non-contractile tail. Short tail.
Polyhedral ssDNA (C) dsDNA (C, T) dsDNA (L) ssRNA (L) dsRNA (L, S)
Microviridae Corticoviridae Tectiviridae Leviviridae Cystoviridae
41121
ΦX174 PM2 PRD1 MS2, Qß. Φ6
403? 18391
Icosahedral capsid, no tail. Lipids, complex capsid, icosahedral Internal lipoprotein vesicle, double icosahedral capsid Icosahedral capsid, no tail Envelope, lipids
Filamentous ssDNA (C) dsDNA (L) dsDNA (L)
Inoviridae Lipothrixviridae Rudiviridae
211
fd, f1, M13 TTV1 SIRV1
576? 2
Rods or filaments Envelope, lipids, rod shaped TMV like, rod-shaped
Pleomorphic dsDNA (C, T) dsDNA (C, T)
Plasmaviridae Fuselloviridae
11
L2 SSV1
68?
Envelope, lipids, without capsid Spindle/lemon shaped, without capsid

24
Figure 2.1 Major phage groups organised by nature of genetic material (adapted from Ackermann, 2003)
2.1.1 Phage structure and basic biology
As Figure 2.1 and Table 2.1 illustrate, phages constitute a diverse viral group, with
tailed phages (delineated into the order Caudovirales) dominating. As of the year
2000, there were more than 4950 ‘species’ members of the Caudoviriale order
identified, representing 96 % of identified phages (Ackermann, 2001); this was an
increase from 2700 members (95 % of identified phages) in 1987 (Ackermann and
DuBow, 1987a). Tailed phages consist of a permanent cubic capsid (head) and a
tubular tail structure. This combination is not seen in any other viral group
(Ackermann, 2003) and Caudovirales are amongst the most complex viruses known
(Lwoff et al., 1962). Phages have been found in 90 diverse host genera, encompassing
a wide spectrum of bacterial types (Ackermann and DuBow, 1987a; Grabow, 2001).
Phages not possessing binary morphology are in the minority; as of the year 2000, 186
Caudoviriale Order

25
(3.6%) polyhedral, pleomorphic and filamentous phages were identified (Ackermann,
2001).
The Caudovirale capsid is predominantly icosahedral (or derivatives thereof; 12
vertices, 20 faces and 30 edges and are composed of 2 pentagonal caps with one
equatorial band of equilateral triangles) constructed from monomers (quasi-equivalent
protein subunits) allowing for an economic genome. The monomers may be arranged
by 2 (dimers), 3 (trimers), 5 (pentamers), or 6 (hexamers), the sum of which (the
capsomer), may be viewed using transmission electron microscopy. Some capsids are
icosadeltahedra, with each face being sub-divided into a number of smaller triangles
(Ackermann and DuBow, 1987b).
Within the order Caudovirales, there are three phage families primarily defined by tail
structure (see boxed area Figure 2.1):
- Siphoviridae family (61 % of Caudovirales; Ackermann, 2003) possess a
simple long non-contractile tail, which can be either flexible or rigid.
There is no neck between tail and capsid which is usually 55 to 65 nm in
diameter. When stained with uranyl acetate and viewed using electron
microscopy, flexible tails may appear rigid, whilst excess stain around the
head may give the impression of a neck (Ackermann and DuBow, 1987b).
λ (lambda) phage is one of the most studied siphoviruses;
- Myoviridae family (25 %; Ackermann, 2003) tails are long and contractile,
consisting of a central core/tube and an outer sheath, which are always
separated by a neck (free interval; Figure 2.2). They are constructed of
protein sub-units arranged in rings/spirals and are usually rigid. Tails are
contracted (made shorter and wider) when base plate makes contact with a

26
suitable receptor site (Ackermann and DuBow, 1987b). Myoviruses tend to
have the largest capsid of the Caudovirales, and display a larger range in
capsid size than other viral groups. Capsids range from 45 to 170 nm in
diameter for non-elongated capsids and for elongated icosametric capsids,
46 x 33 to 230 x 50 nm (Ackermann and DuBow, 1987b). T4 is one of the
most studied myoviruses; and
- Podoviridae family (14 %; Ackermann, 2003) possesses short tails that are
similar in structure to long non-contractile tails with capsids around 55 to
65 nm in diameter (Ackermann and DuBow, 1987b). T7 is a notable
member of the Podoviridae family.
Tails may contain numerous proteins of high molecular weight and can vary greatly in
length; generally, contractile tails are shorter than non-contractile tails (Ackermann,
2003). Tails of phages belonging to the Myoviridae family range from around 60 to
455 nm in length whilst in the Siphoviridae family, tails range from 65 to 570 nm in
length. Tail range observed within the Podoviridae family is very small, and the
difference between podoviruses and siphoviruses is obvious, there being no
intermediate tail length. Other dimensions of all tailed phages are remarkably similar
(Table 2.2), which may be a legacy of Caudovirale shared evolution (Ackermann,
2001).

27
Table 2.2 Constant dimensions in Caudovirales (Ackermann and DuBow, 1987b)
Phage component and parameters Dimensions (nm) Capsid thickness 2 to 3 Neck 10 x 8 Collar 12 x 2 Extended sheath Diameter Striations, repeat
18 4
Contracted sheath Diameter Lumen (space within tail structure) Wall, thickness
24
8 to 9 3
Tail tube Diameter Lumen
7 to 9
2 to 2.5 Non-contractile tail Diameter Striations, repeat Wall, thickness Lumen
7 to 10
4 3 to 4
2 to 2.5 Base plate Thickness
3 to 5
Figure 2.2 Components of phages belonging to the Caudovirale order (Anon, 2008b)
28
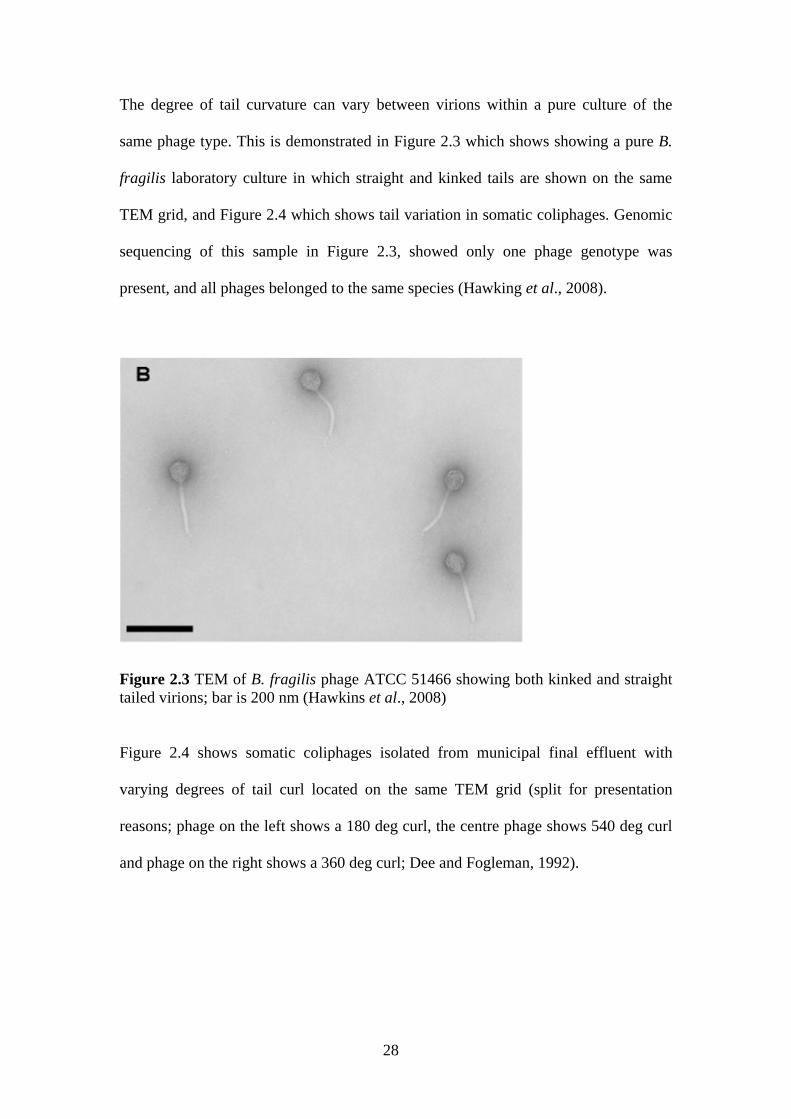
The degree of tail curvature can vary between virions within a pure culture of the
same phage type. This is demonstrated in Figure 2.3 which shows showing a pure B.
fragilis laboratory culture in which straight and kinked tails are shown on the same
TEM grid, and Figure 2.4 which shows tail variation in somatic coliphages. Genomic
sequencing of this sample in Figure 2.3, showed only one phage genotype was
present, and all phages belonged to the same species (Hawking et al., 2008).
Figure 2.3 TEM of B. fragilis phage ATCC 51466 showing both kinked and straight tailed virions; bar is 200 nm (Hawkins et al., 2008)
Figure 2.4 shows somatic coliphages isolated from municipal final effluent with
varying degrees of tail curl located on the same TEM grid (split for presentation
reasons; phage on the left shows a 180 deg curl, the centre phage shows 540 deg curl
and phage on the right shows a 360 deg curl; Dee and Fogleman, 1992).

29
Figure 2.4 Tail variation of somatic coliphages isolated from municipal wastewater (Dee and Fogleman, 1992)
Delineation of phages into groups based upon tail curvature is therefore not advisable,
as tail shape may vary between individual virions within a pure sample, and be altered
by the electron microscopy staining process.
The connection between head and tail varies between phages, some phages have
collars, whereas others have discs. Such structures are needed to connect the 5-fold
symmetry of the capsid with the 6-, 5- fold symmetry of the tail. Tailed phages may
also have a range of facultative organelles (fibres/knobs on phage head, collars/collar
fibres, tail ornaments, and base plates/spikes) that have no apparent function, but are
vital for taxonomy (Ackermann, 2001).
The majority of phages contain double stranded DNA (dsDNA), few contain double
stranded RNA (dsRNA), single stranded RNA (ssRNA) or single stranded DNA
(ssDNA; Ackermann, 2003). Tailed phages usually contain a single linear molecule of
dsDNA usually between 11 and 490 Mdaltons in weight with length varying between
17 to 700+ kb (Ackermann, 2003). Protein and DNA composition of phages is
roughly proportional (Schlesinger, 1934). The chemical composition of numerous
phages has also been determined. Caudovirale G + C content (guanine-cytosine)
appears to vary between 27 and 72 % with phages and host having similar G + C

30
contents (Ackermann and DuBow, 1987a). Unusual bases, such as 5-
hydroxymethylcytosine (HMC), have been reported in many Caudovirales, the
purposes of which may be to protect phage DNA against bacterial restriction
endonucleases. Unusual bases may be indicated by abnormally high/low buoyancy in
CsCl or melting temperatures.
Numerous members of the Caudovirale order have been genetically mapped; for
example, phage T4 has around 290 genes, which are clustered together by function.
The genome structure of 15 genera has been defined, and it is thought many more will
be included in the future (Ackermann, 2003).
2.1.2 Early phage research
Although phages were discovered almost simultaneously by F.W. Twort and Felix
d’Hérelle, in 1915 and 1917, respectively, it is possible that their effects were reported
in the literature as early as the late 19th century. Hankin (1896) noted the antiseptic
properties of Ganges (India) river water against Vibrio cholerae, assuming a volatile
chemical agent was responsible, whilst Emmerich and Löw (1901) recorded lysis of
bacterial cultures by an unknown agent. It is not certain whether observed phenomena
recorded in the aforementioned studies were a result of phages, bacteriocins or other
lytic enzymes.
Of the two co-discoverers of phage, it was d’Hérelle who actively pursued phage
research, producing 97 books and papers in twenty years (Ackermann, 1987a). Using
both solid and liquid media, he realised the particulate nature of phages, and
developed the concept of plaque forming units (PFU) on agar as a way of phage

31
enumeration. The step-wise nature of phage replication was also highlighted in his
experiments. The majority of early phage papers focused on phage therapy: d’Hérelle
realised that as patient recovery was taking place, phage titers in patients’ stools
increased forming the conclusion that phages may be the causative agent of recovery.
Notable early human phage therapy experiments included using staphylococcal
phages to treat cutaneous boils (Bruynoghe and Maisin, 1921) and the bubonic plaque
(d’Hérelle, 1925). The possibility of using phages medicinally within animal
populations was also investigated by d’Hérelle (1921; 1926). By 1940, it is thought
that approximately 560 phage papers had been published (Raettig 1958) and phage
preparations were available both commercially and in field medical packs issued to
German soldiers during the second world war (Summers, 2005). Research into phage
therapy was made largely redundant by the introduction of antibiotics during the
1940s and research output fell considerably (Kellenberger, 1995).
As interest in phage therapy declined, research into the genetics, epidemiology and
general characteristics of phages increased in the period 1940 to 1965 (Raettig 1967).
The introduction of the electron microscope settled one of the early contentions
regarding the state of phages; early electron microscope studies (e.g., Pfannkueh and
Kauschc, 1940; Ruska, 1941; Luria and Anderson, 1942) showed that phages are
particulate in character with specific morphologies.
Molecular studies of phages led to important discoveries (Grabow, 2001) such as
establishing DNA as the genetic material (Hershey and Chase, 1952) and the nature of
viral replication (Ellis and Delbrück, 1939). Phage research contributed to the
Watson-Crick double helix DNA model (Watson and Crick, 1953; Kellenberger,
32
1995) and the development of the ‘central dogma’ of molecular biology. By
examining phages it was shown that genetic material could be ssDNA (e.g., ΦX174
phage; Sinsheimer, 1959) or ssRNA (e.g., MS2; Fiers et al., 1976) and that genetic
material could contain bases other than adenine, thymine, guanine or cytosine. Phages
were important to geneticists as they could be rapidly propagated and compared to
human, animal, insect and plant hosts for other viruses, allowing quicker
experimentation, achievable in standard laboratories (Pelczar et al., 1988). Recently,
post 1990, the number of papers publishing phage genomes has increased
exponentially indicating renewed interest This renewed interest is because of the sheer
abundance of phages being discovered in a range of terrestrial and aquatic
environments, the discovery of phage importance in the host genome evolution
(indicated by host genome sequencing), their use as indicators of specific pollution
sources, and their use as therapeutic agents because of development of antibiotic
resistance within humans (Kropinski and Clokie, 2009).
2.1.3 Phage infection of the host cell
The stages of phage life cycle vary in length, and therefore provide a useful
taxonomic tool. The stages and kinetics of the infection process were demonstrated
clearly by Ellis and Delbruck (1939) utilising one-step growth experiments. The main
stages of the phage life cycle are:
1. Adsorption: the extracellular search by a virion for a host is diffusion driven,
ending when adsorption structure (tail fibres, spikes) make contact with an
adsorption site on the host bacterium (lipopolysaccharides, proteins,
oligosaccharides). The specific site required by phages varies between species.
Some phages require cofactors to bind successfully to the host; these include Ca2+

33
and Mg2+ (and other divalent cations), tryptophan (for T4B phage) and maltose
(for λ phage). Hosts often change binding structure to prohibit phage infection, but
in most cases the effectiveness of such actions is limited as phages can adapt
accordingly. Some phages may encode numerous versions of tail structures to
cope with host mutations, whilst other may be able to utilize multiple adsorption
sites;
2. Penetration: the transfer of genetic material from phage to host occurs after
successful adsorption. Mechanisms vary from phage to phage, but generally the
genetic material in Caudovirales is passed through the tail (which may be either
contractile or non-contractile) into the host cell. The peptidoglycan and inner
membranes of the host are penetrated by enzymes and phage genetic material
begins to drive host mechanisms;
3. Direction of phage synthesis: transcription of phage immediate early genes is
carried by host RNA, the function of which is to ensure successful phage
replication. This may be achieved by disrupting host proteases, blocking
restriction enzymes and destroying selected host proteins. Middle genes that direct
phage DNA synthesis may then be produced, followed by late genes that encode
phage particle;
4. Morphogenesis: DNA and phage heads are combined, producing procapsids,
which are assembled using scaffolding proteins. Tails are assembled separately
and combined when head is complete; and

34
5. The phage-host infection cycle may be concluded by lysis or lysogeny:
- lytic (virulent) phages: once new phages have been synthesised, they are
liberated by host cell destruction. Two components are utilized by tailed
phages, a lysin (an enzyme that breaks the peptidoglycan layer of host) and
a holin (a protein that creates a path in the inner membrane in which the
lysin can pass through to reach the peptidoglycan matrix). The timing of
cell lysis is a balance between maximum phage production within the host,
and delay of phages finding a new host. Should the period between
infection be too long, opportunities for instigation of new lytic cycle may
be lost, and if too short, too few phages may be produced and the lytic
cycle can break down.
- lysogenic (temperate) phages: in contrast to the lytic cycle, lysogeny does
not result in destruction of the host cell; phages are held in a non-infective
state and are transferred to all host daughter cells. This research project
utilizes virulent phage, thus temperate phages will not be discussed.
It is possible that in response to environmental stresses, typically lytic phages may
enter a lysogenic state becoming integrated with the host bacterial genome.

35
2.2 Using phages as indicators of faecal pollution
To overcome the problems with ‘traditional’ FIO outlined in Section 1.5, several
groups of bacteriophages have been proposed as indicators of the presence of human
faecal material. Bacteriophages are persistent in the environment, are enumerated by a
simple and economical assay, are non-pathogenic to humans, and tend to be host-
specific (Ackermann and DuBow, 1987a; Grabow et al., 1995; Van Cuyk and
Siegrist, 2007). It has been hypothesised that, as phage structure, morphology, size
and composition may be similar to enteric viruses, it is possible they can be used as
surrogate organisms for enteric viruses (Jofre et al., 1986; IAWPRC, 1991; Grabow et
al., 1995). Indeed, phages were first speculated to be acceptable models for enteric
viruses as long ago as the 1940s (Guelin, 1948).
Phages are generally present in greater densities in faeces than are enteroviruses
(Jofre, 2002), fulfilling a number of the requirements stated in Section 1.5. This
research sets out to address some of the knowledge gaps (i.e., those stated by Borrego
et al., 1987; Havelaar, 1993; Section 1.5) regarding the ecological similarity of
Bacteroides phages and enteroviruses, thereby providing an evaluation of their
potential to act as surrogates for enteroviruses in QMRA studies and water/wastewater
treatment evaluations.
When evaluating the effectiveness of a phage group in MST and QMRA studies,
differential inactivation within a phage group may present problems, and ideally a
bacterial host capable of detecting a homogenous group of phages is recommended
(Lasobras et al., 1997; Queralt et al., 2003). Therefore, identification of group
homogeneity allows for a better understanding of how environmental conditions are

36
likely to influence the suitability and accuracy of GB-124 in MST studies. For
example, if a host used in MST studies detects a heterogeneous group of phages, with
the dominant phages being inactivated by high pH environments, the host bacterium
may detect no phages in such environments, indicating an absence of faecal pollution
(and associated enteric pathogens), resulting in mis-diagnosis of health risk (false
negatives). However, if it was known that the dominant phage type was susceptible to
high pH, other hosts could be used, achieving a more accurate assessment of risk to
human health with the original host being successfully employed in other
environments. By detecting a homogeneous group of phages, these false-negatives
may be reduced, allowing the phages to be used more accurately in a diverse range of
environments.
It is important to note that the composition of phage populations, in most situations, is
not static. Indeed, it has been reported that the composition of phage populations may
be altered by water and wastewater treatment processes. Dee and Fogleman (1992)
studied the composition of somatic coliphage communities through a WwTW
(Denver, USA). Six dsDNA phages, three from influent and three from effluent, were
isolated and studied using electron microscopy. It was shown that the influent phage
population was heterogeneous, containing two types of siphovirus (one group had
tight curled tails and one group had non-contractile straight tails) and one type of
microvirus (small cubic phage) whereas effluent phage populations were
homogeneous (all siphoviruses with tightly curled tails). The study showed that the
phage populations had differential inactivation kinetics, with siphoviruses being the
most resistant to inactivation. However, it must be noted that the observations and

37
conclusions stated in this particular study were based on very small sample
populations (three influent phage groups and three effluent phage groups).
Similar results were reported by Muniesa et al., (1999), who recorded a change in
population ecology of somatic coliphages in sewage and sewage influenced waters:
members of the Siphoviridae family dominated river waters downstream of WwTW,
whilst members of the Myoviridae family were dominant in raw wastewater and at
sites closer to the WwTW outfall. Lasobras et al (1997) recorded that the proportions
of somatic coliphages belonging to the two families changed between two locations;
proportions of phages belonging to the Myoviridae and Siphoviridae families were
91.0 % and 6.0 % in wastewater samples, respectively, and 67.6 % and 26.4 % in
samples with persistent pollution. One conclusion from this study was that phage
populations found in waters subject to persistent pollution (i.e., subject to either
natural inactivation or by inactivation during treatment), are likely to be
morphologically different than those in wastewater as a result of differential
inactivation. The study concluded that phage morphology may significantly contribute
to environmental persistence. Siphoviruses appeared to be more resistant to
inactivation and this may explain why they are the most frequently recorded phage
family so far (Francki et al., 1991). Phage homogeneity in wastewater final effluent is
important, as this is the discharge of most concern to environmental managers.
Early research focused on phages as indicators of shigellae, cholera vibrios, and
typhoid bacteria (Ackermann and DuBow, 1987a), from which three groups of phages
capable of infecting enteric bacteria emerged as indicators of faecal pollution:

38
2.2.1 Somatic coliphages (SC; Hilton and Stotzky, 1973; IAWPRC, 1991)
Resulting from a decision in the 1940s to concentrate phage research on one particular
type (Summers, 2005), SC are the most studied of all phages (Toranzos et al., 2002)
and are capable of infecting E. coli and other closely related species (Gerba, 2006)
from the family Enterobacteriacea (Grabow, 2001). Well known and extensively
studied SC include T1-T7, PRD1 and ΦX174 (Gerba, 2006). Coliphages are a diverse
group and no single host bacterium can propagate all phages (Ackermann and
DuBow, 1987a), but strains such as WG-5 [E. coli mutant strain CN, American Type
Culture Collection (ATCC) 700078] and E. coli strain C (ATCC 13706) have become
standardized (Anon, 2001b) allowing comparison of inter-laboratory results. SC are
found in the stools of many animal species, including humans, higher and lower
primates, domestic animals and birds (Grabow et al., 1995). SC are lytic phages that
utilise either protein receptors or lipopolysaccharides in the host cell wall as receptor
sites (Anon, 2001b) and can belong to any of the Caudoviriale families identified in
Section 2.1.1, or the Microviridae family (simple tailless structure, ssDNA, capsid
may be up to 30 nm). The genetic material of SC is either ssDNA or dsDNA (Anon,
2001b).
Indications that SC may be used as indicators of faecal pollution/enteric pathogens
were first given in Kott (1966). Although this study was primarily focused on the
adaption of the most probable number enumeration technique to phages, this study
presented data for SC active against E. coli B in WwTW (Austin, USA) and in the
marine area surrounding the WwTW outfall. It was found that SC were present in
both wastewater and sea water samples (mean = 85.6 MPN/100 ml and 23.2
MPN/100 ml respectively) and, although not stated in the paper, the data

39
demonstrated the potential for using SC as a tracer of WwTW effluent. A targeted
study carried out by Wimpenny et al (1972) demonstrated (alongside Serratia
marcescens, pigmented yeasts, and Bacillus) the ability of a λ-like phages active
against E. coli K12 to detect faecal pollution in water. Numerous studies have
employed SC as indicators of human faecal material since (e.g., Borrego et al., 1987;
Borrego et al., 1990; Lucena et al., 1994; Paul et al., 1997).
There are numerous advantages of using SC as indicators of faecal pollution/enteric
viruses, not least the simple and economical assay. SC display varying responses to
environmental factors such as temperature and pH (Gerba, 2006), but generally tend
to persist longer than FIB (Anon, 2007) and selected pathogenic viruses (Scarpino,
1978; Borrego et al., 1990). Somatic coliphages are often present in greater densities
than pathogenic human enteric viruses, often outnumbering cytopathogenic viruses by
a factor of around 500 (Grabow et al., 1993). A positive correlation with enteric
viruses has been reported in a range of environments in varying geographical
locations (Borrego et al., 1987; Dutka et al., 1987; Borrego et al., 1990). Somatic
coliphages were found to be lineally positively correlated with Salmonella bacteria,
performing better than FC (Borrego et al., 1987) whilst Skraber et al (2004) found a
correlation between SC and enteric viral genomes in French river waters.
SC tend to be more prevalent in wastewater (raw and treated) and wastewater polluted
waters, than the two other phage types discussed below (F-specific RNA phages and
B. fragilis phages; Grabow et al., 1993), and densities of SC in human stool samples
have been found to be 60 to 100 times higher than those of B. fragilis phages in stool
samples (Havelaar, 1993; Gantzer et al., 2002). Subsequently SC can be detected in

40
small sample volumes, 1 ml of faecally contaminated waters (Anon, 2007), and hence
proving useful as a general indicator of faecal pollution (Gerba, 2006).
However, the disadvantages of using SC as an indicator of human faecal pollution are
numerous:
- SC may infect bacteria related to E. coli that are capable of environmental
replication, therefore facilitating SC replication (Grabow et al, 1995) presenting
the potential for false-positive indications of faecal material. However, a recent
review of the literature has assessed this potential as negligible (Jofre, 2009);
- SC are a heterogeneous group (Gerba, 2006), therefore differential inactivation
kinetics may influence their use in MST studies in certain environments
containing inactivation agents;
- There is limited information regarding the aquatic ecology of SC (particularly host
range and their behaviour in different climatic regions; Anon, 2007) consequently
it is not known how this effects their use in MST studies; and
- Although well correlated with wastewater effluent, SC are also associated with
non-point pollution (Paul et al., 1997) and are found in areas not subject to faecal
pollution (Seeley and Primrose, 1980) meaning they have little source
identification ability (Gerba, 2006).
Although some positive correlation has been reported (Skraber et al., 2004), the use of
SC as surrogate organisms of human enteric viruses in not recommended. This is
primarily because of very different excretion patterns in terms of both timing and
numbers (Jiang et al., 2001).

41
In summary, SC are a good indicator of faecal pollution (and of water quality in
general) as they are found in high densities in faeces and faecally polluted waters, but
they can not be used to distinguish between human and animal sources. In spite of all
the aforementioned shortcomings, SC are still judged to provide a cheap, fast and
effective method for detecting general faecal pollution.
2.2.2 F-specific RNA phages (FRNA phages; Havelaar et al., 1986; IAWPRC,
1991)
FRNA phages consist of ssRNA contained in a cubic capsid, usually between 21 nm
and 30 nm in diameter (Anon, 2001a). Belonging to the Leviviridae family, FRNA
phages are either leviviruses (e.g., MS2 phage) or alloleviviruses (e.g., Qß phage;
Anon, 2001a). FRNA phages are active against coliform bacteria and are genetically
and morphologically similar to human enteroviruses (Fujioka, 2002). For example,
FRNA phages have very similar morphology to the poliovirus (Picornaviridae
family), in that both have icosahedral capsids of around 25 nm, and when viewed
using electron microscopy, appear extremely similar (Grabow, 2001). FRNA phages
have been recorded in stool samples from humans, higher primates, primates,
domestic animals and birds (Grabow et al., 1995).
It is thought that FRNA phages are possibly the most suitable model organism for
enteric viruses; Havelaar (1993) and Jiang et al (2001) reported good correlation in a
range of water types between FRNA phages and enteric viruses, and absence of
FRNA phages suggests absence of human enteric viruses (Havelaar and Nieuwstad,
1985; IAWPRC, 1991). Domestic wastewater has high densities of FRNA phages
(albeit lower than somatic coliphage) and have been found to outnumber
42
cytopathogenic enteric viruses by up to 100 x (Gerba, 2006). FRNA phages have also
been shown to accumulate in shellfish (Riou et al., 2007) and may provide an
indicator of remote faecal pollution.
Two bacterial hosts are commonly used to detect FRNA coliphages:
- Salmonella enterica serovar typhimurium (WG-49; Havelaar and Pot-
Hogeboom, 1988); and
- E. coli mutant HS(pFamp)R (Debartolomeis and Cabelli, 1991).
FRNA phages are only able to infect hosts possessing pili (sex fimbriae) coded by the
F genetic factor, as these carry the required receptor sites. As the fimbriae are only
produced at temperatures higher than 30 °C (Grabow et al., 1995), FRNA phages are
unable to reproduce in most aquatic environments (Grabow, 2001).
The disadvantages of using FRNA phages as indicators of faecal pollution are that the
phages are present in low numbers in human faeces, and the host bacterium must be
kept in the mutated state (Fujioka, 2002). Since they are isolated from a range of
human and animal faeces, they possess little ability to discriminate between human
and animal faecal sources (Grabow, 2001). It has also been reported that they do not
persist in the environment for as long as many enteric viruses (Jofre, 2002) and may
possess higher decay rates than SC and B. fragilis phages (Lucena et al., 1994).
It is interesting to note that a number of FRNA coliphage serotypes have been
identified (groups I – IV). These serogroups may prove useful for faecal source
tracking studies, groups I and IV have only been detected in animal faeces, whereas

43
serogroups II and III have been almost exclusively detected in human faeces (the
exception is 28% of porcine faeces; Furuse et al., 1983; Hsu et al., 1995; Grabow,
2001).
In summary, FRNA phages are unable to distinguish between human and animal
faeces using the plaque assay method (Anon, 2001a) but analysis of serotypes may
identify faecal source (hybridisation laboratory equipment would be required to
perform these assays). There may be some validity in using them as models of
selected human enteric viruses, especially as environmental replication is very
unlikely, though environmental persistence may not correlate with enteric viruses.
One advantage of using FRNA phages is the recent emergence of a new rapid (three
hour) detection technique (Love and Sobsey, 2007) which could mean that incidents
of general faecal contamination could be identified more quickly.
2.2.3 Phages infecting Bacteroides spp. (Tartera and Jofre, 1987; IAWPRC, 1991)
Phages active against B. fragilis constitute the main focus of this project, and thus
they are therefore discussed in detail in Section 2.3.

44
2.3 Using phages infecting Bacteroides spp., as indicators of human faecal
material
Bacteroides bacteria are Gram negative, obligate anaerobes found in the human
intestinal tract (Shah, 1992; Fujioka, 2002). Members of the Bacteroides genus are
found at densities more than 109 to 1010 per gram of faeces (Geldreich, 1978; Salyers,
1984) and thus constitute the major component of the human faecal bacterial flora
(Finegold et al., 1983). There are numerous Bacteroides species recognised: B.
fragilis (the most commonly used in MST), B. thetaiotaomicron, B. vulgatus, B.
ovatus, B. distasonis, B. uniformis, B. stercoris, B. eggerthii, B. merdae, B. caccae
(Gherna and Woese, 1992), B. oralis and B. melaninogenicus (Keller and Traub,
1974).
B. fragilis phages are lytic, attaching to the host cell wall (Puig and Gironés, 1999),
the majority of which belong to the Siphoviridae family. Before the practice of
employing B. fragilis phages as an indicator of human faecal material was formalised
(i.e., prior to the work of Jofre et al., 1986 and Tartera and Jofre, 1987), there were
numerous references reported of Bacteroides phages being isolated from wastewater;
Sabiston and Cohl (1969) briefly noted isolation of phages active against B.
distasonis, Prévot et al (1970) isolated several phages active against Ristella
pseudoinsolita (B. fragilis), and Nacescu et al (1972) isolated two phages active
against Bacteroides spp.
Although belonging to the same taxonomic group, and probably being serologically
related, no Bacteroides phage has an identical host range spectra and many phages are
specific to only one Bacteroides strain (Kory and Booth, 1986). Booth et al (1979)

45
showed that Bacteroides phages were only able to infect other strains within the
original species (i.e., B. fragilis phages could infect other B. fragilis strains, but were
unable to infect B. ovatus or B. thetaiotaomicron etc.). Keller and Traub (1974) found
that six B. fragilis phages were unable to infect any of the 36 B. oralis strains and six
B. melaninogenicus they tested. Restricted host ranges of Bacteroides phages have
also been reported by Tartera and Jofre (1987) and Bradley (1999).
Bacteroides phages tend to show little morphological variation, belonging mostly to
the Siphoviridae family (Booth et al., 1979; Queralt et al., 2003).The dominance of
siphoviruses does not appear to be geographically limited (Kory and Booth. 1986).
Typical dimensions of Bacteroides phages are between 50 and 70 nm capsid diameter,
with a straight, or slightly curved, tail of around 130 to 190 nm in length (Table 2.3).
Although in the minority, descriptions of Bacteroides phages belonging to the
Myoviridae and Podoviridae families do appear in the literature. Booth et al., (1979)
isolated two Myoviridae (one on B. ovatus and one on B. fragilis), and one
Podoviridae (on B. fragilis).
The validity of using phages infecting Bacteroides as indicators of human faecal
material is reflected in the issue of an International Standard (Anon, 2001c) for their
laboratory handling and assay. In the search for hosts that are able to detect species-
specific phages, numerous B. fragilis strains have been studied, with varying degrees
of phage recovery (Gerba, 2006).

Table 2.3 Selected Bacteroides phages found in the literature
Phage ID Location isolated
Isolated from Capsid diameter (nm) Tail dimensions (nm) Family Host Study
12 n/a Animal Sera 68 180 (Straight/slightly curved)
Siphoviridae B. fragilis Keller and Traub, 1974
969 n/a Animal Sera 68 180 (Straight/slightly curved)
Siphoviridae B. fragilis Keller and Traub, 1974
Bf-1 Virginia Wastewater 70 190 x 16 (Straight/slightly curved)
Siphoviridae B. fragilis Booth et al., 1979
Bf-41 Virginia Wastewater 106 50 x 16 (Short) Podoviridae B. fragilis Booth et al., 1979 Bf-42 Virginia Wastewater 90 167 x 24 (Straight) Myoviridae B. ovatus/ B.
fragilis Booth et al., 1979
Bf-71 Virginia Wastewater 100 150 x 22 (Straight) Myoviridae B. ovatus/ B. fragilis
Booth et al., 1979
F1 Japan Human Faeces 53 132 x 12 (straight) Siphoviridae B. fragilis Kai et al., 1985 Baf-44, Baf-48, and Baf-64
Nebraska, USA Wastewater Dimensions given as between 51.1 x 49 and 55.9 x 52.3
Dimensions given as between 133 x 13.1 nm and 138 x 12.8
Siphoviridae B. fragilis Kory and Booth, 1986
B40-8 Barcelona region, Spain
Wastewater 62.8 156.8 x 9.3 Siphoviridae B. fragilis HSP-40
Puig and Gironés, 1999
No ID stated (Type A/B in micrographs)
Barcelona region, Spain
Wastewater 53 to 55 180 nm long (Straight/slightly curved)
Siphoviridae B. fragilis HSP-40 and RYC-2056
Queralt et al., 2003
No ID stated (Type C in micrographs)
Barcelona region Wastewater 54 to 56 190 to 200 nm long (very flexible)
Siphoviridae B. fragilis HSP-40 and RYC-2056
Queralt et al., 2003
No ID stated (Type D in micrographs)
Barcelona region Wastewater 50 to 52 (Curly) Siphoviridae B. fragilis HSP-40 and RYC-2056
Queralt et al., 2003
ATCC 51477-B1 - - 60 162 x 13.4 nm Siphoviridae B. fragilis RYC-2056
Hawkins et al., 2008

47
The isolation, identification and application of these strains are discussed below, and
the advantages and disadvantages of each strain as a public health tool is described.
2.3.1 Bacteroides fragilis HSP-40
The first B. fragilis host strain proposed as an indicator of human faecal material was
HSP-40 (ATCC51477), sourced from patient peritoneal exudates at the Hospital de
Sant Pau Barcelona, Spain (Jofre et al., 1986). Phages active against HSP-40 are
found in faeces from 4 % to 15 % of humans (Havelaar, 1993; Grabow et al., 1993),
with excretion patterns varying over time (weeks and months). There appears to be no
correlation between phage presence in human stools and age, ethnicity, intestinal
illness or gender (Grabow et al., 1995).
Densities of HSP-40 phages in human faeces have been reported as being from 102
PFU/g (Kai et al., 1985) to 108 PFU/g (Tartera and Jofre, 1987). HSP-40 phages have
been recorded as absent in the faeces of rabbits, pigs, cows, poultry, mice and quail
(Tartera and Jofre, 1987), primates (chacma baboon and vervet monkey), higher
primates (gorilla, chimpanzee, orang-utan), domestic animals (pig, cattle, sheep,
horse, rabbit, dog and cat), and birds (goose and seabird; Grabow et al., 1993; Grabow
et al., 1995). HSP-40 phages have been recorded in a single fowl sample, but it was
speculated that this may have been the result of the fowl consuming human faecal
material, or laboratory contamination (Grabow et al., 1993).
In order to be successful as an indicator of human faecal material, presence in waters
polluted by human faeces, and absence in non-polluted waters must be demonstrated.
Using the MPN technique (adapted for phage by Kott, 1966), in a study undertaken in

48
the Barcelona region, Jofre et al (1986) showed that phages active against HSP-40
were present in 100 % of water (n = 68) and sediment samples (n =6) taken from
waterbodies near urban areas, whereas they were absent in water and sediment
samples (n = 15 and 7, respectively) not subject to human faecal pollution. Presence
of phages capable of infecting HSP-40 in waters contaminated with human faecal
material, and absence in non-human faecally polluted waters was also demonstrated
by Tartera and Jofre (1987). Phages infecting HSP-40 have been found in wastewater
from slaughterhouses (Tartera et al., 1989), but at very low levels (less than three PFU
per 100 ml), and it was speculated that there may have been some minor input of
human faecal material.
The potential for using HSP-40 phages as an enteric virus surrogate organism is
questionable. Phages infecting HSP-40 have been recovered in greater densities than
enteric viruses (but lower than SC) from sediments receiving human faecal pollution
(Jofre et al., 1989), but investigators have also reported absence of HSP-40 phages in
water samples containing human enteric viruses (Grabow, 1993).
Alongside the confirmation of HSP-40 as a suitable indicator of human faecal
material, other Bacteroides strains demonstrating similar or greater levels of phages
recovery have been sought. Tartera and Jofre (1987) assessed eleven other
Bacteroides strains, alongside HSP-40, with regard to their ability to detect phages in
human faeces and WwTW effluent. HSP-40 was found to be the most effective strain,
detecting more phages in thirteen wastewater samples (Table 2.4) than the others.

49
Table 2.4 Isolation of Bacteroides phages using twelve Bacteroides host strains (Tartera and Jofre, 1987)
WwTW Sample ID
B. f
ragi
lis H
SP-4
0*
B. f
ragi
lis H
SP-4
4
B. f
ragi
lis H
SP-3
9
B. f
ragi
lis D
SM-2
151
B. o
vatu
s DSM
-189
6
B. v
ulga
tus D
SM-
1447
B. h
yper
meg
as D
SM-
1672
B. m
icro
fusu
s A
TC
C-2
9728
B. e
gger
thii
AT
CC
-27
254
B. d
ista
soni
s AT
CC
-85
03
B. t
heta
iota
omic
ron
DSM
-207
9
B. u
nifo
rmis
AT
CC
-84
92
1 230 0 0 - - - - - - - - - 2 230 20 0 - - - - - - - - - 3 230 0 0 - - - - - - - - - 4 230 - - 0 - 0 40 - - - - - 5 230 - - 20 - 0 130 - - - - - 6 230 - - 0 - 0 0 - - - - - 7 1100 - - - - - - 0 0 0 - - 8 93 - - - 0 - - 0 0 0 0 - 9 1100 - - - 0 - - 0 0 0 0 -
10 1100 - - - 0 - - - - - 0 - 11 7 - - - - - - - - - - 0 12 24 - - - - - - - - - - 0 13 460 - - - - - - - - - 0
* all MPN per 100 ml; - not tested; 0 values less than 3 MPN/100 ml.
HSP-40 appears to be able to distinguish between human and animal faecal material
in a range of fresh or saline water and sediment environments (Table 2.5). Seawater,
marine sediments and groundwater samples contained phages active against HSP-40,
albeit at diminished densities, which is likely to be a result of inactivation, increasing
distance from pollution source, and dilution with unpolluted water.
Other studies have demonstrated the usefulness of phages infecting HSP-40 as
indicators of human faecal material; Sun et al (1997) found that HSP-40 phages were
present in 100 % of raw urban wastewater (n = 4), 100 % of river water downstream
of WwTW (n = 4), and 50 % of river up-stream of WwTW (n = 2). It should be noted
that these sample numbers are very small.

50
Table 2.5 HSP-40 phage densities in a range of environments, Spain (Tartera and Jofre, 1987)
a Areas exposed to wastewater b Area not exposed to wastewater
Phages infecting HSP-40 have also been shown to bioaccumulate in mussels, in
proportion to distance from pollution source, suggesting mussels containing HSP-40
phages are useful as indicators of remote faecal pollution (Lucena et al., 1994). They
have also been found in oysters downstream of faecal pollution sources in North
Carolina, USA (Chung et al., 1998). Other studies have successfully used phages
active against HSP-40 as indicators of human faecal material in a range of
environments (Lucena et al., 1996; Araujo 1997a, b; Puig et al., 1997).
Phages able to infect HSP-40 have been absent in faecal samples from the USA
(Kator and Rhodes, 1992) and New Zealand (Sinton et al., 1998). Thus using HSP-40
to indicate presence of human faecal material in these, and possibly other, areas may
not be valid (Puig et al., 1999).
Where found, recovery rates of HSP-40 phages from human faecal samples include 4
% in Holland (Havelaar, 1993), 5 % in Japan (Kai et al., 1985), 10 % in Spain
(Tartera and Jofre, 1987), 11 % in France (Gantzer et al., 2002) and 15 % in South
Africa (Grabow et al., 1993).
Sample No of samples
% positive for phage
Max (PFU/100 ml)
Minimum (PFU/100 ml)
Mean (PFU/100 ml)
Median (PFU/100
ml) Wastewater 33 100 1.1 x 10⁵ 7 6.2 x 10³ 1.1 x 10³ River watera 22 100 1.1 x 10⁵ 93 1.6 x 10⁴ 4.6 x 10³ River sedimenta 5 100 4.6 x 10⁵ 90 1.08 x 10⁵ 4.3 x 10³ Seawatera 22 77.2 1.1 x 10³ <3 1.2 x 10² 4 Marine sedimenta
12 91 43 <3 13.4 9
Groundwatera 19 21 Not known 0 - - Non-pollutedb 50 0 - - - -

51
In order to be utilised as an accurate indicator of the presence of human faecal
material and to avoid false-positive results, environmental replication of phages must
not occur (satisfying the criteria for indicator organisms given in Section 1.5). For
phages active against HSP-40, this issue has been addressed under both laboratory and
field conditions (Jofre et al., 1986). Using siphovirus B40-8 (ATCC51477-B1) as a
reference phage, replication was assessed in the presence of the host, in both fresh and
seawater, sediment, under anaerobic and aerobic conditions and at two temperatures
(22 °C and 30 °C). It was found that B40-8 was only capable of replication in the
presence of the host bacteria and an external nutrient source (Modified Brucella-
Broth; MBB). As such conditions are very unlikely to be present in natural
environments (HSP-40 is anaerobic and unlikely to survive in the aquatic
environment), it is assumed that B. fragilis phages are not capable of environmental
replication.
HSP-40 phages are judged to be more resilient to environmental inactivation than SC
and FRNA phages (Araujo et al., 1997a, b; Anon, 2001c; Gerba, 2006; Grabow, 2001;
Fujioka, 2002; Sun et al., 1997) and FIB (Armon, 1993; Lucena et al., 1996; Jofre et
al., 1986) possibly because of the prevalence of siphoviruses. Lasobras et al (1997)
found that 100 % of HSP-40 phages isolated from both wastewater samples (n = 25)
and waters subject to persistent pollution (n = 49) belonged to the Siphoviridae
family.
Although HSP-40 shows good discriminatory powers, SC tend to outnumber HSP-40
phages in water (Tartera et al., 1989; Lucena et al., 1994) and sediments (Jofre et al.,
1989; Lucena et al., 1996) contaminated with human faeces, although in groundwater,

52
densities of SC and HSP-40 phages were similar (2.5 and 2.7 PFU per 100 ml; Lucena
et al., 1996). HSP-40 phages have been found in higher densities than enteroviruses in
water and sediment samples (Lucena et al., 1994 and 1996) but it has also been
reported that HSP-40 phages have been absent when enteroviruses have been found
(Chung et al., 1998).
Araujo et al (1997a) compared levels of SC, HSP-40 phages and FRNA phages,
reporting that in wastewater influent and samples from rivers subject to recent
untreated domestic wastewater, SC were the most abundant (mean = 2.1 x 10⁵
PFU/100 ml), followed by FRNA phages (mean = 7.2 x 10⁴ PFU/100 ml), then HSP-
40 phages (mean = 2.3 x 10³ PFU/100 ml).
In summary, HSP-40 phages appear to be a structurally and phenotypically
homogenous group that are found exclusively in human faeces and in waters and
sediments contaminated with human faecal material. Numerous studies have
demonstrated that they can be used successfully as an indicator of human faecal
material, as they do not replicate in the environment, and have similar, if not greater
persistence than commonly used FIB and enteroviruses. However low densities in
human faeces and evidence of limited geographical applicability mean this indicator
may not be ideal.

53
2.3.2 Bacteroides fragilis RYC-2056
HSP-40 was the B. fragilis host strain used in the majority of microbial source
tracking studies for around ten years (Jofre et al., 1986 to Puig et al., 1997). In order
to find a more effective Bacteroides host strain, overcoming the previously
highlighted shortcomings of HSP-40, Puig et al (1997 and 1999) investigated 115
hospital sourced B. fragilis stains alongside HSP-40. Five of these strains RYC-2056,
RYC-3234, RYC-3317, RYC-3318 and RYC-4023, were selected for further study as
they detected high numbers of phages in urban wastewater.
These RYC strains and HSP-40 were examined in their ability to detect phages in
animal faeces; only phages infecting HSP-40 and RYC-4023 were absent in animal
faeces. HSP-40, RYC-2056 and RYC-4023 did detect phages in slaughterhouse
wastewater, and it was speculated this was a result of minor human faecal
contamination, as was described for HSP-40 in Tartera et al (1989). Phages infecting
RYC-2056 were found in 100 % of slaughterhouse samples (mean = 3.7 x 101
PFU/ml) whereas HSP-40 phages were found in 39 % (mean = 1 x 100 PFU/ml) and
RYC-4023 phages were found in 28 % of samples (mean = 1.4 x 100 PFU/ml).
The assessment of host strain ability to recover phages from human faecal material
was limited. Of the six B. fragilis strains tested, detection rates within human faeces
were only described for HSP-40 (10 to 13 %; Grabow et al., 1995 and Tartera and
Jofre, 1987) and RYC-2056 (28 %). However, all host strains were assayed for their
ability to recover phages from raw wastewater. All strains detected phages in WwTW
samples, with RYC-2056 recovering more than HSP-40 (2.4 x 10² and 8.2 x 101
respectively). Moreover, HSP-40 detected the least phages of all strains in WwTW

54
samples. It is not made clear why strain RYC-4023 was not further assessed for
suitability (it recovered phages exclusively from human faeces and was present in
greater numbers than HSP-40).
In a large pan-European study, Blanch et al (2006) also found that RYC-2056 phages
were detected in both human and animal faecal samples. Geographical spread of HSP-
40 and RYC-2056 phages are shown in Table 2.6 (Puig et al., 1999) which shows that
levels of HSP-40 phages were consistently lower than RYC-2056 phages (mean =
56.6 PFU/ml and 413.9 PFU/ml respectively).
Table 2.6 HSP-40 and RYC-2056 phage densities in urban wastewater samples in a variety of countries (Puig et al., 1999)
Country HSP-40 (PFU/ml)
RYC-2056 (PFU/ml)
The Netherlands 1 4.6 x 10² The Netherlands 2.6 7.7 x 10² Ireland 1.4 3.0 x 10² Ireland 1.6 4.4 x 10² Austria 8.5 8.1 x 10² Austria 0.5 6.1 x 10² Portugal 0.4 1.8 x 10² Portugal 0.1 1.0 x 10² Portugal 0 1.0 x 10² Germany 2.2 7.8 x 10² Germany 1.3 6.0 x 10² Sweden 0.9 2.2 x 101 France 3.1 x 101 2.3 x 10² South Africa 1.1 x 10² 1.8 x 10² South Africa 4.5 x 10² not done South Africa 1.2 x 10² 5.4 x 10² South Africa 2.3 x 10² 5.0 x 10²
Some geographical areas recorded low levels of HSP-40 phages, but moderate levels
of RYC-2056 phages (e.g., Portugal; Puig et al., 1999) suggesting that RYC-2056
may be a more universally applicable indicator. The observed differences between
densities of HSP-40 and RYC-2056 phages in urban wastewater may be explained by

55
differences in excretion rates. Around 30 % of humans excrete RYC-2056 phages
(Puig et al., 1999), whereas less than 15 % excrete HSP-40 phages (Grabow et al.,
1993).
Similar densities of RYC-2056 phages have been found in other areas: levels in
Argentina, Columbia, France and Spain showed little difference, geometric mean over
all sites in all countries being 4.8 log10 PFU/100 ml (n = 100; Lucena et al., 2003).
Blanch et al (2004) showed that phages infecting RYC-2056 had limited ability to
discriminate between faecal source (human and animal) in a range of geographical
areas (UK, Spain, France, Sweden and Cyprus). Human (municipal and hospital) and
animal (slaughterhouse) wastewaters were assayed and there was little difference
between levels of phages infecting RYC-2056 (mean log PFU/100 ml were 3.82, n =
85, and 3.76, n = 85 respectively).
As with HSP-40 phages, RYC-2056 phages have been detected in shellfish (Spain,
Greece, Sweden, UK), at lower densities than SC and FRNA phages (Formiga-Cruz,
2003). The validity of using RYC-2056 phages was assessed in a French river study
by Skraber et al (2002). Levels of RYC-2056 phages were less than SC and FRNA in
all water types tested (Table 2.7). Phages infecting RYC20-56 were influenced
negatively by increased temperatures, but positively by increased flow and
conductivity. It was reported that under favourable environmental conditions (high
flows and low temperatures, i.e., winter) densities remained stable, whereas during
unfavourable environmental conditions (high temperatures and low flows, i.e.,
summer) RYC-2056 phages were often undetectable (75 % of samples, n = 96).

56
Levels of phages infecting RYC-2056 have been shown to be lower than SC in
sewage influent, septic tanks, and sewage-impacted rivers (Lucena et al., 2003). Also,
an EU wide study reported that RYC-2056 phages were present at consistently lower
densities than SC and FRNA phages in seawater sampling sites (n = 89) and
freshwater sampling sites (n = 54; Contreras-Coll et al., 2002). Although lower than
SC and FRNA phages, the widespread geographical prevalence of phages infecting
RYC-2056 is an advantage over HSP-40 phages (as shown in Puig et al., 1999) as the
latter’s geographical spread is more limited.
Table 2.7 Mean levels of phages (log PFU/100 ml) in three types of French water (standard deviation in parenthesis; Skraber et al., 2002) Phage type Raw wastewater
(n = 9) Treated wastewater
(n = 9) River water (n = 96)
SC 6.27 (0.19) 3.96 (0.36) 3.25 (0.33) FRNA 5.63 (0.77) 2.75 (0.54) 2.31 (0.45) RYC-2056 phages
4.42 (0.41) 1.77 (0.44) 58% positive for phages (42% below detection limit (17 PFU/100 ml)
As with other Bacteroides phages, RYC-2056 detect phages with a narrow host range.
(Puig et al., 1997; Puig et al., 1999)
Analysis of the RYC-2056, SC and FRNA phages in temperate river waters suggested
that inactivation rates of all phages were similar, but greater than those of FIB
(Lucena et al., 2003; Durán et al., 2002). Other studies have demonstrated that RYC-
2056 phages are more persistent than SC and FRNA phages (Contreras-Coll et al.,
2002).

57
In summary, RYC-2056 detects phages in both animal and human faeces showing less
discriminatory ability than HSP-40. However, it detects a higher number of phages
than HSP-40 in many geographical areas tested. The International Organisation for
Standardization (Anon 2001c) recommends that RYC-2056 is the Bacteroides fragilis
strain used when employing phages to indicate faecal pollution.
2.3.4 Bacteroides thetaiotaomicron strain GA-17
Bacteroides strain GA-17 was first isolated by Payan et al (2005), and proved
successful in identifying human faecal pollution various European countries (Spain,
France, Sweden, and Cyrus). However, it was found to produce turbid plaques when
tested against municipal WwTW final effluent from southeast England. Costan-
Longares et al (2008) found a good correlation between GA-17 phages and
enteroviruses in water reclamation facilities (Spain). To date, a limited number of
studies have been carried out using GA-17.
2.3.5 Bacteroides strain HB-73
Isolated from Hawaiian municipal WwTW effluent by Kannppan et al (2008), HB-73
has shown to detect phages within wastewater effluents from Hawaii, whereas GB-
124 and GA-17 did not (Vijayavel et al., 2010). The geographical applicability of HB-
73 is yet to be assessed as few studies have been undertaken.
2.3.6 Bacteroides strain GB-124
As has been shown, Bacteroides spp., host strains vary in their ability to distinguish
between human and animal faecal material; strain RYC-2056 detects more phages
than HSP-40 in a range of geographical areas, but does not discriminate between
58
human and animal faeces. Therefore more universally applicable, diagnostic host
strains, able to detect phages in large numbers have been sought.
Bacteroides strain GB-124 isolated by Payan et al (2005), has been proposed as an
indicator of human faecal material. GB-124 is most analogous to B. ovatus (Table 2.8)
and was originally sourced from a raw municipal wastewater sample from south
eastern England.
Table 2.8 Genetic characteristics of GB-124 (Payan et al., 2005)
Size of amplicon (bp) 1,488 Size sequenced (bp) 1,385 Most homologous strain B. ovatus ATCC 8483T Accession number X83952 % Sequence identity 96.5
Ebdon et al (2007) built upon the work carried out by Payan et al (2005), assessing
the discriminatory ability of GB-124 within waterbodies with different pollution
regimes. Phages infecting Bacteroides strain GB-124 were recorded in all tested
WwTW final effluent samples (n = 110; mean = 3.92 log10 PFU/100 ml; Table 2.9),
and at monitoring locations thought to be contaminated with human faecal material (n
= 47; mean = 3.39 log10 PFU/100 ml). GB-124 phages were present in samples taken
from a WwTW with p.e. of 28, suggesting that GB-124 phages are excreted by a
significant percentage of humans. They were recorded in lower densities in areas with
both human and animal faecal contamination (n = 90; mean = 2.38 log10 PFU/100 ml)
whilst they were absent in all water samples not subject to human faecal pollution (n
= 4), and in animal faeces (n = 30).

59
Longitudinal analysis showed that phages infecting Bacteroides GB-124 decreased
with increasing distance from WwTW, suggesting that WwTW effluent contributed
the majority of human faecal material to the catchment. As GB-124 was isolated in
2005, the geographical applicability has not been widely assessed.
Table 2.9 Levels of phages infecting GB-124 in WwTW final effluent (Ebdon et al., 2007)
Site Population equivalent Log10 PFU/100 ml
Brighton Portobello 261,254 4.22–4.38 Eastbourne 119,336 3.76–4.70 Newhaven East 55,955 2.50–3.27 Goddards Green 49,824 3.98 Scaynes Hill 37,327 3.77–4.18 Hailsham South 27,448 2.30–4.26 Vines Cross 23,518 2.95 Uckfield 23,163 3.15–4.04 Crowborough Redgate 20,700 3.32 Hailsham North 14,725 2.00–3.00 Ringmer 4805 3.74 Forest Row 4456 2.30–3.63 Barcombe 3533 2.70 Cuckfield 3186 3.78 Wadhurst Whitegate 2675 2.00–3.00 Crowborough St Jon’s 2377 2.00–2.30 Ditchling 1621 2.47–4.30 Maresfield 1542 3.47 Blackboys 1046 2.47 Hartfield 949 2.00–2.60 Kingston 946 2.30–3.32 Alfriston 769 3.07 East Hoathly 761 2.30–3.65 Rodmell 381 2.00–2.84 Poynings 371 2.30–2.84 Ansty 240 2.00 Streat 28 3.90 Esholt (N. England) 624,000 3.15 Aalborg (Denmark) - 2.70
Phages active against GB-124 have been recorded in final effluents from south eastern
England WwTW, north eastern England, Denmark (Ebdon et al., 2007), Spain, Sicily,

60
Hawaii (though not recorded by Vijayavel et al., 2010), Brazil and Uganda
(unpublished data) suggesting that the usefulness of GB-124 is not limited to SE
England. As has been demonstrated with other Bacteroides host strains, phages active
against GB-124 were found at lower levels than SC, faecal coliforms (FC) and
enterococci (ENT) in all samples (Figure 2.5).
Figure 2.5 Levels of GB-124 phages, SC, FC and enterococci in a range of samples (Ebdon et al., 2007)
0
1
2
3
4
5
6
7
8
9
10
River < 0.5 kmd/s WwTW
River < 2.0 kmd/s WwTW
River > 2.0 kmd/s WwTW +
farms
River directlyd/s of farm
River close toorigin
WwTW Animal samples
Site
Log
10 C
FU/P
FU p
er 1
00m
l
GB-124 SC FC ENT
In order to improve on existing techniques, GB-124 should detect phages in greater
densities than other Bacteroides host strains. As GB-124 was isolated recently,
extensive research has not been carried out, but the limited data suggest that the
relationship between GB-124 and RYC-2056 phages may vary geographically. GB-
124 detected fewer phages in UK wastewater than RYC-2056 (Table 2.10), whereas
in Spanish samples, GB-124 outnumbered RYC-2056 phages.

61
Table 2.10 Levels of phages (PFU/ml) detected from various reference sources by RYC-2056 and GB-124 (Payan et al., 2005) Strain Human1 (n) Human2 (n) Cattle (n) Pig (n) Poultry (n) RYC-2056 1.1 x 10² (12) 1.0 x 10² (9) 2.6 x 10² (7) 6.1 x 10² (8) 2.2 x 10² (8) GB-124 5.0 x 10² (12) 2.5 x 101 (9) 0.17 (7) 0.33 (8) 0 (8) No of sample GB-124>RYC-2056
11/12 3/9 0/7 0/8 0/8
1 Spanish WwTW 2 UK WwTW
Since the ‘phage-lysis’ method relies on traditional culture dependent methods
rather than molecular techniques, the use of bacteriophages infecting Bacteroides
strains for microbial source tracking, or simply as alternative FIO can be relatively
low-cost, (Ebdon et al., 2007). This characteristic of the method would be useful
in LEDC where access to laboratory equipment and media may be limited, and
problems of unregulated PS discharges of human waste may be significant. The
cost of the Bacteroides phage assay is estimated to be less than fifty pence per
sample (author’s own calculation including all lab consumables and media, but
excluding operators time), whereas appropriate molecular methods may be more
expensive.
Work is currently being carried out by researchers of EPHRU at the University of
Brighton and the Instituto Superior Téchnico, Lisbon, into the relationship between
human pathogenic viruses and densities of GB-124 phages in a range of
environments. GB-124 has demonstrated an ability to detect phages of exclusively
human faecal origin. At present, there is a lack of firm evidence supporting its use in
different geographical areas, and nothing is known regarding the phages capable of
infecting it and their ecology. This study aims to improve our understanding of these
important knowledge gaps regarding the ecology of phages infecting GB-124.

62
2.4 Quantitative Microbial Risk Assessment (QMRA)
In order to assess more accurately the risk to users of pathogen contaminated
waterbodies, QMRA may be used to assess the risk associated with a specified
pathogen, in a particular water system. Risk assessments are ideally based on
pathogen occurrence data, but as this is often missing, surrogates are often used (Haas
et al., 1999). Phages infecting Bacteroides strains may be used as surrogate
microorganisms in QMRA.
QMRA produces an estimation of the disease burden from a water resource, based on the
probable risks associated with the densities of surrogate organisms present. Health burden
can be measured using the Disability Adjusted Life Years (DALYs) approach (Murray
and Lopez, 1996) allowing comparison between health burdens of different pathogens.
With respect to the present study, it appears that Bacteroides phages and enteroviruses
may show similar ecological behaviour, and it is hypothesised that phages infecting
GB-124 may be used in QMRA for assessments of the enteroviruses health burden. A
relationship between surrogate microorganism and pathogen must be demonstrated before
QMRA can be used.
When selecting a surrogate microorganism, assumptions relating to correlation of
pathogen and surrogate ecology are made. This study aims to test the assumption that
phages infecting GB-124 and enteroviruses share similar inactivation kinetics during
exposure to UV-B and UV-C radiation. Assessment of phages infecting GB-124
inactivation kinetics will support the development of QMRA in a number of ways.
The removal of enteroviruses during solar irradiation (UV-B driven) and during UV-C
treatment within WwTW, may be indicated by the removal of phages infecting GB-
124, thus providing better data for the formulation of QMRA.

63
Production of a QMRA is a complex process with many protocols available. As it is
beyond the scope of the present research, production of QMRA will not be discussed
in greater detail. However, further information is given by Haas et al (1999) or
Medema and Ashbolt (2006).

64
CHAPTER THREE
3. Phage ecology and UV inactivation
3.1 Phage ecology
As stated in Section 2.2, differential inactivation/removal rates of enteric pathogens
and their indicators may lead to inaccurate assessments of human health risk from
faecally polluted waters. Many factors influence removal and inactivation of indicator
organisms, some of which may be reversible. In order for GB-124 phages to be used
as indicators of human faecal material in a range of geographical regions and
physiochemical situations, a better understanding of their ecology is needed.
Major phage ecology studies have only been published during the past 25 years; the
first monograph being Phage Ecology (Goyal, 1987). Studies detailing the ecology of
phages in numerous environments have since been published; these include terrestrial
(Ashelford et al., 2003), marine (Breitbart et al., 2002; Azam and Worden, 2004),
freshwater (Paul and Kellogg, 2000), and dairy (Brüssow, 2001). Phage ecology has
been dominated by two strands of enquiry, dairy processes and phage therapy in
humans (Guttman and Kutter, 2005), but other ‘real world’ ecological situations are
now being examined.
Numerous factors are thought to influence the survival of phages in natural
environments (Grabow, 2001), including:
- the relationship between host and phage densities;
- organic compounds/matter (humic and fulvic acids);
- temperature and pH of surrounding environment;

65
- presence, and type, of solids;
- UV/visible light;
- other microorganisms; and
- presence of ions.
Phages are most vulnerable to inactivation when searching for a new host, or trapped
in a host-free environment (Guttman and Kutter, 2005).
The majority of phages used in ecological experiments to date have been somatic
coliphages. There is little information regarding the behaviour of Bacteroides phages
in natural environments, though, as outlined in Chapter Two, available evidence
suggests they are more persistent in the environment than traditional FIO.

66
3.2 UV inactivation technologies
3.2.1 Background
In order to meet mandatory consents for microbial indicators given in the EU Bathing
Waters Directive (76/160/EEC) and the Shellfish Waters Directive (2006/113/EEC)
disinfection of wastewaters is becoming more widespread and is also used in the food
industry, notably with dairy, meat and vegetables (Ngadi et al., 2003). It is estimated
that diarrhoea episodes could be reduced by up to 45% in less developed countries if
drinking water disinfection was more widespread (WHO, 2004).
The first use of UV as a disinfecting agent in drinking water was recorded in 1910
(Henry et al., 1910), but high cost, introduction of chlorination and unreliability all
restricted its use (Wolfe, 1990; Hoyer, 2004). The evidence of susceptibility of
Cryptosporidium to UV (not readily inactivated by chlorination) encouraged the
introduction of UV disinfection within drinking water plants (Clancy et al., 1998).
The driver behind the introduction of UV treatment in the US, was the introduction of
the Long Term 1 Surface Water Treatment Rule (USEPA, 2002) and subsequent
water treatment rules requiring the 3-log10 removal/inactivation of Giardia cysts and
Cryptosporidium and 4-log10 removal of viruses. In the US, UV disinfection has been
widespread for over twenty years (Bolton and Smith, 2005) and in the UK, UV
disinfection is becoming increasingly used during the tertiary stage at wastewater
treatment works. Because of the reluctance of many European countries to introduce
widespread chlorination of drinking water, UV is an attractive option, tending to be
more economical than membrane or ozone treatment (Bolton and Smith, 2005).
Moreover, UV disinfection does not produce harmful by-products (Shin et al., 2005).
A number of countries have formulated regulation and guidance manuals regarding

67
the use of UV disinfection technologies (see ÖNORM, 2001 and 2003; USEPA,
2006).
UV disinfection systems are usually one of three types:
1. low-pressure low intensity (LPLI): These systems generate monochromatic
radiation usually around 254 nm, and are housed in quartz sleeves, preventing
direct contact with water;
2. low-pressure high intensity (LPHI): As above, but with two to four times the
UV-C output of LPLI systems; and
3. medium-pressure high-intensity (MPHI): These systems generate
polychromatic radiation (more than one wavelength), of which 27 to 44 % of
energy is UV-C and only 7 to 15 % in near 255 nm. However, total UV-C
output is 50 to 100 times greater than LPLI systems.
Table 3.1 Typical operational characteristics for UV lamps used in WwTW (Metcalf and Eddy, 2003)
Type of lamp Item Unit L pressure L intensity
L pressure H intensity
M pressure H intensity
Power consumption
W kW
70 to100 200 to 500 1.2a
Not stated 2 to 5
Lamp current mA 350 to 550 Variable Variable Lamp voltage V 220 Variable Variable Efficiency % 30 to 40 25 to 35 10 to 12b Lamp output at 254 nm
W 25 to 27 60 to 400 Not stated
Temperature ° C 35 to 45 90 to 150 600 to 800 Pressure mmHg 0.007 0.001 to 0.01 Not stated Lamp length M 0.75 to 1.5 Variable Variable Lamp diameter Mm 15 to 20 Variable Variable a Very high output lamp b Output in the germicidal range (~ 250 to 260 nm)

68
3.2.2 General UV inactivation characteristics of micro-organisms
UV radiation is the portion of the electromagnetic spectrum between 180 and 400 nm
(UV-C: 180 to 280 nm, UV-B: 280 to 315 nm and UV-A: 315 to 400 nm; Hargreaves
et al., 2007). The primary germicidal band is between 220 to 320 nm, located mainly
in the UV-C range. However, UV-C produced by the sun is totally absorbed by the
ozone layer, and does not reach the Earth’s surface (Jagger, 1985). In the context of
environmental microorganism inactivation, UV-C is not a factor. Solar UV-A and
UV-B do reach the ground (95% and 5 % of solar UV respectively; Hargreaves et al.,
2007), and have inactivating effects on organisms. Deleterious properties of sunlight
on living cells are usually assigned to UV-B, although UV-A can also contribute
significantly, having carcinogenic qualities (Stary and Sarasin, 2000).
The detrimental effects of UV-B have been widely documented. Studies have shown
that UV-B is capable of inactivating viruses (Suttle and Chen, 1992; Noble and
Fuhrman, 1997), bacteriophages (Suttle and Chen, 1992; Suttle and Chan, 1994),
bacteria (Joux et al., 1999), oocysts (King et al., 2008), plants (Krizek et al., 1997),
bacterioplankton communities (Winter et al., 2001) and more complex life forms (van
der Horst et al., 2002; Nazari et al., 2010; Wang et al., 2010a).
UV is a physical rather than chemical disinfection method, primarily through UV
photon absorption by the pyrimidine bases in DNA (thymine or cytosine), or within
RNA (uracil or cytosine), preventing cell replication (Bolton and Linden, 2003). The
level and manner of microorganism inactivation differ between UV wavelengths.

69
Examples of direct damage caused by DNA absorption of UV include cyclobutane
pyrimidine dimers (most common type being T-T; Figure 3.1) and pyrimidine (4–6)
pyrimidine photoproducts (most common type being T-C) which mostly create C → T
transitions (Rünger and Kappes, 2008). Such pyrimidine dimers are the most common
UV-B induced pre-mutagenic lesion (Jagger, 1985). In conjunction with direct DNA
damage, capsid damage may also be caused by UV-C irradiation (Pecson et al., 2009)
leading to microorganism inactivation.
Figure 3.1 Formation of thymine cyclobutane dimers (Ravanat et al., 2001)
The dose of UV irradiation may alter the inactivation mechanism; Yang et al (1999)
reported that sunlight exposure for a short period of time led to C to T mutations
within M13mp2 phage, but at longer exposure the dominant mutation was G to C. The
absorption of UV-B by DNA is less efficient than UV-C, whilst UV-A is thought not
to be directly absorbed by DNA (Harm, 1980).
The effects of environmental UV-B and UV-C on microorganisms have been recorded
by numerous authors, and the response of microorganisms to UV radiation has been
shown to vary widely. Faecal indicator bacteria have been shown to be inactivated
more quickly than enteric viruses (Sobsey, 1989). Bacteriophages may prove to have
more similar inactivation characteristics to enteric viruses than enteric bacteria. They

70
may therefore prove to be more suitable surrogates for these pathogens (Shin et al.,
2005). This is a key knowledge gap addressed in this study.
Sunlight (in which the UV component is 95% UV-A, 5% UV-B) has been shown to
decrease phage titres of surface waters by five percent per hour (Wommack et al.,
1996), and it is thought to be the dominant factor controlling loss of infectivity within
surface waters (Garza and Suttle, 1998). The effects of sunlight have been observed
up to 200 m below the surface of the water (Guttman and Kutter, 2005), and phages
with smaller capsids (less than 60 nm) were found to be more susceptible to damage
(Heldal and Bratbak, 1991; Mathias et al., 1995). Phages capable of infecting the
same host may have different decay rates in sunlight, with non-native phages
decaying faster than native phages (Noble and Fuhrman, 1997) indicating that native
phages adapt to ambient conditions.

71
3.3 Collimated Beam apparatus set-ups
In order to investigate the inactivation kinetics of phages, laboratory batch
experiments using collimated beam (CB) apparatus are often carried out. CB
experiments allow UV fluence rate and exposure times to be accurately controlled,
giving narrow confidence intervals. UV inactivation experiments in situ (e.g., at
wastewater treatment works/water treatment works) are more difficult to conduct
because of complex water matrices (Scott et al., 2005), and difficulties in measuring
average fluence rate and contact time (Sommer and Cabaj, 1993a, b; Hijnen et al.,
2006). Modelling of predicted UV fluence levels and distribution within UV reactors
based on water quality and reactor design has been carried out (Bolton et al., 2005;
Cabaj et al., 2005; Ducoste and Linden, 2005), but collimated beam apparatus allow
the close control of all parameters. CB experiments for microbial UV inactivation
studies have become commonplace since the work of Qualls and Johnson (1983) who
demonstrated the ease and accuracy of the method.
3.3.1 Hardware
UV CB inactivation experiments carried out by different authors often report
conflicting results, despite using the same test organism. Differences in organism
preparation and handling, UV irradiation apparatus, or the way fluences are calculated
are likely to account for this. Numerous pieces of information are required in order for
the reader to interpret results from a particular CB experiment. Sommer et al., (1995)
states the following pieces of information are required:
- details of the vessel containing sample being irradiated;
- depth of the sample;
- initial density of the test organism suspension;

72
- the UV apparatus design;
- the method of fluence measurement; and
- the irradiation duration.
When all of the above information is known, inactivation data from different studies,
or laboratories, may be compared. If some of the above information is missing, it
should be noted that the results of the study may not be directly comparable to other
studies. In circumstances where authors used a different irradiation method, or the
method is not fully described, the data should be treated with caution. Conclusions
drawn from such situations should be confirmed by running test organisms in parallel
using the same apparatus and experimental design.
Although numerous configurations of CB apparatus are detailed in the literature, in
order to conduct quality UV experiments, seven components are considered necessary
(Bolton and Linden, 2003):
1. A UV impenetrable shutter: required to regulate exposure time;
2. a window/structure: UV lamp output is temperature sensitive and it is
necessary to ensure enclosure is thermally stable;
3. a stable power supply;
4. a collimating tube: in order to provide a spatially homogeneous irradiation
field, a collimating tube should be used. The inside of the tube must be
‘roughened’ and painted ‘flat black’ to prevent reflections within the tube.
Alternatively, a series of apertures may be used;
5. an irradiation stage;

73
6. a stirring mechanism: suspension must be slowly stirred (avoiding vortex
creation) during UV exposure to assume equal fluence; and
7. UV lamps: lamps should be vented to keep the temperature stable.
It is also important to recognise that although the term ‘collimated beam’ is
commonly used, the UV rays are never truly parallel. It has been suggested that the
term ‘quasi-parallel beam’ should be used instead (Sommer et al., 2001). The CB
apparatus used in this study is described in Chapter Four: Materials and methods.
3.3.2 Fluence calculation and exposure methods
Methods of UV inactivation detailed in the literature are presented in Tables 3.2 and
3.3, and it is evident that many different arrangements of UV irradiation apparatus and
fluence calculations have been used. In some studies microwells have been used to
irradiate microorganisms, whereas some have used large Petri dishes. The
arrangement and power of UV bulbs also varies widely between studies. Numerous
authors have used no corrections to determine fluences (e.g., Kadavy et al., 2000),
some have corrected for the attenuation of UV beam through sample depth (e.g.,
Hayes et al., 2006), and some have included absorption and a correction to account
for unequal photon distribution across the irradiation vessel (e.g., Mofidi et al., 2002).
Since the study of Bolton and Linden (2003), many authors have used the UVCalc
spreadsheet which employs all necessary corrections (or calculating these corrections
manually), giving a much more accurate estimation of the true fluence delivered to the
sample being irradiated.

74
Table 3.2 Low pressure UV-C irradiation methods reported in the literature Reference Bolton and Linden 2003 corrections
(or similar) used? Other corrections made
Rauth, 1965 N Absorbance corrections (Beer-Lambert law)
Antopol and Ellner, 1979 N None Rice and Hoff, 1981 N None
Qualls and Johnson, 1983 N Absorbance corrections (Beer-Lambert law)
Restifo et al., 1983 N None
Chang et al., 1985 N Absorbance corrections (Beer-Lambert law)
Knudson, 1986 N None
Butler, et al., 1987 N
UV absorbance of solutions; some divergence calculations; both corrections not used in all calculations
Harris et al., 1987 N Absorbance corrections (Beer-Lambert law)
Havelaar et al., 1990 N
Fluence rate distribution (similar to Petri factor); Absorbance corrections (Beer-Lambert law)
Liltved and Landfald, 1996 N Absorbance corrections (Beer-Lambert law)
Menga and Gerba, 1996 N Absorbance corrections (Beer-Lambert law)
Lazarova et al., 1998 N No detailed method stated Shaffer et al., 1999 N - Kuluncsics et al., 1999 N None Tosa and Hirata, 1999 N None Kadavy et al., 2000 N None Martin et al., 2000 N None
Shin et al., 2001 N
Fluence rate distribution (similar to Petri factor); Absorbance corrections (Beer-Lambert law)
Oguma et al., 2001 N None
Mofidi et al., 2002 N
Fluence rate distribution (similar to Petri factor); Absorbance corrections (Beer-Lambert law)
Morita et al., 2002 N None
Campbell and Wallis, 2002 N
Distribution factor (similar, but less comprehensive than Petri factor); UV absorbance
Kellogg and Paul, 2002 N None
Linden et al., 2002b N
Absorbance corrections (Beer-Lambert law); Petri factor (no details given)
Gerba et al., 2002 N Absorbance corrections (Beer-Lambert law)
Oguma et al., 2002 N Used biodosimeter (Qß phage) Zimmer and Slawson, 2002 Y
Hayes et al., 2003 N
None, though acknowledged attenuation may occur through Petri dish and solution
Marshall et al., 2003 Y Zimmer et al., 2003 Y Ngadi et al, 2003 N None Nicholson and Galeano, 2003 Y -
Thurston-Enriquez et al., 2003 N Absorbance corrections (Beer-Lambert law)

75
Table 3.2 (cont.) Low pressure UV-C irradiation methods reported in the literature
Reference Bolton and Linden 2003 corrections (or similar) used?
Other corrections made
Caballero et al., 2004 N None
Husman et al., 2004 N Reflection and adsorption of sample
Lazarova and Savoye, 2004 Not stated Method not given Oguma et al., 2004 N None Duizer et al., 2004 N None stated Oguma et al., 2005 N None
Scott et al., 2005 N Absorbance corrections (Beer-Lambert law)
Shin et al., 2005 Y - Templeton et al., 2005 Y -
Tree et al., 2005 N Average depth through sample (Beer-Lambert law)
Wu et al., 2005 N None
Nwachuku et al., 2005 N Absorbance corrections (Beer-Lambert law)
Bohrerova et al., 2006 Y - Hayes et al., 2006 N UV absorbance of solutions Eischeid and Linden, 2007 Y - Hayes et al., 2008 Y - Sirikanchana et al., 2008 Y - Chun et al., 2009 Y - Eischeid et al., 2009 Y - McKinney et al, 2009 N Not stated Wang et al., 2010b Y -
Table 3.3 Low pressure UV-B irradiation methods presented in the literature Reference Bolton and Linden 2003
corrections (or similar) used? Other corrections made
Joux, 1999 N None Jacquet and Bratbak, 2003 N None Duizer et al., 2004 N Not specified Kumar et al., 2003 N Not specified Zenoff et al., 2006 N None

76
3.4 Microorganism inactivation kinetics
3.4.1 UV-C
By comparing all the inactivation data from studies detailed in Appendix 1, general
patterns of UV-C sensitivity may be observed. Within the literature there have been
two major deviations from first-order kinetics reported:
1. The shoulder model – no inactivation at low fluences, with log-linear
relationship at high fluences (Knudson, 1985; Hoyer, 1998; Sommer et al.,
1998; Mamane-Gravetz et al., 2005); and
2. The tailing model – no subsequent increase in inactivation at higher fluences
usually after 99% inactivation has occurred (Hijnen, et al., 2006). This may be
caused by inadequate stirring (Budowsky et al., 1981a, b).
Bacteria are the most UV-C sensitive category of microorganisms, with a wide degree
of fluences required to achieve 4-log10 reductions, from 1.1 mJ/cm2 (Escherichia coli
O157:H7; Sommer et al., 2000) to 50 mJ/cm2 (Salmonella typhimurium; Maya et al.,
2003). The mean fluence required for a 4-log10 reduction is 9.95 mJ/cm2 (n = 54).
Some bacteria display a “shoulder” (e.g., Mycobacterium avium W41; Hayes et al.,
2008), whilst the majority do not. Protozoa are also easily inactivated requiring low
fluences for 4-log10 reduction, the exception being excystation assays which show
large fluence requirements (Giardia muris excystation assay requires 110 mJ/cm2 to
achieve a 2-log10 inactivation). Data in the literature suggest that inactivation of
protozoan specimens is not log10 linear throughout the inactivation curve, with
significant “tailing” observed (Craik et al., 2000; Campbell and Wallis, 2002; Zimmer
et al., 2003).

77
Generally, the fluence requirements for the inactivation of viruses and phages are
higher than those for bacteria and protozoa. Inactivation fluences for phages range
from around 6.7 mJ/cm2 to 119 mJ/cm2 (n = 26) to achieve a 4-log10 reduction (data
presented in appendix I). These data are severely skewed by MS2, which has been
consistently shown to be the most UV resistant phage, requiring fluences far higher
than other phages tested. Inactivation data for viruses range from 7 mJ/cm2 to 226
mJ/cm2 (n = 37) to achieve a 4-log10 decrease in titre. As with MS2 phage, adenovirus
skews the data set as this requires far higher fluences than the other viruses tested: the
various serotypes all require greater than 100 mJ/cm2 to achieve a 4-log10 inactivation.
Bacterial spores tend to be the most resistant organisms tested. Spores have been
shown to display a “shoulder”, and possible “tailing” (Knudson, 1986; Bohrerova et
al., 2006). Spores tend not to be as susceptible to dimer formation (therefore UV-C
inactivation) as the corresponding bacterium in its vegetative state.
Fluence requirements to achieve a 4-log10 inactivation for the same microorganism
varies between studies. Fluence required to achieve a 4-log10 reduction of E. coli
(ATCC11229) varied from 5 mJ/cm2 (Harris et al., 1987) to 25 mJ/cm2 (Zemke et al.,
1990). This may be because of different methods of specimen isolation, processing,
storage, purification, irradiation methods (Hoyer, 2000; Nicholson and Law, 1990;
Nwachuku et al., 2005) or fluence calculation. For example, freeze-thawing many
times during sample preparation may increase sensitivity to UV radiation; Meng and
Gerba (1996) used 5x freeze-thaw for adenovirus whereas Thurston-Enriquez et al
(2003) used 1x freeze-thaw and fluence requirement for 4-log10 inactivation varied by
105 mJ/cm2. The data for protozoa highlight the extent to which assay method can

78
influence the assessment of inactivation kinetics. The animal infectivity assay (e.g.,
Mofidi et al., 2002) and excitation assay (e.g., Karanis et al., 1992) for Giardia
lamblia gave vastly different results. Morita et al (2002) studied infectivity and
excystation assays of Cryptosporidium parvum in parallel and found the same thing,
concluding that UV irradiated cysts may be able to excyst (i.e., exit the cyst), but not
infect. The most credible way to compare required fluence of different organisms is to
run both organisms using the same apparatus in parallel (Nichols and Galeano, 2003)
using the same method of fluence calculation, irradiation and, where possible, sample
preparation. Due to time constraints, in this study it was not possible to conduct both
phages infecting GB-124 and pathogen inactivation experiments in parallel. Future
work to confirm the results of this thesis should run both GB-124 phage inactivation
experiments and pathogen inactivation experiments simultaneously using the same
apparatus and methodology.
3.4.2 UV-B
Although in situ studies, identifying the role that UV-B plays in environmental
microorganism inactivation, have been carried out, laboratory studies using collimated
beam apparatus are rare (Tables 3.3 and 3.4), with the vast majority of UV studies
using UV-C (Lytle and Sagripanti, 2005). Owing to the prevalence of UV-C as a
tertiary treatment within both drinking water and wastewater treatment works, this is
perhaps to be expected.
The six bacterial strains irradiated by Joux et al (1999) showed varying responses to
UV-B, although all showed a log linear inactivation curve with increasing fluence and
all strains were inactivated by a factor of 2-log10 using a fluence of 100 mJ/cm2. As

79
was shown for UV-C, there appears to be little or no relationship between the
bacterial genome size and UV-B fluence required to achieve a 4-log10 inactivation
(Jacquet and Bratbak, 2003).
Table 3.4 Inactivation of microorganisms by low pressure UV-B radiation
Fluence required per log10 reduction (mJ/cm2)
Organism
1 2 3 4 5
Reference
Canine calicivirus ~8 21 34 - - Duizer et al., 2004 Feline calicivirus ~15 22 34 - - Duizer et al., 2004 Deleya aquamarina ~95 150 225 - - Joux et al., 1999 Pseudomonas stutzeri
100 150 215 250 - Joux et al., 1999
Pseudoalteromonas haloplanktis
~60 ~90 ~120 ~140 - Joux et al., 1999
Sphingomonas sp. RB2256
~185 >300 - - - Joux et al., 1999
Salmonella typhimurium
50 100 175 210 250 Joux et al., 1999
Vibrio natriegens 37.5 75 100 130 150 Joux et al., 1999
Duizer et al (2004) present interesting results: to achieve a 3-log10 inactivation of
feline and canine calicivirus by low-pressure UV-B radiation, 34 mJ/cm2 is required,
which is similar to fluences required for UV-C inactivation of caliciviruses (Thurston-
Enriquez et al., 2003; Husman et al., 2004; Tree et al., 2005). This is a significant
deviation from the 1:9/1:10 relationship for other microorganisms observed in other
studies, indicating that mechanisms other than for formation of pyrimidine dimers
may be functioning.

80
3.5 Applications of UV technologies
3.5.1 Drinking water plants
The USEPA recommends 21 mJ/cm2 (for 2-log10 reduction) and 36 mJ/cm2 (for 3-
log10 reduction; Gerba et al., 2002) UV-C fluences for inactivation of enteric viruses
in drinking water plants. These fluences may be less than is required to inactivate
adenovirus type 2, though is sufficient for enteroviruses (Gerba et al., 2002). The
Long Term 2 Enhanced Surface Water Treatment Rule (LT2ESWTR) was established
to regulate UV-C treatment of drinking waters in the USA, and the fluences
recommended are detailed in Table 3.5.
Table 3.5 The LT2ESWTR dose requirements in mJ/cm2 (Cotton and Passantino, 2005)
Log inactivation (mJ/cm2) 0.5 1 1.5 2 2.5 3 3.5 4 Cryptosporidium 1.6 2.5 3.9 5.8 8.5 12 - - Giardia 1.5 2.1 3.0 5.2 7.7 11 - - Viruses 39 58 79 100 121 143 163 186
3.5.2 Wastewater treatment works
At fluences greater than 40 mJ/cm2 virtually all viral and bacterial pathogens are
inactivated (Bolton and Smith, 2005), and WwTW therefore aim to deliver fluences of
this magnitude. However, in the UK fluences commonly used in WwTW vary.
Southern Water Plc (the main water supply and sewerage company in south east
England) have fluence consents (i.e., minimum requirements) of 32 and 35 mJ/cm2,
but it is common practice to deliver fluences of 50 mJ/cm2 (I Mayor-Smith, pers
comm). Data for New Romney WwTW (Southern Water, UK) show fluences
delivered to be between 50.3 and 210 mJ/cm2 with a mean of 79.8 mJ/cm2

81
3.6 Environmental UV related microorganism inactivation
3.6.1 General considerations
Wavelengths shorter than 290 nm (UV-C) do not reach the Earth’s surface as they are
blocked by the atmosphere, (Harm, 1980; Coohill, 1996), with solar terrestrial UV
composed of 5% UV-B and 95% UV-A (Kuluncsics et al., 1999). Therefore, when
considering microorganism inactivation by environmental UV radiation, UV-C is not
a factor. It has been calculated that around 90% of bacterial inactivation by solar UV
is a function of UV-B wavelengths (Coohill and Sagripanti, 2009) and UV-B has been
shown to have a greater effect than UV-A on virus inactivation (Noble and Fuhrman,
1997). The inactivation of phages and viruses in natural waters has been documented
(Davies-Colley et al., 1997; Sinton et al., 2002; King and Monis, 2007; Sinton et al.,
2007), with sunlight shown to be the dominant factor (Suttle and Chen, 1992; Suttle
and Chan, 1994; Wommack et al., 1996; Davies et al., 2009). For example, it has
been estimated that a 4.4 log10 reduction of poliovirus can be achieved using a 6h
exposure (simulated conditions) using solar water disinfection (SODIS; Heaselgrave
et al., 2006).
3.6.2 UV-B environmental inactivation
Because of localised ozone depletion during the latter part of the twentieth century,
much of the literature focussing on UV-B radiation is based around the Antarctic
(Cywinska et al., 2000; McKenzie et al., 2007; Hernández et al., 2009), but
environmental studies detailing the effect of UV-B radiation in more temperate
latitudes are also reported in the literature (Boelen et al., 2002; Jung et al., 2008).
Environmental UV-B fluences vary depending on the latitude at which it is measured,
altitude (it has been estimated UV-B fluence rate increases by 19% with every 1000m

82
increase in altitude; Blumthaler et al., 1993), time of day, season and overhead ozone
concentration (Coohill and Sagripanti, 2009).
To give an indication of fluence rate found at the water surface in temperate latitudes,
a figure of 0.022 mW/cm2 has been used in previous studies (Jacquet and Bratbak,
2003) relating to a cloudy day with moderate sunlight intensity (Mostajir et al., 1999;
Garde and Cailliau, 2000). Other studies have given UV-B peak fluence rates as
approximately 0.20mW/cm2 during a sunny April day, and a peak of around 0.10
mW/cm2 during a sunny February day (Figure 3.2; Jung et al., 2008). Examples of
total daily UV-B fluences have been measured as 55 kJ/m2 in June and 10 kJ/m2 in
January (both Baltimore, USA; Heisler et al., 2004) and 570 to 611 kJ/m2 (September,
Red Sea, Boelen et al., 2002).
In the UK, UV-B data are difficult to obtain and are not widely measured (Sayers et
al., 2009). For example, the UK Health Protection Agency, which supplies UV index
data to the Meteorological Office, does not monitor UV-B levels directly (A Pearson,
pers. comm.). UV-B levels recorded in Wales by UK amateur groups during March to
June 2005 (http://www.uvguide.co.uk/uvinnature.htm) give maximum daily readings
in the range of 0.04 mW/cm2 (during cloudy conditions) to 0.375 mW/cm2 (clear sky).
All data given by this group show a bell-shaped curve of UV-B recorded through the
day, with a peak around solar noon, similar to those shown in Figure 3.2.

83
Figure 3.2 UV-B fluence rate recorded in Seoul, South Korea during a sunny February day (2005) represented by solid circles, and sunny April day (2005) represented by open circles (Jung et al., 2008)
Data from Québec (Canada) give peak environmental UV-B fluence rates of
approximately 0.15 mW/cm2 on a sunny day, and around 0.05 mW/cm2 just below the
water surface on a cloudy day during July 1996 (Mostajir et al., 1999). These figures
are in accordance with those recorded in the UK (amateur group above).
It is clear from the literature that environmental UV-B fluences vary greatly, both
geographically and diurnally. As UV-B fluences are not constant throughout the day,
it is important to recognise that viral inactivation rates dependent on UV-B may also
vary diurnally (Heldal and Bratbak, 1991). In order to prove useful, either direct
measurements or estimates of UV-B fluence should be constructed when assessing
how UV-B radiation will affect MST studies and QMRA in a particular location. For
example, the UV-B Monitoring and Research Program (UVMRP, Colorado State

84
University, (http://uvb.nrel.colostate.edu/UVB/index.jsf) is a useful resource for
further UV-B data within the United States. Elsewhere, national/regional databases
may exist.
The potential for UV-B inactivation of phages has been shown by other authors, and
may be the result of a rapid mechanism. Lytle and Sagripanti (2005) estimated that
63% of pathogenic virus would be inactivated by solar radiation (including UV-A and
UV-B components) exposures between 8.4 minutes (phage T1) and 71 minutes
(Tobacco Mosaic Virus) using data predicted from inactivation kinetics at 254nm.
Changes in the genomic structure of solar-irradiated phages have also been observed.
Research on the DNA phage M13mp2 (host E. coli) showed that when exposed to
natural sunlight (therefore UV-A and UV-B), a change in bases occurred, with the G
to C or G to T being the most prevalent changes (Negishi and Hao, 1992).
3.6.3 Microorganism protection from UV-B radiation
UV-B is attenuated as it passes through the water column, with the degree of
attenuation determined by numerous physiochemical factors. In oligotrophic (low
nutrient) water bodies, less UV-B attenuation occurs than in nutrient rich water bodies
(Boelen et al., 2000), with the degree of UV-B attenuation highly dependent on
dissolved organic carbon and both organic and inorganic particulate matter (Häder et
al., 1998 and 2007; Bancroft et al., 2007). Experiments carried out in oligotrophic
(i.e., low nutrient) waters with low particulate matter content show average UV-B
attenuation over three metres (based on 6 hour fluence data given in Table 3.6) is
73.4% (n = 5). At three metres, the UV-B attenuation is 98.9%. In waters with
suspended organic and inorganic matter, and with higher nutrient status (i.e., river

85
systems), attenuation of UV-B is much greater. Other studies have shown UV-B to be
detected at 6m depths in low dissolved organic carbon lakes (Williamson et al., 1996)
and 15m in Gulf of Mexico (Wilhelm, et al., 2002). Attenuation of UV-B within
marine water columns has been correlated with a decrease in UV induced DNA
damage (Boelen et al., 2002).
Table 3.6 UV-B fluences measured at different depths through the water column at King George Island, Antarctica (Hernández et al., 2009)
Depth (m) 2 hour UV-B fluence (mJ/cm2)
6 hour UV-B fluence (mJ/cm2)
Repetition 1 0 1 3
320 61 1.7
460 80 2.8
Rep. 2 0 1 3
837 209 0.8
2011 502 0.2
Rep. 3 0 1 3
120 33 2.5
433 120 9.3
Rep. 4 0 1 3
- - -
950 190 4
Rep. 5 0 1 3
- - -
480 121 7.6
There is also evidence to suggest that turbid waters with high levels of particulate
matter may reduce the level of UV-B penetration, whilst shielding microorganisms
from UV photons. Water spiked with montmorillonite has been shown to reduce the
inactivation rates of phage T7, and poliovirus 1 (Quignon et al., 1997). Kaolinite
displays similar effects (Gerba and Schaiberger, 1975) as do organic humic acids

86
(which absorb UV strongly) (Bitton et al., 1972), possibly by coating the phage in a
protective layer (Templeton et al., 2005).
Phages may also be protected from UV inactivation by deposition into bed-sediments.
Skraber et al (2009) demonstrated that F-specific phage (MS2) and SC (ΦX174 and
PRD-1) accumulated in natural clayey sediments sourced from canals, river and lakes.
The binding ability of phages to clays has been reported (Schiffenbauer and Stotzky,
1982; Gantzer et al., 2001). These phages may become available when high flows re-
suspend the bed sediments. The size of clay particle may also influence viral
adsorption, with smaller particles capable of greater phage adsorption (Gerba and
Schaiberger, 1975).
Viral adsorption rates to sediments may be temporally variable. Viruses can be
adsorbed in large levels to suspended sediments, but after periods of rainfall, dilution
of cations may retard adsorption (Schaub and Sagik, 1975). Natural sediments don’t
have the adsorptive capacity of kaolinite, with sand being particularly bad (Gerba and
Schaiberger, 1975). Differential reaction to electrostatic charges by enteroviruses and
phages may have implications for environmental studies and adsorption onto solid
surfaces (Grabow, 2001).
Other protective features include phage coagulation, (reducing surface area subject to
UV-B irradiation; Coohill and Sagripanti, 2008), and shading (by other
microorganisms, surface and sub-surface plants, and other structures). Shading may
be enhanced in eutrophic waters where primary production is greater than in nutrient
poor waters.

87
The final protective feature that should be considered is the potential for phages such
as those infecting GB-124 to undergo reactivation within the water column. There are
two primary methods of reactivation: 1) photoreactivation (repair of pyrimidine
dimers by UV-A exposure using the photolyase enzyme) and 2) dark repair
(nucleotide excision repair; Oguma et al., 2001), which is more complex as it utilises
at least twelve proteins (Freidberg et al., 1995). UV-A driven reactivation of UV-C
irradiated organisms has been documented in bacteria (Kashimada et al., 1996; Tosa
and Hirata, 1999; Sommer et al., 2000; Zimmer and Slawson, 2002; Oguma et al.,
2004), protozoa (Oguma et al., 2001), spores (Knudson, 1986) and phages (Kadavy et
al., 2000) and this can occur within a few hours (Oguma et al., 2002). The photolyase
enzyme is crucial, and if absent from the microorganism, photoreactivation cannot
take place (Oguma et al., 2001). It should be noted that although photorepair may be
carried out, CPD repair is often done with errors leading to non-reactivation (Wang et
al., 2010b).
During laboratory assays (i.e., the double agar assay for phages infecting GB-124),
reactivation may occur: adenovirus serotype 40 has demonstrated a “shouldering”
effect at low fluences (<30 mJ/cm; Thurston-Enriquez et al., 2003), which may be
because of repair carried out by the host cell during assay. As the genetic material of
adenoviruses is dsDNA, it is possible that only one strand of DNA is damaged during
UV-C irradiation, which can then serve as a template for repair using the host cell
(Harm, 1980). This may account for “shoulders” observed in some dsDNA virus
inactivation curves. Rate of photorepair is limited by the amount of photolyase
present. In E. coli there are around twenty photolyase enzymes in each cell, each of
which can repair 5 dimers per minute (Friedberg et al., 1995).

88
The ability of microorganism to reactivate varies greatly from species to species, and
specific target organisms should be assessed for their reactivation ability. As phages
use the host cell to propagate, if the host has the photolyase enzyme the capacity for
photoreactivation exists. It is not known if GB-124 has the photolyase enzyme, and
therefore the ability to perform photoreactivation.

89
3.7 Rationale of study
As mentioned previously, there is no perfect indicator of human faecal pollution
appropriate to all situations, but the indirect enumeration of bacteriophages infecting
Bacteroides strains, by phage lysis of bacterial cultures, has shown promise, both for
identifying faecal contamination, and for distinguishing faecal sources. However,
since it is likely that there is no perfect indicator, a ‘toolbox approach’ to identifying
faecal pollution, and ultimately to quantifying risk of human infection may be
appropriate, using different indicators in different environments. In order to develop
such a ‘toolbox’ the limitations of each indicator must be assessed systematically. If
phages infecting Bacteroides spp., are to be used as indicators of human faecal
contamination, further information regarding their ecology in natural aquatic
environments is needed (Araujo et al., 1997; Weinbauer et al., 2007). The USEPA has
identified research into phages infecting Bacteroides spp., as a high priority critical
research need (Ashbolt et al., 2007).
Numerous physical, chemical and biological factors influence the survival of
pathogens in waterbodies and effective indictors of faecal material and surrogate
organisms must possess similar ecological characteristics to the pathogen or
pathogens of concern. Bacteroides strain GB-124 has shown good potential as an
indicator of human faecal material and as a possible surrogate for enteroviruses.
However, no studies have been undertaken on the ecology of phages infecting GB-
124. If phages of GB-124 are inactivated more rapidly than are common waterborne
pathogens, then inaccurate water risk assessments may arise, resulting in human
illness and mortality. The relationship between phages infecting GB-124, and
waterborne viral pathogen levels needs to be demonstrated in order to allow accurate

90
assessment of risk through quantitative microbial risk assessment (QMRA)
methodologies.
Differential environmental inactivation kinetics of Bacteroides phages and pathogens
are likely to influence their application as an indicator of faecal contamination in
aquatic environments (requirements for enterovirus surrogate organisms specified in
Section 1.5). Bacterial hosts that detect a homogenous group of phages are
recommended as homogeneity allows the comparison of different water types (as
composition of phage population will not change) and ensure a consistent reaction to
environmental pressures (Queralt et al., 2003).
As discussed above, one common method of pathogen/phage inactivation is UV
radiation, delivered either naturally via sunlight (UV-B and UV-A) or artificially
during effluent disinfection at WwTW (UV-C). UV disinfection of wastewater
effluents using UV-C radiation is very effective in reducing the pathogen load of final
effluents, and its use is becoming increasingly common (Cotton et al., 2001),
primarily because of its effectiveness at inactivating Cryptosporidium (Cotton and
Passantino, 2005). Sunlight-derived UV-B radiation has also been shown to inactivate
microorganisms, and may influence the survival of phages (such as those infecting
GB-124) in the environment (Jagger, 1985). These two important inactivation
mechanisms may limit the use of phages infecting GB-124 in QMRA and MST
studies if indicators and pathogens display different inactivation kinetics.

91
3.8 Aims and objectives of research project
To date, phages capable of infecting GB-124 have not been isolated and classified and
hence assessment of their survival characteristics has not been investigated. What’s
more little is known of the ecology of such phages capable of infecting GB-124 and
how this relates to types and densities of pathogens present in wastewater. In order to
address these gaps in knowledge, this study contributes to the achievement of the
following aim:
- To improve understanding of the environmental ecology of bacteriophages
capable of infecting Bacteroides strain GB-124 and assess implications for phage-
based MST studies and QMRA.
More specifically the research project set out to achieve two objectives:
- To isolate and characterise bacteriophages capable of infecting Bacteroides strain
GB-124 assessing group homogeneity; and
- To ascertain UV inactivation kinetics of isolated phages using two UV
wavelengths: UV-B (representing primary germicidal portion of sunlight) and
UV-C (representing germicidal UV employed in WwTW) in controlled laboratory
experiments.
This study will fill some of the critical knowledge gaps with regard to the
homogeneity of phages able to infect GB-124, and how they are likely to behave and
survive when exposed to tertiary disinfection stages during wastewater treatment, and
in the environment. Results from this study may inform the decision as to whether
phages infecting GB-124 can be used as indicators of human faecal contamination in
areas downstream of WwTW with UV disinfection installed, and if they can be used

92
as surrogate organisms for enteroviruses after UV treatment and during solar UV-B
exposure.
Through the better understanding of GB-124 phage ecology, results from this study
may help to protect human health by informing the production of more accurate risk
assessments.

93
CHAPTER FOUR
4. MATERIALS AND METHODS
This study used both international standard (e.g., ISO) methodologies and those
detailed in scientific peer-reviewed literature by numerous authors. All glassware was
acid-washed and sterilized (by autoclaving at 121 °C for 15 minutes) prior to use, and
media and reagents were prepared according to the manufacturers’ instructions.
Methodologies are presented here chronologically with regard to the experiments
undertaken, vis a vis phage isolation, characterisation, and finally irradiation using
254 nm (UV-C ) and 302 nm (UV-B) wavelength ultraviolet radiation.
4.1 Isolation of bacteriophages infecting GB-124
4.1.1 Collection of samples and double-agar analysis
There are numerous phage isolation and concentration methods detailed in the
literature, including ultrafiltration (Wommack et al., 1996; Breitbart et al., 2002),
precipitation with polyethylene glycol (PEG; Yamamoto et al., 1970) and sequential
adsorption and elution (Seeley and Primrose, 1982; Sobsey et al., 1990; Mendez et
al., 2002). This study used the polyethylene glycol method developed by Yamamoto
et al., (1970) as it has proved successful for bacteriophage concentration and
purification in many previous studies (cited in over 1200 articles as of Jan 2010; Web
of Science search). Extensive information regarding working with bacteriophages is
detailed in Kutter and Sulakvelidze (2005).
On three occasions (1st October 2008, 13th October 2008 and 27th October 2008) one
litre grab samples of wastewater final effluent from Scaynes Hill wastewater

94
treatment works (West Sussex, UK; 37, 327 p.e.) were collected in sterile
polyethylene bottles (Fisher Scientific, UK), stored at 4°C in the dark and transported
to the Environment and Public Health Research Unit (EPHRU) laboratory, University
of Brighton. Effluent samples were filtered using sterile 10ml plastic syringes (Becton
Dickinson, US) with a sterile 0.22 μm filter unit attached (Millipore, US) to retain
bacteria and organic material, whilst allowing phages to pass through. Because of
their low protein binding nature, these filters retain few phages (Tartera et al., 1992).
Filtered effluent was stored in sterile glass tubes at 4°C in the dark until assayed. This
was performed within four hours of collection.
A dilution series of filtered final effluent samples were assayed in triplicate (100 μl,
500 µl and 1 ml aliquots) using the double-agar protocol (ISO 10705-2) specifically
for B. fragilis phages (Adams, 1959; Anon, 2001c). GB-124 working cultures were
prepared by streaking a GB-124 culture on a BPRMA (Bacteroides phage recovery
medium agar; Anon, 2001c) plate and incubating anaerobically [in anaerobic jars with
an anaerobic sachet (Anaerogen, Oxoid, UK)] at 36 (± 2) °C for 44 (± 4) hours. 12 ml
of BPRMB (Bacteroides phage recovery medium broth; Anon, 2001c) in a Pyrex
screw-topped glass test tube (SciLabware, UK), was then inoculated with 1/8th of the
cells on BPRMA plate and incubated anaerobically at 36 (± 2) °C for 21 (± 3) hours. 1
ml of this culture was then transferred to 11 ml of pre-warmed BPRMB in a Pyrex test
tube and incubated anaerobically at 36 (± 2) °C until the correct optical density was
reached (0.33 OD at 620 nm). This optical density equates to 2 x 10⁸ CFU/ml,
representing the exponential bacterial growth phase (previously determined
experimentally by GB-124 growth curves). Before optical density readings were
taken, test tubes were wiped with a lint free cloth and with 70% ethanol to ensure

95
accurate readings. Pre-warmed (36 (± 2) °C) complete BPRMB was used to zero the
spectrophotometer. The working culture was then mixed in a ratio of 1:1 (volume)
with Bovine Albumin cryoprotector (Anon, 2001c), distributed into Eppendorf tubes
(1.5 ml volume) and stored at -80 °C until required.
1 ml of GB-124 working culture was removed from storage at -80 °C and allowed to
equilibrate to ambient room temperature (~20 °C). This was added to 11 ml of
complete BPRMB in a 12 ml Pyrex screw-topped test tube excluding all air. The
culture was incubated anaerobically overnight at 36 (± 2) °C. The following day,
inoculum cultures were prepared by adding 1 ml of overnight GB-124 culture to 11
ml of pre-warmed BPRMB [36 (± 2) °C] in a 12 ml Pyrex test tube and incubated
anaerobically at 36 (± 2) °C until the correct optical density was reached. Pre-warmed
[36 (± 2) °C] complete BPRMB was used to zero the spectrophotometer and when the
correct OD was reached, inoculum cultures were placed on ice and used within three
hours.
For each assay, 1 ml of GB-124 inoculum culture was combined with 2.5 ml of
molten (50 °C) semi-solid BPRM agar (0.8 % agar) and 1ml of sample (or dilution
thereof) in a 13 ml plastic test tube, vortexed at low speed, poured over BPRM agar
(1.6 % agar number 1) and left to set for approximately 10 minutes. Petri dishes were
then inverted, placed in anaerobic jars with an anaerobic sachet (Anaerogen, Oxoid,
UK) and incubated for 18 (± 2) hours at 36 (± 2) °C.

96
After incubation, zones of lysis were visible (plaques) where phages infected the
confluent bacterial lawn, destroying the host Bacteroides cells. Each plaque represents
one plaque forming unit (PFU) and PFU/ml of samples is given by:
Where:
npfp = the number of plaque-forming particles/units of bacteriophages infecting
Bacteroides fragilis per millilitre (PFU/ml)
N = the total number of plaques counted on plates
n1, n2 = the number of replicates counted for dilution F1, F2 respectively
V1, V2 = the test volumes used with dilution F1, F2 respectively
F1, F2 = the dilution or concentration factors used for the test portions V1, V2
respectively (F = 1 for undiluted, F = 0.1 for ten-fold dilution etc.).
Anon (2001c)
4.1.2 Phage isolation, concentration and purification
Plates with well-spaced plaques were selected for isolation work. Plaques were
selected at random in order to avoid selection based upon morphology (i.e., plaque
appearance), and 20 plaques were picked during each round of isolation (this is
considered the minimum number required to estimate population diversity; according
to Bianchi and Bianchi, 1982). Agar plugs containing plaques were picked from plates
using a sterile glass Pasteur pipette and suspended in 400 µl of buffer (19.5 mM
Na2HPO4, 22 mM KH2PO4, 85.5 mM NaCl, 1 mM MgSO4, 0.1 mM CaCl2) in a
microcentrifuge tube (Fisherbrand). The suspension was then incubated for four hours

97
at 4°C (Puig and Girones, 1999) allowing phage diffusion from agar plug into the
buffer. 100 μl of phage infected buffer (and dilutions thereof) were retested using the
double-agar method (above) to confirm phage presence. Plaques were picked for a
second time from plates with well spaced zones of lysis and suspended in 400μl of
buffer for four hours at 4°C.
This suspension was added to 27 ml of GB-124 (at 0.33 OD) in a glass tube (filled to
capacity to exclude air) and incubated anaerobically for 18 (± 2) hours at 36 (± 2) °C,
to produce crude lysates. 1 ml of each crude lysate (and dilutions thereof) was assayed
for phage viability using the double-agar method described above. Lysates that
produced plaques were selected for further work. Remaining volumes of lysates that
produced plaques were added to separate 620 ml cultures (500 ml Schott bottle filled
to capacity to exclude air) of exponential GB-124 and incubated anaerobically for 18
(± 2) hours at 36 (± 2) °C. Crude lysates containing no lytic phages (absence of
plaques) were discarded.
Phages were then concentrated and purified by precipitation with polyethylene glycol
in accordance with Kutter and Sulakvelidze, (2005) and Yamamoto et al (1970).
Following incubation, phage suspensions were kept at 4 °C and NaCl was added to a
final concentration of 1M. After one to two hours, suspensions were centrifuged at
1,789 x g for 10 minutes to remove bacterial debris. Polyethylene glycol 8000 was
added to a final concentration of 10 % (w/v), mixed for 30 minutes using a magnetic
stirrer, and left overnight at 4 °C. The following morning, suspensions were
centrifuged at 11,000 x g for 10 minutes at 4 °C in order to sediment precipitated
phage. The supernatant was discarded and 30 ml of buffer (as above) were added.

98
Suspensions were stored at 4 °C overnight, allowing pellet to soften. The following
morning, pellet and overlying buffer were mixed by gentle pipetting and further
debris were removed by centrifugation at 1,500 x g for 10 minutes. The titre of
resulting suspensions was between 108 and 1011 PFU/ml and they were stored in light
tight glass tubes in the dark at 4°C.
Phages were named B124-1, B124-2 etc., following the system used in Tartera and
Jofre (1987) for HSP-40 and related phage, where:
B = genus of host on which phages were isolated (in this example
Bacteroides)
124 = strain of Bacteroides on which phages were isolated (GB-124)
-1 = the ID of the plaque picked (i.e., B124-1 was the first plaque picked)

99
4.2 Phage characterisation
4.2.1 Transmission Electron Microscopy
Electron microscopy employs electron dense solutions containing metal salts of high
molecular weight and small molecular size, staining specimens and allowing
visualisation under an electron beam. All twenty propagated phages were examined
under the electron microscope. One drop (~ 10 µl) of phage preparation (10-1 dilution
of original high titre lysate as detailed in 4.1.2 above) was deposited on 200 mesh
Formvar/Carbon copper electron microscope grids (Agar Scientific, UK) and allowed
to absorb for two minutes. The excess suspension was withdrawn using Whatman No.
1 filter paper (Whatman, UK) and one drop (~ 10 µl) of 0.22 µm filtered 1 % w/v
uranyl acetate stain (pH 4 – 4.5) was added to the grid and left for 1 minute. The
excess was withdrawn using filter paper and grids were left to air dry before viewing
under the electron microscope (Hitachi-7100 at 100 kV). All phages were measured
on micrograph printouts rather than on-screen (Ackermann, 2009).
4.2.2 Host range assessment
The ability of isolated B124 phages to infect other Bacteroides species/strains used in
MST studies was assessed. The B. fragilis strains used were RYC-2056 (Puig et al.,
1999) and HSP-40 (Jofre et al., 1986; Tartera and Jofre, 1987). 10-fold dilution series
of phage suspensions were created and assayed in parallel with GB-124, using a
control of sterile distilled water in place of phage dilution series. Samples were
assayed using double-agar method and all dilutions were analysed in triplicate.
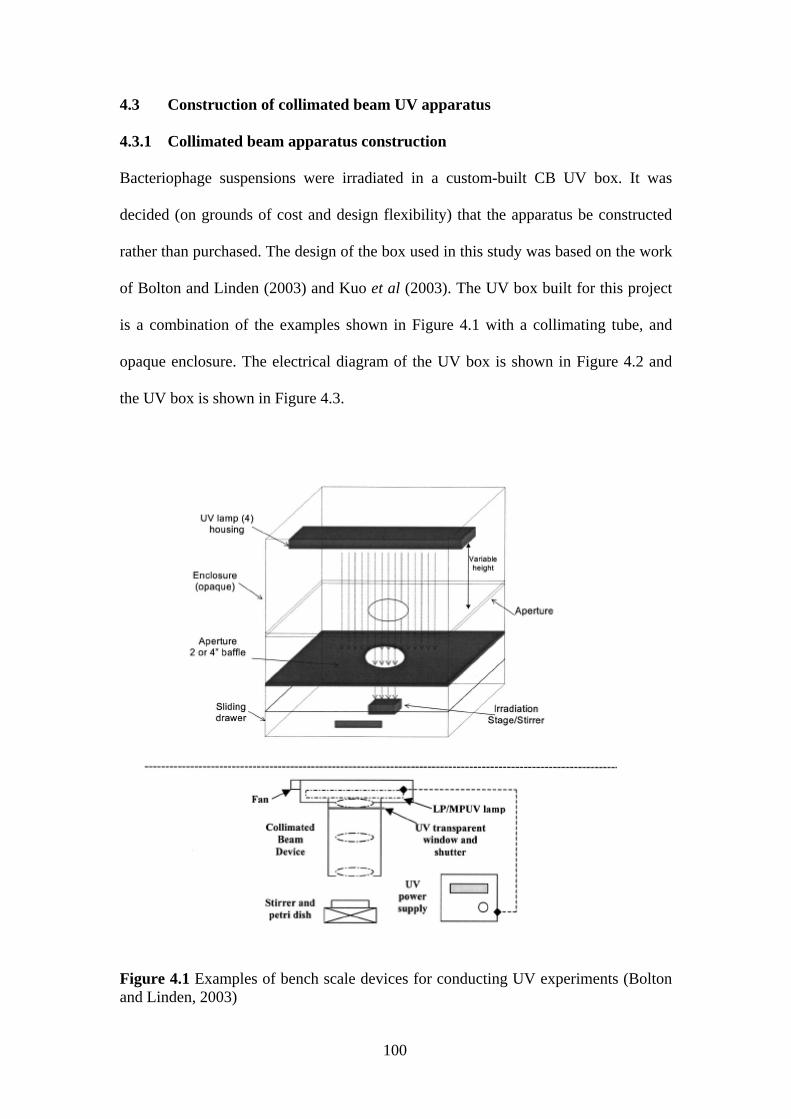
100
4.3 Construction of collimated beam UV apparatus
4.3.1 Collimated beam apparatus construction
Bacteriophage suspensions were irradiated in a custom-built CB UV box. It was
decided (on grounds of cost and design flexibility) that the apparatus be constructed
rather than purchased. The design of the box used in this study was based on the work
of Bolton and Linden (2003) and Kuo et al (2003). The UV box built for this project
is a combination of the examples shown in Figure 4.1 with a collimating tube, and
opaque enclosure. The electrical diagram of the UV box is shown in Figure 4.2 and
the UV box is shown in Figure 4.3.
Figure 4.1 Examples of bench scale devices for conducting UV experiments (Bolton and Linden, 2003)

101
Figure 4.2 Electrical diagram of custom-built UV box (R = resistor)
The UV box enclosure was constructed using 90mm plywood, which was
waterproofed using wood sealant and the interior painted flat black. The box exterior
was covered with waterproof vinyl allowing easy cleaning. The bulb compartment
housed four low-pressure low-intensity Hg 15W UV bulbs (UVP, UK), of which the
central two were used to deliver light through a collimating tube, producing quasi-
parallel rays (Figure 4.4). Bulbs were either of wavelength 254 or 302 nm, using a
single wavelength at a time. 15W ballasts (UVP, UK) were used to regulate power
supply to UV bulbs and starters (UVP, UK) were used to initialise UV bulbs.
A microswitch was fitted to the box door ensuring that the power supply to UV bulbs
was cut when the door was opened, though because of changes in methodology, this

102
was bypassed for the tests. The box included two external LED lamps (with
appropriate resistors) per UV bulb (Figure 4.5) for safety purposes: an amber lamp
indicated that the UV bulb circuit was complete, and the bulb was switched off, a red
lamp indicating that the UV bulb was on and emitting UV radiation. Any on/off
configuration of the four bulbs was possible. Temperature sensors were located in the
bulb compartment and in the experimental chamber.
Figure 4.3 UV box exterior (left) and interior (right) (the interior is shown with a shortened collimating tube)
Figure 4.4 UV bulb arrangement

103
Figure 4.5 Lamps and switches on UV box
4.3.2 UV properties of CB apparatus
Two wavelengths were used in this study, and the spectral output of the UV-B and
UV-C bulbs is shown in Figure 4.6. The UV-C bulbs had a monochromatic output at
around 254 nm, whilst the UV-B bulb had a wider range of wavelengths with a peak
at 300 to 325 nm (outputs above 400 nm were blocked by the filter mounted on the
detector head). As this bulb had a wider output spectrum, its output is referred to as
‘UV-B’ rather than a specific wavelength (i.e., 302nm as described by
manufacturers). No UV-C radiation is delivered by the UV-B bulb. Bulbs with similar
properties to those used in this study have been used by several other authors: UV-C
(Kellogg and Paul, 2002); UV-B (Kumar et al., 2003; Zenoff et al., 2006; Dib et al.,
2008).
In the literature, the term ‘UV dose’ has been widely used. However this term is
incorrect, as it implies that all UV output is absorbed by the test organism, whereas in
reality little of the delivered UV energy is actually absorbed by the test organism.
Fluence is the correct term. Fluence cannot be measured directly, but it can be
inferred from two accurately monitored variables: fluence rate (power delivered from
UV bulbs) and exposure time. Fluence rate was measured using an IL1400A

104
Figure 4.6 Spectral output of UV-C (top) and UV-B (bottom) bulbs (unspecified power unit on y axis, x axis shows wavelength in nm; UVP, 2010)

105
radiometer fitted with a SED005/U sensor and a WBS320 wide band UV-IR filter
(both International Light; calibrated June 2009 by International Light). A UV-visible
domed Teflon diffuser was also fitted and a spectral response curve of the sensor/filter
unit (International Light) was used to determine the calibration factor to be used for
different wavelengths.
Initial tests were carried out to characterise UV bulb output and to ascertain when
stability was reached. The bulbs were labelled sequentially from one to four
corresponding to their position in the box. To ensure continuity the same bulbs were
used in the same positions for all experiments. These experiments were repeated on
three consecutive days with the mean values being reported (Figures 4.7and 4.8).
UV bulb output (fluence rate) was stable after approximately 30 minutes.
Temperatures in the bulb compartment and irradiation stage increased gradually, then
stabilised. Bulb temperatures increased to ~40 °C whilst compartment temperature
rose to ~23 °C. Efficacy of UV disinfection is not affected by pH or temperatures
between 20 °C and 40 °C (Severin et al., 1983; Abu-Ghararah, 1997; USEPA, 2003),
so the observed temperature increase in the sample compartment was not considered
significant, in terms of its impact on the outcome of the experiment. During sample
irradiation, bulbs were switched on one hour prior to commencement of inactivation
to ensure consistency of UV output.

106
Figu
re 4
.7 U
V-B
bul
b flu
ence
rate
, com
partm
ent t
empe
ratu
re a
nd b
ulb
com
partm
ent t
empe
ratu
re d
urin
g pr
elim
inar
y ex
perim
ent.
Each
dat
a po
int i
s the
mea
n of
thre
e ex
perim
ents
and
err
or b
ars r
epre
sent
1 st
anda
rd d
evia
tion
abov
e an
d be
low
the
mea
n.
202530354045
015
3045
6075
9010
512
0Tim
e (m
inutes
)
Temperature (°C)
400
450
500
550
600
650
700
Fluence rate (μW/cm2)
Bulb
tempe
ratur
e
Comp
artme
nttem
pera
ture
Fluen
ce ra
te

107
Figu
re 4
.8 U
V-C
bul
b flu
ence
rate
, com
partm
ent t
empe
ratu
re a
nd b
ulb
com
partm
ent t
empe
ratu
re d
urin
g pr
elim
inar
y ex
perim
ent.
Each
dat
a
poin
t is t
he m
ean
of th
ree
expe
rimen
ts a
nd e
rror
bar
s rep
rese
nt 1
stan
dard
dev
iatio
n ab
ove
and
belo
w th
e m
ean.
202530354045
015
3045
6075
9010
512
0Ti
me (m
inutes
)
Temperature (°C)
690
700
710
720
730
740
750
760
770
Fluence rate (μW/cm2)
Bulb
tempe
rature
Comp
artme
nttem
pera
ture
Fluen
ce ra
te

108
4.4 UV Inactivation Methods
Irradiation of B124 phages was carried out in two phases. All phage suspensions were
subjected to Phase One screening tests (to highlight differences between phage
specimens), from which seven were selected for more thorough Phase Two
investigation. To ensure an efficient use of time, media, and materials, the method
used during Phase One screening experiments was simpler than the method used
during the detailed experiments.
4.4.1 Phase One initial screening irradiation experiments
Initial screening irradiation experiments were conducted in accordance with
previously described methods (Tartera et al., 1988a; Havelaar et al., 1990; Nicholson
and Galeano, 2003; Shin et al., 2005).
For each phage specimen, 15 ml was warmed to room temperature, diluted to ~105
PFU/ml (using buffer given in Section 4.1.2) and pipetted into a 53mm diameter Petri
dish. Immediately prior to phage exposure, the fluence rate directly below the
collimating tube aperture was measured. This was the fluence rate used for the fluence
calculation. Fluence rate was determined before each exposure. This petri dish
containing the phage suspension was then placed directly below the collimating tube,
with the shutter in place. The suspension surface was 20 cm from the base of the
lamps, allowing higher fluence rate than would be used in the Phase Two
experiments. Stirring was initialised ten seconds before UV exposure to ensure
homogenous distribution of phages within samples. A preliminary experiment was
carried out to determine if stirring decreased PFU/ml. Phage suspensions were stirred
in situ for 4, 6, 8, and 10 minutes without UV and assayed in triplicate (along with a

109
control - no UV, no stirring) using the double-agar technique. No decrease in titre was
observed, and it was assumed that slow stirring had no influence on phage
inactivation. UV bulbs two and three were used during all screening experiments. A
timer was started when the shutter was withdrawn and at predetermined intervals, the
shutter was replaced, suspensions removed from the box, and a 400 µl aliquot taken
for assay from which a dilution series was created. In order to avoid any shadowing of
the solution by the meniscus (refracting UV light, excluding it from the edges of the
Petri dish), aliquots were taken from the centre of the Petri dish (Havelaar et al.,
1990). All test aliquots were assayed in triplicate using the double-agar method
detailed above. The suspension was then returned to the box, the shutter removed and
the timer restarted. For UV-B experiments, aliquots were taken every minute, whereas
for UV-C aliquots were taken every 10 seconds. These time intervals were determined
in a series of pilot experiments to determine inactivation time frames. Temperature in
both the bulb and sample compartments were consistent with the preliminary study
(i.e., ~40 °C and ~23°C respectively, Figures 4.7 and 4.8). Each phage suspension
was subject to three experimental runs for each wavelength.
The fluence received by the irradiated sample is given by:
D = It
where: D = fluence (mJ/cm2)
I = fluence rate (mW/cm2)
t = exposure time
(Metcalf and Eddy, 2003)

110
4.4.2 Phase Two inactivation experiments
Seven phage suspensions were selected for further experimentation (the rationale for
selecting these phages is presented in Chapter Seven). For this set of experiments, the
methodology was altered to ensure greater accuracy and precision, allowing data to be
compared with other studies using CB apparatus. Fluences were calculated using the
UVCalc spreadsheet (kindly provided by Professor James R. Bolton of Bolton
Photosciences Ltd), which is based upon the work presented by Bolton and Linden,
(2003) in which the collimated beam methodology was standardised (this paper has
been cited by over 100 authors as of 24 March 2010, according to Web of Science). A
broadly similar standardization protocol of collimated beam experimentation was
presented by Kuo et al (2003).
The phage suspensions were diluted to a final concentration of 105 PFU/ml using the
buffer described in Section 4.1.2. As with the screening experiments, the UV box was
switched on one hour before the first experiment allowing the bulbs to reach a stable
temperature. Phage suspensions were equilibrated to room temperature before
irradiation. Samples were stirred in situ, protected from UV light by the shutter, for 10
seconds before UV exposure, ensuring a fully mixed sample. Prior to each exposure,
the fluence rate at the centre of the beam (E0) was measured and entered into the
UVCalc spreadsheet. UV-C bulb output varied during the experimental run by ± 2
μW/cm2 and UV-B bulb output tended to vary by ± 4 μW/cm2. Exposure times were
adjusted to correct for this. Data from the screening experiments identified estimated
UV-C fluences required to inactivate samples to 99%, and seven fluences were
chosen to capture this inactivation (0, 5, 10, 15, 20, 25, and 30 mJ/cm2). For UV-B,
fluences of 0, 50, 100, 150, 200, 250 and 300 mJ/cm2 were used.

111
Rather than taking aliquots for assay from the Petri dish then returning suspension
under UV beam until next target-time was reached (as in Phase One experiments),
each fluence experiment was carried out separately using a new 10 ml volume of
phage suspension.
Each exposure was repeated three times with samples being irradiated in a random
order. Upon completion of exposure, the phage suspensions were removed from the
UV box and stored in light-tight glass tubes, in the dark at 4 °C until all exposures had
been carried out. UV-C test samples were assayed on the same day as inactivation
experiments, whereas UV-B irradiated suspensions were assayed the next day; this
was because longer inactivation periods were required by UV-B. Prior to inactivation
experiments, stability of phages in light tight glass tubes stored at 4 °C was tested
over three days and no decrease in the titre was observed.
A dilution series of each irradiated suspension was created immediately prior to
analysis and assayed using the double-agar method described previously. Two
dilutions were selected for assay, with each assayed in triplicate. Therefore 18 plaque
assays were conducted for each fluence. Temperatures in both the bulb and sample
compartments were consistent with the preliminary study (i.e., 40 °C and 23 °C
respectively; Figures 4.7 and 4.8). Plates containing more than 300 PFU were not
included in the analysis (as individual plaques were not clearly distinguishable), and
no lower exclusion limit was used, as it was necessary to ascertain when total
inactivation occurred (i.e., evidence of tailing). The lower limit of sensitivity of assay
is < 1 PFU/100μl.

112
4.4.3 Statistical analysis of Phase Two experiments
In order to give accurate fluence measurements, a number of corrections to the
equation given in Section 4.4.1 were considered necessary.
These were:
- The Petri factor
Fluence rate varies over the surface of the Petri dish and it is necessary to correct
for this. A 0.5 cm x 0.5 cm grid was produced, covering the Petri dish area and
centred in the middle of the beam. UV fluence rate was measured every 0.5 cm
along the x and y axis, and the ratio of each reading to the centre reading was
calculated. The mean of these ratios gives the Petri factor. In order to improve
accuracy, the sensor was partially blinded using UV impenetrable material,
leaving a detection area of 2mm2. Using a partially blinded sensor does not give
accurate readings of fluence rate, but this is of no consequence, as it is only the
ratio of the readings that are important. The Petri factor was determined for each
wavelength before commencement of exposures;
- Reflection factor
UV light is reflected back towards the source when the beam passes between
media (in this case air and water). For an air/water interface this is constant at
0.975 (Bolton and Linden, 2003);
- Water factor
This accounts for the amount of UV adsorbed by liquid as the beam penetrates the
phage suspension and is given by:

113
where:
a = decadic absorption coefficient (cm-1)
l = vertical path length of water in Petri dish being irradiated
The above equation is only suitable for completely mixed samples, and is derived
from integration of the Beer-Lambert law over the same depth (Morowitz, 1950;
Bolton and Linden, 2003). The absorption coefficient for each phage suspension
was measured using a UV visible spectrophotometer, which had been zeroed
using distilled water. This was then replaced with phage suspension and the
absorption coefficient (path length 1 cm) at the wavelength being investigated
(254 nm and 302 nm); and
- Divergence factor
As the UV beam is not collimated perfectly (i.e., it displays divergence), a
correction is necessary:
where:
L = distance from UV bulb to surface of suspension (cm)
l = vertical path length of liquid in Petri dish being irradiated (cm)
The distance from the UV bulb to the suspension surface, and the sample volume
remained constant throughout the detailed experiments.

114
Determination of fluence rate
The average germicidal fluence rate (E’avg) is therefore given by the following
equation:
E’avg = E0 (fluence rate at the centre of the beam) X Petri
Factor X Reflection Factor X Water Factor X Divergence
Factor
(Bolton and Linden, 2003)
The fluence (mJ/cm2) a suspension receives is given by E’avg (mJ/cm2) multiplied by
exposure t (s).
The UVCalc spreadsheet was used to calculate exposure times required for chosen
fluences.
The identification and observance of the factors outlined above helped ensure that the
experimental design was sound, and that the results obtained during this investigation
were robust, reproducible and reliable. What’s more, it is possible to compare the
results from this investigation with the findings from previous studies. As such, the
results should further our understanding of the behaviour (persistence and survival) of
such phages and consequently help determine their suitability as surrogates for human
enteric viruses. The following chapter details the findings of the isolation and
characterisation experiments, whilst the next chapters present the results of the
inactivation experiments.

115
CHAPTER FIVE
5. RESULTS OF ISOLATION AND CHARACTERISATION OF
B124 PHAGES
In order to act as an effective phage-lysis MST tool, it is desirable that any bacterial
host strain detects a homogenous group of phage, as diverse groups of phage, such as
somatic coliphages may demonstrate differential inactivation kinetics in different
water matrices, making inter-site comparisons problematic. This chapter assesses the
similarity of isolated B124 phages using morphological and host range characteristics.
These data, and those detailed in the next chapter that present the results of Phase One
inactivation experiments, informed the decision as to which phages would be selected
for Phase Two inactivation experiments.
5.1 Phage isolation
During each round of phage isolation, 20 or 21 plaques were picked from final
effluent double-agar plates; 61 plaques being picked in total. The proportion of picked
plaques successfully propagated and stored in high titre (~1010 PFU/ml) culture was
33%. The remaining 67% of plaques unsuccessfully propagated may have contained
lysogenic phage strains (unlikely because of presence of initial plaque), bacteriocins
able to destroy bacterial lawn, thus giving the appearance of plaques (as reported by
Booth et al., 1979), or may have been damaged in some way by the culturing
technique. As detailed in Chapter Four, to achieve 27 mls of high titre phage
suspension, two rounds of host infection were necessary. Firstly, an inoculation of a
27 ml GB-124 culture in exponential growth phase with a picked plaque, and
secondly, this 27 ml lysate was used to inoculate a 620 ml GB-124 culture in

116
exponential growth phase. After each stage of infection, the titre of lysate was tested
in triplicate by double-agar assay (Table 5.1).
Table 5.1 Titres and plaque size of B124 phages during isolation process
Phage ID (B124-)
Stage 1 lysate (PFU/ml)
Stage 2 lysate (PFU/ml)
Plaque size range (mm)
1 1.00 x 10² 1.47 x 10¹⁰ 0.2 to 1.5 2 1.42 x 10⁴ 4.00 x 10⁸ 0.2 to 1.1 3 1.21 x 10³ 1.02 x 10¹⁰ 0.5 4 9.20 x 10³ 1.00 x 10¹⁰ 0.3 to 1.5 10 4.50 x 10² 1.60 x 10⁹ 1 to 3.6 12 3.00 x 10² 2.22 x 10¹⁰ 0.3 to 2.5 14 3.56 x 10² 1.30 x 10¹⁰ 0.2 to 1 17 1.43 x 10⁴ 7.50 x 10⁹ 1 to 3.8 20 2.00 x 101 4.40 x 10⁸ 0.2 to 1.5 21 1.23 x 10⁴ 1.80 x 10¹⁰ 0.2 to 1 22 9.00 x 10² 5.75 x 10¹⁰ 0.9 to 3.8 25 1.00 x 10⁴ 5.00 x 10¹⁰ 0.2 to 3.2 26 5.00 x 10³ 5.60 x 10¹⁰ 0.2 to 1 29 4.00 x 10³ 3.63 x 10¹⁰ 1 to 3 30 1.10 x 10⁴ 2.44 x 10¹⁰ 1 to 4.9 31 2.10 x 101 2.10 x 10⁸ 0.2 to 4 35 3.00 x 10² 1.80 x 10¹¹ 1.2 to 3.1 45 1.00 x 10³ 7.00 x 10¹⁰ 2.1 to 3.1 54 2.36 x 10³ 1.10 x 10¹¹ 1 to 3 57 4.80 x 10² 1.00 x 10¹¹ 3 to 4.2
Single plaques produced ‘stage one’ non chloroform treated lysates of between 2.00 x
101 PFU/ml (B124-20) and 1.43 x 10⁴ PFU/ml (B124-17). The range of stage one
lysates was 1.42 x 10⁴ PFU/ml with a mean value of 4.37 x 10³ PFU/ml (n = 20), and
PFU/ml of stage two lysates was between 2.10 x 10⁸ PFU/ml and 1.80 x 10¹¹ PFU/ml
(range = 1.80 x 10¹¹ PFU/ml, mean = 3.91 x 10¹⁰ PFU/ml, n = 20). Correlation
analysis showed that the titre of the second stage lysate was not significantly related
to the titre of the first stage lysate (R2 = 0.076 %, n = 20).

117
Plaque sizes during stage one and stage two isolation varied between phage
specimens, and also within plates of the same phage specimen (see Table 5.1). Figure
5.1 shows typical plaques caused by lytic phages infecting GB-124.
Figure 5.1 Example of plaques caused by phage infecting GB-124 present in municipal wastewater
The range of plaque sizes recorded ranged from approximately 0.2 mm to 4.9 mm in
diameter. It was interesting to note that the plaque size range was constant between
stage one and stage two lysates. There are numerous reasons why plaque size might
be expected to vary on the same plate (e.g., the gel-strength of the semi-solid agar).
Phage isolates from the environment, rather than from pure laboratory strains, may
have different replication and adsorption rates when re-plated. Delayed adsorption to
new host cell by certain replicated phages once on the plate, may create greater
variation in plaque size (Adams, 1959). This can be minimised by allowing phage and
host to mix prior to plating, though this was shown to have no effect on plaque size

118
variation during the research. To facilitate faster phage diffusion through agar,
reducing differential plaque sizes, agar density of both ssBPRMA and BPRMA was
lowered to 0.65% and 1% respectively (original values were 0.8% and 1.6%).
Resulting plaques were the same size as those recorded on original strength plates and
PFU/ml of samples were consistent. For all subsequent analyses original agar
strengths were used.

119
5.2 Transmission Electron Microscopy
In order to assess the morphology of the twenty isolated B124 phages, they were
examined using transmission electron microscopy (TEM). Phage micrographs are
shown in Figures 5.2 to 5.7, and the dimensions are summarised in Table 5.2. For
reasons of space, not all phages are presented in the figures below. Both
phosphotungstic acid and uranyl acetate stains were used during TEM, with uranyl
acetate producing clearer images. However, staining with uranyl acetate produced
both positively (black coloured) and negatively (white coloured) stained virions, often
on the same grid (as has been described elsewhere; Ackermann, 2009). Examples of
both a positively and negatively stained B124-17 phages are shown in Figure 5.5.
Each dimension given in table 5.2 is the mean value of five virion measurements.
All isolated B124 phages had binary morphology with an icosahedral capsid and a
non-contractile helical tail, placing them in the Caudoviriale order, Siphoviridae
family. As described in the literature review, the Caudovirale order is divided into
three families, Siphoviridae, Myoviridae and Podoviridae. Members of these families
are distinguishable by tail length and structure (long non-contractile, long contractile,
and short non-contractile respectively). The presence of both an icosahedral capsid
and helical tail identifies the genetic material of all isolated B124 phages as dsDNA.
All phages had capsids that were non-elongated, with diameters ranging from 50 nm
to 70 nm, and it is apparent from the micrographs that both positively and negatively
stained capsids of the same phage specimen appear to be different sizes (Figure 5.5).
As is consistent with the literature, positively stained capsids appear smaller than
negatively stained capsid, and as the majority of phages were only positively stained,

120
the capsid measurements based on positive stains only (given in Table 5.2) should be
treated with caution. However, as some phage specimen micrographs show both types
of staining of the same phage specimen, it is possible to estimate the negatively
stained capsid size from positively stained virions A shrink of positively stained
specimens between 10 nm – 26 nm was observed.
Figure 5.2 Positively stained B124-1 siphovirus showing ‘curly’ tail (L) and straight tail (R)
Figure 5.3 Positively stained B124-3 siphovirus showing ‘curved’ tail (L) and ‘kinked’ tail (R)

121
Figure 5.4 Negatively stained B124-12 siphovirus showing ‘curved’ tail (L) and straight tail (R)
Figure 5.5 B124-17 straight-tailed siphovirus showing negative staining (L) and positive staining (R)

122
Table 5.2 Morphological characteristics of B124 bacteriophages
Phage ID (B124-)
Capsid shape
Mean capsid diameter (nm) Tail shape Mean tail width (nm) Mean tail length (nm) Family
1 Icosahedral (P)† 64 nm (SD = 4.16) (n = 5) Curled/straight 13 nm (SD = 1.67) (n = 5) 195 nm (SD = 9.09) (n = 5) Siphoviridae 2 Icosahedral (P) 59 nm (SD = 4.98) (n = 5) Straight 12 nm (SD = 1.58) (n = 5) * Siphoviridae 3 Icosahedral (N)‡ 72 nm (SD = n/a) (n = 1)
(P) 62 nm (SD = 5.90) (n = 5) Slightly curved/straight -
11 nm (SD = 1.82) (n = 5) -
166 nm (SD = 5.86) (n = 5) Siphoviridae
4 Icosahedral (P) 60 nm (SD = 7.30) (n = 5) Slightly curved/straight 13 nm (SD = 1.10) (n = 5) 210 nm (SD = 9.35) (n = 5) Siphoviridae 10 Icosahedral (P) 60 nm (SD = 5.37) (n = 5) Straight 13 nm (SD = 0.89) (n = 5) * Siphoviridae 12 Icosahedral (N) 70 nm (SD = 3.70) (n = 5) Slightly curved/straight 12 nm (SD = 1.48) (n = 5) 167 nm (SD = 5.26) (n = 5) Siphoviridae 14 Icosahedral (P) 65 nm (SD = 5.54) (n = 5) Straight 12 nm (SD = 1.79) (n = 5) 165 nm (SD = 6.08) (n = 5) Siphoviridae 17 Icosahedral (N) 71 nm (SD = 5.32) (n = 5)
(P) 45 nm (SD = n/a) (n = 1) Straight 12 nm (SD = 1.58) (n = 5)
- 120 nm (SD = 6.12) (n = 5)
- Siphoviridae
20 Icosahedral (P) 60 nm (SD = 2.68) (n = 5) Slightly curved 12 nm (SD = 0.84) (n = 5) 120 nm (SD = 4.82) (n = 5) Siphoviridae 21 Icosahedral (P) 65 nm (SD = 5.90) (n = 5) Long wavy tail 13 nm (SD = 1.10) (n = 5) 245 nm (SD = 7.13) (n = 5) Siphoviridae 22 Icosahedral (N) 70 nm (SD = 4.38) (n = 5)
(P) 50 nm (SD = n/a) (n = 1) Straight and curved 13 nm (SD = 0.84) (n = 5)
- 163 nm (SD = 23.93) (n = 5)
- Siphoviridae
25 Icosahedral (P) 50 nm (SD = 4.12) (n = 5) Straight and curved 12 nm (SD = 0.89) (n = 5) 135 nm (SD = 5.64) (n = 5) Siphoviridae 26 Icosahedral (P) 50 nm (SD = 4.53) (n = 5) Straight and curved 12 nm (SD = 0.71) (n = 5) 135 nm (SD = 7.33) (n = 5) Siphoviridae 29 Icosahedral (P) 59 nm (SD = 4.32) (n = 5) Straight and curved 13 nm (SD = 1.22) (n = 5) 160 nm (SD = 9.50) (n = 5) Siphoviridae 30 Icosahedral (P) 65 nm (SD = 5.22) (n = 5) Slightly curved 12 nm (SD = 2.28) (n = 5) 181 nm (SD = 8.89) (n = 5) Siphoviridae 31 Icosahedral (P) 58 nm (SD = 6.06) (n = 5) Straight 12 nm (SD = 0.84) (n = 5) 164 nm (SD = 4.92) (n = 5) Siphoviridae 35 Icosahedral (P) 59 nm (SD = 5.76) (n = 5) Straight 12 nm (SD = 1.64) (n = 5) 145 nm (SD = 13.56) (n = 5) Siphoviridae 45 Icosahedral (P) 60 nm (SD = 5.41) (n = 5) Straight 12 nm (SD = 1.79) (n = 5) 148 nm (SD = 13.67) (n = 5) Siphoviridae 54 Icosahedral (P) 59 nm (SD = 5.45) (n = 5) Straight 12 nm (SD = 1.22) (n = 5) 200 nm (SD = 8.79) (n = 5) Siphoviridae 57 Icosahedral (P) 58 nm (SD = 4.56) (n = 5) Slightly curved 13 nm (SD = 1.67) (n = 5) 160 nm (SD = 10.16) (n = 5) Siphoviridae
† P = positive stain ‡ N= negative stain * It was not possible to determine tail lengths of B124-2 and B124-10 on micrographs

123
Tail shape appeared to be homogenous, showing little variation and the majority of
phages having straight (Figure 5.2 R) or slightly curved tails (Figure 5.3 L and 5.4 L).
However, tail length varied from 120 nm (B124-17, Figure 5.5) to 245 nm (B124-21,
Figure 5.6). Tail width was consistent throughout, being around 12.5 nm, and tail
fibres or other appendages were not observed. Small kinks or curves may be caused
by the staining process, and may not be indicative of true morphological variation (see
Section 2.2.1). Of all 20 samples, two phages had distinct tails: B124-21 had a long
(245 nm) ‘wavy’ tail and some B124-1 virions had a curled tail [though this may be a
result of virion damage indicated by the offset head-neck joint; Figure 5.2 (L)].
Capsid damage was also evident on positively stained phage, notably B124-2 and
other phage micrographs show head and tail disassociation (B124-22, Figure 5.7 L).
Susceptibility of phages to damage may indicate why only 33% of picked plaques
were successfully propagated.
Figure 5.6 Phage B124-21 with head damage/shrinkage (L), and showing long wavy tail (R)

124
The damage to some virions suggested at first glance that Podoviridae were present in
some samples (see Figure 5.7 R). However the presence of Podoviridae in the isolated
phage suspensions is disputable. When examined under the electron microscope,
phage suspensions containing presumed Podoviridae (B124-3, B124-31, B124-45 and
B124-57) also contained disassociated tails. Tail-less phages observed may be
siphoviruses with tail damage, and as these damaged virions were found in isolation
(i.e., one or two per grid), it suggests virion damage rather than genuine Podoviridae.
Micrographs of bf-1 phage given in Booth et al (1979) also show disassociated tails
with kinked and straight tailed varieties of the same phage.
Figure 5.7 Phage B124-22 with head damage and disassociated tails (L) and false Podoviridae B124-57 (R)

125
5.3 B124 phage host range
The host range of B124 phages was assessed using two B. fragilis strains previously
proposed as detecting phage exclusively present in human faecal material: HSP-40
(Tartera and Jofre, 1987) and RYC-2056 (Puig et al., 1997, 1999). The results are
shown in Table 5.3. All B124 phage, excluding B124-35, were able to infect RYC-
2056, tending to have marginally lower titres (though not statistically significant;
paired t test; P = 0.06) when plated on RYC-2056 [mean GB-124 = 3.17 x 10¹⁰
PFU/ml (n = 20), mean RYC-2056 = 3.67 x 10⁹ PFU/ml (n = 20)]. Morphology of
B124-35 has no distinctive characteristics, suggesting morphology may not influence
phage host range. There was no correlation between PFU/ml when plated on GB-124
and RYC-2056 (R2 = 0.11 %) and no clear relationship was evident between B124
phage plaque size when plated on RYC-2056 and GB-124. Some phages produced
larger maximum plaques on GB-124 than RYC-2056 (B124-1, -10, -12, -14, 17, -22, -
25, -29, -30, -31, -45, -54 and -57), whilst some produced smaller plaques (B124-2, -
3, -4, -20, -21 and -26). Overall, plaques tended to be more homogenous in size when
plated on RYC-2056 than when plated on GB-124 with less ‘in-plate’ variation (see
standard deviation data in table 5.3.) The mean standard deviation of all RYC-2056
plaques was 0.30 (n = 200) and GB -124 plaques was 0.66 (n = 200). None of the
isolated B124 phages were able to cause bacterial lysis when plated on HSP-40.
The high homogeneity of isolated B124 phages is evident not only from virion
morphology but also in host range. Moreover, intra-Family variation appears to be
limited, with the majority of isolated phages having a capsid of 50 nm to 70 nm in
diameter, and a straight/slightly curved tail between 120 nm and 200 nm (the
exception being B124-21 which had a relatively long wavy tail). This high

126
homogeneity is a positive characteristic in relation to MST. The following chapters
report the UV inactivation of B124 phage, assessing if morphological and host range
homogeneity corresponds to congruent behaviour during UV irradiation.

127
Table 5.3 Host range of B124 phages using HSP-40 and RYC-2056
Phage ID (B124-)
PFU/ml GB-124
Mean GB-124 Plaque size (mm)
Able to infect RYC-2056
PFU/ml RYC-2056 Mean RYC-2056 Plaque size (mm)
Able to infect HSP-40
1 1.47 x 10¹⁰ 1.1 mm (SD = 0.51) (n = 10) Y 5.60 x 10⁹ 1.0 mm (SD = 0.28) (n = 10) N 2 4.00 x 10⁸ 0.9 mm (SD = 0.44) (n = 10) Y 7.60 x 10⁸ 1.3 mm (SD = 0.26) (n = 10) N 3 1.02 x 10¹⁰ 0.6 mm (SD = 0.21) (n = 10) Y 1.69 x 10⁹ 1.0 mm (SD = 0.28) (n = 10) N 4 1.00 x 10¹⁰ 0.9 mm (SD = 0.40) (n = 10) Y 3.70 x 10⁹ 1.7 mm (SD = 0.53) (n = 10) N 10 1.60 x 10⁹ 2.2 mm (SD = 0.80) (n = 10) Y 2.06 x 10⁸ 0.6 mm (SD = 0.21) (n = 10) N 12 2.22 x 10¹⁰ 1.5 mm (SD = 0.76) (n = 10) Y 4.70 x 10⁸ 1.2 mm (SD = 0.26) (n = 10) N 14 1.30 x 10¹⁰ 0.7 mm (SD = 0.30) (n = 10) Y 6.40 x 10⁹ 0.6 mm (SD = 0.21) (n = 10) N 17 7.50 x 10⁹ 2.4 mm (SD = 0.77) (n = 10) Y 5.40 x 10⁹ 1.4 mm (SD = 0.58) (n = 10) N 20 4.40 x 10⁸ 1.4 mm (SD = 0.81) (n = 10) Y 7.70 x 10⁸ 1.6 mm (SD = 0.44) (n = 10) N 21 1.80 x 10¹⁰ 0.6 mm (SD = 0.28) (n = 10) Y 1.04 x 10⁹ 1.2 mm (SD = 0.35) (n = 10) N 22 5.75 x 10¹⁰ 2.1 mm (SD = 1.31) (n = 10) Y 1.50 x 10¹⁰ 1.3 mm (SD = 0.48) (n = 10) N 25 5.00 x 10¹⁰ 2.0 mm (SD = 0.92) (n = 10) Y 1.30 x 10⁹ 1.7 mm (SD = 0.26) (n = 10) N 26 5.60 x 10¹⁰ 0.7 mm (SD = 0.31) (n = 10) Y 1.68 x 10¹⁰ 2.1 mm (SD = 0.21) (n = 10) N 29 3.63 x 10¹⁰ 1.8 mm (SD = 0.67) (n = 10) Y 7.00 x 10⁸ 1.0 mm (SD = 0.16) (n = 10) N 30 2.44 x 10¹⁰ 2.9 mm (SD = 1.26) (n = 10) Y 2.70 x 10⁸ 1.1 mm (SD = 0.21) (n = 10) N 31 2.10 x 10⁸ 2.1 mm (SD = 1.25) (n = 10) Y 4.50 x 10⁷ 0.9 mm (SD = 0.24) (n = 10)* N 35 1.80 x 10¹¹ 2.1 mm (SD = 0.62) (n = 10) N - - N 45 7.00 x 10¹⁰ 2.6 mm (SD = 0.37) (n = 10) Y 6.20 x 10⁸ 0.8 mm (SD = 0.26) (n = 10)* N 54 1.10 x 10¹¹ 1.8 mm (SD = 0.86) (n = 10) Y 5.20 x 10⁹ 2.1 mm (SD = 0.21) (n = 10) N 57 1.00 x 10¹¹ 3.6 mm (SD = 0.46) (n = 10) Y 3.75 x 10⁹ 1.2 mm (SD = 0.26) (n = 10) N
* At low dilutions there were many large plaques (3mm) and an almost confluent lysis of small plaques (~1mm). At higher dilutions only small plaques were evident and this figure used to ascertain PFU/ml

128
CHAPTER SIX
6. RESULTS OF PHASE ONE UV INACTIVATION
EXPERIMENTS
Numerous different methods of phage inactivation using collimated beam apparatus
have been presented in the literature. This chapter presents the results of Phase One
screening experiments of all 20 isolated phage specimens, carried out in order to
determine general patterns of UV inactivation. Data from Phase One experiments, in
conjunction with morphological and host range data given in Chapter Five, were used
to select seven phages to undergo Phase Two inactivation experiments. Note, all P
values given are based on 95% confidence interval.
6.1 Phase One UV-C inactivation kinetics of B124 phages
6.1.1 Correlation between fluence and phage inactivation during Phase One
experiments
All 20 phage specimens showed a significant (P = 0.000) negative linear relationship
between log10 PFU/100 µl and fluence (mJ/cm2), ranging from -0.97 % (B124-12 and
B124-29) to -1.00 % (B124-2 and B124-30), with a mean of -0.98 % and 0.008 SD
(Table 6.1). Variance of correlation between phages was very limited, with all phages
showing a statistically significant relationship, meaning that the null hypothesis of the
relationship between fluence and log10 PFU/100 µl occurring as a result of chance
could be rejected.

129
Table 6.1 Pearson product-moment correlation values for log10 PFU/100μl and UV-C fluence during Phase One experiments
Phage specimen ID (B124-)
Pearson product-moment correlation
P-value
1 -0.99 0.000 2 -1.00 0.000 3 -0.99 0.000 4 -0.99 0.000 10 -0.98 0.000 12 -0.97 0.000 14 -0.98 0.000 17 -0.98 0.000 20 -0.99 0.000 21 -0.99 0.000 22 -0.99 0.000 25 -0.99 0.000 26 -0.98 0.000 29 -0.97 0.000 30 -1.00 0.000 31 -0.98 0.000 35 -0.99 0.000 45 -0.98 0.000 54 -0.98 0.000 57 -0.98 0.000
6.1.2 UV-C inactivation rate coefficient and fluence required for 1-, 2-, 3- and
4-log10 inactivation of B124 phages during Phase One experiments
To determine the inactivation rate coefficient (k), i.e., how readily the microorganism
is inactivated, the first-order disinfection model (Chick, 1908; Watson, 1908) can be
applied. The linear relationship between fluence and log10 inactivation given by:
where Nt is the organism concentration after time t (seconds), and k is the inactivation
rate coefficient (Hijnen et al., 2006). Inactivation rate coefficients allow the

130
comparison of inactivation kinetics of different organisms from different studies.
Higher k values indicate that the test organism is more easily inactivated, hence
requiring low fluences. Organisms with lower k values require more fluence for
inactivation.
The dose-response curves for all 20 phage specimens irradiated by UV-C are shown
in Figures 6.1 to 6.4, and it is evident that the phages do not display a significant
shoulder (i.e., a fluence threshold needed to initiate inactivation; shoulders are mainly
found in bacteria and bacterial spores).
All linear regression analysis (used in production of k values and fluence required for
log10 reduction in titre) was calculated with an intercept of 0 (Havelaar et al., 1990;
Hijnen et al., 2006; Hijnen, pers. comm.) allowing the data to be compared with those
of other UV inactivation studies.
The presence of a minimal shoulder in B124-17 and B124-57 was unexpected and it is
likely that this could be explained by the methodology employed during Phase One
experiments, rather than by a real dose-response relationship. This issue will be
discussed further in Chapter Eight.

131
0
0.51
1.52
2.53
3.54
4.55
05
1015
2025
3035
4045
50Fl
uenc
e (m
J/cm
2 )
Log10 (No/N)
B12
4-1
B12
4-2
B12
4-3
B12
4-4
B12
4-10
Figu
re 6
.1 D
ose-
resp
onse
cur
ves o
f B12
4-1,
B12
4-2,
B12
4-3,
B12
4-4
and
B12
4-10
pha
ges d
urin
g Ph
ase
O
ne U
V-C
inac
tivat
ion
expe
rimen
ts (d
ata
poin
ts sh
ow th
e m
ean
of 9
val
ues.
Erro
r bar
s rep
rese
nt o
ne st
anda
rd d
evia
tion
ab
ove
and
belo
w th
e m
ean)

132
0
0.51
1.52
2.53
3.54
4.55
05
1015
2025
3035
4045
5055
Flue
nce
(mJ/
cm2 )
Log10 (No/N)
B12
4-12
B12
4-14
B12
4-17
B12
4-20
B12
4-21
Figu
re 6
.2 D
ose-
resp
onse
cur
ves o
f B12
4-12
, B12
4-14
, B12
4-17
, B12
4-20
and
B12
4-21
pha
ges d
urin
g Ph
ase
O
ne U
V-C
inac
tivat
ion
expe
rimen
ts (d
ata
poin
ts sh
ow th
e m
ean
of 9
val
ues.
Erro
r bar
s rep
rese
nt o
ne st
anda
rd d
evia
tion
ab
ove
and
belo
w th
e m
ean)

133
0
0.51
1.52
2.53
3.54
4.55
05
1015
2025
3035
4045
5055
60Fl
uenc
e (m
J/cm
2 )
Log10 (No/N)
B12
4-22
B12
4-25
B12
4-26
B12
4-29
B12
4-30
Figu
re 6
.3 D
ose-
resp
onse
cur
ves o
f B12
4-22
, B12
4-25
, B12
4-26
, B12
4-29
and
B12
4-30
pha
ges d
urin
g Ph
ase
O
ne U
V-C
inac
tivat
ion
expe
rimen
ts (d
ata
poin
ts sh
ow th
e m
ean
of 9
val
ues.
Erro
r bar
s rep
rese
nt o
ne st
anda
rd d
evia
tion
ab
ove
and
belo
w th
e m
ean)

134
0
0.51
1.52
2.53
3.54
4.55
05
1015
2025
3035
4045
5055
Flue
nce
(mJ/
cm2 )
Log10 (No/N)
B12
4-31
B12
4-35
B12
4-45
B12
4-54
B12
4-57
Figu
re 6
.4 D
ose-
resp
onse
cur
ves o
f B12
4-31
, B12
4-35
, B12
4-45
, B12
4-54
and
B12
4-57
pha
ges d
urin
g Ph
ase
O
ne U
V-C
inac
tivat
ion
expe
rimen
ts (d
ata
poin
ts sh
ow th
e m
ean
of 9
val
ues.
Erro
r bar
s rep
rese
nt o
ne st
anda
rd d
evia
tion
ab
ove
and
belo
w th
e m
ean)

135
Data are presented as log10 phage inactivation (No/N) against fluence (mJ/cm2). As
was shown statistically in Table 6.1, the relationship between fluence and PFU/100μl
is linear negative, and when expressed in terms of log10 inactivation and fluence, the
inverse is apparent (i.e., as fluence increases, log10 inactivation also increases). The
dose-response curves are not entirely linear, with the majority showing a slight curve.
Phage B124-14 inactivation appears to reach a plateau between 20 mJ/cm2 and 32
mJ/cm2 (Figure 6.2). All phage specimens presented a similar relationship to
increasing fluence, and the inactivation rate coefficient can be expressed statistically,
derived from linear regression analysis (Table 6.2). k values vary from 0.065 mJ/cm2
(B124-29) to 0.106 mJ/cm2 (B124-10) with a mean value of 0.084 mJ/cm2 (SD =
0.041). All phage k values lie within ±2 SD from the mean and 4 groups based upon
SD from mean k values can be delineated (Table 6.3). The inactivation curves are
statistically different from each other (t test; P = 0.018).
Phages B124-10, -20 and -21 showed higher inactivation rate constants (0.106
mJ/cm2, 0.100 mJ/cm2 and 0.104 mJ/cm2) lying within +2 SD of the mean k value.
The largest group of phages (50%) is 1 SD below the mean (between 0.072 mJ/cm2
and 0.083 mJ/cm2). Phages with the lowest inactivation rate constants are B124-17
and -29 (0.066 mJ/cm2 and 0.065 mJ/cm2).
Determination of fluence required for log10 reductions in viral titre is a useful statistic
when assessing efficacy of UV disinfection units in water and wastewater treatment
plants. This is particularly important where effluents have pathogen removal consents
outlined in environmental legislation (e.g., when UV tertiary treatment of effluent is
mandatory, prior to discharge to shellfish waters).

136
Table 6.2 Fluence required using UV-C for each log10 reduction of phage specimens during Phase One experiments
Phage specimen
ID (B124-)
k (mJ/cm2)
P-value
Initial log10
PFU/100μl
-1 log10 reduction (mJ/cm2)
-2 log10 reduction (mJ/cm2)
-3 log10 reduction (mJ/cm2)
-4 log10 reduction (mJ/cm2)
1 (72)* 0.091 0.000 4.74 11 22 33 44 2 (63) 0.092 0.000 4.84 11 22 33 44 3 (72) 0.096 0.000 5.06 10 21 31 41 4 (72) 0.082 0.000 5.01 12 25 37 49 10 (54) 0.106 0.003 4.93 9 19 28 38 12 (63) 0.090 0.000 4.47 11 22 33 44 14 (81) 0.080 0.000 6.06 12 25 37 50 17 (81) 0.066 0.000 3.99 15 30 46 61 20 (63) 0.100 0.000 5.24 10 20 30 40 21 (72) 0.104 0.000 4.38 10 19 29 38 22 (90) 0.073 0.000 5.67 14 27 41 55 25 (81) 0.082 0.000 4.64 12 24 36 49 26 (63) 0.076 0.000 5.31 13 26 40 53 29 (81) 0.065 0.000 4.39 15 31 46 61 30 (81) 0.092 0.000 4.93 11 22 33 44 31 (90) 0.073 0.000 4.83 14 27 41 55 35 (81) 0.072 0.000 4.36 14 28 42 55 45 (81) 0.083 0.000 4.61 12 24 36 48 54 (90) 0.083 0.000 4.86 12 24 36 48 57 (90) 0.074 0.000 4.87 14 27 41 54
* number of data points included in regression analysis for each phage specimen (3 exposures for each fluence, each assayed in triplicate)
Table 6.3 Identification of phage groups based on SD of k (UV-C) during Phase One experiments
±SD k value (mJ/cm2) Phage specimen ID (B124-) Within +2 SD 0.097 – 0.108 10, 20, 21 Within +1 SD 0.085 – 0.096 1, 2, 3, 12, 30 Mean 0.084 - Within -1 SD 0.072 – 0.083 4, 14, 22, 25, 26, 31, 35, 45, 54, 57 Within -2 SD 0.060 – 0.071 17, 29

137
Rearrangement of the standard linear regression equation allows the calculation of
fluence values for the required log10 inactivation. The rearranged equation used was:
N log10 inactivation = N/k
where
N = required log10 inactivation
k = slope of line (inactivation rate constant)
Fluences required for 1-log10, 2-log10, 3-log10 and 4-log10 inactivation of phage
specimens are also given in Table 6.2. As is often reported by other authors, fluences
required to inactivate organisms are presented with no decimal places.
As the inactivation rate coefficient is constant, it is not necessary to discuss
comparative 1-log10, 2-log10 etc. values for each phage specimen and, as they are
often reported in the literature, only 4-log10 reduction values will be discussed.
Fluence required to reach 4-log10 inactivation varied between phage specimens from
38 mJ/cm2 (B124-10) to 61 mJ/cm2 (B124-29) with a mean of 49 mJ/cm2 (SD = 6.96 a
range of 23 mJ/cm2). As expected, when distributed into groups based on SD from the
mean, the pattern is broadly inverted to that found for k values (Table 6.4) with only a
few phages changing groups (this is a function of the data spread and resulting SD
calculation). This is as expected, as higher k equates to a higher rate of inactivation,
and therefore lower fluence required for 4-log10 reductions in titre. As 4-log10
reduction values are a function of k, the k values and 4-log10 reduction values are
highly correlated (R2 = 0.98)

138
Table 6.4 Identification of phage groups based on SD of 4-log10 reduction value (UV-C) during Phase One experiments
±SD 4-log10 reduction value (mJ/cm2)
Phage specimen ID (B124-)
Within +2 SD 55.55 – 62.52 17, 29 Within +1 SD 48.60 – 55.54 4, 14, 22, 25, 26, 31, 35, 57 Mean 48.59 - Within -1 SD 41.63 - 48.58 1, 2, 10, 12, 30, 45, 54 Within -2 SD 34.67 – 41.62 3, 20, 21
Neither the inactivation rate constant or the fluence required to reach 4-log10
inactivation were correlated with the initial PFU/100μl of the phage specimen (R2 =
0.011% and R2 = 0.028 % respectively), indicating that initial titre of phage
suspension being irradiated has little effect on either the rate of inactivation, or the
fluence required to reach 4-log10 inactivation. An indirect way in which phage titre
may influence fluence required to achieve a 4-log10 reduction is because of UV
absorbance of phage suspension (i.e., higher titre phage suspensions are likely to have
higher absorbance). In Phase Two experiments this will be corrected for using the
method given in Bolton and Linden (2003) and the UV-Calc spreadsheet.

139
6.2 Phase One UV-B inactivation kinetics of B124 phages
6.2.1 Correlation between fluence and phage inactivation during Phase One
experiments
As was shown with UV-C radiation, all 20 phage specimens demonstrated a
significant (P = 0.000) negative linear relationship between log10 PFU/100 µl and
fluence, in this instance ranging from -0.95 % (B124-10) to -1.00 % (B124-2, B124-
20 and B124-31), with a mean value of -0.98 % and 0.012 SD (Table 6.5).
Table 6.5 Pearson product-moment correlation values for log10 PFU/100μl and UV-B fluence during Phase One experiments
Phage specimen ID (B124-)
Pearson product-moment correlation
P-value
1 -0.96 0.000 2 -1.00 0.000 3 -0.99 0.000 4 -0.99 0.000 10 -0.95 0.000 12 -0.99 0.000 14 -0.99 0.000 17 -0.99 0.000 20 -1.00 0.000 21 -0.98 0.000 22 -0.98 0.000 25 -0.98 0.000 26 -0.98 0.000 29 -0.98 0.000 30 -0.99 0.000 31 -1.00 0.000 35 -0.98 0.000 45 -0.99 0.000 54 -0.98 0.000 57 -0.98 0.000
The variance in correlation values is extremely small, though slightly larger than that
recorded for UV-C, with all phages showing a statistically significant relationship.
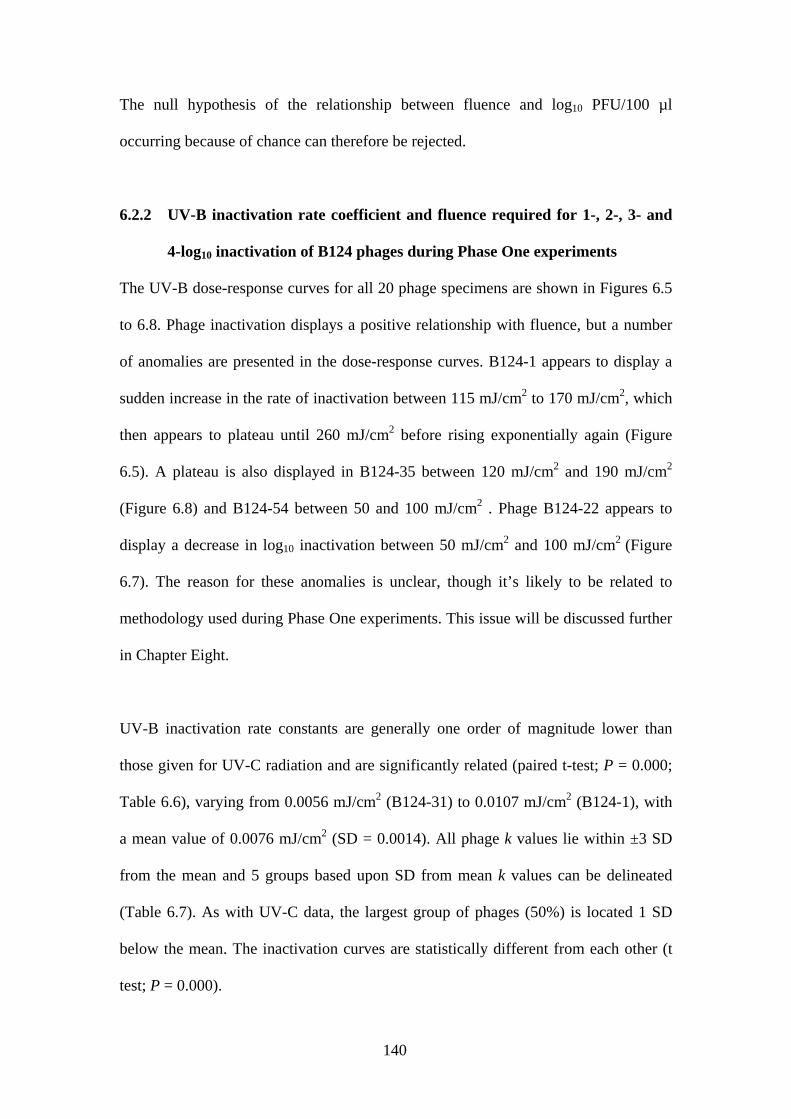
140
The null hypothesis of the relationship between fluence and log10 PFU/100 µl
occurring because of chance can therefore be rejected.
6.2.2 UV-B inactivation rate coefficient and fluence required for 1-, 2-, 3- and
4-log10 inactivation of B124 phages during Phase One experiments
The UV-B dose-response curves for all 20 phage specimens are shown in Figures 6.5
to 6.8. Phage inactivation displays a positive relationship with fluence, but a number
of anomalies are presented in the dose-response curves. B124-1 appears to display a
sudden increase in the rate of inactivation between 115 mJ/cm2 to 170 mJ/cm2, which
then appears to plateau until 260 mJ/cm2 before rising exponentially again (Figure
6.5). A plateau is also displayed in B124-35 between 120 mJ/cm2 and 190 mJ/cm2
(Figure 6.8) and B124-54 between 50 and 100 mJ/cm2 . Phage B124-22 appears to
display a decrease in log10 inactivation between 50 mJ/cm2 and 100 mJ/cm2 (Figure
6.7). The reason for these anomalies is unclear, though it’s likely to be related to
methodology used during Phase One experiments. This issue will be discussed further
in Chapter Eight.
UV-B inactivation rate constants are generally one order of magnitude lower than
those given for UV-C radiation and are significantly related (paired t-test; P = 0.000;
Table 6.6), varying from 0.0056 mJ/cm2 (B124-31) to 0.0107 mJ/cm2 (B124-1), with
a mean value of 0.0076 mJ/cm2 (SD = 0.0014). All phage k values lie within ±3 SD
from the mean and 5 groups based upon SD from mean k values can be delineated
(Table 6.7). As with UV-C data, the largest group of phages (50%) is located 1 SD
below the mean. The inactivation curves are statistically different from each other (t
test; P = 0.000).

141
0
0.51
1.52
2.53
3.54
4.55
050
100
150
200
250
300
350
400
450
Flue
nce
(mJ/
cm2 )
Log10 (No/N)
B12
4-1
B12
4-2
B12
4-3
B12
4-4
B12
4-10
Figu
re 6
.5 D
ose-
resp
onse
cur
ves o
f B12
4-1,
B12
4-2,
B12
4-3,
B12
4-4
and
B12
4-10
pha
ges d
urin
g Ph
ase
O
ne U
V-B
inac
tivat
ion
expe
rimen
ts (d
ata
poin
ts sh
ow th
e m
ean
of 9
val
ues.
Erro
r bar
s rep
rese
nt o
ne st
anda
rd d
evia
tion
ab
ove
and
belo
w th
e m
ean)

142
0
0.51
1.52
2.53
3.54
4.55
050
100
150
200
250
300
350
400
450
Flue
nce
(mJ/
cm2 )
Log10 (No/N)
B12
4-12
B12
4-14
B12
4-17
B12
4-20
B12
4-21
Figu
re 6
.6 D
ose-
resp
onse
cur
ves o
f B12
4-12
, B12
4-14
, B12
4-17
, B12
4-20
and
B12
4-21
pha
ges d
urin
g Ph
ase
O
ne U
V-B
inac
tivat
ion
expe
rimen
ts (d
ata
poin
ts sh
ow th
e m
ean
of 9
val
ues.
Erro
r bar
s rep
rese
nt o
ne st
anda
rd d
evia
tion
ab
ove
and
belo
w th
e m
ean)

143
0
0.51
1.52
2.53
3.5
050
100
150
200
250
300
350
400
Flue
nce
(mJ/
cm2 )
Log10 (No/N)
B12
4-22
B12
4-25
B12
4-26
B12
4-29
B12
4-30
Figu
re 6
.7 D
ose-
resp
onse
cur
ves o
f B12
4-22
, B12
4-25
, B12
4-26
, B12
4-29
and
B12
4-30
pha
ges d
urin
g Ph
ase
O
ne U
V-B
inac
tivat
ion
expe
rimen
ts (d
ata
poin
ts sh
ow th
e m
ean
of 9
val
ues.
Erro
r bar
s rep
rese
nt o
ne st
anda
rd
devi
atio
n ab
ove
and
belo
w th
e m
ean)

144
0
0.51
1.52
2.53
3.54
050
100
150
200
250
300
350
400
450
Flue
nce
(mJ/
cm2 )
Log10 (No/N)
B12
4-31
B12
4-35
B12
4-45
B12
4-54
B12
4-57
Figu
re 6
.8 D
ose-
resp
onse
cur
ves o
f B12
4-31
, B12
4-35
, B12
4-45
, B12
4-54
and
B12
4-57
pha
ges d
urin
g Ph
ase
O
ne U
V-B
inac
tivat
ion
expe
rimen
ts (d
ata
poin
ts sh
ow th
e m
ean
of 9
val
ues.
Erro
r bar
s rep
rese
nt o
ne st
anda
rd d
evia
tion
ab
ove
and
belo
w th
e m
ean)

145
Table 6.6 Fluence required using UV-B for each log10 reduction of phage specimens during Phase One experiments
* number of data points included in regression analysis for each phage specimen (3 exposures for each fluence, each assayed in triplicate) Table 6.7 Identification of phage groups based on SD of k (UV-B) during Phase One experiments
±SD k value (mJ/cm2) Phage specimen ID (B124-) Within +3 SD 0.0105 – 0.0117 1 Within +2 SD 0.0091 – 0.0104 12, 14, 35 Within +1 SD 0.0077 – 0.0090 2, 3, 4, 10 Mean 0.0076 - Within -1 SD 0.0063 - 0.0075 17, 20, 21, 22, 25, 26, 30, 45, 54, 57 Within -2 SD 0.0049 – 0.0062 29, 31
Based upon Phase One UV-B k values, B124-1 is the only phage located in the group
+3 SD above the mean. 4-log10 inactivation fluences ranged from 374 mJ/cm2 (B124-
1) to 713 mJ/cm2 (B124-31) with a mean value of 540 mJ/cm2 (range = 339 mJcm2;
SD = 91.05; Table 6.6). Fluence required to achieve 4-log10 inactivation of all 20
Phage specimen
ID (B124-)
k (mJ/cm2)
P-value
Initial log10
PFU/100μl
-1 log10 reduction (mJ/cm2)
-2 log10 reduction (mJ/cm2)
-3 log10 reduction (mJ/cm2)
-4 log10 reduction (mJ/cm2)
1 (117)* 0.0107 0.000 4.65 93 187 280 374 2 (126) 0.0084 0.000 4.68 120 240 359 479 3 (135) 0.0077 0.000 5.13 130 259 389 518 4 (108) 0.0082 0.000 4.95 123 245 368 490 10 (81) 0.0090 0.000 4.82 111 222 333 444 12 (135) 0.0093 0.000 4.31 108 216 324 432 14 (90) 0.0097 0.000 6.05 103 206 309 412 17 (135) 0.0070 0.000 4.60 143 287 430 574 20 (117) 0.0075 0.000 5.34 134 267 401 535 21 (135) 0.0075 0.000 4.29 133 267 400 533 22 (126) 0.0067 0.000 4.79 149 298 447 596 25 (126) 0.0065 0.000 4.72 153 306 459 612 26 (117) 0.0065 0.000 4.45 153 306 459 612 29 (99) 0.0059 0.000 4.77 170 341 511 681 30 (126) 0.0066 0.000 4.39 153 305 458 611 31 (135) 0.0056 0.000 5.32 178 357 535 713 35 (117) 0.0091 0.000 4.75 110 221 331 442 45 (135) 0.0072 0.000 4.48 139 279 418 557 54 (108) 0.0068 0.000 5.03 147 293 440 587 57 (117) 0.0066 0.000 4.90 151 302 452 603

146
phages were within ±2SD of the mean, with the largest group being within +1 SD
(45% of phage; Table 6.8).
Table 6.8 Identification of phage groups based on SD of 4-log10 reduction value (UV-B) during Phase One experiments ±SD 4-log10 reduction value (mJ/cm2) Phage specimen ID (B124-) Within +2 SD 631.22 - 722.26 29, 31 Within +1 SD 540.16 - 631.21 17, 22, 25, 26, 30, 45, 54, 57 Mean 540.15 - Within -1 SD 449.10 – 540.14 1, 2, 3, 4, 20, 21 Within -2 SD 358.05 – 449.09 10, 12, 14, 35

147
6.3 Relationship between UV-B and UV-C inactivation rates of B124 phages
during Phase One experiments
Fluences required for a 4-log10 inactivation during U V-B and UV-C exposures were
only slightly correlated (R2 = 0.48; Figure 6.9), as were k values (R2 = 0.41),
suggesting that behaviour during UV-B and UV-C radiation (based solely on Phase
One results) is reasonably consistent for phage. However, this lower than expected
correlation may be a consequence of the methodology used during the Phase One
screening experiments. This issue will be discussed further in Chapter Eight.
300
350
400
450
500
550
600
650
700
750
30 35 40 45 50 55 60 65
UV-C fluence required for 4-log10 reduction (mJ/cm2)
UV
-B fl
uenc
e re
quire
d fo
r 4-lo
g 10 r
educ
tion
(mJ/
cm2 )
Figure 6.9 Relationship between 4-log10 reduction B-124 phage fluence requirements for UV-B and UV-C radiation during Phase One experiments
Phase One experiments revealed some interesting results that were consequently used
to inform the design of Phase Two experiments. These results gave general
indications of the behaviour of B124 phages during UV-B and UV-C radiation, and
Phase Two experiments presented in the next chapter will attempt to quantify
inactivation relationships using a more detailed and in-depth methodology.

148
CHAPTER SEVEN
7. RESULTS OF PHASE TWO UV INACTIVATION
EXPERIMENTS
The results of the Phase One screening experiments presented in Chapters Five and
Six reporting the morphology and host range of different phage, identified a sub-set of
seven phages with distinct characteristics, suitable for further investigation (Phase
Two). These were:
- B124-1 (selected because of its low k value and non-characteristic dose-response
curve during UV-B irradiation);
- B124-10 (because of its contrasting response to different UV wavelengths i.e.,
highest group of k values during Phase One UV-C experiments and just above
mean k value during Phase One UV-B experiments);
- B124-12 (because it demonstrated the second highest k group in both UV-B and
UV-C Phase One experiments);
- B124-21 (because it demonstrated one of the highest k values found during Phase
One UV-C experiments but medium k during UV-B experiments, and it was the
only phage with a distinct wavy tail);
- B124-29 (because of its very low k value during both UV-B and UV-C Phase One
experiments);
- B124-35 (because it was the only phage unable to infect Bacteroides strain RYC-
2056); and
- B124-54 (because it was one of the most consistent ‘typical’ phage with near
mean k values for both UV-B and UV-C during Phase One experiments and had

149
an inactivation plateau between 50 mJ/cm2 and 100 mJ/cm2 during UV-B
irradiation).
A total of eighteen plates (two dilutions) were used for each fluence exposure (three
replicates), of which there were six (giving a total of 108 plates for each phage
inactivation curve) and each data point in the dose-response curves is a mean value
from at least nine plates. A total of 1512 plates were analysed during Phase Two
experiments. During these experiments, plaque size was recorded, and it was found
that fluence had no discernable impact on plaque dimensions or appearance (for both
UV-B and UV-C wavelengths), with plaque morphology being consistent with that
when isolated (Table 5.1).
7.1 Phase Two UV-C inactivation kinetics of B124 phages
7.1.1 Correlation between fluence and phage inactivation during Phase Two
experiments
All seven phage specimens showed a significant (P = 0.000) negative linear
relationship between log10 PFU/100 µl and fluence, displaying minimal range: from -
0.98 % (B124-10, -12, -29 and -35) to -0.99 % (B124-1, -21 and -54), with a mean
value of -0.98 % and 0.006 SD (Table 7.1). Therefore, the null hypothesis that the
relationship between fluence and log10 PFU/100 µl resulted from chance alone can be
rejected.

150
Table 7.1 Pearson product-moment correlation values for log10 PFU/100μl and UV-C during Phase Two experiments
Phage specimen ID
(B124-)
Pearson product-moment
correlation
P-value
1 -0.99 0.000 10 -0.98 0.000 12 -0.98 0.000 21 -0.99 0.000 29 -0.98 0.000 35 -0.98 0.000 54 -0.99 0.000
7.1.2 UV-C inactivation rate coefficient and fluence required for 1-, 2-, 3- and
4-log10 inactivation of B124 phages during Phase Two experiments
The dose-response curves for UV-C irradiation of all seven phage specimens are
shown in Figure 7.1. As in Chapter Six, data are presented as log10 phage inactivation
(No/N) against fluence (mJ/cm2).
The relationship between log10 inactivation and fluence is linear positive (i.e., as
fluence increases, log10 inactivation increases accordingly) and no shoulder or tail
were present in the data, indicating that all phages followed first order kinetics (i.e.,
the rate of inactivation was proportional to the fluence delivered). All phage
specimens displayed a similar relationship to increasing fluence, and the slope of the
inactivation curves derived from linear regression analysis is shown in Table 7.2. k
values varied from 0.099 mJ/cm2 (B124-54) to 0.139 mJ/cm2 (B124-10) with a mean
value of 0.114 mJ/cm2 (SD = 0.014, range = 0.04 mJ/cm2). All phage k values lay
within ±2 SD from the mean, and four groups were delineated (Table 7.3).

151
0.0
0
0.5
0
1.0
0
1.5
0
2.0
0
2.5
0
3.0
0
3.5
0
4.0
0
4.5
0
5.0
0
05
10
15
20
25
30
35
Flu
en
ce
(m
J/c
m2 )
Log10(No/N)
B1
24
-1B
12
4-1
0B
12
4-1
2B
12
4-2
1B
12
4-2
9B
12
4-3
5B
12
4-5
4
Figu
re 7
.1 D
ose-
resp
onse
cur
ves o
f pha
ges B
124-
1, B
124-
10, B
124-
12, B
124-
21, B
124-
29 B
124-
35
and
B12
4-54
dur
ing
Phas
e Tw
o U
V-C
inac
tivat
ion
expe
rimen
ts (d
ata
poin
ts sh
ow th
e m
ean
of 9
val
ues.
Erro
r bar
s rep
rese
nt o
ne st
anda
rd
devi
atio
n ab
ove
and
belo
w th
e m
ean)

152
Phage B124-10 had the largest inactivation rate constant, laying within +2 SD of the
mean k value, and B124-54 the lowest k value, located -2 SD below the mean. The
largest group of phages (42%) was located one SD below the mean with 28% lying
one SD above the mean. Although groups based on SD can be identified, statistical
analysis shows that the inactivation curves are not significantly different (t test; P =
0.874).
Table 7.2 Fluence required for each log10 reduction of phage specimens during Phase Two UV-C irradiation
Phage specimen
ID (B124-)
k (mJ/cm2) P-value Initial log10 PFU/100μl
-1 log10 reduction (mJ/cm2)
-2 log10 reduction (mJ/cm2)
-3 log10 reduction (mJ/cm2)
-4 log10 reduction (mJ/cm2)
1 (54) 0.113 0.000 5.00 9 18 27 35 10 (54) 0.139 0.000 4.84 7 14 22 29 12 (54) 0.121 0.000 4.77 8 17 25 33 21 (54) 0.117 0.000 4.96 9 17 26 34 29 (54) 0.101 0.000 4.24 10 20 30 40 35 (54) 0.107 0.001 4.19 9 19 28 37 54 (54) 0.099 0.000 4.10 10 20 30 41
* number of data points included in regression analysis for each phage specimen (3 exposures for each fluence, each assayed in triplicate)
Fluences required to achieve a 4-log10 phage inactivation ranged from 29 mJ/cm2
(B124-10) to 41 mJ/cm2 (B124-54). The mean was 36 mJ/cm2, the range was 12
mJ/cm2 and the SD was 4.07 mJ/cm2.
Table 7.3 Identification of phage groups based on SD of k (UV-C) during Phase Two experiments
±SD k value (mJ/cm2) Phage specimen ID (B124-) Within +2 SD 0.129 – 0.141 10 Within +1 SD 0.114 – 0.128 12, 21 Mean 0.114 - Within -1 SD 0.100 – 0.113 1, 29, 35 Within -2 SD 0.086 – 0.099 54
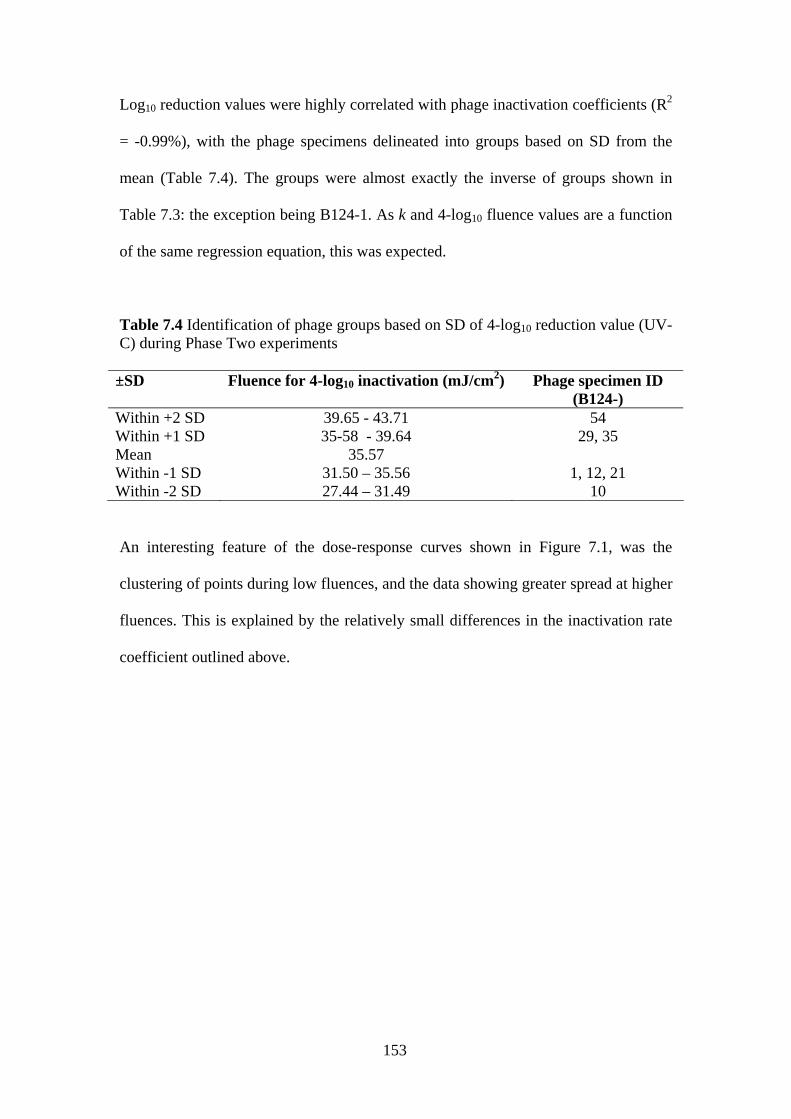
153
Log10 reduction values were highly correlated with phage inactivation coefficients (R2
= -0.99%), with the phage specimens delineated into groups based on SD from the
mean (Table 7.4). The groups were almost exactly the inverse of groups shown in
Table 7.3: the exception being B124-1. As k and 4-log10 fluence values are a function
of the same regression equation, this was expected.
Table 7.4 Identification of phage groups based on SD of 4-log10 reduction value (UV-C) during Phase Two experiments
±SD Fluence for 4-log10 inactivation (mJ/cm2) Phage specimen ID (B124-)
Within +2 SD 39.65 - 43.71 54 Within +1 SD 35-58 - 39.64 29, 35 Mean 35.57 Within -1 SD 31.50 – 35.56 1, 12, 21 Within -2 SD 27.44 – 31.49 10
An interesting feature of the dose-response curves shown in Figure 7.1, was the
clustering of points during low fluences, and the data showing greater spread at higher
fluences. This is explained by the relatively small differences in the inactivation rate
coefficient outlined above.

154
7.2 Phase Two UV-B inactivation kinetics of B124 phages
7.2.1 Correlation between fluence and phage inactivation during Phase Two
experiments
As with all previous experiments conducted for both UV-B and UV-C wavelengths
during Phase One and Phase Two, a negative linear relationship between log10
PFU/100 µl and fluence was evident for UV-B irradiation during Phase Two
experiments, displaying minimal range: from -0.98 % (B124-1, -10 and -54) to -0.99
% (B124-12, -21, -29 and -35), with a mean value of -0.99 % and 0.007 SD (Table
7.5). Therefore, the null hypothesis that the relationship between fluence and log10
PFU/100 µl occurred as a result of change could be rejected.
Table 7.5 Pearson product-moment correlation values for log10 PFU/100μl and UV-B during Phase Two experiments
Phage specimen ID
(B124-)
Pearson product-moment
correlation
P-value
1 -0.98 0.000 10 -0.98 0.000 12 -0.99 0.000 21 -0.99 0.000 29 -0.99 0.000 35 -0.99 0.000 54 -0.98 0.000
7.2.3 UV-B inactivation rate coefficient and fluence required for 1-, 2-, 3- and
4-log10 inactivation of B124 phages during Phase Two experiments
The dose-response curves for UV-B irradiation of all seven phage specimens are
shown in Figure 7.2 and in Table 7.6.

155
0.00
1.00
2.00
3.00
4.00
5.00
050
100
150
200
250
300
350
Flue
nce
(mJ/
cm2 )
Log10(No/N)
B124
-1B1
24-1
0B1
24-1
2B1
24-2
1B1
24-2
9B1
24-3
5B1
24-5
4
Figu
re 7
.2 D
ose-
resp
onse
cur
ves o
f pha
ges B
124-
1, B
124-
10, B
124-
12, B
124-
21, B
124-
29 B
124-
35
and
B12
4-54
dur
ing
Phas
e Tw
o U
V-B
inac
tivat
ion
expe
rimen
ts. D
ata
poin
ts sh
ow th
e m
ean
of 9
val
ues.
Erro
r bar
s rep
rese
nt o
ne st
anda
rd
devi
atio
n ab
ove
and
belo
w th
e m
ean.

156
Table 7.6 Fluence required for each log10 reduction of phage specimens during Phase Two UV-B irradiation
Phage specimen
ID (B124-)
k (mJ/cm2) P-value Initial log10 PFU/100μl
-1 log10 reduction (mJ/cm2)
-2 log10 reduction (mJ/cm2)
-3 log10 reduction (mJ/cm2)
-4 log10 reduction (mJ/cm2)
1 (54) * 0.0123 0.000 5.00 81 163 244 325 10 (54) 0.0139 0.000 5.28 72 144 216 288 12 (54) 0.0136 0.000 5.14 74 147 221 294 21 (54) 0.0129 0.000 4.99 78 155 233 310 29 (54) 0.0124 0.000 4.14 81 161 242 323 35 (54) 0.0133 0.000 4.21 75 150 226 301 54 (54) 0.0100 0.000 4.07 101 201 302 402 * number of data points included in regression analysis for each phage specimen (3 exposures for each fluence, each assayed in triplicate)
The data showed no shouldering or tailing and the relationship between log10
inactivation and fluence was linear positive (i.e., as fluence increased, log10
inactivation increased) and no deviation from first order kinetics was observed. All
phage specimens displayed a similar relationship to increasing fluence. The slope of
the inactivation curves, derived from linear regression analysis, are shown in Table
7.6. k values varied from 0.01 mJ/cm2 (B124-54) to 0.0139 mJ/cm2 (B124-10) with a
mean value of 0.0126 mJ/cm2 (range = 0.013, SD = 0.004). All phage k values lay
within ±2 SD from the mean and 3 groups based upon SD from mean k values could
be delineated (Table 7.7). The majority group (57%) was within + 1 SD (B124-10, -
12, 21 and -35). The inactivation curves are not statistically different from each other
(t test; P = 0.529).
Table 7.7 Identification of phage groups based on SD of k (UV-C) during Phase Two experiments
±SD k value (mJ/cm2) Phage specimen ID (B124-) Within +1 SD 0.0127 - 0.0139 10, 12, 21, 35, Mean 0.0126 - Within -1 SD 0.0113 – 0.0125 1, 29, Within -2 SD 0.0100 – 0.0112 54

157
Fluences required to inactivate phages by 4-log10 ranged from 288 mJ/cm2 (B124-10)
to 402 mJ/cm2 (B124-54). The mean was 320 mJ/cm2, the range was 114 mJ/cm2 and
the SD was 38.59 mJ/cm2. Log10 reduction values were highly correlated with phage
inactivation coefficients (R2 = -0.99%), and phage specimens were delineated into
groups based upon SD from the mean (Table 7.8). The groups were almost exactly the
inverse of the groups shown in Table 7.7 (with the exception of B124-54) which,
because of its lowest k value, is located +3 SD of the mean. No 4-log10 fluence
requirement was located below 1 SD of the mean.
Table 7.8 Identification of phage groups based on SD of 4-log10 reduction value (UV-B) during Phase Two experiments ±SD Fluence for 4-log10 inactivation (mJ/cm2) Phage specimen ID
(B124-) Within +3 SD 397.55 – 436.13 54 Within +2 SD 358.96 - 397.54 - Within +1 SD 320.37 - 358.95 1, 29, Mean 320.36 - Within -1 SD 281.77 – 320.35 10, 12, 21, 35,

158
7.3 Relationship between UV-B and UV-C inactivation kinetics of B124
phages during Phase Two experiments
The inactivation kinetics of each phage during UV-B and UV-C irradiation were
similar and statistically significant. Correlation of inactivation rate coefficients
required during UV-B and UV-C radiation show a positive linear relationship (R2 =
0.73 %, P = 0.063). The relationship between k for UV-C and UV-B was
approximately 1:0.11 (i.e., phage inactivation occurs 1-log10 slower during UV-B than
UV-C; Table 7.9). This relationship was relatively stable between phage specimens,
varying from 1:0.10 (B124-10 and -54) to 1:0.12 (B124-29 and -35).
Table 7.9 Relationship between k for phage specimens during UV-B and UV-C irradiation during Phase Two experiments
Phage specimen ID (B124-)
UV-C k values (mJ/cm2)
UV-B k values (mJ/cm2)
Ratio (UV-C:UV-B)
1 0.113 0.0123 0.11 10 0.139 0.0139 0.10 12 0.121 0.0136 0.11 21 0.117 0.0129 0.11 29 0.101 0.0124 0.12 35 0.107 0.0133 0.12 54 0.0985 0.0100 0.10
Fluences required for 4-log10 inactivation of each phage during UV-B and UV-C
radiation were also positively correlated (R2 = 0.73 %, P = 0.062; Table 7.10 and
Figure 7.3) with an average ratio of 1:9.03 (UV-C requirement:UV-B requirement).
The ratio varied from 1:8 (B124-35) to 1:10 (B124-10), indicating that nearly ten
times the amount of UV-B radiation than UV-C radiation was required for a 4-log10
reduction in phage titre.

159
0
50
100
150
200
250
300
350
400
450
0 5 10 15 20 25 30 35 40 45
UV-C fluence (mJ/cm2)
UV
-B fl
uenc
e (m
J/cm
2 )
1 log reduction2 log reduction3 log reduction4 log reduction
Figure 7.3 Relationship between UV-C and UV-B fluences required for log10 reduction in B124 phage titres.
Table 7.10 Relationship between 4-log10 reduction fluence for phage specimens during UV-B and UV-C irradiation during Phase Two experiments
Phage specimen ID
(B124-)
UV-C 4-log10 inactivation fluence
(mJ/cm2)
UV-B 4-log10 inactivation fluence
(mJ/cm2)
UV-C:UV-B ratio
1 35 325 1:9.19 10 29 288 1:10.00 12 33 294 1:8.90 21 34 310 1:9.07 29 40 323 1:8.15 35 37 301 1:8.05 54 41 402 1:9.90

160
7.4. Comparison of Phase One and Phase Two experiments
Comparing the results from Phase One and Phase Two experiments (which can be
done directly for seven phage specimens), it is evident that a disparity exists between
the two methods. 4-log10 reduction values for the seven phage during UV-B and UV-
C irradiation are shown in Table 7.11. The differences for UV-B range from 15%
(B124-1) to 111 % (B124-29). For UV-C the differences tend to be lower (because of
shorter exposure times), ranging from 12% (B124-21) to 55 % (B124-29).
Table 7.11 Comparison of Phase One (P1) and Phase Two (P2) 4-log10 reduction fluences
UV-B UV-C Phage ID (B124-) P1
(mJ/cm2) P2
(mJ/cm2) Difference (mJ/cm2)
P1 (mJ/cm2)
P2 (mJ/cm2)
Difference (mJ/cm2)
1 374 325 49 44 35 9 10 444 288 156 38 29 9 12 432 294 138 44 33 11 21 533 310 223 38 34 4 29 681 323 358 61 40 21 35 442 301 141 55 37 18 54 587 402 185 48 41 7
The previous two chapters have demonstrated how phages capable of infecting
Bacteroides strain GB-124 present in partially treated municipal wastewater, are
inactivated under conditions similar to those found in both wastewater treatment
works (UV-C) and also in the natural environment (UV-B). As phages infecting GB-
124 have been proposed as indicators of faecal contamination, it is important to
establish how these results may impact upon MST studies, and if there is the
possibility of using GB-124 phages as surrogate organisms for enteroviruses in both
WwTW and river catchments. In Chapter Eight these findings will be discussed
within the context of QMRA, and the potential use of B124 phages as surrogates of
pathogens within waterbodies will be assessed, with conclusions and suggestions for
further work presented.

161
CHAPTER EIGHT
8. DISCUSSION, CONCLUSIONS AND FURTHER WORK
This work was designed to contribute to the aim of improving our understanding of
the ecology of phages capable of infecting Bacteroides strain GB-124, in order to
better assess their suitability for use in MST studies and as surrogate organisms of
enteric viruses in QMRA. This study was the first to isolate and assess the
homogeneity of B124 phage, and to determine their inactivation kinetics during
exposure to UV-B and UV-C radiation (representing germicidal UV wavelengths
associated with sunlight and wastewater treatment processes, respectively). This
chapter discusses how the results reported in the three preceding chapters, influence
the potential use of B124 phages within MST and QMRA studies, and evaluate if they
may be able to indicate risk of enteric virus infection to water-users.
8.1 Phage homogeneity
8.1.1 Isolation
Bacterial hosts used in bacteriophage-based MST and QMRA, should detect a
homogenous phage group. In this study, although 61 plaques were selected from final
effluent double agar plates, only 20 plaques caused bacterial lysis when re-plated on
GB-124. As these plaques were able to cause lysis on the original agar plate, it was
unexpected that subsequent lysis was not observed. It is possible that the plaques were
unable to cause lysis after being selected because they had entered a dormant
lysogenic state (see Section 2.1.3). Host infection by phages may have taken place,
but phage DNA was integrated in the host cell rather than causing lysis. Moreover,
when the selected plaques were introduced to GB-124 broth cultures, no bacterial

162
clearing was observed (i.e., reduction of culture turbidity or production of ‘stringy’
cultures), suggesting that the phages had entered a pseudolysogenic, or phage-carrier
state which has been observed for other phages including those infecting other strains
of Bacteroides (Lwoff, 1953; Keller and Traub, 1974; Booth et al., 1979; Lythgoe and
Chao, 2003). Pseudolysogeny is where a mixed bacterial population develops in broth
culture, including a significant portion of bacterial phenotypes resistant to phage
infection, causing retardation of phage replication. It is possible that two phage
phenotypes are present in WwTW final effluent, one group that can lyse GB-124 after
re-plating, and one group that cannot, either entering a lysogenic state or having been
sufficiently damaged to inhibit host infection.
8.1.2 Morphology and host range
All B124 phages selected during this study belonged to the Siphoviridae family
(binary morphology with icosahedral capsid and non-contractile tail), showing little
variation between specimens. Minor tail variations were evident (i.e., straight, slightly
curved, kinked etc.). However, this tail shape variation may have been because of the
effects of the uranyl acetate staining, rather than being true morphological
characteristics (see Section 2.1.1). The only phage to possess different tail
morphology was B124-21, which had a distinct long (~245 nm) wavy tail. Compared
with tail variation reported by other authors, the variation in tail shape observed in
B124 phages was minimal. As shown in Figures 2.3 and 2.4, it is evident that the
degree of tail curvature can vary between virions in the same sample, on the same
TEM grid. The delineation of B124 phages into distinct groups, based on the degree
of tail curvature alone, is therefore not possible.

163
The dominance of phages belonging to the Siphoviridae family within the B124 phage
population is consistent with reports of Bacteroides phages given in the literature
(Prévot et al., 1970; Nacescu et al., 1972; Keller and Traub, 1974; Burt and Woods,
1977; Booth et al., 1979; Masanori et al., 1985; Kory and Booth, 1986; Tartera and
Jofre, 1987; Lasobras et al., 1997; Queralt et al., 2003) showing high within-family
homogeneity (i.e., siphoviruses with similar dimensions and morphology). It is
however possible that the culturing technique used in the present study favoured the
survival of members of the Siphoviridae family. Only 33% of selected plaques
resulted in propagation, and there is the possibility that the unsuccessfully propagated
phages may have belonged to other families (some of which are more fragile and
easily damaged: e.g., Myoviridae or Podoviridae families).
B124 phages appear to be a more homogeneous group than those reported to infect
Bacteroides strains HSP-40 or RYC-2056 (e.g., variations recorded by Queralt et al.,
2003), and therefore may be better indicators of human faecal pollution. During
initial data analysis for this study, it was thought that members of the Podoviridae
family had been isolated (icosahedral head with short tail). However, the presence of
podoviruses was rejected, as disassociated tails were observed in micrographs,
suggesting virion damage rather than genuine podoviruses. Disassociated heads and
tails have been observed by other authors, and such virion damage may account for
the low recovery of lytic phages from the selected plaques. It is also possible that the
TEM staining procedure damaged virions.
All B124 phages were isolated from municipal wastewater final effluent, and it is
possible that the high homogeneity of B124 phages in such wastewater effluent may

164
not be an accurate reflection of the phage population in raw and partially treated
wastewater at other stages of wastewater treatment. As was discussed in Section 2.2,
the composition of phage populations through WwTW is not constant, and when
using phages infecting GB-124 in MST studies, it is important to be aware of water
sample origin. For example, septic tanks may have a higher percentage of myoviruses
and podoviruses, whereas treated sewage may have a greater percentage of
siphoviruses (Dee and Fogleman, 1992). If siphoviruses are more persistent in both
the environment and through treatment plants, WwTW effluent would be detectable
longer in the receiving waterbody than septic tank effluent because of the higher
proportion of resistant siphoviruses in the final effluent. This may become an issue if
quantitative estimations of faecal pollution (and risk to health) are attempted using
B124 phages as an indicator of viral loads.
The majority of capsid dimensions for phages infecting Bacteroides given in the
literature are within the range displayed by B124 phages isolated in this study (Tables
2.3 and 5.2), and appear to be representative of siphoviruses isolated from wastewater.
The only significant deviation from the dimensions given in Table 2.3 was B124-21,
which as previously mentioned, had a long (~245 nm) wavy tail.
The host range patterns exhibited by B124 phages were found to be homogenous.
B124 phages were found to infect Bacteroides strain GB-124 and RYC-2056 (with
the exception of B124-35) but were unable to infect and lyse Bacteroides strain HSP-
40. Host range analysis during this study was not extensive enough to draw
exhaustive conclusions. However, the homogeneity of the host range when tested on
three more widely researched Bacteroides host strains has been demonstrated.

165
All the morphological and infectious characteristics described above suggest that
B124 phages are a highly homogenous group consisting of predominantly
siphoviruses, with either a straight or slightly curved tail, capable of infecting
Bacteroides strain RYC-2056, but not HSP-40.

166
8.2 Issues arising from different UV methodologies
8.2.1 Fluence calculations
When discussing microorganism inactivation kinetics it is useful to determine both the
inactivation rate coefficient (k) and the 4-log10 reduction value. However, in the
majority of studies, log10 reduction values are given, rather than k values. As the two
items are derived from the same regression equation and the k value (slope of line) is
used in calculation of the 4-log10 reduction value, the two are essentially different
measurements of inactivation kinetics. In the discussion below, 4-log10 inactivation
values are discussed, allowing easier comparison with previous studies reported in the
literature.
As shown in Chapter Seven, the degree of correlation between Phase One and Phase
Two UV experiments differs according to wavelength. Correlation between fluences
required for a 4-log10 inactivation using UV-B during Phase One and Phase Two is
weaker than that for UV-C (R2 = 0.20 and 0.58 respectively). The mean 4- log10
reduction value for the seven phages that were used during both experimental phases
was 47 mJ/cm2 for Phase One and 36 mJ/cm2 for Phase Two (UV-C). For UV-B, the
Figures were 499 mJ/cm2 and 320 mJ/cm2 (Phase One and Phase Two respectively).
However, it is evident that the methodology employed during Phase One
experimentation may over-estimate the fluences required to achieve 4-log10
inactivation.
Fluence over-estimation can result from using an overly simplistic method of fluence
calculation. The method used in Phase One was based on the equation used by
numerous authors (e.g., Oguma et al., 2001; Kellogg and Paul, 2002; Wu et al., 2005),

167
where fluence (mJ/cm2) is the product of fluence rate (i.e., the fluence rate
measurement at the water surface of irradiation vessel, mW/cm2) and exposure time
(seconds). This calculation does not take into account any other factors, such as light
reflection from the water surface, UV absorbance of the phage suspension, and
unequal distribution of UV photons across the Petri dish. This has important
implications, not just in this study, but for research conducted by other authors where
correction factors have not been used (Tables 3.2 and 3.3).
If fluence rate correction factors are not used, fluence is invariably over-estimated.
For example, during Phase Two irradiation of B124-1 (using 254nm UV), the
radiometer reading at the centre of the Petri dish located below the aperture of the
collimating tube was 0.129 mW/cm2. When applying the Bolton and Linden (2003)
corrections (Petri factor, reflection factor, water factor and divergence factor as
detailed in Materials and methods) the true fluence rate across the Petri dish was
calculated as 0.103 mW/cm2 (a difference of 0.026 mW/cm2). To deliver a fluence of
10 mJ/cm to the sample using the corrected fluence rate values, the exposure time
would be 1 minute and 43 seconds. If using uncorrected fluence rate readings, the
calculated fluence delivered in 1 minute 43 seconds would have been 13.32 mJ/cm2 a
difference of 3.32 mJ/cm2). During longer exposure, the disparity between
uncorrected and corrected fluences is exaggerated. For example, an exposure time of
5 minutes, 1 second would deliver a fluence of 30 mJ/cm2 when calculated using the
corrected values (fluence rate as previous example). Using uncorrected values this
fluence would have been 39.96 mJ/cm2 (a difference of 9.96 mJ/cm2).

168
When evaluating UV-B fluences, the generally longer exposure times used (up to one
hour) compound the problem yet further. For example, when irradiating B124-1 using
UV-B during Phase Two experiments, the radiometer reading at the centre of the Petri
dish was 0. 0117 mW/cm2, and the corrected value for true fluence rate across the
Petri dish was 0.094 mW/cm2. An exposure time of 56 minutes and 1 second
delivered a fluence of 300 mJ/cm2 using the corrected fluence rate, whereas the
uncorrected figure would have delivered a fluence of 393.22 mJ/cm2 (a difference of
93.22 mJ/cm2). This would partially explain the disparity between Phase One and
Phase Two experiments. Fluences delivered were the same during both experimental
phases, it was the method of fluence calculation that was different.
Data from studies using the Bolton and Linden (2003) method can be directly
compared with data recorded during this research, whereas studies using no fluence
corrections cannot. Without knowing the precise details of the experimental set-up of
studies not using the fluence corrections, it is impossible to alter these results to
reflect true fluence rates.
8.2.2 Anomalies produced during Phase One experiments
Another interesting feature of the data that was present in Phase One experiments
only, was the apparent “shouldering” (i.e., little inactivation during initial exposures)
observed in B124-17 and B124-57 (during UV-C irradiation) and the inactivation
curve fluctuations observed during Phase One UV-B irradiation (e.g., inactivation
plateaus shown by B124-1, B124-4, B124-21, B124- 22, B124-35 and B124-54). One
reason why data produced during Phase One may be more variable is that aliquots
were withdrawn from the Petri dish for assay rather than using a fresh sample for each

169
fluence exposure. By withdrawing an aliquot for assay, the sample volume within the
irradiation vessel decreased, reducing UV attenuation and leading to possible
miscalculation of fluence. Aliquots were withdrawn from the centre of the Petri dish,
and as this is where the stir bar was suspended during stirring, a degree of phage
shadowing may have occurred. Therefore, it is possible that aliquots contained phages
that had been shielded from UV light by the stir bar. Also, phage aggregation may
have caused apparent increased inactivation shown in the Phase One results (e.g.,
B124-1 during UV-B exposure between 100 and 200 mJ/cm2). Phase One exposure
times were shorter, and any phage clusters may not have had sufficient time to break
up during irradiation. As these “shoulders” were not observed during Phase Two
experiments, they are likely to be a result of the methodology employed, rather than
true biological characteristics. These data support the adoption of the standardised UV
protocol used during Phase Two experiments. The results from Phase Two
experiments are discussed in detail below.

170
8.3 Comparison of B124 phages UV-C inactivation kinetics to those of other
microorganisms
Although the method of UV exposure and fluence calculation varies between studies
reported in the literature, it is important to compare the inactivation kinetics of B124
phages with those of specific pathogenic microorganisms. This will inform the
decision as to whether B124 phages can be used as a suitable indicator organisms of
human faecal pollution, or surrogates for particular pathogens. For the sake of clarity,
not all the data identified during the course of the literature review are presented here.
Only data for selected organisms that have similar fluence requirements to those
shown by B124 phages, or which are of particular interest in terms of water quality
monitoring are presented here. Full data concerning fluence rates for microorganisms
are given in Appendix 1 (inactivation data for over 60 bacterial, 40 phage, 40 viral, 20
protozoan and 10 spore experiments).
8.3.1 Bacteria, Protozoa and Spores
It is evident from data provided in Appendix 1, that B124 phages require different
fluences than bacteria, protozoa and spores in order to achieve 4-log10 inactivation.
Protozoa and bacteria both require lower fluences, whereas spores require higher
fluences to achieve the same reduction as B124 phages. This indicates that B124
phages may not be suitable as surrogate organisms of spore-forming pathogens (such
as Bacillus anthracis) as B124 phages will be inactivated more rapidly. In comparison
with bacteria and protozoa, B124 phages appear to be more persistent, and may
therefore be used to indicate their potential presence, but there exists a potential for
false-positive indication (over-estimation) of bacterial and protozoan pathogens.

171
8.3.2 Viruses and bacteriophages
Importantly, the fluence requirements of B124 phages were found to be much more
closely aligned with those of other viruses and bacteriophages, than the other groups
of microorganisms reported above (Table 8.1). The similarity of fluence requirement
for B124 phages and previously reported B40-8 phage was not unexpected, as B40-8
is a siphovirus isolated using Bacteroides strain HSP-40, also from municipal
wastewater. Data for the other phages are variable. Although inactivation data for
PRD-1 given by Meng and Gerba (1996) are similar to those for B124 phage, data for
PRD-1 given by Shin et al (2005) are less so. These authors state that a fluence of 110
mJ/cm2 was required for a 4-log-10 inactivation. Staphylococcus aureus phage A994 is
a siphovirus with dsDNA (44kbp in length) and a non-elongated head (Kwan et al.,
2005); this the same morphology as B124 phages.
The viruses that require similar fluences to B124 phages are calicivirus canine,
calicivirus feline, coxsackievirus (B3 and B5), echovirus (I and II), hepatitis A
HM175 - though other data, namely those of Battigelli et al (1993) do not agree -
poliovirus type 1 and rotavirus SA 11. Also, although no exact figures for 1-, 2-log10
etc., are given, greater than 3.6 log inactivation of poliovirus type 1 (LSc 1, BGMK
cell line) was achieved by Shin et al (2005) using 30 mJ/cm2, and greater than 5.2
log10 inactivation of coxsackievirus 4 (BGMK cell line) was achieved using 30
mJ/cm2.

172
Table 8.1 Phages and viruses with similar UV-C inactivation kinetics to B124 phages (FRNA phages are also shown for comparison) Fluence required for log inactivation Reference Organism Type/Species Genetic material
-1 -2 -3 -4 B124-1 dsDNA 9 18 27 35 This study B124-10 dsDNA 7 14 22 29 This study B124-12 dsDNA 8 17 25 33 This study B124-21 dsDNA 9 17 26 34 This study B124-29 dsDNA 10 20 30 40 This study B124-35 dsDNA 9 19 28 37 This study B124-54 dsDNA 10 20 30 41 This study B40-8 (HSP-40) dsDNA 12 18 23 28 Sommer et al., 1998 B40-8 (HSP-40) dsDNA 11 17 23 29 Sommer et al., 2001 B40-8 (HSP-40) dsDNA 7.1 14.3 21.4 28.6 Clancy et al., 2004 PRD-1 (S. typhimurium Lt2) dsDNA 9.9 17.2 23.5 30.1 Meng and Gerba, 1996
Phage
Staphylococcus aureus phage A994 (Staphylococcus aureus A994) dsDNA 8 17 25 36 Sommer et al., 1989 FRNA (MS2) ssRNA 23 55 87 119 Thurston-Enriquez
et al., 2003 Calicivirus canine (MDCK cell line) ssRNA 7 15 22 30 Husman et al., 2004 Calicivirus canine (CRFK cell line) ssRNA 7 16 25 - Husman et al., 2004 Calicivirus feline (CRFK cell line) ssRNA 6 16 26 36 Thurston-Enriquez
et al., 2003 Coxsackievirus B3 (BGM cell line) ssRNA 8 16 24.5 32.5 Gerba et al., 2002 Coxsackievirus B5 (BGM cell line) ssRNA 9.5 18 27 36 Gerba et al., 2002 Echovirus I (BGM cell line) ssRNA 8 16.5 25 33 Gerba et al., 2002 Echovirus II (BGM cell line) ssRNA 7 14 20.5 28 Gerba et al., 2002 Enterovirus ssRNA 7.5 15 24 34.5 Lazarova and Savoye, 2004 Hepatitis A HM175 (FRhK-4 cell) ssRNA 5.1 13.7 22 29.6 Wilson et al., 1992 Poliovirus ssRNA 6 14 22 32.5 Lazarova and Savoye, 2004 Poliovirus Type 1 (Mahoney) ssRNA 3 7 14 40 Sommer et al., 1989 Poliovirus 1 (BGM cell line) ssRNA 8 15.5 23 31 Gerba et al., 2002 Poliovirus 1 [CaCo2 cell-line (ATCC HTB37)]
ssRNA 7 17 28 37 Thompson et al., 2003
Poliovirus Type 1 LSc-1 ssRNA - - - 23 - 29 Snicer et al., 1998 Rotavirus SA 11 (MA 104) dsRNA 8 15 27 38 Sommer et al., 1989
Virus
Rotavirus SA 11 (MA 104) dsRNA 9.1 19 26 36 Wilson et al., 1992

173
The data indicate that B124 phages may be used as indicator and surrogate organisms
for enterovirus (polio-, coxsackie- and echovirus) and there may be potential for B124
phages to act as a surrogate organism of norovirus (for which feline calicivirus are
often used as surrogates; Doultree et al., 1999). The data for enterovirus inactivation
derive from studies where not all the Bolton and Linden (2003) corrections were
applied, and it is possible therefore, that slightly lower fluences may be required to
achieve 4-log10 inactivation than those given.
The data show that there appears to be no clear relationship between inactivation
kinetics and phage morphology. Phages that require similar fluences to B124 to
achieve a 4-log10 inactivation are all dsDNA, but have different morphologies. B40-8
and S. aureus phage A994 are members of the Siphoviridae family (therefore binary
morphology with a long non-contractile tail), PRD-1 is a tail-less virion belonging to
the Tectiviridae family. Other members of the Siphoviridae family, for which
inactivation data are available suggest that 3-log10 inactivation occurs at around 11.6
mJ/cm2 and 18.1 mJ/cm2 (siphoviruses D3C3, F116 and G101 in Kadavy et al., 2000),
whereas B124 phages require between 22 and 30 mJ/cm2 to inactivate by 3-log10. The
morphology of the viruses requiring the same fluences as B124 phages are also
different: unlike B124 phage, the enteroviruses and caliciviruses both have
icosahedral capsids without tails, indicating that inactivation kinetics are independent
of the presence/absence of tail structures.
Persistence of phages belonging to different families was also reported by Shin et al
(2005). One siphovirus, one podovirus and one myovirus were irradiated (host E. coli
WG5) and were inactivated very quickly (10 mJ/cm2 inactivated phages by greater

174
than 5.5-, greater than 3.48- and greater than 5.99-log10, respectively). Interestingly,
and in contrast to other studies, the difference between Myoviridae and Siphoviridae
was minimal.
As dsDNA, ssRNA and dsRNA phages and viruses are inactivated at similar fluences
to B124 phages (data presented in Appendix 1), no clear relationship is evident
between the nature of genetic material and inactivation kinetics. If the nature of
genetic material were to be the factor determining inactivation kinetics, then B124
phages would be inactivated at similar fluences as siphoviruses as reported by Shin et
al (2005) and adenovirus (this is dsDNA with a genome of between 30 to 40 kbp, of a
similar size to Bacteroides phage). This is not the case: MS2 phage, commonly used
as a biodosimeter, requires the highest fluences to achieve 4-log inactivation. The
genetic material of MS2 phage is ssRNA, with a similar structure and size to
enteroviruses. However, MS2 phage requires a greater fluence dose to achieve the
same level of inactivation as enteroviruses. In Section 2.2.2, it was noted that FRNA
phages (of which MS2 is the most studied) may be used as surrogates for
enteroviruses. The difference in UV-C inactivation requirements may make this
inadvisable (Table 8.1).
Although no clear relationship is evident, it has been suggested that double stranded
viruses may be more UV tolerant, and in the case of adenovirus, it is hypothesised that
this is because they can utilise host enzymes to repair damage (Gerba et al., 2002).
There is also no evident relationship between genome size and UV-C inactivation
kinetics. For example, although B40-8 has a genome of 51.7 kbp, and echovirus has a
genome of around 7.5 kbp, they require similar fluences for 4-log10 inactivation.

175
8.4 Comparison of B124 phages UV-B inactivation kinetics with those of
other microorganisms
From B124 phage inactivation data derived from this study, and enterovirus data
reported in the literature, the UV-C inactivation characteristics of B124 phages and
enterovirus appear well correlated. However, as solar UV-C does not reach the
surface of the earth, in order to be useful in QMST and QMRA studies, the response
to UV-B irradiation should also be correlated. As detailed in the Chapter Three, solar
UV-B is one of the primary environmental inactivation methods of microorganisms.
8.4.1 Bacteria and viruses
Few data are available from studies in which organisms have been irradiated in CB
apparatus with UV-B. As was demonstrated with UV-C inactivation kinetics, B124
phages are inactivated at a slower rate than selected bacteria, but insufficient data are
available to be able to assess how B124 phage inactivation kinetics relate with respect
other phage, viruses, spores and protozoa.
In Section 8.3.2, it was hypothesised that B124 phages may have similar UV-C
inactivation kinetics to feline/canine caliciviruses (which are commonly used as
surrogates for noroviruses). When irradiated using UV-B, 34 mJ/cm2 were required to
reduce both feline and canine caliciviruses by 3-log10 (Duizer et al., 2004). These data
indicate that B124 phages may not be used as indicators of feline/canine caliciviruses
in waterbodies where UV-B is the dominant inactivating factor, as feline/canine
caliciviruses may be inactivated more rapidly than B124 phages. However, as these
studies were not carried out in parallel, using the same apparatus (e.g., Duizer et al.,
2004 irradiated samples in microwells, whereas the present study used Petri dishes), a

176
degree of experimental error may be present. No UV-B/enterovirus data were found in
the literature, and therefore it is not currently possible to examine the applicability of
B124 phages as an indicator index for enteroviruses during solar irradiation.
The results of inactivation experiments using UV-B undertaken during this research,
show B124 phages to be inactivated by 4-log10 at fluences between 288 mJ/cm2 and
402 mJ/cm2, whereas 4-log10 inactivation for UV-C required from 29 to 41 mJ/cm2.
The data show that ten times the amount of UV-B fluence is required than UV-C
fluence in order to achieve the same level of inactivation. The difference in fluence
requirement is most probably because of the greater efficiency of UV photon
absorption by DNA at wavelengths close to 250 nm than at 302 nm, and therefore the
greater efficiency of dimer formation (i.e., disruption in base pairing). It has been
demonstrated that dimer formation during UV-B is around 90% less efficient than
dimer formation during UV-C (Ravanat et al., 2001; Giacomoni, 1995) and as this is
similar to the observed ratio for B124 phage, it can be postulated that the main
mechanism of UV-B inactivation of B124 phages is via the production of dimers.

177
8.5 The use of Collimated Beam experiments to inform QMST and QMRA
studies
8.5.1 Using B124 phages as index/indicator organisms during and after UV-C
treatment
An objective of this research was to assess the suitability of B124 phages as surrogate
organisms for particular pathogens, both in the natural environment and during
wastewater treatment processes. This work also informs QMRA studies, as the levels
of B124 phages in wastewater may suggest the degree of treatment needed to reduce
illness and morbidity, caused by selected pathogens, among consumers of shellfish
and recreational users of the receiving waters.
A key knowledge gap is the comparative environmental behaviour of GB-124 phages
and enteroviruses. As presented in Section 1.5, in order to be a useful indicator for
enteroviruses in wastewater and wastewater contaminated waterbodies, GB-124
phages should be present in greater numbers and have similar inactivation
characteristics (Borrego et al., 1987; Havelaar, 1993).
From the data presented in Table 8.1, it appears that B124 phages and enteroviruses
require similar UV-C fluences for a 4-log10 inactivation, and it is therefore proposed
that B124 phages may be able to act as surrogate organisms for enteroviruses during
WwTW UV tertiary treatment, and in QMRA studies. As echovirus and
coxsackievirus have been implicated in waterborne disease outbreaks (e.g., Kapadia et
al., 1984; Kukkula et al., 1997; Amvrosieva et al., 2001) and poliovirus is prevalent
in LEDC, the use of a safe, easily assayed surrogate phage is a very useful tool for
QMRA and health protection.

178
Moreover, as phages infecting GB-124 assays are relatively low-cost, its use would
prove beneficial in areas where poliovirus is endemic (India, Nigeria and areas
surrounding the Afghanistan/Pakistan border). By using B124 phages as surrogates of
enteroviruses in WwTW final effluent samples and in faecally-impacted surface
waters, a cheaper and rapid estimation of risk to users of waterbodies could be
achieved. This would benefit both the individuals using the water resource, and by
reducing the number of days lost to illness, the cost of medical care for infected
individuals, and the overall enteric disease burden. More expensive techniques to
detect poliovirus (and other enteric viruses) may be provided by WHO poliovirus
eradication programme, providing equipment and expertise to affected areas.
Given the data from the Phase Two experiments, the fluences delivered by UK
WwTW (up to 50 mJ/cm2; Mayor-Smith, pers. comm.) would be enough for a 4-log10
inactivation of B124 phages. An extensive record of the densities of B124 phages in
final effluents from the southeast of England are presented by Ebdon et al (2007;
Table 2.9), and it is clear that phages infecting GB-124 would be inactivated by
‘typical’ WwTW fluences, and would therefore be absent from UV irradiated final
effluents.
Enterovirus densities of final effluent detailed in the literature vary. Dahling et al
(1989) recorded between 1 and 24,000 PFU/litre in Puerto Rico, and the data vary
depending on the efficacy, and process stages, of WwTW. Generally, the ratio of
enterovirus to HSP-40 phages in wastewater has been given as approximately 1:5
(South Africa; Grabow et al., 1993) and if this ratio were to be consistent in all
scenarios, as B124 phages appear to be a conservative indicator of enteroviruses, it

179
can be assumed that enteroviruses would also be absent from UV treated final effluent
(Jacangelo, et al., 2003). As the fluence requirements necessary to achieve a 4-log10
inactivation of enteroviruses are similar to those required for a 4-log10 reduction of
B124 phages, it is expected that no enterovirus virions would be present in the final
effluent of tertiary treated UV WwTW (based on 100 ml sample), providing that a
fluence greater than 40 mJ/cm2 is delivered. Also, as the majority of bacterial and
viral pathogens (excluding adenovirus) require lower fluences than B124 phages to
achieve a 4-log10 reduction, B124 phages can act as a conservative indicator for these
organisms, aiding the development of QMRA protocols.
Another group of viruses for which B124 phages may be an index indicator organism
are noroviruses. At present, norovirus cannot be cultivated in the laboratory and
feline/canine caliciviruses are often used as a model system during disinfection
studies (Slomka and Appleton, 1998; Doultree et al., 1999). As B124 phages and
canine/feline calicivirus appear to require similar fluences in order to achieve the
same level of inactivation using UV-C, B124 phages may prove to be a useful
indicator/index organism for noroviruses. However, unlike Bacteroides GB-124
phages, noroviruses are not necessarily human specific and because of this, B124
phages may be an unsuitable indicator of animal-derived noroviruses in the
environment.
Finally, recent work (unpublished data) suggests that there may be a positive
correlation between adenovirus and B124 phages in surface waters in the UK and
Portugal (James Ebdon, Pers comm.). However, this relationship may break down in
waterbodies where effluents are subject to UV sterilisation as adenovirus requires far

180
higher fluences (greater than 100 mJ/cm2), than B124 phages. This means that
adenovirus would still be present after UV treatment, whereas B124 phages are likely
to be absent. If B124 phages were to be used as an indicator of adenoviruses, false
negative results may be obtained and QMRA models based on B124 phages as a
surrogate would be inappropriate.
8.5.2 Using B124 phages as index/indicator organisms during UV-B irradiation
The correlation of enteroviruses and B124 phages when studied using CB apparatus
under UV-C radiation is useful in determining the efficiency of UV inactivation
treatment methods, and the risk to human populations coming into contact with final
effluent. However, in MEDC it is unlikely that people will be exposed to minimally
diluted, recently discharged effluent, with the majority of contact taking place
downstream of the discharge point in recreational waters (i.e., after significant mixing
and dilution has occurred). In LEDC, contact with minimally treated wastewater is
more likely and therefore the risk to human health is greater. In between the final
effluent release point and the point of contact with human populations, numerous
physiochemical and biological factors influence phage and enterovirus survival. As
described in Chapter Three, sunlight inactivation by UV-B is an important factor
influencing the survival of microorganisms in river systems, and for B124 phages to
be used as indicator/index organisms of enteroviruses through the receiving drainage
system, B124 phages should ideally have higher UV-B resistance than the target
pathogen.
Using the CB apparatus detailed in this study (Chapter Four), exposure times
necessary to deliver required fluences can be calculated (Table 8.2). These

181
calculations use example fluence rates of 0.022 mW/cm2 (Jacquet and Bratbak, 2003)
and 0.20 mW/cm2 (Jung et al., 2008) and assume that microorganisms will be
exposed to a constant fluence with no virus reactivation occurring. In river systems,
constant fluence is unlikely, because microorganisms move within the water column.
Moreover, as most UV-B is delivered around a four hour period (two hours either side
of the solar noon) a constant fluence cannot be assumed (Coohill and Sagripanti,
2009).
Table 8.2 Exposure times for target fluences using UV-B fluence rate values detailed in the literature (Jacquet and Bratbak, 2003)
Target fluence (mJ/cm2)
Time required (Jacquet and Bratbak, 2003)
Time required (Jung et al., 2008)
50 37m 53s 4m 10s 100 1h 15m 45s 8m 20 150 1h 53m 38s 12m 30s 200 2h 31m 31s 16m 40s 250 3h 9m 24s 23m 59s 300 3h 47m 16s 33m 30s
Data from this study indicate that a UV-B fluence of between 288 mJ/cm2 and 402
mJ/cm2 is required to achieve a 4-log10 inactivation of B124 phage. Given the fluence
rate of 0.022 mW/cm2, this would equate to environmental exposure times of between
3h 38m and 5h 4m 33s. As this is the peak exposure, it is unlikely that 4-log10
inactivation could be achieved during a single diurnal cycle. However, if a higher
fluence rate were used in the calculation (i.e., 0.20 mW/cm2 as recorded by Jung et al.,
2008, and similar to those recorded in the UK) 4-log10 inactivation would occur
within 35 minutes. Based on a fluence rate of 0.20 mW/cm2, the potential for
environmental inactivation of B124 phages within a diurnal UV-B exposure cycle is
evident.

182
In determining the possibility of B124 phage inactivation in a waterbody by UV-B, it
is useful to determine daily fluence loads. Examples given in the literature include 10
kJ/m2 in January and 55 kJ/m2 in June in Baltimore, USA (Heisler et al., 2004), and
570 to 611 kJ/m2 in September at the Red Sea (Boelen et al., 2002). A 4-log10
reduction of B124 phages could be achieved during a single day based upon these
total fluence loads, as this requires from 2.8 kJ/m2 to 4 kJ/m2. This calculation is
highly dependent on local solar conditions, as the UV-B load delivered in sunnier
climates will be far higher. This may have important ramifications for the use of GB-
124 phages as a tool for QMST and QMRA in latitudes where solar UV-B levels are
higher. Therefore, local climatic conditions should be assessed when using B124
phages in river systems, and factors such as cloud cover must be taken into account.
This is pivotal in controlling the amount of UV-B radiation reaching the water
surface.
To date, no in situ ecological studies of B124 phages have been reported, but data
collected by researchers at the Environment & Public Health Research Unit at the
University of Brighton, show the reduction/decline of phages infecting GB-124 along
a longitudinal river transect. Phages infecting GB-124 at monitoring sites less than
0.5km downstream of a WwTW in a chalkland river catchment in southern England,
were demonstrated to range from 3.11 log10 PFU/100ml during base-flow, to 3.76
log10 PFU/100ml during high-flow events. At sites less than 2km downstream the
mean values decreased to 2.49 log10 PFU/100ml during base-flow, to 3.14 log10
PFU/100ml during high-flow events. The furthest sites, greater than 2km from
WwTW, phage densities fell to 1.21 log10 PFU/100ml during base-flow, to 1.88 log10
PFU/100ml during high-flow events (Ebdon, pers. comm.). These figures concisely

183
demonstrate the decline of GB-124 phages over a longitudinal river profile
downstream of a point source of human faecal material. One of the explanations for
the decline could be the influence of UV-B radiation, as the fluences likely to be
delivered during a sunny day are capable of inactivating the phage. Another
explanation could be the dilution of wastewater effluent through the river catchment
(though conversely, other point sources could be contributing phage load to water
system mitigating the dilution effect).
In pilot tests for this study, river water samples were taken downstream of a WwTW
in an area subject to long water retention times (the Pevensey Levels, East Sussex,
UK). Phages infecting GB-124 were found in non-UV disinfected WwTW final
effluent (approximately 3.70 log10 PFU/100ml), but were not discovered at any points
in the receiving drainage system (closest monitoring point is approximately 1km
downstream of WwTW outlet). Retention times in this area may be greater than five
days, and it is likely that sufficient UV-B would be delivered to inactivate B124
phage.
Moreover, as mean densities of phages infecting GB-124 found in the River Ouse
(south east England) have been recorded as less than 104 PFU per 100 ml throughout
the river transect (Ebdon et al., 2007), a fluence of less than that required for 4-log10
inactivation will be required to remove B124 phages completely. For a 3-log10
inactivation of B124-phage, between 216 mJ/cm2 and 302 mJ/cm2 would be required.
This corresponds to exposures times between 17 minutes and 59 seconds to 25
minutes and 8 seconds (0.2 mW/cm2 fluence rate).

184
As phages infecting GB-124 have been enumerated in river water samples in many
countries (Ebdon, pers. comm.), it is likely that virions are not exposed to the full
amount of solar UV-B reaching the water surface. So far it has been assumed that all
phage virions are exposed to the full UV-B fluence throughout the water column.
However, it has been shown that UV-B radiation is attenuated through the water
column (Table 3.6) and this may extend phage survival. As WwTW effluents are
typically nutrient rich and more turbid than surrounding waters, UV-B penetration
into the receiving water column will not be as great as in waters with a lower nutrient
status/turbidity, thus protecting the phages from inactivation. However, in areas
subject to faecal pollution other than from WwTW (i.e., rural septic tanks and
soakways, usually in isolated rural locations), the receiving water may be nutrient
poor, and UV-B irradiation of phages may be greater. As septic tanks may have
greater proportions of myoviruses and podoviruses (which may be inactivated more
quickly than siphoviruses), when using GB-124 to detect phages downstream of septic
tanks, this problem will be compounded, and low levels of phages may be present.
The protective influence of sediments may also extend B124 survival in river systems.
After rainfall events, phage protection will be enhanced because of increased
deposition of terrestrial sediments into the river. Increased phage densities have been
observed after heavy rainfall (Ebdon et al., 2007), but it is difficult to separate the
influence of WwTW overflows, re-suspension of phage-rich river bed sediments, and
decreased UV-B water column penetration, as no detailed studies have been
conducted to date. The sediment absorption characteristics of B124 phages have yet to
be assessed.

185
As well as physiochemical factors reducing phage exposure to UV-B radiation, the
method and time of water sampling may influence the density of phages (infecting
GB-124) present. Samples taken after the period of greatest inactivation (i.e., two
hours post solar-noon) may contain more inactivated B124 phages than those taken
two hours before solar noon. Also, in winter, less solar UV-B is delivered, therefore
less UV induced phage-inactivation will take place. The location of sample collection
point may also influence density of phages recorded. For example, if a slow moving
river is being sampled, with limited mixing between bank and centre water columns,
the difference between UV-B exposure in the centre (i.e., exposed section) of the river
will be greater than the UV-B exposure on the banks (which may be shaded for part of
the day).
It is evident that when using phages infecting GB-124 in environmental aquatic
systems, particular attention must be paid to the local environmental conditions within
the system. Characteristics such as type of point source (septic tank or WwTW), cloud
cover, sediment transport characteristics, river flows, and water chemistry may all
influence the densities of B124 phages recorded. If such environmental factors are
underestimated, then there is a chance that there may be a mis-diagnosis of risk,
resulting in negative health impacts for resource users.

186
8.6 Conclusions
The principal findings from this study are:
1. Phages infecting GB-124 are a morphologically homogenous group belonging to
the Siphoviridae family with capsid diameters between 50 and 70nm and tails of
12.5 x 130 to 200 nm. B124-21 appears to be the only phage with a distinct tail,
longer (245nm) and with a wave pattern. As staining procedures may produce tail
deformation, delineation of B124 phages into group based on tail morphology
alone is not advisable. Low recovery rate of picked plaques may indicate
experimental bias, favouring propagation of siphoviruses;
2. This study has shown that UV inactivation kinetics of phages infecting GB-124
are highly homogenous and when exposed to UV-C and UV-B radiation, all B124
phages show first order inactivation kinetics with a positive log linear relationship
between fluence and inactivation. B124 phages are inactivated by both UV-B and
UV-C radiation and fluence required to inactivate phages between UV-B and UV-
C are highly correlated. Fluences required to inactivate phages by 4-log10 when
using UV-C are approximately an order of magnitude lower than UV-B and it is
possible to estimate environmental inactivation by UV-B from laboratory based
UV-C experiments. This has important implications for MST studies and the
application of using phages infecting GB-124 in river systems and downstream of
WwTW using tertiary UV disinfection;
3. B124 phages are likely to be inactivated by the fluences delivered both in WwTW
(UV-C) and in the natural environment (UV-B). Also, because of UV-B
inactivation data, faecally polluted river systems with long water retention times

187
may not contain any phages able to infect GB-124, therefore leading to false
negatives of human faecal material. However, as the majority of pathogens would
also be removed, there would be no risk associated with diagnosis;
4. Results from Phase Two experiments show that B124 phages may be used as an
index, or indicator organism for enteric viruses, and possibly norovirus during
UV-C wastewater disinfection. The potential for using B124 phages as
index/indicator organisms within in the environment is unknown, as data for UV-
B inactivation of enteroviruses and norovirus (feline/caninecalicivirus) have not
been produced.; and
5. Rapid methods, as used in Phase One experiments, may lead to fluctuation of
inactivation rates over experimental period, and produce microorganism
inactivation ‘shoulders’. The detailed methodology used in Phase Two gives more
rational inactivation curves. Phase One and Phase Two experimental results were
only weakly correlated and studies employing methods similar to those used in
Phase One should be treated with caution.

188
8.7 Recommendations for future work
1. When discussing the inactivation kinetics of B124 phages and how this may
influence their use as surrogates of enteroviruses and indicators of human faecal
pollution, it is important to recognise the limitations of applying results from
collimated beam studies to ‘real world’ situations (i.e., wastewater treatment
works with complex biochemical water matrices or river systems). This is because
CB tests are carried out using Petri dishes where sample depth (path length) etc. is
constant, CB test usually use organisms in suspension with low turbidity/high UV
transmission and flow rate in WwTW may be variable, where in CB tests there is
no flow. Assessment of B124 phage inactivation in wastewater treatment would
prove useful for their application in QMRA;
2. During initial phage isolation from final effluent agar plates, only 33% of picked
plaques were successfully propagated and able to re-infect GB-124. It would be
useful to investigate if the method of phage isolation damaged particular phage
types, favouring the survival of others;
3. The community ecology of WwTW influent and effluent phage populations may
have an influence on MST and should be investigated. Septic tanks may have
higher proportion of myoviruses and podoviruses (more easily inactivated than
siphoviruses), whereas treated sewage may have greater percentage of
siphoviruses. This would mean that WwTW effluent would be detectable longer
than septic tank effluent because of the presence of more resistant phage;

189
4. Reactivation of UV-C irradiated adenovirus during assay has been observed, and
it may also be useful to investigate if repair of damaged B124 phage occurs in host
cells during assay. It would also be useful to investigate if GB-124 can cause
photoreactivation of B124 phages when in river systems. If it were able to so,
there would be implications for both MST and QMRA;
5. As it is possible that B124 phages may be suitable surrogate organisms of
enteroviruses, more work needs to be carried out on the relationship between the
two organisms in situ (i.e., in river systems and WwTW). It would be useful to
determine if a predictive relationship between the two microorganisms could be
determined, thus giving a better estimation of risk to users of receiving
waterbodies, enhancing QMRA;
6. It would be useful to assess UV-A inactivation fluences and B124 phage
inactivation, to further investigate the role of solar UV in phage decay. This would
be of particular interest in river systems. This was planned in this study, but the
exposure times involved did not permit it;
7. This study only investigated low-pressure UV radiation, and there is some
evidence to suggest microorganisms are inactivated more quickly using medium-
pressure (MP) polychromatic UV (Malley et al., 2004; Mamane-Gravetz et al.,
2005). If polychromatic UV is to be installed in more WwTW, this may influence
the use of B124 phages as indicators of human faecal material and surrogates for
enteroviruses; and

190
8. An investigation into B124 phages accumulation in sediments would also help to
determine how much sediment re-suspension (associated with high flow events)
contributes to phage levels in river systems. This would aid in the formulation of
QMRA by better distinguishing phage sources.
9. It would be useful to investigate the development of a B124 phage detection assay
based on molecular methods. This may facilitate quicker determination of human
faecal pollution in affected waterbodies. Further UV inactivation studies using a
new B124 molecular technique should be carried out parallel with pathogen
inactivation studies, also using appropriate molecular techniques.
This study has identified and contributed to key knowledge gaps regarding the group
composition and ecological behaviour of phages infecting GB-124. Within the wider
context of public health protection, this study has shown that non-pathogenic
bacteriophages infecting GB-124 may prove useful indicator organisms for
pathogenic enteroviruses, assisting in the development of risk assessments and
reducing health burden from waterborne disease. Moreover, as the GB-124 phage-
lysis method is low-cost and implementable in basic laboratories, use of the technique
may aid in the achievement of the Millennium Development Goals relating to water
quality (four and seven).

191
REFERENCES Abedon, S.T. (2006). Phage Ecology. In: Calendar, R. (ed.). The Bacteriophages. 2nd edition, Oxford University Press. Abedon, S.T. and Yin, J. (2009). Bacteriophage plaques: theory and analysis. In: Clokie, M.R.J. and Kropinski, A.M. (eds.). Bacteriophages. Methods and protocols, volume 1: isolation, characterisation and interactions. New York: Humana Press. Abu-Ghararah, Z.H. (1997). Effect of temperature on the kinetics of wastewater disinfection using ultraviolet radiation. Journal of King Abdul Aziz University: Engineering, 9 (1), pp. 171-186. Ackermann, H.-W. and Nguyen, T.M. (1983). Sewage coliphages studied by electron microscopy. Applied and Environmental Microbiology, 45 (3), pp. 1049-1059. Ackermann, H.-W. and Dubow, M.S. (1987a). Viruses of prokaryotes, volume 1, General Properties of Bacteriophages, Florida: CRC Press, Ackermann, H.-W. and M.S. DuBow. (1987b). Viruses of prokaryotes, volume 2, natural groups of bacteriophages, Florida: CRC Press. Ackermann, H.-W. (1999). Tailed bacteriophages: the order Caudovirales. Advances in Virus Research, 51, pp. 135-201. Ackermann, H.-W. (2003). Bacteriophage observations and evolution. Research in Microbiology, 154, pp. 245-251. Ackermann, H.-W. (2005). Box 2: Electron Microscopy. In: Kutter, E. and Sulakvelidze, A. (eds.). Bacteriophages: biology and applications. CRC Press. Ackermann, H.-W. (2006). Classification of bacteriophages. In: Calendar, R. (ed.). The Bacteriophages. 2nd edition, Oxford University Press. Ackermann, H.-W. (2009). Basic phage electron microscopy. In: Clokie, M.R.J. and Kropinski, A.M. (eds.). Bacteriophages. methods and protocols, volume 1: isolation, characterisation and interactions. New York: Humana Press. Adams, M.H. (1959). Bacteriophages. New Yoro: Interscience Publishers. Ahmad, S.I. Hargreaves, A. Taiwo, F.A. and Kirk, S.H. (2004). Near-ultraviolet photolysis of (L)-mandelate, formation of reactive oxygen species, inactivation of phage T7 and implications on human health. Journal of Photochemistry and Photobiology B: Biology, 77, pp. 55–62. Akin, E.W. Benton, W.H., and Hill, W.W. (1971). Enteric viruses in ground and surface waters: a review of their occurrence and survival. In: Snocvink, E.P. (ed.). Proceedings of the.13th Water Quality Conference: virus and water quality, occurrence and control. University of Illinois, Urbana.

192
Amvrosieva, T.V. Titov, L.P. Mulders, M. Hovi, T. Dyakonova, O.V. Votyakov, V.I. Kvacheva, Z.B. Eremin, V.F. Sharko, R.M. Orlova, S.V. Kazinets, O.N. Bogush, Z.F. (2001). Viral water contamination as the cause of aseptic meningitis outbreak in Belarus. Central European Journal of Public Health, 9, pp. 154-157. Anderson, K.L. Whitlock, J.E. and Harwood, V.J. (2005). Persistence and differential survival of fecal indicator bacteria in subtropical waters and sediments, Applied and Environmental Microbiology, 71 (6), pp. 3041-3048. Anon (2001a). ISO 10705-1, Water quality - Detection and enumeration of bacteriophages - Part 1: enumeration of F-specific RNA bacteriophages. International Organisation for Standardisation, Geneva, Switzerland. Anon (2001b). ISO 10705-2, Water quality - Detection and enumeration of bacteriophages - Part 2: enumeration of somatic coliphages. International Organisation for Standardisation, Geneva, Switzerland. Anon (2001c). ISO 10705-4, Water quality - Detection and enumeration of bacteriophages - Part 4: enumeration of bacteriophages infecting Bacteroides fragilis, International Organisation for Standardisation. Geneva, Switzerland. Anon (2004a). World population to 2300. Department of Economic and Social Affairs: Population Division, ST/ESA/SER.A/236, New York. Anon (2004b). Wastewater Technology Factsheet – Bacterial source tracking. Environmental Protection Agency (EPA 832-F-01-010). Office of Water, Municipal Technology Branch, Washington DC. Anon (2004c). Inactivation of pathogens with innovative UV technologies, AWWA Research Foundation, USA. Anon (2007). Report of the experts scientific workshop on critical research needs for the development of new or revised recreational water quality criteria, U.S (EPA 823-R-07-006). Environmental Protection Agency: Office of Water Office of Research and Development. Available at: http://www.epa.gov/waterscience/criteria/recreation/experts/expertsWorkshop.pdf Anon (2008a). Water, sanitation and hygiene links to health Facts and figures updated November 2004. World Health Organisation website. Available at: http://www.who.int/water_sanitation_health/publications/facts2004/en/index.html (accessed June 2008) Anon (2008b). Bacteriophage structure. Available at : http://www.intralytix.com/images/PhageStructure2.jpg (accessed June 2008) Anon (2010). Waterfacts: The water industry today. Available at: http://www.water.org.uk/home/resources-and-links/waterfacts/waterindustry. (accessed February 2010).

193
Antopol, S.C. and Ellner, P.D. (1979). Susceptibility of Legionella pneumophila to ultraviolet radiation. Applied and Environmental Microbiology, 38 (2), pp. 347-348. Araujo, R. Lasobras, J. Puig, A. Lucena, F. and Jofre, J. (1997a). Abundance of bacteriophages of enteric bacteria in different freshwater environments. Water Science and Technology, 35 (11-12), pp. 125-128. Araujo, R.M. Puig, A. Lasobras, J. Lucena, F. and Jofre, J. (1997b). Phages of enteric bacteria in fresh water with different levels of faecal pollution, Journal of Applied Microbiology, 82, pp. 281-286. Armon, R. (1993). Bacteriophage monitoring in drinking water: do they fulfil the index or indicator function? Water Science and Technology, vol 27 (3-4), pp. 463-467. Ashbolt, N. Fujioka, R. Glymph, T. McGee, C. Schaub, S. Sobsey, M. and Toranzos, G. (2007). Pathogens, pathogen indicators, and indicators of fecal contamination. In: Anon (2007). Report of the experts scientific workshop on critical research needs for the development of new or revised recreational water quality criteria. EPA 823-R-07-006. U.S. Environmental Protection Agency Office of Water Office of Research and Development. Ashelford, K.E. Day, M.J. and Fry, J.C. (2003). Elevated abundance of bacteriophages infecting bacteria in soil. Applied Environmental Microbiology, 69 (1), pp. 285-289. Azam, F. and Worden, A.Z. (2004). Oceanography. Microbes, molecules, and marine ecosystems, Science, 303, pp. 1622-1624. Ballester, N.A. and Malley, V.P. (2004). Sequential disinfection of adenovirus type 2 with UV-chlorine-chloramine. Journal of the American Water Works Association, 96, pp. 97-103. Batch, L.F. Schulz, C.D., and Linden, K.G. (2004). Evaluating water quality effects on UV disinfection of MS2 coliphage. Journal of the American Water Works Association, 96, pp. 75-87. Battigelli, D.A. Sobsey, M.D. and Lobe, D.C. (1993). The inactivation of Hepatitis A virus and other model viruses by UV irradiation. Water Science Technology, 27 (3-4), pp. 339-342. Bancroft, B.A. Baker, N.J. Blaustein, A.R. (2007). Effects of UVB radiation on marine and freshwater organisms: a synthesis through meta-analysis, Ecology Letters, 10, pp. 332-345. Bell, R.G. (1976) The limitation of the ratio of fecal coliforms to total coliphages as a water pollution index. Water Research, 10, pp. 745-748. Berg, G. (1967). Transmission of viruses by the water route. New York: Wiley Interscience Publishers.

194
Berg, G. (ed.) (1978). Indicators of viruses in water and food. Michigan: Ann Arbor Science Publishers. Berg, G. and Sullivan, G. (1988). Optimum pH levels for eluting enteroviruses from sludge solids with beef extract. Applied and Environmental Microbiology, 54 (7), pp. 1880-1881. Bernhard, A.E. and Field, K.G. (2000). A PCR assay to discriminate human and ruminant feces on the basis of host differences in Bacteroides-Prevotella genes encoding 16S rRNA. Applied and Environmental Microbiology, 66 (10), pp. 4571-4574. Bianchi, M.A.G. and Bianchi, A.J.M. (1982). Statistical sampling of bacterial strains and its use in bacterial diversity measurement. Microbial Ecology, 8 (1), pp. 61-69. Bitton, G. Henis, Y. and Lahav, N. (1972). Effect of several clay minerals and humic acid on the survival of Klebsiella aerogenes exposed to ultraviolet irradiation. Applied and Environmental Microbiology, 23 (5), pp. 870-874. Bitton, G. and Mitchell, R. (1974). Effect of colloids on the survival of bacteriophages in seawater. Water Research, 8, pp. 227-229. Bitton, G. (ed.) (2002) Encyclopedia of Environmental Microbiology, New York: Wiley. Blanch, A.R. Belanche-Muñoz, L. Bonjoch, X. Ebdon, J. Gantzer, C. Lucena, F. Ottoson, J. Kourtis, C. Iverson, A. Kühn, I. Moce, L. Muniesa, M. Schwartzbrod, J. Skraber, S. Papageorgiou, G. Taylor, H. Wallis, J. and Jofre, J. (2004). Tracking the origin of faecal pollution in surface water: an ongoing project within the European Union research programme. Journal of Water and Health, 2 (4), pp. 249-260. Blanch, A.R. Belanche-Muñoz, L. Bonjoch, X. Ebdon, J. Gantzer, C. Lucena, F. Ottoson, J. Kourtis, C. Iverson, A. Kühn, I. Moce, L. Muniesa, M. Schwartzbrod, J. Skraber, S. Papageorgiou, G. Taylor, H. Wallis, J. and Jofre, J. (2006). Integrated analysis of established and novel microbial and chemical methods for microbial source tracking. Applied and Environmental Microbiology, 72 (9), pp. 5915-5926. Blumthaler, M. Ambach, W. and M. Huber (1993). Altitude effect of solar UV radiation dependent on albedo, turbidity and solar elevation, Meteorologische Zeitschrift, 2, pp. 116-120. Boelen, P. de Boer, M.K. Kraay, G.W. Veldhuis, M.J.W. and Buma, A.G.J. (2000). UVBR-induced DNA damage in natural picoplankton assemblages in the tropical Atlantic Ocean. Marine Ecology Progress Series, 193, pp. 1-9. Boelen, P. Post, A.F. Veldhuis, M.J.W. and Buma, A.G.J. (2002). Diel patterns of UVBR-induced DNA damage in picoplankton size fractions from the Gulf of Aqaba, Red Sea. Microbial Ecology, 44, pp. 164-174.

195
Bohrerova, Z. Mamane, H. Ducoste, J.J. and Linden, K.G. (2006). Comparative inactivation of Bacillus Subtilis spores and MS-2 coliphage in a UV reactor: implications for validation. Journal of Environmental Engineering, 132 (12), pp. 1554-1561. Bolton, J.R. and Linden, K.G. (2003). Standardization of methods for fluence (UV dose) determination in bench-scale UV experiments. Journal of Environmental Engineering, 129 (3), pp. 209-215. Bolton, J.R. and Smith, D.W. (2005). Editorial. Journal of Environmental Engineering and Science, 4, pp. Sv. Bolton, J.R. Wright, H. and Rokjer, D. (2005). Using a mathematical fluence rate model to estimate the sensor readings in a multi-lamp ultraviolet reactor. Journal of Environmental Engineering and Science, 4, pp. S27-S31. Booth, S.J. Van Tassell, R.L. Johnson, J.L. and Wilkins, T.D. (1979). Bacteriophages of Bacteroides. Reviews of Infectious Diseases, 1 (2), pp. 325-336. Borrego, J.J. Moriñigo, M.A. De Vicente, A. Córnax, R and Romero, P. (1987). Coliphages as an indicator of faecal pollution in water. Its relationship with indicator and pathogenic microorganisms. Water Research, 21 (12), pp. 1473-1480. Borrego, J.J. Córnax, R. Moriñigo, M.A. Martínez-Manzanares, E. and Romero, P. (1990). Coliphages as an indicator of faecal pollution in water. Their survival and productive infectivity in natural aquatic environments. Water Research, 24 (1), pp. 111-116. Bradley, D.E. (1967). Ultrastructure of Bacteriophages and Bacteriocins. Bacteriological Reviews, 31 (4), pp. 230-314. Bradley, G. Carter, J. Gaudie, D. and King, C. (1999). Distribution of the human faecal bacterium Bacteroides fragilis, its bacteriophages and their relationship to current sewage pollution indicators in bathing water. Journal of Applied Microbiology Symposium Supplement, 85, pp. 90s-100s. Breitbart, M. Salamon, P. Andresen, B. Mahaffy, J.M. Segall, A.M. Mead, D. and Azam, F. (2002). Genomic analysis of uncultured marine viral communities, Proceedings of the National Academy of Sciences, 99, pp. 14250-14255. Breitbart, M. Wegley, L. Leeds, S. Schoenfeld, T. and Rohwer, F. (2004). Phage community dynamics in hot springs. Applied and Environmental Microbiology, 70 (3), pp. 1633-1640. Brownwell, M.J. Harwood, V.J. Kurz, R.C. McQuaig, S.M. Lukasik, J. and Scott, T.M. (2007). Confirmation of putative stormwater impact on water quality at a Florida beach by microbial source tracking methods and structure of indicator organism populations. Water Research, 41, pp. 3747-3757.

196
Brüssow, H. (2001). Phages of dairy bacteria. Annual Review of Microbiology, 55, pp. 283-303. Bruynoghe, R. and Maisin, J. (1921). Essais de therapeutique au moyen du bacteriophage du staphylocoque. Comptes rendus hebdomadaires de Seances de la Societe de Biologie. 85, pp. 1120-1121. Budowsky, E.I. Bresler, S.E. Friedman, E.A. and Zheleznova, N.V. (1981a). Archives of Virology, 68, pp. 239-247. Budowsky E.I. Kostyuk G.V. Kost A.A. and Savin F.A. (1981b). Principles of selective inactivation of viral genome II. Influence of stirring and optical density of the layer to be irradiated upon UV-induced inactivation of viruses. Archives of Virology, 68, 249-256. Bukhari, Z. Hargy, T.M. Bolton, J.R. Dussert, B. Clancy, J.L. (1999). Medium-pressure UV light for oocysts inactivation. Journal of the American Water Works Association, 91 (3), pp. 86-94. Burck, K.B. Scraba, D.G. and Miller, R.C. Jnr (1979). Electron microscopic analysis of partially replicated bacteriophage T7 DNA. Journal of Virology, 32 (2), pp. 606-613. Burt, S.J. and Woods, D.R. (1977). Transfection of the anaerobe Bacteroides thetaiotaomicron with phage DNA. Journal of General Microbiology, 103, pp. 181-187. Butler, R.C. Lund, V. and Carlson, D.A. (1987). Susceptibility of Campylobacter jejuni and Yersinia enterocolitica to UV radiation. Applied and Environmental Microbiology, 53 (2), pp. 375-378 Buzrul, S. Öztürk, P. Alpas, H. and Akcelik, M. (2007). Thermal and chemical inactivation of lactococcal bacteriophages, LWT – Food, Science and Technology, 40, pp. 1671-1677. Cabaj, A. Sommer, R. Bolton, J. Wright, H. and Schmalwieser, A. (2005). The influence of the position and spectral sensitivity of sensors on the surveillance of water disinfection plants with polychromatic ultraviolet radiation. Journal of Environmental Engineering and Science, 4, pp. S45-S50. Caballero, S. Abad, F.X. Loisy, F. Le Guyader, F.S. Cohen, J. Pintó, R.M. and Bosch, A. (2004). Rotavirus virus-like particles as surrogates in environmental persistence and inactivation studies. Applied and Environmental Microbiology, 70 (7), pp. 3904-3909. Calendar, R. (ed.) (2006). The Bacteriophages. 2nd edition. Oxford University Press. Campbell, A.T. and Wallis, P. (2002). The effect of UV irradiation on human-derived Giardia lamblia cysts, Water Research, 36 (4), pp. 963-969.

197
Carlson, D.A. Seabloom, R.W. DeWalle, F.B. Wetzler, T.F. Engeset, J. Butler, R. Wangsuphachart, S. and Wang, S. (1985). Ultraviolet disinfection of water for small water supplies (EPA/600/S2-85/092). Cincinnati: USEPA Chang, S.L. Stevenson, R.E. Bryant, A.R. Woodward, R.L. and Kabler, P.W. (1958). Removal of coxsackie and bacterial viruses in water by flocculation. II. Removal of coxsackie and bacterial viruses and the native bacteria in raw Ohio River water by flocculation with aluminium sulfate and ferric chloride. American Journal of Public Health and Nation’s Health, 48(2), pp. 159-169. Chang, J.C.H. Ossoff, S.F. Lobe, D.C. Dorfman, M.H. Dumais, C.M. Qualls, R.G. and Johnson, J.D. (1985). UV inactivation of pathogenic and indicator microorganisms. Applied and Environmental Microbiology¸ 49 (6), pp. 1361-1365. Chevrefils, G. and Caron, E. (2006). UV dose required to achieve incremental log inactivation of bacteria, protozoa and viruses. IUVA News, 8 (1), pp. 38-45. Chick, H. (1908). An investigation into the laws of disinfection. Journal of Hygiene, 8, pp. 92-158. Cho, M. Chung, H. Choi, W. and Yoon, J. (2005). Different inactivation behaviours of MS-2 phage and Escherichia coli in TiO2 photocatalytic disinfection. Applied and Environmental Microbiology, 71 (1), pp. 270-275. Chun, H. Kim, J. Chung, K. Won, M. and Song, K.B. (2009). Inactivation kinetics of Listeria monocytogenes, Salmonella enterica serovar Typhimurium, and Campylobacter jejuni in ready-to-eat sliced ham using UV-C irradiation. Meat Science, 83, pp. 599-603. Chung, H. Jaykus, L.A. Lovelance, G. Sobsey, M.D. (1998). Bacteriophages and bacteria as indicators of enteric viruses in oysters and their harvest waters. Water Science and Technology, 38 (12), pp. 37-44. Cimenti, M. Hubberstey, A. Bewtra, J.K. Biswas, N. (2007). Alternative methods in tracking sources of microbial contamination in waters, Water South Africa, 33 (2), pp. 183-194. Clancy, J.L. Hargy, T.M. Marshall, M.M. Dyksen, J.E. (1998). UV light inactivation of Cryptosporidium oocysts. Journal of the American Water Works Association, 90 (9), 92-102. Clancy, J.L. Marshall, M.M. Hargy, T.M. and Korich, D.G. (2004a). Susceptibility of five strains of Cryptosporidium parvum oocysts to UV light. Journal of the American Water Works Association, 96 (3), pp. 84-93. Clancy, J.L. Fallon, K. Hargy, T.M. Mackey, E. and Wright, H. (2004b). Development of non-pathogenic surrogates for large scale UV reactor validation. In: Proceedings of the American Water Works Association Water Quality Technology Conference. San Antonio, USA.

198
Clokie, M.R.J. and Kropinski, A.M. (eds.) (2009). Bacteriophages. Methods and protocols, volume 1: isolation, characterisation and interactions. New York: Humana Press. Coetzee, O.J. (1962). Bakteriophagen als indikator fakaler wassereinigung. Gesundheits Ingenieur, 12, pp. 371-372. Contreras-Coll, N. Lucena, F. Mooijman, K. Havelaar, A. Pierzo, V. Boque, M. Gawler, A. Höller, C. Lambiri, M. Mirolo, G. Moreno, B. Niemi, M. Sommer, R. Valentin, B. Wiedenmann, A. Young, V. and Jofre, J. (2002). Occurrence and levels of indicator bacteriophages in bathing waters through Europe. Water Research, 36, pp. 4963-4974. Coohill, T.P. (1996). Stratospheric ozone loss, ultraviolet effects and action spectroscopy. Advanced Space Research, 18 (12), pp. 27-33. Coohill, T.P. and Sagripanti, J.-L. (2008). Bacterial inactivation by germicidal ultraviolet radiation. Photochemistry and Photobiology, 84, pp. 1084-1090. Coohill, T.P. and Sagripanti, J-L. (2009). Bacterial inactivation by solar ultraviolet radiation compared with sensitivity to 254 nm radiation. Photochemistry and Photobiology, 85, pp. 1043-1052. Costán-Longaresa, A. Montemayor, M. Payán, A. Méndez, J. Jofre, J. Mujeriego, R. and Lucena, F. (2008). Microbial indicators and pathogens: removal, relationships and predictive capabilities in water reclamation facilities. Water Research, 42, pp. 4439-4448. Cotton, I.M. and Lockingen, L.S. (1963). Inactivation of bacteriophage by chloroform and X radiation. Proceedings of the National Academy of Sciences, 50 (2), pp. 363-367. Cotton, C.A. Owen, D.M. Cline, G.C. and Brodeur, T.P. (2001). UV disinfection costs for inactivating Cryptosporidium. Journal of the American Water Works Association, 93 (4), pp. 82-94. Cotton, C. and Passantino, L. (2005). Regulations in the United States: requirements and guidance for ultraviolet disinfection of drinking water. Journal of Environmental Engineering and Science, 4, pp. S57-S63. Craik, S.A. Finch, G.R. Bolton, J.R. and Belosevic, M. (2000). Inactivation of Giardia muris cysts using medium-pressure ultraviolet radiation in filtered drinking water. Water Research, 34 (18), pp. 4325-4332. Cywinska, A. Crump, D. and Lean, D. (2000). Influence of UV radiation on four freshwater invertebrates. Photochemistry and Photobiology, 72, pp. 652-659. Da Silva A.K. Le Saux, J-C. Parnaudeau, S. Pommepuy, M. Elimelech, M. and Le Guyader, F.S. (2007). Evaluation of Removal of Noroviruses during Wastewater

199
Treatment, Using Real-Time Reverse Transcription-PCR: Different Behaviours of Genogroups I and II Applied Environmental Microbiology, 73 (24), pp. 7891-7897. Davies, C.M. Long, J.A.H. Donald, M. and Ashbolt, N.J. (1995). Survival of fecal microorganisms in marine and freshwater sediments. Applied Environmental Microbiology, 61 (5), pp. 1888-1896. Davies, C.M. Roser, D.J. Feitz, A.J. and Ashbolt, N.J. (2009). Solar radiation disinfection of drinking water at temperate latitudes: inactivation rates for an optimised reactor configuration. Water Research, 43, pp. 643-652. Davies-Colley, R.J. Donnisson, A.M. and Speed, D.J. (1997). Sunlight wavelengths inactivating faecal indicator microorganisms in waste stabilization pond. Water Science and Technology, 35 (11–12), pp. 219-225. Debartolomeis, J. and Cabelli, V.J., (1991). Evaluation of an Escherichia coli host strain for enumeration of F male-specific bacteriophages. Journal of Applied Environmental Microbiology, 57, pp. 1301-1305. Dee, S.W. and Fogleman, J.C. (1992). Rates of inactivation of waterborne coliphages by monochloramine. Applied and Environmental Microbiology, 58 (9), pp. 3136-3141. De Flora, S. De Renzi, G.P. and Badolati, G. (1975). Detection of animal viruses in coastal seawater and sediments. Applied Microbiology, 30 (3), pp. 472-475. Demuth, J. Neve, H. and Witzel, K.-P. (1993). Direct electron microscopy study on the morphological diversity of bacteriophage populations in Lake Plußsee. Applied and Environmental Microbiology, 59 (10), pp. 3378-3384. d’Hérelle, F. (1917). Sur un microbe invisible antagoniste des bacilles dysentériques. Comptes rendus hebdomadaires de Seances de la Societe de Biologie, 165, pp. 373-375. d’Hérelle, F. (1921). Le bactériophage: Son rôle dans limmunité. Paris: Masson et Cie. d’Hérelle, F. (1925). Essai de traîtement de la peste bubonique par le bactériophage. La Presse Médicale, 33, pp. 1393-1394. d’Hérelle, F. (1926). The bacteriophage and its behaviour. Baltimore: Williams and Watkins. Dib, J. Motok, J. Zenoff, V.F. Ordoñez, O. and Farías, M.E. (2008). Occurrence of resistance to antibiotics, UV-B, and arsenic in bacteria isolated from extreme environments in high-altitude (above 4400 m) Andean wetlands. Current Microbiology, 56, pp. 510-517.

200
Dizer, H. Nasser, A. and Lopez, J.M. (1984). Penetration of different human pathogenic viruses into sand columns percolated with distilled water, groundwater, or wastewater. Applied Environmental Microbiology, 47 (2), pp. 409-415. Douki, T. Reynaud-Angelin, A. Cadet, J. and Sage, E. (2003). Bipyrimidine photoproducts rather than oxidative lesions are the main type of DNA damage involved in the genotoxic effect of solar UVA radiation. Biochemistry, 42, pp. 9221-9226. Doultree, J.C. Druce, J.D. Birch, C.J. Bowden, D.S. and Marshall, J.A. (1999). Inactivation of feline calicivirus, a Norwalk virus surrogate, Journal of Hospital Infection, 41, pp. 51-57. Ducoste, J. and Linden, K. (2005). Determination of ultraviolet sensor location for sensor set-point monitoring using computational fluid dynamics. Journal of Environmental Engineering and Science, 4, pp. S33-S43. Duizer, E. Bijkerk, P. Rockx, B. de Groot, A. Twisk, F. and Koopmans, M. (2004). Inactivation of caliciviruses. Applied and Environmental Microbiology, 70 (8), pp. 4538-4543. Durán, A.E. Muniesa, M. Méndez, X. Valero, F. Lucena, F. and Jofre, J. (2002). Removal and inactivation of indicator bacteriophages in fresh waters, Journal of Applied. Microbiology, 92, pp 338-347. Dutka, B.J. El-Shaarawi, A. Martins, M.T. and Sanchez, P.S. (1987). North and South American studies on the potential of coliphage as a water quality indicator. Water Research, 21, pp. 1127-1134. Ebdon, J. Muniesa, M. and Taylor, H.D. (2007). The application of a recently isolated strain of Bacteroides (GB-124) to identify human sources of faecal pollution in a temperate river catchment. Water Research, 41 (16), pp. 3683-3690. Eischeid, A.C. and Linden, K.G. (2007). Efficiency of pyrimidine dimer formation in Escherichia coli across UV wavelengths. Journal of Applied Microbiology, 103, pp. 1650-1656. Eischeid, A.C. Meyer, J.N. and Linden, K.G. (2009). UV disinfection of adenovirus: molecular indications of DNA damage efficiency. Applied and Environmental Microbiology, 75 (1), pp. 23-28. Ellis, E.L. and Delbrück, M. (1939). The growth of bacteriophage. Journal of General Physiology, 22, pp. 265-384. Emmerich, R. and Löw, O. (1901). Die Künstliche Darstellung der immunusuerenden Substanzen (Nucleasen-Immunproteïdine ) und ihre Verwendung zur Therapie der Infektionskrankheiten und zur Schutzimpfung and Stelle de Heilserums. Zeitschrift für Hygiene und Infectionskrankheiten, 36, pp. 9-28.

201
Evanson, M. and Ambrose, R.F. (2006). Sources and growth dynamics of fecal indicator bacteria in a coastal wetland system and potential impacts to adjacent waters. Water Research, 40, pp 475-486. Fauquet, C.M. Mayo, M.A. Maniloff, J. Desselberger, U. and Ball, L.A. (eds.) (2005). Virus taxonomy, classification and nomenclature of viruses, eighth report of the international committee on the taxonomy of viruses. Elsevier Academic Press. Field, K.G. Bernhard, A.E. and Brodeur, T.J. (2003). Molecular approaches to microbiological monitoring: fecal source detection. Environmental Monitoring and Assessment, 81, pp. 313-326. Field, K.G. and Samadpour, M. (2007). Fecal source tracking, the indicator paradigm, and managing water quality. Water Research, 41, pp. 3517-3538.
Fiers, W. Contreras, R. Duerinck, F. Haegeman, G. Iserentant, D. Merregaert, J. Min Jou W. Molemans, F. Raeymaekers, A. Van den Berghe, A. Volckaert, G. and Ysebaert, M. (1976). Complete nucleotide sequence of bacteriophage MS2 RNA: primary and secondary structure of the replicase gene. Nature, 260, pp. 500-507.
Finegold, S.M. Sutter, V.L. and Mathisen, G.E. (1983). Normal indigenous intestinal flora. In: Hentges, D.J. (ed.). Human intestinal microflora in health and disease. New York: Academic Press. Fleisher, J.M. Kay, D. Salmon, R.L. Jones, F. Wyer, M.D. and Godfree, A.F. (1996). Marine waters contaminated with domestic sewage: non-enteric illness associated with bather exposure in the United Kingdom. American Journal of Public Health, 86 (9), pp. 1228-1234. Formiga-Cruz, M. Allard, A.K. Conden-Hansson, A.-C. Henshilwood, K. Hernroth, B.E. Jofre, J. Lees, D.N. Lucena, F. Papapetropoulou, M. Rangdale, R.E. Tsibouxi, A. Vantarakis, A. and Gironés, R. (2003). Evaluation of potential indicators of viral contamination in shellfish and their applicability to diverse geographical areas. Applied and Environmental Microbiology, 69 (3), pp. 1556-1563. Francki, R.I.B. Fauquet, C.M. Knudson, D.L. and Brown, F. (1991) Classification and nomenclature of viruses: 5th report of the International Committee on Taxonomy of Viruses. Archoves of Virology Supplement, 2. Friedberg, E.C. Walker, G.C. and Siede, W. (1995). DNA and mutagenesis. Washington, D.C: ASM Press. Fujioka, R. (2002). Microbial indicators of marine recreational water quality. In: Hurst, C.J. Crawford, R.L. Knudsen, G.R. McInerney, M.J. and Stetzenbach, L.D. (eds.). Manual of environmental microbiology. 2nd edition. Washington, D.C: ASM Press. Furuse, K. Osawa, S. Kawashiro, J. Tanaka, R. Ozawa, A. Sawamura, S. Yanagawa, Y. Nagao, T. and Watanabe, I. (1983). Bacteriophage distribution in human feces:

202
continuous survey of healthy subjects and patients with internal and leukaemic disease. Journal of General Virology, 64, pp. 2039-2043. Gabrielli, R. Divizia, M. Donia, D. Ruscio, V. Bonadonna, L. Diotallevi, C. Villa, L. Manzone, G. and Paná, A. (1997). Evaluation of the wastewater treatment plant of Rome airport. Water Science and Technology, 35 (11-12), pp. 193-196. Gantzer, C. Maul, A. Audic, A.U. and Schwartzbrod, L. (1998). Detection of infectious enteroviruses, enterovirus genomes, somatic coliphages, and Bacteroides fragilis phages in treated wastewater. Applied and Environmental Microbiology, 64 (11), pp. 4307-4312. Gantzer, C. Gillerman, L. Kuznetsov, M. and Oron, G. (2001). Adsorption and survival of faecal coliforms, somatic coliphages and F-specific RNA phages in soil irrigated with wastewater. Water Science and Technology, 43 (12), pp. 117-124. Gantzer, C. Henry, J. and Schwartzbrod, L. (2002). Bacteroides fragilis and Escherichia coli bacteriophages in human faeces. International Journal of Hygiene and Environmental Health, 205 (4), pp. 325-328. Garde, K. and Cailliau, C. (2000). The impact of UV-B radiation and different PAR intensities on growth, uptake of 14C, excretion of DOC, cell volume, and pigmentation in the marine prymnesiophyte, Emiliania huxleyi. Journal of Experimental Marine Biology and Ecology, 247 (1), pp. 99-112. Garza, D.R. and Suttle, C.A. (1998). The effect of cyanophages in the mortality of Synechococcus spp. and selection for UV resistant viral communities. Microbial Ecology, 36, pp. 281-292. Gehr, R. (2007). Collimated beam tests: their limitations for assessing wastewater disinfectability by UV, and a proposal for an additional evaluation parameter. Journal of Environmental Engineering and Science, 6, pp. 265-270. Geldreich, E.E. and Clarke, N.A. (1971). The coliform test: a criterion for the viral safety of water. Proceedings: Thirteenth Water Quality Conference. Urbana, Illinois. Geldreich, E.E. (1978). Bacterial populations and indicator concepts in faeces, sewage, stormwater and solid wastes. In: Berg, G. (ed.). Indicators of Viruses in Water and Food. Michigan: Ann Arbor Science Publishers, Inc. Gerba, C.P. and Schaiberger, G.E. (1975). Effect of particulates on virus survival in seawater. Journal Water Pollution Control Federation, 47 (1), pp.93-103. Gerba, C.P. and McLeod, J.S. (1976). Effect of sediments on the survival of Escherichia coli in marine waters. Applied Environmental Microbiology, 32 (1), pp. 114-120. Gerba, C.P. Smith, E.M. and Melnick, J.L. (1977). Development of a quantitative method for detecting enteroviruses in estuarine sediments, Applied Environmental Microbiology, 34 (2), pp. 158-163.

203
Gerba, C.P. (1984). Applied and theoretical aspects of virus adsorption to surfaces. Advances in Applied Microbiology, 30, pp. 133-168. Gerba, C.P. Gramos, D.M. and Nwachuku, N. (2002). Comparative inactivation of enteroviruses and adenovirus 2 by UV light. Applied and Environmental Microbiology, 68 (10), pp. 5167-5169. Gerba, C.P. (2006). Bacteriophage as pollution indicators. In: Calendar, R. (ed.) (2006). The Bacteriophages. 2nd edition, Oxford University Press. German, G.J. Misra, R. and Kropinski, A.M. (2006). The T1-Like phages. In: Calendar, R. (ed.) (2006). The Bacteriophages. 2nd edition, Oxford University Press. Gherna, R. and Woese, C.R. (1992). A partial phylogenetic analysis of the "Flavobacter-Bacteroides" phylum: basis for taxonomic restructuring. Systematic and Applied Microbiology, 15 (4), pp. 513-521. Giacomoni, P.U. (1995). Open questions in photobiology 2. Induction of nicks by UV-A. Journal of Photochemistry and Photobiology. B: Biology, 29, pp. 83-85. Given, S. Pendleton, L. and Boehm, A.B. (2006). Regional public health cost estimates of contaminated coastal waters: a case study of gastroenteritis at southern California Beaches. Environmental Science and Technology, 40 (16), pp. 4851-4858. Godfree, A.F. Kay, D. and Wyer, M.D. (1997). Faecal streptococci as indicators of faecal contamination in water. Journal of Applied microbiology, 83, 110s-119s. Golding, A.M.B. (ed.) (1994). Water & Public Health. London: Smith-Gordon. Gordon, M.H. (1905). Report of some characters by which various streptococci and staphylococci may be differentiated and identified. Supplement to the Thirty-third Annual Report of the Local Government Board Containing the "Report of the Medical Officer" for 1903-04. British Government. Goyal, S.M. Gerba, C.P. and Melnick, J.L. (1977). Occurrence and distribution of bacterial indicators and pathogens in canal communities along the Texas coast. Applied and Environmental Microbiology, 34 (2), pp. 139-149. Goyal, S.M. and Gerba, C.P. (1979). Comparative adsorption of human enteroviruses, simian rotavirus, and selected bacteriophages to soils. Applied Environmental Microbiology, 38 (2), pp. 241-247. Goyal, S.M. Gerba, G.P. and Bitton, G. (1987). Phage Ecology, New York: John Wiley & Sons. Grabow, W.O.K. Holtzhausen, C.S. and de Villiers, J.C. (1993). Research on bacteriophages as indicators of water quality (WRC report no. 321/1/93). Pretoria, South Africa: Water Research Commission.

204
Grabow, W.O.K. Neubrech, T.E. Holtzhausen, C.S. and Jofre, J. (1995). Bacteroides fragilis and Escherichia coli bacteriophages: excretion by humans and animals. Water Science and Technology, 31 (5-6), pp. 223-230. Grabow, W.O.K. (2001). Bacteriophages: update for application as models for viruses in water. Water South Africa, 27 (2), pp. 251-268. Guttman, B. Raya, R. and Kutter, E. (2005). Basic phage biology. In: Kutter, E. and Sulakvelidze, A. (eds.) Bacteriophages: Biology and Applications. CRC Press Haas, C.N. Rose, J.B. and Gerba, C.P. (1999). Quantitative microbial risk assessment. New York: Wiley Häder, D.P. Kumar, H.D. Smith, R.C. and Worrest, R.C. (1998). Effects on aquatic ecosystems. Journal of Photochemistry and Photobiology B: Biology, 46, pp. 53-68. Häder, D.P. Kumar, H.D. Smith, R.C. Worrest, R.C. (2007). Effects of solar UV radiation on aquatic ecosystems and interactions with climate change. Photochemical and Photobiological Science, 6, 267-285. Hankin, E.H. (1896). L’action bactericide des eaux de al Jumma et du Gange sur le vibrion du cholera. Ann de l’Inst Pasteur, 10, pp. 511-523. Hantula, J. Kurki, A. Vuoriranta, P. and Bamford, D.H. (1991). Ecology of bacteriophages infecting activated sludge bacteria. Applied and Environmental Microbiology, 57 (8), pp. 2147-2451. Hargreaves, A. Taiwo, F.A. Duggan, O. Kirk, S.H. and Ahmad, S.I. (2007). Near-ultraviolet photolysis of β-phenylpyruvic acid generates free radicals and results in DNA damage. Journal of Photochemistry and Photobiology B: Biology, 89, pp. 110-116. Harm, W. (1980). Biological Effects of Ultraviolet Radiation. Cambridge Massachusetts: Cambridge University Press. Harris, G.D. Adams, V.D. Sorensen, D.L. and Curtis, M.S. (1987). Ultraviolet inactivation of selected bacteria and viruses with photoreactivation of the bacteria, Water Research, 21 (6), pp. 687-692. Hartman, P.S. and Eisenstark, A. (1982). Alteration of bacteriophage attachment capacity by near-UV irradiation, Journal of Virology, 43 (2), pp. 529-532. Havelaar, A.H. and Nieuwstad, T.J. (1985). Bacteriophages and faecal bacteria as indicators of chlorination efficiency of biologically treated wastewater. Journal of the Water Pollution Control Federation, 57, pp. 1084-1088. Havelaar, A.H. Furuse, K. and Hogeboom, W.H. (1986). Bacteriophages and indicator bacteria in human and animal faeces. Journal of Applied Bacteriology, 60, pp. 255-262.

205
Havelaar, A.H. and Pot- Hogeboom, W.M. (1988). F-specific RNA bacteriophages as model viruses in water hygiene: ecological aspects. Water Science and Technology, 20, pp. 399-407. Havelaar, A.H. Meulemans, C.C.E. Pot-Hogeboom, W.M. and Koster, J. (1990). Inactivation of bacteriophage MS2 in wastewater effluent with monochromatic and polychromatic ultraviolet light, Water Research, 24 (11), pp. 1387-1393. Havelaar, A.H. (1993). Bacteriophages as models of human enteric viruses in the environment, ASM News, 59, pp 614-619. Havelaar, A.H. Van Olphen, M. and Drost, Y.C. (1993). F-specific RNA bacteriophages are adequate model organisms for enteric viruses in fresh water. Applied and Environmental Microbiology, 59 (9), pp. 2956-2962. Hawkins, S.A. Layton, A.C. Ripp, S. Williams, D. and Sayler, G.S. (2008). Genome sequence of the Bacteroides fragilis phage ATCC 51477-B1. Virology Journal, 5, article number 97. Hayes, S.L. Rice, E.W. Ware, M.W. and Schaefer, F.W. (2003). Low pressure ultraviolet studies for inactivation of Giardia muris cysts. Journal of Applied Microbiology, 94 (1), pp. 54-59. Hayes, S.L. White, K.M. and Rodgers, M.R. (2006). Assessment of the effectiveness of low-pressure UV light for inactivation of Helicobacter pylori. Applied and Environmental Microbiology, 72 (5), pp. 3763-3765. Hayes, S.L. Sivaganesan, M. White, K.M. and Pfaller, S.L. (2008). Assessing the effectiveness of low-pressure ultraviolet light for inactivating Mycobacterium avium complex (MAC) micro-organisms. Letters in Applied Microbiology, 47, pp. 386-392. Heaselgrave, W. Patel, N. Kilvington, S. Kehoe, S.C. and McGuigan, K.G. (2006). Solar disinfection of poliovirus and Acanthamoeba polyphaga cysts in water – a laboratory study using simulated sunlight. Letters in Applied Microbiology, 43, pp. 125-130. Heisler, G.M. Grant, R.H. Gao, W. and Slusser, J.R. (2004). Solar ultraviolet-B radiation in urban environments: the case of Baltimore, Maryland. Photochemistry and Photobiology, 80, pp. 422-428 Heldal, M. and Bratbak, G. (1991). Production and decay of viruses in aquatic environments. Marine Ecology Progress Series, 72, pp. 205-212. Hendirx, R.W. and Casjens, S. (2006). Bacteriophage λ and its genetic neighbourhood. In: Calendar, R. (ed.). The Bacteriophages. 2nd edition, Oxford University Press. Henry, V. Helbronner, A. and Recklinghausen, M. (1910). Nouvelles recherches sur la sterilization de grandes quantited d’eau par les rayons ultraviolets. Comptes rendus hebdomadaires de Seances de la Societe de Biologie, 151, pp. 677-680.

206
Hentges, D.J. (ed.). Human intestinal microflora in health and disease. New York: Academic Press. Hernández, E.A. Ferreyra, G.A. Ruberto, L.A.M. and Mac Cormack, W.P. (2009). The water column as an attenuating factor of the UVR effects on bacteria from a coastal Antarctic marine environment, Polar Research, 28, pp. 390-398. Hershey, A.D. and Chase, M. (1952). Independent functions of viral protein and nucleic acid in the growth of bacteriophage. Journal of General Physiology, 36 (1), pp. 39-56. Hijnen, W.A.M. van der Veer, A.J. Beerendonk, E.F. and Medema, G.J. (2004). Increased resistance of environmental anaerobic spores to inactivation by UV, Water Science and Technology: Water Supply, 4 (2), pp. 54-61. Hijnen, W.E.M. Beerendonk, E.F. and Medema, G.J. (2006). Inactivation credit of UV radiation for viruses, bacteria and protozoan (oo)cysts in water: a review. Water Research, 40, pp. 3-22. Hilton, M.C. and Stotzky, G. (1973). Use of coliphages as indicators of water pollution. Canadian Journal of Microbiology, 19, pp. 747-751. Hoff, J.C. Rice, E.W. and Schaefer, F.W. (1985). Comparison of animal infectivity and excystation as measures of Giardia muris cyst inactivation by chlorine. Applied and Environmental Microbiology, 50 (4), pp. 1115-1117. Hoyer, O. (1998). Testing performance and monitoring of UV systems for drinking water disinfection, Water Supply, 16 (1-2), pp. 424-429. Hoyer, O. (2000). The status of UV technology in Europe, IUVA News, 2, pp. 22-27. Hoyer, O. (2004). Water disinfection with UV radiation - requirements and realization. In: Proceedings of the European Conference UV Karlsruhe, UV radiation. Effects and Technologies. Karlsruhe. Hsu, F.C. Shieh, Y.S. van Duin, J. Beekwilder, M.J. and Sobsey, M.D. (1995). Genotyping male-specific RNA coliphages by hybridization with oligonucleotide probes. Applied and Environmental Microbiology 61 (11), pp. 3960-3966. Hu, T.-L. (1998). A comparison of two methods to recover phages from soil samples. Bioresource Technology, 65, pp. 167-169. Hunter, P.R. (1997). Waterborne disease. Chichester: Wiley Hurst, C.J. (ed.) Modeling disease transmission and its prevention by disinfection. Cambridge, UK: Cambridge University Press. Hurst, C.J. (1997). Overview of water microbiology as it relates to public health. In: Hurst, C.J. Knudsen, G.R. McInerney, M.J. Stetzenbach, L.D. and Walter, M.V. (eds.) Manual of environmental microbiology. Washington DC: ASM Press.

207
Hurst, C.J. Knudsen, G.R. McInerney, M.J. Stetzenbach, L.D. and Walter, M.V. (eds.) (1997). Manual of environmental microbiology. Washington DC: ASM Press. Hurst, C.J. Crawford, R.L. Knudsen, G.R. McInerney, M.J. and Stetzenbach, L.D. (eds.) (2002). Manual of environmental microbiology. 2nd edition. Washington DC: ASM Press. Husman, A.M.D. Bijkerk, P. Lodder, W. Van den Berg, H. Pribil, W. Cabaj, A. Gehringer, P. Sommer, R. and Duizer, E. (2004). Calicivirus inactivation by nonionizing 253.7-nanometer-wavelength (UV) and ionizing (Gamma) radiation. Applied and Environmental Microbiology, 70 (9), pp. 5089-5093. IAWPRC Study Group on Health Related Water Microbiology (1991). Bacteriophages as model viruses in water quality control. Water Research, 25 (5), pp. 529-545. Jacangelo, J.G. Loughran, P. Petrik, B. Simpson, D. and McIlroy, C. (2003) Removal of enteric viruses and selected microbial indicators by UV irradiation of secondary effluent. Water Science and Technology, 47 (9), pp.193-198. Jacquet, S. and Bratbak, G. (2003). Effects of ultraviolet radiation on marine virus-phytoplankton interactions. FEMS Microbiology Ecology, 44, pp. 279-289. Jagals, P. Grabow, W.O.K. and de Villiers, J.C. (1995). Evaluation of indicators for assessment of human and animal faecal pollution of surface run-off. Water Science and Technology, 31 (5-6), pp. 235-241. Jagger, J. (1985). Solar-UV actions on living cells. Praeger Publishers. Jiang, S. Noble, R. and Chu, W. (2001). Human adenoviruses and coliphages in urban runoff-impacted coastal waters of Southern California. Applied and Environmental Microbiology, 67 (1), pp. 179-184. Jofre, J. Bosch, A. Lucena, F. Gironés, R. and Tartera, C. (1986). Evaluation of Bacteroides fragilis bacteriophages as indicators of the virological quality of water. Water Science and Technology, 18 (10), pp. 167-173. Jofre, J. Blasi, M. Bosch, A. and Lucena, F. (1989). Occurrence of bacteriophages infecting Bacteroides fragilis and other viruses in polluted marine sediments. Water Science & Technology, 21 (3), pp. 15-19. Jofre, J. (2002). Bacteriophage indicators. In: Bitton, G. (ed.) Encyclopedia of Environmental Microbiology. New York: Wiley. Jofre. J. (2009). Is the replication of somatic coliphages in water environments significant? Journal of Applied Microbiology, 106, pp. 1059-1069. Jolis, D. (2002). The effect of storage and lag time on MS2 bacteriophage susceptibility to ultraviolet radiation. Water Environment Research, 74 (6), pp. 516-520.

208
Joux, F. Jefferey, W.H. Lebaron, P. and Mitchell, D.L. (1999). Marine bacterial isolates display diverse responses to UV-B radiation. Applied and Environmental Microbiology, 65 (9), pp. 3820-3827. Jung, J. Kim, Y. Kim, J. Jeong, D-H. and Choi, K. (2008). Environmental levels of ultraviolet light potentiate the toxicity of sulfonamide antibiotics in Daphnia magna. Ecotoxicology, 17, pp. 37-45. Kadavy, D.R. Shaffer, J.J. Lott, S.E. Wolf, T.A. Bolton, C.E. Gallimore, W.H. Martin, E.L. Nickerson, K.W. Kokjohn, T.A. (2000). Influence of infected cell growth state on bacteriophage reactivation levels. Applied and Environmental Microbiology, 66 (12), pp. 5206-5212. Kahn, M.A. Satoh, H. Katayama, H. Kurisu, F. and Mino, T. (2002). Bacteriophages isolated from activated sludge processes and their polivalency. Water Research, 36, pp. 3364-3370. Kai, M. (1985). Bacteroides bacteriophages isolated from human feces. Microbiology and immunology, 29 (9), pp. 895-899. Kannappan, V. Fujioka, R. Ebdon, J. and Taylor, H. (2008). The successful recovery of phages from sewage in tropical Hawaii using a newly isolated Bacteroides strain, Abstracts of the General Meeting of the American Society for Microbiology, 108, pp. 570. Kapadia, C.R. Bhat, P. Baker, S.J. and Mathan, V.I. (1984). A commonsource epidemic of mixed diarrhea with secondary transmission. American Journal of Epidemiology, 120, pp. 743-749. Karanis, P. Maier, W.A. Seitz, H.M. and Schoenen, D. (1992). UV sensitivity of protozoan parasites, Aqua, 41 (2), pp. 95-100. Karim, M.R. Manshadi, F.D. Karpiscak, M.M. and Gerba, C.P. (2004). The persistence and removal of enteric pathogens in constructed wetlands. Water Research, 38, pp. 1831-1837. Kator, H. and Rhodes, M. (1992). Evaluation of Bacteroides fragilis bacteriophage, a candidate human-specific indicator of fecal contamination for shellfish-growing waters. Virginia: Virginia Institute of Marine Science, College of William and Mary, Gloucester Point. Kellenberger, E. (1995). History of phage research as viewed by a European. FEMS Microbiology Reviews, 17, pp. 7-24. Keller, R. and Traub, N. (1974). The characterization of Bacteroides fragilis bacteriophage recovered from animal sera: observations on the nature of bacteroides phage carrier cultures. Journal of General Virology, 24, pp. 179-189.

209
Kellogg, C.A. and Paul, J.H. (2002). Degree of ultraviolet radiation damage and repair capabilities are related to G+C content in marine vibriophages. Aquatic microbial ecology, 27 (1), pp. 13-20. King, B.J. and Monis, P.T. (2007). Critical processes affecting Cryptosporidium oocyst survival in the environment. Parasitology, 134, pp. 309-323. King, B.J. Hoefel, D. Daminato, D.P. Fanok, S and Monis, P.T. (2008). Solar UV reduces Cryptosporidium parvum oocyst infectivity in environmental waters. Journal of Applied Microbiology, 104, pp. 1311-1323. Knudson, G.B. (1986). Photoreactivation of ultraviolet-irradiated, plasmid bearing, and plasmid-free strains of Bacillus anthracis. Applied and Environmental Microbiology, 52 (3), pp. 444-449. Kokjohn, T.A. Sayler, G.S. and Miller, R.V. (1991). Attachment and replication of Pseudomonas aeruginosa bacteriophages under conditions simulating aquatic environments. Journal of General Microbiology, 137, pp. 661-666. Kory, M.M. and Booth, J.M. (1986). Characteristics of Bacteroides fragilis bacteriophages and their DNAs, Current microbiology, 14 (4), pp. 199-203. Kott, Y. (1966). Estimation of low numbers of Escherichia coli bacteriophage by use of the most probable number method, Applied Microbiology, 14 (2), pp. 141-144. Krizek, D.T. Mirecki, R.M. and Britz, S.J. (1997). Inhibitory effects of ambient levels of solar UV-A and UV-B radiation on growth of cucumber. Plant Physiology, 100, pp. 886-893. Kropinski, A.M. and Clokie, M.R.J. (2009). Introduction. In; Clokie, M.R.J. and Kropinski, A.M. (eds.). Bacteriophages. Methods and protocols, volume 1: isolation, characterisation and interactions. New York: Humana Press. Kukkula, M. Arstila, P. Klossner, M.L. Manula, L. Bonsorff, C.H. and Jaatinen, P. (1997). Waterborne outbreak of viral gastroenteritis. Scandinavian Journal of Infectious Diseases, 29, pp. 415-418. Kuluncsics, Z. Perdiz, D. Brulay, E. Muel, B. and Sage, E. (1999). Wavelength dependence of ultraviolet-induced DNA damage distribution: involvement of direct or indirect mechanisms and possible artefacts. Journal of Photochemistry and Photobiology B: Biology, 49 (1), pp. 71-80. Kumar, A. Tyagi, M.B. Singh, N. Tyagi, R. Jha, P.N. Sinha, R.P. and Häder, D-P. (2003). Role of white light in reversing UV-B-mediated effects in the N2-fixing cyanobacterium Anabaena BT2, Journal of Photochemistry and Photobiology B: Biology, 71, pp. 35-42. Kuo, J. Chen, C-L. and Nellor, M. (2003). Standardized collimated beam testing protocol for water/wastewater ultraviolet disinfection. Journal of Environmental Engineering, 129 (8), pp. 774-779.

210
Kutter, E. and Sulakvelidze, A. (eds.) (2005). Bacteriophages: biology and applications. CRC Press. Kwan, T. Liu, J. DuBow, M. Gros, P. and Pelletier, J. (2005). The complete genomes and proteomes of 27 Staphylococcus aureus bacteriophages. Proceedings of the National Academy of Sciences, 102 (14), pp. 5174-5179. Lasobras, J. Muniesa, M. Frías, J. Lucena, F. and Jofre, J. (1997). Relationship between the morphology of bacteriophages and their persistence in the environment. Water Science and Technology, 35 (11-12), pp. 129-132. Lazarova, V. Janex, M.L. Fiksdal, L. Oberg, C. Barcina, I. and Pommepuy, M. (1998). Advanced wastewater disinfection technologies: short and long term efficiency. Water Science and Technology, 38 (12), pp. 109-117. Lazarova, V. and Savoye, P. (2004). Technical and sanitary aspect of wastewater disinfection by ultraviolet irradiation for landscape irrigation, Water Science and Technology, 50 (2), pp. 203-209. Leclerc, H. Edberg, S. Pierzo, V. and Delattre, J.M. (2000). Bacteriophages as indicators of enteric viruses and public health risk in groundwaters. Journal of Applied Microbiology, 88, pp. 5-21. Liltved, H. and Landfald, B. (1996). Influence of liquid holding recovery and photoreactivation on survival of ultraviolet-irradiated fish pathogenic bacteria. Water Research, 30 (5), pp. 1109-1114. Linden, K.G. Batch, L. and Schulz, C. (2002a). UV disinfection of filtered water supplies: water quality impacts on MS2 dose-response curves. Proceedings of the American Water Works Association Annual Conference. Denver: American Water Works Association. Linden, K.G. Shin, G-A, Faubert, G. Cairns, W. and Sobsey, M.D. (2002b). UV disinfection of Giardia lamblia cysts in water, Environmental Science and Technology, 36, pp. 2519-2522. Linden, K.G. Thurston, J. Schaefer, R. and Malley, J.P. (2007). Enhanced UV inactivation of adenoviruses under polychromatic UV Lamps, Applied and Environmental Microbiology, 73 (23), pp. 7571-7574. Love, D.C and Sobsey, M.D. (2007). Simple and rapid F+ coliphage culture, latex agglutination, and typing assay to detect and source track fecal contamination. Applied and environmental microbiology, 73 (13), pp. 4110-4118. Lucena, F. Lasobras, J. McIntosh, D. Forcadell, M. and Jofre, J. (1994). Effect of distance from the polluting focus on relative concentrations of Bacteroides fragilis phages and coliphages in mussels. Applied and Environmental Microbiology, 60 (7), pp. 2272-2277.

211
Lucena, F. Lasobras, J. Munoz, R. Araujo, R.M. and Jofre, J. (1995). Bacteriophage persistence in the sea environment. Water Science and Technology, 31, pp. 195-198. Lucena, F. Araujo, R. and Jofre, J. (1996). Usefulness of using bacteriophages infecting Bacteroides fragilis as index microorganisms of remote faecal pollution. Water Research, 30 (11), pp. 2812-2816. Lucena, F. Méndez, X. Morón, A. Calderón, E. Campos, C. Guerrero, A. Cárdenas, M. Gantzer, C. Schwartzbrod, L. Skraber, S. and Jofre, J. (2003). Occurrence and densities of bacteriophages proposed as indicators and bacterial indicators in river waters from Europe and South America. Journal of Applied Microbiology, 94 (5), pp. 808-815. Lucena, F. Durán, A.E. Morón, A. Calderón, E. Campos, C. Gantzer, C. Skraber, S. and Jofre, J. (2004). Reduction of bacterial indicators and bacteriophages infecting faecal bacteria in primary and secondary wastewater treatments. Journal of Applied Microbiology, 97, pp. 1069-1076. Luria, S.E. and Anderson, T.F. (1942). The identification and characterization of bacteriophages with the electron microscope. Proceedings of the National Academy of Sciences, 27, pp. 127-130. Lwoff, A. (1953). Lysogeny. Bacteriological Reviews, 17 (4), pp. 269-337. Lythgoe, K.A. and Chao, L. (2003). Mechanisms of coexistence of a bacteria and a bacteriophage in a spatially homogeneous environment. Ecology Letters, 6, pp. 326-334. Lytle, C.D. and Sagripanti, J.-L. (2005). Predicted inactivation of viruses of relevance to biodefense by solar radiation. Journal of Virology, 79, pp 1-9. Maniloff, J. and Ackermann, H.-W. (1998). Taxonomy of bacterial viruses: establishment of tailed virus genera and the order Caudovirales. Archives of Virology, 143 (10), pp. 2051-2063. Malley, J. (2000). Demonstration scale UV disinfection study. Project 474. Denver: American Water Works Association Research Foundation. Malley, J.P. Ballester, N.A. Margolin, A.B. Linden, K.G. Mofidi, A. Bolton, J.R. Crozes, G. Laine, J.M. and Janex, M.L. (2004). Inactivation of pathogens with innovative UV technologies. American Water Works Association Research Foundation. Mamane-Gravetz, H. Linden, K.G. Cabaj, A. and Sommer, R. (2005). Spectral sensitivity of Bacillus subtilis spores and MS2 coliphage for validation testing of ultraviolet reactors for water disinfection. Environmental Science and Technology, 39 (20), pp. 7845-7852. Marshall, M.M. Hayes, S. Moffett, J. Sterling, C.R. and Nicholson, W.L. (2003). Comparison of UV inactivation of three Encephalitozoon species with that of spores

212
of two DNA repair-deficient Bacillus subtilis biodosimetry strains. Applied and Environmental Microbiology, 69 (1), pp. 683-685. Martin, E.L. Reinhardt, R.L. Baum, L.L. Becker, M.R. Shaffer, J.J. and Kokjohn, T.A. (2000). The effects of ultraviolet radiation on the moderate halophile Halomonas elongata and the extreme halophile Halobacterium salinarum. Canadian Journal of Microbiology, 46 (2), pp. 180-187. Masanori, K. Watanabe, S. Furuse, K. and Ozawa, A. (1985). Bacteroides bacteriophages isolated from human feces. Microbiology and Immunology, 29, pp. 895-899. Mathias, C.B. Kirschner, A.K.T. and Velimirov, B. (1995). Seasonal variations of virus abundance and viral control of the bacterial populations in a backwater system of the Danube river. Applied and Environmental Microbiology, 61 (10), pp. 3734-3740. Mawdsley, J.L. Bardgett, R.D. Merry, R.J. Pain, B.F. and Theodorou, M.K. (1995). Pathogens in livestock waste, their potential for movement through soil and environmental pollution. Applied Soil Ecology, 2, pp. 1-15. Maya, C. Beltran, N. Jimenez, B. and Bonilla, P. (2003). Evaluation of the UV disinfection process in bacteria and amphizoic amoebae inactivation. Water Science and Technology: Water Supply, 3 (4): 285-291. McBride, T.J. Preston, B.D. and Loeb, L.A. (1991). Mutagenic spectrum resulting from DNA damage by oxygen radicals. Biochemistry, 30, pp. 107-213. McGrath, S. and Van Sinderen, D (eds.) (2007). Bacteriophage: genetics and molecular biology. Norfolk, UK: Caister Academic Press. McKenzie, R.L. Aucamp, P.J. Bais, A. Björn, L.O. and Ilyas, M. (2007). Changes in biologically-active ultraviolet radiation reaching the Earth’s surface. Photochemistry and Photobiology Science, 6, pp. 218-231. McKinney, J. Williams, R.C. Boardman, G.D. Eifert, J.D. and Sumner, S.S. (2009). Dose of UV light required to inactivate Listeria monocytogenes in distilled water, fresh brine, and spent brine. Journal of Food Protection, 72 (10), pp. 2144-2150. Meays, C.L. Broersma, K. Nordin, R. and Mazumder, A. (2004). Source tracking faecal bacteria in water: a critical review of current methods. Journal of Environmental Management, 73, pp. 71-79. Medima, G. and Ashbolt, N. (2006). QMRA: its value for risk management. Microrisk report. Available at: http://www.microrisk.com/uploads/microrisk_value_of_qmra_for_risk_management.pdf Melnick, J.L. and Gerba, C.P. (1980). The ecology of Enteroviruses in natural water. CRC Critical Review in Environmental Control, 10 (1), pp. 65-93.

213
Mendez, J. Jofre, J. Lucena, F. Contreras, N. Mooijman, K. and Araujo, R. (2002). Conservation of phage reference materials and water samples containing bacteriophages of enteric bacteria. Journal of Virological Methods, 106, pp. 215-224. Meng, Q.S. and Gerba, C.P. (1996). Comparative inactivation of enteric adenovirus, poliovirus and coliphages by ultraviolet radiation. Water Research, 30, pp. 2665-2668. Metcalf and Eddy Inc. (2003). Wastewater engineering: treatment and reuse. 4th edition. McGraw Hill Higher Education. Mignotte, B. Maul, A. and Schwartzbrod, L. (1999). Comparative study of techniques used to recover viruses from residual urban sludge. Journal of Virological Methods, 78, pp. 71-80. Mocé-Llivina, L. Muniesa, M. Pimenta-Vale, H. Lucena, F. and Jofre, J. (2003). Survival of bacterial indicator species and bacteriophages after thermal treatment of sludge and sewage. Applied and Environmental Microbiology, 69 (3), pp. 1452-1456. Moe, C.L. (1997). Waterborne transmission of infectious agents. In; Hurst, C.J. Knudsen, G.R. McInerney, M.J. Stetzenbach, L.D. and Walter, M.V. (eds.) Manual of environmental microbiology. Washington DC: ASM Press. Mofidi, A.A. Meyer, E.A. Wallis, P.M. Chou, C.I. Meyer, B.P. Ramalingam, S. and Coffey, B.M. (2002). The effect of UV light on the inactivation of Giardia lamblia and Giardia muris cysts as determined by animal infectivity assay. Water Research, 36 (8), pp. 2098-2108. Morgan-Capner, P. (ed.) (1991). Current topics in clinical virology. Salisbury: Laverham Press. Morita, S. Namikoshi, A. Hirata, T. Oguma, K. Katayama, H. Ohgaki, S. Motoyama, N. and Fujiwara, M. (2002). Efficacy of UV irradiation in inactivating Cryptosporidium parvum oocysts, Applied and Environmental Microbiology, 68 (11), pp. 5387-5393. Morowitz, H.J. (1950). Absorption effects in volume irradiation dosimetry. Science¸ 111, pp. 229-230. Morris, R.D. and Levin, R. (1995). Estimating the incidence of waterborne infectious disease related to drinking water in the United States. In: Reichard, E.G. and Zapponi, G.A. (eds.) Assessing and managing health risks from drinking water contamination: approaches and applications. Wallington: IAHS Press. Mostajir, B. Demers, S. de Mora, S. Belzile, C. Chanut, J-P. Gosselin, M. Roy, S. Villegas, P.Z. Fauchot, J. and Bouchard, J. (1999). Experimental test of the effect of ultraviolet-B radiation in a planktonic community, Limnology and Oceanography, 44 (3), pp. 586-596.

214
Müller, M. Wurtz, M. Kellenberger, E. and Aebi, U. (1991). Physiological, morphological, and physicochemical characterization of a novel Escherichia coli bacteriophage, phage MM. Journal of Structural Biology, 106 (1), pp. 17-30. Muniesa, M. Lucena, F. and Jofre, J. (1999). Study of the potential relationship between the morphology of infectious somatic coliphages and their persistence in the environment, Journal of Applied Microbiology, 87, pp. 402–409. Muniesa, M. Blanch, A.R. Lucena, F. and Jofre, J. (2005). Bacteriophages may bias outcome of bacterial enrichment cultures. Applied and Environmental Microbiology, 71 (8), pp. 4269-4275. Murray, C.J.L. and Lopez, A.D. (1996). The global burden of disease. Geneva: World Health Organization. Nacescu, N. Brandis, H. and Wermer, H. (1972). Isolation of two Bacteroides fragilis phages from sewage and detection of lysogenic strains. Zentralblatt für Bakteriologie, Parasitenkunde, Infektionskrankheiten und Hygiene. Erste Abteilung Originale. Reihe A: Medizinische Mikrobiologie und Parasitolog, 219, pp. 522-529. Nazari, E.M. Ammar, D. de Bem, A.F. Latini, A. Müller, Y.M.R. and Allodi, S. (2010). Effects of environmental and artificial UV-B radiation on freshwater prawn Macrobrachium olfersi embryos. Aquatic Toxicology, 98, pp. 25-33. Negishi, K. and Hao, W. (1992). Spectrum of mutations in single-stranded DNA phage M13mp2 exposed to sunlight: predominance of G-to-C transversion. Carcinogeuesis, 13 (9), pp. 1615-1618. Ngadi, M. Smith, J.P. and Cayouette, B. (2003). Kinetics of ultraviolet light inactivation of Escherichia coli O157:H7 in liquid foods. Journal of the Science of Food and Agriculture, 83, pp. 1551-1555. Nicholson, W.L. and Law, J.F. (1999). Method for purification of bacterial endospores from soils: UV resistance of natural Sonoran desert soil populations of Bacillus spp. with reference to B. subtilis 168. Journal of Microbiological Methods, 35, pp. 13-21. Nicholson, W.L. and Galeano, B. (2003). UV Resistance of Bacillus anthracis spores revisited: validation of Bacillus subtilis spores as UV surrogates for spores of B. anthracis sterne. Applied and Environmental Microbiology, 69 (2), pp. 1327-1330. Noble, R.T. and Fuhrman, J.A. (1997). Virus decay and its causes in coastal waters. Applied and Environmental Microbiology, 63 (1), pp. 77-83. Nuttall, S.D. and Dyall-Smith, M.L. (1993). Novel bacteriophages of halophilic archaea. Virology, 197, pp. 678-684. Nwachuku, N. Gerba, C.P. Oswald, A. and Mashadi, F. D. (2005). Comparative inactivation of adenovirus serotypes by UV light disinfection, Applied and Environmental Microbiology, 71 (9), pp. 5633-5636.

215
OFWAT (2008), Water industry facts and figures. Available at http://www.ofwat.gov.uk/legacy/aptrix/ofwat/publish.nsf/AttachmentsByTitle/water_regfacts_figs.pdf/$FILE/water_regfacts_figs.pdf (accessed February 2010). Ogata, S. Miyamoto, H. and Hayashida, S. (1980). An investigation of the influence of bacteriophages on the bacterial flora and purification powers of activated sludge. Journal of General and Applied Microbiology, 26, pp. 97-108. Oguma, K. Katayama, H. Mitani, H. Morita, S. Hirata, T. and Ohgaki, S. (2001). Determination of pyrimidine dimers in Escherichia coli and Cryptosporidium parvum during UV light inactivation, photoreactivation, and dark repair. Applied and Environmental Microbiology, 67 (10), pp. 4630-4637. Oguma, K. Katayama, H. and Ohgaki, S. (2002). Photoreactivation of Escherichia coli after low- or medium-pressure UV disinfection determined by an endonuclease sensitive site assay. Applied and Environmental Microbiology, 68 (12), pp. 6029-6035. Oguma, K. Katayama, H. and Ohgaki, S. (2004). Photoreactivation of Legionella pneumophila after inactivation by low- or medium-pressure ultraviolet lamp. Water Research, 38 (11), pp. 2757-2763. Oguma, K. Katayama, H. and Ohgaki, S. (2005). Spectral impact of inactivating light on photoreactivation of Escherichia coli. Journal of Environmental Engineering and Science, 4, pp. S1-S6. Oh, D-Y. Gaedicke, G. and Schreir, J.M. (2003). Viral agents of acute gastroenteritis in German children: prevalence and molecular diversity. Journal of Medical Virology, 71, pp. 82-93. ÖNORM (2001). Plants for disinfection of water using ultraviolet radiation – requirements and testing: low pressure mercury lamp plants. Austrian Standard 5873-1. ÖNORM (2003). Plants for disinfection of water using ultraviolet radiation – requirements and testing: medium pressure mercury lamp plants. Austrian Standard 5873-2. Oppenheimer, J.A. Hoagland, J.E. Laine, J.-M. Jacangelo, J.G. and Bhamrah, A. (1993). Microbial inactivation and characterization of toxicity and by-products occurring in reclaimed wastewater disinfected with UV radiation. Conference on planning, design and operation of effluent disinfection systems. Virginia: Water Environment Federation. Otaki, M. Okuda, A. Tajima, K. Iwasaki, T. Kinoshita, S. and Ohgaki, S. (2003). Inactivation differences of microorganisms by low pressure UV and pulsed xenon lamps. Water Science and Technology, 47 (3), pp. 185-190.

216
Palmateer, G.A. Dutka, B.J. Janzen, E.M. Meissner, S.M. and Sakellaris,M.G. (1991). Coliphage and bacteriophage as indicators of recreational water quality. Water Research, 25, pp. 355-357. Parashar, U.D. Holman, R.C. Clarke, M.J. Bresee, J.S. and Glass, R.I. (1998). Hospitalizations associated with rotavirus diarrhoea in the United States, 1993 through 1995: surveillance based on the new ICD-9-CM rotavirus-specific diagnostic code. Journal of Infectious Disease, 177, pp. 13-17. Paul, J.H. Rose, J.B. Jiang, S.C. London, P. Xhou, X. and Kellogg, C. (1997). Coliphage and indigenous phage in Mamala Bay, Oahu, Hawaii. Applied and Environmental Microbiology, 63 (1), pp. 133-138. Paul, J.H. and Kellogg, C.A. (2000). Ecology of bacteriophages in nature. In: Hurst, C.J. (ed.) Viral Ecology. San Diego: Academic Press. Payan, A. Ebdon, J. Taylor, H. Gantzer, C. Ottoson, J. Papageorgiou, G.T. Blanch, A.R. Lucena, F. Jofre, J. and Muniesa, M. (2005). Method for isolation of Bacteroides bacteriophage host strains suitable for tracking sources of fecal pollution in water. Applied and Environmental Microbiology, 71 (9), pp. 5659-5662. Pecson, B.M. Martin, L.V. and Kohn, T. (2009). Quantitative PCR for determining the infectivity of bacteriophage MS2 upon inactivation by heat, UV-B radiation, and singlet oxygen: advantages and limitations of an enzymatic treatment to reduce false-positive results. Applied and Environmental Microbiology, 75 (17), pp. 5544-5554. Pelczar, M.J. Chan, E.C.S. and Krieg, N.R. (1988). Microbiology. 5th edition. Singapore: McGraw-Hill Book Co. Percival, S.L. Chalmers, R.M. Embrey, M. Hunter, P.R. Sellwood, J. and Wyn-Jones, P. (2004). Microbiology of Waterborne Diseases. Elsevier Academic Press. Pereira, V.J. Linden, K.G. and Weinberg, H.S. (2007). Evaluation of UV irradiation for photolytic and oxidative degradation of pharmaceutical compounds in water. Water Research, 41, pp. 4413-4423. Pfannkueh, E. and Kauschc, G.A. (1940). Isolierung und iibermikroskopische Abbildung nines Bakteriophagen. Natuzwissenschaften, 28. Piette, J, Merville-Louis, M.P. and Decuyper, J (1986). Damages induced in nucleic acids by photosensitization. Photochemistry and Photobiology, 44, pp. 793-802. Pourcher, A. Françoise, P. Virginie, F. Agnieszka, G. Vasilica, S. and Gérard, M. (2007) Survival of faecal indicators and enteroviruses in soil after land-spreading of municipal sewage sludge, Applied Soil Ecology, 35, pp. 473 – 479. Prévot, A.R. Vieu, J.F. Thouvenot, H. and Brault, G. (1970). Étude de Ristella pseudoinsolita et de ses bacterériophages, Essai de lysotypic. Bulletin de l’Académie Nationale de Medecine, 154, pp. 681-690.

217
Puig, A. Jofre, J. and Araujo, R. (1997). Bacteriophages infecting various Bacteroides fragilis strains differ in their capacity to distinguish human from animal faecal pollution. Water Science and Technology, 35 (11-12), pp. 359-362. Puig, M. and Gironés, R. (1999). Genomic structure of phage B40-8 of Bacteroides fragilis. Microbiology, 145, pp. 1661-1670. Puig, A. Queralt, N. Jofre, J. and Araujo, R. (1999). Diversity of Bacteroides fragilis strains in their capacity to recover phages from human and animal wastes and from fecally polluted wastewater. Applied and Environmental Microbiology, 65 (4), pp. 1172-1176. Qualls, R.G. and Johnson, J.D. (1983). Bioassay and dose measurement in UV disinfection, Applied and Environmental Microbiology, 45 (3), pp. 872-877. Queralt, N. Jofre, J. Araujo, R. and Muniesa, M. (2003). Homogeneity of the morphological groups of bacteriophages infecting Bacteroides fragilis strain HSP40 and strain RYC2056. Current Microbiology, 46, pp. 163-168. Quignon, F. Sardin, M. Kiene, L. and Schwartzbrod, L. (1997). Poliovirus-1 inactivation and interaction with biofilm: a pilot-scale study. Applied and Environmental Microbiology, 63 (3), pp. 978-982. Raettig, H. (1958). Bakteriophagie, 1917 bis 1956. Zugleich en vorschlag zur dokumentation wissenschaftlicher literatur. Stuttgart: G. Fischer. Raettig, H. (1967). Bakteriophagie 1957-1965. Stuttgart: G. Fischer. Rauth, A.M. (1965). The physical state of viral nucleic acid and the sensitivity of viruses to ultraviolet light. Biophysical Journal, 5, pp. 257-273. Ravanat, J-L. Douki, T. and Cadet, J. (2001). Direct and indirect effects of UV radiation on DNA and its components. Journal of Photochemistry and Photobiology B: Biology, 63 (1-3), pp. 88-102. Restifo, L.L. Vogelbacker, H.H. Madara, T. Ling, S-K. and Kozinsk, A.W. (1983). Effects of UV irradiation on the fate of 5-bromodeoxyuridine-substituted bacteriophage T4 DNA. Journal of Virology, 47(1), pp. 151-170. Rice, E.W. and Hoff, J.C. (1981). Inactivation of Giardia lamblia cysts by ultraviolet irradiation. Applied and Environmental Microbiology, 42 (3), pp. 546-547. Riou, P. Le Saux, J.C. Dumas, F. Caprais, M.P. Le Guyader, S.F. and Pommepuy, M. (2007). Microbial impact of small tributaries on water and shellfish quality in shallow coastal areas. Water Research, 41, pp. 2774-2786. Rochette, P.J. Therrien, J.P. Drouin, R. Perdiz, D. Bastien, N. Drobetsky, E.A. and Sage, E. (2003). UVA-induced cyclobutane pyrimidine dimers form predominantly at thymine–thymine dipyrimidines and correlate with the mutation spectrum in rodent cells. Nucleic Acids Research, 31, pp. 2786-2794.

218
Roessler, P.F. and Severin, B.F. (1996). Ultraviolet light disinfection of water and wastewater. In: Hurst, C.J. (ed.) Modeling disease transmission and its prevention by disinfection. Cambridge, UK: Cambridge University Press. Ruimy, R. Podglajen, I. Breuil, J. Christen, R. and Collatz, E. (1996). A recent fixation of cfiA genes in a monophyletic cluster of Bacteroides fragilis is correlated with the presence of multiple insertion elements. Journal of Bacteriology, 178 (7), pp. 1914-1918. Rünger, T.M. and Kappes, U.P. (2008). Mechanisms of mutation formation with long-wave ultraviolet light (UVA), Photodermatology, Photoimmunology & Photomedicine, 24, pp. 2-10. Ruska, H. (1941). Llber ein neons bei der Baktcriophagen Lyse aufiretendes Formelement. Naturwissenschafien, 29, pp. 367-368. Sabiston, C.B. and Cohl, M.E. (1969). Bacteriophage virulent for species of the genus Bacteroides. Journal of Dental Research, 48 (4), pp. 599. Santo Domingo, J.W. Bambic, D.G. Edge, T.A. and Wuertz, S. (2007). Quo vadis source tracking? Towards a strategic framework for environmental monitoring of fecal pollution, Water Research, 41, pp. 3539-3552. Savichtcheva, O. and Okabe, S. (2006). Alternative indicators of fecal pollution: Relations with pathogens and conventional indicators, current methodologies for direct pathogen monitoring and future application perspectives. Water Research, 40, pp. 2463-2476. Sayers, J.R. (2006) Bacteriophage T-5. In: Calendar, R. (ed.) (2006). The Bacteriophages. 2nd edition, Oxford University Press. Sayers, A. Tilling, K. Boucher, B.J. Noonan, K. and Tobias, J.H. (2009). Predicting ambient ultraviolet from routine meteorological data; its potential use as an instrumental variable for vitamin D status in pregnancy in a longitudinal birth cohort in the UK. International Journal of Epidemiology, 38 (6), pp. 1681-1688. Scarpino, P.V. (1978). Bacteriophage indicators. In: Berg, G. (ed.) Indicators of viruses in water and food. Michigan: Ann Arbor Science Publishers. Schaub, S.A. and Sagik, B.P. (1975). Association of enteroviruses with natural and artificially introduced colloidal solids in water and infectivity of solids-associated virions, Applied Microbiology, 30 (2), pp. 212-222. Schiffenbauer, M. and Stotzky, G. (1982). Adsorption of coliphages T1 and T7 to clay minerals. Applied and Environmental Microbiology, 43(3), 590-596. Schumann, J.P. Jones, D.T. and Woods, D.R. (1984). Effect of UV irradiation on macromolecular synthesis and colony formation in Bacteroides fragilis. Journal of General Microbiology, 130, pp. 771-777.
219
Scoging, A.C. (1991). Illness associated with seafood. Communicable Disease Report, volume 1, review 11. London: PHLS Communicable Disease Surveillance Centre. Available at: http://www.hpa.org.uk/cdr/archives/CDRreview/1991/cdrr1191.pdf Scott, T.M. Rose, J.B. Jenkins, T.M. Farrah, S.R. and Lukasik, J. (2002). Microbial source tracking: current methodology and future directions. Applied and Environmental Microbiology, 68 (12), pp. 5796-5803. Scott, H.E. Liss, S.N. Farnood, R.R. and Allen, D.G. (2005). Ultraviolet disinfection of sequencing batch reactor effluent: a study of physiochemical properties of microbial floc and disinfection performance. Journal of Environmental Engineering and Science, 4, pp. S65-S74. Seeley, N.D. and Primrose, S.B. (1980). The effect of temperature on the ecology of aquatic bacteriophages. Journal of General Virology, 46, pp. 87-95. Seeley, N.D. and Primrose, S.B. (1982). The isolation of bacteriophages from the environment. Journal of Applied Bacteriology, 53, pp 1-17. Sellwood, J. and Dadswell, J.V. (1991). Human viruses and water. In: Morgan-Capner, P. (ed.). Current topics in clinical virology. Salisbury: Laverham Press. Setlow, P. (1992) I will survive: protecting and repairing spore DNA. Journal of Bacteriology, 174, 2737-2741. Shaffer, J.J. Jacobson, L.M. Schrader, J.O. Lee, K.W. Martin, E.L. and Kokjohn, T.A. (1999). Characterization of Pseudomonas aeruginosa bacteriophage UNL-1, a bacterial virus with a novel UV-A-inducible DNA damage reactivation phenotype. Applied and Environmental Microbiology, 65 (6), pp. 2606-2613. Shang, C. Cheung, L-M. and Liu, W. (2007). MS2 coliphage inactivation with UV irradiation and free chlorine/monochloramine. Environmental Engineering Science, 24 (9), pp. 1321-1332. Shin, G-A. Linden, K.G. Arrowood, M.J. and Sobsey, M.D. (2001). Low-pressure UV inactivation and DNA repair potential of Cryptosporidium parvum oocysts. Applied and Environmental Microbiology, 67 (7), pp. 3029-3032. Shin, G-A. Linden, K.G. and Sobsey, M.D. (2005). Low pressure ultraviolet inactivation of pathogenic enteric viruses and bacteriophages, Journal of Environmental Engineering and Science, 4, pp. S7-S11. Shin, G-A. Lee, J-K. and Linden, K.G. (2009). Enhanced effectiveness of medium-pressure ultraviolet lamps on human adenovirus 2 and its possible mechanism. Water Science and Technology, 60 (4), pp. 851-857. Short, C.S. (1988). The Bramham incident, 1980: an outbreak of waterbourne infection. Water and Environment Journal, 2 (4), pp. 383-390.

220
Sinton, L.W. Finlay, R.K. and Hannah, D.J. (1998). Distinguishing human from animal contamination in water: a review. New Zealand Journal of Marine and Freshwater Research, 32, pp. 323-348. Sinton, L.W. Hall, C.H. Lynch, P.A. and Davies-Colley, R.J. (2002). Sunlight inactivation of fecal indicator bacteria and bacteriophages from waste stabilization pond effluent in fresh and saline waters. Applied and Environmental Microbiology, 68 (3), pp. 1122-1131. Sinton, L. Hall, C. and Braithwaite, R. (2007). Sunlight inactivation of Campylobacter jejuni and Salmonella enterica, compared to Escherichia coli, in seawater and river water. Journal of Water and Health, 5 (3), pp. 357-365. Sirikanchana, K. Shisler, J.L. and Mariñas, B.J. (2008). Effect of exposure to UV-C irradiation and monochloramine on adenovirus serotype 2 early protein expression and DNA replication. Applied and Environmental Microbiology, 74 (12), pp. 3774-3782. Skraber, S. Gantzer, C. Maul, L. and Schwartzbrod, L. (2002). Fates of bacteriophages and bacterial indicators in the Moselle river (France). Water Research, 36, pp. 3629-3637. Skraber, S. Gassilloud, B. and Gantzer, C. (2004). Comparison of coliforms and coliphages as tools for assessment of viral contamination in river water. Applied and Environmental Microbiology, 70 (6), pp. 3644-3649. Skraber, S. Schijven, J. Italiaander, R. and de Roda Husman, A.M. (2009). Accumulation of enteric bacteriophage in fresh water sediments. Journal of Water and Health, 7 (3), pp. 372-379. Sirikanchana, K. Shisler, J.L. and Mariñas, B.J. (2008). Effect of exposure to UV-C irradiation and monochloramine on adenovirus serotype 2 early protein expression and DNA replication. Applied and Environmental Microbiology, 74 (12), pp. 3774-3782. Slomka, M.J. and Appleton, H. (1998). Feline calicivirus as a model system for heat inactivation studies of small round structured viruses in shellfish. Epidemiology and Infection, 121, pp. 401-407. Smith, R.C. and Baker, K.S. (1979). Penetration of UV-B and biologically effective dose-rates in natural waters. Photochemistry and Photobiology, 29, pp. 311-323. Smith, L.A. and Drake, J.W. (1998). Aspects of the ultraviolet photobiology of some T-even bacteriophages. Genetics, 148, pp. 1611-1618. Snicer, G.A. Malley, J.P. Margolin, A.B. and Hogan, S.P. (1998) UV Inactivation of Viruses in Natural Waters. Denver: American Water Works Association Research Foundation.
221
Snocvink, E.P. (ed.) (1971). Proceedings of the.13th Water Quality Conference: virus and water quality, occurrence and control. University of Illinois: Urbana. Sobsey, M. (1989). Inactivation of health-related microorganisms in water by disinfection processes. Water science and technology, 21 (3), pp. 179-195. Sobsey, M.D. Schwab, K.J. and Handzel, T.R. (1990). A simple membrane filter method to concentrate and enumerate male-specific RNA coliphages. Journal of the American Water Works Association, 82, pp. 52-59. Sobsey, M.D. Battigelli, D.A. Shin, G.-A. and Newland, S. (1998). RT-PCR amplification detects inactivated viruses in water and wastewater, Water Science and Technology, 38 (12), pp. 91-94. Solo-Gabriele, H.M. Wolfert, M.A. Desmarais, T.R. and Palmer, C.J. (2000). Sources of Escherichia coli in a coastal subtropical environment, Applied and Environmental Microbiology, 66 (1), pp. 230–237. Sommer, R. Weber, G. Cabaj, A. Wekerle, J. Keck, G. and Schauberger, G. (1989). UV inactivation of microorganisms in water. Zentralblatt Für Hygiene, 189, pp. 214-224. Sommer, R. Cabaj, A. Schoenen, D. Gebel, J. Kolch, A. Havelaar, A.H. and Schets, F.M. (1995). Comparison of three laboratory devices for UV-inactivation of microorganisms. Water Science and Technology, 31 (5-6), pp. 147-156. Sommer, R. Haider, T. Cabaj, A. Pribil, W. and Lhotsky, M. (1998). Time dose reciprocity in UV disinfection of water. Water Science and Technology, 38 (12), pp. 145-150. Sommer, R. Lhotsky, M. Haider, T. and Cabaj, A. (2000). UV inactivation, liquid-holding recovery, and photoreactivation of E. coli O157 and other pathogenic E. coli strains in water. Journal of Food Protection, 63 (8): 1015-1020. Sommer, R. Pribil, W. Appelt, S. Gehringer, P. Eschweiler, H. Leth, H. Cabaj, A. and Haider, T. (2001). Inactivation of bacteriophages in water by means of non-ionizing (UV-253.7 nm) and ionizing (gamma) radiation: a comparative approach. Water Research, 35 (13), pp. 3109-3116. Stanwell-Smith, R. (1994). Recent trends in the epidemiology of waterborne disease. In: Golding, A.M.B. (ed.). Water & Public Health. London: Smith-Gordon. Stary, A. and Sarasin, A. (2000). Ultraviolet A- and singlet oxygen-induced mutation spectra. Methods in Enzymology, 319, pp. 153-165. Stewart, J.R. Ellender, R.D. Gooch, J.A. Jiang, S. Myoda, S.P. and Weisberg, S.B. (2003). Recommendations for microbial source tracking: lessons from a methods comparison study. Journal of Water and Health, 1 (4), pp. 225-231.
222
Stoeckel, D.M. and Harwood, V.J. (2007). Performance, design, and analysis in microbial source tracking studies, Applied and Environmental Microbiology, 73 (8), pp. 2405-2415. Summers, W.C. (2005). Bacteriophage research: early history. In: Kutter, E. and Sulakvelidze, A. (eds.) Bacteriophages: biology and applications. CRC Press. Sun, Z.P. Levi, Y. Kiene, L. Dumoutier, N. and Lucena, F. (1997). Quantification of bacteriophages of Bacteroides fragilis in environmental water samples of Seine River. Water, Air and Soil Pollution, 96, pp. 175-183. Surabhi, G-K. Raja Reddy, K.R. and Singh, S.K. (2009). Photosynthesis, fluorescence, shoot biomass and seed weight responses of three cowpea (Vigna unguiculata (L.)Walp.) cultivars with contrasting sensitivity to UV-B radiation. Experimental and Experimental Botany, 66, pp. 160-171. Suttle, C.A. and Chen, F. (1992). Mechanisms and rates of decay of marine viruses in seawater, Applied and Environmental Microbiology, 58 (11), pp. 3721-3729. Suttle, C.A. and Chan, A.M. (1994). Dynamics and distribution of cyanophages and their effect on marine Synechococcus spp.. Applied and Environmental Microbiology, 60 (9), pp. 3167-3174. Tartera, C. and Jofre, J. (1987). Bacteriophages active against Bacteroides fragilis in sewage-polluted waters, Applied and Environmental Microbiology, 53 (7), pp. 1632-1637. Tartera, C. Bosch, A. and Jofre, J. (1988a). The inactivation of bacteriophages infecting Bacteroides fragilis by chlorine treatment and UV-irradiation, FEMS microbiology letters, 56 (3), pp. 313-316. Tartera, C. Jofre, J. and Lucena, F. (1988b). Relationship between numbers of enteroviruses and bacteriophages infecting Bacteroides-fragilis in different environmental-samples, Environmental Technology Letters, 9 (5), pp. 407-410. Tartera, C. Lucena, F. and Jofre, J. (1989). Human origin of Bacteroides fragilis bacteriophages present in the environment. Applied and Environmental Microbiology, 55 (10), pp. 2696-2701. Tartera, C. Araujo, R. Michel, T. and Jofre, J. (1992). Culture and decontaminating methods affecting enumeration of phages infecting Bacteroides fragilis in sewage. Applied and Environmental Microbiology, 58 (8), pp. 2670-2673. Templeton, M.R. Andrews, R.C. and Hofmann, R. (2005). Inactivation of particle-associated viral surrogates by ultraviolet light. Water Research, 39, pp. 3487-3500. Thompson, S.S. Jackson, J.L. Suva-Castillo, M. Yanko, W.A. Jack, Z.E. Kuo, J. Chen, C.L. Williams, F.P. and Schnurr, D.P. (2003). Detection of infectious human adenoviruses in tertiary-treated and ultraviolet-disinfected wastewater. Water Environment Research, 75 (2), pp. 163-170.

223
Thurston-Enriquez, J.A. Haas, C.N. Jacangelo, J. Riley, K. and Gerba, C.P. (2003). Inactivation of feline calicivirus and adenovirus type 40 by UV radiation. Applied and Environmental Microbiology, 69 (1), pp. 577-582. Toranzos, G.A. McFeters, G.A. and Borrego, J.J. (2002). Detection of microorganisms in environmental freshwaters and drinking waters. In: Hurst, C.J. Crawford, R.L. Knudsen, G.R. McInerney, M.J. and Stetzenbach, L.D. (eds.) Manual of environmental microbiology. 2nd edition. Washington DC: ASM Press. Tosa, K. and Hirata, T. (1999). Photoreactivation of enterohemorrhagic Escherichia coli following UV disinfection. Water Research, 33 (2), pp. 361-366. Tree, J.A. Adams, M.R. and Lees, D.N. (1997). Virus inactivation during disinfection of wastewater by chlorination and UV irradiation and the efficacy of F+ bacteriophage as a viral indicator. Water Science and Technology, 35 (11), pp. 227-232. Tree, J.A. Adams, M.R. and Lees, D.N. (2005). Disinfection of feline calicivirus (a surrogate for Norovirus) in wastewaters. Journal of Applied Microbiology, 98, pp. 155-162. Twort, F.W. (1915). An investigation on the nature of ultra-microscopic viruses. The Lancet, 86 (4814), pp. 1241-1243. USEPA (2002) National Primary Drinking Water Regulations: Long Term 1 Enhanced Surface Water Treatment Rule, Federal Register, 67 (9) available at: http://www.epa.gov/fedrgstr/EPA-WATER/2002/January/Day-14/w409.htm USEPA (2006). Ultraviolet Disinfection Guidance Manual for the Long Term 2 Enhanced Surface Water Treatment Rule (LT2ESWTR). EPA 815-R-06-007. Washington, DC: Office of Water. UVP (2010). Spectral output charts. Available at: http://uvp.com/spectralcharts.html Van Cuyk, S. and Siegrist, R.L. (2007). Virus removal within a soil infiltration zone as affected by effluent composition, application rate, and soil type. Water Research, 41, pp. 699-709. Van der Horst, G.T.J. Meira, L. Gorgels, T.G.M.F. de Wit, J. Velasco-Miguel, S. Richardson, J.A. Kamp, Y. Vreeswijk, M.P.G. Smit, B. Bootsma, D. Hoeijmakers, J.H.J. and Friedberg, E.C. (2002). UVB radiation-induced cancer predisposition in Cockayne syndrome group A (Csa) mutant mice. DNA Repair 1, 1 (2), pp. 143-157. Van Regenmortel, M.H.V. (2000). Introduction to the species concept in virus taxonomy. In: Van Regenmortel, M.H.V. Fauquet, C.M. Bishop, D.H.L. Carstens, E.B. Estes, M.K. Lemon, S.M. Maniloff, J. Mayo, M.A. McGeoch, D.J. Pringle, C.R. and Wickner, R.B. (eds.). Virus taxonomy - seventh report of the international committee on taxonomy of viruses. San Diego: Academic Press.

224
Van Regenmortel, M.H.V. Fauquet, C.M. Bishop, D.H.L. Carstens, E.B. Estes, M.K. Lemon, S.M. Maniloff, J. Mayo, M.A. McGeoch, D.J. Pringle, C.R. and Wickner, R.B. (eds.) (2000). Virus taxonomy: classification and nomenclature of viruses. seventh report of the international committee on taxonomy of viruses. San Diego: Academic Press. Vijayavel, K. Fujioka, R. Ebdon, J. and Taylor, H. (2010). Isolation and characterization of Bacteroides host strain HB-73 used to detect sewage specific phages in Hawaii. Water Research, 44 (12), pp. 3714-3724. Villar, L.M. De Paula,V.S. Diniz-Mendes, L. Guimaraes, F.R. Ferreira, F.F.M. Shubo, T.C. Miagostovich, M.P. Lampe, E. Gaspar, A.M.C. Molecular detection of hepatitis A virus in urban sewage in Rio de Janeiro, Brazil. (2007). Letters in Applied Microbiology, 45 (2), pp. 168-173. Wagner, P.L. Livny, J. Neely, M.N. Acheson, D.W. Friedman, D.I. and Waldor, M.K. (2002). Bacteriophage control of Shiga toxin 1 production and release by Escherichia coli. Molecular Microbiology, 44, pp. 957-970. Wallis, J.L. and Taylor, H.D. (2003). Phenotypic population characteristics of the enterococci in wastewater and animal faeces: implications for the new European directive on the quality of bathing waters. Water science and technology, 47 (3). pp. 27-32. Wang, B. Liu, P. Tang, Y. Pan, H. Xu, X. and Tang, R. (2010a). Guarding embryo development of zebrafish by shell engineering: a strategy to shield life from ozone depletion, PLoS One, 5 (4), e9963. Wang, D. Oppenländer, T. El-Din, M.G. and Bolton, J.R. (2010b). Comparison of the disinfection effects of vacuum-UV (VUV) and UV light on spores in aqueous suspensions at 172, 222 and 254nm. Photochemistry and Photobiology, 86 (1), pp. 176-181. Water UK website (2007). Available at: http://www.watercare.co.uk/ (accessed June 2010). Watson, H.E. (1908). A note on variation of the rate of disinfection with change in the concentration of disinfectant, Journal of Hygiene, 8, pp. 536-542. Watson, J.D. and Crick, F.H.C. (1953). Molecular structure of nucleic acids: a structure for deoxyribose nucleic acid. Nature, 4356, pp. 737-738. Webb, R.B. and Brown, M.S. (1976). Sensitivity of strains of Escherichia coli differing in repair capability to far UV, near UV and visible radiations. Photochemistry and Photobiology, 24, pp. 425-432. Webb, R.B. (1997). Lethal and mutagenic effects of near-ultraviolet radiation. Photochemistry and Photobiology Review, 2, pp. 169-261.

225
Weinbauer, M.G. Agis, M. Bonilla-Findji, O. Malits, A. and Winter, C. (2007). Bacteriophage in the Environment. In: McGrath, S. and Van Sinderen, D (eds.) Bacteriophage: genetics and molecular biology. Norfolk, UK: Caister Academic Press. WHO (2003a). Right to Water. Health and Human Rights Publication Series (no 3). Geneva: WHO. WHO (2003b). Guidelines for safe recreational water environments. Volume 1, Coastal and fresh waters. Geneva: WHO. Available at: http://www.who.int/water_sanitation_health/bathing/en/ WHO (2004) Water, Sanitation and Hygiene Links to Health. Facts and Figures. Geneva: WHO. Available at: http://www.who.int/water_sanitation_health/en/factsfigures04.pdf Wiedenmann, A. Fischer, B. Straub, U. Wang, C-H. Flehmig, B. and Schoenen, D. (1993). Disinfection of Hepatitis A virus and MS2 coliphage in water by ultraviolet irradiation: comparison of UV-susceptability. Water Science and Technology, 27 (3-4), pp. 335-338. Wilhelm, S.W. Jeffery, W.H. Suttle, C.A. and Mitchell, D.L. (2002). Estimation of biologically damaging UV levels in marine surface waters with DNA and viral dosimeters. Photochemistry and Photobiology, 76 (3), pp. 268-273. Williamson, C.E. Stemberger, R.S. Morris, D.P. Frost, T.M. and Paulsen, S.G. (1996). Ultraviolet radiation in North American lakes: attenuation estimates from DOC measurements and implications for plankton communities. Limnology and Oceanography, 41 (5), pp. 1024-1034. Wilson, B.R. Roessler, P.F. Van Dellen, E. Abbaszadegan, M and Gerba, C.P. (1992). Coliphage MS2 as a UV water disinfection efficacy test surrogate for bacterial and viral pathogens. Proceedings Water Quality and Technology Conference, Toronto Canada: American Water Works Association. Winter, C. Moeseneder, M.M. and Herndl, G.J. (2001). Impact of UV radiation on bacterioplankton community composition, Applied and Environmental Microbiology, 67 (2), pp. 665-672. Wolfe, R.L. (1990). Ultraviolet disinfection of potable water. Environmental Science and Technology, 24 (6), pp. 768-773. Wommack, K.E. Hill, R.T. Muller, T.A. and Colwell, R.R. (1996). Effects of sunlight on bacteriophage viability and structure, Applied Environmental Microbiology, 62 (4), pp. 1336-1341. Wu, Y. Clevenger, T. and Deng, B. (2005). Impacts of goethite particles on UV disinfection of drinking water. Applied and Environmental Microbiology, 71 (7), pp. 4140-4143.

226
Wurtz, M. (1992). Bacteriophage structure, Electron Microscopy Reviews, 5 (2), pp. 283-309. Wyn-Jones, A.P. and Sellwood, J. (2001). Enteric viruses in the aquatic environment, Journal of Applied Microbiology, 91, pp. 945-962. Yamamoto, K.R. Alberts, B.M. Benzinger, R. Lawhorne, L. and Treiber, G. (1970). Rapid bacteriophage sedimentation in the presence of polyethylene glycol and its application to large scale virus purification. Virology, 40, pp. 734-744. Yang, J-S. Hao, W. Ekuni, A. Fujiwara, Y. Ono, T. Munakata, N. Hayatsu, H. Negishi, K. (1999). Sunlight mutagenesis: changes in mutational specificity during the irradiation of phage M13mp2. Mutation Research, 438, pp. 53-62. Yates, M.V. Malley, J. Rochelle, P. and Hoffman, R. (2006). Effect of adenovirus resistance on UV disinfection requirements: a report on the state of adenovirus science. Journal of the American Water Works Association, 98 (6), pp. 93-106. Yates, M.V. (2008). Adenoviruses and ultraviolet light: an introduction. Ozone: Science and Engineering, 30, pp. 70-72. Yaun, B.R. Sumner, S.S. Eifert, J.D. and Marcy, J.E. (2003). Response of Salmonella and E. coli O157:H7 to UV energy. Journal of Food Protection, 66 (6), pp. 1071-1073. Zemke, V. Podgorsek, L. and Schoenen, D. (1990) Ultraviolet disinfection of drinking water 1. Communication: Inactivation of E. coli and coliform bacteria. Zentralblatt Für Hygiene, 190, pp. 51-61. Zenoff, V.F. Siñeriz, F. and Farías, M.E. (2006). Diverse responses to UV-B radiation and repair mechanisms of bacteria isolated from high-altitude aquatic environments. Applied and Environmental Microbiology, 72 (12), pp. 7857-7863. Zimmer, J.L. and Slawson, R.M. (2002). Potential repair of E. coli DNA following exposure to UV radiation from both medium and low-pressure UV sources used in drinking water treatment. Applied and Environmental Microbiology, 68 (7), pp. 3293-3299. Zimmer, J.L. Slawson, R.M. and Huck, P.M. (2003). Inactivation and potential repair of C. parvum following low- and medium-pressure ultraviolet irradiation. Water Research, 37 (14), pp. 3517-3523.

227
APPENDIX I – Inactivation data reported in the literature
Table A1 UV-C fluences required for bacterial inactivation presented in the literature
Fluence required per log10 reduction (mJ/cm2)
Species
1 2 3 4 5
Reference
Aeromonas hydrophila ATCC 7966
1.1 2.6 3.9 5 6.7 Wilson et al., 1992
Aeromonas salmonicida 1.5 2.7 3.1 5.9 - Liltved and Landfald, 1996
Campylobacter jejuni biotype 1 strain 709/84
- - 1.8 - Butler et al., 1987
Campylobacter jejuni ATCC 43429
1.6 3.4 4 4.6 5.9 Wilson et al., 1992
Citrobacter freundii ATCC 8090
4.2 9.3 15 22 - Zemke et al., 1990
Enterobacter cloacae ATCC 13047
7 12 22 34 - Zemke et al., 1990
E. coli (wastewater isolate) - - 5 - - Butler et al., 1987
Escherichia coli ATCC 11229 2.5 3 3.5 5 10 Harris et al., 1987
Escherichia coli ATCC 11229 3 4.8 6.7 8.4 10.5 Chang et al., 1985
Escherichia coli ATCC 11229 5.1 8.4 15 25 34 Zemke et al., 1990
Escherichia coli ATCC 11229 <5 5.5 6.6 7.7 10 Zimmer and Slawson, 2002
Escherichia coli ATCC 11229 7 8 9 11 12 Hoyer, 1998
Escherichia coli ATCC 11229 3.95 5.3 6.4 7.3 8.4 Sommer et al., 1998
Escherichia coli ATCC 11303 4 6 9 10 13 Wu et al., 2005
Escherichia coli ATCC 29222 6 6.5 7 8 9 Sommer et al., 1998
Escherichia coli ATCC 25922 6 6.5 7 8 9 Sommer et al., 2000
Escherichia coli C 2 3 4 5.6 6.5 Otaki et al., 2003
Escherichia coli C300 2.5 4.8 6 7.5 10 Eischeid and Linden, 2007
Escherichia coli IFO3301 2 4 6 - - Oguma et al., 2001

228
Table A1 (cont.) UV-C fluences required for bacterial inactivation presented in the literature
Species 1 2 3 4 5 Reference
Escherichia coli K-12 IFO3301
1.5 2 3.5 4.2 5.5 Otaki et al., 2003
Escherichia coli (NCTC 10418)
1.33 - - 5.32 - Tree et al., 2005
Escherichia coli O157:H7 1.5 3 4.5 6 - Tosa and Hirata, 1999
Escherichia coli O157:H7 <2 <2 2.5 4 8 Yaun et al., 2003
Escherichia coli O157:H7 ATCC 43894
1.5 2.8 4.1 5.6 6.8 Wilson et al., 1992
Escherichia coli
O157:H7 CCUG 29193
3.5 4.7 5.5 7 - Sommer et al., 2000
Escherichia coli
O157:H7 CCUG 29197
2.5 3 4.6 5 5.5 Sommer et al., 2000
Escherichia coli
O157:H7 CCUG 29199
0.4 0.7 1 1.1 1.3 Sommer et al., 2000
Escherichia coli O25:K98:NM 5 7.5 9 10 11.5 Sommer et al., 2000
Escherichia coli O26 5.4 8 10.5 12.8 - Tosa and Hirata, 1999
Escherichia coli O50:H7 2.5 3 3.5 4.5 5 Sommer et al., 2000
Escherichia coli O78:H11 4 5 5.5 6 7 Sommer et al., 2000
Escherichia coli wild type 4.4 6.2 7.3 8.1 9.2 Sommer et al., 1998
Halobacterium elongata
ATCC33173
0.4 0.7 1 - - Martin et al., 2000
Halobacterium salinarum
ATCC43214
12 15 17.5 20 - Martin et al., 2000
Helicobacter pylori (clinical isolate, Texas)
<2.3 <3.9 <5.4 <5.4 - Hayes et al., 2006
Helicobacter pylori ATCC 43504
<6.2 <6.2 <6.3 <6.2 - Hayes et al., 2006

229
Table A1 (cont.) UV-C fluences required for bacterial inactivation presented in the literature
Species 1 2 3 4 5 Reference
Helicobacter pylori ATCC
49503
<2.4 <4.3 <6 <6 - Hayes et al., 2006
Klebsiella pneumoniae ATCC 13047
4.2 8.8 15 23 - Zemke et al., 1990
Klebsiella terrigena ATCC 33257
4.6 6.7 8.9 11 - Wilson et al., 1992
Legionella pneumohila Philadelphia 2 strain
0.92 1.8 2.8 - - Antopol and Ellner, 1979
Legionella pneumohila ATCC 33152
1.6 3.2 4.8 6.4 8.0 Oguma et al., 2004
Legionella pneumohila ATCC 43660
3.1 5 6.9 9.4 - Wilson et al., 1992
Listeria monocytogenes (in fresh brine)
- - - - 16.8 McKinney et al., 2009
Mycobacterium avium 33B 5.76 8.10 10.4 12.8 - Hayes et al., 2008
Mycobacterium avium W41 5.74 7.93 10.1 12.3 - Hayes et al., 2008
M. avium D55A01 6.39 9.37 12.4 15.3 - Hayes et al., 2008
M. intracellulare B12CC2 7.83 10.6 13.4 16.1 - Hayes et al., 2008
M. intracellulare ATCC13950 7.42 11.2 15 18.7 - Hayes et al., 2008
Salmonella spp. <2 2 3.5 7 14 Yaun et al., 2003
Salmonella anatum (human faeces)
7.5 12 15 - - Tosa and Hirata, 1998
Salmonella derby (human faeces)
3.5 7.5 - - - Tosa and Hirata, 1998
Salmonella enteritidis (human faeces)
5 7 9 10 - Tosa and Hirata, 1998
Salmonella infantis (human faeces)
2 4 6 - - Tosa and Hirata, 1998
Salmonella typhi ATCC 6539 2.7 4.1 5.5 7.1 8.5 Chang et al., 1985
Salmonella typhi ATCC 19430 1.8 4.8 6.4 8.2 - Wilson et al., 1992

230
Table A1 (cont.) UV-C fluences required for bacterial inactivation presented in the literature
Species 1 2 3 4 5 Reference
Salmonella typhimurium (human faeces)
2 3.5 5 9 - Tosa and Hirata, 1998
Salmonella typhimurium (activated sludge)
3 11.5 22 50 - Maya et al., 2003
Shigella dysenteriae ATCC 29027
0.5 1.2 2 3 4 Wilson et al., 1992
Shigella sonnei ATCC 9290 3.2 4.9 6.5 8.2 - Chang et al., 1985
Staphylococcus aureus ATCC 25923
3.9 5.4 6.5 10.4 - Chang et al., 1985
Streptococcus faecalis 6.6 8.8 9.9 1.2 - Chang et al., 1985
Streptococcus faecalis (secondary effluent)
5.5 6.5 8 9 12 Harris et al., 1987
Vibrio anguillarum 0.5 1.2 1.5 2 - Liltved and Landfald, 1996
Vibrio cholerae ATCC 25872 0.8 1.4 2.2 2.9 3.6 Wilson et al., 1992
Yersina enterocolitica serogroup 0:3 biotype 4 strain 304/84
- - 2.7 - - Butler et al., 1987
Yersina enterocolitica ATCC 27729
1.7 2.8 3.7 4.6 - Wilson et al., 1992
Yersinia ruckeri 1 2 3 5 - Liltved and Landfald, 1996

231
Table A2 UV-C fluences required for bacteriophage inactivation presented in the literature
Fluence required per log10 reduction (mJ/cm2)
Reference Type (host)
1 2 3 4
B40-8 (HSP-40) 12 18 23 28 Sommer et al., 1998 B40-8 (HSP-40) 11 17 23 29 Sommer et al., 2001 B40-8 (HSP-40) 7.1 14.3 21.4 28.6 Clancy et al., 2004b
MS2 3.9 25.3 46.7 68 Snicer et al., 1998 MS2 15.3 39.3 63.3 87.4 Snicer et al., 1998 MS2 - - - 64 - 93 Snicer et al., 1998 MS2 28.9 57.9 86.9 115.9 Roessler and
Severin, 1996 MS2 ATCC 15977-B1 (E. coli ATCC 15977–B1)
15.9 34 52 71 Wilson et al., 1992
MS2 (E. coli ATCC 15597) 19 40 61 - Oppenheimer et al., 1993
MS2 (E. coli ATCC 15977) 13.4 28.6 44.8 61.9 Meng and Gerba, 1996
MS2 (E. coli ATCC 15597) 23 55 87 119 Thurston-Enriquez et al., 2003
MS2 (E. coli ATCC 15597) 20 42 70 98 Lazarova and Savoye, 2004
MS2 (E. coli ATCC 15597) ~11 ~28 to 30 ~45 to ~48
- Bohrerova et al., 2006
MS2 (E. coli CR63) 16.9 33.8 - - Rauth, 1965 MS2 (E. coli C3000) 35 - - - Battigelli et al., 1993 MS2 (E. coli C3000) ~13 30 - - Shin et al., 2001 MS2 (E. coli C3000) 20 42 68 90 Linden et al., 2002a MS2 (E. coli C3000) 20 42 69 92 Batch et al., 2004 MS2 (E. coli HS(pFamp)R) - 45 75 100 Thompson et al.,
2003 MS2 (E. coli K-12 Hfr) 21 36 - - Sommer et al., 1998 MS2 (E. coli K-12) 18.5 36 55 - Sommer et al., 2001 MS2 DSM 5694 (E. coli NCIB 9481)
4 16 38 68 Wiedenmann et al., 1993
MS2 (E. coli NCIMB 9481) 14 - - 62.5 Tree et al., 2005 MS2 (Salmonella typhimurium WG49)
16.3 35 57 83 Nieuwstad and Havelaar, 1994

232
Table A2 (cont.) UV-C fluences required for bacteriophage inactivation presented in the literature
Type 1 2 3 4 Reference
MS2 NCIMB 10108 (Salmonella typhimurium WG49)
12.1 30.1 - - Tree et al., 1997
Pseudomonas aeruginosa phage D3C3 (PAO303)
~6.2 ~10.6 ~17.5 - Kadavy et al., 2000
Pseudomonas aeruginosa phage F116 (PAO303)
~8.6 ~14.6 ~18.1 - Kadavy et al., 2000
Pseudomonas aeruginosa phage G101 (PAO303)
~4.3 ~8.6 ~11.6 - Kadavy et al., 2000
Pseudomonas aeruginosa phage UNL-1 (PAO303)
~1.3 ~2.5 ~4.3 ~6.7 Kadavy et al., 2000
PHI X 174 (E. coli ATCC 15597)
4 8 12 - Oppenheimer et al., 1993
PHI X 174 (E. coli WG5) 2.2 5.3 7.3 10.5 Sommer et al., 1998
PHI X 174 (E. coli WG5) Lazarova et al., 1998
PHI X 174 (E. coli WG 5) 3 5 7.5 10 Sommer et al., 2001
PHI X 174 (E. coli C3000) 2.1 4.2 6.4 8.5 Battigelli et al., 1993
PRD-1 (S. typhimurium Lt2) 9.9 17.2 23.5 30.1 Meng and Gerba, 1996
PRD-1 (S. typhimurium Lt2) - 50 - 110 Shin et al., 2005
Staphylococcus aureus phage A994 (Staphylococcus aureus A994)
8 17 25 36 Sommer et al., 1989
T7 4.3 8.6 12.9 17.2 Clancy et al., 2004
Qβ 11.9 23.8 35.7 47.6 Clancy et al., 2004

233
Table A3 UV–C fluences required for viral inactivation presented in the literature
Fluence required per log10 reduction (mJ/cm2)
Reference Species/type
1 2 3 4
Adenovirus type 1 (CCL-2; ATTC)
34.4 68.9 103.4 137.9 Nwachuku et al., 2005
Adenovirus type 2 (A549 cell line)
20 45 80 110 Shin et al., 2005
Adenovirus type 2 (Human lung cell line)
35 55 75 100 Ballester and Malley, 2004
Adenovirus type 2 (PLC / PRF / 5 cell line)
40 78 119 160 Gerba et al., 2002
Adenovirus type 2 (A549 cell line)
45 85 125 165 Sirikanchana et al., 2008
Adenovirus type 2 (A549 cell line)
- 30 50 80 Eischeid et al., 2009
Adenovirus type 6 (CCL-2; ATTC)
38.5 76.9 115.4 153.8 Nwachuku et al., 2005
Adenovirus type 15 (A549 cell line)
40 80 122 165 Thompson et al., 2003
Adenovirus 40 (PLC / PRF / 5 cell line)
50 109 167 226 Thurston-Enriquez et al., 2003
Adenovirus 40 (ATCC – Dugan)
29.5 59.4 89.8 120.9 Meng and Gerba, 1996
Adenovirus 41 (ATCC – TAK)
22.4 49.5 80.2 - Meng and Gerba, 1996
Calicivirus canine (MDCK cell line)
7 15 22 30 Husman et al., 2004
Calicivirus canine (CRFK cell line)
7 16 25 - Husman et al., 2004
Calicivirus feline (CRFK cell line)
4 9 14 19 Tree et al., 2005
Calicivirus feline (CRFK cell line)
6 16 26 36 Thurston-Enriquez
et al., 2003

234
Table A3 (cont.) UV-C fluences required for viral inactivation presented in the literature
Species/type (host) 1 2 3 4 Reference
Coxsackievirus B3 (BGM cell line)
8 16 24.5 32.5 Gerba et al., 2002
Coxsackievirus B5 (Buffalo Green
Monkey cell line)
6.9 13.7 20.6 - Battigelli et al., 1993
Coxsackievirus B5 (BGM cell line)
9.5 18 27 36 Gerba et al., 2002
Echovirus I (BGM cell line) 8 16.5 25 33 Gerba et al., 2002
Echovirus II (BGM cell line) 7 14 20.5 28 Gerba et al., 2002
Enterovirus 7.5 15 24 34.5 Lazarova and Savoye, 2004
Hepatitis A (HAV/HFS/GBM) 5.5 9.8 15 21 Wiedenmann et al., 1993
Hepatitis A HM175 (FRhK-4 cell)
5.1 13.7 22 29.6 Wilson et al., 1992
Hepatitis A HM175 (FRhK-4 cell)
- - - 7 Snicer et al., 1998
Hepatitis A HM175 (FRhK-4 cell)
4.1 8.2 12.3 16.4 Battigelli et al., 1993
Poliovirus 6 14 22 32.5 Lazarova and Savoye, 2004
Poliovirus Type 1 (Mahoney) 3 7 14 40 Sommer et al., 1989
Poliovirus Type 1 (ATCC Mahoney)
6 14 23 30 Harris et al., 1987
Poliovirus 1 (BGM cell line) 5 11 18 27 Tree et al., 2005
Poliovirus 1 (BGM cell line) 8 15.5 23 31 Gerba et al., 2002
Poliovirus 1 [CaCo2 cell-line
(ATCC HTB37)]
7 17 28 37 Thompson et al., 2003
Poliovirus Type 1 LSc-1 4 8.7 14.2 20.6 Meng and Gerba, 1996
Poliovirus Type 1 LSc-1 (MA104 cell)
5.6 11 16.5 21.5 Chang et al., 1985

235
Table A3 (cont.) UV-C fluences required for viral inactivation presented in the literature
Species/type 1 2 3 4 Reference
Poliovirus Type 1 LSc-1 5.7 11 17.6 23.3 Wilson et al., 1992
Poliovirus Type 1 LSc-1 - - - 23 – 29
Snicer et al., 1998
Reovirus Type 1 Lang strain 16 36 - - Harris et al., 1987
Reovirus -3 (Mouse L-60) 11.2 22.4 - - Rauth, 1965
Rotavirus (MA 104) in freshwater
20 80 140 200 Caballero et al., 2004
Rotavirus (MA 104) in seawater
50 110 160 220 Caballero et al., 2004
Rotavirus SA 11 (MA 104) 8 15 27 38 Sommer et al., 1989
Rotavirus SA 11 (MA 104) 7.6 15.3 23 - Battigelli et al., 1993
Rotavirus SA 11 (MA 104) 7.1 14.8 25 - Chang et al., 1985
Rotavirus SA 11 (MA 104) 9.1 19 26 36 Wilson et al., 1992
Rotavirus WA 11 (MA 104) - - - 50 Snicer et al., 1998

236
Table A4 UV-C fluences required for protozoan inactivation presented in the literature
Fluence required per log10 reduction (mJ/cm2)
Reference Species (assay method)
1 2 3 4
Cryptosporidium parvum (cell culture infectivity)
1 2 <5 - Shin et al., 2001
Cryptosporidium parvum (animal?) <2 <2 <2 <4 Clancy et al., 2004a
Cryptosporidium parvum
(animal?)
<3 <3 3 - 6 <16 Clancy et al., 2000
Cryptosporidium parvum (animal infectivity)
0.5 1 1.4 2.2 Morita et al., 2002
Cryptosporidium parvum 2 <3 <3 - Zimmer et al., 2003
Cryptosporidium parum - - - <19 Bukhari et al., 1999
Cryptosporidium parum - - <10 - Shin et al., 1999
Cryptosporidium parvum,
oocysts, tissue culture assay
1.3 2.3 3.2 - Shin et al., 2000
Encephalitozoon cuniculi,
microsporidia
4 9 13 - Marshall et al., 2003
Encephalitozoon hellem,
microsporidia
8 12 18 - Marshall et al., 2003
Encephalitozoon intestinalis,
Microsporidia
3 5 6 - Marshall et al., 2003
Giardia lamblia <1 <2 Shin et al., 2000
Giardia lamblia - - - - Malley et al., 2000
Giardia lamblia <10 ~10 <20 - Campbell et al., 2002
Giardia lamblia <2 <2 <4 - Mofidi et al., 2002
Giardia lamblia excystation assay >63 - - - Rice and Hoff, 1981

237
Table A4 (cont.) UV-C fluences required for protozoan inactivation presented in the literature
Species (assay method) 1 2 3 4 Reference
Giardia lamblia excystation assay
40 180 - - Karanis et al., 1992
Giardia lamblia,
gerbil infectivity assay
<0.5 <0.5 <0.5 <1 Linden et al., 2002b
Giardia muris <1.9 <1.9 ~2 ~2.3 Hayes et al., 2003
Giardia muris <2 <2 <4 Mofidi et al., 2002
Giardia muris excystation assay
77 110 - - Carlson et al., 1985
Table A5 UV-C fluences required for sporal inactivation presented in the literature
Fluence required per log10 reduction (mJ/cm2)
Spore
1 2 3 4
Reference
Bacillus anthracis Sterne 81 - - - Knudson, 1986
B. anthracis Sterne 27.5 - - - Nicholson and Galeano, 2003
B. subtilis ~35 40.4 ~55 ~70 Wang et al., 2010
B. subtilis (ATCC 6633) 36 48.6 61 78 Chang et al., 1985
B. subtilis (ATCC 6633) 29 40 51 - Sommer et al., 1998
B. subtilis (ATCC 6633) 20 39 60 81 Sommer et al., 1999
B. subtilis (ATCC 6633) 26 - - - Hoyer, 2000
B. subtilis (ATCC 6633) 24.5 - - - Nicholson and Galeano, 2003
B. subtilis (ATCC 6633) 24 35 47 79 Mamane-Gravetz and
Linden, 2004
B. subtilis (ATCC 6633) 24.5 - - - Nicholson and Galeano, 2003
B. subtilis (ATCC 6633) - 22.8 - - Bohrerova et al., 2006
B. subtilis (ATCC WN626) 24.5 - - - Nicholson and Galeano, 2003
B. subtilis (ATCC WN626) 0.4 0.9 1.3 2 Marshall et al., 2003

238