3 Rapid Differentiation of Commercially-Available Soy Sauces ...
10
2019 Issue 3 INTRODUCTION Soy sauce is a popular food condiment produced by fermenting soybean with other ingredients such as wheat, rice, brine solution and fermenting culture of fungi for 6-8 months (Fukushima, 2004; Liu, 2015). During fermentation, proteins, carbohydrates and other components of soybeans and wheat are converted to peptides, amino acids, sugars, alcohols, and other low molecule compounds that define the soy sauce’s aroma and unique taste (a combination ABSTRACT Near-infrared (NIR) spectroscopy was used to differentiate between four leading brands of soy sauce in the Philippines; the local brands included Datu Puti (DP), Marca Piña (MP), and Silver Swan (SS). A naturally-brewed imported brand, Kikkoman (KK), was used for comparison. Spectral data of soy sauce samples were acquired in absorbance mode from 900 nm to 1700 nm. First– (1D) and second– (2D) derivative transforms of preprocessed spectral data were analysed by a combination of principal component analysis (PCA) – linear discriminant analysis (LDA), and by partial least squares regression (PLSR). Spectral data with no derivative (ND) transformation was analysed for comparison. Preprocessing methods included mean scatter correction (MSC), Savitzky-Golay (SG) smoothing, and standard normal variate (SNV); these were used in different combinations to determine the best treatment. PCA-LDA results showed that the MSC-SG-ND treatment gave the best result overall with 97.6% of samples classified correctly, and 96.9% of variability explained by two principal components. For PLSR, data preprocessed using SNV-SG-2D transformation gave the best results after cross-validation, with a 9-factor model with root mean square error (RMSE) and coefficient of determination (R 2 ) of 0.114 and 0.989, respectively. Using an independent set of soy sauce samples, the PLSR model was able to correctly identify 100% of DP, KK and MP; however, all SS samples were misclassified as DP or MP. This underscores the need for extensive sampling to build up a spectral library of soy sauce from different brands and sources; this will enable rapid testing of products for authenticity, quality and safety. Keywords: NIR spectroscopy; spectral fingerprint; soy sauce; differentiation; chemometrics Abbreviations: 1D – 1st order differentiation; 2D – 2nd order differentiation; AIC – Akaike information criterion; LDA – linear discriminant analysis; MC – mean centering; MSC – multiplicative scatter correction; ND – no differentiation; NIR – near-infrared; PCA – principal component analysis; PLSR – partial least squares regression; RMSE – root mean square error; SG – Savitzky-Golay; SNV – standard normal variate; VIP – variable of importance for projection Rapid Differentiation of Commercially-Available Soy Sauces using Near-Infrared Spectroscopy Jeric H. Rosales 1 , Kevin F. Yaptenco 2 , Mae Joanne B. Aguila 3 , Paul R. Armstrong 4 1 University Research Associate I, Agricultural and Bio-Process Division, Institute of Agricultural Engineering, College of Engineering and Agro-Industrial Technology, University of the Philippines Los Banos, 4031 College, Laguna, Philippines (Author for correspondence email: [email protected]). 2 Professor 2, Agricultural and Bio-Process Division, Institute of Agricultural Engineering, College of Engineering and Agro-Industrial Technology, University of the Philippines Los Ban os, 4031 College, Laguna, Philippines 3 Associate Professor 1, Institute of Chemistry, College of Arts and Sciences, University of the Philippines Los Banos, 4031 College, Laguna, Philippines. 4 Lead Scientist-Research Engineer, United States Department of Agriculture, Agriculture Research Service, Center for Grain and Animal Health Research Manhattan, Kansas, 66502, USA.
-
Upload
khangminh22 -
Category
Documents
-
view
0 -
download
0
Transcript of 3 Rapid Differentiation of Commercially-Available Soy Sauces ...

2019 Issue
3
INTRODUCTION Soy sauce is a popular food condiment produced by fermenting soybean with other ingredients such as wheat, rice, brine solution and fermenting culture of
fungi for 6-8 months (Fukushima, 2004; Liu, 2015). During fermentation, proteins, carbohydrates and other components of soybeans and wheat are converted to peptides, amino acids, sugars, alcohols, and other low molecule compounds that define the soy sauce’s aroma and unique taste (a combination
ABSTRACT
Near-infrared (NIR) spectroscopy was used to differentiate between four leading brands of soy sauce in
the Philippines; the local brands included Datu Puti (DP), Marca Piña (MP), and Silver Swan (SS). A
naturally-brewed imported brand, Kikkoman (KK), was used for comparison. Spectral data of soy sauce
samples were acquired in absorbance mode from 900 nm to 1700 nm. First– (1D) and second– (2D)
derivative transforms of preprocessed spectral data were analysed by a combination of principal
component analysis (PCA) – linear discriminant analysis (LDA), and by partial least squares regression
(PLSR). Spectral data with no derivative (ND) transformation was analysed for comparison.
Preprocessing methods included mean scatter correction (MSC), Savitzky-Golay (SG) smoothing, and
standard normal variate (SNV); these were used in different combinations to determine the best
treatment. PCA-LDA results showed that the MSC-SG-ND treatment gave the best result overall with
97.6% of samples classified correctly, and 96.9% of variability explained by two principal components. For
PLSR, data preprocessed using SNV-SG-2D transformation gave the best results after cross-validation,
with a 9-factor model with root mean square error (RMSE) and coefficient of determination (R2) of 0.114
and 0.989, respectively. Using an independent set of soy sauce samples, the PLSR model was able to
correctly identify 100% of DP, KK and MP; however, all SS samples were misclassified as DP or MP. This
underscores the need for extensive sampling to build up a spectral library of soy sauce from different
brands and sources; this will enable rapid testing of products for authenticity, quality and safety. Keywords: NIR spectroscopy; spectral fingerprint; soy sauce; differentiation; chemometrics Abbreviations: 1D – 1st order differentiation; 2D – 2nd order differentiation; AIC – Akaike information criterion; LDA – linear discriminant analysis; MC – mean centering; MSC – multiplicative scatter correction; ND – no differentiation; NIR – near-infrared; PCA – principal component analysis; PLSR – partial least squares regression; RMSE – root mean square error; SG – Savitzky-Golay; SNV – standard normal variate; VIP – variable of importance for projection
Rapid Differentiation of Commercially-Available Soy Sauces using Near-Infrared Spectroscopy
Jeric H. Rosales1, Kevin F. Yaptenco2, Mae Joanne B. Aguila3, Paul R. Armstrong4
1University Research Associate I, Agricultural and Bio-Process Division, Institute of Agricultural Engineering, College of Engineering and Agro-Industrial Technology, University of the Philippines Los Ban os, 4031 College, Laguna, Philippines (Author for correspondence email: [email protected]). 2Professor 2, Agricultural and Bio-Process Division, Institute of Agricultural Engineering, College of Engineering and Agro-Industrial Technology, University of the Philippines Los Ban os, 4031 College, Laguna, Philippines 3Associate Professor 1, Institute of Chemistry, College of Arts and Sciences, University of the Philippines Los Ban os, 4031 College, Laguna, Philippines. 4Lead Scientist-Research Engineer, United States Department of Agriculture, Agriculture Research Service, Center for Grain and Animal Health Research Manhattan, Kansas, 66502, USA.
Philippine Journal of Agricultural and Biosystems Engineering Vol. 15, No. 2
4
of tartness, sweetness, and saltiness) (Sanchez, 2008; Lee, 2015). The reaction between sugars and amino acids produces the brown hue of soy sauce (Liu, 2012). Soy sauce can also be produced by acid hydrolysis of vegetable protein (acid-HVP) for 12 to 16 hours (Gao et al., 2015). During acid-HVP, proteins and carbohydrates from defatted soybeans and wheat gluten, respectively, are chemically digested with hydrochloric acid and sodium hydroxide (Sano et al., 2007). However, soy sauce produced by acid-HVP contain carcinogens such as 3-monochloro-1,2-propanediol (3-MCPD) and 1,3-dichloropropanol (1,3-DCP) (Baer et al., 2009). International food standards specify a maximum limit of 0.4 mg kg-1 for 3-MCPD (Codex Alimentarius, 2015) with the Philippine government imposing this limit in June 2012 (DOH-FDA, 2011). Other compounds such as dark humins, levulinic acid, formic acid, dimethyl sulfide, hydrogen sulfide and furfurals that cause unnatural flavors and strong off-odor are present (Liu, 2012; Fukushima, 2004). Moreover, some essential amino acids are degraded during chemical hydrolysis resulting in a less nutritious product (Gao et al., 2015; Zhu et al., 2009).
The ability to rapidly manufacture a cheap alternative to naturally fermented soy sauce has resulted in fraudulent practices such as mislabelling acid-hydrolysed product as pure fermented soy sauce (Sano et al., 2007) or mixing brine solution, monosodium glutamate, and dark soy sauce in suitable ratios (Natcha & Panmanas, 2014). A report by the non-profit organization Food & Water Watch (FWW) shows that China’s food safety system suffers from major deficiencies that have allowed manufacturers to produce adulterated, unsafe or contaminated products such as milk powder, seafood and honey. Among the scandals is a report of imitation soy sauce containing hair clippings (Tang and Babich, 2014); more recently, family-owned companies in Tianjin were discovered to have been manufacturing fake condiments (including soy sauce) for up to 10 years using unsafe ingredients and practices (CNN Philippines, 2017). However, despite the numerous food scandals periodically originating from this country, many food processors now find that China is too important
to abandon as a source of ingredients and raw material (Zhang and Xue, 2016; FWW, 2011). High-performance liquid chromatography (Zhu et al., 2009) fluorescence resonance energy transfer (Gao et al., 2015), and liquid chromatography coupled with mass spectrometry (Sano et al., 2007) have been used to differentiate between purely fermented and chemically synthesized soy sauce. However, these methods require extensive sample preparation, chemical reagents and buffers, specialized training and costly instruments. Near-infrared (NIR) spectroscopy can potentially detect adulteration of soy sauce (Natcha and Panmanas, 2014), and differentiate between soy sauce made from whole or defatted soybean (Kinoshita et al., 1998; Iizuka and Aishama, 1999). NIR spectroscopy is also rapid, requires minimal sample preparation, and can be operated with minimal training once a suitable and robust calibration model has been developed. This method can provide a rapid way of differentiating between various soy sauce products manufactured under different methods. The general objective of the study was to develop a NIR spectroscopy method to differentiate between locally manufactured soy sauce products in the Philippines with reference to an imported brand considered as naturally fermented soy sauce. However, the study was limited to selected local brands and focuses on soy sauce samples in plastic packs. Results of the study could then be used as a basis for later development of a portable instrument for market surveillance.
METHODOLOGY Sampling Scheme and Sample Preparation Samples of soy sauce of various brands were obtained from six different markets and department stores (designated as A, B, C, D, E and F) in the municipality of Los Baños, Laguna province. Three popular brands of soy sauce manufactured in the Philippines were used for the study: Datu Puti (DP), Marca Piña (MP) and Silver Swan (SS). The imported Kikkoman (KK) brand was considered as a purely fermented product (Kikkoman, 2014) and used for comparison. For DP, MP and SS, three 10-mL replicate samples were taken from each pack;

2019 Issue
5
for KK, five 5-mL replicate samples were obtained (Table 1). All pouches were stored at room temperature (≈ 25oC). Samples were passed through Whatman filter paper to remove any suspended solids prior to spectra acquisition. These samples served as a training set for developing models for predicting brands of soy sauce. A separate set of soy sauce samples (3 packs per brand) was purchased from one market to serve as a prediction set. Three 10-mL samples were extracted from each pack for spectral data acquisition. Spectral Data Acquisition All components of the NIR spectra acquisition system were manufactured by Ocean Optics (Florida, USA). Spectra were acquired in absorbance mode using a NIRQuest 512 spectrometer with a useable wavelength range of 900-1700 nm. A tungsten-halogen lamp (HL-2000) was used as the light source. Spectrasuite software (2011 release, Ocean Optics, Florida, USA) was used for instrument control and data recording; the following settings were used: integration time = 15 ms, scans to average = 30, boxcar width = 5 nm. A reference spectrum was recorded using distilled water in a quartz cuvette (10-mm path length) as a blank solution; this served to subtract the contribution of water to the spectral signature. Dark spectrum was recorded with the spectrometer filter slot blocked to prevent the entry of light. Data acquisition was performed at room temperature (≈ 25oC) at all times. Each sample replicate was scanned twice; hence, 180 NIR spectra were obtained for each brand (Table 1), giving a total of 720 spectra to form the training set. Similarly, for the separate prediction set, 18 NIR spectra were recorded for each brand, or a total of 72 spectra. Data at the opposite ends of the operating range of the spectrometer were discarded 50 nm from the minimum and maximum wavelengths to eliminate spectral noise. The training set of 720 spectra was randomly divided to form a
calibration set (120 samples per brand) and validation set (60 samples per brand). Preprocessing and Pretreatment of Spectral Data ParLeS version 3.1 (Viscarra-Rossel, 2007) was used to preprocess and pretreat the NIR spectra of each sample as shown in Table 2. These procedures serve to smooth out the spectral curve, scale the spectra, eliminate scattering effects, and identify peaks and valleys that correspond to wavelengths that contribute significantly to correct prediction. All spectra were scaled using mean centering. Principal Component Analysis and Linear Discriminant Analysis of Pretreated NIR Spectra Principal component analysis (PCA) and linear discriminant analysis (LDA) were used to generate
Table 1. Sampling scheme for soy sauce by brand for the training set*
BRAND (PACK SIZE)
NUMBER OF SAMPLE PACKS
REPLI-CATE SAM-PLES PER
PACK (X)
TOTAL NUMBER
OF SPECTRA
(W)
Per Market
(Z)
Total
(Y) Datu Puti (200 mL) 5 30 3 180
Marca Pina (220 mL) 5 30 3 180
Silver Swan (200 mL) 5 30 3 180
Kikkoman (100 mL) 3 18 5 180
Grand Total 720 *Y = (Z) ∙ (6 markets); W = (Y) ∙ (X) ∙ (2 scans per replicate)
Table 2. Combinations of data preprocessing and pretreatment methods using ParleS ver. 3.1
TREATMENT NUMBER
TRANSFORMATION COMBINATIONSZ
1 No transformation
2 MSC – SG – ND
3 MSC – SG – 1D
4 MSC – SG – 2D
5 SNV – SG – ND
6 SNV – SG – 1D
7 SNV – SG – 2D zAbbreviations: 1D – first derivative; 2D – second deriva-tive, MSC – mean scatter correction; ND – no derivative; SG – Savitzky-Golay; SNV – standard normal variate
Philippine Journal of Agricultural and Biosystems Engineering Vol. 15, No. 2
6
mathematical models to classify soy sauce samples according to brand. ParLeS ver. 3.1 (Viscarra-Rossel, 2007) was used to perform PCA, while the XLSTAT add-in for Microsoft Excel 2013 was used for LDA. PCA was performed for a maximum of 10 principal components. LDA was subsequently performed using the scores for the first principal components derived from PCA that explain at least 95% of the variability in the NIR spectral data. Classification of samples was made using the LDA models of all combinations of pretreatment methods. Partial Least Squares Regression Partial least squares regression (PLSR) was performed using ParLeS ver. 3.1 (Viscarra-Rossel 2007) to form regression models to predict the brand of a sample of soy sauce. Numerical values were assigned to each brand (to serve as a dummy
variable) as follows: DP = 1, MP = 2, SS = 3, KK = 4. The optimal number of factors in the regression model was determined using leave-one-out cross-validation up to a maximum of 30 PLSR factors using the calibration data set. Only treatment combinations (shown in Table 5) with a low number of PLSR factors and high R2 values were considered for further validation and prediction.
RESULTS AND DISCUSSION Spectral Fingerprinting of Soy Sauce Brands The mean NIR spectral profile of each soy sauce brand as a function of wavelength is shown in Figure 1. From the visual inspection of the profiles, in Figure 1, no obvious differences between brands can be observed. All brands have a strong absorption band near 1400 nm, with Kikkoman soy sauce having the sharpest peak. Absorption at 1170 nm to 1180 nm are mainly related to the C–H stretch
Figure 1. NIR spectral fingerprint of popular brands of soy sauce available in the Philippines. Solid lines represent the average spectral profile of 180 sample spectra for each brand; dotted lines denote the 95%
confidence interval.
2019 Issue
7
second overtone of sugars and alkenes. The NIR absorption at 1660 nm, on the other hand, are mainly due to the C–H stretch first overtone of compounds having methylene group (–CH2). Lastly, the strongest absorption in 1400 nm can be associated with the O–H stretch, first overtone in phenols and alcohols (Workman & Weyer, 2008; Shenk et al., 2008). First- and second-derivative spectra also showed no obvious differences between brands (data not shown). However, the 95% confidence intervals for KK spectra were greater compared to the three local brands (Figure 1), possibly indicating a greater variation in components of the naturally fermented brand.
Discriminant Analysis The preprocessing and transformation treatments for spectral data produced PCA models that accounted for more than 90% of variation; results of
Table 3. Percentage of correct classification of soy sauce samples by brand using linear discriminant analysis of principal component scores
TREAT-MENT
NUMBER
TRANSFOR-MATION AND
PRE-PROCESSING
COMBINATIONSz
% CLASSIFICATION BY BRAND
% CORRECT CLASSIFI-CATION
DP KK MP SS
1 No transfor-mation
98.3 100.0 82.8 42.2 80.8
2 MSC – SG – ND 100.0 100.0 96.7 93.9 97.6
3 MSC – SG – 1D 100.0 100.0 62.2 93.9 89.0
4 MSC – SG – 2D 100.0 55.0 72.2 80.6 76.9
5 SNV – SG – ND 100.0 100.0 96.7 93.9 97.6
6 SNV – SG – 1D 100.0 100.0 62.2 92.8 88.8
7 SNV – SG – 2D 0.0 7.8 52.8 61.7 30.6 zAbbreviations: 1D – first derivative; 2D – second derivative, DP – Datu Puti, KK – Kikko-man, MP – Marca Piña, MSC – mean scatter correction; ND – no derivative; SG – Savitzky-Golay; SNV – standard normal variate, SS – Silver Swan
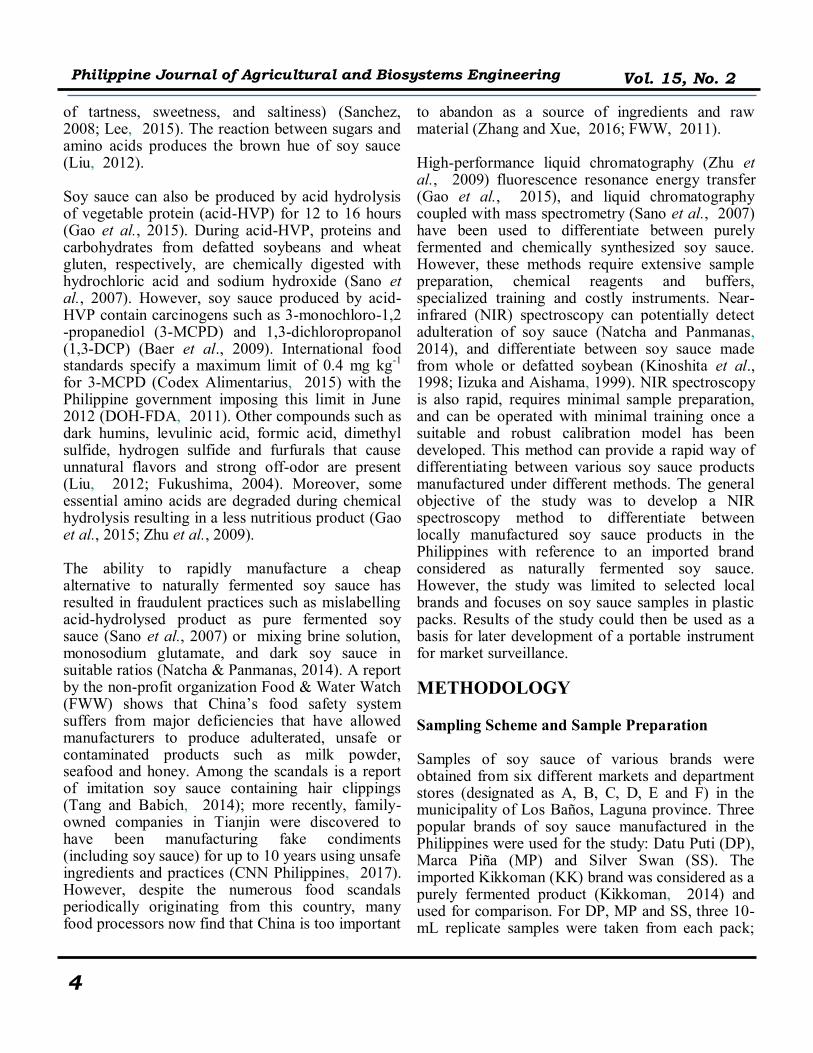
Figure 2. Results of principal component analysis for differentiation between soy sauce brands using Treatment 2 (mean scatter correction, Savitzky-Golay smoothing, and no differentiation): (a) score plots of
the first two principal components (PC); (b) loading scores for PC 1, 2 and 3 versus wavelength.
(a) (b)

Philippine Journal of Agricultural and Biosystems Engineering Vol. 15, No. 2
8
Figure 3. Score plot of partial least squares regres-sion using a 9-factor model of NIR spectral data sub-
jected to standard normal variate, Savitzky-Golay smoothing, and 2nd derivative differentiation.
Figure 4. Performance of the partial least squares regression model using validation set of samples.
Table 4. Absorption bands and functional groups of NIR wavelengthsz with high loadings in the first three principal components of PCA.
WAVELENGTH (nm)
NIR ABSORPTION
BAND
FUNCTION-AL GROUP
1350, 1380, 1400, 1460, 1545
C–H combination Hydrocarbons Sugars
1400 O–H stretch, first overtone
Phenols (2-methoxy phe-nol) Alcohols (methanol, ethanol)
1460 N–H stretch, first overtone
Secondary amine
1545 O–H-stretch, C–H stretch, first overtone
Carboxylic acid (acetic acid, propano-ic acid, ben-zoic acid); Sugars
1630, 1640 C–H stretch, first overtone
Alkenes, oth-er compounds containing C–H aromatic groups
zSource: Workman & Weyer, 2008; Shenk et al., 2008; Yokotsuka, , 1986
Table 5. Performance of data preprocessing treatments using partial least squares regression with leave-one-out cross-validation for predicting soy sauce brands. TREATMENT
NO.
TRANS-FORMATION COM-
BINA-TIONSZ
CROSS-VALIDATION RESULTSZ
No. of Factors
RMSE R2 AIC
1 No trans-formation
16 0.071 0.996 -1239
2 MSC – SG – ND
16 0.075 0.996 -1214
3 MSC – SG – 1D
11 0.075 0.995 -1219
4 MSC – SG – 2D
9 0.115 0.989 -1022
5 SNV – SG – ND
16 0.069 0.996 -1254
6 SNV – SG – 1D
11 0.075 0.995 -1221
7 SNV – SG – 2D
9 0.114 0.989 -1022
zAbbreviations: 1D – first derivative; 2D – second derivative; AIC – Akaike Information Criterion; MSC – mean scatter correction; ND – no derivative; RMSE – root mean square error; SG – Savitz-ky-Golay; SNV – standard normal variate

2019 Issue
9
subsequent LDA on PCA scores showed that using 1st and 2nd derivative transformation decreased the percentage of samples correctly classified according to brand (Table 3). The treatments with the highest percentage of correctly classified samples (97.6%) were Treatments 2 and 5 (combination of mean scatter correction or standard normal variate, with Savitzky- Golay smoothing and no differentiation). A plot of scores for the first two PCs of these treatments showed, however, that Treatment 2 gave the best classification results due to tighter clustering of samples according to brand (Figure 2a) and a slightly higher percentage (by 0.05%) of explained variation compared to Treatment 5. The first PC accounted for 83.2% of variation in NIR spectral data and represented the largest difference between brands. All KK and DP samples were correctly classified, while overlaps in the scores plot could account for the misclassification observed for MP and SS samples (Figure 2a). The spectral loadings plotted against wavelength of the first three PCs are shown in Figure 2b. For each PC, wavelengths having large absolute loading values are considered to have a high contribution to the variability explained by the PCA model (Grootveld, 2014). The highest loadings for each PC were observed as follows: PC1: 1350, 1400 and 1545 nm PC2: 1380, 1460 and 1640 nm PC3: 1390 and 1630 nm. High loadings at these wavelengths may be attributed to major chemical constituents of soy sauce like alcohols, acids, and sugars (Table 4). These compounds, either singly or in combination with other components, have the strongest influence for discriminating between soy sauce brands. Partial Least Squares Regression Table 5 shows the best results of PLSR analysis of transformed spectral data, where
Table 6. Identification of significant wavelengths based on performance of the partial least squares regression model of Treatment 7
MEASURE OF PER-
FORMANCE
INTERPRETATION WAVE-LENGTH BANDS
WITH SIG-NIFICANCE
(nm)
Regression coefficients
Large absolute values (> 1000) indicate that a wave-length has a significant effect on prediction (Liu et al., 2008; Mehmood et al., 2012)
1130 – 1300 1400 – 1500 1650
Loading weights
Absolute value of loading weights > 0.04 indicate useful wavelengths (Liu et al., 2008)
1400 – 1460 1500 – 1550
VIP Indicates the contribution of each wavelength accord-ing to the variation ex-plained by each latent vari-able or PLSR factor (Wold et al., 2001; Mehmood et al., 2012); wavelengths with VIP scores > 7.5 were considered significant
1400 – 1460 1500 – 1540
Table 7. Validation results of the 9-factor partial least squares regression model of Treatment 7z for predicting soy sauce brand using the prediction set
ACTUAL BRANDZ
PREDICTED BRAND TO-TAL
% CORRECT
CLASSIFICA-TION
DP KK MP SS
DP 18 0 0 0 18 100.0%
KK 0 18 0 0 18 100.0%
MP 0 0 18 0 18 100.0%
SS 9 0 9 0 18 0.0%
Total 27 18 27 0 72 75.0% zTreatment 7 used standard normal variate, Savitzky-Golay smooth-ing and 2nd derivative transformation of spectral data yAbbreviations: DP – Datu Puti; KK – Kikkoman; MP – Marca Piña; SS – Silver Swan
Philippine Journal of Agricultural and Biosystems Engineering Vol. 15, No. 2
10
up to 30 factors were tested. For selection of the best model, the number of PLSR factors must be as few as possible but must comprise all relevant information in the spectra; furthermore, R2 value must be as close to 1 as possible, while both RMSE and AIC values must below (Nicolai et al., 2007; Moghimi et al., 2010; Viscarra Rossel, 2007). Based on these criteria, Treatment 7 (SNV-SG-2D) was selected for further validation. A plot of the first two PLSR scores or latent variables (LV), designated as LV1 and LV2, clearly shows clustering according to brand (Figure 3). Clustering was more pronounced between KK samples and the three local brands. Among the local brands, DP samples could be clearly separated from MP and SS samples. The wider dispersion within the KK cluster could again be due to the natural brewing process used by the manufacturer. In comparison, the tight clustering observed for DP, MP and SS samples may be indicative of production through chemical hydrolysis, thus yielding products with definite and similar chemical composition regardless of processing batch (Ignacio, 1996). Selection of Effective Wavelengths Wavelengths of significance can be identified through their regression coefficients, loading weights, and VIP values (Table 6); by combining these indicators, eleven wavelengths with the most significance were identified: 1402, 1407, 1413, 1420, 1426, 1431, 1505, 1514, 1519, 1524 and 1530 nm. Validation of the PLSR Model using Test Set of Samples Using the best PLSR model on the validation set showed that this method could be used for classifying samples according to brand (Figure 4). Using a threshold value of ±0.5 in the assessment of the predicted values for brand (DP: 0.5 – 1.5; MP: 1.5–2.5; SS: 2.5–3.5, and; KK: 3.5–4.5), the 9-factor PLSR model was able to correctly classify all soy sauce samples according to brand.
Final validation using the separate prediction set showed similar results for DP, KK and MP samples
(Table 7). The model, however, misclassified all SS samples as either DP or MP. Since the prediction set was composed of samples purchased one month after the training set, this could be due to large variations between the two batches of SS samples. The processing methods, ingredients, and conditions could be different between these particular batches of soy sauce, resulting in the misclassification. This emphasizes the need for more substantial sampling of soy sauce products with respect to manufacturing source to strengthen the PLSR model and improve its accuracy.
SUMMARY AND CONCLUSION The study showed that soy sauce brands could be separated according to their NIR spectral signatures through the use of combined principal component analysis (PCA) – linear discriminant analysis (LDA), or by partial least squares regression (PLSR) analysis. Wavelength regions with a high degree of contribution to the models were identified which are related to chemical components present in soy sauce. For PCA-LDA, the best classification was achieved using mean-centered spectral data that was pre-processed using mean scatter correction and Savitzky-Golay smoothing. For PLSR, the use of standard normal variate, Savitzky-Golay smoothing and 2nd derivative transformation on mean-centered data gave the best results for predicting soy sauce brand. Results of the study could serve as a basis for the eventual development of a portable instrument for rapid testing of soy sauce products to detect adulteration, predict authenticity or test for safety. However, extensive sampling is needed to make regression models more robust and to build up a spectral library of different brands and sources of soy sauce.
RECOMMENDATIONS NIR spectroscopy was proven to be feasible in discriminating between locally manufactured soy sauces. It is recommended to study the effect of the type of packaging material in the spectral fingerprint of different soy sauce brands. A study to check the effect of storage duration and conditions on the

2019 Issue
11
spectral fingerprint is also recommended. The application of NIR spectroscopy in determining soy sauces' chemical properties such as pH, salt, total solids, total nitrogen, amino acids, and the like can also be done.
ACKNOWLEDGEMENTS The authors gratefully acknowledge the support of the Philippine Commission on Higher Education and the U.S. Department of Agriculture (USDA) – Stored Product Insect and Engineering Research Unit (SPIER) for the NIR instrumentation essential to this study. This study was conducted as the undergraduate thesis of the first author at the Institute of Agricultural Engineering (IAE), University of the Philippines Los Baños (UPLB). The contributions of Engr. Elizabeth B. Maghirang of USDA-SPIER and Engr. Erwin P. Quilloy of IAE-CEAT, UPLB are gratefully acknowledged in the completion of the study. Financial support was provided by Mr. and Mrs. Club of Lumban, Laguna, Syngenta Philippines Inc., the PHINMA Foundation, and other providers of student aid that made this study possible. The mention of a trademark or proprietary product does not constitute a guarantee or warranty of the product by the USDA and does not imply its approval for the exclusion of other products that may also be suitable. USDA is an equal opportunity provider and employer.
LITERATURE CITED
BAER, I., DE LA CALLE, B., & TAYLOR, P. (2009). 3-MCPD in food other than soy sauce or hydrolysed vegetable protein (HVP). Journal of Analytical and Bio-analytical Chemistry, 396, 443-456. doi: 10.1007/s00216-009-3177-y
CNN PHILIPPINES. 2017. China’s Fake Food Problem: Soy Sauce and Spice Mixes. Available at http://cnnphilippines.com/news/2017/01/19/china-fake-food-soy-sauce-spices.html. Accessed on 28 January 2018.
CODEX ALIMENTARIUS. 2015. General Standard for Food Contaminants and Toxins in Food and Feed (CODEX STAN 193-1995). Available at www.fao.org/input/download/standards/17/CXS_193e_2015.pdf. Accessed on 27 January 2018.
DOH-FDA. 2011. FDA Memorandum No. 2011-028: Safety of Soy Sauce in the Philippines. Available at http://www.fda.gov.ph/attachments/article/38593/FM%202011-028%20Safety%20of%20Soy%20Sauce%20in%20the%20Phil%20CODEX.pdf. Accessed on 27 January 2018.
FUKUSHIMA, D. (2004). Industrialization of fermented soy sauce production centering around Japanese shoyu. In: K.H. Steinkraus (ed). Industrialization of Indigenous Fermented Foods (2nd edition), (pp. 1-98). New York, USA: Marcel, Dekker.
FWW [Food & Water Watch]. 2011. A Decade of Dangerous Food Imports from China. Available at https://www.foodandwaterwatch.org/insight/decade-dangerous-food-imports-china. Accessed on 27 January 2018.
GAO, Y., HSIEH, B., CHENG, T., & CHEN, R. (2015). Judgment of pure fermented soy sauce by fluorescence resonance energy transfer of OPA-tryptophan adduct. J Food Chem. 178: 122-127.
GROOTVELD, M. (2014). Introduction to the Applications of Chemometric Techniques in Omics Research: Common Pitfalls, Misconceptions and Rights and Wrongs. In: Grootveld M (ed). Metabolic Profiling: Disease and Xenobiotics. Royal Society of Chemistry: UK. pp 1-34.
IGNACIO, D.S. (1996). A comparative study on the quality of commercial soy sauces in the Philippines. Unpublished undergraduate thesis – Food Technology. University of the Philippines Los Baños. College, Laguna.
IIZUKA K., AISHIMA T. (1999). Differentiation of soy sauce by pattern recognition analysis of mid- and near-IR spectra. J Food Comp Analysis. 12: 197-209.

Philippine Journal of Agricultural and Biosystems Engineering Vol. 15, No. 2
12
KIKKOMAN. (2014). Kikkoman Flavor Handbook. Available at http://www.kikkoman.com.au/food-manufacturers. Accessed on 27 January 2018.
KINOSHITA E., SUGIMOTO, T., OZAWA, Y., AISHIMA, T. (1998). Differentiation of soy sauce produced from whole soybeans and defatted soybeans by pattern recognition analysis of HPLC profiles. J. Agric. Food Chem. 46, 877-883.
LEE, B.H. (2015). Fundamentals of Food Biotechnology. West Sussex, UK: John Wiley & Sons, Ltd. 544 p.
LIU, K.S. (2012). Soybeans: Chemistry, Technology and Utilization. Boston, USA: Springer. 532 p.
LIU, K. (2015). Food Use of Whole Soybeans. In: L. Johnson, P. White & R. Galloway (ed.). Soybeans: Chemistry, Production, Processing and Utilization. USA: Elsevier Science pp. 465-467.
LIU, F. HE, Y. & WANG, L. (2008). Determination of effective wavelengths for discrimination of fruit vinegars using near infrared spectroscopy and multivariate analysis. Analytica Chimica Acta, 615: 10-17.
MEHMOOD, T., LILAND, K.H., SNIPEN, L. & SAEBO, S. (2012). A review of variable selection methods in partial least squares regression. Chemometrics and Intelligent Lab Sys. 118, 62-69.
MOGHIMI, A., AGHKHANI, M.H., SAZGARNIA, A. & SARMAD, M. (2010). Vis/NIR spectroscopy and chemometrics for the prediction of soluble solids content and acidity (pH) of kiwi fruit. Biosystems Engineering, 106, 295-302.
NATCHA, T. & PANMANAS, S. (2014). Detection of adulteration of soy sauce by brine using near infrared spectroscopy. Agriculture and Agricultural Science Procedia. 2: 212-217.
NICOLAI, B.M., BEULLENS, K., BOBELYN, E. PEIRS, A., SAEYS, W. THERON, K.I. & LAMMERTYN, J. (2007). Nondestructive measurement of fruit and vegetable quality by means of NIR spectroscopy: a review. J Postharv Biol Technol. 46: 99-118.
SANCHEZ, P.C. (2008). Philippine Fermented Foods: Principles and Technology. Quezon City, Philippines: The University of the Philippines Press. 516 p.
SANO, A., SATOH, T., OGUMA, T., NAKATOH, A., SATOH, J. & OHGAWARA, T. (2007). Determination of levulinic acid in soy sauce by liquid chromatography with mass spectrometric detection. J Food Chem. 105: 1242-1247.
SHENK, J.S., WORKMAN JR., J.J., & WESTERHAUS, M.O. (2008). Application of NIR Spectroscopy to Agricultural Products. In D.A. Burns & E.W.Ciurczak (Eds.), Handbook of Near-Infrared Analysis, (3rd ed.). New York: CRC Press, Taylor & Francis Group. pp. 347-386.
TANG C.S., BABICH V. (2014). Using social and economic incentives to discourage Chinese suppliers from product adulteration. Business Horizons. 57: 497-508.
VISCARRA-ROSSEL, R.A. (2007). ParLes: software for chemometric analysis of spectroscopic data. Chemometrics and Intelligent Laboratory Systems, 90, 72-83.
WOLD, S., SJOSTROM, M. & ERIKSSON, L. (2001). PLS-regression: a basic tool of chemometrics. Chemometrics and Intelligent Laboratory System, 58, 109-130.
WORKMAN JR., J. & WEYER, L. (2008). Practical guide to interpretative near-infrared spectroscopy. New York: CRC Press Taylor & Francis Group.
YOKOTSUKA, T. (1986). Soy Sauce Biochemistry. In: C.O. Chichester, E.M. Mrak, & B.S. Schweigert (Eds). Advances in Food Research. Orlando, Florida, USA: Academic Press. pp 195-316.ZHANG W., XUE J. 2016. Economically motivated food fraud and adulteration in China: an analysis based on 1553 media reports. Food Control. 67: 192-198.
ZHU, Y., YANG Y., ZHOU, Z., LI, G., JIANG, M., ZHANG, C., CHEN, S. (2009). Direct determination of free tryptophan contents in soy sauces and its application as an index of soy sauce adulteration. Food Chem. 118, 159-162.