3 Rapid Differentiation of Commercially-Available Soy Sauces ...
Upload
independentCategory
view
1download
0
Value-Added Production of Nisin from Soy Whey
Debjani Mitra & Anthony L. Pometto III &Samir K. Khanal & Bishnu Karki &Byron F. Brehm-Stecher & J. (Hans) van Leeuwen
Received: 25 November 2009 /Accepted: 15 March 2010# Springer Science+Business Media, LLC 2010
Abstract The objective of this study was to evaluate the potential of low/negative valuesoy whey (SW) as an alternative, inexpensive fermentation substrate to culture Lactococcuslactis subsp. lactis for nisin production. Initially, a microtiter plate assay using a BioscreenC Microbiology Plate Reader was used for rapid optimization of culture conditions. Varioustreatments were examined in efforts to optimize nisin production from SW, includingdifferent methods for SW sterilization, ultrasonication of soy flake slurries for possiblenutrient release, comparison of diluted and undiluted SW, and supplementation of SW withnutrients. In subsequent flask-based experiments, dry bacterial mass and nisin yieldsobtained from SW were 2.18 g/L and 619 mg/L, respectively, as compared to 2.17 g/Land 672 mg/L from a complex medium, de Man–Rogosa–Sharpe broth. Ultrasonicationof soybean flake slurries (10% solid content) in water prior to production of SW resultedin ∼2% increase in biomass yields and ∼1% decrease in nisin yields. Nutrient
Appl Biochem BiotechnolDOI 10.1007/s12010-010-8951-y
D. Mitra : J. (. van LeeuwenBiorenewable Resources and Technology Program, Iowa State University, Ames, IA 50011, USA
D. Mitra : B. Karki : B. F. Brehm-Stecher : J. (. van LeeuwenDepartment of Food Science and Human Nutrition, Iowa State University, Ames, IA 50011, USA
D. Mitra : J. (. van Leeuwen (*)Department of Civil, Construction and Environmental Engineering, Iowa State University,476 Town Engineering, Ames, IA 50011, USAe-mail: [email protected]
J. (. van LeeuwenDepartment of Agricultural and Biosystem Engineering, Iowa State University, Ames, IA 50011, USA
A. L. Pometto IIIDepartment of Food Science and Human Nutrition, Clemson University, Clemson,SC 29634-0316, USA
S. K. KhanalDepartment of Molecular Biosciences and Bioengineering, University of Hawaii at Mānoa, Honolulu,HI 96822, USA
D. Mitra : J. (H.) van Leeuwen
D. Mitra : B. Karki : B. F. Brehm-Stecher : J. (H.) van Leeuwen
D. Mitra : J. (H.) van Leeuwen (*)
J. (H.) van Leeuwen
supplementation to SW resulted in ∼3% and ∼7% increase in cell and nisin yields,respectively. This proof-of-concept study demonstrates the potential for use of a low/negative value liquid waste stream from soybean processing for production of a high-value fermentation end product.
Keywords Soy whey . Nisin . Value-added production . Lactococcus lactis . Bioscreen .
Fermentation
Introduction
An increasing demand for natural food preservatives has created a niche market forbacteriocins, which are natural antimicrobial peptides produced by lactic acid bacteria(LAB). Nisin is the only bacteriocin approved by the Food and Drug Administration andcommercially produced by the fermentation of the lactic acid bacterium, Lactococcus lactissubsp. lactis in milk-based media under well-controlled culture conditions [1–3]. Nisin is a34-amino acid peptide with a molecular mass of 3.5 kDa. Nisin occurs naturally in twodifferent forms, nisin A and nisin Z. Nisin Z differs from Nisin A by one amino acidresidue. It contains asparagine at position 27 instead of histidine. The two nisin variantshave identical minimum inhibitory concentrations against most microbes with nisin Zshowing better diffusion ability in agar. Nisin demonstrates wide-spectrum activity againstalmost all Gram-positive bacteria including the food-borne pathogens Listeria mono-cytogenes, Staphylococcus aureus, and Bacillus cereus [4].
The limitations of nisin production are low yields, low product concentrations, and highmedium costs among others [5]. In view of the growing consumer demand for natural foodadditives, there is a great need for more cost-effective means to produce this product. Thus,there has been a rising research trend in exploring the use of food processing waste streamsas low-cost, value-added growth media for nisin production. In the quest for suitablematerials, dairy byproducts have been widely studied [1, 6, 7]. Recent work has alsofocused on the use of nondairy substrates. For example, agricultural wastes such as cullpotato hydrolysate and fermented barley extracts as well as fishery byproducts, includingoctopus and mussel processing wastes, have been examined as possible feedstocks for nisinfermentation [8–11]. In this study, we have evaluated soy whey, a byproduct stream fromthe soybean processing industry for nisin production as substrate for cultivating the strainL. lactis subsp. lactis ATCC 7962. Production of nisin using a readily available andnontoxic plant product such as soy whey may help minimize processing requirements andease barriers in regulatory approval for food use of nisin produced in this way [12]. To ourknowledge, this is the first report on potential usage of soy whey to support L. lactis growthand nisin production.
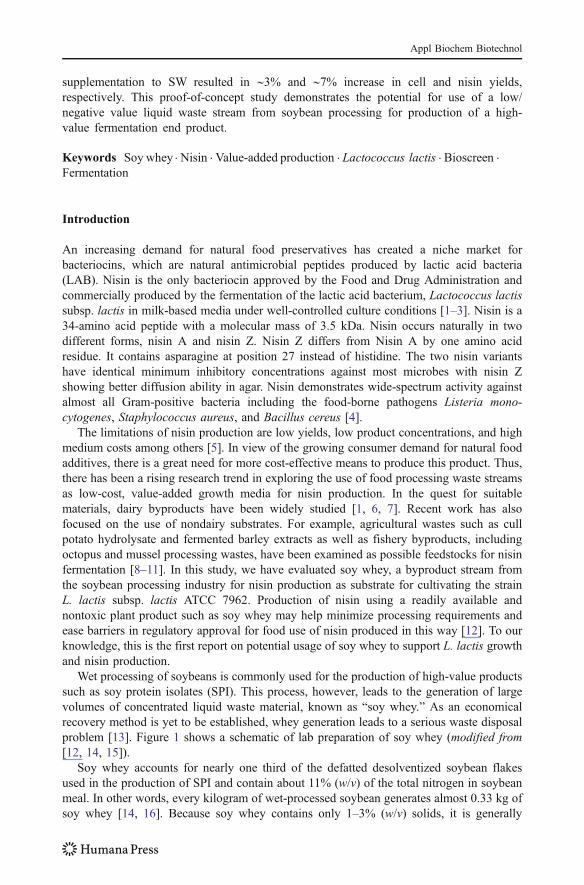
Wet processing of soybeans is commonly used for the production of high-value productssuch as soy protein isolates (SPI). This process, however, leads to the generation of largevolumes of concentrated liquid waste material, known as “soy whey.” As an economicalrecovery method is yet to be established, whey generation leads to a serious waste disposalproblem [13]. Figure 1 shows a schematic of lab preparation of soy whey (modified from[12, 14, 15]).
Soy whey accounts for nearly one third of the defatted desolventized soybean flakesused in the production of SPI and contain about 11% (w/v) of the total nitrogen in soybeanmeal. In other words, every kilogram of wet-processed soybean generates almost 0.33 kg ofsoy whey [14, 16]. Because soy whey contains only 1–3% (w/v) solids, it is generally
Appl Biochem Biotechnol

considered too dilute for economical recovery of the whey solids [14, 17]. Smith et al. [18]showed that soy whey solids content and composition depend on origin of the soybeanmeal and method of whey preparation. On a dry basis, soy whey typically contains 3.6–4.4% nitrogen (50% of which is protein nitrogen) and 25–35% soluble sugars like sucrose,raffinose, and stachyose, various glycosides, galactans, and hemicelluloses [14]. Substantialamounts of phosphorus and minerals, largely as phytate salts and numerous trace elementsessential for microbial fermentation of fastidious LAB, are also present in soy whey[14, 18]. Because of its inherent nitrogen content, soluble sugar levels and high chemicaloxygen demand content (25,000 mg/L), soy whey poses a burden on the environment ifdisposed of untreated. Although it is generally considered a waste product, wehypothesized that the high-nutrient content of soy whey could enable its value-addeduse as a substrate for microbial fermentation. Specifically, we sought to investigate theuse of soy whey as a fermentation feedstock for the production of the high-value foodpreservative nisin. The goals of this study were (a) evaluation of soy whey as a substratefor LAB growth and subsequent nisin production, (b) optimization of soy whey mediumand fermentation parameters, and (c) comparison of the biomass and nisin yields obtainedfrom soy whey to de Man–Rogosa–Sharpe (MRS) broth (Difco Laboratories), anutritionally rich complex growth medium.
* This step was performed only in some experiments (potential effects of ultrasonic pretreatment on growthand nisin production).
Acid precipitation (pH 4.5, 2N HCl)
Alkaline extraction (2N NaOH, pH9, 60˚C)
Insoluble residue
Soy protein isolate
Extract
Adjustment of pH to 6.8-6.9
Flask studies for optimization of nisin production parameters
*Pretreatment with ultrasonication
Soy Whey
Bioscreen studies for optimization of cell growth parameters
Defatted soybean flakes added to water in 1:10 ratio
Testing effect of: Dilution of soy whey Sterilization method Nutrient supplementation to undiluted and diluted soy whey
Testing effect of: Ultrasonication of soy flake suspension Dilution of soy whey Sterilization method Nutrient supplementation
•••
•
•••
Fig. 1 Lab preparation of soy whey (modified from [12, 17, 23]) and experimental outline for its use as agrowth medium for L. lactis subsp. lactis ATCC 7962
Appl Biochem Biotechnol

Materials and Methods
Microorganisms and Media L. lactis subsp. lactis ATCC 7962 (nisin producer) andMicrococcus luteus ATCC 10240 (nisin indicator strain) were acquired from the AmericanType Culture Collection (ATCC, Manassas, VA, USA). They were maintained asfrozen stocks at −75 °C in MRS or nutrient broth (Difco Laboratories, Lawrence, KS,USA) media, respectively, containing 20% (v/v) glycerol. Working cultures of L. lactisand M. luteus were maintained as slants on MRS and nutrient agar at 4 °C, respectively.
Soy Whey Preparation and Partial Characterization Commercially available soybeanflakes (Cargill, Inc., Cedar Rapids, IA) were obtained from the Center for CropsUtilization Research (CCUR) at Iowa State University, Ames, IA. Soy flakes werepacked in air-tight plastic bags and stored at 4 °C until further use. According toanalyses provided by the manufacturer, these flakes contained 57.3% (dry basis) crudeprotein and had a protein dispersibility index of 93.8. A method for lab-scaleproduction of soy whey from hexane-defatted, desolventized dry soybean flakes wasdeveloped, yielding a final product with properties similar to soy whey generatedthrough commercial-scale wet milling of soy beans. Briefly, ground and defattedsoybean flakes (50 g) were mixed in a 1:10 ratio (w/v) with tap water [19]. The pH wasraised to 8.5 with 2 N NaOH, and the resulting slurry was stirred for 30 min at 60 °C.After centrifugation at 10,000×g (20 min, 4 °C), the supernatant was collected. The watersoluble proteins in the supernatant were precipitated by lowering the pH to 4.5 withaddition of 2 N HCl. The slurry was kept at 4 °C for ∼4 h and was again centrifuged at10,000×g for 20 min at 4 °C. The supernatant (soy whey) was collected; the pH wasadjusted to 6.8–6.9, and after sterilization, it was ready to be used as a growth medium.Use of this lab-scale method for production of soy whey yielded a reproducible substratefor our proof-of-concept studies.
The soy whey produced in this manner was characterized for its total nitrogen andprotein content, as well as its sugar composition. Total nitrogen content was estimated usingthe Dumas nitrogen combustion method [1] with an Elementar Vario MAX CN analyzer(Elementar Analysensysteme GmbH, Hanau, Germany) and was found to be 1,210 mg/L,and after multiplying by conversion factor 6.25, the crude protein content was calculated tobe 7,575 mg/L. Whey sugars were analyzed using a Varian high-performance liquidchromatograph (HPLC) with a Bio-Rad HPX-87P column for carbohydrates, a guardcolumn, and equipped with a Varian’s refractive index (RI) detector. The sample volumewas 20 µl, eluant used was filtered (Millipore nylon membrane filter, pore size 0.2 µm), anddegassed HPLC grade water at a flow rate of 0.6 ml/min. The column temperature was 85 °C,and run time was 22 min. Standards used were glucose, galactose, fructose, sucrose, stachyose,and raffinose prepared at a concentration of 5 mg/ml in mili-Q water. The soy whey was foundto contain 7.14 mg/ml sucrose, 6.56 mg/ml stachyose, 0.84 mg/ml galactose, and 0.74 mg/mlglucose.
Inoculum Preparation In preparation for its use as a microbial growth substrate, the pH ofthe whey was adjusted from 4.4–4.7 to 6.8–7.0, and the whey was sterilized via heat (121 °C for15 min) or filtration (0.2 µm nylon filter). Inocula for batch fermentation were prepared byadding 1 ml of culture stock (109 CFU/ml) to 10 ml of sterilized soy whey and incubating at28 °C for 10 h under stationary conditions. Additional dilution was performed as needed toobtain a final cell concentration of 109 CFU/ml, equivalent to an absorbance of 0.45 at600 nm (Abs600).
Appl Biochem Biotechnol

Batch Fermentation Batch fermentations were carried out in 250-ml Erlenmeyer flaskscontaining a final volume of 100 ml of soy whey. A 10% (v/v) inoculum was added to theflasks to obtain a cell density of 108 CFU/ml, and flasks were incubated at 28 °C for 48 h. Allsoy whey batch fermentations were carried out under static conditions. At regular timeintervals during the fermentation, samples were taken and pH, cell density (Abs600), totalsugars, total soluble proteins, lactic acid, acetic acid, and bacteriocin concentration weremeasured. For comparison, parallel batch fermentations were carried out in MRS broth usinggrowth conditions identical to those used for soy whey. All batch fermentations and analyticaldeterminations were performed in triplicate. Between 1 and 3 ml of sample was removed foranalysis at each sampling time, depending on which analytical tests were performed.
Microtiter Plate Rapid Bioassay A Bioscreen C Microbiology Reader (Growth Curves,Inc., Piscataway, NJ) was used to rapidly determine the effect of various culture parameterson bacterial growth, assuming a positive correlation between cell growth and nisinproduction. The Bioscreen instrument is a combined incubator and microplate reader thatenables collection of high-resolution optical density data for up to 200 individual wells(well capacity 400 µl). Plates can be incubated at temperatures ranging from ambient to60 °C, and automated optical density readings of individual wells can be taken at discreteintervals to yield detailed growth curves useful in process optimization. Growth medium(200 µl) and inoculum (50 µl) were added to individual wells to yield a final cell density ineach well of 108 CFU/ml or Abs600=0.17. Inoculated plates were placed in the Bioscreenand incubated for up to 24 h at 28 °C. Abs600 was recorded at 30-min intervals withautomatic shaking for 5 s before each reading to ensure proper mixing of well contents. Alltreatments were evaluated in replicates of five (n=5).
Analytical Procedures
Biomass Yields A standard curve was derived by plotting cell dry weight (CDW)measurements (grams per liter) against corresponding spectrophotometric Abs600 readings(Spectronic 20 Genesys, Thermo Electron, Cambridge, UK). CDW was measured byharvesting the cells of known Abs600 by centrifugation (12,000×g for 15 min at 4 °C),washing twice with sterile saline (0.85% (w/v) NaCl) and drying to a constant weight at80 °C. A regression equation was obtained for CDW as a function of Abs600. A correlationcoefficient of 0.9955 was derived for the best-fit regression line for the CDW–Abs600curve. During fermentation, absorbance readings of samples were converted into equivalentCDW values (grams per liter) using this standard curve and plotted against time (hours) toobtain growth–time curves.
Determination of Sugars, Proteins, and Fermentation End Products After removal of thebacterial cells from the culture broth by centrifugation (12,000×g, 15 min, 4 °C), theculture supernatants were tested for total sugars by the phenol–sulfuric acid method ofStrickland et al.[20], with glucose as the standard. The total soluble proteins were measuredby Lowry’s method [21], with bovine serum albumin (Sigma, St. Louis, MO, USA) as thestandard. The sugar and protein contents were determined spectrophotometrically at 490and 750 nm, respectively. Lactic acid and acetic acid concentrations were measured using aWaters HPLC (Millipore Corporation, Milford, MA, USA) equipped with a Waters Model401 RI detector, column heater, auto-sampler, and computer controller. A Bio-Rad AminexHPX-87H column (300×7.8 mm; Bio-Rad Chemical Division, Richmond, CA, USA) was
Appl Biochem Biotechnol

used with 0.012 N sulfuric acid as the mobile phase with a flow rate of 0.8 ml/min,injection volume of 20 µl, and a column temperature of 65 °C. All measurements wereperformed in triplicate (n=3).
Nisin Quantification The nisin titer in the fermentation broth samples was determined bythe method of Tramer and Fowler [22], with the modifications of Wolf et al. [15]. Thevolume of the fermentate present in individual Bioscreen wells was too low to allowaccurate manipulation of the sample needed to determine nisin titer. Therefore, nisin titerwas determined only for samples prepared using Erlenmeyer flasks. Briefly, fermentationbroth samples from flasks were adjusted to pH 2.0 with dropwise addition of 2 N HCl. Thiswas done to release nisin bound to producer cell surfaces to facilitate measurement of cell-associated nisin. Samples were then heated at 90 °C for 5 min to inactivate any interferingproteases in the medium without affecting nisin, which is thermostable at acidic pH. Aftercentrifugation at 4,000×g for 10 min at 4 °C, the clear, nisin-containing supernatant (nisinextract) was neutralized in order to eliminate erroneous inhibition zones resulting from lowpH. Nisin concentration was determined by agar well diffusion bioassay [22, 23] usingM. luteus as the indicator strain. Briefly, nutrient agar (NA) overlays containing aconcentration of 108 CFU/ml M. luteus were poured over NA base plates and allowed toharden, and wells were bored in the agar aseptically using a sterile stainless steel borer(5 mm inner diameter). One hundred microliter aliquots of nisin extract were added toindividual agar wells, and the plates were incubated overnight at 37 °C. The diameter ofresulting zones of inhibition around each well were measured horizontally and verticallyto the nearest 0.01 mm using a digital caliper (Digimatic caliper, Mitutoyo, Kanagawa,Japan) and the average value recorded. These values were used to determine the nisinconcentration from the standard curve (below). Each zone of inhibition determinationrepresented the average of three replicate wells.
Standard Curve The commercial nisin used here (Nisaplin, Sigma Chemical Co., St. Louis,MO), was reported to contain 1×10⁶ IU/g. A stock solution of this nisin preparation at1,000 IU/ml was made using sterile 0.02 N HCl. This stock solution was diluted further asneeded in sterile 0.02 N HCl, neutralized, and a standard curve relating zone size to nisinconcentration was prepared by plotting inhibition zones versus known units of activity (IU).The regression equation obtained for inhibition zone diameter as an exponential function ofnisin concentration: Y (log nisin conc.)=0.1515 × (zone diameter)−3.9467, resulted in acorrelation coefficient of 0.989. Nisin concentrations (in milligrams per liter) in test sampleswere estimated from inhibition zone measurements using this standard curve.
Optimization of Fermentation Parameters
Several different pre-fermentation treatments were examined for their impact on cell growth andnisin production in an effort to optimize our results. Factors examined included differentmethods of soy whey sterilization, physical treatment (sonication) of defatted soy flakes forpossible enhanced nutrient release, the use of diluted vs. undiluted soy whey and micronutrientsupplementation of diluted or full strength soy whey. These treatments are described below.
Soy Whey Sterilization Four methods for soy whey sterilization were evaluated todetermine the procedure with the minimal impact on nutrient bioavailability as determinedby microbial growth and nisin production. The first method tested was membrane filtration
Appl Biochem Biotechnol

using a Millipore nylon membrane filter of pore size 0.2 µm (Millipore Corp. Billerica,MA, USA). The second method was heat sterilization at 121 °C for 15 min. In the thirdmethod, heat sterilization at 121 °C for 15 min was followed by centrifugation at 5,000×gfor 15 min at 20 °C to remove precipitated materials. In the fourth method, soy whey wasfilter-sterilized followed by heat sterilization and centrifugation as described above. Filteredand autoclaved soy whey mixed in different proportions was also examined. Heat-sterilizedMRS was used as control. Cell growth and nisin production were monitored and measured atregular time intervals in the Bioscreen as well as flask level. Table 1 gives the nomenclatureused in this paper to describe these different preparations of the soy whey media.
Pretreatment of Soybean Flake Suspension by Ultrasonication The impact of high-powerultrasound on sugar and protein release from soybean flakes [24, 25] and subsequentbiomass and nisin yields from soy whey made with sonicated flakes was investigated.Defatted soy flakes (10 g) were dispersed into 100 ml of tap water in a glass beaker. Thebatch experiment was conducted in a Branson 2000 series bench-scale ultrasonic unit(Branson Ultrasonics, Danbury, CT) with a maximum output of 2.2 kW. A standard 20-kHzhalf wavelength titanium horn with a gain of 1:8 and a booster with a gain of 1:1.5 wereused. Samples were sonicated at amplitudes 60 and 192 µmpp (peak to peak amplitude inµm) for 15 and 120 s. Soy whey was prepared from the sonicated soybean flakessuspension by the aqueous alkaline method summarized in Fig. 1. Whey prepared fromnon-sonicated defatted soy flakes was used as a control. All whey samples were filtersterilized and characterized for protein and sugar contents and tested for their ability tosupport cell growth and bacteriocin production in batch fermentation studies.
Soy Whey Dilution Three different dilutions of 10%, 50%, and 80% (v/v) of Medium FW(Table 1) were prepared with sterile-distilled water in 250-ml Erlenmeyer flasks. UndilutedMedium FW was used as a positive control. All flasks were inoculated as described earlier,and samples taken aseptically were tested for cell growth and nisin concentration and theyields were compared.
Table 1 Nomenclature of soy whey media used.
Soy whey media Composition
Medium FW Filter sterilized (0.2 µm nylon membrane) soy whey
Medium AW Autoclaved (121 °C for 15 min) soy whey
Medium ACW Autoclaved and centrifuged (5,000×g for 15 min at 20 °C)soy whey
Medium FACW Filtered, autoclaved, and centrifuged soy whey
Medium 1:1 1:1 Filtered/autoclaved and centrifuged soy whey
Medium 3:7 3:7 Filtered/autoclaved and centrifuged soy whey
Medium SFW Soy whey with nutrient supplementation (FW+2% (w/v)sucrose+0.5% (w/v) KH2PO4+0.01% (w/v) MgSO4
.7H2O+0.1%(w/v) NaCl+0.01% (w/v) yeast extract (Difco))
Medium DFW 4-fold diluted Medium FW
Medium DFW-ss Diluted soy whey with sucrose supplementation (4-fold dilutedFW+2% (w/v) sucrose)
Medium DFW-ns Diluted soy whey with nutrient supplementation (4-fold dilutedFW+2% (w/v) sucrose+0.5% (w/v) KH2PO4+0.01% (w/v)MgSO4
.7H2O+0.1% (w/v) NaCl+0.01% (w/v) yeast extract)
Appl Biochem Biotechnol

Supplementation of Diluted Soy Whey The effect of carbon source supplementation todiluted soy whey (Medium DFW-ss) was compared to micronutrients supplementation(Medium DFW-ns), and cell yields were calculated from Bioscreen absorbance data. It wasfound from previous experiments that 4-fold dilution of Medium FW (Medium DFW)could support growth; hence, in this experiment, supplementation was done in MediumDFW. Unsupplemented Medium DFW and Medium FW were used as controls.
Supplementation of Soy Whey In order to evaluate the potential of enhancing nisin activityby external nutrient supplementation, different micronutrients (sucrose, NaCl, KH2PO4,Yeast Extract, MgSO4) were added to Medium FW in defined amounts [25], and theirindividual as well as combined effects were studied in the Bioscreen. UnsupplementedMedium FW was used as the control.
Comparative Study with Lactobacillus casei To examine whether nisin activity was the solecause of the inhibition zones observed for L. lactis grown on soy whey, a comparative studyusing a modified agar overlay method [26] was done using L. casei ATCC 7469, ahomofermentative LAB that produces lactic acid but not nisin. Briefly, a colony of eachorganism was grown on MRS agar, a nutrient agar overlay containing 108 CFU/ml of theM. luteus indicator strain was poured over the colonies. These plates were incubatedovernight at 37 °C, zones of inhibition in the overlay resulting from the production ofinhibitory substances by the L. lactis or L. casei colonies were measured and additionaltesting was performed as needed to characterize the nature of any inhibition phenomenaobserved (see “Results and Discussion”).
Statistical Analysis The significant difference between results obtained from differenttreatments was evaluated and analyzed by the Method of Derived Variables [27]. Alogistic growth model was fitted to the time profile of each well, using nonlinear leastsquares. Using this fit, the entire time profile for each well was reduced to one numberdenoted by the letter, “a,” which can be scientifically interpreted as the limit of bacterialgrowth over time. All pairwise treatment comparisons were done using the WilcoxonRank Sum Test. The p value was derived after comparison of the mean “a” values foreach experimental sample. The p value was calculated for every experimental sample incomparison with the others. A p value <0.01 indicated statistically significant differentmean values of “a” for the two samples. Samples having higher “a” values were thenjudged to represent the optimal condition or treatment under investigation. Theperformance of different media was statistically analyzed, and the ones havingstatistically significant differences in their performance were further selected to identifythe best culture growth condition.
Results and Discussion
Sterilization Method The sterilization method of soy whey played an important role on thegrowth rate of L. lactis in soy whey. The combined treatment of filtration, followed byautoclaving and centrifugation (Medium FACW) resulted in a significantly higher (p<0.01)growth of L. lactis while the autoclaved soy whey medium AW resulted in a significantlylower growth (p<0.01) of L. lactis as compared to MRS. This is summarized in Table 2 andFigs. 2a and 3.
Appl Biochem Biotechnol

It is possible that heat sterilization led to a loss of proteins from the whey via denaturationand precipitation. If so, then Medium ACW would likely be nitrogen deficient, whichnegatively impacted cell yields (Table 2). However, Medium ACW also supported thehighest nisin production of all the soy media examined. Soy is known to contain proteaseinhibitors [28, 29]. Posttranslational modification of pre-nisin to nisin requires the action ofproteases. It is, therefore, possible that heat denaturation of endogenous soy proteaseinhibitors could have played a role in the higher nisin activity observed in Medium ACW,as proteases responsible for activating nisin would have remained active. This observationwas further supported by the fact that equal proportions of filtered soy whey and autoclavedsoy whey in Medium 1:1 gave a nisin yield which was almost midway between thatobtained separately from filtered soy whey and autoclaved soy whey. Medium 3:7 whichhad an increased percentage of autoclaved soy whey, showed an increased nisin yield butlower cell density than Medium 1:1 (Table 2).
We found that growth of L. lactis in soy whey differed from that previously reported forcheese whey [30]. Specifically, we found the nisin yield from soy whey was growth-independent. Among the soy whey media tested, Medium FACW led to the highest growthrate (253.86 mg/L/h) and biomass yield (2.18 g/L), while Medium ACW yielded the highestnisin activity (24,767 IU/ml, corresponding to a nisin concentration of 619.2 mg/L).Overall, MRS gave the highest nisin concentration (672.8 mg/L). However, Medium ACWresulted in a higher production rate for nisin, after an initial lag from 0–12 h (Table 2).
A similar decoupling of nisin and cell biomass production has been reported by othergroups. For example, Vásquez et al. [10] found higher nisin yields under conditions
Table 2 Biomass and nisin yields from soy whey sterilized by different methods in static culture flaskstudies (n=3).
Soy wheymedia
Biomass yield Nisin yield
Maximumabsorbanceat 600 nm
Maximumbiomassyield (mg/L)
Maximumgrowth rateb
(mg/L/h)
Maximumnisin activity(IU/mL)
Maximumnisinconcentration(mg/L)
Maximum nisinproduction ratec
(mg/L/h)
FW 1.03 2,151.3 218.13 23,230 580.75 53.44
AW 0.71 2,112.4 176.03 1,192 29.79 1.98
ACW 1.12 2,141.5 308.79 24,767 619.16a 72.58a
FACW 1.32 2,183.2a 253.86a 23,740 593.49 63.26
1:1-FW:ACW 1.01 2,144.0 252.24 23,988 599.7 61.24
3:7-FW:ACW 0.81 2,122.2 282.96 24,114 602.85 67.84
MRS 1.2 2,174.8 217.48 26,912 672.81a 57.75a
25%,15 s 1.23 2,175.95 217.59 23,886 597.15 54.29
25%, 120 s 1.24 2,177.37 217.74 24,279.2 606.98 55.18
100%, 15 s 1.17 2,168.10 216.81 24,248 606.20 55.11
100%, 120 s 1.22 2,174.01 217.40 24,339.6 608.49 55.32
a Highest yields/rates of biomass/nisin production in the groupbMaximum growth rate was determined by calculating the growth rates over constant time intervals duringlog phase of growth curve and selecting the highestc Maximum nisin production rate was determined by calculating the nisin production rates over constant timeintervals during entire growth curve and selecting the highest
Appl Biochem Biotechnol

conducive to lower cell growth. There is some controversy as to whether nisin should beconsidered a primary or a secondary metabolite [5, 30–33]. Difficulties in making directcorrelations between cell growth rate and nisin production may stem from crypticphenomena such as adsorption of the bacteriocins onto cell surfaces and/or theposttranslational processing of the prepeptides to active forms [9]. Additional media-specific variables (pH, nutrient availability, etc.) may also play a role in bacteriocinsynthesis and further confound efforts at direct correlation between growth and nisinproduction [2, 34–36].
A clear link between the nutrient content of media in which L. lactis is grown and finalnisin concentration has been established [37, 38]. With this in mind, it was interesting tonote that the average biomass yield from the soy whey media tested (average for all
0 22 4 2 84 2 8 10 12 14 16 18 20 222.06
2.08
2.10
2.12
2.14
2.16
2.18
2.20
0 2 4 6 8 10 12 14 16 18 20 22
2.04
2.06
2.08
2.10
2.12
2.14
2.16
2.18
2.20
2.22
0 10 12 14 16 18 20 22
2.04
2.06
2.08
2.10
2.12
2.14
2.16
2.18
2.20
b
Time (h)
Cel
l yie
ld (
g/L)
Cel
l yie
ld (
g/L)
Time(h)
c
Time (h)
a
Cel
l yie
ld (
g/L)
Fig. 2 Time course of growth of L. lactis subsp. lactis ATCC 7962 in soy whey media under differentconditions using the Bioscreen C Microbiological Reader. a Soy whey sterilized by different methods ascompared to standard MRS medium: filled circles MRS, filled squares Medium FW, unfilled trianglesMedium ACW, solid line Medium AW, unfilled squares Medium FACW; (n=5). b Medium FW diluted todifferent levels as compared to original Medium FW: filled triangles 10% or 10-fold diluted Medium FW,unfilled diamonds 50% or 2-fold diluted Medium FW, filled diamonds 80% or 1.25-fold diluted Medium FW,filled squares undiluted Medium FW; (n=5). c Soy whey supplemented with nutrients as compared tounsupplemented soy whey and MRS: asterisks Medium SFW, filled squares Medium FW, (filled circles)MRS; (n=5)
Appl Biochem Biotechnol
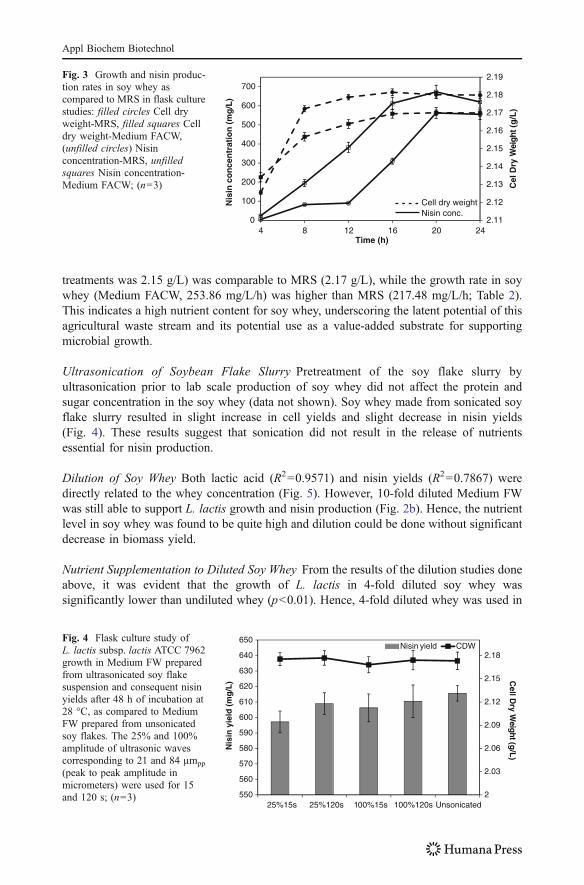
treatments was 2.15 g/L) was comparable to MRS (2.17 g/L), while the growth rate in soywhey (Medium FACW, 253.86 mg/L/h) was higher than MRS (217.48 mg/L/h; Table 2).This indicates a high nutrient content for soy whey, underscoring the latent potential of thisagricultural waste stream and its potential use as a value-added substrate for supportingmicrobial growth.
Ultrasonication of Soybean Flake Slurry Pretreatment of the soy flake slurry byultrasonication prior to lab scale production of soy whey did not affect the protein andsugar concentration in the soy whey (data not shown). Soy whey made from sonicated soyflake slurry resulted in slight increase in cell yields and slight decrease in nisin yields(Fig. 4). These results suggest that sonication did not result in the release of nutrientsessential for nisin production.
Dilution of Soy Whey Both lactic acid (R2=0.9571) and nisin yields (R2=0.7867) weredirectly related to the whey concentration (Fig. 5). However, 10-fold diluted Medium FWwas still able to support L. lactis growth and nisin production (Fig. 2b). Hence, the nutrientlevel in soy whey was found to be quite high and dilution could be done without significantdecrease in biomass yield.
Nutrient Supplementation to Diluted Soy Whey From the results of the dilution studies doneabove, it was evident that the growth of L. lactis in 4-fold diluted soy whey wassignificantly lower than undiluted whey (p<0.01). Hence, 4-fold diluted whey was used in
2.11
2.12
2.13
2.14
2.15
2.16
2.17
2.18
2.19
0
100
200
300
400
500
600
700
4 8 12 16 20
Cell dry weightNisin conc.
24
Cel
Dry
Wei
ght (
g/L
)
Nis
in c
on
cen
trat
ion
(m
g/L
)Time (h)
Fig. 3 Growth and nisin produc-tion rates in soy whey ascompared to MRS in flask culturestudies: filled circles Cell dryweight-MRS, filled squares Celldry weight-Medium FACW,(unfilled circles) Nisinconcentration-MRS, unfilledsquares Nisin concentration-Medium FACW; (n=3)
2
2.03
2.06
2.09
2.12
2.15
2.18
550
560
570
580
590
600
610
620
630
640
650
25%15s 25%120s 100%15s 100%120s Unsonicated
Cell D
ry Weight (g
/L)
Nis
in y
ield
(m
g/L
)
Nisin yield CDWFig. 4 Flask culture study ofL. lactis subsp. lactis ATCC 7962growth in Medium FW preparedfrom ultrasonicated soy flakesuspension and consequent nisinyields after 48 h of incubation at28 °C, as compared to MediumFW prepared from unsonicatedsoy flakes. The 25% and 100%amplitude of ultrasonic wavescorresponding to 21 and 84 µmpp
(peak to peak amplitude inmicrometers) were used for 15and 120 s; (n=3)
Appl Biochem Biotechnol

this test to examine the effect of nutrient supplementation on L. lactis growth and nisinyields. Supplementation of diluted soy whey with sucrose as a carbon source (MediumDFW-ss) did not lead to a significant increase in biomass yield vis-à-vis unsupplemented,diluted soy whey (p>0.01), whereas supplementation with nitrogen and phosphorus sources(Medium DFW-ns) led to a significant increase in growth (p<0.01; data not shown).Interestingly, Medium DFW-ns was almost as efficient as undiluted soy whey in its abilityto support bacterial growth. This suggests that the growth-limiting nutrient in soy whey isnot the carbon source.
Nutrient Supplementation to Undiluted Soy Whey When sucrose, KH2PO4, MgSO4.7H2O,
NaCl, and yeast extract were individually supplemented to Medium FW, significantincrease (p<0.01) in biomass yield was observed in almost every case (data not shown).Among the nutrients, KH2PO4 proved to be the most effective growth promoter/supplement. Our hypothesis is that KH2PO4 acts as a growth promoter in soy whey bysupplying phosphorus, as supported by Liu et al. [30]. Soybeans do contain phosphorus, butthe primary source of phosphorus in soy is phytate which is in a biologically unavailableform [39].
Biomass yield from Medium SFW was significantly higher than Medium FW and MRSboth (p<0.01; Fig. 2c, Table 3). Thus, this indicated that addition of small amounts ofmainly a phosphorus source could greatly increase L. lactis growth in soy whey.
As determined via HPLC, lactic acid production in soy whey during L. lactis growth wasseen to rise slightly with nutrient supplementation, paralleling our observation of increasedbiomass yield in supplemented whey treatments. Growth of L. lactis was seen to reach astationary phase before the complete depletion of sugars in the whey (Fig. 6). There couldbe two possible explanations to this observation; either the growth-limiting nutrient in soywhey was not the carbon source, or L. lactis grew and exhausted the simple sugars in the
0
1
2
3
4
5
6
7
10% FW 50% FW 80% FW Undiluted FWL
acti
c &
ace
tic
acid
s (g
/L)
0
100
200
300
400
500
600
700
Nis
in y
ield
(m
g/L
)
Lactic acid yield (g/L)Acetic acid yield (g/L)Nisin Yield (mg/L)
Fig. 5 Flask culture study oflactic acid, acetic acid, and nisinyields after 24 h of growth ofL. lactis subsp. lactis ATCC 7962in Medium FW at differentdilution levels; (n=3)
Table 3 Cell yields of L. lactis subsp. lactis ATCC 7962 and nisin production when grown on MRS,supplemented soy whey (Medium SFW) or unsupplemented soy whey (Medium FW); (n=3).
Media Maximum nisinactivity(IU/ml)
Maximum nisinconcentration(mg/L)
Maximumabsorbanceat 600 nm
Maximumbiomassyield (mg/L)
Medium FW 23,230 580.80 1.03 2,151.3
Medium SFW 24,858 621.46 1.5 2,211.2
MRS 26,912 672.81 1.2 2,174.8
Appl Biochem Biotechnol
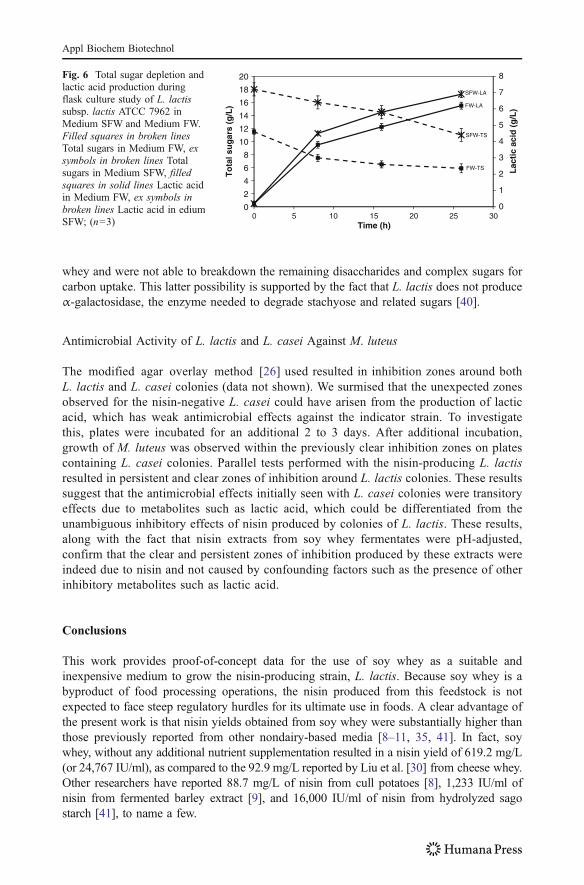
whey and were not able to breakdown the remaining disaccharides and complex sugars forcarbon uptake. This latter possibility is supported by the fact that L. lactis does not produceα-galactosidase, the enzyme needed to degrade stachyose and related sugars [40].
Antimicrobial Activity of L. lactis and L. casei Against M. luteus
The modified agar overlay method [26] used resulted in inhibition zones around bothL. lactis and L. casei colonies (data not shown). We surmised that the unexpected zonesobserved for the nisin-negative L. casei could have arisen from the production of lacticacid, which has weak antimicrobial effects against the indicator strain. To investigatethis, plates were incubated for an additional 2 to 3 days. After additional incubation,growth of M. luteus was observed within the previously clear inhibition zones on platescontaining L. casei colonies. Parallel tests performed with the nisin-producing L. lactisresulted in persistent and clear zones of inhibition around L. lactis colonies. These resultssuggest that the antimicrobial effects initially seen with L. casei colonies were transitoryeffects due to metabolites such as lactic acid, which could be differentiated from theunambiguous inhibitory effects of nisin produced by colonies of L. lactis. These results,along with the fact that nisin extracts from soy whey fermentates were pH-adjusted,confirm that the clear and persistent zones of inhibition produced by these extracts wereindeed due to nisin and not caused by confounding factors such as the presence of otherinhibitory metabolites such as lactic acid.
Conclusions
This work provides proof-of-concept data for the use of soy whey as a suitable andinexpensive medium to grow the nisin-producing strain, L. lactis. Because soy whey is abyproduct of food processing operations, the nisin produced from this feedstock is notexpected to face steep regulatory hurdles for its ultimate use in foods. A clear advantage ofthe present work is that nisin yields obtained from soy whey were substantially higher thanthose previously reported from other nondairy-based media [8–11, 35, 41]. In fact, soywhey, without any additional nutrient supplementation resulted in a nisin yield of 619.2 mg/L(or 24,767 IU/ml), as compared to the 92.9 mg/L reported by Liu et al. [30] from cheese whey.Other researchers have reported 88.7 mg/L of nisin from cull potatoes [8], 1,233 IU/ml ofnisin from fermented barley extract [9], and 16,000 IU/ml of nisin from hydrolyzed sagostarch [41], to name a few.
0
1
2
3
4
5
6
7
8
0
2
4
6
8
10
12
14
16
18
20
0 5 10 15 20 25 30
Lac
tic
acid
(g
/L)
To
tal s
ug
ars
(g/L
)Time (h)
FW-TS
FW-LA
SFW-LA
SFW-TS
Fig. 6 Total sugar depletion andlactic acid production duringflask culture study of L. lactissubsp. lactis ATCC 7962 inMedium SFW and Medium FW.Filled squares in broken linesTotal sugars in Medium FW, exsymbols in broken lines Totalsugars in Medium SFW, filledsquares in solid lines Lactic acidin Medium FW, ex symbols inbroken lines Lactic acid in ediumSFW; (n=3)
Appl Biochem Biotechnol

The ability to efficiently produce nisin using value-added agricultural waste materialssuch as soy whey may facilitate wider use of this once cost-restrictive antimicrobial. In thesimplest example, the entire fermentate containing the soy whey, L. lactis and nisin couldbe concentrated and dried and used as a shelf life extender in foods or also as a value-addedanimal feed additive. Depending on the processes used, this product could potentially haveboth probiotic and antimicrobial properties due to the presence of viable L. lactis and nisin,respectively.
In summary, we have demonstrated the successful use of soy whey, a soy-processingwaste material, for fermentation of L. lactis and subsequent high-yield production of nisin.Our ability to use this readily available and inexpensive agricultural byproduct as a base forfermentative production of nisin suggests the possibility for more cost-effective, sustainableproduction of nisin, which is currently produced using higher cost milk-based materials.Based on the strengths of this study, future work should be performed, focusing on the useof commercial waste soy whey and on scaled-up production of soy-fermented nisin toindustrially relevant levels. Additional monitoring of L. lactis gene expression (nisP) duringgrowth on soy whey could also enable us to more fully characterize this substrate as amedium for nisin production.
Acknowledgement The authors wish to thank the Iowa Biotechnology Byproducts Consortium and IowaState University, Institute for Food Safety and Security (IFSS) for financial support. We also extend ourthanks to the CCUR at Iowa State University, Adam Pintar for help with statistical analysis, Stephanie Jung,Devin Maurer, Steve Fox, Ilankovan Paraman, Supriyo Das and Carol Ziel for experimental and analyticalassistance. The defatted soy flakes were kindly provided by Cargill through CCUR.
References
1. Guerra, N. P., & Pastrana, L. (2003). Letters in Applied Microbiology, 37(1), 51–55.2. Parente, E., & Ricciardi, A. (1999). Applied Microbiology Biotechnology, 52, 628–638.3. Pongtharangkul, T., & Demirci, A. (2005). Biotechnological Progress, 22(1), 217–224.4. Cleveland, J., Chikindas, M., & Montville, T. J. (2002). Industrial Microbiology & Biotechnology, 29,
228–232.5. Vuyst, L., & Vandamme, E. J. (1993). Applied Microbiology Biotechnology, 40(1), 17–22.6. Arauz, L. J. D., Jozala, A. F., Mazzola, P. G., & Penna, T. C. V. (2009). Trends in Food Science&
Technology, 20(3–4), 146–154.7. Jozala, A. F., Andrade, M. S., Arauz, L. J., Pessoa, A., Jr., & Penna, T. C. V. (2007). Applied
Biochemistry Biotechnology, 136–140, 515–528.8. Liu, C., Liu, Y., & Chen, S. (2005). Applied Biochemistry Biotechnology, 121–124, 475–484.9. Furuta, Y., Maruoka, N., Nakamura, A., Omori, T., & Sonomoto, K. (2008). Bioscience Bioengineering,
106(4), 393–397.10. Vásquez, J. A., González, M. P., & Murado, M. A. (2006). Bioresource Technology, 97, 605–613.11. Guerra, N. P., Agrasar, A. T., Macías, C. L., Bernárdez, P. F., & Castro, L. P. (2007). Food Engineering,
82, 103–113.12. Davidson, P. M., & Branen, A. L. (2005). Food antimicrobials – An introduction (3rd ed., p. 2). New
York: CRC.13. Smith, A. K., Nash, A. M., Eldridge, A. C., & Wolf, W. J. (1962). Agricultural & Food Chemistry, 10(4),
302–304.14. Falanghe, H., Smith, A. K., & Rackis, J. J. (1964). Applied Microbiology, 12(4), 330–334.15. Wolf, C. E., & Gibbons, W. R. (1996). Applied Bacteriology, 80(4), 453–457.16. Rackis, J. J., Honig, D. H., Sessa, D. J., & Cavins, J. F. (1971). Food Science, 36(1), 10–13.17. Snyder, H. E., & Kwon, T. W. (1987). Soybean utilization (p. 59). New York: Van Nostrand Reinhold.18. Smith, A. K., Schubert, E. N., & Belter, P. A. (1954). American Oil Chemical Society, 32, 274–278.19. Deak, N. A., & Johnson, L. A. (2007). American Oil Chemical Society, 84, 259–268.
Appl Biochem Biotechnol

20. Strickland, J. D. H., & Parsons, T. R. (1968). A practical handbook of sea water analysis. Bulletin–Fisheries Research Board of Canada.
21. Lowry, O. H., Rosebrough, N. J., Farr, A. L., & Randall, R. S. (1951). Biological Chemistry, 193, 265–275.22. Tramer, J., & Fowler, G. G. (1964). Science of Food &Agriculture, 15, 522–528.23. Mocquot, G., & Lefebvre, E. (1956). Applied Bacteriology, 19, 322–323.24. Karki, B., Lamsal, B. P., Jung, S., van Leeuwen, H., Grewell, D., Pometto, A. L., et al. (2009). Food
Engineering, 96(2), 270–278.25. Karki, B., Lamsal, B. P., Grewell, D., Pometto, A. L., Van Leeuwen, J., Khanal, S. K., et al. (2009).
American Chemical Society, 86(10), 1021–1028.26. Barry, A. L., Garcia, F., & Thrupp, L. D. (1970). American Journal of Clinical Pathology, 53(2), 149–158.27. Diggle, P. J., Liang, K. Y., & Zeger, S. L. (1994). Analysis of longitudinal data. Oxford: Oxford
University Press.28. Daniel, K. T. (2005). The whole soy story, the dark side of America’s favorite health food, CCN (pp. 38–39).
Washington DC: New Trends.29. Rackis, J. J. (1974). American Oil Chemical Society, 51, 161A–170A.30. Liu, C., Liu, Y., Liao, W., Wen, Z., & Chen, S. (2004). Applied Biochemistry Biotechnology, 114(1–3),
627–638.31. Matsusaki, H., Endo, N., Sonomoto, K., & Ishizaki, A. (1996). Applied Microbiology Biotechnology, 45,
36–40.32. De Vuyst, L., De Poorter, G., & Vandamme, E. J. (1989). In P. L. Yu (Ed.), Fermentation technologies:
industrial applications (pp. 166–172). London: Elsevier.33. Hurst, A. (1966). General Microbiology, 44, 209–220.34. Guerra, N. P., Rua, M. L., & Pastrana, L. (2001). International Journal of Food Microbiology, 70, 267–281.35. Guerra, N. P., & Pastrana, L. (2002). Biotechnology Applied Biochemistry, 36, 119–125.36. Guerra, N. P., & Pastrana, L. (2002). Process Biochemistry, 37, 1005–1015.37. Yang, R., & Ray, B. (1994). Food Microbiology, 11, 281–291.38. Guerra, N. P., & Pastrana, L. (2001). Biotechnology Letters, 23, 609–612.39. Brooks, J. R., & Morr, C. V. (1984). Agricultural Food Chemistry, 32(3), 672–674.40. LeBlanc, J. G., Silvestroni, A., Connes, C., Juillard, V., de Giori, G. S., Piard, J. C., et al. (2004).
Reduction of non-digestible oligosaccharides in soymilk: Application of engineered lactic acid bacteriathat produce a-galactosidase. Genetics Molecular Research, 3(3), 432–440.
41. Zarrabal, O. C., Hipolito, C. N., Bujang, K. P., & Ishizaki, A. (2009). Industrial MicrobiologyBiotechnology, 36, 409–415.
Appl Biochem Biotechnol
Copyright © 2022 FDOKUMEN