Soy Biocomposite Turfgrass Fertilizer - CORE
77
Graduate eses and Dissertations Iowa State University Capstones, eses and Dissertations 2017 Soy Biocomposite Turfgrass Fertilizer Jake Behrens Iowa State University Follow this and additional works at: hps://lib.dr.iastate.edu/etd Part of the Agriculture Commons , Bioresource and Agricultural Engineering Commons , and the Industrial Engineering Commons is esis is brought to you for free and open access by the Iowa State University Capstones, eses and Dissertations at Iowa State University Digital Repository. It has been accepted for inclusion in Graduate eses and Dissertations by an authorized administrator of Iowa State University Digital Repository. For more information, please contact [email protected]. Recommended Citation Behrens, Jake, "Soy Biocomposite Turfgrass Fertilizer" (2017). Graduate eses and Dissertations. 15258. hps://lib.dr.iastate.edu/etd/15258
-
Upload
khangminh22 -
Category
Documents
-
view
4 -
download
0
Transcript of Soy Biocomposite Turfgrass Fertilizer - CORE

Graduate Theses and Dissertations Iowa State University Capstones, Theses andDissertations
2017
Soy Biocomposite Turfgrass FertilizerJake BehrensIowa State University
Follow this and additional works at: https://lib.dr.iastate.edu/etd
Part of the Agriculture Commons, Bioresource and Agricultural Engineering Commons, and theIndustrial Engineering Commons
This Thesis is brought to you for free and open access by the Iowa State University Capstones, Theses and Dissertations at Iowa State University DigitalRepository. It has been accepted for inclusion in Graduate Theses and Dissertations by an authorized administrator of Iowa State University DigitalRepository. For more information, please contact [email protected].
Recommended CitationBehrens, Jake, "Soy Biocomposite Turfgrass Fertilizer" (2017). Graduate Theses and Dissertations. 15258.https://lib.dr.iastate.edu/etd/15258

Soy biocomposite turfgrass fertilizer
by
Jake J. Behrens
A thesis submitted to the graduate faculty
in partial fulfillment of the requirements for the degree of
MASTER OF SCIENCE
Major: Industrial and Agricultural Technology
Program of Study Committee: David Grewell, Major Professor
James Schrader Amy Kaleita
Iowa State University
Ames, Iowa
2017

ii
TABLE OF CONTENTS
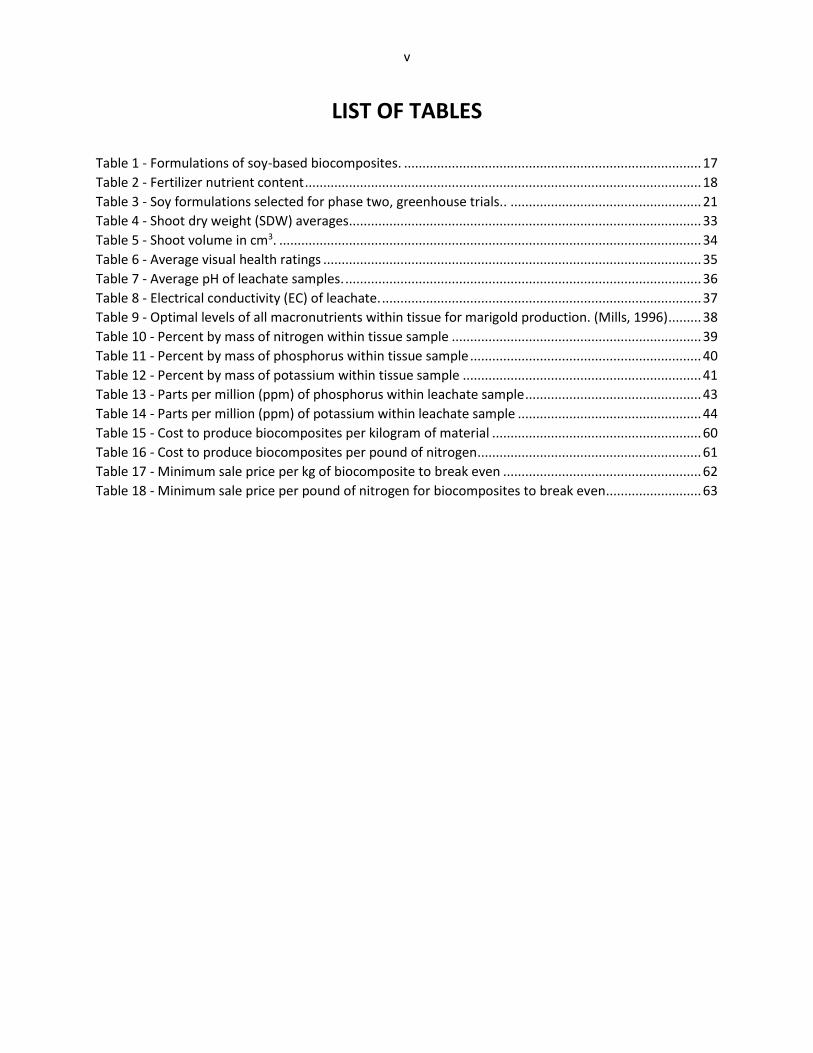
LIST OF FIGURES ........................................................................................................................................... iv
LIST OF TABLES .............................................................................................................................................. v
ACRONYMS .................................................................................................................................................. vi
ACKNOWLEDGEMENTS ............................................................................................................................... vii
ABSTRACT ................................................................................................................................................... viii
CHAPTER 1 INTRODUCTION .......................................................................................................................... 1
Background ............................................................................................................................................... 1
Objective ................................................................................................................................................... 2
General Approach ..................................................................................................................................... 2
CHAPTER 2 LITERATURE REVIEW .................................................................................................................. 4
Negative Effects of Excess Nutrients in Watersheds ................................................................................ 5
Turfgrass Fertilizing ................................................................................................................................... 8
Legume Nitrogen Fixation ....................................................................................................................... 10
Fertilizer Production and Life Cycle Assessment .................................................................................... 11
CHAPTER 3 MATERIALS ............................................................................................................................... 13
Filler Materials ........................................................................................................................................ 13
Matrix ...................................................................................................................................................... 14
Plasticizer ................................................................................................................................................ 15
Synthetic Fertilizer .................................................................................................................................. 16
Biobased Alternative Fertilizer ................................................................................................................ 16
Soy Biocomposite Formulations ............................................................................................................. 17
Material Processing ................................................................................................................................. 18
CHAPTER 4 METHODOLOGY ....................................................................................................................... 19
Phase One: Turfgrass Trial ...................................................................................................................... 19
Phase Two: Greenhouse Trial ................................................................................................................. 21
Techno-Economic Analysis ...................................................................................................................... 23
Life Cycle Assessment ............................................................................................................................. 24
CHAPTER 5 RESULTS AND DISCUSSION ....................................................................................................... 27
Greenhouse Photographs ....................................................................................................................... 27

iii
Shoot Dry Weight .................................................................................................................................... 32
Shoot Volume.......................................................................................................................................... 34
Visual Health Rating ................................................................................................................................ 34
Leachate Acid/Base Characterization ..................................................................................................... 35
Leachate Electrical Conductivity ............................................................................................................. 36
Tissue Nutrients ...................................................................................................................................... 37
Leachate Nutrients .................................................................................................................................. 41
Effect of Type of Soy Filler ...................................................................................................................... 44
Filler to Matrix Ratio Effect ..................................................................................................................... 46
Plasticizer Effect ...................................................................................................................................... 47
Effect of Polymer Grade .......................................................................................................................... 48
Effect of Application Rate ....................................................................................................................... 49
Techno-Economic Analysis ...................................................................................................................... 59
Life Cycle Assessment ............................................................................................................................. 63
CHAPTER 6 CONCLUSION ............................................................................................................................ 66
References .................................................................................................................................................. 67

iv
LIST OF FIGURES
Figure 1 – U.S. nitrate ion concentration across the .................................................................................... 7
Figure 2 - Areas at risk of nitrate contamination .......................................................................................... 8
Figure 3 - Turfgrass plot visual health ratings over 7 week test ................................................................. 20
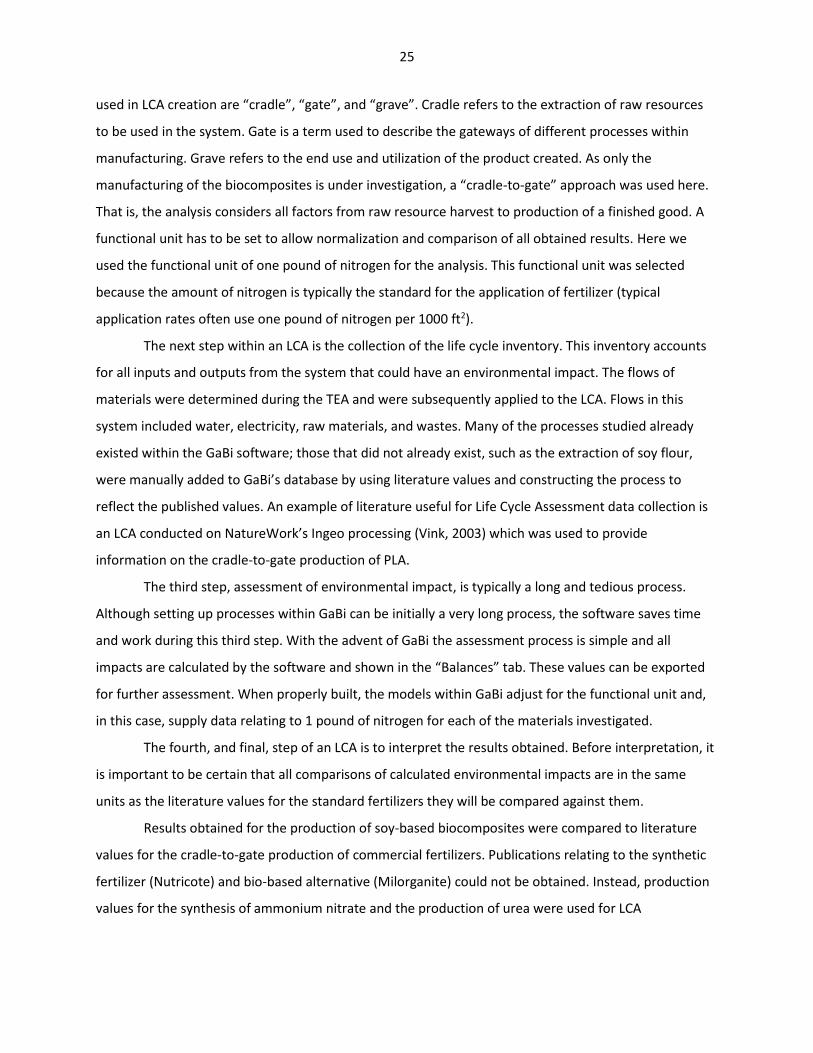
Figure 4 – Images taken just before harvest of plants grown with 3001 PLA/SPA (50/50) ........................ 28
Figure 5 - Images taken just before harvest of plants grown with 3001 PLA/SPA (30/70). ....................... 28
Figure 6 - Images taken just before harvest of plants grown with 3001 PLA(5%PEG)/SPA (30/70) ........... 29
Figure 7 - Images taken just before harvest of plants grown with 3001 PLA(10%PEG)/SPA (30/70) ......... 29
Figure 8 - Images taken just before harvest of plants grown with 2003 PLA/SPA (30/70) ........................ 30
Figure 9 - Images taken just before harvest of plants grown with 2003 PLA/SF (60/40) ........................... 30
Figure 10 - Images taken just before harvest of plants grown with 2003 PLA/SF (50/50) ......................... 31
Figure 11 - Images taken just before harvest of plants grown with 2003 PLA/SF (40/60) ......................... 31
Figure 12 - Images taken just before harvest of plants grown with Milorganite ....................................... 32
Figure 13 - Images taken just before harvest of plants grown with synthetic fertilizer (Nutricote) .......... 32
Figure 14 - Shoot dry weight (SDW) ............................................................................................................ 50
Figure 15 - Shoot volume ............................................................................................................................ 51
Figure 16 - Average pH for leachate samples ............................................................................................. 52
Figure 17 - Electrical conductivity (EC) ........................................................................................................ 53
Figure 18 - Average visual health rating ..................................................................................................... 54
Figure 19 - Tissue nitrogen, by percent mass ............................................................................................. 55
Figure 20 - Tissue phosphorus, by percent mass ........................................................................................ 56
Figure 21 - Tissue potassium, by percent mass .......................................................................................... 57
Figure 22 - Tissue phosphorus, in parts per million .................................................................................... 58
v
LIST OF TABLES
Table 1 - Formulations of soy-based biocomposites. ................................................................................. 17
Table 2 - Fertilizer nutrient content ............................................................................................................ 18
Table 3 - Soy formulations selected for phase two, greenhouse trials.. .................................................... 21
Table 4 - Shoot dry weight (SDW) averages ................................................................................................ 33
Table 5 - Shoot volume in cm3. ................................................................................................................... 34
Table 6 - Average visual health ratings ....................................................................................................... 35
Table 7 - Average pH of leachate samples. ................................................................................................. 36
Table 8 - Electrical conductivity (EC) of leachate. ....................................................................................... 37
Table 9 - Optimal levels of all macronutrients within tissue for marigold production. (Mills, 1996) ......... 38
Table 10 - Percent by mass of nitrogen within tissue sample .................................................................... 39
Table 11 - Percent by mass of phosphorus within tissue sample ............................................................... 40
Table 12 - Percent by mass of potassium within tissue sample ................................................................. 41
Table 13 - Parts per million (ppm) of phosphorus within leachate sample ................................................ 43
Table 14 - Parts per million (ppm) of potassium within leachate sample .................................................. 44
Table 15 - Cost to produce biocomposites per kilogram of material ......................................................... 60
Table 16 - Cost to produce biocomposites per pound of nitrogen ............................................................. 61
Table 17 - Minimum sale price per kg of biocomposite to break even ...................................................... 62
Table 18 - Minimum sale price per pound of nitrogen for biocomposites to break even .......................... 63

vi
ACRONYMS
SPA Soy Protein Polymer with Adipic Acid
SF Soy Flour
SPI Soy Protein Isolate
PLA Polylactic Acid/Polylactide
PEG Polyethylene Glycol
GHG Greenhouse Gas
NPK Nitrogen – Phosphorus - Potassium
EPA Environmental Protection Agency
SDW Shoot Dry Weight
PPM Parts Per Million
EC Electrical Conductivity
LCA Life Cycle Assessment
TEA Techno-Economic Analysis
GWP Global Warming Potential
AP Acidification Potential
EP Eutrophication Potential
AN Ammonium Nitrate

vii
ACKNOWLEDGEMENTS
Thank you to my professor and Principal Investigator Dr. David Grewell, as well as my committee members Dr. James Schrader and Dr. Amy Kaleita. Each of them is an individual I admire for their work ethic. Without their support and teaching this would not have been possible.
Funding and resources for this project were provided by: the U.S. Department of Agriculture, the United Soybean Board, and Iowa State University’s Center for Crops Utilization Research.
Special thanks to other members of my home department, past research team members within Agricultural and Biosystems Engineering, and other colleagues of tremendous guidance: Dr. Christine Strohm, Dr. Melissa Montalbo-Lomboy, Dr. Gowrishankar Srinivasan, Mitchel Michel, and Kendra Allen.
A thank you to my friend in the Department of Horticulture, Kenneth McCabe, for his assistance in testing and recommendation of literature references.
Lastly, special thanks to my significant other, Danielle Newell, my parents, John and Lois Behrens, and my siblings, Nicole and the late John Behrens, for their continued support and encouragement throughout my education.

viii
ABSTRACT
Turfgrass production and maintenance relies heavily on the addition of nutrients, typically in the
form of synthetic fertilizers based on natural gas. Soy-based biocomposite fertilizers have the potential
to replace these synthetic fertilizers and reduce dependence on abiotic resources as well as decrease
the environmental impact associated with the production and use of synthetic fertilizers.
Plant-based turfgrass fertilizers already exist on the market and typically use plant materials,
such as sugar beets, that are relatively difficult and costly to produce. Soybeans are the preferred plant
protein to provide nutrients in a biocomposite fertilizer because of the soybean’s unique relationship
with bacteria that allows it to utilize nitrogen gas from the atmosphere. Soybeans are also grown on a
large scale in the Midwest, making them readily available.
In this work, it was determined that soy-based biocomposites performed as well as
commercially available fertilizers in terms of facilitating plant growth. It was also seen that nutrient
levels in leachate samples were not significantly different for soy-biocomposite fertilizers compared to
synthetic slow-release fertilizers when applied at a standard application rate. Addition, when over-
applied the soy-based composites exhibited drawbacks similar to that of some synthetic fertilizers.
Economic analysis demonstrated that soy-based biocomposites could be produced on a
commercial scale and at a competitive cost. Dependent on the specific formulation, the production costs
for soy biocomposites were as low as $15.15 per pound of nitrogen. In comparison, the synthetic slow-
release fertilizers used for comparison in this study are currently sold at a retail price of $54.73 per
pound of nitrogen.
A life cycle assessment also demonstrated that the cradle-to-gate production of soy-
biocomposite fertilizers creates significantly less global warming potential (GWP) compared to the
production of traditional ammonium nitrate and urea fertilizers. In the case of biocomposites comprising
of more than 60% soy filler, the GWP was shown to be negative, suggesting the production of these
biocomposites have the potential to sequester greenhouse gases.

1
CHAPTER 1
INTRODUCTION
Fertilization of turfgrass is typically accomplished with synthetic fertilizers. Natural gas is the
most abundant feedstock used in fertilizer production today. In addition to using non-renewable
resources, petro-chemical fertilizers are energy intensive to manufacture, hazardous to produce, and
create a significant amount of global warming potential (GWP).
In this study, a biocomposite material was developed, consisting of a polylactic acid (PLA)
polymer matrix filled with a relatively large concentration of nutrient-carrying filler, such as soy. The
proteins within the soy provided the macronutrients (nitrogen, phosphorus, and potassium) for healthy
plant growth during degradation of the composite. Soy is naturally effective at utilizing atmospheric
nitrogen during its growth process, and can be grown in sub-optimal conditions where low soil nitrogen
content has less detrimental effects than with other row crops.
This research tested the viability of soy biocomposite fertilizers and compared them to
commercially available slow-release fertilizers and biobased alternatives. Testing included growth and
nutrient trials, as well as modelling of the economic viability and the environmental impacts associated
with the production of soy biocomposite fertilizers.
It was hypothesized that through this research a soy based biocomposite fertilizer could be
developed which could compete with premium slow-release synthetic fertilizers in terms of
performance and costs. Soy based biocomposites exhibiting similar or lower levels of global warming
potential and water nutrient contamination would be considered successful as they rely on renewable
resources.
Background
This work focused on measuring the effectiveness of fertilizers, such as those used on residential
turfgrass, where over-application and over-watering are far more common when compared to the
production of agronomic crops. The use of biobased, controlled-release fertilizer, such as a protein-filled
degradable composite, may provide important nutrients to the residential lawn-care market.

2
Homeowners require smaller quantities of fertilizer when compared to farmers. As these users purchase
in a smaller niche market, they often desire and can afford premium products. Consumers are often
willing to purchase a more costly product if there are additional value-added benefits that offset the
additional costs. Examples of additional benefits from biorenewable, soy-based fertilizer include: greater
safety for children and pets, biorenewable sourcing of inputs, slow release of nutrients, lower
environmental impact, and greater overall sustainability.
A previous ISU research project on biobased pots, served as a catalysts for the initiation this
project. A research project conducted under Dr. David Grewell, Dr. James Schrader, and Dr. William
Graves investigated the use of biobased alternatives to petroleum-based plastic horticulture pots
(containers). During these trials, it was seen that biocomposite containers produced larger plants
compared to those grown in standard containers produced from petrochemical plastics (Schrader et al.,
2013; McCabe et al., 2016). These studies showed that nutrients were supplied to the plant by the
decomposing container materials; that is to say, the containers were “self-fertilizing”. The present
research investigated the effectiveness of similar biocomposite materials for use as granular fertilizers
and aimed to identify an optimal formulation in terms of promoting plant growth, reducing nutrient
pollution, and minimizing costs.
The research conducted with bio-containers at Iowa State included the use of a soy-based
polymer produced from soy flour and soy protein isolate. This formulation, known as soy protein
polymer with adipic acid (SPA), had proven its ability to be used as a polymer filler, extruded, and
injection molded. Therefore, this formulation was used for the experiments performed in this work.
Objective
The objective of this work was to determine whether it is possible to develop biobased fertilizers
that can compete with commercially availability fertilizers in terms of performance and costs. This
included comparing biobased and synthetic fertilizers in terms of plant health, costs, and environmental
impacts.
General Approach
To achieve the objectives it was important to identify a soy-based biocomposite formulation for
the fertilizer that could function as well as or better than commercial fertilizers. Plant growth and
health, including plant dry mass, shoot volume, and overall health were measured. This data was used
to determine the effectiveness of the soy-based materials in comparison with synthetic fertilizers and

3
currently available biobased alternatives. Nutrient analyses of plant tissue and water leachate were also
characterized to determine the effectiveness of plant nutrient uptake and to estimate the amount of
nutrients lost through water leaching in greenhouse trials. Although the leachate trials did not directly
correlate to nutrient runoff, they provided insight into potential full-scale run-off scenarios.
Testing was completed in two major phases. The first phase studied a broad set of formulations
to eliminate ineffective formulations and reduced the experimental design space. The second phase, a
greenhouse trial, was performed to supply quantifiable, numerical data for the analysis of a subset of
formulations selected from the initial trial. The two-phase approach allowed for a larger number of
formulations to be included in testing.
Nutrient content of the biocomposites is directly proportional to the level of soy-based material
in the composite. That is to say, soy protein was the active fertilizing ingredient. In general protein
purity results in an increase in the cost of the final composite, but also provided increased nutrient
levels of a given formulation. These competing desired features (costs and nitrogen concentration) were
studied by using two different soy-based fillers with different protein purities and associated costs, soy
protein polymer (SPA) and soy flour (SF). The polymer matrix material provided control over the
degradation rate, and thereby controlled the nutrient release rate. Two different grades of the same
polymer type (binder), PLA 2003D and PLA 3001D from NatureWorks, were selected for the
investigation. The use of plasticizers and their content was also analyzed as they increase the
processability of the composites; however, they also increased the overall price.

4
CHAPTER 2
LITERATURE REVIEW
The use of fertilizers is common in most residential and agricultural applications; however, its
goals, effects, and negative impacts vary depending on many factors, such a fertilizer type, application
rate, environment, as well as geography. This literature review will provide insight into how the use and
effects of turfgrass fertilizer differ from fertilizer use. Key concepts relating to the modeling processes
used during this research will also discussed.
The literature review will assess multiple areas of interest surrounding fertilizer production and
use. Discussed first will be the negative effects associated with the production of traditional, synthetic
fertilizers. Among discussed items will be how Life Cycle Assessments can be used to model the total
resource use and pollutant production of manufacturing them.
The detrimental effects of fertilizer runoff and nonpoint source pollution is discussed in a
separate section. Nutrient pollution is a topic of concern with respect to water quality impacts. Nutrient
runoff not only has detrimental effects on surface water and water sheds (and thus on the drinking
water quality of parts of the US population), it has the potential to promote dead zones downstream
(Gulf region, Chesapeake Bay).
Although this work will focus on turfgrass, the findings can help differentiate between the
effects of fertilization of turfgrass systems and agricultural systems, the latter are generally better
understood, as more research data are available.
An additional section of the review will provide a brief overview of legumes (such as soybeans)
and describe why they are suitable as the primary supplier of nutrients (N) for the biocomposite
fertilizer used in the current experiments.
The process of constructing an economic model known as a Techno-Economic Analysis (TEA) will
be examined to give an overview as to why this is an important technique when considering the full-
scale application of the materials discussed herein.
Finally, the modeling of the total life cycle impact of a product provides will be reviewed on how
different consumer goods effect the environment. A Life Cycle Assessment (LCA) review will discuss
some benefits and limitations of the modelling process.

5
Negative Effects of Excess Nutrients in Watersheds
Nitrogen, phosphorus, and potassium (NPK) are the most important elements required for
healthy plant growth (Mengel, 2009). These nutrients are typically applied annually to crops and
residential lawns in the form of different fertilizers. A plethora of fertilizer-related water pollution issues
have been reported, especially in the rivers and lakes of the Midwest and Southern states where runoff
from numerous watersheds converge and concentrate the contaminants. These nutrients are harmful to
the ecosystem and cost the U.S. taxpayers $2.2 billion annually in clean up and mitigation, for nitrogen
and phosphorus alone. (EPA, 2016)
Before the creation of modern fertilizers, these elements existed in our aquatic ecosystems. In
small quantities, these materials are harmless and support a healthy environment. However, application
of fertilizers on both agricultural and residential lands has led to excessive levels of these nutrients
within surface waters caused by runoff. Of these nutrients, nitrogen in the form of nitrate is the largest
portion of surface water nutrients. Research by the U.S. Geological Survey found that approximately
10% of private water sources, such as wells, were found to contain NO3-N levels above the EPA
recommended limit of 10 mg/L (Oram, 2014). Nutrient pollution is not limited to small areas. The fact
that 166 costal hypoxic dead zones have been identified (Diaz et al., 2008) demonstrates the potential
negative effects of fertilization.
Currently, the U.S. EPA acknowledges the pollution issues associated with application of
fertilizers and describes them concisely on their webpage (EPA, 2016). The list of issues includes excess
algae growth, habitat destruction, hypoxia, eutrophication, fish kills, bacterial blooms, “blue-baby”
syndrome, and destruction of recreational areas.
Runoff of nutrients associated with fertilizer application is described as a type of nonpoint
source pollution. This type of pollution is defined as “pollution coming from diverse diffuse sources
including urban storm water, agriculture, and hydromodification, etc.” (Lin, et al., 2009). Urban
watersheds are also contributing to nonpoint pollution and causing water quality hazards of surface
waterbodies (Lin, et al., 2009).
In the US Midwest, these pollutants eventually concentrate in rivers and feed into the Gulf of
Mexico, causing widespread water quality issues in coastal areas. An article in Scientific American
(Biello, 2008) describes the “dead zones” created off the coasts. The dead zone in the gulf is
approximately 5,000 square miles in total area. The hypoxic conditions are caused by excessive nutrient
6
loads in the water. Dead zones in the gulf are not only harmful to marine life, but can also cause
economic hardships for those that rely on the gulf waters for their livelihood.
The article (Biello, 2008) also describes an experiment conducted to determine if rivers and
streams are capable of removing excess nutrients by natural processes. Because plant life relies on the
nutrients to grow, organisms in lakes and streams may be able to uptake some of the excess nutrients.
Researchers found through their studies that only a limited amount of nutrients can be abated by the
environment. However, because the system is so large and complex, the research team was unable to
define a numerical quantity that could be up taken by organisms. Their findings did show that a
significant number of watersheds are severely overloaded and are incapable of utilizing the large
nutrient load, leading to the nutrient pollution currently plaguing the gulf coast.
Figures 1 and 2 show maps from the National Geological Society mapping the levels of nitrate
ions in different areas across the U.S. and how they can affect the quality of groundwater for drinking
use in specific areas. Figure 1 shows a strong correlation of ion concentration with agricultural intensity
across the U.S., most notably the Midwest.

7
Figure 1 - Nitrate ion concentration across the U.S. Image provided by National Geological Society.
Agricultural runoff is not the only nutrient source causing harm to water supplies. Residential
lawn care can also provide excess nutrients to watersheds and contribute to nutrient pollution. Some
areas within the U.S. rely on water stored deep within the soil, often separated by a layer of hard rock
such as limestone. These water sources are known as aquifers and are generally not affected by nutrient
runoff, as water must infiltrate deep into the earth and excess nutrients tend to be filtered by the
limestone as water permeates downwards. However, many Americans rely on more shallow sources of
groundwater for drinking water. These areas are extremely susceptible to nutrient related issues and
illnesses. Figure 2 indicates areas of the U.S. that are at higher risks of nitrate contamination. Without
the thick layer of rock to percolate through, shallow groundwater sources are more susceptible to
nutrient pollution.

8
Figure 2 - Areas at risk of nitrate contamination. Image provided by the National Geological Society.
Turfgrass Fertilizing
Nitrogen runoff after application of synthetic fertilizers is a common issue, especially when
combined with large rain events. A journal article posted in the Journal of Environmental Quality
(Morton, 1987) describes an experiment conducted to test the amount of nitrogen leaching from
turfgrass under various conditions. Researchers varied the amount of fertilizer applied as well as the
quantity of water. The amount of nitrogen leachate varied significantly from 32 kg/ha for overwatered,
high nitrogen rate treatments; to 2 kg/ha for the scheduled watering, unfertilized, control treatment.
This sixteen-fold increase is mostly likely the result of the fact that conventional fertilizers
contain nitrogen in a water-soluble state allowing major rain events or overwatering to transport
nutrients into larger bodies of water where they are concentrated with other similar runoff. Negative
effects of this pollution can be exacerbated in urban areas because of the infrastructure, such as storm

9
drains, and impermeable areas such as pavements. Drains are put in place to increase the rate at which
water is transferred away from residential areas and into bodies of water. Pavement has similar effects
as piping as it is impermeable and connected to the storm drain system. This decreases the area of
permeable surfaces like soil and the amount of time available for nutrient-laden water to infiltrate into
the soil where nutrients would be contained or utilized.
Another key contributor to turfgrass fertilizer leaching is the amount of fertilizer applied. As
reported by (Morton, 1987), higher application rates lead to larger amounts of runoff, especially when
combined with high precipitation rates. A long-term project funded by the National Science Foundation
(Neely, 2004) estimated the average amount of fertilizer applied in residential settings by homeowners
and professional lawn care companies. This research discovered that on average 97.6 kg/ha (2.00
lbs/1000 ft2) of nitrogen was applied annually. However, they calculated a standard deviation of 88.3
kg/ha (1.81 lbs/1000 ft2). This suggests that the amount of fertilizer applied fluctuated in many cases
from nearly no fertilizer, to a rate nearly double the average. This may also suggest that many
homeowners either lack the proper knowledge to apply fertilizer correctly, or are poorly informed on
the impacts caused by over-application of these fertilizers.
Excessive application of fertilizer is relatively common in residential settings. Farmers are
relatively educated with regard to fertilizer use and have a better understanding of application and
usage. More importantly, farmers are less likely to have a standard deviation of delivery rates as high as
the residential application because of costs and profit driven factors. In more detail, the cost of fertilizer
is among the highest input costs for row crop farmers in the U.S. Economists of the USDA estimated
costs for 2015 corn production at nearly $700 per acre (Gloy, 2015). Of the total cost, fertilizer
corresponds to the second most expensive input for farming at $135 per acre of the total $700. Costs
associated with land ownership are the only higher input; estimated at $181 per acre.
Fertilizing a residential lawn is relatively inexpensive compared to the large acreage most
farmers manage, so that the cost factor of over-application of fertilizer in a residential setting is
negligible compared to agricultural crop production. Homeowners are less likely to notice the small
financial difference caused by over-applying fertilizer and there is little social identification of the
impacts of lawn care compared to the impact of farming activities.
Considering the amount of land currently treated as turfgrass, 17 million hectares (King, 2007);
management of the nutrient pollution caused by fertilization in these areas should not be ignored. Areas
contributing to the 17 million hectares include: home lawns, commercial property, golf courses, parks,
other recreational areas, schools, cemeteries, and others. Notably, the areas associated with turfgrass

10
tend to be urban/suburban areas. These urban areas produce more runoff than the natural ecosystem,
such as forested areas because of the aforementioned impermeable nature of most urban land cover.
A three-year experiment comparing nitrogen content in urban runoff to other systems
(Groffman, 2004) found that nitrogen yields from 2.9 to 7.9 kg N/ha/y were found to be common in
urban areas. In comparison, the forested area lost approximately 1 kg N/ha/y under similar weather
conditions. The large amount of nitrogen lost in urban areas was contributed to variables such as storm
water infrastructure, application rate of fertilizers, impermeable areas, and over-watering of turfgrass.
Legume Nitrogen Fixation
Many sources of nitrogen exist for the production fertilizers and nitrogen is one of the most
abundant elements in the world. The focus of this research is on the use of biocomposites with soybean
content, in which soy protein is used as a source of nitrogen for fertilizers. Soybeans were chosen
because they are a member of the family Leguminosae that have a unique relationship with a specific
bacterium that allows them to capture and utilize nitrogen from the atmosphere.
Most plants rely on ammonia (NH3) for nitrogen needed to build the plant’s amino acids,
proteins, and nucleic acids. Soybeans are no exception to this rule and also use ammonia. However,
soybeans typically are less affected compared to other plants by lower nitrogen content in the soil
because a specific type of rhizobial bacteria, Rhizobiaceae, α-Proteobacteria, is capable of turning
atmospheric nitrogen (N2) into ammonia within the legume’s root system (Rolfe, 1984). The bacteria and
legume share a symbiotic relationship where each organism benefits from the presence of the other. In
this case, the rhizobial bacteria live in nodules located on the plant’s root system. This growth does not
cause physical harm to the plant, but the legume does provide the bacteria an environment to thrive.
The bacteria benefit the legume by producing ammonia from diatomic nitrogen; the legume then uses
this ammonia in return.
It is estimated that soybeans account for 77% of the total nitrogen fixation by all legumes
worldwide, with 1.64×10⁷ metric tons of atmospheric nitrogen fixed annually (Herridge, 2008). The U.S.
soybean crop accounts for approximately one third of this nitrogen, with Brazil and Argentina’s soybean
crops following close behind. Herridge combines data and models from nearly a dozen different authors’
estimations on the global nitrogen budget of soybeans and other legumes. He created his own model
based upon the most accurate and useful components of various models, ranging back to the 1970s.
Herridge also suggests that most of these models are, at best, well-informed guesses. The complexity of
11
the nitrogen fixation occurring within legumes, and the multitude of variables, make these models
difficult to verify.
In his study, Herridge defined the percentage of a plant’s total nitrogen associated with N2
fixation as %Ndfa. Among other legumes, soybeans are the most difficult plant for which to model this
%Ndfa because the variance in soil health, current nitrogen within the soil, and other factors affect
soybeans to a much higher degree compared to non-legume plants. It was estimated that, on average,
58% of nitrogen in soybeans was related to the dinitrogen fixation for a typical farmer’s crop (Herridge,
2008). However, within controlled experiments, a range of 0-95 %Ndfa was reported. This large range
was the result of the plants’ ability to utilize N from the soil as well as the atmosphere.
In more detail, it was found that within a controlled experiment the amount of ammonia made
available to the plant had a great effect on the utilization of atmospheric nitrogen by fixation. If more
nitrogen was supplied through fertilizers and organic matter, the soybean had no need for the bacteria
and they were not present. Under extremely low nutrient availability, the rhizobial bacteria flourished
and provided nearly all (95%) of the nitrogen the soybean plants needed; assuming plants had enough
starting fertilizer to grow a root system. This implies that soybeans can be grown under different
conditions, even in soil nearly void of nitrogen, and it will sequester additional amounts of nitrogen from
the air to compensate for the lack of nutrients.
Fertilizer Production and Life Cycle Assessment
One method to compare the total environmental impact of the production of different goods is
through Life Cycle Assessments (LCA). Conducting an LCA involves summation of the inputs and outputs
of a particular system to determine the environmental and resource usage and their impact associated
with production of a certain quantity of a good. Details on conducting an LCA are documented in
standards such as ISO 14040. These inputs and outputs include raw resource collection, transportation,
manufacturing, packaging, consumer use, and end of life treatment. Properly defining the boundaries of
a LCA can be difficult, but researchers have developed models and databases that can be shared to
utilize the collective knowledge of the community to promote consistency of various models.
For the research conducted here, the life cycle assessments will show the total environmental
impact associated with the production of the soy biocomposite fertilizer. Assessments that focus on the
production of a good are referred to as “cradle-to-gate” LCAs as they consider all activities from raw

12
resource harvesting through the production of a good. The life cycle assessment developed here will be
compared to published literature values of other authors who also utilized a cradle-to-gate approach.
The methodology for conducting a life cycle assessment is outlined in the standard ISO 14040.
An LCA consists of four major steps: determination of goal and scope, analysis of inputs/outputs, impact
assessment, and interpretation of results. More details on each of these steps are outlined in the
Methodology section.
Many impacts can be calculated throughout an LCA. The LCA conducted here focusses on the
impact categories most relevant to fertilizer production. These categories include: global warming
potential (GWP), abiotic energy depletion, abiotic resource use, eutrophication potential, and
acidification potential. These categories account for the largest impacts associated with the production
of most consumer goods (Skowrońska, 2014). Skowrońska and other authors typically focus on the
production of either ammonium nitrate (AN) or urea. These two forms of nitrogen are the most
commonly used forms of fertilizer. The process used to create urea and ammonium nitrate is described
in detail in the materials section.
The impact categories include the respective input resources or output pollutants that
contribute to the specific negative effect in question. For example, GWP accounts for greenhouse gases
(GHGs) such as N2O, CO2, and CH4 (Skowrońska, 2014). Total GWP is measured in kilogram of CO2
equivalence (kg CO2 eq). The total GWP for both AN and urea is 2.82 and 0.72 kg CO2 eq, respectively for
each pound of nitrogen produced (Skowrońska, 2014).
Abiotic energy or resource use refers to inputs that are from non-renewable feedstocks such as
oil, gas, coal, and other fossil fuel based products. In many LCA’s, authors examine traditional fertilizers
from natural gas. However, they include the feedstock natural gas as a resource used, but not as energy
consumption. This can lead to discrepancies when comparing different models. Thus, attention must be
given to ensure similar methods were when comparing models.
Acidification and eutrophication potentials are calculated with regard to the variety of pollutants that
cause negative effects on both fresh and salt-water environments. The most common forms of acetic
pollutants include NOx, SOx, as well as other nitrogen-based contaminants.

13
CHAPTER 3
MATERIALS
The formulations investigated for this project contained varying amounts of the materials listed
in the following sections. Each of these components served a specific function within the composite,
which is detailed in each corresponding sections. The experimental design of the varying formulations is
discussed in a separate section “Methodology”. The categories of materials used include: fillers,
matrices, and plasticizers. The function of the filler material in this specific application was to provide
the nutrients needed by plants. As stated, soy-based fillers were utilized as the key source of nutrients
for the composite fertilizer because of their relatively high nitrogen content. Polymer matrices are
needed to mechanically stabilize the filler material and control the degradation rate. It is important to
note that the ratio of filler to matrix material within these formulations affects the rate at which the
composite degraded, as well as the rate of nutrient release. There is an inversely proportional
relationship between matrix content within the composite and degradation rate; higher matrix content
decreases degradation rate and slows nutrient release.
Lastly, the use of a plasticizer was also investigated to determine if the additive, which enhances
processability, also has an effect on plant growth. In more detail, plasticizers can have a wide range of
functions; however, for this study their primary function was to lower the processing temperature of the
matrix to reduce thermal degradation of the soy filler.
Filler Materials
Two soy-based fillers were investigated during this research to determine their effectiveness as
a nutrient source as well as their effect on overall formulation cost. A soy-based formulation previously
developed at Iowa State University (Grewell et al, 2013) was the first filler investigated for this
experiment. It was developed for use in the horticulture crop containers previously mentioned in the
background information, and will be referred to as “SPA”. This material mixture is comprised of both soy
flour and soy protein isolate. It includes plasticizing ingredients, such as glycerol as a processing aid. This
particular formulation contains adipic acid, which is used as a crosslinking agent to improve the
mechanical properties of the soy-based polymer.

14
Because of the success of this material with the crop containers, it was decided that this filler
would be used as a starting point for the biocomposite formulation. The material formulation consisted
primarily of soy flour (SF) and soy protein isolate (SPI). Additional ingredients included: glycerol, adipic
acid, phthalic anhydride, potassium sorbate, sodium sulfite anhydrous, and water. The primary function
of the other additives was to increase water stability and act as plasticizers during the extrusion process.
Of the two primary soy ingredients, soy protein isolate has a higher protein content and provides a
higher amount of nitrogen. However, SPI is more expensive and may affect the cost competitiveness the
soy biocomposite fertilizer. The SPA has the drawback of requiring a separate extrusion step, increasing
the time and cost to produce the final formulation as more production time is required.
Soy flour was also investigated as the single source of nutrients. Soy flour contains nutrients
required for healthy plant growth, but in lower concentrations compared to SPA. It was hypothesized
that the lower cost of SF compared to SPA may provide an economic advantage. The SF-based materials
also required fewer extrusion steps as the flour does not need to be compounded before being
combined with the matrix (PLA).
Matrix
Polymer composite materials require a mechanical stabilizing component. This material is often
referred to as the base resin, or the matrix. In composites, filler materials are typically added to a matrix
to enhance specific properties: strength, chemical resistance, UV light stability, electrical conductivity,
among other mechanical properties, and/or to lower cost. In the biocomposite investigated here, the
filler provided the unique benefit of supplying nutrients for plant growth. This uncommon use of a filler
material requires the use of specialized polymers that support the filler and promote the composite’s
functions. Desirable characteristics for this application include: degradability, commercially available,
and affordability. Few polymers meet these requirements however polylactide or polylactic acid (PLA) is
a suitable material.
Polylactic acid is a biobased polymer resin that can be derived from agricultural crops, or crop
by-products. Currently, the largest producer of PLA is NatureWorks, with production facilities located
near Omaha, Nebraska. NatureWorks produces their “Ingeo” line of PLA polymers by first grinding whole
kernel corn and mixing it with water into a slurry. The slurry is then exposed to enzymes to
depolymerize the starch into sugar. The sugar then undergoes a fermentation process, converting the
carbohydrates into lactic acid, the base monomer for PLA. These lactic acid monomers are first

15
converted into short chain oligomers before the final polymerization. The intermediate process of
creating oligomers is used to allow large-scale production of high molecular weight PLA. If lactic acid
monomers are polymerize directly on a large scale, the reaction is self-limiting and low molecular weight
polymers with limited thermal/mechanical properties. The final polymerization with the oligomers,
result in polylactide resin, which can be processed similar to other polymers by extrusion, injection
molding, and other processes.
NatureWorks manufactures a wide variety of PLA resins suited for different applications. Many
of their resin grades are well suited for durable goods applications. However, these resin grades are not
suitable when resin degradation is desired, as they are too tenacious. The more stable grades of resin
also tend to be more costly, which would be counterproductive for the proposed application. Therefore,
the less durable grades of PLA were identified as the most desirable matrices for this research and the
2000 and 3000 series of Ingeo biopolymers were chosen as suitable matrices. These materials are
relatively easy to degrade in the environment. Although the 2000 and 3000 Ingeo series are also sold
with modifications, such as lubricants for ease of processing, the unmodified versions of these two
polymers were selected for investigation. The 2003D resin is advertised as an “extrusion grade”
polymer, and the 3001D grade as an “injection mold grade” polymer. While past research projects at
Iowa State University had used the 3001D resin for the injection molding of horticulture pots, this
project required only the extrusion of material and therefore the 2003D resin was studied.
Plasticizer
Plasticizers are often used with polymers to improve the processability of composites as well as
increase flexibility of the final plastic. In this application, a plasticizer was used to decrease the extrusion
temperature during processing. Polyethylene glycol (PEG) was selected for this purpose; it can also be
derived from biobased feedstocks. PEG was added to the formulation to lower the extrusion
temperatures, and reduce thermal degradation of soy fillers in the composite, as well as reduce
denaturing of the soy proteins.
A disadvantage of the addition of a plasticizer is the additional extrusion step, which is required
to combine the PLA and PEG prior to further compounding with soy fillers. It was found during past
work at ISU that PEG lowers the processing temperature of PLA by approximately 30 °C (when included
at 10% by weight). In this work, plasticizer content varied from zero, five, to ten percent of overall
matrix mass. It is important to note these contents assume overall matrix mass and not overall
composite mass.

16
Synthetic Fertilizer
Commercially available, synthetic fertilizer was studied and was used as a “baseline” in terms of
performance, environmental impacts, and costs; these fertilizers are the current standard for both crop
production and turf maintenance. They are generally derived from fossil fuels, such as natural gas, and
are produced in various formulations and types for different applications. Large reaction chambers are
filled with natural gas and steam, and are reduced to remove the oxygen. This leaves nitrogen,
hydrogen, and carbon dioxide. After removal of the carbon dioxide, a catalyst is used to convert the
contents to ammonia. The ammonia can be used directly as a fertilizer; or it can be further refined into
ammonium nitrate (NH₄NO₃) by first converting into nitric oxide, nitric acid, and then finally ammonium
nitrate. The synthetic fertilizer selected for comparison in these trials was a slow-release, polymer-
coated synthetic fertilizer known as Nutricote, manufactured by Florikan. It is important to note that
Nutricote is considered one of the most efficient and sought-after slow-release fertilizers currently on
the market. It provides a best-case scenario for the synthetic fertilizer control groups.
Generally, fertilizer is expensive to produce and involves multiple environmental issues. Large-
scale chemical conversions require thermal energy to initiate the reaction. Significant quantities of
water are required, both for cooling and for cleaning between reactions. This adds to the environmental
impacts of these products. In addition, it is important to note that catalysts are typically expensive and
are often considered environmental hazards because they tend to be based on heavy metals.
Biobased Alternative Fertilizer
This work also tested a commercialized biobased alternative fertilizer, known as Milorganite.
Its nutrient content was comparable to several of the formulations of the soy biocomposite materials.
Milorganite consists of heat-dried microbes that are used in the digestion process of organic materials
for wastewater treatment. This material was included for growth trials, but because very little
information on its production is available, it was omitted from the LCA conducted during this research.
The cost of Milorganite is relatively low as the feedstock is a byproduct of wastewater treatment and
the only major input is energy for drying and packaging.

17
Soy Biocomposite Formulations
Ultimately, 14 formulations were produced for the initial phase of testing. The ratio of
components was varied to determine the effects of filler type, matrix type, filler to matrix ratio, and
plasticizer content. Each of the 14 formulations are detailed in Table 1.
Table 1 - Formulations of soy-based biocomposites by percent mass.
MATRIX MATERIAL
PLASTICIZER FILLER MATERIAL
MATERIAL NAME 2003D 3001D PEG 8000 Soy Flour SPA
3001 PLA/SPA (50/50) - 50 - - 50
3001 PLA/SPA (40/60) - 40 - - 60
3001 PLA/SPA (30/70) - 30 - - 70
3001 PLA(5%PEG)/SPA (50/50) - 47.5 2.5 - 50
3001 PLA(5%PEG)/SPA (40/60) - 38 2 - 60
3001 PLA(5%PEG)/SPA (30/70) - 28.5 1.5 - 70
3001 PLA(10%PEG)/SPA (50/50) - 45 5 - 50
3001 PLA(10%PEG)/SPA (40/60) - 36 4 - 60
3001 PLA(10%PEG)/SPA (30/70) - 27 3 - 70
2003 PLA/SPA (50/50) 50 - - - 50
2003 PLA/SPA (40/60) 40 - - - 60
2003 PLA/SF (60/40) 60 - - 40 -
2003 PLA/SF (50/50) 50 - - 50 -
2003 PLA/SF (40/60) 40 - - 60 -
After material compounding was completed, the formulations were analyzed for nutrient
content. A third-party testing center, Minnesota Valley Testing Laboratories, was hired to analyze the
materials and determine nitrogen (N), phosphorus (P), and potassium (K) levels. These three materials
are the key ingredients, or macronutrients, for healthy plant growth and are often referred to as “NPK
values”. The most important of these nutrients is nitrogen, which was used as the normalizing
independent variable. In more detail, the N content was used to calculate the total applied material to
turf in terms of mass (N)/square area. Typical application rates for fertilizing turfgrass is 1 pound of
nitrogen per 1000 ft2. Table 2 details the relative elemental composition of each fertilizer.

18
Table 2 - Fertilizer nutrient content: nitrogen, phosphorus, and potassium (NPK) for each of the tested materials. Shown on a percent mass basis.
MATERIAL NAME NITROGEN PHOSPHORUS POTASSIUM
3001 PLA/SPA (50/50) 3.21 0.68 1.05
3001 PLA/SPA (40/60) 3.82 0.88 1.31
3001 PLA/SPA (30/70) 4.89 1.03 1.56
3001 PLA(5%PEG)/SPA (50/50) 3.36 0.71 1.09
3001 PLA(5%PEG)/SPA (40/60) 3.87 0.91 1.37
3001 PLA(5%PEG)/SPA (30/70) 5.22 1.07 1.70
3001 PLA(10%PEG)/SPA (50/50) 3.99 0.83 1.27
3001 PLA(10%PEG)/SPA (40/60) 4.28 0.91 1.39
3001 PLA(10%PEG)/SPA (30/70) 5.19 1.10 1.71
2003 PLA/SPA (50/50) 3.33 0.75 1.13
2003 PLA/SPA (40/60) 4.11 0.78 1.23
2003 PLA/SF (60/40) 3.00 0.73 1.14
2003 PLA/SF (50/50) 4.01 0.93 1.45
2003 PLA/SF (40/60) 4.49 1.09 1.74
SYNTHETIC FERTILIZER 18.00 6.00 8.00
MILORGANITE 5.00 2.00 0.00
Material Processing
The biocomposite materials were extruded at Iowa State’s Center for Crops Utilization Research
pilot plant on standard polymer processing equipment. A Leistritz 28 mm co-rotating extruder was used
to compound the components. This machine has a maximum throughput rate of 350 kg/h, as stated by
the manufacturer. Several of the formulations required multiple extrusions steps. For example, the SPA
had to be compounded before it was further compounded with the PLA matrix. The plasticizer, PEG, also
had to be extruded individually with PLA before adding the filler materials (soy). Each formulation
required between one and three extrusion steps, depending on the composition. During the extrusion
process, the extruded material was pulled across a steel table and into a pelletizer. This process created
fertilizer pellets, or prills, that can be applied with traditional broadcast-style spreaders common in the
turfgrass industry.

19
CHAPTER 4
METHODOLOGY
Phase One: Turfgrass Trial
An initial screening experiment was conducted to confirm effect of fertilizer biocomposites on
turfgrass health and to reduce the number of formulations to analyze in the greenhouse testing. This
experiment was set up at the ISU Turfgrass Research Facility. With the aid of turfgrass specialists, a test
area was created on a plot that had not been fertilized or treated for approximately three years and
consisted of Clarion loam type soil. Individual, square test plots were defined (five feet on each side).
The testing area consisted of Park Kentucky Bluegrass, maintained to a height of three inches. Enough
plots were marked to test the 14 biobased material formulations, synthetic fertilizer, and Milorganite; as
well as their replicates. As stated previously, a standard application rate of one pound of nitrogen per
1000 ft2 was adopted. Three negative control groups (without fertilizer) were also included in the
experimental design and replicated just as each of the 16 treatments was. Each testing group had four
replicates that were randomly assigned throughout the testing area.
This test was conducted in the fall of 2015; fertilizers were applied in the second week of
September. Application was completed by hand, individually for each square plot to reduce cross
contamination between test plots. The fertilizers were “watered in” after application to reduce the risk
of nitrogen burning of the turfgrass by the synthetic material. After the initial application, no manual
watering was included in the procedure.
Data collected during the turfgrass trial was completely subjective and relied on visual data
collection with the assistance of turfgrass specialists. A numerical rating scale from 1 through 9 was used
to characterize growth. A score of 9 indicated an ideal lawn with dark green turfgrass. A score of 1 was
assigned to turf with a dark brown color, indicating it was dormant or dead. A score of 6 indicated turf
that was “least commercially acceptable”; a term used by specialists to define the minimum visual
quality for a commercially tended lawn. Data collection continued for an additional seven weeks after
application, until the turfgrass went into dormancy. Figure 3 shows the average visual health ratings for
each treatment. A slight decrease in visual data during the final week can be seen in Figure 3; indicating
the start of the dormant cycle for the fall and winter seasons.

20
Using the data in Figure 3, the best performing biocomposites were selected for further
investigations. The eight materials selected for greenhouse trials are listed in Table 3.
Figure 3 - Turfgrass plot visual health ratings over 7 week test.
3.50
4.00
4.50
5.00
5.50
6.00
6.50
7.00
Week 0 Week 1 Week 2 Week 3 Week 4 Week 5 Week 6 Week 7
Plo
t A
vera
ge V
isu
al R
atin
g
Experiment TImeline
Ctrl. Avg. Milorganite 3001 PLA-SPA 50/50
3001 PLA-SPA 40/60 3001 PLA-SPA 30/70 3001 PLA(5%PEG)-SPA 40/60
3001 PLA(10%PEG)-SPA 40/60 2003 PLA-SPA 50/50 2003 PLA-SPA 40/60
3001 PLA(5%PEG)-SPA 50/50 2003 PLA-SF 60/40 3001 PLA(10%PEG)-SPA 50/50
2003 PLA-SF 50/50 3001 PLA(5%PEG)-SPA 30/70 2003 PLA-SF 40/60
2003 PLA-Algae-SF 42.5/12.5/45 Synthetic 3001 PLA(10%PEG)-SPA 30/70
21
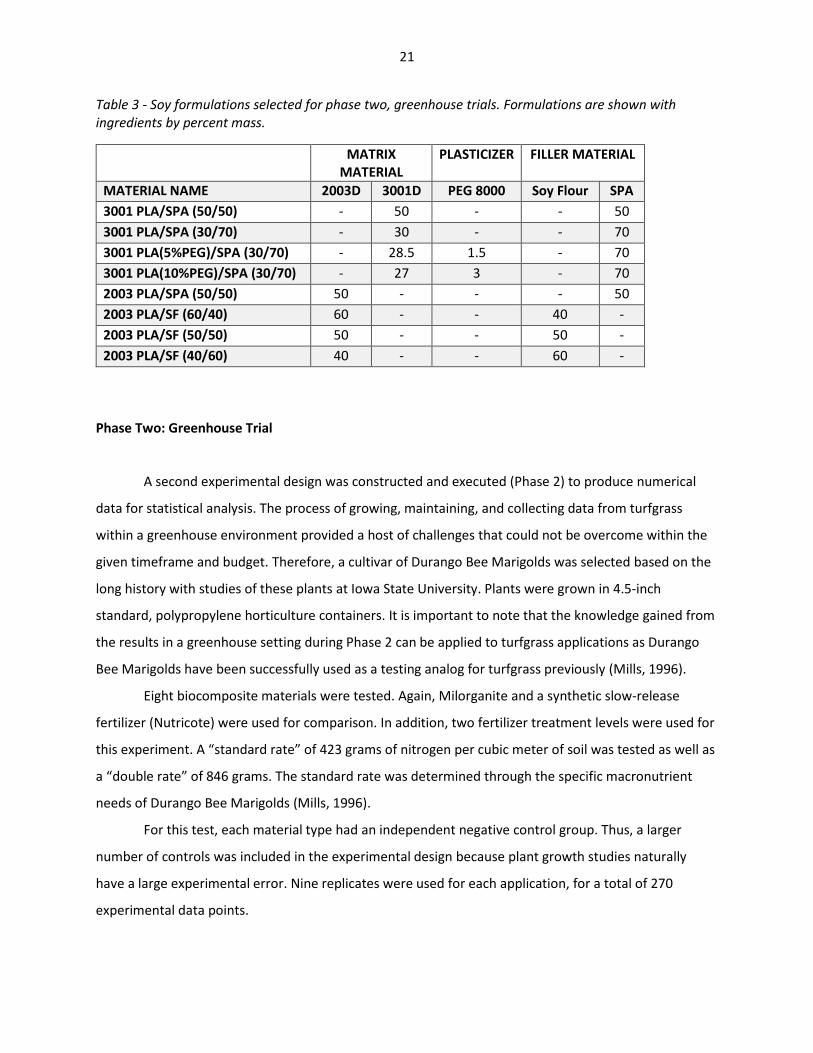
Table 3 - Soy formulations selected for phase two, greenhouse trials. Formulations are shown with ingredients by percent mass.
MATRIX MATERIAL
PLASTICIZER FILLER MATERIAL
MATERIAL NAME 2003D 3001D PEG 8000 Soy Flour SPA
3001 PLA/SPA (50/50) - 50 - - 50
3001 PLA/SPA (30/70) - 30 - - 70
3001 PLA(5%PEG)/SPA (30/70) - 28.5 1.5 - 70
3001 PLA(10%PEG)/SPA (30/70) - 27 3 - 70
2003 PLA/SPA (50/50) 50 - - - 50
2003 PLA/SF (60/40) 60 - - 40 -
2003 PLA/SF (50/50) 50 - - 50 -
2003 PLA/SF (40/60) 40 - - 60 -
Phase Two: Greenhouse Trial
A second experimental design was constructed and executed (Phase 2) to produce numerical
data for statistical analysis. The process of growing, maintaining, and collecting data from turfgrass
within a greenhouse environment provided a host of challenges that could not be overcome within the
given timeframe and budget. Therefore, a cultivar of Durango Bee Marigolds was selected based on the
long history with studies of these plants at Iowa State University. Plants were grown in 4.5-inch
standard, polypropylene horticulture containers. It is important to note that the knowledge gained from
the results in a greenhouse setting during Phase 2 can be applied to turfgrass applications as Durango
Bee Marigolds have been successfully used as a testing analog for turfgrass previously (Mills, 1996).
Eight biocomposite materials were tested. Again, Milorganite and a synthetic slow-release
fertilizer (Nutricote) were used for comparison. In addition, two fertilizer treatment levels were used for
this experiment. A “standard rate” of 423 grams of nitrogen per cubic meter of soil was tested as well as
a “double rate” of 846 grams. The standard rate was determined through the specific macronutrient
needs of Durango Bee Marigolds (Mills, 1996).
For this test, each material type had an independent negative control group. Thus, a larger
number of controls was included in the experimental design because plant growth studies naturally
have a large experimental error. Nine replicates were used for each application, for a total of 270
experimental data points.

22
Marigold seedlings were started four weeks prior to the start of the greenhouse growth
experiment. To reduce experimental error, only those seedlings with a relatively uniform plant height
were transplanted into the 4.5-inch containers for testing. Preparation of the containers included
metering of the fertilizers for each of the experimental pots. This allowed for the individual mixing of the
appropriate mass of fertilizer with the appropriate volume of soil for each of the 180 containers that
received a fertilizer treatment. Seedlings were watered directly after transplant and a random number
generator was used to disperse them throughout the growing area in the greenhouse.
Plants were grown for four weeks until they reached a suitable size, the equivalent of a sale-
sized plant at a nursery. During the growth period, a dry-growing process was used. This technique
refers to the watering of the plants to the point where the soil is saturated, but water does not flow
from the container.
Horticulture experts took visual health ratings. Shoot volume was measured based on the
maximum height, width, and depth of each plant’s shoot. The shoot is considered the part of the plant
that exists above the surface of the soil. Each plant was then harvested at the base, individually bagged,
and labelled; all bagged shoots were placed in a drier to remove all moisture to determine shoot dry
weight.
After harvesting of shoots, a pour-through method (Wright, 1990) was used to collect leachate
samples. The pour-through method was conducted by first watering the plants to saturation, 12 hours
prior to leachate collection. This ensures that all containers contain a similar amount of water before the
pour-through was conducted. For the collection of leachate samples, each pot was placed in secondary
containment and 70 mL of water was poured into the soil. The majority of this water (50-55 mL) exited
the bottom of the container as leachate and was collected. Five leachate and tissue samples were
randomly selected from each treatment group for nutrient analysis. These leachate and plant tissue
samples were sent for nutrient analysis of total nitrogen, phosphorous, and potassium to a third-party
analysis group, Minnesota Valley Testing Laboratories. While the leachate data does not directly
correlate to expected runoff values, researchers believe that there is a general relationship between the
two. Full-scale testing of each of these materials was not economically feasible, but could be considered
for future work once an optimal formulation is identified.
Statistical analysis was completed on the dependent variables. Each Pair, Student’s t-Test
statistical comparison was used within the latest version of JMP statistics software to compare the
differences between materials tested. A confidence level of 95% was applied to the statistical analysis.
This approach was adopted for all health and growth data collected during the greenhouse trials.

23
Techno-Economic Analysis
The most important factor for the economic viability of the proposed bio-fertilizer, outside of
material availability, is its cost competitiveness with current commercially available fertilizers. To
estimate the cost to produce the proposed bio-fertilizer, a techno-economic analysis (TEA) was
constructed to model its production at a given scale.
In order to conduct a TEA, a list of assumptions was generated. The assumptions for equipment,
production, and prices were all based on best possible estimates currently available. This model was
constructed to account for changes in material, nitrogen content, material cost, and processing. The
following list contains the major assumptions for the cost inputs of setting up a facility capable of
producing soy biocomposite fertilizers.
Extruder cost: $300,000
o Used 2,200 hours annually
o Output of 1,200 kg/h
o Power rating of 50 kW
Pelletizer cost: $5,000
o Used 2,200 hours annually
o Power rating of 7.5 kW
Material feeder cost: $2,500
o Used 2,200 hours annually
o Power rating of 5 kW
Material mixer cost: $7,500
o Used 550 hour annually
o Power rating of 10 kW
Four laborers
o 2,200 hours annually
o $12 per hour pay
o
Lifetime of ten years
Lease 4,000 ft2 commercial space
o $12 ft2 per year
Interest rate of 3.30%
One-time setup cost: $15,000
Straight-line depreciation of equipment
o Salvage value of 10%
Material costs were based on bulk wholesale prices. Cost of filler materials (soy flour and SPA)
were calculated to be $1.00 and $2.27 per kilogram, respectively. Wholesale price of the plasticizer
(PEG) was $1.30 per kg. The cost of both the 3001D and 2003D PLA averaged $2.25 per kilogram.
Input cost increased by 2% each subsequent year to adjust for rising material costs. Total
material production output increased at a rate of 5% per year to account for increases in efficiency as
laborers gain competency.

24
The model initially estimated the yearly annuity and depreciation. These numbers give time
value to the money originally invested in the company. Subsequently, using assumed material costs and
outputs, yearly material input and its cost could be calculated for production costs. Other production
costs were calculated on a yearly basis and can be scaled with overall production in the model. These
items include labor, electrical costs of equipment, water, cost of facilities, and yearly fixed costs. Yearly
fixed costs account for small charges that do not fluctuate, unlike other production costs that change
with production rates. We assumed this to be a fixed portion (10%) of the yearly annuity.
The individual costs were then totaled to calculate the annual operating cost. The annual
operating cost for each scenario (material formulation) was adjusted to account for the total amount of
nitrogen produced. This adjustment allows for comparison across all materials by eliminating error
associated with different nitrogen content in the fertilizers. This is especially important when comparing
a range of materials. In this case, operating cost was first adjusted to account for total kilograms of
production per year. Using the calculated cost per kilogram, the cost per pound of nitrogen can then be
determined by using the nitrogen content of each fertilizer produced. Dollars per pound of nitrogen is
the most useful functional unit (normalized unit) when comparing fertilizers because they are applied to
turfgrass using the nitrogen content.
Profits per year were estimated within the TEA by assigning a sale price to the fertilizer
produced. This sale price can be changed to estimate yearly profits, or estimate the amount of time
required to “break even” with regard to the initial investment. The Solver add-in within Microsoft Excel
was used to calculate the break-even cost for each material. This was completed by totaling the yearly
profits over the 10-year lifespan. In Solver, the profit total was set to zero and the Solver was given the
option to change the sale cost of the material. This adjusted the sale cost to the minimum price to break
even over the 10-year period.
Life Cycle Assessment
For this analysis, a software package known as GaBi was used to create the LCA models. GaBi
contains a range of the materials and processes used during the manufacturing of the biocomposites,
but many processes required individual data generation within the software. The software has the
capability of calculating all environmental impacts with a properly constructed model.
The goal of the LCA was to determine the environmental impact associated with the production
of soy-based biocomposite fertilizers. Knowing the goal allows a system boundary to be set. Terms often
25
used in LCA creation are “cradle”, “gate”, and “grave”. Cradle refers to the extraction of raw resources
to be used in the system. Gate is a term used to describe the gateways of different processes within
manufacturing. Grave refers to the end use and utilization of the product created. As only the
manufacturing of the biocomposites is under investigation, a “cradle-to-gate” approach was used here.
That is, the analysis considers all factors from raw resource harvest to production of a finished good. A
functional unit has to be set to allow normalization and comparison of all obtained results. Here we
used the functional unit of one pound of nitrogen for the analysis. This functional unit was selected
because the amount of nitrogen is typically the standard for the application of fertilizer (typical
application rates often use one pound of nitrogen per 1000 ft2).
The next step within an LCA is the collection of the life cycle inventory. This inventory accounts
for all inputs and outputs from the system that could have an environmental impact. The flows of
materials were determined during the TEA and were subsequently applied to the LCA. Flows in this
system included water, electricity, raw materials, and wastes. Many of the processes studied already
existed within the GaBi software; those that did not already exist, such as the extraction of soy flour,
were manually added to GaBi’s database by using literature values and constructing the process to
reflect the published values. An example of literature useful for Life Cycle Assessment data collection is
an LCA conducted on NatureWork’s Ingeo processing (Vink, 2003) which was used to provide
information on the cradle-to-gate production of PLA.
The third step, assessment of environmental impact, is typically a long and tedious process.
Although setting up processes within GaBi can be initially a very long process, the software saves time
and work during this third step. With the advent of GaBi the assessment process is simple and all
impacts are calculated by the software and shown in the “Balances” tab. These values can be exported
for further assessment. When properly built, the models within GaBi adjust for the functional unit and,
in this case, supply data relating to 1 pound of nitrogen for each of the materials investigated.
The fourth, and final, step of an LCA is to interpret the results obtained. Before interpretation, it
is important to be certain that all comparisons of calculated environmental impacts are in the same
units as the literature values for the standard fertilizers they will be compared against them.
Results obtained for the production of soy-based biocomposites were compared to literature
values for the cradle-to-gate production of commercial fertilizers. Publications relating to the synthetic
fertilizer (Nutricote) and bio-based alternative (Milorganite) could not be obtained. Instead, production
values for the synthesis of ammonium nitrate and the production of urea were used for LCA

26
comparisons. Literature values for comparisons are taken from the publication “Life Cycle Assessment of
Fertilizers: A Review”, by Skowrońska (2014).

27
CHAPTER 5
RESULTS AND DISCUSSION
Greenhouse Photographs
Figures 4 to 13 show photographs of random samples selected from each treatment group. Each
photograph shows a plant that received no fertilizer (left), a plant that received the standard application
rate of 423 grams nitrogen per cubic meter of soil (center), and a plant that received the high
application rate of 846 grams nitrogen per cubic meter of soil (right). Photographs are shown here to
support data presented for shoot dry weight, shoot volume, and plant visual health in the following
section. Some forms of traditional fertilizer are susceptible to nutrient burning plants. A major
observation made during the greenhouse experiment was the ability of the soy-based fertilizer to
nutrient burn the plants when fertilizer is over applied; this can be observed easiest in the photographs
provided. Figure 11, specifically, shows the formulation which caused the worst nutrient burning when
over applied.
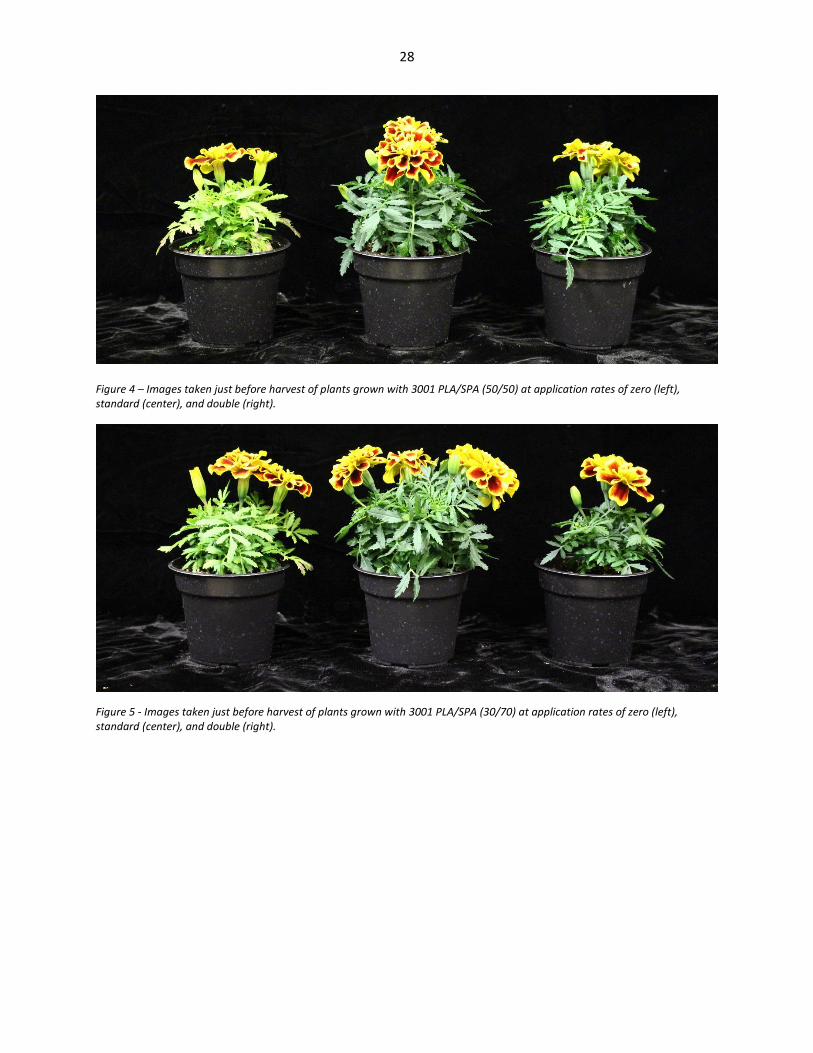
28
Figure 4 – Images taken just before harvest of plants grown with 3001 PLA/SPA (50/50) at application rates of zero (left), standard (center), and double (right).
Figure 5 - Images taken just before harvest of plants grown with 3001 PLA/SPA (30/70) at application rates of zero (left), standard (center), and double (right).

29
Figure 6 - Images taken just before harvest of plants grown with 3001 PLA(5%PEG)/SPA (30/70) at application rates of zero (left), standard (center), and double (right).
Figure 7 - Images taken just before harvest of plants grown with 3001 PLA(10%PEG)/SPA (30/70) at application rates of zero (left), standard (center), and double (right).

30
Figure 8 - Images taken just before harvest of plants grown with 2003 PLA/SPA (30/70) at application rates of zero (left), standard (center), and double (right).
Figure 9 - Images taken just before harvest of plants grown with 2003 PLA/SF (60/40) at application rates of zero (left), standard (center), and double (right).

31
Figure 10 - Images taken just before harvest of plants grown with 2003 PLA/SF (50/50) at application rates of zero (left), standard (center), and double (right).
Figure 11 - Images taken just before harvest of plants grown with 2003 PLA/SF (40/60) at application rates of zero (left), standard (center), and double (right).

32
Figure 12 - Images taken just before harvest of plants grown with Milorganite at application rates of zero (left), standard (center), and double (right).
Figure 13 - Images taken just before harvest of plants grown with synthetic fertilizer (Nutricote) at application rates of zero (left), standard (center), and double (right).
Shoot Dry Weight
The statistical results are presented in charts referred to as a “connecting letters chart”. The
tables consist of sets of letters assigned to the biocomposites based on their statistical difference, or
lack of difference, from other fertilizers. In more detail, materials (population sets) were assigned the
same letter if there was no statistical difference compared to other materials also assigned this letter.

33
Materials are often assigned multiple letters corresponding to various population sets. The connecting
letters charts for plant growth and health data can be seen below.
The average shoot dry weight (SDW) was one of the key indicators (independent variables) for
yield used in the greenhouse experiments. With all other growth factors being equal (dependent
parameters: light, water, soil type, and plant species), the differences in shoot dry weight indicate
effectiveness of the fertilizing nutrients made available to the plant.
Table 4 shows the average shoot dry weight in grams for different fertilizer formulations using
the standard application rate of fertilizer. It is important to note that the negative control (no fertilizer)
was assigned its own letter and that it mean value 2.379 g was the lowest of all of the populations. This
indicates that plants receiving any of the soy-based fertilizer performed statistically better than
receiving no fertilizer. There were only two materials that did not statistically perform as well as the
synthetic fertilizer: 2003 PLA/SF (60/40), and 3001 PLA (10% PEG)/SPA (30/70). The balance of the soy-
based composites showed no statistical difference in terms of shoot dry weight yield.
Table 4 - Shoot dry weight (SDW) averages, displayed in grams, for each fertilizer type using standard application rate.
MATERIAL
MEAN (G) STD DEV
MILORGANITE A
3.857 0.695
2003 PLA/SF (50/50) A B
3.552 0.362
SYNTHETIC FERTILIZER
B C
3.374 0.387
2003 PLA/SF (40/60)
B C D
3.211 0.704
3001 PLA/SPA (50/50)
C D
3.137 0.419
3001 PLA(5%PEG)/SPA (30/70)
C D
3.081 0.455
3001 PLA/SPA (30/70)
C D
3.031 0.635
2003 PLA/SPA (50/50)
C D
3.002 0.547
2003 PLA/SF (60/40)
D
2.856 0.429
3001 PLA(10%PEG)/SPA (30/70)
D
2.842 0.645
NEGATIVE CONTROL
E 2.378 0.335

34
Shoot Volume
Shoot volume is another indicator of plant health. Generally, the shoot volume correlates with
shoot weight. Table 5 shows the mean shoot volume (in cubic centimeters) for each soy-based fertilizer
type and the standard application rate of fertilizer. In this table, the negative control group is given its
own letter group. This indicates that all fertilizers performed statistically better at producing larger
plants when compared to applying no fertilizer.
Table 5 - Shoot volume in cm3 for each material using standard application rate.
MATERIAL
MEAN (CM3) STD DEV
2003 PLA/SF (50/50) A
3506 437
MILORGANITE A B
3158 814
2003 PLA/SPA (50/50) A B
3158 541
3001 PLA/SPA (50/50)
B C
3083 346
2003 PLA/SF (60/40)
B C
3057 467
3001 PLA(5%PEG)/SPA (30/70)
B C
2976 362
3001 PLA(10%PEG)/SPA (30/70)
B C
2901 532
2003 PLA/SF (40/60)
B C
2872 683
SYNTHETIC FERTILIZER
B C
2800 396
3001 PLA/SPA (30/70)
C
2736 438
NEGATIVE CONTROL
D 1914 359
Visual Health Rating
The visual health ratings of plants is subjectively based that relies on visual observations by
researchers. A rating system of 1 through 5 was used to assign scores to each plant in the series; 5 being
ideal and 1 being brown/dead. Average visual health ratings are detailed in Table 6. The statistical

35
comparison shown in Table 6 indicates that most of the fertilizers produced acceptable, healthy plants
that outperformed the control group. Although the synthetic fertilizer produced an acceptable plant, it
was not as appealing as the plants that received other fertilizers.
Table 6 - Average visual health ratings for each material type under standard application rate. Visual grading scale went from 1 (dead, brown plant) to 5 (lush, dark green plant).
MATERIAL
MEAN STD DEV
2003 PLA/SF (40/60) A
5.00 0.00
2003 PLA/SF (50/50) A
5.00 0.00
2003 PLA/SF (60/40) A
5.00 0.00
2003 PLA/SPA (50/50) A
5.00 0.00
3001 PLA(10%PEG)/SPA (30/70) A
5.00 0.00
3001 PLA(5%PEG)/SPA (30/70) A
5.00 0.00
3001 PLA/SPA (30/70) A
5.00 0.00
3001 PLA/SPA (50/50) A
5.00 0.00
MILORGANITE A
4.92 0.18
SYNTHETIC FERTILIZER
B
4.44 0.30
NEGATIVE CONTROL
C 3.60 0.39
Leachate Acid/Base Characterization
The average pH of leachate samples are detailed in Table 7. The range of leachate pH observed
varied between 6.54 to 6.71. The level of pH of the leachate samples is an indicator of chemical effects
caused by the growing medium or fertilizer on the water passing through them. Changes in pH can
promote adverse effects to plant health as well as other effects. Fertilizers typically decreases the pH
because of their tendencies to form acids. This can be seen in the results in Table 7 as both the synthetic
and Milorganite leachate samples have relatively low average pH levels.

36
Table 7 - Average pH of leachate samples for each materials type. Standard application rate of fertilizer.
MATERIAL
MEAN (PH) STD DEV
3001 PLA/SPA (30/70) A
6.71 0.11
NEGATIVE CONTROL A B
6.67 0.11
2003 PLA/SPA (50/50) A B C
6.66 0.09
3001 PLA(5%PEG)/SPA (30/70) A B C
6.64 0.09
3001 PLA(10%PEG)/SPA (30/70) A B C D 6.63 0.07
2003 PLA/SF (50/50) A B C D 6.63 0.14
2003 PLA/SF (60/40)
B C D 6.60 0.07
3001 PLA/SPA (50/50)
B C D 6.60 0.05
MILORGANITE
B C D 6.60 0.07
SYNTHETIC FERTILIZER
C D 6.59 0.06
2003 PLA/SF (40/60)
D 6.54 0.12
Leachate Electrical Conductivity
The electrical conductivity (EC) of leachate samples is typically measured by horticulture
specialists when examining the effects of fertilizers or growing mediums. The EC is influenced by
physical and chemical properties including soluble salts, clay content, mineralogy, organic matter, and
other factors. The level of EC of a leachate sample is a measure of ions present in the sample, and can be
used as an indicator of the amount of nutrients present in the sample. Electrical conductivity is
measured in units of Siemens per unit area (here the data is reported in milliSiemens per square
centimeter (mS/cm2).
Table 8 shows the EC of leachate samples collected after fertilization with different soy-based
and comparison fertilizers under the standard application rate. Three leachate samples contained similar
EC levels as the negative control group, indicating they would likely have lower amounts of nutrient

37
runoff in a turfgrass situation. These materials were 2003 PLA/SF (50/50), synthetic fertilizer, and 2003
PLA/SF (60/40). All other fertilizers were shown to result in higher leachate EC readings.
Table 8 - Electrical conductivity (EC) measured in milliSiemens per square centimeter (mS/cm2). Data is for all material types using standard application rate of fertilizer.
MATERIAL
MEAN (MS/CM2) STD DEV
2003 PLA/SF (40/60) A
2.36 0.23
3001 PLA/SPA (30/70) A
2.31 0.42
3001 PLA(10%PEG)/SPA (30/70) A B
2.24 0.48
2003 PLA/SPA (50/50) A B C
2.22 0.27
3001 PLA(5%PEG)/SPA (30/70) A B C D
2.19 0.50
MILORGANITE A B C D
2.14 0.60
3001 PLA/SPA (50/50) A B C D
2.09 0.29
2003 PLA/SF (60/40)
B C D E 1.93 0.33
SYNTHETIC FERTILIZER
C D E 1.89 0.31
2003 PLA/SF (50/50)
D E 1.84 0.31
NEGATIVE CONTROL
E 1.70 0.36
Tissue Nutrients
The nutrients held within the plant’s tissue are an indication of how much fertilizer the plants
had access to and took up during their growing cycle. The optimal level of nutrients, in percent mass, in
the tissue are listen in horticultural textbooks and will be used for comparison. Table 9 details the
optimal tissue for marigold plant nutrient levels of all three macronutrients by percent mass (Mills,
1996).
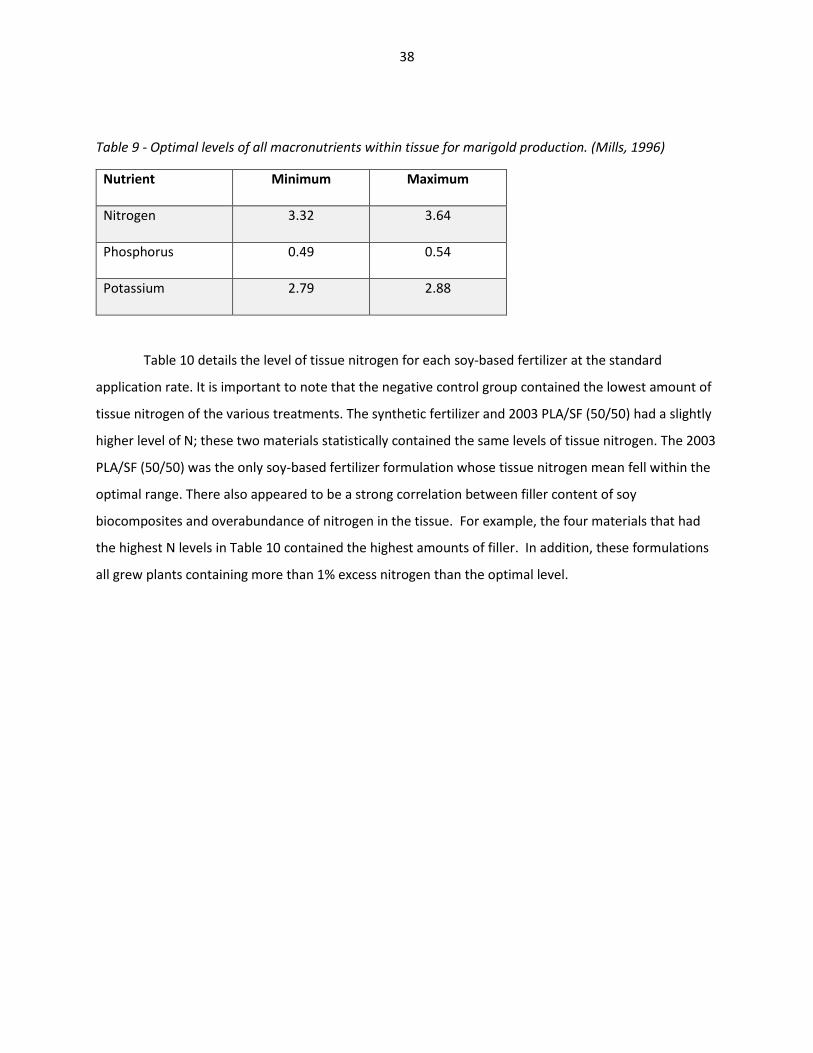
38
Table 9 - Optimal levels of all macronutrients within tissue for marigold production. (Mills, 1996)
Nutrient Minimum Maximum
Nitrogen 3.32 3.64
Phosphorus 0.49 0.54
Potassium 2.79 2.88
Table 10 details the level of tissue nitrogen for each soy-based fertilizer at the standard
application rate. It is important to note that the negative control group contained the lowest amount of
tissue nitrogen of the various treatments. The synthetic fertilizer and 2003 PLA/SF (50/50) had a slightly
higher level of N; these two materials statistically contained the same levels of tissue nitrogen. The 2003
PLA/SF (50/50) was the only soy-based fertilizer formulation whose tissue nitrogen mean fell within the
optimal range. There also appeared to be a strong correlation between filler content of soy
biocomposites and overabundance of nitrogen in the tissue. For example, the four materials that had
the highest N levels in Table 10 contained the highest amounts of filler. In addition, these formulations
all grew plants containing more than 1% excess nitrogen than the optimal level.

39
Table 10 - Percent by mass of nitrogen within tissue sample for plants grown with each material type under standard application of fertilizer. Optimal level of nitrogen is between 3.32 and 3.64%.
MATERIAL
MEAN (% MASS) STD DEV
3001 PLA(10%PEG)/SPA (30/70) A
4.52 0.38
2003 PLA/SF (40/60) A
4.39 0.45
3001 PLA(5%PEG)/SPA (30/70) A B
4.30 0.26
3001 PLA/SPA (30/70)
B C
3.88 0.67
2003 PLA/SF (60/40)
B C
3.88 0.22
3001 PLA/SPA (50/50)
C
3.72 0.38
2003 PLA/SPA (50/50)
C
3.69 0.21
MILORGANITE
C
3.68 0.65
2003 PLA/SF (50/50)
C D
3.48 0.14
SYNTHETIC FERTILIZER
D
3.00 0.43
NEGATIVE CONTROL
E 1.32 0.37
The results of the phosphorus study indicated that the soy biocomposites performed well
compared to the synthetic fertilizer and negative controls, as detailed in Table 11. In more detail, the
synthetic fertilizer had no statistical difference compared to the negative control group. The Milorganite
fertilizer grew plants containing nearly optimized levels of phosphorus in this experiment (0.485 %).
However, it did not statistically outperform the 2003 PLA/SF (60/40) formulation. The soy biocomposite
2003 PLA/SF (40/60) was the only fertilizer that resulted in plants containing levels of phosphorus higher
than the optimal level (0.645%).

40
Table 11 - Percent by mass of phosphorus within tissue sample for plants grown with each material type under standard application of fertilizer. Optimal level of tissue phosphorus is between 0.49 and 0.54%.
MATERIAL
MEAN (% MASS) STD DEV
2003 PLA/SF (40/60) A
0.645 0.104
MILORGANITE
B
0.485 0.063
2003 PLA/SF (60/40)
B C
0.430 0.055
2003 PLA/SF (50/50)
C D
0.414 0.053
3001 PLA(10%PEG)/SPA (30/70)
C D
0.394 0.072
3001 PLA/SPA (30/70)
C D E
0.384 0.081
3001 PLA(5%PEG)/SPA (30/70)
D E F
0.357 0.043
2003 PLA/SPA (50/50)
E F
0.325 0.062
3001 PLA/SPA (50/50)
F G
0.307 0.037
SYNTHETIC FERTILIZER
G H 0.254 0.024
NEGATIVE CONTROL
H 0.247 0.030
As seen in Table 12, all soy-based biocomposites grew plants containing higher levels of
potassium within the tissue compared to the negative control group and the commercial fertilizers. In
addition the synthetic fertilizer, Milorganite, and the negative control group performed similar and
contained approximately 1% less potassium than desired. In comparison, the marigolds fertilized with
the SPA biocomposite contained levels of tissue potassium closer to the optimum amount, ranging from
2.76 to 3.09. However, formulations containing SF on average resulted in higher levels of tissue
potassium compared to SPA formulations, ranging from 3.04 to 3.32%. It is important to note that the
highest levels are approximately 0.5% too high.

41
Table 12 - Percent by mass of potassium within tissue sample for plants grown with each material type under standard application of fertilizer. Optimal level of potassium is between 2.79 and 2.88%.
MATERIAL
MEAN (% MASS) STD DEV
2003 PLA/SF (60/40) A
3.32 0.34
2003 PLA/SF (40/60) A
3.19 0.54
3001 PLA(10%PEG)/SPA (30/70) A B
3.09 0.49
2003 PLA/SF (50/50) A B
3.04 0.17
2003 PLA/SPA (50/50) A B
2.97 0.62
3001 PLA/SPA (50/50) A B
2.93 0.25
3001 PLA/SPA (30/70) A B
2.93 0.53
3001 PLA(5%PEG)/SPA (30/70)
B
2.76 0.21
SYNTHETIC FERTILIZER
C 1.76 0.15
MILORGANITE
C 1.64 0.26
NEGATIVE CONTROL
C 1.62 0.24
Leachate Nutrients
The nutrient leachate studies were completed to estimate the level of nutrient runoff that
would likely be observed, although it is not a direct measurement of the predicted runoff. The leachate
samples were collected following the standard pour-through collection process (Wright, 1990) and sent
to a third party for nutrient analysis techniques.
It was hypothesized that soy-based biocomposite fertilizers would result in less nutrient
pollution compared to synthetic fertilizers. In this analysis, the negative control group corresponded to
the minimum levels of expected leachate nutrients. The data for phosphorus and potassium is reported
in parts per million (PPM), while the nitrogen data is reported in percent mass.
The data collected on nitrogen leachate was inconclusive. Numbers returned from MVTL
indicated no difference in nitrogen leachate for any of the materials or treatment rates. The testing

42
equipment used to analyze leachate samples did not have the accuracy needed to discern any
differences. All data returned from MVTL indicated a leachate level of 0.01%.
The conclusion that can be drawn from these results is that materials tested performed well
enough to show no discernable difference in terms of nitrogen levels in leachate. The extremely low
levels of nitrogen within the leachate may be an indicator that materials tested performed exceedingly
well as slow-release fertilizers.
Table 13 details the average level of phosphorus found in the leachate samples collected from each
material at the standard application rate. Three materials showed statistical differences from one
another and the negative control group. These materials were: 3001 PLA/SPA (30/70), 3001 PLA/SPA
(50/50), and 2003 PLA/SF (40/60). All three materials contained higher levels of phosphorus compared
to all other fertilizers, containing 5.07 to 8.53 ppm in comparison to the 1.30 ppm found for the negative
control. All other fertilizer materials showed no statistical difference in phosphorus content in leachate
from the negative control group. It was hypothesized that the high levels of phosphorus are attributed
to the large filler to matrix ratio of the formulations and their lack of plasticizer. Similar material
formulations contained as high as 70% filler, but did not have statistically different levels of phosphorus
leachate when they included a plasticizer, indicating the addition of PEG allowed for better utilization of
the phosphorus in those formulations.

43
Table 13 - Parts per million (ppm) of phosphorus within leachate sample from plants grown with each material type under standard application of fertilizer.
MATERIAL
MEAN (PPM) STD DEV
3001 PLA/SPA (30/70) A
8.53 2.64
3001 PLA/SPA (50/50)
B
6.60 1.68
2003 PLA/SF (40/60)
C
5.07 2.35
3001 PLA(10%PEG)/SPA (30/70)
D 1.84 0.97
2003 PLA/SF (50/50)
D 1.82 0.37
2003 PLA/SF (60/40)
D 1.71 0.41
MILORGANITE
D 1.62 0.45
3001 PLA(5%PEG)/SPA (30/70)
D 1.54 0.56
2003 PLA/SPA (50/50)
D 1.54 1.01
NEGATIVE CONTROL
D 1.30 1.09
SYNTHETIC FERTILIZER
D 0.93 0.19
Table 14 details the levels of potassium in leachate samples collected from plants grown at the
standard application rate of fertilizers. Five of the fertilizers tested performed similarly to the negative
control group according to the data collected. These materials were: 2003 PLA/SPA (50/50), Milorganite,
synthetic fertilizer, 3001 PLA/SPA (30/70), and 3001 PLA/SPA (50/50). All other materials produced up to
twice as much potassium in the leachate when compared to the negative control group at 0.82 ppm.

44
Table 14 - Parts per million (ppm) of potassium within leachate sample from plants grown with each material type under standard application of fertilizer.
MATERIAL
MEAN (PPM) STD DEV
2003 PLA/SF (60/40) A
1.85 0.55
3001 PLA(10%PEG)/SPA (30/70) A B
1.65 0.97
2003 PLA/SF (40/60) A B
1.61 0.66
3001 PLA(5%PEG)/SPA (30/70) A B
1.40 0.46
2003 PLA/SF (50/50) A B
1.37 0.26
2003 PLA/SPA (50/50)
B C 1.07 0.64
NEGATIVE CONTROL
C 0.82 0.59
MILORGANITE
C 0.66 0.22
SYNTHETIC FERTILIZER
C 0.62 0.09
3001 PLA/SPA (30/70)
C 0.45 0.15
3001 PLA/SPA (50/50)
C 0.39 0.18
Effect of Type of Soy Filler
Two base materials were considered (soy protein isolate and soy flour) to determine if the
relatively inexpensive soy flour was able to perform as well as the more refined SPA (SPI-based plastic)
soy filler. Both formulations had the same matrix to filler ratio, used the same matrix material, and
contained no plasticizer. It is important to note that the resulting formulations had the same amount of
SF and SPA (SPI) plastic filler and thus had various levels of N levels because SPA had a higher level of
nitrogen-rich protein. The varying amount of nitrogen was accounted for by adjusting the amount of
fertilizer applied (rate).The material formulations used to determine this effect were:
2003 PLA/SF (50/50)
2003 PLA/SPA (50/50).

45
It was determined that the only statistically significant differences were their electrical
conductivity and the level of phosphorus in the collected tissue samples. As shown in Tables 9 and 12,
the two materials were assigned different letters for each of these independent variables.
In more detail, it was determined that the formulation that contained SF resulted in a lower soil
EC, suggesting a lower loss of nutrients through leaching. In this experiment the negative control group
had an average EC of 1.70 mS/cm2 and was used as the baseline as it represented the lowest expected
leachate values. The formulation containing SF had an average EC of 1.84 mS/cm2 and the SPA-based
formulation had an EC of 2.22 mS/cm2. It was theorized that the plant’s utilization of nutrients from the
soy flour was superior to that of the SPA. This could have been caused by the higher water stability of
the SPA formulation compared to the SF. The higher water stability in the SPA is prmoted by the
crosslinking agents added during extrusion to increase processability and decreased the degradability of
the SPA.
In order to compare tissue phosphorus levels, it is proposed to compare the measured values to
the optimal level of tissue nutrients as detailed in Table 9. The optimal level of phosphorus in the tissue
is 0.49 to 0.54% (Mills, 1996). The formulation containing SF produced plants with an average of 0.414%
phosphorus, which was closer to the optimum level compared to the SPA formulation’s average of
0.325%. This result was contributed to the fact that higher levels of phosphorus were found in the soy
flour formulation, as detailed in Table 3.

46
Filler to Matrix Ratio Effect
The ratio of filler (soy) to matrix (PLA) had the dominant effect in terms of fertilizing effects
compared to the other independent variables that were studied within the experimental design space.
This is consistent with the theory that the filler content is directly proportional to the degradation rate
and the amount of nutrients released. In more detail, formulations containing more filler material
required a lower application rate as they contained higher levels of nutrients. Higher filler loading levels
correlated to lower matrix content, increasing the degradation rate and rate of nutrient release. Three
formulations were selected to determine the effects of the matrix to filler ratio. The biocomposites
contained the same PLA matrix type (2003 PLA), had no plasticizer, and used the same filler material
(SF). The formulations examined were:
2003 PLA/SF (60/40)
2003 PLA/SF (50/50), and
2003 PLA/SF (40/60).
It was determined that there were statistically significant differences between these three
formulations for average shoot dry weight, shoot volume, tissue nitrogen, tissue phosphorus, and levels
of phosphorus in the leachate.
As detailed in Table 4, the average shoot dry weight was not statistically different between the
40/60 mixture and either of the other two other materials. However, the formulation with 50/50
(PLA/SF) was statically better than the 60/40 (PLA/SF) material as indicated by the differences in the
connecting letters chart (Table 4). The average shoot dry weight for each of the three materials was
2.856 g, 3.552 g, and 3.211 g for the 60/40, 50/50, and 40/60 formulations, respectively. The likely
explanation for the 40/60 (PLA/SF) material’s poor plant growth was that the nutrients were released
too quickly, stunting plant growth. That is to say, over-fertilization with nitrogen can often “burn” plants,
causing inhibited growth.
Table 5 details the average shoot volume for each formulation type. The formulation containing
a 50/50 mixture showed statistically larger shoot volumes compared to the other two formulations.
Results showed that the average shoot volume was 3057, 3506, and 2872 cm3 for the 60/40, 50/50, and
40/60 formulations, respectively. Similarly to shoot dry weight results, the 40/60 material formulation
likely released nutrients too quickly during the growth period and inhibited plant growth.
Nitrogen content in the plant tissue is detailed in Table 10; it was found that the 40/60 (PLA/SF)
formulation was statistically different from the other two materials. The average tissue nitrogen for

47
each of the formulations was 3.88, 3.48, and 4.39% for the 60/40, 50/50, and 40/60 formulations,
respectively. It is important to note that the optimal level of tissue nitrogen ranges between 3.32 and
3.64% (Mills, 1996) and only the 50/50 formulation fell within this range. The other two formulations
(40/60 and 60/40) exhibited levels above the optimum amount, with 40/60 significantly above optimal.
Higher levels of tissue nitrogen for the 2003 PLA/SF (40/60) material are likely caused by the higher filler
content (nutrient content). As seen in Table 10, there appears to be a very strong correlation between
filler content and increased nitrogen levels in the tissue.
In reference to the phosphorous tissue levels, Table 11 indicates that while two formulations
(60/40 and 50/50) were statistically similar, the third formulation (40/60) was statistically different. The
optimum level of tissue phosphorus ranges between 0.49 and 0.54% (Mills, 1996). As seen in Table 11,
none of the biocomposite formulations fell within this relatively small window. The 40/60 formulation
resulted in a higher than optimum phosphorus level, at 0.645% tissue phosphorus. The formulations
containing 60/40 and 50/50 mixtures fell below the optimal level with 0.430 and 0.414%, respectively. It
is assumed that the higher tissue nutrient levels were caused by the increased filler content in the
formulation. As previously noted, higher filler content increases degradation rate as well as nutrient
release rates.
A statistically significant difference was also observed in the average level of phosphorus in the
leachate samples, as detailed in Table 13. The formulation containing a 40/60 (PLA/SF) mixture was
statistically different from the other two formulations. The two formulations containing lower levels of
filler (60/40 and 50/50) did not have a statistically higher levels of phosphorus in leachate compared to
the negative control group. The phosphate levels were 1.71, 1.82, and 1.30 ppm for 60/40, 50/50, and
the negative control, respectively. Inversely, the 40/60 mixture were significantly higher levels of
phosphorus, at 5.07 ppm. The filler content strongly correlated to the phosphorus level in the leachate.
That is, the materials with lower filler contents produced leachate with lower levels of phosphorus. This
is likely because of the higher degradation rates associated with higher filler contents.
Plasticizer Effect
To determine the effects of plasticizer, three levels of plasticizer content were studied. The
plasticizer used during these trials was polyethylene glycol. The formulations contained the same base
polymer matrix (3001 PLA), type of soy filler (SPA), and filler content (70%); however, the plasticizer
content was varied between 0, 5, and 10% wt. of the matrix weight. The plasticizer did not replace any

48
of the filler material, but rather the matrix in order to assure the content remained the same. In more
detail, the formulations under review to determine the effect of plasticizer were:
3001 PLA/SPA (30/70)
3001 PLA(5%PEG)/SPA (30/70), and
3001 PLA(10%PEG)/SPA (30/70).
In summary, the statistical analysis suggested that the plasticizer had an effect on tissue
nitrogen and on levels of phosphorus and potassium in leachate. As detailed in Table 10, the
formulations containing plasticizer had statistically higher levels of nitrogen in the plant tissue. Optimal
levels of tissue nitrogen for marigolds range between 3.32 and 3.64% (Mills, 1996). Levels of nitrogen in
tissue measured in this investigation were 4.52, 4.30, and 3.88% for formulations containing 10, 5, and
0% PEG, respectively. While all three materials produced plants containing higher than optimal levels of
tissue nitrogen, nitrogen level was generally proportional to PEG levels.
Table 13 details the average levels of phosphorus found in leachate samples. The samples
containing 5 and 10% PEG contained statistically lower levels of phosphorus in the leachate than
formulations without PEG at 1.54 and 1.84 ppm respectively. The formulation containing no plasticizer
had the highest level of leachate phosphorus (8.53 ppm).
Table 14 details the potassium levels in leachate for the various formulations, and it is seen that
there is no statistical difference between formulations containing 10 and 5% PEG (1.65 and 1.40 ppm of
potassium, respectively). However, the formulation containing no plasticizer was statistically different
from the formulations with PEG, containing 0.45 ppm of potassium in leachate.
Effect of Polymer Grade
To determine the effect of the polymer matrix (PLA) grade, two materials were studied. The
materials selected were NatureWorks 2003D and 3001D polylactide (PLA). These two materials were
selected because these biopolymers are known to have higher degradation rates while retaining much
of the processability associated with higher grades. While there are other grades available within the
two and three thousand series, many contain modifications such as lubricants. The 2003D and 3001D
polymers were selected because they are the base resins and lack additional modifications which may
change the results. The two formulations that were used for this comparison were:
2003 PLA/SPA (50/50)
3001 PLA/SPA (50/50).

49
In summary, it was determined that the grade of polymer chosen had a statistically significant
effect only on the level of phosphorus within leachate.
The average levels of phosphorus found in leachate samples are detailed in Table 13. The table
shows the statistical difference between 2003D and 3001D PLA. The formulations containing 3001D PLA
caused phosphorus levels in leachate of 6.60 ppm while the 2003D PLA showed an average phosphorus
level in leachate of 1.54 ppm and was not statistically different from the negative control group at 1.30
ppm.
The variance of the phosphorus levels in the leachate of these two materials was likely caused
by the differences of phosphorus in the formulation. As seen in Table 3, the formulation containing 2003
PLA had a higher ratio of phosphorus to nitrogen compared to the 3001 PLA-based biocomposite.
Fertilizer is applied by nitrogen content and therefore more phosphorus is applied when using the 2003
PLA based formulation.
Effect of Application Rate
It is important to note that the standard application rate used for the greenhouse experiment
was 423 g of nitrogen per cubic meter of soil, while the highest rate that was studied was two times this
value at 846 g per cubic meter of soil. The results obtained for each of these application rates are
compared below in the following figures. The negative control group, no fertilizer, is shown for
comparison as well.
Figure 14 shows the shoot dry weight (SDW) for both the standard and high application rate. It
is seen that neither fertilizer formulation showed a statistically significant increase in SDW when
increasing from standard to high application rates. Some growth indicators saw a large decrease when
the application rate was doubled; indicating that over fertilization of soy-based fertilizers is a concern. It
is important to note that there was significantly lower shoot weights for soy-based fertilizers when using
the higher application rate. Five of the eight soy biocomposite materials saw statistically lower SDW
values when the double application rate was used. In addition, several soy-fertilizers at the higher rates
resulted in lower weights compared to the negative control group; this indicates that overdosing of soy-
based fertilizers can decrease overall yield. Milorganite also produced a lower SDW when the
application rate was doubled, although it was not significantly lower.

50
Figure 14 - Shoot dry weight (SDW) displayed in grams for the standard and double application rates. Negative control shown in gray.
Figure 15 shows the average shoot volume for both the standard and the double application
rates. The trends are similar to shoot dry weights seen in Figure 13. The same five soy biocomposites
that showed lower SDWs at the higher rate also showed statistically lower shoot volumes. Again, the
synthetic fertilizer showed a slight increase in shoot volume when applied at a double rate, although the
increase was not statistically significant. It was theorized that decreases in SDW and shoot volume for
soy biocomposites were caused by nutrient “burning”. That is, nutrients were released more quickly
than the plant was able to use them, creating a toxic environment that inhibits growth.
0.0
1.0
2.0
3.0
4.0
5.0G
ram
s
Standard Rate
Double Rate
51
Figure 15 - Shoot volume displayed in cm3 for each material type using standard and high application rates. Negative control shown in gray.
The results of fertilizer effect on soil acidity are seen in Figure 16. The effect of application rate
on the pH of leachate samples was generally an inverse relationship for the soy-based fertilizers. The
Milorganite fertilizer resulted in the largest decrease in pH between the two rates, dropping from a 6.60
average to 6.01. Decreases in leachate pH are attributed to the fertilizer’s inherent acidity, which is
magnified by higher application rates. Although the synthetic fertilizer resulted in a slight increase in pH
when increasing from the standard to the double rate, it was not significant.
0
500
1000
1500
2000
2500
3000
3500
4000
4500cm
3
Standard Rate
Double Rate

52
Figure 16 - Average pH for leachate samples collected from each material type under standard and double application rates. Negative control shown in gray.
Figure 17 details the effect of application rate on the leachate’s electrical conductivity. As
expected, the majority of the formulations showed statistically higher EC levels when the application
rate was doubled because of increased levels of nutrients available. Milorganite showed the largest
increase of EC, with the higher application rate more than doubling the EC compared to the standard
application rate. Higher EC levels were expected with increased application rates because there are
more nutrients available for the leachate to absorb. These results show that most of the fertilizers
tested produced statistically higher levels of leachate EC when the application rate was increased;
reinforcing the fact that over-application of fertilizer leads to more surface water contamination.
5.50
5.75
6.00
6.25
6.50
6.75
7.00p
H
Standard Rate
Double Rate

53
Figure 17 - Electrical conductivity (EC), measured in milliSiemens per cm2 for each material type under standard and double application rate. Negative control shown in gray.
The effects of application rate on plant visual health ratings are seen in Figure 18. Two of the
soy-based composites caused only slight decreases in visual health at higher application rates. These
two materials were the formulations containing 5 and 10% PEG plasticizer. This may be anecdotal
evidence that higher levels of plasticizer can decrease plant health. One formulation, 2003 PLA/SF
(40/60), resulted in a statistically significant decrease in visual health at the higher application rate.
Figure 8 shows photos of plants from this treatment group. It was theorized that the high filler content
of soy flour released nutrients too quickly and the marigolds were nutrient-“burned”. The only material
to see an increase in visual health is the synthetic fertilizer, which saw a statistically significant increase
in its average visual health rating.
0.0
1.0
2.0
3.0
4.0
5.0
6.0m
S/cm
2
Standard Rate
Double Rate

54
Figure 18 - Average visual health rating for each material type under standard and double application rates. Negative control shown in gray.
Figure 19 shows the level of nitrogen in the plant’s tissue. The optimal level of nitrogen in the
tissue ranges between 3.32 and 3.64% (Mills, 1996). It is seen that six of the eight soy biocomposites,
and seven of the total ten materials, showed statistically higher levels of tissue nitrogen when applied at
double the standard rate. This suggests that over-application of fertilizer leads to higher levels of
nitrogen in the plant tissue and promotes excessive levels of nitrogen in the tissue.
0.0
1.0
2.0
3.0
4.0
5.0
6.0H
ealt
h R
atin
g
Standard Rate
Double Rate

55
Figure 19 - Tissue nitrogen, by percent mass, for each material type under standard and double application rates. Negative control shown in gray. Ideal levels are between 3.32 and 3.64% (Mills, 1996).
Phosphorus levels of tissue samples are seen in Figure 20. As expected, over-application of
fertilizer led to higher phosphorus levels in plant tissues. An important takeaway from this comparison is
that soy-based fertilizers saw large increases in tissue phosphorus when increasing the fertilizer
application rate; in some cases, the level more than doubled. However, the synthetic fertilizer caused no
significant difference when applied at the higher rate. The synthetic fertilizer also resulted in the lowest
level of tissue phosphorus, other than the negative control group. The synthetic fertilizer was unable to
create optimal levels of tissue phosphorus (between 0.49 and 0.54% (Mills, 1996)), even when applied at
double the recommended rate. However, the majority of the soy-based biocomposites did reach, or in
some cases exceeded, the optimal level. It was theorized that the form of phosphorus in the synthetic
and soy-based fertilizers differed, with the phosphorus in the soy-based fertilizer being more easily
available for uptake by the plant.
0.0
1.0
2.0
3.0
4.0
5.0
6.0%
N b
y m
ass
Standard Rate
Double Rate

56
Figure 20 - Tissue phosphorus, by percent mass, for each material type under standard and double application rates. Negative control shown in gray. Ideal levels are between 0.49 and 0.54% (Mills, 1996).
Figure 21 shows the application rate’s effect on the tissue’s potassium level. Similar to the
phosphorus levels, the synthetic fertilizer did not result in plants with optimal levels of potassium
(between 2.79 and 2.88% (Mills, 1996)). Synthetic fertilizers also showed very little increase in tissue
nutrients when increasing from a standard to a double application rate. The majority of soy-based
fertilizers fell within the ideal range when applied at a standard rate, but many exceeded the optimal
levels when over-applied at the double application rate because excessive amounts of nutrients were
made available to the plants.
0.00
0.10
0.20
0.30
0.40
0.50
0.60
0.70
0.80%
P b
y m
ass
Standard Rate
Double Rate

57
Figure 21 - Tissue potassium, by percent mass, for each material type under standard and double application rates. Negative control shown in gray. Ideal levels are between 2.79 and 2.88% (Mills, 1996).
For both phosphorus and potassium in leachate, there were significantly higher levels of these
nutrients found when application rates were doubled as seen in Figures 22 and 23, which show the
phosphorus and potassium levels respectively. The synthetic fertilizer and Milorganite did not show the
same results. This result was unexpected and proves that over-application of soy-based fertilizers can
lead to excessive levels of leachate contamination than other fertilizers under investigation. However,
when applied at the standard application rate, the leachate nutrient levels were comparable to the
synthetic and Milorganite fertilizers.
The fact that doubling the application rate of synthetic and Milorganite fertilizers did not cause
excessive levels of nutrients in leachate may be attributed to earlier leaching of nutrients. That is, the
nutrients were leached out of the container earlier in the growth cycle. The leachate sample results
shown here were collected at harvest. Additional work should be completed to determine if this
hypothesis is true.
0.0
1.0
2.0
3.0
4.0
5.0%
K b
y m
ass
Standard Rate
Double Rate

58
Figure 22 - Tissue phosphorus, in parts per million (ppm), for each material type under standard and double application rates. Negative control shown in gray.
Figure 22 - Tissue potassium, in parts per million (ppm), for each material type under standard and double application rates. Negative control shown in gray.
0
10
20
30
40
50
60
70p
pm
Standard Rate
Double Rate
0
50
100
150
200
250
300
350
pp
m
Standard Rate
Double Rate

59
Techno-Economic Analysis
The two control materials that were compared to the soy biocomposites were the synthetic
fertilizer (Nutricote) and the biobased alternative (Milorganite). As of summer 2016, the synthetic
fertilizer had a sale price of $21.72 per kilogram. Adjusting for the nitrogen content of 18%, the cost
per pound of nitrogen was $54.73. Milorganite currently sells for approximately ~$1.89 per kilogram.
Adjusting for its nitrogen content of 5% it has a cost of $17.15 per pound of nitrogen. Data on price per
pound of nitrogen for both of these fertilizers is the sale cost of the material, and not the production
cost. Production cost could not be obtained from the manufacturer, so sale price was used for
comparisons.
Results obtained through the techno-economic analysis are detailed in Table 15. Table 15 lists
the cost to produce one kilogram of material for the first and last year of production as designated by
the lifespan of 10 years given in the assumptions. Costs of year ten are lower because of the increases in
production efficiency made over the ten year period that was listed in the assumptions. It is seen that
because of the insignificant cost difference between PLA and SPA ($2.25 per kilogram compared to
$2.27) there is little difference in price per kilogram between a formulation containing 50% filler
compared to one with 70% filler. However, there are significant effects caused by filler content when
soy flour is used compared to SPA. Soy flour has a price of $1.00 per kilogram, compared to SPA’s cost of
$2.27. Soy flour also had reduced processing cost, as it only required one extrusion step.

60
Table 15 - Cost to produce biocomposites per kilogram of material for the first and last year of the ten year lifespan.
MATERIAL NAME YEAR 1 COST ($/KG)
YEAR 10 COST ($/KG)
3001 PLA/SPA (50/50) $2.39 $1.84
3001 PLA/SPA (40/60) $2.39 $1.84
3001 PLA/SPA (30/70) $2.39 $1.84
3001 PLA(5%PEG)/SPA (50/50) $2.43 $1.87
3001 PLA(5%PEG)/SPA (40/60) $2.43 $1.87
3001 PLA(5%PEG)/SPA (30/70) $2.44 $1.88
3001 PLA(10%PEG)/SPA (50/50) $2.40 $1.85
3001 PLA(10%PEG)/SPA (40/60) $2.41 $1.86
3001 PLA(10%PEG)/SPA (30/70) $2.43 $1.87
2003 PLA/SPA (50/50) $2.39 $1.84
2003 PLA/SPA (40/60) $2.39 $1.84
2003 PLA/SF (60/40) $1.81 $1.40
2003 PLA/SF (50/50) $1.69 $1.30
2003 PLA/SF (40/60) $1.56 $1.20
Table 16 shows a similar trend when the cost was adjusted for total nitrogen content in the
formulations. The prices displayed is the cost to produce enough material to supply one pound of
nitrogen. The production cost per pound of nitrogen allows for better comparison between materials as
it adjusts for any differences in nitrogen content.

61
Table 16 - Cost to produce biocomposites per pound of nitrogen for the first and last year of the ten year lifespan.
MATERIAL NAME YEAR 1 COST ($/LB N)
YEAR 10 COST ($/LB N)
3001 PLA/SPA (50/50) $33.73 $25.95
3001 PLA/SPA (40/60) $28.37 $21.83
3001 PLA/SPA (30/70) $22.18 $17.07
3001 PLA(5%PEG)/SPA (50/50) $32.76 $25.19
3001 PLA(5%PEG)/SPA (40/60) $28.52 $21.93
3001 PLA(5%PEG)/SPA (30/70) $21.21 $16.30
3001 PLA(10%PEG)/SPA (50/50) $27.32 $21.00
3001 PLA(10%PEG)/SPA (40/60) $25.59 $19.67
3001 PLA(10%PEG)/SPA (30/70) $21.20 $16.30
2003 PLA/SPA (50/50) $32.52 $25.02
2003 PLA/SPA (40/60) $26.37 $20.29
2003 PLA/SF (60/40) $27.41 $21.10
2003 PLA/SF (50/50) $19.10 $14.70
2003 PLA/SF (40/60) $15.79 $12.15
By using the Solver add-in provided by Excel, the minimum sale price can be calculated for each
material (Table 17). This break-even price is calculated by assigning a sale price to the material produced
and totaling the profit over the ten-year period. Within Solver, the option to vary sale price was given
and a target of $0.00 was set for the total profit. This returns a minimum sale price to break-even over
the ten-year period.

62
Table 17 - Minimum sale price per kg of biocomposite to break even over lifespan of model.
MATERIAL NAME BREAKEVEN PRICE ($/KG)
3001 PLA/SPA (50/50) $2.08
3001 PLA/SPA (40/60) $2.08
3001 PLA/SPA (30/70) $2.08
3001 PLA(5%PEG)/SPA (50/50) $2.11
3001 PLA(5%PEG)/SPA (40/60) $2.12
3001 PLA(5%PEG)/SPA (30/70) $2.12
3001 PLA(10%PEG)/SPA (50/50) $2.09
3001 PLA(10%PEG)/SPA (40/60) $2.10
3001 PLA(10%PEG)/SPA (30/70) $2.11
2003 PLA/SPA (50/50) $2.08
2003 PLA/SPA (40/60) $2.08
2003 PLA/SF (60/40) $1.58
2003 PLA/SF (50/50) $1.47
2003 PLA/SF (40/60) $1.36
Converting the minimum sale price to a nitrogen basis allows for comparison to other material
types, such as the synthetic and Milorganite fertilizers (Table 18). The price for the synthetic and
Milorganite fertilizers is $54.73 and $17.15 per pound of nitrogen, respectively. It is important to note
that these are the sale prices and not the production prices, which is detailed for the soy biocomposites.
The price to produce one pound of nitrogen varied from $13.77 to $29.45 for the soy biocomposites,
with the least expensive material being 2003 PLA/SF (40/60). With the production costs calculated, it
can be assumed that production of soy-based biocomposite fertilizers would be viable on a commercial
production level.

63
Table 18 - Minimum sale price per pound of nitrogen for biocomposites to break even over lifespan of model. To compare; the synthetic fertilizer and Milorganite have sale prices equal to $54.73 and $17.15 per pound of nitrogen, respectively.
MATERIAL NAME BREAKEVEN PRICE ($/KG)
3001 PLA/SPA (50/50) $29.45
3001 PLA/SPA (40/60) $24.75
3001 PLA/SPA (30/70) $19.33
3001 PLA(5%PEG)/SPA (50/50) $28.54
3001 PLA(5%PEG)/SPA (40/60) $24.90
3001 PLA(5%PEG)/SPA (30/70) $18.46
3001 PLA(10%PEG)/SPA (50/50) $23.81
3001 PLA(10%PEG)/SPA (40/60) $22.30
3001 PLA(10%PEG)/SPA (30/70) $18.48
2003 PLA/SPA (50/50) $28.39
2003 PLA/SPA (40/60) $23.00
2003 PLA/SF (60/40) $23.94
2003 PLA/SF (50/50) $16.66
2003 PLA/SF (40/60) $13.77
Life Cycle Assessment
Life cycle assessment results obtained through GaBi are detailed for the production of soy
biocomposites as well as both ammonium nitrate and urea fertilizers. Impact categories discussed
included: total global warming potential (GWP), eutrophication potential (EP), acidification potential
(AP), as well as abiotic energy depletion and abiotic resource use.

64
Table 19 details the total GWP for each of the fertilizers. The functional unit for comparison is
kilograms of CO2 equivalence. It is important to note that the negative value for the following soy-based
biocomposite fertilizers: 3001 PLA/SPA (30/70), 3001 PLA(5%PEG)/SPA (30/70), 3001 PLA(10%PEG)/SPA
(30/70), and 2003 PLA/SF (40/60). These negative values are the result of the sequestration of CO2
during the growth of soybeans. In addition, there is a general inverse relationship between soy content
and GWP. It is also seen that there is generally a proportional relationship between PLA and GWP. This
can be attributed to the fact that PLA requires relatively large amounts of energy during synthesis -
approximately 54.1 MJ of energy per kilogram of polymer (Vink, 2003). The largest GWP of any material
examined was 2.82 kg of CO2 equivalence, a result of the synthesis of ammonium nitrate.
Abiotic energy depletion is also detailed in Table 19 and has a unit of MJ of energy consumed.
The results follow similar trends as those seen for GWP in reference to soy and PLA content. It is
important to note that the values for ammonium nitrate and urea are relatively low (18 and 23 MJ,
respectively) due to the natural gas being used as a feedstock for chemistry, and not for fuel for energy
production.
GWP
ABIOTIC ENERGY
DEPLETION
ABIOTIC RESOURCE
USE EUTROPHICATION ACIDIFICATION
(kg CO2 eq) (MJ) (kg Sb eq) (kg PO4
3- eq) (kg SO2 eq)
3001 PLA/SPA (50/50) 1.26 252 7.02E-06 1.70E-02 6.83E-02
3001 PLA/SPA (30/70) -1.17 114 2.85E-06 1.03E-02 3.42E-02
3001 PLA(5%PEG)/SPA (30/70) -0.86 106 2.58E-06 9.55E-03 3.20E-02
3001 PLA(10%PEG)/SPA (30/70) -0.94 102 2.46E-06 9.42E-03 3.12E-02
2003 PLA/SPA (50/50) 1.21 243 6.77E-06 1.64E-02 6.58E-02
2003 PLA/SF (60/40) 2.67 333 9.11E-06 2.11E-02 8.83E-02
2003 PLA/SF (50/50) 0.71 222 5.77E-06 1.57E-02 6.08E-02
2003 PLA/SF (40/60) -0.51 173 4.21E-06 1.39E-02 4.95E-02
AMMONIUM NITRATE 2.82 18 1.04E-02 2.27E-04 2.13E-03
UREA 0.72 23 1.04E-02 2.45E-04 2.41E-03
Table 19 - Results for cradle-to-gate life cycle assessment for the equivalence of 1 pound of nitrogen produced.

65
Abiotic resource use is detailed in Table 19 and has a functional unit of kilograms of antimony
equivalence (kg SB eq). It is seen in this column that the natural gas is accounted for in abiotic resources
and not abiotic energy depletion. Abiotic resource use is four magnitudes higher for urea and
ammonium nitrate than for soy-based biocomposites.
Table 19 also shows the results for the eutrophication potential for each material. The
functional unit used is kilogram of phosphate equivalence (kg PO43- eq) for each pound of nitrogen
produced. In addition, Table 19 details the acidification potential for each of the materials with a
functional unit of kilogram of sulfur dioxide equivalence (kg of SO2 eq) per pound of nitrogen produced.
In general, it is seen that the eutrophication potential (EP) and acidification potential (AP) are
one or two magnitudes higher for the soy-based fertilizers when compared to urea and ammonium
nitrate. While this may be counterintuitive, it is related to current farming practices. In more detail, the
production of soybeans in the U.S. typically utilizes synthetic fertilizers, which cause increases to
eutrophication and acidification levels once the nutrients applied to the field become runoff. As detailed
in the literature review, up to 95% of the nitrogen needed for soybean production could come from
atmospheric nitrogen under the correct conditions (Herridge, 2008). Currently, the average is only
approximately 58% of the total nitrogen needed. With the correct sustainable farming practices, the
amount of eutrophication and acidification caused by soybean production could be drastically
decreased, thus lowering the impact of soy-based biocomposite fertilizers in this category.

66
CHAPTER 6
CONCLUSION
The results obtained during this study indicate that soy-based biocomposite fertilizers can be a
viable alternative to currently available turfgrass fertilizers. All soy biocomposites performed better than
the negative control group, proving they have positive effects on plant shoot dry weight, shoot volume,
and visual health. Some formulations performed as well as, or better than, the commercially available
fertilizers.
Nutrient content in leachate was found to be statistically similar to both of the commercially
available fertilizers (Milorganite and Nutricote) when applied at a standard application rate. In addition,
it was found that both phosphorus and potassium levels in leachate were not statistically higher for
most soy biocomposites compared to the commercially available fertilizers.
Soy biocomposites were also found to be cost effective in comparison to the commercially
available fertilizers. The production price of soy biocomposites was competitive compared to the
purchasing price for the commercially available fertilizers.
The life cycle assessment indicated that soy biocomposites with high filler content reduced GWP
compared to commercially available fertilizers. Fertilizers containing more than 60% filler showed lower
energy and resource use, as well as a negative GWP because the of sequestration of CO2 during the
growth cycle of the soybeans, which constitute the majority of the fertilizers’ makeup.
Future testing could provide more insight into the transport of nitrogen, as well as the major
factors contributing to the release rate of nutrients from the soy biocomposites. Information on factors
such as pellet size and porosity may provide benefits to the project as well. Any further investigation
should also include an analysis of micronutrients within the biocomposites and the effects of adding
them to formulations.

67
References
"The Problem." U.S. Environmental Protection Agency. Environmental Protection Agency, 1 Mar. 2016. Web. 12 May 2016.
"The Sources and Solutions: Agriculture." U.S. Environmental Protection Agency. Environmental
Protection Agency, 1 Mar. 2016. Web. 12 Apr. 2016.
Areas at Risk of Nitrate Contamination to Shallow Groundwater. Digital image.
Http://water.usgs.gov/edu/nitrogen.html. U.S. Geological Society, n.d. Web. Biello, David. "Fertilizer Runoff Overwhelms Streams and Rivers--Creating Vast "Dead Zones""
Scientific American. N.p., 14 Mar. 2008. Web. 22 Apr. 2016.
Diaz, R. J., & Rosenberg, R. (2008). Spreading Dead Zones and Consequences for Marine Ecosystems. Science,321(5891), 926-929. doi:10.1126/science.1156401
E.P.A. - Learn about Water. (2016). Retrieved from https://www.epa.gov/learn-issues/learn-about-water
Fan, A. M., & Steinberg, V. E. (1996). Health Implications of Nitrate and Nitrite in Drinking Water:
An Update on Methemoglobinemia Occurrence and Reproductive and Developmental Toxicity. Regulatory Toxicology and Pharmacology, 23(1), 35-43. doi:10.1006/rtph.1996.0006
Gloy, B. (2015, August 03). 2016 USDA Cost of Production Forecasts Point To More of the Same
for U.S. Farmers. Retrieved from http://ageconomists.com/2015/08/03/2016-usda-cost-of-production-forecasts-point-to-more-of-the-same-for-u-s-farmers/
Grewell, D., Carolan, S., & Srinivasan, G. (2013). Development of soy protein plastics using
functional chemistry for short life biodegradable applications. J. Renewable Materials, 231-241. Groffman, P. M., Law, N. L., Belt, K. T., Band, L. E., & Fisher, G. T. (2004). Nitrogen Fluxes and
Retention in Urban Watershed Ecosystems. Ecosystems, 7(4). doi:10.1007/s10021-003-0039-x Herridge, D. F., Peoples, M. B., & Boddey, R. M. (2008). Global inputs of biological nitrogen
fixation in agricultural systems. Plant and Soil,311(1-2), 1-18. doi:10.1007/s11104-008-9668-3 King, K. W., Balogh, J. C., Hughes, K. L., & Harmel, R. D. (2007). Nutrient Load Generated by
Storm Event Runoff from a Golf Course Watershed. Journal of Environment Quality, 36(4), 1021. doi:10.2134/jeq2006.0387
Law, Neely, Lawrence Band, and Morgan Grove. (2004) "Nitrogen Input from Residential Lawn
Care Practices in Suburban Watersheds in Baltimore County, MD." Journal of Environmental Planning and Management: 737-55. Print.

68
Lin, L., Deng, Z., & Gang, D. D. (2009). Nonpoint Source Pollution. Water Environment Research, 81(10), 1996-2018. doi:10.2175/106143009x12445568400610
McCabe, K.G., J.A. Schrader, C.J. Currey, D. Grewell, and W.R. Graves. (2016). Soy-composite
biocontainers allow for reduced fertilizer inputs during container-crop production. HortScience 51:927-934.
Mengel, K. (2009). Principles of plant nutrition. Dordrecht: Kluwer.
Mills, H., & Jones, J. (1996). Plant analysis handbook II: A practical sampling, preparation, analysis, and interpretation guide/ Harry A. Mills J. Benton Jones, Jr. AthensA: MicroMacro Publishing.
Morton, T. G., A. J. Gold, and W. M. Sullivan. (1988) "Influence of Overwatering and Fertilization
on Nitrogen Losses from Home Lawns." Journal of Environment Quality: 124. Print. Nitrate Ion Concentration, 2002. Digital image. Http://water.usgs.gov/edu/nitrogen.html. U.S.
Geological Society, n.d. Web. Oram, P. M. (2014). Many people have questions about the impact of nitrate in their drinking
water. Retrieved from http://www.water-research.net/index.php/nitrate Rolfe, B. G., & Shine, J. (1984). Rhizobium-Leguminosae Symbiosis: The Bacterial Point of
View. Genes Involved in Microbe-Plant Interactions Plant Gene Research, 95-128. doi:10.1007/978-3-7091-8739-5_4
Schrader, J.A., G. Srinivasan, D. Grewell, K.G. McCabe, and W.R. Graves. (2013). Fertilizer effects of soy-plastic containers during crop production and transplant establishment. HortScience 48: 724-731.
Skowrońska, M., & Filipek, T. (2014). Life cycle assessment of fertilizers: A review. International Agrophysics, 28(1). doi:10.2478/intag-2013-0032
Vink, E. T., Rábago, K. R., Glassner, D. A., & Gruber, P. R. (2003). Applications of life cycle assessment to NatureWorks™ polylactide (PLA) production. Polymer Degradation and Stability, 80(3), 403-419. doi:10.1016/s0141-3910(02)00372-5
Wright, R. D., Grueber, K. L., & Leda, C. (1990). 'Medium Nutrient Extraction with the Pour-through and ... Retrieved from http://hortsci.ashspublications.org/content/25/6/658.full.pdf