Quality of commercially reared queen and drone honey bees ...
235
Quality of commercially reared queen and drone honey bees (Apis mellifera L.) in eastern Australia By John W. Rhodes A thesis prepared for the degree of Doctor of Philosophy at the University of Western Sydney, New South Wales, Australia. August, 2011.
-
Upload
khangminh22 -
Category
Documents
-
view
1 -
download
0
Transcript of Quality of commercially reared queen and drone honey bees ...

Quality of commercially reared queen and drone honey bees (Apis
mellifera L.) in eastern Australia
By John W. Rhodes
A thesis prepared for the degree of Doctor of Philosophy at the University of
Western Sydney, New South Wales, Australia.
August, 2011.
Declaration
The research presented in this thesis is my own original work with assistance and
contributions by other persons identified in the text and in the Acknowledgements.
John Rhodes.
August 2011.

Acknowledgements
I would like to express my appreciation to my Principal Supervisor, Assoc. Professor
Robert Spooner-Hart, Centre for Plants and the Environment, University of Western
Sydney, and to Dr. Denis Anderson, CSIRO Entomology, Canberra, for guidance and
assistance during the progress of this study.
I would like to thank the Rural Industries Research and Development Corporation,
Honeybee Research and Development Program, Canberra; the University of Western
Sydney, Hawkesbury Campus; and the New South Wales Department of Primary
Industries for providing financial assistance and facilities.
For the experiments on queen bee introduction and survival: I would like to
acknowledge the following persons for their support which allowed these diverse
range of experiments to come together successfully. Dr. Doug Somerville, NSW
Department of Primary Industries, Goulburn for managing the collection of data at one
of the field apiaries, and for providing input during the course of these experiments.
Mr. Steven Harden, Biometry Branch, NSW Department of Primary Industries,
Tamworth, for data analysis and comments on presentation. Laurie, Paula and Robert
Dewar, Aratula, Queensland, commercial queen bee breeders, for the production of
queen bees. Noel and Neil Bingley, Queanbeyan, NSW; Bob and Marie Michey, and
Rob and Raelene Michie, Tamworth, NSW, commercial honey producers, for
providing commercial apiaries for field evaluation of queen bees and for assisting with
the collection of data from their apiaries. Dr. Denis Anderson and Ms. Kerry
Medveczky; and Dr. Mike Lacey, CSIRO Entomology Laboratories, Canberra, ACT,
for laboratory examinations of queen bees; and for chemical extraction and
identification from queen head glands, respectively. Mr. Bruce White, former Apiary
Officer, NSW Department of Primary Industries, Windsor, for providing comments
during the course of the experiments.
For the experiments on drones, the following people provided major support and
assistance: Ms. Gretchen Wheen, Richmond, NSW, for collection of samples, use of

apiary and laboratory facilities, and interpretation of results; Ms. Liz. Kabanoff,
University of Western Sydney, Hawkesbury, for support and laboratory use for sperm
viability experiments; Mr. Michael Duncan, Apiary Manager, University of Western
Sydney, Hawkesbury, for assistance and use of apiary facilities; Ms. Sue Rees,
Laboratory Technician, University of Western Sydney, Richmond, determination of
sperm motility ratings; Mr. Steven Harden and Mr. Bruce McCorkell, Biometricians,
NSW DPI, Tamworth, for statistical analysis of data; Ms. Sharon Nielsen,
Biometrician, NSW DPI, provided comments on sperm viability and motility data; Dr.
Bruce Tier, Animal Genetics and Breeding Unit, University of New England,
Armidale, NSW, for assistance in developing experimental methodology; and Dr.
Adrian Nicholas, NSW DPI, Tamworth, for use of laboratory facilities.
Amino acid analysis of drone semen samples was carried out by the Australian
Proteome Analysis Facility Ltd., Macquarie University, Sydney, NSW, and fatty acid
analysis by the NSW Department of Primary Industries, Oil Testing Service, Wagga
Wagga, NSW. I would like to thank Dr. Rod Mailer and staff at Wagga Wagga and
staff at the Macquarie University Facility for their efforts in analysing samples of
small volumes.
Commercial beekeepers who contributed with queen bees, use of facilities and
information were: Mr. Col Wilson, Kurri Kurri, NSW; Mr. Ken Olley, Clifton, Qld.;
Mr.Linton Briggs, Glenrowan, Victoria; Mr.Frank Malfroy, Freemans Reach, NSW;
Mr.Greg Mulder, Murrays Run, NSW; Mr.Greg Tyson, Inverell, NSW and Mr. David
Weik, Tamworth, NSW.
I would like to thank members of the beekeeping section, NSW DPI, for support, in
particular Mr. Tim Burfitt, Manager, Intensive Livestock Industry Development,
Orange; Mr. Bruce White, former Technical Specialist, Richmond; Dr. Doug
Somerville, Technical Specialist, Goulburn; and Mr. Nick Annand, Livestock Officer,
Bathurst. I would like to thank support staff at the Tamworth DPI office, particularly
the librarians who have been very helpful over the past years.

Table of Contents
Table of Contents i
List of Tables vii
List of Figures xii
Thesis summary xiii
Chapter 1 Literature review, thesis aims and objectives.
1.1 Literature review 11.2 Research objectives 361.3 Thesis structure 37
Chapter 2 Queen bee introduction and early performance
success
2.1 Introduction 392.2 Objectives 402.3 Materials and methods 42
2.3.1 Year 1 (1999-2000) Investigations
42
2.3.2 Year 2 (2000-1) Investigations
47
2.3.3 Year 3 (2001-2) Investigations
54
2.4 Statistical Analyses 582.4.1 Introduction
Success Rate and Early Performance Success Rate.
58
2.4.2 Sperm counts and number of
59
i
ovarioles
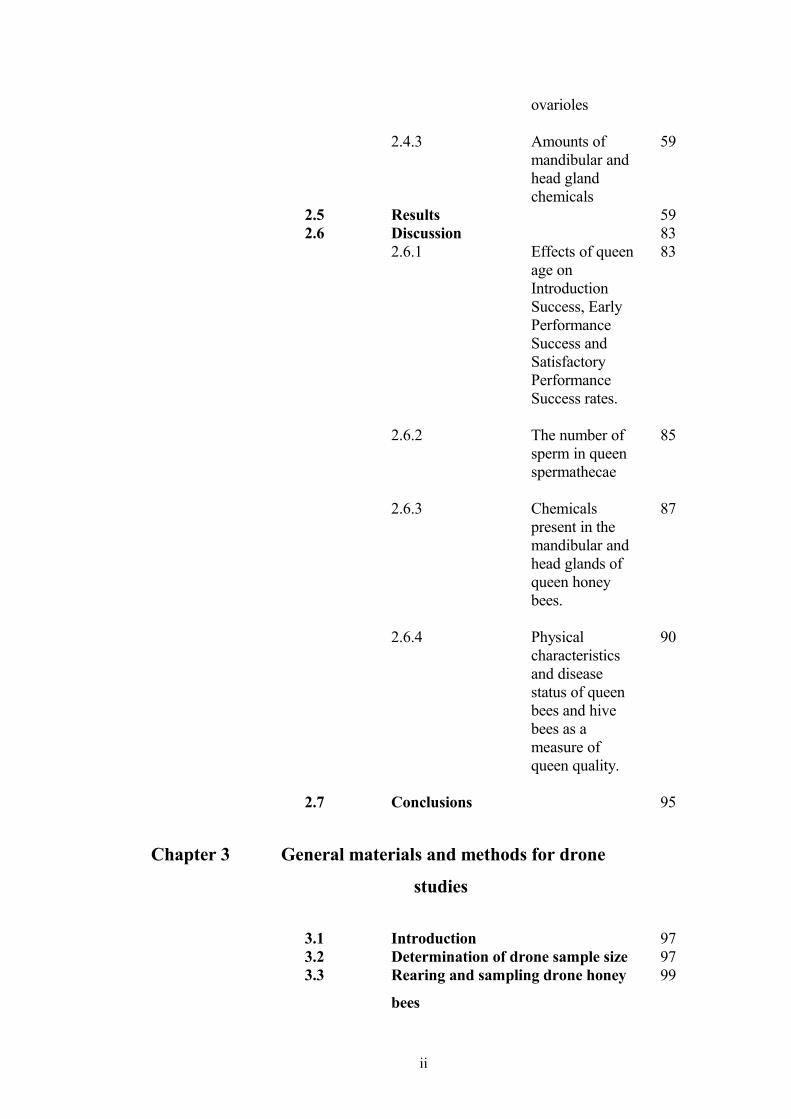
2.4.3 Amounts of mandibular and head gland chemicals
59
2.5 Results 592.6 Discussion 83
2.6.1 Effects of queen age on Introduction Success, Early Performance Success and Satisfactory Performance Success rates.
83
2.6.2 The number of sperm in queen spermathecae
85
2.6.3 Chemicals present in the mandibular and head glands of queen honey bees.
87
2.6.4 Physical characteristics and disease status of queen bees and hive bees as a measure of queen quality.
90
2.7 Conclusions 95
Chapter 3 General materials and methods for drone
studies
3.1 Introduction 973.2 Determination of drone sample size 973.3 Rearing and sampling drone honey
bees
99
ii
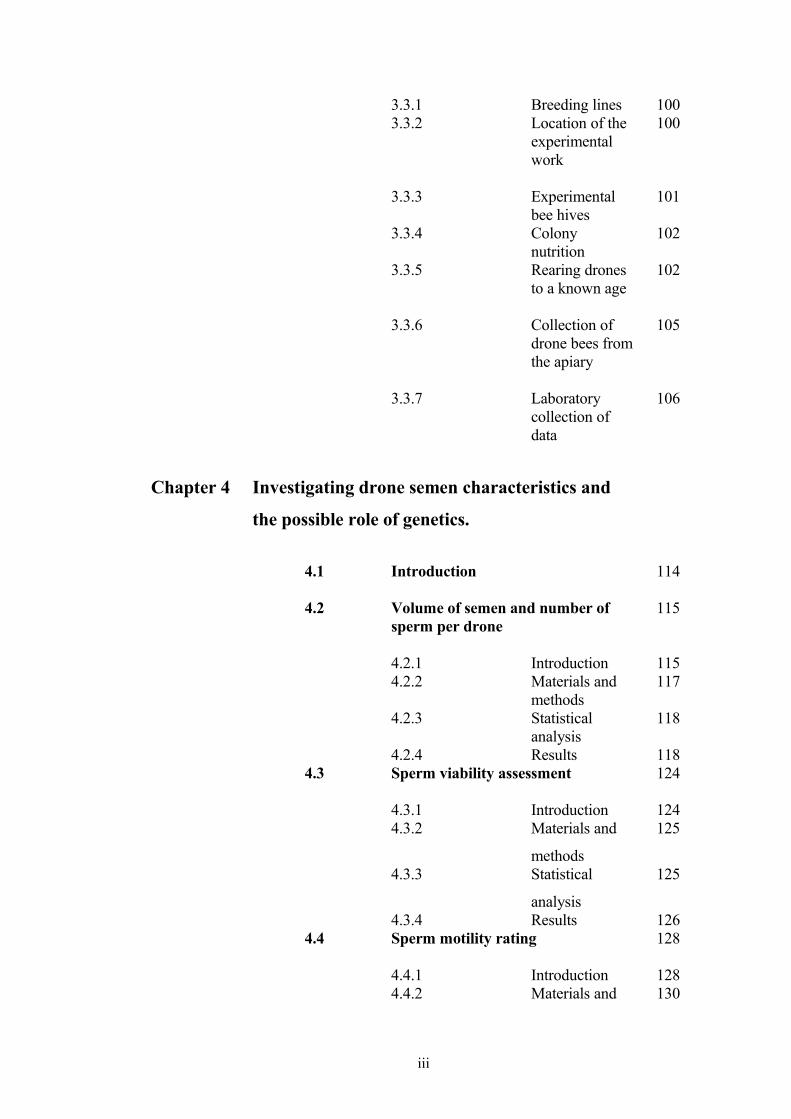
3.3.1 Breeding lines 1003.3.2 Location of the
experimental work
100
3.3.3 Experimental bee hives
101
3.3.4 Colony nutrition
102
3.3.5 Rearing drones to a known age
102
3.3.6 Collection of drone bees from the apiary
105
3.3.7 Laboratory collection of data
106
Chapter 4 Investigating drone semen characteristics and
the possible role of genetics.
4.1 Introduction 114
4.2 Volume of semen and number of sperm per drone
115
4.2.1 Introduction 1154.2.2 Materials and
methods 117
4.2.3 Statistical analysis
118
4.2.4 Results 1184.3 Sperm viability assessment 124
4.3.1 Introduction 1244.3.2 Materials and
methods
125
4.3.3 Statistical
analysis
125
4.3.4 Results 1264.4 Sperm motility rating 128
4.4.1 Introduction 1284.4.2 Materials and 130
iii

methods4.4.3 Statistical
analysis
130
4.4.4 Results 1314.5 Investigating the role of genetics in
drone semen production133
4.5.1 Introduction 133
4.5.2 Materials and methods
135
4.5.2.1 Two-way cross methodology
135
4.5.2.2 Confirmation of High and Low breeding lines
139
4.5.2.3 Disease
identification
139
4.5.3 Statistical
analysis
140
4.5.4 Results 1404.5.4.1 Confirmation of
High Line and Low Breeding Lines
140
4.5.4.2 Disease
examination
141
4.6 Drones not releasing semen after
manual eversion
145
4.6.1 Initial
examination
145
4.6.1.1 Introduction 1454.6.1.2 Materials and
methods
145
4.6.1.3 Results 1464.6.2 Manual
eversion – comparison between two operators
145
4.6.2.1 Introduction 147
iv
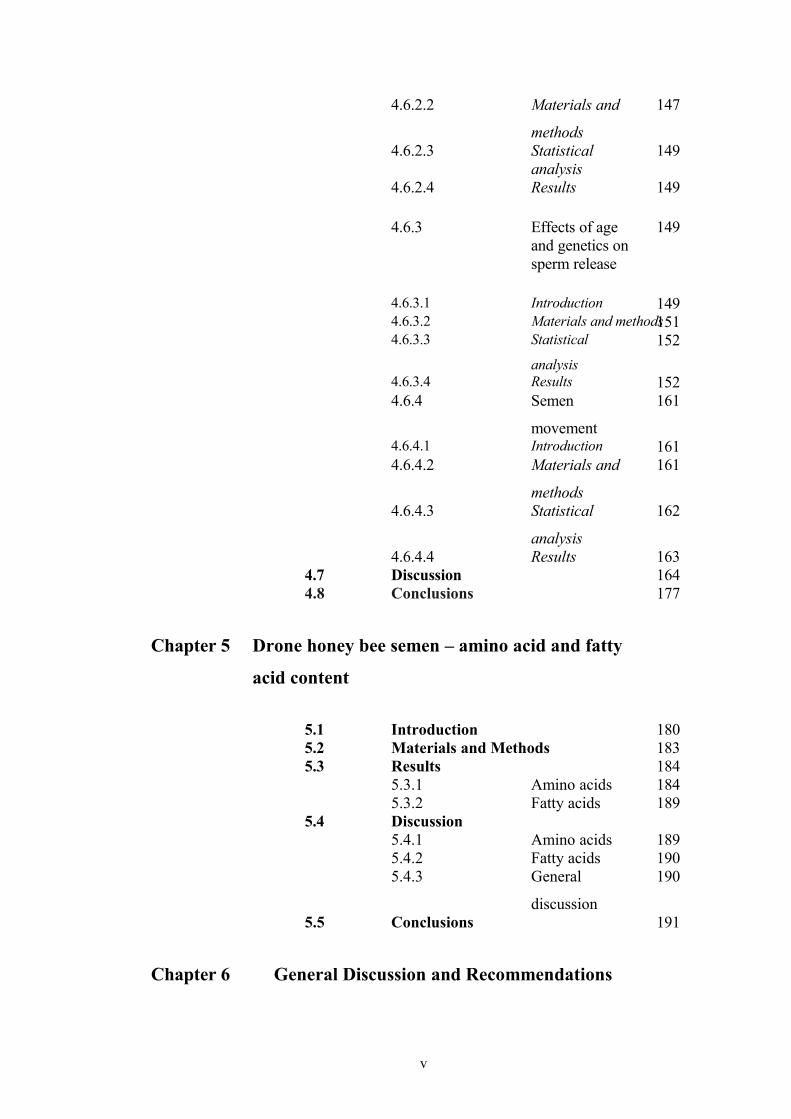
4.6.2.2 Materials and
methods
147
4.6.2.3 Statistical analysis
149
4.6.2.4 Results 149
4.6.3 Effects of age and genetics on sperm release
149
4.6.3.1 Introduction 1494.6.3.2 Materials and methods1514.6.3.3 Statistical
analysis152
4.6.3.4 Results 1524.6.4 Semen
movement
161
4.6.4.1 Introduction 1614.6.4.2 Materials and
methods
161
4.6.4.3 Statistical
analysis
162
4.6.4.4 Results 1634.7 Discussion 1644.8 Conclusions 177
Chapter 5 Drone honey bee semen – amino acid and fatty
acid content
5.1 Introduction 1805.2 Materials and Methods 1835.3 Results 184
5.3.1 Amino acids 1845.3.2 Fatty acids 189
5.4 Discussion5.4.1 Amino acids 1895.4.2 Fatty acids 1905.4.3 General
discussion
190
5.5 Conclusions 191
Chapter 6 General Discussion and Recommendations
v

6.1 Introduction 1926.2 General Discussion 1936.3 Industry impacts 1966.4 Further research 2016.5 Final conclusion 202
References 204
vi
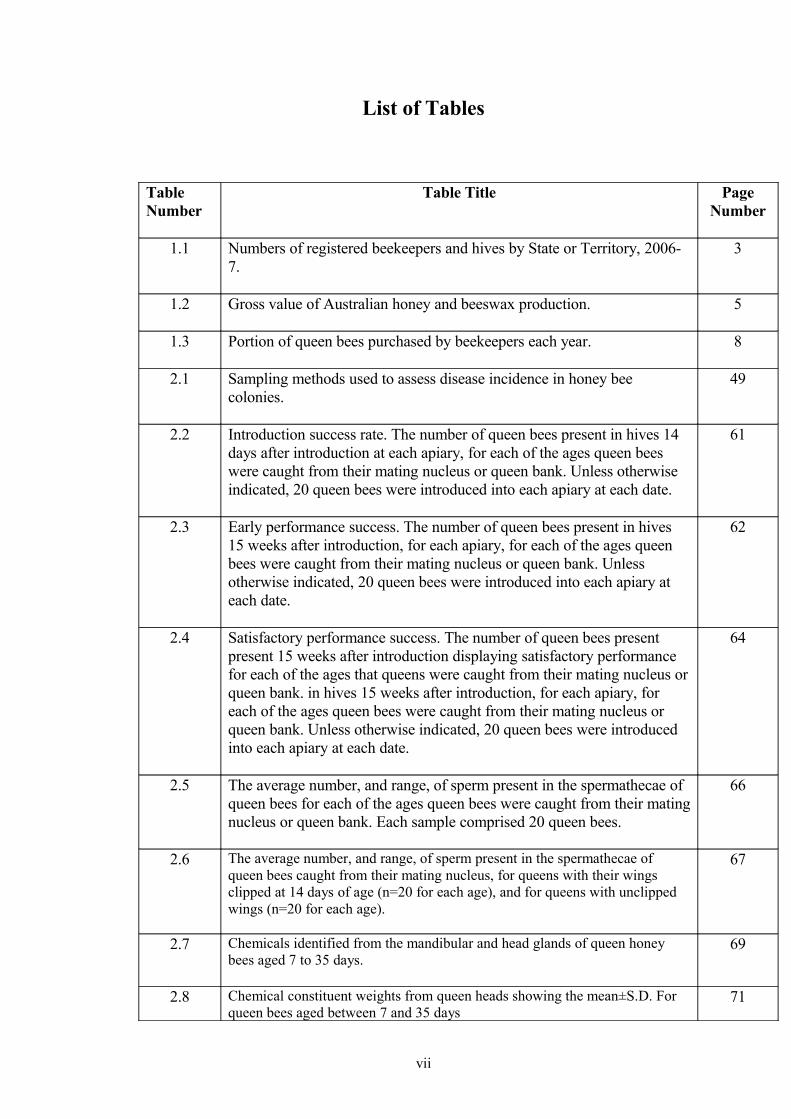
List of Tables
Table Number
Table Title Page Number
1.1 Numbers of registered beekeepers and hives by State or Territory, 2006-7.
3
1.2 Gross value of Australian honey and beeswax production. 5
1.3 Portion of queen bees purchased by beekeepers each year. 8
2.1 Sampling methods used to assess disease incidence in honey bee colonies.
49
2.2 Introduction success rate. The number of queen bees present in hives 14 days after introduction at each apiary, for each of the ages queen bees were caught from their mating nucleus or queen bank. Unless otherwise indicated, 20 queen bees were introduced into each apiary at each date.
61
2.3 Early performance success. The number of queen bees present in hives 15 weeks after introduction, for each apiary, for each of the ages queen bees were caught from their mating nucleus or queen bank. Unless otherwise indicated, 20 queen bees were introduced into each apiary at each date.
62
2.4 Satisfactory performance success. The number of queen bees present present 15 weeks after introduction displaying satisfactory performance for each of the ages that queens were caught from their mating nucleus or queen bank. in hives 15 weeks after introduction, for each apiary, for each of the ages queen bees were caught from their mating nucleus or queen bank. Unless otherwise indicated, 20 queen bees were introduced into each apiary at each date.
64
2.5 The average number, and range, of sperm present in the spermathecae of queen bees for each of the ages queen bees were caught from their mating nucleus or queen bank. Each sample comprised 20 queen bees.
66
2.6 The average number, and range, of sperm present in the spermathecae of queen bees caught from their mating nucleus, for queens with their wings clipped at 14 days of age (n=20 for each age), and for queens with unclipped wings (n=20 for each age).
67
2.7 Chemicals identified from the mandibular and head glands of queen honey bees aged 7 to 35 days.
69
2.8 Chemical constituent weights from queen heads showing the mean±S.D. For queen bees aged between 7 and 35 days
71
vii

2.9 The average number and range of ovarioles present in queen bees from each of the age groups queen bees were examined for the 1999-2000, 2000-1 and 2001-2 experiments (20 queen bees examined per sample).
73
2.10 Means±S.E. for queen body weight, spermatheca diameter, and the presence of sperm in the oviducts of queen bees for each of the ages queens were examined for the 2000-1, and 2001-2 experiments. Unless otherwise indicated, 20 queens were examined per sample.
74
2.11 Nosema disease Nosema spp. spore counts from queen rearing hives at the time of queen production, and honey production hives at the time of queen introduction, for the years 2000 and 2001.
75
2.12 Brood disease status of honey production hives used for queen bee introduction experiments in year 2000-1. Number of hives displaying infection for each apiary /20 hives.
76
2.13 Queen bee transport data for each age group of queen bees for shipments mailed November-December 1999. Number of hours in transport (time), temperatures and humidities recorded from inside envelopes containing the caged queen bees and escort bees, queen bee and escort bee survival, and queen bee survival 14 days after introduction into honey production hives.
77
2.14 Queen bee transport data for each age group of queen bees for shipments mailed November-December 2000. Number of hours in transport (time), temperatures and humidities recorded from inside envelopes containing the caged queen bees and escort bees, queen bee and escort bee survival, and queen bee survival 14 days after introduction into honey production hives.
78
2.15 Queen bee transport data for each age group of queen bees for shipments mailed November-December 2001. Number of hours in transport (time), temperatures and humidities recorded from inside envelopes containing the caged queen bees and escort bees, queen bee and escort bee survival, and queen bee survival 14 days after introduction into honey production hives.
79
2.16 The percentage of queen bees developed from queen cell cups at Positions 1 to 5 on the cell bar and which survived to 15 weeks after introduction of the queen bee into a honey production hive.
80
2.17 Data recorded for adult queen bees developed in queen cell cups for the five positions on the cell bar for number of sperm in the spermatheca, spermatheca diameter, queen body weight, and number of ovarioles in one ovary.
81
2.18 Comparison of the numbers of sperm in the spermathecae of queen bees examined either at 7 or 14 days of age, and sister queens examined 15
82
viii

weeks after being introduced into established hives at either 7 or 14 days of age.
3.1 Tris buffer formula. 110
4.1 The proportion of drones releasing a measurable amount of semen after manual eversion from the total number examined for four breeding lines, for three seasons and examined at three ages.
120
4.2 The proportion of drones releasing a measurable amount of semen after manual eversion for three seasons, three age groups and four breeding lines.
121
4.3 Semen volume and range of volumes released by drones for season, age and breeding line effects for drones which released a measurable amount (> 0.1 µL) of semen.
122
4.4 Sperm numbers and range of sperm numbers released by drones for season, age, and breeding line effects for drones which released a measurable amount (> 0.1 µL) of semen.
123
4.5 Significance of season, age, breeding line and all interactions. Deviance statistics from logistic regression model for semen release and F statistics from linear model for semen volume and sperm numbers together with their respective P values.
123
4.6 Number of drones providing a semen sample for assessment of mean percent sperm viability for drones over three seasons, from four breeding lines, for three ages.
127
4.7 Predicted sperm viability, live percent for sperm produced by drones for season, age, and breeding line for drones which produced a measurable amount of semen (> 0.1 µL) after manual eversion.
128
4.8 Number of drones providing a semen sample for assessment of predicted mean sperm motility for drones over three seasons, from four breeding lines, for three ages.
132
4.9 Data from drones from the original High v Low breeding lines hive comparison experiment (Examination 1) showing the proportion of drones releasing semen, semen volume and sperm numbers for each hive sample for drones from each of the queen bees examined.
142
4.10 Analysis of data from Table 4.9, showing differences between drones from High and Low breeding line queen bees for all High line hives v. all Low line hives, and the two representative hives for High breeding line v. Low breeding line.
143
4.11 Data from drones from the High and Low breeding line replacement queen bees (Examination 2) showing the proportion of drones releasing
143
ix
semen, semen volume and sperm numbers for each hive sample.
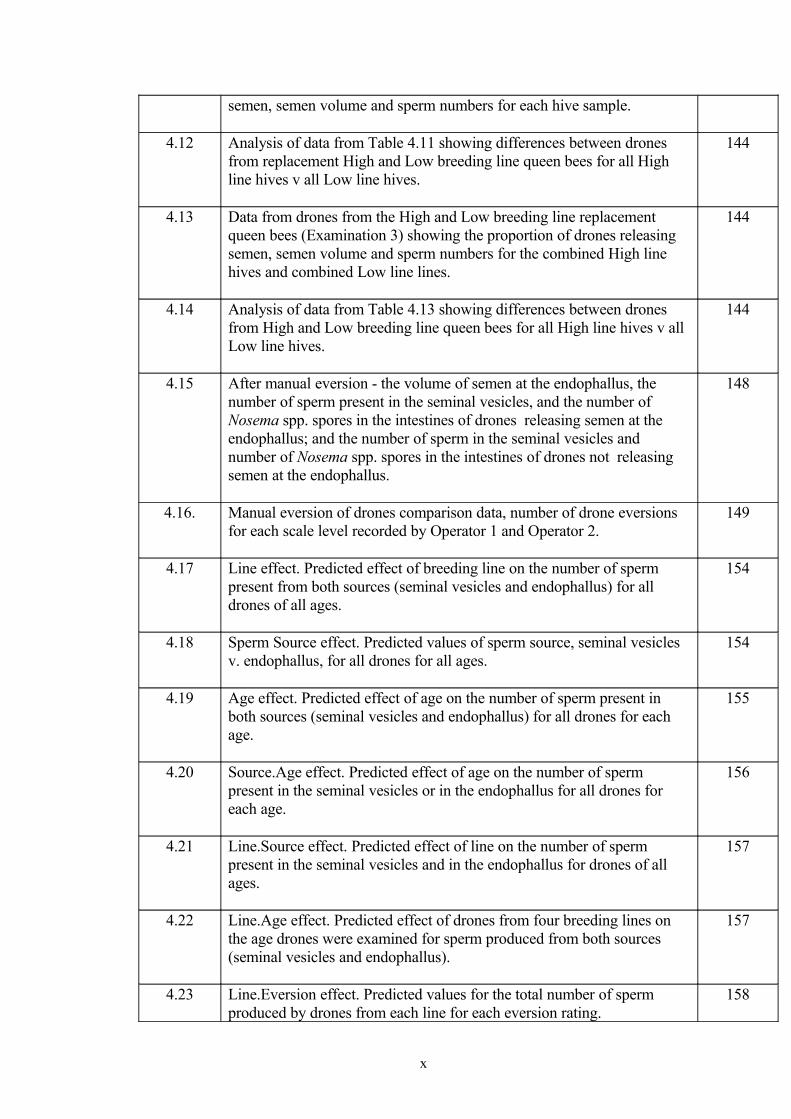
4.12 Analysis of data from Table 4.11 showing differences between drones from replacement High and Low breeding line queen bees for all High line hives v all Low line hives.
144
4.13 Data from drones from the High and Low breeding line replacement queen bees (Examination 3) showing the proportion of drones releasing semen, semen volume and sperm numbers for the combined High line hives and combined Low line lines.
144
4.14 Analysis of data from Table 4.13 showing differences between drones from High and Low breeding line queen bees for all High line hives v all Low line hives.
144
4.15 After manual eversion - the volume of semen at the endophallus, the number of sperm present in the seminal vesicles, and the number of Nosema spp. spores in the intestines of drones releasing semen at the endophallus; and the number of sperm in the seminal vesicles and number of Nosema spp. spores in the intestines of drones not releasing semen at the endophallus.
148
4.16. Manual eversion of drones comparison data, number of drone eversions for each scale level recorded by Operator 1 and Operator 2.
149
4.17 Line effect. Predicted effect of breeding line on the number of sperm present from both sources (seminal vesicles and endophallus) for all drones of all ages.
154
4.18 Sperm Source effect. Predicted values of sperm source, seminal vesicles v. endophallus, for all drones for all ages.
154
4.19 Age effect. Predicted effect of age on the number of sperm present in both sources (seminal vesicles and endophallus) for all drones for each age.
155
4.20 Source.Age effect. Predicted effect of age on the number of sperm present in the seminal vesicles or in the endophallus for all drones for each age.
156
4.21 Line.Source effect. Predicted effect of line on the number of sperm present in the seminal vesicles and in the endophallus for drones of all ages.
157
4.22 Line.Age effect. Predicted effect of drones from four breeding lines on the age drones were examined for sperm produced from both sources (seminal vesicles and endophallus).
157
4.23 Line.Eversion effect. Predicted values for the total number of sperm produced by drones from each line for each eversion rating.
158
x
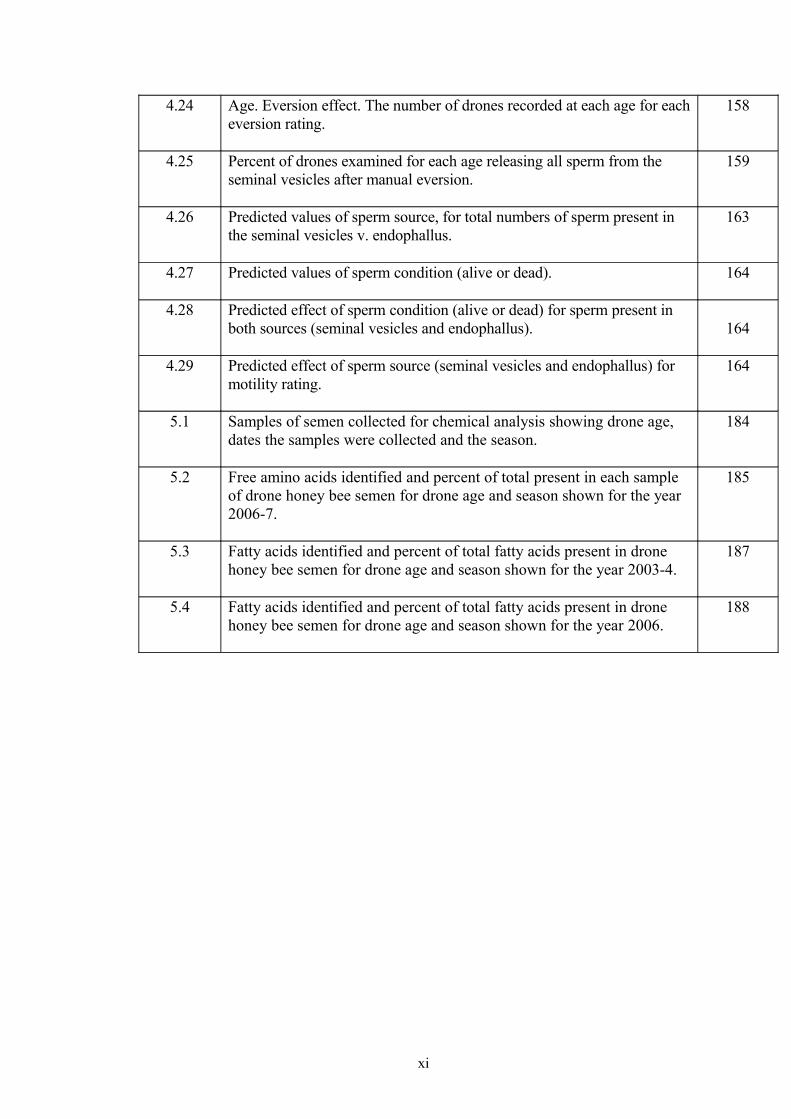
4.24 Age. Eversion effect. The number of drones recorded at each age for each eversion rating.
158
4.25 Percent of drones examined for each age releasing all sperm from the seminal vesicles after manual eversion.
159
4.26 Predicted values of sperm source, for total numbers of sperm present in the seminal vesicles v. endophallus.
163
4.27 Predicted values of sperm condition (alive or dead). 164
4.28 Predicted effect of sperm condition (alive or dead) for sperm present in both sources (seminal vesicles and endophallus). 164
4.29 Predicted effect of sperm source (seminal vesicles and endophallus) for motility rating.
164
5.1 Samples of semen collected for chemical analysis showing drone age, dates the samples were collected and the season.
184
5.2 Free amino acids identified and percent of total present in each sample of drone honey bee semen for drone age and season shown for the year 2006-7.
185
5.3 Fatty acids identified and percent of total fatty acids present in drone honey bee semen for drone age and season shown for the year 2003-4.
187
5.4 Fatty acids identified and percent of total fatty acids present in drone honey bee semen for drone age and season shown for the year 2006.
188
xi

List of Figures
FigureNumber
Figure Title Page Number
2.1 Fitted curves for Introduction Success (ISS) and Early Performance Success (ESS) measured as percent survival, for queen bees introduced at different ages, for the years 1999-2000, 2000-1, 2001-2.
65
3.1 Research apiary situated on G. Wheen`s property, Richmond, NSW. 101
3.2 Hive nutrition for drone rearing hives. High protein pollen and sugar syrup supplied (internal sugar syrup feeder replacing upper wall frame in super).
102
3.3 Queen excluder cage used to confine queen and emerging drones on drone comb frame.
104
3.4 Newly emerged drones marked individually.
104
3.5 (A) Fully everted drone endophallus with mucous and semen released. (B) Partially everted drone endophallus with no mucous or semen released.
107
3.6 Ms Gretchen Wheen collecting drone semen samples using a Schley II apparatus at her laboratory, Richmond, NSW.
108
3.7 Stained drone sperm, green=live; red=dead. 111
4.1 Sperm motility barplot showing the probabilities of the motility rating categories for each season (autumn, spring, summer) by age (14, 21, 35 days) by breeding line (1, 2, 3, 4) combination.
133
4.2 Age effect. Cubic smoothing spline describing change in sperm count with age of the drone.
160
4.3 Source.Age effect. Cubic smoothing spline describing changes in sperm numbers with drone age (days) for source of sperm (seminal vesicle or endophallus).
160
xii

Thesis Summary
The reasons for undertaking this work were based on observations of commercial
queen honey bee breeders rearing queen bees using current knowledge and technolo-
gies, followed by introduction of those queens into established honey producing
hives with subsequent failures of the queens to survive or perform satisfactorily. An
initial studies on queen bees provided data which developed into more detailed drone
studies.
The specific aims of the queen bee rearing and introductory studies were to identify
problem areas which may contribute to queen failures. Subjects examined included
the effects on queen introduction survival and performance of - the position of the
queen cell on the cell bar during queen development, stresses resulting from trans-
port between the queen breeding and honey producing apiaries, queen age at intro-
duction, mating success measured by sperm numbers in the queen`s spermatheca,
and the effects of queen head gland chemicals by identifying and measuring the
range and number of chemicals present in queens at different ages. As well, queen
physical characteristics and disease status were recorded as an indicator of queen
quality.
The specific aims of the drone studies were to examine semen quality from drone
honey bees from a number of commercial breeding lines, at a range of drone ages,
over the seasons that queen bees are reared and mated in eastern Australia. Subjects
examined included determination of drone quality measured by semen volume, num-
ber of sperm produced, sperm viability and motility, and investigation of the role of
genetics in semen production. Also, the age at which drones mature was investigated
along with the identification of the range and amounts of amino acids and fatty acids
present in drone semen from drones of different ages over different seasons to de-
termine changes in semen composition.
Drone semen quality studies will benefit commercial beekeeping by improving the
mating success of queen bees thereby increasing the queen`s longevity. Low num-
xiii
bers of sperm in the spermathecae of queen bees after mating contributes to early su-
persedure of the queen resulting in increased costs to the beekeeper from queen re-
placement and reduced colony production during queen replacement.
Results from the queen studies showed that, in general, queen bees were reared to a
high standard to the unmated stage. The two outstanding factors identified which
were considered to negatively affect queen bee introduction and performance success
were (i) the age at which newly mated laying queens are caught from their mating
nucleus and introduced into established bee colonies, and (ii) low numbers of sperm
present in the spermathecae of young, laying queens caught from their mating nucle-
us, this factor initiated further studies into the quality of drones present at queen mat-
ing areas.
Results from the drone studies were that (i) significant differences were found
between drones from different breeding lines for the number of drones releasing se-
men at the endophallus after manual eversion, for semen volume, number of sperm
produced, and sperm viability band motility, (ii) in general, semen volume per drone,
sperm viability and sperm motility were comparable with available data, however,
the number of sperm produced per drone was at the lower end of published data, also
of concern was the low longevity of drones considered to have been reared under
conditions of high nutrition and hive population strength. No drone maturation age
was able to be determined and this, along with reasons why drones do not release se-
men at the endophallus after manual eversion, require further investigation.
This study provides information to persons interested in honey bee breeding with
particular reference to commercial queen bee production by providing data relating
to numbers of sperm produced by drones and highlighting the requirement of use of
this data in the selection of queen bee drone mothers by including drone sperm pro-
duction in the selection criteria and by identifying the most suitable method for col-
lecting drone sperm samples.
xiv
CHAPTER 1.
Literature Review, thesis aims and objectives.
1.1. Literature review
Australian beekeeping industry
Australia is in the southern hemisphere; it is considered to be the largest island in the
world and one of the most arid. The conventional four seasons are not easily identified
and grade into each other. Four climatic zones are often recognised, the tropical north,
the centre, a temperate zone and a sub-arctic zone; the continent is divided into
summer and winter rainfall areas. This combination of climatic factors allows year-
round beekeeping for beekeepers prepared to travel, following the flowering season of
trees and plants, and migratory beekeepers move their apiaries four to six times each
year. Non-migratory beekeepers may be restricted to one or two honey flows each
year. The coastal areas are favoured by beekeepers that operate in a limited migration
range, since they generally provide a wider range of flora. Drought is a major factor
and in recent years (until summer 2010-11) the continent has undergone a series of
droughts, in some areas, since the early 1990s. Some areas naturally have low rainfall
and the flora has evolved to cope with this condition. Many trees and plants on the
inland plains have evolved to flower and yield nectar in the winter months and provide
honey flows for most months of each year for migratory beekeepers.
The best description of Australian beekeeping has been given by Gulliford (2005),
and the following is a summary of the key aspects of the industry from this
publication. Australia has no native species of the genus Apis with the first
importations of European honey bee, Apis mellifera L., colonies occurring in 1822.
The first honey bees introduced into Australia were considered to be Apis mellifera
mellifera, the English bee. Other European races arrived in following years including
A. m. mellifera from Germany. Remnant colonies of A. m. m. have been identified
from Tasmania, one Queensland coastal island, and a number of mainland areas.
1
Italian race bees A. m. ligustica were introduced about the early 1860s and were
widely accepted. In 1885, the Ligurian Bees Bill was introduced into South Australia
and Ligurian bee colonies were placed on Kangaroo Island which was declared a
Sanctuary for the Ligurian honey bee. The Ligurian bee sanctuary on Kangaroo Island
is part of the world`s genetic heritage developed with the foresight of the pioneer
beekeepers of South Australia. Italian race type bees were introduced into Australia
from various parts of Italy and adjacent countries, with the consequence of Italian race
bees in Australia varying widely in colour and performance. From the late 1950s,
selection of Italian race bees centred on disease resistance, wintering ability,
temperament and breeding rates, and importations of Italian race bees have continued
on a regular basis to the present. Importations of other races have occurred: Punic
bees, A. m. intermissa, in 1892; Cyprian bees, A. m. cypria, between 1896 and 1952;
Caucasian bees, A. m. caucasica, from the 1880s with large numbers of shipments
arriving in the late 1960s and with further shipments continuing to be introduced into
Australia; Carniolan bees, A. m. carnica, with introductions between the 1890s and
1990s; A. m. lamarckii and A. m. syriaca were also introduced during the late 19th
century with no recent importations. Hybrids of A. m. ligustica and A. m. mellifera or
A. m. caucasica have been popular with commercial honey producers at different
periods. “Starline” hybrids created in the USA were introduced into Australia in 1953.
Australian apiaries, at present, predominantly stock Italian race type bees, followed by
Caucasian type and Carniolan type.
Based on Australian beekeeping registration data there are about 10000 registered
beekeepers owning about 572000 hives (Table 1.1) (Crook, 2008). Beekeepers owning
50 to 200 hives generally have another source of income to supplement their income
from beekeeping; beekeepers with 200 to 500 hives are transitory between having a
second source of income and being full-time beekeepers and beekeepers with more
than 500 hives generally derive most or all of their income from beekeeping.
2
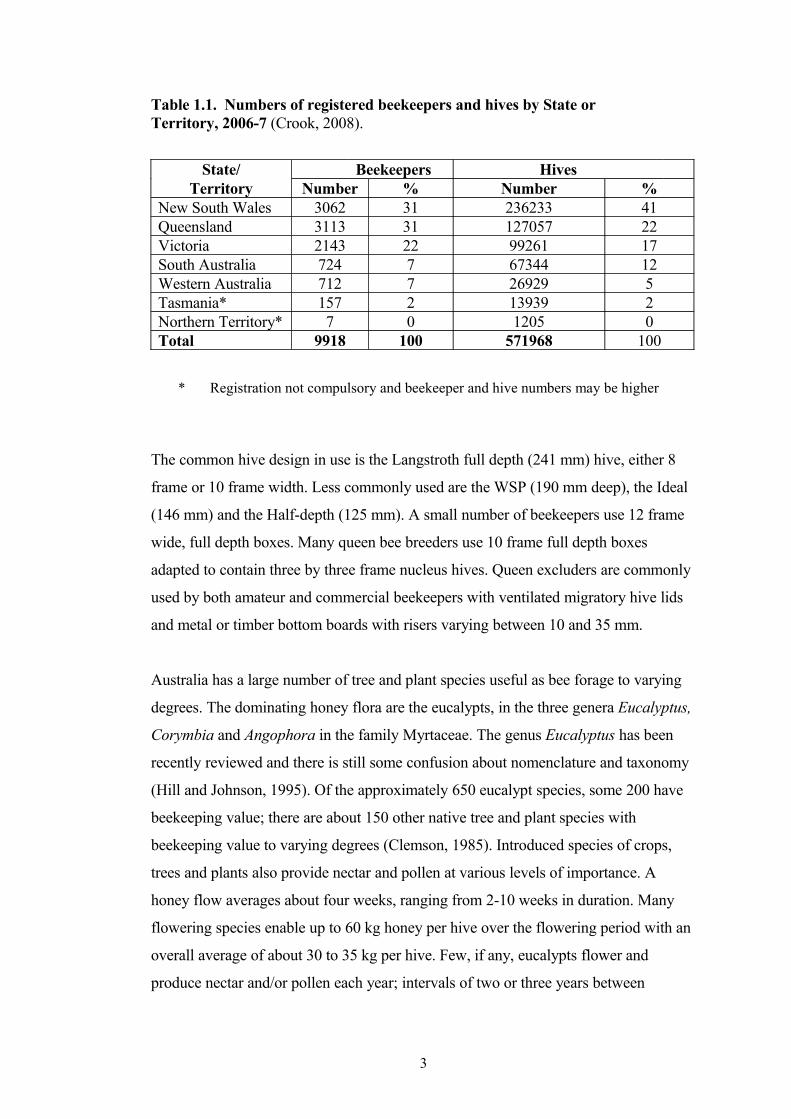
Table 1.1. Numbers of registered beekeepers and hives by State or Territory, 2006-7 (Crook, 2008).
State/ Beekeepers HivesTerritory Number % Number %
New South Wales 3062 31 236233 41Queensland 3113 31 127057 22Victoria 2143 22 99261 17South Australia 724 7 67344 12Western Australia 712 7 26929 5Tasmania* 157 2 13939 2Northern Territory* 7 0 1205 0Total 9918 100 571968 100
* Registration not compulsory and beekeeper and hive numbers may be higher
The common hive design in use is the Langstroth full depth (241 mm) hive, either 8
frame or 10 frame width. Less commonly used are the WSP (190 mm deep), the Ideal
(146 mm) and the Half-depth (125 mm). A small number of beekeepers use 12 frame
wide, full depth boxes. Many queen bee breeders use 10 frame full depth boxes
adapted to contain three by three frame nucleus hives. Queen excluders are commonly
used by both amateur and commercial beekeepers with ventilated migratory hive lids
and metal or timber bottom boards with risers varying between 10 and 35 mm.
Australia has a large number of tree and plant species useful as bee forage to varying
degrees. The dominating honey flora are the eucalypts, in the three genera Eucalyptus,
Corymbia and Angophora in the family Myrtaceae. The genus Eucalyptus has been
recently reviewed and there is still some confusion about nomenclature and taxonomy
(Hill and Johnson, 1995). Of the approximately 650 eucalypt species, some 200 have
beekeeping value; there are about 150 other native tree and plant species with
beekeeping value to varying degrees (Clemson, 1985). Introduced species of crops,
trees and plants also provide nectar and pollen at various levels of importance. A
honey flow averages about four weeks, ranging from 2-10 weeks in duration. Many
flowering species enable up to 60 kg honey per hive over the flowering period with an
overall average of about 30 to 35 kg per hive. Few, if any, eucalypts flower and
produce nectar and/or pollen each year; intervals of two or three years between
3

flowering are common with intervals of six to nine years in some cases depending on
the plant species and timing of rainfall.
The presence of buds on eucalypts is an indication that they may flower within the
following twelve months provided the climate is suitable. Some eucalypt species have
a six to eight week budding to flowering cycle and other species may retain their buds
for nine to eighteen months. If rainfall is insufficient, trees may drop their buds, and
even those which produce flowers may provide little nectar and pollen. Some
eucalypts produce low amounts of pollen; as a result, colonies may cease brood
rearing and may collapse while continuing to collect large amounts of nectar. Some
eucalypts are deficient in some basic amino acids and bees suffer nutritional imbalance
stress since they have not evolved with this deficiency (Kleinschmidt, 1984). This
problem is managed by placing apiaries in areas providing a variety of pollens,
particularly pollens originating in the countries from which the bees were imported.
Until the late 1800s beekeeping in Australia was a stationary industry with beekeepers
having permanent site out-apiaries, these sites produced one or two nectar flows each
year. Moving apiaries from honey flow to honey flow, or migratory beekeeping,
commenced about 1920. Most commercial apiaries are now managed as migratory
apiaries with beekeepers moving up to 1000 km in each move. Migratory beekeeping
stimulated technological development with the introduction of well equipped
extracting caravans used on their own or in conjunction with a central or home based
extracting plant. Hives are loaded individually using hive loaders or, more commonly,
apiaries are palletised and moved with forklifts.
4

Apiary products
A major assessment of future directions for the Australian honeybee industry was
undertaken in 2005 (Centre for International Economics, 2005). This identified the
then current status and future prospects for apiary products in Australia. Unless
otherwise referenced, much of the following information is summarised from this
report.
Each year, the Australian beekeeping industry produces between 20000 and 30000
tonnes of honey. Annual production for 2006-7 was estimated at 311000 tonnes
(Crook, 2008). In recent years production has been reduced, primarily as a result of
drought conditions (Table 1.2). Rodriguez et al. (2003) determined the total economic
value for honeybee products was around $AUD 62 million (all subsequent values are
also in AUD) for 2000-01, made up of honey production $53 million, and other
honeybee products $9 million.
Table 1.2. Gross value of Australian honey and beeswax production*.
Honey and Beeswax $AUD million
2003-4 2004-5 2005-6 2006-774 77 49 38
* ABARE, 2008
An Australian Bureau of Agricultural and Resource Economics (ABARE) Report
stated that the estimated gross value of honey and beeswax production in 2007-8 was
$75 million (Australian Government, 2008)
An estimated profile of honey imports, exports and sales for 2008, based on 21000 tonnes of
Australian honey purchased by honey manufacturers and 4411 tonnes of imported honey –
4774 tonnes (19%) were used for processing/manufacturing, 9198 tonnes (36%) sold in
supermarkets, 2759 tonnes (11%) sold by other retail outlets, 880 tonnes (3%) used for
foodservice, 3510 tonnes (14%) exported as bulk honey and 4290 tonnes (17%) exported as
packed honey (Kneebone, 2010).
5

In addition to honey and beeswax, the beekeeping industry generates value from the
production of queen bees and package bees, pollen, royal jelly, propolis and bee
venom. Rodriguez et al. (2003) noted that about 17% of apiarists have 50 hives or
more but operate 85% of the total number of hives. Beekeepers operating 250 hives or
less produce 16% of the honey crop and 62% of the total honey production is
estimated to be produced by about 250 beekeeping businesses. Most commercial
honey producers are contracted to supply an annual volume of honey to a major honey
packing business.
The industry also generates economic value through pollination services. Paid
pollination to beekeepers has been estimated at $3.5 million per year (Oakeshott,
2007). There have been various studies aimed at calculating the value of pollination
outside of paid pollination. The original study by Gill (1989) valued pollination by
honey bees at $1.2 billion p.a. and a later study by Gibbs and Muirhead (1998) arrived
at a similar amount. A more recent study by Gordon and Davis (2003) has revised the
estimate upwards to $1.7 billion p.a. These figures are based on many horticultural and
other crops not continuing if honey bee pollination is not available. A significant level
of honey bee pollination service is provided free to agriculture by incidental
pollination, through the location of managed apiaries near agricultural enterprises as
well as by feral bees. The report of the Australian House of Representatives Standing
Committee on Primary Industries and Resources (Australian Government, 2008) stated
that, taking into account all plant based industries and wool, meat and dairy
production, it is estimated that the honey bee industry contributes directly to between $
4 billion and $6 billion p.a. worth of agricultural production. Hive numbers required
for almond pollination are increasing with the major Australian almond grower
requiring 82000 hives for 2009, with these figures expected to increase to 250000-
300000 in the following few years, (Australian Honey Bee Industry Council (AHBIC),
2009).
The annual production of beeswax has decreased from a high of 596 tonnes in 1995 to
a consistent range of 327-345 tonnes between 2001-8 (Anon, 2011), with an estimated
farmgate value for 2008 of $1.73 million, based on honey manufacturers paying
beekeepers $5.30/kg (Warhurst, 2011). The most recent estimated value of beeswax,
propolis and honeycomb is about $2.5 million per year (Rodriguez et al., 2003).
6

Beeswax is used in candle making, cosmetics, food processing, varnishes and polishes.
Commercial pollen production is an important diversification for some beekeepers,
production has increased in recent years with 3 to 4 tonnes per year per beekeeper
being collected and sold, primarily to Asian markets. Like honey, pollen varies
according to the plant species from which it originates; it is used in medicines, as a
food supplement and in cosmetics. Royal jelly is produced in the hypopharyngeal
glands of young worker bees following the consumption of pollen and is the food fed
to queen bees during their larval and adult stages. Royal jelly is sold fresh, cooled or
frozen, freeze dried, or mixed with other products, it is used in dietary supplements,
food products and cosmetics. There are currently no producers in Australia due to the
high costs of production and royal jelly is imported from Asian countries. Propolis is a
substance made by bees from plant resin; it is sold in a fresh or processed state and is
used as an additive to cosmetics, food and medicine. Honey bee venom is a clear,
odourless watery liquid containing a number of volatile compounds and is traditionally
used in natural medicines. Bee venom collection is a highly specialised field with a
relatively small market.
Queen bee and package bee industry
Queen bees are produced by dedicated breeders who sell the mated queen bees to
beekeepers within Australia and to export markets. Many honey producers and
pollinators produce either part or all of their annual requirement of queen bees and
purchase the balance. Statistics on the estimated portion of queen bees purchased by
beekeepers was compiled and published by Benecke in 2003 and is shown in Table
1.3.
7

Table 1.3. Portion of queen bees purchased by beekeepers each year**.
State None < Half > Half All% % % %
New South Wales 48 21 18 13Victoria 0 85 0 15
Queensland 50 45 0 5Northern Territory 0 0 0 100
South Australia 3 4 29 64Tasmania * * * *
Western Australia * * * *
** Source: Benecke (2003)* Unknown
The primary queen bee production area is located along the east coast of Australia,
with Western Australia also producing queen bees. In 2000-01, the latest data
available, Australian beekeepers sold approximately $3.3 million worth of queen bees
(Rodriguez et al., 2003) which approximates to 250000 queen bees produced. Queen
bee and package bee exports have reduced with concerns from importing countries
about the disease status of Australian bees (Australian Honey Bee Industry Council,
2009), for the 2009-10 financial year New South Wales exported 30233 queen bees
and 22145 package bees, this has reduced for the 2010-11 financial year to 21412
queen bees and no package bees (Mifsud, 2011 pers. com.).
Three races of Apis mellifera queens are produced for use by commercial beekeepers
and in package bees: Italian race is the most popular and Caucasian race is the second
most popular, followed by the Carniolan race. Queen bees are required at various
times of the year with demand highest between spring and autumn. Queen bee exports
are required in the northern hemisphere spring. Queen bees are shipped in mailing
cages made from wood or plastic in ventilated boxes, or in queen banks by overnight
express or through the mail system. Queen bee breeding stock is imported from
Europe and the USA. Importation of breeding stock is expensive as the queen is
required to remain in quarantine with grafted larvae being released to the importer
before the imported queen bee is destroyed.
8

There has been continued research undertaken by the Rural Industries Research and
Development Corporation and State Departments of Agriculture on improving queen
bee production. Due to the concerns raised by some beekeepers, the Australian Honey
Bee Industry Council (AHBIC) has re-established a breeding program to provide
improved genetic material to the domestic and international markets. This group is
continuing to rear and evaluate breeding stock (Australian Honey Bee Industry
Council, 2009).
Package bees, usually 1.5 to 3 kg of worker bees with or without a mated queen bee in
a small wood and gauze container, have been exported in small quantities for a number
of decades with the market increasing in the 1990`s due to demands from Korea. The
production of package bees is labour intensive requiring a small crew of employees to
complete the task quickly. Bees are shipped by airfreight with each cage of bees
supplied with a container of bee feed, the cargo is fragile and ventilation is an
important factor. There are three major exporters of package bees from Australia, all
located in New South Wales with exports undertaken between February and April.
The package bee industry has been valued at about $2 million each year (Benecke,
2003), the most recent valuation published. Package bee exports have declined in
recent years with concerns about Australian bee disease status (Australian Honey Bee
Industry Council, 2009).
There are about ten major breeders and suppliers of queen bees in Australia with about
five exporting queen bees on a regular basis. The queen bee sector is essential for the
Australian beekeeping industry with the supply of queen bees to the Australian market
considered to be limited with orders not able to be met at specific times of the year.
The lack of availability of queen bees results in honey producers not being able to
maximise their honey production and may restrict the expected increase in supply of
hives for pollination services. There are a relatively low number of commercial queen
bee breeders in Australia, considering the potential size of the queen bee market.
Australia recently gained access into the north American market; however, similar to
packaged bees, this market is also currently under scrutiny by the importing countries
(Australian Honey Bee Industry Council, 2009).
9

There is an opportunity for beekeepers to diversify into queen bee production to
reduce some of the risks resulting from reduced world honey prices. Although queen
bee breeders may earn a greater profit relative to honey producers, the time-consuming
nature and inflexible working hours associated with breeding queen bees suggest the
per unit costs could be high. Honey producers may not receive a high profit but they
are not required to manage the business seven days a week and they have some
flexibility in working hours. Becoming a queen bee breeder also requires specialist
equipment and skills.
Industry consultations suggest there is a general lack of breeding stock within
Australia, which limits the ability to capitalise on the USA access. Improving and
increasing the breeding stock in Australia will ensure that queen bee breeders can
compete with overseas competitors. In the long term, the success of the queen bee
breeding sector will depend on the quality of Australian queen bees relative to the
world suppliers (Centre for International Economics, 2005). This means that
Australian queen bees should continue to be bred for their honey-gathering potential,
good temperament, high disease resistance, low swarming tendency and high daily egg
laying rate.
Queen bees and queen quality
Breeding queen bees is an important part of the beekeeping industry. Each bee colony
is headed by a queen bee with a lifespan of one to three years. To maintain colonies in
a strong condition with the high worker bee population necessary to produce surplus
honey or for crop pollination requires the queen bee to be replaced on a regular basis.
For commercial honey-producing hives queen replacement may occur two or three
times in a two year period. Some commercial beekeepers rear a portion of their
replacement queen bees each year. However, due to the need to produce a honey crop
at the same time that queen bee rearing is taking place, many beekeepers purchase a
portion of their required queen numbers each year from commercial queen bee
breeders.
Commercial queen bee breeding and rearing in Australia are generally based on
methods developed in the USA and adapted for Australian conditions. Some
individual queen bee breeders, or a group of beekeeping industry personnel,
10
sometimes supported by a Government agency, have developed selection and
evaluation programs to provide breeding stock to their own business or to supply other
queen bee breeders and beekeepers that rear queen bees from that breeding stock.
Australia has a diverse range of climatic regions containing a wide variety of native
flora, cultivated crops and exotic ground flora. In addition, it has a wide range of
agricultural and horticultural crops which benefit from honey bee pollination, as well
as an opportunity to produce queen bees and package bees for export. A diverse range
of honey bee uses would be expected to benefit from the development of honey bee
varieties specifically suited for these different purposes. However, it is not
economically feasible to cater for this wide range of needs due to the relatively small
size of the Australian beekeeping industry. Principally because of the financial
constraints placed on the industry, queen bee selection concentrates on the basic
criteria of honey production, disease resistance and temperament for breeding stock
producing both queen bees and drones. Little selection or evaluation consideration for
other characteristics has been applied to drone honey bee breeding stock.
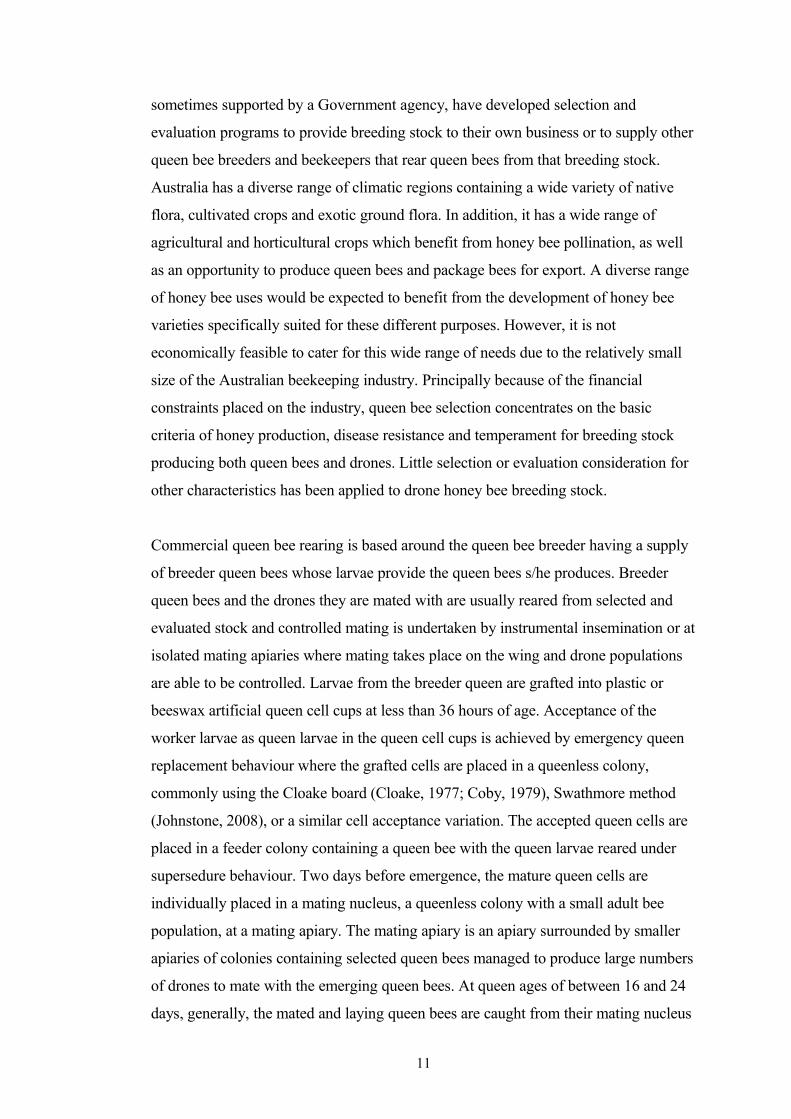
Commercial queen bee rearing is based around the queen bee breeder having a supply
of breeder queen bees whose larvae provide the queen bees s/he produces. Breeder
queen bees and the drones they are mated with are usually reared from selected and
evaluated stock and controlled mating is undertaken by instrumental insemination or at
isolated mating apiaries where mating takes place on the wing and drone populations
are able to be controlled. Larvae from the breeder queen are grafted into plastic or
beeswax artificial queen cell cups at less than 36 hours of age. Acceptance of the
worker larvae as queen larvae in the queen cell cups is achieved by emergency queen
replacement behaviour where the grafted cells are placed in a queenless colony,
commonly using the Cloake board (Cloake, 1977; Coby, 1979), Swathmore method
(Johnstone, 2008), or a similar cell acceptance variation. The accepted queen cells are
placed in a feeder colony containing a queen bee with the queen larvae reared under
supersedure behaviour. Two days before emergence, the mature queen cells are
individually placed in a mating nucleus, a queenless colony with a small adult bee
population, at a mating apiary. The mating apiary is an apiary surrounded by smaller
apiaries of colonies containing selected queen bees managed to produce large numbers
of drones to mate with the emerging queen bees. At queen ages of between 16 and 24
days, generally, the mated and laying queen bees are caught from their mating nucleus
11

and placed in a small mailing cage provided with food and with a small number of
young escort bees to care for the queen. The cage with the young queen bee and escort
bees is mailed or delivered to the purchaser, usually a commercial beekeeper, who
then removes the old queen from the hive to be requeened and introduces the young
queen into the hive, usually in the mailing cage. By about seven days after introduction
the young queen has been released from the cage, fed, and egg laying has commenced
within the hive. Attention to disease control, nutrition, and drone population numbers
are of high priority at all times during the queen rearing and mating processes.
Information at various levels of competence has been available over many decades in
books, journals and research papers on all aspects of queen bee breeding and rearing.
A number of books published mainly during the 1980s (Laidlaw, 1979; British Isles
Bee Breeder`s Association, 1983; Ruttner, 1983; Rinderer, 1986; Taber, 1987) provide
detailed information on biological, technical and practical aspects of breeding, rearing
and mating queen bees from small numbers to large numbers for commercial
purposes. Data in these books have been continuously updated by numerous research
papers adding to the knowledge base.
The number of sperm present in the spermathecae of queen bees after mating and the
effects of spermathecal sperm numbers on queen performance have been investigated
by a number of researchers. Mackensen (quoted in Jay and Dixon, 1984) stated that
queen bees with one million sperm should lay fertilised eggs for “a time”, whereas
Taber (quoted in Jay and Dixon, 1984) stated that queen bees with less than three
million sperm are unable to head commercial honey production hives for one season.
The actual number of sperm reported in spermathecae of naturally mated queens varies
quite widely. Over a six year period, Jay and Dixon (1984) found that 11 % of queen
bees had less than three million sperm and 45-64 % contained more than five million
sperm in their spermathecae. Severson and Erickson (1989) recorded sperm counts
from naturally mated queen bees over three years, finding 41 % of queens had sperm
counts of at least 4.5 million, and considered these queens to be adequately
inseminated for utilization by beekeepers. This view was shared by Harizanis and
Gary (1984), who considered that drone bee populations were adequate when they
provided commercially reared queen bees with sperm counts of 4.3-4.7 million.
12

Woyke (1971) reported naturally mated queen bees produced from larvae grafted at
one or two days of age contained between 5.03-5.74 million sperm in their
spermathecae whereas Al-Lawati et al. (2009), examining old and young queens,
found on average 3.5 million sperm. Van Eaton (1986) reported the mean sperm count
for New Zealand queen bees was 4.72 million.
Koeniger and Koeniger (2007) commented on the differences between authors on the
range of sperm numbers present, with a low 1.01 to 1.88 million reported by Schlüns
et al. (2005); Koeniger and Koeniger (2007) of 1.1 to 3.0 and Woyke (1964) 3.4 to 5.1
million, suggesting that these differences in sperm counts may be associated with
numbers of available drones. They reported a significant negative correlation between
mating flight duration and number of spermatozoa in the spermatheca, with groups of
queens which flew less than 30 minutes having a mean 3.0±0.77 million sperm,
compared with 1.1±1.04 million sperm for those that had flown for 30 minutes or
more. They further suggested that these data support the hypothesis that queens
continuously receive information about their mating success during flight and return to
the colony as soon as they have mated with a sufficient number of drones.
The most recent investigation of sperm numbers in spermathecae was by Delaney et
al. (2010), who assayed commercially reared queen bees for potential measures of
queen quality in the USA. Overall, they considered the queens they examined to be
“sufficiently” inseminated with 3.99±1.50 (range 0.20-9.03) million sperm. Of the
queens they examined, 18% were considered to be “poorly” mated with < 3 million
stored sperm, and 81.1% of queens were “under” mated with < 5 million sperm.
However, their conclusions were based on Woyke (1962) reporting that a fully mated
queen bee typically stores approximately 5-7 million sperm. The number of sperm
present in spermathecae was significantly different across the various commercial
sources, which Delaney et al. (2010) ascribed to a number of factors (i) Abiotic factors
such as weather and geographic location; (ii) Biotic factors such as differences in
drone availability, density, and sperm loads among males, and (iii) Management
practices such as different genetic stock, chemical treatments and hive environment.
The number of ovarioles in a queen`s ovaries is a measure of queen quality as it relates
to the number of eggs a queen is able to lay. Casagrande-Ialoretto et al. (1984)
reported an average of 175 ovarioles per ovary in A. m. ligustica queen bees and Van
13

Eaton (1986), examining commercial strains of queen bees in New Zealand, reported a
mean number of 148 ovarioles per ovary, with a range of 100-182.
In artificially reared queens, the number of ovarioles per ovary is closely related to the
age of the larva when grafted (Ruttner, 1983). Orosi-Pal (cited in Ruttner, 1983) found
that the number of queens in which the number of ovarioles exceeded a certain level
increased with the younger the age that larvae were grafted. He found that 80 % of
queens reared from eggs, 51 % reared from worker larvae 18-20 hours old, and 12 %
reared from larvae grafted at 66-78 hours old exceeded 150 ovarioles per ovary.
Woyke (1971) reported similar results, with one-day-old larvae averaging 154
ovarioles per ovary, two-day-old larvae averaging 146, and three-day-old larvae
averaging 136.
Queen body weight and spermatheca diameter are also indicators of queen quality.
Woyke (1971) reported that queen bees grafted from one- and two-day-old larvae, at
emergence, ranged in weight between 0.156-0.201 g; whereas Van Eaton, (1986)
reported a mean queen weight for mated queen bees of 0.214 g; and Nelson and Gary
(quoted in Van Eaton, 1986) reported an average queen bee weight of 0.208 g.
Delaney et al. (2010) found the mean wet weight for non-laying queens to be
0.184±0.217 g; they also reported significant differences between the various sources
of queen bee suppliers.
Van Eaton (1986) reported the mean spermatheca diameter of commercial New
Zealand queen bees as 1.217 mm. Woyke (1971) identified differences in spermatheca
diameter between queens grafted from larvae of different ages, with one-day-old
larvae producing newly emerged queens with spermatheca diameters between 1.225-
1.375 mm, and two-day-old larvae produced queens ranging between 1.150-1.300
mm.
Retention of semen in oviducts negatively affects queen performance. Vesely (1970)
reported that infecundity and incidental death of artificially inseminated queen bees
was often caused by the retention of semen in lateral oviducts. Vesely observed semen
retention in: queens that had been inseminated after they had commenced laying,
queens reared in unsuitably populated mating hives, those inseminated out of the
14
rearing season and those inseminated with preserved semen. Woyke and Jasinski
(1978) found that as the age of drones used to inseminate queen bees increased, the
percentage of queens with semen residues in their oviducts increased. A seasonal
effect was also found. Queen bees which could not clear their oviducts died.
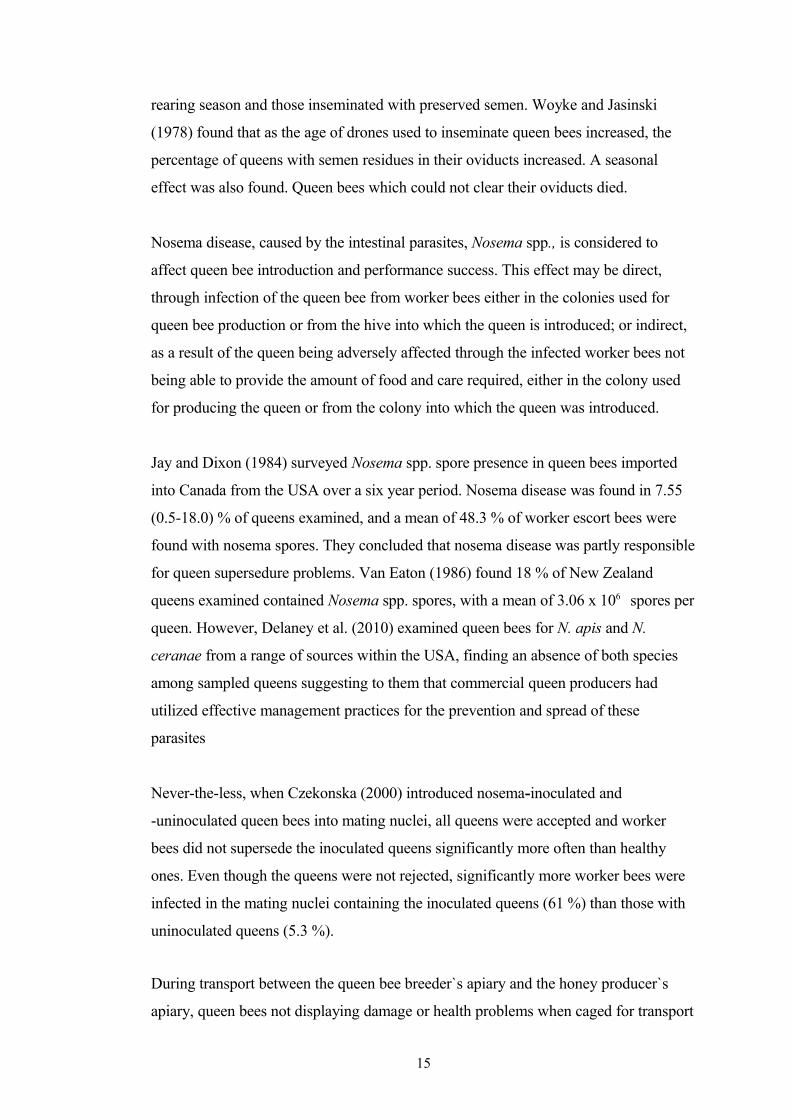
Nosema disease, caused by the intestinal parasites, Nosema spp., is considered to
affect queen bee introduction and performance success. This effect may be direct,
through infection of the queen bee from worker bees either in the colonies used for
queen bee production or from the hive into which the queen is introduced; or indirect,
as a result of the queen being adversely affected through the infected worker bees not
being able to provide the amount of food and care required, either in the colony used
for producing the queen or from the colony into which the queen was introduced.
Jay and Dixon (1984) surveyed Nosema spp. spore presence in queen bees imported
into Canada from the USA over a six year period. Nosema disease was found in 7.55
(0.5-18.0) % of queens examined, and a mean of 48.3 % of worker escort bees were
found with nosema spores. They concluded that nosema disease was partly responsible
for queen supersedure problems. Van Eaton (1986) found 18 % of New Zealand
queens examined contained Nosema spp. spores, with a mean of 3.06 x 10⁶ spores per
queen. However, Delaney et al. (2010) examined queen bees for N. apis and N.
ceranae from a range of sources within the USA, finding an absence of both species
among sampled queens suggesting to them that commercial queen producers had
utilized effective management practices for the prevention and spread of these
parasites
Never-the-less, when Czekonska (2000) introduced nosema-inoculated and
-uninoculated queen bees into mating nuclei, all queens were accepted and worker
bees did not supersede the inoculated queens significantly more often than healthy
ones. Even though the queens were not rejected, significantly more worker bees were
infected in the mating nuclei containing the inoculated queens (61 %) than those with
uninoculated queens (5.3 %).
During transport between the queen bee breeder`s apiary and the honey producer`s
apiary, queen bees not displaying damage or health problems when caged for transport
15

may be physically damaged or stressed by temperature and humidity extremes to a
level where the queen arrives dead, visually damaged, or apparently healthy with
effects of the damage not becoming apparent until a later time. Forster (1971)
examined transport effects on queen bees by comparing local, air-mailed and surface
mailed queen bees, concluding there was no significant difference in honey production
between the three groups examined; however, queen supersedure was significantly less
for local queens (5.2 %) than for air-mailed (27.7 %) and surface mailed (27.7 %)
queens. He suggested that the higher supersedure rates resulted from damage to the
queens during transport.
Finley et al. (1999) placed temperature monitoring devices in queen shipments moved
across the USA. Although small numbers of bees arrived dead, there were no clear
long-term detrimental effects of transport. Free (quoted in Finley et al., 1999) found
that groups of ten bees died after five hours exposed to 10°C. While bees without
water die at about 46°C, they may survive these temperature extremes for short
periods of time (Finley et al., 1999).
The ability of a queen bee to re-commence mating after commencing egg laying has
not been widely reported in beekeeping literature. Jungwirth (1972) observed two
instances where he concluded that a queen that had started egglaying after mating,
subsequently mated again.
Drone bees and drone quality
Although there is a large amount of information readily available on queen bee
breeding and rearing, there is much less information available on the selection, rearing
and maintenance of drone bees for use in breeding programs or at commercial queen
bee mating apiaries. In general, queen bees used to produce drones for breeding
purposes are selected on the ability of the queen’s offspring to be high achievers for
the same criteria that queen mother queen bees are selected- principally their ability to
produce high volumes of honey or to pollinate a particular crop, high disease
resistance and good temperament. Drone characteristics important for the successful
mating of queen bees under the unnatural situation of commercial mating apiaries are
not usually taken into account; e.g., rearing of large numbers of drones over a range of
16
nutritional and seasonal conditions, care and maintenance of those drones to a
maximum age, and individual drones each producing a large volume of semen
containing spermatozoa in large numbers with high viability and motility.
Bee colonies tend to produce drone bees to coincide with the production of virgin
queen bees for either swarming or supersedure. Free and Williams (1975), in the
northern hemisphere, found drone eggs normally first appear in a colony in spring,
reach maximum numbers by early summer and cease to be laid by early autumn.
Dzierzon, 1845 (Results presented in Grout, 1949) reported that unfertilised eggs from
unmated queen bees produced drone bees. Root (1890) reported the first recorded
sighting of a drone mating with a queen bee, that a drone develops from an unfertilised
egg and worker bees from fertilised eggs, that sperm are stored in the queen`s
spermatheca and remain viable for a number of years and that a queen bee, once
mated, is able to lay fertilised or unfertilised eggs. Root also discussed methods for
rearing large numbers of drones suitable for mating with queen bees and means of
restraining undesirable drones. Beekeepers have, thus, had this basic knowledge
available to them, at least since Root`s book was published.
The reproductive organs of the drone have been described by Moritz (1989). The
reproductive organs comprise one endophallus (copulatory organ), paired testes,
seminal vesicles and mucous glands. The endophallus is a long, soft, membranous
duct which lies inside the abdomen and has three distinguishing zones; the vestibulum,
the cervix and the bulb. Spermatozoa migrate from the testes to the seminal vesicles,
although the time at which this occurs is not fully clear. They attach their head to the
gland cells of the wall and undergo a secondary physiological process of maturation.
At the same time, the gland cells empty their contents into the vesicle, among the
spermatozoa. The mucous glands are at the rear of the seminal vesicles and open into
the seminal duct; the inner walls of the mucous glands consist of secretory epithelial
cells which secrete the white mucous substance. Secretion of mucous starts
immediately after emergence of the adult drone and is completed by about day 5.
Semen consists of two components from different sources; sperm from the testes
which are about 0.25 mm long, and seminal fluid from the seminal vesicles.
17
A publication of major practical benefit to honey bee researchers and bee breeders was
by Bishop (1920), which identified that the extrusion of the drone`s endophallus
caused by artificial means (manual eversion) did not necessarily, nor generally,
duplicate the natural act of copulation, even when it appeared to do so.
Bishop (1920) reported that sperm developed in the testes during the drone pupal stage
and that sperm and seminal fluid organ development was complete in drones about 9-
12 days after emergence. He examined drones, by manual eversion, over a range of
ages and found that in three-day-old drones there was no secretion or only mucous
with full eversion only if strong stimulus was applied; in five-day-old drones, the
organ may be caused to extrude with ejaculation of mucous and inactive sperm; in
nine-day-old drones the organ extruded more readily with ejaculation of active sperm
first and mucous second; in 12-day-old drones the apparatus was apparently mature
with the reaction more easily produced; and that 21-day-old drones elicited a similar
response as 12-day-old drones.
Mackensen and Roberts (1948) found that, after initial eversion of the endophallus by
anaesthesia of the drones, complete eversion was obtained by manual eversion.
However, there was a great variation in the degree of eversion, the distribution of
semen and mucous, and the amount of semen ejaculated. Woyke (2010) reported that
during manual eversion of the endophallus and during natural mating three substances
are ejected – semen, mucous and fragments of epithelial membranes sloughed off from
the mucous glands.
Jaycox (1961) assessed drone sexual maturity on the movement of sperm from the
testes to the seminal vesicles and vasa deferentia, which he found was completed at
age 8-11 days. This view was not shared by Moritz (1989), with sperm completing
their migration to the vasa deferentia much earlier (about two-three days of age) and
completing their second physiological process during a second stage of maturation.
Moritz (1989) considered drones to have completed their physiological development
by 12 days old, indicating that drones of this age may be used for inseminating queen
bees. Moors et al. (2005) examined the development of mucous glands in drone honey
bees each day between days two to six and on days nine and twelve after emergence,
18

finding accumulation of mucous commenced at the onset of adult life and reached a
maximum by day six.
The age at which drones mature and are able to mate with queen bees is not known
with accuracy due to difficulties with obtaining this data under field conditions, since
queen bees mate on the wing at a distance from their colony. Mating age of queen bees
has been shown to be affected by climatic conditions (Ruttner, 1956) which could also
be expected to affect drone mating age. Other factors, such as nutritional conditions
during drone rearing, could be expected to affect drone mating age (Nguyen, 1995). A
number of authors have provided data on the age at which drones mature, based on
sperm presence in the seminal vesicles and the mucous glands with completed
development and full of mucous (see above and below). However, this physiological
development in itself is not sufficient to ensure that the drone is physically capable of
mating with a queen bee.
Bishop (1920) considered drones to be mature after the fifth or sixth day with the
added statement that maturity becomes accentuated up to the age of nine or ten days
with slight morphological and histological changes after the sixth day. Mackensen and
Roberts (1948) stated that drones become sexually mature at eight days of age with the
maximum number of sperm accumulated in the seminal vesicles. Moritz (1989) stated
drones at twelve days old are mature and their sperm may be used for inseminating
queen bees. Nguyen (1995) found drones in hives fed improved protein nutrition
reached sexual maturity as early as ten days after emergence with all being mature by
seventeen days, while drones in hives not fed supplementary pollen commenced
reaching sexual maturity at twelve days with all reaching sexual maturity by eighteen
days. However, Nguyen defined sexual maturity as the presence of semen on the tip of
the endophallus following manual eversion, and therefore did not account for drone
mating behaviour.
Drone flight is considered to be a contributing factor to drone maturity. It is suggested
that flight provides reflex or mechanical stimulation, and that the transfer of sperm to
the seminal vesicles must be followed by a period of regular flights to ensure maturity
(Kurennoi, 1953, quoted in Jaycox, 1961). Brunnich (1927, quoted in Jaycox, 1961)
suggested that flight may be a factor in overcoming retarded maturation by raising the
19

drone`s body temperature. He reported drone body temperatures of up to 48°C
compared with foraging worker bee temperatures of 44°C found by Schultz-Langner
(1958, quoted in Jaycox, 1961).
Jaycox (1961), however, compared the number of sperm in seminal vesicles and vasa
deferentia in 3- to 11-day-old drones allowed free flight following their emergence,
with those caged at emergence in a nursery colony. There was no significant
difference in sperm counts between same-age drones allowed free flight or confined,
with a continuation of the study showing that there was no deleterious effect from
confining drones for up to six weeks. There may be an effect of flight on mucous
composition. Colonello and Hartfelder (2003) found that protein content of mucous in
Africanized honey bee drones peaked at day 5 then decreased reaching a stable level at
day 8, which they suggested coincided with the age at which drones initiate their first
flight activities.
Ruttner (1956) measured the effects of temperature, cloud cover, wind and radiation at
the time of mating on mating success of queen bees and concluded that such factors
could delay mating flights between the first and last mating flight by 5-15 and up to 24
days. Ruttner also stated that queen bees receiving too little semen at mating were
short-lived queens. Koeniger and Koeniger (2007) found that under conditions of
limited drone numbers there was a significant negative correlation between mating
flight duration and number of spermatozoa in the spermatheca. This issue has been
discussed elsewhere in the review.
Practical aspects of drone/queen bee matings were summarised by Loper (1993). USA
researchers in the early 1960s identified areas where drone bees congregated, termed
“drone congregation areas” (DCAs). In these areas, drones responded to the queen sex
pheromone (9-oxodec-trans-2-enoic acid) six to 30 metres above the ground while few
or no queens were present in other, seemingly similar, areas. Further research showed
better mating success of queen bees was obtained when colonies containing drones
were placed 2.5 kilometers from the colonies containing the queen bees, rather than in
the same apiary. Thus, DCAs seem to be re-orientation areas where drone numbers
increase with drones flying higher and possibly seeking out more cues to follow,
20
allowing them to come into contact with queen bees on mating flights, also attracted to
the same areas.
Male fitness of honey bee colonies was examined by Kraus et al. (2003). In social
insects, such as honey bees, female reproductive success is determined through the
number of surviving reproductive colonies (swarms) produced and is relatively easily
measured. Determination of reproductive success of males is difficult since males are
usually short-lived and matings are difficult to observe. The male reproductive success
of a whole colony is not able to be determined by the number of males produced, as
drones in one colony may out-compete others in mating efficiency. Kraus et al. (2003)
found clear evidence for an extensive diversity in male mating success at the colony
level with a significant positive correlation between the number of successfully mating
drones per colony and the individual siring success of drones of these colonies. It has
been assumed that the number of drones, rather than their individual mating success,
was most significant for colony success (Baudry et al., 1998, quoted in Kraus et al.,
2003). However, Kraus et al. (2003) consider that not only the number of mating
males but also the individual siring success of a drone is determined by the colony
and/or the genotype of the mother queen, and selection through the male side appears
to be an extremely important factor for colony fitness. Woyke (1973) showed that the
volume of semen produced per drone is highly variable and Kraus et al. (2003) stated
that even when a high amount of sperm is transferred into the spermatheca of a queen
bee, this does not necessarily imply that many offspring workers are sired. They
concluded that male reproductive success appears to be a major driver of natural
selection in honey bees.
The effects of inbreeding on brood survival was examined by Woyke (1963) who
observed that after two or three generations of brother-sister matings, queens laid
fertilised eggs in worker cells with approximately 50% of the hatching larvae being
diploid males. The diploid male larvae were destroyed by nurse bees, with only
approximately 50% of hatching female larvae surviving. A queen bee heading such a
hive would be classified as failing and would not be expected to survive over an
extended time period.
21
Semen volume and number of sperm per drone
Honey bee sperm are 230 µm long cells, consisting of an 8 µm head with an acrosome
on its end and a long tail. The tail contains an axoneme and two different-sized
accompanying mitochondrial derivatives. Spermatogenesis takes place in the testes of
the haploid drone during its larval and pupal life (Hoage and Kessel, 1968, cited in
Pabst and Pfeiler, 1994).
Moritz (1986), examining sperm competition in honey bees, found there was an
unequal contribution of drones to the offspring of a honey bee queen. While Moritz
was unclear on the reason for this, he cited Ruttner (1976) who had reported
considerable variation in the numbers of sperm per drone, suggesting that drones with
a large number of sperm may be genetically more successful than others.
Schlüns et al. (2004), using microsatellite fingerprinting, determined the contribution
of sperm in the progeny of queen bees inseminated with either 0.5 or 1.0 µL of semen
from six or seven drones. They reported no significant effects of the insemination
sequence but a strong impact of the semen volume of a drone on the frequency of his
worker offspring in the colony. They also found a high correlation between a drone`s
sperm number and the percentage of its sperm reaching the spermatheca after
instrumental insemination, suggesting that individual differences in number of sperm
per drone influence their paternity success.
Methods for assessing the number of spermatozoa produced by drones have been
varied, as have been the reported results. Mackensen and Roberts (1948) described
their methodology for estimating the number of sperm present, either from a queen
bee`s spermatheca or from a drone`s seminal vesicles. They diluted each sample in
either 5 mL or 10 mL of tap water and counted the number of sperm present in a
known volume (0.8 mm3) contained in a counting chamber. They conceded that there
was considerable chance of error in making counts from such a small sample and that
greater accuracy could be obtained by counting a larger sample.
Mackensen (1955), experimenting with artificial insemination techniques of queen
bees, collected sperm directly from the seminal vesicles removed from drones and
22
reported that drones 7-8 days of age produced an average of 9.89 (ra. 8.36-10.63) x 106
sperm per drone. Köhler (1955, quoted in Ruttner, 1956), however, reported the
average number of sperm in a drone to be much lower, at 4.5 x 10 6, whereas Woyke
(1962) reported an average of 11.0 x 10⁶ sperm per drone and Jaycox (1961) 10.76 x
106 sperm in free-flying drones at 8-9 days of age. Rinderer et al. (1985) reported 5.7 ±
0.9 x 10⁶ sperm in one seminal vesicle in European race drones. Rinderer et al. (1999)
subsequently collected data on sperm numbers from 12-day-old drones in free flying
hives, by dissecting one seminal vesicle from each drone, macerating in 10 mL of
0.5% saline solution and using a haemocytometer to count sperm numbers. In this
case, a mean sperm count of 4.25 ± 0.42 x 10⁶ sperm per seminal vesicle was recorded.
Collins and Pettis (2001) also used manual eversion to assess sperm numbers in
drones. Forty percent of 12-day-old drones produced semen using manual eversion,
with the authors stating “artificial ejaculation of drones is not completely efficient”.
Semen volume was determined using a Gilmont micrometer syringe with a digital
scale, and the number of sperm was assessed by diluting a 0.1 µL fraction of the
semen from each drone in 250 µL of a 3% saline solution and counting the number of
sperm present in a counting chamber. Results from Collins and Pettis (2001) were:
volume of semen per drone, mean 0.946 (ra. 0.48-1.67) µL, concentration of sperm per
drone, mean 9.15 (ra. 0.5-29.95) x 10 6 sperm per µL, or a mean of 8.66 x 10⁶ sperm
per drone. They considered that the large variation they found for concentration of
sperm in the semen was influenced by the semen being viscous with sperm cells
tending to clump together after dilution, providing a considerable error of
measurement at this point. They concluded that a healthy drone will produce up to
1.25 µL of semen with close to 10 x 106 sperm, with the majority of sperm present
being alive.
Duay et al. (2002) considered the number of sperm produced by a drone of paramount
importance to male fitness. Twelve-day-old A. m. carnica drones, confined in their
hives until examination, produced 7.475 ± 2.813 x 10⁶ sperm per drone with sperm
numbers determined by dissecting the two seminal vesicles in ethylene glycol diluted
in distilled water. Schlüns et al. (2003) compared the number of sperm produced by
drones reared in drone cells with smaller body sized drones reared in worker cells.
Drones were allowed free flight during maturation and sperm counts were obtained by
23

dissection of the seminal vesicles. The number of sperm in one seminal vesicle was
counted in 0.5 mL Hyes` Ringer solution further diluted in distilled water to 5 mL total
volume, counting was in a Thoma counting chamber. The smaller drones produced
significantly fewer sperm, 7.5 ± 0.5 x 10⁶, than normal sized drones, 11.9 ± 1.0 x 10⁶.
Gencer and Kayha (2011) also compared semen volume and the number of sperm
produced between small drones reared in worker cells and large drones reared in drone
cells from A. m. caucasica queens. Small drones produced a significantly lower mean
semen volume (0.66 µL) than large drones (1.01 µL), with the mean sperm number
from small drones also being significantly lower (4.43 x 10⁶) than large drones (7.32 x
106).
Phiancharoen et al. (2004) dissected seminal vesicles from A. mellifera drones
collected during mating flights and stored them in Tris buffer. Sperm from the vesicles
were then dispersed in the buffer solution and further diluted with 20 mL of distilled
water. Sperm numbers were counted with a Fuchs-Rosenthal haemocytometer, with
the mean number being 7.6 ± 1.47 x 10⁶.
The effect of hive nutrition on drone production of semen and spermatozoa is unclear.
Nguyen (1995) examined the effects of dietary supplements on semen and sperm
production. Drones were manually everted and the volume of semen produced
recorded in a graduated syringe. Semen was then diluted in 1.0 mL Tris buffer and 9.0
mL water added, and sperm counts were made using a haemocytometer B.S.748. The
number of sperm in 10 squares of the haemocytometer field was counted.
He found semen volumes and sperm counts from drones from colonies fed limited
field pollen were, mean 0.91 (ra. 0.80-1.00) µL and, mean 7.14 (ra. 5.75-8.45) x 106
sperm per drone, compared with drones from colonies fed supplementary pollen with
mean 0.93 (ra. 0.82-1.00) µL and 8.01 (ra. 6.75-9.50) x 106 sperm per drone,
respectively. Anderson (2004), however, reported a different outcome when he
examined the effects of dietary supplements fed to drone rearing colonies, on
subsequent drone sperm numbers. Drones were confined in a super above a queen
excluder. At 20 days of age > 95% did not produce semen after manual eversion.
Semen was collected at 27 days of age, by manual eversion. Sperm numbers were
determined by removing and breaking each endophallus apart in 1:80 or 1:160 distilled
water and sperm numbers counted using a haemocytometer. Drones from control
24

colonies not fed dietary supplements produced 3.19 ± 2.37 x 10⁶ sperm per drone and
drones from colonies fed dietary supplements produced fewer numbers of sperm.
Koeniger et al. (2005) attempted to address the issue of differences in reported data for
drone sperm production. They examined published data from Apis spp. by various
authors, including A. mellifera – A. m. (mellifera?) 11-12 x 106 (Woyke, 1960); and
for A. m. carnica 7.1 ± 1.9 (ra. 3.9-11.71) x 106 (Berg, 1990, 1992); 8.3 ± 1.1 x 10⁶
(Koeniger 2002, unpublished); 8.5 x 10⁶ (Moritz, 1981); and 10.2 ± 0.3 (ra. 8.1-12.4)
x 106 (Elbassiouny, 1992), drawing attention to the frequent high variation between
individual drones. They suggested this could be due to errors in the method used to
assess them. They identified two critical sources for inaccuracy when estimating drone
sperm numbers in dissected drones: (i) upon dissection, some sperm may be pushed
into the endophallus, (ii) upon dilution, sperm sink to the bottom and there is a
gradient of sperm concentration within the solution. They further suggested that
thorough dispersal before taking a sample is crucial. In addition, they commented that,
normally, the number of tested samples per drone or the number of units evaluated are
not published, with only average numbers of spermatozoa being given. They
concluded that it is premature to draw general conclusions from the differences in
number of sperm of drones and that the reason for these variations have to be
understood.
Sperm viability.
Evidence showing that sperm competition selects for “higher sperm quality” [sic] in
insects was provided by García-Gonzáles and Simmons (2005) who found paternity
success in the cricket Teleogryllus oceanicus was determined by the proportion of live
sperm in a male`s ejaculate. They were able to predict the paternity patterns observed
on the basis of the male`s relative representation of viable sperm in the female`s
sperm-storage organ. Their results provided direct experimental evidence that sperm
viability plays an important role in determining which male has the advantage when
males compete for fertilisation, and supported the hypothesis that selection should
maximise sperm quality. Hunter and Birkhead (2002), when examining sperm viability
and sperm competition in insects concluded that, all else being equal, males will vary
in their ability to fertilize ova on the basis of sperm viability alone, with their results
25
suggesting that sperm viability is one of a suite of male adaptations to sperm
competition in insects.
Honey bee sperm viability data vary between authors. Viability assessment of honey
bee sperm was also investigated by Collins and Donoghue (1999) who developed and
validated the use of the living:dead fluorescent stains SYBR-14 and propidium iodide
(PI). In an experiment examining the relationship between semen quality, percentage
viable sperm and queen performance, using instrumentally inseminated queen bees
inseminated with known ratios of live:dead sperm, Collins (2000a) determined that
sperm survival levels of 50% were sufficient for the queens to produce only fertilised
eggs, at least early in their lives.
Lodesani et al. (2004), when examining the effect of time on the viability of sperm in a
queen bee`s spermatheca, found a relatively low percentage (20.5 %) of dead sperm in
spermathecae of two-month-old inseminated queen bees, suggesting that sperm in
spermathecae undergo an initial selection for quality. However, after inseminating
queen bees with only dead sperm, Collins (2000b) found dead sperm in the vaginal
area of inseminated queen bees but none in the spermathecae, suggesting that activity
of the sperm themselves is critical in their initial migration to the spermatheca. Dead
sperm were found in the spermathecae of queen bees inseminated with a mixture of
live and dead sperm, causing Collins (2000b) to suggest that live sperm drag dead
sperm along with them when moving towards the spermatheca. In addition, Bresslau
(1905, cited in Collins, 2000b) identified a muscular sperm pump located in the
spermaduct, which was considered to support migration of sperm into the spermatheca
as well as the release of spermathecal contents for fertilisation.
Sperm viability, using the live:dead SYBR-14 propidium iodide stains, was used as a
measure of semen quality by Collins and Pettis (2001), who found that some sperm
were killed during collection and mixing so that 100% fresh semen did not always
provide 100% live sperm at examination. The presence of non-viable sperm in male
hymenopterans was also examined by Damiens et al. (2002), using the same staining
technique, assessing viability of sperm of the chalcid wasps Eupelmus orientalis and
Dinarmus basalis. They found that for both species 40% of the sperm in the seminal
vesicles was non-viable. They considered the high proportion of non-viable sperm
26
could not be explained by the experimental procedure as special care was taken and
suggested the results may be explained, in part, by the high initial dilution rate used
during flushing procedures.
Centrifuging pooled honey bee semen at conventional speeds was found to result in
unacceptably low sperm viability (34.1%) (Collins, 2003) with highest viability being
obtained at 82 or 250 g for 20-30 or 10-20 minutes, respectively. Collins (2004) also
reported that the temperature of the assay buffer in which the semen was collected had
less effect on viability than the method used for semen collection. Washing semen into
the buffer had less effect than collecting semen in a syringe, with an average of 15%
increase in viability. Highest viability was found when semen was collected directly
from the seminal vesicles rather than from ejaculation.
Conditions of honey bee semen storage after its collection may also influence sperm
viability data. Collins (2000a) observed good survival of sperm (70-80%) for up to 6
weeks if they were stored at room temperature. Collins (2004) subsequently collected
semen in a syringe and buffer at room temperature recorded a mean percent live sperm
of 78.1 ± 10.1 (ra. 58.5-91.0)%.
Effects of drone age on sperm quality were examined by Locke and Peng (1993) who
found sperm viability, identified by supravital staining, was adversely affected by
drone age. For example, they reported sperm viability in drones at 28 and 42 days of
age was 81.4 ± 1.62% and 80.1 ± 2.01%, respectively, with both being significantly
lower than for 14-day-old drones, at 86.2 ± 1.12%. They suggested this decline in
viability may be an indicator of a natural aging process with sperm in the seminal
vesicles reaching some age at which sperm senescence begins, with the final stage
being sperm membrane disruption and death. Gençer and Kayha (2011) compared
sperm viability between sperm from small drones reared in worker cells and large
drones reared in drone cells; mean sperm viability was not significantly different
between them, at approximately 98 %. Woyke and Jasinski (1978) also examined the
effects of drone age on semen quality, finding that as the age of the drone increased,
generally a lower number of spermatozoa entered the spermathecae of queen bees, and
that the percentage of queens with semen residues in their oviducts increased. The
effect of reduced drone semen quality on the increased presence of semen residues in
27
lateral oviducts of artificially inseminated queen honey bees and associated infertility
and death of the queens was also discussed by Vesely (1970, cited in Locke and Peng,
1993).
One hypothesised mechanism by which sperm competition may occur is by sperm
incapacitation (SI) which involves killing and/or inhibition of function of sperm from
one male by sperm or seminal fluid from another male. This hypothesis was tested by
Shafir et al. (2009), using A. mellifera, testing for increases in sperm mortality when
sperm from several drones are mixed. Their results, however, did not support the
existence of SI by killing of sperm during early encounter in vitro between semen
from unrelated drones
Sperm motility
Tourmente et al. (2007), when evaluating the seminal qualities of Boa constrictor
occidentalis, considered semen quality analysis a powerful tool for evaluation of
fertility potential of males and stated that sperm motility, evaluated as the sperm
velocity and percentage of motile spermatozoa, is positively correlated with
fertilisation success in several species.
Locke and Peng (1993) examined drone age, semen storage time and contamination to
determine how they contributed to honey bee sperm motility patterns. Drone bees
were allowed free flight until examined and semen samples were collected by manual
ejaculation. A 10 µL subsample of semen suspended in modified Kieve solution was
prepared for motility assessment, with motility scored on a scale of 0-4 (0 = no
movement, 4 = most movement), three minutes after the slide was placed on the stage
and examined at 400 X magnification. In this experiment there was a lag time of 2-5
hours between semen collection and motility assessment. No significant differences
were found for sperm motility from drones 7, 14, 28 and 42 days old, with motility
scores of 2.81±0.16, 2.85 ± 0.13, 2.55 ± 0.15, and 2.65 ± 0.17, respectively.
Honey bee sperm motility rates are reported to be higher at pH 6.35-8.40 in
hypertonic, rather than in hypotonic, solutions and no vigorous sperm motility was
observed in saline and tris-buffer diluents, both being hypotonic to seminal plasma
28
(Kaftanoglu and Peng 1984). Sperm storage time after collection may also
significantly alter sperm motility characteristics. Dietrich et al. (2005) assessing sperm
motility in rainbow trout, Oncorhynchus mykiss, semen found that post-mortem
storage (≥ 40-60 minutes), lowered sperm motility and also significantly influenced
sperm motility parameters such as percentage of motile sperm, mean sperm velocity
and sperm trajectory parameters.
Seasonal factors may also influence sperm motility. Martinez-Pastor et al. (2005),
examining sperm production and quality in three species of deer, reported that while
there were seasonal influences, there were greater differences between the species. For
chamois deer, they found that sperm samples collected during the breeding season
provided good motility results, with almost half of the samples collected during the
non-breeding season having almost no motility. Gizejewski (2004) reported that for
red deer, sperm motility was better in the first part of the mating period than in the rest
of it. Abdelwahab et al. (2006) reported that mean sperm motility in dairy goats was
significantly higher in spring than in autumn, and Ravimurugan et al. (2006) found a
seasonal effect on motility of buffalo sperm, with sperm motility being significantly
highest in winter for the first ejaculation and in summer for the second ejaculation.
There appears to be no data reported for impact of season on sperm motility in honey
bees.
Genetically determined traits of honey bees
There are numerous traits of honey bees which are known to be genetically determined
and, therefore, selected for in honey bee breeding programs. These have traditionally
been commercially advantageous traits, such as honey production and temperament.
More recently, a number of other traits have been demonstrated to be genetically
determined, including age at which individuals initiate foraging, forager nectar and
pollen load size, attendance of recruitment dances, dance dialect (Page et al., 1995),
pollen hoarding (Page and Fondrk, 1995), proboscis extension response (Page et al.,
1998), selection of foraging sources (Pankiw and Page, 1999) and hygienic behaviour
(Oxley et al., 2010).
29
While the above traits are primarily associated with worker bees, they indicate that
many traits in drones, including semen and sperm production are likely to be, at least
in part, genetically-determined.
Chemical composition of bee fluids, including drone semen
The source of the amino acids in honey bee bodies is the pollen collected by the
colony. Somerville (2004) analysed 182 pollen samples from 61 identified plant
species commonly foraged by honey bees in New South Wales and identified 17
amino acids present. He found that isoleucine was the most frequently limited amino
acid with 66 samples having levels of isoleucine; 11 samples with valine and two
samples with methionine below the desirable levels reported by de Groot (1953).
Never-the-less, Somerville (2004) concluded that most of the essential amino acids in
honey bee-collected pollen samples were at levels sufficient to meet the honey bee
nutritional requirements outlined by de Groot (1953).
Crailsheim and Leonard (1997) identified amino acids in worker honey bee
haemolymph, finding proline the predominant amino acid comprising ≥ 50% of total
amino acids in newly emerged bees and up to 80% from the third day; however, its
level decreased in older bees. The majority of amino acids present at lower
concentrations showed either no change in concentration or were higher in newly
emerged bees, and also decreased during the lifespan of the bees. Eighteen amino
acids were identified, with ten described by de Groot (1953) as essential for the growth
of honey bees, based on diet experiments; namely, arginine, histidine, lysine,
tryptophane, phenylalanine, methionine, threonine, leucine, isoleucine and valine. The
remaining eight identified amino acids were aspargine, glutamine, serine, glycine,
alanine, proline, cystine and tyrosine.
Amino acids present in drone honey bee haemolymph were subsequently examined by
Leonard and Crailsheim (1999), who found concentrations of free amino acids higher
than in worker bee haemolymph and with different relative proportions of individual
amino acids. The overall concentration of free amino acids reached its highest level on
the fifth day after adult drone emergence with only minor changes in concentration
occurring after the ninth day, with the ninth day being around the age at which drones
30

mature (Mindt, 1962, quoted in Leonard and Crailsheim, 1999). As with worker bees,
the most abundant amino acid was proline with the average content rising from the
first day to a maximum at seven days, and then continuously decreasing with age to
25-day-old drones. Essential free amino acids described by de Groot (1953) were at
their highest levels in one- and three-day-old drones, then decreasing to seven-day-old
drones but not changing significantly after seven days. A comparison of the free amino
acids in five-day-old drones and five-day-old worker bees showed significant
differences in the levels of all amino acids except tryptophane and tyrosine.
There have been a number of investigations on the characteristics and composition of
drone seminal fluid. Woyke and Jasinski (1978), investigating the effects of increasing
drone age on the number of sperm entering a queen bee`s spermatheca and the amount
of residual semen in the oviducts after instrumental insemination, found a difference in
semen composition with age. Semen from drones 10-14 days old was liquid, yellow-
cream in colour and easily taken into the tip of a syringe, whereas semen from drones
28 days and older was thick, cream-brown in colour and more difficult to take into a
syringe tip. They reported that as the age of the drone increased, generally, a lower
number of sperm entered the spermathecae of queen bees and the percentage of queen
bees with seminal residue in their oviducts increased from 0-14% of queens
inseminated with semen from drones 14 days old to 43-67% of queen bees
inseminated with semen from drones 28 days old.
An early investigation into the composition of drone semen involved separation of
seminal fluid from the sperm by centrifugation and determining the free and bound
amino acids present in each. Novak et al. (1960) identified 15 amino acids, at different
levels, in both the seminal fluid and sperm. Levels of arginine (39.2 mg/g), lysine
(12.6 mg/g), and leucine (12.5 mg/g) in sperm, and arginine (1.37 mg/g) and glutamic
acid (1.03 mg/g) in seminal fluid were high in comparison with other amino acids
present in the respective semen components.
The protein fraction of the secretions of the male accessory glands are the major
contributors towards seminal fluid and enhance sperm survival (den Boer et al., 2009).
King et al. (2011) showed (i) A. mellifera seminal fluid was highly potent in keeping
sperm alive over a 24 hour time span, comparable to the amount of time required for
31

the sperm to reach the spermatheca following copulation; (ii) the presence of proteins
within the seminal fluid and their structural integrity were crucial for this effect; and
(iii) by activating sperm using fructose, they providing evidence that the positive effect
of seminal fluid proteins on sperm survival cannot be replicated using generic protein
substitutes.
Baer et al. (2009) used mass spectroscopy to identify the 57 most abundant proteins
within the ejaculated seminal fluid of A. mellifera. The range of proteins in the seminal
fluid was similar to the secretion of the male accessory glands but different from those
found in either sperm or haemolymph. These seminal fluid proteins appear to represent
a complex mixture of functional classes (i) a range of proteins seem to be involved in
maintaining an optimal environment for sperm cell survival, (ii) a second set has
known or predicted antimicrobial or antioxidant properties, (iii) a third group has the
potential to influence female physiology or behaviour e.g. antennal protein precursor
3c is able to bind fatty acids in order to trigger a behavioural response.
Interestingly, the proteomic profile of accessory gland secretions and spermathecal
fluid secretion (in queen honey bees) hardly overlap (den Boer et al., 2009), suggesting
that male and female honey bees use different proteins to enhance sperm viability
during, respectively, ejaculation and final sperm storage. Baer et al. (2009) identified
over 100 proteins representing the major constituents of the spermathecal fluid of
queen honey bees which contribute to sperm in storage and that these proteins were
very similar to secretions of the spermathecal glands.
With regard to carbohydrate chemistry of the drone reproductive system, Blum et al.
(1962) found three sugars: fructose, glucose and trehalose, present in all the
anatomical areas of the reproductive system as well as in the ejaculated semen,
occurring almost exclusively in the seminal fluid. Several metal ions including iron,
magnesium, copper, calcium, manganese and sodium were also present in the
ejaculated semen. Studies on the oxidation of free sugars in seminal fluid (Blum et al.,
1962) indicated that honey bee sperm utilize intracellular compounds as an energy
source for their motility; this suggested that fatty acids may be the source of this
endogenous energy.
32
Fatty acids are also a key component of drone semen Blum et al. (1967), an initial
investigation to determine the fatty acid composition of semen showed phospholipids
constituted the major lipid fraction in honey bee semen and that these contained no
appreciable amounts of short-chain fatty acids, with C16:0 (23%) and C18:1 (56%)
accounting for 80% of the total fatty acids present. Fatty acids and sterols are
important for general honey bee development and nutrition, as well as reproduction
(Manning, 2001a). Manning (2001b) reported the main fatty acids present in
Australian Eucalyptus spp. pollens were C14:0; C16:0: C18:0; C18:1; C18:2; C18:3;
C20:0, with smaller amounts of C22:0 and that of these, linoleic acid (C18:2) was the
dominant fatty acid, comprising 44% of total fatty acids present.
The influence of seminal fluid and accessory reproductive gland (ARG) secretions on
sperm activity and performance, as well as their effects on mated females, has been
studied in insects. Gillott (1996) reported on the functions of male ARGs in insects,
broadly categorising available information into functions of structural, biochemical,
physiological and behavioural. Among the physiological roles was facilitation of
sperm transfer to the spermatheca. Gillott stated that for representatives of some insect
orders, e.g. Orthoptera, Diptera and Lepidoptera, male ARG material transferred
during mating significantly modifies the mated female`s behaviour. The transferred
molecules, usually proteins or peptides, serve to promote egg production or to render
the female unwilling to re-mate. Similar molecules also appear to play both roles in
some Diptera.
The ARG of male insects also produce secretions essential for the transfer of sperm to
the female (Gillott, 2002). In species where sperm are transferred in a liquid medium,
such as with honey bees, the seminal fluid is also a product of the ARG, although
components secreted by other regions of the male reproductive tract, e.g. the
ejaculatory duct, may be added. One reported role of the ARG is the acceleration of
egg production. The clearest demonstration of involvement of ARG products in
stimulating egg development is in Drosophila melanogaster, where oocytes gradually
develop during sexual maturation but, unless mating occurs, a large proportion of the
oocytes do not mature (Gillott, 2002). Sperm, itself, is also important in regulating
oocyte progression (Gillott, 2002).
33

During the early history of artificial insemination of queen honey bees, Mackensen
(1947) reported that queen bees anaesthesised with ether or with carbon dioxide to
quieten them during the insemination process matured, that is, commenced egg laying
at a significantly earlier age than queens not treated. Carbon dioxide was found to have
queen survival benefits compared with ether and became the preferred method for
artificially maturing queen bees. How carbon dioxide produces its effect is not known
but may provide comparable physiological effects on the queen resulting from mating
flights. Following on from these initial studies, Niño et al. (2011) examined the effects
of carbon dioxide and physical manipulation (procedures used during instrumental
insemination of queen bees which they considered may mimic certain aspects of
copulation) on the behavioural, physiological and brain transcriptional changes in
honey bee queens. They found that while carbon dioxide contributes to the cessation
of mating flights and to ovary activation, physical manipulation of the queens had the
additional effects on ovary activation and brain transcriptional changes. The
complexity of factors involved in the transition between an unmated queen and an egg
laying mated queen have been further demonstrated by Kocher et al. (2008) who have
suggested that stretch receptors (in the spermatheca) that detect insemination volume
may mediate this behavioural response. Collins et al. (2006) did not find proteins
similar to those in D. melanogaster that influenced subsequent mating behaviour of
the queen.
In a study of social bees Colonello et al. (2005) found that honey bees A. mellifera
show considerable species-specific variation in their mating signs, with the mucus
gland providing the mass of the mating sign with these glands undergoing a
hormonally controlled sexual maturation in its program of protein synthesis. In
conclusion, Colonello et al. (2005) stated that an understanding of the functional
significance of the mating plug is needed and questioned its effects on how much
sperm is transferred and the post-mating reaction of females.
Ram and Wolfner (2007) provided an overview of the D. melanogaster male
accessory gland proteins (Acps), with the results from several studies bringing the
current number of known D. melanogaster Acps to 112. They reported that molecular
interplay between Acps and the female (i) enhances her egg production, (ii) reduces
her receptivity to remating, (iii) alters her immune response and feeding behaviour,
34
(iv) facilitates storage and utilisation of sperm in the female, and (v) affects her
longevity.
Rice (1996), also experimenting with D. melanogaster, found indirect evidence
indicating that seminal fluid reduced the competitive ability of sperm from another
male, reduced a female`s propensity to re-mate, and increased her oviposition rate.
Holman (2009), however, examined the effects of D. melanogaster seminal fluid on
the survival of sperm from the same male as well as sperm from a rival male, and his
results suggested that seminal fluid improved sperm survival even when the sperm was
from a different male. Tram and Wolfner (1998) examined post-mating changes in
female D. melanogaster triggered by seminal fluid proteins from the male`s accessory
gland proteins and by sperm. Their results demonstrated that copulation alone, without
male accessory gland fluids or sperm, was sufficient to produce a short-term decrease
in attractiveness of mated females, but the maintenance of this decreased attractiveness
requiring the presence of sperm.
Chemicals present in the mating plug transferred by male bumblebees, Bombus
terrestris, into the queen bee`s sexual tract shortly after sperm transfer were identified
by Baer et al. (2000), with the main compounds being four fatty acids: palmitic,
linoleic, oleic and stearic acids; and a cyclic peptide, cyclopropylproline. Further
investigations by Baer et al. (2001) found linoleic acid was the only substance in the
mating plug that decreased female re-mating behaviour, even when they did not
receive sperm. No effects were detected from the remaining three fatty acids or the
peptide.
35

1.2 Research objectives
Overall Aim
As described in the Introduction, this project arose as a result of an earlier pilot study
carried out to investigate the introduction and early performance success of
commercially reared queen bees, following beekeeper reports of high failure rates of
commercially reared queen bees introduced into eastern Australian colonies at
requeening.
Thus, the overall aim of the work was to identify likely causes which result in the
failure of young, commercially reared queen honey bees to survive introduction into
established bee hives (colonies), or if accepted, failure to survive as a productive egg-
laying queen for an extended period of time. The key output was to provide
information for improved management of queen bee production to reduce queen
losses.
Specific aims
The specific aims were:
1. To identify reasons for early failure of commercially reared queen bees by
examining:
• effects of queen age on introduction
• queen quality, and factors influencing queen quality, including
o queen transport
o number of sperm in the queen`s spermatheca
o physical characteristics and health status
o position of queen cell during larval feeding stage
o head gland chemicals of queens at different ages
2. To examine quality of drone honey bees based on:
• volume of semen produced per drone
36

• number of sperm produced per drone
• release of semen at the endophallus after manual eversion
• sperm viability
• sperm motility
• changes in composition of amino and fatty acids in semen
3. To investigate factors influencing drone semen quality
• breeding line
• drone age
• season
• role of genetics in semen quality
Based on the literature review, of particular interest in this thesis, was investigating the
accuracy of comparing results with respect to the number of sperm produced per A.
mellifera drone when the semen/sperm sample has been obtained from (i) manual
eversion of the drone, (ii) from dissection of two seminal vesicles, or (iii) dissection of
one seminal vesicle. When I commenced my studies, there was a plethora of published
data on this topic, but limited ability to comparing between different reports.
1.3 Thesis structure
A literature review covering background information related to the Australian
beekeeping industry and published research relating to the current investigations is
presented in Chapter 1.1 (above). Parts of the review of literature may be included in
the relevant chapters, but with the aim to minimise this as much as possible.
Chapter 2 describes investigations related to factors influencing introduction success,
early performance success and satisfactory performance success, including queen
age, number of sperm present in the spermathecae, physical characteristics, queen
head gland chemicals, disease status of queens and associated disease status of honey
production hives, and queen transport to commercial hives.
37
Chapter 3 describes general materials and methods used for the drone studies,
including determination of minimum sample sizes, methodology for rearing and
sampling drones, and assessment of drone quality parameters.
Chapter 4 describes investigations relating to drone semen volume and sperm number,
viability, and motility. It also examines effects of breeding line (genetics), drone age
and season on these parameters.
Chapter 5 describes investigations into amino acids and fatty acid composition in
drone semen (combined sperm and seminal fluid). This was to determine if semen
composition (and, thus, drone quality) may be impacted by these factors.
Chapter 6 concludes the outcomes for the previous experimental chapters, and
discusses their implications and applications.
38
CHAPTER 2
Queen bee introduction and early performance success
2.1 Introduction
Failed queen bee introductions into commercial honey production hives and hives
used for pollination are expected to result in significant economic losses for
beekeepers when costs of replacement queens, extra labour, travel and transport costs
involved in the re-queening process, and loss of production from the affected hives,
are considered.
During the Australian 1996-97 beekeeping season, low queen acceptance levels after
introduction into hives, and poor early performance by queens which were accepted at
introduction, were reported from beekeepers that had purchased queen bees from a
number of commercial queen honey bee suppliers in eastern Australia. This resulted in
the Australian Queen Bee Breeders’ Association resolving at their 1997 Annual
General Meeting to develop a research project to determine whether a definable
problem existed and, if so, to determine critical areas of queen bee production
requiring research.
The Australian Honey Bee Research and Development Committee provided funding
for a pilot research project to be carried out during spring and autumn of 1997-98. This
research (Rhodes, 1998) investigated the introduction and early performance success
of commercially reared A. mellifera queens introduced into commercial honey
production apiaries. Test queens were reared by commercial queen bee breeders and
“control” queens were queens from a honey producer`s apiary, caged and introduced
into a different colony. In addition, queens from the honey producer`s apiary were
caged and re-introduced into the colony from which they originated.
Introduction success was assessed as the ability of a marked, caged queen introduced
into a different colony to survive 14 days after introduction. The spring trial resulted in
39
a loss of 9.8 % of test queens and 6.9 % control queens while the autumn trial resulted
in the loss of 10.7 % test and 6.9 % control queens. Queen bees caught, caged, and
immediately re-introduced into their own colony resulted in 100 % of the queens
surviving for 14 days after introduction for both the spring and autumn trials. Early
performance success was based on the ability of a queen to be present and heading a
commercially viable colony fifteen weeks after introduction. For queens reared in
spring 1997, a significant loss of 30.3 % for test queens occurred compared to a loss of
16.8 % for control queens.
This project identified two factors to be sufficiently important to warrant further
investigation- the age of the queen bee which provided the highest success when
introduced into an established hive, and the identification of causes for the wide range
of sperm counts recorded from the spermathecae of same-aged sister queens reared
under the same conditions and mated in the same mating apiary and at the same time.
The importance of these two factors lead to the investigations reported in this chapter,
in which detailed field data was obtained on queen bee survival; the field data was
interpreted using data obtained from laboratory examinations of sister queens; and by
identifying stress situations to which queen bees may have been subjected during
transport. Three experiments on queen bee introduction and early performance success
were conducted over three years, between November 1999 and April 2002.
2.2 Objectives
The three experiments contained a number of similar objectives incorporated into Year
1 (1999-2000), Year 2 (2000-2001) and Year 3 (2001-2002). Some objectives were
pursued in all three years, whereas others were only pursued in one or two years.
Those not conducted over the three years, and the years in which they were conducted,
are noted below.
These objectives were:
1. Investigating the effect of queen age on introduction success, early performance
success and satisfactory performance success.
40

2. Assessing the number of spermatozoa present in the spermatheca of each queen
3. Determining the range and amounts of mandibular and head gland chemicals
present in queen bees 7 to 35 days of age. (Year 1 only)
4. Assessing queen quality in terms of their physical characteristics.
5. Investigating the effects of queen transport between their rearing apiaries and
honey production apiaries on their subsequent introduction survival rates.
6. Determining the effects of position of the queen cell cup on the cell bar during the
larval feeding stage and queen development on subsequent queen survival. (Year 2
only)
7. Assessing the effects of freezing whole queen bees at -20ºC on physical damage to
sperm in the queen`s spermatheca. (Year 2 only)
8. Determining the number of sperm produced by mature age drones from drone
mother colonies providing drones at the time of mating of test queens. (Year 2 only)
9. Comparing the number of sperm present in the spermathecae of same aged sister
queen bees mated in (i) a commercial queen bee breeder`s mating apiary, and (ii) a
commercial honey producer`s queen bee mating apiary. (Year 2 only)
10. Comparing sperm counts present in queen bees examined at 7 and 14 days of age
with sperm counts of their sister queens introduced into commercial honey
production hives at 7 and 14 days of age and caught from those hives 15 weeks after
introduction. (Year 2 only)
11. Developing a short-term storage method for whole adult drone bodies which
would allow sperm counts to be made using manual ejaculation as the sample
collection method. (Year 2 only)
41

2.3 Materials and methods
2.3.1 Year 1 (1999-2000) Investigations
In this year, Objectives 1, 2, 3, 4, and 5 were investigated.
An experienced commercial queen bee breeder based in south-east Queensland
produced 300 queen bees which were grafted on the same day and mated in the same
queen mating apiary at the same time. Two sister A. m. ligustica type breeder queen
bees provided sufficient larvae for grafting.
Mating nuclei were ten-frame, full-depth Langstroth brood chambers divided into
three by three frame nuclei. Based on available information (Rhodes 1999 a, b), the
mating apiary was encircled by three drone mother apiaries placed 2.3, 1.5 and 1.0 km,
respectively, from the mating apiary. Each apiary containing 20 hives managed to
provide mature age drones when the test queens were expected to be mating,
commencing at about six days of age.
Objective 1. Investigating the effect of queen age on introduction success, early performance success and satisfactory performance success.
Seven days after their expected date of emergence, 60 queen bees were caught from
the mating apiary, marked on the thorax with a Posca® water-based marking pen, and
placed in standard wood mailing cages for dispatch. At 14 days after emergence when
mating was expected to be completed, all remaining queen bees in the mating apiary
were marked on the thorax and one fore-wing clipped, to ensure later identification.
Sixty queen bees were caught and caged from the mating apiary each week when the
queens were estimated to be 7, 14, 21, 28 and 35 days of age. Each week, 20 queen
bees were mailed to a commercial honey producer based in Queanbeyan
(149.2312511, -35.3549182) New South Wales (Apiary A), 20 to a commercial honey
producer based in Tamworth (150.9303741, -31.091085) New South Wales (Apiary
B), and 20 to the CSIRO Division of Entomology Laboratory, Canberra.
42

Queen bees were introduced into established commercial honey production colonies
using the standard management practice of each beekeeper when receiving and
introducing queen bees. In apiary A, queens were introduced in the wood mailing cage
they arrived in with the (six) escort bees present. In apiary B, queens were introduced
in Miller introduction cages (Miller, 1911), the cage design and method of
introduction without escort bees are described in a book published by the A.I. Root
Company, Medina, Ohio. Both apiaries comprised more than 100 hives and, in the
opinion of the apiary owners, required requeening as part of their standard
management process.
Introduction success rates were measured by the number of introduced queen bees
present 14 days after introduction into established, commercial, honey production
hives. All hives containing marked test queens were inspected 14 days after
introduction and the presence or absence of the marked queen recorded.
Early performance success rates were measured by the number of queen bees present
in hives 15 weeks after introduction. All hives containing a marked test queen 14 days
after introduction were inspected a second time, 15 weeks after introduction, and the
presence or absence of the marked queen recorded. At the second inspection, each
queen was recorded as Satisfactory, or Not Satisfactory, based on the performance of
the colony headed by each queen, and based on the field conditions under which the
apiary was being inspected.
The third group of 20 queen bees sampled each week was mailed to the CSIRO
Division of Entomology, Canberra, for laboratory examination. Queen bees were
coded individually for identification, narcotised with carbon dioxide, the head
removed and placed into 200 µL of dichloromethane for analysis of chemicals present
in the head glands (Lacey, 1999). The remaining part of the body of each queen was
stored at -20°C until required for determination of ovariole and sperm numbers and
levels of nosema disease (Anderson, 1999).
43

Objective 2. Number of sperm present in spermathecae of queens
Sister queen bees corresponding to each of the ages queen bees were caught for field
trials for Years 1, 2 and 3, were examined at the CSIRO Division of Entomology
Laboratory, Canberra, and the number of sperm present in each queen`s spermatheca
recorded. The spermatheca was removed from the queen, placed in 100 µL of
phosphate buffered saline in a small Eppendorf tube, mashed, and then diluted 1:80 or
1:160 in distilled water. The sperm were then counted using a haemocytometer at 160
magnifications with the aid of a light microscope (Anderson, 1999).
Objective 3. Chemicals present in queen head glands.
The effects of queen age on the number and amounts of mandibular and head gland
chemicals present in queen bees caught at 7, 14, 21, 28 and 35 days of age were
determined for the 1999-2000 experiment only. Heads from the 20 queen bees from
each of the five age groups were examined individually. Each dissected head was
placed into dichloromethane (0.2 mL) in a screw-capped vial (Alltech, 12x32 mm).
Pentadecanoic acid was added as the internal standard. Each head was extracted with
agitation for 1.5 hours at room temperature (22°C); the head was then removed from
the solvent and amalgamated for a second extraction in fresh dichloromethane (1mL,
1.5 hour). The second extract was used for validating the identity of known
components by gas chromatography/mass spectrometry and for elucidating the
molecular structures of unknown components.
Each of the individual first extracts in dichloromethane was gently evaporated in an
updraught of nitrogen in subdued light to ca. 25 µL, a strategy that diminishes
potential losses of small quantities of the more volatile solutes (Harris et al., 1987).
The final stages of evaporation were carried within a glass insert (Alltech, 100 µL).
To make the head gland extracts from A. mellifera more amenable to analyse by gas
chromatography, the hydroxyl and carboxyl groups of the chemical components are
generally derivatised at room temperature. However, silylation of alcohol functional
groups with BSTFA (Slessor et al., 1990) is slow at room temperature and may be
incomplete before analysis. Conversely, the conditions for esterification with
44

diazomethane (Engels et al., 1997) may also allow partial methylation of the phenolic
groups. To avoid the complication of multiple derivatives for the present analyses, a
trace of pyridine was added to catalyse the persilylations. To the concentrated
individual head chemical extract containing the internal standard was added BSTFA
(Aldrich, 10 µL) and dry pyridine (2 µL) and the solution was left for 15 minutes at
room temperature after vortex mixing before storage at -20°C for analysis.
Glycerides were also found in the solvent extracts and the fatty acid moieties of the
glycerides in an extract were determined by transesterification. After completion of the
head chemicals analysis, the silyated extract was evaporated to dryness and dissolved
in methanol (50 µL) containing sulphuric acid (2%). The solution was heated to 99ºC
for one hour and the resulting methyl esters (including methyl pentadecanoate)
extracted with hexane (50 µL) and washed with water (20 µL) before gas
chromatographic analysis.
Gas chromatography was carried out using a Varian model 3300 with a cool on-
column injector, a flame-ionisation detector and a computer with data acquisition,
plotting and analysis (DAPA) software. The column was a bonded phase methyl
silicone (Econocap, SE-30), 30 m x 0.32 mm ID with a phase thickness of 0.25 µm
and a helium carrier gas flow rate of 2 mL min -1. The column was preceded by a
retention gap (fore-column) of deactivated silica (2 m).
At the beginning of a series of analyses, the retention gap was back-flushed
successively with methanol and dichloromethane in order to remove accumulated
glycerides and other volatiles and to preserve the chromatographic high-resolution of
the column. The temperature program used was 40°C for two minutes followed by a
temperature gradient of 20°C min -1 to 150°C; a temperature gradient of 5°C min -1 to
215°C; and finally a temperature gradient of 25°C min -1 to 300°C isothermally for ten
minutes, sufficient to elute the remaining volatile components (Lacey, 1999).
Objective 4. Physical characteristics and disease status of queens and disease status
of honey production hives.
45

These were assessed by measuring (i) the number of ovarioles in test queens, (ii)
nosema disease levels in test queens, and (iii) brood disease status of honey production
hives.
Number of ovarioles.
The number of ovarioles was counted from queen bees from each age group of queens
caught. The number of ovarioles present in both the left and right ovaries were
separately counted in the Year 1 experiment, but the number present in the left ovary
were only counted for the two subsequent years’ experiments, as there was no
significant difference between numbers in left or right ovaries in Year 1. Queen bees
were examined individually; each queen was removed from its -20°C storage, thawed,
and its ovaries dissected in distilled water. The number of ovarioles in the right and
left ovary were then counted with the aid of a dissecting microscope. To assist in
distinguishing and counting the ovarioles, each ovary was first placed for 30 seconds
in electrophoresis gel stain (0.1% Coomassie brilliant blue R250 in 45% methanol plus
10% acetic acid), then placed in 35% ethanol and examined. This procedure stained
the linings of each ovariole blue, but left the eggs inside white. To count the ovarioles,
a transverse section was cut from the middle of each ovary and placed in a small watch
glass containing 35% ethanol. The number of ovarioles was then counted by teasing
the ovarioles apart and moving each ovariole to the side of the watch glass as it was
counted (Anderson, 1999).
Nosema disease levels.
All queen bees forwarded to the Division of Entomology, Canberra, were examined
for the presence of Nosema spp. spores. Test queen bees were caught from their
mating nucleus or from the queen bank at each of the ages queens were caught for
each of the three years’ experiments. The mid- and hind-gut of each queen were
removed at the same time the ovaries and spermatheca were removed. The gut
material was placed in 0.5 mL distilled water and examined for Nosema spp. spores at
400 X magnification with the aid of a light microscope. The number of spores present
was counted using a haemocytometer (Anderson, 1999).
Brood disease status of honey production hives.
46

Hives used for field evaluation in Year 1 were selected on the basis of being free from
brood diseases or containing less than five infected brood stages, by visual inspection.
Brood diseases accepted were chalk brood, Ascosphaera apis; European foulbrood,
Melissococcus pluton, and sacbrood (virus)
Objective 5. Transport effects on queen survival.
Factors relating to the transport of queen bees which were able to be recorded, and
which would be expected to express their effects in terms of damage to the queens as a
result of the transport process between the queen bee breeder and the honey producer
purchasing the queens were the amount of time in transit and exposure to a range of
temperatures and humidities. Major damage was measured by the number of dead
queen and escort bees in cages on arrival at their destination, and minor damage by the
number of queen bees arriving alive but the queen not surviving 14 days after
introduction into an established honey production hive.
The 60 queen bees caught each week were caged individually with about six young
worker bees as escort bees, in wooden mailing cages measuring 8 x 3 x 2 cm with
either a wire gauze or punched plastic cover. Groups of 20 cages were selected at
random, taped together, and placed into plastic Australia Post Express Post envelopes,
35 x 20 cm, in which 58-60 air holes 14 mm in diameter were made around three sides
of the envelope.
The packages mailed to each of the two honey producers contained a Tinytag Ultra
datalogger (Hastings Dataloggers, Port Macquarie, NSW) which recorded temperature
and humidity within the envelope at ten minute intervals between the period when the
envelope was sealed by the queen bee breeder and when it was opened by the honey
producer.
2.3.2 Year 2 (2000-1) Investigations
In this year, Objectives 1, 2, 4, 5, 6, 7, 8, 9 and 11 were investigated.
47

The same Queensland based commercial queen bee breeder supplying queen bees to
the Year 1 experiment also supplied test queen bees for the Year 2 experiment. The
queen breeder supplied fifty mature queen cells, and 370 queen bees grafted from the
same A. m. ligustica type breeder queen mother on the same day, reared in the same
cell raising apiary, and mated in the same mating apiary at the same time. Based on
available data, sufficient drone mother colonies were provided around the mating
apiary as occurred for Year 1. The same New South Wales based commercial honey
producers providing Apiaries A and B to the Year 1 experiment also provided their
apiaries for the Year 2 experiment.
Field experiments were carried out as for Year 1, with some modifications:
(i) Queens were marked with five colours corresponding to their position on the cell
bar, to provide data for Objective 6.
(ii) Sixty, seven-day-old queens were caught, marked, and 20 queens sent each to
Beekeeper A, Beekeeper B and to the CSIRO Division of Entomology (queen head
chemical experiments were not repeated in Year 2).
(iii) The remaining 310 test queen bees were caught when they were 14 days old and
marked. Sixty queens had both wings clipped (clipped queens) to prevent them from
flying and continuing mating (Objective 2). Sixty unclipped queens were caught,
caged, and dispatched as for seven-day-old queens. The remaining 250 queen bees
were returned to their mating nucleus.
(iv) Ninety queens were caught at 21 days of age. Twenty unclipped queens were
sent to Apiary A and 20 to Apiary B. Twenty clipped and 20 unclipped queens were
sent to the CSIRO Division of Entomology. A further 10 unclipped queens were sent
to the CSIRO Division of Entomology for sperm fragmentation experiments
(Objective 7).
(v) Eighty queens were caught at 28 days of age and caged. Twenty unclipped
queens were sent to Apiary A and 20 to Apiary B. Twenty clipped and 20 unclipped
queens were sent to the CSIRO Division of Entomology.
48
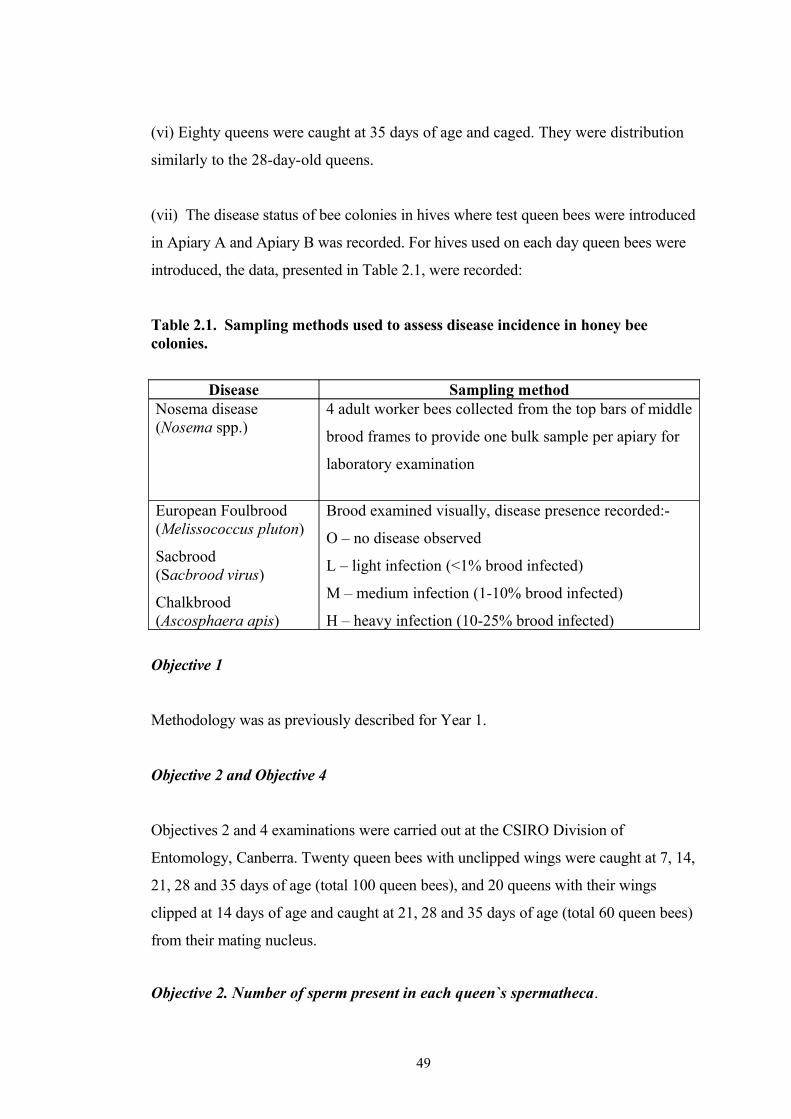
(vi) Eighty queens were caught at 35 days of age and caged. They were distribution
similarly to the 28-day-old queens.
(vii) The disease status of bee colonies in hives where test queen bees were introduced
in Apiary A and Apiary B was recorded. For hives used on each day queen bees were
introduced, the data, presented in Table 2.1, were recorded:
Table 2.1. Sampling methods used to assess disease incidence in honey bee colonies.
Disease Sampling methodNosema disease(Nosema spp.)
4 adult worker bees collected from the top bars of middle
brood frames to provide one bulk sample per apiary for
laboratory examination
European Foulbrood(Melissococcus pluton)
Sacbrood(Sacbrood virus)
Chalkbrood(Ascosphaera apis)
Brood examined visually, disease presence recorded:-
O – no disease observed
L – light infection (<1% brood infected)
M – medium infection (1-10% brood infected)
H – heavy infection (10-25% brood infected)
Objective 1
Methodology was as previously described for Year 1.
Objective 2 and Objective 4
Objectives 2 and 4 examinations were carried out at the CSIRO Division of
Entomology, Canberra. Twenty queen bees with unclipped wings were caught at 7, 14,
21, 28 and 35 days of age (total 100 queen bees), and 20 queens with their wings
clipped at 14 days of age and caught at 21, 28 and 35 days of age (total 60 queen bees)
from their mating nucleus.
Objective 2. Number of sperm present in each queen`s spermatheca.
49

This measurement was recorded to identify relationships between sperm numbers in
the queen`s spermatheca and (i) the increasing age of the queen; (ii) the inability of
the queen to fly and continue mating after 14 days of age.
Objective 4. Assessing queen quality in terms of their physical characteristics.
Spermatheca diameter
The spermatheca was removed and measured with a gradicule using a WILD M3C
dissecting microscope at 40 X magnification. Data were converted to mm using the
conversion factor: 1 eyepiece unit @ 40 X magnification = 0.23809 mm.
Measurement was carried out on the horizontal plane (Medveczky, 2001, pers.com.).
Sperm presence in queens’ oviducts
To determine the presence or absence of sperm in each queen`s oviduct, the oviduct
was dissected out, homogenised in 100 µL water and then another 100 µL water was
added. The sample was then examined on a haemocytometer for the presence of
sperm, using phase contrast microscopy. When sperm were present, sperm numbers
were counted, in an average of 10 fields, at 160 X magnification (Medveczky, 2001,
pers.com.).
Number of ovarioles in one ovary
The methodology was the same as previously described for Year 1.
Queen body weight
Individual queen bees were immobilised with CO 2, placed in a small container of
known weight and weighed on an AND HR-200 electronic analytical scale
(Medveczky, 2001, pers. com.).
Nosema disease status
The methodology to determine the nosema disease status of each queen bee was the
same as described for Year 1.
Objective 5. Transport effects on queen survival.
50

The methodology was the same as described for Year 1.
Objective 6. The effect on queen survival of the position of the queen cell cup on
the cell bar during the larval feeding stage and queen development.
Field observations of larvae reared in queen cell cups positioned at the ends of cell
bars during the larval rearing stage may result in those larvae either not surviving, or
if surviving, then the mature queen cell formed may be smaller in size than mature
cells positioned closer to the centre of the cell bar. Larvae in cell cups further away
from the middle of the cell bar may be subjected to increasing stresses resulting from
reduced temperature and humidity control, and reduced amounts of food fed to the
larvae. Such observations are noticeable in cell rearing (cell-feeding) colonies with
insufficient numbers of suitably-aged nurse bees to feed and support the developing
queens. The position of the queen cell cup on the cell bar in cell rearing colonies
during development, which includes the critical larval feeding period, was examined
for its effects on queen quality by measurement of:
(i) Queen bee survival following introduction into established honey production
hives(ii) The number of sperm in the queen`s spermatheca after mating(iii) Queen spermatheca diameter(iv) Queen body weight(v) The number of ovarioles in the left ovary
At grafting, plastic queen cell cups of five colours were used. The day following
grafting, cell cups containing an accepted larva were arranged with two cell cups of
the same colour together, in the following order from one end of the cell bar- red,
green, dark grey, maroon, light grey, light grey, maroon, dark grey, green, and red-
to provide 20 cell cups on each bar.
After cell feeding and maturation, ten days after grafting, cell cups were placed
randomly, by colour, in mating nuclei in the mating apiary. When queens were
caught and marked, the marking colour used on each queen corresponded to the
51

colour of the cell cup from which the queen had emerged. The colour code remained
with each queen for those placed in field trials and for those examined in the
laboratory. Queen bee survival data were collected for the number of queen bees
surviving 15 weeks after introduction according to the position of the cell cup on the
cell bar which produced each queen.
Objective 7. Fragmentation of frozen spermatozoa.
An experiment was conducted to establish whether storage of whole queen bodies by
freezing resulted in fragmentation of sperm present in the spermatheca of frozen
queen bees. Four sister queen bees were examined. On arrival at the laboratory (in
live condition), the spermatheca was removed from one queen and the number of
sperm in a defined area examined in the fresh state. The number of whole and
damaged sperm was recorded. The remaining three queen bees were stored by
freezing at -20°C. Similar counts of whole and damaged sperm were carried out on
one frozen queen bee at intervals of 1, 2 and 3 months after being frozen (Anderson,
2000 pers. com.).
Objective 8. Initial data on sperm numbers present in mature age drones caught at
the estimated peak seasonal conditions in south-east Queensland.
Drone mother colonies placed at a commercial queen bee breeder`s mating apiary at
Aratula, south-east Queensland (-27.98; 152.55) were examined 20 days before the
test queen bees were expected to commence mating (at about six-seven days of age),
and newly emerged drones were marked on the thorax with a Posca® marking pen
and released back into their hive.
One hundred and twenty marked drones were caught at the mating apiary at 20 days
of age and transported by car from Aratula where they were reared to a laboratory in
Richmond, New South Wales. One hundred randomly selected drones were
examined by Ms G. Wheen over the following four days, to determine the number of
sperm per drone. Methodology for sperm number determination was the same as
methodology described in Chapter 3 for this procedure with the exception that the
average number of sperm per drone was determined from counting sperm numbers
52

in five squares, each square containing 16 smaller squares, at one end of a
haemocytometer.
Objective 9. Comparison of sperm counts from sister queen bees mated at different
mating apiaries.
An experiment was carried out to compare sperm counts from the spermathecae of
sister queen bees mated in a commercial queen bee breeder`s mating apiary at
Aratula, Queensland (see details in Objective 8) and those mated in the queen mating
apiary of a commercial honey producer (Honey Producer B) based at Tamworth,
New South Wales (-31.09 °S 150.85 °), the same beekeepers supplying test queens
and a field test apiary for Year 1. The purpose of the experiment was to establish
whether improved sperm counts would result from the smaller number of queen bees
being mated in the commercial honey producer`s queen mating apiary than in a
commercial queen bee breeder`s mating apiary.
Fifty extra queen cells produced by the commercial queen bee breeder supplying
mated queen bees to this project were packaged in warm sawdust in a small
polystryrene box and transported by overnight bus service from Aratula in
Queensland to the owner of Apiary B in Tamworth in New South Wales, a distance
of approximately 550 km. These queen cells were then distributed in mating nuclei
in a mating apiary established by Honey Producer B at Tamworth, on the same day
the Queensland-based commercial queen bee breeder distributed the sister queen
cells in his queen mating apiary.
Queen bees from Apiary B owner`s mating apiary were caught and caged at 21 days
of age and mailed to the CSIRO Division of Entomology, Canberra, for
determination of the number of sperm present in the spermatheca of each queen.
Sperm count data from the sister queens from both locations queens were then
compared.
Objective 10. Comparison of sperm counts from the spermathecae of sister queen
bees examined at different ages.
53

An experiment was carried out to compare sperm counts of queen bees caught from
mating nuclei at seven and 14 days of age with sperm counts from sister queens
introduced into established honey production hives at seven and 14 days old, and
then re-caught from the hives 15 weeks after their introduction and examined for the
number of sperm present in their spermathecae. The purpose of this experiment was
to provide initial data on the hypothesis that queen bees caught from mating nuclei at
14 days or less, if they have not completed their mating procedure, may continue to
fly and mate from the honey production hive after introduction.
For Apiary B, all of the queen bees which had been introduced into honey
production hives at seven and 14 days of age and which were present in their hive at
the inspection 15 weeks after introduction were caught. Sperm counts were carried
out at the CSIRO Division of Entomology, Canberra. Sperm counts from the two
groups of similar introduction age sister queens were then compared
Objective 11. Adult drone storage.
A comparison between the effectiveness of two storage methods for large numbers
of adult drones for several days before examining them for the number of sperm
produced was undertaken.
Whole, mature adult drones were caught and stored either:
(i) In the insect preservative 4% glutaraldehyde (equal volumes of 8%
glutaraldehyde and phosphate buffer, pH 7.2)
or
(ii) By freezing at - 4ºC.
Seven days after treatment, attempts were made to evert drones, collect semen, and
carry out sperm counts.
2.3.3 Year 3 (2001-2) Investigations
In this year, Objectives 1, 2, 4 and 5 were investigated.
54
The Year 3 experiments conducted field and laboratory comparisons between queen
bees which had been maintained either in a mating nucleus hive or in a queen bank
hive to age them prior to their introduction into established honey production hives.
Commercial beekeepers providing queen bees and apiaries, and the CSIRO Division
of Entomology Laboratory, Canberra, which carried out examinations for the Years
1 and 2 experiments, provided similar services for the Year 3 experiments. The
commercial queen bee breeder provided 300 queen bees which had been grafted on
the same day from the same A. m. ligustica-type breeder queen, reared in the same
cell rearing apiary, and mated in the same mating apiary at the same time. Based on
available information, sufficient drone mother colonies were established to provide
drones for the mating apiary.
Objective 1. Early Performance Success, Satisfactory Performance Success,
nosema disease sampling, and queen management.
Methodologies were modified from the previous years, for the Year 3 experiment, as
follows:
Queen marking and distribution
(i)
At 17 days of age:
(a) all queen bees were marked on the thorax with a coloured Posca® pen. Two
colours were used, (i) 180 queen bees marked colour A, to be supplied directly to
the project from their mating nucleus; and (ii), 120 queen bees marked colour B
and placed in a queen bank (at 17 days of age) and supplied to the experiment
from the queen bank.
A queen bank is a means for storing numbers of queen bees over a short or
extended period of time; generally, newly mated queen bees are caged individually
without escort bees in a small cage with the cages held in a modified hive frame;
55

the frame of caged queens may be held above a queen excluder in a queen-right
hive or in the brood chamber of a queen-less hive with young worker bees feeding
and supporting the caged queen bees; a maximum of 21 days is recommended for
storing in this manner, but this time may be increased.
(b) sixty queen bees marked colour A were caught from their mating nucleus with
20 queens dispatched each to Apiary A, Apiary B, and the CSIRO Division of
Entomology, Canberra.
(ii)
At 24 days of age, twenty queen bees caught from their mating nucleus (colour A),
and 20 queens removed from the queen bank (colour B) were dispatched each to
Apiary A, Apiary B, and the CSIRO Division of Entomology (total 120 queen
bees).
(iii)
At 31 days of age, 120 queen bees were dispatched as for 24-day-old queen bees.
Queen bank management followed the recommendations of Kleinschmidt (undated).
Field evaluation
(i)
To determine queen survival success, queen bees dispatched to Apiaries A
and B were subjected to inspections for:
• the number of queens surviving 14 days after introduction
(Introduction Success Rate)
• the number of queens surviving 15 weeks after
introduction (Early Performance Success Rate)
• field evaluation of queen performance, carried out at
the 15th week inspection (Satisfactory Performance Success).
56
(ii)
To determine level of nosema disease in the introductory (production) hives,
on each of the three queen introduction dates at each apiary, a bulk sample of
worker bees was collected from the top bars of the middle frames of the
brood chamber of those hives which had queen bees introduced into them on
that date.
(iii)
To determine level of brood diseases, on the date of introduction of each age group
of queen bees, hives in Apiary A and in Apiary B were examined for the presence
of the brood diseases EFB, Sacbrood and Chalkbrood. Hives displaying zero, or
low incidence (< 10 cells/colony) of one of the brood diseases were selected for
use in the experiment.
Objective 2. Number of sperm present in each queen`s spermatheca.
Examination was carried out at the CSIRO Division of Entomology, using the
methodology used for Year 1 experiments.
Objective 4. Queen physical characteristics measured to determine queen quality.
Queen bees were examined at the CSIRO Division of Entomology, using the same
methodology used for Year 2, for:
(i) Number of ovarioles in the left ovary(ii) Diameter of the spermatheca(iii) Presence or absence of sperm in the oviducts(iv) Queen body weight(v) Nosema disease levels
Objective 5. Examination of effects of transport on queen survival.
The methodology was the same as for Year 1.
2.4 Statistical Analyses
57

2.4.1 Introduction Success Rate and Early Performance Success Rate.
The data on Introduction Success (ISS), Early Performance Success (ESS) and
Satisfactory Performance Success (Tables 2.2, 2.3, 2.4 and Figure 2.1) are the
proportion of queen bees of varying age surviving to 14 days and 15 weeks after
introduction, and are binomial in nature. These binomial data were analysed as a
generalised linear model using the glm() function in the statistical software package S-
Plus (Mathsoft, 1999) using the logistic function log(p/(1-p) which ensures predicted
proportions remain in the 0 to 1 interval, together with a binomial variance function
p(1-p) and using the number of queen bees (n) tested as weights. A logistic regression
of the proportion of queen bees surviving (ISS and ESS) with Age at introduction
(AGE) as the only independent variable gave a poor fit. The fit was greatly improved
with the addition of the term AGE^2 to accommodate curvature in the regression and
the terms APIARY and YEAR were included in the model to account for differences
due to apiary and year. The significance of a term in the model can be tested using the
deviance statistic D = 2(LL1 – LL2) (McCullagh and Nelder, 1989), where LL1 is the
log-likelihood of the model containing the term and LL2 is the log-likelihood of the
model with the term excluded. The deviance statistic has an approximate χ2df
distribution, where df is the difference in the number of parameters fitted, and terms
are significant for df = 1 at the 5% level if D > 3.84. The significant terms together
with their deviance statistics for ISS and ESS were AGE (128.6, 87.9), AGE^2 (9.6,
9.4) and YEAR (12.9, 44.6). The deviance statistics for APIARY and the interaction
terms of AGE and AGE^2 with YEAR and APIARY were small and these terms were
not significant. The terms for the final model were YEAR + AGE + AGE^2.
Differences between means were determined using LSD on the transformed data, and
the predictions were also made on the transformed data. The predictions presented in
Tables 2.2, 2.3 and 2.4 are retransformed values.
58
2.4.2 Sperm counts and number of ovarioles
For years 1999-2000 and 2000-1, data on sperm counts and number of ovarioles were
analysed by ANOVA, with Age as an explanatory factor. In 2001-2, when queens
originated either from a mating nucleus or a mating bank, the combination of Age with
Origin was the explanatory factor.
2.4.3 Amounts of mandibular and head gland chemicals
Plots of head chemical constituent proportions (each chemical constituent was
expressed as a percentage of the total weight (µg) of chemicals from each queen)
versus queen age were produced and the most common non-parametric regression –
loess (locally weighted scatter plot smoothing) (Cleveland, 1979) with a span of 2/3
was used to display the underlying trend in the data. Statistical work was performed
using the statistical software package S-PLUS (Mathsoft, 1999). Locally weighted
regression implemented with the “loess” function was used to show the trend in the
data for the scatter plots of the chemical constituents versus age (Figure 2.2).
Significance of the differences in chemical constituent weights between mated and
unmated queens for each age were determined using T tests.
Least Significant Differences (LSD) were used to compare means in Tables 2.2, 2.3,
2.4, 2.5, 2.6, 2.9, and 2.10. In general, significance was determined at P ≤ 0.05.
2.5 Results
Objective 1. Effects of queen age on Introduction Success, Early Performance
Success, and Satisfactory Performance Success rates.
Introduction Success Rates
The results for Introduction Success Rates are presented in Table 2.2. There was no
significant difference between survival rates 14 days after introduction for each age
59

group for queen bees supplied to Apiary A and Apiary B for any of the three years,
1999-2000, 2000-1 and 2001-2.
For 1999-2000, there was a significant difference (P < 0.05) between survival rates of
queen bees introduced at different ages. Queens introduced at seven days old had
significantly lowest survival rate, followed by those introduced at 14 days old. All
other aged queens (viz. 21, 28 and 35 days old) had the significantly highest survival
rate (≥ 85%), but were not different from each other.
For 2000-1, survival rates were improved for all ages compared to the first year’s data.
Again, there was a significant difference (P < 0.05) between survival rate for different
aged queens, with seven-day-old queens with lowest survival, and 14 day old queens
having significantly lower survival than 28- and 35- day-old queens. There were no
other differences between treatments.
For 2001-2, there were significant differences (P < 0.05) between survival rate at
different ages in nucleus hives, and between 24-day-old queens caught from mating
nuclei and from a queen bank. For example, 17-day-old queens from nucleus hives
had a lower survival rate than queens at 24 and 31 days of age also from nucleus hives,
but similar to 24-day-old queens from queen banks. However, there was no difference
in the survival rate of 31-day-old queens from either source. Survival rates of > 87%
were recorded for 24-day-old queens from nucleus hives and 31-day-old queens from
both nucleus hives and queen banks.
60
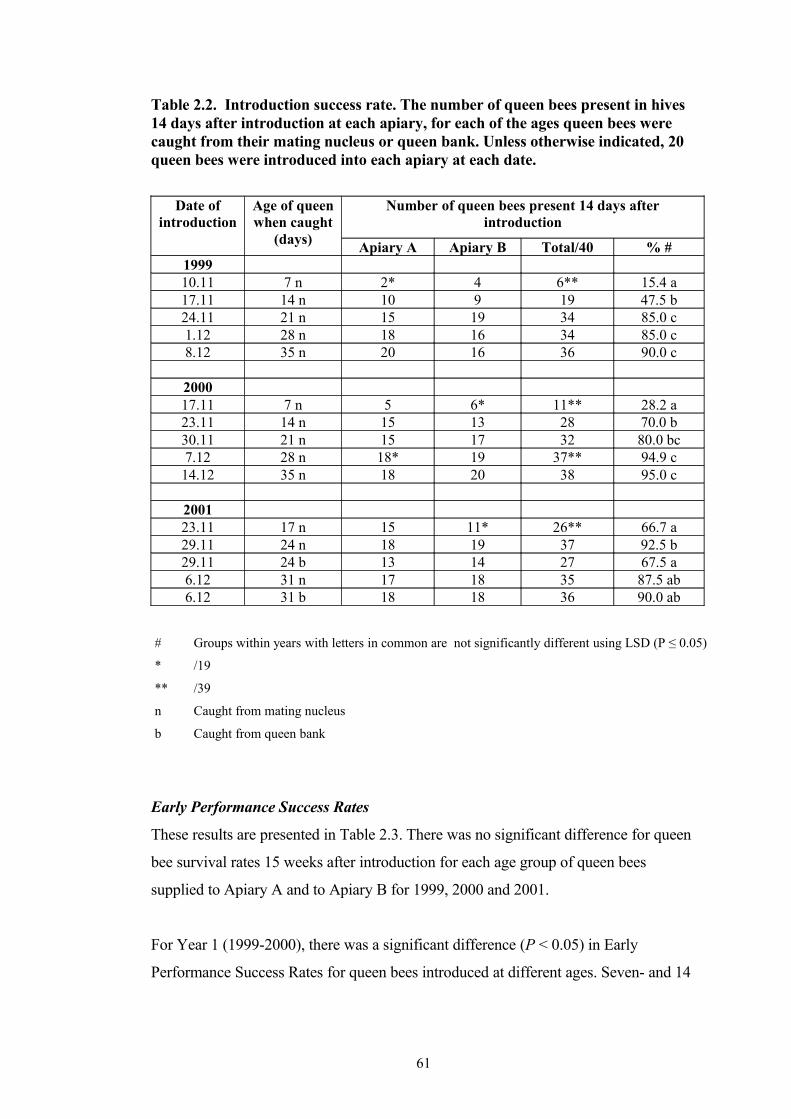
Table 2.2. Introduction success rate. The number of queen bees present in hives 14 days after introduction at each apiary, for each of the ages queen bees were caught from their mating nucleus or queen bank. Unless otherwise indicated, 20 queen bees were introduced into each apiary at each date.
Date of introduction
Age of queen when caught
(days)
Number of queen bees present 14 days after introduction
Apiary A Apiary B Total/40 % #199910.11 7 n 2* 4 6** 15.4 a17.11 14 n 10 9 19 47.5 b24.11 21 n 15 19 34 85.0 c1.12 28 n 18 16 34 85.0 c8.12 35 n 20 16 36 90.0 c
200017.11 7 n 5 6* 11** 28.2 a23.11 14 n 15 13 28 70.0 b30.11 21 n 15 17 32 80.0 bc7.12 28 n 18* 19 37** 94.9 c
14.12 35 n 18 20 38 95.0 c
200123.11 17 n 15 11* 26** 66.7 a29.11 24 n 18 19 37 92.5 b29.11 24 b 13 14 27 67.5 a6.12 31 n 17 18 35 87.5 ab6.12 31 b 18 18 36 90.0 ab
# Groups within years with letters in common are not significantly different using LSD (P ≤ 0.05)
* /19
** /39
n Caught from mating nucleus
b Caught from queen bank
Early Performance Success Rates
These results are presented in Table 2.3. There was no significant difference for queen
bee survival rates 15 weeks after introduction for each age group of queen bees
supplied to Apiary A and to Apiary B for 1999, 2000 and 2001.
For Year 1 (1999-2000), there was a significant difference (P < 0.05) in Early
Performance Success Rates for queen bees introduced at different ages. Seven- and 14
61

day old queens had poorer Earlier Performance Success (i.e. lower queen survival)
than 21-, 28- and 35-day-old queen bees.
For Year 2 (2000-1), there was also a significantly lower (P < 0.05) survival rate for
queens introduced at different ages. In this case, seven-day-old queens were
significantly inferior to those introduced at 14, 21, 28 and 35 days of age. There was
no difference between the older aged queens.
Table 2.3. Early performance success. The number of queen bees present in hives 15 weeks after introduction, for each apiary, for each of the ages queen bees were caught from their mating nucleus or queen bank. Unless otherwise indicated, 20 queen bees were introduced into each apiary at each date.
Date of introduction
Age of queen when
caught (days)
Number of queen bees present 15 weeks after introduction
Apiary A Apiary B Total/40 % #
1999 10.11 7 n 1 3 4** 10.3 a17.11 14 n 3 3 6 15.0 a24.11 21 n 9 16 25 62.5 b1.12 28 n 11 13 24 60.0 b8.12 35 n 14 15 29 72.5 b
200017.11 7 n 4 6* 10** 25.6 a23.11 14 n 15 13 28 70.0 b30.11 21 n 14 15 29 72.5 b7.12 28 n 18* 16 34** 87.2 b
14.12 35 n 16 19 35 87.5 b
200123.11 17 n 15 11* 26** 66.7 a29.11 24 n 16 19 35 87.5 a29.11 24 b 13 14 27 67.5 a6.12 31 n 15 17 32 80.0 a6.12 31 b 17 16 33 82.5 a
# Groups within years with letters in common are not significantly different using LSD (P < 0.05)
* /19** /39n Caught from mating nucleusb Caught from queen bank
62
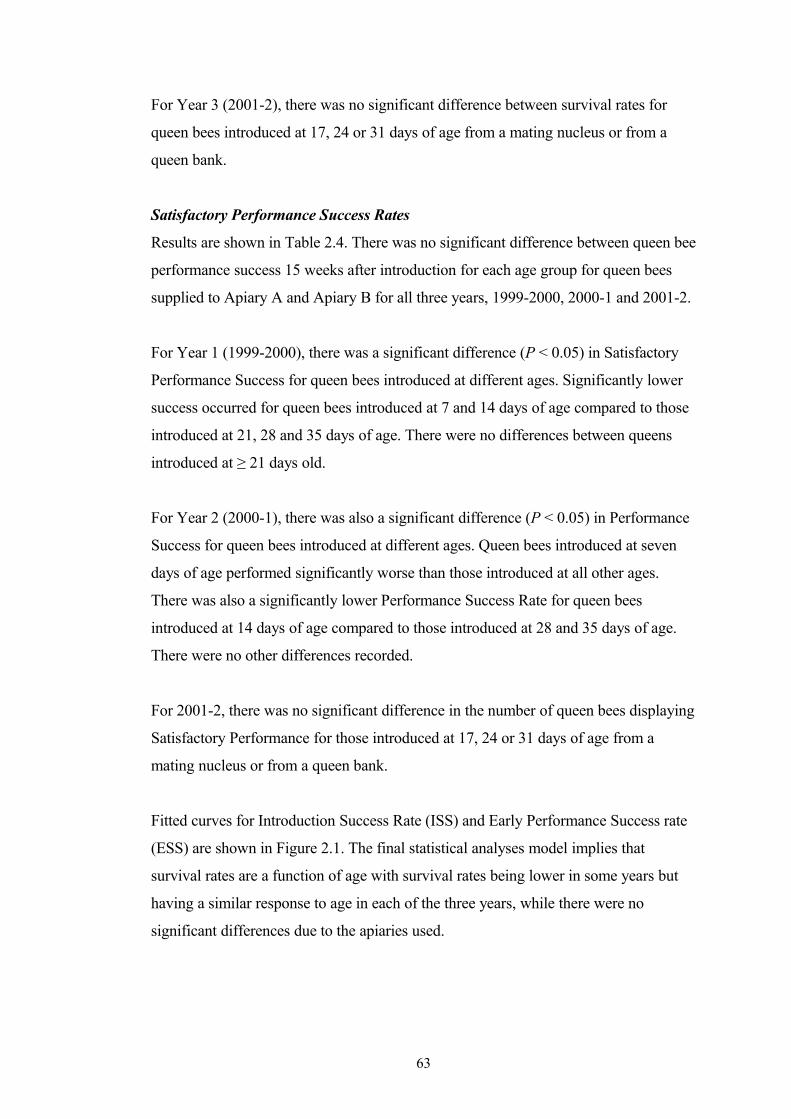
For Year 3 (2001-2), there was no significant difference between survival rates for
queen bees introduced at 17, 24 or 31 days of age from a mating nucleus or from a
queen bank.
Satisfactory Performance Success Rates
Results are shown in Table 2.4. There was no significant difference between queen bee
performance success 15 weeks after introduction for each age group for queen bees
supplied to Apiary A and Apiary B for all three years, 1999-2000, 2000-1 and 2001-2.
For Year 1 (1999-2000), there was a significant difference (P < 0.05) in Satisfactory
Performance Success for queen bees introduced at different ages. Significantly lower
success occurred for queen bees introduced at 7 and 14 days of age compared to those
introduced at 21, 28 and 35 days of age. There were no differences between queens
introduced at ≥ 21 days old.
For Year 2 (2000-1), there was also a significant difference (P < 0.05) in Performance
Success for queen bees introduced at different ages. Queen bees introduced at seven
days of age performed significantly worse than those introduced at all other ages.
There was also a significantly lower Performance Success Rate for queen bees
introduced at 14 days of age compared to those introduced at 28 and 35 days of age.
There were no other differences recorded.
For 2001-2, there was no significant difference in the number of queen bees displaying
Satisfactory Performance for those introduced at 17, 24 or 31 days of age from a
mating nucleus or from a queen bank.
Fitted curves for Introduction Success Rate (ISS) and Early Performance Success rate
(ESS) are shown in Figure 2.1. The final statistical analyses model implies that
survival rates are a function of age with survival rates being lower in some years but
having a similar response to age in each of the three years, while there were no
significant differences due to the apiaries used.
63
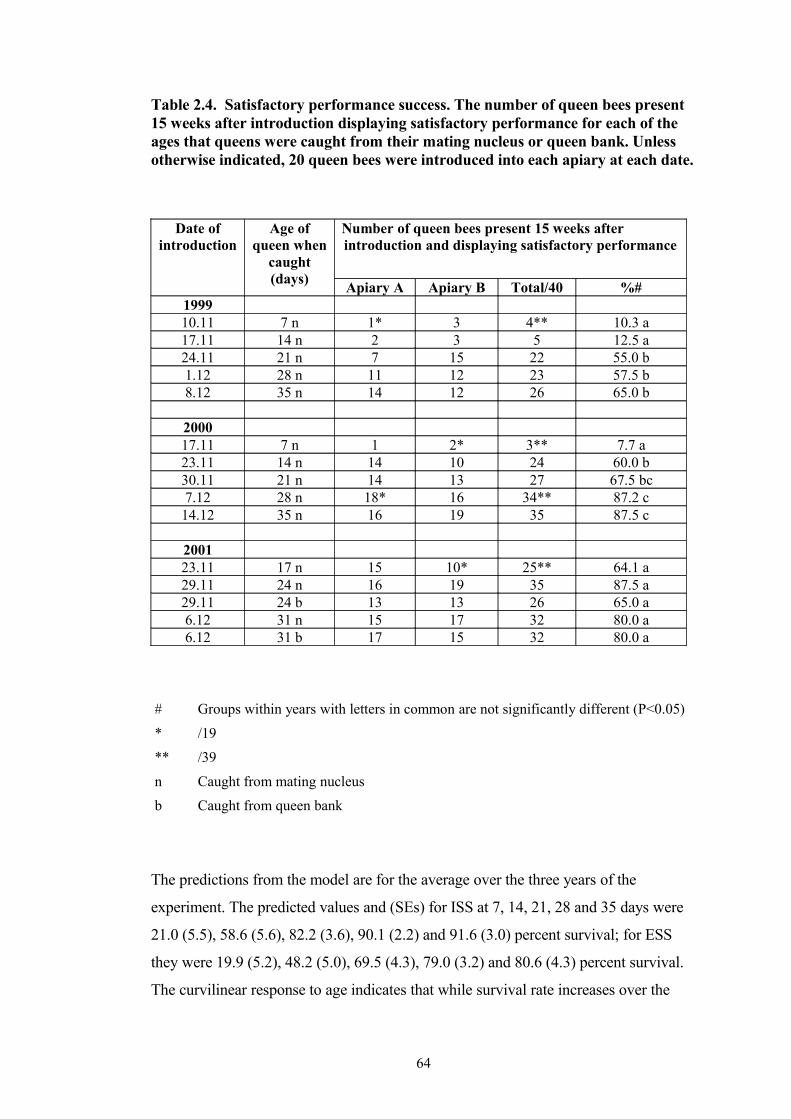
Table 2.4. Satisfactory performance success. The number of queen bees present 15 weeks after introduction displaying satisfactory performance for each of the ages that queens were caught from their mating nucleus or queen bank. Unless otherwise indicated, 20 queen bees were introduced into each apiary at each date.
Date of introduction
Age of queen when
caught (days)
Number of queen bees present 15 weeks afterintroduction and displaying satisfactory performance
Apiary A Apiary B Total/40 %#199910.11 7 n 1* 3 4** 10.3 a17.11 14 n 2 3 5 12.5 a24.11 21 n 7 15 22 55.0 b1.12 28 n 11 12 23 57.5 b8.12 35 n 14 12 26 65.0 b
200017.11 7 n 1 2* 3** 7.7 a23.11 14 n 14 10 24 60.0 b30.11 21 n 14 13 27 67.5 bc7.12 28 n 18* 16 34** 87.2 c
14.12 35 n 16 19 35 87.5 c
200123.11 17 n 15 10* 25** 64.1 a29.11 24 n 16 19 35 87.5 a29.11 24 b 13 13 26 65.0 a6.12 31 n 15 17 32 80.0 a6.12 31 b 17 15 32 80.0 a
# Groups within years with letters in common are not significantly different (P<0.05)
* /19
** /39
n Caught from mating nucleus
b Caught from queen bank
The predictions from the model are for the average over the three years of the
experiment. The predicted values and (SEs) for ISS at 7, 14, 21, 28 and 35 days were
21.0 (5.5), 58.6 (5.6), 82.2 (3.6), 90.1 (2.2) and 91.6 (3.0) percent survival; for ESS
they were 19.9 (5.2), 48.2 (5.0), 69.5 (4.3), 79.0 (3.2) and 80.6 (4.3) percent survival.
The curvilinear response to age indicates that while survival rate increases over the
64

interval 7 to 35 days, the rate of increase in survival rate decreases as age increases.
Most increase occurs before 28 days. Note that data for queen bees caught from a
queen bank were not included in the analysis because they were collected only in 2001
for queen bees aged 24 and 31 days.
When data from the non-egg laying queen bees were omitted and the models refitted,
the predicted values and (SEs) for ISS at 14, 21, 28 and 35 days were 57.6 (7.0), 82.6
(3.9), 90.4 92.4) and 91.3 93.3) percent survival; for ESS they were 47.7 (6.4), 69.6
(4.5), 79.2 (3.6) and 80.4 (4.5) percent survival. The response of survival rate to
increasing age is similar to the response obtained when data for the egg laying and
non-egglaying queen bees were used to fit the curve.
Fig 2.1. Fitted curves for Introduction Success (ISS) and Early Performance
Success (ESS) measured as percent survival, for queen bees introduced at
different ages, for the years 1999-2000, 2000-1, 2001-2.
65
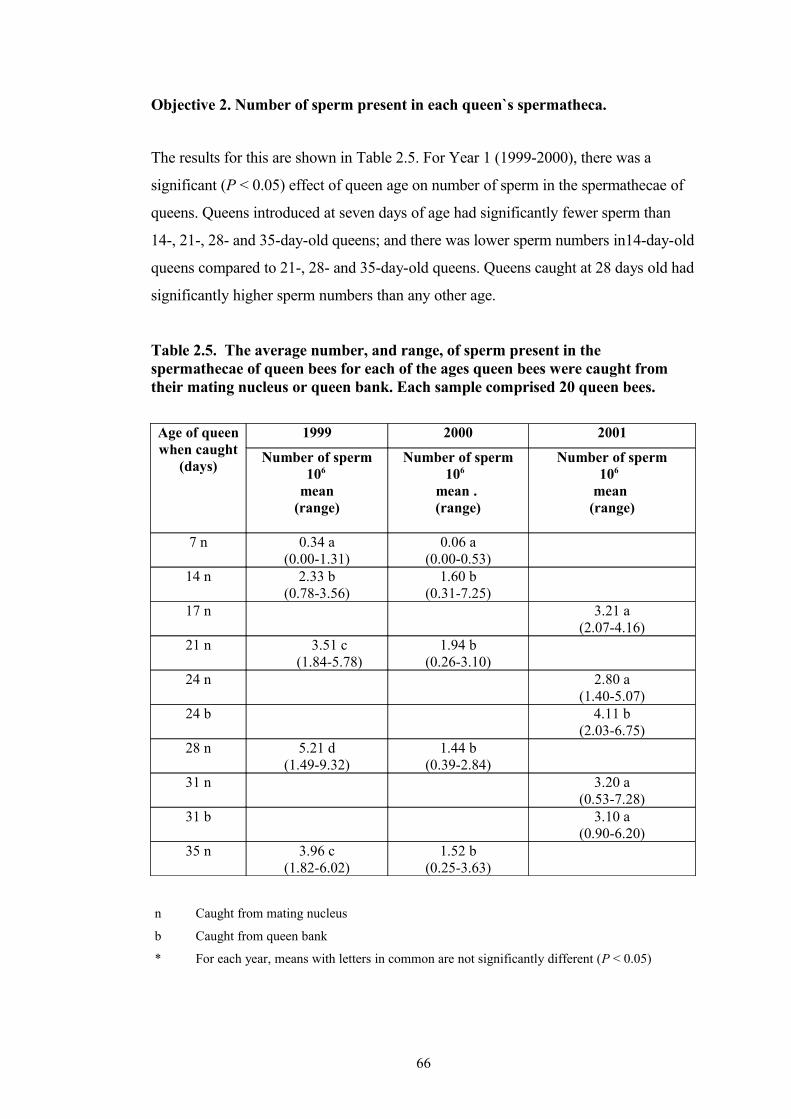
Objective 2. Number of sperm present in each queen`s spermatheca.
The results for this are shown in Table 2.5. For Year 1 (1999-2000), there was a
significant (P < 0.05) effect of queen age on number of sperm in the spermathecae of
queens. Queens introduced at seven days of age had significantly fewer sperm than
14-, 21-, 28- and 35-day-old queens; and there was lower sperm numbers in14-day-old
queens compared to 21-, 28- and 35-day-old queens. Queens caught at 28 days old had
significantly higher sperm numbers than any other age.
Table 2.5. The average number, and range, of sperm present in the spermathecae of queen bees for each of the ages queen bees were caught from their mating nucleus or queen bank. Each sample comprised 20 queen bees.
Age of queen when caught
(days)
1999 2000 2001
Number of sperm106
mean(range)
Number of sperm106
mean . (range)
Number of sperm106
mean (range)
7 n 0.34 a(0.00-1.31)
0.06 a(0.00-0.53)
14 n 2.33 b(0.78-3.56)
1.60 b(0.31-7.25)
17 n 3.21 a(2.07-4.16)
21 n 3.51 c(1.84-5.78)
1.94 b(0.26-3.10)
24 n 2.80 a(1.40-5.07)
24 b 4.11 b(2.03-6.75)
28 n 5.21 d(1.49-9.32)
1.44 b(0.39-2.84)
31 n 3.20 a(0.53-7.28)
31 b 3.10 a(0.90-6.20)
35 n 3.96 c(1.82-6.02)
1.52 b(0.25-3.63)
n Caught from mating nucleus
b Caught from queen bank
* For each year, means with letters in common are not significantly different (P < 0.05)
66
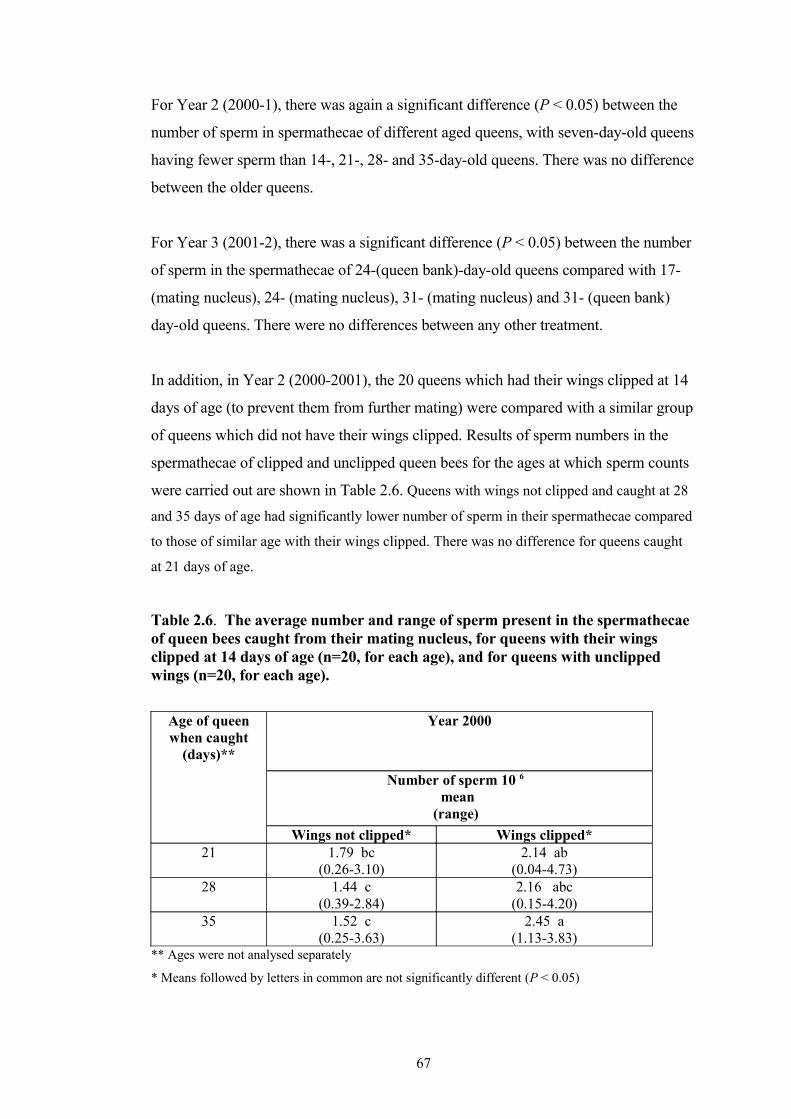
For Year 2 (2000-1), there was again a significant difference (P < 0.05) between the
number of sperm in spermathecae of different aged queens, with seven-day-old queens
having fewer sperm than 14-, 21-, 28- and 35-day-old queens. There was no difference
between the older queens.
For Year 3 (2001-2), there was a significant difference (P < 0.05) between the number
of sperm in the spermathecae of 24-(queen bank)-day-old queens compared with 17-
(mating nucleus), 24- (mating nucleus), 31- (mating nucleus) and 31- (queen bank)
day-old queens. There were no differences between any other treatment.
In addition, in Year 2 (2000-2001), the 20 queens which had their wings clipped at 14
days of age (to prevent them from further mating) were compared with a similar group
of queens which did not have their wings clipped. Results of sperm numbers in the
spermathecae of clipped and unclipped queen bees for the ages at which sperm counts
were carried out are shown in Table 2.6. Queens with wings not clipped and caught at 28
and 35 days of age had significantly lower number of sperm in their spermathecae compared
to those of similar age with their wings clipped. There was no difference for queens caught
at 21 days of age.
Table 2.6. The average number and range of sperm present in the spermathecae of queen bees caught from their mating nucleus, for queens with their wings clipped at 14 days of age (n=20, for each age), and for queens with unclipped wings (n=20, for each age).
Age of queen when caught
(days)**
Year 2000
Number of sperm 10 6
mean (range)
Wings not clipped* Wings clipped*21 1.79 bc
(0.26-3.10)2.14 ab
(0.04-4.73)28 1.44 c
(0.39-2.84)2.16 abc
(0.15-4.20)35 1.52 c
(0.25-3.63)2.45 a
(1.13-3.83)** Ages were not analysed separately
* Means followed by letters in common are not significantly different (P < 0.05)
67

Averaged over the three queen ages, the clipped queens had significantly higher numbers of
sperm (P < 0.05) than non-clipped queens.
Sperm numbers present in the spermathecae of newly mated queen bees.
One hundred commercially reared, mated queen bees, between 14 and 35 days of age,
with unclipped wings, were examined for the number of sperm present in their
spermathecae each year for the years 1999-2000, 2000-1 and 2001-2. The percentages
of queen bees with less than three million sperm in their spermathecae were 42.5%
(1999-2000), 81.4% (2000-2001), 46.0% (2001-2002); with 3.0-4.5 million sperm
were 23.8% (1999-2000), 16.4% (2000-2001), 33.0% (2001-2002; and queens with
more than 4.5 million sperm were 33.7% (1999-2000), 2.2% (2000-2001) and 21.0%
(2001-2002).
The age at which queen bees commence to mate.
Queen bees caught from their mating nuclei at seven days of age and examined for
sperm in their spermathecae resulted in 40% (1999-2000), and 15% (2000-1) of
queens with sperm. For both years, 100% of 14-day-old queens examined contained
sperm in their spermathecae. This indicated that queen bees commenced mating at an
age just prior to seven days old with the majority commencing at an age older than
seven days.
Objective 3. The number and amounts of mandibular and head gland chemicals
present in queen bees seven to 35 days of age.
Ten chemicals were identified in amounts > 0.05 µgm/queen and these are shown in
Table 2.7 (12 chemicals are present if the (R,S) enantiomersd of 9-HDA and 9-HDAA
are included separately).
The (R, S) enantiomers of 9-hydroxy-2(E)-decenoic acid (9-HDA) and 9-
hydroxydecanoic acid (9-HDAA) were not separable with the present achiral GC
column, although the two isomers of 9-HDA have been resolved previously through
derivatization to acetyl lactate diastereomers (Slessor et al., 1990).
68

Table 2.7. Chemicals identified from the mandibular and head glands of queen honey bees aged 7 - 35 days of age.
MHB methyl 4-hydroxybenzoate7-HO 7-hydroxyoctanoic acid8-HO 8-hydroxyoctanoic acid9-ODA 9-oxo-2 (E)-decenoic acidHVA 4-hydroxy-3-methoxyphenethanol 9-HDAA (R, S)-9-hydroxydecanoic acid9-HDA (R, S)-9-hydroxy-2-(E)-decenoic acid10-HDAA 10-hydroxydecanoic acid10-HDA 10-hydroxy-2-(E)-decenoic acidHFA 4-hydroxy-3 methoxybenzene-propanoic acid
Significant quantities of glycerides were identified in the extracts and were found to
contain 9(Z)-octa decenoate as the major ligand. For example, the head of a 21-day-old
queen contained 9(Z)-octadecenoate (65.9 µg), hexadecanoate (7.0 µg), octadecanoate
(2.0 µg) and 9(Z)-hexadecenoate (1.9 µg).
The means ± SD of chemical levels recorded for each chemical for each age group are
shown in Table 2.8. With the exceptions of HVA, HFA and MHB, mean constituent
levels for queen bees from each age group were at a low level for seven-day-old
queens, reduced to a minimum level at 14 days, increased to peak at either 21 or 28
days, and began to reduce for 35-day-old queens. 9-ODA was the dominant chemical
constituent; 9-HDA and 10-HDA were present in levels higher than the remaining
seven constituents (Table 2.8).
The most notable aspect of the head chemical constituent proportions was the large
variation between individual queens at each age. All head chemical constituents had
the highest mean for either the 21- or 28-day-old queens. At those ages, the mean total
of the head chemical constituents was approximately double the weight for the seven-
and 35-day-old queens, and seven times the weight for the 14-day-old queens. For
head chemical constituent proportions, 9-ODA and 10-HDA which had the highest
means of 0.66 and 0.15 for the seven-day-old queens were the only two head chemical
constituents which declined with increasing queen age.
69
The mean total weight of head chemical constituents for each age group (7, 14, 21, 28
and 35 days) was 61, 21 138, 142 and 74 µg, respectively. The very low mean total
weight for the 14-day-old queens is not consistent with the mean total weights found
for the adjacent age groups of seven- and 21-day-old queens. However, when the
weight for each head chemical constituent for individuals is expressed as a proportion
of the total weight of the head chemical constituents for each queen, the proportions
for the 14-day-old queens are consistent with the proportions for the seven- and 21-
day-old queens.
Forty percent of seven-day-old queens and 100% of 14-day-old queens contained
sperm in their spermathecae (Section 2.5.2). Based on the absence or presence of
sperm in the spermathecae of seven-day-old queens, chemical constituent levels found
in unmated and in mated queen bees are shown in Table 2.8. Significant differences
were found for 9-HDA (P < 0.05) and for 9-ODA, 10-HDA (P < 0.10) and for the
total weights of head chemical constituents for non-mated versus mated queens.
The level of each chemical produced by each queen varied between queen bees in the
same age group. The average level of each chemical produced by each age group
varied between the five age groups of queen bees examined.
70

Table 2.8. Chemical constituent weights from queen heads showing the mean ± S.D. for queen bees aged between 7 - 35 days.
Chemical constituent
Mean ± S.D. for Age shown (days)
µg 7U*n# = 12
7Mn = 8
14n = 20
21n = 20
28n = 20
35n = 20
HFA 0.12±0.14 0.15±0.12 0.49±0.66 3.75±2.35 2.73±1.78 1.54±0.89HVA 0.02±0.06 0.05±0.05 1.08±1.07 7.0±2.55 8.1±4.16 7.39±3.7MHB 0.04±0.05 0.02±0.05 0.2±0.16 3.2±2.15 2.48±1.98 1.52±1.47-HO 0.18±0.11 0.11±0.1 0.08±0.07 0.52±0.21 0.9±0.36 0.58±0.268-HO 2.14±0.79 1.75±0.97 0.94±0.72 6.52±3.02 10.47±4.01 7.84±3.249-HDA 9.06±1.95 6.69±2.56 2.9±2.04 28.85±12.78 42.62±14.19 17.07±7.129-HDAA 0.45±0.17 0.39±0.08 0.24±0.13 0.8±0.38 1.07±0.32 0.63±0.229-ODA 45.08±14.19 33.56±14.61 12.62±8.15 72.19±26.19 57.62±26.54 32.56±13.3210-HDA 10.32±4.18 7.36±2.97 1.92±2.4 15.84±8.52 13.36±6.4 4.05±2.0310-HDAA 0.38²0.31 0.28±0.15 0.26±0.36 2.28±0.95 2.72±1.29 0.97±0.42
* U unmated queen, M mated queen
# Number in sample
71
Objective 4. Queen quality.
Number of ovarioles
The number of ovarioles in the right and left ovaries for 1999-2000, and the left ovary
of queen bees for the two subsequent years (2000-1 and 2001-2) are presented in Table
2.9. There was no significant difference between the number of ovarioles in the left
ovary compared to the number in the right ovary for the 1999-2000 experiment. Thus,
for the two subsequent years (2000-1 and 2001-2) experiments, only the number of
ovarioles in the left ovary was counted. There appeared to be no regular pattern, other
than that 7-day-old queens had fewer ovarioles than other ages. In Year 1 (1999-
2000), queens seven days old had significantly fewer ovarioles than all other ages,
whereas queens 28 days old had significantly higher mean number of ovarioles than
all other ages. In 2000-1, queens aged seven and 28 days had a similar number, but
less ovarioles than queens 14 and 21 days old. In 2001-2, 31-day-old queens from
mating nucleus hives had significantly fewer ovarioles than those 17 and 14 days old
from the same source. Queens 24 days old from queen banks had significantly fewer
ovarioles than same age queens from mating nucleus hives. However, this difference
was not evident for 31-day-old queens.
Queen body weight, spermatheca diameter, and presence or absence of sperm in the
oviducts.
Results for these characteristics for Years 2000-1 and 2001-2 are presented in Table
2.10.
Queen body weight differed significantly (P < 0.05) with queen age in 1999-2000,
with seven-day-old queens significantly lighter in weight than all other age queens
caught from mating nuclei. In 2000-2001, while there was a significant difference
recorded in body weight between queens of different ages in mating nucleus colonies,
there was no pattern of relationship between these two parameters. In this year, no
seven-day-old queens were examined. However, queens from queen banks were
significantly lighter than comparative same aged queens from mating nucleus colonies.
72
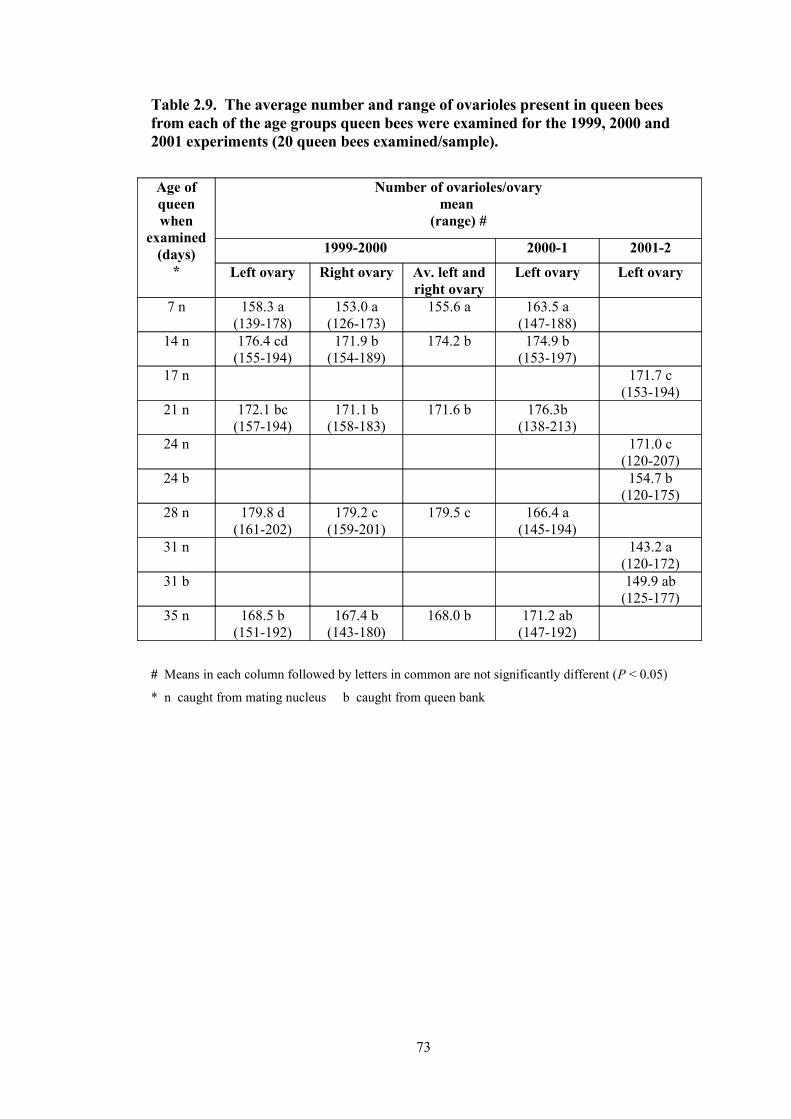
Table 2.9. The average number and range of ovarioles present in queen bees from each of the age groups queen bees were examined for the 1999, 2000 and 2001 experiments (20 queen bees examined/sample).
Age of queen when
examined (days)
*
Number of ovarioles/ovarymean
(range) #
1999-2000 2000-1 2001-2
Left ovary Right ovary Av. left and right ovary
Left ovary Left ovary
7 n 158.3 a(139-178)
153.0 a(126-173)
155.6 a 163.5 a(147-188)
14 n 176.4 cd(155-194)
171.9 b(154-189)
174.2 b 174.9 b(153-197)
17 n 171.7 c(153-194)
21 n 172.1 bc(157-194)
171.1 b(158-183)
171.6 b 176.3b(138-213)
24 n 171.0 c(120-207)
24 b 154.7 b(120-175)
28 n 179.8 d(161-202)
179.2 c(159-201)
179.5 c 166.4 a(145-194)
31 n 143.2 a(120-172)
31 b 149.9 ab(125-177)
35 n 168.5 b(151-192)
167.4 b(143-180)
168.0 b 171.2 ab(147-192)
# Means in each column followed by letters in common are not significantly different (P < 0.05)
* n caught from mating nucleus b caught from queen bank
73

Table 2.10. Means ± S.E. for queen body weight, spermatheca diameter, and the presence of sperm in the oviducts of queen bees for each of the ages queens were examined for the 2000-1 and 2001-2 experiments. Unless otherwise indicated, 20 queen bees were examined/sample.
Queen age
(days)*
Body weight g
mean ± .S.E.#
Spermatheca diameter mm
mean ± S.E.#
Number of queen bees with semen
present in oviducts
2000-1 2001-2 2000-1 2001-2 2000-1 2001-27 n 0.173±0.003
a1.377±0.024
b2/20
14 n 0.214±0.003 b
1.364±0.024 b
2/20
17 n 0.220±0.003 b
1.235±0.017 a
8/20
21 n 0.226±0.002 b
1.374±0.013 b
4/40
24 n 0.212±0.003 b
1.285±0.017 b
3/20
24 b 0.197±0.003 a
1.299±0.017 b
1/20
28 n 0.221±0.002 b
1.323±0.017 a
4/40
31 n 0.214±0.003 b
1.262±0.017 ab
2/20
31 b 0.200±0.003 a
1.238±0.017 a
4/20
35 n 0.218±0.002 b
1.380±0.017 b
0/40
# For each year, means followed by letters in common are not significantly different (P < 0.05)
* n caught from mating nucleus b caught from queen bank
Spermatheca diameter differed significantly in different aged queens in both years, but
there was no clear relationship between these two parameters. There was a generally
greater spermatheca diameter recorded in 2000-1 compared to 2001-2.
The percentage of queens with semen present in their oviduct varied from 0% for 35-
day-old queens to 10% for queens 21 and 28 days of age in 2000-1. In 2001-2, this
percentage varied from 5% for 24-day-old queens (in queen banks) to 40% in 17-day-
old queens in mating nucleus colonies.
74

Nosema disease levels in test queen bees.
Nosema levels in honey production hives and queen rearing hives.
Data on nosema prevalence in honey production hives that test queen bees were
introduced into, and queen bee rearing hives (mating nuclei and queen bank hives) are
presented in Table 2.11. Mean nosema spore levels varied from < 0.05 to a maximum
of 1.7 x 10⁶, the latter in a queen bank seven days after its establishment.
Table 2.11. Nosema disease Nosema spp. spore counts from queen rearing hives at the time of queen production, and honey production hives at the time of queen introduction, for the years 2000 and 2001.
Queen bee production hives
Honey production hives
Nosema spp. spores/bee x 10 6
mean (range)
2000-1 2001-2Mating nuclei 0.88
(0.55-1.20)Queen bank - at establishment
< 0.05
Queen bank – after 7 days
1.70
Queen bank – after 14 days
0.15
Apiary A 0.39 (0.05-0.90)
< 0.05
Apiary B 0.42 (0.10-1.35)
0.13 (0.10-0.15)
Brood disease levels in honey production hives
The disease status of bee brood in established, commercial honey production hives
receiving test queen bees was assessed at the date queen bees were being introduced.
Based on visual inspection, in 1999-2000, hives used were free from brood diseases,
or contained < 5 cells chalkbrood, A. apis; European foulbrood (EFB), M. pluton; and
sacbrood (virus). For the 2000-1 and 2001-2 experiments, disease prevalence was
recorded. The results of the disease status of hives used in 2000-1 are shown in Table
2.12. For Apiary A, no EFB was detected; chalkbrood was detected in 0-30% of hives,
with most infections being light. Light sacbrood infection was recorded in a maximum
75
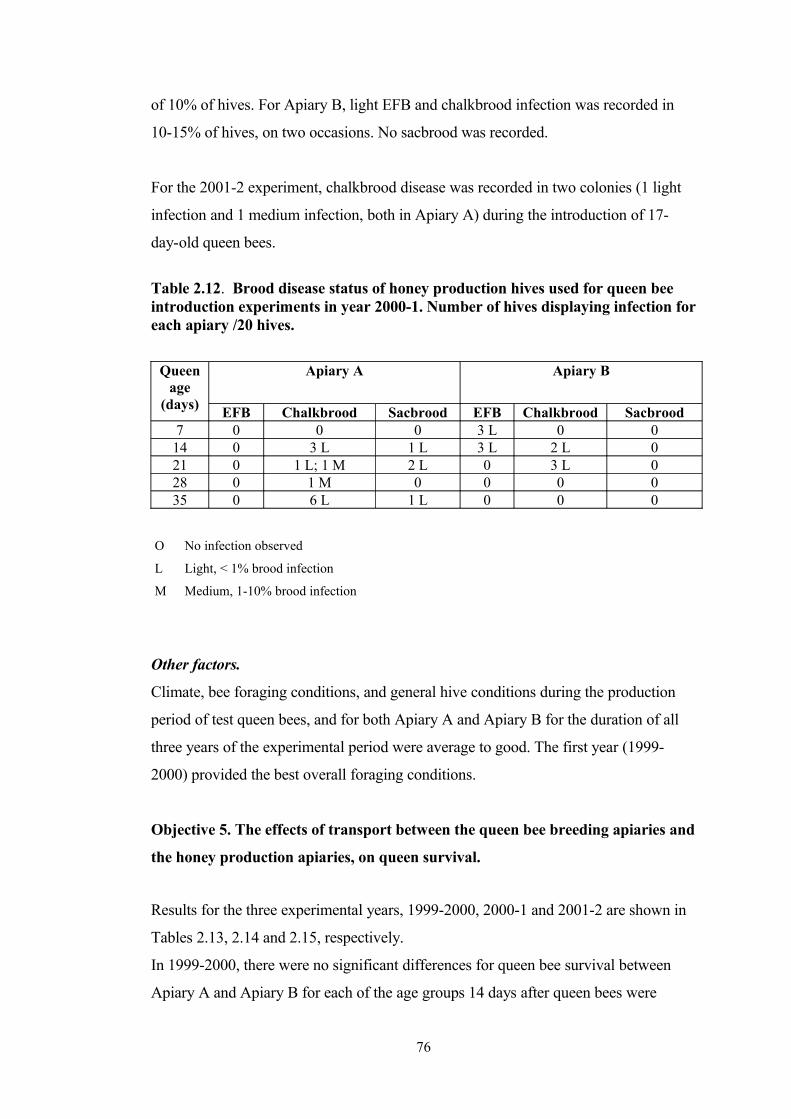
of 10% of hives. For Apiary B, light EFB and chalkbrood infection was recorded in
10-15% of hives, on two occasions. No sacbrood was recorded.
For the 2001-2 experiment, chalkbrood disease was recorded in two colonies (1 light
infection and 1 medium infection, both in Apiary A) during the introduction of 17-
day-old queen bees.
Table 2.12. Brood disease status of honey production hives used for queen bee introduction experiments in year 2000-1. Number of hives displaying infection for each apiary /20 hives.
Queen age
(days)
Apiary A
Apiary B
EFB Chalkbrood Sacbrood EFB Chalkbrood Sacbrood7 0 0 0 3 L 0 014 0 3 L 1 L 3 L 2 L 021 0 1 L; 1 M 2 L 0 3 L 028 0 1 M 0 0 0 035 0 6 L 1 L 0 0 0
O No infection observed
L Light, < 1% brood infection
M Medium, 1-10% brood infection
Other factors.
Climate, bee foraging conditions, and general hive conditions during the production
period of test queen bees, and for both Apiary A and Apiary B for the duration of all
three years of the experimental period were average to good. The first year (1999-
2000) provided the best overall foraging conditions.
Objective 5. The effects of transport between the queen bee breeding apiaries and
the honey production apiaries, on queen survival.
Results for the three experimental years, 1999-2000, 2000-1 and 2001-2 are shown in
Tables 2.13, 2.14 and 2.15, respectively.
In 1999-2000, there were no significant differences for queen bee survival between
Apiary A and Apiary B for each of the age groups 14 days after queen bees were
76

introduced into honey production hives (Table 2.13). Only one queen and few escorts
from any of the treatments were dead on arrival, although queen survival 14 days after
introduction varied from 10% for seven-day-old queens to 100% for 35-day-old
queens.
Table 2.13. Queen bee transport data for each age group of queen bees for shipments mailed November-December 1999. Number of hours in transport (time), temperatures and humidities recorded from inside envelopes containing the caged queen bees and escort bees, queen bee and escort bee survival, and queen bee survival 14 days after introduction into honey production hives.
Honey ProducerApiary
Age of queen (days)
7 14 21 28 35
Time (hours) AB
3331
2029
2018
2218
2622
Temperature°C
Min.Max.Min.Max.
AABB
18.928.319.228.3
-2.528.319.231.0
18.329.122.129.1
20.231.019.532.2
22.130.619.531.4
Relative Humidity
%
Min.Max.Min.Max.
AABB
51.673.551.969.3
26.749.662.773.3
56.387.278.387.7
43.463.960.369.9
58.277.656.472.3
Number of dead bees on
arrival*
QEQE
AABB
0000
1002
0104
0100
0000
Queen bee survival**
AB
24
109
1519
1816
2016
* Q = queen (/20) E = escort worker bees (/120)
** Number of queen bees alive 14 days after introduction into honey production hives (/20 per apiary)
In 2000-1, there were also no significant differences for queen bee survival between
Apiary A and Apiary B for each of the age groups 14 days after queen bees were
introduced into honey production hives (Table 2.14). Only one queen and few escort
bees from any of the treatments were dead on arrival, although queen survival 14 days
after introduction varied from 25% for seven-day-old queens to 100% for 35-day-old
queens.
77
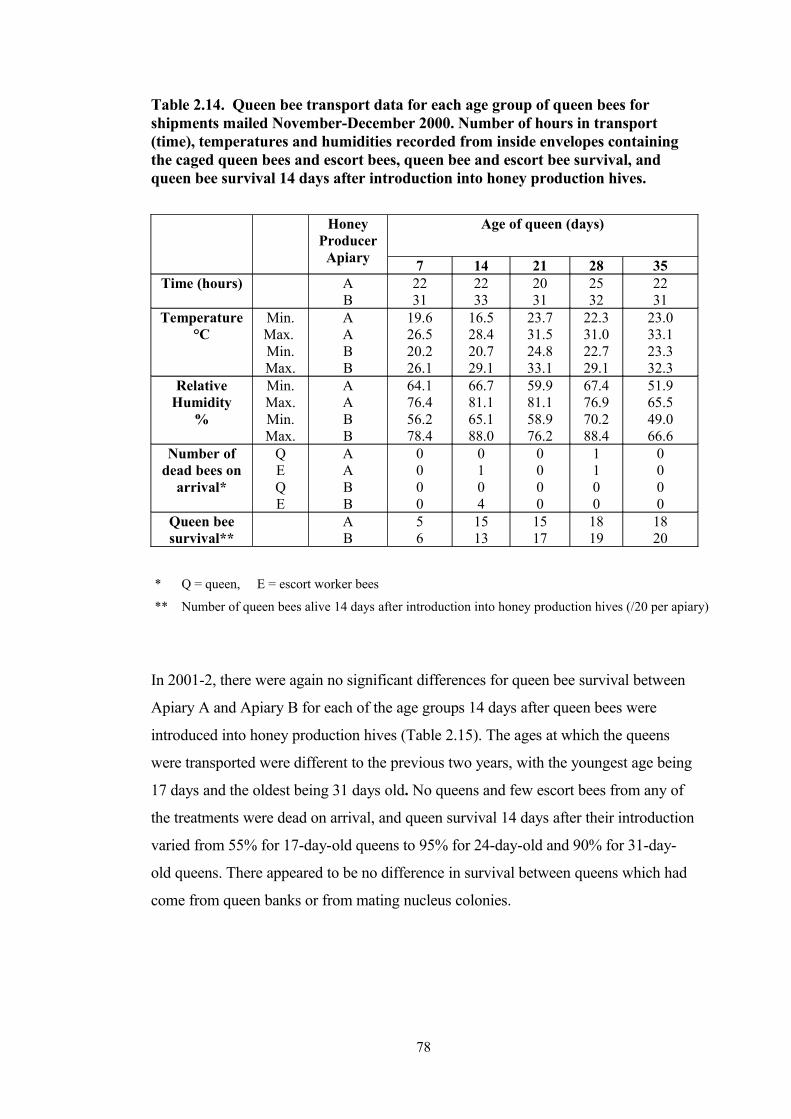
Table 2.14. Queen bee transport data for each age group of queen bees for shipments mailed November-December 2000. Number of hours in transport (time), temperatures and humidities recorded from inside envelopes containing the caged queen bees and escort bees, queen bee and escort bee survival, and queen bee survival 14 days after introduction into honey production hives.
Honey Producer Apiary
Age of queen (days)
7 14 21 28 35Time (hours) A
B2231
2233
2031
2532
2231
Temperature°C
Min.Max. Min.Max.
AABB
19.626.520.226.1
16.528.420.729.1
23.731.524.833.1
22.331.022.729.1
23.033.123.332.3
Relative Humidity
%
Min.Max.Min.Max.
AABB
64.176.456.278.4
66.781.165.188.0
59.981.158.976.2
67.476.970.288.4
51.965.549.066.6
Number of dead bees on
arrival*
QEQE
AABB
0000
0104
0000
1100
0000
Queen bee survival**
AB
56
1513
1517
1819
1820
* Q = queen, E = escort worker bees
** Number of queen bees alive 14 days after introduction into honey production hives (/20 per apiary)
In 2001-2, there were again no significant differences for queen bee survival between
Apiary A and Apiary B for each of the age groups 14 days after queen bees were
introduced into honey production hives (Table 2.15). The ages at which the queens
were transported were different to the previous two years, with the youngest age being
17 days and the oldest being 31 days old. No queens and few escort bees from any of
the treatments were dead on arrival, and queen survival 14 days after their introduction
varied from 55% for 17-day-old queens to 95% for 24-day-old and 90% for 31-day-
old queens. There appeared to be no difference in survival between queens which had
come from queen banks or from mating nucleus colonies.
78
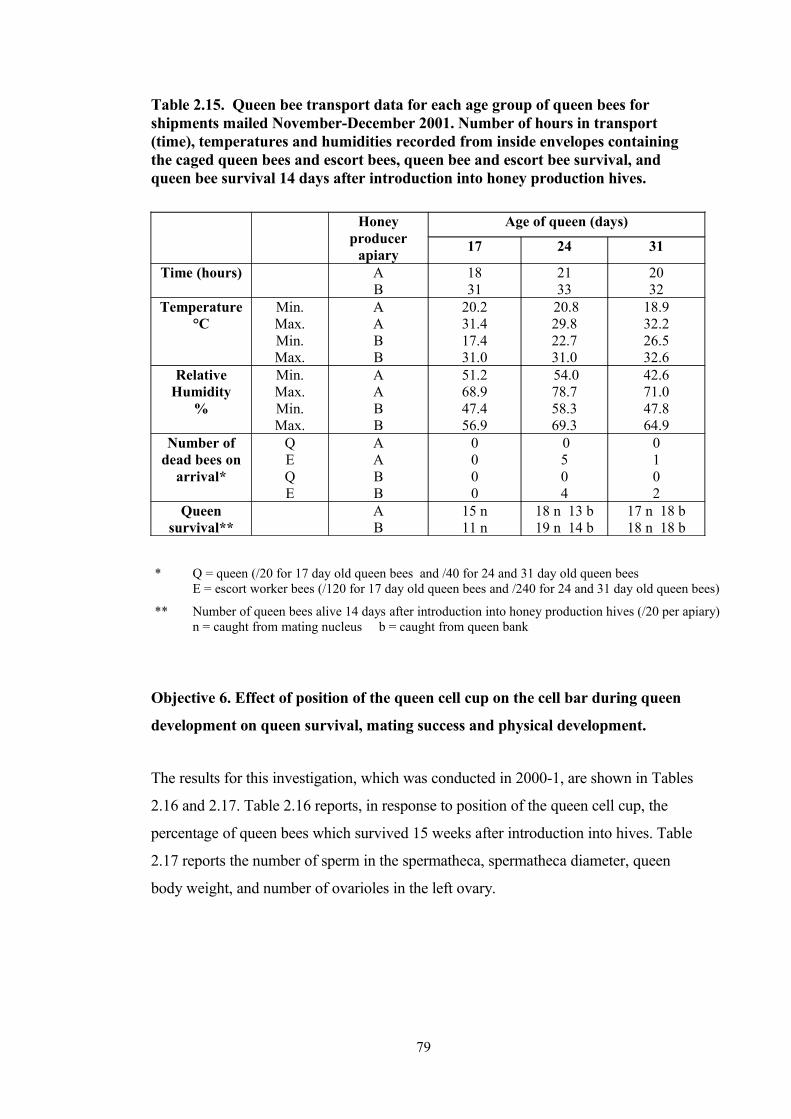
Table 2.15. Queen bee transport data for each age group of queen bees for shipments mailed November-December 2001. Number of hours in transport (time), temperatures and humidities recorded from inside envelopes containing the caged queen bees and escort bees, queen bee and escort bee survival, and queen bee survival 14 days after introduction into honey production hives.
Honey producer
apiary
Age of queen (days)
17 24 31
Time (hours) AB
1831
2133
2032
Temperature°C
Min.Max.Min.Max.
AABB
20.231.417.431.0
20.829.822.731.0
18.932.226.532.6
Relative Humidity
%
Min.Max.Min.Max.
AABB
51.268.947.456.9
54.078.758.369.3
42.671.047.864.9
Number of dead bees on
arrival*
QEQE
AABB
0000
0504
0102
Queen survival**
AB
15 n11 n
18 n 13 b19 n 14 b
17 n 18 b18 n 18 b
* Q = queen (/20 for 17 day old queen bees and /40 for 24 and 31 day old queen beesE = escort worker bees (/120 for 17 day old queen bees and /240 for 24 and 31 day old queen bees)
** Number of queen bees alive 14 days after introduction into honey production hives (/20 per apiary)n = caught from mating nucleus b = caught from queen bank
Objective 6. Effect of position of the queen cell cup on the cell bar during queen
development on queen survival, mating success and physical development.
The results for this investigation, which was conducted in 2000-1, are shown in Tables
2.16 and 2.17. Table 2.16 reports, in response to position of the queen cell cup, the
percentage of queen bees which survived 15 weeks after introduction into hives. Table
2.17 reports the number of sperm in the spermatheca, spermatheca diameter, queen
body weight, and number of ovarioles in the left ovary.
79
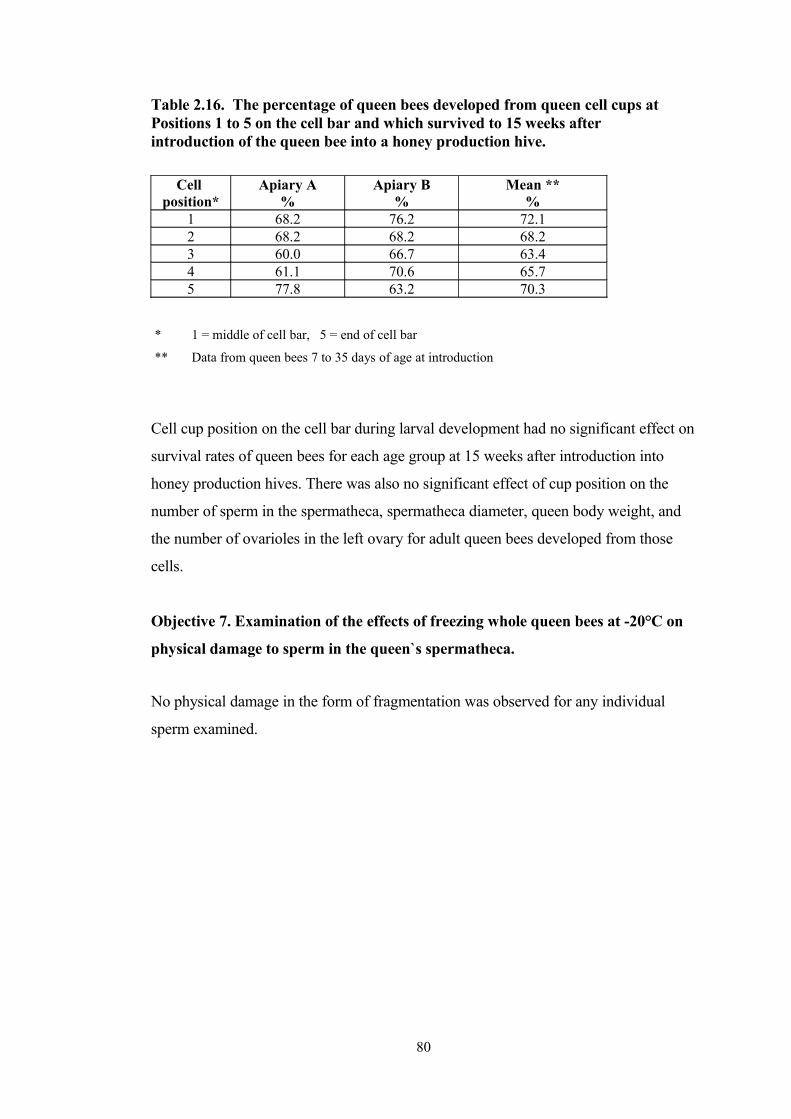
Table 2.16. The percentage of queen bees developed from queen cell cups at Positions 1 to 5 on the cell bar and which survived to 15 weeks after introduction of the queen bee into a honey production hive.
Cell position*
Apiary A%
Apiary B%
Mean **%
1 68.2 76.2 72.12 68.2 68.2 68.23 60.0 66.7 63.44 61.1 70.6 65.75 77.8 63.2 70.3
* 1 = middle of cell bar, 5 = end of cell bar
** Data from queen bees 7 to 35 days of age at introduction
Cell cup position on the cell bar during larval development had no significant effect on
survival rates of queen bees for each age group at 15 weeks after introduction into
honey production hives. There was also no significant effect of cup position on the
number of sperm in the spermatheca, spermatheca diameter, queen body weight, and
the number of ovarioles in the left ovary for adult queen bees developed from those
cells.
Objective 7. Examination of the effects of freezing whole queen bees at -20°C on
physical damage to sperm in the queen`s spermatheca.
No physical damage in the form of fragmentation was observed for any individual
sperm examined.
80

Table 2.17. Data recorded for adult queen bees developed in queen cell cups for the five positions on the cell bar for number of sperm in the spermatheca, spermatheca diameter, queen body weight, and number of ovarioles in one ovary
Cell position
*
Number of sperm in
spermatheca10 6
mean (range)**
Spermatheca diameter
mmmean (range)#
Queen body weight
gmean
(range)#
Number of ovarioles in one
ovarymean (range)#
1 1.627 (0.788-3.633)
1.377 (1.167-1.738)
0.2118 (0.1542-0.2536)
164.9 (140-195)
2 1.608 (0.363-2.838)
1.354 (1.214-1.524)
0.2123 (0.1399-0.2456)
171.1 (153-197)
3 1.404 (0.250-3.167)
1.386 (1.214-1.595)
0.2139 (0.1523-0.2435)
173.9 (151-213)
4 1.330 (0.263-3.450)
1.387 (1.119-1.595)
0.2087 (0.1609-0.2492)
172.1 (149-199)
5 1.959 (0.390-7.250)
1.321 (1.190-1.571)
0.2124 (0.1663-0.2469)
170.7 (154-188)
* Position 1 = middle of cell bar, Position 5 = end of cell bar
** Data from queen bees 14 to 35 days of age
# Data from queen bees 7 to 35 days of age
Objective 8. Initial data on the numbers of sperm produced by mature age
drones from drone mother colonies providing drones at the time of mating of test
queen bees.
Of the 100 drones examined, 58 provided a sample of semen after manual eversion.
The mean number of sperm per drone was 6.45 x 10⁶ (ra. 0.5-10.7 x 10⁶).
Objective 9. Comparison of sperm counts between same aged sister queen bees
mated in mating apiaries of a commercial queen bee breeder and a commercial
honey producer.
There was no significant difference in mean number of sperm in spermathecae of
queens produced by the queen breeder (1.791, ra. 0.263-3.100 x 10⁶) and Honey
Producer B (2.057, ra. 0.375-5.400 x 10⁶).
81

Objective 10. Comparison of the number of sperm in the spermathecae of queen
bees caught from their mating nuclei at 7 and 14 day of age, and measured at 7 or
14 days of age, and at 16 and 17 weeks of age in sister queens.
The numbers of sperm in the spermathecae of different aged queens are shown in
Table 2.18. There was a significantly lower number of sperm in spermathecae of
queens caught at seven and 14 days old from their mating nuclei, compared with
sister queens caught 15 weeks after introduction into commercial honey hives.
Table 2.18. Comparison of the numbers of sperm in the spermathecae of queen bees examined either at 7 or 14 days of age, and sister queens examined 15 weeks after being introduced into established hives at either 7 or 14 days of age.
Age of queen when caught from mating
nucleus(days)
Age of queen when examined for
number of sperm in the spermatheca
Number of sister queens examined
Number of sperm10 6
mean (range)
7 7 days 20 0.06 (0.00-0.53)*
7 16 weeks 5 2.21 (1.13-4.43)*
14 14 days 20 1.60 (0.31-7.25)**
14 17 weeks 11 3.18 (1.04-4.40)**
* Significantly different from each other (P < 0.05)
** Significantly different from each other (P < 0.05)
Objective 11. Development of a short-term storage method for whole adult drone
bodies which would allow sperm counts to be carried out.
Both methods attempted resulted in the drone abdominal contents softening, with a
resultant inability to manually evert drones, because of softening of the body tissue .
They were, therefore, considered unsuitable for the collection of semen using manual
eversion as the collection method.
82
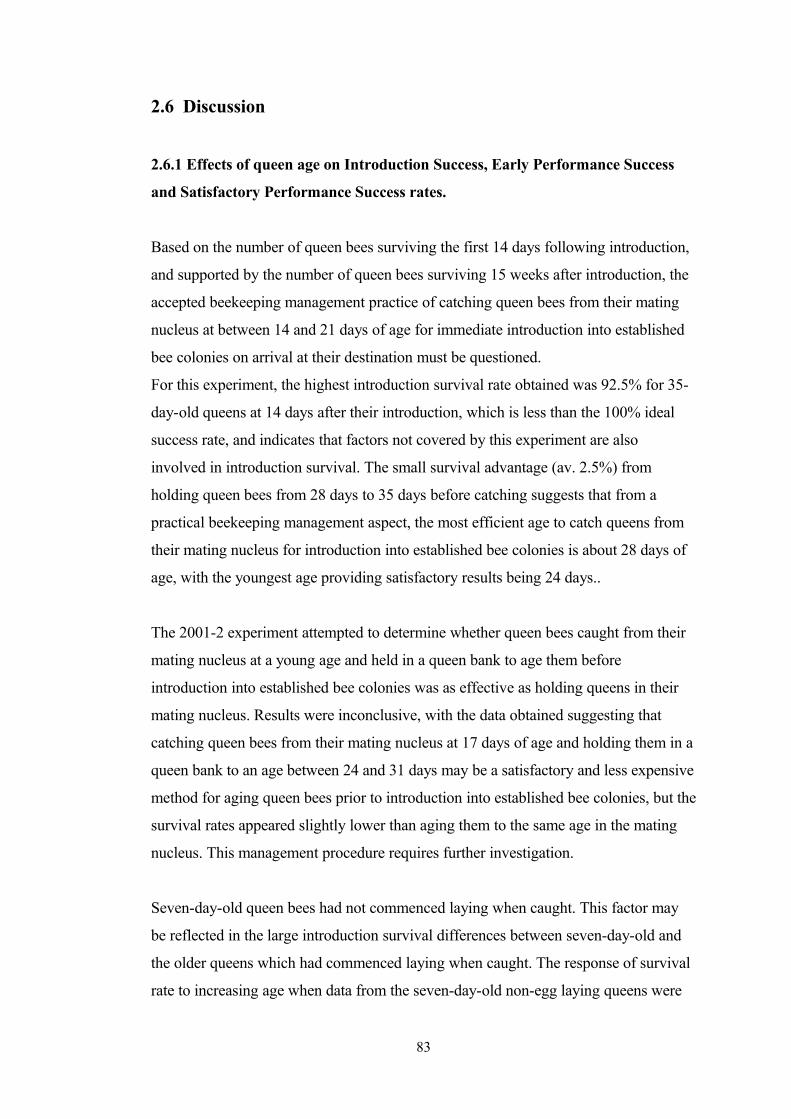
2.6 Discussion
2.6.1 Effects of queen age on Introduction Success, Early Performance Success
and Satisfactory Performance Success rates.
Based on the number of queen bees surviving the first 14 days following introduction,
and supported by the number of queen bees surviving 15 weeks after introduction, the
accepted beekeeping management practice of catching queen bees from their mating
nucleus at between 14 and 21 days of age for immediate introduction into established
bee colonies on arrival at their destination must be questioned.
For this experiment, the highest introduction survival rate obtained was 92.5% for 35-
day-old queens at 14 days after their introduction, which is less than the 100% ideal
success rate, and indicates that factors not covered by this experiment are also
involved in introduction survival. The small survival advantage (av. 2.5%) from
holding queen bees from 28 days to 35 days before catching suggests that from a
practical beekeeping management aspect, the most efficient age to catch queens from
their mating nucleus for introduction into established bee colonies is about 28 days of
age, with the youngest age providing satisfactory results being 24 days..
The 2001-2 experiment attempted to determine whether queen bees caught from their
mating nucleus at a young age and held in a queen bank to age them before
introduction into established bee colonies was as effective as holding queens in their
mating nucleus. Results were inconclusive, with the data obtained suggesting that
catching queen bees from their mating nucleus at 17 days of age and holding them in a
queen bank to an age between 24 and 31 days may be a satisfactory and less expensive
method for aging queen bees prior to introduction into established bee colonies, but the
survival rates appeared slightly lower than aging them to the same age in the mating
nucleus. This management procedure requires further investigation.
Seven-day-old queen bees had not commenced laying when caught. This factor may
be reflected in the large introduction survival differences between seven-day-old and
the older queens which had commenced laying when caught. The response of survival
rate to increasing age when data from the seven-day-old non-egg laying queens were
83
omitted is similar to the response obtained when data for egg-laying and non-egg-
laying queens were used, suggesting that increased survival can be attributed to
increased age and not whether the queens were laying or non-laying when caught prior
to shipping.
Under conditions of this experiment, the low survival rates 14 days after introduction
demonstrate that seven, 14 and 17 days are not satisfactory ages to catch queens for
introduction into established colonies. For queen bees caught from their mating
nucleus at 21 days of age, the survival rate 14 days after introduction averaged 82.5%
which was improved further to an average of 90% for queen bees caught at 28 days of
age. The benefits from increased numbers of queen bees surviving the introduction
process were retained with increased numbers of queens surviving 15 weeks after
introduction.
There were no significant differences between survival rates for queen bees of each
age group introduced into bee colonies at either Apiary A or Apiary B for the three
years data were collected (Tables 2.2, 2.3 and 2.4). This suggests that where
differences were found within or between groups of queens, then those differences
resulted from the effects of the factors being measured and not from indirect factors
associated with apiary management practices, climate effects, nutritional conditions,
apiary disease status etc., which can be expected to have impacted on the data
obtained.
The project identified a year effect on queen bee survival following introduction. Data
from the 1999-2000 season provided lower queen survival across all age groups of
queen bees (Table 2.2 and Figure 2.1). Queen bees used each year were sister queens
reared from related but different Instrumentally Inseminated (II) queen mothers.
Seasonal effects and genotypic differences between each year`s queens would have
contributed to the lower survival rate recorded in 1999-2000.
Test queen bees were reared at the same time and introduced over a number of weeks.
For each year`s test queens, rearing conditions were constant but introduction
conditions may have varied. There was no significant difference in survival rates
84
between queens introduced at the two climatically separated apiaries used each year,
suggesting that conditions at introduction had minimal effect on queen survival.
Beekeepers can expect an economic benefit from introducing queen bees that are 28
days of age or older. The benefit derives from reducing queen loss in colonies 15
weeks after introduction from 30.5% when queens were caught at 21 days to 21% for
queens caught at 28 days. Costs to the beekeeper when purchasing and introducing
young queens into bee colonies are relatively low when compared with benefits
provided from requeening (Mangum, 1997). Costs to the beekeeper when requeening
increase substantially when an introduced queen bee fails to be accepted, or is
superseded a short time after being accepted. Colony population can decline rapidly
during queen replacement and for several weeks afterwards (Tarpy et al., 2000).
Increased costs result from replacement queen costs, travel and labour costs involved
in requeening a colony in which queen removal was not controlled by the beekeeper,
and loss of colony population growth and production following an uncontrolled period
without a queen.
Improved survival benefits from introducing queen bees at an older age should
encourage beekeepers to select queen bees that are 28 days of age, or older, at
introduction in their requeening management programs.
2.6.2 The number of sperm in queen spermathecae
From the 1999-2000 data, a positive correlation was shown between increased queen
survival and increased sperm counts (Tables 2.2, 2.3 and 2.5) with data suggesting that
sperm counts of less than two million sperm per queen were associated with low
survival of queens following introduction into established honey production hives.
This result was not, however, supported by data from the 2000-1 and 2001-2
experiments. The 2000-1 data showed high queen survival (Tables 2.2 and 2.3) and
low sperm counts (Table 2.5), suggesting that the number of sperm in a queen`s
spermatheca is not an important factor for queen bee introduction success and survival
during the 15 weeks following introduction.
85

For the three years of results for this experiment, the percentages of queen bees
examined between 14 and 35 days of age which contained less than 3 million, and less
than 4.5 million sperm per queen are unacceptably high when compared with data and
statements contained in Jay and Dixon (1984), Harizanis and Gary (1984) and
Severson and Erickson (1989). Combined with the low overall average sperm counts
are the wide range of sperm counts associated with each age group of queen bees for
the three years queen bees were examined (Table 2.5).
The two factors of overall low sperm counts per queen, and a wide range of sperm
counts within each similar group of queen bees, suggest a problem during queen bee
mating, e.g. insufficient numbers and/or inadequate quality of drones present in the
mating area during mating of the examined queen bees.
A comparison of sperm numbers present in the spermathecae of queen bees which had
their wings either clipped at 14 days of age, or not clipped (Table 2.6) resulted in
clipped queens having higher, but not significantly higher, average sperm counts than
non-clipped queens. Only laying queens had their wings clipped which may have
inadvertently biased the results so that slightly older, or more mature queens, which
flew and mated earlier than their sister queens were selected.
Data from Tables 2.5 and 2.6 showed that queen bees are able to stop mating and
commence egg laying with low sperm numbers in their spermatheca. The reason for
this is not known and may be associated with (i) queen internal factors e.g. factors
associated with the mating process determine the amount of time available to the
queen from when it mates with the first drone until it has to cease the mating process
for physical (e.g. egg production) or physiological (e.g. behavioural) reasons; or (ii)
external factors e.g. insufficient drone numbers and/or inadequate drone quality to
complete mating and to provide queen bees with high average sperm counts at the
completion of mating.
Results from physical and disease prevalence characteristics measured (Tables 2.9 and
2.10) indicate that the physical qualities of queen bees examined in experiments for
Years 1-3 were of a high standard, suggesting the problem appears to be related to
86
drone factors rather than queen factors and requires further attention to identify the
correct sources of the problem.
2.6.3 Chemicals present in the mandibular and head glands of queen honey bees.
An examination of solvent extracts of freshly excised heads of queen bees revealed 12
volatile chemical constituents in significant amounts (> 0.05 µg/queen). There is
evidence that some of these constituents, such as 9-HDAA, are biosynthetic
intermediates (Plettner et al., 1996, 1998).
The blend of 12 constituents showed a wide range of levels between each constituent,
between same aged queens for each constituent, and between different aged queens for
each constituent. As well as HVA, the related 4-hydroxy-3-methoxyphenyl compound,
hydroferulic acid (HFA) was found in significant amounts in queens aged 7-35 days.
While the four additional constituents identified by Keeling et al. (2003) for the
pheromone blend eliciting retinue formation were not specifically evaluated in the
present survey, HFA was the only other 4-hydroxy-3-methoxyphenyl derivative that
could be quantified reliably (> 0.05 µg/queen) in the individual queen head extracts.
Free linolenic acid was not detected in these extracts.
Apart from linolenic acid reported by Keeling et al. (2003), relatively large quantities
of 9(Z)-octadecenoic acid (oleic acid) were detected in mandibular gland extracts of
young queens of A. mellifera carnica (Engels et al., 1997). Only trace amounts of
9(Z)-octadecenoic acid were found in the present study of individual head extracts of
A. mellifera, wheras significant quantities of glycerides were detected instead which
contained 9(Z)-octadecenoate as the major ligand. Since quantification of the chemical
blend has been restricted arbitrarily to those constituents that could contribute to the
vapour, the glycerides and other sparingly volatile constituents in the individual
extracts were not investigated further in the present survey. However, they may be
relevant since the glyceride glyceryl-1, 2-oleate-3-palmitate has been identified as a
brood pheromone of A. mellifera (Koeniger and Veith, 1983) and they are possible
biosynthetic progenitors of the C10 pheromonal constituents (Plettner et al., 1996,
1998).
87

When the means of the relative weight of each constituent are considered as a
proportion of the total weight for each queen (Table 2.8), as age increases a general
transition occurs with small reductions in the dominant constituents, 9-ODA, 9-HDA
and 10-HDA associated with small increases in the aromatics HVA, HFA and MHB
and in 7-HO and 8-HO. The total yields of chemical constituents from 14-day-old
queens were depressed (Table 2.8). Previous researchers have reported both a seasonal
cycle (Pain et al., 1974) and a circadian rhythm (Pain and Roger, 1978) in the 9-ODA
content of the heads of virgin A. mellifera queens. Depressed yields only from 14-day-
old queens may have resulted from the queen being confined in the mailing cage with
escort bees for a longer time than queen bees sampled at other ages: however, no exact
records were kept of queen confinement times in mailing cages. Slessor et al. (1990)
found that pheromone levels in queen mandibular glands are largely unaffected by
queen restraint with worker bees in a mailing cage. If depressed yields for 14-day-old
queens are a natural occurrence then this characteristic may contribute to the original
queen and the replacement queen surviving together for a short period of time
following supersedure.
The dominant chemical constituent was 9-ODA. It has been described as highly
attractive to drone bees and also is a key element in retinue formation (Blum, 1996;
Winston and Slessor, 1998). It can attract drones from up to 60m (Brockmann and
Brückner, 1998) and there is a specific receptor for 9-ODA present on drone antennae
(Engels et al., 1997). The relative proportion of 9-ODA in the blend was at its highest
in seven-day-old queens when mating had just commenced (Table 2.8). Furthermore,
9-HDA and 10-HDA are additional components of the sex pheromone blend of A.
mellifera (Brockmann et al., 2006).
A comparison of chemical constituent levels recorded from unmated and mated seven-
day-old queens showed a reduction in average levels indicating that the partially or
fully mated queen quickly develops a different chemical composition from that of an
unmated queen. For each age group the range of each chemical constituent was large.
A number of these compounds have been reported as pheromone components in a
variety of species, including honey bees (Keeling et al., 2003; Slessor et al., 2005) and
stingless bees (Francke et al., 2000), suggesting that some of the head chemical
constituents identified in this study are behaving as pheromone components.
88

Higher introduction survival rates associated with increased age of queens at
introduction and the differences in head chemical constituents with queen age recorded
in the current experiment, suggest there may be a relationship between queen survival
at introduction and head chemical constituent levels. HVA, HFA and MHB displayed
an increase in level with increasing queen age (Table 2.8). This suggests that some
chemicals and their levels may be involved in the introduction success of queen bees
less than 28 days into new colonies, with HVA being the important chemical for
increasing queen survival. This view appears to be consistent with Wossler et al.
(2006) who correlated the hostility of worker bees to introduced virgin queen bees of
A. mellifera capensis aged from 1-14 days with the levels of 9-ODA.
Several studies (e.g. Slessor et al. 1990, Pankiw et al. 1996, Plettner et al. 1997) have
reported similar head chemical constituents as those recorded in the current
investigation from similar aged queens, but the levels are different. For HVA, for
example, this experiment identified slightly higher levels for 6-7-day-old queens and
> 5 times higher levels for 35-day-old queens than Slessor et al. (1990). It also found
lower levels of the remaining chemicals than those reported by the above three
authors, in some cases substantial differences up to eight times lower were recorded.
For the current study, the primary extraction of each queen head was followed by a
second extraction which contained < 10% of amounts of the named chemical
constituents recovered in the primary extraction. Reasons for differences in the
amounts of the chemical constituents found here and those of other authors require
further investigation.
Unfortunately, the methodology required destructive sampling of queens, so temporal
data could not be collected for individual queens. In addition, the sample size of 20
queens, which was restricted because of cost, appeared in retrospect to be too small
because of the large variation in chemical constituents between individual queen bees
at each age. These two factors limited any further conclusions being drawn.
89

2.6.4 Physical characteristics and disease status of queen bees and hive bees as a
measure of queen quality.
Number of ovarioles.
The lower number of ovarioles in seven-day-old queen bees (Table 2.9) may be
explained by their incomplete development and, thus, the difficulty in observing and
counting them at that age of bee. In Year 1 (1999-2000), queens seven days old had
significantly fewer ovarioles than all other ages, whereas queens 28 days old had
significantly higher mean number of ovarioles than all other ages. In 2000-1, queens
aged seven and 28 days had a similar number, but less ovarioles than queens 14 and 21
days old. In 2001-2, 31-day-old queens from mating nucleus hives had significantly
fewer ovarioles than those 17 and 14 days old from the same source. Queens 24 days
old from queen banks had significantly fewer ovarioles than same age queens from
mating nucleus hives. However, this difference was not evident for 31-day-old queens.
The reason(s) for the variations in ovariole numbers between queens of different ages,
and queens from queen banks having significantly fewer ovarioles than queens held in
their mating nucleus are not known. Queens were reared from genetically similar
queen mothers, non-genetic factors affecting queen numbers include the impacts of
pathogens, chemical contamination and other factors at the late larval stage when final
ovariole number is determined (Jackson et al., 2011). Queens stored in queen banks
were laying queens caught from their mating nucleus at 17 days of age when it could
be expected that their ovariole number had been determined (Jackson et al., 2011).
In general, data on the number of ovarioles per ovary in queen bees used in these
experiments equalled or were better than similar data accepted as being of a suitable
standard from a number of overseas sources (e.g. Woyke, 1971; Orosi-Pal quoted in
Ruttner, 1983; Casagrande-Ialoretto et al., 1984; Van Eaton, 1986).
These results are indicative of the queen bee breeder producing queen bees of high
quality for these experiments for all Years 1 to 3, and suggest that unsatisfactory
results for queen bee survival rates and number of sperm in queen spermathecae after
90

mating, have probably resulted from factors other than those associated with queen bee
production.
Queen body weight; spermatheca diameter; and presence or absence of semen in
the oviducts.
In the 2000-1 investigation, the seven-day-old bees weighed significantly less than all
other aged queens. This can probably be explained by the fact that these samples
containing mainly unmated queens, whereas queens 14 days and older were all mated.
This view was supported by the data from the following year, in which there was no
difference in weight between mated queens ≥ 17 days of age.
In addition, in the 2001-2 investigation, queens removed from queen banks after seven
and 14 days weighed significantly less than queens removed from mating nuclei. It is
suspected that this was a temporary weight loss associated with a lower nutritional
regime for queen bees stored in queen banks. Queen weights for 14- to 35-day-old
queen bees in this experiment ranged between 0.197-0.226 g which is comparable
with overseas data (Woyke, 1971; Nelson and Gary, 1983; Van Eaton, 1986; Delaney,
2010).
There was no consistent relationship between queen age and spermatheca diameter.
Significant differences were identified for spermatheca diameter between queen bees
examined at different ages for the 2000-1 and 2001-2 experiments (Table 2.10). A
difference in the ages of larvae when grafted may have contributed to the differences
between the cohorts of adult queen bees from the 2000-1 and 2001-2 experiments.
Another possible reason is that different breeder queens may have been used to supply
the queens for examination in the different years. Spermatheca diameters from queen
bees 7-35 days of age used in these experiments ranged between 1.235-1.380 mm,
which compared well with overseas data (Woyke, 1971; Van Eaton, 1986).
Presence of semen in oviducts
During the 2000-2 and 2001-3 experiments, oviducts of queen bees were examined for
semen residues to provide initial data on the prevalence of semen retention in queen
91
oviducts in naturally mated queen bees. As previously discussed, semen retention may
be regarded as an indirect measure of queen quality, and semen residues may be a
factor contributing to reduced survival of young queen bees.
For queen bees aged between 7-17 days, semen residue in oviducts could be expected
to result from queen bees mating in the 24 hours previous to when they were
examined. For queen bees older than 17 days when examined, semen residue in
oviducts may indicate a queen problem (i.e. an inability of the queen to clear its
oviducts of semen for an unknown reason), or it may indicate a drone problem (e.g.
age effects or seasonal effects on drones providing semen in the area available for
mating with the queen bee).
Data obtained in these experiments are of interest as they show that semen residue in
oviducts was observed in queen bees up to 31 days of age and its presence in 11.5 %
of queens examined at 21-31 days of age indicates that its occurrence is not
uncommon. This result suggests that this problem is most likely to be drone-related.
Presence of disease and its effect on queen quality
Nosema disease present in bee colonies used for the production of queen bees, or in
the bee colonies into which queen bees are introduced, is often considered as a
possible cause for poor queen bee introduction or performance success.
For the 1999-2000, 2000-1 and 2001-2 experiments, very low numbers (3/360) of
queen bees supplied to the project by the queen bee breeder contained measurable
levels of nosema spores. Samples of worker bees from mating nuclei and the queen
bank used in 2001-2 resulted in relatively low numbers of nosema spores present.
Commercial honey production hives in the two field apiaries, Apiary A and Apiary B,
which received the test queen bees during the 2000-1 and 2001-2 seasons also
recorded relatively low nosema spore counts. These data suggest that nosema disease
did not have a measurable effect on the introduction success and early performance of
queen bees used in these experiments
92

Brood diseases, either light or heavy infections in colonies that young queen bees are
being introduced into, are considered by some beekeepers to be a contributing factor
towards low introduction success rates and poor early performance of young, healthy
queen bees. The relatively low brood disease levels in honey production colonies at
the dates of queen introduction, combined with the data showing there was no
significant difference between introduction success and early performance success
rates between queen bees introduced into either Apiary A or Apiary B (Tables 2.2, 2.3
and 2.4), suggest that there were no measurable effects of brood diseases on survival
and performance data obtained in these experiments.
Other factors influencing queen introduction and early performance success
Indirect factors such as climate, foraging conditions, and beekeeper management at the
time of queen introduction, are also considered to affect introduction and early
performance success rates of young queen bees.
Records of climate and foraging conditions maintained at the times queen
introductions were carried out for the three years of experiments did not indicate
extremes or problem areas which may have impacted on the results. The absence of
differences between survival and performance rates for queen bees introduced into
Apiary A and Apiary B for each of the three years of experiments, with each apiary
being managed by a different commercial beekeeper and in different parts of New
South Wales, indicates that climate and foraging conditions, and beekeeper
management practices, did not have a measurable effect on the introduction and
performance results obtained.
Another (but direct) factor investigated was the effect of queen transport. Damage to
queen bees during transport between apiaries of the queen bee breeder and apiaries of
the beekeeper honey producer was examined for each of the three years of these
experiments. Queen bees may be damaged directly and arrive dead or visually injured,
or suffer indirect damage and arrive in an apparent healthy condition with the effect of
the damage not becoming apparent until a later time.
93
Over the three years data were recorded for these experiments, extremes of
temperatures were -2.5 to 33.1°C, and relative humidities were 26.7 to 88.4%. Small
numbers of queen bees (2/300) and escort worker bees (26/800) arrived dead
following transport. Combined with a non-significant difference between survival
rates 14 days after introduction for queen bees received at Apiaries A and B, these data
indicate that the conditions experienced by queen bees during transport had little or no
effect on their survival and performance success rates following introduction into
established honey production hives.
The position of the cell cup on the cell bar during the queen larval feeding and
development stages in the cell raising colony was also shown to not have a significant
effect on queen survival rates 15 weeks after introduction, nor on the number of sperm
in the spermatheca, spermatheca diameter, queen body weight and the number of
ovarioles in one (the left) ovary of adult queen bees
The ce ll rearing colonies used to provide queen bees for this experiment were not
inspected by myself, however, these data suggest careful management by the queen
bee breeder in the current investigations by providing well fed, strongly populated cell
raising colonies. Different results may be expected to occur from queen bees raised
under conditions of nutritional stress and reduced worker bee population numbers in
the cell raising colonies.
The fact that no significant difference was found between sperm counts in the
spermathecae of same-aged sister queen bees mated at either the queen bee breeder`s
mating apiary or at a queen mating apiary established by the beekeeper owner of
Apiary B, but that both sets of queens had low sperm numbers in their spermathecae,
indicates that the queen bees had ceased the mating process and commenced egg
laying even though it is probable that their spermathecae were not filled to capacity
with sperm.
A lower sperm count number would have been expected in the spermathecae of queen
bees mated at the queen bee breeder`s mating apiary, should the larger number of
queen bees being mated at the queen bee breeder`s mating apiary compared to the
smaller number of queens at the beekeepers’ mating apiary have been a factor
94
affecting sperm numbers. This implies that the likely problem is related to the mating
process (i.e. the number and quality of drones available) rather that queen quality.
In this regard, the preliminary investigation conducted on drone quality, specifically
sperm production, showed that only 58% of 24-day-old drones were able to be
manually everted and provided a measurable semen sample (> 0.1 µL). Mean sperm
numbers from these drones (6.45 x 10⁶) were at acceptable levels, but at the lower end,
of the published data at that time.
The result that 42 % of drones produced no measurable semen sample and of those
drones that did 16 % produced less than 5 x 10⁶ sperm was of concern due to: (i) the
drones sampled were expected to represent drones at their peak condition, i.e. mature
age and reared under good climate and nutritional conditions; (ii) the high number of
drones with low sperm counts were not physically distinguishable externally from
drones containing suitable numbers of sperm and (iii) the possible inadequacies of
adult drone sampling and semen collection methodology (e.g. manual eversion) used
in this experiment and their effects on the results are not known.
In conclusion, the results reported in this chapter suggested early failure of queens
appeared to be unrelated to queen factors per se, and were more reflective of either
drone quality or the mating process. This meant that management of drone mother
colonies, including means for determining numbers of viable drones present in drone
production colonies, required further attention. The following chapters report on the
subsequent investigations on drone quality.
2.7 Conclusions
1. The youngest effective age for queens used to requeen established bee colonies is 24
days.
2. Commercially reared queen bees in eastern Australia are reared to a high physical
standard to the unmated stage.
95
3. Overall results suggest a major problem with the queen mating process.
4. Selection and evaluation of queens to head drone mother colonies requires attention.
96

CHAPTER 3
General Materials and Methods for Drone Studies
3.1 Introduction
Results from Chapter 2 on studies of commercially reared queen bees showed queen
bees reared to the unmated stage of the rearing process to be of a high standard. These
data suggest that failures of commercially reared queen bees at a young age may be
due to problems with the mating process, either with insufficient numbers of drones
and/or drones of inadequate quality being available to mate with the queen bees at the
mating apiary. This Chapter describes the materials and methods that were used in
Chapters 4 and 5. Specific materials and methods relating to individual experiments
are included in the relevant chapter section.
3.2 Determination of drone sample size
At the commencement of the drone component of the project in 2003, when
developing methodology for collecting data, it was necessary to determine the
minimum sample size for the number of drones to be examined to provide statistically
sound data on the number of sperm produced per drone. The following describes how
the minimum sample size was determined.
Drones were reared by two commercial queen breeders located within the same
district (Hawkesbury, NSW) and approximately 3 km from the UWS site: Queen
breeder A (Ms Gretchen Wheen, Richmond NSW, -33.598°, 150.753°) and Queen
breeder B (Mr Frank Malfroy, Freemens Reach, -33.558°, 150.796°). Drone honey
bees similar to Apis mellifera ligustica were obtained from open mated daughter queen
bees of instrumentally inseminated breeder queen bees. Queen breeder A supplied 100
drone honey bees which were marked on emergence and caught at 16 days old, when
they were considered to have matured. Queen breeder B provided seven drones which
were examined at 16 days old.
97

Examination of drones and collection of data were carried out in the laboratory of Ms
G. Wheen. The number of sperm produced by each drone was determined by manually
everting the drone and collecting semen released on to the endophallus in a Schley II
(instrumental insemination) apparatus (Cobey and Schley, 2002). The complete
volume of semen was diluted in a constant volume (1.5 mL) of Tris buffer (see Table
3.1).
The number of sperm present in each sample was determined using an Improved
Neubauer haemocytometer (depth 0.1mm, volume 1/400 mm2 ) by counting the
number of sperm present in the 16 small squares in each of the four corners and the
central group of 16 small squares (total 5 x 16 = 80 small squares) at one end of the
haemocytometer. Fresh samples of diluted semen were placed on each end of the
haemocytometer five times for each drone, providing ten (5 x 2) counts for each drone.
The number of sperm/drone was then determined from the formula:
Number of sperm/drone (million) = total number of sperm counted in the 10 cells x 25
x 10 000
Sixty drones from Queen breeder A and six drones from Queen breeder B provided
semen. A comparison between results from drones from Queen breeder A and Queen
breeder B found no significant difference (P < 0.05) between the two samples. There
was a large mean standard error for Queen breeder B because of the small sample size.
Queen breeder A: sample size 60 drones. Mean 2.59 x 10⁶ sperm per drone, S.E. 0.04.
Queen breeder B: sample size 6 drones. Mean 2.09 x 10⁶ sperm per drone, S.E. 0.29.
There were 41 drones that did not provide semen. The variance in sperm numbers for
these 106 drones was 12.13 and this was used to calculate sample sizes methodology
described by Dobson (1984). The formula for the sample size (n) is:
n = (s2 ÷ Δ2 ) x f (1- α)
where s2 is the variance (12.13). Δ is the desired confidence interval for α = 0.05 and f
(0.95) = 3.842. Choosing a desirable confidence interval of 1.25 x 10⁶ sperm gives a
value of n = 30 for the required sample size. Halving the desired confidence interval
would mean a quadrupling of the sampling size required with the choice of 30 giving
98

reasonable accuracy while not being prohibitive in terms of resources required. As a
result, a sample size of 30 drones was chosen for subsequent work, as it provided the
lowest number of drones to be examined with the required level of accuracy.
3. 3 Rearing and sampling drone honey bees
To achieve the aims of the following investigations by examining bee semen from
drone honey bees from an identified breeding line, of a known age, and reared to
represent drones from a known season, it was necessary to establish methods for
rearing the drones, sampling sufficient numbers of drones on the dates required, and
delivering those drones to the laboratory in a healthy condition for further
examination.
Two factors: drone confinement and nutrition, required early attention as they could be
perceived as flaws in the methodology for rearing drones:
(i) Whether to use confinement in hives or allow free flight of drones during the period
of rearing them to their required age. Free flight is, of course, the natural condition and
has been described as being beneficial in drone maturation preparedness: this topic has
been discussed in Chapter 1.
A pilot experiment conducted to rear drones, which allowed free flight, resulted in
insufficient numbers of drones present in their original hives on the dates required to
be caught. However, marked drones were found in other hives in the same apiary and
in different apiaries, indicating there was major drone drift. Thus, the decision was
taken to confine the drones within their original hive for the length of each experiment.
(ii) Nutrition has been shown to be an important factor in drone development and
maturation; this has been discussed in Chapter 1. The nutritional value of pollens from
different plant species varies (Somerville, 2004), because foraging bees from different
colonies in the same apiary may forage in different areas and collect different pollens,
and because different colonies may have different numbers of foraging bees in the
field due to their relative strengths. It can, therefore, be expected that the pollen and
99

nectar being brought into each colony on a daily basis may vary in nutritional quality
and quantity.
To overcome any differences in the nutritional status of individual bee colonies in the
investigations resulting from variation in the availability of pollen from different plant
species, and differences in the amounts of nectar collected, each colony rearing and
holding drone bees for these experiments was fed with an assured source of high
nutrition pollen and a sugar/water syrup (see Section 3.3.4).
3.3.1 Breeding lines
Due to a lack of a recorded pedigree system within Australian commercial bee
breeding programs, commercial breeders of queen bees who supply the beekeeping
industry in Victoria (Vic.), New South Wales (NSW) and Queensland (Qld.), in
eastern Australia, were questioned with regard to the sources of their breeding stock.
For all experiments involving comparison of data between breeding lines, four queen
bee breeders were selected to provide queen bees to the project, based on the un-
relatedness of their breeding stock. Each queen bee breeder supplied four open-mated
sister queens from an instrumentally inseminated breeder queen mother of the Italian
race and considered to be predominantly A.m.ligustica.
3.3.2. Location of the experimental work
The four queen bees from each of the four queen bee breeders were introduced into 16
hives provided from the University of Western Sydney`s research apiary, Richmond,
NSW. For purposes of experimentation or building colony strength the apiary was
sited at the property of Ms Gretchen Wheen, Old Kurrajong Rd., Richmond, NSW
2753 (approximately 2 km from the University of Western Sydney, -33.599, 150.762),
at the Bathurst Agricultural Research and Advisory Station, Research Station Drive,
Bathurst, NSW 2795 (-33.420, 149.574), or at the Tamworth Agricultural Institute,
Marsden Park Rd., Calala, NSW 2340. (-31.132, 150.922) (Figure 3.1).
100

Figure 3.1. Research apiary situated on G. Wheen`s property, Richmond, NSW.
3.3.3 Experimental bee hives
Experimental bee colonies were housed in two-storey, Langstroth, full-depth hives,
with nine frames in the brood chamber and eight frames and an internal frame-type
sugar syrup feeder holding 1 L of syrup replacing the wall frame in the honey super.
Plastic Petri dishes, 90 mm diameter, were placed on the top bars of each super for
feeding powdered pollen (Figure 3.2). Hives of good strength were selected, on the
basis of their brood chambers full of bees and a minimum of half to three-quarters of
the honey super frames covered with bees. Adequate stores of pollen and honey were
present in each hive. Hives were fitted with a wire queen bee excluder between the
bottom board and brood chamber, and a plastic queen bee excluder between the brood
chamber and super to confine drones. Hives in good material condition with Emlock
hive fasteners (John L Guilfoyle Pty Ltd, Werrington NSW) were selected to prevent
the escape of drones. Flat bottom boards and ventilated migratory lids were also used.
An internal hive device containing diatomaceous earth was used to control adult small
hive beetles, Aethina tumida, (Rhodes, 2008) when the apiary was at Richmond, which
is an identified small hive beetle area (Gillespie et al., 2003).
101
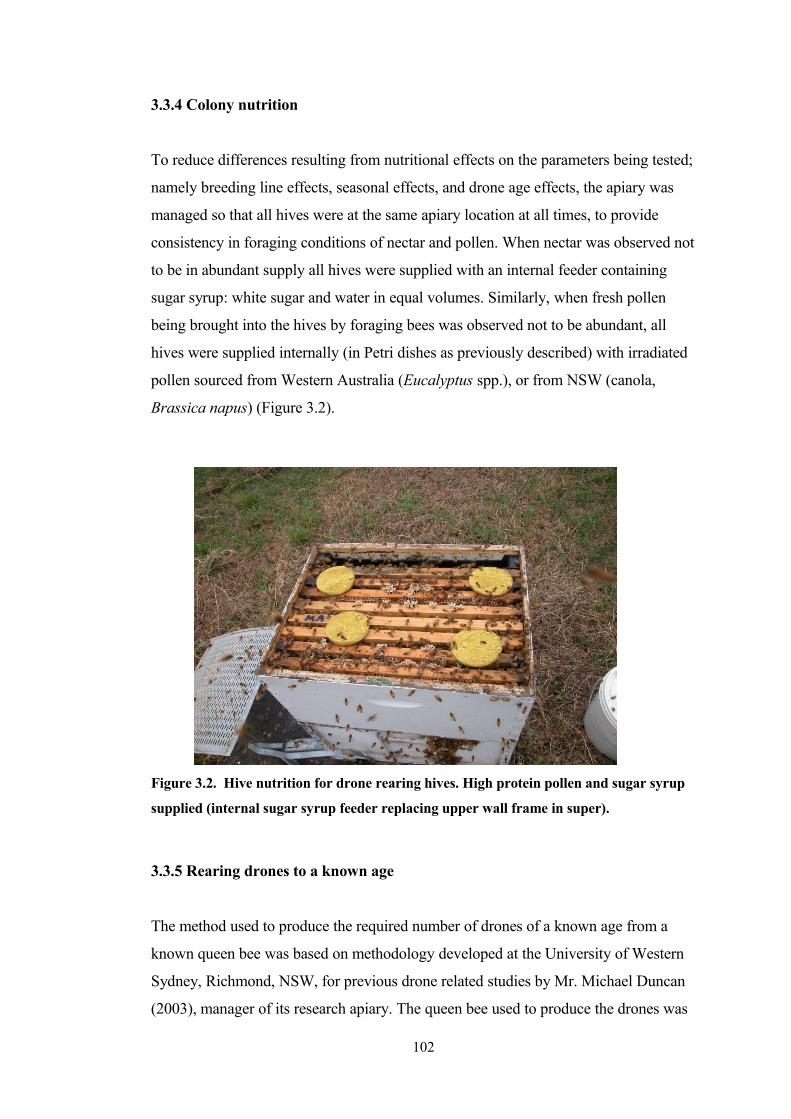
3.3.4 Colony nutrition
To reduce differences resulting from nutritional effects on the parameters being tested;
namely breeding line effects, seasonal effects, and drone age effects, the apiary was
managed so that all hives were at the same apiary location at all times, to provide
consistency in foraging conditions of nectar and pollen. When nectar was observed not
to be in abundant supply all hives were supplied with an internal feeder containing
sugar syrup: white sugar and water in equal volumes. Similarly, when fresh pollen
being brought into the hives by foraging bees was observed not to be abundant, all
hives were supplied internally (in Petri dishes as previously described) with irradiated
pollen sourced from Western Australia (Eucalyptus spp.), or from NSW (canola,
Brassica napus) (Figure 3.2).
Figure 3.2. Hive nutrition for drone rearing hives. High protein pollen and sugar syrup
supplied (internal sugar syrup feeder replacing upper wall frame in super).
3.3.5 Rearing drones to a known age
The method used to produce the required number of drones of a known age from a
known queen bee was based on methodology developed at the University of Western
Sydney, Richmond, NSW, for previous drone related studies by Mr. Michael Duncan
(2003), manager of its research apiary. The queen bee used to produce the drones was
102

placed on a full-depth frame of drone comb (drone bee cell diam. av. 6.4 mm, worker
bee cell diam. av. 5.1 mm), inside a one-frame cage constructed from wire queen
excluder with a bee-proof metal lid. The queen excluder cage comprised wire bars
spaced 4 mm apart, which allowed entry by worker bees to feed and maintain the
queen bee and her brood but prevented queen bees and drones with their larger body
sizes from entering or exiting (Figure 3.3). The cage with the queen inside on the
drone comb was placed in the middle of the brood chamber frames of the hive from
which the queen came; the two outside brood chamber frames were removed
temporarily to provide room for the cage. The cage was removed from the hive after
24 hours, the queen was released into the hive. The frame of drone comb containing
eggs was placed in the middle of the frames in the brood chamber, and one outside
frame was replaced to provide nine frames in the brood chamber. Colonies were fed
sugar syrup and powdered pollen throughout the drone rearing process.
Eighteen days after the frame of drone comb was removed from the cage, it was
replaced in the cage which was placed in the centre of the brood chamber frames.
Drones began emerging from the sealed drone cells about four days later. One day
after drones began emerging, the frame of sealed cells and newly emerged drones were
removed from the cage, taken to a protected area in the apiary and the newly emerged
drones were marked on the thorax with a water-based Posca® marking pen (Figure
3.4). Different colours were used for different breeding lines. Marked drones were
returned to the brood chamber of the hive in which they were reared and confined
there by queen excluders above and below the brood chamber. Marked bees were,
thus, of a known age with an error of + 24 hours.
103
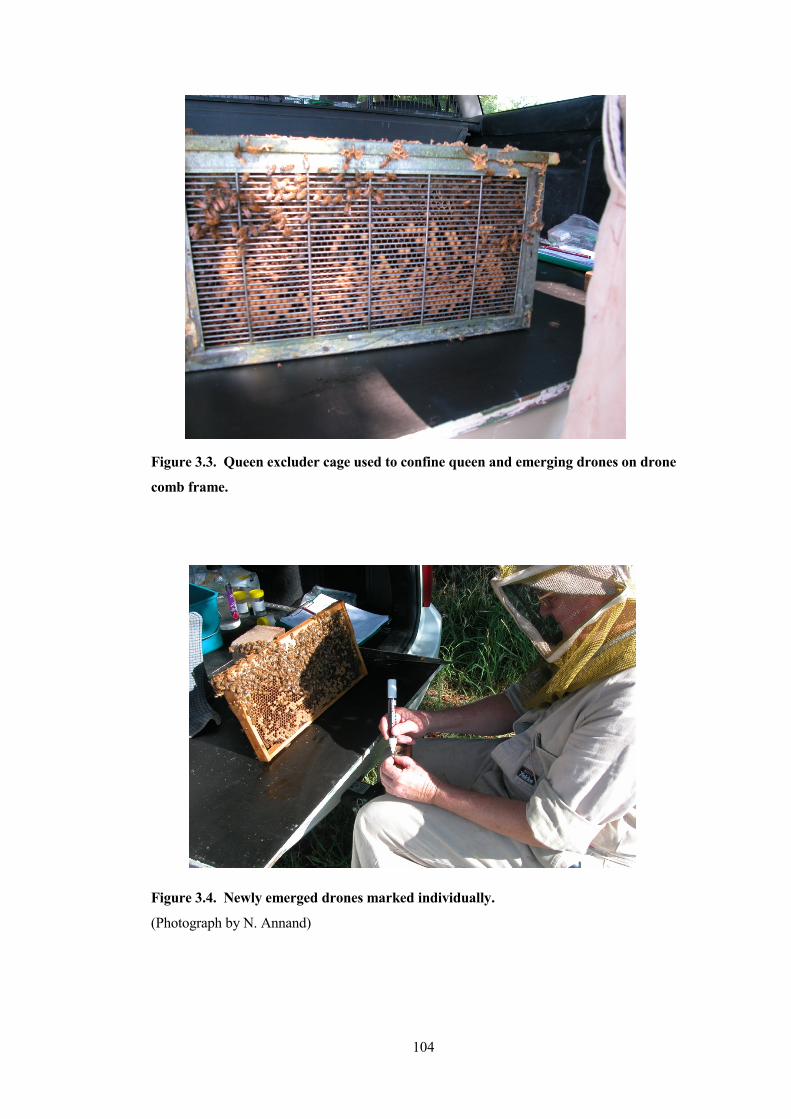
Figure 3.3. Queen excluder cage used to confine queen and emerging drones on drone
comb frame.
Figure 3.4. Newly emerged drones marked individually.
(Photograph by N. Annand)
104
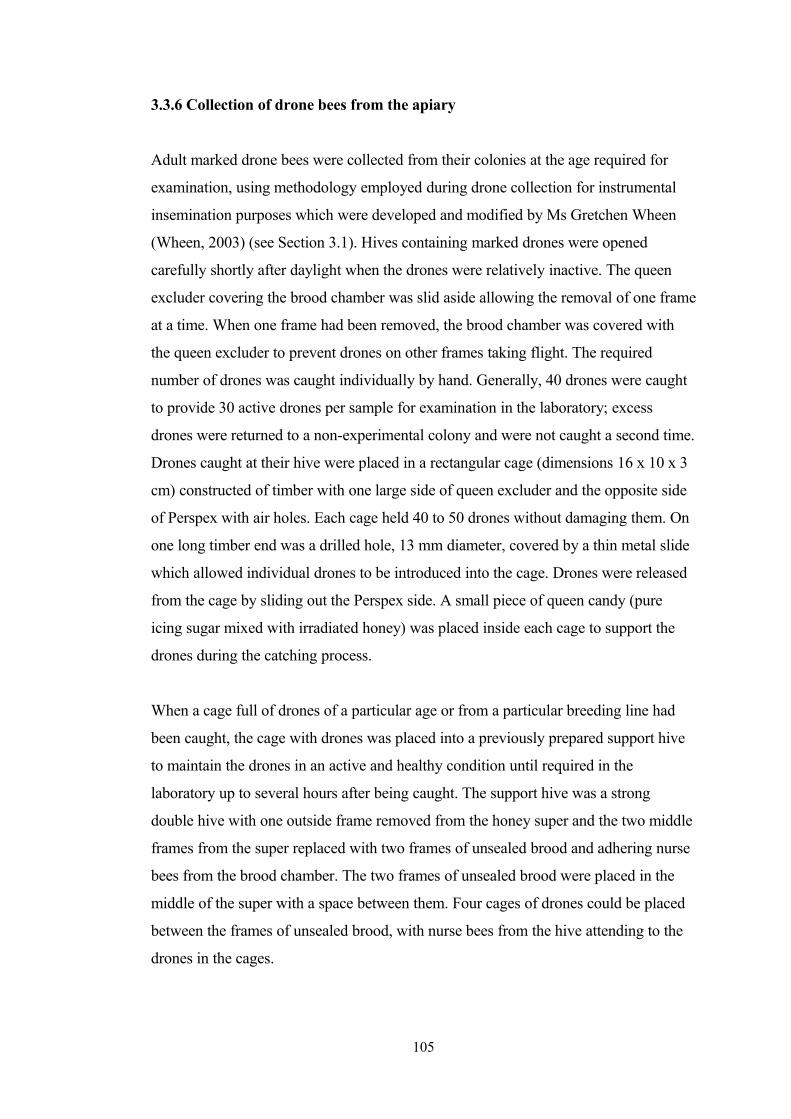
3.3.6 Collection of drone bees from the apiary
Adult marked drone bees were collected from their colonies at the age required for
examination, using methodology employed during drone collection for instrumental
insemination purposes which were developed and modified by Ms Gretchen Wheen
(Wheen, 2003) (see Section 3.1). Hives containing marked drones were opened
carefully shortly after daylight when the drones were relatively inactive. The queen
excluder covering the brood chamber was slid aside allowing the removal of one frame
at a time. When one frame had been removed, the brood chamber was covered with
the queen excluder to prevent drones on other frames taking flight. The required
number of drones was caught individually by hand. Generally, 40 drones were caught
to provide 30 active drones per sample for examination in the laboratory; excess
drones were returned to a non-experimental colony and were not caught a second time.
Drones caught at their hive were placed in a rectangular cage (dimensions 16 x 10 x 3
cm) constructed of timber with one large side of queen excluder and the opposite side
of Perspex with air holes. Each cage held 40 to 50 drones without damaging them. On
one long timber end was a drilled hole, 13 mm diameter, covered by a thin metal slide
which allowed individual drones to be introduced into the cage. Drones were released
from the cage by sliding out the Perspex side. A small piece of queen candy (pure
icing sugar mixed with irradiated honey) was placed inside each cage to support the
drones during the catching process.
When a cage full of drones of a particular age or from a particular breeding line had
been caught, the cage with drones was placed into a previously prepared support hive
to maintain the drones in an active and healthy condition until required in the
laboratory up to several hours after being caught. The support hive was a strong
double hive with one outside frame removed from the honey super and the two middle
frames from the super replaced with two frames of unsealed brood and adhering nurse
bees from the brood chamber. The two frames of unsealed brood were placed in the
middle of the super with a space between them. Four cages of drones could be placed
between the frames of unsealed brood, with nurse bees from the hive attending to the
drones in the cages.
105

3.3.7 Laboratory collection of data
1. Location of laboratories
For all experiments, with the exception of sperm viability assessment, drones
providing the sample were reared in an apiary maintained on the same premises at
which the laboratory was situated. At Richmond, drones were reared in an apiary
situated on the property of Ms G. Wheen, with semen samples collected and data on
semen volume, number of sperm per drone and sperm motility rating per drone
determined in the instrumental insemination laboratory maintained by Ms Wheen.
Semen samples examined for sperm viability were collected at Ms Wheen`s laboratory
and taken to the laboratory of Ms Liz Kabanoff, University of Western Sydney, 2 km
from Ms Wheen`s laboratory, within 30 minutes of collection. Experiments on sperm
release after manual eversion were carried out at the NSW Department of Primary
Industries Entomology Laboratory, Tamworth, with the drone rearing apiary located
on the research station.
2. Maintenance of drones
A cage of drones was removed from the support hive (see Section 3.3.6) and taken to
the laboratory where they were released into a flight cage (dimensions 40 x 30 x 30
cm) with one end covered in flywire gauze and facing a table lamp. Drones were
attracted to fly to the light, and defaecated during flight. Inside the flight cage was
placed a small cage (dimensions 16 x 10 x 3 cm) with 3 mm gauze mesh on one side, a
plug of queen candy, and containing 50-100 nurse bees collected each morning from
frames of unsealed brood from a support hive. The cage was placed gauze side
uppermost. Drones released into the flight cage were attracted to settle on the gauze
and were fed by the nurse bees in the cage. This provided active drones throughout the
period of examination.
106

3. Sample size
For the major experiments, a sample size of 30 drones was used (see Section 3.2), with
the exception that when 30 drones were not available the number of drones available
up to 30 drones was used.
4. Manual eversion of drones
Collection of semen samples and measurement of semen volume per drone were
carried out by Ms G. Wheen, a highly skilled and leading instrumental insemination
expert in the Australian beekeeping industry. Drones were caught from the flight cage
and stimulated to ejaculate using manual eversion, which involved putting vertical
pressure on the drone`s thorax with the thumb and first finger of one hand and then
placing horizontal pressure on the drone`s abdomen with the thumb and first finger of
the second hand. Pressure was commenced at the anterior end of the abdomen, and
proceeded towards the posterior end. When successful, this resulted in full eversion of
the endophallus with a film of semen on top of a ball of mucous at the posterior tip of
the endophallus. Partial eversion with no semen released was achieved for a significant
percent of drones, which led to further investigation of this factor (Figure 3.5).
A. B.
Figure 3.5. (A) Fully everted drone endophallus with mucous and semen released.
(B) Partially everted drone endophallus with no mucous or semen released.
(Photograph by G.Wheen)
107
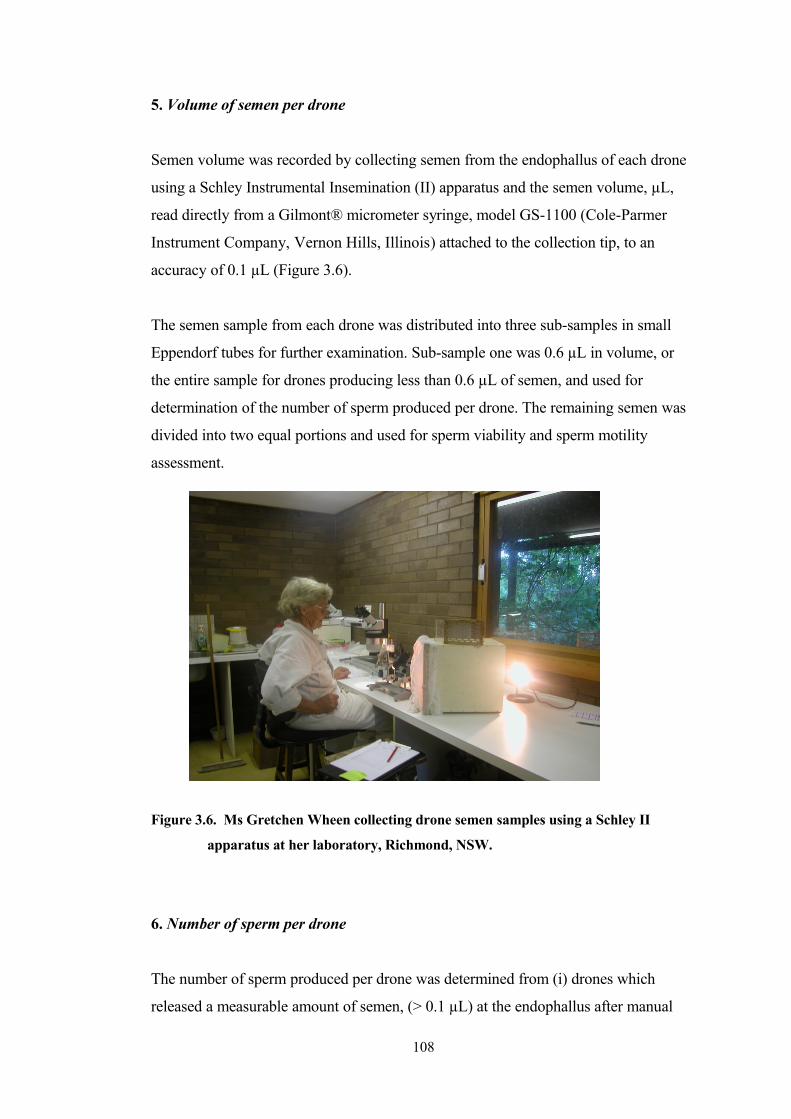
5. Volume of semen per drone
Semen volume was recorded by collecting semen from the endophallus of each drone
using a Schley Instrumental Insemination (II) apparatus and the semen volume, µL,
read directly from a Gilmont® micrometer syringe, model GS-1100 (Cole-Parmer
Instrument Company, Vernon Hills, Illinois) attached to the collection tip, to an
accuracy of 0.1 µL (Figure 3.6).
The semen sample from each drone was distributed into three sub-samples in small
Eppendorf tubes for further examination. Sub-sample one was 0.6 µL in volume, or
the entire sample for drones producing less than 0.6 µL of semen, and used for
determination of the number of sperm produced per drone. The remaining semen was
divided into two equal portions and used for sperm viability and sperm motility
assessment.
Figure 3.6. Ms Gretchen Wheen collecting drone semen samples using a Schley II
apparatus at her laboratory, Richmond, NSW.
6. Number of sperm per drone
The number of sperm produced per drone was determined from (i) drones which
released a measurable amount of semen, (> 0.1 µL) at the endophallus after manual
108
eversion and was collected in a Schley II syringe or (ii) from the dissected seminal
vesicles and from the dissected partially or fully extended endophallus of drones after
manual eversion, where the dissected material was placed into the dilutant.
For semen collected in the Schley II syringe, the 0.6 µL sub-sample was used to
calculate the number of sperm per drone by diluting 0.6 µL semen in 0.5 mL Tris
buffer, mixing, and adding a further 1.0 mL Tris buffer and mixing, with a dilution
rate of 0.6 µL semen in 1.5 mL Tris buffer. The formula for Tris buffer is given in
Table 3.1. The dilution rate was calculated as 1.5 x 10⁻³ divided by 0.6 x 10-6 = 2500.
The number of sperm present was counted in five squares, each square containing
sixteen smaller squares at one end of a haemocytometer, the procedure being repeated
five times for each drone. The haemocytometer was an Improved Neubauer, BS.748,
depth 0.1 mm, 1/400 mm2. The number of sperm per drone (million) was calculated
as:
Total number of sperm counted in 25 squares x semen volume (µL) x 25000 (dilution
rate x 10).
For semen present in a dissected endophallus or in seminal vesicles, the dissected
material was placed in 0.5 mL water and macerated with a mortar and pestle. The
number of sperm per drone was calculated by counting the number of sperm present in
ten squares (each square containing 16 small squares) of the same Improved Neubauer,
haemocytometer used for syringe samples. The total number of sperm present in the
material being examined was calculated using the formulae in Nguyen (1995):
Number of sperm per drone = number of sperm in 10 counted squares x 25 x 10 000
Where 25 = the multiplier to convert the volume of semen solution in 10 counted
squares to one mm³ (10 counted squares contain 1/25 mm3).
10 000 = the volume (in mm3 ) of 10 mL of semen solution.
109
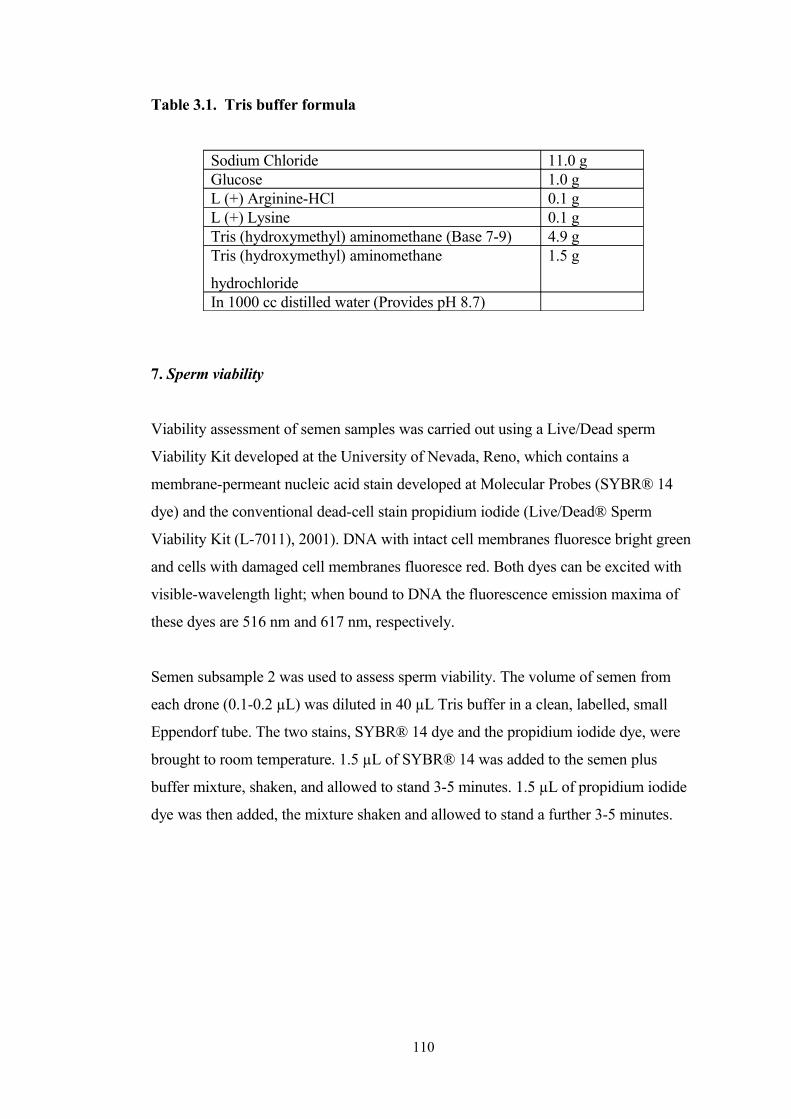
Table 3.1. Tris buffer formula
Sodium Chloride 11.0 gGlucose 1.0 gL (+) Arginine-HCl 0.1 gL (+) Lysine 0.1 gTris (hydroxymethyl) aminomethane (Base 7-9) 4.9 gTris (hydroxymethyl) aminomethane
hydrochloride
1.5 g
In 1000 cc distilled water (Provides pH 8.7)
7. Sperm viability
Viability assessment of semen samples was carried out using a Live/Dead sperm
Viability Kit developed at the University of Nevada, Reno, which contains a
membrane-permeant nucleic acid stain developed at Molecular Probes (SYBR® 14
dye) and the conventional dead-cell stain propidium iodide (Live/Dead® Sperm
Viability Kit (L-7011), 2001). DNA with intact cell membranes fluoresce bright green
and cells with damaged cell membranes fluoresce red. Both dyes can be excited with
visible-wavelength light; when bound to DNA the fluorescence emission maxima of
these dyes are 516 nm and 617 nm, respectively.
Semen subsample 2 was used to assess sperm viability. The volume of semen from
each drone (0.1-0.2 µL) was diluted in 40 µL Tris buffer in a clean, labelled, small
Eppendorf tube. The two stains, SYBR® 14 dye and the propidium iodide dye, were
brought to room temperature. 1.5 µL of SYBR® 14 was added to the semen plus
buffer mixture, shaken, and allowed to stand 3-5 minutes. 1.5 µL of propidium iodide
dye was then added, the mixture shaken and allowed to stand a further 3-5 minutes.
110

Figure 3.7. Stained drone sperm, green=live; red=dead (Photograph by L. Kabanoff).
A slide was then made from each drone sample by placing 1.5 µL of Tris buffer on the
slide, adding 1.5 µL of stained semen to the buffer, and mixing. The stained semen on
the microscope slide was covered with a glass cover slip, then examined with an
Olympus BX60 compound microscope with a blue fluorescence filter, excitation
bandpass filter 460-490 nm, dichroic mirror 505 nm, barrier filter 515 nm suitable for
examination of material stained with both SYBR® 14 dye and propidium iodide dye at
200 X magnifications (Figure 3.7). Six to eight fields of view of each slide were
photographed and saved for counting the number of live:dead sperm present in each
field of view. Counting the number of live and dead sperm for five photographed
fields of view for each drone was carried out using image processing software (Image
Pro Plus, v 5.1, Media Cybernetics, Maryland, USA), this methodology was more
advanced than previous methodologies, enabling the counting of more sperm and thus
gave greater accuracy.
8. Sperm motility
The third of the three sub-samples of semen from each drone (0.1-0.2 µL) was diluted
with 10 µL of Tris buffer, and assessed for motility at room temperature within five
minutes of each sample being collected.
111

Motility was assessed by preparing the two ends of two haemocytometer slides
(Improved Neubauer BS.748, as previously described) covered with a coverslip and
five fields of view were examined, one each from three ends of the two
haemocytometers and two different fields of view on the fourth end of one
haemocytometer. A light microscope at 400 X magnification was used to record
motility. Sperm motility rating was assessed based on the method described in Locke
and Peng (1993) which scored five levels of movement:
0 = no movement; 1= < 50% sperm vibrating; 2 = > 50% sperm vibrating but no
circular or progressive movement; 3 = > 50% vibrating with < 50% exhibiting circular
and progressive movement; and 4 = > 50% exhibited circular and progressive
movement.
9. Dissection of endophallus, seminal vesicles and intestine
Individual adult drones were placed in a 90 mm Petri dish under a 10 X magnification
dissecting microscope. After manual eversion, the full everted portion of the
endophallus was dissected using fine scissors and placed in 0.5 mL water for
examination. Using a fine pair of scissors the drone`s abdomen was opened dorsally.
Using forceps (Inox No.4) the seminal vesicles, vasa deferentia, and any remaining
portion of the endophallus were then removed and placed in 0.5 mL water for
examination. The intestine was removed with forceps and placed in 0.5 mL water for
nosema disease examination.
10. Nosema disease examination
The presence of Nosema, Nosema spp., spores was determined by macerating the
drone intestine in 0.5 mL water and identifying spores present with a light microscope
at 400 X magnification. The number of spores per drone was determined using a
haemocytometer (an improved Neubauer BS.748), counting the number of spores
present in five large squares (each large square containing sixteen small squares), at
each end of the haemocytometer and determining the total number of spores per drone
using the method described by Cantwell (1970).
112

11. Amino acid determination in drone semen
Amino acid analysis was carried out by the Australian Proteome Analysis Facility Ltd,
Macquarie University, Sydney, New South Wales, Australia. The 2003-04 sample
analysis was performed using the Waters AccQTag chemistry with data presented as
free amino acids. Samples were analysed in duplicate and results expressed as an
average. The 2006 samples underwent 24 hour liquid hydrolysis in 6M HCl at 110°C.
After hydrolysis, all amino acids were analysed using the Waters AccQTag chemistry
with data presented as free amino acids plus water. With some exceptions, samples
were analysed in duplicate with results expressed as an average.
12. Fatty acid determination in drone semen
Fatty acid analysis was carried out by the Department of Primary Industries
Agricultural Institute, Wagga Wagga, New South Wales, Australia. The fatty acid
profile was determined as fatty acid methyl esters by gas chromatography, described in
Mailer et al. (2002). Separation of fatty acid methyl esters was performed on a Varian
3800 Gas Chromatograph using a Supelco® BPX 70 chromatography column (30 m
by 0.22 mm; 0.25 µm film) and flame ionisation detector (FID). The column
temperature was programmed at 185°C for eight minutes, then increased at 10°C per
minute up to 220°C. It was held for three minutes before cooling. The injector (split
mode) temperature was set at 240°C with a split ratio of 1:50. Detector temperature
was 250°C. Data were analysed using Star Workstation Chromatography software
(Version 4.51).
113

CHAPTER 4
Investigating drone semen characteristics and the possible
role of genetics.
4.1 Introduction
In Chapter 2, I discussed investigations relating to factors which were likely to impact
negatively on queen introduction success and subsequent performance. The conclusion
was that queen quality per se did not seem to be the underlying cause, but rather
mating and/or drone quality. My preliminary investigation of drones also appeared to
support this view.
I therefore investigated drone bee performance, and assessed a number of drone
characteristics, in particular semen volume and number of sperm per drone, sperm
viability and motility in the context of drone age, drone lineage, and season being
factors which might influence these parameters. In addition, I conducted a preliminary
investigation to determine whether the results recorded between different drone lines
were likely to be genetically linked. Finally, because manual eversion was used as the
method of collecting semen and sperm for my experiments, I investigated whether
manual eversion was a reliable method to record drone semen volume and number of
sperm produced.
This chapter reports these investigations and their findings. For clarity, I have
separated these investigations into discrete units, but have discussed these at the end of
the chapter, and have attempted to draw some general conclusions.
114

4.2 Volume of semen and number of sperm per drone
4.2.1 Introduction
Drone quality is paramount to the mating success of queen bees, with sufficient
numbers of mature age drones, each producing a large volume of semen containing a
large number of sperm, required to be present at commercial queen bee mating
apiaries to result in queen bees with the maximum number of sperm present in their
spermathecae after mating (Ruttner, 1983). Low sperm counts in queen spermathecae
after mating contribute to early supersedure and result in increased costs to beekeepers
from queen replacement and reduced colony production, as colonies weaken in
strength or become queenless during the period of queen replacement.
My earlier studies of A. mellifera queen honey bees, reported in Chapter 2 and also in
Rhodes and Somerville (2003), found low mean numbers of sperm in the
spermathecae of commercially reared queen bees aged 14 to 35 days over a three year
period: 1999, av.3.75 (ra. 0.78-9.32); 2000, av. 1.63 (ra. 0.25-3.63); 2001, av. 3.28 (ra.
0.53-7.28) x 106 sperm per queen. One explanation may be a problem with drones in
the mating area- either low numbers of drones available to mate with the queen bees,
or sufficient numbers of drones but a problem with semen production by those drones,
or a combination of both. This investigation examined semen production and quality in
drones measured in terms of the proportion of drones releasing semen at the tip of the
endophallus after manual eversion, and the volume of semen and the number of sperm
produced by individual drones from commercial breeding lines used at queen bee
mating areas.
Limited data are available on the proportion of drones releasing semen at the tip of
the endophallus after manual eversion, and subsequent drone semen production and
semen quality. Woyke et al. (2001) found a high proportion (84%) of A. dorsata
drones of unspecified age failed to ejaculate semen after lateral squeezing of the
abdomen. Collins and Pettis (2001) reported that 40% of 12-day-old drones
produced semen after manual eversion and Anderson (2004) reported that more than
115

95% of drones at 20 days of age did not release semen at the endophallus after
manual eversion.
Nguyen (1995) studied nutritional effects on the sexual maturity of drones (using
manual eversion) in apiaries in NSW, finding protein nutrition is one of the most
important factors influencing sexual development in drones, with drones reaching
sexual maturity between 10 and 20 days after emergence, the majority between 13
and 18 days. In hives fed adequate protein, compared with lower nutrition hives, the
proportion of sexually mature drones 10 - 17 days of age was significantly higher,
with all drones reaching sexual maturity one to two days earlier. The mean volume
of semen per drone collected from higher nutrition hives was higher, but not
statistically different, than for drones from lower nutrition hives, although the mean
number of spermatozoa in high nutrition hives was significantly higher than for
drones from lower nutrition hives. Nguyen (1995) concluded that large numbers of
high quality drones can only be produced in hives provided with adequate protein
nutrition. However, Anderson (2004) reported that there were no benefits from
feeding dietary supplements for bee colonies or during queen development in his
investigations and suggested that additional fundamental research was required.
Schlüns et al. (2004) investigated sperm utilisation patterns in honey bee queens,
stating that not all drones contribute equally to the queen`s offspring and that the
queen`s utilisation pattern of sperm from different drones has an important impact on
the genetic composition of the colony. Their results showed no significant effect on the
insemination sequence but did show a strong relationship between the semen volume
of a drone and the frequency of his worker offspring in the colony. Woyke (1962)
stated that a drone produces about 10 x 106 million sperm, and 1 µL semen contains
about 7.5 x 10⁶ sperm. Koeniger et al. (2005) compared spermatozoa numbers between
A. dorsata and A. mellifera drones and provided a comparison of sperm counts from
A. mellifera drones from various authors. Sperm counts ranged from, mean 4 (2.0 ±
0.1) x 106 per seminal vesicle for European A. mellifera (Rinderer et al., 1999) to 11.9
± 1.0 x 10⁶ for drones from an A. m. carnica colony (Schlüns et al., 2003). Nguyen
(1995), in his studies in eastern Australia, reported a mean sperm count of 8.01 ( ra.
6.75-9.50) x 106 in drones from colonies fed adequate protein and 7.14 (ra. 5.75-8.45)
x 106 for drones from protein-deprived colonies.
116
Collins and Pettis (2001) considered the large variation found for the concentration of
sperm in semen was influenced by the semen being viscous and sticky with the sperm
cells tending to clump together after dilution, providing a considerable error of
measurement at this point. Koeniger et al. (2005) stated that, in general, sperm
numbers of individual drones show high variance and suggested this could be due to
errors in the method used. They concluded that it was premature to draw general
conclusions from the differences in numbers of sperm of drones and that the reasons
for these variations need to be understood.
The current investigation was therefore undertaken to compare semen production and
quality from honey bee drones from a number of commercial breeding lines examined
at a range of ages over the three seasons when queen bees are reared commercially in
eastern Australia. It aimed to provide data for queen breeders and others on the
number of sperm produced by eastern Australian drones and to highlight using these
data in selecting queen bee drone mother stock.
4.2.2 Materials and methods
Drones were reared from the apiary, as described in Chapter 3. Field work for this
experiment involved rearing and managing drones to a known age for examination,
and was carried out between October 2003 and May 2004 at Richmond, NSW. A 16
hive apiary was used to ensure sufficient numbers of drones.
Open mated queen bees produced from instrumentally inseminated breeder queen bees
similar to A. m. ligustica were sourced from four commercial queen bee breeders in
eastern Australia, to represent breeding lines from dissimilar backgrounds. Drones
were reared from these queens, to represent spring drones (eggs laid 6-7 October,
2003), summer drones (eggs laid 7-8 January, 2004), and autumn drones (eggs laid 15-
16 March, 2004). For each breeding line and for each season, drones were sampled at
three ages: 14, 21 and 35 days old.
Methodology for collection of data from drones in the laboratory is described in
Chapter 3. Drones reared to a known age, breeding line and season were examined
117
individually for semen volume, sperm – number, viability and motility, and
selectability for these characteristics
4.2.3 Statistical analysis
Counts of drones with measurable amounts of semen are binomial variates. These
were analysed using a logistic regression model, which is a generalised linear model
with a logit link, and binomial variance function. Season, age, line and all interactions
were terms in the model and the significances of these terms were assessed by
sequentially adding each term to the model and the changes in deviance between the
nested models were compared to a Chi squared distribution with degrees of freedom
being the degrees of freedom of the added term. Semen volume and number of sperm
per drone for those drones with semen were analysed as a linear model with season,
drone age, breeding line and all interactions included in the model. A square root
transformation for both variables was necessary to meet the assumptions of normally
distributed residuals. Predictions on the back-transformed are shown for all levels of
the main effect terms (season, drone age and breeding line) and averaged over all other
terms in the model. The logistic regression model was fitted using the statistical
software R (R Development Core Team, 2007), utilising the general linear model
(GLM) function and the linear model was fitted using ASReml (Gilmour et al., 2006).
Significance of terms was assessed at a probability of 5 percent (P ≤ 0.05). Note that
this study was conducted over a one-year period and hence any seasonal effects found
may or may not be replicated again had the study been repeated in another year. Each
season had only one replication and hence pseudo-replication is involved in any
analysis with season as a factor.
4.2.4 Results
1. Semen release and semen volume
Only 59.4% of drones examined from the four breeding lines released measurable
amounts of semen at the endophallus after manual eversion (Table 4.1) The percentage
of drones that released semen was quite variable among the different genetic lines,
with 91.7% from line 2 releasing semen, 40.03% from line 1, 38.9% from line 3 and
118
64.8% from line 4 (Table 4.2). The percentage of drones that released semen when
aged 14, 21 and 35 days was 58.6%, 52.8% and 75.8%, respectively, while the
percentage that released semen in spring, summer and autumn was 58.4%, 61.8% and
57.2%, respectively (Table 4.2).
Statistical analyses showed that semen release in the drones was dependent on their
genetics (i.e. the breeding line they came from) and, to a lesser extent, on their age and
the season in which they were produced. The deviance for each term and their
associated degrees of freedom and P values are shown in Table 4.5.
For drones that released a semen sample after manual eversion, the mean semen
volume was 1.09 (range 0.1-3.6) µL per drone, with a predicted mean of 1.03 µL when
adjusted for imbalance in drone numbers for age, season and breeding line. Predicted
semen volumes and ranges of volumes for drones that released a measurable volume
of semen are shown in Table 4.3 for season, age and breeding line. Semen volumes
were significantly higher for spring- than summer- and autumn-reared drones, which
produced the smallest volumes. Volumes were also significantly higher in the 14- and
21-day-old drones than in the 35-day-old drones. A significant breeding line effect was
also identified, with lines 2 and 4 producing greater volumes than line 3, with line 1
producing the smallest volumes. Significance values for all terms in the model are
shown in Table 4.5. The relative sizes of the F values and a perusal of the predicted
values showed that genetics (breeding line) had the largest effect on semen volume,
followed by the age of drones with all other terms having much smaller effects.
2. Sperm numbers
The mean number of sperm produced per drone was 3.63 (range 0-19.1) x 106 with a
predicted mean of 3.17 x 10⁶ when adjusted for imbalance in drone numbers for age,
season and breeding line. Predicted means of the number of sperm produced per drone
and range of sperm numbers for drones releasing a measurable volume of semen are
shown in Table 4.4 for season, age and breeding line. A season effect was identified,
with autumn-reared drones producing significantly more sperm than summer- and
spring-reared drones, which produced the least sperm. An age effect was also
identified, with 21-day-old drones producing more sperm than 14- and 35-day-old
119
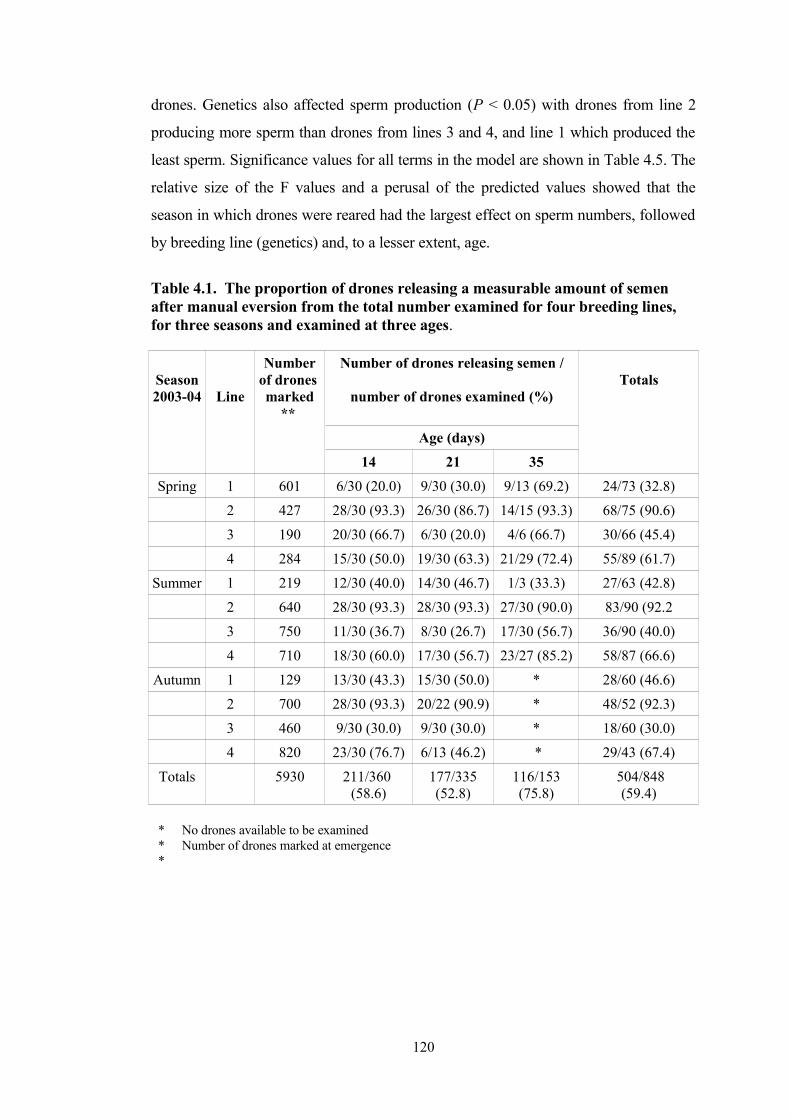
drones. Genetics also affected sperm production (P < 0.05) with drones from line 2
producing more sperm than drones from lines 3 and 4, and line 1 which produced the
least sperm. Significance values for all terms in the model are shown in Table 4.5. The
relative size of the F values and a perusal of the predicted values showed that the
season in which drones were reared had the largest effect on sperm numbers, followed
by breeding line (genetics) and, to a lesser extent, age.
Table 4.1. The proportion of drones releasing a measurable amount of semen after manual eversion from the total number examined for four breeding lines, for three seasons and examined at three ages.
Season2003-04 Line
Number of drones marked
**
Number of drones releasing semen /
number of drones examined (%)Totals
Age (days)14 21 35
Spring 1 601 6/30 (20.0) 9/30 (30.0) 9/13 (69.2) 24/73 (32.8)
2 427 28/30 (93.3) 26/30 (86.7) 14/15 (93.3) 68/75 (90.6)
3 190 20/30 (66.7) 6/30 (20.0) 4/6 (66.7) 30/66 (45.4)
4 284 15/30 (50.0) 19/30 (63.3) 21/29 (72.4) 55/89 (61.7)
Summer 1 219 12/30 (40.0) 14/30 (46.7) 1/3 (33.3) 27/63 (42.8)
2 640 28/30 (93.3) 28/30 (93.3) 27/30 (90.0) 83/90 (92.2
3 750 11/30 (36.7) 8/30 (26.7) 17/30 (56.7) 36/90 (40.0)
4 710 18/30 (60.0) 17/30 (56.7) 23/27 (85.2) 58/87 (66.6)
Autumn 1 129 13/30 (43.3) 15/30 (50.0) * 28/60 (46.6)
2 700 28/30 (93.3) 20/22 (90.9) * 48/52 (92.3)
3 460 9/30 (30.0) 9/30 (30.0) * 18/60 (30.0)
4 820 23/30 (76.7) 6/13 (46.2) * 29/43 (67.4)
Totals 5930 211/360 (58.6)
177/335(52.8)
116/153(75.8)
504/848(59.4)
* No drones available to be examined**
Number of drones marked at emergence
120

Table 4.2. The proportion of drones releasing a measurable amount of semen after manual eversion for three seasons, three age groups and four breeding lines.
Variable Proportion of drones releasing semen (%)
Sig.*
SeasonSpring 177/303 (58.4) aSummer 204/330 (61.8) aAutumn 123/215 (57.2) aAge (days)14 211/360 (58.6) b21 177/335 (52.8) b35 116/153 (75.8) aLine1 79/196 (40.3) c2 199/217 (91.7) a3 84/216 (38.9) c4 142/219 (64.8) bOverall mean 504/848 (59.4)
Percentages followed by different letters are significantly different (P ≤ 0.05)
121

Table 4.3. Semen volume and range of volumes released by drones for season, age and breeding line effects for drones which released a measurable amount (> 0.1 µL) of semen.
Variable Number of Semen volume/drone µL Sig.+drones** Predicted mean±s.e.*Range
SeasonSpring 177 1.1147 ± 0.0418 0.2-3.6 aSummer 204 0.9752 ± 0.0508 0.1-3.0 abAutumn 123 0.8728 ± 0.0511 0.1-1.6 bTotal 504Age (days)14 211 1.0179 ± 0.0365 0.1-2.2 a21 177 1.1368 ± 0.0405 0.2-3.6 a35 116 0.8062 ± 0.0533 0.2-3.0 bTotal 504Line1 79 0.7666 ± 0.0547 0.2-1.8 c2 199 1.1642 ± 0.0356 0.1-3.0 a3 84 0.9316 ± 0.0545 0.1-2.6 b4 142 1.0898 ± 0.0405 0.2-3.6 aTotal 504Overall mean 1.03 ± 0.02
*Data are fitted means averaged out over other variables
+ Means followed by different letters are significantly different (P ≤ 0.05)
** Number of drones providing semen sample
A correlation of 0.54 was found between number of sperm and semen volume, with little change when Age was added.
122
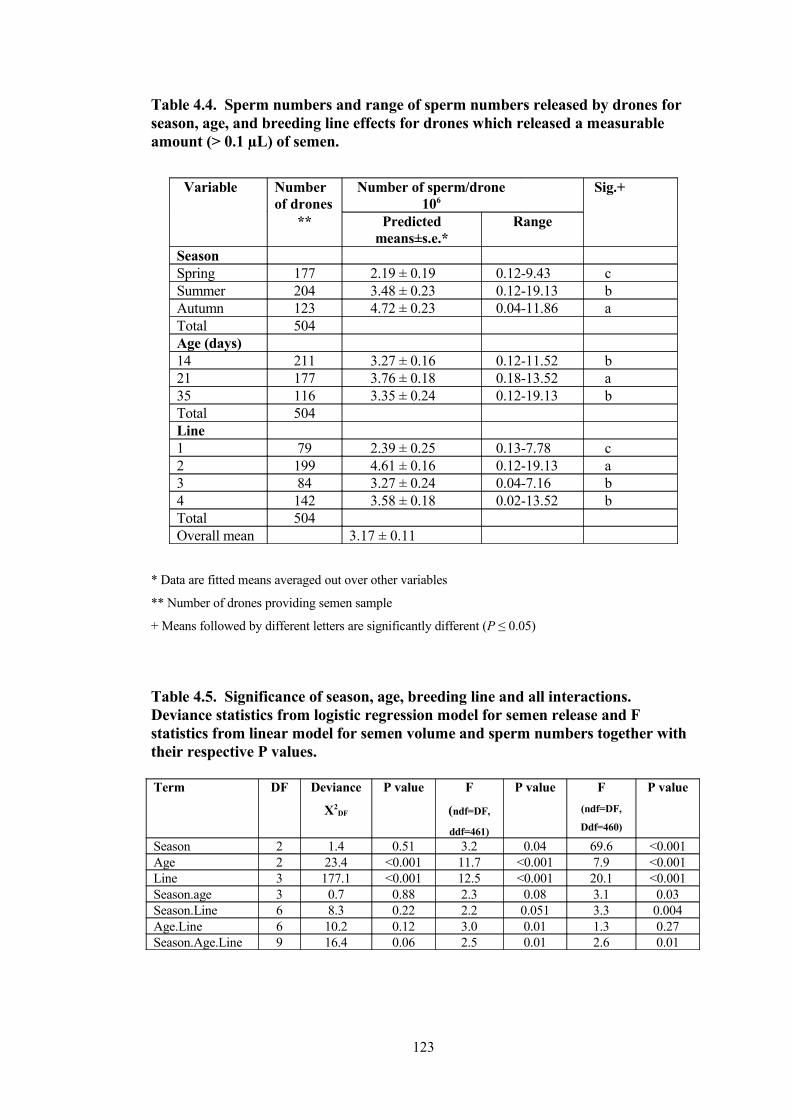
Table 4.4. Sperm numbers and range of sperm numbers released by drones for season, age, and breeding line effects for drones which released a measurable amount (> 0.1 µL) of semen.
Variable Number of drones
Number of sperm/drone106
Sig.+
** Predicted means±s.e.*
Range
SeasonSpring 177 2.19 ± 0.19 0.12-9.43 cSummer 204 3.48 ± 0.23 0.12-19.13 bAutumn 123 4.72 ± 0.23 0.04-11.86 aTotal 504Age (days)14 211 3.27 ± 0.16 0.12-11.52 b21 177 3.76 ± 0.18 0.18-13.52 a35 116 3.35 ± 0.24 0.12-19.13 bTotal 504Line1 79 2.39 ± 0.25 0.13-7.78 c2 199 4.61 ± 0.16 0.12-19.13 a3 84 3.27 ± 0.24 0.04-7.16 b4 142 3.58 ± 0.18 0.02-13.52 bTotal 504Overall mean 3.17 ± 0.11
* Data are fitted means averaged out over other variables
** Number of drones providing semen sample
+ Means followed by different letters are significantly different (P ≤ 0.05)
Table 4.5. Significance of season, age, breeding line and all interactions. Deviance statistics from logistic regression model for semen release and F statistics from linear model for semen volume and sperm numbers together with their respective P values.
Term DF Deviance
Χ2DF
P value F
(ndf=DF,
ddf=461)
P value F(ndf=DF,
Ddf=460)
P value
Season 2 1.4 0.51 3.2 0.04 69.6 <0.001Age 2 23.4 <0.001 11.7 <0.001 7.9 <0.001Line 3 177.1 <0.001 12.5 <0.001 20.1 <0.001Season.age 3 0.7 0.88 2.3 0.08 3.1 0.03Season.Line 6 8.3 0.22 2.2 0.051 3.3 0.004Age.Line 6 10.2 0.12 3.0 0.01 1.3 0.27Season.Age.Line 9 16.4 0.06 2.5 0.01 2.6 0.01
123
4.3 Sperm viability assessment
4.3.1 Introduction
Evidence showing that sperm competition selects for higher sperm quality in insects
was provided by García-Gonzáles and Simmons (2005) who found that paternity
success was determined by the proportion of live sperm in a male`s ejaculate. Their
results supported the hypothesis that selection should maximise sperm quality. Kraus
et al. (2003), investigating male fitness in drone honey bees, found selection through
the male side appeared to be an extremely important factor for colony fitness, as both
the number of mating drones and the individual siring success of those drones is
determined by the colony and/or the genotype of the mother queen.
Interest in honey bee semen quality increased with the development of instrumental
insemination of queen bees using semen collected by various means from drones of a
range of ages, and with the semen stored for different amounts of time under different
conditions prior to use. Attention to drone semen quality was raised by Vesely (1970,
quoted in Locke and Peng, 1993) who studied the retention of semen in the oviducts of
inseminated queen bees which often resulted in infertility or death of the queen bee.
Woyke and Jasinski (1978) examined the effects of drone age on semen quality and
found that as the age of the drone increased a generally lower number of sperm entered
the spermathecae of queen bees, and the percentage of queen bees with semen residue
in their oviducts increased.
Hunter and Birkhead (2002) found that, all else being equal, males vary in their ability
to fertilise ova on the basis of sperm viability alone, with sperm viability being one of
a suite of male adaptions to sperm competition in insects. Locke and Peng (1993)
reported sperm viability decreased with increasing drone age with drones 28 and 42
days old (81.4 ± 1.62% and 80.1 ± 2.01%, respectively) having significantly lower
sperm viability than 14-day-old drones (86.2 ± 1.12%). Collins and Pettis (2001)
found a mean of 99.2 (ra. 82.3-100.0)%, viability in a sample of 16 drones a minimum
of 12 days old. Collins (2004) examined 20 drones, collecting semen in a syringe and
124

using room temperature buffer, and found a mean percent live sperm of 78.1 ± 10.1
(ra. 58.5-91.0) %.
The objective of the current experiment was to use sperm viability as a measure of
quality in a comparison between drones from a number of breeding lines, over a range
of ages and over the three seasons that queen bees are reared commercially in eastern
Australia.
4.3.2 Materials and methods
The processes for rearing the drones used in these experiments have been described in
Chapter 3. The same drones reared to provide a semen sample for data on volume of
semen per drone and number of sperm produced per drone (Chapter 3), provided a
sample of sperm for viability assessment. Methodology for sperm viability assessment
has also been described in Chapter 3.
Open mated queen bees produced from instrumentally inseminated breeder queen bees
similar to A. m. ligustica were sourced from the four commercial queen bee breeders,
as previously described in Chapter 3 and Section 4.2. Drones were reared to represent
spring, summer and autumn reared drones. For each breeding line and for each season,
drones were examined at three ages: 14, 21 and 35 days of age. Semen was collected
from each drone in a Schley II apparatus after manual eversion, and a sub-sample of
each semen sample was used to assess sperm viability.
4.3.3 Statistical analysis
For each drone, the numbers of alive and dead sperm observed in each photographed
field of view were summed. The status of a sperm (alive or dead) is a binomial variate
and was analysed using a logistic regression model which is a generalised linear model
with a logit link and binomial variance function. Season, age, breeding line and all
interactions were terms in the model and significance of these terms were assessed by
sequentially adding each term to the model and the changes in deviance between the
125
nested models are compared to a Chi-squared distribution with degrees of freedom
being the degrees of freedom of the added term.
4.3.4 Results
The number of drones examined and the number providing a semen sample for sperm
viability percent assessment are shown in Table 4.6. Drone sperm viability averaged
79.7 (ra. 59.9 – 90.5)% (Table 4. 6). Of the 848 drones examined, 425 (50.1%)
produced a sufficient volume of semen for examination for sperm viability. The
numbers of drones providing a sample of semen compared with the number of drones
examined for each breeding line were: Line 1, 62/196 drones (31.6%); Line 2, 178/217
(82.0%); Line 3, 81/216 (37.5%); and Line 4, 117/219 (53.4%); for each Age were: 14
days of age, 170/360 (47.2%); 21 days of age, 153/335 (45.7%); and 35 days of age,
102/153 (66.7%); and for each season were: Spring, 159/303 drones (52.5%); Summer
162/330 (49.1%); and Autumn 104/215 (48.4%). No 35-day-old autumn drones
survived to be examined.
A season effect was identified with autumn drones having a significantly higher (P ≤
0.05) sperm viability than spring and summer drones (Table 4.7). An age effect was
identified (P ≤ 0.05) with 21-day-old drones having the highest sperm viability
followed by 35-day-old drones and 14-day old drones. A breeding line effect (P ≤
0.05) was also identified, with Line 1 drones having significantly lower sperm viability
than Lines 2, 3 and 4.
The deviance statistics for all terms from the logistic regression model were highly
significant (P < 0.001) with season and season.age having the largest deviance
statistics, but all other terms have some influence on sperm viability. Predictions, with
standard errors for all combinations of season, age and breeding line are given in Table
4.7. The deviances for each term and their associated degrees of freedom (in brackets)
were: season (S) 878 (2); age (A) 145 (2); breeding line (L) 230 (3); S.A 816 (3);
S.L353 (6); A.L 423 (6) and S.A.L 364 (8).
126
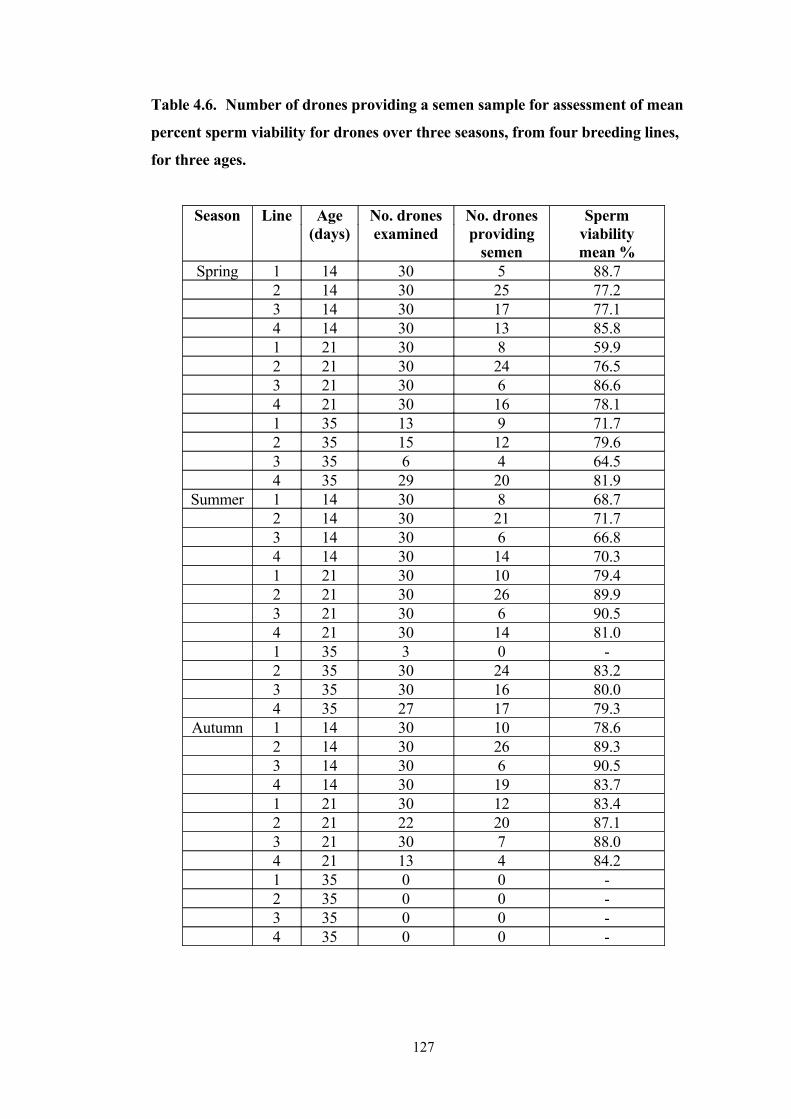
Table 4.6. Number of drones providing a semen sample for assessment of mean
percent sperm viability for drones over three seasons, from four breeding lines,
for three ages.
Season Line Age No. drones No. drones Sperm(days) examined providing
semenviabilitymean %
Spring 1 14 30 5 88.72 14 30 25 77.23 14 30 17 77.14 14 30 13 85.81 21 30 8 59.92 21 30 24 76.53 21 30 6 86.64 21 30 16 78.11 35 13 9 71.72 35 15 12 79.63 35 6 4 64.54 35 29 20 81.9
Summer 1 14 30 8 68.72 14 30 21 71.73 14 30 6 66.84 14 30 14 70.31 21 30 10 79.42 21 30 26 89.93 21 30 6 90.54 21 30 14 81.01 35 3 0 -2 35 30 24 83.23 35 30 16 80.04 35 27 17 79.3
Autumn 1 14 30 10 78.62 14 30 26 89.33 14 30 6 90.54 14 30 19 83.71 21 30 12 83.42 21 22 20 87.13 21 30 7 88.04 21 13 4 84.21 35 0 0 -2 35 0 0 -3 35 0 0 -4 35 0 0 -
127

Table 4.7. Predicted sperm viability, live percent for sperm produced by drones for season, age, and breeding line for drones which produced a measurable amount of semen (> 0.1 µL) after manual eversion.
Variable Sperm Viability Live:Dead %Predicted mean ± s.e. Sig.*
SeasonSpring 77.00 ± 1.09 bSummer 78.06 ± 1.09 bAutumn 84.87 ±1.54 aAge (days)14 77.85 ± 1.06 b21 81.92 ± 1.11 a35 80.16 ± 1.58 abLine1 75.47 ± 1.70 b2 82.33 ±1.06 a3 80.84 ± 1.69 a4 81.25 ± 1.25 a
Means followed by different letters are significantly different (P ≤ 0.05)
4.4 Sperm motility rating
4.4.1 Introduction
Sperm, generally, are motile cells with sperm motility being critical at the time of
fertilisation, allowing sperm motility to be used as a measure of sperm quality.
Tourmente et al. (2007) considered semen quality analysis to be a powerful tool for
evaluation of fertility potential of males and stated that sperm motility is positively
correlated with fertilisation success in several species. A review of insect sperm
motility (Werner and Simmons, 2008) stated that despite a considerable volume of
data available on sperm morphology, little is known about the motility of insect sperm.
They considered that understanding sperm motility would help to refine models of
sexual selection on insect sperm and would assist in explaining selective mechanisms
that shape insect sperm structure and function.
128

Locke and Peng (1993) examined honey bee sperm motility patterns to determine how
drone age, semen storage time and contamination contributed to semen quality. Drone
bees were marked on emergence and allowed free flight until examination, when
semen samples were collected by manual ejaculation. Sperm was assessed for motility
by scoring on a scale of 0-4 (0 = no movement, 4 = most movement); in this
experiment there was a lag time of two to five hours between semen collection and
motility assessment. No significant differences were found for sperm motility from
drones 14, 28 and 42 days of age, with motility scores of 2.85±0.13, 2.55±0.15 and
2.65±0.17, respectively.
Kaftanoglu and Peng (1984) found honey bee sperm motility rates were higher at pH
6.35-8.40 in hypertonic rather than in hypotonic solutions and no vigorous sperm
motility was observed in saline and tris-buffer diluents, both of which were hypotonic
to seminal plasma. Dietrich et al. (2005) assessed motility in rainbow trout,
Oncorhynchus mykiss, semen and found that post-mortem storage, for ≥ 40-60 minutes
lowered sperm motility.
Seasonal effects on sperm motility have been shown in several animal species.
Examining three species of deer, Martinez-Pastor et al. (2005) considered the
influence of season on sperm production and quality was a factor of high impact,
stating there were great differences between species. For chamois deer, they found
good motility results for sperm collected during the breeding season while sperm
collected during the non-breeding season showed almost no motility. Gizejewski,
(2004) found for red deer that sperm motility was better in the first part of the mating
period than in the rest of the mating period. Seasonal effects on motility were also
identified in dairy goats by Abdelwahab et al. (2006), who found mean sperm motility
was significantly higher in spring than in autumn. On the other hand, Ravimurugan et
al. (2006) found sperm motility for buffalo sperm was significantly highest in winter
for the first ejaculate and the mean sperm motility highest in summer for the second
ejaculation.
There appear to be no data regarding seasonal effects on sperm motility in insects. As
drones can be reared from spring to autumn and be required to mate with virgin queen
bees reared over this time, it was considered that it was important to ascertain any
129
effects of season on drone sperm motility. Using four separate breeding lines also
allowed examination of a possible genetic basis to any differences recorded in sperm
motility.
4.4.2 Materials and methods
The same drones providing samples for assessing volume of semen, number of sperm
and sperm viability also provided a sample for assessing sperm motility. Methodology
for rearing drones and for assessing sperm motility are described in Chapter 3.
Drones were reared to represent spring, summer and autumn reared drones. For each
breeding line and for each season, drones were examined at three ages: 14, 21 and 35
days of age. Semen was collected from each drone in a Schley instrumental
insemination apparatus after manual eversion, and a sub-sample of semen sample was
used to determine sperm motility rating.
4.4.3 Statistical analysis
Motility was rated on a scale from 0 to 4 and is ordinal data. Except for a small
percentage of drones the motility rating was the same for all five fields of view.
Motility for a drone was taken to be the median of the five motility ratings. The
motility data were analysed using a proportional odds logistic regression. All data
were analysed using the statistical software R (R Development Core Team, 2007)
utilising the Generalised Linear Models (GLM) function for the logistic regression
model and using the Proportional Odds Logistic Regression (polr) and step AIC
functions of the MASS package (Venable and Ripley, 2002) for the polr. The most
parsimonious polr model was selected by using Akaike`s Information Criteria (AIC)
(Akaike, 1974). The model selected had season, age, breeding line and season.age as
terms in the model.
Note that this study was conducted only over one year and any seasonal effects found
may or may not be replicated again had the study been repeated in another year. Each
season has only one replication and hence pseudo-replication is involved in any
analysis with season as a factor.
130
4.4.4 Results
The number of drones providing a semen sample for assessment of mean sperm
motility for season, breeding line and drone age are shown in Table 4.8.
The most parsimonious model had the terms season, age, breeding line and season.age
meaning the breeding line effect was consistent for all seasons and ages. The
significant coefficients in the model followed by their standard errors were – season
(Summer) by breeding line, breeding line (1) 1.34 (0.34); line (2) 1.07 (0.30); breeding
line (3) 0.77 (0.36); breeding line (4) 0.91 (0.31): season (Spring) by age (21) 1.73
(0.50); season (Spring) by age (35) 3.08 (0.57). Significance was calculated at P ≤
0.05.
Breeding line 1 has significantly lower motility than the three other breeding lines.
Breeding line 2 has the highest motility but is not significantly higher than for
breeding lines 3 and 4. In general, motility in summer is significantly higher than in
autumn and spring but is not affected by age. The exception is that motility increases
with age in spring with motility for 35-day-old spring drones significantly higher than
for 21-day-old spring drones, which in turn have motility significantly higher than the
14-day-old spring drones.
Ordinal data only conveys information concerning the relativities of the underlying
data and no information as to their scale, and so should never be averaged. In
previously published findings the motility scores have been averaged, so in order to
make comparisons with previous findings we have taken the probabilities of the
motility rating categories for each season by age by breeding line combination (Figure
4.1), multiplied these by the relevant motility rating (0 to 4) and summed to give a
predicted or “average” motility score, which is presented in Table 4.8.
Sperm viability v. sperm motility
A plot of percentages of live sperm (viability) for each drone versus its motility rating
showed no relationship. For each of the motility ratings of 0-4 the average viability
was 81, 77, 84, 80 and 83 percent, respectively.
131

Table 4.8. Number of drones providing a semen sample for assessment of predicted mean sperm motility for drones over three seasons, from four breeding lines, for three ages.
Season Breeding Line
Age (days)
No. drones examined
No. drones
providing semen
Sperm motilityPredictions
Spring 1 14 30 0 -2 14 30 30 2.13 14 30 26 1.814 14 30 30 1.91 21 30 8 2.42 21 30 24 33 21 30 6 2.94 21 30 17 2.91 35 13 7 3.142 35 15 14 3.53 35 6 4 3.44 35 29 21 3.5
Summer 1 14 30 7 2.22 14 30 23 2.93 14 30 8 2.74 14 30 15 3.51 21 30 10 2.32 21 30 26 33 21 30 7 2.84 21 30 14 2.91 35 3 0 -2 35 30 24 2.73 35 30 16 2.54 35 27 17 2.6
Autumn 1 14 30 10 1.42 14 30 27 23 14 30 6 1.94 14 30 19 1.91 21 30 12 1.42 21 22 20 23 21 30 7 1.84 21 13 4 1.91 35 0 0 -2 35 0 0 -3 35 0 0 -4 35 0 0 -
132

Figure 4.1. Sperm motility barplot showing the probabilities of the motility
rating categories for each season (autumn, spring, summer) by age (14, 21, 35
days) by breeding line (1, 2, 3, 4) combination.
4.5 Investigating the role of genetics in drone semen production
4.5.1 Introduction
Data from Section 4.2 showed significant differences between the four breeding lines
examined for the proportion of drones producing semen at the endophallus after
133

manual eversion, semen volume and sperm number per drone with a high producing
line and a low producing line able to be identified.
The aims of this experiment were to examine whether (i) the ability of mature age
drone honey bees to release semen at their endophallus after manual eversion and, (ii)
the volume of semen and number of sperm produced per drone, are selectable traits.
There is no readily available data on the subject of the ability of drone bees to release
semen following manual eversion, which raises the question whether the absence of
semen at the endophallus after manual eversion (Table 4.1) means the drone:
(i) did not produce semen in the seminal vesicles
(ii) did produce semen in the seminal vesicles but did not release the semen due to –
(a) physiological or behavioural reasons
(b) physical reasons based on the ability of the operator carrying out the manual
eversion.
As significant differences were found between breeding lines for (i) the proportion of
drones producing semen after manual eversion, (ii) the volume of semen produced per
drone, and (iii) the number of sperm produced per drone with all the manual eversions
of drones being carried out by one operator, and all measurements being determined
by a second operator, then the human factor of operator effect may be removed from
the list of reasons significant differences were found.
An investigation into the proportion of drones producing semen after manual eversion
(Tables 4.1 and 4.2) and semen volume and the number of sperm produced per drone
(Tables 4.3 and 4.4) , resulted in significant differences ( P ≤ 0.05) between the
breeding lines. These data suggest that genetics may be involved in the proportion of
drones releasing semen at their endophallus, the volume of semen produced per drone,
and the number of sperm produced per drone for each breeding line, following manual
eversion.
Examples of selectable traits involving foraging behaviour in honey bees (e.g. Page
and Fondrk, 1995; Page et al., 1995; Hunt et al., 1995; Page et al., 1998; Pankiw and
Page, 1999 and Humphries, 2003) and average weight gain in rabbits (Moura et al.,
134

1997) demonstrate genotypic variability for some aspects of behaviour and physiology
present in some animals. On this basis, it may be that different breeding lines of drones
display differences in behaviour when manually everted with some lines releasing
semen at the endophallus in a higher proportion of drones than other lines. As well,
some breeding lines of drones may display differences in their physiology by having
higher proportions of drones produce higher numbers of sperm in their seminal
vesicles than other lines.
Drones were also examined for the presence of adult bee diseases nosema and virus
infections to identify their presence or absence and, if present, assess their possible
effects on the results obtained. This was to ensure that there was no relationship
between breeding line and presence of disease which could impact on interpretation of
results.
4.5.2 Materials and methods
Drones were reared to a known age and examined to obtain semen samples, as
described in Chapter 3.
4.5.2.1 Two-way cross methodology
Examination of drones for this experiment was carried out at Richmond, NSW,
between November 2004 and March 2006. A Two-way Cross Methodology was
developed (Tier, 2004, pers. comm.) to determine whether genetic inheritance is
involved in the release of semen at the endophallus after manual eversion, the volume
of semen produced, and the number of sperm produced by drone honey bees.
Two-way cross methodology
1. Select one breeding line to represent the High Line and one breeding line to
represent the Low Line from data shown in Tables 4.1 to 4.4.
Breeding line 2 was selected as a High Line and breeding line 1 selected as a Low
Line for the proportion of drones producing a measurable amount of semen at the
135

endophallus after manual eversion, for semen volume and for number of sperm
produced.
- • Rear 50 drones from each of five queens from each breeding line. Examine
drones from each queen for proportion of drones producing a measurable
amount of semen at the endophallus after manual eversion, volume of
semen produced and number of sperm produced.- • Examine data from drones from each breeding line to confirm the two lines
are significantly different from each other for the three characteristics
measured.- • Select the queen bee with the highest data from the High Line (Selected
High Line queen mother) and the queen bee with the lowest data from the
Low Line (Selected Low Line queen mother) to produce daughter queen
bees.- • The remaining queen bees identified in each group are used to rear High
Line and Low Line drones for the experiment (High and Low Line drone
mothers).
2. Rearing of High Line and Low Line queen bees and drone bees for the Line
Crossing experiment.
High Line Selected High Line
queen mother
Raise 10 daughter queens
- divide into 5 (a) queens
and 5 (b) queens
H
♀
High Line Remaining High Line
identified queens
Raise drones
- homogenise semen
H
♂
Low Line Selected Low Line
queen mother
Raise 10 daughter queens
- divide into 5 (c) queens
and 5 (d) queens
L
♀
Low Line Remaining Low Line
identified queens
Raise drones
- homogenise semen
L
♂
136

3. Crossing the four groups of queen bees and drone bees using artificial insemination to
ensure correct matings.
Drones H L
H 5(a)Queens H 5(b)
L 5(c)L 5(d)
4. Produce two queens from each of the five queens in each of the four groups (see dot
point 3), all queens to be open mated (i.e. allowed to mate on the wing with unknown
drones).
- provides a total of 40 queens (10 (a), 10 (b), 10 (c), and 10 (d) cross queens).
5. Rear 30 drones from each of the 40 queens, in dot point 4. Examine each drone at
21 days of age for the proportion of drones producing a measurable amount of semen
after manual eversion, the volume of semen produced and the number of sperm
produced.
6. Select data from the three highest and three lowest producing queens from each of
the four groups of ten queens (dot point 4). A total of 24 queen bees to provide data.
7. Analyse data from bees in dot point 6 for variation between and within groups with
the purpose of identifying variations in the three characteristics measured – proportion
of drones producing semen, semen volume per drone, and number of sperm per drone.
8. Analyse data for correlations between High and Low Lines.
137

4.5.2.2 Confirmation of High and Low breeding lines
Methodology
Prior to commencing the two-way cross experiment, drones from the identified High
Line and Low Line were examined three times for differences between the High and
Low Lines by examining drones reared in hives headed by queen bees used in the
2003-4 experiments (Tables 4.1 - 4.4). Drones were reared and samples collected
using methodology described in Chapter 3, at Richmond, NSW.
Examination 1
Forty drones from each hive were examined at 21 days of age in January, 2005.
Drones were examined for (i) proportion of drones producing a measurable volume of
semen after manual eversion, (ii) volume of semen produced per drone, and (iii)
number of sperm produced per drone. Drones reared from five High Line queen bees
(hive numbers 1-5), and three Low Line queen bees (hive numbers 6-8) were
examined. Results are presented in Tables 4.9 and 4.10.
Examination 2
The two-way crossing experiment was planned to commence in spring 2005 and be
completed during the beekeeping season of spring 2005 - autumn 2006. When the
experiment recommenced in spring 2005, it was found that the identified High and
Low Line queen bees had been superseded (viz. replaced by daughter queens). Young
queen bees from the same breeding lines as the High and Low Line queens were
obtained from the two beekeepers who supplied the original queen bees. The
replacement queen bees were obtained in October, 2005. Evaluation of drones from
the two lines to determine whether they satisfied requirements for classification into
High and Low Line, based on the three characteristics previously examined,
commenced in November, 2005. Thirty drones reared from 4 High Line and 3 Low
Line replacement queen bees were examined at 21 days of age for (i) the proportion of
drones producing a measurable amount of semen after manual eversion, (ii) the
138
volume of semen produced per drone, and (iii) the number of sperm produced per
drone. Results are shown in Tables 4.11 and 4.12.
Examination 3
Drones from the replacement High and Low Line queen bees providing drones for
Examination 2 were examined a second time in March 2006 for characteristics (i), (ii)
and (iii) in Examination 2. The number of drones available (up to 30 drones per hive at
21 days of age) were examined from 3 High and 3 Low Line hives. Results are shown
in Tables 4.13 and 4.14.
4.5.2.3 Disease identification
Forty drones from Lines 1 and 40 drones from Line 2 remaining from the semen
volume and sperm number examinations, January 2005, were held at -20°C until
examined at the CSIRO Entomology Laboratories, Canberra under the direction of Dr.
D. Anderson, March 14-17, 2005. Drones were examined for nosema disease and for
the virus diseases: Kashmir bee virus, chronic bee paralysis virus, black queen cell
virus, bee virus X, bee virus Y, cloudy wing virus and sacbrood virus.
Methodology
Nosema disease examination
The drone body was placed in distilled water on a watchglass and the intestine
dissected from the abdomen. The intestine was macerated in 1 mL distilled water and
placed on a vortex for 10 seconds. One drop of solution was placed on a slide, covered
with a coverslip, and examined with a light microscope at 400 magnifications. Three
fields of view were examined for the presence of spores. For drones where spores were
present, the number of spores per drone was calculated from the number of spores
present in 10 squares, each of 16 small squares, of a haemocytometer (Improved
Neubauer, depth 1 mm, 1/400 mm2) using Cantwell’s (1970) calculation tables.
139

Virus examination
The drone`s head and thorax were stored in100 µL insect Ringers solution in a labelled
Eppendorf tube until examined. For examination, the drone head and thorax were
placed in an Eppendorf tube with 900 µl phosphate buffer and 100 µl chloroform,
macerated, placed on a vortex for 30-45 seconds, and then centrifuged at 8000 rpm for
two minutes. The drone sample was placed in a fume cabinet and the clear liquid
removed and placed in a new, labelled Eppendorf tube.
Gel-diffusion plates were prepared using 0.25% Agarose gel with a diluted antiserum
of antiserum/insect Ringers 1/20. Antiserums used were Kashmir strain K23 (ACT
local strain), Kashmir strain 2 (Fiji), chronic bee paralysis, black queen cell virus, bee
virus X, bee virus Y, cloudy wing virus and sacbrood virus. Acute bee paralysis virus
was not examined for since it has not been identified in Australia. The gel-diffusion
plates containing the antiserums and drone extracts were held in a damp chamber
overnight and examined the following morning.
4.5.3 Statistical analysis
A two-sample test for equality of proportions with continuity correction was
undertaken.
4.5.4 Results
4.5.4.1 Confirmation of High Line and Low Breeding Lines
Drones from test queen bees were examined at a mature age on three occasions for the
three characteristics: (i) the proportion of drones releasing semen at their endophallus
after manual eversion, (ii) the volume of semen produced per drone, (iii) the number
of sperm produced per drone.
140
Examination 1.
When results from drones from all five High Line hives were compared against data
from drones from all three Low Line hives, a significant difference (P ≤ 0.05) was
found for the number of sperm produced per drone, and no significant differences
were found for the proportion of drones releasing semen after manual eversion, or for
the volume of semen produced per drone. When data from the two highest producing
High Line hives (hive numbers 3 and 5) were compared against data from the two
lowest producing Low Line hives (hive numbers 6 and 7) significant differences (P ≤
0.05) were found for all three characteristics examined (Table 4.10).
Examination 2.
No significant differences were found for the three characteristics examined when data from
drones from the 4 replacement High Line queen bees were compared against data from
drones from the 3 replacement Low Line queen bees (Tables 4.11 and 4.12).
Examination 3.
No significant differences were found for the three characteristics examined when data
from drones from 3 replacement High Line queen bees were compared against data
from drones from 3 replacement Low line queen bees in a second examination (Tables
4.13 and 4.14).
4.5.4.2 Disease examination
Virus disease
For the 40 High Line drones examined, no drones were found positive for virus
infection. For the 40 Low Line drones examined, one drone (L-11) showed a positive
reaction for sacbrood virus. No other virus infection was identified.
141

Nosema disease
(i) High Line - small numbers of spores were found in 10/40 High Line drones.
Numbers of spores present in the ten drones with spores present were av. 0.148 (ra.
0.05-0.225) x 106 spores per drone.
(ii) Low Line – Large numbers of spores were present per drone in two drones, drone
L-27 – 19.525 x 10⁶ and drone L-29 – 3.4 x 10⁶, and small numbers in two other
drones, drone L-35 – 0.075 x 10⁶ and drone L-38 – 0.025 x 10⁶ spores per drone.
Table 4. 9. Data from drones from the original High v Low breeding lines hive comparison experiment (Examination 1) showing the proportion of drones releasing semen, semen volume and sperm numbers for each hive sample for drones from each of the queen bees examined.
Hive Line*
Number Drones
Semen volume Number of sperm
number
of drones with per drone per drone
examined
semen %
average (range)µL
average (range)106
1 H 40 47.5 1.25 (0.2-1.8) 4.35 (0.23-8.91)2 H 40 65.0 1.00 (0.6-1.8) 3.24 (1.24-5.78)3 H 40 72.5 1.01 (0.6-1.4) 3.95 (2.04-8.04)4 H 40 69.6 0.98 (0.6-1.6) 4.33 (1.02-8.22)5 H 40 87.5 1.17 (0.6-1.6) 4.07 (1.88-7.63)6 L 40 60.0 0.67 (0.1-1.2) 2.08 (0.17-4.15)7 L 40 35.0 0.75 (0.2-1.1) 2.43 (0.62-4.65)8 L 40 77.5 0.82 (0.2-1.2) 2.70 (0.30-4.98)
* H = High Line, L = Low Line
142

Table 4.10. Analysis of data from Table 4.9, showing differences between drones from High and Low breeding line queen bees for all High line hives v. all Low line hives, and the two representative hives for High breeding line v. Low breeding line.
Hive numbers
Line Proportion of
drones producing
semen
Semen volume/dron
eµL
Number of sperm/drone 106
1,2,3,4,5 Hv. n.s.* n.s. s.
6,7,8 L3 and 5 H
v. s.** s. s.6 and 7 L
* n.s. = not significant (P ≤ 0.05)** s. = significant (P ≤ 0.05)
Table 4.11. Data from drones from the High and Low breeding line replacement queen bees (Examination 2) showing the proportion of drones releasing semen, semen volume and sperm numbers for each hive sample.
Hive Line* Number Drones Semen volume Number of spermnumber of drones with per drone per drone
examined semen%
average (range)
µL
average (range)106
1 H 30 43.3 1.10 (0.4-1.6) 7.17 (2.70-14.50)2 H 30 53.3 1.21 (1.0-1.6) 4.73 (1.35-10.48)3 H 30 50.0 0.99 (0.2-1.5) 3.68 (0.24-7.23)4 H 30 60.0 1.17 (0.6-1.5) 5.98 (3.24-10.8)5 L 30 63.3 0.84 (0.4-1.2) 4.32 (1.79-6.75)6 L 30 40.0 0.89 (0.6-1.4) 3.49 (0.93-5.32)7 L 30 70.0 0.82 (0.4-1.2) 3.47 (1.3-6.93)
* H = High Line, L = Low Line
143

Table 4.12. Analysis of data from Table 4.11 showing differences between drones from replacement High and Low breeding line queen bees for all High line hives v all Low line hives.
Hive numbers
Line Proportion of drones
producing semen
Semen volume/drone
µL
Number of sperm/drone
106
1,2,3,4
5,6,7
Hv.L
n.s.* n.s. n.s.
* n.s. = not significant (P ≤ 0.05)
Table 4.13. Data from drones from the High and Low breeding line replacement queen bees (Examination 3) showing the proportion of drones releasing semen, semen volume and sperm numbers for the combined High line hives and combined Low line lines.
Line Number of drones examined
Droneswith semen
%
Semen volume per drone
mean ± s.d.µL
Number of spermper drone
mean ± s.d.106
High
90 33.3 0.76 ± 0.08 4.0 ± 0.7
Low 59 35.6 0.81 ± 0.09 4.2 ± 0.8
Table 4.14. Analysis of data from Table 4.13 showing differences between drones from High and Low breeding line queen bees for all High line hives v all Low line hives.
Line Proportion of drones producing
semen
Semen volume/dron
eµL
Number of sperm/drone
106
Hv.L
n.s.* n.s. n.s.
* n.s. = not significant (P ≤ 0.05)
144

4.6 Drones not releasing semen after manual eversion
4.6.1 Initial examination
4.6.1.1 Introduction
A high proportion of drones aged 14-35 days did not release semen at the endophallus
after manual eversion, Table 4.1, for the four breeding lines examined the percent
releasing semen was, av. 59 (ra. 39-92) %, Table 4.2. This experiment was developed
to provide initial data on the presence of sperm in the seminal vesicles of mature age
drones not releasing semen after manual eversion.
4.6.1.2 Materials and methods
Drones were reared from open mated queens reared from instrumentally inseminated
breeder queens similar to A. m. ligustica from four commercial breeding lines from
eastern Australia. Drones were reared at Richmond, NSW, in six hives during
September 2006, and confined in their hives until 21-22 days of age using
methodology described in Chapter 3. Drones from the six hives were mixed with each
other during collection from their hives.
(i) Drones were selected at random, manually everted and the proportion of drones
producing semen at the endophallus recorded.
(ii) Thirty drones which produced semen at their endophallus after manual eversion
were numbered, the volume of semen on the endophallus measured and recorded, the
seminal vesicles were dissected from the drone`s abdomen and the number of sperm
present in the seminal vesicles counted and recorded. The intestines were removed
from the abdomen and the number of Nosema spp. spores present counted and
recorded. Methodology for all these procedures are described in Chapter 3.
(iii) Thirty drones which did not produce semen at the endophallus after manual
eversion were numbered, the seminal vesicles dissected from the abdomen and the
145

number of sperm present in the seminal vesicles counted and recorded. The intestine
was removed and the number of Nosema spp. spores counted and recorded.
Methodology for sperm counts and Nosema spp. spore counts.
The seminal vesicles or drone intestine, respectively, was placed in 0.5 mL water in a
mortar and pestle and crushed. The number of sperm, or nosema spores, was counted
in the five groups of 16 small squares at the four corners and centre of each end of a
haemocytometer (Improved Neubauer, depth 0.1 mm, 1/400 mm2): a total of 160 small
squares were counted/sample. The number of sperm present was calculated using the
methodology described in Chapter 3, and the number of Nosema spp. spores were
calculated according to Cantwell (1970).
4.6.1.3 Results
(i) Of the 250 drones examined by manual eversion, 173 (69.2%) produced semen
at the endophallus.
(ii) For the 30 drones examined which produced semen at the endophallus after
manual eversion -
- the volume of semen produced, av. 0.9 (ra. 0.5 – 1.2) µl
- 5/30 (16.7%) had sperm present in the seminal vesicles
- the number of sperm present in the seminal vesicles, av. 0.2 (ra. 0.003 – 0.09)
x 106 sperm per drone
- 2/30 (6.7%) contained Nosema spp. spores, 2.28 and 14.05 x 10⁶ spores per
drone
(iii) For the 30 drones examined which did not produce semen at the endophallus
after manual eversion -
-30/30 (100%) had sperm present in the seminal vesicles
- the number of sperm present in the seminal vesicles, average 1.38 (range 0.01
– 4.60) x 106
-7/30 (23.3%) of drones contained Nosema spp. spores, av. 0.59 (ra. 0.03 – 3.53)
x 106 spores per drone
Data for individual drones are shown in Table 4.15.
146

4.6.2 Manual eversion – comparison between two operators
4.6.2.1 Introduction
Chapter 4.1 discussed the collection of semen from drones for measurement of semen
volume and number of sperm produced by individual drones. One result from this
experiment was that for each of the four breeding lines of drones examined at ages 14-
35 days of age, only a proportion, 59 (ra. 32-92) % of drones released semen at the
endophallus after manual eversion, Table 4.1.The manual eversion of drones for all
data collected for Chapter 4, with the exceptions of Sections 4.5.3 and 4.5.4, was
carried out at Richmond, NSW, by the same operator, Ms. Gretchen Wheen (Operator
1), an experienced and skilled commercial honey bee instrumental insemination
expert. This experiment was carried out to compare success rates between Ms. G
Wheen (Operator 1) and a second person, J. Rhodes (Operator 2) when manually
everting drones.
4.6.2.2 Materials and methods
During March-April, 2007, drones were reared from one drone mother queen to a
mature age in one hive in a Richmond, NSW apiary using methodology described in s
Chapter 3. In April, 128 drones, 21-22 days of age were collected and held in a flight
box in the laboratory. Operator 1 and Operator 2 each selected 64 drones at random
from the flight box and manually everted each drone. Results of each eversion were
recorded with eversion ranked on a scale of 0-4; 0 = no eversion; 1 = one quarter
eversion; 2 = one half eversion; 3 = three quarters eversion; and 4 = full eversion.
147
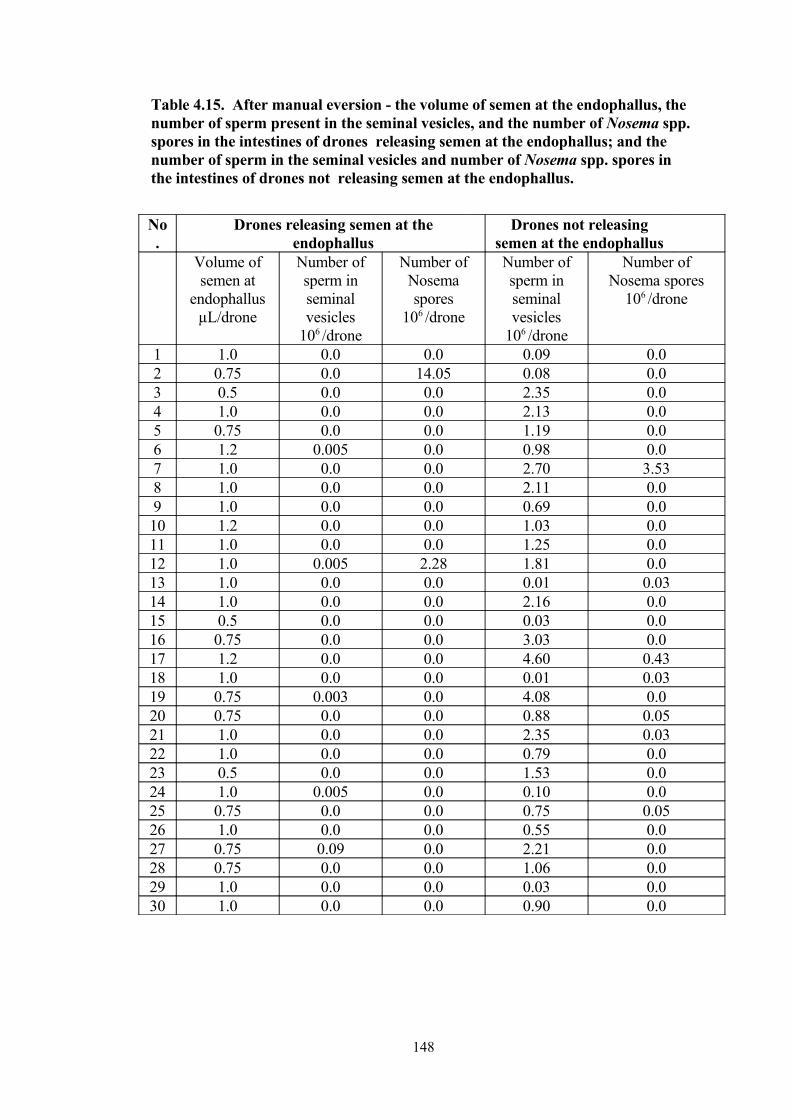
Table 4.15. After manual eversion - the volume of semen at the endophallus, the number of sperm present in the seminal vesicles, and the number of Nosema spp. spores in the intestines of drones releasing semen at the endophallus; and the number of sperm in the seminal vesicles and number of Nosema spp. spores in the intestines of drones not releasing semen at the endophallus.
No.
Drones releasing semen at the endophallus
Drones not releasing semen at the endophallus
Volume of semen at
endophallusµL/drone
Number of sperm in seminal vesicles
106 /drone
Number of Nosema spores
106 /drone
Number of sperm in seminal vesicles
106 /drone
Number of Nosema spores
106 /drone
1 1.0 0.0 0.0 0.09 0.02 0.75 0.0 14.05 0.08 0.03 0.5 0.0 0.0 2.35 0.04 1.0 0.0 0.0 2.13 0.05 0.75 0.0 0.0 1.19 0.06 1.2 0.005 0.0 0.98 0.07 1.0 0.0 0.0 2.70 3.538 1.0 0.0 0.0 2.11 0.09 1.0 0.0 0.0 0.69 0.010 1.2 0.0 0.0 1.03 0.011 1.0 0.0 0.0 1.25 0.012 1.0 0.005 2.28 1.81 0.013 1.0 0.0 0.0 0.01 0.0314 1.0 0.0 0.0 2.16 0.015 0.5 0.0 0.0 0.03 0.016 0.75 0.0 0.0 3.03 0.017 1.2 0.0 0.0 4.60 0.4318 1.0 0.0 0.0 0.01 0.0319 0.75 0.003 0.0 4.08 0.020 0.75 0.0 0.0 0.88 0.0521 1.0 0.0 0.0 2.35 0.0322 1.0 0.0 0.0 0.79 0.023 0.5 0.0 0.0 1.53 0.024 1.0 0.005 0.0 0.10 0.025 0.75 0.0 0.0 0.75 0.0526 1.0 0.0 0.0 0.55 0.027 0.75 0.09 0.0 2.21 0.028 0.75 0.0 0.0 1.06 0.029 1.0 0.0 0.0 0.03 0.030 1.0 0.0 0.0 0.90 0.0
148
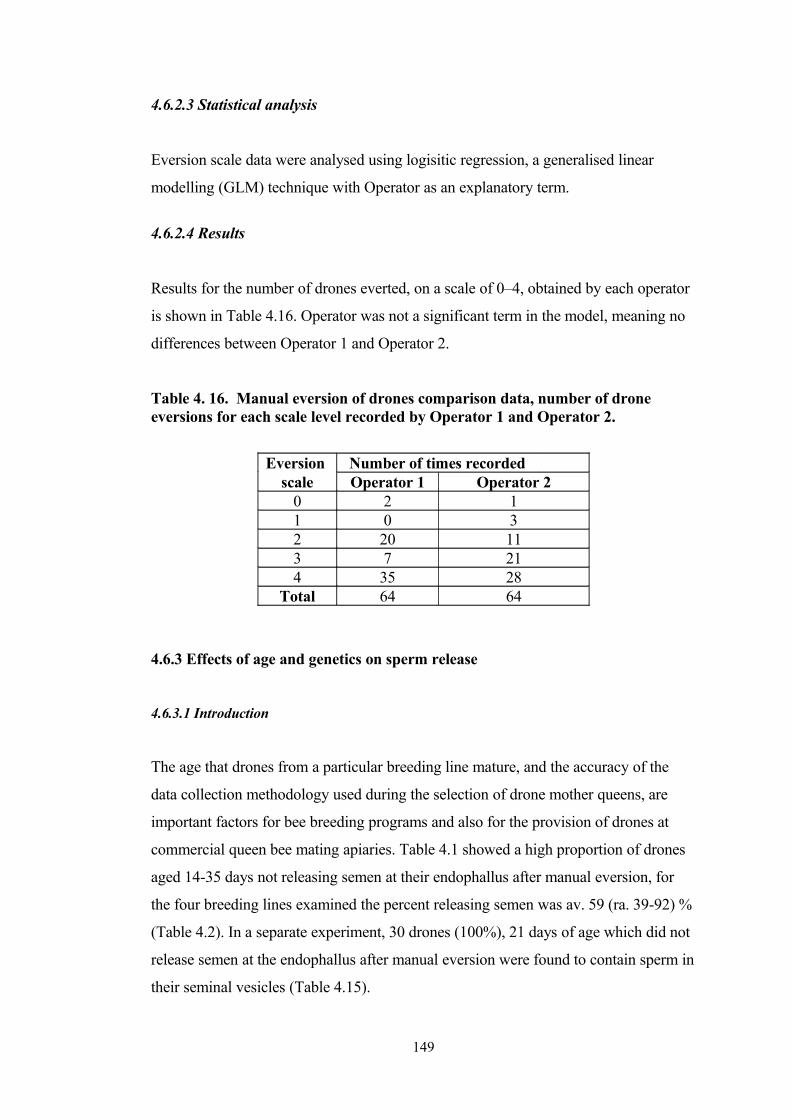
4.6.2.3 Statistical analysis
Eversion scale data were analysed using logisitic regression, a generalised linear
modelling (GLM) technique with Operator as an explanatory term.
4.6.2.4 Results
Results for the number of drones everted, on a scale of 0–4, obtained by each operator
is shown in Table 4.16. Operator was not a significant term in the model, meaning no
differences between Operator 1 and Operator 2.
Table 4. 16. Manual eversion of drones comparison data, number of drone eversions for each scale level recorded by Operator 1 and Operator 2.
Eversion Number of times recordedscale Operator 1 Operator 2
0 2 11 0 32 20 113 7 214 35 28
Total 64 64
4.6.3 Effects of age and genetics on sperm release
4.6.3.1 Introduction
The age that drones from a particular breeding line mature, and the accuracy of the
data collection methodology used during the selection of drone mother queens, are
important factors for bee breeding programs and also for the provision of drones at
commercial queen bee mating apiaries. Table 4.1 showed a high proportion of drones
aged 14-35 days not releasing semen at their endophallus after manual eversion, for
the four breeding lines examined the percent releasing semen was av. 59 (ra. 39-92) %
(Table 4.2). In a separate experiment, 30 drones (100%), 21 days of age which did not
release semen at the endophallus after manual eversion were found to contain sperm in
their seminal vesicles (Table 4.15).
149

The age at which drones become mature may be defined as the age a drone is capable
of mating with a queen bee under natural conditions. Release of semen after manual
eversion is not an indicator of drone maturation as the same values stimulating semen
release in a natural mating do not apply, and completion of sperm movement to the
seminal vesicles from the testes and filling of the mucous glands, in themselves, are
not sufficient to define the age at which a drone matures. For the purpose of this
experiment, drone maturation age was considered as the age of the drone when all of
its sperm had been released from the seminal vesicles and were present in seminal
fluid at the tip of the endophallus after manual eversion, from a significant number of
drones.
Bishop (1920) considered sperm and seminal fluid organ development was complete
in drones about 9-12 days after emergence; Jaycox (1961) assessed drone sexual
maturity on the movement of sperm from the testes to the seminal vesicles and vasa
deferentia, which was completed at age 8-11 days; Moritz, (1989) found sperm
completed their migration to the vasa deferentia at about 2-3 days old and completed a
second physiological process during a second stage of maturation, stating that drones
may be used for inseminating queens at 12 days of age. Colonello and Hartfelder
(2003) examined mucous gland protein content during sexual maturation, that peaked
at five day of age then decreased to a stable level at day eight, which they commented
coincided with the age drones first flight activities. The development of mucous glands
was also examined by Moors et al., (2005) finding accumulation of mucous
commenced at the onset of adult life and reached its maximum by day 6. None of the
above authors commented on drones which had reached the ages specified and did not
produce semen after manual eversion, nor the ability of those drones to mate with
queen bees under natural conditions.
This experiment was developed to provide initial data on the presence of sperm in the
seminal vesicles of mature age drones not releasing semen after manual eversion by
determining the number of drones retaining sperm in their seminal vesicles, and by
comparing viability and motility assessment of sperm released at the endophallus with
sperm retained in the seminal vesicles.
150

4.6.3.2 Materials and methods
Two open-mated sister queen bees reared from unrelated instrumentally inseminated
breeder queens of the type A. m. ligustica were obtained from each of four commercial
queen bee producers in eastern Australia, designated Lines 1, 2, 3 and 4. The eight
queen bees were introduced into colonies of similar strength at the Department of
Primary Industries Research Station, Tamworth, NSW. Drones were reared from the
eight queen bees in December 2006 with drones emerging and being marked at one
day of age in January, 2007. Drone rearing methodology is described in Chapter 3. All
drone rearing colonies were fed with pollen and dry sugar throughout the experiment
to reduce nutritional effects on the drone characteristics being examined. All hives
were free from clinical signs of disease.
Ten drones from each breeding line were caught each day for examination when the
drones were 3 - 25 days old, and also when the drones were 30 days old, i.e. a total of
24 times. Line 3 drones were present in their hives and able to be sampled between 3 -
18 days of age only. Drones were caught early in the morning before drone flight
commenced and held in a small flight cage (approx. 30 x 30 x 50 cm) supported by a
cage holding approx. 50 young worker bees with access to queen candy, which fed and
supported the drones until examined.
Examination comprised manual eversion of the drone by J. Rhodes, with the level of
eversion of the endophallus recorded as a rating of 0 – 4, as previously described in
Section 4.1. The amount of the endophallus which had everted was dissected from the
drone and the number of sperm present determined. The drone`s abdomen was opened
dorsally and the seminal vesicles, vas deferens and remaining portion of the
endophallus dissected from the drone using forceps (Inox No. 4) ,and the number of
sperm present in the removed organs determined. At four intervals: when drones were
4, 9, 18 and 23 days old, during dissection of the seminal vesicles, each drone`s
intestine was removed and the number of Nosema spp. spores were assessed for
individual drones.
For each drone the three parts: everted portion of the endophallus, seminal vesicles
plus attached remaining organs, and the intestine, were examined separately. The
number of sperm in each part of the drone`s reproductive system was determined by
151
mashing the dissected organ in a mortar and pestle in 0.5 mL water, and counting the
number of sperm present in 10 squares (each square containing 16 small squares) of a
the haemocytometer previously described. The total number of sperm in the organ
being examined was calculated using the formula in Nguyen (1995) (see Chapter 3),
modified for the reduced dilution rate.
The presence of nosema spores was determined by mashing the drone intestine in 0.5
mL water and using a light microscope at 400 X magnifications to identify spores
present in the sample.
4.6.3.3 Statistical analysis
Data were analysed with a Generalised Linear Model (GLM), the variables being
analysed examined the effects of breeding line, source of sperm (seminal vesicles and
endophallus) and the age of the drone (days). A Chi-square analysis was used to test
the association between drone age and eversion rating.
4.6.3.4 Results
Comparison of sperm numbers in endophallus and in seminal vesicles
(a) Line effect. No significant difference was found (P = 0.263) between the four
drone lines for total number of sperm per drone (Table 4.17).
(b) Source effect. A significant sperm source effect was identified (P < 0.001), with
total sperm numbers from the seminal vesicles higher than total sperm numbers from
the endophallus (Table 4.18).
(c) Age effect. There was a significant linear relationship (P = 0.006) between age and
total sperm, for the number of sperm present from both sources (seminal vesicles and
endophallus), for all drones (Table 4.19 and Figure 4.2).
152

(d) Source.Age effect. There was an age effect (P < 0.001) for the number of sperm
present in the seminal vesicles or in the endophallus for all drones (Table 4.20 and
Figure 4.3).
(e) Line.Source effect. A significant line.source effect was identified (P = 0.003) for
all drones from each line for the number of sperm produced from each source (seminal
vesicles or endophallus), for all ages (Table 4.21)
(f) Line.Age effect. No significant difference (P = 0.456), was found between the four
breeding lines and the 24 ages of drones examined (Table 4.22).
(g) Line. Source.Age effect. A significant three way interaction effect was found (P =
0.022) for the source of sperm produced in the seminal vesicles or in the endophallus,
for drones from each line examined for each age.
2. Nosema disease examinations.
No Nosema spp. spores were observed for breeding lines 1, 2, 3 and 4 examined at 4,
9, and 18 days of age, and for breeding lines 1, 2 and 3 examined at 23 days of age. A
total of 148 drones were examined.
3. Endophallus eversion ratings
(a) Line.Eversion effect. A significant line.eversion effect (P = 0.018) was found for
the total number of sperm produced by drones from each line for each eversion rating
(Table 4.23).
(b) Age.Eversion effect. A significant age.eversion effect (P < 0.001) was found for
the total number of drones of each age for each eversion rating (Table 4.24).
4. Number of sperm produced per drone.
From the total number of sperm from each drone for all drones for all ages (n=709) the
mean was 2.12 (ra. 0.00-6.94) x 106 sperm per drone.
153

5. Percent of all drones releasing sperm from seminal vesicles.
Of the 878 drones examined between 3 and 30 days of age, 119 (13.6%) released all of
their sperm from the seminal vesicles after manual eversion. The percent of drones of
each age releasing all their sperm after manual eversion is shown in Table 4.25.
Table 4. 17. Line effect. Predicted effect of breeding line on the number of sperm present from both sources (seminal vesicles and endophallus) for all drones of all ages.
Line Predicted value*1 1550.852 1574.823 1435.614 1377.49
s.e.d. Mean 83.31
* Data were square root transformed
Table 4.18. Sperm source effect. Predicted values of sperm source, seminal vesicles v. endophallus, for all drones for all ages.
Source Predicted value*Seminal vesicles 1177.92Endophallus 374.60s.e.d. Mean 31.51
* Data were square root transformed
154
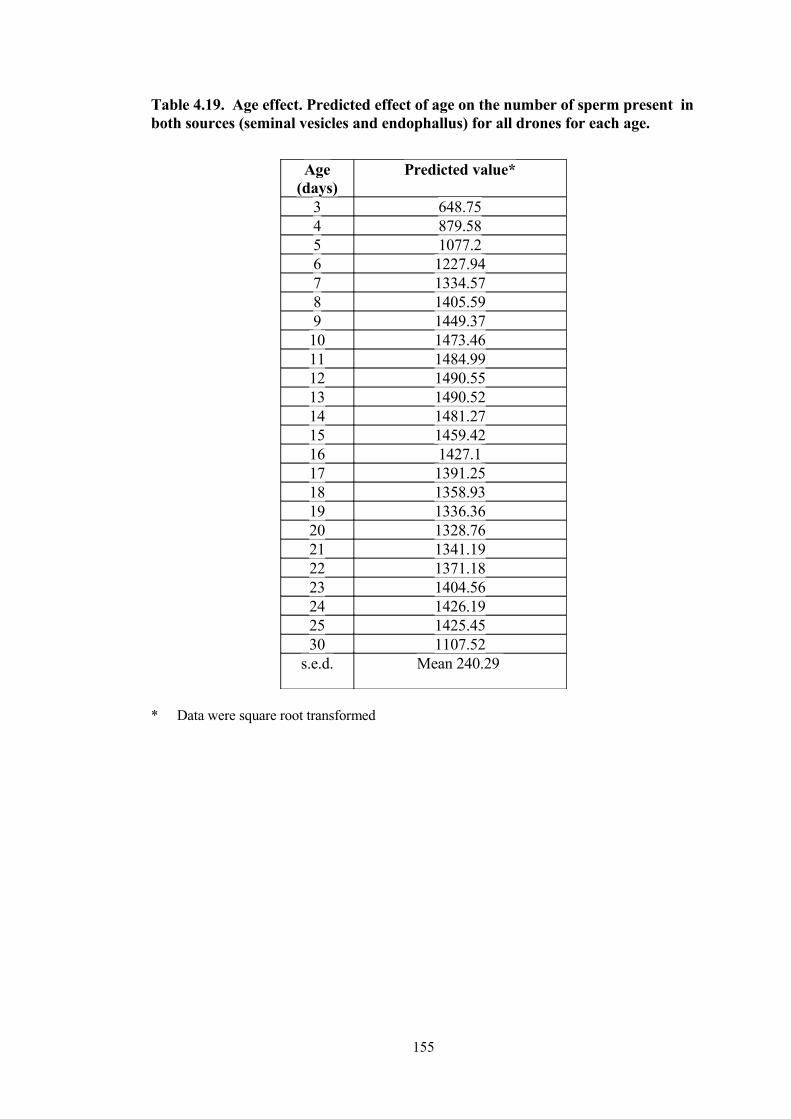
Table 4.19. Age effect. Predicted effect of age on the number of sperm present in both sources (seminal vesicles and endophallus) for all drones for each age.
Age(days)
Predicted value*
3 648.754 879.585 1077.26 1227.947 1334.578 1405.599 1449.3710 1473.4611 1484.9912 1490.5513 1490.5214 1481.2715 1459.4216 1427.117 1391.2518 1358.9319 1336.3620 1328.7621 1341.1922 1371.1823 1404.5624 1426.1925 1425.4530 1107.52
s.e.d. Mean 240.29
* Data were square root transformed
155

Table 4.20. Source.Age effect. Predicted effect of age on the number of sperm present in the seminal vesicles or in the endophallus for all drones for each age.
Age(days)
Predicted value
Seminal vesicles
Endophallus
3 939.15 -179.604 1019.72 -69.365 1090.93 31.526 1148.65 118.927 1191.92 191.868 1220.86 250.479 1235.75 295.0410 1238.25 327.2111 1230.65 349.2812 1215.21 363.5113 1193.91 371.8914 1168.54 376.1915 1140.85 378.1816 1112.45 379.4517 1084.78 381.4518 1059.25 385.6019 1036.83 392.8420 1017.91 403.6021 1002.88 418.2422 990.44 435.4823 976.77 451.4824 957.83 462.2125 931.04 465.0930 708.30 390.72s.e.d. Mean 136.41
* Data were square root transformed
156

Table 4.21. Line.Source effect. Predicted effect of line on the number of sperm present in the seminal vesicles and in the endophallus for drones of all ages.
Line Predicted value*Seminalvesicles
Endophallus
1 1269.98 284.372 1251.00 415.313 1118.97 404.374 1071.73 394.33
s.e.d. Mean 82.24
* Data were square root transformed
Table 4.22. Line.Age effect. Predicted effect of drones from four breeding lines on the age drones were examined for sperm produced from both sources (seminal vesicles and endophallus).
Age Predicted value*(days) Line
1 2 3 43 339.71 454.24 316.31 408.844 438.97 547.99 416.32 497.455 528.87 632.38 506.96 576.696 605.29 703.29 584.12 642.457 667.25 759.74 646.82 693.758 714.88 801.86 695.19 730.729 748.46 829.94 729.52 753.6510 769.66 845.62 751.45 764.1911 780.74 851.20 763.28 764.6212 784.00 848.95 767.28 757.2213 781.39 840.83 765.42 743.9614 774.71 828.64 759.48 726.6215 765.71 814.14 751.23 706.9716 756.01 798.93 742.26 686.6117 747.03 784.44 734.03 666.9818 740.19 773.00 727.93 649.4919 736.45 762.85 724.94 635.0920 736.23 757.12 725.46 624.2221 739.89 755.27 729.86 617.2222 746.14 756.02 736.86 612.8223 751.16 755.53 742.62 607.1924 750.91 749.78 743.12 596.2825 742.81 736.17 735.76 577.5330 613.53 579.35 610.20 394.98
s.e.d. Mean84.81
min.10.55
max.266.34
* Data were square root transformed
157

Table 4.23. Line.Eversion effect. Predicted values for the total number of sperm produced by drones from each line for each eversion rating.
Line Predicted value*Eversion rating
0 1 2 3 41 1570 1470 1272 1505 2242 1720 1445 1424 1545 7283 1595 1333 1298 1098 8474 1607 1524 1402 940 1344
s.e.d. Mean 205.6
min. 89.1
max. 433.5
* Data were square root transformed
Table 4.24. Age. Eversion effect. The number of drones recorded at each age for each eversion rating.
Age(days)
Number of dronesEversion rating
0 1 2 3 43 1 17 11 0 14 1 10 29 0 05 5 7 28 0 06 10 6 24 0 07 11 4 16 8 18 14 5 13 8 09 11 6 14 7 210 10 5 13 11 111 13 6 10 9 212 7 4 15 12 213 9 9 10 9 214 10 7 12 8 315 10 7 12 6 516 10 3 16 4 717 5 7 15 4 918 9 3 17 2 719 0 4 13 3 1020 8 2 8 2 1021 1 2 9 3 1522 4 4 11 0 1123 0 0 9 0 2124 1 4 6 1 1825 0 0 2 3 530 1 1 8 0 20
158
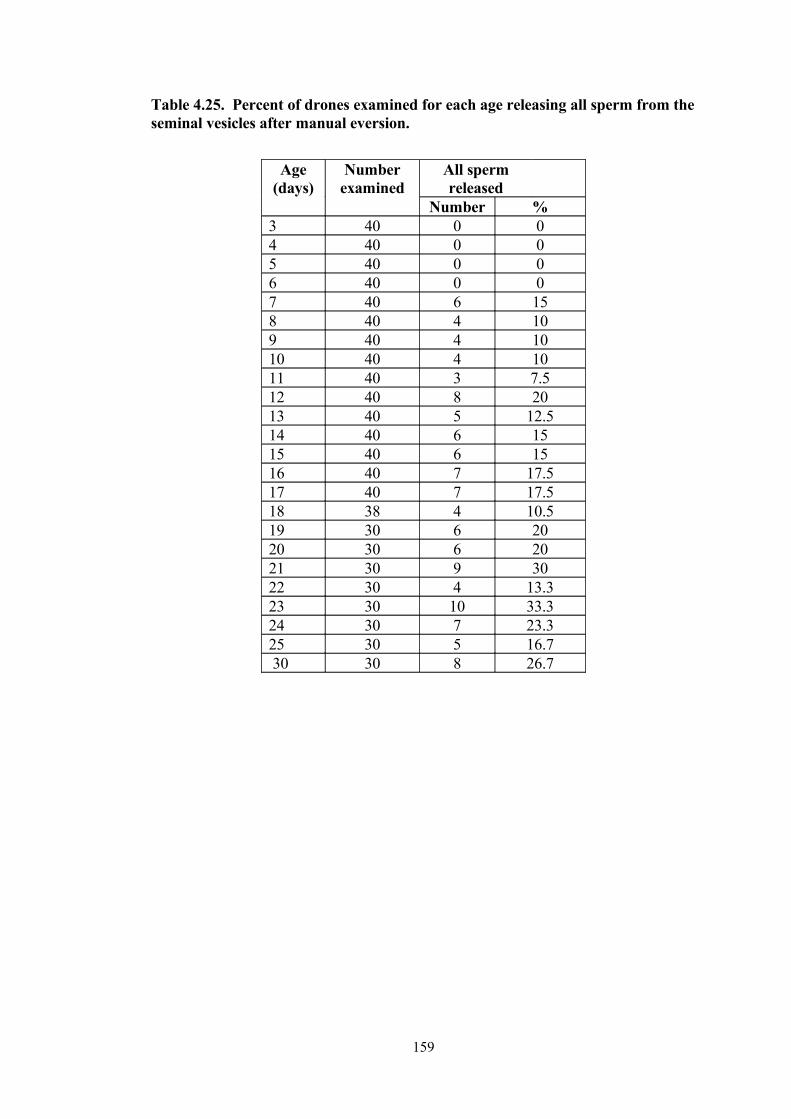
Table 4.25. Percent of drones examined for each age releasing all sperm from the seminal vesicles after manual eversion.
Age(days)
Numberexamined
All sperm released
Number %3 40 0 04 40 0 05 40 0 06 40 0 07 40 6 158 40 4 109 40 4 1010 40 4 1011 40 3 7.512 40 8 2013 40 5 12.514 40 6 1515 40 6 1516 40 7 17.517 40 7 17.518 38 4 10.519 30 6 2020 30 6 2021 30 9 3022 30 4 13.323 30 10 33.324 30 7 23.325 30 5 16.7 30 30 8 26.7
159

Figure 4.2. Age effect. Cubic smoothing spline describing change in sperm count
with age of the drone.
Figure 4.3. Source.Age effect. Cubic smoothing spline describing changes in
sperm numbers with drone age (days) for source of sperm (seminal vesicle or
endophallus).
160

4.6.4 Semen movement
4.6.4.1 Introduction
An investigation of the location of sperm and seminal fluid following manual eversion
of drones 3 to 30 days of age showed a significant sperm Source.Age effect (P <
0.001), with higher numbers of sperm in the seminal vesicles of younger aged drones
and higher numbers of sperm at the endophallus in older age drones (Table 4.20) and
Figure 4.3 (Section 4.6). For all ages between 3 and 30 days, there was a proportion of
drones with sperm remaining in the seminal vesicles after manual eversion suggesting
that the problem of sperm retention in the seminal vesicles of older age drones may
result from either manual eversion being an inefficient method for retrieving sperm,
and/or there is a problem with the sperm e.g. low viability and / or low motility.
This experiment examined the viability and motility of sperm present in the seminal
vesicles and in the endophallus of individual mature age drones after manual eversion,
to provide information to assist with understanding why sperm was retained in the
seminal vesicles following manual eversion. The experiment was carried out in 2007
with the assistance of Ms. Liz Kabanoff, University of Western Sydney, Richmond,
NSW.
4.6.4.2 Materials and methods
The drone rearing apiary was located at G. Wheen`s property, Richmond, NSW.
Drones emerged and were marked on October 10, 2007 and examined at 28 days of
age on November 6, 2007. Drones were reared from the same drone mother, a
commercially reared open-mated queen similar to A. m. ligustica produced from an
instrumentally inseminated breeder queen. Drones were reared according to the
method described in Chapter 3.
Twenty four drones were examined. Drones were caught early in the morning and held
in a flight cage supported by young worker bees with access to queen candy until
examined. Drones were manually everted by J. Rhodes, the amount of endophallus
161
which everted was dissected from the drone, placed in 50 µl buffer, mashed, and
divided into 40µL for sperm viability assessment and 10 µL for sperm motility
assessment. The seminal vesicles were dissected from the drone, placed in 50 µL
buffer, mashed and divided into 40µL for sperm viability assessment and 10 µL for
sperm motility assessment. Chapter 3 contains descriptions of methodologies used
above.
Sperm viability assessment was carried out using a Live/Dead Sperm Viability Kit
containing a membrane-permeant nucleic acid stain and a dead cell stain, and sperm
motility was assessed by scoring sperm movement at room temperature at five levels
of movement. Methodologies for sperm viability and sperm motility experiments are
described in Chapter 3.
4.6.4.3 Statistical analysis
Sperm viability
Data were analysed with a Generalised Linear Model (GLM) to test the effects of
sperm source (endophallus or seminal vesicles), condition (dead or alive) and the
interaction between them. Data were square root transformed to satisfy some of the
assumptions underlying the analysis.
Sperm motility
Data were analysed with a Generalised Linear Model (GLM) to test the effects of
sperm source (endophallus or seminal vesicles), with motility ratings as the response
variable.
162
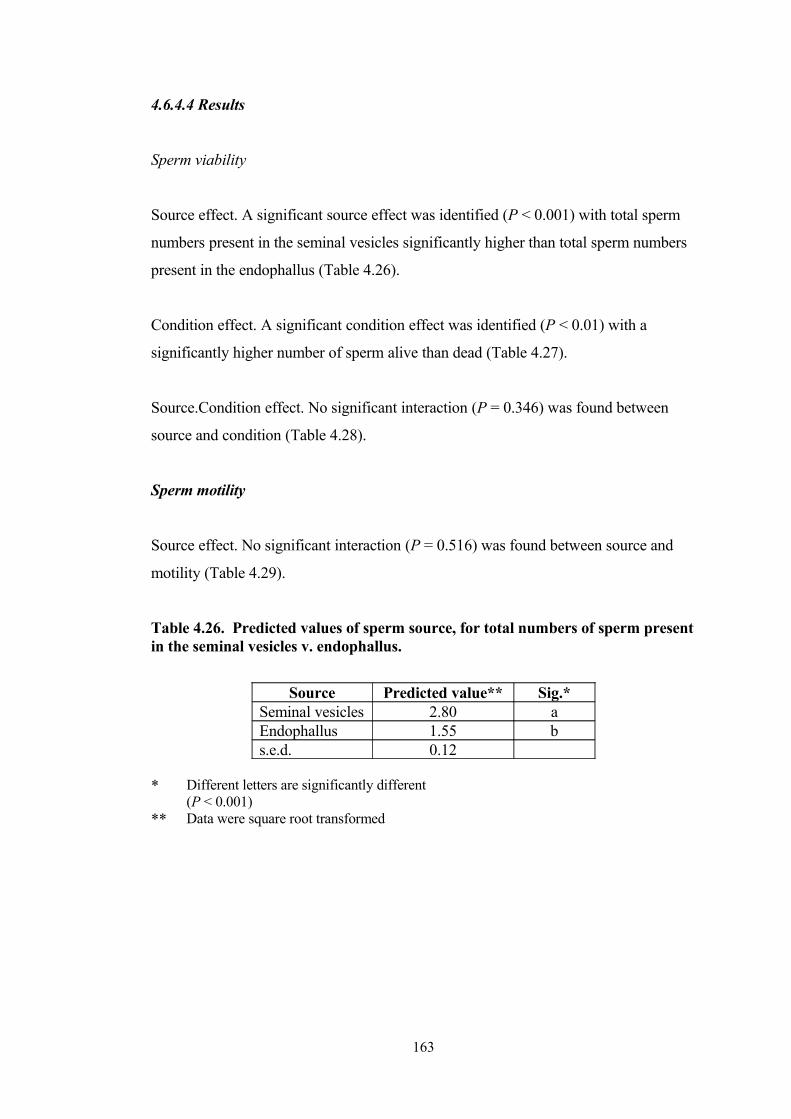
4.6.4.4 Results
Sperm viability
Source effect. A significant source effect was identified (P < 0.001) with total sperm
numbers present in the seminal vesicles significantly higher than total sperm numbers
present in the endophallus (Table 4.26).
Condition effect. A significant condition effect was identified (P < 0.01) with a
significantly higher number of sperm alive than dead (Table 4.27).
Source.Condition effect. No significant interaction (P = 0.346) was found between
source and condition (Table 4.28).
Sperm motility
Source effect. No significant interaction (P = 0.516) was found between source and
motility (Table 4.29).
Table 4.26. Predicted values of sperm source, for total numbers of sperm present in the seminal vesicles v. endophallus.
Source Predicted value** Sig.*Seminal vesicles 2.80 aEndophallus 1.55 bs.e.d. 0.12
* Different letters are significantly different (P < 0.001)
** Data were square root transformed
163
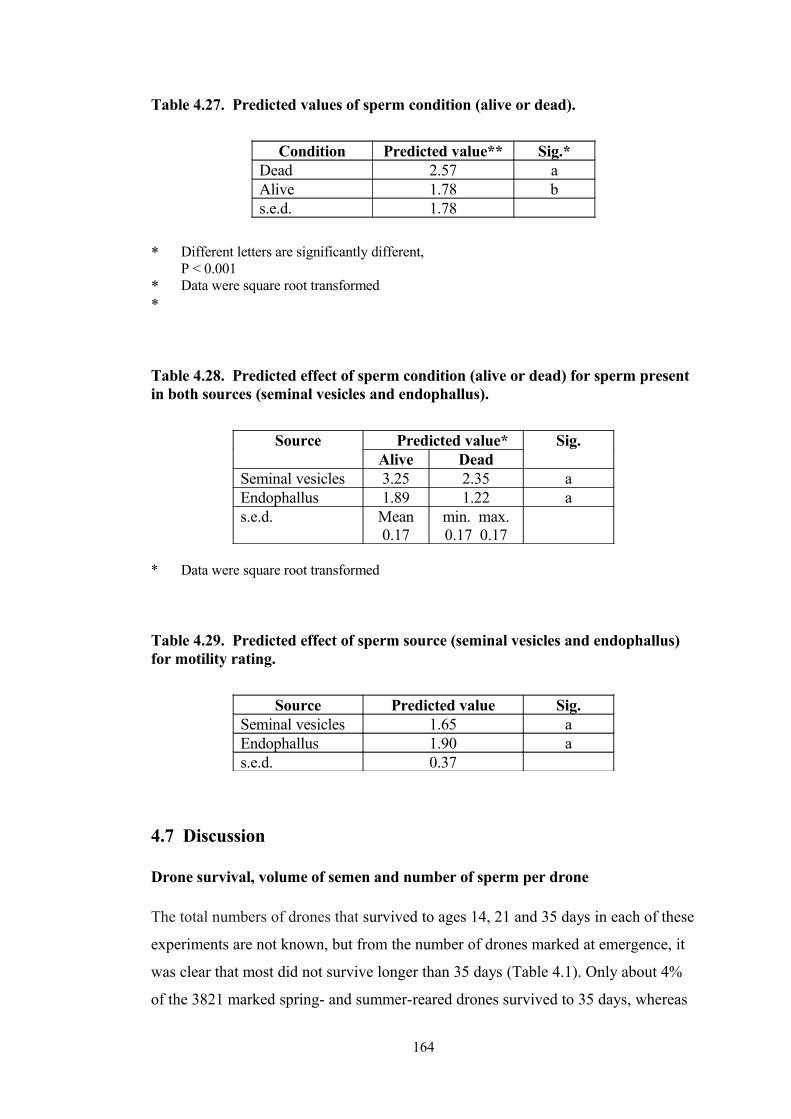
Table 4.27. Predicted values of sperm condition (alive or dead).
Condition Predicted value** Sig.*Dead 2.57 aAlive 1.78 bs.e.d. 1.78
* Different letters are significantly different, P < 0.001
**
Data were square root transformed
Table 4.28. Predicted effect of sperm condition (alive or dead) for sperm present in both sources (seminal vesicles and endophallus).
Source Predicted value* Sig.Alive Dead
Seminal vesicles 3.25 2.35 aEndophallus 1.89 1.22 as.e.d. Mean
0.17min. max.0.17 0.17
* Data were square root transformed
Table 4.29. Predicted effect of sperm source (seminal vesicles and endophallus) for motility rating.
Source Predicted value Sig.Seminal vesicles 1.65 aEndophallus 1.90 as.e.d. 0.37
4.7 Discussion
Drone survival, volume of semen and number of sperm per drone
The total numbers of drones that survived to ages 14, 21 and 35 days in each of these
experiments are not known, but from the number of drones marked at emergence, it
was clear that most did not survive longer than 35 days (Table 4.1). Only about 4%
of the 3821 marked spring- and summer-reared drones survived to 35 days, whereas
164

none of the 2109 marked autumn-reared drones survived to 35 days (Table 4.1)..
Hence, the life span of drones in this study was similar to that reported in other stud-
ies (Witherell, 1972; Fukuda and Ohtani, 1977).
The volumes of semen in drones of the four breeding lines (Table 4.2) were also
mostly comparable with those reported in other studies. The mean volume of semen
per drone in this study of 1.0 3 μL (range 0.72 ± 0.04−1.12 ±0.04 μL) (Table 4.3)
was within the range reported by Woyke (1960; quoted in Rinderer, 1986) of 1.3 μL
per drone, and by Collins and Pettis (2001) of 0.95 (range 0.48–1.67) μL per drone.
However, the mean number of sperm produced per drone in this study, 3.17 (range
1.88 – 4.11) x 106 (Table 4.4) was at the lower end of sperm numbers reported in
studies by Schlüns et al. (2003) of 11.9 (±1.0) x 106, Woyke (1960; quoted in Koeni-
ger et al., 2005) of 11–12 x 106, Collins and Pettis (2001) of 8.66 x 10⁶, Köhler
(1955; quoted in Ruttner, 1956) of 4.5 x 10⁶ and Anderson (2004) 3.19 (±2.37) x 106.
Interestingly, the sperm count reported by Anderson (2004) was similar to that ob-
tained in the current study, and employed a similar counting methodology, and also
used drones in a commercial queen-rearing apiary in the same region as this study
(viz. south east Australia). Hence, while the volumes of semen produced by drones
in this study were comparable with those from drones observed in other studies, the
concentration of sperm in their semen was generally less. As the drone mother colon-
ies in these studies were fed pollen and sugar syrup on a continuous basis, it is un-
likely that the reduced sperm concentrations were due to nutritional effects. Perhaps
the large differences in sperm numbers reported to date by different authors may be
due to differences in the counting method used. In this study, sperm was counted in
semen released at the tip of the endophallus following manual eversion and dilution
in water; whereas in some other studies, sperm numbers have been determined from
seminal vesicles.
In this study, increasing semen volume did not always correspond with increased
sperm numbers. The predicted means for semen volume (Table 4.3) showed a sea-
sonal effect, with spring drones producing significantly higher volumes of semen
than summer and autumn drones. Yet, autumn drones produced significantly more
sperm than summer drones which, in turn, produced more sperm than spring drones.
165

The higher volume of semen produced by spring drones but lower numbers of sperm
(Table 4.4) indicates a seasonal effect on sperm production. The drones examined in
these studies released semen at a much older age than has been previously reported.
Earlier studies reported that sperm production in drones is largely completed by the
time adult drones reach sexual maturity and can be released in the seminal fluids of
drones at that stage, or when they are about 9–12 days old (Bishop, 1920). Yet, in
this study, a far higher proportion of drones released semen at the endophallus after
manual eversion when aged 35 days (75.8%) than when aged 14 days (58.6%) or 21
days (52.6%) (Table 4.2). Anderson (2004) also reported that adult drones older than
20 days produced more semen than younger drones and, as mentioned, that study
was carried out in a similar geographical region to that of the current study. Thus,
there appears to be greater variation in the time that drones reach sexual maturity,
which is the stage at which they release seminal fluid and sperm from the endophal-
lus (Bishop, 1920a) than is currently recognized. These results also indicated that se-
men release (and thus the time taken for drones to reach sexual maturity) is depend-
ent on the genetics of the drones. For instance, significantly more drones from line 2
released semen at day 14 than drones of the other lines (Table 4.1). Line 2 queen
mothers were sourced from a honey bee breeding program which has been in opera-
tion in excess of 20 years with selection based on field evaluation combined with the
use of instrumental insemination to produce the following season’s breeding stock.
While not specifically selecting drones producing a large volume of semen, these
drones may have inadvertently been selected over drones producing a smaller
volume of semen. Sperm numbers in drone honey bees have been found to depend
on body size (Schlüns et al., 2003). Even though body size was not measured here,
results clearly showed that sperm numbers in drones also depend on the genetics of
the drones. Drones from line 2 produced significantly more sperm after manual ever-
sion than drones derived from the other three lines (Table 4.4). Indeed, the data in-
dicate that the genetics of the drones underpins all aspects of seminal fluid and sperm
production in drones, including the proportion of drones that release semen, the
volume of semen produced per drone, and the number of sperms produced per drone.
A relatively large proportion (40.6%) of all drones examined here when 14 to 35
days old did not provide a semen sample (and, hence, sperm). This was due to the
drones either releasing no semen or insufficient amounts to be collected (Table 4.1).
166
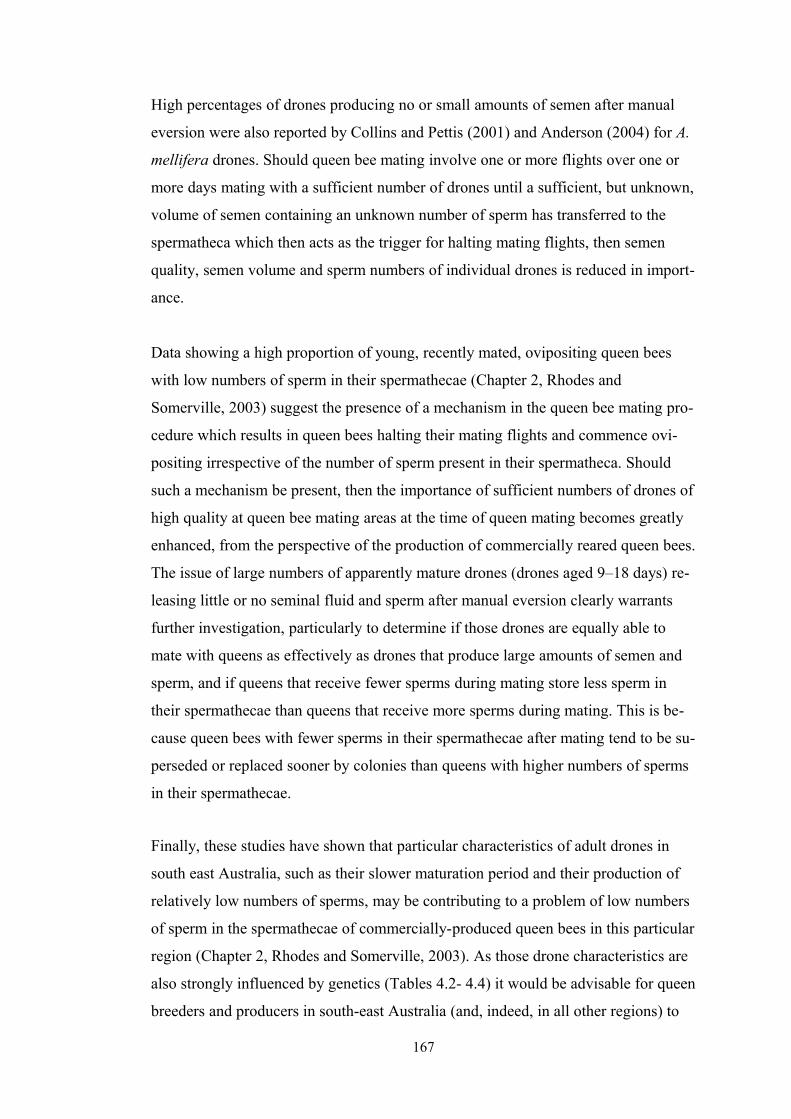
High percentages of drones producing no or small amounts of semen after manual
eversion were also reported by Collins and Pettis (2001) and Anderson (2004) for A.
mellifera drones. Should queen bee mating involve one or more flights over one or
more days mating with a sufficient number of drones until a sufficient, but unknown,
volume of semen containing an unknown number of sperm has transferred to the
spermatheca which then acts as the trigger for halting mating flights, then semen
quality, semen volume and sperm numbers of individual drones is reduced in import-
ance.
Data showing a high proportion of young, recently mated, ovipositing queen bees
with low numbers of sperm in their spermathecae (Chapter 2, Rhodes and
Somerville, 2003) suggest the presence of a mechanism in the queen bee mating pro-
cedure which results in queen bees halting their mating flights and commence ovi-
positing irrespective of the number of sperm present in their spermatheca. Should
such a mechanism be present, then the importance of sufficient numbers of drones of
high quality at queen bee mating areas at the time of queen mating becomes greatly
enhanced, from the perspective of the production of commercially reared queen bees.
The issue of large numbers of apparently mature drones (drones aged 9–18 days) re-
leasing little or no seminal fluid and sperm after manual eversion clearly warrants
further investigation, particularly to determine if those drones are equally able to
mate with queens as effectively as drones that produce large amounts of semen and
sperm, and if queens that receive fewer sperms during mating store less sperm in
their spermathecae than queens that receive more sperms during mating. This is be-
cause queen bees with fewer sperms in their spermathecae after mating tend to be su-
perseded or replaced sooner by colonies than queens with higher numbers of sperms
in their spermathecae.
Finally, these studies have shown that particular characteristics of adult drones in
south east Australia, such as their slower maturation period and their production of
relatively low numbers of sperms, may be contributing to a problem of low numbers
of sperm in the spermathecae of commercially-produced queen bees in this particular
region (Chapter 2, Rhodes and Somerville, 2003). As those drone characteristics are
also strongly influenced by genetics (Tables 4.2- 4.4) it would be advisable for queen
breeders and producers in south-east Australia (and, indeed, in all other regions) to
167
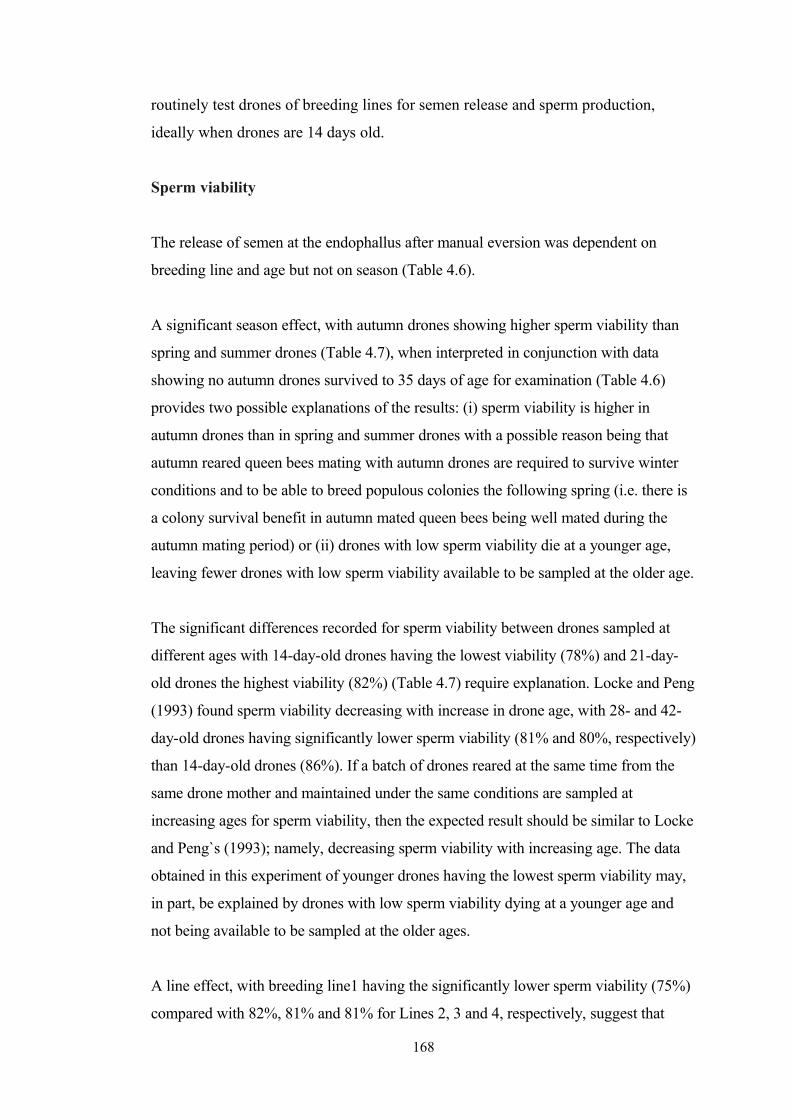
routinely test drones of breeding lines for semen release and sperm production,
ideally when drones are 14 days old.
Sperm viability
The release of semen at the endophallus after manual eversion was dependent on
breeding line and age but not on season (Table 4.6).
A significant season effect, with autumn drones showing higher sperm viability than
spring and summer drones (Table 4.7), when interpreted in conjunction with data
showing no autumn drones survived to 35 days of age for examination (Table 4.6)
provides two possible explanations of the results: (i) sperm viability is higher in
autumn drones than in spring and summer drones with a possible reason being that
autumn reared queen bees mating with autumn drones are required to survive winter
conditions and to be able to breed populous colonies the following spring (i.e. there is
a colony survival benefit in autumn mated queen bees being well mated during the
autumn mating period) or (ii) drones with low sperm viability die at a younger age,
leaving fewer drones with low sperm viability available to be sampled at the older age.
The significant differences recorded for sperm viability between drones sampled at
different ages with 14-day-old drones having the lowest viability (78%) and 21-day-
old drones the highest viability (82%) (Table 4.7) require explanation. Locke and Peng
(1993) found sperm viability decreasing with increase in drone age, with 28- and 42-
day-old drones having significantly lower sperm viability (81% and 80%, respectively)
than 14-day-old drones (86%). If a batch of drones reared at the same time from the
same drone mother and maintained under the same conditions are sampled at
increasing ages for sperm viability, then the expected result should be similar to Locke
and Peng`s (1993); namely, decreasing sperm viability with increasing age. The data
obtained in this experiment of younger drones having the lowest sperm viability may,
in part, be explained by drones with low sperm viability dying at a younger age and
not being available to be sampled at the older ages.
A line effect, with breeding line1 having the significantly lower sperm viability (75%)
compared with 82%, 81% and 81% for Lines 2, 3 and 4, respectively, suggest that
168
sperm viability in drones may be a selectable trait when selecting queen bees as drone
mother queens for breeding purposes.
Sperm viability data recorded from this experiment (mean 79.7, ra. 59.9-90.5 %), are
similar to data published by other authors. For example, Locke and Peng (1993) found
28-day-old drones with 81.4±1.62% live sperm, 42-day-old drones with 80.1±2.01%,
and 14 day-old-drones with 86.2±1.12%. For drones a minimum of 12 days old,
Collins and Pettis (2001) found a mean of 99.2 (ra. 82.3-100.0)%. Collins (2004),
collecting semen in a syringe and using room temperature buffer, recorded a mean live
percent sperm of 78.1±10.1% (ra. 58.5-91.0%) live sperm. These results indicate that
viability levels of sperm from drone honey bees reared from queen bees from
commercial breeding lines in eastern Australia are on the lower end, but are
comparable with published data and suggest that an improvement in viability percent
may be possible through a queen bee breeding program selecting for high sperm
viability in drones produced from those queen bees.
Collins (2004) compared methods for semen collection, reporting that the highest
viability levels were found when semen was collected directly from the seminal
vesicles rather than from ejaculation. Although this statement presents a strong
argument for the collection of semen samples requiring a high level of accuracy to be
collected from drone seminal vesicles, the common methodology being used in
published papers at the time this work was being developed was to obtain semen
samples by manual eversion. As well, manual eversion has allowed comparison of
previously published data with data from this work.
Sperm motility
With 55% of the samples having high motility scores (2 or 3) these data are
comparable to those of Locke and Peng (1993). However, data from this experiment
may be at the lower end of data from Locke and Peng (1993) when expected negative
effects of increased lag time during data recording, based on Dietrich et al. (2005), are
added to Locke and Peng (1993) data.
169
Summer drone sperm motility was significantly (P < 0.05) higher than for autumn
drones, and for 14-day-old drones in spring. There was a significant (P < 0.05) effect
of age on motility in spring, with motility for this experiment being highest for 35-day-
old drones in spring. Results from motility studies on mammalian sperm identified the
importance of seasonal effect on sperm production and quality which included sperm
motility. However, great differences in results have been found between mammalian
species and differences between animal and insect genera are not reported. The lower
motility of autumn drone sperm compared with spring and summer drone sperm, com-
bined with mammalian sperm data identifying distinct seasonal effects, suggest the
question of whether there is a time period for A. mellifera during one or more seasons
each year when sperm production is at its highest level of quality. Queen bees for the
commercial beekeeping industry are reared and mated continuously between early
spring and late autumn each year. If one or more time periods of peak sperm quality
were identified for honey bees, this would question the “mating quality” of queen bees
mating with drones out of the peak sperm quality time period and would further ques-
tion their success rate as queen bees heading colonies in commercial apiaries.
For spring drones, there is an age effect on drone sperm motility with motility increas-
ing with age. There was no significant effect of age in autumn or summer. Locke and
Peng (1993) did not find significant differences between sperm motility from drones
aged 14, 28 and 42 days. An explanation for the 35-day-old drones having the highest
motility and the 14-day-old the lowest may result from the number of drones available
for examination at each age; 201 for 14-day-old, 155 for 21-day-old, and 103 for 35-
day-old (Table 4.8), the decreasing number of drones available for examination with
increasing age providing motility for the oldest aged drones suggests that drones with
low motility levels die at a younger age and are not available for sampling at the older
ages. Note that the sample size for 21-day-old drones was 30 in spring and summer
and less in autumn, implying a higher mortality rate in autumn, however, 21-day-old
drones have sperm motility no higher than 14-day-old drones.
170
Investigating the role of genetics in drone semen production
This experiment was suspended after Examination 3 showed that a High Line and a
Low Line were not present for the three characteristics being examined in drones
reared from queen bees from the two replacement lines. The loss of the differences
between the two lines of bees for the characteristics of (i) the proportion of drones
releasing semen at the endophallus after manual eversion, (ii) the volume of semen
produced per drone, and (iii) the number of sperm produced per drone, suggests that if
these characteristics are selectable traits, then recessive genes may be involved. Should
recessive genes be involved in the expression of those three characteristics, then
identification and maintenance of these traits in queen bee breeding stock would
require a continuing managed breeding program.
Diseases
Small numbers of spores in ten of the 40 High Line drones examined may have
resulted from feeding behaviour, or may suggest that the drones have been, or were
about to become infected. Large numbers of spores in 2 of the 40 drones examined
from the Low Line suggests that a heavy infection may have been present in all drones
in that line. A more sensitive test than the one carried out may have shown this.
The Nosema spp. spore levels recorded for nine of the 60 drones (i.e. 15.0%) ex-
amined (Table 4.15) does not appear to have had a significant impact on the number of
sperm produced by each of the infected drones when compared with the number of
sperm present in drones with no Nosema spp. spores present. This may be explained
by sperm formation occurring during the pupal stage of drone reproduction, prior to an
infection from nosema disease. However, nosema infection may affect drones in areas
not examined in this experiment, e.g. reduced ability to fly resulting from lower nutri-
tion uptake.
One Low Line drone out of the 80 examined was positive for sacbrood virus. A gel-
diffusion test requires large numbers of particles present, more than one million, to
provide a reaction, which suggests the presence of sacbrood disease within the drone
population of the bee colony.
171

Combined, the results suggest that the Low line drones are affected by the pathogens
nosema disease and sacbrood virus. A high concentration of sacbrood virus in one
drone, in conjunction with the nosema levels from the Low line is sufficient to cast
doubt on all the drones examined, i.e. a basic health condition appears to exist. These
results indicate that further examination of the effects of nosema and virus infection on
semen and sperm production and availability are required.
Drones not releasing semen after manual eversion
When mature age drones do not release semen at the endophallus after manual
eversion there is a question of whether the drone did not produce sperm, or whether
the drone did produce sperm and did not release it for other reasons. Data from Table
4.15 show that drones that released semen released most of the sperm from their
seminal vesicles with only small numbers of sperm found in the seminal vesicles of
five drones, and all drones which did not release semen after manual eversion
contained sperm in their seminal vesicles. The high proportion of drones not releasing
semen after manual eversion, 30.8% in this experiment, suggests that factors are
involved other than the effect of the operator carrying out the manual eversion, eg.
physiological factors within the drone. Table 4.2 data showing a significant breeding
line effect for the number of drones releasing semen after manual eversion suggest that
this characteristic may be a selectable trait.
Since no significant difference was found between the two operators in their ability to
manually evert drones, Operator 2 was able to continue experiments involving manual
eversion of drones on the basis that drone eversion data obtained from Operator 2
would be comparable to that obtained by Operator 1. This allowed further experiments
on drone semen release to be carried out at the NSW Department of Primary Industries
Research Station, Calala, Tamworth with J. Rhodes collecting all data.
172

Effects of age and genetics on sperm release
This experiment considered the age at which drones mature as the age when a
significant number of drones release all of the sperm from the seminal vesicles to the
tip of the endophallus after manual eversion. Results showed that sperm movement
from the testes to the seminal vesicles may not be complete until age 5 - 11 days. The
release of all sperm from the seminal vesicles after manual eversion from a low
proportion of drones between seven days up to and including 30-day-old-drones
suggested that drone maturation commences at about seven days of age and occurs
over a wide range of ages.
Data from this experiment suggest that manual eversion is not a suitable method for
collecting semen samples required to provide accurate semen volume and sperm num-
bers data for individual drones, with dissection and counting from the seminal vesicles
providing a more reliable alternative. The importance of the proportion of semen re-
leased at the endophallus after manual eversion lies in the accuracy of data on semen
volume and sperm numbers produced per drone, when these data are used for selection
of drone mother stock for bee breeding programs to rear drones which produce large
volumes of semen and high numbers of sperm.
Although no significant differences were found between the total numbers of sperm
produced by each of the four breeding lines of drones examined in this experiment
(Table 4.17) and Rhodes et al. ( 2010) found a significant effect (P ≤ 0.05) for the
volume of semen and numbers of sperm produced per drone for drones from different
breeding lines.
A significant Sperm.Source effect (P < 0.001) was identified with total sperm numbers
from the seminal vesicles significantly higher than total sperm numbers from the
endophallus for all drones (Table 4.18). From the results, the ratio of sperm numbers
in the seminal vesicles: endophallus is 3.1:1 which is higher than would be expected if
manual eversion was an efficient method for retrieving sperm (Table 4.18).
The significant linear relationship (P = 0.006; Table 4.19, Figure 4.2) between drone
age and the total number of sperm recorded from both sources, seminal vesicles and
173

endophallus, describes the relationship between each drone producing a fixed number
of sperm in the testes which moves to the seminal vesicles and remain there until the
drone mates with a queen bee or dies. The data showed an increase in sperm numbers
to about age 11 days and then a gradual decline to age 30 days. Sperm is released from
the testes to the seminal vesicles during the first few days after adult drone emergence,
this is generally considered to be completed by about day 3 after emergence (Moritz,
1989). Data from this experiment (Figure 4.2) suggest that movement of sperm from
the testes to the seminal vesicles may not be complete until day 5-11 after adult drone
emergence, which support data from Jaycox (1961).
The significant sperm Source.Age effect (P < 0.001; Table 4.20, Figure 4.3) associated
with the numbers of sperm in the seminal vesicles and numbers present in the endo-
phallus for all drones present at each age, showed higher numbers of sperm in the sem-
inal vesicles of younger drones but moving towards convergence with increasing
drone age. If manual eversion is an efficient method for retrieving sperm from mature
age drones and if drones mature (release semen) at the generally accepted age of 8-12
days (Bishop, 1920; Jaycox, 1961; Moritz, 1989), then the seminal vesicle data and the
endophallus data in Figure 4.3 would be expected to show high readings for the semin-
al vesicles and low readings for the endophallus until about days 8-12. At the age
where the drones matured the two lines would be expected to cross over, with the re-
mainder of Figure 4.3 showing low sperm numbers for the seminal vesicles and high
sperm numbers for the endophallus. The figure, however, shows the two lines continu-
ing to converge past drone age 30 days, suggesting that a proportion of drones mature
at different ages, and manual eversion is not an efficient method for collecting semen
samples.
A significant Line.Source effect (P = 0.003) compared the total number of sperm
present in the seminal vesicles or in the endophallus, from all drones for all ages from
each breeding line (Table 4.21). There were no significant differences between sperm
numbers from the endophallus for each line with all endophallus sperm numbers being
significantly lower than all seminal vesicle numbers from each breeding line. Breeding
line 4 seminal vesicle sperm number was significantly lower than breeding lines 1, 2
and 3. Regardless of the numbers of sperm in the seminal vesicles, all breeding lines
174
had about the same numbers of sperm in the endophallus and all had more sperm in
the seminal vesicles than in the endophallus. The lower numbers of sperm from the
endophallus for all breeding lines of drones aged to 30 days further suggest that
manual eversion has a low overall efficiency as a method for retrieving sperm from
drones.
The significant Sperm.Source effect (Table 4.18), linear relationship for Age effect
(Table 4.19) and the Line.Source effect (Table 4.21) all strongly suggest that either
manual eversion of drones is not an efficient method for effecting movement of sperm
from the seminal vesicles to the tip of the endophallus in semen, or manual eversion is
an efficient method and the lack of movement of sperm is due to physiological factors
within the drone, i.e. drones which have not reached sexual maturity are restricted in
the amount of sperm they release with manual eversion. Data from the Source.Age ef-
fect (Table 4.20 and Figure 4.3) show sperm remaining in the seminal vesicles of
drones up to, and possibly past, 30 days of age. Based on the definition of maturation
of drones used for this experiment it was not possible to identify a mean age at which
drones could be considered to have reached maturity, which also suggests that drone
maturation occurs over a wide range of ages.
No significant Line.Age effect was identified (P = 0.456) when the total sperm from
the seminal vesicles and the endophallus from each breeding line for each age was
examined (Table 4.22), with the effect of increasing age being the same for each
breeding line. A significant three way interaction effect was found for Line.
Source.Age (P = 0.002) for the source of sperm produced in the seminal vesicles or in
the endophallus for drones from each breeding line examined for each age.
For the 148 drones examined for nosema disease at four ages, no Nosema spp. spores
were observed indicating that nosema disease was not a factor affecting sperm count
numbers recorded in this experiment.
A significant Line.Eversion effect (P = 0.018) was found for the total number of sperm
produced by drones from each breeding line for each eversion rating (Table 4.23). The
inflated prediction for breeding line 4 drones for eversion rating level 4 may have res-
175

ulted from breeding line 4 drones not being available for sampling after age 18 days.
A significant Age.Eversion effect (P < 0.001) was found for the total number of
drones of each age for each eversion rating (Table 4.24) with data showing large num-
bers of drones at a young age at the lower eversion rating and large numbers of older
drones present at the higher eversion rating. The change in numbers of drones from
low eversion rating to high eversion rating is gradual and does not identify a specific
age at which drones change suggesting drone maturation occurs over a wide range of
drone ages.
The percent of drones examined each day which released all their sperm from the
seminal vesicles (Table 4.25) suggests drone maturation, based on complete release of
sperm from the seminal vesicles after manual eversion, commencing at about age 7
days and ranges over a large number of days, with a high percentage of drones of all
ages to 30 days retaining sperm in their seminal vesicles.
Compared with data from Europe and the USA, e.g. Woyke (1962) 11.0 x 10⁶ per
drone; Jaycox (1961) 10.8 x 10⁶ per drone, and Rinderer et al. (1985) 5.7±0.9 x 10⁶ in
one seminal vesicle, low numbers of sperm per drone were recorded from this
experiment (Section 4.6.3) (mean 2.12 (ra. 0.00-6.94) x 106 per drone),
suggesting that selection of drone mother queen bees whose drones produce large
numbers of sperm should be included in stock selection criteria for breeding programs.
Semen movement
Sperm viability analysis results indicated there were significantly more sperm in the
seminal vesicles than in the endophallus (Table 4.26). Significantly more sperm were
found alive than dead (Table 4.27). The data show that 32.7% of all sperm was dead
which, although high, is within the range of sperm viability (average 79.7 (ra. 59.9-
90.5)%) recorded in this project (Table 4.6). Drones for this experiment were reared
from one drone mother queen, suggesting that individual queen bees may be
producing drones with unacceptably high numbers of dead sperm, and further
indicating the importance of sperm viability as a criterion when selecting drone mother
queen bees for breeding programs.
176

There was no significant interaction between source and condition, with similar
proportions of dead sperm present in the seminal vesicles as in the endophallus. This
indicates that sperm in the seminal vesicles after manual eversion do not remain there
due to low viability and suggests that drone physiology ( i.e. drone immaturity) or
ineffectiveness of the manual eversion method for retrieving sperm may be the cause.
No significant difference (P > 0.05) was found between the motility of sperm from the
seminal vesicles and sperm from the endophallus.
4.8 Conclusions
• Forty-one percent of drones aged 14-35 days did not release semen after manual eversion.
• The volume of semen produced per drone (mean 1.09 µL) is comparable with
other published data.
• The number of sperm produced per drone (mean 3.63 x 10⁶) (Section 4.2) is
low compared with the majority of published data.
• Sperm quality was high for spring and autumn drones, for 21- and 35-day-old
drones.
• Drone age, breeding line and season are factors influencing drone semen qual-
ity.
• Drone sperm viability at 79.7% is at the lower end but comparable with limited
published data.
• Drone sperm motility rating is comparable with limited published results.
• There was no particular drone age, breeding line or season, or combination of
these three factors, when sperm viability and/or motility were at a highest
level or at a lowest level.
177

• It appears that recessive genes are involved in the expression of the traits - re-
leasing semen at the endophallus after manual eversion, volume of semen,
number of sperm, viability percent and motility rating levels per drone, and
all may be selectable traits able to be improved by breeding programs.
• Drones which did not release semen at the endophallus after manual eversion
contained sperm in their seminal vesicles i.e. the presence of sperm in the
seminal vesicles, by itself, does not ensure the release of semen at the endo-
phallus after manual eversion.
• The majority of drones releasing semen released a high percentage of sperm
present in their seminal vesicles.
• Presence of nosema disease did not impact on the number of sperm produced
by drones.
• Movement of sperm from the testes to the seminal vesicles is not complete
until about drone age day 5 to 11.
• Release of sperm from the seminal vesicles to the endophallus after manual
eversion occurs over a range of ages, commencing at about age 7 days, with
no specific drone age identified when drone maturation occurred, based on
sperm release from a significant number of drones.
• Older aged drones have higher numbers of sperm released to the endophallus
after manual eversion than younger aged drones.
• Manual eversion of drones was identified as not being a suitable method for
obtaining accurate samples of semen for determination of semen volume and
number of sperm produced per drone.
• Older aged drones have a higher endophallus eversion rating after manual
eversion than younger aged drones. No specific drone age was identified
when a change from low eversion rating to high eversion rating occurred.
178
• Lower sperm quality, measured in terms of sperm viability and sperm motil-
ity, are not the cause of sperm remaining in the seminal vesicles of mature
age drones after manual eversion.
• These results suggest that individual queen bees are able to produce drones
with unacceptably high levels of dead sperm in their seminal vesicles.
179

CHAPTER 5
Drone honey bee semen – amino acid and fatty acid content
5.1 Introduction
As discussed in previous chapters, queen honey bees are reared on a commercial
level between spring and the following autumn in eastern Australia, but there is little
data available on the quality of drone bees reared to mate with queen bees at mating
apiaries during this extended production period. Chapter 4 reported seasonal
differences in sperm quality. It is possible that season floral resources and associated
honey bee colony nutrition may affect chemical composition of spermatozoa and
seminal fluid and, thus, drone quality.
Drone seminal fluid is primarily derived from the seminal vesicles and penis bulb
and probably contains traces of mucous gland secretion (Blum et al., 1962). Woyke
(2010), reported that three substances are ejected; semen, mucous and fragments of
epithelial membrane sloughed off from the mucous gland. The two key chemical
constituents examined in sperm and seminal fluid are free amino acids and free fatty
acids.
An early investigation of the composition of drone semen by Novak et al. (1960)
identified 15 amino acids at different levels; with arginine, lysine and leucine in
sperm, and arginine and glutamic acid in seminal fluid present at higher levels in
comparison to other amino acids. Woyke and Jasinski (1978) found differences
associated with drone age, in semen colour, density and viscosity. They also reported
that after instrumental insemination older drones resulted in a lower number of
sperm, generally, entered the queen`s spermatheca and an increase in the percentage
of queen bees with semen residues in their oviducts. This phenomenon is possibly
the result of differences in semen composition.
180

While there have been few studies on the impact of season or age on drone seminal
composition, there have been a number of papers published on their effects on
composition of of bee haemolymph. Crailsheim and Leonard (1997) found proline
the predominant amino acid in worker honey bee haemolymph, comprising from
50% in newly emerged bees up to 80% of total amino acids from the third day but
then decreasing in older bees. They identified 18 amino acids, ten of which were
previously reported by de Groot (1953, quoted in Crailsheim and Leonard, 1997) as
essential for the growth of honey bees in diet experiments. Leonard and Crailsheim
(1999) examined amino acids present in drone honey bee haemolymph, finding
concentrations of free amino acids higher than in worker bee haemolymph and with
different relative proportions of individual amino acids. The overall concentration of
free amino acids reached its highest level at the fifth day after adult emergence with
only minor changes in concentration occurring after the ninth day, with the ninth day
being about the age drones are considered to mature (Mindt 1962, quoted in Leonard
and Crailsheim, 1999). Proline was the most abundant amino acid, with the average
content rising from the first day to a maximum at seven days, then continuously
decreasing with age to 25-day-old drones. Essential free amino acids described by de
Groot (1953) were at their highest levels in one- and three-day-old drones, decreased
to-seven-day old drones and then remained constant.
Amino acids are naturally obtained from floral pollen sources. Somerville (2004)
analysed 182 pollen samples from 61 identified plant species commonly foraged by
honey bees in New South Wales and identified 17 amino acids present (amino acids
described in Table 1 with the exceptions of asparagine, glutamine and tryptophan).
He found 66 samples with isoleucine, 11 samples with valine, and 2 samples with
methionine with levels below desirable levels recommended by de Groot (1953). He
concluded that the results indicated that most of the essential amino acids in honey
bee collected pollen samples were at levels sufficient to meet their nutritional
requirements.
Fatty acids in drone semen were examined by Blum et al. (1967). An initial
investigation found phospholipids constituted the major fraction present in the lipids
of honey bee semen with C16:0 (23%) and C18:1 (56%) accounting for 80% of the
total fatty acids. Manning (2001a) reported that lipids, apart from being a source of
181
energy, are involved in the synthesis of reserve fat and glycogen, and in the
membrane structure of cells, fatty acids and sterols and more generally, are
important in honey bee development, nutrition and reproduction. Regarding floral
sources of fatty acids Manning (2001a) found linoleic acid (C18:2) to be the
dominant fatty acid, comprising 44% of total fatty acids present in Eucalyptus spp.
pollen. Manning (2001b) presented data showing the main fatty acids present in
Eucalyptus spp. pollen to be C14:0 (myristic); C16:0 (palmitic); C18:0 (stearic);
C18:1 (oleic); C18:2 (linoleic); C18:3 (linilenic); C20:0 (arachidic) and smaller
amounts of C22:0 (behenic).
Some effects of seminal fluid on sperm activity and survival in female insects and in
influencing female behaviour following mating have been studied. Rice (1996)
found indirect evidence with Drosophila melanogaster that seminal fluid reduces the
competitive ability of sperm from another male, reduces a female`s propensity to
remate, and increases her egg laying rate. Holman (2009), however, reported that
seminal fluid from D. melanogaster males improved sperm survival even when the
sperm was from a different male. Baer et al. (2001) investigated chemicals present in
the mating plug transferred by male bumblebees, Bombus terrestris, into the queen`s
sexual tract shortly after sperm transfer, and found linoleic acid in the mating plug
decreased female remating behaviour.
The roles of chemicals present in the male accessory glands of insects in influencing
female behaviour following mating are also of interest. Gillott (2002) stated that in
species where sperm are transferred in a liquid medium the seminal fluid is a product
of the accessory reproductive glands (ARG) although components secreted by other
regions of the male reproductive tract (e.g. the ejaculatory duct) may be added. One
reported role of the ARG is the acceleration of egg production.
The importance of the amino acid and fatty acid composition of sperm and seminal
fluid, together with results in previous chapters which reported drone age and season
influenced drone quality prompted this experiment. The objectives were to (i) assess
changes in amino acid and fatty acid content of drone honey bee semen (i.e. seminal
fluid and the sperm it contained) associated with drone age and season, to identify
any differences which occurred that may have affected drone semen quality, and (ii)
182

to identify significant amino acids and fatty acids specific to drone bee semen
production which may be relevant in developing a food supplement for rearing drone
bees.
5.2 Materials and Methods
Drones were reared as previously described (Chapter 3 and subsequent) to provide
semen at three ages: 14, 21 and 35 days; for three seasons, spring, summer and
autumn; with samples collected during 2003-4 and in 2006. Drone mother queen
bees were open mated daughter queen bees from instrumentally inseminated
breeding queen bee stock of the type Apis m. ligustica produced by commercial
queen bee producers in eastern Australia (see Chapter 3). Four commercial breeding
lines of queen bees provided drones which contributed to a bulk semen sample
representative of each age and season sampled. Semen was collected from drones,
following manual eversion, using a Schley Instrumental Insemination apparatus,
with each sample size a minimum of 100 µL. Some semen samples for 2006 were
collected from two separate breeding lines (A and B). Drone rearing and semen
collection methods were similar to those described in Chapter 3. Details of data
collected for this experiment are shown in Table 5.1.
Between the dates when semen was collected and forwarded to the analytical
laboratories, samples were maintained in a freezer at -20°C. Semen samples were
forwarded to the respective analytical laboratories (amino acid analysis- the
Australian Proteome Analysis Facility Ltd, Macquarie University; fatty acid analysis-
Oil Testing Laboratory, Department of Primary Industries Agricultural Institute,
Wagga Wagga) in individual glass capillary tubes prepared with: petroleum jelly at
the tip, air space, buffer, air space, semen, and reverse procedure. Samples were
packed in dry ice and transported by an overnight freight service. The buffer
composition was:
Sodium chloride 11.0 g; glucose 1.0 g; L (+) Arginine-HCl 0.1 g; L (+) Lysine 0.1 g;
Tris (hydroxymethyl) aminomethane (Base 7-9) 4.9 g; Tris (hydroxymethyl)
aminomethane hydrochloride 1.5 g; in 1000 cc distilled water, pH 8.7.
183
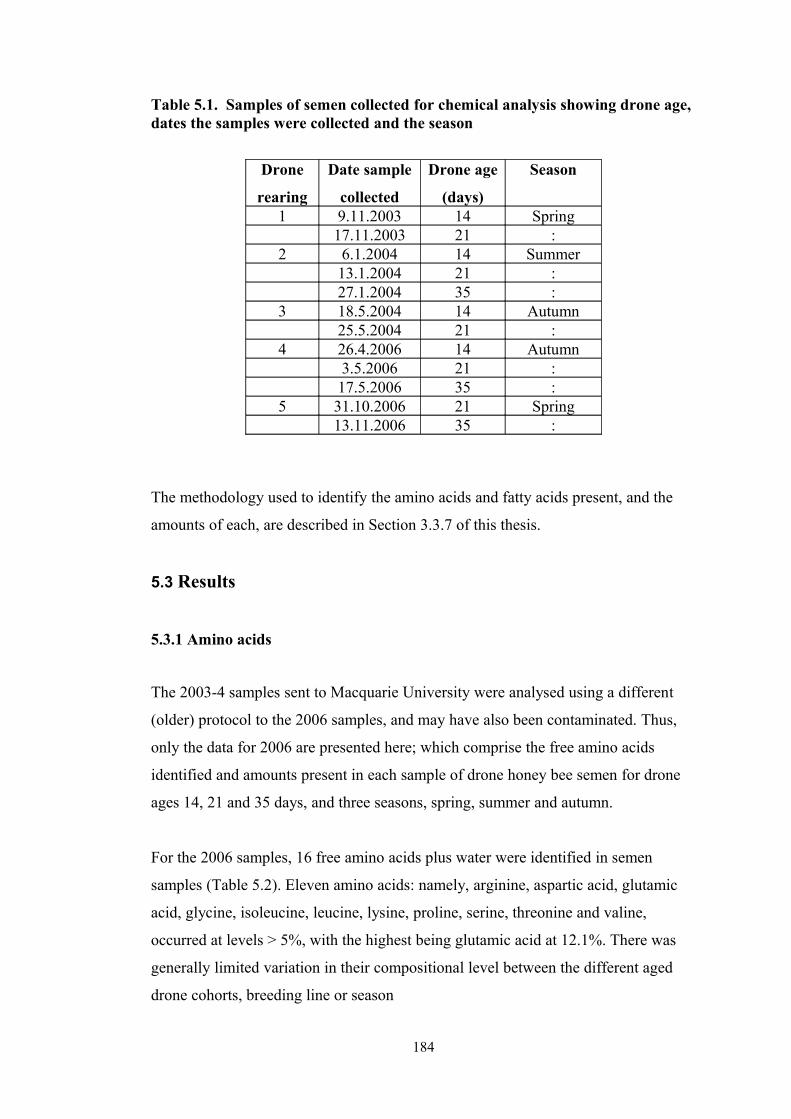
Table 5.1. Samples of semen collected for chemical analysis showing drone age, dates the samples were collected and the season
Drone
rearing
Date sample
collected
Drone age
(days)
Season
1 9.11.2003 14 Spring17.11.2003 21 :
2 6.1.2004 14 Summer13.1.2004 21 :27.1.2004 35 :
3 18.5.2004 14 Autumn25.5.2004 21 :
4 26.4.2006 14 Autumn3.5.2006 21 :17.5.2006 35 :
5 31.10.2006 21 Spring13.11.2006 35 :
The methodology used to identify the amino acids and fatty acids present, and the
amounts of each, are described in Section 3.3.7 of this thesis.
5.3 Results
5.3.1 Amino acids
The 2003-4 samples sent to Macquarie University were analysed using a different
(older) protocol to the 2006 samples, and may have also been contaminated. Thus,
only the data for 2006 are presented here; which comprise the free amino acids
identified and amounts present in each sample of drone honey bee semen for drone
ages 14, 21 and 35 days, and three seasons, spring, summer and autumn.
For the 2006 samples, 16 free amino acids plus water were identified in semen
samples (Table 5.2). Eleven amino acids: namely, arginine, aspartic acid, glutamic
acid, glycine, isoleucine, leucine, lysine, proline, serine, threonine and valine,
occurred at levels > 5%, with the highest being glutamic acid at 12.1%. There was
generally limited variation in their compositional level between the different aged
drone cohorts, breeding line or season
184

Table 5.2. Free amino acids identified and percent of total present in each sample of drone honey bee semen for drone age and season shown for the year 2006.
Aminoacid
% of Total Amino AcidsDrone age (days) / season
21Spring
35Spring
14Autumn
A*
14Autumn
B*
21Autumn
A
21Autumn
B
35Autumn
A
35Autumn
BAspartic Acid 10.2 10.3 10.1 10.2 10.3 10.4 10.5 9.7Glutamic Acid
11.8 12.0 11.6 11.7 11.8 11.8 12.1 11.4
Serine 5.7 6.0 5.9 5.8 5.9 5.8 6.1 6.3Glycine 5.0 5.4 5.4 5.0 5.3 5.2 5.4 7.2Histidine 2.3 2.0 2.2 2.3 2.3 2.3 1.9 2.1Threonine 4.9 5.0 5.0 5.0 5.0 5.0 5.1 4.9Arginine 9.3 8.9 9.3 9.1 9.5 9.2 8.5 9.1Alanine 4.7 4.7 4.7 4.7 4.8 4.8 4.9 4.6Proline 6.7 6.2 6.6 6.5 6.5 6.4 6.2 6.2Tyrosine 4.0 4.3 3.7 3.9 3.5 3.8 3.6 4.0Valine 5.2 5.3 5.3 5.3 5.4 5.4 5.5 5.2Methionine 2.5 2.8 2.9 2.9 2.6 2.9 2.1 2.9Isoleucine 6.2 6.4 6.3 6.3 6.3 6.3 6.4 6.2Leucine 8.1 8.3 8.1 7.9 8.0 7.9 8.1 8.0Lysine 8.9 7.8 8.2 8.9 8.5 8.3 8.7 7.6Phenylalanine 4.5 4.7 4.6 4.4 4.4 4.5 4.9 4.6
* Semen samples from drones from A = queen breeder A, and B = queen breeder B
5.3.2 Fatty acids
Thirty-two fatty acids were identified, with unidentified peaks occurring at nine
points. The fatty acids identified and the percent of each present in each sample for
three drone ages and three seasons for the year 2003-4 are shown in Table 5.3, and
for three ages and two seasons for the year 2006 in Table 5.4. Each fatty acid, as a
percent of the total fatty acids identified in each sample, in general, varied for drone
age, season and year sampled. Oleic acid (C18: 1n9c) was present in the highest
amounts and varied considerably between years: 2003-4 av. 65.5 (ra. 48.5 – 80.1)%
and 2006 av. 20.8 (ra. 10.0 – 32.4)%; elaidic acid (C18: 1n9t) was present in low
amounts in 2003-4 av. 2.6 (ra. 1.1 – 4.2)% but much higher amounts in 2006 av. 37.1
(ra. 8.1 – 58.3)%. All other identified fatty acids peaked at less than 7% for all data
for 2003-4 and 2006 (Tables 5.3 and 5.4).
185

Fatty acid levels appear to be higher in spring than in autumn with lowest levels in
summer levels. No general trend across all fatty acids for age and season was found,
apparently with changes dependent on other factors affecting individual fatty acids
(Table 5.3). Changes in fatty acid levels occurred with no clear age or season effect
identified with factors other than age and season affecting the fatty acid levels (Table
5.4).
186
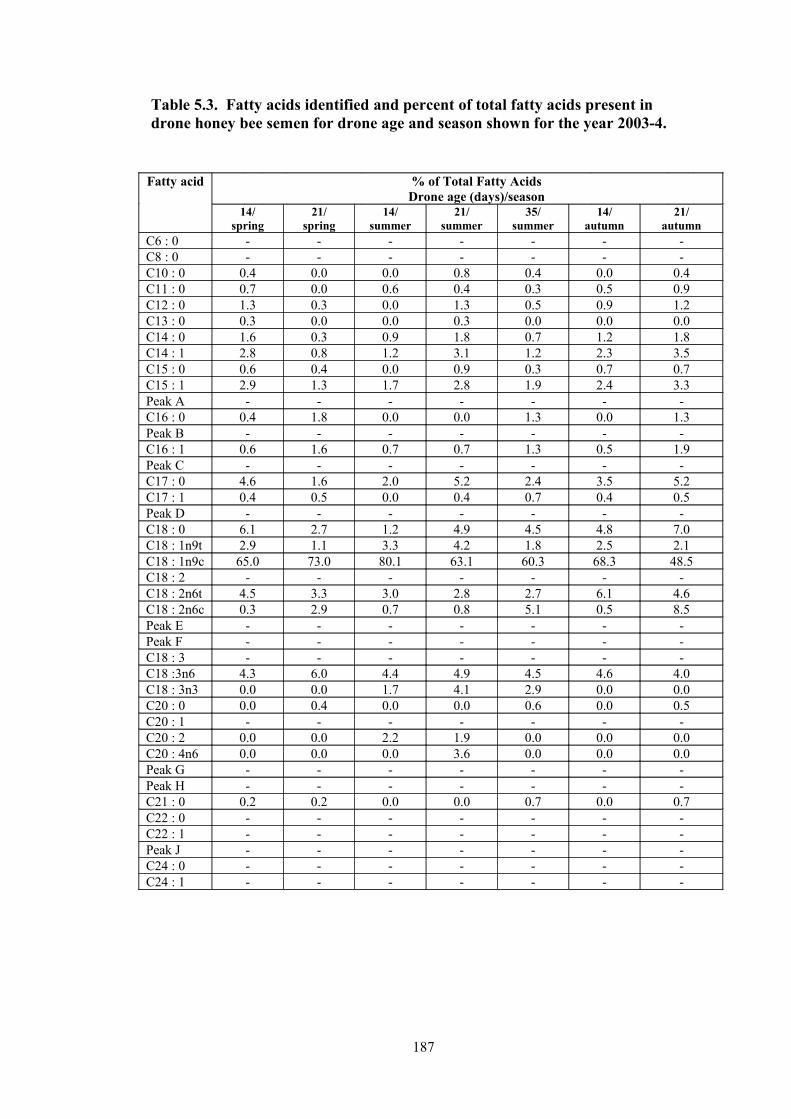
Table 5.3. Fatty acids identified and percent of total fatty acids present in drone honey bee semen for drone age and season shown for the year 2003-4.
Fatty acid % of Total Fatty AcidsDrone age (days)/season
14/spring
21/spring
14/summer
21/summer
35/summer
14/autumn
21/autumn
C6 : 0 - - - - - - -C8 : 0 - - - - - - -C10 : 0 0.4 0.0 0.0 0.8 0.4 0.0 0.4C11 : 0 0.7 0.0 0.6 0.4 0.3 0.5 0.9C12 : 0 1.3 0.3 0.0 1.3 0.5 0.9 1.2C13 : 0 0.3 0.0 0.0 0.3 0.0 0.0 0.0C14 : 0 1.6 0.3 0.9 1.8 0.7 1.2 1.8C14 : 1 2.8 0.8 1.2 3.1 1.2 2.3 3.5C15 : 0 0.6 0.4 0.0 0.9 0.3 0.7 0.7C15 : 1 2.9 1.3 1.7 2.8 1.9 2.4 3.3Peak A - - - - - - -C16 : 0 0.4 1.8 0.0 0.0 1.3 0.0 1.3Peak B - - - - - - -C16 : 1 0.6 1.6 0.7 0.7 1.3 0.5 1.9Peak C - - - - - - -C17 : 0 4.6 1.6 2.0 5.2 2.4 3.5 5.2C17 : 1 0.4 0.5 0.0 0.4 0.7 0.4 0.5Peak D - - - - - - -C18 : 0 6.1 2.7 1.2 4.9 4.5 4.8 7.0C18 : 1n9t 2.9 1.1 3.3 4.2 1.8 2.5 2.1C18 : 1n9c 65.0 73.0 80.1 63.1 60.3 68.3 48.5C18 : 2 - - - - - - -C18 : 2n6t 4.5 3.3 3.0 2.8 2.7 6.1 4.6C18 : 2n6c 0.3 2.9 0.7 0.8 5.1 0.5 8.5Peak E - - - - - - -Peak F - - - - - - -C18 : 3 - - - - - - -C18 :3n6 4.3 6.0 4.4 4.9 4.5 4.6 4.0C18 : 3n3 0.0 0.0 1.7 4.1 2.9 0.0 0.0C20 : 0 0.0 0.4 0.0 0.0 0.6 0.0 0.5C20 : 1 - - - - - - -C20 : 2 0.0 0.0 2.2 1.9 0.0 0.0 0.0C20 : 4n6 0.0 0.0 0.0 3.6 0.0 0.0 0.0Peak G - - - - - - -Peak H - - - - - - -C21 : 0 0.2 0.2 0.0 0.0 0.7 0.0 0.7C22 : 0 - - - - - - -C22 : 1 - - - - - - -Peak J - - - - - - -C24 : 0 - - - - - - -C24 : 1 - - - - - - -
187

Table 5.4. Fatty acids identified and percent of total fatty acids present in drone honey bee semen for drone age and season shown for the year 2006.
Fatty acid % of Total Fatty AcidsDrone age (days) and season
21spring
35spring
14autumn
A*
14autumn
B*
21autumn
A
21autumn
B
35autumn
A
35autumn
BC6 : 0 3.1 2.3 1.2 1.6 6.3 3.9 5.1 6.7C8 : 0 2.6 1.5 1.4 0.9 5.6 2.7 6.5 4.6C10 ; 0 1.8 1.3 0.6 0.8 3.7 1.7 5.1 3.4C11 : 0 - - - - - - - -C12 : 0 1.0 0.8 1.3 0.7 4.4 1.8 2.9 3.2C13 : 0 - - - - - - - -C14 : 0 0.3 0.3 0.1 0.1 0.1 0.3 0.5 0.2C14 : 1 - - - - - - - -C15 : 0 0.1 0.1 0.3 0.1 0.1 0.1 0.1 0.3C15 : 1 0.3 0.2 0.1 0.4 0.5 0.3 0.6 0.5Peak A 1.9 1.1 5.9 1.0 14.2 5.5 3.0 33.0C16 : 0 2.4 2.4 3.1 1.4 1.3 1.7 5.6 1.0Peak B 1.7 2.0 0.5 0.8 2.4 1.2 2.0 1.6C16 : 1 1.6 1.9 2.3 1.3 1.8 1.4 2.9 2.5Peak C 0.3 0.5 1.0 1.0 2.4 0.4 0.6 1.1C17 : 0 0.1 0.3 0.5 0.5 2.9 0.1 0.3 2.4C17 : 1 0.1 0.1 0.1 0.1 0.1 0.1 0.1 0.2Peak D 0.1 0.1 0.2 0.1 0.1 0.1 0.1 0.2C18 : 0 1.8 1.8 2.7 1.5 5.3 1.6 1.4 3.9C18 : 1n9t 58.3 54.7 36.7 48.8 17.2 40.8 32.1 8.1C18 : 1n9c 14.5 20.9 32.4 30.2 15.1 29.4 13.5 10.0C18 : 2 1.4 1.0 2.3 0.9 5.4 0.9 1.9 5.5C18 : 2n6t - - - - - - - -C18 : 2n6c - - - - - - - -Peak E 0.9 1.0 2.2 1.8 4.7 1.2 1.4 6.3Peak F 0.1 0.1 0.1 0.1 0.8 0.1 0.1 0.1C18 : 3 2.7 2.3 1.1 1.6 0.8 1.3 2.5 0.8C18 : 3n6 - - - - - - - -C18 : 3n3 - - - - - - - -C20 : 0 0.7 1.1 1.3 1.2 1.2 1.1 2.1 0.6C20 : 1 1.7 1.4 0.2 1.5 0.7 1.1 5.0 0.2C20 : 2 - - - - - - - -C20 : 4n6 - - - - - - - -Peak G 0.7 0.9 0.3 0.9 1.1 0.9 4.5 0.7Peak H 0.1 0.1 0.3 0.3 0.5 0.1 0.2 0.2C21 : 0 - - - - - - - -C22 : 0 0.1 0.1 0.5 0.2 0.1 0.1 0.1 1.1C22 : 1 0.1 0.1 0.4 0.1 0.1 0.1 0.2 0.1Peak J 0.1 0.1 0.5 0.4 1.3 0.6 0.1 1.3C24 : 0 0.1 0.4 0.2 0.1 0.4 0.1 0.1 0.1C24 : 1 0.3 0.1 0.1 0.2 0.1 0.1 0.1 0.4
* Semen samples from drones from A = queen breeder A, and B = queen breeder B
188
5.4 Discussion
5.4.1 Amino acids
The 16 free amino acids identified in semen samples collected during 2006 are
generally consistent with those reported by other authors, although the different
methodologies used make direct comparisons (especially levels of amino acids
present) difficult between existing published data, as well as between my data and
other published data. It should be noted that I analysed seminal fluid and
spermatozoa combined, which was also different to a number of authors. However, I
did this to investigate the seasonal and drone age effects on overall chemical
composition quality of semen.
I was aware that there was a possibility of contaminating the semen samples with
arginine-HCl and lysine from the buffer in the capillary tubes during storage, even
though there was an airlock between the sample and the buffer. However, the
relatively low levels of arginine and lysine recorded in 2006, which are similar or
lower than other published data, suggest that no contamination occurred.
Novak et al. (1960) identified 15 amino acids present in seminal fluid and
spermatozoa, with higher amounts of arginine, lysine, leucine and glutamic acid
being present. I identified 16 amino acids present in crude drone semen, with
glutamic acid being the most abundant, and eight other amino acids (including
arginine lysine and leucine) present in relatively high amounts. There was generally
limited variation in their compositional level between the different aged drone
cohorts, breeding line or season.
Crailsheim and Leonard (1997) identified 18 amino acids in worker bee
haemolymph, including the ten amino acids De Groot (1953) described as essential
for honey bee growth and development. The current experiment, which examined
amino acids present in drone semen (seminal fluid and spermatozoa combined)
identified a number which were not in De Groot`s list. Leonard and Crailsheim
(1999) found levels of DeGroot’s essential amino acids in drone haemolymph did
189
not change significantly after 7 days of age, and with proline the most abundant
amino acid. The current experiment also found limited change in amino acid levels
in drone semen, but proline only the sixth most abundant amino acid.
No differences, in general, were identified between the amino acid levels present in
semen from drones reared from queen bees supplied by the two queen bee breeders,
A and B. The generally low range of differences between samples from the eight
ages and different seasons sampled may be explained by there being adequate
amounts of pollen, from a range of different plant species, being foraged and
consumed at the time the drones were sampled. This is also consistent with
Somerville’s (2004) view that most of the essential amino acids in many honey bee
collected pollens in eastern Australia are at levels sufficient to meet their nutritional
requirements.
5.4.2 Fatty acids
Considering both seasons, 2003-4 and 2006, a total of 32 fatty acids were identified,
with a further nine unidentified peaks each season. These investigations identified
fatty acids likely to be important constituents of drone semen content and indicate
that two: oleic and elaidic, are utilised by drones in their semen in larger amounts
than the other identified fatty acids. Blum et al. (1967) reported that C18:1 (56%)
and C16:0 (23%) fatty acids and were highly represented in drone semen, and the
current investigations also showed C18 types to be the most prominent. In addition,
the changes recorded in amounts of fatty acids present in semen of different aged
drones support the findings of Woyke and Jasinski (1978) that semen composition
changes with drone age.
5.4.3 General discussion
The significance of the amino acid and fatty acid composition and their levels in
drone semen is not well understood. Further work is required to identify benefits
(e.g. the effects on drone longevity), resulting from supplementary feeding of drone
rearing colonies with materials high in the identified amino and fatty acids,
especially in seasons of floral paucity.
190
The importance of a sufficient number of mature age drones each with high numbers
of sperm and high sperm viability and motility at queen bee mating apiaries is
emphasised by research data on D. melanogaster, which indicates that chemicals
present in the seminal fluid and in male accessory glands material transferred to the
female during mating modify the mated female`s behaviour by reducing the female`s
propensity to remate and accelerate egg production (Gillott 1996, 2002; Rice 1996,
Baer et al., 2001). Should similar effects of chemicals present in the seminal fluid
and accessory glands of drone bees on queen bees at mating be identified, then it
may be that the trigger mechanism which stops a queen from continuing mating and
initiates egg laying, which may commence only after the queen has mated for the
first time. An effect of these chemicals accelerating egg production after initial
mating may result in the queen bee having only a pre-determined, limited period of
time (e.g. only a few days) in which to subsequently complete the mating process.
This phenomenon, if shown to occur, may help to explain the results (Chapter 2 and
Rhodes and Somerville, 2003) in which a high proportion of laying queen bees 14 to
35 days of age had low numbers of sperm present in their spermathecae.
5.5 Conclusions
(i) The dietary requirements of drones require more attention in relation to the
eighteen amino acids and thirty two fatty acids identified in drone semen.
(ii) Changes in the levels of amino acids and fatty acids in drone semen associated
with drone age and season suggest that changes in semen quality are likely to occur
with drone age and season.
(iii) The period of time available to a queen bee to complete the mating process
between her initial mating and termination of mating flights requires clarification.
The less time available to a queen to complete her mating process increases the
importance of sufficient numbers of drones of adequate quality being present at the
mating site at all times she is on her mating flights.
191

CHAPTER 6
General Discussion and Recommendations
6.1 Introduction
For many years, at least since the 1960`s from my own experience, commercial
beekeepers (honey producers) in eastern Australia have been dissatisfied with the
quality (survival and performance) of queen bees purchased from specialist
commercial beekeepers who rear queen bees in large numbers (queen bee breeders or
queen rearers) for sale to honey producers to requeen their bee colonies, usually on
an annual basis. Dissatisfaction by honey producers with queen bee quality from
queen bees purchased from different breeders occurs amongst all the different queen
breeders and occurs in different years, i.e., it is not consistent with a particular group
of breeders or consistent over a number of years.
It is difficult to place a cost to the honey producer when a newly introduced young
queen bee fails to be accepted by the colony it was introduced into. Costs to the
honey producer can be based on (i) the colony attempts to rear a queen from brood
remaining from the original queen; if the attempt is successful, then generally the
brood age used is old and an inferior quality (low number of ovarioles) queen is
produced; if unsuccessful, then the colony becomes queenless and without further
management from the beekeeper will die out, (ii) there are added management costs
to the beekeeper including increased labour, travel, and loss of production from the
colony until it is brought back to full production strength.
Purchasers of commercially reared queen bees expect a percentage of queens to fail
on introduction, the usual expectation being about 5%. However, beekeepers do not
monitor exact details of queen failures and 5% is probably below actual failure rates.
Rhodes (1998) monitored queen survival following introduction of young
commercially reared queens of an unknown age, finding 10% absent after 14 days
192

and 30% absent after 15 weeks, suggesting that an average failure rate of about 20%
is probably a more realistic figure.
Initial studies for this thesis examined queen bee qualities (Chapter 2) which showed
that queen bees reared to the unmated stage were of a high standard, and that a
problem(s) occurred during the queen bee mating stage of production, i.e. the issue
was with drone quality and/or numbers. Procedures for the examination of drone
bees were developed with Chapter 3 describing materials and methodologies used
and Chapter 4 reporting on investigations of drone bee performances. Chapter 5
examined reasons for possible changes in drone semen quality and provided
information for the possible development of drone colony supplementary feeds.
6.2 General Discussion
The work described here is a comprehensive study of factors affecting introduction
success and mating success of queen bees. It involved the most detailed study
undertaken on drone quality and factors affecting drone quality. My studies also
generated detailed data on the quality of drones from a number of commercial
sources of queen breeding stock in eastern Australia.
My key findings were:
Queen bees
1. The youngest age to introduce queen bees into established colonies is about 24
days, with increasing survival rates up to 35 days
2. Queen bees should not be introduced into established colonies at 7 - 14 days of
age
3. A high standard for queen weight, number of ovarioles and spermatheca diameter
was recorded
4. Low number of sperm present in the mated queen`s spermatheca did not appear to
affect introduction success but is of major concern due to it:
(i) negatively affecting long-term life expectancy
193
(ii) indicating that a queen bee is able to stop mating and commence egg
laying with low sperm numbers present in her spermatheca
(iii) indicating that queens may have a limited and/or fixed time to complete
mating
(iv) suggesting a problem with low numbers and/or low quality of drones
available at the time of mating
5. Management practices for drone mother colonies require major attention
6. Transport effects on queen introduction survival are of minor importance
7. Queen cell cup position on the cell bar is of minor importance
8. Detrimental effects from semen residue in oviducts requires further investigation.
Semen release, volume of semen and number of sperm per drone
1. Forty-one percent of drones aged 14-35 days did not release semen after manual
eversion
2. The volume of semen produced per drone in the investigations is comparable with
published data
3. The number of sperm produced per drone is low compared with the majority of
published data
4. Sperm quality was high for spring and autumn drones and for drones aged 21 and
35 days
5. Age, breeding line and season were identified as factors influencing semen quality
Sperm viability and motility
1. Viability percentage is at the lower end of, but comparable with, limited published
data
2. Motility rating is lower than limited published data
Role of genetics in semen production
1. Results suggest that release of semen after manual eversion; semen volume; sperm
number, viability and motility may be selectable traits able to be improved by
breeding programs.
194

Effects of age and genetics on sperm release
1. Movement of sperm from the testes to the seminal vesicles was not complete until
age 5 - 11 days
2. Release of sperm from the seminal vesicles to the endophallus after manual
eversion occurs over a wide range of ages commencing at about day 7 and
continuing past day 30
3. Drones aged 21-22 days not releasing semen after manual eversion contained
sperm in their seminal vesicles
4. No specific age was identified when drones were considered to have matured.
Semen movement
1. Low sperm viability and/or motility are not the cause for sperm remaining in the
seminal vesicles after manual eversion
2. Results suggest that individual queen bees may produce drones with high levels of
dead sperm in their seminal vesicles.
Methodology
1. Manual eversion was identified as not being suitable for obtaining accurate
samples of semen for data on drone semen volume and sperm numbers.
Amino acids and fatty acids in drone semen
1. Changes in the levels of amino and fatty acids with drone age and season suggest
changes occur in semen quality
2. Dietary requirements of drones require attention based on amino and fatty acids
identified in semen in this study
195
Queen bee mating
1. Data from the queen and drone studies together strongly suggest the presence of a
mechanism within the queen which stops queen mating flights and initiates queen
egg laying
2. The mechanism operates irrespective of the number of sperm present in the
queen`s spermatheca
3. This implies that the queen has a controlled amount of time to complete the
mating process
4. Should such a mechanism be present, and is triggered by drone accessory gland
chemical,ie, from when the queen mates with the first drone, then the presence of
drones of suitable quality in sufficient numbers at commercial queen mating areas
increases greatly in importance to ensure maximum mating success
Disease effects
1. Although low levels of disease were recorded in some instances, overall, disease
did not appear to negatively affect results obtained in these studies.
6.3 Industry impacts
The importance of drone semen quality studies to the commercial beekeeping
industry has its effect on the mating success of queen bees. Sufficient numbers of
mature age drones, each producing a large volume of semen containing a high
number of sperm are required to be present at commercial queen bee mating apiaries
to result in queen bees with the maximum number of sperm present in their
spermathecae at the completion of the mating process. Low numbers of sperm in the
spermathecae of queen bees after mating contributes to early supersedure resulting in
increased costs to the beekeeper from queen replacement and reduced colony
production as colonies weaken in strength or become queenless during the period of
queen replacement.
196
This project provides information to persons interested in bee breeding, with
particular reference to commercial queen bee production, by providing data relating
to numbers of sperm and the amount of semen produced by drones and, thus,
highlighting the need to use these data in selection of queen bee drone mothers. It
furthermore indicates the most suitable method for collecting and measuring drone
sperm samples.
Initial experiments carried out during 2003 and 2004 examined the production and
quality of semen of A. mellifera drones from different commercial breeding lines, at
different ages and at different seasons during the commercial queen bee production
period in eastern Australia, between spring and the following autumn. The aim was
to determine whether problems associated with factors such as breeding line, drone
age or season negatively affected semen production and/or quality to the extent it
was not satisfactory for mating requirements of queen bees. Four breeding lines of
queen bees were selected to provide the drones, which were reared during different
months of the year to represent spring, summer and autumn reared drones. For each
breeding line and for each season drones were sampled (N ≤ 30) at three ages: 14, 21
and 35 days.
For the four breeding lines examined, significant differences were found between the
four lines for the proportion of drones producing semen at the endophallus after
manual eversion, the volume of semen produced per drone, and the number of sperm
produced per drone. These data suggest that genetics may be involved and these
three traits may be able to be selected for in a breeding program. One breeding line
was consistently superior to the other lines.
In the 2003-4 experiment, 41% of all drones examined at ages 14 to 35 days old did
not produce a measurable amount of semen at the endophallus after manual eversion.
Although a number of authors have made reference to the proportion of mature age
drones not producing semen at the endophallus after manual eversion, it does not
appear to have been identified as a subject of interest and neither has the importance
of its apparent consequences been recognised i.e., whether these drones produce
semen and whether they are capable of mating with queen bees. These questions are
important for the selection of drone mother queens to head drone producing colonies
197
during the establishment of commercial mating apiaries for mating large numbers of
queen bees in a short period of time.
Spring reared drones produced higher volumes of semen than summer drones which,
in turn, were higher than autumn drones. However, autumn drones produced higher
numbers of sperm than summer drones (which were also higher than spring drones),
indicating a seasonal variation in sperm concentration in semen. An age effect was
identified with 35-day-old drones having a higher proportion of drones producing
semen at the endophallus after manual eversion and producing a lower volume of
semen than 14- and 21-day-old drones. There was a high mortality rate amongst 35-
day-old drones and the higher percent of 35-day-old drones producing semen at the
endophallus after manual eversion, compared with those 14 and 21 days old,
suggests that drones able to produce semen at the endophallus after manual eversion
have a higher survival rate than drones not able to produce semen. There was no
significant difference between 14-, 21- and 35-day-old drones for the number of
sperm produced.
A large range was found for the volume of semen produced, mean 1.09 (ra. 0.77 ±
0.05 – 1.16 ± 0.04) µl, which was comparable to published data from Australia,
Europe and the USA. The range of numbers of sperm produced per drone in this
experiment, mean 3.63 (ra. 2.19 ± 0.19 – 4.72 ± 0.230) x 106, in general, were low
compared with published data from Australia, Europe and the USA.
Although drone ages and seasons were identified when drone semen was of a higher
quality, no drone age or season was found when drones were considered not suitable
for mating with queen bees based on semen quality.
Drone sperm viability averaged 79.7 (ra. 59.9-90.5) %. A significant season effect
was found with autumn drones recording higher viability than spring and summer
drones; a significant age effect with 21 day old drones with highest viability
followed by 35-day-old and 14-day-old drones with the lowest. A significant
breeding line effect was found with one line showing lower viability than the other
three lines. Sperm viability data from this experiment are at the lower end but
comparable with data published by USA authors and suggest that an improvement in
198

viability may be possible through a queen bee breeding program selecting for high
sperm viability in drones produced from those queen bees.
Sperm motility assessment resulted in significant season, age and breeding line
effects. These data were at the lower end but comparable with limited USA data and
suggest that sperm motility may be a selectable trait and thus, able to be improved by
a bee breeding program.
A planned examination of drones to determine whether genetic inheritance is
involved in the release of semen at the endophallus after manual eversion, the
volume of semen produced, and the number of sperm produced in drone honey bees,
was suspended after the original test queen bees displaying high and low levels of
the three characteristics were superseded. Drones from daughters of the superseded
queens and replacement queen bees from the same breeding lines did not display the
required characteristics. Never-the-less, data from this experiment suggest that if
these three characteristics are selectable traits then recessive genes may be involved
in their expression. Identification and maintenance of these traits in drone mother
queen bee breeding stock would require a continuing managed breeding program.
The seminal vesicles of all mature aged drones which did not produce semen at the
endophallus after manual eversion were found to contain sperm. These data raise the
question of whether mature age drones not releasing semen after manual eversion
and which contain sperm in their seminal vesicles are able to mate successfully with
queen bees in a natural mating situation.
An experiment carried out to investigate the relationship between semen release and
drone maturity also examined the accuracy of semen volume and sperm number
data, using drone manual eversion as the method for sample collection. Large
numbers of young drones were recorded at the lower eversion rating and large
numbers of older drones were recorded at the higher eversion rating. The change in
numbers of drones from low to high rating was, however, gradual and did not
identify a specific age at which drones change from low release of semen to high
release of semen, suggesting that drone maturation occurs over a wide range of drone
ages. Data from this experiment also suggest that manual eversion is not a suitable
199
method for collecting semen samples required to provide accurate semen volume and
sperm number data for individual drones, with dissection and counting sperm
numbers from the seminal vesicles providing a more reliable alternative.
No differences were found for sperm viability and sperm motility between sperm
which remained in the seminal vesicles and sperm which had moved to the
endophallus after manual eversion. This indicates that lower sperm quality, measured
in terms of viability and motility, is not the cause of sperm remaining in the seminal
vesicles of mature age drones following manual eversion.
Changes were identified in the amounts of amino acids and fatty acids in semen from
drones of different ages sampled at different seasons. Variations between fatty acid
levels suggest the resulting semen composition changes may affect semen quality.
The management of queen mating apiaries requires a knowledge of what is occurring
and a means of controlling all the factors involved to produce mated queen bees of
the highest quality. To assist with determining drone quality and numbers, it is
necessary to know the amount of time available to a queen bee to complete the
mating process. At present this information is not available and it is suggested here
that this is a major factor contributing to the high early failure rate of commercially
reared queen bees.
Successful colonies are generally those with high populations of worker bees
available at the correct time to do the job required. High worker population numbers
are principally dependent on the queen bee heading the colony laying large numbers
of fertilised eggs; one major requirement for this is the queen bee completing the
mating process with high numbers of viable sperm stored in her spermatheca.
Data from Chapter 2 and Rhodes and Somerville (2003) identified a high proportion
of 14- to 35-day-old, newly mated, laying queens with low numbers of sperm present
in their spermathecae, strongly suggesting that queen bees do not have unlimited
time to complete the mating process. The amount of time a queen bee actually has
available to complete the mating process is critical information for managing
commercial queen bee rearing and for ensuring the presence of adequate numbers of
200
high quality drones to mate with the number of queen bees present at that time. Only
then will queens be assured of maximum numbers of sperm in their spermathecae on
the completion of mating.
The importance of a sufficient number of mature drones, each with high numbers of
sperm and high sperm viability and motility at queen bee mating apiaries, is further
emphasised by reports which indicate that chemicals present in the seminal fluid and
ARG material transferred to the female during mating can modify a mated female`s
behaviour by reducing her propensity to remate and to also accelerate egg production
(Gillott, 1996, 2002; Rice, 1996; Baer et al., 2001). Should chemicals present in the
seminal fluid and accessory glands of drone honey bees have similar effects on
queen bees at mating, then it may be that the mechanism commences functioning
only after the queen has mated for the first time. The effect of the chemicals in
accelerating egg production may result in the queen bee having only a pre-
determined and limited amount of time in which to complete the mating process
once she has mated with the first drone.
6.4 Further research
Based on the findings reported in this thesis, there is further work which could
elucidate a number of issues. This suggested work includes:
1. Investigating whether holding queens in a queen bank is a satisfactory method for
ageing queens prior to their introduction into established bee colonies
2. Examining the use of HVA (4-hydroxy-3-methoxyphenethanol) as a management
tool for improving queen bee introduction success
3. Further assessing the effects of semen residue in oviducts on queen bee survival
and performance
4. Verifying whether (i) release of semen at the endophallus after manual eversion,
(ii) volume of semen, (iii) number of sperm produced per drone, (iv) sperm viability,
and (vi) sperm motility, are selectable traits able to be improved by breeding
programs, to provide selection criteria for drone mother queen bees
201

5. Investigating the significance of 41% of drones aged 14-35 days not releasing
semen at the endophallus after manual eversion in the context of their ability to mate
with queen bees and release semen
6. Assessing the impacts of nosema and virus diseases on sperm production, mating
ability and longevity of drones
7. Although no specific age for drone maturation was identified in this study, further
investigations are required to provide data for drone rearing management programs
8. Investigating reasons why sperm is retained in seminal vesicles after manual
eversion
9 Determining and developing supplementary diet requirements of drone honey bees
reared for breeding purposes, particularly in relation to the 18 amino acids and 32
fatty acids identified in drone semen
10. Assessing whether changes in amounts of amino acids and fatty acids in drone
semen (associated with drone age and season) influence semen quality and, in turn,
mating success
11. Accurately assessing the amount of time available to a queen to complete the
mating process between mating for the first time and having to halt mating flights
12. Developing and promulgating standard methodologies for (i) sampling sperm
from queen spermathecae and from drone seminal vesicles, and (ii) determining
volumes of fluid present and number of sperm present in queen spermathecae and in
drone seminal vesicles, to improve the accuracy of comparisons of data between
different authors.
13. Determining minimum acceptable levels for drone semen volume, number of
sperm, sperm viability and sperm motility for drone queen mother selection
14. Determining reasons for the high mortality rate of drones reared under good
conditions (with respect to colony strength and nutrition)
6.5 Final conclusion
The work here demonstrates that there is a vast amount of knowledge available on
rearing queen bees to the unmated stage and that commercial queen bee breeders
have the practical ability to apply this knowledge, demonstrated by the high physical
standards of queen bees supplied to this study. When the queen breeder reaches the
202

production stage of placing the mature queen cell in the mating nucleus colony to
allow the queen to emerge from the cell and mate, then the amount of knowledge
available to the queen breeder on the status of the queen within the mating nucleus
and when flying for mating purposes is very low, and correspondingly, the amount
of control the queen breeder has over the mating process is significantly reduced.
There are no external physical distinctions between mated and laying queen bees
with high numbers of sperm in their spermathecae and those with low numbers,
similarly, there are no physical distinctions between drones with high quality semen
and those with low quality semen. That is, it is not possible for queen bee breeders to
evaluate queen and drone bee quality under field conditions.
This work has attempted to find answers to practical problems which commercial
queen breeders face on a daily basis and for which there are a large number of
reasons and responses based principally on practical experience with little controlled
research involved. The work examined queen bees initially, examining many of the
queen bee breeder developed reasons why queens failed at introduction or soon
afterwards, e.g. transport between the queen rearing apiary and the honey producer`s
apiary; introduction of queens into colonies with low populations, on poor nutritional
conditions, and/or containing disease. It also examined many of the honey producer
developed reasons why queens fail on introduction, e.g. low quality rearing methods,
low quality of queen mating procedures, diseased queen rearing colonies.
For the limited number of queen bee breeders supplying queen bees to the study,
results showed a very high standard of the queen bees produced with the one
problem of low numbers of sperm in the laying queens` spermathecae. No other
subject examined on either the part of the queen bee breeder or the honey producer
was found to be of major concern. This study then examined drone quality, finding
drones produced from commercially reared queen bees to contain sperm numbers
generally lower than numbers published by other authors. This study of drones has
answered a small number of questions on drone rearing and maintenance while
identifying many areas requiring further studies It is hoped that this contributes to
the benefit of beekeeping industries within Australia and overseas
203

REFERENCES
ABARE 2008. Australian commodities. 15 (1), Canberra, Australia.
Abdelwahab, D., Rivera, M.M., Rodríguez-Gil, J.E. and Rigau, T. 2006. Seasonality effects on sperm motility kinematic parameters of Murciano-Granadina bucks. Reproduction of Domestic Animals, 41, Supplement 2, 103. (Abstract).
Akaike, H. 1974. A new look at statistical model identification. IEEE Transactions on Automatic Control. 19: 716-723.
Al-lawati, H., Kamp, G., Bienefeldt, K. 2009. Characteristics of the spermathecal contents of old and young honeybee queens. Journal of Insect Physiology, 55(2), 117-122.
Anderson, D. 1999. Variation with age of queen bees in ovariole and spermatozoa numbers and Nosema disease. CSIRO Entomology Department, Canberra, Australia (unpublished report).
Anderson, D. 2000. CSIRO Entomology Department, Canberra, Australia.
Anderson, D. 2004. Improving queen bee production. Publication No. 04/153, Rural Industries Research and Development Corporation, Canberra, Australia.
Anon. 2011. Production quantity of beeswax in Australia-1961-2009. downloaded from mongabay.com FAOSTAT database.
Australian Government 2008. More than honey: the future of the Australian honey bee and pollination industries. Report of the House of Representatives Standing Committee on Primary Industries and Resources, [1.1], Parliament of Australia, Canberra.
Australian Honey Bee Industry Council 2009. Annual Report, [email protected].
Baer, B., Maile, R., Schmid-Hempel, P., Morgan, E.D. and Jones, G.R. 2000. Chemistry of a mating plug in bumblebees. Journal of Chemical Ecology, 26 (8), 1869-1875.
Baer, B., Morgan, E.D. and Schmid-Hempel, P. 2001. A non-specific fatty acid within the bumblebee mating plug prevents females from remating. Proceedings of the National Academy of Sciences of the United States of America, 98 (7), 3926-3928.
Baer, B., Heazlewood, J.L., Taylor, N.L., Eubel, H., Millar, A.H. 2009. The seminal fluid proteome of the honeybee, Apis mellifera. Proteomics, 9, 2085-2097.
204
Baudry, E., Solignac, M., Garnery, L., Gries, M., Cornuet, J.M. and Koeniger, N. 1998. Relatedness among honey bees (Apis mellifera) of a drone congregation. Proceedings of the Royal Society of London, 26, 2009-2014. Benecke, F. 2003. Commercial beekeeping in Australia. Publication No. 03/037, Rural Industries Research and Development Corporation, Canberra, Australia.
Berg, S. and Koeniger, N. 1990. Larger drones (Apis mellifera) have more offspring. Proceedings of the German Zoological Society, 83rd Meeting, Frankfurt am Main, Gustav Fischer Verlag, 614.
Berg, S. 1992. Der reproduktionserfolg von drohnen (Apis mellifera L.) unterschiedlicher Größe. PhD Thesis, Johann-Wolfgang Goethe University, Frankfurt am Main.
Bishop, G.H. 1920. Fertilisation in the honey-bee. Journal of Experimental Zoology, 31 (2), 225-266.
Blum, M.S. 1996. Semiochemical parsimony in the arthropods. Annual Review of Entomology, 41, 353-374.
Blum, M.S., Glowska, Z. and Taber, S. III 1962. Chemistry of the drone honey bee reproductive system. II Carbohydrates in the reproductive organs and semen. Annals of the Entomological Society of America, 55, 135-139.
Blum, M.S., Bumgarner, J.E. and Taber, S. III 1967. Composition and possible significance of fatty acids in the lipid classes in honey bee semen. Journal of Insect Physiology, 13(9), 1301-1308.
Bresslau, E. 1905. Der samenblasengang der bienenkönigin. Zoologischer Anzeiger, 29, 299-325.
British Isles Bee Breeder`s Association, 1983. Pedigree bee breeding in western Europe. Codnor, Derby, UK.
Brockmann, A., Brückner, D. 1998. The EAG response spectra of workers and drones to queen honey bee mandibular gland components: the evolution of a social signal. Naturwissenschaften, 85, 283-285.
Brockmann, A., Dietz, D., Spaethe, J., Tautz, J. 2006. Beyond 9-ODA: sex pheromone communication in the European honeybee, Apis mellifera L. Journal of Chemical Ecology, 32, 657-667.
Brunnich, K. 1927. The temperature of the honey-bee. 1. The male sexual organs: their histological structure and physiological functioning. Journal of Experimental Zoology, 31 (2), 225-265.
Cantwell, G.E. 1970. Standard methods for counting nosema spores. American Bee Journal, 110, 222-223.
205
Casagrande-Ialoretto, D.C., Correa Bueno, O., Stort, A.C. 1984. The number of ovarioles in queen bees Apis mellifera. Naturalia, Sao Paulo, 9, 73-79.
Centre for International Economics 2005. Future directions for the Australian honeybee industry. Canberra, Australia.
Clemson, A. 1985. Honey and Pollen Flora. Inkata Press, Melbourne, Victoria.
Cleveland, W.S. 1979. Robust locally weighted regression and smoothing scatterplots. Journal of the American Statistical Association, 74, 829-836.
Cloake, H. 1977. Queen cell raising my way. Proceedings, Apimondia Conference, Adelaide, Australia.
Cobey, S. 1979. A New Zealander`s unique system of queen rearing. American Bee Journal, 119: 421.
Cobey, S. and Schley, P. 2002. Innovations in instrumental insemination. The compact versatile right and left handed Schley Model II instrument. American Bee Journal, 433-435.
Collins, A.M. 2000a. Survival of honey bee (Hymenoptera: Apidae) spermatozoa stored at above-freezing temperatures. Journal of Economic Entomology, 93 (3), 568-571.
Collins, A.M. 2000b. Relationship between semen quality and performance of instrumentally inseminated honey bee queens. Apidologie, 31, 421-429.
Collins, A.M. 2003. A scientific note on the effect of centrifugation on pooled honey bee semen. Apidologie, 34, 469-470.
Collins, A.M. 2004. Sources of variation in the viability of honey bee, Apis mellifera L., semen collected for artificial insemination. Invertebrate Reproduction and Development, 45 (3), 231-237.
Collins, A.M. and Donoghue, A.M. 1999. Viability assessment of honey bee Apis mellifera sperm using dual fluorescent staining. Theriogenology, 51, 1513-1523.
Collins, A.M. and Pettis, J.S. 2001. Effect of varroa infestation on semen quality. American Bee Journal, 141 (8), 590-593.
Collins, A.M., Caperna, T.J., Williams, V., Garrett, W.M. and Evans, J.D. 2006. Proteomic analyses of male contributions to honey bee sperm storage and mating. Insect Molecular Biology, 15: 541-549. doi:10.1111/j. 1365-2583.2006.00674.x
Colonello, N.A. and Hartfelder, K. 2003. Protein content and pattern during mucus gland maturation and its ecdysteroid control in honey bee drones. Apidologie, 34, 257-267.
206
Colonello, N.A. and Hartfelder, K. 2005. She`s my girl-male accessory gland products and their function in the reproductive biology of social bees. Apidologie, 36: 231-244.
Crailsheim, K. and Leonard, B. 1997. Amino acids in honeybee worker haemolymph. Amino Acids, 13, 141-153.
Crook, S. 2008. Australian Honey Bee Industry Survey, 2006-7. Publication No. 08/170, Rural Industries Research and Development Corporation, ACT, Canberra, Australia.
Czekonska, K. 2000. The influence of Nosema apis on young honey bee queens and transmission of the disease from queens to workers. Apidologie, 31: 6, 701-706.
Damiens, D., Bressac, C., Brillard, J-P. and Chevrier, C. 2002. Qualitative aspects of sperm stock in males and females from Eupelmus orientalis and Dinarmus basalis (Hymenoptera: Chalcidoidea) as revealed by dual fluorescence. Physiological Entomology, 27 (2), 97-102.
de Groot, A.P. 1953. Protein and amino acid requirements of the honeybee (Apis mellifera L.). Physiologia Comparata et d´Ecologia, 3, 197-285.
Delaney, A.D., Keller, J.J., Caren, J.R., Tarpy, D. 2010. The physical, insemination, and reproductive quality of honey bee queens (Apis mellifera L.). Apidologie, doi. 10.1051/apido/2010027.
Den Boer, S.P.A., Boomsma, J.J., Baer, B. 2009. Honey bee males and queens use glandular secretions to enhance sperm viability before and after storage. Journal of Insect Physiology, 55, 538-543.
Dietrich, G., Kowalski, R., Wojtczak, M., Dobosz, S., Goryczko, K. and Ciereszko, A. 2005. Motility parameters of rainbow trout (Oncorhynchus mykiss) spermatozoa in relation to sequential collection of milt, time of post-mortem storage and anaesthesia. Fish Physiology and Biochemistry, 31 (1), 1-9.
Dobson, A.J. 1984. Calculating sample size. Transactions of the Menzies Foundation, 7, 75-79.
Duay, P., De Jong, D., Engels, W. 2002. Decreased flight performance and sperm production in drones of the honey bee (Apis mellifera) slightly infested by Varroa destructor mites during pupal development. Genetic Molecular Research, 1 (3), 227-232.
Duncan, M. 2003. Controlled rearing of drone honey bees. University of Western Sydney, Hawkesbury, NSW, Australia. (personal communication).
Dzierzon, J. 1845 Gutachten über die von Herrn Direktor Stõhr im ersten und zweiten Kapitel des General-Gutachtens aufgestelten Fragen. Eichstädter Bienenzeitung 1, 109-113, 119-121.
207
Elbassiouny, A.M.M. 1992. Comparative studies on the Carniolan honey bee race and its crosses. PhD Thesis, Ain Shams University, Alexandria, Egypt, 53.
Engels, W., Rosenkranz, P., Adler, A., Taghizadeh, T., Lubke, G., Francke, W. 1997. Mandibular gland volatiles and their ontogenetic patterns in queen honey bees A. m. carnica. Journal of Insect Physiology, 43(4), 307-313.
Finley, J., Sammataro, D., Camazine, S. 1999. Queens in transit: spying on the post office. American Bee Journal, 139(4), 311.
Forster, I.W. 1971. The effect of air or surface mailing of queen bees on subsequent breeding, honey production, and queen supersedure. New Zealand Journal of Agricultural Research, 14, 951-953.
Francke, W., Lübke, G., Schröder, W., Reckziegel, A., Imperatriz-Fonseca, V., Kleinert, A., Engels, E., Hartfelder, K., Radtke, R., Engels, W. 2000. Identification of oxygen containing volatiles in cephalic secretions of workers of Brazilian stingless bees. Journal of the Brazilian Chemical Society, 11(6), 562-571.
Free, J.B. and Williams, I.H. 1975. Factors determining the rearing and rejection of drones by the honeybee colony. Animal Behaviour. 23, 650-675.
Fukuda, H. and Ohtani, T. 1977. Survival and life span of drone honeybees. Researches on Population Ecology. 19, 51-68.
Future directions for the Australian honeybee industry, 2005. Centre for International Economics, Canberra, Australia.
García-Gonzáles, F. and Simmons, L.W. 2005. Sperm viability matters in insect sperm competition. Current Biology, 15, 271-275.
Gençer, H.V. and Kayha, Y. 2011. Are sperm traits of drones (Apis mellifera L.) from laying worker colonies noteworthy? Journal of Apicultural Research, 50(2), 130-137.
Gibbs, D. and Muirhead, I. 1998. The economic value and environmental impact of the Australian beekeeping industry, report prepared for the Australian beekeeping industry. http:www.honeybee.org.au/economics.htm.
Gill, R. 1989. The value of commercially managed honey bee pollination services in Australia. The Australasian Beekeeper, 91 (6), 256-275.
Gillespie, P., Staples, J., King, C., Fletcher, M.J. And Dominiak, B.C. 2003. Small hive beetle, Aethina tumida (Murray) (Coleoptera Nitidulidae) in New South Wales. General and Applied Entomology, 32: 5-7.
Gillott, C. 1996. Male insect accessory glands: functions and control of secretory activity. Invertebrate Reproduction and Development, 30: 1-3, 199-205.
208

Gillott, C. 2002. Male accessory gland secretions: modulators of female reproductive physiology and behaviour. Annual Review of Entomology, 48, 163-184.
Gilmour, A.R., Gogel, B.J., Cullis, Thompson, R. 2006. ASReml User Guide Release 2.0. VSN International Ltd., Hemel Hempstead, UK.
Gizejewski, Z. 2004. Effects of season on characteristics of red deer (Cervus elaphus L.) semen collected using modified artificial vagina. Reproductive Biology, 4, 51-66.
Gordon, J. and Davis, L. 2003. Valuing honeybee pollination. Publication No. 03/077, Rural Industries Research and Development Corporation, Canberra, ACT, Australia.
Grout, R.A. (Editor) 1949. The hive and the honey bee, R.R. Donnelly and Sons Company, Chicago, USA.
Gulliford, R. (Ed.) 2005. Beekeeping in Australia. The Australasian Beekeeper, Rutherford, NSW, Australia.
Harizanis, P.C. and Gary, N.E. 1984. The quality of insemination of queen honey bees mated under commercial conditions. American Bee Journal, 124, 385-387.
Harris, R.L.N., Lacey, M.J., Brown, W.V., Allen, M.S. 1987. Determination of 2-methoxy-3-alkylpyrazines in wine by gas chromatography/mass spectrometry. Vitis, 26, 201-207.
Hill, K.D. and Johnson, L.A.S. 1995. Systematic studies in the eucalypts, 7. A revision of the bloodwoods, genus Corymbia (Myrtaceae). Telopea, 6(2-3), 233.
Hoage, T.R. and Kessel, R.G. 1968. An electron microscope study of the process of differentiation during spermatogenesis in the drone honey bee (Apis mellifera L.) with special reference to centriole replication and elimination. Journal of Ultrastructure Research, 24, 6-32.
Holman, L. 2009. Drosophila melanogaster seminal fluid can protect the sperm of other males. Functional Ecology, 23(1), 180-186.
Humphries, M.A., Müller, U., Fondrk, M.K. 2003. PKA and PKC content in the honey bee central brain differs in genotypic strains with distinct foraging behaviour. Journal of Comparative Physiology, 189, 555-562.
Hunt, G.J., Page, R.E. Jnr., Fondrk, M.K., Dullum, C.J. 1995. Major quantitative trait loci affecting honey bee foraging behaviour. Genetics, 141, 1537-1545.
Hunter, F.M. and Birkhead, T.R. 2002. Sperm viability and sperm competition in insects. Current Biology, 12, 121-123.
209

Jackson, J.T., Tarpy, D.R. and Fahrback, S.E. 2011. Histological estimates of ovariole number in honey bee queens, Apis mellifera, reveal lack of correlation with other queen quality measures. Journal of Insect Science, 11(82): 1-11. doi.org/10.1673/031.011.820
Jay, C. and Dixon, D. 1984. Infertile and nosema infected honey bees shipped to western Canada. Journal of Apicultural Research, 23, 40-44.
Jaycox, E.R. 1961. Effects of foods and temperatures on maturity of drone bees. Annals of the Entomological Society of America, 54, 519-523.
Johnstone, M. 2008. Rearing queen bees. NSW DPI, Primefact 828.
Jungwirth, J. 1972. Mating after egglaying starts? Controlled mating and selection of the honey bee. Apimondia, Bucharest, 54.
Kaftanoglu, O. and Peng, Y-S. 1984. Preservation of honeybee spermatozoa in liquid nitrogen. Journal of Apicultural Research, 23, 157-163.
Keeling, C.I., Slessor, K.N., Higo, H.A., Winston, M.L. 2003. New components of the honey bee (Apis mellifera L.) queen retinue pheromone. Proceedings of the National Academy of Science of the USA, 100, 4486-4491.
King, M., Eubel, H., Millar, A.H., Baer, B. 2011. Proteins within the seminal fluid are crucial to keep sperm viable in the honeybee Apis mellifera. Journal of Insect Physiology, 57(3), 409-414.
Kleinschmidt, G. (Undated). Banking of queen honey bees. Queensland Agricultural College, Lawes, Queensland, 2.5.1-2.5.8.
Kleinschmidt, G. 1984. Research report: Nutritional management of colonies on the basis of body protein of bees. Queensland University, Gatton Campus. Report to Honey Research Committee, D.P.I. and E., Canberra.
Kneebone, M. 2010. A study of existing and prospective markets and marketing activities for Australian honey. Publication No. 10/145, Rural Industries Research and Development Corporation, Canberra, ACT, Australia.
Kocher, S.D., Richard, F-J., Tarpy, D.R. and Grozinger, C.M. 2008. Genomic analysis of post-mating changes in the honey bee queen (Apis mellifera). BMC Genomics. 9: 232-248. doi: 10.1186/1471-2164-9-232
Koeniger, N. and Veith, H.J. 1983. Identification of a triglyceride (glyceryl-1, 2-dioleate-3-palmitate) as a brood pheromone of the honey bee (Apis mellifera L.). Apidologie, 14, 59.
Koeniger, G., Koeniger, N., Tingek, S. and Phiancharoen, M. 2005. Variance in spermatozoa numbers among Apis dorsata drones and among Apis mellifera drones. Apidologie, 36, 279-284.
210
Koeniger, N. and Koeniger, G. 2007. Mating flight duration of Apis mellifera queens: As short as possible, as long as necessary. Apidologie, 38(6), 606-611.
Köhler, F. 1955.Unter suchungen zum Problem der künstlichen Begattung der Bienenkönigin (Apis mellifera L.). Würzburg: Inaugral-Dissertation.
Kraus, F.B., Neumann, P., Scharpenburg, H., van Praagh, J. and Moritz, R.F.A. 2003. Male fitness of honeybee colonies (Apis mellifera L.). Journal of Evolutionary Biology, 16, 914-920.
Kurennoi, N.M. 1953. When are drones sexually mature? Pchelovodstvo, 11, 28-32 (in Russian). Translation in Marie Simpson, 1954, Some recent Russian researches on bees and beekeeping. Bee Research Association, London, 36 pp.
Lacey, M. 1999. Variation with age of queen pheromone from individual queens of Apis mellifera, CSIRO Entomology Department, Canberra, Australia (unpublished report).
Laidlaw, H.H. Jnr. 1979. Contemporary queen rearing. Dadant and Sons Inc., Illinois, USA.
Leonard, B. and Crailsheim, K. 1999. Amino acids and osmolarity in honeybee drone haemolymph. Amino Acids, 17, 195-205.
Live/Dead® Sperm Viability Kit 2001. Molecular Probes Inc Eugene, OR 97402-9165, USA.
Locke, S.J. and Peng, Y-S. 1993. The effects of drone age, semen storage and contamination on semen quality in the honey bee (Apis mellifera). Physiological Entomology.18, 144-148.
Lodesani, M., Balduzzi, D., Galli, A. 2004. A study on spermatozoa viability over time in honey bee (Apis mellifera ligustica) queen spermathecae. Journal of Apicultural Research, 43(1), 27-28.
Loper, G.M. 1993. What do we really know about drone flight behaviour? Bee World, 73, 198-203.
Mackensen, O. 1947. Effects of carbon dioxide on initial oviposition of artificially inseminated and virgin queen bees, U.S.D.A., Bureau of Entomology and Plant Quarantine, Baton Rouge, Louisiana, USA.
Mackensen, O. 1955. Experiments in the technique of artificial insemination of queen bees. Journal of Economic Entomology, 48(4), 418-421.
Mackensen, O. and Roberts, W.C. 1948. A manual for the artificial insemination of queen bees. USDA, Bureau of Entomology and Plant Quarantine, ET-250, 1-33.
211

Mailer, R.J., Ayton, J., Conlan, D. 2002. Comparison and evaluation of the quality of thirty eight commercial Australian and New Zealand olive oils. Advances in Horticultural Sciences, 16 (3-4), 256-259.
Mangum, W.A. 1997. Queen bee introduction: A review of the basics and a description of hostile worker behaviour towards the new queen. American Bee Journal, 137(1), 33-38.
Manning, R. 2001a. Fatty acids in pollen: a review of their importance for honey bees. Bee World, 82 (2), 60-75.
Manning, R. 2001b. Pollen analysis of Eucalypts in Western Australia. Publication No. 01/53, Rural Industries Research and Development Corporation, Canberra, ACT, Australia.
Martinez-Pastor, F., Guerra, C., Kaabi, M., Garcia-Macias, V., de Paz, P., Alvarez, M., Herraez, P. and Anel, L. 2005. Season effect on genitalia and epididymal sperm from Iberian red deer, roe deer and Cantabrian chamois. Theriogenology, 63 (7), 1857-1875.
MathSoft. 1999. Data Analysis. Products Division, MathSoft, Seattle, USA.
McCullagh, P. and Nelder, J.A. 1989. Generalised Linear Models, 2nd Edition. Chapman and Hall, London.
Medveczky, K. 2001. CSIRO Entomology Department, Canberra, Australia (personal communication).
Mifsud, C. 2011. Queen bee and package bee exports from New South Wales. AQIS, Canberra (personal communication).
Miller, C.C. 1911. Fifty years among the bees. The A.I.Root Company, Medina, Ohio.
Mindt, B. 1962. Untersuchungen über das Leben der Drohnen, insbesondere Ernährung und Geschlechtsreife. Z Bienenforsch 6: 9-33.
Moors, L., Spaas, O., Koeniger, G. and Billen, J. 2005. Morphological and ultrastructural changes in the mucus glands of Apis mellifera drones during pupal development and sexual maturation. Apidologie, 36, 245-254.
Moritz, R.F.A. 1981. Der einfluss der inzucht auf die fitness der drohnen von Apis mellifera carnica. Apidologie, 12, 41-55.
Moritz, R.F.A. 1986. Intracolonial worker relationship and sperm competition in the honey bee (Apis mellifera L.). Experientia, 42, 445-448.
Moritz, R.F.A. (Ed.) 1989. The instrumental insemination of the queen bee. Apimondia Publishing House, Bucharest, Romania, 22-28.
212

Moura, A.S.A.M.T., Kaps, M., Vogt, D.W. and Lamberson, W.R. 1997. Two-way selection for daily gain and feed conversion in a composite rabbit population. Journal of Animal Science, 75, 2344-2349.
Nelson, D.L. and Gary, N.E. 1983. Honey productivity of honeybee colonies in relation to body weight, attractiveness and fecundity of the queen. Journal of Apicultural Research, 22 (4), 209-213.
Nguyen V.N., 1995. Effects of protein nutrition and pollen supplementation of honey bee (Apis mellifera L.) colonies on characteristics of drones with particular reference to sexual maturity. MSc (Honours) Thesis, University of Western Sydney, Hawkesbury, NSW, Australia.
Niño, E.L., Tarpy, D.R. and Grozinger, C. 2011. Genome-wide analysis of brain transcriptional changes in honey bee (Apis mellifera L.) queens exposed to carbon dioxide and physical manipulation. Insect Molecular Biology, 20(3): 387-398. doi: 10.1111/j. 1365-2583.2011.01072.x
Novak, A.F., Blum, M.S., Taber, S. III and Liuzzo, J.A. 1960. Separation and determination of seminal plasma and sperm amino acids of the honey bee Apis mellifera. Annals of the Entomological Society of America, 53, 841-843.
Oakeshott, G. 2007. Billion dollar bees. About the House, Canberra, 18-23.
Oxley, P.R., Spivak, M., Oldroyd, B.P. 2010. Six quantitative trait loci influence task thresholds for hygienic behaviour in honeybees (Apis mellifera). Molecular Ecology, 19 (7), 1452-1461.
Pabst, M.A. and Pfeiler, G. 1994. The sperms of young drones of Apis mellifera. International Congress on Electron Microscopy 13, Paris, 689-690.
Page, R.E. Jnr. and Fondrk, M.K. 1995. The effects of colony-level selection on the social organisation of honey bee (Apis mellifera L.) colonies: colony-level components of pollen hoarding. Behavioural Ecology and Sociobiology, 36, 135-144.
Page, R.E. Jnr., Waddington, K.D., Hunt, G.J. and Fondrk, M.K. 1995. Genetic determinants of honey bee foraging behaviour. Animal Behaviour, 50, 1617-1625.
Page, R.E. Jnr., Erber, J. and Fondrk, M.K. 1998. The effect of genotype on response thresholds to sucrose and foraging behaviour of honey bees (Apis mellifera L.). Journal of Comparative Physiology A, 182, 489-500.Pain, J., Roger, B., Theurkauff, J. 1974. Determination of a seasonal cycle for the content of 9-oxodec- and 9-hydroxydec-2-enoic acids in the head of the virgin queen honey bee. Apidologie, 5, 319-355.
Pain, J. and Roger, B. 1978.Circadian rhythm of secretion of 9-oxodec-2-enoic acid, queen honey bee pheromone, and of 10-hydroxydec-2-enoic acid in worker honey bees. Apidologie, 9, 263-272.
213
Pankiw, T., Winston, M.L., Plettner, E., Slessor, K.N., Pettis, J.S., Taylor, O.R. 1996. Mandibular gland components of European and Africanised honey bee queens (Apis mellifera L.). Journal of Chemical Ecology, 22(4), 605-615.
Pankiw, T. and Page, R.E. Jnr. 1999. The effect of genotype, age, sex, and caste on response thresholds to sucrose and foraging behaviour of honey bees (Apis mellifera L.). Journal of Comparative Physiology A, 185, 207-213.
Phiancharoen, M., Wongsiri, S., Koeniger, N. and Koeniger, G. 2004. Instrumental insemination of Apis mellifera queens with hetero- and con-specific spermatozoa results in different sperm survival. Apidologie, 35, 503-511.
Plettner, E., Slessor, K.N., Winston, M.L., Oliver, J.E. 1996. Caste-selective pheromone biosynthesis in honeybees. Science, 271, 1851-1853.
Plettner, E., Otis, G.W., Wimalaratne, P.D.C., Winston, M.L., Slessor, K.N., Pankiw, T., Punchihewa, P.W.K. 1997. Species- and caste-determined mandibular gland signals in honey bees (Apis). Journal of Chemical Ecology, 23, 363-377.
Plettner, E., Slessor, K.N., Winston, M.L. 1998. Biosynthesis of mandibular acids in honey bee (Apis mellifera): De novo synthesis, route of fatty acid hydroxylation and caste-selective beta-oxidation. Insect Biochemistry and Molecular Biology, 28, 31-42.
R Development Core Team. 2007. A language and environment for statistical computing. R Foundation for Statistical Computing, Vienna, Austria. ISBN 3-900051-07-0, URL : http//www.Rproject.org.
Ram, K.R. And Wolfner, M.F. 2007. Seminal influences: Drosophila Acps and the molecular interplay between males and females during reproduction. Integrative and Comparative Biology, 47(3), 427-445.
Ravimurugan, T., Kanakaraj, P., Thangaraju, P. 2006. Effect of seasons on semen production traits in murrah buffalo bulls. Tamilnadu Journal of Veterinary and Animal Sciences, 2 (3), 109-111.
Rhodes, J.W. 1998. Introduction and early performance of queen bees: Introductory apiary status and post introduction results. Publication No. 08/099, Rural Industries Research and Development Corporation, Canberra, ACT, Australia.
Rhodes, J. 1999a. Drone honey bees-rearing and maintenance. The Australasian Beekeeper, 101 (1), 28-29.
Rhodes, J. 1999b. Drone mother colonies-numbers required and positioning of colonies. The Australasian Beekeeper, 101 (1), 22 and 25.
Rhodes, J. and Somerville, D. 2003. Introduction and early performance of queen bees - some factors affecting success. Publication No. 03/049, Rural Industries Research and Development Corporation, Canberra, ACT, Australia.
214

Rhodes, J. 2008. Small hive beetle, an in-hive control device using diatomaceous earth. www.dpi.nsw.gov.au/agriculture/livestock/honey-bees/pests-diseases
Rhodes, J.W., Harden, S., Spooner-Hart, R., Anderson, D. and Wheen, G. 2010. Effects of age, season and genetics on semen and sperm production in Apis mellifera drones. Apidologie, June, doi. 10.1051/apido/2010026, 1-5.
Rice, W.R. 1996. Sexually antagonistic male adaption triggered by experimental arrest of female evolution. Nature, 381, 232-234 (Abstract).
Rinderer, T.E. (Ed.) 1986. Bee genetics and breeding. Academic Press, Orlando, Florida, USA.
Rinderer, T.E., Collins, A.M., Pesante, D. 1985. A comparison of Africanised and European drones: weights, mucus gland and seminal vesicle weights and counts of spermatozoa. Apidologie, 16 (4), 407-412.
Rinderer, T.E., Guzman, L.I., Lancaster, V.A., Delatte, G.T., Stelzer, J.A. 1999. Varroa in the mating yard: 1. The effects of Varroa jacobsoni and Apistan® on drone honey bees. American Bee Journal, 139 (5), 134-139.
Rodriguez, V.B., Riley, C., Shafron, W. and Lindsay, R. 2003. Honeybee industry survey. Publication No. 03/039, Rural Industries Research and Development Corporation, Canberra, ACT, Australia.
Root, A.I. 1890. ABC of Bee Culture. Medina, Ohio, USA.
Rural Industries Research and Development Corporation (RIRDC) 2004. Honeybee research programme, http://www.rirdc.gov.au/programs/hb.htmL#Background
Ruttner, F. 1956. The mating of the honey bee. Bee World, 3, 2-15 and 23-24.
Ruttner, F. 1976. The instrumental insemination of the queen bee. Apimondia Publishing House, Bucharest.
Ruttner, F. (Ed.) 1983. Queen rearing biological basis and technical instruction. Apimondia Publishing House, Bucharest.
Schlüns, H., Schlüns, E.A., van Praagh, J. and Moritz, R.F.A. 2003. Sperm numbers in drone honeybees (Apis mellifera) depend on body size. Apidologie, 34, 577-584.
Schlüns, H., Koeniger, G., Koeniger, N., Moritz, R.F.A. 2004. Sperm utilization pattern in the honey bee (Apis mellifera). Behavioural Ecology and Sociobiology, 56, 458-463.
Schlüns, H., Moritz, R.F.A., Neumann, P., Kryger, P., Koeniger, G. 2005. Multiple nuptial flights, sperm transfer and the evolution of extreme polyandry in honeybee queens. Animal Behaviour, 70, 125-131.
Schulz-Langner, E. 1958. Zeitschrift fur Bienenforsch, 4 (4), 67-86.
215

Severson, D.W. and Erickson, E.H. 1989. Seasonal constraints on mating and insemination of queen honeybees in a continental climate. Apidologie, 20(1), 21-27.
Shafir, S., Kabanoff, L., Duncan, M., Oldroyd, B. 2009. Honey bee (Apis mellifera) sperm competition in vitro- two are no less viable than one. Apidologie, 40, 556-561.
Slessor, K.N., Kaminski, L.A., King, G.G.S., Winston, M.L. 1990. Semiochemicals of the honey bee queen mandibular glands. Journal of Chemical Ecology, 16(3), 851-860.
Slessor, K.N., Winston, M.L., LeConte, Y. 2005. Pheromone communication in the honey bee (Apis mellifera L.). Journal of Chemical Ecology, 31, 2731-2745.
Somerville, D. 2004. The floral resources of New South Wales of primary importance to beekeeping. PhD Thesis, Australian National University, Canberra, Australia.
Taber, S. 1987. Breeding super bees. A.I.Root Co., Medina, Ohio, USA.
Tarpy, D.R., Hatch, S., Fletcher, D.J. 2000. The influence of queen age and quality during queen replacement in honey bee colonies. Animal Behaviour, 59, 97-101.
Tier, B. 2004. Development of an experimental program to determine if genetic inheritance is involved in the volume of semen produced and number of sperm produced by drone honey bees. AGBU, University of New England, Armidale, New South Wales, Australia (personal communication).
Tourmente, M., Cardozo, G.A., Guidobaldi, H.A., Giojalas, L.C., Bertona, M., Chiaraviglio, M. 2007. Sperm motility parameters to evaluate the seminal quality of Boa constrictor occidentalis, a threatened snake species. Research in Veterinary Science, 82 (1), 93-98.
Tram, U. and Wolfner, M.F. 1998. Seminal fluid regulation of female sexual attractiveness in Drosophila melanogaster. Proceedings of the National Academy of Sciences of the United States of America, 95, 4051-4054.
Van Eaton, C. 1986. Determinants of queen quality in New Zealand commercial queens. The New Zealand Beekeeper, 28-30.
Venables, W.N. and Ripley, B.D. 2002. Modern Applied Statistics with S (4th edition). Springer.
Vesely, V. 1970. Retention of semen in the lateral oviducts of artificially inseminated honey bee queens (A. mellifera L.). Acta Entomologica Bohemoslovaca, 67, 83-9.
Warhurst, P. 2011. Beeswax price paid to Queensland beekeepers. Queensland Department of Primary Industries and Fisheries, Warwick, Queensland (personal communication).
216

Werner, M. and Simmons, L.W. 2008. Insect sperm motility. Biological Reviews, 83(2), 191-208.
Wheen, G. 2003. Management of drone honey bees prepared for semen collection. Richmond, NSW, Australia (personal communication).
Winston, M.L. and Slessor, K.N. 1998. Honeybee primer pheromones and colony organisation: gaps in our knowledge. Apidologie, 29, 81-95.
Witherell, P.C. 1972. Flight activity and natural mortality of normal and mutant drone honeybees. Journal of Apicultural Research, 11, 65-75.
Wossler, T.C., Jones, G.E., Allsopp, M.H., Hepburn, R. 2006. Virgin queen mandibular gland signals of Apis mellifera capensis change with age and affect honey bee worker responses. Journal of Chemical Ecology, 32, 1043-1046.
Woyke, J. 1960. Natural and artificial insemination of queen honey bees. Pszczelnicze Zeszyty Naukowe, 4, 183-275.
Woyke, J. 1962. Natural and artificial insemination of queen bees. Bee World, 43, 21-25.
Woyke, J. 1963. Drone larvae from fertilised eggs of the honeybee. Journal of Apicultural Research, 2, 19-24.
Woyke, J. 1964. Causes of repeated mating flights by queen honeybees. Journal of Apicultural Research, 3, 17-23.
Woyke, J. 1971. Correlations between the age at which honey bee brood was grafted, characteristics of the resultant queens, and results of insemination. Journal of Apicultural Research, 10, 45-55.
Woyke, J. 1973. Reproductive organs of haploid and diploid drones. Journal of Apicultural Research, 12, 1-18.
Woyke, J. 2010. Three substances ejected by Apis mellifera drones from everted endophallus and during natural matings with queen bees. Apidologie, 41(6), 613-621.
Woyke, J. and Jasinski, Z. 1978. Influence of age of drones on the results of instrumental insemination of honey bee queens. Apidologie, 9, 203-212.
Woyke, J., Wilde, J. and Wilde, M. 2001. Apis dorsata drone flights, collection of semen from everted endophalli and instrumental insemination of queens. Apidologie, 32, 407-416.
217