Phenotypic diversity in cold-tolerant peanut ( Arachis hypogaea L.) germplasm
Upload
independentCategory
view
0download
0
AFLP-Based Genetic Diversity Assessmentof Commercially Important Tea Germplasm in India
R. K. Sharma • M. S. Negi • S. Sharma •
P. Bhardwaj • R. Kumar • E. Bhattachrya •
S. B. Tripathi • D. Vijayan • A. R. Baruah •
S. C. Das • B. Bera • R. Rajkumar • J. Thomas •
R. K. Sud • N. Muraleedharan • M. Hazarika •
M. Lakshmikumaran • S. N. Raina • P. S. Ahuja
Received: 12 August 2009 / Accepted: 19 November 2009 / Published online: 14 April 2010
� Springer Science+Business Media, LLC 2010
Abstract India has a large repository of important tea accessions and, therefore,
plays a major role in improving production and quality of tea across the world.
Using seven AFLP primer combinations, we analyzed 123 commercially important
tea accessions representing major populations in India. The overall genetic simi-
larity recorded was 51%. No significant differences were recorded in average
genetic similarity among tea populations cultivated in various geographic regions
(northwest 0.60, northeast and south both 0.59). UPGMA cluster analysis grouped
the tea accessions according to geographic locations, with a bias toward China or
Assam/Cambod types. Cluster analysis results were congruent with principal
component analysis. Further, analysis of molecular variance detected a high level of
R. K. Sharma (&) � P. Bhardwaj � R. Kumar � P. S. Ahuja (&)
Biotechnology Division, Institute of Himalayan Bioresource Technology, CSIR,
P.O. Box 6, Palampur 176061, Himachal Pradesh, India
e-mail: [email protected]
P. S. Ahuja
e-mail: [email protected]
M. S. Negi � S. B. Tripathi � M. Lakshmikumaran
Plant Molecular Biology Division, The Energy Resources Institute, Darbari Seth Block,
IHC Complex, Lodhi Road, New Delhi 110003, India
S. Sharma � E. Bhattachrya � S. N. Raina
Department of Botany, University of Delhi, Delhi 110007, India
D. Vijayan � R. Rajkumar � J. Thomas � N. Muraleedharan
UPASI Tea Research Institute, Valparai, Coimbatore 642127, India
A. R. Baruah � S. C. Das � B. Bera � M. Hazarika
Tea Research Association, Tocklai Experimental Station, Jorhat 785008, Assam, India
R. K. Sud
HATS Division, Institute of Himalayan Bioresource Technology, CSIR,
P.O. Box 6, Palampur 176061, Himachal Pradesh, India
123
Biochem Genet (2010) 48:549–564
DOI 10.1007/s10528-010-9338-z

genetic variation (85%) within and limited genetic variation (15%) among the
populations, suggesting their origin from a similar genetic pool.
Keywords AFLP � Genetic diversity � Tea accessions � Institute of Himalayan
Bioresource Technology (IHBT) � Tea Research Association � UPASI Tea Research
Foundation
Introduction
Tea is one of the oldest, most widely consumed, and least expensive natural
beverages, known the world over for its heritage brew, with various flavors and
antioxidant properties. Because of specific soil and climate requirements, tea
production is confined to particular regions of Asia (India, China, Sri Lanka, Japan,
Vietnam, and Indonesia), Africa (Kenya, Uganda, and Malawi), and to a small
extent Latin America (e.g., Argentina). It is one of the most important agro-based,
eco-friendly, labor-intensive, employment-generating, and export-oriented indus-
tries in all of the countries in which it is grown.
The genus Camellia has been described as containing 82 species (Sealy 1958),
but other taxonomic classification systems have also been proposed in the recent
past. For example, Chang (1981, 1998) recognized 284 species, and Ming (2000)
identified 119 species. Of these plants, only three have contributed significantly to
the entire genetic pool of cultivated tea worldwide: the China type, Camelliasinensis (L.) O. Kuntze; the Assam type, C. assamica ssp. assamica (Masters); and
the Cambod type, C. assamica ssp. lasiocalyx (Planch MS). Because of their
compatibility across species, these plants breed with other wild Camellia species,
such as C. flava, C. petelotii (Wight 1962), and C. lutescens (Sharma and
Venkataramani 1974), and these wild species have also contributed to the tea gene
pool, in addition to C. irrawadiensis and C. taliensis, which have morphological
proximity to tea (Banerjee 1992). Therefore, tea cultivated at the national level is
highly heterogeneous, having several intergrades, introgressants, and putative
hybrids. These can be categorized from China types through intermediate to Assam
types, and hence the existence of true China, Assam, or Cambod tea is doubtful
(Visser 1969).
Annual world tea production grew by more than 3% in 2006, to reach an estimated
3.6 million metric tons (FAO 2008). An increase was also recorded in India, the
second-largest producer and consumer, where harvests were also 3% higher, totaling
(945,000 metric tons) in the same year. Nonetheless, India ranks first as a producer,
consumer, and exporter of black tea. Tea-producing areas in India are confined to
three major geographic regions: the northeast, represented by Assam, West Bengal,
Bihar, Tripura, Sikkim, Manipur, Nagaland, Meghalaya, Arunachal Pradesh, and
Mizoram; the south, represented by Kerala, Karnataka, and Tamil Nadu; and the
northwest, represented by the hills of Himachal Pradesh and Uttarakhand.
The introduction of tea germplasm from China in the year 1836 and its subsequent
spontaneous large-scale hybridization with indigenous tea accessions and wild
relatives from a wide range of geographic distribution in India led to hybrid swarms
550 Biochem Genet (2010) 48:549–564
123

with tremendous genetic variability. In order to maintain a heterogeneous gene pool
at the national level, regional germplasm collection centers were established in
predominant tea-growing areas. Tea germplasm is now maintained at the national
level in northeastern India at the Tea Research Association, Tocklai Experimental
Station, Jorhat, Assam; in southern India at the United Planters’ Association of
Southern India (UPASI), Valparai, Coimbatore; and in northwestern India at the
Institute of Himalayan Bioresource Technology (IHBT), Palampur. It is estimated
that presently more than 2532 accessions are held by Tocklai Experimental Station
(Singh 1999). Large numbers of commercially important accessions are also
available at UPASI and IHBT. There is, therefore, an immediate need for assessing
the highly heterogeneous tea germplasm representing major populations in India at
the DNA sequence level, not only for the future benefits in identification, inventory,
utilization, management, and conservation of the tea germplasm but also for the
development of a strategy for future genetic improvement programs. In the past
decade or so, many efforts have been made to assess the genetic diversity of Indian
tea germplasm at the phenotypic (Barua 1963; Banerjee 1992; Das 2001),
cytogenetic (Bezbaruah 1971), biochemical (Saravanan et al. 2005), and molecular
levels (Paul et al. 1997; Mondal 2002; Wachira et al. 2001; Balasaravanan et al.
2003; Singh and Ahuja 2006; Karthigeyan et al. 2008; Sharma et al. 2009).
Numerous genetic diversity studies have also been conducted on tea germplasm in
other regions of the world, using various molecular marker techniques (Kaundun
et al. 2000; Kaundun and Matsumoto 2002; Chen et al. 2005; Chen and Yamaguchi
2005; Matsumoto et al. 2004; Ohsako et al. 2008; Yao et al. 2008). Most of these
investigations carried out nationally or internationally, however, suffer from an
important lacuna: either small sample size or accessions restricted to a particular
region.
In this study, for the first time, a large number of samples covering the total
spectrum of variation of the tea in India were used to make a comprehensive study
of polymorphism at the DNA sequence level. This analysis provides evidence of
existing genetic relatedness and molecular diversity of the commercial tea
accessions at the national level and thus should be helpful in developing a strategy
for the genetic improvement program in tea. In a coordinated effort, we have
characterized 123 commercially important tea accessions representing major
populations in different geographic regions of India by AFLP markers.
Materials and Methods
Plant Materials
Of the 123 tea accessions, 57 were from northeastern India, 44 from southern India,
and 14 from northwestern India. In addition, four released accessions from the Tea
Research Institute, Sri Lanka, and a single accession from the National Research
Institute of Vegetables, Ornamental Plants, and Tea (NIVOT), Japan were also
included in the study, along with three wild relatives of ornamental C. japonica for
comparison. All of these accessions were either collected from commercial estates
Biochem Genet (2010) 48:549–564 551
123

or abandoned tea gardens or developed by open pollination and control crosses
through the breeding program at various centers, and they are regionally maintained
at the Tocklai Experimental Station in the northeast, UPASI in the south, and IHBT
in the northwest (Table 1). The northeastern accessions (at Tocklai) consisted of
collections from Darjeeling in West Bengal and Cachar in Assam. The southern
collections (at UPASI) included accessions from Nilgiris, Anamallais, and Munnar
and released accessions of Tata Tea Limited. The northwestern collections
(at IHBT) consisted of accessions from Himachal Pradesh and Uttarakhand states.
The characteristics of these accessions listed in Table 1 are from either published
information (Bezbaruah and Dutta 1977; Barbora et al. 1996) or observations
recorded and provided by the respective institutes.
DNA Extractions and AFLP Analysis
Total DNA was extracted from fresh leaf tissue by the CTAB method (Doyle and
Doyle 1990) with minor modifications. The quality and concentration of the
extracted DNA were estimated on 0.8% agarose gel using diluted uncut kDNA as a
standard. AFLP fingerprints were generated based on the protocol of Vos et al.
(1995) with slight modifications. Genomic DNA (250 ng) was restricted with EcoRI
and MseI and ligated to standard adapters. The adapter-ligated DNA served as a
template for preamplification, with PCR parameters of 20 cycles of 30 s at 94�C,
60 s at 56�C, and 60 s at 72�C. Selective amplification was subsequently carried out
using EcoRI and MseI primers. The EcoRI primer was labeled with c-33P ATP using
T4 polynucleotide kinase. The first selective amplification cycle consisted of 30 s at
94�C, 30 s at 65�C, and 60 s at 72�C. The annealing temperature was lowered by
0.7�C per cycle during the next 12 cycles, followed by 23 cycles at 94�C for 30 s,
56�C for 30 s, and 72�C for 60 s. All PCR reactions were carried out in a PE-9700
thermocycler (Perkin Elmer, USA). AFLP products were resolved on a 5%
denaturing polyacrylamide gel using 19 Tris–borate–EDTA (TBE) electropho-
resis buffer. The gel was dried for 2 h before subjecting it to autoradiography for
1–3 days at -70�C, depending on the signal intensity. The size of the fragments was
estimated using 20 bp size standards (BioWhittaker Molecular Applications, USA).
Molecular Data Analysis
An AFLP fragment was assumed to represent a single locus, and reproducible
polymorphic fragments were scored as present (1) or absent (0). The polymorphism
information content (PIC) of each marker was calculated according to Anderson
et al. (1993). Data were entered into a binary matrix as discrete variables. Jaccard’s
coefficient of similarity was measured, and a dendrogram based on similarity
coefficients was generated using the unweighted pair group method with arithmetic
mean (UPGMA). The computer package NTsys-PC 2.02 (Rohlf 1998) was used for
cluster analysis. Bootstrap analysis was performed to determine significance of
the clusters with Paup version 4.0b10 (Swofford 1993). In order to identify the
most informative primer pair, discrimination rate was calculated as the number of
polymorphic pairs per total number of pairs of accessions. The structure of the
552 Biochem Genet (2010) 48:549–564
123

Table 1 Tea accessions used for AFLP analysis
Serial
no.
Accession Varietal type Sourced Remarkse
1 KangraAsha China hybrid Himachal Pradesh, Krishi Viswavidyalaya,
Palampur
H
2 KangraJat China hybrid IHBT
3 K-15 China hybrid Khilpet, Palampur
4 BS-26 China hybrid IHBT E
5 BS-1 China hybrid IHBT
6 BS-14 China hybrid IHBT
7 BS-38 China hybrid IHBT
8 BS-46 China hybrid IHBT
9 BS-53 China hybrid IHBT
10 BS-54 China hybrid IHBT
11 BS-65a China hybrid IHBT
12 BS-68 China hybrid IHBT G
13 KM-9 China hybrid Vijaypur Tea Estate, Kumaon Hills,
Uttarakhand
14 KM-8 China hybrid Gwaldam, Kumaon Hills, Uttarakhand
15 CSIN-303536 China NIVOT, Japan
16 TS-379b Assam Tocklai ES A
17 TS-464a Assam Tocklai ES A
18 TS-449b Assam hybrid Tocklai ES A
19 TG-270/2/13 Assam Tocklai ES
20 Teenali-17/
154
Assam Teenali, Assam
21 RYDAK-1 China Makaibari Tea Estate, Darjeeling
22 AV-2-Ic China Makaibari Tea Estate, Darjeeling
23 TV-1c Assam-China
hybrid
Tocklai ES A
24 TV-2c Assam Tocklai ES C
25 TV-3c Assam Tocklai ES
26 TV-4c Assam Tocklai ES D
27 TV-5c Assam Tocklai ES A
28 TV-6c Assam Tocklai ES D
29 TV-7c China hybrid Tocklai ES B
30 TV-8c Assam Tocklai ES D
31 TV-9c Cambod Tocklai ES B, O
32 TV-10c Assam Tocklai ES B
33 TV-12c Assam Tocklai ES B
34 TV-13c Assam Tocklai ES D
35 TV-14c Assam hybrid Tocklai ES B
36 TV-15c Assam Tocklai ES A
37 TV-16c Assam hybrid Tocklai ES B
38 TV-17c Assam hybrid Tocklai ES A
Biochem Genet (2010) 48:549–564 553
123

Table 1 continued
Serial
no.
Accession Varietal type Sourced Remarkse
39 TV-18a Cambod Tocklai ES B
40 TV-19a Cambod Tocklai ES A
41 TV-20c Cambod Tocklai ES A
42 TV-21 Assam Tocklai ES D
43 TV-22a Cambod Tocklai ES B
44 TV-23a Cambod Tocklai ES A
45 TV-24c Cambod/ssp.
hybrid
Tocklai ES B
46 TV-25a Cambod Tocklai ES B
47 TV-26a Cambod Tocklai ES B
48 TV-27c Cambod Tocklai ES B
49 TV-28c Cambod Tocklai ES B
50 TV-29a Cambod, triploid Tocklai ES B
51 TV-30a Cambod Tocklai ES B
52 S-3a/1 Assam Tocklai ES
53 KP-6/25a China-Assam
hybrid
Tocklai ES
54 CB-38c Assam-China
hybrid
Tocklai ES
55 LG-26c China-Assam
hybrid
Cachar, Assam B
56 LG-17a China-Assam
hybrid
Cachar, Assam B
57 P-126 China Tocklai ES
58 P-463 China-Cambod
hybrid
Tocklai ES
59 P-492 China-Cambod
hybrid
Tocklai ES
60 BJ-02b China-Assam
hybrid
Tocklai ES
61 Nokrai-89 Assam Tocklai ES
62 HK-22/14c China-Assam
hybrid
Tocklai ES C
63 HK-23/19c China-Assam
hybrid
Tocklai ES C
64 HV-39a China Darjeeling, West Bengal
65 SS-40Ac China-Assam
hybrid
Tocklai ES B
66 CP-01a China Darjeeling, West Bengal
67 NJ-6/24a China-Assam
hybrid
Tocklai ES B
68 T-78c China Darjeeling, West Bengal B
69 RR-17/144c China Darjeeling, West Bengal
554 Biochem Genet (2010) 48:549–564
123

Table 1 continued
Serial
no.
Accession Varietal type Sourced Remarkse
70 Teesta-
Valley-1cChina Darjeeling, West Bengal
71 S-3 Assam Tocklai ES
72 T-3E/3 Assam Tocklai ES
73 UPASI-1 Assam Brookland A, J, M
74 UPASI-2a Assam Brookland A, J
75 UPASI-3a Assam Brookland D, H, J
76 UPASI-4 Assam Brookland
77 UPASI-5 Cambod Brookland J
78 UPASI-6 Assam Brookland A, J
79 UPASI-7 Assam Brookland A, H, J
80 UPASI-8 Cambod Brookland D, J
81 UPASI-9a Assam Brookland G
82 UPASI-10 China Brookland A, I, M
83 UPASI-11 Assam Brookland J
84 UPASI-12 Cambod Brookland
85 UPASI-13 Assam Brookland J
86 UPASI-14 Cambod Singara Estate, The Nilgiris J
87 UPASI-15 China Springfield Estate, The Nilgiris A, J
88 UPASI-16 Assam Brookland A, J
89 UPASI-17a Cambod Brookland D, J
90 UPASI-18 Cambod Brookland A, J
91 UPASI-19 Cambod Springfield Estate, The Nilgiris A, E, K
92 UPASI-20 China Brookland H, J
93 UPASI-21 Assam Brookland J
94 UPASI-22c Assam Brookland A
95 UPASI-23 Assam Brookland A, J
96 UPASI-24 Cambod Brookland A, J
97 UPASI-25c Cambod Anamallais, Valparai, Coimbatore J
98 UPASI-26a Assam Davershola, Gudalur, The Nilgiris A, J, L,
M
99 UPASI-27a Assam Anamallais, Valparai, Coimbatore A, J, L
100 TRI-2026a Assam TRI, Sri Lanka H
101 TRI-2024a Assam TRI, Sri Lanka A, N
102 TRI-2025 Assam TRI, Sri Lanka
103 TRI-2043 Assam TRI, Sri Lanka F
104 ATK-1 Assam Attikunna, The Nilgiri-Wayanad A, J
105 AK-1 China Akkamalai, Anamallais
106 CR-6017 Cambod Craigmore, The Niligiris D
107 SA-6 Assam UPASI E
108 BSS-1 Assam UPASI A, K
Biochem Genet (2010) 48:549–564 555
123
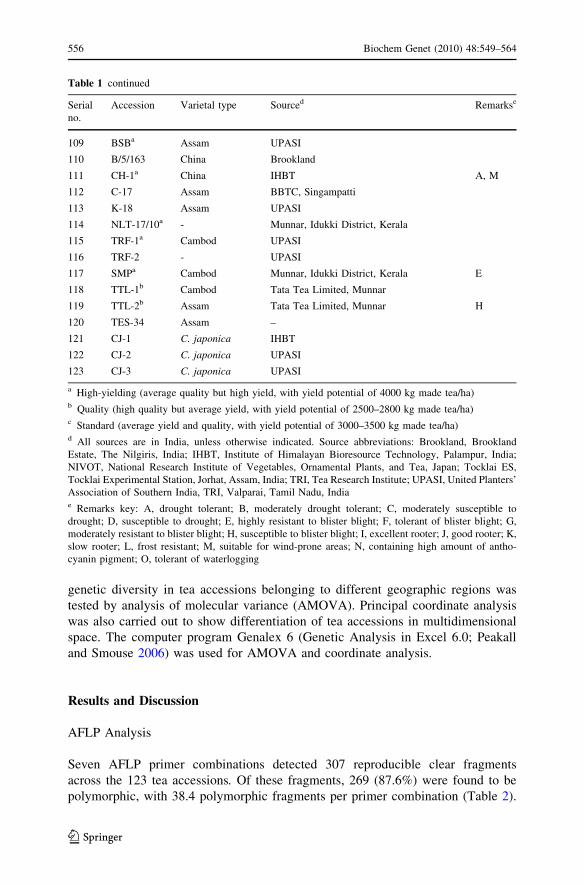
genetic diversity in tea accessions belonging to different geographic regions was
tested by analysis of molecular variance (AMOVA). Principal coordinate analysis
was also carried out to show differentiation of tea accessions in multidimensional
space. The computer program Genalex 6 (Genetic Analysis in Excel 6.0; Peakall
and Smouse 2006) was used for AMOVA and coordinate analysis.
Results and Discussion
AFLP Analysis
Seven AFLP primer combinations detected 307 reproducible clear fragments
across the 123 tea accessions. Of these fragments, 269 (87.6%) were found to be
polymorphic, with 38.4 polymorphic fragments per primer combination (Table 2).
Table 1 continued
Serial
no.
Accession Varietal type Sourced Remarkse
109 BSBa Assam UPASI
110 B/5/163 China Brookland
111 CH-1a China IHBT A, M
112 C-17 Assam BBTC, Singampatti
113 K-18 Assam UPASI
114 NLT-17/10a - Munnar, Idukki District, Kerala
115 TRF-1a Cambod UPASI
116 TRF-2 - UPASI
117 SMPa Cambod Munnar, Idukki District, Kerala E
118 TTL-1b Cambod Tata Tea Limited, Munnar
119 TTL-2b Assam Tata Tea Limited, Munnar H
120 TES-34 Assam –
121 CJ-1 C. japonica IHBT
122 CJ-2 C. japonica UPASI
123 CJ-3 C. japonica UPASI
a High-yielding (average quality but high yield, with yield potential of 4000 kg made tea/ha)b Quality (high quality but average yield, with yield potential of 2500–2800 kg made tea/ha)c Standard (average yield and quality, with yield potential of 3000–3500 kg made tea/ha)d All sources are in India, unless otherwise indicated. Source abbreviations: Brookland, Brookland
Estate, The Nilgiris, India; IHBT, Institute of Himalayan Bioresource Technology, Palampur, India;
NIVOT, National Research Institute of Vegetables, Ornamental Plants, and Tea, Japan; Tocklai ES,
Tocklai Experimental Station, Jorhat, Assam, India; TRI, Tea Research Institute; UPASI, United Planters’
Association of Southern India, TRI, Valparai, Tamil Nadu, Indiae Remarks key: A, drought tolerant; B, moderately drought tolerant; C, moderately susceptible to
drought; D, susceptible to drought; E, highly resistant to blister blight; F, tolerant of blister blight; G,
moderately resistant to blister blight; H, susceptible to blister blight; I, excellent rooter; J, good rooter; K,
slow rooter; L, frost resistant; M, suitable for wind-prone areas; N, containing high amount of antho-
cyanin pigment; O, tolerant of waterlogging
556 Biochem Genet (2010) 48:549–564
123

The remaining 38 bands (12.3%) were monomorphic in all tested accessions and,
therefore, could be used to understand the pattern of divergence and the phylum-
specific genetic clock (Hill et al. 1996). AFLP analysis detected a large number of
distinct scorable fragments per primer combination (Fig. 1). The number of
fragments generated with each primer combination ranged from 21 (E-ACG/M-
CTGC) to 58 (E-ACG/M-CGAT), with an average of 43.9 fragments per primer
combination. The detection of comparatively fewer fragments per primer combi-
nation than was reported by Paul et al. (1997) in an AFLP analysis of Indian and
Kenyan tea germplasm might be due to the presence of four arbitrary nucleotides at
Table 2 AFLP analysis by primer combination
Primer
combination
Total
fragments
Polymorphic
fragments
% Polymorphism PIC Discrimination
rate
E-ACA/M-CACG 36 33 91.66 0.413 0.99
E-AAG/M-CTGC 51 43 84.31 0.418 0.99
E-ACG/M-CTGC 21 17 80.95 0.322 0.99
E-AAC/M-CTAC 53 52 98.11 0.454 0.99
E-ACG/M-CGAT 58 51 87.93 0.500 0.99
E-AAG/M-CGTG 46 31 67.39 0.404 0.99
E-AAG/M-CAGT 42 42 100.0 0.474 0.99
Total 307 269
Mean 43.85 38.42 87.6 0.426 0.99
Fig. 1 A representative amplification profile generated with AFLP primer combination E-ACA/M-CTGC. Lanes 1–55 represent 55 tea accessions (Table 1); Lane M, 20 bp ladder (Cambrex BioScience Rockland, USA) used as size standard
Biochem Genet (2010) 48:549–564 557
123

the 30 end of the MseI primers during selective amplifications in the present study.
All primer combinations tested in our study revealed high discrimination power
(C0.99). Primer combination E-ACG/M-CGAT showed the highest PIC (0.500),
whereas the lowest value was recorded with primer pair E-ACG/M-CTGC (0.322).
The three primer combinations E-AAC/M-CTAC, E-ACG/M-CGAT, and E-AAG/
M-CAGT each recorded a PIC C 0.45 (Table 2); therefore, they can be categorized
as informative primer combinations for characterizing an even larger set of tea
germplasm.
AFLP-Based Genetic Relationships
The 123 tea accessions clustered into two major groups, plus an outgroup consisting
of the three C. japonica ornamentals (Fig. 2). A dendrogram constructed on the
basis of shared fragments largely matched the existing taxonomic classification of
tea (Banerjee 1992). Group I consisted of 23 accessions, which could be further
divided into three internal subgroups. The majority of the northwest selections were
from the natural populations of the Kangra region and hence clustered together in
this group. An accession from Japan, CSIN-303536, and the high-yielding HV-39
from the Darjeeling collection made up one subgroup. Two accessions from the
Kumaon Hills of Uttarakhand, KM-8 and KM-9, also clustered with accessions from
the Darjeeling collection.
The first bifurcation of tea accessions clearly separated a cluster of northeastern
plus southern tea populations, including TRI-series accessions of Sri Lanka, into
group II. Further, group II was composed of two major subgroups (IIa and IIb).
Subgroup IIa was dominated by accessions from northeastern India. This finding is
possibly due either to their derivation from the original seeds of wild Assam tea
plants, collected from the hills of Assam, Nagaland, Mizoram, Manipur, and
neighboring Burma, or to their selection from the highly heterogeneous population
derived from seeds collected from established commercial seed baris (Bezbaruah
and Dutta 1977). The three accessions TS-379, TS-449, and TS-464 were biclonal
seed stocks derived from control crosses of the most popular TV-1 with other high-
quality tea accessions; they therefore clustered together as a minor subgroup. TV-18
and TV-19 were derived from open-pollinated seeds of plants 4 and 14,
respectively, from the common stock 107, and hence grouped together. TV-13,
intermediate between the major subgroups IIa and IIb, was the single accession
collected from the seed nursery of Doomur Dullung Tea Estate. Other TV-series tea
accessions, although derived from the open pollination of common seed stock, were
scattered throughout subgroup IIa, confirming the heterogeneous nature of TV-
series clones reported by Mondal (2002).
All but five of the tea accessions representing major populations in southern India
were clustered into subgroup IIb. The popular TRI-series tea accessions (TRI-2024,
TRI-2025, TRI-2026, and TRI-2043) evolved from a single genetic stock (St 123) of
Tocklai. All but one of the TRI-series accessions clustered in a common internal
subgroup, along with biclonal seed stock BSS-1 and TTL-1. The clustering of
northeastern and southern tea accessions in a common major group confirms their
common ancestry and supports the suggestion that early planting materials of tea
558 Biochem Genet (2010) 48:549–564
123

(China or Assam types) used in southern India and Sri Lanka might have been
derived from a similar gene pool (Singh 1979; Bezbaruah and Dutta 1977).
According to the molecular data, the five tea accessions C-17, NJ-6/24-T, ATK,
BSB, and TTL-2 are the most diverse, being intermediate between the cultivated
and related wild C. japonica. Similar results were reported in earlier AFLP studies
0.35 0.49 0.63 0.76 0.90
KangraAsha KangraJat BS-65 BS-1 BS-26 BS-46 BS-68 BS-14 BS-38 K-15 Teesta-Valley-1 CH-1 Teenali P463 P126 KM8 AV2 KM9 RYDAK1 HV39 CSIN-303536 BS-53 BS-54 TG-270/2/13 TV7HK22/14
HK23/19 LG17 LG26 TV9 T78 CB-38 T-3E/3 S-3A S-3 TV4 Nokrai-89 TV14 TV16 RR-17/144 TS379 TV1 TS449 TS464 TV3 TV12 S-3A TV2 TV5 TV8 TV15 TV6 CR-6017 TV23 TV22 TV19 TV18 TV21 TV26 TV28 TV25 TV29 TV27 TV30 TV24 SA-6 KP-6/25 BJ-2-T TV20 SS-40A TV17 TV10 P-492 TV13 UPASI-9 UPASI11 UPASI10 UPASI13 UPASI12 UPASI16 UPASI21 UPASI-8 UPASI15 UPASI-4 UPASI-5 UPASI-2 UPASI-7 UPASI-6 UPASI17 UPASI26 UPASI-1 UPASI27 UPASI20 UPASI14 UPASI19 SMP TRI2043 UPASI18 UPASI25 UPASI24NLT17/10
UPASI22 B/5/163 UPASI23 TRI2024 TRI2025 TRI2026 BSS-1 TTL1 UPASI-3 TRF1 BSB 1 CP-01 TRF2 AK K18 TES34 C17 NJ6/24-T ATK TTL2
CJ-1 CJ-3 CJ-2
63
97 100
86
97
73
65
80
70 83
64
72
73
63
61
89
69
92
Out group
II
IIb
IIa
I
69
72
72
62
66
67
Fig. 2 Genetic relationships of 123 tea accessions based on seven AFLP primer combinations. The scaleindicates Jaccard’s similarity coefficient. Bootstrap values greater than 60% are indicated at the branches
Biochem Genet (2010) 48:549–564 559
123

(Balasaravanan et al. 2003). They are highly heterogeneous, and as such seem to be
potential sources for the genetic improvement of tea. The occurrence of a few highly
heterogeneous tea accessions might be due to hybridization between new
introductions and existing old accessions, including wild taxa of Camellia species,
which often grow side by side in the germplasm block. In general, the affinity of tea
accessions on a regional basis, as detected in this molecular study, might be due to
the occurrence of free hybridization within the available genetic base in a particular
region.
AFLP data in this study grouped three varietal types among cultivated accessions
according to geographic locations, having a bias toward either the China or the
Assam/Cambod type. In general, it was possible to separate two distinct tea
varieties, China and Assam. A few exceptions were expected, however, since the
existing classification is based solely on a few morphological characteristics that are
subject to substantial environmental influences (Wachira et al. 1995; Paul et al.
1997; Mondal 2002). Cultivation of northwestern tea is dominated by the China
type or China hybrids, clustering together in group I, along with other China
accessions from Darjeeling, Assam, and Japan. Tea cultivation in the northeast and
the south, with a few exceptions, is dominated by the Assam or Cambod types or
their hybrids, and most of those accessions clustered together in group II. Most of
the Cambod tea accessions formed minor subgroups in IIa. Traditionally, Cambod is
considered a subgroup of the Assam type or is sometimes referred to as a subspecies
of Assam (C. assamica ssp. lasiocalyx; Wight 1962); our data broadly support this
view. A few hybrids (China–Assam, China–Cambod, and Assam–China), however,
were intermingled in other groups. It is possible that these hybrids of China and
Assam types had morphological characters that predisposed them to identification as
either a China or an Assam type. A few of these hybrids clustered as intermediate
between cultivated and ornamentals, suggesting the possibility of free hybridization
between cultivated varieties of tea (Visser 1969). Another important observation
769067
1
260
5 14812
6 7
311
1566 59
21
22
13
4
20
72 10
9
121
62
17
2370
5856
73
6535
28
31
30
71
41
2974
27
63
5346
26
32
49
5048
50
45
424443
4041
57
47
51 38
33 5534
6867 37
366569
83
85
84
7686
90
88
828978
1088790
8075114
10093
959796
98
92
99
115
111
79 119
104104
109105
107 112116
118
113106
114120
77100
94
122123
Coo
rdin
ate
2
C. japonica
NW tea populations; broadly China types
NE tea populations; broadly Assam (39.5 %) & Cambod (27 %) types S tea populations; Assam (51%) & Cambod
(22 %) types
25
Coordinate 1
1816
24
NW
NE
S
Fig. 3 Principal coordinate plot of 123 tea accessions based on AFLP data. Northwest accessions areindicated by diamonds, northeast by squares, and south by triangles. Accession numbers as in Table 1
560 Biochem Genet (2010) 48:549–564
123

made in this study was the inclusion of UPASI-9 in the Assam group, consistent
with the conclusion made by Wachira et al. (1995) and Balasaravanan et al. (2003)
but inconsistent with the report of Mondal (2002), who designated UPASI-9 as a
China type. This study puts the controversy to rest by concluding that UPASI-9 is
more or less an Assam type and not a China type. Clustering of CJ-1, CJ-2, and CJ-3
of C. japonica as outgroups was expected and was validated by the molecular data.
Principal coordinate analysis was based on the similarity matrices generated with
AFLP markers; eigenvalues were extracted for two components and plotted against
each other (Fig. 3). The first two components accounted for more than 50% of the
variation. Major groupings were based on accessions from the northwest, northeast,
and south populations in direct relationships with China, Assam, or Cambod types,
somewhat similar to the UPGMA-based cluster analysis. Related C. japonicaaccessions clearly separated out from the cultivated tea accessions.
Extent of Genetic Variation
Overall genetic similarity (GS) among the 123 tea accessions ranged from 0.32 to
0.88, averaging 0.51. A slightly higher average (0.52) was recorded among the
released accessions, which ranged from 0.42 (TTL-2 and TV-20) to 0.88 (SS-40A
and TV-20). No significant difference was recorded in the average GS among the
tea populations cultivated in various geographic regions (0.60 in the northwest and
0.59 in both the northeast and south). The clustering pattern, however, suggested
that existing tea populations of northeastern and southern India are derived from a
single regional genetic background (Wood and Barua 1958; Cannel et al. 1977). The
high level of heterozygosity recorded in this study possibly provides the required
genetic plasticity essential for the survival of the crop in diverse climatic conditions
(Singh et al. 2006). Among the populations, the most diverse were BS-54 and BS-53
in the northwest (GS 0.48), TV-13 in the northeast (0.52), and TTL-2 in the south
(0.43). Somewhat similar genetic diversity patterns were also recorded in earlier
studies, irrespective of molecular marker techniques (Wachira et al. 1995, 2001;
Paul et al. 1997).
This study revealed considerable diversity among the tea accessions having
quality and tolerance of or resistance to various biotic (blister blight) and abiotic
stresses (drought, waterlogging, frost). Among the tea accessions associated with
trait attributes, SMP, TRI-2043, UPASI-19, SA-6, and BS-26 (average GS 0.56) are
resistant to blister blight; UPASI-26 and UPASI-27 (0.62) are resistant to frost;
UPASI-1, UPASI-10, UPASI-26, and CH-1 (0.53) are tolerant to wind; TV-9 is
tolerant to waterlogging; and 26 accessions (0.57) are tolerant to drought. Overall,
44% genetic diversity was recorded in these accessions. Since these accessions are
Table 3 Analysis of molecular variance of 123 tea accessions
Source of genetic variation df Sum of squares Variance component P value % variation
Among populations 2 527.515 5.824 \0.010 15
Within populations 120 3926.687 32.452 \0.010 85
Biochem Genet (2010) 48:549–564 561
123

highly heterogeneous and were clustered in different groups and subgroups, they are
potential parental groups for recombination of these traits in quality tea accessions
through controlled crossing in future tea improvement programs.
Partitioning of genetic diversity indicates the existence of large-scale variation
within populations. These findings were also confirmed by AMOVA, which
detected a high level of genetic variation (85%) within populations, as well as
limited genetic variation (15%) among populations (Table 3). A further explanation
for these genetic diversity results could be that tea populations cultivated at the
national level are derived from a similar gene pool and share a common genetic
background. Lack of genetic differentiation among the populations has also been
reported in earlier studies of tea (Wachira et al. 1995, 2001; Paul et al. 1997; Yao
et al. 2008; Ohsako et al. 2008). Exchange of genetic material in cultivated crop
species in most of the cases is dictated more by human intervention than by natural
factors. A similar genetic diversity trend was recorded in earlier studies, irrespective
of the various molecular markers (Wachira et al. 2001; Paul et al. 1997).
In conclusion, this study demonstrates for the first time the extent of genetic
diversity in a large collection of commercially important Indian tea germplasm
representing major populations at the national level. The findings of this study can
be a good source of molecular information for future tea breeders because it
eliminates the limitations and shortcomings of selection methodology based on
morphological, biochemical, and physiological data, which are easily influenced by
environmental conditions and the age of the plant. Detailed information about the
existing genetic diversity among standard, quality, and high-yielding tea accessions,
along with trait attributes, would be useful in proper identification, management,
utilization, and strategizing in future tea breeding programs at the regional and
national levels. A low level of genetic variation among populations indicates an
urgent need for diversification and exchange of tea genetic resources at the
international level.
Acknowledgments A financial grant received from the Department of Biotechnology and the
Council of Scientific and Industrial Research, Government of India, is gratefully acknowledged. We
thank Dr. S. Rajkumar for providing help in bootstrap analysis and AMOVA. This is IHBT Publication 0649.
References
Anderson JA, Churchill GA, Autrique JE, Tanksley SD, Sorrells ME (1993) Optimizing parental selection
for genetic linkage maps. Genome 36:181–186
Balasaravanan T, Pius PK, Rajkumar R, Muraleedharan N, Shasany AK (2003) Genetic diversity among
south Indian tea germplasm (Camellia sinensis, C. assamica and C. assamica spp. lasiocalyx) using
AFLP markers. Plant Sci 165:365–372
Banerjee B (1992) Botanical classification of tea. In: Wilson KC, Clifford MN (eds) Tea: cultivation to
consumption. Chapman and Hall, London, pp 25–52
Barbora BC, Barua DN, Bera B (1996) Tea breeding at Tocklai. Two & Bud 43:3
Barua PK (1963) Classification of tea plant. Two & Bud 10:3–11
Bezbaruah HP (1971) Cytological investigation in the family Theaceae-I: chromosome numbers in some
Camellia species and allied genera. Caryologia 24:421–426
Bezbaruah HP, Dutta AC (1977) Tea germplasm collection of Tocklai Experimental Station. Two & Bud
24:22–30
562 Biochem Genet (2010) 48:549–564
123

Cannel MGR, Njuguna CK, Ford ED (1977) Variation in yield among competing individuals within
mixed genotype stands of tea: a selection problem. J Appl Ecol 14:969–985
Chang HT (1981) A taxonomy of the genus Camellia. Acta Sci Nat Univ Sunyatseni Monogr Ser 1:1–180
Chang HT (1998) Flora of Reipublicae Popularis Sinicae, Delectis Florae Republicae Popularis Sinicae,
Agendae Academiae Sinicae Edita. Tomus 49:101–113
Chen L, Yamaguchi S (2005) RAPD markers for discriminating tea germplasms on the inter-specific level
in China. Plant Breed 124:404–409
Chen L, Gao QK, Chen DM, Xu CJ (2005) The use of RAPD markers for detecting genetic diversity,
relationship and molecular identification of Chinese elite tea genetic resources [Camellia sinensis(L.) O. Kuntze] preserved in tea germplasm repository. Biodivers Conserv 14:1433–1444
Das SC (2001) Tea. In: Parthasarathy VA, Bose TK, Deka PC, Das P, Mitra SK, Mohandas S (eds)
Biotechnology of horticultural crops, vol 1. Naya Prokash, India, pp 526–546
Doyle JJ, Doyle JL (1990) A rapid total DNA preparation procedure for fresh plant tissue. Focus 12:13–
15
FAO (2008) Tea production data. http://faostat.fao.org
Hill M, Witsenboer H, Zabeau M, Vos P, Kesseli R, Michelmore R (1996) PCR fingerprinting using
AFLPs as a tool for studying genetic relationships in Latuca spp. Theor Appl Genet 93:1202–1210
Karthigeyan S, Rajkumar S, Sharma RK, Gulati A, Sud RK, Ahuja PS (2008) High level of genetic
diversity among the selected accessions of tea (Camellia sinensis) from abandoned tea gardens in
western Himalaya. Biochem Genet 46:810–819
Kaundun SS, Matsumoto S (2002) Heterologous nuclear and chloroplast microsatellite amplification and
variation in tea, Camellia sinensis. Genome 45:1041–1048
Kaundun SS, Zhyvoloup A, Park YG (2000) Evaluation of the genetic diversity among elite tea (Camelliasinensis var. sinensis) accessions using RAPD markers. Euphytica 115:7–16
Matsumoto S, Kiriiwa Y, Yamaguchi S (2004) The Korean tea plant (Camellia sinensis): RFLP analysis
of genetic diversity and relationship to Japanese tea. Breed Sci 54:231–237
Ming T (2000) Monograph of the genus Camellia. Kunming Institute of Botany, Chinese Academy of
Sciences, Yunnan Science and Technology Press, Kunming
Mondal TK (2002) Assessment of genetic diversity of tea (Camellia sinensis (L.) O. Kuntze) by inter-
simple sequence repeat polymerase chain reaction. Euphytica 128:307–315
Ohsako T, Ohgushi T, Motosugi H, Oka K (2008) Microsatellite variability within and among local
landrace populations of tea, Camellia sinensis (L.) O. Kuntze, in Kyoto, Japan. Genet Resour Crop
Evol 55:1047–1053
Paul S, Wachira FN, Powell W, Waugh R (1997) Diversity and genetic differentiation among populations
of Indian and Kenyan tea (Camellia sinensis (L.) Kuntze, O.) revealed by AFLP markers. Theor
Appl Genet 94:255–263
Peakall R, Smouse PE (2006) Genalex 6: genetic analysis in Excel; population genetic software for
teaching and research. Mol Ecol Notes 6:288–295
Rohlf FJ (1998) NTsys-PC 2.0e. Exeter Software. Setauket, New York
Saravanan M, Maria John KM, Rajkumar R, Pius RK, Sasikumar S (2005) Genetic diversity of UPASI tea
clones (Camellia sinensis (L.) O. Kuntze) on the basis of total catechins and their fractions.
Phytochemistry 66:561–565
Sealy J (1958) A revision of the genus Camellia. Royal Horticultural Society, London
Sharma VS, Venkataramani KS (1974) The tea complex. I. Taxonomy of tea clones. Proc Indian Acad Sci
53:178–187
Sharma RK, Bhardwaj P, Negi R, Mohapatra T, Ahuja PS (2009) Identification, characterization and
utilization of unigene derived microsatellite markers in tea (Camellia sinensis, L.). BMC Plant Biol
9:53
Singh ID (1979) Indian tea germplasm and its contribution to the world’s tea industry. Two & Bud 26:23–
26
Singh ID (1999) Plant improvement. In: Jain NK (ed) Global advances in tea. Aravali Book International
(P) Ltd, India, pp 427–448
Singh D, Ahuja PS (2006) 5S rDNA gene diversity in tea (Camellia sinensis (L.) O. Kuntze) and its use
for variety identification. Genome 49:91–96
Singh AK, Sharma RK, Singh NK, Bansal KC, Koundal KR, Mohapatra T (2006) Genetic diversity in ber
(Ziziphus spp.) revealed by AFLP markers. J Hortic Sci Biotechnol 81:205–210
Swofford DL (1993) Phylogenetic analysis using parsimony (PAUP*) Version 3.1.1. Illinois Natural
History Survey, Champaign
Biochem Genet (2010) 48:549–564 563
123

Visser T (1969) Tea Camellia sinensis (L.) O, Kuntze. In: Veenman H, Zanon N (eds) Perennial crops
breeding in the tropics. Wageningen, Netherlands, pp 459–493
Vos P, Hogers R, Bleeker M, Reijansm M, Van de Lee T, Hornes M, Freijters A, Pot J, Peleman J, Kuiper
M, Zabeau M (1995) AFLP: a new technique for DNA fingerprinting. Nucleic Acids Res 23:4407–
4414
Wachira FN, Waugh R, Hackett CA, Powell W (1995) Detection of genetic diversity in tea (Camelliasinensis) using RAPD markers. Genome 38:201–210
Wachira FN, Tanaka J, Takeda Y (2001) Genetic variation and differentiation in tea (Camellia sinensis)
germplasm revealed by RAPD and AFLP variation. J Hortic Sci Biotechnol 76:557–563
Wight W (1962) Tea classification revised. Curr Sci 31:298–299
Wood DJ, Barua PK (1958) Species hybrids of tea. Nature 181:1674–1675
Yao MZ, Chen L, Liang YR (2008) Genetic diversity among tea cultivars from China, Japan and Kenya
revealed by ISSR markers and its implication for parental selection in tea breeding programmes.
Plant Breed 127:166–172
564 Biochem Genet (2010) 48:549–564
123
Copyright © 2022 FDOKUMEN