Variability for Productivity and Nutritional Traits in Germplasm ...
12
CROP SCIENCE, VOL. 59, MAY–JUNE 2019 WWW.CROPS.ORG 1095 RESEARCH F ood and nutrition insecurity are the major threats to the world’s population, particularly in Africa and Asia. Global food systems have become more dependent on a few major “staple” crops and three cereals (rice [ Oryza sativa L.], wheat [Triticum aestivum L.], and maize [ Zea mays L.]), which possess a lower concentration of mineral elements and provide >60% of plant-based human energy intake; this is greater in several coun- tries in Asia (Cakmak and Kutman, 2018). The global population is projected to reach 9.8 billion by 2050, posing a great challenge in terms of a larger number of mouths to feed. It is important to grow different crops that contribute to dietary diversity for sustain- able agriculture and healthy diets to ensure food and nutritional security (Rajendran et al., 2017; Vetriventhan and Upadhyaya, 2018). Current agricultural systems and food habits have encour- aged research and development on major crops, neglecting minor and regionally important crops such as small millets (finger millet [Eleusine coracana (L.) Gaertn.], foxtail millet [ Setaria italica (L.) P. Beauv.], proso millet [ Panicum miliaceum L.], barnyard millet [Echi- nochloa crus-galli (L.) P. Beauv. and Echinochloa colona (L.) Link], kodo millet [ Paspalum scrobiculatum L.], little millet [ Panicum suma- trense Roth ex Roem. & Schult.], etc.). Small millets are naturally biofortified crops and are nutritionally superior to the major food staples, as their grains are rich in protein, minerals, vitamins, and essential amino acids, and they play an important role in food Variability for Productivity and Nutritional Traits in Germplasm of Kodo Millet, an Underutilized Nutrient-Rich Climate Smart Crop Mani Vetriventhan and Hari D. Upadhyaya* ABSTRACT Kodo millet (Paspalum scrobiculatum L.) is an important drought-tolerant crop cultivated on marginal soils under diverse environmental conditions. Its grains are nutritionally superior to those of major cereals. Knowledge of the variability in agronomic and nutritional traits is important to identify germplasm for use in crop improvement and by farmers. Two hundred kodo millet accessions were evaluated in 2 yr during the rainy season to assess variability for morphoagronomic and grain nutritional traits and to identify high grain-yielding and nutrient- rich accessions. Large variability was observed for important traits including days to maturity, grain yield, and Fe, Zn, Ca, and protein content with moderate to high heritability. Three kodo millet races did not differ significantly for grain yield or Fe, Zn, Ca, and protein content. For Zn, Fe, protein, and Ca, 78.5, 75.0, 67.5, and 54.0% of accessions, respectively, were consis- tent between the years, indicating the relative sensitivity of these nutrients to the environ- ment and genotype ´ environment interaction. Considering data of both the years separately, 50 promising trait-specific accessions were identified, including those for early maturity (8 accessions), greater 100-seed weight (10), high grain yield (15), Fe (8), Zn (14), Ca (6) and protein content (7), and 10 with a combination of agronomic and nutritional traits. The extensive multilocation evaluation of these high-yielding, nutrient-rich accessions would be useful to identify promising genotypes for direct cultivar release or for use in crop improvement to contribute to the food and nutritional security of resource-poor farmers in a changing climate scenario. M. Vetriventhan and H.D. Upadhyaya, Genebank, International Crops Research Institute for the Semi-Arid Tropics (ICRISAT), Patancheru, 502 324 Telangana, India; H.D. Upadhyaya, Center of Excellence for Advanced Materials Research, King Abdulaziz Univ., Jeddah 21589, Saudi Arabia. Received 20 July 2018. Accepted 20 Feb. 2019. *Corresponding author ([email protected], harideo.upadhyaya@ gmail.com). Assigned to Associate Editor Adam Heuberger. Abbreviations: DAS, days after sowing. Published in Crop Sci. 59:1095–1106 (2019). doi: 10.2135/cropsci2018.07.0450 © 2019 The Author(s). This is an open access article distributed under the CC BY-NC-ND license (http://creativecommons.org/licenses/by-nc-nd/4.0/). Published May 16, 2019
-
Upload
khangminh22 -
Category
Documents
-
view
1 -
download
0
Transcript of Variability for Productivity and Nutritional Traits in Germplasm ...

crop science, vol. 59, may–june 2019 www.crops.org 1095
RESEARCH
Food and nutrition insecurity are the major threats to the world’s population, particularly in Africa and Asia. Global
food systems have become more dependent on a few major “staple” crops and three cereals (rice [Oryza sativa L.], wheat [Triticum aestivum L.], and maize [Zea mays L.]), which possess a lower concentration of mineral elements and provide >60% of plant-based human energy intake; this is greater in several coun-tries in Asia (Cakmak and Kutman, 2018). The global population is projected to reach 9.8 billion by 2050, posing a great challenge in terms of a larger number of mouths to feed. It is important to grow different crops that contribute to dietary diversity for sustain-able agriculture and healthy diets to ensure food and nutritional security (Rajendran et al., 2017; Vetriventhan and Upadhyaya, 2018). Current agricultural systems and food habits have encour-aged research and development on major crops, neglecting minor and regionally important crops such as small millets (finger millet [Eleusine coracana (L.) Gaertn.], foxtail millet [Setaria italica (L.) P. Beauv.], proso millet [Panicum miliaceum L.], barnyard millet [Echi-nochloa crus-galli (L.) P. Beauv. and Echinochloa colona (L.) Link], kodo millet [Paspalum scrobiculatum L.], little millet [Panicum suma-trense Roth ex Roem. & Schult.], etc.). Small millets are naturally biofortified crops and are nutritionally superior to the major food staples, as their grains are rich in protein, minerals, vitamins, and essential amino acids, and they play an important role in food
Variability for Productivity and Nutritional Traits in Germplasm of Kodo Millet, an Underutilized
Nutrient-Rich Climate Smart Crop
Mani Vetriventhan and Hari D. Upadhyaya*
ABSTRACTKodo millet (Paspalum scrobiculatum L.) is an important drought-tolerant crop cultivated on marginal soils under diverse environmental conditions. Its grains are nutritionally superior to those of major cereals. Knowledge of the variability in agronomic and nutritional traits is important to identify germplasm for use in crop improvement and by farmers. Two hundred kodo millet accessions were evaluated in 2 yr during the rainy season to assess variability for morphoagronomic and grain nutritional traits and to identify high grain-yielding and nutrient-rich accessions. Large variability was observed for important traits including days to maturity, grain yield, and Fe, Zn, Ca, and protein content with moderate to high heritability. Three kodo millet races did not differ significantly for grain yield or Fe, Zn, Ca, and protein content. For Zn, Fe, protein, and Ca, 78.5, 75.0, 67.5, and 54.0% of accessions, respectively, were consis-tent between the years, indicating the relative sensitivity of these nutrients to the environ-ment and genotype ´ environment interaction. Considering data of both the years separately, 50 promising trait-specific accessions were identified, including those for early maturity (8 accessions), greater 100-seed weight (10), high grain yield (15), Fe (8), Zn (14), Ca (6) and protein content (7), and 10 with a combination of agronomic and nutritional traits. The extensive multilocation evaluation of these high-yielding, nutrient-rich accessions would be useful to identify promising genotypes for direct cultivar release or for use in crop improvement to contribute to the food and nutritional security of resource-poor farmers in a changing climate scenario.
M. Vetriventhan and H.D. Upadhyaya, Genebank, International Crops Research Institute for the Semi-Arid Tropics (ICRISAT), Patancheru, 502 324 Telangana, India; H.D. Upadhyaya, Center of Excellence for Advanced Materials Research, King Abdulaziz Univ., Jeddah 21589, Saudi Arabia. Received 20 July 2018. Accepted 20 Feb. 2019. *Corresponding author ([email protected], [email protected]). Assigned to Associate Editor Adam Heuberger.
Abbreviations: DAS, days after sowing.
Published in Crop Sci. 59:1095–1106 (2019). doi: 10.2135/cropsci2018.07.0450 © 2019 The Author(s). This is an open access article distributed under the CC BY-NC-ND license (http://creativecommons.org/licenses/by-nc-nd/4.0/).
Published May 16, 2019
1096 www.crops.org crop science, vol. 59, may–june 2019
and nutrition security in areas where they are grown (Saleh et al., 2013). Small millets are hardy crops with diverse adaptation and are less prone to being affected by insect pests and diseases. Diversifying crops and diets by including climate-resilient and nutrient-rich small millets could potentially help in overcoming malnutrition and enhancing the livelihoods of smallholder farmers.
Kodo millet is commonly known as rice grass, African bastard millet, creeping paspalum, ditch millet, Indian paspalum, kodo grass, varagu, etc. in different parts of the world. It was domesticated in India some 3000 yr ago, where it is grown as a food and feed crop; in Africa, it is harvested as a wild cereal, while its distribution is global (de Wet et al., 1983). Kodo millet is grown on marginal lands and produces high grain yields even under limited water. Currently, it is being cultivated only in India on a limited acreage (0.20 million ha) (Ganapathy, 2017; Bhat et al., 2018); however, it has great potential and could be introduced to other semiarid regions in the world. Wild forms of kodo millet occur in Africa. However, the culti-vated forms have an important future in Africa as well and deserve greater research and recognition (NRC, 1996). Kodo millet can be cultivated as a pure crop or inter-cropped with pulses, particularly pigeonpea [Cajanus cajan (L.) Millsp.], soybean [Glycine max (L.) Merr.], and mung bean [Vigna radiata (L.) R. Wilczek] (Baghel et al., 1989; www.aicrpsm.res.in). Nutritionally, the fiber content in kodo millet is much higher than that in other cereals such as rice, wheat, maize, sorghum [Sorghum bicolor (L.) Moench], pearl millet [Pennisetum glaucum (L.) R. Br.], and finger millet (Saleh et al., 2013). A variety of food and snacks are made out of kodo millet in India (Desh-pande et al., 2015). In Africa, it is cooked as rice. It is very easy to digest and contains a high amount of lecithin, which is excellent for strengthening the nervous system. Its grains are rich in B vitamins, especially niacin, B6, and folic acid, as well as minerals such as Ca, Fe, K, Mg, and Zn (Ganapathy, 2017). Supplementation with kodo millet alleviates high-fat-diet-induced changes and can be incorporated as a functional ingredient to manage obesity (Sarma et al., 2017). It is also a good choice of fodder for cattle, goats, pigs, sheep, and poultry.
There has been a drastic decline in the area under cultivation of small millets in India (where kodo millet is largely cultivated) from 5.29 to 0.69 million ha between 1951 and 1955 and 2011 to 2015, with the exception of finger millet (Indian Council of Agricultural Research-All India Coordinated Research Project on Small Millets Annual Report 2017–2018, available at www.aicrpsm.res.in). This was mainly due to very limited crop improve-ment efforts, and production and processing technologies that resulted in no yield improvements in kodo millet and other small millets, except finger millet. Globally, >8000 germplasm accessions of kodo millet have been conserved
in genebanks, and a majority are housed in India (Upad-hyaya et al., 2015). The genebank at ICRISAT, India, conserves 665 landrace accessions, representing all three races of kodo millet: regularis (457 accessions), irregularis (82 accessions), and variabilis (117 accessions) (http://genebank.icrisat.org/). There is no comprehensive study on vari-ability in kodo millet germplasm accessions for grain yield and other important agronomic traits. Neither is such information available for grain nutritional traits that could provide important insights to kodo millet researchers and prove useful in germplasm selection and multilocation testing, and even lead to their direct release as cultivars. Therefore, this study selected a representative set of 200 kodo millet accessions from the 665 accessions conserved at the ICRISAT genebank using the cluster information that was used to constitute the kodo millet core collec-tion (Upadhyaya et al., 2014), representing ?30% of entire collection, and 26, 37, and 48% of the races regularis, variabilis, and irregularis, respectively. This study aimed to assess kodo millet germplasm for morphoagronomic and grain nutritional traits, to assess the association between agronomic and grain nutritional traits, and to identify high-yielding and nutrient-rich accessions for use in research to identify and/or develop suitable cultivars.
MATERIALS AND METHODSExperimental DetailsTwo hundred kodo millet germplasm accessions, including the core collection (75 accessions; Upadhyaya et al., 2014) originating from India and Sri Lanka, were included in this study. The accessions were evaluated for morphoagronomic traits during the rainy season in 2015 and 2016 at ICRISAT, Patancheru, Telangana, India (17°51¢ N, 78°27¢ E; 545 m asl). The experiments were planted on red soils (Alfisols) in the third week of July in both years, in an a design with two replica-tions, and sowing was done on ridges that were 60 cm apart. Each accession was planted in a single row of 4-m length, with an interplant spacing of 10 cm and at uniform depth. Diam-monium phosphate was applied at 100 kg ha−1 as a basal dose to supply N and P. In addition, 100 kg ha−1 of urea was applied as topdressing. The precision fields at ICRISAT have uniform fertility and a gentle slope of 0.5%. Crop-specific agronomic practices (including irrigation, weeding, etc.) were followed to raise a healthy crop.
Data Collection of Morphoagronomic TraitsObservations on 22 morphoagronomic traits were recorded following kodo millet descriptors (IBPGR, 1983). The five morphological traits included growth habit (erect or decum-bent), culm branching (high, medium, or low), leaf erectness (erect, arched, or bent), internodal exposure (covered, partly exposed, or exposed), and flag leaf at the second axis node (absent, well developed, or rudimentary). Of the 17 agronomic traits, five (namely, days to 50% flowering, days to maturity, 100-seed weight, straw yield, and grain yield) were recorded on a plot basis, whereas basal tiller number, plant height, flag

crop science, vol. 59, may–june 2019 www.crops.org 1097
accessions were clustered using Gower’s phenotypic distance matrix following hierarchical clustering as in Ward’s method (Ward, 1963) using R package cluster (Maechler et al., 2018).
RESULTSANOVA and HeritabilityThe ANOVA indicated that genotype differed signifi-cantly for all the agronomic and grain nutritional traits in the individual years, whereas races did not differ signifi-cantly for flag leaf blade length and grain yield (g plant−1) in both years, or for basal tiller number, flag leaf sheath length, Fe, and Ca in 2015 or number of racemes, Zn, and protein content in 2016 (Table 1). Grain yield (kg ha−1) and straw yield (kg ha−1) were estimated only in 2016, and the genotype differed significantly for both the traits. Homo-geneity of variance test (Bartlett, 1937) revealed that the error variances between 2 yr were heterogeneous for days to 50% flowering, maturity, flag leaf blade length, flag leaf blade width, flag leaf sheath length, inflorescence length, and grain nutrient traits Fe, Ca and protein content, and homogenous for other agronomic traits and Zn content. Therefore, further analyses were done on the basis of individual years. All the agronomic traits showed high estimates of h2
b (>0.60), except number of basal tillers, flag leaf blade length, flag leaf sheath length, sterile primary axis length, and harvest index in 2015, and basal tiller number, flag leaf blade length, flag leaf blade width, sterile primary axis length, number of racemes, and grain yield in 2016 (Table 1). All four grain nutrient traits showed high heritability in both the years, except Zn and protein, which showed moderate heritability in 2016.
Variability for Morphoagronomic and Grain Nutrient TraitsMorphological TraitsThe frequency of different phenotypic classes of five qual-itative (morphological) traits was determined for the full set of accessions (n = 200) and for each race (Fig. 1). In the full set, accessions with erect growth habit (90%), medium culm branching (51%), erect leaves (81%), partly exposed internode (55%), and all three classes of flag leaf at second axis node (absent in 30% of accessions, well developed in 35% of accessions, and rudimentary in 35% of acces-sions) were predominant classes. Similar patterns were observed in each race. Flag leaf at secondary axis node had the highest Shannon–Weaver diversity index (H¢) in the full set and in each race, whereas growth habit had the least (Table 2). Across traits, irregularis had the highest H¢ (0.360), followed by regularis (0.338), and variabilis (0.330).
Agronomic TraitsKodo millet accessions showed a wide range of variation for all the agronomic traits in both the years. Significant differ-ences were observed between years for all the agronomic
leaf blade length, flag leaf blade width, flag leaf sheath length, inflorescence length, sterile primary axis length, raceme number, thumb length, longest raceme length, grain yield per plant, and harvest index were recorded on five randomly selected competitive plants in each plot, and average values of each accession and trait were used for analysis. Harvest index was calculated as the ratio of grain yield per plant to total biological yield (dry weight) per plant. Straw and grain yields per plot were converted into yields (kg ha−1).
Estimation of Grain Nutrient ContentGrains of 200 kodo millet accessions in each year were harvested separately at maturity. Care was taken to avoid contamination with dust and metal particles during their cleaning. Further, to divest them of dust and metal particles, grains were washed for a few seconds using distilled water and dried in hot air at 40°C for 2 h. A randomly well-cleaned grain sample (unhusked) from each accession was used to estimate grain protein, Ca, Fe, and Zn content at the Charles Renard Analytical Laboratory, ICRISAT. Grain Ca, Fe, and Zn content were assessed by HNO3–H2O2 digestion method, and the digests were analyzed using induc-tively coupled plasma optical emission spectrometry (ICP–OES) (Wheal et al., 2011). Protein content in grain samples was deter-mined by H2SO4–Se digestion method (total N was estimated in a Skalar autoanalyzer, and protein was calculated as N% ´ 6.25 [a conversion factor]; Sahrawat et al., 2002).
Statistical Analysis and Identification of Trait-Specific SourcesAn ANOVA was performed for 17 agronomic and four grain nutritional traits for individual years following an a design using GenStat 17th edition (http://www.genstat.co.uk). The homogeneity of variance test (Bartlett, 1937) revealed that the error variances between 2 yr were heterogeneous for most traits, and therefore, individual year data were considered to assess variability and identify trait-specific sources. The mean performance of the races for each agronomic and grain nutrient trait was compared using the Newman–Keuls test (Newman, 1939; Keuls, 1952), and the homogeneity of variances among races was tested using Levene’s procedure (Levene, 1960) using the R packages agricolae (de Mendiburu, 2017) and car (Fox and Weisberg, 2011), respectively. Broad-sense heritability (h2
b) was estimated for individual years for each trait and catego-rized as low (<0.30), moderate (0.30–0.60) or high (>0.60). Correlation coefficients were estimated among the 15 agro-nomic traits and four grain nutrient traits using GenStat 17th edition. The Shannon–Weaver diversity index (H¢) (Shannon and Weaver, 1949) was estimated for agronomic and nutritional traits using mean data of each accession, whereas phenotypic classes of each qualitative trait were numerically coded for H¢ estimation, using GenStat 17th Edition. A low H¢ indi-cates extremely unbalanced frequency classes for an individual trait and a lack of genetic diversity. Based on the performance over 2 yr, accessions with high grain yield, greater 100-seed weight, early maturity, and high grain nutrient content were identified. Gower’s phenotypic distance matrix (Gower, 1971) was constructed using all the traits in both the years, and the most diverse pairs of accessions were identified. Trait-specific

1098 www.crops.org crop science, vol. 59, may–june 2019
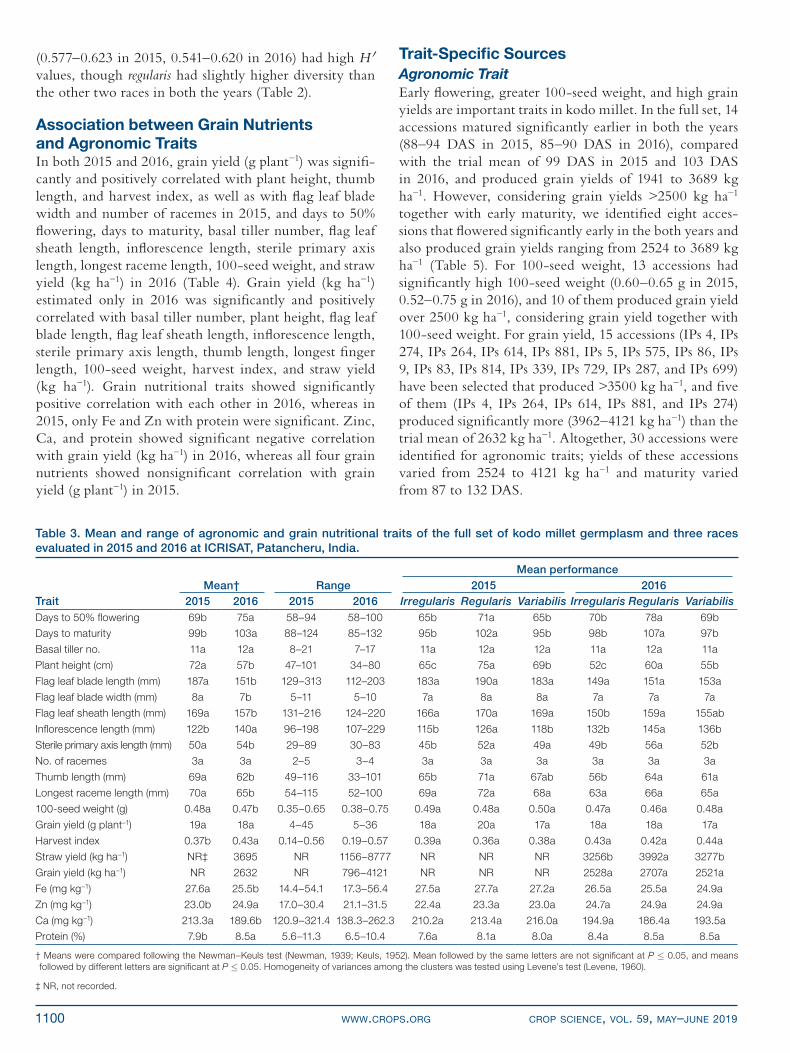
traits except basal tiller number, number of racemes, and grain yield (g plant−1) (Table 3). Overall, the accessions took 6 d more to 50% flowering in 2016 than in 2015, and this was also reflected in the 4-d delayed maturity in 2016 (103 d after sowing [DAS]) compared with 2015 (99 DAS). The mean grain yield (g plant−1) was similar in both years (19 g in 2015 and 18 g in 2016). Among the races, regularis
showed wide range of variation for most of the traits, including days to 50% flowering (60–94 DAS in 2015, 63–100 DAS in 2016), days to maturity (90–124 DAS in 2015, 89–132 DAS in 2016), grain yield (961–4121 kg ha−1 in 2016), and 100-seed weight (0.35–0.65 g in 2015, 0.38–0.75 g in 2016; data not shown). Races differed significantly for days to 50% flowering, days to maturity, plant height,
Table 1. Estimates of race, genotype, error and total mean squares (MS), and broad-sense heritability (h2b) for agronomic traits
and grain nutritional traits of kodo millet germplasm evaluated in 2015 and 2016 at ICRISAT, Patancheru, India.
2015 2016
TraitRace MS
Genotype MS
Error MS
Total MS h2
b
Race MS
Genotype MS
Error MS
Total MS h2
b
Days to 50% flowering 1,837.6** 98.6** 6.4 61.7 0.94 3,503.9** 161.8** 23.7 109.8 0.85Days to maturity 1,860.0** 100.5** 6.5 62.9 0.94 5,005.6** 220.9** 40.1 154.5 0.82Basal tiller no. 7.1ns 4.1** 2.8 3.7 0.32 81.1** 5.1** 2.2 4.4 0.57Plant height (cm) 3,241.1** 179.3** 29.2 120.5 0.84 2,082.4** 160.9** 53.6 116.3 0.67Flag leaf blade length (mm) 1,314.3ns† 1,545.5** 650.1 1,269.8 0.58 266.8ns 552.8* 415.2 494.0 0.25Flag leaf blade width (mm) 3.3* 2.1** 0.8 1.8 0.62 3.3** 1.2** 0.8 1.1 0.33Flag leaf sheath length (mm) 555.1ns 388.8** 200.3 303.2 0.48 2,287.0** 520.9** 194.9 373.4 0.63Inflorescence length (mm) 4,848.5** 423.8** 108.1 313.7 0.74 5,703.5** 768.4** 196.1 512.4 0.74Sterile primary axis length (mm) 2,067.6** 153.0** 69.3 136.8 0.55 1,572.6** 155.7** 81.4 138.5 0.48No. of racemes 0.3* 0.3** 0.1 0.2 0.70 0.07ns 0.2** 0.1 0.2 0.40Thumb length (mm) 1,104.1** 215.6** 37.5 134.7 0.83 1,972.3** 215.8** 42.3 137.6 0.80Longest raceme length (mm) 572.7** 232.3** 29.8 135.7 0.87 419.5** 184.2** 24.6 105.5 0.87100-seed weight (g) 0.02** 0.01** 0.002 0.005 0.80 0.04** 0.01** 0.001 0.004 0.90Grain yield (g plant−1) 85.3ns 84.0** 28.9 63.4 0.66 32.3ns 28.2** 17.8 24.1 0.37Harvest index 0.03* 0.01** 0.01 0.01 0.50 0.02** 0.01** 0.004 0.01 0.60Straw yield (kg ha−1) NR‡ NR NR NR NR 25,227,912** 3,643,228** 1,445,850 2,651,470 0.60Grain yield (kg ha−1) NR NR NR NR NR 1,500,972* 843,362** 416,994 644,590 0.51Fe (mg kg−1) 16.4ns 77.4** 17.0 50.6 0.78 53.2* 51.4** 12.9 34.3 0.75Zn (mg kg−1) 28.7** 9.5** 2.6 6.7 0.73 1.1ns 7.9** 4.5 6.5 0.42Ca (mg kg−1) 633.5ns 1,827.8** 351.5 1,101.2 0.81 2,947.9** 970.6** 198.4 595.5 0.80Protein (%) 5.7** 2.7** 0.6 1.9 0.78 0.01ns 0.9** 0.5 1.0 0.47
* Significant at the 0.05 probability level.
** Significant at the 0.01 probability level.
† ns, nonsignificant.
‡ NR, data not recorded.
Fig. 1. Occurrences (instances) of phenotypic classes of five qualitative traits in the entire set and in three races of kodo millet germplasm.

crop science, vol. 59, may–june 2019 www.crops.org 1099
Grain Nutrient ContentThe 200 kodo millet accessions had a mean Fe of 27.6 mg kg−1 in 2015 (range 14.4–54.1 mg kg−1) and 25.5 mg kg−1 in 2016 (range 17.3–56.4 mg kg−1); Zn of 23.0 mg kg−1 in 2015 (range 17.0–30.4 mg kg−1) and 24.9 mg kg−1 in 2016 (range 21.1–31.5 mg kg−1); Ca of 213.3 mg kg−1 in 2015 (range 120.9–321.4 mg kg−1) and 189.6 mg kg−1 in 2016 (range 138.3–262.3 mg kg−1); and protein of 7.9% in 2015 (range 5.6–11.3%) and 8.5% in 2016 (range 6.5–10.4%). Significant difference was observed between 2 yr for Fe, Zn, Ca and protein content, whereas races had similar mean Fe (27.2–27.7 mg ka−1 in 2015, 24.9–26.5 mg ka−1 in 2016), Zn (22.4–23.3 mg ka−1 2015, 24.7–24.9 mg ka−1 in 2016), Ca (210.2–216.0 mg ka−1 in 2015, 186.4–194.9 mg ka−1 in 2016), and protein (7.6–8.1% in 2015, 8.4–8.5% in 2016) and did not differ significantly with each other (Table 3). The H¢ index indicated that the three races (0.538–0.599 in 2015, 0.578–0.596 in 2016), the full set (0.601 in 2015, 0.598 in 2016), and all four grain nutrients
flag leaf sheath length, inflorescence length, sterile primary axis length, thumb length, and straw yield (Table 3). The race regularis was late maturing (102 DAS in 2015, 107 DAS in 2016), produced tall plants (75 cm in 2015, 60 cm in 2016) with long inflorescence (126 mm in 2015, 145 mm in 2016), long sterile primary axis (52 mm in 2015, 56 mm in 2016), and long thumb length (71 mm in 2015, 64 mm in 2016) and produced higher straw yield (3992 kg ha−1 in 2016), whereas the other two races had similar means for these traits. Other traits, namely basal tiller number, flag leaf blade length, flag leaf blade width, number of racemes, longest raceme length, 100-seed weight, harvest index, and grain yield did not differ among races in both the years. The number of racemes had the lowest H¢ value in both years (0.271 in 2015, 0.220 in 2016) and in all three races (0.245–0.326 in 2015, 0.203–0.257 in 2016), whereas other traits had high diversity (Table 2), indicating considerably high diversity of kodo millet accessions for agronomic traits.
Table 2. Shannon–Weaver diversity indices (H¢) of qualitative, agronomic, and grain nutrient traits of the full set of kodo millet accessions and three races evaluated in 2015 and 2016 at ICRISAT, Patancheru, India.
2015 2016Trait regularis irregularis variabilis Full set regularis irregularis variabilis Full setQualitative traits (both years)
Growth habit 0.135 0.187 0.110 0.141
Culm branching 0.435 0.459 0.421 0.444
Leaf erectness 0.221 0.330 0.268 0.257
Internodal exposure 0.422 0.355 0.385 0.405
Flag leaf at secondary axis node 0.475 0.469 0.465 0.476
Mean 0.338 0.360 0.330 0.345
Agronomic traits
Days to 50% flowering 0.498 0.525 0.550 0.518 0.549 0.563 0.523 0.599
Days to maturity 0.503 0.516 0.550 0.518 0.557 0.589 0.405 0.570
Basal tiller no. 0.613 0.511 0.415 0.532 0.587 0.586 0.573 0.600
Plant height (cm) 0.622 0.546 0.560 0.621 0.608 0.564 0.600 0.620
Flag leaf blade length (mm) 0.581 0.559 0.593 0.593 0.593 0.551 0.560 0.624
Flag leaf blade width (mm) 0.551 0.518 0.572 0.620 0.514 0.553 0.534 0.538
Flag leaf sheath length (mm) 0.602 0.547 0.602 0.633 0.567 0.560 0.624 0.599
Inflorescence length (mm) 0.556 0.513 0.600 0.573 0.554 0.532 0.557 0.536
Sterile primary axis length (mm) 0.591 0.541 0.566 0.589 0.615 0.546 0.577 0.608
No. of racemes 0.245 0.270 0.326 0.271 0.203 0.220 0.257 0.220
Thumb length (mm) 0.425 0.589 0.552 0.505 0.532 0.597 0.559 0.582
Longest raceme length (mm) 0.443 0.578 0.549 0.496 0.492 0.448 0.512 0.496
100-seed weight (g) 0.630 0.525 0.530 0.645 0.514 0.620 0.599 0.558
Grain yield (g plant−1) 0.591 0.581 0.562 0.586 0.601 0.573 0.584 0.603
Harvest index 0.628 0.601 0.588 0.625 0.622 0.590 0.605 0.623
Straw yield (kg ha−1) NR† NR NR NR 0.563 0.577 0.611 0.573
Grain yield (kg ha−1) NR NR NR NR 0.606 0.589 0.590 0.608
Mean 0.538 0.528 0.541 0.555 0.546 0.545 0.545 0.562
Grain nutritional traits
Fe (mg kg−1) 0.595 0.530 0.499 0.577 0.535 0.576 0.596 0.541
Zn (mg kg−1) 0.612 0.573 0.581 0.605 0.609 0.571 0.575 0.616
Ca (mg kg−1) 0.609 0.596 0.524 0.623 0.625 0.594 0.619 0.613
Protein (%) 0.579 0.513 0.550 0.601 0.616 0.572 0.564 0.620
Mean 0.599 0.553 0.538 0.601 0.596 0.578 0.589 0.598
† NR, not recorded.
1100 www.crops.org crop science, vol. 59, may–june 2019
(0.577–0.623 in 2015, 0.541–0.620 in 2016) had high H¢ values, though regularis had slightly higher diversity than the other two races in both the years (Table 2).
Association between Grain Nutrients and Agronomic TraitsIn both 2015 and 2016, grain yield (g plant−1) was signifi-cantly and positively correlated with plant height, thumb length, and harvest index, as well as with flag leaf blade width and number of racemes in 2015, and days to 50% flowering, days to maturity, basal tiller number, flag leaf sheath length, inflorescence length, sterile primary axis length, longest raceme length, 100-seed weight, and straw yield (kg ha−1) in 2016 (Table 4). Grain yield (kg ha−1) estimated only in 2016 was significantly and positively correlated with basal tiller number, plant height, flag leaf blade length, flag leaf sheath length, inflorescence length, sterile primary axis length, thumb length, longest finger length, 100-seed weight, harvest index, and straw yield (kg ha−1). Grain nutritional traits showed significantly positive correlation with each other in 2016, whereas in 2015, only Fe and Zn with protein were significant. Zinc, Ca, and protein showed significant negative correlation with grain yield (kg ha−1) in 2016, whereas all four grain nutrients showed nonsignificant correlation with grain yield (g plant−1) in 2015.
Trait-Specific SourcesAgronomic TraitEarly flowering, greater 100-seed weight, and high grain yields are important traits in kodo millet. In the full set, 14 accessions matured significantly earlier in both the years (88–94 DAS in 2015, 85–90 DAS in 2016), compared with the trial mean of 99 DAS in 2015 and 103 DAS in 2016, and produced grain yields of 1941 to 3689 kg ha−1. However, considering grain yields >2500 kg ha−1 together with early maturity, we identified eight acces-sions that flowered significantly early in the both years and also produced grain yields ranging from 2524 to 3689 kg ha−1 (Table 5). For 100-seed weight, 13 accessions had significantly high 100-seed weight (0.60–0.65 g in 2015, 0.52–0.75 g in 2016), and 10 of them produced grain yield over 2500 kg ha−1, considering grain yield together with 100-seed weight. For grain yield, 15 accessions (IPs 4, IPs 274, IPs 264, IPs 614, IPs 881, IPs 5, IPs 575, IPs 86, IPs 9, IPs 83, IPs 814, IPs 339, IPs 729, IPs 287, and IPs 699) have been selected that produced >3500 kg ha−1, and five of them (IPs 4, IPs 264, IPs 614, IPs 881, and IPs 274) produced significantly more (3962–4121 kg ha−1) than the trial mean of 2632 kg ha−1. Altogether, 30 accessions were identified for agronomic traits; yields of these accessions varied from 2524 to 4121 kg ha−1 and maturity varied from 87 to 132 DAS.
Table 3. Mean and range of agronomic and grain nutritional traits of the full set of kodo millet germplasm and three races evaluated in 2015 and 2016 at ICRISAT, Patancheru, India.
Mean performanceMean† Range 2015 2016
Trait 2015 2016 2015 2016 Irregularis Regularis Variabilis Irregularis Regularis VariabilisDays to 50% flowering 69b 75a 58–94 58–100 65b 71a 65b 70b 78a 69b
Days to maturity 99b 103a 88–124 85–132 95b 102a 95b 98b 107a 97b
Basal tiller no. 11a 12a 8–21 7–17 11a 12a 12a 11a 12a 11a
Plant height (cm) 72a 57b 47–101 34–80 65c 75a 69b 52c 60a 55b
Flag leaf blade length (mm) 187a 151b 129–313 112–203 183a 190a 183a 149a 151a 153a
Flag leaf blade width (mm) 8a 7b 5–11 5–10 7a 8a 8a 7a 7a 7a
Flag leaf sheath length (mm) 169a 157b 131–216 124–220 166a 170a 169a 150b 159a 155ab
Inflorescence length (mm) 122b 140a 96–198 107–229 115b 126a 118b 132b 145a 136b
Sterile primary axis length (mm) 50a 54b 29–89 30–83 45b 52a 49a 49b 56a 52b
No. of racemes 3a 3a 2–5 3–4 3a 3a 3a 3a 3a 3a
Thumb length (mm) 69a 62b 49–116 33–101 65b 71a 67ab 56b 64a 61a
Longest raceme length (mm) 70a 65b 54–115 52–100 69a 72a 68a 63a 66a 65a
100-seed weight (g) 0.48a 0.47b 0.35–0.65 0.38–0.75 0.49a 0.48a 0.50a 0.47a 0.46a 0.48a
Grain yield (g plant−1) 19a 18a 4–45 5–36 18a 20a 17a 18a 18a 17a
Harvest index 0.37b 0.43a 0.14–0.56 0.19–0.57 0.39a 0.36a 0.38a 0.43a 0.42a 0.44a
Straw yield (kg ha−1) NR‡ 3695 NR 1156–8777 NR NR NR 3256b 3992a 3277b
Grain yield (kg ha−1) NR 2632 NR 796–4121 NR NR NR 2528a 2707a 2521a
Fe (mg kg−1) 27.6a 25.5b 14.4–54.1 17.3–56.4 27.5a 27.7a 27.2a 26.5a 25.5a 24.9a
Zn (mg kg−1) 23.0b 24.9a 17.0–30.4 21.1–31.5 22.4a 23.3a 23.0a 24.7a 24.9a 24.9a
Ca (mg kg−1) 213.3a 189.6b 120.9–321.4 138.3–262.3 210.2a 213.4a 216.0a 194.9a 186.4a 193.5a
Protein (%) 7.9b 8.5a 5.6–11.3 6.5–10.4 7.6a 8.1a 8.0a 8.4a 8.5a 8.5a
† Means were compared following the Newman–Keuls test (Newman, 1939; Keuls, 1952). Mean followed by the same letters are not significant at P £ 0.05, and means followed by different letters are significant at P £ 0.05. Homogeneity of variances among the clusters was tested using Levene’s test (Levene, 1960).
‡ NR, not recorded.

crop science, vol. 59, may–june 2019 www.crops.org 1101
Grain Nutrient ContentGrain nutrient traits showed considerable differences between years, and thus most grain nutrient rich acces-sions in 1 yr did not display the same performance in another year. Therefore, the accessions that were consis-tent in both the years were identified using averaged LSD over both the years. Thus, if the difference between years for a given nutrient was greater than or equal to the average LSD of both the years (Fe £ 7.8 mg kg−1, Zn £ 3.8 mg kg−1, Ca £ 32.5 mg kg−1, and protein £ 1.5%), the accession was considered as consistent. For Fe content, differences of up to 28.9 mg kg−1 were observed between years, and 150 accessions with differences of <7.8 mg kg−1 were considered as consistent, of which 18 accessions with Fe content over 27 mg kg−1 in both years (trial mean of >27.6 mg kg−1 in 2015 and >25.5 mg kg−1 in 2016) were identified as consistently high Fe accessions. Similarly, for Zn content, differences of up to 9.6 mg kg−1 were observed between years, and 157 accessions were found to be consistent in both years (difference between years £ 3.8 mg kg−1), of which 19 accessions with Zn content of >25 mg kg−1 in both years (trial mean = 23.0 mg kg−1 in 2015 and 24.9 mg kg−1 in 2016) were identified as consis-tently high Zn accessions. For Ca content, differences of up to 120 mg kg−1 between years were observed, and 108 accessions were found to be consistent with differences of
£32.5 mg kg−1 between years, of which 10 were identi-fied as consistently high Ca accessions having >215 mg kg−1 in both years (trial mean = 213.3 mg kg−1 in 2015 and 189.6 mg kg−1 in 2016). Protein content had differences of up to 3.4% between years, and 135 accessions were found having £2% differences between years and were consid-ered consistent. Accessions with >9% protein in both the years (trial mean = 7.9% in 2015 and 8.5% in 2016) were identified as consistently high-protein accessions. Consid-ering the pivotal role that grain yield plays for farmers, a yield ceiling of >2500 kg ha−1 was considered along with high nutrient content. Thus, 30 accessions were identified including eight for Fe, 14 for Zn, six for Ca, and seven for protein, with a few accessions for more than nutrients, that met both the criteria of yield and nutrient content (Table 6).
Diversity among Trait-Specific SourcesGower’s phenotypic distance among the 50 trait-specific accessions ranged from 0.113 between IPs 344 and IPs 44 (both belong to the race regularis) to 0.569 between IPs 730 and IPs 279 (both belong to the race regularis), with a mean distance of 0.280. The average diversity in the 10 multiple trait accessions was higher (0.302) than among the 30 agronomic trait accessions (0.294) or among the 30 grain nutritional traits (0.264). The multiple trait accessions (10)
Table 4. Correlation of agronomic and grain nutrient traits with grain yield of kodo millet germplasm evaluated in 2015 and 2016 at ICRISAT, Patancheru, India.
2015 2016
Trait† Fe Zn Ca Protein
Grain yield
(g plant−1) Fe Zn Ca Protein
Grain yield
(g plant−1)
Grain yield
(kg ha−1)Days to 50% flowering −0.182** 0.418** −0.126 0.042 0.134 −0.165* 0.091 −0.272** −0.214** 0.216** 0.085
Days to maturity −0.175* 0.419** −0.128 0.047 0.137 −0.169* 0.110 −0.261** −0.203** 0.182** 0.055
Basal tiller no. −0.032 −0.025 0.035 0.019 −0.043 −0.024 −0.079 −0.178* −0.128 0.195** 0.216**
Plant height (cm) −0.074 0.352** −0.142* 0.064 0.155* −0.252** −0.169* −0.260** −0.336** 0.318** 0.442**
Flag leaf blade length (mm) −0.102 0.235** −0.022 0.026 0.096 −0.111 −0.139** −0.121 −0.188** 0.119 0.181*
Flag leaf blade width (mm) −0.107 0.223** −0.029 −0.198** 0.282** −0.038 −0.067 −0.037 −0.231** 0.051 0.100
Flag leaf sheath length (mm) −0.172* 0.195** −0.102 −0.068 0.076 −0.220** −0.072 −0.298** −0.362** 0.304** 0.265**
Inflorescence length (mm) −0.145* 0.372** −0.168* 0.052 0.101 −0.217** 0.005 −0.208** −0.353** 0.227** 0.256**
Sterile primary axis length (mm) −0.053 0.202** −0.175* 0.028 0.022 −0.071 0.014 −0.091 −0.314** 0.154* 0.231**
No. of racemes −0.088 0.238** −0.057 −0.163* 0.149* −0.053 0.008 0.022 −0.216** 0.016 −0.011
Thumb length (mm) −0.132 0.372** −0.092 −0.011 0.139* −0.190** 0.018 −0.204** −0.383** 0.229** 0.211**
Longest raceme length (mm) −0.190** 0.354** −0.060 0.057 0.129 −0.220** −0.009 −0.209** −0.355** 0.218** 0.185**
100-seed weight (g) −0.168* 0.097 0.112 −0.106 0.011 −0.192** −0.142* −0.228** −0.283** 0.230** 0.153*
Harvest index 0.008 −0.278** 0.104 −0.237** 0.266** 0.204** −0.037 0.091 0.170* 0.175* 0.269**
Straw yield (kg ha−1) NR‡ NR NR NR NR −0.247** −0.172* −0.286** −0.318** 0.241** 0.412**
Fe (mg kg−1) 0.040 0.063 0.157* 0.048 0.221** 0.349** 0.195** −0.081 −0.080
Zn (mg kg−1) −0.066 0.330** 0.097 0.310** 0.208** −0.116 −0.260**
Ca (mg kg−1) 0.080 −0.026 0.262** −0.319** −0.262**
Protein (%) −0.082 −0.170* −0.221**
* Significant at the 0.05 probability level.
** Significant at the 0.01 probability level.
† The correlations were estimated using traits of respective years. Straw and grain yields (kg ha−1) were estimated only in 2016, whereas other traits were recorded in both the years.
‡ NR, not recorded.

1102 www.crops.org crop science, vol. 59, may–june 2019
were common to both agronomic and nutritional groups. The five most diverse pairs of accessions in the three groups with distance are given in Table 7.
A hierarchical clustering analysis of trait-specific sources following Ward’s method resulted in three major clusters, C-I, C-II, and C-III at the height (distance between clusters) of 0.35 (Fig. 2). The 13 accessions in C-I were late maturing (117 DAS in 2015, 125 DAS in 2016), had greater 100-seed weight (0.60 g in 2015, 0.58 g in 2016), and produced high biomass (6252 kg ha−1 in 2016), whereas the 28 accessions in C-II were early maturing (95 DAS in 2015, 96 DAS in 2016), had low 100-seed weight (0.46 g in 2015, 0.45 g in 2016), and straw yield (3275 kg ha−1 in 2016). The nine acces-sions of C-III were intermediate in maturity (104 DAS in 2015, 111 DAS in 2016) and straw yield (4257 kg ha−1 in
2016). However, average grain yields were similar in all three clusters (3149–3308 kg ha−1, data not shown). In C-I and C-III clusters, all the accessions except three belonged to the race regularis, whereas C-II contained accessions belonging to all three races with a preponderance of regularis (15 accessions) followed by variabilis (7) and irregularis (6).
DISCUSSIONKodo millet accessions evaluated in this study revealed a significant level of variability for morphoagronomic and grain nutrient traits. The three races of kodo millet can be differentiated on the basis of spikelet arrangement on racemes: accessions of race regularis are characterized by racemes with the spikelets arranged in two rows on one side of a flattened rachis; accessions of race irregularis
Table 5. Kodo millet germplasm accessions identified for greater 100-seed weight and high grain yield, based on evaluation in 2015 and 2016 at ICRISAT, Patancheru, India.
Days to maturity
100-seed weight Fe Zn Ca Protein
Straw yield
Grain yield
Accession Race 2015 2016 2015 2016 2015 2016 2015 2016 2015 2016 2015 2016 2016 2016——— d ——— ——— g ——— ————————————— mg kg−1 ————————————— ——— % ——— —— kg ha−1 ——
IPs 729 variabilis 90* 89* 0.45 0.50 28.8 26.9 21.1 21.6 219.8 185.9 7.3 8.2 3553 3689
IPs 222 regularis 94* 89* 0.40 0.44 31.1 32.1 22.7 24.5 209.5 211.2 6.4 9.7 3113 3432
IPs 860 variabilis 90* 87* 0.50 0.53* 27.8 26.5 21.1 23.5 255.9* 195.9 10.0* 8.2 2559 3394
IPs 670 variabilis 94* 88* 0.50 0.48 24.9 25.7 20.9 24.7 268.8* 201.2 6.6 8.3 3730 3386
IPs 77 variabilis 91* 89* 0.45 0.47 22.7 28.4 25.3 25.2 168.7 180.5 7.1 8.4 3072 3247
IPs 710 irregularis 92* 90* 0.50 0.49 31.7 26.8 21.8 26.0 244.9 194.1 7.5 8.9 2890 2924
IPs 158 irregularis 94* 89* 0.50 0.49 29.9 19.2 21.9 23.8 237.1 166.6 8.8 8.5 3617 2777
IPs 585 variabilis 93* 88* 0.50 0.49 33.2 22.9 21.6 24.6 230.0 196.7 8.7 7.8 3288 2524
IPs 13 regularis 123 132 0.60* 0.52* 18.6 23.9 25.7 23.9 190.9 169.6 7.3 7.2 6276* 2636
IPs 669 regularis 120 131 0.60* 0.57* 20.6 22.7 22.1 20.9 246.5 172.2 7.2 7.6 3066 3260
IPs 279 regularis 122 132 0.60* 0.60* 20.8 19.8 25.3 25.6 190.4 152.8 8.0 8.1 8777* 2944
IPs 588 regularis 122 126 0.60* 0.60* 22.4 21.1 27.2* 23.6 236.5 169.6 7.8 8.1 7311* 3407
IPs 593 irregularis 93* 103 0.60* 0.57* 24.3 40.0* 24.4 27.8 214.2 199.4 6.5 8.7 3881 3185
IPs 686 regularis 108 125 0.60* 0.54* 26.1 24.2 25.2 25.7 267.2* 173.8 6.9 8.6 7674* 3040
IPs 280 regularis 118 132 0.62* 0.59* 26.4 23.6 25.1 24.3 160.2 166.9 7.8 7.7 8715* 3057
IPs 689 regularis 107 117 0.65* 0.75* 30.4 24.2 24.7 24.4 220.5 219.1* 10.4* 8.2 6143* 2953
IPs 4 regularis 124 129 0.65* 0.65* 32.3 22.0 27.4* 25.5 210.7 160.6 8.7 8.0 8298* 4121*
IPs 274 regularis 120 126 0.65* 0.60* 21.8 19.7 25.2 23.1 244.1 170.8 7.6 8.1 6429* 3962*
IPs 264 regularis 94* 96 0.55 0.52 27.2 22.1 24.4 23.7 232.9 158.0 9.2 9.1 4408 4110*
IPs 614 regularis 93* 102 0.45 0.46 28.1 21.3 23.6 22.2 193.8 175.2 8.4 8.8 2268 4031*
IPs 881 regularis 109 123 0.40 0.41 32.6 25.9 25.4 23.6 187.3 152.3 7.1 8.2 3842 3985*
IPs 5 regularis 120 119 0.60* 0.47 21.9 24.3 25.7 25.2 237.1 220.0* 7.4 7.5 5390 3859
IPs 575 regularis 108 124 0.50 0.50 22.6 20.7 24.6 21.3 230.7 138.6 7.1 8.9 5906 3850
IPs 86 regularis 104 104 0.50 0.48 24.5 25.1 23.2 26.3 193.6 204.7 7.8 8.4 4482 3829
IPs 9 irregularis 97 91 0.45 0.43 24.7 29.0 25.1 23.6 182.4 219.1* 7.5 8.7 3016 3824
IPs 83 irregularis 102 105 0.40 0.44 29.9 28.4 24.4 24.7 200.7 147.0 7.4 8.0 3018 3775
IPs 814 regularis 96 98 0.35 0.40 37.7* 29.3 21.4 25.2 215.3 232.6* 6.5 8.0 3400 3708
IPs 339 regularis 93* 109 0.45 0.47 37.9* 22.1 20.0 24.7 209.9 156.4 7.0 8.9 3368 3699
IPs 287 variabilis 107 114 0.55 0.52 28.4 17.9 28.0* 24.8 160.2 156.6 6.6 7.4 6421* 3680
IPs 699 regularis 96 94 0.45 0.43 25.5 20.4 24.2 23.8 217.7 155.3 9.1 8.1 3367 3647
Trial mean 99 103 0.48 0.47 27.6 25.5 23.0 24.9 213.3 189.6 7.9 8.5 3695 2632
Trial range 88– 124
85– 132
0.35–0.65
0.38–0.75
14.4–54.1
17.3–56.4
17.0–30.4
20.1–31.5
120.9–321.4
138.3–262.3
5.6– 11.5
6.5– 10.4
1156–8777
796–4121
LSD (5%) 5 12.5 0.1 0.06 8.4 7.2 3.3 4.2 37.2 27.8 1.6 1.4 2388 1282
CV 2.6 6.4 10 7 14.9 14.1 7 8.5 8.8 7.4 9.7 8.4 32.5 24.5
* Significant at the 0.05 probability level.

crop science, vol. 59, may–june 2019 www.crops.org 1103
are characterized by racemes with the spikelets arranged along the rachis in two to four irregular rows; and race variabilis is characterized with the irregularly arranged spikelets on the lower parts of raceme, while spikelets arrangement becomes more regularly two-rowed in the upper part of the raceme (de Wet et al., 1983). In this study, there were no differences in frequency and diversity of qualitative traits among kodo millet races, other than the spikelet arrangement on racemes, whereas agronomic traits, namely maturity duration, plant height, inflores-cence length, sterile primary axis length, and thumb length, showed significant differences among races. The race regularis was late maturing, produced tall plants with long inflorescence, long sterile primary axis, long thumb length, and produced higher straw yield, whereas the other
two races did not differ from each other for these traits. However, all the three races did not differ significantly for grain yield, although race regularis had higher grain yield followed by variabilis and irregularis.
Identification of kodo millet germplasm that could be tested in multiple locations and, if found suitable, further released as cultivars is a very effective and quick road to cultivar release, since hybridization-based breeding is difficult in the crop owing to its floral morphology. Early maturity and high grain yield are the important traits of focus in kodo millet. In India, ?33 kodo millet cultivars have been released since 1942, and all of them were pure line selections from landraces, except a few that were released by mutation breeding. Grain yields of released cultivars varied from 0.8 to 3.0 t ha−1 (AICSMIP, 2014). This study showed a wide range
Table 6. Consistently grain nutrient dense kodo millet germplasm accessions identified based on evaluation in 2015 and 2016 at Patancheru, India.
Days to maturity Fe Zn Ca ProteinGrain yield
Accession Race 2015 2016 2015 2016 2015 2016 2015 2016 2015 2016 2016————— d ————— —————————————————— mg kg−1 —————————————————— ————— % ————— kg ha−1
IPs 766 regularis 102 101 38.2*† 40.9* 24.2 23.4 206.4 200.1 10.7* 9.2 2829
IPs 618 variabilis 91* 94 32.8 29.2 24.9 28.5 227.5 176.6 9.6* 9.0 2501
IPs 344 regularis 103 100 32.2 28.5 25.2 27.8 170.7 196.1 9.0 8.7 3397
IPs 255 regularis 102 105 27.9 27.2 23.9 24.8 187.9 185.1 7.8 8.8 2536
IPs 83 irregularis 102 105 29.9 28.4 24.4 24.7 200.7 147.0 7.4 8.0 3775
IPs 735 regularis 93* 107 28.8 28.9 21.9 24.5 196.8 189.9 7.0 7.7 2661
IPs 730 regularis 95 101 28.8 28.4 22.0 26.1 204.6 179.2 6.5 8.2 2953
IPs 222 regularis 94* 89* 31.1 32.1 22.7 24.5 209.5 211.2 6.4 9.7 3432
IPs 313 regularis 119 126 22.4 23.3 27.7* 26.8 224.6 140.9 9.5* 7.1 2691
IPs 244 regularis 101 97 25.0 23.6 26.3* 26.2 222.2 222.3* 10.3* 8.5 2734
IPs 597 regularis 106 122 20.6 22.4 25.8 26.2 167.2 179.4 9.2 8.2 2528
IPs 4 regularis 124 129 32.3 22.0 27.4* 25.5 210.7 160.6 8.7 8.0 4121*
IPs 279 regularis 122 132 20.8 19.8 25.3 25.6 190.4 152.8 8.0 8.1 2944
IPs 587 irregularis 107 111 14.4 19.3 30.0* 31.5* 221.5 196.6 7.4 7.5 3148
IPs 5 regularis 120 119 21.9 24.3 25.7 25.2 237.1 220.0* 7.4 7.5 3859
IPs 77 variabilis 91* 89* 22.7 28.4 25.3 25.2 168.7 180.5 7.1 8.4 3247
IPs 695 regularis 108 125 24.4 22.7 25.8 25.4 260.1* 194.2 6.9 7.9 2950
IPs 686 regularis 108 125 26.1 24.2 25.2 25.7 267.2* 173.8 6.9 8.6 3040
IPs 133 irregularis 96 91 52.4* 28.9 25.2 26.7 191.0 194.5 6.7 7.2 3442
IPs 349 regularis 104 105 31.3 24.2 25.8 28.9 166.6 189.4 6.7 9.0 2515
IPs 21 regularis 96 104 30.3 26.2 25.2 28.3 227.2 164.5 5.9 8.4 2672
IPs 689 regularis 107 117 30.4 24.2 24.7 24.4 220.5 219.1* 10.4* 8.2 2953
IPs 785 variabilis 93* 95 26.2 31.5 21.4 25.1 235.2 226.0* 10.7* 8.7 2784
IPs 154 regularis 101 101 47.3* 24.8 23.9 25.6 220.0 231.6* 7.6 8.6 2566
IPs 814 regularis 96 98 37.7* 29.3 21.4 25.2 215.3 232.6* 6.5 8.0 3708
IPs 898 regularis 101 97 28.1 20.9 24.7 24.3 219.0 186.6 11.3* 9.3 2558
IPs 862 regularis 95 104 31.7 43.5* 24.5 27.0 211.5 210.0 10.5* 9.1 2949
IPs 236 irregularis 91* 101 22.1 34.4* 22.0 25.0 167.6 262.3* 9.5* 9.1 2829
IPs 264 regularis 94* 96 27.2 22.1 24.4 23.7 232.9 158.0 9.2 9.1 4110*
IPs 44 regularis 101 105 32.1 23.0 23.6 24.3 183.8 163.0 9.1 9.1 3336
Trial mean 99 103 27.6 25.5 23.0 24.9 213.3 189.6 7.9 8.5 2632Trial range 88–
12485– 132
14.4– 54.1
17.3– 56.4
17.0– 30.4
20.1– 31.5
120.9–321.4
138.3–262.3
5.6– 11.5
6.5–1 0.4
796– 4121
LSD (5%) 5 12.5 8.4 7.2 3.3 4.2 37.2 27.8 1.6 1.4 1282
* Significant at the 0.05 probability level.
† Values in bold were consistent in both the years.

1104 www.crops.org crop science, vol. 59, may–june 2019
of maturity duration from 85 to 132 DAS in kodo millet germplasm and identified eight accessions (IPs 729, IPs 222, IPs 860, IPs 670, IPs 77, IPs 710, IPs 158, and IPs 585) as early maturing (<94 DAS) and that produced high grain yields (>2500 kg ha−1). These early-maturing accessions could be grown as a catch crop to assure maximum yields if the monsoon fails. Similarly, 10 accessions with greater 100-seed weight and high yields (>2500 kg ha−1) were identified. Fifteen high-yielding accessions that produced >3500 kg ha−1 were identified, of which IPs 729 matured in <90 DAS and yielded 3689 kg ha−1. Altogether, 30 accessions were identified for agronomic traits, all of which yielded >2500 kg ha−1. Their yield adaptability could be tested across diverse kodo millet growing regions in the arid and semiarid regions for potential release as cultivars if they perform better than existing cultivars.
There have been no studies on variability for grain nutrient content in kodo millet germplasm, except for a few on protein content. Earlier studies have reported protein content of 9.2 to 11.2% using a few germplasm (Kulkarni and Naik, 2000; Kewat et al., 2016). Kodo millet accessions used here showed significant variation for grain Fe, Zn, Ca and protein content, and the three races did not differ significantly from each other. In proso millet, the race ovatum was found to have considerably higher grain nutrients than other races (Vetriventhan and Upadhyaya, 2018). Average Zn (23–25 mg kg−1) and protein (7.9–8.5%) contents in the kodo millet accessions used in this study were greater than those in finger millet germplasm (Zn 19.9 mg kg−1, protein 7.3%) (Upadhyaya et al., 2011a), and Ca content (190–213 mg kg−1) was greater than in foxtail millet (146 mg kg−1) (Upadhyaya et al., 2011b) and proso millet (165 mg kg−1) (Vetriventhan
Table 7. The five most diverse pairs of kodo millet accessions in the three trait groups with distance.
Trait type Pair of accessions (race) Gower’s distanceAgronomic IPs 710 (irregularis), IPs 279 (regularis) 0.548
IPs 279 (regularis), IPs 222 (regularis) 0.537IPs 710 (irregularis), IPs 13 (regularis) 0.527IPs 860 (variabilis), IPs 279 (regularis) 0.511IPs 710 (irregularis), IPs 280 (regularis) 0.509
Avg. distance 0.294 among 435 pairs (varied from 0.123 to 0.548)Grain nutrient IPs 730 (regularis), IPs 279 (regularis) 0.569
IPs 279 (regularis), IPs 236 (irregularis) 0.566IPs 279 (regularis), IPs 222 (regularis) 0.537IPs 236 (irregularis), IPs 4 (regularis) 0.528IPs 814 (regularis), IPs 279 (regularis) 0.498
Avg. distance 0.264 among 435 pairs (varied from 0.113 to 0.569)Both agronomic and grain nutrient IPs 279 (regularis), IPs 222 (regularis) 0.537
IPs 814 (regularis), IPs 279 (regularis) 0.498IPs 77 (variabilis), IPs 4 (regularis) 0.490
IPs 279 (regularis), IPs 77 (variabilis) 0.458IPs 279 (regularis), IPs 83 (irregularis) 0.458
Avg. distance 0.302 among 45 pairs (varied from 0.142 to 0.537)
Fig. 2. Gower’s phenotypic distance-based hierarchical clustering of kodo millet trait-specific accessions following Ward’s method (Ward, 1963). The height in the cluster represents the distance or dissimilarity between two clusters or objects that are joined. REG, regularis; IRR, irregularis; VAR, variabilis.

crop science, vol. 59, may–june 2019 www.crops.org 1105
and Upadhyaya, 2018) germplasm. Also, average Fe and Zn contents in kodo millet germplasm were greater than that of the final target content established by HarvestPlus for rice (Fe = 13 mg kg−1, Zn = 24 mg kg−1) and comparable with the average Fe and Zn contents at the baseline of wheat, maize, and sorghum (Garcia-Oliveira et al., 2018). This underlines the importance of kodo millet in terms of grain nutrient contribution, high yield potential, and drought adaptation and demonstrates that kodo millet could be a good supple-ment for crop and diet diversification.
Grain nutrient content is highly influenced by genotype and genotype ´ environment interactions; therefore, assessing trait stability across environments is important in crop improvement programs to enhance the nutritional quality of food crops. High genotype ´ environment inter-action has been reported for grain nutrient content in several crops including maize (Oikeh et al., 2004), sorghum (Phuke et al., 2017), pearl millet (Pucher et al., 2014), and affects the rank of genotypes across environments. In this study, most significantly high-grain, nutrient-rich accessions in 1 yr did not display the same performance in another year. Therefore, it is important to identify high-grain, nutrient-rich accessions that performed consistently during both the years. In the full set, a high percentage of accessions performed consistently in both years for Zn (78.5%) and Fe content (75.0%) followed by protein content (67.5%) and the least was for Ca (54.0%), indicating the relative sensitivity of these nutrient traits to environment and genotype ´ environment interactions.
Grain Fe and Zn content in several crops including sorghum (Upadhyaya et al., 2016; Phuke et al., 2017), pearl millet (Kanatti et al., 2014), proso millet (Vetriven-than and Upadhyaya, 2018), and finger millet (Upadhyaya et al., 2011a) were significantly and positively corre-lated. However, in this study, Fe and Zn content showed significant correlation only in 2016, indicating that the performance of accessions between years and conse-quently the correlation between the traits, differ mainly due to the influence of year (environments) and genotype ´ year interaction. Thus, it is important to test nutrient stability and identify consistently performing genotypes across seasons and years. Based on the consistent perfor-mance for nutrient content and high grain yield in both the years, 30 grain nutrient-rich accessions were identi-fied, including eight for Fe, 14 for Zn, six for Ca, and seven for protein content. Some of them were consistently high for more than one nutrient trait: IPs 766 and IPs 618 for Fe and protein, IPs 344 for Fe and Zn, and IPs 244 and IPs 5 for Zn and Ca content. All these grain nutrient-rich accessions also produced grain yields >2500 kg ha−1, of which IPs 83, IPs 4, IPs 5, IPs 814, and IPs 264 produced >3500 kg ha−1. Nonsignificant correlation of grain Fe and Zn with grain yield (g plant−1) was observed in this study, offering the possibility of identifying accessions with high Fe and Zn in a high-yielding background.
This study identified 50 trait-specific accessions, including 10 for multiple traits (both agronomic and grain nutrient: IPs 4, IPs 5, IPs 77, IPs 83, IPs 222, IPs 264, IPs 279, IPs 686, IPs 689, and IPs 814). The five most diverse pairs in each of the three groups (agronomic, nutritional and multiple traits) revealed repeated occurrence of a few accessions (Table 7). IPs 279 occurred three times in the agronomic group and four times each in the nutrient and multitrait groups, whereas IPs 710 occurred three times in the agronomic group, and IPs 236 in the nutrient group and IPs 77 in multitrait group occurred twice each (Table 7). This indicates that IPs 279, IPs 710, IPs 236, and IPs 77 may be of particular interest in imparting diversity. High-yielding diverse cultivars form the basis of sustainable agricultural production. The multiple trait accessions produced grain yields in the range of 2944 to 4121 kg ha−1 and matured in 89 to 132 DAS, and all of them were consistently rich in either one or two grain nutrients. These high-yielding and nutrient-rich accessions could be evaluated extensively in multiple locations under diverse conditions and years in the kodo millet growing regions. This will facilitate the identi-fication of promising high-yielding nutrient-rich accessions for further release as cultivars and use in crop improvement to ensure food and nutritional security in a changing climate scenario. Integration of kodo millet into cropping systems will also contribute to crop diversification and better use of land, diet diversification, and reducing micronutrient and protein malnutrition. Researchers can obtain seed samples of these accessions from the ICRISAT genebank (http://genebank.icrisat.org/) for research purpose through a Standard Material Transfer Agreement.
Conflict of InterestThe authors hereby state that there is no conflict of interest with regard to this manuscript.
AcknowledgmentsThe authors gratefully acknowledge the contributions Mr. Shailesh K. Singh, Mr. U. Venugopal Reddy, and Mr. M. Thimma Reddy of the ICRISAT Genebank, Patancheru, India, to data collection and documentation.
ReferencesAICSMIP. 2014. Report on compendium of released varieties in small
millets. All India Coord. Small Millets Improv. Proj., Banglore, India.
Baghel, M.S., H.S. Yadava, and M.S. Tomer. 1989. Intercropping pulse and oilseeds with kodo millet under dryland conditions. Ann. Arid Zone 28:331–333.
Bartlett, M.S. 1937. Properties of sufficiency and statistical tests. Proc. R. Soc. London, Ser. A 160:268–282. doi:10.1098/rspa.1937.0109
Bhat, B.V., V.A. Tonapi, B.D. Rao, A. Singode, and D. Santra. 2018. Production and utilization of millets in India. In: D.K. Santra and J.J. Johnson, editors, Proceedings of the International Millet Symposium and the 3rd International Symposium on Broomcorn Millet, Fort Collins, CO. 8–13 Aug. 2018. Univ. Nebraska, Lin-coln. p. 24–26.

1106 www.crops.org crop science, vol. 59, may–june 2019
Cakmak, I., and U.B. Kutman. 2018. Agronomic biofortification of cereals with zinc: A review. Eur. J. Soil Sci. 69:172–180. doi:10.1111/ejss.12437
de Mendiburu, F. 2017. agricolae: Statistical procedures for agricul-tural research. R package version 1.2-7. Comprehensive R Arch. Network. https://cran.r-project.org/package=agricolae (accessed 21 May 2018).
de Wet, J.M.J., K.E.P. Rao, M.H. Mengesha, and D.E. Brink. 1983. Diversity in kodo millet, Paspalum scrobiculatum. Econ. Bot. 37:159–163. doi:10.1007/BF02858779
Deshpande, S.S., D. Mohapatra, M.K. Tripathi, and R.H. Sadvatha. 2015. Kodo millet: Nutritional value and utilization in Indian foods. J. Grain Processing Storage 2:16–23.
Fox, J., and S. Weisberg. 2011. An {R} companion to applied regres-sion. 2nd ed. Sage, Thousand Oaks, CA.
Ganapathy, K.N. 2017. Improvement in finger millet: Status and future prospects. In: J.V. Patil, editor, Millets and sorghum: Biol-ogy and genetic improvement. John Wiley & Sons, Chichester, UK. p. 87–111. doi:10.1002/9781119130765.ch3
Garcia-Oliveira, A.L., S. Chander, R. Ortiz, A. Menkir, and M. Gedil. 2018. Genetic basis and breeding perspectives of grain iron and zinc enrichment in cereals. Front. Plant Sci. 9:937. doi:10.3389/fpls.2018.00937
Gower, J.C. 1971. A general coefficient of similarity and some of its properties. Biometrics 27:857–874. doi:10.2307/2528823
IBPGR. 1983. Kodo millet descriptors. Int. Board Plant Genet. Resour., Rome.
Kanatti, A., K.N. Rai, K. Radhika, M. Govindaraj, and K.L. Sahrawat. 2014. Grain iron and zinc density in pearl millet : Combining ability, heterosis and association with grain yield and grain size. SpringerPlus 3:763. doi:10.1186/2193-1801-3-763
Keuls, M. 1952. The use of the “studentized range” in connection with an analysis of variance. Euphytica 1:112–122. doi:10.1007/BF01908269
Kewat, R.N., S.K.Z. Rizvi, R.P. Singh, R.P. Singh, and P. Singh. 2016. Biochemical screening of kodo millets (Paspalum scrobicula-tum var. L.) grown in region of Vindhyachal eastern U.P. Asian Sci. 11:37–39. doi:10.15740/HAS/AS/11.1/37-39
Kulkarni, L.R., and R.K. Naik. 2000. Nutritive value, protein qual-ity and organoleptic quality of kodo millet (Paspalum scrobicula-tum). Karnataka J. Agric. Sci. 13:125–129.
Levene, H. 1960. Robust tests for equality of variances. In: I. Olkin, et al., editors, Contributions to probability and statistics: Essays in honor of Harold Hotelling. Stanford Univ. Press, Palo Alto, CA. p. 278–292.
Maechler, M., P. Rousseeuw, A. Struyf, M. Hubert, and K. Hornik. 2018. cluster: Cluster analysis basics and extensions. R pack-age version 2.0.7-1. Comprehensive R Arch. Network. https://CRAN.R-project.org/package=cluster (accessed 12 Dec. 2018)
National Research Council (NRC). 1996. Lost crops of Africa. Vol. 1: Grains. Natl. Acad. Press., Washington, DC.
Newman, B.Y.D. 1939. The distribution of range in samples from a normal population, expressed in terms of an independent esti-mate of standard deviation. Biometrika 31:20–30. doi:10.1093/biomet/31.1-2.20
Oikeh, S.O., A. Menkir, B. Maziya-Dixon, R.M. Welch, R.P. Glahn, and G. Gauch. 2004. Environmental stability of iron and zinc concentrations in grain of elite early-maturing tropical maize genotypes grown under field conditions. J. Agric. Sci. 142:543–551. doi:10.1017/S0021859604004733
Phuke, R.M., K. Anuradha, K. Radhika, F. Jabeen, G. Anuradha, T. Ramesh, et al. 2017. Genetic variability, genotype ´ environ-ment interaction, correlation, and GGE biplot analysis for grain
iron and zinc concentration and other agronomic traits in RIL population of sorghum (Sorghum bicolor L. Moench). Front. Plant Sci. 8:712. doi:10.3389/fpls.2017.00712
Pucher, A., H. Høgh-Jensen, J. Gondah, C.T. Hash, and B.I.G. Haussmann. 2014. Micronutrient density and stability in West African pearl millet-potential for biofortification. Crop Sci. 54:1709–1720. doi:10.2135/cropsci2013.11.0744
Rajendran, S., V. Afari-Sefa, A. Shee, T. Bocher, M. Bekunda, I. Dominick, and P.J. Lukumay. 2017. Does crop diversity contrib-ute to dietary diversity? Evidence from integration of vegetables into maize-based farming systems. Agric. Food Secur. 6:50. doi:10.1186/s40066-017-0127-3
Sahrawat, K.L., G.R. Kumar, and K.V.S. Murthy. 2002. Sulfuric acid–selenium digestion for multi-element analysis in a single plant digest. Commun. Soil Sci. Plant Anal. 33:3757–3765. doi:10.1081/CSS-120015920
Saleh, A.S.M., Q. Zhang, J. Chen, and Q. Shen. 2013. Millet grains: Nutritional quality, processing, and potential health benefits. Compr. Rev. Food Sci. Food Saf. 12:281–295. doi:10.1111/1541-4337.12012
Sarma, S.M., P. Khare, S. Jagtap, D.P. Singh, R.K. Baboota, K. Podili, et al. 2017. Kodo millet whole grain and bran supplemen-tation prevents high-fat diet induced derangements in a lipid pro-file, inflammatory status and gut bacteria in mice. Food Funct. 8:1174–1183. doi:10.1039/C6FO01467D
Shannon, C.E., and W. Weaver. 1949. The mathematical theory of communication. Univ. Illinois Press, Urbana.
Upadhyaya, H.D., S.L. Dwivedi, S. Singh, K.L. Sahrawat, and S.K. Singh. 2016. Genetic variation and postflowering drought effects on seed iron and zinc in ICRISAT sorghum mini core collection. Crop Sci. 56:374–383. doi:10.2135/cropsci2015.05.0308
Upadhyaya, H.D., S.L. Dwivedi, S.K. Singh, S. Singh, M. Vetriven-than, and S. Sharma. 2014. Forming core collections in barnyard, kodo, and little millets using morphoagronomic descriptors. Crop Sci. 54:2673–2682. doi:10.2135/cropsci2014.03.0221
Upadhyaya, H.D., S. Ramesh, S. Sharma, S.K. Singh, S.K. Varsh-ney, N.D.R.K. Sarma, et al. 2011a. Genetic diversity for grain nutrients contents in a core collection of finger millet (Eleusine coracana (L.) Gaertn.) germplasm. Field Crops Res. 121:42–52. doi:10.1016/j.fcr.2010.11.017
Upadhyaya, H.D., C.R. Ravishankar, Y. Narasimhudu, N.D.R.K. Sarma, S.K. Singh, S.K. Varshney, et al. 2011b. Identification of trait-specific germplasm and developing a mini core collec-tion for efficient use of foxtail millet genetic resources in crop improvement. Field Crops Res. 124:459–467. doi:10.1016/j.fcr.2011.08.004
Upadhyaya, H.D., M. Vetriventhan, S.L. Dwivedi, S.K. Pattanashetti, and S.K. Singh. 2015. Proso, barnyard, little and kodo millets. In: M. Singh and H.D. Upadhyaya, editors, Genetic and genomic resources for grain cereals improvement. Acad. Press, Oxford, UK. p. 321–343.
Vetriventhan, M., and H.D. Upadhyaya. 2018. Diversity and trait-specific sources for productivity and nutritional traits in the global proso millet (Panicum miliaceum L.) germplasm collection. Crop J. 6:451–463. doi:10.1016/j.cj.2018.04.002
Ward, J.H. 1963. Hierarchical grouping to optimize an objective function. J. Am. Stat. Assoc. 58:236–244. doi:10.1080/01621459.1963.10500845
Wheal, M.S., T.O. Fowles, and L.T. Palmer. 2011. A cost-effective acid digestion method using closed polypropylene tubes for inductively coupled plasma optical emission spectrometry (ICP-OES) analysis of plant essential elements. Anal. Methods 3:2854–2863. doi:10.1039/c1ay05430a