Molecular diversity and association mapping of quantitative traits in Tibetan wild and worldwide...
13
Molecular diversity and association mapping of quantitative traits in Tibetan wild and worldwide originated barley (Hordeum vulgare L.) germplasm Dongfa Sun • Wenbin Ren • Genlou Sun • Junhua Peng Received: 29 May 2010 / Accepted: 14 September 2010 / Published online: 28 September 2010 Ó Springer Science+Business Media B.V. 2010 Abstract Molecular diversity of 40 accessions of Tibetan wild barley (TB), 10 Syrian (SY), 72 North American (NA), 36 European (EU), 9 South American (SA) and 8 Australian (AU) varieties were character- ized using multiple microsatellite loci. The 42 SSR primers amplified 278 alleles across the 175 barley accessions tested in the present study. The average gene diversity for the whole sample was 0.3387 whereas the mean value for the each population was as follows: TB = 0.3286, SY = 0.2474, EU = 0.299, AU = 0.2867, NA = 0.3138, SA = 0.2536. Cluster- ing analysis based on Nei’s original genetic distance showed that the EU and NA barley populations were grouped together. The TB population was well sepa- rated from the other 5 barley populations. Associations between microsatellite markers and 14 quantitative traits were also investigated. Significant associations were found for 18 microsatellite marker loci. The number of marker loci associated with each trait ranged from one (stem diameter, filled grains per plant, grain weight per plant, length of main spike and awn length) to seven (plant height). The percentage of the total variation explained by each marker ranged from 4.59% (HVM2 associated with plant height) to 17.48% (Bmac90 associated with density of main spike). This study provides candidate markers for further QTL mapping of these traits and for marker-assisted selection. Keywords Barley germplasm Á Tibetan wild barley Á Microsatellite Á Molecular diversity Á Association mapping Introduction Barley is one of the main grain crops, and also ranking the fourth staples in the world, and is used for animal feed, brewing malts, and human consumption (Hayes et al. 2003). Barley can be grown in a wide range of environments such as the Arctic, high mountains and desert oases (Harlan 1976). It was suggested that worldwide cultivated barley originated from either the Fertile Crescent (Ancient Egypt, the Levant and Mesopotamia) (Harlan 1976), or the Qinghai-Tibet plateau region in China (Vavilov 1926; Bru ¨cher and A ˚ berg 1950; Feng et al. 2006). The amount of genetic variation in germplasm and genetic relationships between genotypes are critical information for effective conservation and utilization D. Sun (&) Á W. Ren Á G. Sun College of Plant Science and Technology, Huazhong Agricultural University, Wuhan 430070, Hubei, China e-mail: [email protected] G. Sun Biology Department, Saint Mary’s University, Halifax, NS B3H 3C3, Canada J. Peng Wuhan Botanical Garden/Institute, Chinese Academy of Sciences, Wuhan 430074, Hubei, China 123 Euphytica (2011) 178:31–43 DOI 10.1007/s10681-010-0260-6
-
Upload
independent -
Category
Documents
-
view
4 -
download
0
Transcript of Molecular diversity and association mapping of quantitative traits in Tibetan wild and worldwide...

Molecular diversity and association mapping of quantitativetraits in Tibetan wild and worldwide originated barley(Hordeum vulgare L.) germplasm
Dongfa Sun • Wenbin Ren • Genlou Sun •
Junhua Peng
Received: 29 May 2010 / Accepted: 14 September 2010 / Published online: 28 September 2010
� Springer Science+Business Media B.V. 2010
Abstract Molecular diversity of 40 accessions of
Tibetan wild barley (TB), 10 Syrian (SY), 72 North
American (NA), 36 European (EU), 9 South American
(SA) and 8 Australian (AU) varieties were character-
ized using multiple microsatellite loci. The 42 SSR
primers amplified 278 alleles across the 175 barley
accessions tested in the present study. The average
gene diversity for the whole sample was 0.3387
whereas the mean value for the each population was as
follows: TB = 0.3286, SY = 0.2474, EU = 0.299,
AU = 0.2867, NA = 0.3138, SA = 0.2536. Cluster-
ing analysis based on Nei’s original genetic distance
showed that the EU and NA barley populations were
grouped together. The TB population was well sepa-
rated from the other 5 barley populations. Associations
between microsatellite markers and 14 quantitative
traits were also investigated. Significant associations
were found for 18 microsatellite marker loci. The
number of marker loci associated with each trait
ranged from one (stem diameter, filled grains per plant,
grain weight per plant, length of main spike and awn
length) to seven (plant height). The percentage of the
total variation explained by each marker ranged from
4.59% (HVM2 associated with plant height) to 17.48%
(Bmac90 associated with density of main spike). This
study provides candidate markers for further QTL
mapping of these traits and for marker-assisted
selection.
Keywords Barley germplasm � Tibetan wild barley �Microsatellite � Molecular diversity �Association mapping
Introduction
Barley is one of the main grain crops, and also
ranking the fourth staples in the world, and is used for
animal feed, brewing malts, and human consumption
(Hayes et al. 2003). Barley can be grown in a wide
range of environments such as the Arctic, high
mountains and desert oases (Harlan 1976). It was
suggested that worldwide cultivated barley originated
from either the Fertile Crescent (Ancient Egypt, the
Levant and Mesopotamia) (Harlan 1976), or the
Qinghai-Tibet plateau region in China (Vavilov 1926;
Brucher and Aberg 1950; Feng et al. 2006).
The amount of genetic variation in germplasm and
genetic relationships between genotypes are critical
information for effective conservation and utilization
D. Sun (&) � W. Ren � G. Sun
College of Plant Science and Technology, Huazhong
Agricultural University, Wuhan 430070, Hubei, China
e-mail: [email protected]
G. Sun
Biology Department, Saint Mary’s University, Halifax,
NS B3H 3C3, Canada
J. Peng
Wuhan Botanical Garden/Institute, Chinese Academy
of Sciences, Wuhan 430074, Hubei, China
123
Euphytica (2011) 178:31–43
DOI 10.1007/s10681-010-0260-6

of genetic resources (Kresovich et al. 1995). Knowl-
edge on the amount of genetic variation present, and
the location of the genetic determinants of diversity
may be useful for discovering new genes (Jana 1999;
Matus and Hayes 2002). Assessment of genetic
diversity in barley germplasm and their genetic
relationships will provide useful information for
breeding programs. The degree of genetic diversity
in germplasm can be characterized by using mor-
phology, pedigree and molecular techniques. Molec-
ular techniques are currently the most feasible
strategy for characterizing diversity in wild and
cultivated germplasm (Matus and Hayes 2002).
Genetic diversity of wild and cultivated barley have
been characterized using RFLPs (Graner et al. 1990;
Petersen et al. 1994; Russell et al. 1997), RAPDs
(Dawson et al. 1993; Frank and Ana 2001), AFLPs
(Turpeinen et al. 2003), and SSRs (Saghai-Maroof
et al. 1994; Struss and Plieske 1998; Matus and Hayes
2002; Feng et al. 2006). It has been demonstrated that
SSR markers possess a number of advantages over
other types of molecular markers, such as codomi-
nance, highly polymorphisms, locus specificity, good
reproducibility, and random distribution throughout
the genome. In recent years, a large number of SSR
markers in barley have been developed and exten-
sively utilized in barley genomic mapping and marker-
assisted breeding (Liu et al. 1996; Ramsay et al. 2000;
Varshney et al. 2007; Williams et al. 2008).
Conventional barley linkage mapping has been
conducted using experimental populations derived
from a bi-parental cross. Many quantitative trait loci
(QTL) have been reported. However, the effects of
these QTL often turn out to be unique to a specific
genetic background which has limited their applica-
tion in breeding programs (Achleitner et al. 2008).
Association mapping strategy seems to be a promising
approach to overcome the limitations of conventional
QTL mapping and has received increased attention of
plant geneticists during the last few years (Kraakman
et al. 2004; Gupta et al. 2005; Breseghello and Sorrells
2006; Peng et al. 2009; Stracke et al. 2009). The
principal of association mapping (AM) is based on
linkage disequilibrium (LD) and to utilize historic
patterns of recombination that have occurred within a
sample of individuals to detect correlations between
genotypes and phenotypes within these individuals
(Zondervan and Cardon 2004). The natural decay rate
of LD with distance occurs in inbreeding species at a
considerably slower than in outbreeding species
because effective recombination in inbreeding species
is severely reduced and genetic polymorphisms remain
correlated over longer physical distances (Nordborg
et al. 2002; Caldwell et al. 2006). Association between
traits and markers across germplasm collections were
established in oat, rice, maize, wheat and barley
(Kraakman et al. 2004; Peng et al. 2009). In barley,
Igartua et al. (1999) detected marker-trait associations
for heading date in 32 cultivars. Ivandic et al. (2003)
found association between markers and the traits of
water-stress tolerance (Chromosome 4H) and powdery
mildew resistance in 52 wild barley lines. Using 236
AFLP markers and a collection of 146 modern two-
row spring barley cultivars, the markers associated
with yield and yield stability were identified (Kraak-
man et al. 2004). Barley is a inbreeding species, its
genome contains extensive blocks of chromatin in LD
(Malysheva-Otta et al. 2006), and thus is suitable for
association mapping. Association mapping has so far
been applied in the cultivated population, rarely used
in the heterogeneous populations mixing cultivated
and wild ancestors.
The objectives of this study were to analyze the
genetic diversity and genetic relationships among
Tibetan wild and barley germplasm of worldwide
origin, and to test preliminarily genetic associations
between SSR markers and morphological and agro-
nomical traits using heterogeneous population with
cultivated and wild barley. The results of this study
will help utilize, conserve and manage the barley
germplasm effectively.
Materials and methods
Plant materials and phenotyping
One hundred and seventy-five barley accessions of
worldwide origin were used for this study. Among the
175 accession, 40 originated from Chinese Tibet, 10
from Syria, 72 from North America, 36 from different
parts of Europe, 9 from South America, and 8 from
Australia. The names, countries of origin and row
numbers of the accessions are listed in Table 1.
All accessions were evaluated for agronomic and
morphological traits in replicated field experiments.
Briefly, the barley accessions were sown in three
replications in the experimental field of Huazhong
32 Euphytica (2011) 178:31–43
123

Table 1 The code, name, origin and row type of 175 barley accessions used in this study
Code Name Origin Row Code Name Origin Row
L35 H01 Tibet 2 0121 Anerle USA 2
L36 H03 Tibet 2 0122 Clark USA 2
L37 H04 Tibet 6 0123 Wal8892-78 USA 2
L38 H04a Tibet 2 0124 Wal4583-77 USA 2
L39 H09 Tibet 6 0125 Gus USA 6
L40 H010 Tibet 6 0126 Columbia USA 6
L41 H011 Tibet 6 0127 W84-145 USA 6
L42 H017 Tibet 6 0128 W84-144 USA 6
L43 H018 Tibet 2 0129 W84-143 USA 2
L44 H022 Tibet 2 0130 W84-142 USA 6
L45 H029 Tibet 2 0131 W84-141 USA 6
L46 H032 Tibet 2 0132 W84-140 USA 2
L47 H033 Tibet 2 0133 W84-138 USA 2
L48 H052 Tibet 2 0134 W84-137 USA 2
L49 H079 Tibet 6 0135 W84-136 USA 6
L50 H094 Tibet 2 0136 W84-134 USA 2
L51 H0230 Tibet 2 0137 Clipper/volla Syria 2
L52 H0246 Tibet 6 0138 W84-146 USA 6
L53 H0334 Tibet 2 0139 W84-147 USA 6
L54 H0544 Tibet 2 0140 W84-150 USA 2
L55 H0545 Tibet 2 0141 W84-151 USA 6
L56 H0546 Tibet 2 0142 W84-152 USA 6
L57 H0547 Tibet 2 0143 W84-155 USA 6
L58 H0548 Tibet 2 0144 W84-156 USA 6
L59 H0551 Tibet 2 0145 W84-158 USA 2
L60 H0551 Tibet 2 0146 W84-159 USA 6
L61 H0552 Tibet 2 0147 W84-160 USA 6
L62 H0564 Tibet 2 0148 W84-161 USA 6
L63 H0567 Tibet 2 0149 W84-163 USA 6
L64 H0569 Tibet 2 0150 W84-164 USA 6
L65 H0590 Tibet 2 0151 W84-165 USA 6
L66 H0609 Tibet 2 0152 W84-166 USA 2
L67 H0609 Tibet 2 0153 W84-184 USA 2
L68 H0640 Tibet 6 0154 W84-106 USA 6
L69 H0641 Tibet 2 0155 W84-108 USA 2
L70 H0642 Tibet 2 0156 W84-109 USA 6
L71 H0648 Tibet 2 0157 W84-110 USA 6
L72 H0650 Tibet 2 0158 W84-112 USA 6
L73 H0651 Tibet 2 0159 W84-113 USA 2
L74 Yeshengerlenghei Tibet 2 0160 W84-114 USA 2
077 Monker USA 6 0161 W84-115 USA 2
078 Mute USA 6 0162 W84-130 USA 6
079 Bananza USA 6 0163 W84-129 USA 2
080 Dalt Canada 6 0164 W84-128 USA 6
Euphytica (2011) 178:31–43 33
123

Table 1 continued
Code Name Origin Row Code Name Origin Row
081 Ho208 Canada 2 0165 W84-127 USA 6
082 Mpyt Canada 2 0166 W84-125 USA 6
0100 Arenter13 Australia 2 0167 W84-123 USA 2
0101 Ns293 Australia 2 0168 W84-120 USA 2
0169 W84-117 USA 2 0348 Leger Canada 6
0170 W84-116 USA 6 0349 Atlanta Canada 6
0171 W84-113 USA 6 0350 Micmac Canada 2
0172 W84-154 USA 6 0431 Nutans244 Russia 2
0173 W84-148 USA 6 0432 Nutans106 Russia 2
0174 W84-165 USA 2 0433 Mockobkun121 Russia 2
0175 W84-119 USA 2 0434 Australia no. 1 Australia 6
0192 Soufara‘‘s’’ Syria 2 0435 Arupo‘‘s’’ Mexico 2
0193 C18887/C15961 Syria 2 0438 Karla Mexico 6
0194 Thunk27 Syria 6 0439 Bedford Mexico 6
0195 Owinn Syria 6 0440 Ideal Mexico 6
0196 Lignee527 Syria 6 0441 Gloria‘‘s’’/Com‘‘s’’ Mexico 6
0197 Martin46 Syria 6 0442 Gloria‘‘s’’/Com‘‘s’’ Mexico 6
0198 Atlas46 Syria 6 0443 Con‘‘s’’/Collo‘‘s’’ Mexico 6
0199 DeirAha106 Syria 6 0444 H. vulgare 1 Turkey 6
0200 Clipper/volla Syria 6 0445 H. vulgare 2 Turkey 2
0212 Grivita Romania 2 0462 Australia no. 2 Australia 6
0213 Produtiv Romania 2 0465 Rubust USA 6
0214 W12269 Australia 6 0466 Hazen USA 6
0215 Oregen line USA 2 0467 Morex USA 2
0216 Asse USA 6 0567 Karan15 Mexico 6
0217 Ris/1508 Sweden 6 0571 Ai471 Germany 6
0220 Quibenras Columbia 6 0572 Ai127 Germany 2
0221 Dram England 6 0573 Ai128 Germany 2
0222 Lignee640 France 6 0575 Ai473 Germany 2
0223 7109 Sweden 6 0576 Ai472 Germany 2
0224 7198 Sweden 2 0577 Ai125 Germany 2
0225 7200 Sweden 6 0578 Ai474 Germany 2
0226 Lina Sweden 6 0579 Ai508 Germany 2
0227 Alva Sweden 2 0582 Ai126 Germany 2
0228 Harry Sweden 2 0585 Ai509 Germany 2
0229 Kristina Sweden 2 0586 Ai510 Germany 2
0230 Pallas Sweden 6 0588 Ai471 Germany 6
0231 Cd15425 USA 6 0589 Ai124 Germany 2
0240 Washington USA 2 0590 Ai475 Germany 6
0342 Grand prix Netherland 2 0597 Farniwait Hungary 2
0343 Rorin Netherland 2 5441 Baudin Australia 2
0344 Atem Netherland 2 5442 Hamelin Australia 2
0346 Lauriner Canada 6 5443 Gairdner Australia 2
0347 Kinkora Canada 6
34 Euphytica (2011) 178:31–43
123

Agricultural University, Wuhan, China in 2005. The
leaf area (LA), stem diameter (SD), grains per plant
(GPP), filled grains per plant (FGPP), grain weight
per plant (GWP), plant height (PH), spikelets on main
spike (SMS), grains on main spike (GMS), grain
weight on main spike (GWMS), length of main spike
(LMS), density of main spike (DMS), length of the
1st internode (LFIN), length of spike neck (LSN), and
awn length (AL) were measured. The mean and
variance were calculated for each trait.
DNA isolation
The cetyltrimethylammonium bromide (CTAB)
method was used to extract genomic DNA from about
0.6 to 1.0 g of young leaf-tissue of each accession (Stein
et al. 2001). The quality of DNA was checked using
0.8% agarose gel electrophoresis, and the DNA
concentration was measured using a spectrophotometer.
SSR genotyping
In order to have a good coverage of the barley genome,
42 primer pairs, six from each chromosome, were
selected from the published genetic maps (Karakousis
et al. 2003; Varshney et al. 2007). Polymerase chain
reaction (PCR) was carried out in a final volume of 15
ll, containing 3 ll of the 20 ng ll-1 genomic DNA,
1.5 ll of 109 PCR buffer (with 15 mM Mg2?), 0.3 ll
of 10 mM dNTP mixture, 2.0 ll of a 2.5 lM solution
of the forward and reverse primers, and 0.6 units of
Taq DNA polymerase (TakaRa Biotechnology,
Dalian, China). DNA amplifications were performed
in a thermocycler using the following touchdown PCR
protocol: 1 cycle of 3 min at 94�C, followed by 15
cycles 94�C for 30 s, 30 s at 60�C (decreasing 1�C per
cycle), 45 s at 72�C. Another 25 cycles of 30 s at 94�C,
30 s at 50�C, 45 s at 72�C. The reaction ended with a
5 min extension at 72�C.
After PCR amplification, 6 ll of 98% (v/v)
formamide electrophoresis loading dye containing
0.25% (w/v) bromophenol blue, 0.25% (w/v) xylene
cyanole FF and 100 mM EDTA were added to each
reaction mixture. The PCR products were denatured
and separated on 6% denaturing polyacrylamide gel.
The gels were visualized with silver staining. Fig-
ure 1 shows polymorphism pattern of SSR marker
Ebmac775 as an example.
Genetic diversity analysis
The SSR markers were treated as co-dominant markers.
The collection of the barley germplasm was classified
into six groups based on their geographic origins, Tibet
(TB), Syria (SY), Europe (EU), North America (NA),
South America (SA) and Australia (AU). To determine
the magnitude of genetic variation in the 175 barley
accessions, POPGENE program (Yeh and Yang 2000)
was used to calculate allelic richness (A), proportion of
polymorphic loci (P), Shannon’s information index (I)
(Shannon and Weaver 1949), genetic differentiation
among population (Fst) and gene diversity (He). Gene
diversity was estimated according to the formula of Nei
(1973) for each locus He = 1 - RPij2, where Pij is the
frequency of the jth allele for ith locus summed across
all alleles of the locus. Nei’s (1972) genetic distance (D)
was calculated for each pair of population and for each
pair of tested entries. Dendrogram based on Nei’s
genetic distances (Nei 1972) were generated using the
unweighted pair group method with arithmetic average
(UPGMA). All the analyses were conducted using
POPGENE 1.32 Window based computer package
(Yeh and Yang 2000).
Association mapping
Mean phenotypic values of the 14 quantitative traits
(LA, SD, GPP, FGPP, GWP, PH, SMS, GMS,
Fig. 1 An example of amplification profiles of SSR marker Ebmac775 in the 40 barley accessions. Lanes 1–40 corresponds to the
code L35 to L74 in Table 1. Lane 41: DNA ladder
Euphytica (2011) 178:31–43 35
123
GWMS, LMS, DMS, LFIN, LSN and AL) were
subjected to association analysis based on the whole
set of 175 accessions used in this study. Association
analysis was performed based on the general linear
model by using computer software TASSEL 2.0.1
(http://www.maizegenetics.net/tassel) account for pop-
ulation structure estimates from STRUCTURE2.1
software (Prichard et al. 2000, http://pritch.bsd.uchicago.
edu/structure.html). The number of permutation run
was set as 10,000 to obtain the permutation-based test
of marker significance and the experiment-wise
P value for marker significance. Markers were con-
sidered to be associated with the traits if the markers
are significant (P \ 0.05) in all the three tests, F test,
permutation-based test, and experiment-wise test.
Results
Allelic variation at SSR loci
A total of 278 alleles were detected by 42 pairs of
primers across the 175 barley accessions with a mean
of 6.62 alleles per primer pair. The highest number of
alleles (6.0) for all accessions, regardless of their
origins, was observed in Ebmac501 locus, following
by Awbms22-2, Ebmac032 and Ebmac785 with 5
alleles. The effective number of alleles (ne) by
Kimura and Crow (1964) was estimated and it was
between 1.000 and 3.8805 (Awbms22), with means of
1.7097 ± 0.6329. The mean Nei’s gene diversity was
0.3388 ± 0.2236 with highest one detected in locus
Awbms22 (0.7423).
For each group of the barley accessions, the total
number of detected SSR alleles in Tibetan wild type,
Syria, Europe, Australia, North America and South
America barley was 264, 219, 249, 233, 265 and 219,
respectively. The average number of alleles per locus
ranged from 1.78 in Syrian and Australian barley
population to 2.154 in North American barley popu-
lation. The highest number of alleles (5) was observed
in locus Ebmac501, Awbms22, Ebmac785, and
Ebmac824 in Tibetan wild barley. Ebmac501 dis-
played highest number alleles (5) in both Syrian and
European barley. Three loci, Ebmac032, Ebmac501,
and Awbms22, each possessed 5 alleles in North
American barley. Five loci, Ebmac501, Awbms22,
Ebmac785, Bmac90, and Ebmac775, each contained 4
alleles in Australian barley. The highest number of
alleles (4) was detected in Ebmac032, Ebmac775,
Ebmac785, Awbms22, and Ebmac824 in South Amer-
ican barley. The polymorphic loci in population was
78.86% in Tibetan wild type, 65.85% in Syrian,
76.42% in European, 67.48% in Australian, 77.24% in
North American, and 60.98% in South American
barley.
Comparison of gene diversity
The statistics describing the genetic diversity found at
each locus in each population was calculated. Consid-
ering the geographic origin of the experimental barley
accessions, the average gene diversity for the whole
sample was 0.3387, whereas the mean value for each
population was as follows: TB = 0.3286, SY =
0.2474, EU = 0.299, AU = 0.2867, NA = 0.3138,
SA = 0.2536. Large variation of gene diversity
among loci was found. The lowest gene diversity (0)
was detected in 22 loci for all populations. The lowest
number of loci (26) with 0 of gene diversity was
detected in Tibet wild barley. Gene diversity of [0.50
in all six populations was observed for the loci,
Ebmac032, Awbms22, and Ebmac785. The highest
gene diversity in each population was found at
Ebmac824 (0.7478) in Tibetan barley, Ebmac775
(0.6916) in South American barley, Ebmac501 in
Syrian (0.7600), European (0.7145), Australian
(0.7188) and North American barley (0.7176). Seven-
teen loci with gene diversity [ 0.6 were found in
Tibetan wild barley, which is twice the number of loci
detected in any other populations.
The total genetic diversity can be divided into
within and among populations. In our case, the
proportion of each component varied from locus to
locus. The averaged genetic variation among popu-
lations (Fst) was 13.55% with the highest value of
28.25% detected for loci, HVM27 and Bmac167.
Cluster analysis
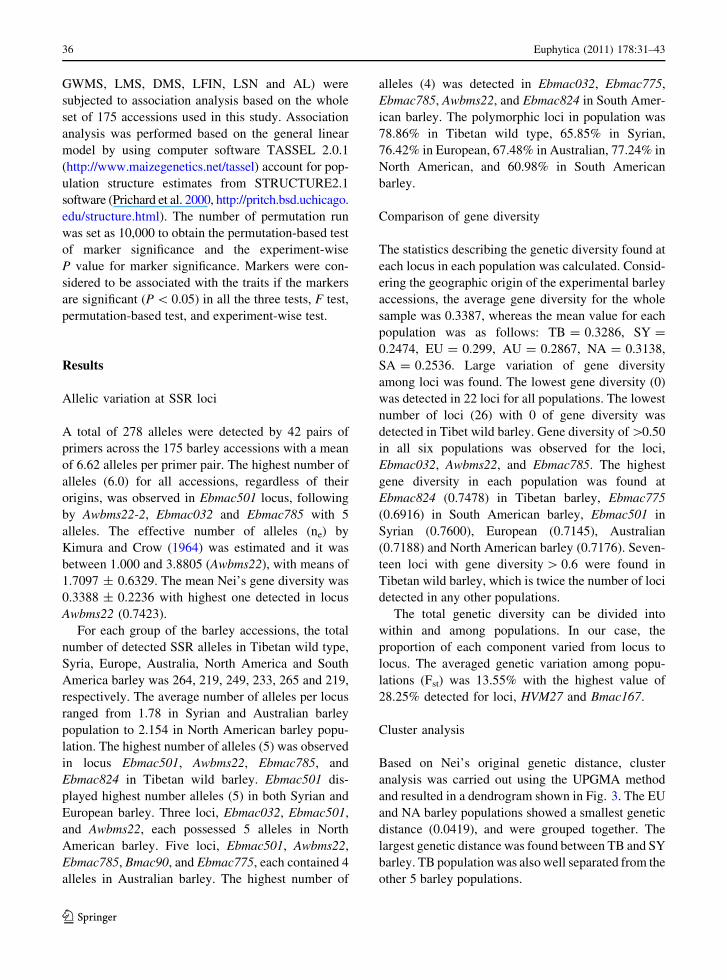
Based on Nei’s original genetic distance, cluster
analysis was carried out using the UPGMA method
and resulted in a dendrogram shown in Fig. 3. The EU
and NA barley populations showed a smallest genetic
distance (0.0419), and were grouped together. The
largest genetic distance was found between TB and SY
barley. TB population was also well separated from the
other 5 barley populations.
36 Euphytica (2011) 178:31–43
123

In order to demonstrate the phylogenetic relation-
ships of 175 barley accessions, a dendrogram based
on the Nei’s genetic distance was shown in Fig. 2.
The 175 barley accessions could be divided into two
mega-groups. Mega-group I included 144 accessions
that can be further divided into four subgroups and
L37022305880589L66L67059002170216L47012601300131016201720173016501660167L49079L50015901600168017001710770220L73L7401940195L6104330225022602270228059704440126012701350141014201470148014901460156015701430144012901400145017401330134013501530169016101520158022104340780125046602140438043904400441L530230L720196015401500151
IA
a
b
c
d
USA
Europe
USA6 row
USA2 row
6 rowe
IB
L3502120462L36L38L46L700573L64L65L68L39L40L42L41L48L54L59L60L58L55L56L57L43L45L69L71L62L6304670567
L44L51L520197019801990200022208101370192022903440342034304310163057805750164057604320572012101220123012403500435544154425443044505770582019202240585058601320100082021301010175021508001550579024005710231034703490348034604650442044301380139
ICa
b
2 row
6 row
II
6 row
2 row
I
ID
Fig. 2 Dendrogram of 175 barley accessions based on the Nei’s (1972) original genetic distance calculated from data of 123 SSR
loci using the UPGMA method. The code for each accession refers to Table 1
Euphytica (2011) 178:31–43 37
123
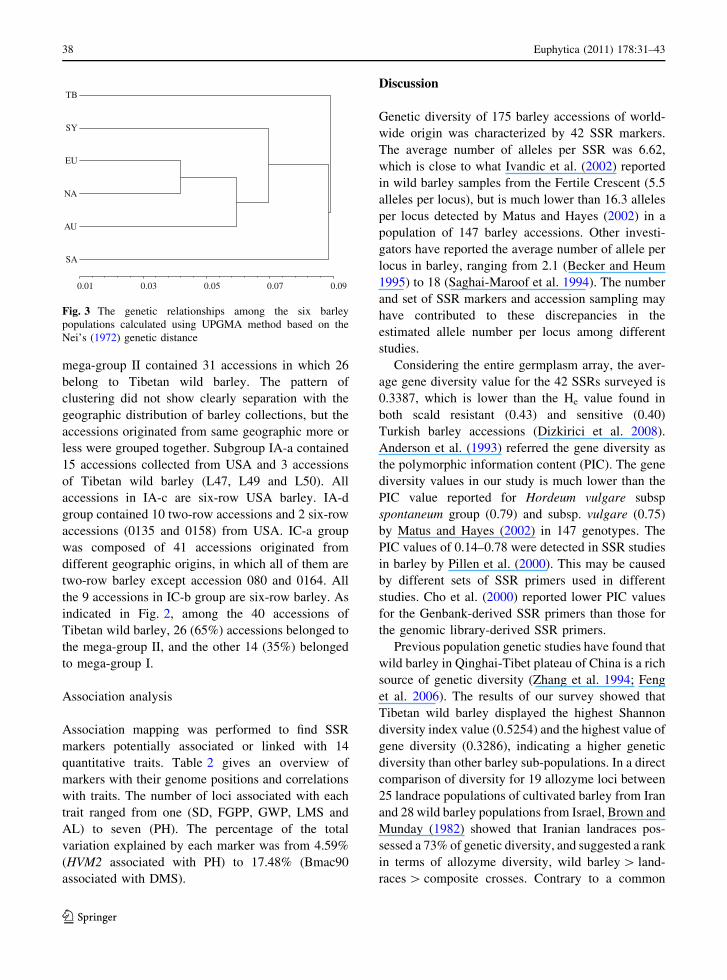
mega-group II contained 31 accessions in which 26
belong to Tibetan wild barley. The pattern of
clustering did not show clearly separation with the
geographic distribution of barley collections, but the
accessions originated from same geographic more or
less were grouped together. Subgroup IA-a contained
15 accessions collected from USA and 3 accessions
of Tibetan wild barley (L47, L49 and L50). All
accessions in IA-c are six-row USA barley. IA-d
group contained 10 two-row accessions and 2 six-row
accessions (0135 and 0158) from USA. IC-a group
was composed of 41 accessions originated from
different geographic origins, in which all of them are
two-row barley except accession 080 and 0164. All
the 9 accessions in IC-b group are six-row barley. As
indicated in Fig. 2, among the 40 accessions of
Tibetan wild barley, 26 (65%) accessions belonged to
the mega-group II, and the other 14 (35%) belonged
to mega-group I.
Association analysis
Association mapping was performed to find SSR
markers potentially associated or linked with 14
quantitative traits. Table 2 gives an overview of
markers with their genome positions and correlations
with traits. The number of loci associated with each
trait ranged from one (SD, FGPP, GWP, LMS and
AL) to seven (PH). The percentage of the total
variation explained by each marker was from 4.59%
(HVM2 associated with PH) to 17.48% (Bmac90
associated with DMS).
Discussion
Genetic diversity of 175 barley accessions of world-
wide origin was characterized by 42 SSR markers.
The average number of alleles per SSR was 6.62,
which is close to what Ivandic et al. (2002) reported
in wild barley samples from the Fertile Crescent (5.5
alleles per locus), but is much lower than 16.3 alleles
per locus detected by Matus and Hayes (2002) in a
population of 147 barley accessions. Other investi-
gators have reported the average number of allele per
locus in barley, ranging from 2.1 (Becker and Heum
1995) to 18 (Saghai-Maroof et al. 1994). The number
and set of SSR markers and accession sampling may
have contributed to these discrepancies in the
estimated allele number per locus among different
studies.
Considering the entire germplasm array, the aver-
age gene diversity value for the 42 SSRs surveyed is
0.3387, which is lower than the He value found in
both scald resistant (0.43) and sensitive (0.40)
Turkish barley accessions (Dizkirici et al. 2008).
Anderson et al. (1993) referred the gene diversity as
the polymorphic information content (PIC). The gene
diversity values in our study is much lower than the
PIC value reported for Hordeum vulgare subsp
spontaneum group (0.79) and subsp. vulgare (0.75)
by Matus and Hayes (2002) in 147 genotypes. The
PIC values of 0.14–0.78 were detected in SSR studies
in barley by Pillen et al. (2000). This may be caused
by different sets of SSR primers used in different
studies. Cho et al. (2000) reported lower PIC values
for the Genbank-derived SSR primers than those for
the genomic library-derived SSR primers.
Previous population genetic studies have found that
wild barley in Qinghai-Tibet plateau of China is a rich
source of genetic diversity (Zhang et al. 1994; Feng
et al. 2006). The results of our survey showed that
Tibetan wild barley displayed the highest Shannon
diversity index value (0.5254) and the highest value of
gene diversity (0.3286), indicating a higher genetic
diversity than other barley sub-populations. In a direct
comparison of diversity for 19 allozyme loci between
25 landrace populations of cultivated barley from Iran
and 28 wild barley populations from Israel, Brown and
Munday (1982) showed that Iranian landraces pos-
sessed a 73% of genetic diversity, and suggested a rank
in terms of allozyme diversity, wild barley [ land-
races [ composite crosses. Contrary to a common
0.01 0.03 0.05 0.07 0.09
TB
SY
EU
NA
AU
SA
Fig. 3 The genetic relationships among the six barley
populations calculated using UPGMA method based on the
Nei’s (1972) genetic distance
38 Euphytica (2011) 178:31–43
123

Table 2 SSR markers associated with 15 traits and chromosome location
Traitsa Alleles R2b p-Mc p-Pd p-adje Chromosome
LA Bmag394 0.0849 \0.0001 0.0001 0.00014 5HS
LA Ebmac871 0.0804 0.0006 0.0006 0.0293 3HS
LA Bmac213 0.111 0.0001 0.0002 0.0043 1HL
LA Bmag718 0.1011 \0.0001 0.0001 0.0001 1HL
SD HVM30 0.1283 \0.0001 0.0001 0.0001 5HL
GPP HVM30 0.0699 0.0003 0.0007 0.0127 5HL
GPP Ebmac658 0.067 0.0004 0.0013 0.024 4HL
GPP Bmac167 0.0629 0.0006 0.0005 0.0278 7HS
FGPP Ebmac705 0.1013 0.0002 0.0025 0.0101 3HS
GWP Bmac167 0.0599 0.0007 0.0006 0.0369 7HS
PH HVM30 0.0781 \0.0001 0.0001 0.0001 5HL
PH Ebmac705 0.1054 \0.0001 0.0002 0.0001 3HS
PH Ebmac871 0.0826 \0.0001 0.0002 0.0001 3HS
PH HVM2 0.0459 0.0014 0.001 0.0927 1HL
PH Bmag718 0.0518 0.0006 0.0008 0.0408 1HL
PH Bmag867 0.0827 \0.0001 0.0001 0.0001 6HL
PH Bmac167 0.0537 0.0005 0.0002 0.0224 7HS
SMS HVM30 0.1392 \0.0001 0.0001 0.0001 5HL
SMS Bmag394 0.0866 \0.0001 0.0003 0.0001 5HS
SMS Bmac84 0.1006 \0.0001 0.0002 0.0001 4HL
GMS HVM30 0.1291 \0.0001 0.0001 0.0001 5HL
GMS Bmag394 0.0634 0.0008 0.001 0.0493 5HS
GMS Bmac213 0.115 0.0001 0.0002 0.0041 1HL
GMS Hvm68 0.065 0.0007 0.0005 0.0339 4HL
GMS Bmac84 0.1054 \0.0001 0.0001 0.0001 4HL
GWMS HVM30 0.0748 0.0004 0.0001 0.0037 5HL
GWMS Ebmac684 0.0771 0.0002 0.0003 0.0052 5HL
GWMS Bmag394 0.0971 \0.0001 0.0001 0.0001 5HS
GWMS Bmac213 0.1061 0.0002 0.0001 0.0043 1HL
GWMS Ebmac640 0.1099 \0.0001 0.0008 0.0001 2HS
GWMS Bmac84 0.0661 0.0006 0.0006 0.0288 4HL
LMS Ebmac640 0.1107 \0.0001 0.0029 0.0001 2HS
DMS Bmac90 0.1748 \0.0001 0.0001 0.0001 1HS
DMS HVM2 0.1184 \0.0001 0.0001 0.0001 1HL
DMS Ebmac501 0.159 \0.0001 0.0001 0.0001 1HS
DMS Bmac213 0.0898 0.0005 0.0004 0.0273 1HL
LFIN HVM30 0.0673 \0.0001 0.0001 0.0001 5HL
LFIN Ebmac705 0.0932 \0.0001 0.0001 0.0001 3HS
LFIN Ebmac871 0.0707 \0.0001 0.0002 0.0001 3HS
LFIN Hvm54 0.0538 \0.0001 0.0001 0.0001 2HL
LFIN Bmac167 0.0472 0.0002 0.0004 0.0107 7HS
LSN HVM30 0.0933 \0.0001 0.0001 0.0001 5HL
LSN Ebmac705 0.0671 0.0006 0.0007 0.0318 3HS
LSN Ebmac871 0.1265 \0.0001 0.0001 0.0001 3HS
Euphytica (2011) 178:31–43 39
123

impression, electrophoretic assay for genetic diversity
at 16 isozyme loci in wild barley and indigenous
primitive varieties of cultivated barley collected from
43 locations in four eastern Mediterranean countries,
Jordan, Syria, Turkey and Greece, did not reveal a
significant excess of diversity in wild barley (Jana and
Pietrzak 1988). A comparative analysis of genetic
polymorphism in wild and cultivated barley from
Tibet using isozyme and ribosomal DNA markers indi-
cated that little genetic differentiation was detected
among the three barley groups (H. vulgare ssp.
vulgare, H. vulgare ssp. agriocrithon, and H. vulgare
ssp. spontaneum) (Zhang et al. 1994).
The UPGMA dendrogram grouped the 175 barley
accessions into two mega-groups. Among the 40
accessions of Tibet wild barley, 26 (65%) accessions
were grouped into mega-group II, and the other 14
(35%) belonged to mega-group I. No clear separation
of grouping between wild barley and cultivated
barley was detected. This is in consistent to the
similar study (Matus and Hayes 2002), in which wild
barley accessions were clustered into multiple groups
and associated with other barley varieties. Certain
degree of divergence between two-row and six-row
barley types was observed in our survey. Subgroup
IA-c contained six-row USA barley. IA-d group
consists of 10 two-row and 2 six-row barley acces-
sions. IC-a group is composed of 41 accessions
originated from different geographic origins, in
which all of them are two-row barley except acces-
sion 080 and 0164. All the 9 accessions in IC-b group
are six-row barley. The similar tendency of grouping
was also reported by Matus and Hayes (2002). The
number of fertile florets per rachis node (two-row vs.
six-row), which was controlled by two major gene
loci, the vrs1 locus located in the centromeric region
of chromosome 2 (2H) and int-c on the short arm of
chromosome 4 (4H) (Franckowiak and Lundqvist
1997; Lundqvist and Franckowiak 1997), defines the
two major germplasm groups within cultivated
Hordeum.
As indicated in Fig. 2, North American two-row
barley and six-row barley accessions were separated
from each other (IA-c, IA-d, IC-a and IC-b). Our
result is consistent to the finding of Matus and Hayes
(2002), and further confirms that the North American
two-row and six row malting barley germplasm pools
have distinct profiles (Marquez-Cedillo et al. 2000).
Matus and Hayes (2002) found that the North
America two-row malting varieties are distinct from
the two-row malting accessions from Japan, Austra-
lia, and Europe. In our survey, part of two-row North
America barley accessions were clustered into multi-
ple groups and associated with two-row barley
accession originated from Europe, Australia, Syria,
and South America.
At population level, UPGMA-dendrogram based on
Nei’s original genetic distance showed that North
America barley is closely related to Europe barley.
Australia barley population is sister to Europe and
North America barley populations (Fig. 3). An expla-
nation might be that North American cultivars and
European cultivars have common ancestors. North
American varieties were originally introduced from
Table 2 continued
Traitsa Alleles R2b p-Mc p-Pd p-adje Chromosome
LSN HVM2 0.051 0.0003 0.0002 0.0089 1HL
LSN Hvm54 0.0574 0.0001 0.0002 0.0044 2HL
LSN AWBMS22 0.0808 0.0001 0.0002 0.0042 7HL
AL HVM11 0.1241 \0.0001 0.0003 0.0001 6HS
Number of permutations run = 10,000a LA leaf area; SD stem diameter; GPP grains per plant; FGPP filled grains per plant; GWP grain weight per plant; PH plant height;
SMS spiklets on main spike; GMS grains on main spike; GWMS grain weight on main spike; LMS length of main spike; DMS density
of main spike; LFIN length of the 1st internode; LSN length of spike neck; AL awn lengthb R2: the fraction of the total variation explained by the marker after fitting the other model effectsc p-M: probability based on the F test for specific markersd p-P: the permutation based test for marker significance of individual markerse p-adj: the experiment-wise P value for marker significance that controls the error-rate for the entire set of hypotheses
40 Euphytica (2011) 178:31–43
123
European within the past 100 years. The study of
Fischbeck (2003) stated that barley seeds were intro-
duced to North America from many countries, espe-
cially from Central, Northern, and Eastern Europe. In
most cases, there has been little germplasm infusion
from outside North America since the initial introduc-
tions (Matus and Hayes 2002).
The molecular marker data present here can provide
an opportunity to examine preliminary evidence for
marker-trait associations. The challenge in association
analysis is to separate the population structure from the
genetic linkage as causes for marker-trait association.
The 175 accessions were artificially divided into six
populations according to their origins for genetic
analysis, however, no trait-associated markers were in
the set of markers discriminating the six populations,
so we can concluded that identified marker-trait
associations were not a consequence of population
structure, but very probably were indeed caused by
linkage (Kraakman et al. 2004).
Association between markers and traits was tested
in three ways. Markers were considered to be
associated with the traits only when the markers are
significant (P \ 0.05) in all the three tests, F test,
permutation-based test, and experiment-wise test. In
the aspect of traits analyzed, the following 10
markers were associated with more than 2 traits:
Hvm30 (was associated with SD, GPP, PH, SMS,
GMS, GWMS, LFIN and LSN); Both Bmag394 (LA,
SMS, GMS, and GWMS); Ebmac871 (with LA, PH,
LFIN, and LSN); Bmac213 (LA, GMS, GWMS and
DMS); Ebmac705 (FGPP, PH, LFIN and LSN);
HVM2 (PH, DMS and LSN), and Bmac84 (SMS,
GMS and GWMS). These markers could be of great
use to correlate traits that were not reported to be
correlated or to support a correlation between traits
that was suspected or need more investigation. For
example, all the four markers, Bmag394 (5H),
Bmag394 (5H), HVM30 (5H) and Bmac84 (4H) were
associated with SMS, GMS and GWMS, suggesting
that these three traits might correlate to each other.
The markers significantly associated with traits
were compared to the markers associated QTL
identified in barley (http://grain.jouy.inra.fr/GG2/
Barley/).Up to date, 63 markers significantly associ-
ated with plant height (PH) have been identified. The
QTLs controlling PH were located on chromosome
1H to 7H. Our association mapping has identified 7
markers associated with PH, which located on
chromosome 1H, 3H, 5H, 6H and 7H. Two loci on
3HS associated with PH gave higher percentage of
the total variation explained by each marker. The
dwarfing gene uzu, and denso were mapped onto the
region of chromosome 3HL (Laurie et al. 1993:
Zhang 2003). Wang et al. (2010) identified two QTLs
controlling plant height on 3HL. Comparison with the
consensus map, the positions of two markers identi-
fied here are different from those reported in previous
studies. Eighteen markers located on chromosome 1H
to 7H have found to be significantly associated with
GWP previously. Our association analysis revealed
that Bmac167 on 7H was associated with GWP. Our
survey detected 5 markers associated with GMS
which are different from the 9 markers reported
(http://grain.jouy.inra.fr/GG2/Barley/). Six markers
on 2H and 6H associated with LFIN have been
identified. In present study, we found, with aid of
association mapping, that 5 SSR loci on 2H, 3H and
5H were significantly associated with LFIN. Up to 28
markers located on 1H to 7H were associated with
grain weight/spike. As shown in Table 2, six loci on
1H, 2H, 4H and 5H were found to be associated with
GWMS. In addition to the four loci on 2H associated
with stem diameter, we detected another one loci on
5HL associated with this trait.
Previous studies demonstrated that both QTL
analysis and association mapping are suitable tools
for mapping quantitative loci in barley (Bezant et al.
1997; Kraakman et al. 2004; Cockram et al. 2008;
Stracke et al. 2009). We found 18 loci associated with
14 quantitative traits using heterogeneous population
for association mapping. According to Breseghello
and Sorrells (2006) and Peng et al. (2009), the
markers identified via association mapping need to
be validated for individual cultivars involved in
crosses before they can be applied to marker-assisted
selection in the progeny.
Acknowledgments This project is supported by the National
Natural Science Foundation of China (30630047) and China
863 Project (2006AA10Z1C3).
References
Achleitner A, Tinker NA, Zechner E, Buerstmayr H (2008)
Genetic diversity among oat varieties of worldwide origin
and associations of AFLP markers with quantitative traits.
Theor Appl Genet 117:1041–1053
Euphytica (2011) 178:31–43 41
123

Anderson JA, Churchill GA, Autrique JE, Tanksley SD,
Sorrells ME (1993) Optimizing parental selection for
genetic linkage maps. Genome 36:181–186
Becker J, Heum M (1995) Barley microsatellites: alleles var-
iation and mapping. Plant Mol Biol 27:835–845
Bezant J, Laurie D, Pratchett N, Chojecki J, Kearsey M (1997)
Mapping QTL controlling yield and yield components in a
spring barley (Hordeum vulgare L.) cross using marker
regression. Mol Breed 3:29–38
Breseghello F, Sorrells ME (2006) Association mapping of
kernel size and milling quality in wheat (Triticum aes-tivum L.) cultivars. Genetics 172:1165–1177
Brown AHD, Munday J (1982) Population genetic structure
and optimal sampling of land races of barley from Iran.
Genetica 58:85–96
Brucher H, Aberg E (1950) Die-primitiv-gersten des hochlands
von Tibet, ihre bedeutung fuer die zuechtung und das
verstandis des ursprungs und der klassifizierung der ger-
sten. Ann KGL Landwei Hochsch Schwedens 17:247–319
Caldwell KS, Russell J, Langridge P, Powell W (2006)
Extreme population-dependent linkage disequilibrium
detected in an inbreeding plant species, Hordeum vulgare.
Genetics 172:557–567
Cho YG, Ishii T, Temnykh S, Chen X, Lipovich L, McCouch
SR, Park WD, Ayres N, Cartihour S (2000) Diversity of
microsatellites derived from genomic libraries and Gen-
Bank sequences in rice (Oryza sativa L.). Theor Appl
Genet 100:713–722
Cockram J, White J, Leigh FJ, Lea VJ, Chiapparino E, Laurie
DA, Mackay IJ, Powell W, O’Sullivan MO (2008)
Association mapping of partitioning loci in barley. BMC
Genet 9:16
Dawson IK, Chalmers KJ, Waugh R, Powell W (1993)
Detection genetic variation in Hordeum spontaneumpopulations from Israel using RAPD markers. Mol Ecol
2:51–59
Dizkirici A, Guren HE, Onde S, Temel F, Akar T, Budak H,
Kaya Z (2008) Microsatellite (SSR) variation in barley
germplasm and its potential use for marker assisted
selection in scald resistance breeding. Int J Integr Biol
4:9–15
Feng ZY, Zhang LL, Zheng YZ, Ling HQ (2006) Genetic
diversity and geographical differentiation of cultivated
six-rowed naked barley landraces from Qinghai-Tibet
plateau of China detected by SSR analysis. Genet Mol
Biol 29:330–338
Fischbeck G (2003) Diversification through breeding. In: von
Bothmer R, van Hintum T, Knupffer H, Sato K (eds)
Diversity in barley. Elsevier Science, Amsterdam, pp 29–50
Franckowiak JD, Lundqvist U (1997) BGS 6, six-rowed spike
1, vrs1. Barley Genet Newsl 26:49–50
Frank RB, Ana GBM (2001) RAPD data do not support a
second center of barley domestication in Morocco. Genet
Resour Evol 48:13–19
Graner A, Siedler H, Jahoor A, Herrmann RG, Wenzel G
(1990) Assessment of the degree and the type of restric-
tion fragment length polymorphism in barley (Hordeumvulgare). Theor Appl Genet 80:826–832
Gupta PK, Rustgi S, Kulwal PL (2005) Linkage disequilibrium
and association studies in higher plants: present status and
future prospects. Plant Mol Biol 57:461–485
Harlan JR (1976) Barley. In: Simmonds N (ed) Evolution of
crop plants. Academic Press, London, pp 93–98
Hayes PM, Castro A, Marquez-Cedillo L, Corey A, Henson C,
Jones B, Kling J, Mather D, Matus I, Rossi C, Sato K
(2003) Genetic diversity for quantitatively inherited
agronomic and malting quality traits. In: Von Bothmer R,
Knupfeer H, van Hintum T, Sato K (eds) Diversity barley.
Elsevier Science Publishers, Amsterdam, The Netherlands
Igartua E, Casas AM, Ciudad F, Montoya JL, Romagosa I
(1999) RFLP markers associated with major genes con-
trolling heading date evaluated in a barley germplasm
pool. Heredity 83:551–559
Ivandic V, Hackett CA, Nevo E, Keith R, Thomas WT, Forster
BP (2002) Analysis of simple sequence repeats (SSRs) in
wild barley from the Fertile Crescent: associations with
ecology, geography and flowering time. Plant Mol Biol
48:511–527
Ivandic V, Thomas WTB, Nevo E, Zhang Z, Forster BP (2003)
Association of SSRs with quantitative trait variation
including biotic and abiotic stress tolerance in Hordeumspontaneum. Plant Breed 122:300–304
Jana S (1999) Some recent issues on the conservation of crop
genetic resources in developing countries. Genome
44:562–569
Jana S, Pietrzak LN (1988) Comparative assessment of genetic
diversity in wild and primitive cultivated barley in a
center of diversity. Genetics 119:981–990
Karakousis A, Gustafson JP, Chalmers KJ, Barr AR, Langridge
P (2003) A consensus map of barley integrating SSR,
RFLP, and AFLP markers. Aust J Agric Res 54:1173–
1185
Kimura M, Crow JF (1964) The number of alleles that can be
maintained in a finite population. Genetics 49:725–738
Kraakman ATW, Niks RE, Van den Berg PMMM, Stam P, van
Eeuwijk FA (2004) Linkage disequilibrium mapping of
yield and yield stability in modern spring barley cultivars.
Genetics 168:435–446
Kresovich S, Szewe-McFadden AK, Bliek SM, McFerson JR
(1995) Abundance and characterization of simple
sequence repeats (SSRs) isolated from a size fractionated
genomic library of Brassica napus L. (rapeseed). Theor
Appl Genet 91:206–211
Laurie DA, Pratchett N, Romero C, Simpson E, Snape JW
(1993) Assignment of the denso dwarfing gene to the long
arm of chromosome 3(3H) of barley by use of RFLP
markers. Plant Breed 111:198–203
Liu ZW, Biyashev RM, Saghai-Maroof MA (1996) Develop-
ment of simple sequence repeat DNA markers and their
integration into a barley linkage map. Theor Appl Genet
93:869–876
Lundqvist U, Franckowiak JD (1997) BGS 178, intermedium
spike-c, int-c. Barley Genet Newsl 26:200–201
Malysheva-Otta LV, Ganal MW, Roder MS (2006) Analysis of
molecular diversity, population structure and linkage
disequilibrium in a worldwide survey of cultivated barley
germplasm (Hordeum vulgare L.). BMC Genet 7:6
Marquez-Cedillo LA, Hayes PM, Jones BL, Kleinhofs A,
Legge WG, Rossnagel BG, Sato K, Ullrich SE, Wesen-
berg DM, The North American Barley Genome Mapping
Project (2000) QTL analysis of malting quality in barley
based on the double haploid progeny of two elite North
42 Euphytica (2011) 178:31–43
123

American varieties representing different germplasm
groups. Theor Appl Genet 101:173–184
Matus I, Hayes PM (2002) Genetic diversity in three groups of
barley germplasm assessed by simple sequence repeats.
Genome 45:1095–1106
Nei M (1972) Genetic distance between populations. Am Nat
106:283–292
Nei M (1973) Analysis of gene diversity in subdivided popu-
lations. Proc Natl Acad Sci USA 70:3321–3323
Nordborg M, Borevitz JO, Bergelson J, Berry CC, Chory J,
Hagenblad J, Kreitman M, Maloof JN, Noyes T, Oefner
PJ, Stahl EA, Weigel D (2002) The extent of linkage
disequilibrium in Arabidopsis thaliana. Nat Genet
30:190–193
Peng JH, Bai Y, Haley SD, Lapitan NLV (2009) Microsatel-
lite-based molecular diversity of bread wheat germplasm
and association mapping of wheat resistance to the Rus-
sian wheat aphid. Genetica 135:95–122
Petersen L, Østergard H, Giese H (1994) Genetic diversity
among wild and cultivated barley as revealed by RFLP.
Theor Appl Genet 89:676–681
Pillen K, Binder A, Kreuzkam B, Ramsay L, Waugh R, Forster
J, Leon J (2000) Mapping new EMBL-derived barley
microsatellites and their use to differentiate German bar-
ley cultivars. Theor Appl Genet 101:652–660
Prichard JK, Stephens M, Donnelly P (2000) Inference of
population structure using multilocus genotype data.
Genetics 155:945–959
Ramsay L, Macaulay M, degli Ivanissevich S, MacLean K,
Cardle L, Fuller J, Edwards KJ, Tuvesson S, Morgante M,
Massari A, Maestri E, Marmiroli N, Sjakste T, Ganal M,
Powell W, Waugh R (2000) A simple sequence repeat-
based linkage map of barley. Genetics 156:1997–2005
Russell JR, Fuller JD, Young G, Thomas B, Taramino G,
Macaulay M, Waugh R, Powell W (1997) Discriminating
between barley genotypes using microsatellite markers.
Genome 40:442–450
Saghai-Maroof MA, Biyashev RM, Yang GP, Zhang Q, Allard
RW (1994) Extraordinarily polymorphic microsatellite
DNA in barley: species diversity, chromosomal locations,
and population dynamics. Proc Natl Acad Sci USA
91:5466–5470
Shannon CE, Weaver W (1949) The mathematical theory of
communication. University of Illinois Press, Urbana, IL
Stein N, Herren G, Keller B (2001) A new DNA extraction
method for high-throughput marker analysis in a large-
genome species such as Triticum aestivum. Plant Breed
120:354–356
Stracke S, Haseneyer G, Veyrieras JB, Geiger HH, Sauer S,
Graner A, Piepho HP (2009) Association mapping reveals
gene action and interactions in the determination of
flowering time in barley. Theor Appl Genet 118:259–273
Struss D, Plieske J (1998) The use of microsatellite markers for
detection of genetic diversity in barley populations. Theor
Appl Genet 97:308–315
Turpeinen T, Vanhala T, Nevo E, Nissila E (2003) AFLP genetic
polymorphism in wild barley (Hordeum spontaneum)
populations in Israel. Theor Appl Genet 106:1333–1339
Varshney RK, Marcel TC, Ramsay L, Russell J, Roder MS, Stein
N, Waugh R, Langridge P, Niks RE, Graner A (2007) A
high density barley microsatellite consensus map with 775
SSR loci. Theor Appl Genet 114(6):1091–1103
Vavilov NI (1926) Studies on the origin of cultivated plants.
Bull Appl Bot Genet Plant Breed USSR 16:1–248
Wang J, Yang J, McNeil DL, Zhou MX (2010) Identification
and molecular mapping of a dwarfing gene in barley
(Hordeum vulgare L.) and its correlation with other
agronomic traits. Euphytica 175:331–342
Williams K, Bogacki P, Scott L, Karakousis A, Wallwork H
(2008) Mapping of a gene for leaf scald resistance in
barley line ‘B87/14’ and validation of microsatellite and
RFLP markers for marker-assisted selection. Plant Breed
120:301–304
Yeh FC, Yang RC (2000) POPGENE version 1.32. University
of Albert and Center for International Research. http://
www.ualberta.ca/*fyeh/
Zhang J (2003) SSR maker tagging of the dwarfing gene uz in
barley (Hordeum velgare L.). Acta Agronom Sin 29:
637–640
Zhang QF, Yang GP, Dai XK, Sun JZ (1994) A comparative
analysis of genetic polymorphism in wild and cultivated
barley from Tibet using isozyme and ribosomal DNA
markers. Genome 37:631–638
Zondervan KT, Cardon LR (2004) The complex interplay
among factors that influence allelic association. Nat Rev
Genet 5:89–100
Euphytica (2011) 178:31–43 43
123