QTL mapping of the production of wine aroma compounds by yeast
Detection and validation of novel QTL for shoot and roottraits in barley (Hordeum vulgare L.)
Md. Arifuzzaman • Mohammed A. Sayed •
Shumaila Muzammil • Klaus Pillen •
Henrik Schumann • Ali Ahmad Naz • Jens Leon
Received: 2 December 2013 / Accepted: 22 May 2014
� Springer Science+Business Media Dordrecht 2014
Abstract Shoot and root attributes are essential for
plant performance in agriculture. Here, we report
detection and validation of quantitative trait loci
(QTL) for shoot and root traits in 301 BC2DH lines
achieved by crossing cultivar Scarlett and wild barley
accession ISR42-8. Phenotypic evaluations were
made for six traits across 3 years under control and
drought conditions. QTL analysis was performed
using 371 DNA markers genotyped by different
protocols, such as sequence repeats, diversity array
technology as well as gene-specific markers. Marker
by trait analysis revealed 33 QTL of which 15 and 18
QTL showed trait-improving effects of the exotic and
elite alleles, respectively. Two major QTL for plant
height (PH) were found on chromosome 2H
(QPh.S42.2H) and 3H (QPh.S42.3H.b). The strongest
QTL QSdw.S42.5H for increasing shoot dry weight
was associated with an exotic allele on chromosome
5H. QTL QTkw.S42.1H underlie a novel exotic allele
that improved thousand kernel weight. Seven QTL
were associated with root dry weight of which at four
loci introgression of exotic alleles enhanced traits
values. The strongest QTL QRdw.S42.7H was linked
to a gene-specific marker VrnH3 on chromosome 7H.
At QRl.S42.5H, the exotic allele accounted for a 9 %
increase in root length. In addition, 18 epistatic
interactions were linked to PH, shoot and root dry
weights. QTL validation was performed with 53
introgression lines (ILs) carrying ISR42-8 introgres-
sions in the Scarlett background. Nine novel QTL
alleles of exotic origin were validated in the isogenic
background. These QTL-bearing ILs provide valuable
genetic resources for plant breeding and positional
cloning of the underlying genes.
Keywords QTL analysis � QTL validation � Shoot
traits � Root traits �Wild barley
Key message
Wild barley bears unique alleles for agronomic and
adaptive traits. Here, we report the detection, valida-
tion and introgression of valuable exotic QTL alleles
in the cultivated background for their utility in basic
and applied research.
Introduction
Barley (Hordeum vulgare ssp. vulgare L.) is one of the
seven internationally grown cereal grains, currently
Md. Arifuzzaman � M. A. Sayed � S. Muzammil �H. Schumann � A. A. Naz (&) � J. Leon
Crop Genetics and Biotechnology Unit, Institute of Crop
Science and Resource Conservation, University of Bonn,
Katzenburgweg 5, 53115 Bonn, Germany
e-mail: [email protected]
K. Pillen
Plant Breeding, Institute of Agricultural and Nutritional
Sciences, Martin-Luther-University Halle-Wittenberg,
Betty-Heimann-Str. 3, 06120 Halle, Germany
123
Mol Breeding
DOI 10.1007/s11032-014-0122-3
ranking fourth in production behind maize, rice and
wheat. Its production was approximately 129.9 million
metric tons in 2012 while cultivated on 51.05 million
hectares worldwide (Anonymous 2012). Drought
stress is by far the biggest bottleneck in its cultivation
that affects around 45 % of the world agricultural
lands continuously or frequently and causes dramatic
yield losses up to 50 % (Bot et al. 2000; Jenks and
Hasegawa 2005). Therefore, development of the
improved barley cultivars for drought/rainfed envi-
ronments is highly demanding to reduce the gaps in
food production and consumption.
Barley plant develops multiple shoots called tillers
above ground and a network of fibrous roots below
ground. This root system comprises of seminal and
adventitious roots that develop from the embryo’s
radical and from the base of each tiller, respectively. A
direct positive correlation has been reported between
the shoot and root growth in barley (Naz et al. 2012).
Under drought, limited shoot growth is a rule rather
than exception and generally plants reduce number
and area of leaves to cut down their water budget
(Schuppler et al. 1998). Roots are the first organs that
sense water deficit conditions and pass this signal to
shoot via chemical or hydraulic signals transduction
which leads to early drought adaptive changes, such as
growth retardation and carbon assimilation, synthesis
of growth hormone abscisic acid, stomatal closure.
(Davies et al. 2002; Schachtman and Goodger 2008).
Unlike shoot, roots can grow even under drought
conditions, and therefore, its growth, density, prolif-
eration and size are the key determinants of drought
stress tolerance in plants. The possession of a deep and
thick root system allows access to water deep in the
soil, which was considered important in determining
drought resistance in upland rice (Kavar et al. 2007). It
has been reported that root–shoot ratio and root
penetration ability were correlated with drought
tolerance (Price et al. 1997; Li et al. 2005). In this
scenario, the wild progenitors of barley revealed an
inherent ability to develop an extensive root system
that may be decisive in their adaptation to rainfed
conditions of the Middle East. This unique variation
may have potential advantages to establish an optimal
root system and sustainability against drought.
Wild barley has often been considered a promising
resource for the improvement of agronomic and
quality traits as well as drought stress tolerance.
Tanksley and Nelson (1996) devised advanced
backcross-quantitative trait loci (AB-QTL) strategy
that allows a targeted transfer of the favorable exotic
alleles into elite breeding material. Through this
approach, specific exotic alleles derived from the
exotic donor are tagged with molecular markers and
tested for association with agronomic traits. In paral-
lel, these QTL alleles can be transferred into near
isogenic lines (NILs) by means of marker-assisted
breeding. Therefore, unlike the conventional QTL
mapping methods, AB-QTL analysis can accelerate
the process of marker-based breeding because the end
products of analysis are close to NILs carrying
favorable alleles. Several studies have been conducted
in barley to introgress the exotic alleles into cultivated
barley for agronomic performance, quality, drought
tolerance and disease resistance. Pillen et al. (2004)
identified favorable QTL effects linked to the wild
barley accession ISR101-23 for quantitative traits,
such as heading, plant height (PH), harvest index,
number of kernels per ear, thousand grain weight,
yield Similarly, Talame et al. (2004) identified favor-
able QTL alleles for agronomic traits from the wild
germplasm under drought environment. Two different
mapping population, recombinant chromosome sub-
stitution lines and double-haploid lines derived from
the cross between cultivar Haruna Nijo (H. vulgare
ssp. vulgare L.) and exotic accession H602 (H.
vulgare ssp. spontaneum), resulted in the identification
of 18 and 24 QTL for nine agronomic traits, respec-
tively. Von Korff et al. (2006) identified 86 putative
QTL for nine shoot traits using a double-haploid
population S42 achieved by crossing spring barley
cultivar Scarlett (H. vulgare ssp. vulgare) and exotic
wild accession ISR42-8 (H. vulgare ssp. spontaneum).
More recently, Schmalenbach et al. (2008) developed
an introgression line (IL) library encompassing the
wild barley (ISR42-8) introgressions in the Scarlett
background and validated effects of the exotic QTL
alleles for agronomic performance and malting quality
(Schmalenbach et al. 2009; Schmalenbach and Pillen
2009). Naz et al. (2012) selected a candidate IL S42IL-
176 for root trait variations among this library and
validated effects of the exotic QTL alleles in the
Scarlett background under control and drought
conditions.
The present study was aimed to: (1) conduct a
genome-wide analyses of QTL associated with shoot
and root traits using 301 BC2DH lines of a cross
between cultivar Scarlett and wild barley accession
Mol Breeding
123
ISR42-8 under control and drought conditions, (2)
dissect the role of digenic epistatic interaction in the
expression of the soot and root traits and (3) validate
QTL effects of the exotic alleles in a set of ILs carrying
ISR42-8 introgressions in the Scarlett background.
Materials and methods
Plant material
A double-haploid mapping population, designated as
S42 comprising of 301 BC2DH lines, was used for
QTL analysis. This population was generated from a
cross between a German spring barley cultivar Scarlett
(H. vulgare ssp. vulgare) and a wild barley accession
ISR42-8 (H. vulgare ssp. spontaneum). The details of
this material can be found in Sayed et al. (2012). From
these 301 BC2DH lines, a library of 53 barley ILs was
established using successive backcrossing with Scar-
lett and marker-assisted selection. The details of these
barley ILs are given in Schmalenbach et al. (2008).
Evaluation of phenotypic traits
Phenotypic evaluations of the S42 population were
made across years 2007, 2008 and 2009 in plastic
foliar tunnels at the Institute of Crop Science and
Resource Conservation, University of Bonn, Ger-
many. The experimental setup and cultural conditions
were according to Sayed et al. (2012).
A validation experiment was arranged in a split-plot
design with 12 replications (shoot traits) and three
replications (root traits) where the treatments (drought
and control) were assigned to the sub-plots in which
lines were assigned randomly. For this, four seeds of
individual BC2DH were sown in plastic pots
(22 9 22 9 26 cm) containing a mixture of top soil,
silica sand, milled lava and peat dust (Terrasoil�,
Cordel and Sohn, Salm, Germany). Water supply was
done with a drip irrigation system (Netafilm, Adelaide,
Australia) by watering pots three times per day. Echo2
sensors (Decagon Dev., Pullman WA, USA) were
used to determine the volumetric moisture content
(VMC) digitally with the frequency domain technique.
The drought stress treatment was carried out after
30 days of vegetative growth at plant development
stage BBCH 29-31 (Lancashire et al. 1991) by
eliminating the water supply completely. The plants
were kept under stress for 26 days till the VMC
reached the maximum drought stress threshold near
wilting point (VMC near to 0 %), whereas the control
block was kept under the continuous supply of
irrigation. Six shoot and root traits were evaluated
which are presented together with their breeding goals
in Table 1.
Genotyping of the S42 population
A total of 301 BC2DH lines were genotyped with 371
DNA markers using simple sequence repeats (SSRs),
diversity array technology (DArT) and gene-specific
marker systems according to Sayed et al. (2012). The
ILs were genotyped using Illumina 1536-SNP array by
Schmalenbach et al. (2011).
Statistical analysis
Statistical analyses were done using the software
package SAS Enterprise 9.2 (SAS Institute 2008). The
Pearson’s correlation coefficient (r) was calculated
with CORR procedure implemented in the SAS
program. Least squares means (Lsmeans) of the
investigated traits were calculated among BC2DH
lines across years for each treatment separately.
QTL analysis is to a great extent a model selection.
Broman and Speed (2002) and Bauer et al. (2009)
compared the forward selection strategy in restricted
maximum likelihood (REML) analysis with Bayesian
techniques and found that the forward selection
strategy is very effective to detect QTL associated
with quantitative traits. Therefore, we employed a
multiple-locus QTL model in which cofactors were
selected by the forward selection strategy and included
iteratively into the mixed model of the PROC MIXED
procedure in SAS (2008). In each of the iterative
rounds of the forward selection procedure, the most
informative marker was added as a fixed factor (QTL)
into the model. Then, all remaining markers were
reanalyzed again with the same model in which the
newly found QTL is now included. The results of the
current iteration were used as starting point of the next
round in the forward selection process. In our multi-
ple-locus QTL model, the iterations were continued
until no more additional QTL could be detected. The
critical threshold for including a marker (QTL) as a
cofactor in the model was the probability of false
discovery rate (PFDR) of P [ 0.05.
Mol Breeding
123
We used the following mixed hierarchical model as
starting point to estimate single-locus QTL effects first:
Xijklm ¼ lþMi þ Lj Mið Þ þ Tk þ Lj � Tk þMi � Tk
þ Yl þ Tk � Yl þ Bm Tk � Ylð Þ þ eijklm ð1Þ
Here, the total phenotypic value Xijklm was the sum of
general mean l, fixed effect Mi of the ith marker,
random effect Lj(Mi) of the jth individual DH line
nested in the ith marker, fixed effect Tk of the kth
treatment, random interaction effect Lj 9 Tk of the jth
DH line and the kth treatment, fixed interaction effect
Mi 9 Tk of the ith marker genotype and the kth
treatment, fixed effect Yl of the lth year, fixed interaction
effect Tk 9 Yl of the kth treatment and lth year, random
effect Bm(Tk 9 Yl) of mth block nested in treatment and
years and residue eijklm. The P values from F tests were
adjusted genome wide across all single-marker tests
using the PFDR. The traits have been measured with
several replications; hence, we used all measurements
(not mean values) in the mixed model analysis.
The term Lj(Mi) represents the genetic background
and as being a random factor, it was used as an error
term for the marker in the statistical tests. The final
model, which can be considered as a conditional model,
was computed after the forward selection procedure.
The model which was used is described below in detail.
Xijklm ¼ lþ RQTLþMi þ Lj Mið Þ þ Tk
þ Lj � Tk þMi � Tk þ Yl þ Tk � Yl
þ Bm Tk � Ylð Þ þ eijklm ð2Þ
Here,P
QTL represents the sum of detected QTL for
main as well as QTL by marker interaction from the
forward selection approach. The contribution of a QTL
to trait genotypic variance was estimated by the R2
coefficient according to von Korff et al. (2006). The
relative performance of an exotic allele RP[Hsp] was
calculated by the formula (RP[Hsp] = [Hsp] - [Hv]/
[Hv] 9 100). [Hsp] and [Hv] denote the Lsmeans of the
homozygous exotic and elite genotypes, respectively.
The digenic epistatic interactions between all DArT
and SSR marker pairs were tested with SAS procedure
MIXED (SAS ver. 9.2, SAS Institute, 2008) using the
following mixed hierarchical model:
Xijklmn ¼ lþ RQTLþM1i þM2j þM1i �M2j
þ Lk M1i �M2j
� �þ Tlþ Lj � Tk þ Ym
þ Tl � Ym þ Bn Tl � Ymð Þ þ eijklm ð3Þ
Here, M1i and M2j are the fixed effects of the ith
marker and jth marker (M2), M1i 9 M2j is the fixed
interaction effect of the ith M1 genotype with jth M2
genotype and Lk(M1i 9 M2j) is the random effect of the
kth BC2DH line nested in the ith M1 and jth M2 marker
genotype interaction. The term Lk(M1i 9 M2j) represents
the genetic background and as being a random factor, it
was used as an error term for the marker in the statistical
tests. Epistatic effects were accepted based on PFDR
(P B 0.05) and has been calculated by PROC MULT-
TEST procedure in SAS (Benjamini and Yekutieli 2005).
Results
Phenotypic characterization of shoot and root traits
Mean comparison of studied traits among S42, Scarlett
and ISR42-8 is presented in Table 2. S42 revealed a
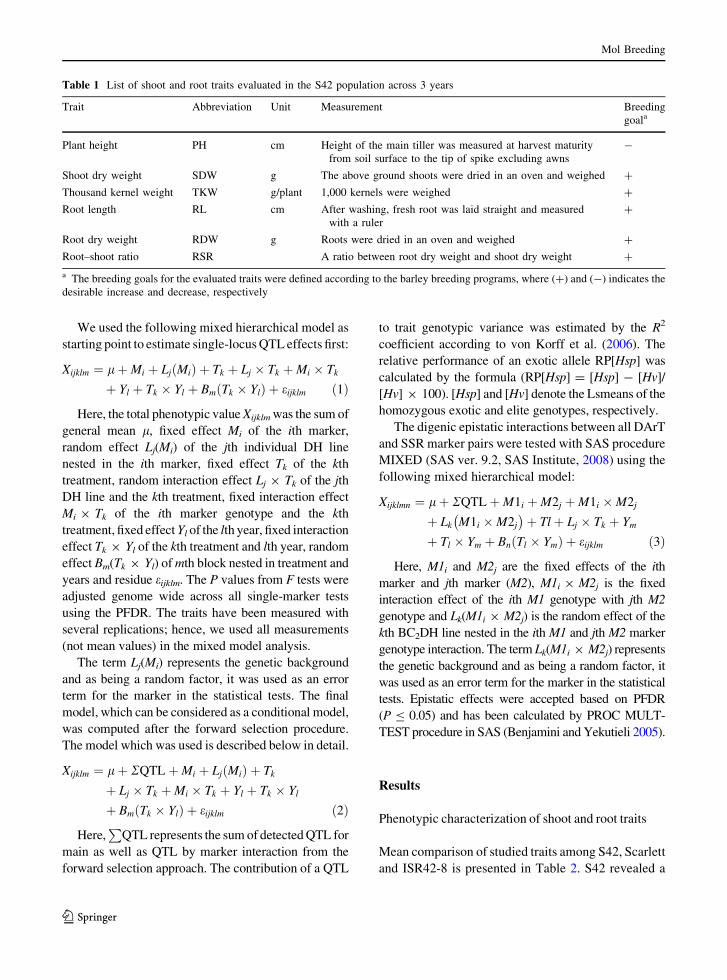
Table 1 List of shoot and root traits evaluated in the S42 population across 3 years
Trait Abbreviation Unit Measurement Breeding
goala
Plant height PH cm Height of the main tiller was measured at harvest maturity
from soil surface to the tip of spike excluding awns
-
Shoot dry weight SDW g The above ground shoots were dried in an oven and weighed ?
Thousand kernel weight TKW g/plant 1,000 kernels were weighed ?
Root length RL cm After washing, fresh root was laid straight and measured
with a ruler
?
Root dry weight RDW g Roots were dried in an oven and weighed ?
Root–shoot ratio RSR A ratio between root dry weight and shoot dry weight ?
a The breeding goals for the evaluated traits were defined according to the barley breeding programs, where (?) and (-) indicates the
desirable increase and decrease, respectively
Mol Breeding
123
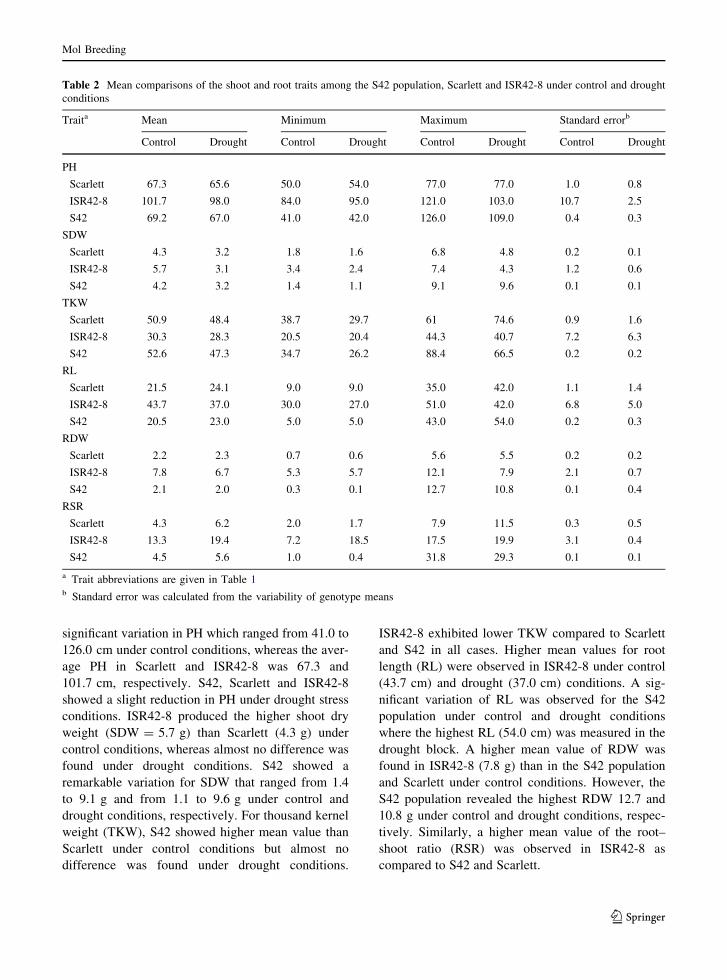
significant variation in PH which ranged from 41.0 to
126.0 cm under control conditions, whereas the aver-
age PH in Scarlett and ISR42-8 was 67.3 and
101.7 cm, respectively. S42, Scarlett and ISR42-8
showed a slight reduction in PH under drought stress
conditions. ISR42-8 produced the higher shoot dry
weight (SDW = 5.7 g) than Scarlett (4.3 g) under
control conditions, whereas almost no difference was
found under drought conditions. S42 showed a
remarkable variation for SDW that ranged from 1.4
to 9.1 g and from 1.1 to 9.6 g under control and
drought conditions, respectively. For thousand kernel
weight (TKW), S42 showed higher mean value than
Scarlett under control conditions but almost no
difference was found under drought conditions.
ISR42-8 exhibited lower TKW compared to Scarlett
and S42 in all cases. Higher mean values for root
length (RL) were observed in ISR42-8 under control
(43.7 cm) and drought (37.0 cm) conditions. A sig-
nificant variation of RL was observed for the S42
population under control and drought conditions
where the highest RL (54.0 cm) was measured in the
drought block. A higher mean value of RDW was
found in ISR42-8 (7.8 g) than in the S42 population
and Scarlett under control conditions. However, the
S42 population revealed the highest RDW 12.7 and
10.8 g under control and drought conditions, respec-
tively. Similarly, a higher mean value of the root–
shoot ratio (RSR) was observed in ISR42-8 as
compared to S42 and Scarlett.
Table 2 Mean comparisons of the shoot and root traits among the S42 population, Scarlett and ISR42-8 under control and drought
conditions
Traita Mean Minimum Maximum Standard errorb
Control Drought Control Drought Control Drought Control Drought
PH
Scarlett 67.3 65.6 50.0 54.0 77.0 77.0 1.0 0.8
ISR42-8 101.7 98.0 84.0 95.0 121.0 103.0 10.7 2.5
S42 69.2 67.0 41.0 42.0 126.0 109.0 0.4 0.3
SDW
Scarlett 4.3 3.2 1.8 1.6 6.8 4.8 0.2 0.1
ISR42-8 5.7 3.1 3.4 2.4 7.4 4.3 1.2 0.6
S42 4.2 3.2 1.4 1.1 9.1 9.6 0.1 0.1
TKW
Scarlett 50.9 48.4 38.7 29.7 61 74.6 0.9 1.6
ISR42-8 30.3 28.3 20.5 20.4 44.3 40.7 7.2 6.3
S42 52.6 47.3 34.7 26.2 88.4 66.5 0.2 0.2
RL
Scarlett 21.5 24.1 9.0 9.0 35.0 42.0 1.1 1.4
ISR42-8 43.7 37.0 30.0 27.0 51.0 42.0 6.8 5.0
S42 20.5 23.0 5.0 5.0 43.0 54.0 0.2 0.3
RDW
Scarlett 2.2 2.3 0.7 0.6 5.6 5.5 0.2 0.2
ISR42-8 7.8 6.7 5.3 5.7 12.1 7.9 2.1 0.7
S42 2.1 2.0 0.3 0.1 12.7 10.8 0.1 0.4
RSR
Scarlett 4.3 6.2 2.0 1.7 7.9 11.5 0.3 0.5
ISR42-8 13.3 19.4 7.2 18.5 17.5 19.9 3.1 0.4
S42 4.5 5.6 1.0 0.4 31.8 29.3 0.1 0.1
a Trait abbreviations are given in Table 1b Standard error was calculated from the variability of genotype means
Mol Breeding
123

Trait correlations
Correlation among studied traits has been listed in
Table 3. PH revealed significant but weak correlation
with SDW under control (0.25) and drought (0.21)
conditions. TKW showed highly significant and strong
correlations under drought but weak correlations
under control conditions with RL, RDW and RSR.
Strong positive correlations were detected between
RL and RDW under control (0.45) and drought (0.68)
conditions. RSR showed highly significant and
positive correlations with RL and RDW in both
control (0.29, 0.81) and drought (0.68, 0.93) condi-
tions, respectively.
QTL analysis
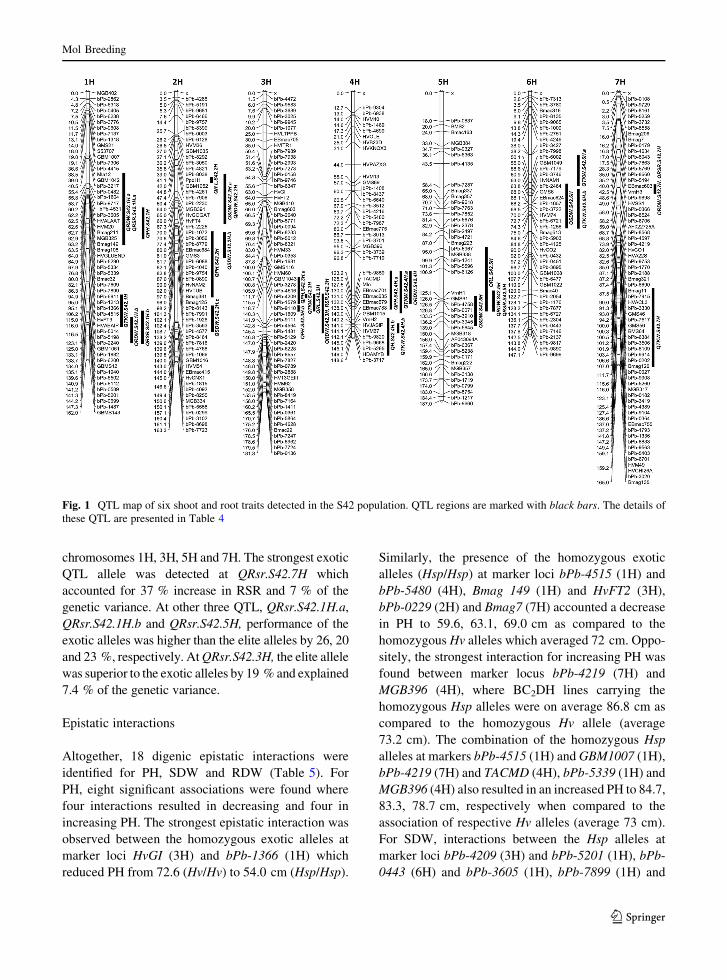
A total of 33 putative QTL were identified for shoot
and root traits of which 15 and 18 QTL alleles were
linked to favorable performance of the exotic and elite
alleles, respectively (Fig. 1; Table 4).
Detection of QTL for shoot traits
The QTL analysis revealed six putative QTL for PH
located on chromosomes 1H, 2H, 3H and 4H. Accord-
ing to relative performance of the exotic allele, three
QTL QPh.S42.2H, QPh.S42.4H.a and QPh.S42.4H.b
resulted in the reduction of PH ranging from 8 to 11 %.
The exotic QTL alleles at QPh.S42.1H, QPh.S42.3H.a
and QPh.S42.3H.b revealed an increase in PH ranging
from 2 to 28 %. The strongest QTL effect
(QPh.S42.3H.b) was linked to marker locus bPb-
9110 that explained huge proportion of the genetic
variance (R2 = 59.2 %) as the marker main effect. The
QTL for SDW were distributed on chromosomes 2H,
5H and 6H. Among these, at QSdw.S42.5H, the exotic
allele revealed an increase in SDW by 11 % and
explained 3.6 % of the genetic variance. Seven QTL
were found for TKW on chromosomes 1H, 3H, 4H, 6H
and 7H. At QTkw.S42.1H, the exotic allele showed a
positive increase in TKW up to 5 % by explaining
7.4 % of the genetic variation. Two minor QTL
QSdw.S42.2H.c and QTkw.S42.6H.b revealed signifi-
cant marker by treatment interactions. The exotic
alleles at these loci were inferior to the elite alleles.
Detection of QTL for root traits
Three QTL for RL located on chromosomes 2H, 3H and
5H. At QRl.S42.2H and QRr.S42.3H, performance of
the elite alleles was higher than the exotic alleles by 15
and 8 %, respectively. At QRl.S42.5H, the exotic allele
was superior to the elite allele by 9 % and explained
1.7 % of the genetic variance. Seven QTL for RDW
were mapped on chromosomes 1H, 2H, 3H, 4H, 5H and
7H. Among these, at QRdw.S42.1H.a, QRdw.S42.1H.b,
QRdw.S42.5H and QRdw.S42.7H, the exotic alleles
increased RDW which ranged from 21 to 42 % and
explained 6.5, 7.9, 4.2 and 6.9 % of the genetic
variance, respectively. QRdw.S42.2H, QRdw.S42.3H
and QRdw.S42.4H revealed the preeminence of elite
allele over the exotic allele which ranged from 13 to
34 %. For RSR, five QTL were detected on
Table 3 Pearson’s correlation coefficients (r) among the shoot and root traits under control and drought conditions
Traita Treatment PH SDW TKW RL RDW
SDW Control 0.25***
Drought 0.21***
TKW Control 0.11** 0.31***
Drought ns -0.22***
RL Control 0.24*** 0.28*** 0.28***
Drought -0.09** -0.06* 0.39***
RDW Control 0.12*** 0.38*** 0.28*** 0.45***
Drought -0.08* ns 0.40*** 0.68***
RSR Control ns -0.13*** 0.09* 0.29*** 0.81***
Drought -0.14*** -0.31*** 0.38*** 0.62*** 0.93***
*, **, *** Significant at \0.05, \0.01 and \0.001 levels of P value, respectivelya The phenotypic traits are defined in Table 1
Mol Breeding
123
chromosomes 1H, 3H, 5H and 7H. The strongest exotic
QTL allele was detected at QRsr.S42.7H which
accounted for 37 % increase in RSR and 7 % of the
genetic variance. At other three QTL, QRsr.S42.1H.a,
QRsr.S42.1H.b and QRsr.S42.5H, performance of the
exotic alleles was higher than the elite alleles by 26, 20
and 23 %, respectively. At QRsr.S42.3H, the elite allele
was superior to the exotic alleles by 19 % and explained
7.4 % of the genetic variance.
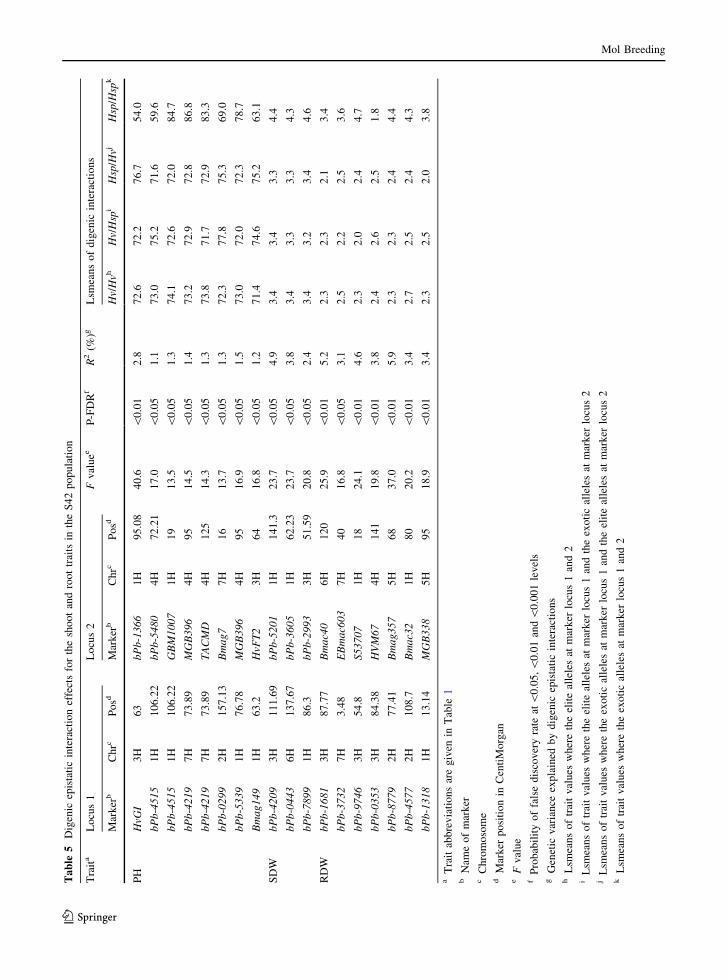
Epistatic interactions
Altogether, 18 digenic epistatic interactions were
identified for PH, SDW and RDW (Table 5). For
PH, eight significant associations were found where
four interactions resulted in decreasing and four in
increasing PH. The strongest epistatic interaction was
observed between the homozygous exotic alleles at
marker loci HvGI (3H) and bPb-1366 (1H) which
reduced PH from 72.6 (Hv/Hv) to 54.0 cm (Hsp/Hsp).
Similarly, the presence of the homozygous exotic
alleles (Hsp/Hsp) at marker loci bPb-4515 (1H) and
bPb-5480 (4H), Bmag 149 (1H) and HvFT2 (3H),
bPb-0229 (2H) and Bmag7 (7H) accounted a decrease
in PH to 59.6, 63.1, 69.0 cm as compared to the
homozygous Hv alleles which averaged 72 cm. Oppo-
sitely, the strongest interaction for increasing PH was
found between marker locus bPb-4219 (7H) and
MGB396 (4H), where BC2DH lines carrying the
homozygous Hsp alleles were on average 86.8 cm as
compared to the homozygous Hv allele (average
73.2 cm). The combination of the homozygous Hsp
alleles at markers bPb-4515 (1H) and GBM1007 (1H),
bPb-4219 (7H) and TACMD (4H), bPb-5339 (1H) and
MGB396 (4H) also resulted in an increased PH to 84.7,
83.3, 78.7 cm, respectively when compared to the
association of respective Hv alleles (average 73 cm).
For SDW, interactions between the Hsp alleles at
marker loci bPb-4209 (3H) and bPb-5201 (1H), bPb-
0443 (6H) and bPb-3605 (1H), bPb-7899 (1H) and
Fig. 1 QTL map of six shoot and root traits detected in the S42 population. QTL regions are marked with black bars. The details of
these QTL are presented in Table 4
Mol Breeding
123
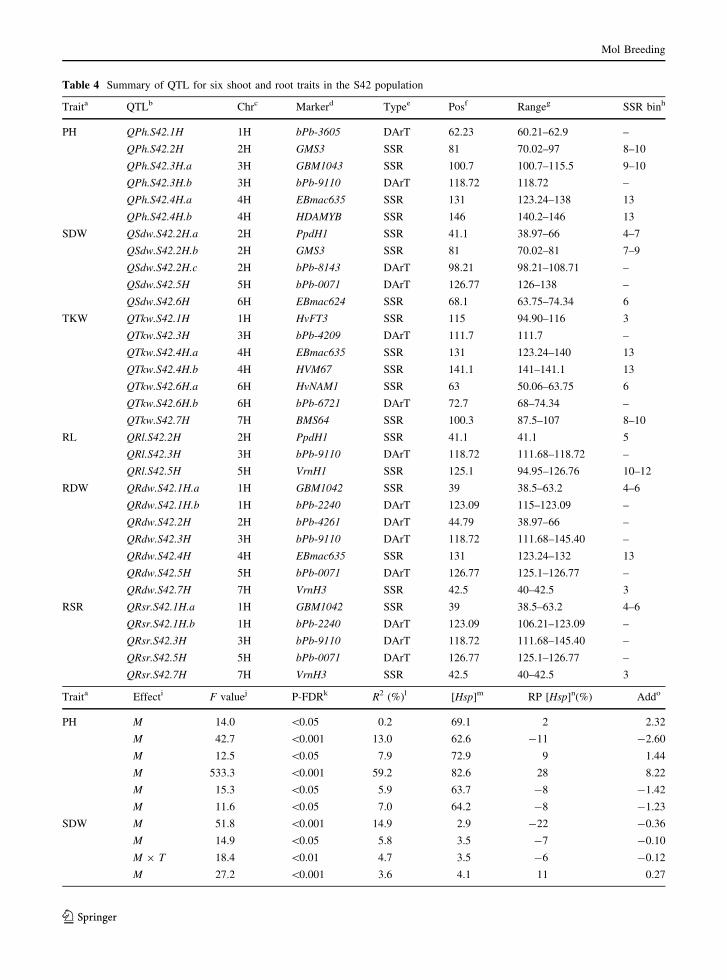
Table 4 Summary of QTL for six shoot and root traits in the S42 population
Traita QTLb Chrc Markerd Typee Posf Rangeg SSR binh
PH QPh.S42.1H 1H bPb-3605 DArT 62.23 60.21–62.9 –
QPh.S42.2H 2H GMS3 SSR 81 70.02–97 8–10
QPh.S42.3H.a 3H GBM1043 SSR 100.7 100.7–115.5 9–10
QPh.S42.3H.b 3H bPb-9110 DArT 118.72 118.72 –
QPh.S42.4H.a 4H EBmac635 SSR 131 123.24–138 13
QPh.S42.4H.b 4H HDAMYB SSR 146 140.2–146 13
SDW QSdw.S42.2H.a 2H PpdH1 SSR 41.1 38.97–66 4–7
QSdw.S42.2H.b 2H GMS3 SSR 81 70.02–81 7–9
QSdw.S42.2H.c 2H bPb-8143 DArT 98.21 98.21–108.71 –
QSdw.S42.5H 5H bPb-0071 DArT 126.77 126–138 –
QSdw.S42.6H 6H EBmac624 SSR 68.1 63.75–74.34 6
TKW QTkw.S42.1H 1H HvFT3 SSR 115 94.90–116 3
QTkw.S42.3H 3H bPb-4209 DArT 111.7 111.7 –
QTkw.S42.4H.a 4H EBmac635 SSR 131 123.24–140 13
QTkw.S42.4H.b 4H HVM67 SSR 141.1 141–141.1 13
QTkw.S42.6H.a 6H HvNAM1 SSR 63 50.06–63.75 6
QTkw.S42.6H.b 6H bPb-6721 DArT 72.7 68–74.34 –
QTkw.S42.7H 7H BMS64 SSR 100.3 87.5–107 8–10
RL QRl.S42.2H 2H PpdH1 SSR 41.1 41.1 5
QRl.S42.3H 3H bPb-9110 DArT 118.72 111.68–118.72 –
QRl.S42.5H 5H VrnH1 SSR 125.1 94.95–126.76 10–12
RDW QRdw.S42.1H.a 1H GBM1042 SSR 39 38.5–63.2 4–6
QRdw.S42.1H.b 1H bPb-2240 DArT 123.09 115–123.09 –
QRdw.S42.2H 2H bPb-4261 DArT 44.79 38.97–66 –
QRdw.S42.3H 3H bPb-9110 DArT 118.72 111.68–145.40 –
QRdw.S42.4H 4H EBmac635 SSR 131 123.24–132 13
QRdw.S42.5H 5H bPb-0071 DArT 126.77 125.1–126.77 –
QRdw.S42.7H 7H VrnH3 SSR 42.5 40–42.5 3
RSR QRsr.S42.1H.a 1H GBM1042 SSR 39 38.5–63.2 4–6
QRsr.S42.1H.b 1H bPb-2240 DArT 123.09 106.21–123.09 –
QRsr.S42.3H 3H bPb-9110 DArT 118.72 111.68–145.40 –
QRsr.S42.5H 5H bPb-0071 DArT 126.77 125.1–126.77 –
QRsr.S42.7H 7H VrnH3 SSR 42.5 40–42.5 3
Traita Effecti F valuej P-FDRk R2 (%)l [Hsp]m RP [Hsp]n(%) Addo
PH M 14.0 \0.05 0.2 69.1 2 2.32
M 42.7 \0.001 13.0 62.6 -11 -2.60
M 12.5 \0.05 7.9 72.9 9 1.44
M 533.3 \0.001 59.2 82.6 28 8.22
M 15.3 \0.05 5.9 63.7 -8 -1.42
M 11.6 \0.05 7.0 64.2 -8 -1.23
SDW M 51.8 \0.001 14.9 2.9 -22 -0.36
M 14.9 \0.05 5.8 3.5 -7 -0.10
M 9 T 18.4 \0.01 4.7 3.5 -6 -0.12
M 27.2 \0.001 3.6 4.1 11 0.27
Mol Breeding
123
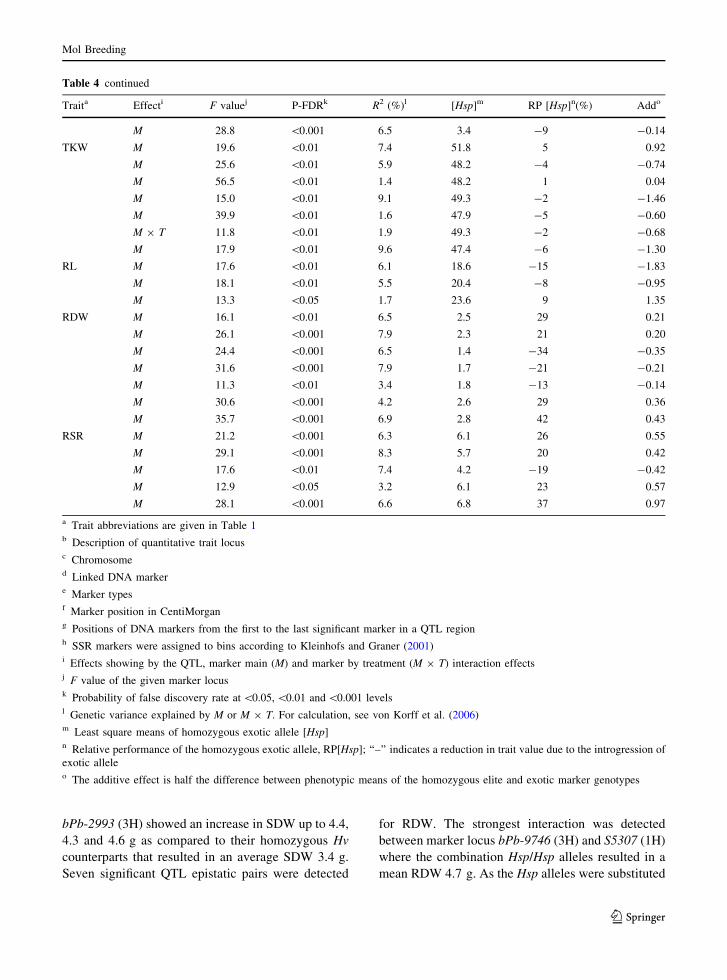
bPb-2993 (3H) showed an increase in SDW up to 4.4,
4.3 and 4.6 g as compared to their homozygous Hv
counterparts that resulted in an average SDW 3.4 g.
Seven significant QTL epistatic pairs were detected
for RDW. The strongest interaction was detected
between marker locus bPb-9746 (3H) and S5307 (1H)
where the combination Hsp/Hsp alleles resulted in a
mean RDW 4.7 g. As the Hsp alleles were substituted
Table 4 continued
Traita Effecti F valuej P-FDRk R2 (%)l [Hsp]m RP [Hsp]n(%) Addo
M 28.8 \0.001 6.5 3.4 -9 -0.14
TKW M 19.6 \0.01 7.4 51.8 5 0.92
M 25.6 \0.01 5.9 48.2 -4 -0.74
M 56.5 \0.01 1.4 48.2 1 0.04
M 15.0 \0.01 9.1 49.3 -2 -1.46
M 39.9 \0.01 1.6 47.9 -5 -0.60
M 9 T 11.8 \0.01 1.9 49.3 -2 -0.68
M 17.9 \0.01 9.6 47.4 -6 -1.30
RL M 17.6 \0.01 6.1 18.6 -15 -1.83
M 18.1 \0.01 5.5 20.4 -8 -0.95
M 13.3 \0.05 1.7 23.6 9 1.35
RDW M 16.1 \0.01 6.5 2.5 29 0.21
M 26.1 \0.001 7.9 2.3 21 0.20
M 24.4 \0.001 6.5 1.4 -34 -0.35
M 31.6 \0.001 7.9 1.7 -21 -0.21
M 11.3 \0.01 3.4 1.8 -13 -0.14
M 30.6 \0.001 4.2 2.6 29 0.36
M 35.7 \0.001 6.9 2.8 42 0.43
RSR M 21.2 \0.001 6.3 6.1 26 0.55
M 29.1 \0.001 8.3 5.7 20 0.42
M 17.6 \0.01 7.4 4.2 -19 -0.42
M 12.9 \0.05 3.2 6.1 23 0.57
M 28.1 \0.001 6.6 6.8 37 0.97
a Trait abbreviations are given in Table 1b Description of quantitative trait locusc Chromosomed Linked DNA markere Marker typesf Marker position in CentiMorgang Positions of DNA markers from the first to the last significant marker in a QTL regionh SSR markers were assigned to bins according to Kleinhofs and Graner (2001)i Effects showing by the QTL, marker main (M) and marker by treatment (M 9 T) interaction effectsj F value of the given marker locusk Probability of false discovery rate at \0.05, \0.01 and \0.001 levelsl Genetic variance explained by M or M 9 T. For calculation, see von Korff et al. (2006)m Least square means of homozygous exotic allele [Hsp]n Relative performance of the homozygous exotic allele, RP[Hsp]; ‘‘–’’ indicates a reduction in trait value due to the introgression of
exotic alleleo The additive effect is half the difference between phenotypic means of the homozygous elite and exotic marker genotypes
Mol Breeding
123
Ta
ble
5D
igen
icep
ista
tic
inte
ract
ion
effe
cts
for
the
sho
ot
and
roo
ttr
aits
inth
eS
42
po
pu
lati
on
Tra
ita
Lo
cus
1L
ocu
s2
Fv
alu
eeP
-FD
Rf
R2
(%)g
Lsm
ean
so
fd
igen
icin
tera
ctio
ns
Mar
ker
bC
hrc
Po
sdM
ark
erb
Ch
rcP
osd
Hv/
Hvh
Hv/
Hsp
iH
sp/H
vjH
sp/H
spk
PH
HvG
I3
H6
3b
Pb-1
36
61
H9
5.0
84
0.6
\0
.01
2.8
72
.67
2.2
76
.75
4.0
bP
b-4
51
51
H1
06
.22
bP
b-5
48
04
H7
2.2
11
7.0
\0
.05
1.1
73
.07
5.2
71
.65
9.6
bP
b-4
51
51
H1
06
.22
GB
M1
00
71
H1
91
3.5
\0
.05
1.3
74
.17
2.6
72
.08
4.7
bP
b-4
21
97
H7
3.8
9M
GB
39
64
H9
51
4.5
\0
.05
1.4
73
.27
2.9
72
.88
6.8
bP
b-4
21
97
H7
3.8
9T
AC
MD
4H
12
51
4.3
\0
.05
1.3
73
.87
1.7
72
.98
3.3
bP
b-0
29
92
H1
57
.13
Bm
ag
77
H1
61
3.7
\0
.05
1.3
72
.37
7.8
75
.36
9.0
bP
b-5
33
91
H7
6.7
8M
GB
39
64
H9
51
6.9
\0
.05
1.5
73
.07
2.0
72
.37
8.7
Bm
ag
14
91
H6
3.2
HvF
T2
3H
64
16
.8\
0.0
51
.27
1.4
74
.67
5.2
63
.1
SD
Wb
Pb
-42
09
3H
11
1.6
9b
Pb-5
20
11
H1
41
.32
3.7
\0
.05
4.9
3.4
3.4
3.3
4.4
bP
b-0
44
36
H1
37
.67
bP
b-3
60
51
H6
2.2
32
3.7
\0
.05
3.8
3.4
3.3
3.3
4.3
bP
b-7
89
91
H8
6.3
bP
b-2
99
33
H5
1.5
92
0.8
\0
.05
2.4
3.4
3.2
3.4
4.6
RD
Wb
Pb
-16
81
3H
87
.77
Bm
ac4
06
H1
20
25
.9\
0.0
15
.22
.32
.32
.13
.4
bP
b-3
73
27
H3
.48
EB
ma
c60
37
H4
01
6.8
\0
.05
3.1
2.5
2.2
2.5
3.6
bP
b-9
74
63
H5
4.8
S5
37
07
1H
18
24
.1\
0.0
14
.62
.32
.02
.44
.7
bP
b-0
35
33
H8
4.3
8H
VM
67
4H
14
11
9.8
\0
.01
3.8
2.4
2.6
2.5
1.8
bP
b-8
77
92
H7
7.4
1B
ma
g3
57
5H
68
37
.0\
0.0
15
.92
.32
.32
.44
.4
bP
b-4
57
72
H1
08
.7B
ma
c32
1H
80
20
.2\
0.0
13
.42
.72
.52
.44
.3
bP
b-1
31
81
H1
3.1
4M
GB
33
85
H9
51
8.9
\0
.01
3.4
2.3
2.5
2.0
3.8
aT
rait
abb
rev
iati
on
sar
eg
iven
inT
able
1b
Nam
eo
fm
ark
erc
Ch
rom
oso
me
dM
ark
erp
osi
tio
nin
Cen
tiM
org
ane
Fv
alu
ef
Pro
bab
ilit
yo
ffa
lse
dis
cov
ery
rate
at\
0.0
5,\
0.0
1an
d\
0.0
01
lev
els
gG
enet
icv
aria
nce
exp
lain
edb
yd
igen
icep
ista
tic
inte
ract
ion
sh
Lsm
ean
so
ftr
ait
val
ues
wh
ere
the
elit
eal
lele
sat
mar
ker
locu
s1
and
2i
Lsm
ean
so
ftr
ait
val
ues
wh
ere
the
elit
eal
lele
sat
mar
ker
locu
s1
and
the
exo
tic
alle
les
atm
ark
erlo
cus
2j
Lsm
ean
so
ftr
ait
val
ues
wh
ere
the
exo
tic
alle
les
atm
ark
erlo
cus
1an
dth
eel
ite
alle
les
atm
ark
erlo
cus
2k
Lsm
ean
so
ftr
ait
val
ues
wh
ere
the
exo
tic
alle
les
atm
ark
erlo
cus
1an
d2
Mol Breeding
123
with Hv, RDW decreased to 2.3 g. Likewise, the
presence of Hsp alleles at marker loci bbPb-8779 (2H)
and Bmag357 (5H), bPb-4577 (2H) and Bmac32 (1H),
bPb-1318 (1H) and MGB338 (5H), bPb-3732 (7H)
and Ebmac603 (7H), bPb-1681 (3H) and Bmac40 (6H)
showed an increase of RDW up to 4.4, 4.3, 3.8, 3.6 and
3.4 g, respectively in comparison with combinations
of the respective Hv alleles that averaged 2.3 g. The
marker loci bPb-0353 (3H) and HVM67 (4H)
accounted a decrease in RDW from 2.4 to 1.8 g due
to the preeminence of homozygous Hv alleles in
comparison with their Hsp counterparts.
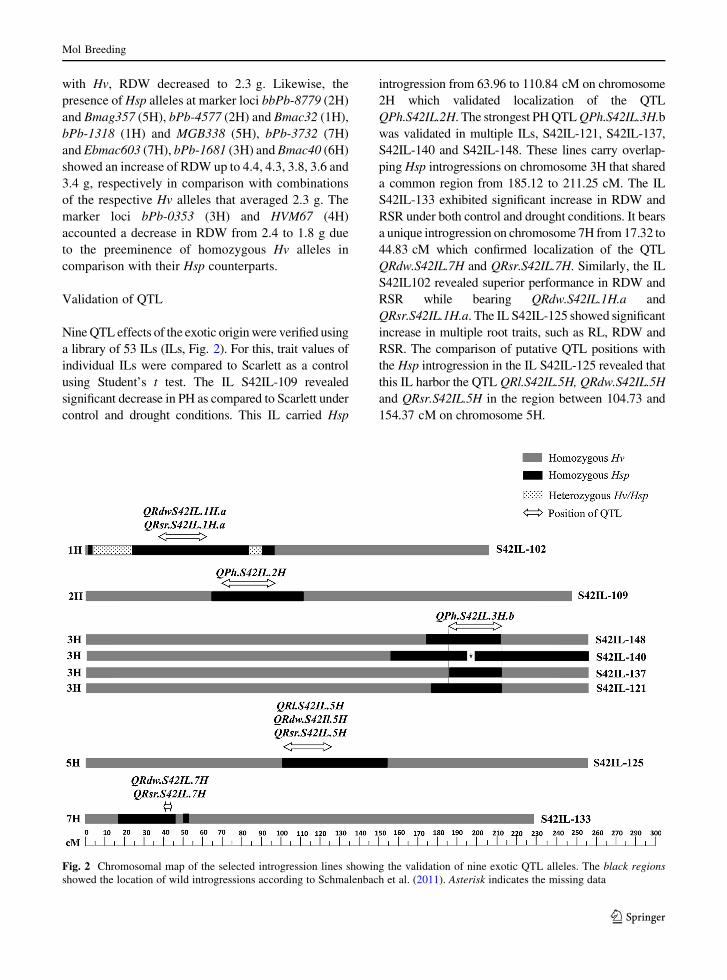
Validation of QTL
Nine QTL effects of the exotic origin were verified using
a library of 53 ILs (ILs, Fig. 2). For this, trait values of
individual ILs were compared to Scarlett as a control
using Student’s t test. The IL S42IL-109 revealed
significant decrease in PH as compared to Scarlett under
control and drought conditions. This IL carried Hsp
introgression from 63.96 to 110.84 cM on chromosome
2H which validated localization of the QTL
QPh.S42IL.2H. The strongest PH QTL QPh.S42IL.3H.b
was validated in multiple ILs, S42IL-121, S42IL-137,
S42IL-140 and S42IL-148. These lines carry overlap-
ping Hsp introgressions on chromosome 3H that shared
a common region from 185.12 to 211.25 cM. The IL
S42IL-133 exhibited significant increase in RDW and
RSR under both control and drought conditions. It bears
a unique introgression on chromosome 7H from 17.32 to
44.83 cM which confirmed localization of the QTL
QRdw.S42IL.7H and QRsr.S42IL.7H. Similarly, the IL
S42IL102 revealed superior performance in RDW and
RSR while bearing QRdw.S42IL.1H.a and
QRsr.S42IL.1H.a. The IL S42IL-125 showed significant
increase in multiple root traits, such as RL, RDW and
RSR. The comparison of putative QTL positions with
the Hsp introgression in the IL S42IL-125 revealed that
this IL harbor the QTL QRl.S42IL.5H, QRdw.S42IL.5H
and QRsr.S42IL.5H in the region between 104.73 and
154.37 cM on chromosome 5H.
Fig. 2 Chromosomal map of the selected introgression lines showing the validation of nine exotic QTL alleles. The black regions
showed the location of wild introgressions according to Schmalenbach et al. (2011). Asterisk indicates the missing data
Mol Breeding
123
Discussion
Trait variation
The S42 population demonstrated significant variation
in the shoot and root traits among 301 BC2DH lines
possibly because it was achieved by crossing two
contrasting parents Scarlett and ISR42-8. Both parents
showed characteristic differences in development of
their shoots and roots under control and drought
conditions (Naz et al. 2012). These features made
them ideal candidates to establish a mapping popula-
tion for genetic analysis of the shoot and root
parameters. It has been reported that resolution of
the QTL mapping depends primarily on phenotypic
difference between the respective parents (Tanksley
1993). Although the wild barley accession ISR42-8
contain detrimental alleles for agronomic traits but
BC2DH lines showed transgression effects for PH,
SDW, RL, RDW and RSR under control and drought
conditions indicating presence of the valuable alleles
for these traits in the wild gene pool. Interestingly,
most shoot traits were influenced by water stress
except RL, RDW and RSR which increased among
individual BC2DH lines under drought conditions. In
this scenario, it is tempting to speculate that intro-
gression of the wild alleles in these BC2DH lines led to
influence the drought adaptive traits, such as RL,
RDW and RSR positively which seems crucial for
drought stress tolerance in barley. The shoot traits
showed significant correlation under control condition
but very weak and negative correlations under drought
conditions possibly due to strong and variable reduc-
tion in the trait values under the extreme conditions of
drought. But TKW showed weak correlation with root
traits under control conditions as compared to drought
putatively due to higher and variable expression of
trait value under control conditions as the recurrent
parent Scarlett is adapted to well water environment.
The BC2DH lines carry major proportion of their
genome from the Scarlett. This expression may be
impaired under drought conditions that lead to stron-
ger correlation of drought adaptive root traits with
TKW. However, root traits were strongly correlated
under both conditions indicating again a root-related
drought adaptation among the S42 population. These
results are in line with Naz et al. (2012) who found
significant positive correlation among root traits, such
as RDW, RL and root volume (RV). Yadav et al.
(1997) who studied root morphology and distribution
in rice also found a strong correlation between RL and
RDW.
QTL localization
PH is a quantitative trait which is controlled by many
genes, including dwarfing, semi dwarfing and many
additional loci (Yu et al. 2010). PH genes have been
mapped to short arm of chromosome 2H (Wang et al.
2010) and long arm of chromosome 4H (Hackett
et al.1992). In the present study, we mapped two QTL
QPh.S42.2H and QPh.S42.4H.b on chromosomes 2H
and 4H which accounted for 11 and 8 % reduction in
PH, respectively. In addition, the QTL QPh.S42.3H.a
and QPh.S42.3H.b were identified on chromosome
3H which associated with increase in PH. Pillen
et al. (2004) reported a QTL on chromosome 3H
which may agree with the chromosomal position
of QPh.S42.3H.a. The exotic allele at QTL
QPh.S42.3H.b showed the strongest increase in Ph
by explaining 59.2 % of the genetic variance. Von
Korff et al. (2006) used a genetic map based on 98 SSR
markers and found a major QTL for PH linked to
marker locus HV13GEIII which explained 19.9 % of
the genetic variance. As we utilized a high-resolution
genetic map based on 371 genetic markers, this QTL
showed linkage to a newly incorporated marker bPb-
9110 which possibly refined the position of this QTL
on chromosome 3H. PH was also influenced by a
number of digenic epistatic interactions where at four
loci the allelic combination of Hsp/Hsp resulted in an
increased PH. Similar to von Korff et al. (2010), these
marker does not appear significant in single-marker
analysis, however, in the combination posed a putative
additive response to enhance PH. The donor of these
exotic alleles, ISR42-8 is taller than the Scarlett which
supports the cumulative response of PH genes from
wild barley. However, individually these genes unable
to contribute significantly because of the prevalence of
respective PH reducing Scarlett alleles in the BC2DH
lines which harbor a major proportion of the Scarlett
genome. This phenomenon partially explains the
presence of transgression effects in BC2DH lines for
PH which may be a concert of PH genes from wild
barley in the presence of useful PH enhancers from
Scarlett.
The strongest QTL for SDW was linked to a gene-
specific marker locus PpdH1 where the preeminence
Mol Breeding
123
of elite allele favored trait performance. Wang et al.
(2010) found that the cultivar Scarlett harbors a
recessive late-flowering Ppd-H1 allele suggesting a
delayed flowering and an excessive vegetative growth
which increases SDW. A single exotic QTL allele was
associated with increased SDW at QSdw.S42.5H
indicating a unique exotic allele putatively linked
with the natural adaptation of ISR42-8 in the rainfed
conditions. Morgan et al. (1993) found that the above
ground dry matter production is an important criterion
to judge drought tolerance in crop breeding. However,
at QTL QSdw.S42.2H.c exotic alleles revealed treat-
ment interaction effect while decreasing trait value
that may explain a putative linkage drag of the exotic
allele on SDW. It may hold true for the drought
inducible exotic QTL alleles for the TKW on
chromosome 6H. Further, three digenic epistatic
interactions were responsible for SDW variation in
the BC2DH lines by additive effect of the homozygous
Hsp alleles. These interaction effects may also explain
transgression effects for SDW in the BC2DH lines.
Although ISR42-8 was inferior in yield and at five
QTL, the exotic alleles showed deleterious effects on
TKW but the exotic alleles at marker locus HvFT3 on
chromosome 1H revealed a positive effect on TKW,
suggesting the presence of a valuable allele for yield in
the wild barley. Von Korff et al. (2006) found a
favorable exotic QTL allele for yield components on
the short arm of chromosome 2H under field condition.
A deep root system able to extract water from
depths and RL is one of the most consensual traits
contributing to drought avoidance (Courtois et al.
2000). Altogether, three QTL were detected for RL
where marker locus VrnH1 was linked to an exotic
QTL allele that increased RL by 9 %. Chen et al.
(2010) also found a QTL for RL in the corresponding
region on chromosome 5H. In wheat, Liu et al. (2012)
detected three QTL for RL under drought stress
conditions which were located on chromosomes 2D,
3A and 5B. A similar QTL Dro1 (Deeper rooting 1)
that controls deep rooting in rice under upland field
conditions was reported on chromosome 9. RDW is
another important parameter of root connected to
water-use efficiency and long-term drought (Songsri
et al. 2009). We identified seven QTL for RDW of
which four QTL QRdw.S42.1H.a, QRdw.S42.1H.b,
QRdw.S42.5H and QRdw.S42.7H had an increased
RDW by introgression of the exotic alleles. All of
these QTL would be useful for drought resistance
breeding in barley. Li et al. (2005) identified three
additive QTL for RDW in rice; however, no reports
were found yet on whole genome QTL mapping of
RDW in barley. Further, seven digenic epistatic
interactions were detected for RDW of which six
interaction effects acted positively and the BC2DH
lines carrying the homozygous Hsp alleles at these loci
were superior in RDW, suggesting a putative additive
effect of exotic alleles in determining this trait in
barley. These results are in line with our expectation
because the donor parent ISR42-8 was superior in
RDW as compared to Scarlett. In rice, Li et al. (2005)
detected three and four epistatic QTL for RDW and
RSR, respectively. Yamauchi and Aragones (1997)
found that the genotypes with high root–shoot ratios
were more resistant under drought conditions.
QTL validation
A total of 15 exotic QTL alleles were associated with
improval of shoot and root traits in the S42 population.
Among these, we validated nine exotic QTL alleles in a
set of ILs. Some exotic QTL alleles have not been
validated in the ILs possibly because of mixed
background of the S42 population. The role of multiple
introgressions in BC2DH lines is crucial due to additive
nature of the quantitative traits. This mixed back-
ground also provides a necessary platform for the
action of epistatic genes in a trait expression. We
validated two QTL for PH, QPh.S42IL.2H and
QPh.S42IL.3H.b. The QTL QPh.S42IL.2H was
responsible for decreasing PH in the IL S42IL-109
that possibly corresponds to a gibberellic acid
insensitive dwarfing gene ‘‘sdw3’’ which reduces PH
and located in the 67–92 cM region on chromosome
2H (Schmalenbach et al. 2009). The QTL QPh.
S42IL.3H.b linked to the strongest increase in PH
was validated in multiple ILs, S42IL-121, S42IL-137,
S42IL-140 and S42IL-148 sharing common overlap-
ping Hsp introgressions which help us to refine the
QTL position between 185.12 and 211.25 cM on
chromosome 3H. Although increasing PH is not a
desirable breeding trait but it is an important adaptive
trait for drought escape therefore, this major QTL
allele of exotic origin that explains 59.2 % of the
genetic variance may be a valuable novel allele for
plant adaptation. For root traits, we identified
two unique ILs, S42IL-133 (QRdw.S42IL.7H,
QRsr.S42IL.7H) and S42IL-102 (QRdw.S42IL.1Ha,
Mol Breeding
123
QRsr.S42IL.1H.a) possessing QTL for RDW and RSR
on chromosomes 7H and 1H, respectively. These QTL
may correspond to Hoffmann et al. (2012) who
reported QTL for shoot–root ratio in the IL S42IL-
133 and RDW in the IL S42IL-102 by studying the
juvenile plant development in a hydroponic system.
These data suggest stability of these QTL effects across
variable environmental conditions. Similarly, the IL
S42IL-125 harbored an Hsp introgression linked to
QTL QRl.S42.5H, QRdw.S42.5H and QRsr.S42.5H for
RL, RDW and RSR, respectively. We believe this
unique IL carried a major gene for root development
that has a broad effect on several root parameters. Naz
et al. (2012) found major QTL for RDW, RL and root
volume in the IL S42IL-176 which reside on chromo-
some 5H in the interval between 200.12 and
234.98 cM. However, this chromosomal region does
not correspond to the Hsp introgression in the IL
S42IL-125 suggesting the identification of a new
exotic allele for root trait variation on chromosome 5H.
Conclusion and future work
The present study describes the identification of 33 QTL
for the shoot and root traits of which 15 and 18 QTL
alleles were linked to favorable performance of the exotic
and elite alleles, respectively. Nine out of 15 exotic QTL
alleles were successfully validated in wild barley ILs.
These exotic QTL alleles are fixed in a near isogenic
background of Scarlett which provides an opportunity to
utilize this valuable genetic resource in plant breeding.
Furthermore, high-resolution mapping populations are
established from the QTL-bearing ILs for fine mapping
and positional cloning of underlying genes.
Acknowledgments We offer special thanks to Mrs. Anne
Reinders, Mrs. Karola Muller, Mrs. Iris Hermeling and Mrs.
Martina Ruland for their support during phenotyping and to Mrs.
Karin Woitol and Mr. Stephan Reinert for reading the
manuscript. Part of this work was funded by the German Plant
Genome Research Initiative (GABI) of the Federal Ministry of
Education and Research (BMBF, Project 0312278A).
Conflict of interest The authors declare that they have no
conflict of interest.
References
Anonymous (2012) Food and agriculture organization, food
outlook. http://www.fao.org/docrep/016/al993e/al993e00.
pdf. (Accessed Jan 2013)
Bauer AM, Hoti F, von Korff M, Pillen K, Leon J, Sillanpaa MJ
(2009) Advanced backcross QTL analysis in spring barley
(H. vulgare ssp. spontaneum) comparing a REML versus a
Bayesian model in multi-environmental field trials. Theor
Appl Genet 119:105–123
Benjamini Y, Yekutieli D (2005) Quantitative trait loci analysis
using the false discovery rate. Genetics 171:783–790
Bot AJ, Nachtergaele FO, Young A (2000) Land resource
potential and constraints at regional and country levels.
World soil resources reports 90. FAO, Rome, p 49
Broman KW, Speed TP (2002) A model selection approach for
identification of quantitative trait loci in experimental
crosses. J R Stat Soc B 64:641–656
Chen Y, Carver BF, Wang S, Cao S, Yan L (2010) Genetic
regulation of developmental phases in winter wheat. Mol
Breed 26:573–582
Courtois B, McLaren G, Sinha PK, Prasad K, Yadav R, Shen L
(2000) Mapping QTLs associated with drought avoidance
in upland rice. Mol Breed 6:55–66
Davies WJ, Wilkinson S, Loveys B (2002) Stomatal control by
chemical signalling and the exploitation of this mechanism
to increase water use efficiency in agriculture. N Phytol
153:449–460
Hackett CA, Ellis RP, Forster BP, McNicol JW, Macaulay M
(1992) Statistical analysis of a linkage experiment in barley
involving quantitative trait loci for height and ear emer-
gence time and two genetic markers on chromosome 4.
Theor Appl Genet 85:120–126
Hoffmann A, Maurer A, Pillen K (2012) Detection of nitrogen
deficiency QTL in juvenile wild barley introgression lines
growing in a hydroponic system. BMC Genet 13:88
Jenks MA, Hasegawa PM (2005) Plant abiotic stress. Blackwell,
UK
Kavar T, Maras M, Kidric M, Sustar-Vozlic J, Meglic V (2007)
Identification of genes involved in the response of leaves of
Phaseolus vulgaris to drought stress. Mol Breed
21:159–172
Kleinhofs A, Graner A (2001) An integrated map of the barley
genome. In: Phillips RL, Vasil IK (eds) DNA-based
markers in plants. Kluwer, Dordrecht, pp 187–199
Lancashire PD, Bleiholder H, Van Den Boom T, Langeluddecke
P, Stauss R, Weber E, Witzenberger A (1991) An uniform
decimal code for growth stages of crops and weeds. Ann
Appl Biol 119:561–601
Li Z, Mu P, Li C, Zhang H, Li Z, Gao Y, Wang X (2005) QTL
mapping of root traits in a doubled haploid population from
a cross between upland and lowland japonica rice in three
environments. Theor Appl Genet 110:1244–1252
Liu X, Li R, Chang X, Jing R (2012) Mapping QTLs for seedling
root traits in a doubled haploid wheat population under
different water regimes. Euphytica 189:51–66
Morgan JA, LeCain DR, McCaig TN, Quick JS (1993) Gas
exchange, carbon isotope discrimination, and productivity
in winter wheat. Crop Sci 33:178–186
Naz AA, Ehl A, Pillen K, Leon J (2012) Validation of root-
related quantitative trait locus effects of wild origin in the
cultivated background of barley (Hordeum vulgare L.).
Plant Breed 131:392–398
Pillen K, Zacharias A, Leon J (2004) Comparative AB-QTL
analysis in barley using a single exotic donor of Hordeum
vulgare ssp spontaneum. Theor Appl Genet 108:1591–1601
Mol Breeding
123
Price AH, Tomos AD, Virk DS (1997) Genetic dissection of root
growth in rice (Oryza sativa L.). I: a hydrophonic screen.
Theor Appl Genet 95:132–142
SAS Institute (2008) The SAS enterprise guide for windows,
release 9.2. SAS Institute, Cary
Sayed MA, Schumann H, Pillen K, Naz AA, Leon J (2012) AB-
QTL analysis reveals new alleles associated to proline
accumulation and leaf wilting under drought stress condi-
tions in barley (Hordeum vulgare L.). BMC Genet 13:61
Schachtman DP, Goodger JQD (2008) Chemical root to shoot
signaling under drought. Trends Plant Sci 13:281–287
Schmalenbach I, Pillen K (2009) Detection and verification of
malting quality QTLs using wild barley introgression lines.
Theor Appl Genet 118(8):1411–1427
Schmalenbach I, Korber N, Pillen K (2008) Selecting a set of
wild barley introgression lines and verification of QTL
effects for resistance to powdery mildew and leaf rust.
Theor Appl Genet 117:1093–1106
Schmalenbach I, Leon J, Pillen K (2009) Identification and
verification of QTLs for agronomic traits using wild barley
introgression lines. Theor Appl Genet 118:483–497
Schmalenbach I, March TJ, Bringezu T, Waugh R, Pillen K
(2011) High-resolution genotyping of wild barley intro-
gression lines and fine-mapping of the threshability locus
thresh-1 using the Illumina GoldenGate assay. G3
1:187–196
Schuppler U, He PH, John PCL, Munns R (1998) Effects of
water stress on cell division and cell-division-cycle-2-like
cell-cycle kinase activity in wheat leaves. Plant Physiol
117:667–678
Songsri P, Jogloy S, Holbrook CC, Kesmala T, Vorasoot N,
Akkasaeng C, Patanothai A (2009) Association of root,
specific leaf area and SPAD chlorophyll meter reading to
water use efficiency of peanut under different available soil
water. Agric Water Manag 96:790–798
Talame V, Sanguineti MC, Chiapparino E, Bahri H, Ben Salem
M, Forster BP, Ellis RP, Rhouma S, Zoumarou W, Waugh
R, Tuberosa R (2004) Identification of Hordeum sponta-
neum QTL alleles improving field performance of barley
grown under rainfed conditions. Ann Appl Biol 144:
309–319
Tanksley SD (1993) Mapping polygenes. Annu Rev Genet
27:205–233
Tanksley SD, Nelson JC (1996) Advanced backcross QTL
analysis: a method for the simultaneous discovery and
transfer of valuable QTLs from unadapted germplasm into
elite breeding lines. Theor Appl Genet 92:191–203
von Korff M, Wang H, Leon J, Pillen K (2006) AB-QTL ana-
lysis in spring barley: II. Detection of favorable exotic
alleles for agronomic traits introgressed from wild barley
(H. vulgare ssp. spontaneum). Theor Appl Genet 112:
1221–1231
von Korff M, Leon J, Pillen K (2010) Detection of epistatic
interactions between exotic alleles introgressed from wild
barley (H. vulgare ssp spontaneum). Theor Appl Genet
121:1455–1464
Wang G, Schmalenbach I, von Korff M, Leon J, Kilian B, Rode
J, Pillen K (2010) Association of barley photoperiod and
vernalization genes with QTLs for flowering time and
agronomic traits in a BC2DH population and a set of wild
barley introgression lines. Theor Appl Genet 120:1559–
1574
Yadav R, Courtois B, Huang N, McLaren G (1997) Mapping
genes controlling root morphology and root distribution in
a doubled haploid population of rice. Theor Appl Genet
94:619–632
Yamauchi M, Aragones DV (1997) Root system and grain yield
of rice with emphasis on F1 hybrids. In: Proceedings of the
4th JSRR symposium (JSRR), The University of Tokyo,
Tokyo, Japan, pp 24–25
Yu GT, Horsley RD, Zhang B, Franckowiak JD (2010) A new
semi-dwarfing gene identified by molecular mapping of
quantitative trait loci in barley. Theor Appl Genet 120:
853–861
Mol Breeding
123
Copyright © 2022 FDOKUMEN