ORIGINAL PAPER QTL Mapping of Yield and Yield Components under Normal
19
ORIGINAL PAPER QTL Mapping of Yield and Yield Components under Normal and Salt-stress Conditions in Bread Wheat (Triticum aestivum L.) Amin Azadi & Mohsen Mardi & Eslam Majidi Hervan & Seyed Abolghasem Mohammadi & Foad Moradi & Mohammad Taghi Tabatabaee & Seyed Mostafa Pirseyedi & Mohsen Ebrahimi & Farzad Fayaz & Mehrbano Kazemi & Sadegh Ashkani & Babak Nakhoda & Ghasem Mohammadi-Nejad Published online: 15 May 2014 # Springer Science+Business Media New York 2014 Abstract A population of 186 recombinant inbred lines of bread wheat (Superhead#2/Roshan) was evaluated to identify quantitative trait loci (QTL) for yield and yield components under normal (2 ds m –1 ) and salt-stress (10–12 ds m –1 ) con- ditions. A genetic map was constructed with 451 markers, including, 23 simple sequences repeats (SSRs) and 428 diver- sity arrays technology markers (DArTs). The main-effect QTL were identified by composite interval mapping (CIM) analysis using QTL Cartographer v2.5 and Qgene v4.3.2 and a mixed- model-based composite interval mapping (MCIM) method using QTLNetwork v2.1. A total of 98 significant QTL were detected at two testing locations on 20 chromosomes. Of these, only 40 QTL were detected by at least two of these software programs. A total of 24 QTL on ten chromosomes were identified for grain yield, most of which had a minor effect, contributing less than 10 % of the total phenotypic variation. Two grain-yield QTL intervals were detected on 1A 1 and 3B, which contributed 11.02 % and 10.3 % to the total phenotypic variation, respectively. Roshan alleles were associated with an increase in grain yield under stress condi- tions on 1A 1 , 2B 3 , 3B, 6B 1 , 1D, 2D 1 . Among the 20 chromo- somes, chromosome 3B with 27 QTL and two distinctive cluster regions was the most important. SSR markers gwm282, gwm247, gwm566, and gwm33 were tightly linked to QTL for the same or different traits under normal, stress or both conditions, and accounted for about 17 %, 43 %, 43 % and 20 % of the total phenotypic variation, respectively. These markers are suitable for marker-assisted selection to improve grain yield under normal and salt-stress conditions. Keywords Recombinant inbred lines . Wheat . QTL . Grain yield . Salt stress Electronic supplementary material The online version of this article (doi:10.1007/s11105-014-0726-0) contains supplementary material, which is available to authorized users. A. Azadi : S. Ashkani Department of Agronomy and Plant Breeding, Shahre-Rey Branch, Islamic Azad University, Tehran, Iran M. Mardi (*) : S. M. Pirseyedi : M. Kazemi Department of Genomics, Agricultural Biotechnology Research Institute of Iran (ABRII), Karaj, Iran e-mail: [email protected] E. M. Hervan : F. Moradi : B. Nakhoda Department of Molecular Physiology, Agricultural Biotechnology Research Institute of Iran (ABRII), Karaj, Iran S. A. Mohammadi Department of Agronomy & Plant Breeding, Faculty of Agriculture, University of Tabriz, Tabriz, Iran M. T. Tabatabaee Yazd Agricultural Research Center, Yazd, Iran M. Ebrahimi Department of Agronomy & Plant Breeding, College of Abouraihan, University of Tehran, Pakdasht, Iran F. Fayaz College of Agriculture, Sanandaj Branch, Islamic Azad University, Sanandaj, Iran G. Mohammadi-Nejad Department of Agronomy & Plant Breeding, Shahid Bahonar University of Kerman, Kerman, Iran Plant Mol Biol Rep (2015) 33:102–120 DOI 10.1007/s11105-014-0726-0
-
Upload
independent -
Category
Documents
-
view
0 -
download
0
Transcript of ORIGINAL PAPER QTL Mapping of Yield and Yield Components under Normal
ORIGINAL PAPER
QTL Mapping of Yield and Yield Components under Normaland Salt-stress Conditions in Bread Wheat (Triticum aestivum L.)
Amin Azadi & Mohsen Mardi & Eslam Majidi Hervan &
Seyed Abolghasem Mohammadi & Foad Moradi &Mohammad Taghi Tabatabaee & Seyed Mostafa Pirseyedi &Mohsen Ebrahimi & Farzad Fayaz & Mehrbano Kazemi &Sadegh Ashkani & Babak Nakhoda & Ghasem Mohammadi-Nejad
Published online: 15 May 2014# Springer Science+Business Media New York 2014
Abstract A population of 186 recombinant inbred lines ofbread wheat (Superhead#2/Roshan) was evaluated to identifyquantitative trait loci (QTL) for yield and yield componentsunder normal (2 ds m–1) and salt-stress (10–12 ds m–1) con-ditions. A genetic map was constructed with 451 markers,including, 23 simple sequences repeats (SSRs) and 428 diver-sity arrays technologymarkers (DArTs). Themain-effect QTLwere identified by composite interval mapping (CIM) analysisusing QTL Cartographer v2.5 and Qgene v4.3.2 and a mixed-model-based composite interval mapping (MCIM) methodusing QTLNetwork v2.1. A total of 98 significant QTL weredetected at two testing locations on 20 chromosomes. Ofthese, only 40 QTL were detected by at least two of thesesoftware programs. A total of 24 QTL on ten chromosomeswere identified for grain yield, most of which had a minoreffect, contributing less than 10 % of the total phenotypic
variation. Two grain-yield QTL intervals were detected on1A1 and 3B, which contributed 11.02 % and 10.3 % to thetotal phenotypic variation, respectively. Roshan alleles wereassociated with an increase in grain yield under stress condi-tions on 1A1, 2B3, 3B, 6B1, 1D, 2D1. Among the 20 chromo-somes, chromosome 3B with 27 QTL and two distinctivecluster regions was the most important. SSR markersgwm282, gwm247, gwm566, and gwm33 were tightly linkedto QTL for the same or different traits under normal, stress orboth conditions, and accounted for about 17 %, 43 %, 43 %and 20% of the total phenotypic variation, respectively. Thesemarkers are suitable for marker-assisted selection to improvegrain yield under normal and salt-stress conditions.
Keywords Recombinant inbred lines .Wheat . QTL . Grainyield . Salt stress
Electronic supplementary material The online version of this article(doi:10.1007/s11105-014-0726-0) contains supplementary material,which is available to authorized users.
A. Azadi : S. AshkaniDepartment of Agronomy and Plant Breeding, Shahre-Rey Branch,Islamic Azad University, Tehran, Iran
M. Mardi (*) : S. M. Pirseyedi :M. KazemiDepartment of Genomics, Agricultural Biotechnology ResearchInstitute of Iran (ABRII), Karaj, Irane-mail: [email protected]
E. M. Hervan : F. Moradi :B. NakhodaDepartment of Molecular Physiology, Agricultural BiotechnologyResearch Institute of Iran (ABRII), Karaj, Iran
S. A. MohammadiDepartment of Agronomy & Plant Breeding, Faculty of Agriculture,University of Tabriz, Tabriz, Iran
M. T. TabatabaeeYazd Agricultural Research Center, Yazd, Iran
M. EbrahimiDepartment of Agronomy & Plant Breeding, College of Abouraihan,University of Tehran, Pakdasht, Iran
F. FayazCollege of Agriculture, Sanandaj Branch, Islamic Azad University,Sanandaj, Iran
G. Mohammadi-NejadDepartment of Agronomy & Plant Breeding, Shahid BahonarUniversity of Kerman, Kerman, Iran
Plant Mol Biol Rep (2015) 33:102–120DOI 10.1007/s11105-014-0726-0
Introduction
Bread wheat is the most important food crop in many coun-tries. Optimizing wheat yield is important, but the achieve-ment of this goal is under constant challenge by exposure ofthe crops to both biotic and abiotic stresses. Among thevarious abiotic stresses plants may face, salinity limits theproductivity of crops all over the world. Soils that contain ahigh concentration of salt are found in many countries, includ-ing Iran. It has been estimated that about 20 % of globalagricultural land (Flowers and Yeo 1995) are soils with highsalinity. Estimates suggest that about 34 million ha, including4.1 million ha of irrigated land in Iran, are salt-affected(Qadir et al. 2008).
An effective approach to developing breeding programsmight be to identify andmap genes that respond to stress usingmolecular markers, and to determine the relationship of thesegenes to phenotypic traits. Grain yield is a particularly com-plex trait, which usually has low heritability (Quarrie et al.2005) and is influenced significantly by the environment(Cuthbertet al. 2008). Due to the importance and complexnature of yield and yield components, mapping these traits isa critical factor for most breeding programs. Most of thequantitative trait loci (QTL) for the yield of such crops aswheat and barley that have been identified account for lessthan 10 % of the total phenotypic variation (McCartney et al.2005; Cuthbert et al. 2008; Xue et al. 2009).
QTL mapping of yield-related traits in wheat (Triticumaestivum L.), which is an allohexaploid species with a largegenome, has produced various results due to the choice ofparents for crossing, environmental effects, the use of differentsoftware programs to analyze data, and the nature of thequantitative traits themselves. Several studies have attemptedto map QTL for grain yield and yield components of wheatunder non-stress conditions (Kato et al. 2000; Börner et al.2002; McCartney et al. 2005; Huang et al. 2004 and 2006;Marza et al. 2006; Narasimhamoorthy et al. 2006; Kumaret al. 2007; Kuchel et al. 2007; Cuthbert et al. 2008; Heidariet al. 2011). Cuthbert et al. (2008) used 186 doubled haploids(DHs) at six locations to identify QTL for different agronomicparameters. They detected 53 QTL on 12 chromosomes, with5 QTL for grain yield detected on chromosomes 1A, 2D, 3B,and 2 loci on chromosome 5A.McCartney et al. (2005) studieda population of 182 DH wheat individuals in multipleenvironments and detected 34 QTL for six agronomic traits.Börner et al. (2002) used a set of 114 recombinant inbred lines(RILs) grown in several different environments and identified64 major QTL for different morphological, agronomic, anddisease-resistance traits. In addition, a considerable number ofreports have been published on the mapping of QTL associatedwith tolerance to salinity in rice seedlings grown in green-houses (Koyama et al. 2001; Lin et al. 2004; Thomson et al.2010; Wang et al. 2012a, b), as well as in wheat seedlings
(Lindsay et al. 2004; Ma et al. 2007; Edwards et al. 2008;Ogbonnaya et al. 2008; Genc et al. 2010; Xu et al. 2012).However, a few studies have investigated the effects of QTLin wheat, barley and rice on yield and yield components in thefield under salt-stress conditions (Quarrie et al. 2005; Mannehet al. 2007; Xue et al. 2009; Diaz de Leon et al. 2011). Diaz deLeon et al. (2011) identified 22 and 36 QTL under normal andsalt-stress conditions, respectively (EC=1.0 and 12.0 ds m−1,respectively). Richards (1983) reported that screening largepopulations for salinity tolerance in the field is difficult, dueto the great heterogeneity of soils with high salinity. Lindsayet al. (2004) identified a locus, named Nax1, (Na exclusion) onchromosome 2AL, using AFLP, RFLP and microsatellitemarkers, that accounted for approximately 38 % of phenotypicvariation in mapping population. Three simple sequence re-peats (SSR) markers (gwm249, wmc170 and gwm313) linkedto the Nax1 locus. A gene for salt tolerance in bread wheat,Kna1, was mapped to the chromosome 4DL (Dubcovsky et al.1996).
In the study reported herein, two bread wheat cultivarswere used: Roshan and Superhead#2. Roshan is a local breadwheat cultivar with high height that is tolerant to both droughtand salinity. In contrast, Superhead#2 is a dwarf cultivar witha high grain yield that is susceptible to salinity and droughtstresses. Superhead#2 was developed at the Seed and PlantImprovement Institute (SPII), Karaj, Iran. The objectives ofthe study were to identify (1) positive parent alleles for QTLthat were specific to normal environments, (2)positive parentalleles for QTL that were specific to salt stress conditions, and(3) markers that are associated significantly with yield andyield components, using single marker analysis.
Materials and Methods
Plant Materials
This study used 186 F8 recombinant inbred lines (RILs),derived from a cross between Superhead#2 (a high-yield andsalt-sensitive variety from SPII) and Roshan (a local salt-tolerant cultivar) via single seed descent at the AgriculturalBiotechnology Research Institute of Iran (ABRII, Karaj, Iran).
Field Trials
The mapping population was evaluated at two locations inIran: Yazd (31°53′N and 54°22′E) and Kerman (30°17′N and57°05′ E). Yield components were studied using a randomizedcomplete block design under normal and salt stress conditionswith two replications in each site. The traits that were inves-tigated included grain yield (Yld), thousand-grain weight(Tgw), grain number per spike (Gnu), and spike length (SL)at all sites. In addition, spike weight (Sw), spikelet number per
Plant Mol Biol Rep (2015) 33:102–120 103
spike (Spn) and biological yield (Byld, straw+grain, t/ha) werestudied in Yazd. The data were recorded for RILs and theirparents using 20 random plants in each plot. In order to assessgrain yield, each plot was harvested in its entirety. A commonseed source was used at the four sites. Each plot consisted of six2m-long rows, each spaced 20 cm apart. The levels of electricalconductivity of the normal and high-salinity soils were approx-imately 2 and 10–12 ds m–1, respectively. The normal andhighly saline soils were irrigated to the same level, but theconcentration of salt in the irrigation water of the soil with highsalinity being maintained at 120 mM NaCl throughout theexperimental period. The frequency distributions of traits forthe186 F8 RILs in the salinity treatment were generated usingExcel. ANOVA was performed using the GLM procedure ofSAS software (SAS Institute 1990). At first, each site wasanalyzed individually, then a combined analysis of varianceover location was performed. Pearson’s correlation coefficient(for the normal and salt-stress conditions separately) amongtraits was calculated using SAS V6.12.
DNA Extraction and Marker Analysis
Leaf tissue of each RIL was used for DNA extraction usingthe Triticarte plant DNA extraction protocol (http://www.triticarte.com.au/content/DNA-preparation.html). A total of107 SSR markers, including 26 Wheat MicrosatelliteConsortium (WMC; Gupta et al. 2002), 67 GaterslebenWheat Microsatellite (GWM; Röder et al. 1998), 12Beltsville Agricultural Research Center (BARC; Song et al.2002, 2005) and 2 Clermont-Ferrand D genome (CFD;Guyomarch et al. 2002) markers, were assessed for the exis-tence of polymorphism between parents. Sequences of SSRmarkers were obtained from the GrainGenes website (http://wheat.pw.usda.gov/) and previously published reports.Amplification was performed with a thermal cycler (AppliedBiosystems, Foster City, CA) using initial denaturation(one cycle) at 94 °C for 1 min, followed by 30 cycles of 1 minat 94 °C, 30 s for annealing (temperature depending on theprimer annealing conditions) and 45 s at 72 °C for extension.An additional final extension of the PCR products wasperformed for 5 min at 72 °C. PCR products were separatedby 6 % polyacrylamide gel electrophoresis and visualizedafter silver staining. In addition to the 107 SSR markers,869 DArT markers were generated by Triticarte (Australia;http://www.triticarte.com.au/) to profile the whole genome ofthe entire population. DArT markers are referred to using theprefix “wPt”, followed by numbers.
Construction of a Genetic Map
From the 976 markers, only 640 polymorphic markers (30SSR and 610 DArT markers) were detected. Map ManagerQTX (Manly et al. 2001) was used to construct the linkage
map using the Kosambi mapping function (Kosambi 1944)and LOD score of 3.0 as a threshold for considering a linkageto be significant. Segregation distortion (deviation from aMendelian ratio) at each locus was tested using the chi-square test (P<0.01). In total, 109 DArT and 3 SSR markersthat showed a highly skewed segregation ratio were excludedfrom the map. Heterozygous loci were considered as missingdata (Villalta et al. 2007; Montovani et al. 2008; Thomsonet al. 2010). Finally, from the 528 remaining markers, 451markers (23 SSR and 428 DArT markers) were used forlinkage map construction, and 77 markers remained unlinked.
QTL Analysis
The QTL analysis for each trait was performed with twodifferent approaches: first, for the four individual sites sepa-rately (Cuthbert et al. 2008; Quarrie et al. 2005; Xue et al.2009), and, second, for the means of the two normal and thetwo salt-stress sites separately. First, to identify putative QTLand markers significantly associated with each trait, singlemarker analysis using the linear regression method option ofQTLCartographer v2.5 (Wang et al. 2012a, b) was performed.In accordance with Villalta et al. (2007), when two or moremarkers were found to be significantly associated with aparticular trait, only the marker with the lowest P value waschosen. The main-effect QTL were identified by compositeinterval mapping (CIM) analysis (Zeng 1994) using QTLCartographer v2.5 (Wang et al. 2012a, b) and Qgene v4.3.2(Joehanes and Nelson 2008). For the setting of CIM parame-ters in QTL Cartographer, model 6 was selected and a forwardand backward regression method with the maximum numberof cofactors was used to control the genetic background foreach trait. The P(Fin) and P(Fout) thresholds were set at 0.05(Cuthbert et al. 2008). Window size and walk speed were setat 10 and 1 cM, respectively. For the setting of CIM param-eters in Qgene, stepwise cofactor selection and default param-eters were used, and QGene was allowed to select the cofactorfor each trait. The genome scan interval was set to 1 cM.Finally, to identify, compare, and confirm the main-effectQTL using other software, QTLNetwork v2.1 (Yang et al.2008) software based on the mixed-model-based CIM(MCIM) method was used. To estimate QTL effects, aMonte Carlo Markov chain (MCMC) algorithm was applied.To identify putative QTL and their effects using this software,the threshold for significancewas set atP=0.05. Gibbs samplesize was set to the default value. Window size and walk speedwere set at 10 and 1 cM, respectively. In all three softwareprograms, significant LOD thresholds were determined by1,000 permutations and P=0.05 (Churchill and Doerge1994). When a QTLwas identified by more than one softwareprogram, the result was reported if the mean LOD value washigher than the mean LOD threshold of the software pro-grams. To identify pleiotropic QTL, a multiple-trait CIM
104 Plant Mol Biol Rep (2015) 33:102–120

(Mt-CIM) analysis was conducted using QTL Cartographer.In addition, to calculate confidence intervals (CIs) for QTL,one LOD interval option of QTL Cartographer was chosen.Linked QTL separated by approximately 20 cM or less wereconsidered as a single QTL (Tanksley 1993) and the highest ofthe peaks was chosen for the position of the putative QTL(Ravi et al. 2011). Graphical linkage maps were generatedusing MapChart v2.1 (Voorrips 2002). QTL nomenclaturewas specified according to the catalogue of gene symbolsfor wheat (http://wheat.pw.usda.gov/ggpages/wgc/98/Intro.htm). ABRII was used as the laboratory designator in QTLnomenclature.
Results
Phenotypic Evaluation
Approximately normal distributions of the population wereobserved for all traits (Fig. 1). High- and low-transgressivesegregation was observed for all traits. Significant differences(P<0.01) were observed among RILs for most of the traitsthat were assessed at each individual site (Supplemental
Table 1A). The combined analysis of variance over locationsindicated a different response of genotypes over locations forall traits (Supplemental Table 1B).The grand mean and rangeof 186 RILs and parents are shown in Supplemental Table 1A.As shown in this table, the two parents differed in all traitsevaluated. Roshan had a higher value than Superhead#2 for alltraits under salt-stress conditions. In addition, exposure tosoils with high salinity resulted in a decrease in the meanvalue of the traits in the RILs (Supplemental Table 1A).Simple correlation coefficients for all traits were obtainedseparately from the mean of each trait at the two normal andthe two salt-stress sites. A significant correlation was observedbetween yield and yield components under normal conditions.Positive correlations were found under salt-stress conditionsas well, but only the correlation between Yld and Tgw wassignificant (Supplemental Table 2A, B). Of these, the stron-gest correlation was between Yld and Tgw in both conditions(r=0.45 and r=0.24, significantly at P<0.01). Under normalconditions, the mean Yld of Superhead#2 was greater thanthat of Roshan. This was probably because of the huge spikesize and high Tgw in the Superhead#2 parent. However, undersalt-stress conditions, the mean Yld of the tolerant parent(Roshan) was higher (Supplemental Table 1A).
0
10
20
30
40
50
60
0.5 1 1.5 2 2.5 3 3.5
Fre
qu
ency
(%)
Yield(t/ha)
0
10
20
30
40
50
60
0.3 0.4 0.5 0.6 0.7 0.8 0.9 1 1.1
Fre
qu
ency
(%)
Biological Yield(t/ha)
0
10
20
30
40
50
60
70
80
35 40 45 50 55 60 65
Fre
qu
ency
(%)
Thousand grain weight (g)
0102030405060708090
25 35 45 55 65
Fre
qu
ency
(%)
KERNEL PER SPIKE
0
10
20
30
40
50
60
70
12 14 16 18 20
Fre
qu
ency
(%)
spikelets per spike
0
10
20
30
40
50
60
70
1.5 2 2.5 3 3.5 4
Fre
qu
ency
(%)
Spike Weight (g)
Fig. 1 Frequency distribution oftraits and parents positions among186 F8 recombinant inbred lines(RIL) in salinity treatment.Approximately normaldistributions of the populationwere observed for all traits.P1 andP2 are Superhead#2 and Roshan,respectively
Plant Mol Biol Rep (2015) 33:102–120 105
Linkage Map
A chi-square test was performed for the expected 1:1Mendelian ratio. In total, 109 DArT and 3 SSR markersshowed segregation distortion; these were excluded fromfurther analysis. A total of 451 (23 SSR and 428 DArTmarkers) out of 528 markers were used to construct a linkagemap, which covered a length of 1,390.3 cMwith an average of3.08 cM between loci along the linkage groups; 77 markersremained unlinked. The markers were not distributeduniformly.
Twenty-seven linkage groups were assigned to 20 chromo-somes (all except 4D). For the purpose of assigning linkagegroups to chromosomes, a comparison of DArT-SSR markersin the present study was undertaken with (1) previously inte-grated DArT-SSR linkage maps (Semagn et al. 2006b; Akbariet al. 2006; Crossa et al. 2007; Montovani et al. 2008; Peleget al. 2008; Jing et al. 2009), and (2) the DArT data set(containing the chromosomal locations of DArT markers) thatwas received from Triticarte (http://www.diversityarrays.com/). The numbers of linkage groups and markers perchromosome varied from 1 (2A, 3A, 4A, 5A, 6A, 7A, 1B,3B, 4B, 7B, 1D, 3D, 5D, 7D) to 3 (2B), and from 2 (2D2) to107 (7D), respectively. The markers were mapped to 7, 7 and6 chromosomes for each of A, B and D genomes respectivelyand covering lengths of 467.7, 551.3, and 371.3 cM, respec-tively. The minimum and maximum distances between twomarkers were 0 (in 7A) and 70 cM (in 4A), respectively, whichindicates that there was a lack of genome coverage in someregions. Linkage group 2D2 and chromosome 7D had thesmallest and largest numbers of markers, with 2 and 107,respectively. Although 7D had the largest number of markers,they covered only 20.3 cM in length. The greatest length (193.95 cM) was for chromosome 4A.
QTL Mapping
Single-Marker Analysis
To identify molecular markers that were associated signifi-cantly with each trait, single-marker analysis using the linearregression method was performed. The significantly associat-edmarkers are indicated by asterisks in Table 1. Only SSR andDArT markers with P≤0.01 are shown in this table and onlySSR markers were considered. Gwm282 on chromosome 7Awas linked tightly to three QTL (one each for Yld, Gnu andTgw). Gwm247 on chromosome 3B was associated signifi-cantly with Yld (under normal conditions), Gnu and Tgw(under normal and salt-stress conditions) and with SL (undersalt-stress conditions). SSR marker gwm566, on chromosome3B, was tightly linked to four Yld QTL in all sites and twoQTL for Gnu under both normal and salt-stress conditions.Gwm33 on 1A1 was associated significantly with Gnu under
normal and salt-stress conditions. These markers showed agood fit to a 1:1 ratio. Chi-squared values are indicated inSupplemental Table 3. These four SSR markers (gwm282,gwm247, gwm566, and gwm33) were tightly linked to differ-ent QTL in different conditions and accounted for approxi-mately 17.00 %, 43.16 %, 43.20 %, and 20.5 % of the totalphenotypic variation, respectively.
Composite Interval Mapping and Mixed-Model-BasedComposite Interval Mapping
QTL analysis of the 186 RILs detected 98 significant QTL atfour sites on 20 chromosomes. Overall, 49 QTL were associ-ated with each condition (normal and salt-stress). The A, B,and D genomes, which are 467.7, 551.3, and 371.3 cM inlength, were assigned 29, 51, and 18QTL, respectively. The Dgenome had the fewest QTL among the three. Chromosomes3B and linkage group 2D1 (142.5 and 187.31 cM, respective-ly) had the largest number of QTL (27 and 12 QTL, respec-tively). As shown in Table 1, QTL Cartographer, Qgene andQTLNetwork identified 98, 50, and 25 QTL, respectively.This table does not show the QTL identified by Qgene andQTLNetwork individually. As indicated in this table, when aQTL was identified by more than one software program, theresult was reported if the LODmean value was higher than themean LOD threshold of the software programs. As a result,the LOD threshold had different values for the same trait in thesame environment (Table 1).
Grain Yield
A total of 24 QTL on 13 linkage groups (10 chromosomes)were identified for the trait of grain yield (Table 1). The Bgenome had the largest number of QTL (13 QTL) for this trait.In total, of these 24 QTL, 6 were identified by both theCartographer and Qgene software programs. Two QTL inter-vals were detected on 1A1 (wPt-668205–wPt-731282) and 3B(gwm566–wPt-730063), which contributed 11.02 % and10.3 % to the total phenotypic variation, respectively. Of the24 putative QTL for this trait, four QTL were identified atapproximately the same positions under normal and salt-stressconditions on chromosome 3B (close to the SSR markergwm566) and chromosome 3B had QTL at four locations(three under normal and three under salt-stress conditions).Under salt-stress conditions, two QTL for grain yield fromSuperHead#2 (Qyld.abrii-3B.2 and Qyld.abrii-2B2) had apositive effect. For other QTL (12 loci), Roshan alleles wereassociated with positive effects on grain yield from 0.14 to0.31 t/ha. Both parental alleles contributed to the effect ofgrain yield under normal conditions (six and four positivealleles from Roshan and SuperHead#2, respectively).However, under normal conditions, the mean additive effectof SuperHead#2 was higher than Roshan (Table 1). Co-
106 Plant Mol Biol Rep (2015) 33:102–120
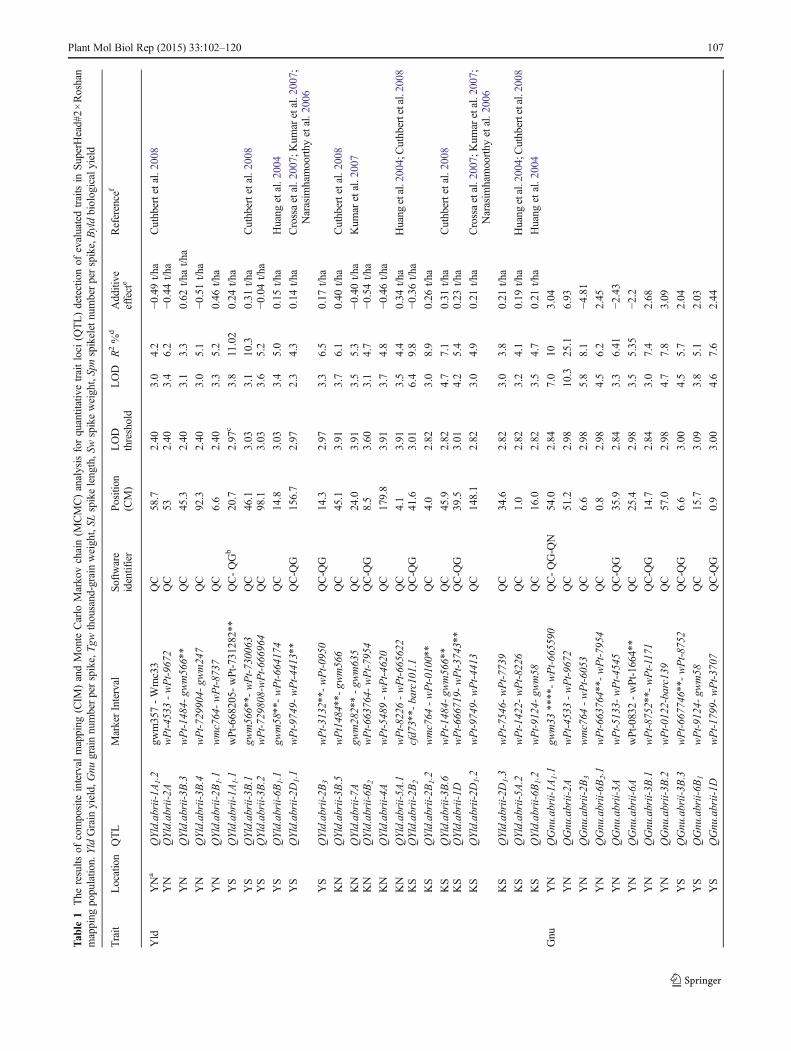
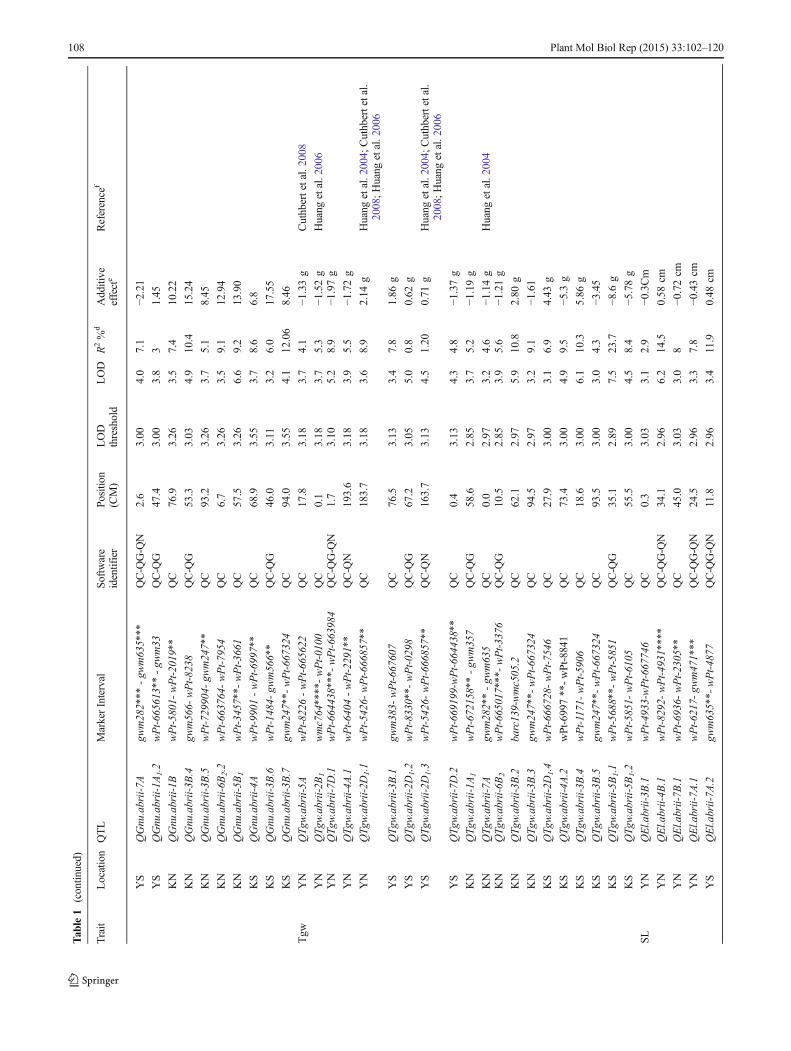
Tab
le1
The
results
ofcomposite
interval
mapping
(CIM
)andMonte
Carlo
Markovchain(M
CMC)analysisforquantitativetraitloci
(QTL)detectionof
evaluatedtraitsin
SuperH
ead#2×Roshan
mapping
populatio
n.Yld
Grain
yield,Gnu
grainnumberperspike,Tg
wthousand-grain
weight,SL
spikelength,Swspikeweight,Spnspikeletnumberperspike,Byldbiologicalyield
Trait
Location
QTL
MarkerInterval
Software
identifier
Positio
n(CM)
LOD
threshold
LOD
R2%
dAdditive
effecte
Reference
f
Yld
YNa
QYld.abrii-1A
1.2
gwm357-Wmc33
QC
58.7
2.40
3.0
4.2
−0.49t/h
aCuthbertetal.2008
YN
QYld.abrii-2A
wPt-4533
-wPt-9672
QC
532.40
3.4
6.2
−0.44t/h
a
YN
QYld.abrii-3B
.3wPt-1484-gw
m566**
QC
45.3
2.40
3.1
3.3
0.62
t/hat/h
a
YN
QYld.abrii-3B
.4wPt-729904-gw
m247
QC
92.3
2.40
3.0
5.1
−0.51t/h
a
YN
QYld.abrii-2B
1.1
wmc764-wPt-8737
QC
6.6
2.40
3.3
5.2
0.46
t/ha
YS
QYld.abrii-1A
1.1
wPt-668205-
wPt-731282**
QC-QGb
20.7
2.97
c3.8
11.02
0.24
t/ha
YS
QYld.abrii-3B
.1gw
m566**-
wPt-730063
QC
46.1
3.03
3.1
10.3
0.31
t/ha
Cuthbertetal.2008
YS
QYld.abrii-3B
.2wPt-729808-wPt-666964
QC
98.1
3.03
3.6
5.2
−0.04t/h
a
YS
QYld.abrii-6B
1.1
gwm58**-wPt-664174
QC
14.8
3.03
3.4
5.0
0.15
t/ha
Huang
etal.2
004
YS
QYld.abrii-2D
1.1
wPt-9749-wPt-4413**
QC-Q
G156.7
2.97
2.3
4.3
0.14
t/ha
Crossaetal.2007;Kum
aretal.2007;
Narasim
hamoorthy
etal.2006
YS
QYld.abrii-2B
3wPt-3132**-wPt-0950
QC-Q
G14.3
2.97
3.3
6.5
0.17
t/ha
KN
QYld.abrii-3B
.5wPt1484**-
gwm566
QC
45.1
3.91
3.7
6.1
0.40
t/ha
Cuthbertetal.2008
KN
QYld.abrii-7A
gwm282**-gw
m635
QC
24.0
3.91
3.5
5.3
−0.40t/h
aKum
aretal.2007
KN
QYld.abrii-6B
2wPt-663764-wPt-7954
QC-Q
G8.5
3.60
3.1
4.7
−0.54t/h
a
KN
QYld.abrii-4A
wPt-5489
-wPt-4620
QC
179.8
3.91
3.7
4.8
−0.46t/h
a
KN
QYld.abrii-5A
.1wPt-8226
-wPt-665622
QC
4.1
3.91
3.5
4.4
0.34
t/ha
Huang
etal.2004;Cuthbertetal.2008
KS
QYld.abrii-2B
2cfd73**-
barc101.1
QC-Q
G41.6
3.01
6.4
9.8
−0.36t/h
a
KS
QYld.abrii-2B
1.2
wmc764
-wPt-0100**
QC
4.0
2.82
3.0
8.9
0.26
t/ha
KS
QYld.abrii-3B
.6wPt-1484-gw
m566**
QC
45.9
2.82
4.7
7.1
0.31
t/ha
Cuthbertetal.2008
KS
QYld.abrii-1D
wPt-666719-wPt-3743**
QC-Q
G39.5
3.01
4.2
5.4
0.23
t/ha
KS
QYld.abrii-2D
1.2
wPt-9749-wPt-4413
QC
148.1
2.82
3.0
4.9
0.21
t/ha
Crossaetal.2007;Kum
aretal.2007;
Narasim
hamoorthy
etal.2006
KS
QYld.abrii-2D
1.3
wPt-7546-wPt-7739
QC
34.6
2.82
3.0
3.8
0.21
t/ha
KS
QYld.abrii-5A
.2wPt-1422-wPt-8226
QC
1.0
2.82
3.2
4.1
0.19
t/ha
Huang
etal.2004;Cuthbertetal.2008
KS
QYld.abrii-6B
1.2
wPt-9124-gw
m58
QC
16.0
2.82
3.5
4.7
0.21
t/ha
Huang
etal.2
004
Gnu
YN
QGnu.abrii-1A
1.1
gwm33
****-wPt-665590
QC-QG-Q
N54.0
2.84
7.0
103.04
YN
QGnu.abrii-2A
wPt-4533
-wPt-9672
QC
51.2
2.98
10.3
25.1
6.93
YN
QGnu.abrii-2B
3wmc764
-wPt-6053
QC
6.6
2.98
5.8
8.1
−4.81
YN
QGnu.abrii-6B
2.1
wPt-663764**-wPt-7954
QC
0.8
2.98
4.5
6.2
2.45
YN
QGnu.abrii-3A
wPt-5133-wPt-4545
QC-Q
G35.9
2.84
3.3
6.41
−2.43
YN
QGnu.abrii-6A
wPt-0832-wPt-1664**
QC
25.4
2.98
3.5
5.35
−2.2
YN
QGnu.abrii-3B
.1wPt-8752**-wPt-1171
QC-Q
G14.7
2.84
3.0
7.4
2.68
YN
QGnu.abrii-3B
.2wPt-0122-barc139
QC
57.0
2.98
4.7
7.8
3.09
YS
QGnu.abrii-3B
.3wPt-667746**-wPt-8752
QC-Q
G6.6
3.00
4.5
5.7
2.04
YS
QGnu.abrii-6B
1wPt-9124-gw
m58
QC
15.7
3.09
3.8
5.1
2.03
YS
QGnu.abrii-1D
wPt-1799-wPt-3707
QC-Q
G0.9
3.00
4.6
7.6
2.44
Plant Mol Biol Rep (2015) 33:102–120 107
Tab
le1
(contin
ued)
Trait
Location
QTL
MarkerInterval
Software
identifier
Positio
n(CM)
LOD
threshold
LOD
R2%
dAdditive
effecte
Reference
f
YS
QGnu.abrii-7A
gwm282***
-gw
m635***
QC-Q
G-Q
N2.6
3.00
4.0
7.1
−2.21
YS
QGnu.abrii-1A
1.2
wPt-665613**
-gw
m33
QC-Q
G47.4
3.00
3.8
31.45
KN
QGnu.abrii-1B
wPt-5801-wPt-2019**
QC
76.9
3.26
3.5
7.4
10.22
KN
QGnu.abrii-3B
.4gw
m566-
wPt-8238
QC-Q
G53.3
3.03
4.9
10.4
15.24
KN
QGnu.abrii-3B
.5wPt-729904-gw
m247**
QC
93.2
3.26
3.7
5.1
8.45
KN
QGnu.abrii-6B
2.2
wPt-663764-wPt-7954
QC
6.7
3.26
3.5
9.1
12.94
KN
QGnu.abrii-5B
1wPt-3457**-wPt-3661
QC
57.5
3.26
6.6
9.2
13.90
KS
QGnu.abrii-4A
wPt-9901
-wPt-6997**
QC
68.9
3.55
3.7
8.6
6.8
KS
QGnu.abrii-3B
.6wPt-1484-gw
m566**
QC-Q
G46.0
3.11
3.2
6.0
17.55
KS
QGnu.abrii-3B
.7gw
m247**-
wPt-667324
QC
94.0
3.55
4.1
12.06
8.46
Tgw
YN
QTg
w.abrii-5A
wPt-8226
-wPt-665622
QC
17.8
3.18
3.7
4.1
−1.33g
Cuthbertetal.2008
YN
QTg
w.abrii-2B
1wmc764****-wPt-0100
QC
0.1
3.18
3.7
5.3
−1.52g
Huang
etal.2006
YN
QTg
w.abrii-7D
.1wPt-664438***-
wPt-663984
QC-Q
G-Q
N1.7
3.10
5.2
8.9
−1.97g
YN
QTg
w.abrii-4A
.1wPt-6404
-wPt-2291**
QC-Q
N193.6
3.18
3.9
5.5
−1.72g
YN
QTg
w.abrii-2D
1.1
wPt-5426-wPt-666857**
QC
183.7
3.18
3.6
8.9
2.14
gHuang
etal.2004;
Cuthbertetal.
2008;H
uang
etal.2
006
YS
QTg
w.abrii-3B
.1gw
m383-
wPt-667607
QC
76.5
3.13
3.4
7.8
1.86
g
YS
QTg
w.abrii-2D
1.2
wPt-8330**-wPt-0298
QC-Q
G67.2
3.05
5.0
0.8
0.62
g
YS
QTg
w.abrii-2D
1.3
wPt-5426-wPt-666857**
QC-Q
N163.7
3.13
4.5
1.20
0.71
gHuang
etal.2004;
Cuthbertetal.
2008;H
uang
etal.2
006
YS
QTg
w.abrii-7D
.2wPt-669199-wPt-664438**
QC
0.4
3.13
4.3
4.8
−1.37g
KN
QTg
w.abrii-1A
1wPt-672158**
-gw
m357
QC-Q
G58.6
2.85
3.7
5.2
−1.19g
KN
QTg
w.abrii-7A
gwm282**-gw
m635
QC
0.0
2.97
3.2
4.6
−1.14g
Huang
etal.2004
KN
QTg
w.abrii-6B
2wPt-665017***-
wPt-3376
QC-Q
G10.5
2.85
3.9
5.6
−1.21g
KN
QTg
w.abrii-3B
.2barc139-wmc505.2
QC
62.1
2.97
5.9
10.8
2.80
g
KN
QTg
w.abrii-3B
.3gw
m247**-
wPt-667324
QC
94.5
2.97
3.2
9.1
−1.61
KS
QTg
w.abrii-2D
1.4
wPt-666728-wPt-7546
QC
27.9
3.00
3.1
6.9
4.43
g
KS
QTg
w.abrii-4A
.2wPt-6997**-wPt-8841
QC
73.4
3.00
4.9
9.5
−5.3
g
KS
QTg
w.abrii-3B
.4wPt-1171-wPt-5906
QC
18.6
3.00
6.1
10.3
5.86
g
KS
QTg
w.abrii-3B
.5gw
m247**-
wPt-667324
QC
93.5
3.00
3.0
4.3
−3.45
KS
QTg
w.abrii-5B
1.1
wPt-5688**-wPt-5851
QC-Q
G35.1
2.89
7.5
23.7
−8.6
g
KS
QTg
w.abrii-5B
1.2
wPt-5851-wPt-6105
QC
55.5
3.00
4.5
8.4
−5.78g
SL
YN
QEl.abrii-3B
.1wPt-4933-wPt-667746
QC
0.3
3.03
3.1
2.9
−0.3Cm
YN
QEl.abrii-4B
.1wPt-8292-wPt-4931****
QC-Q
G-Q
N34.1
2.96
6.2
14.5
0.58
cm
YN
QEl.abrii-7B
.1wPt-6936-wPt-2305**
QC
45.0
3.03
3.0
8−0
.72cm
YN
QEl.abrii-7A
.1wPt-6217-gw
m471***
QC-Q
G-Q
N24.5
2.96
3.3
7.8
−0.43cm
YS
QEl.abrii-7A
.2gw
m635**-
wPt-4877
QC-Q
G-Q
N11.8
2.96
3.4
11.9
0.48
cm
108 Plant Mol Biol Rep (2015) 33:102–120

Tab
le1
(contin
ued)
Trait
Location
QTL
MarkerInterval
Software
identifier
Positio
n(CM)
LOD
threshold
LOD
R2%
dAdditive
effecte
Reference
f
YS
QEl.abrii-1A
1.1
Wmc33-Wmc24
QC
74.4
3.05
3.0
5.6
0.38
cm
YS
QEl.abrii-5B
1wPt-5688**-wPt-5851
QC-Q
G-Q
N28.6
2.96
3.4
9.0
0.41
cm
KN
QEl.abrii-4B
.2wPt-8292***-
wPt-4931
QC-Q
G-Q
N21.6
2.99
5.1
22.7
0.84
cm
KN
QEl.abrii-1A
1.2
wPt-668205**
-wPt-731282
QC
8.3
3.02
3.7
9.4
−0.55cm
KN
QEl.abrii-3B
.2wPt-8752-wPt-1171**
QC-Q
G7.8
2.99
4.0
5.4
−0.42cm
KN
QEl.abrii-3B
.3wPt-671740-wPt-667261**
QC-Q
G119.8
2.99
6.7
10.9
0.60
cm
KS
QEl.abrii-4B
.3wPt-8292**-wPt-4931
QC-Q
G-Q
N2.8
2.75
3.5
7.3
0.71
cm
KS
QEl.abrii-1B
wPt-3465-wPt-5801
QC
55.3
2.99
2.8
4.5
−0.58cm
KS
QEl.abrii-3B
.4gw
m247**-
wPt-667324
QC-Q
G97.6
2.75
4.2
7.5
0.75
cm
KS
QEl.abrii-3B
.5wPt-667261**-wPt-666738
QC-Q
G138.6
2.75
5.9
11.7
1.02
cm
KS
QEl.abrii-2D
1wPt-665166-wPt-666728
QC
6.3
2.99
4.0
8.9
0.79
cm
KS
QEl.abrii-7B
.2wPt-3723-wPt-9397
QC
17.9
2.99
3.6
6.4
0.72
cm
KS
QEL.abrii-1D
wPt-3743
-wPt-731130
QC
48.7
2.99
3.0
9.5
−0.081
cm
Spn
YN
QSpn.abrii-2A
wPt-4533-wPt-9672
QC
42.2
3.17
4.5
18.0
0.93
YN
QSpn.abrii-6A
wPt-0832-
wPt-1664**
QC
25.4
3.17
4.2
5.7
−0.49
YN
QSpn.abrii-3B
.1wPt-8752-wPt-1171**
QC-Q
G15.9
3.05
4.2
8.2
−0.59
YN
QSpn.abrii-3B
.2wPt-667261-wPt-666738
QC
122.1
3.17
10.1
11.1
−1.87
YN
QSpn.abrii-2D
1wPt-665166-wPt-666728
QC-Q
G19.6
3.05
5.5
15.3
0.80
YS
QSpn.abrii-4A
wPt-6997-wPt-8841
QC
72.7
3.21
3.6
4.1
0.44
YS
QSpn.abrii-7A
wPt-6217****
-gw
m471
QC-Q
G-Q
N23.4
3.11
6.0
8.3
−0.60
YS
QSpn.abrii-3B
.3wPt-667746**-wPt-8752
QC-Q
G6.8
3.11
3.5
4.1
0.45
YS
QSpn.abrii-3B
.4wPt-664981**-wPt-672088
QC-Q
G88.3
3.11
3.4
10.4
−0.88
Sw
YN
QEw.abrii-1A
1.1
wPt-665613****-wPt-664666
QC-Q
G-Q
N40.1
2.97
3.8
7.0
−0.17g
YN
QEw.abrii-2D
1wPt-669245**-wPt-3728
QC-Q
G40.4
2.97
3.0
4.3
0.13
g
YS
QEw.abrii-1A
1.2
wPt-665613**
-gw
m33
QC-Q
G47.4
3.04
4.7
7.5
−0.18g
YS
QEw.abrii-5D
wPt-671760-wPt-5505
QC
7.0
3.09
3.5
5.3
−0.15g
Blyd
YN
QByld.abrii-2D
1.1
wPt-9749-
wPt-4413
QC
136.1
3.04
5.7
15.08
0.11
t/ha
YS
QByld.abrii-2D
1.2
wPt-9749-wPt-4413
QC
155
3.00
3.0
6.6
0.48
t/ha
aKKerman,Y
Yazd,Nnorm
al,S
stress
bQCQTLCartographer,QGQgene,Q
NQTLNetwork
cMeanLODthresholdof
QTLCartographerandQgene
dPh
enotypicvariationexplainedby
each
QTL
ePo
sitiv
eandnegativ
evalueindicatethatRoshanandSuperHead#2allelesincreasedphenotypicvalue,respectiv
ely
fQTLpreviously
reported
Plant Mol Biol Rep (2015) 33:102–120 109
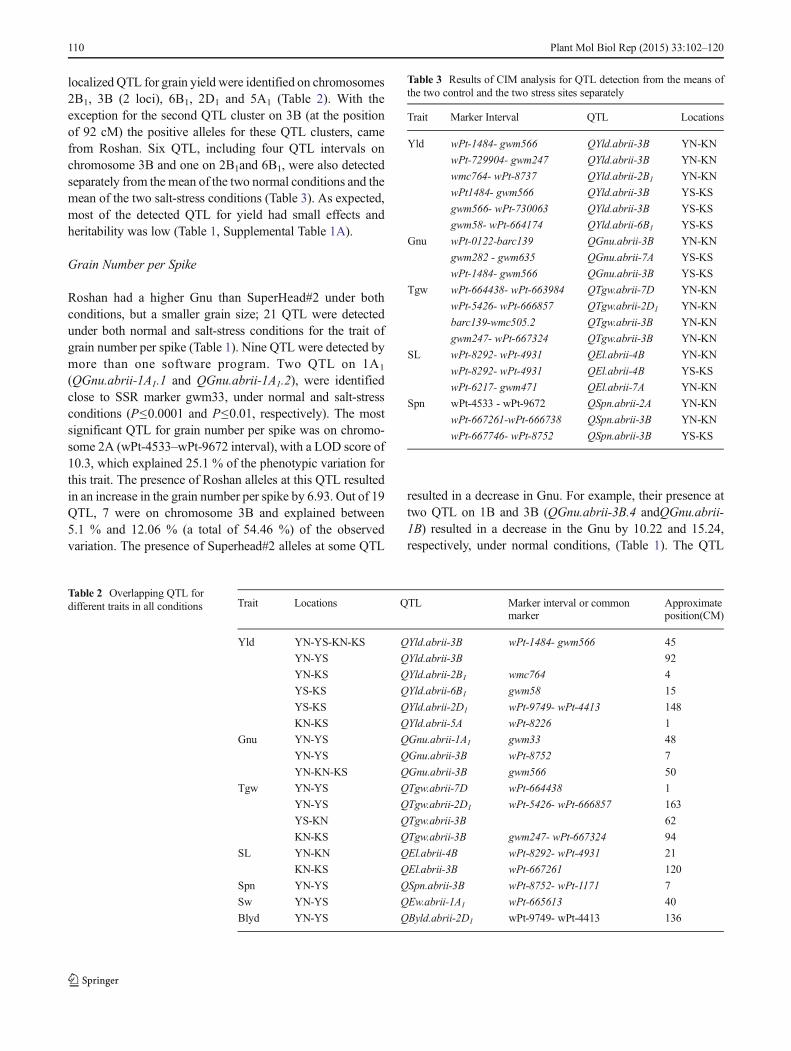
localized QTL for grain yield were identified on chromosomes2B1, 3B (2 loci), 6B1, 2D1 and 5A1 (Table 2). With theexception for the second QTL cluster on 3B (at the positionof 92 cM) the positive alleles for these QTL clusters, camefrom Roshan. Six QTL, including four QTL intervals onchromosome 3B and one on 2B1and 6B1, were also detectedseparately from the mean of the two normal conditions and themean of the two salt-stress conditions (Table 3). As expected,most of the detected QTL for yield had small effects andheritability was low (Table 1, Supplemental Table 1A).
Grain Number per Spike
Roshan had a higher Gnu than SuperHead#2 under bothconditions, but a smaller grain size; 21 QTL were detectedunder both normal and salt-stress conditions for the trait ofgrain number per spike (Table 1). Nine QTL were detected bymore than one software program. Two QTL on 1A1
(QGnu.abrii-1A1.1 and QGnu.abrii-1A1.2), were identifiedclose to SSR marker gwm33, under normal and salt-stressconditions (P≤0.0001 and P≤0.01, respectively). The mostsignificant QTL for grain number per spike was on chromo-some 2A (wPt-4533–wPt-9672 interval), with a LOD score of10.3, which explained 25.1 % of the phenotypic variation forthis trait. The presence of Roshan alleles at this QTL resultedin an increase in the grain number per spike by 6.93. Out of 19QTL, 7 were on chromosome 3B and explained between5.1 % and 12.06 % (a total of 54.46 %) of the observedvariation. The presence of Superhead#2 alleles at some QTL
resulted in a decrease in Gnu. For example, their presence attwo QTL on 1B and 3B (QGnu.abrii-3B.4 andQGnu.abrii-1B) resulted in a decrease in the Gnu by 10.22 and 15.24,respectively, under normal conditions, (Table 1). The QTL
Table 2 Overlapping QTL fordifferent traits in all conditions Trait Locations QTL Marker interval or common
markerApproximateposition(CM)
Yld YN-YS-KN-KS QYld.abrii-3B wPt-1484- gwm566 45
YN-YS QYld.abrii-3B 92
YN-KS QYld.abrii-2B1 wmc764 4
YS-KS QYld.abrii-6B1 gwm58 15
YS-KS QYld.abrii-2D1 wPt-9749- wPt-4413 148
KN-KS QYld.abrii-5A wPt-8226 1
Gnu YN-YS QGnu.abrii-1A1 gwm33 48
YN-YS QGnu.abrii-3B wPt-8752 7
YN-KN-KS QGnu.abrii-3B gwm566 50
Tgw YN-YS QTgw.abrii-7D wPt-664438 1
YN-YS QTgw.abrii-2D1 wPt-5426- wPt-666857 163
YS-KN QTgw.abrii-3B 62
KN-KS QTgw.abrii-3B gwm247- wPt-667324 94
SL YN-KN QEl.abrii-4B wPt-8292- wPt-4931 21
KN-KS QEl.abrii-3B wPt-667261 120
Spn YN-YS QSpn.abrii-3B wPt-8752- wPt-1171 7
Sw YN-YS QEw.abrii-1A1 wPt-665613 40
Blyd YN-YS QByld.abrii-2D1 wPt-9749- wPt-4413 136
Table 3 Results of CIM analysis for QTL detection from the means ofthe two control and the two stress sites separately
Trait Marker Interval QTL Locations
Yld wPt-1484- gwm566 QYld.abrii-3B YN-KN
wPt-729904- gwm247 QYld.abrii-3B YN-KN
wmc764- wPt-8737 QYld.abrii-2B1 YN-KN
wPt1484- gwm566 QYld.abrii-3B YS-KS
gwm566- wPt-730063 QYld.abrii-3B YS-KS
gwm58- wPt-664174 QYld.abrii-6B1 YS-KS
Gnu wPt-0122-barc139 QGnu.abrii-3B YN-KN
gwm282 - gwm635 QGnu.abrii-7A YS-KS
wPt-1484- gwm566 QGnu.abrii-3B YS-KS
Tgw wPt-664438- wPt-663984 QTgw.abrii-7D YN-KN
wPt-5426- wPt-666857 QTgw.abrii-2D1 YN-KN
barc139-wmc505.2 QTgw.abrii-3B YN-KN
gwm247- wPt-667324 QTgw.abrii-3B YN-KN
SL wPt-8292- wPt-4931 QEl.abrii-4B YN-KN
wPt-8292- wPt-4931 QEl.abrii-4B YS-KS
wPt-6217- gwm471 QEl.abrii-7A YN-KN
Spn wPt-4533 - wPt-9672 QSpn.abrii-2A YN-KN
wPt-667261-wPt-666738 QSpn.abrii-3B YN-KN
wPt-667746- wPt-8752 QSpn.abrii-3B YS-KS
110 Plant Mol Biol Rep (2015) 33:102–120
effects under normal conditions were greater than under salt-stress conditions and for most QTL, the presence of Roshanalleles resulted in an increase in Gnu (Table 1).
Thousand-Grain Weight
As shown in Supplemental Table 1A, under normal condi-tions, SuperHead#2 had higher Tgw than Roshan. Half (10QTL) of the identified QTL for the trait of Tgw were associ-ated with salt-stress conditions (Table 1). Seven QTL weredetected by more than one software program. Of these, onlythat on 7D (wPt-664438–wPt-663984 interval) was detectedby all software programs. Out of 24 QTL, 4 were detected onlinkage group 2D1; these explained 17.8 % of the phenotypicvariance in Tgw. The strongest QTL for this trait was on 5B1
(wPt-5688–wPt-5851 interval), with a LOD score of 7.5; itexplained 23.7 % of the total phenotypic variance. The allelesfor this QTL came from Superhead#2 and their presenceresulted in an increase in the Tgw by 8.6 g. As expected, thepresence of Roshan alleles for the QTL on 1A1, 4A (2 loci),7A, 2B1, 5B1 (2loci), 6B2and 7D (two loci) resulted in adecrease in the Tgw (Table 1). Alleles of QTLwhose presenceresulted in increases in Tgw under salt-stress conditions wereidentified from both parents.
Spike Length
For SL, 18 QTL were detected in two locations (Table 1); ofthese, only 10 were identified by more than one softwareprogram. Chromosome 3B had the largest number of QTL(five) for this trait under both normal and salt-stress condi-tions. The strongest QTL for SL were on 4B (three loci) in thewPt-8292–wPt4931 interval, with LOD scores of 6.2, 5.1 and3.5, which accounted for 14.5 %, 22.7 % and 7.3 % of thephenotypic variation, respectively. These QTL were detectedby all three software programs under normal conditions. Thealleles for these QTL that increase SL came from Roshan.According to single-marker analysis, marker wPt-8292 onchromosome 4B was linked tightly with this trait (P≤0.001and P≤0.01) under both normal and salt-stress conditions(Table 1). Under salt stress, two QTL were detected on chro-mosomes 7A and 3B, which accounted for 11.9 % and 11.7 %of the observed variation, respectively. Both of these QTLwere detected by more than one software program. The pres-ence of alleles from Roshan at these QTL resulted in anincrease in SL by 0.48 and 1.02 centimetres, respectively.
Spikelet Number per Spike
Four out of nine QTL for the trait of number of Spn wereassociated with salt-stress conditions (Table 1). Five QTLwere detected by more than one software program.Chromosome 3B had four QTL for Spn. Under normal and
salt-stress conditions, QTL for this trait explained 58.3 % and26.9% of the phenotypic variation, respectively. The strongestQTL at two locations were found on chromosomes 2A and3B, which explained 18.0 % and 10.4 % of the observedvariation, respectively. The presence of Roshan alleles at theQTL on 2A, 4A, 2D1 and 3B (2 loci) resulted in an increase inthe Spn.
Spike Weight
QTL analysis for Sw showed four QTL on 1A1 (two loci),2D1, and 5D, all of which had minor effects (Table 1). TwoQTL on 1A1 were identified at the same position under bothnormal and salt-stress conditions, and both were detected bymore than one software program. Marker wPt-665613 on 1A1
was linked tightly to Sw under both conditions.
Biological Yield
Two QTL on 2D1 were associated with Byld (Table 1), oneeach under normal and salt-stress conditions. The presenceof Roshan alleles for these QTL (QByld.abrii-2D1.1 andQByld.abrii-2D1.2) resulted in an increase in Byld by 0.11and 0.48 t/ha (Table 1).
Discussion
This study reported the identifiction of different QTL control-ling yield and yield components in Superhead#2/Roshan pop-ulations. The method of irrigation, homogeneity of soils withhigh salinity and the salt concentration in irrigation water, areimportant parameters for QTL mapping under salt-stress con-ditions. A randomized complete block design with two repli-cations was used for this study. Previous studies used differentnumbers of replications (Elangovan et al 2007; Cuthbert et al.2008; Khedikar et al. 2010; Pinto et al. 2010; Heidari et al.2011; Diaz de Leon et al. 2011) for QTL mapping. A fewstudies have investigated the effects of QTL in wheat and riceon yield and yield components in the field under salt-stressconditions (Quarrie et al. 2005; Manneh et al. 2007; Diaz deLeon et al. 2011).
SuperHead#2×Roshan Linkage Map
In our study, the majority of markers were DArT and finally27 linkage groups for 20 chromosomes were identified.The number of linkage groups on the polyploidy speciescan be higher than the number of haploid chromosomes(Semagn et al. 2006a, 2006b). Spielmeyer et al. (2007)and Srinivasachary et al. (2009) identified 31 and 36 linkagegroups for the 21 wheat chromosomes, respectively. Thissuggests that several areas of the genome remain unidentified
Plant Mol Biol Rep (2015) 33:102–120 111
using the current set of markers. This is probably due to twofactors: (1) the parental genomic structure, and (2) the fact thatthese molecular markers are not well-distributed across allchromosomes and do not sufficiently cover the genome. Thetotal genome coverage in the present study (1,390.3 cM) wasless than that observed for a previous DArT-SSR integratedmap in hexaploid wheat (Genc et al. 2010). This may be due todifferences in the mapping function (Semagn et al. 2006a),mapping software, population size andmarker number. A totalof 77 molecular markers remained unlinked in the final mapconstructed in our study. Semagn et al. (2006a) and Khedikaret al. (2010) incorporated 624 and 56 markers out of 904 and67 markers into their linkage maps, respectively. The respec-tive numbers of markers left unlinked were 280 and 11,respectively.
In total, 109 DArT (17.86 %) and three SSR markers(10 %) showed significant (P<0.05) segregation distortionin this study. This phenomenon was also identified in previousstudies (Semagn et al. 2006b; Singh et al. 2007; Peleg et al.2008; Genc et al. 2010) and having highest probability in anRIL population, due to five to six generations of selfing (Singhet al. 2007). By using distorted markers in the present study,no changes were observed in most of linkage groups. Most ofhighly skewed markers with P≤0.0001 could not enter thefinal map and remained unlinked in the final map. A few ofthese can be included in the map but they altered the order ofloci or were at the same positions as other markers, so they didnot fill the gaps (data not shown). In order to avoid a biasedestimate of marker-trait association (Gupta 2002) or spuriouslinkage (Kammholz et al. 2001), distorted markers were ex-cluded from the analysis as reported by previous studies (Xueet al. 2009; Genc et al. 2010; Heidari et al. 2011). Someresearchers have used distorted markers for linkage map con-struction (Quarrie et al. 2005; Elangovan et al. 2008; Khedikaret al. 2010). To assign linkage groups to chromosomes, themarkers in each linkage group were compared with the dataset received from Triticarte. In addition, each linkage group(except those on 5A, 5B2, 3D, 6D1, and 6D2) had at least twomarkers (SSR, DArT, or both) and a maximum of 17 markers(on 4A), in agreement with one of the previous integratedDArT-SSR linkage maps (Semagn et al. 2006b; Akbari et al.2006; Crossa et al. 2007; Montovani et al. 2008; Peleg et al.2008; Jing et al. 2009).
QTL Analysis
Specific QTL for Normal and Salt-Stress Conditions and theirEffects
Some of the QTL for Yld were identified only in associationwith either normal or stress conditions (Table 1). Salt stresshas been reported to affect the detection and expression ofQTL or make them detectable only under one type of
environmental condition (Villalta et al. 2007; Xue et al.2009). Environmental stress, such as salt stress, can also lowerthe LOD below a significant threshold. The genotype (RIL)×location interaction was significant for the evaluated traits(Supplemental Table 1B). Inconsistent detection of QTL andQTL effects across environments may be explained by aQTL×environment interaction. QTL associated with in-creased Yld under stress conditions came from the Roshangenotype. Alleles for these QTL increased Yld from 0.14 to0.31 t/ha. Of the 24 identified QTL, 14 were present onlyunder stress conditions (Table 1). Some of these ”stress”QTLsco-localized with QTL previously identified under normalconditions (Huang et al. 2004, 2006; Cuthbert et al. 2008;Kumar et al. 2007) (Table 1).While some of the detected QTLhave been reported previously, the QTL identified in thepresent study have two features: (1) QTL for grain yieldidentified on 1A, 2B, 3B, 6B2, and 2D1 were novel and notpreviously reported, and (2) some of the QTL detected on 6B1
and 2D1 for grain yield under stress conditions were in thesame approximate position as previously detected QTLs forthis trait under normal conditions.
QTLs in Chromosome Groups
Two QTL for grain yield were detected on 1A1. QYld.abrii-1A1.2was tightly linked to SSRmarker gwm357. This markeris between two QYlds that were identified by Cuthbert et al.(2008) and Huang et al. (2004). Crossa et al. (2007) used twolinear mixed models to assess marker-trait associations. Theyidentified significant associations between grain yield and theDArT markers, wPt-0100 and wPt-3132 on chromosome 2B.In the present study, QYld.abrii-2B1.2 and QYld.abrii-2B3
were associated with these respective markers (Fig. 2).There is similar result on chromosome 2B for Tgw in thisand a previous study (Fig. 2). The DArT marker wPt-4413, on2D1, was found to be linked to a Yld QTL identified in thepresent study (Fig. 2), and by Crossa et al. (2007). Using twodifferent mapping populations, Kumar et al. (2007) identifiedtwo QTL for grain yield that were linked to two SSR markers,gwm261 and wmc41, on chromosome 2D. In addition,Narasimhamoorthy et al. (2006) detected a QTL for grainyield linked to gwm261. These SSR markers (gwm261 andwmc41) were linked (3.2 and 1.6 cM, respectively) to theDArT marker wPt-4413 according to the linkage map ofCrossa et al. (2007). Four QTL for Tgw (Huang et al. 2004and 2006; Cuthbert et al. 2008) were identified close (from1.7 cM for gwm296 to 7.9 cM for wmc601) to the DArTmarker wPt-4413 on chromosome 2D according to the linkagemap of Crossa et al. (2007) (Fig. 2). Two detected QTL(QTgw.abrii-2D1 and QTgw.abrii-2D3) identified in the pres-ent study were also close to DArTmarker wPt-4413. Four YldQTL on chromosome 3B were associated with the SSR mark-er gwm566 in the present study (Fig. 2), which was mapped
112 Plant Mol Biol Rep (2015) 33:102–120
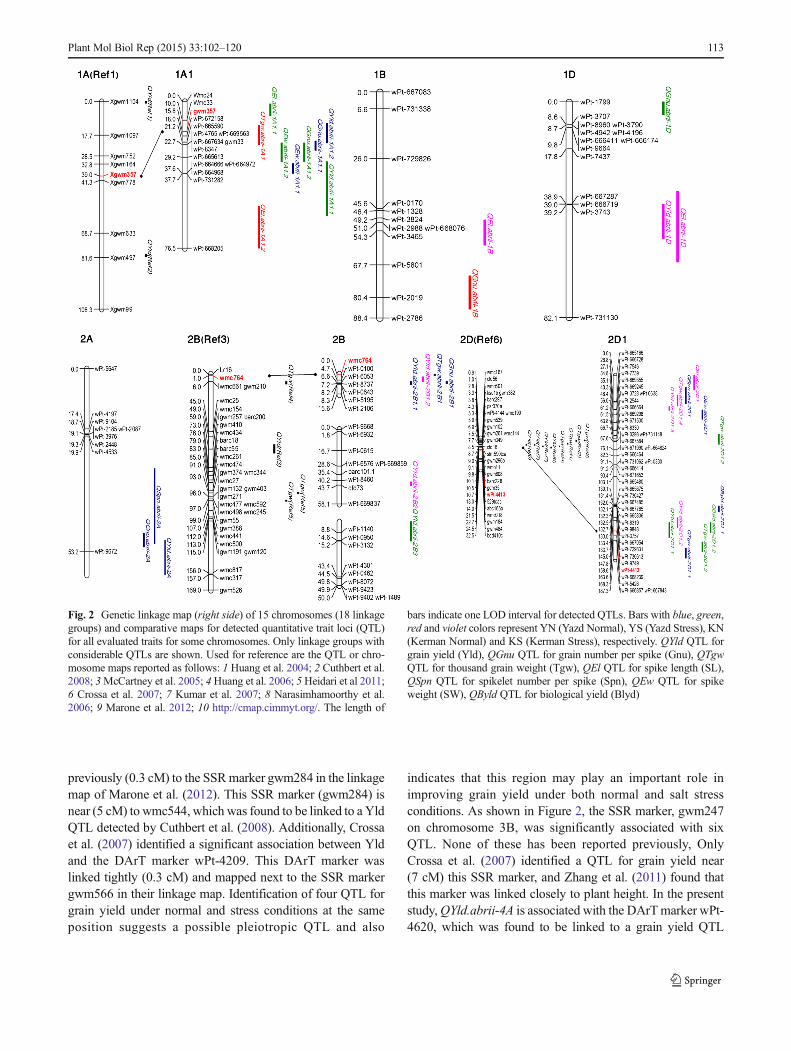
previously (0.3 cM) to the SSRmarker gwm284 in the linkagemap of Marone et al. (2012). This SSR marker (gwm284) isnear (5 cM) to wmc544, which was found to be linked to a YldQTL detected by Cuthbert et al. (2008). Additionally, Crossaet al. (2007) identified a significant association between Yldand the DArT marker wPt-4209. This DArT marker waslinked tightly (0.3 cM) and mapped next to the SSR markergwm566 in their linkage map. Identification of four QTL forgrain yield under normal and stress conditions at the sameposition suggests a possible pleiotropic QTL and also
indicates that this region may play an important role inimproving grain yield under both normal and salt stressconditions. As shown in Figure 2, the SSR marker, gwm247on chromosome 3B, was significantly associated with sixQTL. None of these has been reported previously, OnlyCrossa et al. (2007) identified a QTL for grain yield near(7 cM) this SSR marker, and Zhang et al. (2011) found thatthis marker was linked closely to plant height. In the presentstudy,QYld.abrii-4A is associated with the DArTmarker wPt-4620, which was found to be linked to a grain yield QTL
Fig. 2 Genetic linkage map (right side) of 15 chromosomes (18 linkagegroups) and comparative maps for detected quantitative trait loci (QTL)for all evaluated traits for some chromosomes. Only linkage groups withconsiderable QTLs are shown. Used for reference are the QTL or chro-mosome maps reported as follows: 1 Huang et al. 2004; 2 Cuthbert et al.2008; 3McCartney et al. 2005; 4 Huang et al. 2006; 5 Heidari et al 2011;6 Crossa et al. 2007; 7 Kumar et al. 2007; 8 Narasimhamoorthy et al.2006; 9 Marone et al. 2012; 10 http://cmap.cimmyt.org/. The length of
bars indicate one LOD interval for detected QTLs. Bars with blue, green,red and violet colors represent YN (Yazd Normal), YS (Yazd Stress), KN(Kerman Normal) and KS (Kerman Stress), respectively. QYld QTL forgrain yield (Yld), QGnu QTL for grain number per spike (Gnu), QTgwQTL for thousand grain weight (Tgw), QEl QTL for spike length (SL),QSpn QTL for spikelet number per spike (Spn), QEw QTL for spikeweight (SW), QByld QTL for biological yield (Blyd)
Plant Mol Biol Rep (2015) 33:102–120 113
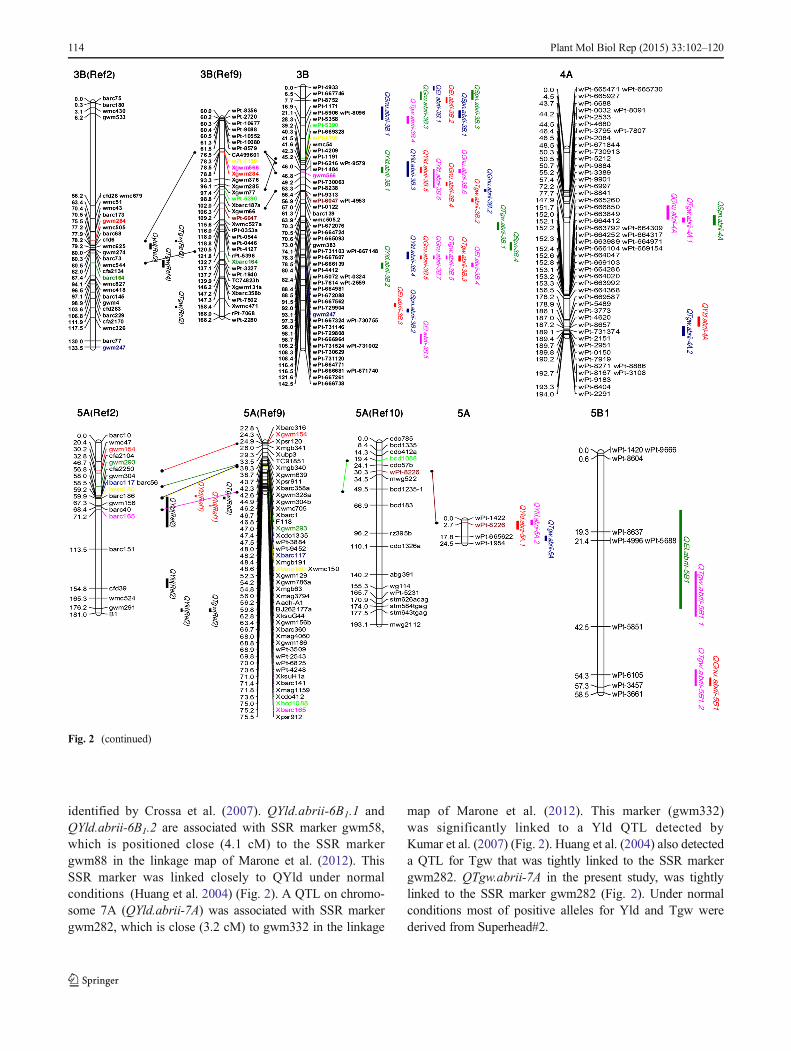
identified by Crossa et al. (2007). QYld.abrii-6B1.1 andQYld.abrii-6B1.2 are associated with SSR marker gwm58,which is positioned close (4.1 cM) to the SSR markergwm88 in the linkage map of Marone et al. (2012). ThisSSR marker was linked closely to QYld under normalconditions (Huang et al. 2004) (Fig. 2). A QTL on chromo-some 7A (QYld.abrii-7A) was associated with SSR markergwm282, which is close (3.2 cM) to gwm332 in the linkage
map of Marone et al. (2012). This marker (gwm332)was significantly linked to a Yld QTL detected byKumar et al. (2007) (Fig. 2). Huang et al. (2004) also detecteda QTL for Tgw that was tightly linked to the SSR markergwm282. QTgw.abrii-7A in the present study, was tightlylinked to the SSR marker gwm282 (Fig. 2). Under normalconditions most of positive alleles for Yld and Tgw werederived from Superhead#2.
Fig. 2 (continued)
114 Plant Mol Biol Rep (2015) 33:102–120
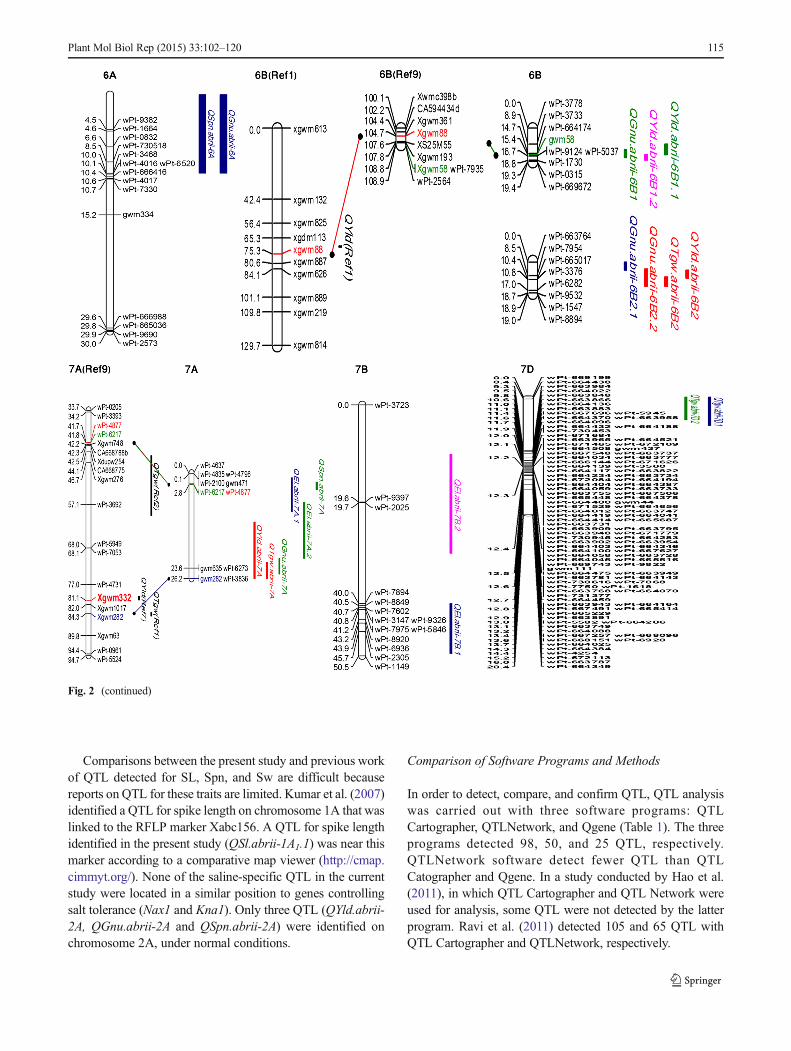
Comparisons between the present study and previous workof QTL detected for SL, Spn, and Sw are difficult becausereports on QTL for these traits are limited. Kumar et al. (2007)identified a QTL for spike length on chromosome 1A that waslinked to the RFLP marker Xabc156. A QTL for spike lengthidentified in the present study (QSl.abrii-1A1.1) was near thismarker according to a comparative map viewer (http://cmap.cimmyt.org/). None of the saline-specific QTL in the currentstudy were located in a similar position to genes controllingsalt tolerance (Nax1 and Kna1). Only three QTL (QYld.abrii-2A, QGnu.abrii-2A and QSpn.abrii-2A) were identified onchromosome 2A, under normal conditions.
Comparison of Software Programs and Methods
In order to detect, compare, and confirm QTL, QTL analysiswas carried out with three software programs: QTLCartographer, QTLNetwork, and Qgene (Table 1). The threeprograms detected 98, 50, and 25 QTL, respectively.QTLNetwork software detect fewer QTL than QTLCatographer and Qgene. In a study conducted by Hao et al.(2011), in which QTL Cartographer and QTL Network wereused for analysis, some QTL were not detected by the latterprogram. Ravi et al. (2011) detected 105 and 65 QTL withQTL Cartographer and QTLNetwork, respectively.
Fig. 2 (continued)
Plant Mol Biol Rep (2015) 33:102–120 115
The efficiency of QTL mapping can be improved by theuse of cofactors in CIM analysis, which can eliminate theeffects of additional QTL outside a defined interval (Jansenet al. 1993; Zeng et al. 1994). The accuracy with whichcofactors are selected and the number of cofactors that areused are very important. In our case, the cofactors wereselected by the same method (i.e., stepwise) in both of thesoftware programs QTL Cartographer and Ogene. Only 40QTL were detected by more than one software program. It hasbeen reported that the detection of a QTL is more reliablewhen it is identified by more than one program (Ravi et al.2011). Moncada et al. (2001) reported that a conservativeapproach is to focus on those QTL that are detected byat least two of three methods of QTL analysis or inmultiple environments. Almost all of the LOD valuesand LOD thresholds of the same QTL detected byQgene were lower than those with QTL Cartographerin this study. In addition, like previous studies (Thomsonet al. 2010; Ravi et al. 2011), phenotypic variation explainedby QTL Cartographer was higher than those of QTLNetworkand Qgene in the present study.
Phenotypic Variation and Confidence Interval
The amount of phenotypic variation explained by most of thedetected QTL was low for all traits. Only 1–3 QTL madenotable contributions in explaining phenotypic variation ineach trait. This may be attributable to the complex and poly-genic nature of yield and yield components, which are con-trolled by a large number of major and minor QTL (Kumaret al. 2007). As indicated in Table 1, most of the detected QTLexplained less than 10 % of the phenotypic variation for aspecific trait (i.e., were minor effect). The heritability of theanalyzed traits was low, which explained why these QTLwerenot able to sufficiently account for the phenotypic variation ineach trait (Supplemental Table 1A). The 95 % confidenceinterval (CI) of some QTL on 1A1, 1D, 2A, 4B, and 5B1
was large (more than 20 cM) which may be attributable to thesmall size of the population (186 individuals) utilized in thecurrent study. These large segments either contain a singleQTL or several tightly linked QTL, which could be deter-mined by fine mapping (Ma et al. 2007). Increasing thenumber of markers to reach a density of one every 15 cM(Kearsey and Farquhar 1998), or even having an infinitenumber of markers (Darvasi et al. 1993), will not reduce thesize of the CI, while increasing the number of genotypes hasbeen reported to greatly improve the resolution of QTL detec-tion (Darvasi et al. 1993; Kearsey and Farquhar 1998). This isimportant because large CIs, as encountered for some theQTLs in the current study, makes it difficult to distinguishbetween two QTL on the same chromosome unless they arefar apart (Kearsey 1998).
QTL Clusters and Pleiotropy
QTL clusters including different traits were detected on 1A1
(gwm33–gwm357), 2B1 (wmc764–wPt-0100), 3B(wPt1159–gwm566 and gwm247–wPt-667324), 4A(wPt-9901–wPt-8841), 6B1 (wPt-9124–gwm58), 6B2
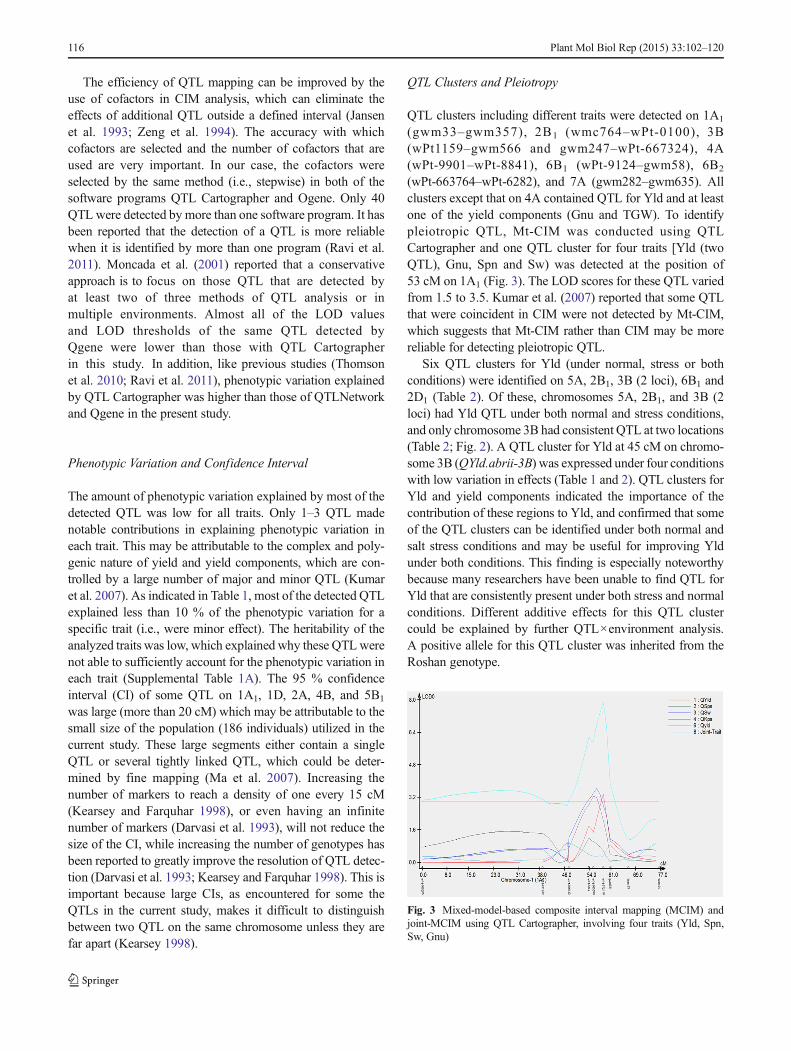
(wPt-663764–wPt-6282), and 7A (gwm282–gwm635). Allclusters except that on 4A contained QTL for Yld and at leastone of the yield components (Gnu and TGW). To identifypleiotropic QTL, Mt-CIM was conducted using QTLCartographer and one QTL cluster for four traits [Yld (twoQTL), Gnu, Spn and Sw) was detected at the position of53 cM on 1A1 (Fig. 3). The LOD scores for these QTL variedfrom 1.5 to 3.5. Kumar et al. (2007) reported that some QTLthat were coincident in CIM were not detected by Mt-CIM,which suggests that Mt-CIM rather than CIM may be morereliable for detecting pleiotropic QTL.
Six QTL clusters for Yld (under normal, stress or bothconditions) were identified on 5A, 2B1, 3B (2 loci), 6B1 and2D1 (Table 2). Of these, chromosomes 5A, 2B1, and 3B (2loci) had Yld QTL under both normal and stress conditions,and only chromosome 3B had consistent QTL at two locations(Table 2; Fig. 2). A QTL cluster for Yld at 45 cM on chromo-some 3B (QYld.abrii-3B) was expressed under four conditionswith low variation in effects (Table 1 and 2). QTL clusters forYld and yield components indicated the importance of thecontribution of these regions to Yld, and confirmed that someof the QTL clusters can be identified under both normal andsalt stress conditions and may be useful for improving Yldunder both conditions. This finding is especially noteworthybecause many researchers have been unable to find QTL forYld that are consistently present under both stress and normalconditions. Different additive effects for this QTL clustercould be explained by further QTL×environment analysis.A positive allele for this QTL cluster was inherited from theRoshan genotype.
Fig. 3 Mixed-model-based composite interval mapping (MCIM) andjoint-MCIM using QTL Cartographer, involving four traits (Yld, Spn,Sw, Gnu)
116 Plant Mol Biol Rep (2015) 33:102–120

Pleiotropy is another possible explanation for the presenceof QTL clusters (Huang et al. 2006). The co-localised QTLidentified in the present study for yield and yield componentssuggests that either a single QTL controls these traits(pleiotropic) or that several tightly linked QTL are presentwithin these regions. Either way, these are very importantregions in the wheat genome under both normal and salt stressconditions. As indicated in Supplemental Table 2A, a signif-icant positive correlation was observed between yield andyield components under normal conditions. Under stress con-ditions, however, only the correlation between Yld and Tgwwas significant. Thus, pleiotropy may exist because of theobserved significant correlation among yield and yield com-ponents (Kumar et al. 2007; Cuthbert et al. 2008). The use ofmore markers and increased population size are required toclarify pleotropic or close linkage effects for these traits(Huang et al. 2006).
QTL×QTL Interactions
QTL×QTL (QQ) interactions for different traits wascalculated using QTLNetwork. Six pairs of QTL wereinvolved in epistatic QQ interactions (Table 4). Theseepistatic effects explained 2.1–10.28 % of the phenotyp-ic variation. One QQ interaction (1A1 and 2D1) wasdetected for Yld under stress conditions. Interestingly,both QTL were detected only by QTLNetwork andneither of them had additive effects. This epistasis in-creased Yld by 0.17 t/ha and explained 6.15 % of thephenotypic variation. Three QQ interactions were detect-ed for spike length under normal and stress conditions(Table 4). Detection of many minor effects QTL for theexamined traits, especially Yld, and the existence of QQand maybe QE interactions in normal and salt stressconditions indicate the complex nature of yield andyield components.
Application for Plant Breeding
Based on a recent estimate, 44.5 million ha of the surface areaof the country and 6.8 million ha of agricultural lands in Iran isaffected by different degrees of salinity (FAO, 2012).Wheat iscultivated in more than 6.6 million ha farm lands, and wheatproduction is affected by salt-affected soils in different regionsof the country.
Several important genomic regions on 1A, 2B, 3B (at 45and 93 cM), 6B and 2D1 and somemajor QTL were identifiedin present study (Table 1; Fig. 2). Marker-assistedbackcrossing (MAB) can be used for introgression of majorQTL into new lines. Often, it may be useful to combine moremajor QTL into the same line (QTL pyramiding) for devel-opment of new wheat varieties with higher level of salt toler-ance. The closely linked markers identified on QYld.abrii-1A1.1, QYld.abrii-3B.1, QGnu.abrii-2A and QTgw.abrii-5B1.1, could be used to develop new varieties throughMAB. Finally, the improved varieties may increase wheatgrain yield in Iran.
Conclusion
Mapping of QTL for stress tolerance in wheat is important forbreeding programs; however, the large size of the wheatgenome and the complexity of yield and yield-related traitsmake such mapping difficult. The detection of a large numberof QTL (tens or hundreds) for each quantitative trait (QT),with low explained phenotypic variation, in the current andprevious studies indicates that these QTs are controlled bymany genes. Therefore, breeding for these traits will requiredetailed information on different part of experiment. Some ofthe QTL identified for Yld were present only when the inbredline was grown under salt stress conditions, suggesting thatthese QTL were linked to salt stress. A number of factorsshould be considered to accurately determine QTL for
Table 4 QTL×QTL interactionsfor different traits in Roshan×Superhead#2 mapping populationby QTLNetwork
Trait Location QTL Marker interval Position (CM) R2% AA P-value
Yld YS 1A1 wPt-665613-wPt-8347 53.4 6.15 0.17 0.00050YS 2D1 wPt-0298-wPt-731148 67.6
Gnu YS 2D1 wPt-667054-wPt-729831 133.4 10.28 3.26 0.00000YS 6D2 wPt-0653-wPt-730912 27.1
Sw YN 7D wPt-666144-wPt-671626 12.2 4.91 −0.58 0.00000YN 7D wPt-664139-wPt-3500 12.3
SL KN 3B wPt-5906-wPt-1171 23.1 6.6 0.68 0.00001KN 3B wPt-666738-wmc505.2 146.3
SL YS 7A gwm635-wPt-4877 11.6 2.1 −0.33 0.04730YS 5B1 wPt-5688-wPt-5851 28.4
SL KS 4A wPt-9901-wPt-6997 70.5 6.96 0.85 0.00021KS 3B wPt-8238-wPt-667148 62.2
Plant Mol Biol Rep (2015) 33:102–120 117
complex traits. These include: the size and type of the popu-lation, good marker density, multiple environments, homoge-neity within each environment, QTL×environment interac-tion analysis, different QTL analysis software, appropriateanalytical methods, accuracy of cofactor selection and thenumber of cofactors utilized. Careful consideration for all ofthese parameters will help us to detect accurate and depend-able QTL for use in breeding programs.
Acknowledgment This research was supported by the AgriculturalBiotechnology Research Institute of Iran (ABRII).
References
Akbari M, Wenzl P, Caig V, Carlig J, Xia L, Yang S, Uszynski G, MohlerV, Ehmensiek A, Howes N, Sharp P, Huttner E, Kilian A (2006)Diversity arrays technology (DArT) for highthroughput profiling ofthe hexaploid wheat genome. Theor Appl Genet 113:1409–1420
Börner A, Schumann E, Furste A, Coster H, Leithold B, Röder MS,Weber WE (2002) Mapping of quantitative trait loci determiningagronomic important characters in hexaploid wheat (Triticumaestivum L). Theor Appl Genet 105:921–936
Churchill GA, Doerge RW (1994) Empirical threshold values for quan-titative trait mapping. Genetics 138:963–971, PMID:7851788
Crossa J, Burgueño J, Dreisigacker S, Vargas M, Herrera-Foessel SA,Lillemo M, Singh RP, Trethowan R, Warburton M, Franco J,Reynolds M, Crouch JH, Ortiz R (2007) Association analysis ofhistorical bread wheat germplasm using additive genetic covarianceof relatives and population structure. Genetics 177:1889–1913
Cuthbert JL, Somers DJ, Brûlé-Babel AL, Brown PD, Crow GH (2008)Molecular mapping of quantitative trait loci for yield and yieldcomponents in spring wheat (Triticum aestivum L.). Theor ApplGenet 117:595–608
Darvasi A, Weinreb A, Minke V, Weller JI, Soller M (1993) Detectingmarker-QTL linkage and estimating QTL gene effect and maplocation using a saturated genetic map. Genetics 134:943–51
Díaz De León JL, Escoppinichi R, Geraldo N, Castellanos T, Mujeeb-Kazi A, Röder MS (2011) Quantitative trait loci associated withsalinity tolerance in field grown bread wheat. Euphytica 181:371–383
Dubcovsky J, Maria GS, Epstein E et al (1996) Mapping of the K+/Na+
discrimination locus Kna1 in wheat. Theor Appl Genet 92:448–454Edwards J, Shavrukov Y, Ramsey C, TesterM, Langridge P, Schnurbusch
T (2008) Identification of a QTL on chromosome 7AS for sodiumexclusion in bread wheat. In: Appels R, Eastwood R, Lagudah E,Langridge P, Mackay M, McIntyre L, Sharp P (eds) Proc. 11th Int.Wheat Genetics Symposium. Brisbane, vol 3. Sydney UniversityPress, Sydney, pp 891–893
Elangovan M, Rai R, Dholakia BB, LaguMD, Tiwari R, Gupta RK, RaoVS, Röder MS, Gupta VS (2008) Molecular genetic mapping ofquantitative trait loci associatedwith loaf volume in hexaploid wheat(Triticum aestivum). J Cereal Sci 47:587–598
FAO (2012) Status and NewDevelopments on the Use of BrackishWaterfor Agricultural Production in the Near East. Iran Country Report
Flowers T, Yeo A (1995) Breeding for salinity resistance in crop plants:where next? Aust J Plant Physiol 22:875–884
GencY, OldachK, Verbyla AP, Lott G, HassanM, TesterM,WallworkH,McDonald GK (2010) Sodium exclusion QTL associated withimproved seedling growth. in bread wheat under salinity stress.Theor Appl Genet 121:877–894
Gupta PK (2002) Molecular markers and QTL analysis in crop plants.Curr Sci 83:113–114
Gupta PK, Balyan HS, Edwards KJ, Isaac P, Korzun V, Roder M, GautierMF, Joudrier P, Schlatter AR, Dubcovsky J, De la Pena RC,Khairallah M, Penner G, Hayden MJ, Sharp P, Keller B, WangRCC, Hardouin JP, Jack P, Leroy P (2002) Genetic mapping of 66new microsatellite (SSR) loci in bread wheat. Theor Appl Genet105:413–422
Guyomarc’h H, Sourdille P, Edwards KJ, Bernard M (2002) Studies ofthe transferability of microsatellites derived from Triticum tauschiito hexaploid wheat and to diploid related species using amplifica-tion, hybridization and sequence comparisons. Theor Appl Genet105:736–744
Hao Y, Chen Z, Wang Y, Bland D, Buck J, Brown-Guedira G, Johnson J(2011) Characterization of a major QTL for adult plant resistance tostripe rust in US soft red winter wheat. Theor Appl Genet 123:1401–1411
Heidari B, Sayed-Tabatabaei BE, Saeidi G, Kearsey M, Suenaga K(2011) Mapping QTL for grain yield, yield components, and spikefeatures in a doubled haploid population of bread wheat. Genome54:517–527
Huang XQ, Kempf H, Ganal MW, Ro¨der MS (2004) Advanced back-cross QTL analysis in progenies derived from a cross between aGerman elite winter wheat variety and synthetic wheat (Triticumaestivum L.). Theor Appl Genet 109:933–943
Huang XQ, Cloutier S, Lycar L, Radovanovic N, Humphreys DG, NollJS, Somers DJ, Brown PD (2006) Molecular detection of QTL foragronomic and quality traits in a doubled haploid population derivedfrom two Canadian wheats (Triticum aestivum L.). Theor ApplGenet 113:753–766
SAS Institute (1990) SAS/STAT user’s guide: version 6 (vol 2). SASInstitute, Cary, NC
Jansen RC (1993) Interval mapping of multiple quantitative trait loci.Genetics 135:205–211
Jing HC, Bayon C, Kanyuka K, Berry S, Wenzl P, Huttner E, Kilian A,Hammond-Kosack KE (2009) DArT markers: diversity analyses,genomes comparison, mapping and integration with SSRmarkers inTriticum monococcum. BMC Genomics 10:458
Joehanes R, Nelson JC (2008) QGene 4.0, an extensible JavaQTLanalysis platform. Bioinformatics. i:10.1093/bioinformatics/btn523
Kammholz SJ, Campbell AW, Sutherland MW, Hollamby GJ, Martin PJ,Eastwood RF, Barclay I, Wilson RE, Brennan PS, Sheppard JA(2001) Establishment and characterisation of wheat genetic mappingpopulations. Aust J Agric Res 52:1079–1088
Kato K, Miura H, Sawada S (2000) Mapping QTL controlling grain yieldand its components on chromosome 5A of wheat. Theor Appl Genet101:1114–1121
Kearsey MJ (1998) The principles of QTL analysis (a minimal mathe-matics approach). J Exp Bot 49:1619–1623. doi:10.1093/jexbot/49.327.1619
Kearsey MJ, Farquhar AGL (1998) QTL analysis in plants: where are wenow? Heredity 80:137–142
Khedikar YP, Gowda MVC, Sarvamangala C, Patgar KV,Upadhyaya HD, Varshney RK (2010) A QTL study on lateleaf spot and rust revealed one major QTL for molecular breed-ing for rust resistance in groundnut (Arachis hypogaea L.). TheorAppl Genet 121:971–984
Kosambi DD (1944) The estimation of map distances from recombina-tion values. Ann Eugen 12:172–175
Koyama ML, Levesley A, Koebner RMD, Flowers TJ, Yeo AR (2001)Quantitative trait loci for component physiological trait determiningsalt tolerance in rice. Plant Physiol 125:406–422
Kuchel H, Williams KJ, Langridge P, Eagles HA, Jefferies SP (2007)Genetic dissection of grain yield in bread wheat. I. QTL analysis.Theor Appl Genet 115:1029–1041
118 Plant Mol Biol Rep (2015) 33:102–120
Kumar N, Kulwal PL, Balyan HS, Gupta PK (2007) QTL mapping foryield and yield contributing traits in two mapping population ofbread wheat. Mol Breed 19:163–177. doi:10.1007/s11032-006-9056-8
Lin HX, ZhuMZ, YanoM, Gao JP, Liang ZW, SuWA, Hu XH, Ren ZH,Chao DY (2004) QTL for Na and K uptake of the shoots and rootscontrolling rice salt tolerance. Theor Appl Genet 108:253–260
LindsayMP, Lagudah ES, Hare RA, Munns R (2004) A locus for sodiumexclusion (Nax1), a trait for salt tolerance, mapped in durum wheat.Funct Plant Biol 31:1105–1114
Ma L, Zhou E, Huo N, Zhou R,Wang G, Jia J (2007) Genetic analysis ofsalt tolerance in a recombinant inbred population of wheat (Triticumaestivum L.). Euphytica 153:109–117
Manly KF, Cudmore RH, Meer JM (2001) Map Manager QTX, cross-platform software for genetic mapping. Mamm Genome 12:930–932
Manneh B, Stam P, Struik PC, Bruce-Oliver S, Van Eeuwijk FA (2007)QTL-based analysis of genotype-by-environment interaction forgrain yield of rice in stress and non-stress environments.Euphytica 156:213–226
Mantovani P, Maccaferri M, Sanguineti MC, Tuberosa R, Catizone I,Wenzl P, Thomson B, Carling J, Huttner E, DeAmbrogio E, KilianA (2008) An integrated DArT-SSR linkage map of durum wheat.Mol Breed 22:629–648
MaroneD, LaidòG, Gadaleta A, Colasuonno P, Ficco DB, Giancaspro A,Giove S, Panio G, Russo MA, De Vita P, Cattivelli L, Papa R,Blanco A, Mastrangelo AM (2012) A high-density consensus mapof A and B wheat genomes. Theor Appl Genet 125:1619–38
Marza F, Bai GH, Carver BF, Zhou WC (2006) Quantitative trait loci foryield and related traits in the wheat population Ning7840×Clark.Theor Appl Genet 112:688–98
McCartney CA, Somers DJ, Humphreys DG, Lukow O, Ames N, Noll J,Cloutier S, McCallum BD (2005) Mapping quantitative trait locicontrolling agronomic traits in the spring wheat cross RL4452·‘ACDomain’. Genome 48:870–883
Moncada P, Martínez CP, Borrero J, Chatel M, Gauch H, Guimaraes E,Tohme J, McCouch SR (2001) Quantitative trait loci for yield andyield components in an Oryza sativa×Oryza rufipogon BC2F2population evaluated in an upland environment. Theor Appl Genet102:41–52
Narasimhamoorthy B, Gill BS, Fritz AK, Nelson JC, Brown-Guedira GL (2006) Advanced backcross QTL analysis of ahard winter wheat x synthetic wheat population. Theor ApplGenet 112:787–96
Ogbonnaya FC, Huang S, Steadman E, Livinus E, Dreccer F, LagudahES, Munns R (2008) Mapping quantitative trait loci associated withsalinity tolerance in synthetic derived backcrossed bread lines. The11th InternationalWheat Genetics Symposium proceedings. SydneyUniversity Press, Sydney
Peleg Z, Saranga Y, Suprunova T, Ronin Y, Röder MS, Kilian A, KorolAB, Fahima TM (2008)High-density genetic map of durumwheat xwild emmer wheat based on SSR and DArT markers. Theor ApplGenet 117:103–115
Pinto RS, Reynolds MP, Mathews KL, McIntyre CL, Olivares-Villegas JJ, Chapman SC (2010) Heat and drought adaptiveQTL in a wheat population designed to minimize confound-ing agronomic effects. Theor Appl Genet 121:1001–1021.doi: 10.1007/s00122-010-1351-4
Qadir M, Qureshi AS, Cheraghi SAM (2008) Extent and charateristion ofsalt-affected soils in Iran and strategies for their amelioration andmanagement. Land Degrad Dev 19:214–227
Quarrie SA, Steed A, Calestani C, Semikhodskii A, Lebreton C, ChinoyC, Steele N, Pljevljakusic D, Waterman E, Weyen J, SchondelmaierJ, Habash DZ, Farmer P, Saker L, Clarkson DT, Abugalieva A,Yessimbekova M, Turuspekov Y, Abugalieva S, Tuberosa R,Sanguineti MC, Hollington PA, Aragues R, Royo A, Dodig D(2005) A high-density genetic map of hexaploid wheat (Triticum
aestivum L.) from the cross Chinese Spring×SQ1 and its use tocompare QTL for grain yield across a range of environments. TheorAppl Genet 110:865–880
Ravi K, Vadez V, Isobe S, Mir RR, Guo Y, Nigam SN, GowdaMV, Radhakrishnan T, Bertioli DJ, Knapp SJ, Varshney RK(2011) Identification of several small main-effect QTL and alarge number of epistatic QTL for drought tolerance relatedtraits in groundnut (Arachis hypogaea L.). Theor Appl Genet122:1119–1132
Richards RA (1983) Should selection for yield be made on saline or non-saline soils? Euphytica 32:431–438
Röder M, Korzun V, Wendehake K, Plaschke J, Tixier MH, Leory P,Ganal MW (1998) A microsatellite map of wheat. Genetics 149:2007–2023
Semagn K, Bjørnstad Å, Ndjiondjop N (2006a) Principles, requirementsand prospects of genetic mapping in plants. Afr J Biotechnol 5:2569–2587
Semagn K, Bjørnstad Å, Skinnes H, Marøy AG, Tarkegne T, William M(2006b) Distribution of DArT, AFLP, and SSR markers in a geneticlinkage map of a doubled haploid hexaploid wheat population.Genome 49:545–555
Singh K, Ghai M, Garg M, Chhuneja P, Kaur P, Schnurbusch T, Keller B,Dhaliwal HS (2007) An integrated molecular linkagemap of diploidwheat based on a Triticum boeoticum x T. monococcum RIL popu-lation. Theor Appl Genet 115:301–12
Song QJ, Fickus EW, Cregan PB (2002) Characterization of trinucleotideSSR motifs in wheat. Theor Appl Genet 104:286–293
Song QJ, Shi JR, Singh S, Fickus EW, Costa JM, Lewis J et al (2005)Development and mapping of microsatellite (SSR) markers inwheat. Theor Appl Genet 110:550–560. doi:10.1007/s00122-004-1871
Spielmeyer W, Hyles J, Joaquim P, Azanza F, Bonnett D, Ellis ME,Moore C, Richards RA (2007) A QTL on chromosome 6A in breadwheat (Triticum aestivum) is associated with longer coleoptiles,greater seedling vigour and final plant height. Theor Appl Genet115:59
Srinivasachary, Gosman N, Steed A, Hollins TW, Bayles R, Jennings P,Nicholson P (2009) Semi-dwarfing Rht-B1 and Rht-D1 loci ofwheat differ significantly in their influence on resistance toFusarium head blight. Theor Appl Genet 118:695
Tanksley SD (1993) Mapping polygenes. Annu Rev Genet 27:205–233Thomson MJ, Ocampo MD, Egdane J, Rahman MA, Sajise AG,
Adorada DL, Tumimbang-Raiz E, Blumwald E, Seraj ZI,Singh RK, Gregorio GB, Ismail AM (2010) Characterizingthe saltol quantitative trait locus for salinity tolerance in rice.Rice 3:148–160
Villalta I, Bernet GP, Carbonell EA, Asins MJ (2007) Comparative QTLanalysis of salinity tolerance in terms of fruit yield using twoSolanum populations of F7 lines. Theor Appl Genet 114:1001–1017
Voorrips RE (2002) MapChart: software for the graphical presen-tation of linkage maps and QTL. J Hered 93:77–78. doi:10.1093/jhered/93.1.77
Wang Z, Cheng J, Chen Z, Huang J, Bao Y, Wang J, Zhang H (2012a)Identification of QTL with main, epistatic and QTL×environmentinteraction effects for salt tolerance in rice seedlings under differentsalinity conditions. Theor Appl Genet 125:807–15
Wang S, Basten CJ, Zeng ZB (2012b) Windows QTL Cartographer 2.5.Department of Statistics, North Carolina State University, Raleigh,NC. http://statgen.ncsu.edu/qtlcart/WQTLCart.htm
Xu YF, An DG, Liu DC, Zhang AM, Xu HX, Li B (2012)Mapping QTL with epistatic effects and QTL×treatment in-teractions for salt tolerance at seedling stage of wheat. Euphytica186:233–245
Xue D, Huang Y, Zhang X, Wei K, Westcott S, Li C, Chen M,Zhang G, Lance R (2009) Identification of QTL associated
Plant Mol Biol Rep (2015) 33:102–120 119
with salinity tolerance at late growth stage in barley. Euphytica169:187–196
Yang J, Hu C, Hu H, Yu R, Xia Z, Ye X, Zhu J (2008) QTLNetwork:mapping and visualizing genetic architecture of complex traits inexperimental populations. Bioinformatics 24:721–723
Zeng ZB (1994) Precision mapping of quantitative trait loci. Genetics136(4):1457–68
Zhang LP, Xu XQ, Zhao CP, Shan FH, Yuan S, Sun H (2011) QTLanalysis of plant height in photoperiod-thermo sensitive male sterilewheat. Mol Plant Breed 2:92–97
120 Plant Mol Biol Rep (2015) 33:102–120