Fatness QTL on chicken chromosome 5 and interaction with sex
16
Genet. Sel. Evol. 38 (2006) 297–311 297 c INRA, EDP Sciences, 2006 DOI: 10.1051/gse:2006005 Original article Fatness QTL on chicken chromosome 5 and interaction with sex Behnam A a , Frédérique P b , Sandrine L a , Elisabeth L B-D c , Pascale L R a,d , Olivier D a , Florence V b , Jean S c , Larry C e , Sammy A f , Alain V b , Madeleine D a ∗ a UMR Inra-Agrocampus Génétique animale, 35042 Rennes, France b Laboratoire de génétique cellulaire, Inra, 31326 Auzeville, France c Station de recherches avicoles, Inra, 37380 Nouzilly, France d SGQA, Inra, 78352 Jouy en Josas, France e Department of Animal and Food Sciences, University of Delaware, Newark DE 19717, USA f University of Georgia, Athens, GA 30602, USA (Received 5 October 2005; accepted 8 December 2005) Abstract – Quantitative trait loci (QTL) affecting fatness in male chickens were previously identified on chromosome 5 (GGA5) in a three-generation design derived from two experimen- tal chicken lines divergently selected for abdominal fat weight. A new design, established from the same pure lines, produced 407 F2 progenies (males and females) from 4 F1-sire families. Body weight and abdominal fat were measured on the F 2 at 9 wk of age. In each sire family, selective genotyping was carried out for 48 extreme individuals for abdominal fat using seven microsatellite markers from GGA5. QTL analyses confirmed the presence of QTL for fatness on GGA5 and identified a QTL by sex interaction. By crossing one F1 sire heterozygous at the QTL with lean line dams, three recombinant backcross 1 (BC1) males were produced and their QTL genotypes were assessed in backcross 2 (BC2) progenies. These results confirmed the QTL by sex interaction identified in the F2 generation and they allow mapping of the female QTL to less than 8 Mb at the distal part of the GGA5. They also indicate that fat QTL alleles were segregating in both fat and lean lines. meat-type chickens / quantitative trait loci / fatness QTL / QTL × sex interaction 1. INTRODUCTION In meat-type chickens, deposition of excessive adipose tissue decreases both feed efficiency and yield of lean meat. Fatness is a complex trait controlled by ∗ Corresponding author: [email protected] Article published by EDP Sciences and available at http://www.edpsciences.org/gse or http://dx.doi.org/10.1051/gse:2006005
Transcript of Fatness QTL on chicken chromosome 5 and interaction with sex

Genet. Sel. Evol. 38 (2006) 297–311 297c© INRA, EDP Sciences, 2006DOI: 10.1051/gse:2006005
Original article
Fatness QTL on chicken chromosome 5and interaction with sex
Behnam Aa, Frédérique Pb, Sandrine La,Elisabeth L B-Dc, Pascale L Ra,d,
Olivier Da, Florence Vb, Jean Sc,Larry Ce, Sammy Af , Alain Vb,
Madeleine Da∗
a UMR Inra-Agrocampus Génétique animale, 35042 Rennes, Franceb Laboratoire de génétique cellulaire, Inra, 31326 Auzeville, France
c Station de recherches avicoles, Inra, 37380 Nouzilly, Franced SGQA, Inra, 78352 Jouy en Josas, France
e Department of Animal and Food Sciences, University of Delaware, Newark DE 19717, USAf University of Georgia, Athens, GA 30602, USA
(Received 5 October 2005; accepted 8 December 2005)
Abstract – Quantitative trait loci (QTL) affecting fatness in male chickens were previouslyidentified on chromosome 5 (GGA5) in a three-generation design derived from two experimen-tal chicken lines divergently selected for abdominal fat weight. A new design, established fromthe same pure lines, produced 407 F2 progenies (males and females) from 4 F1-sire families.Body weight and abdominal fat were measured on the F2 at 9 wk of age. In each sire family,selective genotyping was carried out for 48 extreme individuals for abdominal fat using sevenmicrosatellite markers from GGA5. QTL analyses confirmed the presence of QTL for fatnesson GGA5 and identified a QTL by sex interaction. By crossing one F1 sire heterozygous atthe QTL with lean line dams, three recombinant backcross 1 (BC1) males were produced andtheir QTL genotypes were assessed in backcross 2 (BC2) progenies. These results confirmedthe QTL by sex interaction identified in the F2 generation and they allow mapping of the femaleQTL to less than 8 Mb at the distal part of the GGA5. They also indicate that fat QTL alleleswere segregating in both fat and lean lines.
meat-type chickens / quantitative trait loci / fatness QTL / QTL × sex interaction
1. INTRODUCTION
In meat-type chickens, deposition of excessive adipose tissue decreases bothfeed efficiency and yield of lean meat. Fatness is a complex trait controlled by
∗ Corresponding author: [email protected]
Article published by EDP Sciences and available at http://www.edpsciences.org/gse or http://dx.doi.org/10.1051/gse:2006005

298 B. Abasht et al.
an unknown number of genes [35]. The identification of genes responsible forfat deposition could improve meat-chicken production through the breedingprocess and it would meet the consumer demand for leaner meat. Additionally,the identification of genes associated with excessive fattening could lead to abetter understanding of the fundamental genetic mechanisms underlying thedevelopment of obesity in other species, including humans.
Quantitative trait loci (QTL) mapping has been extensively used as the firststep in genetic dissection of complex traits [13, 32]. In chicken, various ex-perimental designs have been used for the identification of at least 26 fatnessQTL [24,26,29,42]. However, these results were all issued from first attemptsin mapping fatness QTL, which encompass QTL regions spanning tens of cen-tiMorgans (cM).
Further experiments are needed to refine these QTL and to identify the genesresponsible for expression of production traits. For example, Jennen et al. [27]used the advanced intercross line method to reduce fatness QTL locations onchicken chromosome 1 from about 145 cM in the first assessement to less than25 cM and 60 cM, respectively. Several approaches have been suggested forimproving QTL map resolution [9]. The recombinant progeny testing methodis one of the most commonly used to refine QTL regions [6]. This methodidentifies, among the relatives (usually offspring) of an animal known to be het-erozygous for QTL, those individuals which carry recombination in the QTLchromosomal region compared to the chromosome of their QTL heterozygousparent. The recombinant animals are further evaluated for their QTL statusthrough progeny testing [8, 9, 21] which leads to physical dissection of theQTL region.
Following the primary identification of fatness QTL on chromosome 5 in athree-generation cross between experimental fat and lean lines [29], the presentpaper reveals new QTL results in the same lines, five generations later. In thenew design, fatness was measured in both males and females which alloweddetection of the QTL by sex interaction. This interaction was found in furtherback-cross generations in which recombinant events allowed the female QTLto be mapped to <8 Mb at the distal part of the GGA5.
2. ANIMALS, MATERIALS AND METHODS
2.1. Animals and phenotypic data
A three-generation design was performed by inter-crossing two experimen-tal meat-type chicken lines that were divergently selected on fatness [30] re-ferred to as the fat (FL) and lean (LL) lines. F1 birds were generated from

Fat QTL on GGA5 interacting with sex 299
FL | × LL ~ and LL | × FL ~ matings. Two F1 males from each of thereciprocal cross were each mated to 9–10 females from other unrelated fam-ilies of the same cross. A total of 407 F2 chicks in 39 full-sib families wereobtained in four hatches. In order to refine the QTL mapping, 81 back-cross1 (BC1) males were produced from one QTL heterozygous F1 male (issuedfrom FL×LL cross) mated to 10 LL females. Three of the BC1 animals car-rying paternal GGA5 recombinant in the QTL region were progeny tested forfatness QTL. The progeny were half and full-sib sire families of 110–136 BC2animals (males and females) obtained in four hatches by mating the three re-combinant BC1 males each to 7–11 LL females. Blood was collected from allthe animals for DNA analyses.
The F2 and BC2 chickens were fed ad libitum using a conventional starter(0–3 weeks) diet (12.8 MJ of metabolisable energy) and then a growing(4−9 weeks) diet (13.0 MJ of metabolisable energy). Light/dark periods were24h light for the first 2 days, then 14h light/10h night up to slaughtering.At 9 weeks of age, the birds were weighed after an overnight fast and thenkilled by electrical stunning in the experimental processing plant (Station derecherches avicoles, Inra, Nouzilly, France). After evisceration, carcasses werestored overnight at 4 ◦C before dissection and weighing of abdominal fat.
2.2. Markers and genotyping
Genomic DNA was purified from individual blood samples (100 µL) usingthe usual phenol/chloroform extraction method modified for large sample num-bers [2]. It was quantified by the saran method [37] and diluted to 10 ng/µL.
Microsatellite markers on GGA5 were chosen from the genetic consensusmap [18,39] based on their location on the chromosome and their informativityin each sire family. Fluorescently labelled microsatellite sequences were anal-ysed on an ABI 3700 DNA sequencer (Applied Biosystems, Foster City, CA,USA) and their lengths were determined using GeneScan AnalysisTM software(Applied Biosystems, Foster City, CA, USA). Genotypes were interpreted us-ing both the Genotyper AnalysisTM software (Applied Biosystems, Foster City,CA, USA) and GEMMA databases [23].
New markers were developed to refine the QTL location and the positionof recombination events. Among the microsatellite markers identified on thechicken genome sequence (http://www.ensembl.org/Gallus_gallus/) four werechosen for their informativity in the present families and their convenience.They were SEQ0079, SEQ0081, SEQ0082, SEQ0085, with EMBL acces-sion numbers AM040172, AM040174, AM040175, AM040177, respectively.

300 B. Abasht et al.
SSCP (single strand conformational polymorphism) markers were developedfrom expressed sequence tags (EST) localised on the GGA5 radiation hybridmap [34] with the same primer sequences and PCR conditions. QTL heterozy-gous F1 sires and their F0 parents were examined for polymorphisms usingSSCP analyses [2].
In the F2, a genetic map was obtained using the CRI-MAP linkage pro-gramme (“build” option) with marker distances in Kosambi centiMorgans(cM) [16]. The actual distances in the families were used in the F2 QTL analy-ses. They were in accordance with those of the consensus map [39]. In the BC2generation, the consensus genetic map was used because the number of infor-mative meiosis was too low to ensure reliable distance assessment. Genetic dis-tances were expressed either in cM or in bp, according to the chicken genomesequences.
Regarding the QTL analyses, selective genotyping was carried out on192 F2 animals, their 30 F1 parents and 27 F0 grand-parents using sevenGGA5 microsatellite markers (Fig. 1). Only 48 F2 animals with the mostextreme values (i.e., the 24 highest and the 24 lowest) in each F1 sire fam-ily for adjusted abdominal fat weight (see below) were used for the analysis.Offspring from dams which were not roughly equally represented in both ex-treme groups were ignored. For the BC2 generation, 380 animals and their26 parents and grand-parents were genotyped using six GGA5 microsatellitemarkers (Fig. 1).
2.3. Statistical analyses
For the F2 animals, abdominal fat weights were adjusted for sire, dam(within sire), sex, and hatching group effects using the SAS� GLM proce-dure [38] with 9-week body weight as a covariate. In the BC2 generation, thephenotypic data were similarly adjusted in each sire family for dam and sexeffects, without hatch group correction since hatch groups were not signifi-cantly different. Data adjustment was done prior to the QTL analyses in orderto identify those animals with extreme values in each family.
QTL interval mapping was performed using QTL express software [40]with three different models: line-cross and half-sib models were used in theF2 generation, whereas a back-cross model was used for analyses of theBC2 generation.
In the line-cross model, the probability for an F2 animal to be one of the fol-lowing QTL genotypes (QQ, Qq, qQ, and qq) was calculated at 1 cM intervalson GGA5, conditionally to the marker genotypes. Coefficients for additive (ca)
Fat QTL on GGA5 interacting with sex 301
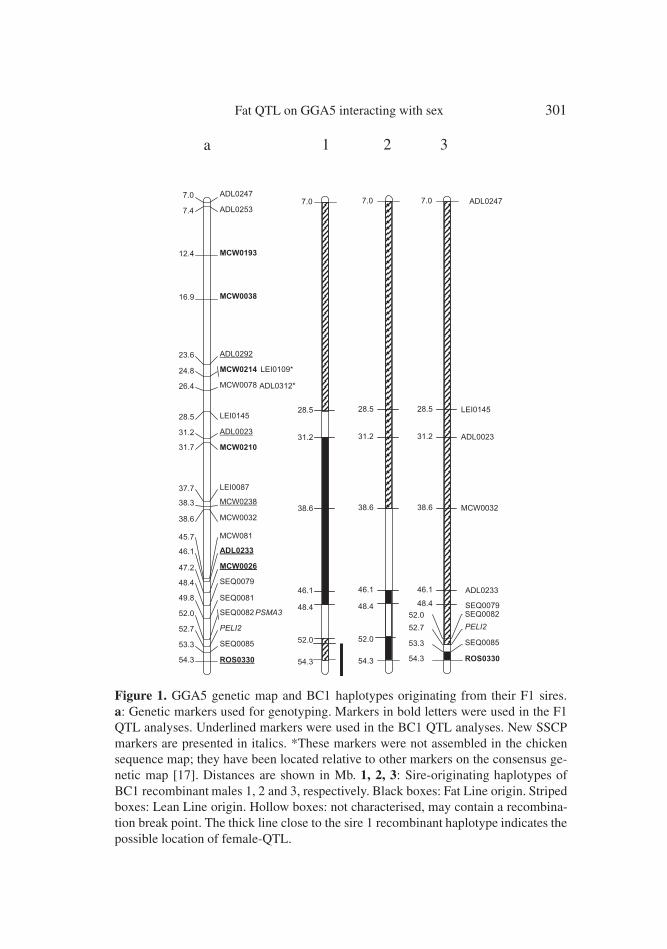
Figure 1. GGA5 genetic map and BC1 haplotypes originating from their F1 sires.a: Genetic markers used for genotyping. Markers in bold letters were used in the F1QTL analyses. Underlined markers were used in the BC1 QTL analyses. New SSCPmarkers are presented in italics. *These markers were not assembled in the chickensequence map; they have been located relative to other markers on the consensus ge-netic map [17]. Distances are shown in Mb. 1, 2, 3: Sire-originating haplotypes ofBC1 recombinant males 1, 2 and 3, respectively. Black boxes: Fat Line origin. Stripedboxes: Lean Line origin. Hollow boxes: not characterised, may contain a recombina-tion break point. The thick line close to the sire 1 recombinant haplotype indicates thepossible location of female-QTL.

302 B. Abasht et al.
and dominance (cd) components were calculated at each position. Prob(XX)being the probability for each individual to have an XX genotype, ca is equalto prob(QQ) – prob(qq) and cd is equal to prob(Qq and qQ), where Q and q aretwo QTL alleles. In the next step, the adjusted phenotypic data were regressedonto these coefficients. Quoting the effect of QQ, Qq and qq as a, d and –a,respectively [14], the additive (a) and dominance effects (d) of putative QTLat a given location can be estimated using the following model:
yi = m + caia + cdid + ei
where yi is the adjusted phenotypic value of animal i, m is the general mean, cai
and cdi are, respectively, the coefficients for the additive and dominant compo-nents for that individual i at the given location, and ei is the residual error. Thesign of the additive component indicates which line carries which QTL allele(high or low). QTL by sex interaction was investigated using the appropriatemodel. When using the half-sib model, the F2 animals were considered as fourindependent half-sib families. The allele substitution effect was fitted withineach sire family.
The back-cross option of QTL express software was applied when analysingthe three BC1 recombinant sires and their BC2 progenies. This option is usedto determine which haplotype is associated with which QTL allele (high orlow).
Chromosome-wide significant thresholds for the presence of a QTL weredetermined empirically by permuting marker data, as described by Churchiland Doerge [7]. Thresholds were obtained from 1000 permutations and arepresented as F0.05 and F0.01 for significance at α = 0.05 and α = 0.01 lev-els, respectively. Confidence intervals for QTL location were calculated from1000 bootstrap samples [43].
3. RESULTS
QTL for abdominal fat weight at 9-weeks of age adjusted for sex and bodyweight (AF) was investigated on GGA5 in F2 and back-cross generations.
3.1. F2 generation analyses: QTL by sex interaction
Single QTL analysis with the line-cross model was performed in 192 F2animals (males and females) with extreme AF values in each of the four F1 sireprogeny. No significant QTL was detected (Fig. 2), however, a test comparing

Fat QTL on GGA5 interacting with sex 303
Figure 2. Fatness QTL analyses along GGA5 in F2 progenies (males and femalestogether). The crossed line shows the test statistic values for the line-cross model [40].The solid line shows the test statistic values for the same model including QTL bysex interaction. The horizontal line shows the chromosome-wide significant threshold(p < 0.05). The genetic markers used in the analyses are shown under the X-axis. Thegenetic distances were assessed in the present design.
a single QTL interacting with sex versus no QTL led to the detection of asignificant QTL (p < 0.05) at 112 cM (Fig. 2).
QTL analyses performed within each sex separately showed a significantQTL (p < 0.05 chromosome-wide) in males at 80 cM and a suggestive QTL(p < 0.07 chromosome-wide) in females at 116 cM (Tab. I). The estimatedadditive effects of QTL were of the same magnitude in both sexes (0.4 and0.5 phenotypic standard deviation in males and females, respectively) but withopposite signs (Tab. I). In this case, the high QTL allele (allele with the highervalue) came from the FL haplotype in males and from the LL haplotype infemales.
There was no evidence of imprinting, multiple QTL or QTL with dominanceeffect in either type of analyses.
QTL interval mapping was also investigated with the half-sib procedureof QTL express software in order to test each F1 sire as for its heterozy-gosity at the QTL. Similarly to the line-cross model, these analyses did notdetect any significant QTL when the sexes were analysed together. When per-formed within each sex separately, and all the 4 sire-families together, half-sibQTL analyses identified a significant male fatness QTL at 72 cM, whereas the
304 B. Abasht et al.
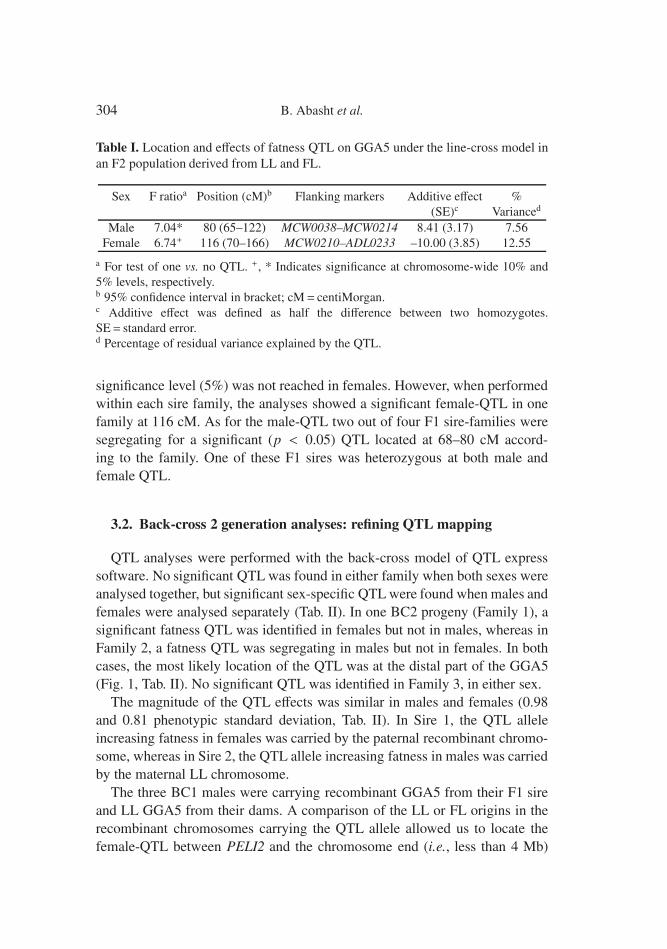
Table I. Location and effects of fatness QTL on GGA5 under the line-cross model inan F2 population derived from LL and FL.
Sex F ratioa Position (cM)b Flanking markers Additive effect %(SE)c Varianced
Male 7.04* 80 (65–122) MCW0038–MCW0214 8.41 (3.17) 7.56Female 6.74+ 116 (70–166) MCW0210–ADL0233 –10.00 (3.85) 12.55
a For test of one vs. no QTL. +, * Indicates significance at chromosome-wide 10% and5% levels, respectively.b 95% confidence interval in bracket; cM= centiMorgan.c Additive effect was defined as half the difference between two homozygotes.SE= standard error.d Percentage of residual variance explained by the QTL.
significance level (5%) was not reached in females. However, when performedwithin each sire family, the analyses showed a significant female-QTL in onefamily at 116 cM. As for the male-QTL two out of four F1 sire-families weresegregating for a significant (p < 0.05) QTL located at 68–80 cM accord-ing to the family. One of these F1 sires was heterozygous at both male andfemale QTL.
3.2. Back-cross 2 generation analyses: refining QTL mapping
QTL analyses were performed with the back-cross model of QTL expresssoftware. No significant QTL was found in either family when both sexes wereanalysed together, but significant sex-specific QTL were found when males andfemales were analysed separately (Tab. II). In one BC2 progeny (Family 1), asignificant fatness QTL was identified in females but not in males, whereas inFamily 2, a fatness QTL was segregating in males but not in females. In bothcases, the most likely location of the QTL was at the distal part of the GGA5(Fig. 1, Tab. II). No significant QTL was identified in Family 3, in either sex.
The magnitude of the QTL effects was similar in males and females (0.98and 0.81 phenotypic standard deviation, Tab. II). In Sire 1, the QTL alleleincreasing fatness in females was carried by the paternal recombinant chromo-some, whereas in Sire 2, the QTL allele increasing fatness in males was carriedby the maternal LL chromosome.
The three BC1 males were carrying recombinant GGA5 from their F1 sireand LL GGA5 from their dams. A comparison of the LL or FL origins in therecombinant chromosomes carrying the QTL allele allowed us to locate thefemale-QTL between PELI2 and the chromosome end (i.e., less than 4 Mb)

Fat QTL on GGA5 interacting with sex 305
Table II. Location and effects of fatness QTL on GGA5 in three back-cross familiesunder the back-cross model.
Family Na Position (cM)b Flanking F ratioc QTL SEe
markers effectd
1Male & Female 136 167 2.81 4.56 2.72
Male 66 151 2.19 4.05 2.73Female 70 192 (87.5–198) MCW0026–ROS0330 6.82* 9.35 3.58
2Male & Female 134 171 6.03 5.25 2.14
Male 71 181 (146–198) MCW0026–ROS0330 11.87** 11.04 3.20Female 63 198 2.63 3.32 2.05
3Male & Female 110 198 0.81 2.11 2.35
Male 53 163 0.33 2.06 3.58Female 57 189 1.90 4.78 3.46
a Number of offspring.b In brackets 95% confidence interval of the QTL position obtained by the bootstrapmethod.c For test of one vs. no QTL. *, ** indicate significance at the chromosome wide 5% and1% level, respectively, based on 1000 permutation tests.d Absolute values of the allele, substitution effect.e SE = standard error of QTL effect.
(Fig. 1). From the F2 analyses, the high female QTL allele was known to orig-inate from the LL chromosome. In the BC1 Male 1 recombinant chromosome(carrying the high female QTL allele), the LL part could extend from SEQ0079(48.4 Mb) up to the distal end (56.2 Mb), which means 7.8 Mb. But in BC1Male 3, carrying no QTL, the LL part of the paternal recombinant chromosomeextended up to PELI2 (52.7 Mb), which would exclude this region for the QTLlocation. Then the QTL would be in the 3.5 Mb beyond PELI2. However, onecannot rule out that the LL part of the BC1 Male 3 recombinant chromosomecould actually carry the high female QTL allele which could be masked by thesame allele carried by the maternal LL chromosome. This would keep the QTLregion to 7.8 Mb.
The male-QTL could not be mapped with such accuracy. The QTL identifiedat 68 cM in the F1 sire was not found in its back-cross progeny. Since noneof the recombinant BC1 descendants carried the relevant chromosomal part(the FL proximal part of GGA5), one could speculate that the male-QTL waslocated in the missing region that is up to 31.2 Mb (ADL0023). The location ofthe new male-QTL found at the distal end of the chromosome in BC1 Male 2

306 B. Abasht et al.
could only rely on the estimated confidence interval (52 cM), since the highallele came from a full LL chromosome.
4. DISCUSSION
This study confirmed the existence of fatness QTL on GGA5 as already re-ported in the FL and LL [29] and in other genetic backgrounds [24,31]. We dis-covered an interaction between QTL and sex, which gives rise to sex-specificQTL. In addition, the analyses of recombinant back-cross sires allowed us torefine the female-QTL to less than 8 Mb at the distal end of GGA5.
When analysing a three-generation QTL design using a cross between diver-gent lines, the line-cross model should provide the best fit to the data. However,that model relies on the assumption that the different QTL alleles are fixed ineach founder line [19], which is doubtful in the FL and LL. In fact not all theF1 sires were identified as QTL heterozygous, which was previously observedby [29]. When the founder lines are not totally fixed for these unique alleles,the method still proves very useful depending on allele effects and allele fre-quencies in both lines [1, 10]. In the half-sib model, no assumption was madeabout the allele frequencies within the founder lines [28], although the esti-mates rely on less data since each family is considered individually. However,De Koning et al. [10] have shown that the half-sib and line-cross approacheshave similar power when QTL effects are mainly additive, which was true inthe present study. In the present F2 generation experiment, line-cross and half-sib models provided consistent results. No QTL was detected when the modelswere applied to data with sexes combined; however, QTL analyses within eachsex led to significant effects and to similar QTL locations with both models.
The QTL by sex interaction and sex-specific QTL in the BC2 generationconfirmed those found in the F2 analyses. Similar QTL with different or spe-cific effects in males and females have been observed in other mapping studieson body composition QTL. For instance, Horvat et al. [22] detected a female-specific QTL for fatness on MMU12 using a cross between lines divergentlyselected for fat content. Also in mice selected for high growth compared toa control line, three QTL were detected with sex-specific effects on abdom-inal fat weight [4]. Ishikawa et al. [25] found five sex-specific QTL with amain effect on body weight. A QTL by sex interaction could result from anopposite QTL effect according to the sex, which was the case presented byDe Koning et al. [11] for meat quality traits in pigs. In broiler-type chickens,markers associated with a body weight QTL displayed alleles with differentfrequencies and different and even opposite effects in males and females [12].

Fat QTL on GGA5 interacting with sex 307
From a biological point of view, QTL by sex interactions might be explainedby genes with different effects in sexually different environments as suggestedby Hamoen et al. [20]. More generally, the QTL by sex can be consideredas a genotype by environment interaction, considering sex as an environmentfor the genotype expression. The same phenotypic measurement could then beconsidered as different traits in the sexes [33]. The concept is applicable toQTL by sex interaction and could have applications in utilising QTL in selec-tion programmes.
A back-cross strategy was undertaken in order to refine the QTL location ev-idenced in the F2 generation. Such a design fits well into our current objectivesince only abdominal fat and one QTL region were under consideration. It ismore productive to focus on particular recombinant breeders avoiding the riskof losing the QTL region when “blind-crosses” are made as in AIL (advancedintercross lines). In addition the step-wise procedure, using a few families ineach generation, allows refining the location at every generation with a limitednumber of relevant animals reducing both genotyping and measurement costs,even if increasing the number of generations to meet the desired goal comparedto a single back-cross generation with many recombinant breeders. Comparedto an AIL procedure [27], this strategy can obtain the same precision regardingthe QTL location in 3–4 back-cross generations instead of 8–10 generations.
The male-QTL found in F2 progeny was located at the proximal end ofGGA5, with the high AF allele originating from the FL. It could not havebeen detected in the back-cross experiment since that FL chromosomal partwas missing in the back-cross recombinant sires. Collectively, the results sug-gest that this QTL is located in the region of 0–31.2 Mb. The location of thisQTL for fatness agrees with previous studies using either males of the FL andLL [29] or a broiler × layer cross [24].
In the back-cross generation, the male- and female-specific QTL were bothlocated in the same region at the distal part of GGA5. As for the male-specificQTL, its location was similar to one already found in a previous experimentwith the male trait only [29]. However, the high AF allele in the present casecame from the LL, unlike the previous experiment. This could explain why thisQTL was not found in the F2 generation, since the LL chromosome of the F1sire was brought by another LL female which did not carry the fat allele. Sim-ilarly in females, the high AF allele originates from the LL. In this case, thesame chromosomal fragment was involved in both F1 and BC1 sires leading tosimilar results which evidenced the female-specific QTL in an LL haplotype.High-fat alleles coming from a low-fat line are defined as transgressive varia-tion [15]. Transgressive alleles have been identified in several comprehensive

308 B. Abasht et al.
QTL scans for ovulation rate in swine [5], for backfat thickness in swine [3,36],for red colour and fruit size in tomatoes [41], for example. The present resultsconfirm that, despite divergent selection, alleles that increase AF are still seg-regating in the LL.
Regarding the female-specific QTL, it could be localised in the 3.5 Mb dis-tal part of GGA5 (beyond PELI2) based on the aforementioned assumptionin the Results paragraph. Without any assumption, it is localised in a 7.8 Mbregion at the end of GGA5 (beyond SEQ0079). Among the 140 genes locatedin this region (http//www.ensembl.org/Gallus_gallus/), some possible candi-date genes are transcription factors (BRF1, TRIP-Br) and the estrogen receptor(ESR). However, there is no direct evidence for their implication in the controlof fatness variability in the chicken.
ACKNOWLEDGEMENTS
The authors acknowledge the valuable technical support provided by the ex-perimental station and laboratory staff in the Station de Recherches Avicoles(Inra-Nouzilly), particularly N. Millet. They are grateful to the technical staffof the Laboratoire de Génétique Cellulaire (Inra-Toulouse) and the Unité deGénétique Animale (Inra-Agrocampus Rennes) for their technical support.Genotyping was realised in the Toulouse-Midi-Pyrénées Génopole� (France).
The production of FL × LL F1 and F2 chickens was funded by aUSDA consortium grant to LC, SA and JS (USDA-IFAFS Animal GenomeProgram, Award Number 00-521009614). Otherwise the investigation wassupported by the French Institute for Agricultural Research (Inra), the FrenchMinistry of Agriculture (DGER), the Regional Council of Brittany and theToulouse-Midi-Pyrénées Génopole�. B. Abasht is a PhD student supported bythe Iranian Ministry of Science, Research and Technology and by SFERE.
REFERENCES
[1] Alfonso L., Haley C.S., Power of different F2 schemes for QTL detection inlivestock, Anim. Sci. 66 (1998) 1–8.
[2] Assaf S., Lagarrigue S., Daval S., Sansom M., Leclercq B., Michel J., Pitel F.,Alizadeh M., Vignal A., Douaire M., Genetic linkage and expression analysis ofSREBP and lipogenic genes in fat and lean chicken, Comp. Biochem. Phys. B137 (2004) 433–441.
[3] Bidanel J.P., Milan D., Iannuccelli N., Amigues Y., Boscher M.Y., Bourgeois F.,Caritez J.C., Gruand J., Le Roy P., Lagant H., Quintanilla R., Renard C., GellinJ., Ollivier L., Chevalet C., Detection of quantitative trait loci for growth andfatness in pigs, Genet. Sel. Evol. 33 (2001) 289–309.

Fat QTL on GGA5 interacting with sex 309
[4] Brockmann G.A., Haley C.S., Renne U., Knott S.A., Schwerin M., Quantitativetrait loci affecting body weight and fatness from a mouse line selected for ex-treme high growth, Genetics 150 (1998) 369–381.
[5] Campbell E.M., Nonneman D., Rohrer G.A., Fine mapping a quantitative traitlocus affecting ovulation rate in swine on chromosome 8, J. Anim. Sci. 81 (2003)1706–1714.
[6] Christians J.K., Keightley P.D., Fine mapping of a murine growth locus toa 1.4-cM region and resolution of linked QTL, Mamm. Genome 15 (2004)482–491.
[7] Churchill G.A., Doerge R.W., Empirical threshold values for quantitative traitmapping, Genetics 138 (1994) 963–971.
[8] Darvasi A., Interval-specific congenic strains (ISCS): an experimental designfor mapping a QTL into a 1-centimorgan interval, Mamm. Genome 8 (1997)163–167.
[9] Darvasi A., Experimental strategies for the genetic dissection of complex traitsin animal models, Nat. Genet. 18 (1998) 19–24.
[10] de Koning D.J., Janss L.L., Rattink A.P., van Oers P.A., de Vries B.J., GroenenM.A., van der Poel J.J., de Groot P.N., Brascamp E.W., Van Arendonk J.A.,Detection of quantitative trait loci for backfat thickness and intramuscular fatcontent in pigs (Sus scrofa), Genetics 152 (1999) 1679–1690.
[11] de Koning D.J., Harlizius B., Rattink A.P., Groenen M.A., Brascamp E.W.,Van Arendonk J.A., Detection and characterization of quantitative trait loci formeat quality traits in pigs, J. Anim. Sci. 79 (2001) 2812–2819.
[12] Deeb N., Lamont S.J., Use of a novel outbred by inbred F1 cross to detect geneticmarkers for growth, Anim. Genet. 34 (2003) 205–212.
[13] Doerge R.W., Mapping and analysis of quantitative trait loci in experimentalpopulations, Nat. Rev. Genet. 3 (2002) 43–52.
[14] Falconer D.S., Introduction to quantitative genetics, Longman, London;New-York, 1981.
[15] Frankel W.N., Taking stock of complex trait genetics in mice, Trends Genet. 11(1995) 471–477.
[16] Green P., Falls K., Crooks S., Documentation for CRI-MAP version 2.4,Washington University School of Medicine, St Louis, MO, 1990.
[17] Groenen M.A., Crooijmans R.P., Veenendaal A., Cheng H.H., Siwek M.,van der Poel J.J., A comprehensive microsatellite linkage map of the chickengenome, Genomics 49 (1998) 265–274.
[18] Groenen M.A., Cheng H.H., Bumstead N., Benkel B.F., Briles W.E., Burke T.,Burt D.W., Crittenden L.B., Dodgson J., Hillel J., Lamont S., de Leon A.P.,Soller M., Takahashi H., Vignal A., A consensus linkage map of the chickengenome, Genome Res. 10 (2000) 137–147.
[19] Haley C.S., Knott S.A., Elsen J.M., Mapping quantitative trait loci in crossesbetween outbred lines using least squares, Genetics 136 (1994) 1195–1207.
[20] Hamoen F.F., Van Kaam J.B., Groenen M.A., Vereijken A.L., Bovenhuis H.,Detection of genes on the Z-chromosome affecting growth and feathering inbroilers, Poult. Sci. 80 (2001) 527–534.

310 B. Abasht et al.
[21] Hill W.G., Selection with recurrent backcrossing to develop congenic lines forquantitative trait loci analysis, Genetics 148 (1998) 1341–1352.
[22] Horvat S., Bunger L., Falconer V.M., Mackay P., Law A., Bulfield G., KeightleyP.D., Mapping of obesity QTL in a cross between mouse lines divergently se-lected on fat content, Mamm. Genome 11 (2000) 2–7.
[23] Iannuccelli N., Wolosyn N., Arhainx J., Gellin J., Milan D., GEMMA: Adatabase to automate microsatellite genotyping., Anim. Genet. 27 Suppl. 2(1996) 55.
[24] Ikeobi C.O., Woolliams J.A., Morrice D.R., Law A., Windsor D., Burt D.W.,Hocking P.M., Quantitative trait loci affecting fatness in the chicken, Anim.Genet. 33 (2002) 428–435.
[25] Ishikawa A., Matsuda Y., Namikawa T., Detection of quantitative trait loci forbody weight at 10 weeks from Philippine wild mice, Mamm. Genome 11 (2000)824–830.
[26] Jennen D.G., Vereijken A.L., Bovenhuis H., Crooijmans R.P., Veenendaal A.,van der Poel J.J., Groenen M.A., Detection and localization of quantitative traitloci affecting fatness in broilers, Poultry Sci. 83 (2004) 295–301.
[27] Jennen D.G., Vereijken A.L., Bovenhuis H., Crooijmans R.M., van der Poel J.J.,Groenen M.A., Confirmation of quantitative trait loci affecting fatness in chick-ens, Genet. Sel. Evol. 37 (2005) 215–228.
[28] Knott S.A., Elsen J.M., Haley C.S., Methods for multiple-marker mapping ofquantitative trait loci in half-sib populations, Theor. Appl. Genet. 93 (1996)71–80.
[29] Lagarrigue S., Pitel F., Carre W., Abasht B., Le Roy P., Néau A., Amigues Y.,Sourdioux M., Simon J., Cogburn L.A., Aggrey S.E., Leclercq B., Vignal A.,Douaire M., Mapping quantitative trait loci affecting fatness and breast muscleweight in meat-type chicken lines divergently selected on abdominal fatness,Genet. Sel. Evol. 38 (2006) 85–97.
[30] Leclercq B., Blum J.C., Boyer J.P., Selecting broilers for low or high abdominalfat: initial observations, Brit. Poultry Sci. 21 (1980) 107–113.
[31] Li H., Deeb N., Zhou H., Mitchell A.D., Ashwell C.M., Lamont S.J., Chickenquantitative trait loci for growth and body composition associated with trans-forming growth factor-beta genes, Poultry Sci. 82 (2003) 347–356.
[32] Lynch M., Walsh B., Genetics and analysis of quantitative traits, SinauerAssociates Inc, Sunderland, MA, 1998.
[33] Muir W.M., Aggrey S.E., Poultry genetics, breeding and biotechnology, CABIPublishing, 2003.
[34] Pitel F., Abasht B., Morisson M., Crooijmans R.P., Vignoles F., Leroux S., FeveK., Bardes S., Milan D., Lagarrigue S., Groenen M.A., Douaire M., Vignal A., Ahigh-resolution radiation hybrid map of chicken chromosome 5 and comparisonwith human chromosomes, BMC. Genomics 5 (2004) 66.
[35] Pomp D., Genetic dissection of obesity in polygenic animal models, Behav.Genet. 27 (1997) 285–306.
[36] Rohrer G.A., Keele J.W., Identification of quantitative trait loci affecting car-cass composition in swine: I. Fat deposition traits, J. Anim. Sci. 76 (1998)2247–2254.

Fat QTL on GGA5 interacting with sex 311
[37] Sambrook J., Fritsch E.F., Maniatis T., Molecular cloning: a laboratory manual,Cold Spring Harbor Laboratory Press, New York, 1989.
[38] SAS� Institute, SAS�/STATO User’s Guide, version 6, SAS� Institute Inc.,Cary NC, 1989.
[39] Schmid M., Nanda I., Guttenbach M., Steinlein C., Hoehn M., Schartl M., HaafT., Weigend S., Fries R., Buerstedde J.M., Wimmers K., Burt D.W., Smith J.,A’Hara S., Law A., Griffin D.K., Bumstead N., Kaufman J., Thomson P.A.,Burke T., Groenen M.A., Crooijmans R.P., Vignal A., Fillon V., Morisson M.,Pitel F., Tixier-Boichard M., Ladjali-Mohammedi K., Hillel J., Maki-Tanila A.,Cheng H.H., Delany M.E., Burnside J., Mizuno S., First report on chicken genesand chromosomes 2000, Cytogenet. Cell Genet. 90 (2000) 169–218.
[40] Seaton G., Haley C.S., Knott S.A., Kearsey M., Visscher P.M., QTL Express:mapping quantitative trait loci in simple and complex pedigrees, Bioinformatics18 (2002) 339–340.
[41] Tanksley S.D., McCouch S.R., Seed banks and molecular maps: unlocking ge-netic potential from the wild, Science 277 (1997) 1063–1066.
[42] Tatsuda K., Fujinaka K., Genetic mapping of the QTL affecting body weight inchickens using a F2 family, Brit. Poultry Sci. 42 (2001) 333–337.
[43] Visscher P.M., Thompson R., Haley C.S., Confidence intervals in QTL mappingby bootstrapping, Genetics 143 (1996) 1013–1020.
To access this journal online:www.edpsciences.org