Trans-Regulation of Mouse Meiotic Recombination Hotspots by Rcr1
Upload
khangminh22Category
view
3download
0
1
Vol.:(0123456789)
Scientific Reports | (2020) 10:22103 | https://doi.org/10.1038/s41598-020-78675-7
www.nature.com/scientificreports
Mapping QTL hotspots associated with weed competitive traits in backcross population derived from Oryza sativa L. and O. glaberrima Steud.Muralidhara Bharamappanavara2,5, Anantha M. Siddaiah1, Senguttuvel Ponnuvel1, Lokesha Ramappa2, Basavaraj Patil1, Manoj Appaiah1, Sheshu Madhav Maganti1, Raman Meenakshi Sundaram1, Shashidhar Kadadanamari Shankarappa3, Mangal Deep Tuti1, Sreedevi Banugu1, Brajendra Parmar1, Santosha Rathod1, Kalyani M. Barbadikar1, Suneetha Kota1, Lella Venkata Subbarao1, Tapan Kumar Mondal4 & Gireesh Channappa1,5*
To improve grain yield under direct seeded and aerobic conditions, weed competitive ability of a rice genotype is a key desirable trait. Hence, understanding and dissecting weed competitive associated traits at both morphological and molecular level is important in developing weed competitive varieties. In the present investigation, the QTLs associated with weed competitive traits were identified in BC1F2:3 population derived from weed competitive accession of O. glaberrima (IRGC105187) and O. sativa cultivar IR64. The mapping population consisting of 144 segregating lines were phenotyped for 33 weed competitive associated traits under direct seeded condition. Genetic analysis of weed competitive traits carried out in BC1F2:3 population showed significant variation for the weed competitive traits and predominance of additive gene action. The population was genotyped with 81 genome wide SSR markers and a linkage map covering 1423 cM was constructed. Composite interval mapping analysis identified 72 QTLs linked to 33 weed competitive traits which were spread on the 11 chromosomes. Among 72 QTLs, 59 were found to be major QTLs (> 10% PVE). Of the 59 major QTLs, 38 had favourable allele contributed from the O. glaberrima parent. We also observed nine QTL hotspots for weed competitive traits (qWCA2a, qWCA2b, qWCA2c, qWCA3, qWCA5, qWCA7, qWCA8, qWCA9, and qWCA10) wherein several QTLs co-localised. Our study demonstrates O. glaberrima species as potential source for improvement for weed competitive traits in rice and identified QTLs hotspots associated with weed competitive traits.
Rice continuous as major staple food in many parts of world and its consumption is projected to rise 50% by 2050 with a production target of 827 million tonnes1. However, irrigated rice ecology, a major supplier of global rice production (94%) is affected due to depleting natural resources, waning water table, mounting labour shortage, increase in production cost and changing climatic condition2. These are the major driving forces lead to shift in the cultivation from irrigated rice to direct seeded rice (DSR) as sustainable alternative. DSR sowing is commonly practiced in aerobic and upland rice cultivation and has several advantages such as water saving, reduced labour requirement, increased fertilizer efficiency, reduced destruction of soil properties, early maturity and less methane emission3. However, severe weeds infestation4 is major threat to the DSR and yield loss of 15% to 100% were reported5. Improving weed competitive ability (WCA) through plant breeding efforts is deemed to be safe tool as it offer eco-friendly low-cost weed management coupled with no risk of developing resistant weed biotypes due to herbicides and reduced labour requirement for manual weeding6–8. The WCA can be achieved through two components such as weed tolerance and weed suppressive ability9. Among two, weed suppressive ability is
OPEN
1ICAR-Indian Institute of Rice Research, Hyderabad 500030, India. 2University of Agricultural Science, Raichur, Karnataka 584104, India. 3Central Agricultural University, Imphal 795004, India. 4ICAR-National Institute for Plant Biotechnology, New Delhi 110012, India. 5These authors contributed equally: Muralidhara Bharamappanavara and Gireesh Channappa. *email: [email protected]

2
Vol:.(1234567890)
Scientific Reports | (2020) 10:22103 | https://doi.org/10.1038/s41598-020-78675-7
www.nature.com/scientificreports/
advocated because suppressing weeds reduces weed seed production and benefits weed management in the future season also10. However, strong weed suppression ability does not guarantee higher yields under weed competition due trade off between yield potential and weed competitiveness11. Therefore, selection for weed competitiveness along with yield potential should be done simultaneously. There is sufficient genetic variation available in the gene pool even though rice is week competitor12–21. However, the progress and genetic gain hampered due to quantitative inheritance, lack of suitable donors, limited knowledge on genetic architecture of WCA 6,22,23. The WCA of rice cultivars has been attributed to increased plant height, higher tiller number, increased root size, rapid early vigour growth, droopy leaves, high specific leaf area, high leaf area index and allelopathy11–13,19. Selec-tion for weed competitiveness can be done directly in the presence of weeds or indirectly under non-competitive conditions for secondary traits related to weed competitiveness11.
To dissect the weed competitive traits in rice, QTL mapping has been employed and large number of QTLs for rice WCA traits2,24 were identified using biparental segregating populations (F2, Backcross inbred line, double haploids, recombinant inbred lines) derived mainly from intrasub-specific25–28 and inter-subspecific crosses29–33. Recently, association mapping panels34–37 and SNP based genotyping by sequencing38–40 have been employed. However, no efforts were done to exploit weed competitive QTLs from inherent weed competitive O. glaberrima species. African endemic, O. glaberrima species has the ability to grow in a wide range of difficult ecosystems and harbours a rich reservoir of genes that allowed it to thrive in the harsh environments41,42. Significantly, O. glaberrima is known to possess early seedling vigour and weed competitiveness43–46 due to faster maturity, high biomass, its wide leaves shade out weeds, weed smothering ability, early seedling vigour, robust root system, its small-diameter roots efficiently extract water and nutrients. Therefore, the African cultivated species will serve as donor species for identification and introgression of weed competitive traits for genetic improvement of Asian cultivated species. However, utilization of O. glaberrima, in O. sativa breeding is hampered by high sterility in interspecific F1 and in early generation of selfed progenies. Repeated backcrossing of interspecific F1s with recur-rent of O. sativa will help in development of fertile progenies. Considering the tremendous scope of utilising the African rice for genetic improvement of Indica rice cultivars, in the present study, weed competitive accession of African rice identified at ICAR-IIRR, Hyderabad (data unpublished) was utilised for development of backcross population and mapping of weed competitive traits.
Materials and methodsPlant material and population development. Initially, a total of 31 O. glaberrima accessions were evaluated for weed competitive traits under laboratory and direct seeded rice in field conditions for two seasons along with checks (IR64, Sabita, Swarna and BPT5204) (unpublished). Based on findings, one O. glaberrima accession (IRGC105187) was found promising for weed competitive traits, namely higher seedling height, bio-mass and leaf area. Hence, IRGC105187 was used as the donor parent for development of mapping population and IR64, a weed sensitive variety with low seedling vigor was used as the recipient/recurrent parent. In total, 144 BC1F2:3 families were generated from the cross IR64*1/O. glaberrima cross.
Phenotyping of mapping population for weed competitive traits under direct seeded rice con-dition. The experiment was laid out in augmented block design with four blocks, wherein, each block con-sists of 36 BC1F2:3 families along with five checks. Each family was sown in two rows of two meter length with spacing of 20 × 15 cm. The population was phenotyped for six weed competitive traits such as seedling height (cm), number of tillers, number of leaves, leaf area (cm2), shoot fresh weight (g) and shoot dry weight (g). The each observation was made on average of three plants at 15, 30 and 45 days after sowing. The leaf area (cm2) was measured using leaf are meter (LI-COR, LI-3100C). Where, fresh leaves of three seedlings were passed through the leaf area meter and average was obtained for each genotype. Similarly, six physiological parameters such as absolute growth rate36, relative growth rate36, crop growth rate36, specific leaf area47, leaf area index47 and leaf area ratio47 were determined at each sampling interval using following formulas.
where as, “t” is number of days after sowing at which observation was recorded; t1 and t2 are first and second interval time (e.g., 15 DAS and 30 DAS) of observation respectively. Where, h1 and h2 are seedling height at t1 and t2 respectively. The difference between seedling heights of two intervals was divided by difference in days for two sampling intervals and expressed as cm day-1.
Absolute growth rate(
cm day−1)
=
(h2− h1)
(t2− t1).
Specific leaf area(
cm2g−1)
=
Leaf area per plant(
cm2)
Leaf dry weigh per plant(
g) ,
Leaf area index =
Leafareaperplant
Numberofplantsm−2,
Leaf area ratio(
cm2g−1)
=
Leafareaperplant(
cm2)
Totaldryweightperplant(
g) ,
3
Vol.:(0123456789)
Scientific Reports | (2020) 10:22103 | https://doi.org/10.1038/s41598-020-78675-7
www.nature.com/scientificreports/
where, w1 and w2 are plant dry weight at times t1 and t2, P = spacing (m2).
where, w1 and w2 are plant dry weight at times t1 and t2 respectively.The analysis of variance was carried out in R studio (version 4.0.2) using augmented RCBD package48 (https
://cloud .r-proje ct.org/packa ge=augme ntedR CBD) to get augmented ANNOVA and to estimate genotypic coef-ficient of variability, phenotypic coefficient of variability, broad sense heritability and genetic advance as percent mean. This package also provided histogram plots for each WCA traits. The box plots and correlation plots were plotted using R studio (version 4.0.2) using package ggplot2 (http://ggplo t2.tidyv erse.org, https ://githu b.com/tidyv erse/ggplo t2) and ggcorplot (http://www.sthda .com/engli sh/wiki/ggcor rplot ) respectively.
Genotyping of mapping population. Total genomic DNA of 30 days old seedlings was extracted using 2% Cetyl Trimethyl Ammonium Bromide (CTAB) method49. The DNA quantity and quality was analyzed by running on 0.8% agarose gel (Biorose agarose) and quantity of DNA in each sample was estimated by comparing the band intensity with known quantity of DNA (Lamda DNA ladder, Takara). The isolated genomic DNA was diluted with 1X TE buffer to get required concentration of DNA (~ 50 ng/μl) in each sample.
A total of 428 SSR markers spanning all over 12 rice chromosomes were used for identification of polymor-phic markers between two parents IR64 and O. glaberrima (IRGC105187). The SSR marker found polymorphic between parents were used for BC1F2 population genotyping. The PCR amplification was carried out in Effendorf Vapo.protect PCR cyclers in 96 well plates using following PCR cycling conditions. The 10 μl volume for each reaction containing 3.5 μl of 2X PCR Taq mastermix (ABM with dye), 0.5 μl of each forward and reverse SSR primer (5 pmol), 2 μl of diluted genomic DNA (~ 50 ng/μl) and 3.5 μl of nuclease free water. The PCR cycling involves, initial denaturation (94 °C for 3 min), denaturation (94 °C for 30 s), annealing (50–58 °C for 30 s), extension (72 °C for 40 s) and final extension (72 °C for 5 min) with 35 cycles (step 2, 3 and 4). Finally samples were stored in 4 °C in cyclers. PCR amplified products were resolved in 3–4 per cent agarose and sizes of ampli-fied fragments were determined by comparing with 100 bp ladder (Genei). The documented gels with amplified products were scored visually and allele score “A” was assigned to recurrent parent IR64, allele score “B” was assigned to donor parent O. glaberrima and heterozygotes were assigned with allele code of “H”. Whereas, miss-ing alleles were scored as “NA” and non parental alleles as “C”.
Linkage map construction and QTL analysis. The linkage map was constructed using QTL ICI map-ping software v 4.2 (CIMMYT) with MAP function as procedure described by50. Recombination frequency of 30 cM was threshold value for grouping, ordering within group was based on K-optimally with 2-optMAP and rippling by recombination frequency with window size of 5. The information regarding marker segregation based on chi-square goodness of fit based also obtained.
The QTL mapping was carried out with Windows QTL cartographer v 2.5 (N.C. state university, Bioinfor-matics Research Centre).The composite interval mapping methods (CIM) was performed with 1000 permuta-tions and significance level of 0.05 along with the standard model (model 6) of composite interval mapping with forward and backward regression method. The QTLs with threshold of > 2.5 LOD was used as criteria for declaring the QTL. The graphics showing QTL location were obtained from Windows QTL cartographer v 2.5. The standard procedure for QTL nomenclature was outlined by “The committee on Gene Symbolization, Nomenclature and Linkage (CGSNL) of the Rice Genetic Cooperative was followed51. Comparison of QTLs with previously reported QTLs were carried out using Q-TARO, Gramene QTL database and research publication (using physical position).
ResultsDevelopment of interspecific mapping population. The O. glaberrima accession, IRGC105187 was crossed to O. sativa cv. IR64, a widely adapted mega variety, but poor in weed competitive ability. The interspe-cific F1 developed by crossing IR64 (♀) with O. glaberrima (♂ ) showed complete pollen sterility, therefore, the BC1F1 seeds were generated by backcrossing F1 with recurrent parent IR64, wherein, F1s served as female parent and IR64 as pollen donor. However, very low seed set during backcross was observed as clipping the florets of the F1 plants lead to shattering of florets within 24 h of pollination. The BC1F1 plants showed partial spikelet fertility (data not shown) and set seeds upon selfing. Each selfed seed obtained from the BC1F1 plants were raised as indi-vidual BC1F2 plants. Among the BC1F2 plants the spikelet fertility varied significantly and set seeds upon selfing. The seeds from each BC1F2 plants were constituted to develop BC1F2:3 families. In total, 144 BC1F2:3 families were generated from the cross IR64*1/IRGC105187.
Phenotyping of BC1F2:3 mapping population for WCA traits under DSR condition. One hundred forty four BC1F2:3 families along with five checks grown under direct seeded condition were phenotyped for 12 WCA traits at 15, 30 and 45 DAS. The following abbreviations such as, SH (seedling height), NT (number of till-ers), NL (number of leaves), LA (leaf area), SFW (shoot fresh weight), SDW (Shoot dry weight), AGR (absolute growth rate), SLA (specific leaf area), LAI (leaf area index), LAR (leaf area ratio), CGR (crop growth rate), RGR (relative growth rate) with corresponding sampling interval (i.e., SH15, SH30 and SH45) were used hereafter in
Crop growth rate(
g m−2 day−1)
=
(W2−W1)
P(t2− t1).
Relative growth rate(
g g−1 day−1)
=
(
logeW2− logeW1)
(t2− t1),

4
Vol:.(1234567890)
Scientific Reports | (2020) 10:22103 | https://doi.org/10.1038/s41598-020-78675-7
www.nature.com/scientificreports/
the manuscript. The augmented analysis of variance (Supplementary Table. S1) revealed significant variability in mapping population for most of the traits except eight WCA traits such as LA15, SLA15, SLA30, LAI15, LAR15, LAR30, LAR45 and CGR15. The checks showed significant difference between each other for all the traits, except for the NT45, NL45 and SLA45. Similarly, mean sum of squares due to treatment vs checks were significant for all traits (SH30, SLA15, SLA30 and SLA45), which indicates that treatments are performing significantly differ-ent than checks.
Phenotypic variation and mean performance of mapping population and parents for WCA traits are presented in Supplementary Table. S2 and graphically represented in box plots (Fig. 1). Although, seedling height in map-ping populations was lower at SH15 (12.29 cm) as compared parents, it increased rapidly at SH30 (20.56 cm) and at SH45 (30.30 cm) and recorded higher values than both parents. Number of tiller at NT15 was confined to single tiller per plant. However, average number of tillers were higher than both the parents in mapping popula-tion at NT30 (3.99) and NT45 (9.24). Similar findings were observed for number of leaves at NL15, as mapping population including parents had three leaves per plant and average number of leaves in mapping population at NL30 (14.28) and NL45 (32.46) were higher than both the parents. Mean leaf area at LA15 was 3.58 cm2, which is lower than both parents. However, significant increase in the leaf area was observed at LA30 and LA45 with mean leaf area of 32.68 cm2 and 116.82 cm2 respectively. At LA45 average leaf area in the mapping population was higher than the donor parent O. glaberrima (105.8 cm2). The mean shoot fresh weight (g) of the mapping population at SFW15 was 0.090 g which was lower than both parents. However, significant increase in average shoot fresh weight (g) was observed at SFW30 with 1.04 g and at SFW45 with 5.09 g, which is higher than donor parent O. glaberrima (0.91 g and 2.66 g) at both sampling intervals. Similar findings were observed for shoot dry weight (g) at SDW15 with the mapping population recording a mean value of 0.021 g which is lower than both parents. As observed for the other traits, significant increase in average shoot dry weight was observed at SDW30 with 0.210 g and at SDW45 with 0.990 g which is higher than donor parent O. glaberrima (0.170 g and 0.497 g) at both sampling intervals. The heritability estimates (Supplementary Table S3) were found high (60.57–98.40%) for all above traits except that it was moderate for SH30, SDW15 (39.66–59.46%) and found low for LA15 (19.45%).
The mean absolute growth rate of the mapping population was observed to decrease from AGR15 (0.81 cm day−1) to AGR30 (0.55 cm day−1). However, it increased at AGR45 (0.64 cm day−1), while IR64 (0.92–0.13 cm day−1) and O. glaberrima parent (0.88–0.41 cm day−1) showed decreasing trends from AGR15-AGR45. The mean specific leaf area of the mapping population was observed to decrease in successive sampling intervals as it reduced from 350.29 cm2 g−1 at SLA15 to 251.79 cm2 g−1 at SLA45. Similarly, O. glaberrima parent showed decreasing trend from 618.99 cm2 g−1 at SLA15 to 342.49 cm2 g−1 at SLA45. The leaf area index found increasing from 0.11 at LAI15 to 3.51 at LAI45. Similarly, O. glaberrima parent shown increase in leaf are index from 0.41 at LAI15 to 3.16 at LAI45. The leaf area ratio shown similar trends as of specific leaf area, where mean leaf area ratio was decreased at each sampling interval as it was reduced from 173.27 cm2 g−1 at LAR15 to 124.98 cm2 g−1 at LAR45. Similarly, O. glaberrima parent shown decreasing trend from 381.82 cm2 g−1 at LAR15 to 211.26 cm2 g−1 at LAR45. The mean crop growth rate in mapping population at CGR15 was 0.05 g m2 day−1 which is
Figure 1. Box plots representing the phenotypic variation for weed competitive ability traits in mapping population.

5
Vol.:(0123456789)
Scientific Reports | (2020) 10:22103 | https://doi.org/10.1038/s41598-020-78675-7
www.nature.com/scientificreports/
lower than both parents. However, crop growth rate was increased at CGR30 with mean of 0.46 g m2 day−1 and at CGR with mean of 1.73 g m2 day−1, which is higher than the donor parent O. glaberrima. Relative growth rate in mapping population at RGR30 was ranging from 0.07–0.26 g g−1 day−1 with average of 0.15 g g−1 day−1. Whereas, at RGR45 it was ranging from 0.01–0.17 g g−1 day−1 with average of 0.10 g g−1 day−1. The heritability esti-mates (Supplementary Table. S3) were found high for AGR15, AGR30, AGR45, LAI30, LAI45, CGR30, CGR45, RGR30 and RGR45 (60.57–98.06%). The traits such as SLA15, SLA30, SLA45, LAR45 and CGR15 had moderate heritability (39.66–59.98%), while heritability was found to be low for LAI15, LAR15 and LAR30 (7.1–20.95%).
All weed competitive traits exhibited positively skewed distribution, except RGR30 and RGR45 which were negatively skewed (Supplementary Fig. S1). Transgressive segregants were observed for all weed competitive traits while the number of families performing better than donor parent increased with later sampling interval for all the traits.
Correlation among weed competitive ability traits. The traits such as seedling height, number of tillers, number of leaves, leaf area, shoot fresh weight, shoot dry weight, absolute growth rate, leaf area index and crop growth rate had significant positive association among them at all stages of sampling. However, specific leaf area and leaf area ratio had significant negative association with shoot dry weight, crop growth rate and relative growth rate (Fig. 2).
Mapping QTLs for weed competitive ability traits. Among 428 SSR markers employed for paren-tal polymorphism between IR64 and IRGC105187, 137 (32%) were found to be polymorphic. Among them 27 markers, which were located at telomere, centromere were excluded. Hence, the mapping population was genotyped with 110 markers. Interestingly, 18 markers were monomorphic (amplifying only IR64 allele) and 11 markers produced non-scorable banding pattern (Supplementary Table S4). Hence, the linkage map was
Figure 2. Correlation among weed competitive ability traits in mapping population (Values in the each rectangle indicates correlation coefficients).

6
Vol:.(1234567890)
Scientific Reports | (2020) 10:22103 | https://doi.org/10.1038/s41598-020-78675-7
www.nature.com/scientificreports/
constructed finally with 81 SSR marker data with genome coverage of 1423 cM. The distribution of these 81 polymorphic SSR markers on each chromosome was ranging from three (chromosome 4) to 10 (chromosome 1) with average of seven markers per chromosome. The genome coverage on each chromosome was ranging from 56.39 cM (chromosome 10) to 281.11 cM (chromosome 2) with average genome coverage of 118.60 cM per chromosome. The marker interval ranged from 7.04 cM (chromosome 10) to 35.14 cM (chromosome 2) with average marker interval of 17.76 cM. Significance of chi-square goodness of fit test revealed that, none of the 81 (100%) SSR markers were segregating according to the expected ratio and exhibited segregation distortion with most of the markers showing distortion towards recurrent parent IR64.
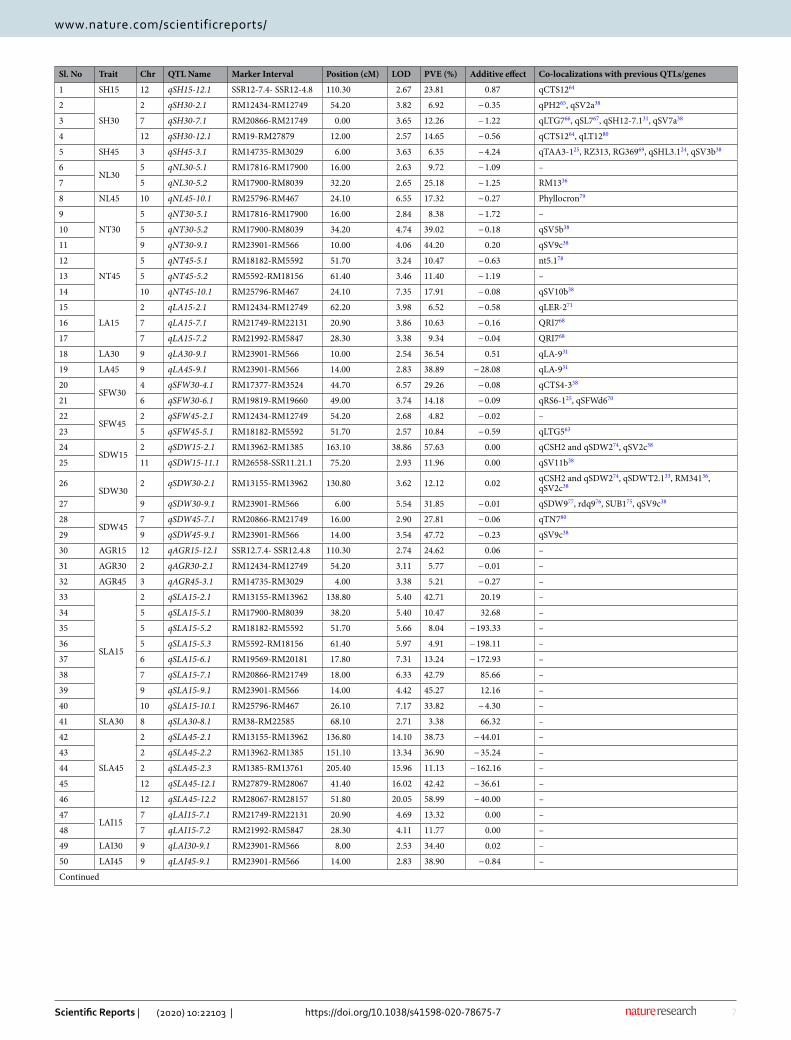
The study identified 72 QTLs associated with 12 WCA traits measured at 15, 30 and 45 DAS (Table 1) in the interspecific backcross derived mapping population. These QTLs were located on all rice chromosomes except chromosome 1 (Supplementary Table. S5, Supplementary Figure S2). Among the 72 QTLs, 28 QTLs were iden-tified at 15 DAS, 21 QTLs at 30 DAS and 23 QTLs at 45 DAS. There were 59 major QTLs with more than 10% phenotypic variance explained (PVE). Among the 59 major QTLs, 38 QTLs were derived from O. glaberrima (Table1). The numbers of QTLs identified for each trait at three sampling intervals are discussed below.
A total of five QTLs were identified for seedling height across three sampling stages namely, qSH15-12.1 (23.81%), qSH30-7.1 (12.26%), qSH30-12.1 (14.65%), qSH30-2.1 (6.92%) and qSH45-3.1 (6.35%). Six QTLs were identified for number of tillers at NT30 and NT45 namely qNT30-5.1 (8.38%), qNT30-5.2 (39.02%), qNT30-9.1 (44.20%), qNT45-5.1 (10.47%), qNT45-5.2 (11.40%) and qNT45-10.1 (17.91%). Number of leaves had three QTLs at NL30 and NL45 such as qNL30-5.1 (9.72%), qNL30-5.2 (25.18%) and QTL qNL45-10.1 (17.32%).The leaf area had five QTLs across three sampling stages, namely qLA15-7.1 (10.63%), qLA15-2.1 (6.52%) and qLA15-7.2 (9.34%), qLA30-9.1 (36.54%) and qLA45-9.1 (38.89%). Shoot fresh weight had two QTLs each at SFW30 and SFW45 namely qSFW30-4.1 (29.26%), qSFW30-6.1 (14.18%), QTL qSFW45-2.1 (4.82%) and qSFW45-5.1 (10.84%). There were six QTLs for total for shoot dry weight across three sampling stages, viz., qSDW15-2.1 (57.63%), qSDW15-11.1 (11.96%), qSDW30-2.1 (12.12%), qSDW30-9.1 (31.85%), qSDW45-7.1 (27.81%) and qSDW45-9.1 (47.72%).
The trait absolute growth rate had one QTL each at three sampling intervals, viz., qAGR15-12.1 (24.62%), qAGR30-2.1 (5.77%) and qAGR45-3.1 (5.21%). Relatively large number of (14) QTLs were identified for specific leaf area at three sampling stages. QTLs such as qSLA15-2.1, qSLA15-5.1, qSLA15-6.1, qSLA15-7.1, qSLA15-9.1 qSLA15-10.1 had phenotypic variance ranging from 10.47–45.27%. At SLA30, one minor QTL qSLA30-8.1 (3.38%) was identified. Whereas at SLA45, five major QTLs were found (qSLA45-2.1, qSLA45-2.2, qSLA45-2.3, qSLA45-12.1 and qSLA45-12.2) with phenotypic variance of 11.13–58.99%. Four major QTLs namely qLAI15-7.1 (13.32%) qLAI15-7.1 (11.77%), qLAI30-9.1 (34.40%) and qLAI45-9.1 (38.90%) were identified for leaf area index. The trait leaf area ratio had 15 QTLs, wherein 10 QTLs were detected at LAR15, three QTLs at LAR30 and two QTLs at LAR45. The QTLs qLAR15-2.1, qLAR15-3.1, qLAR15-5.1, qLAR15-5.2, qLAR15-6.1, qLAR15-8.1, qLAR15-8.2, qLAR15-9.1, qLAR15-10.1 and qLAR15-11.1 had phenotypic variance of 13.08–52.01%. The QTLs at LAR30 (qLAR30-8.1, qLAR30-9.1 and qLAR30-12.1) had phenotypic variance of 15.27–29.71%. Whereas, at LAR45 two major QTLs, qLAR45-12.1 (31.60%) and qLAR45-12.2 (30.60%) were identified. Across three sampling intervals, six QTLs were identified for crop growth rate namely qCGR15-11.1 (18.26%), qCGR30-2.1 (12.82%), qCGR30-9.1 (31.34%), qCGR45-2.1 (47.50%), qCGR45-5.1 (36.27%) and qCGR45-9.1 (43.80%). The relative growth rate had one minor QTL (qRGR45-3.1) on chromosome three with phenotypic variance of 3.20%.
QTL hotspots for weed competitive ability traits. Interestingly, the QTL analysis identified nine genomic regions as QTL hotspot, wherein several QTLs associated with weed competitive traits were found to be co-localized. Among the nine QTL hotpots, three hotspots were localised on chromosome 2 while one each QTL hotspot on chromosome 3, 5, 7, 8, 9, 10 (Table 2). Three QTL hotspots of chromosome 2 were located between RM12434-RM12749, RM13155-RM13962 and RM13962-RM13585 harbouring 4 (qSH30-2.1, qFW45-2.1, qAGR30-2.1 and qLA15-2.1), 4 (qSDW30-2.1, qSLA15-2.1, qSLA45-2.1 and qCGR30-2.1) and 4 (qSDW15-2.1, qSLA45-2.2, qLAR15-2.1 and qCGR45-2.1) QTLs respectively. The QTL hotspot on chromosome 9 har-boured 12 QTLs (qSDW30-9.1, qLAR30-9.1, qCGR30-9.1, qLAI30-9.1, qLAR15-9.1, qNT30-9.1, qLA30-9.1, qLA45-9.1, qSDW45-9.1, qSLA15-9.1, qLAI45-9.1 and qCGR45-9.1) was located between RM239001-RM566. There were eight QTLs (qNL30-5.2, qNT30-5.2, qSLA15-5.1, qLAR15-5.1, qCGR45-5.1, qNT45-5.1, qFW45-5.1 and qSLA15-5.2) co-localized on chromosome 5 between RM17900-RM5592. Similarly, chromosome 10 had for four co-localized QTLs (qNL45-10.1, qNT45-10.1, qSLA15-10.1 and qLAR15-10.1) between RM25796-RM467. In case of QTL hotspot on chromosome 3 (RM14735-RM3029), chromosome 7 (RM20866-RM21749) and chromosome 8 (RM38-RM22585), the number of co-localized QTLs were 3 (qSH45-3.1, qAGR45-3.1 and qRGR45-3.1), 3 (qSH30-7.1, qSDW45-7.1 and qSLA15-7.1), and 3 (qSLA30-8.1, qLAR15-8.2 and qLAR30-8.1) QTLs respectively.
DiscussionEven though scarcity of labour and water is forcing shifting of rice cultivation from irrigated to direct seeded, it is besotted with major production constraints like weed infestation. Hence, development of weed competitive cultivars through plant breeding has become imperative for sustainable production under direct seeded and aerobic rice conditions. However, weed competitive ability is a quantitative trait, determined by interaction of associated traits such as plant height, tiller number, leaf canopy traits and root traits. Hence, insight into the genetic and molecular mechanisms of weed competitive ability will help in rapidly developing weed competitive cultivars. Therefore, the present study was designed and carried out to evaluate weed competitive ability of a map-ping population derived from O. sativa × O. glaberrima cross and to dissect their association with chromosomal region using QTLs identification approach.
7
Vol.:(0123456789)
Scientific Reports | (2020) 10:22103 | https://doi.org/10.1038/s41598-020-78675-7
www.nature.com/scientificreports/
Sl. No Trait Chr QTL Name Marker Interval Position (cM) LOD PVE (%) Additive effect Co-localizations with previous QTLs/genes
1 SH15 12 qSH15-12.1 SSR12-7.4- SSR12-4.8 110.30 2.67 23.81 0.87 qCTS1264
2
SH30
2 qSH30-2.1 RM12434-RM12749 54.20 3.82 6.92 − 0.35 qPH265, qSV2a38
3 7 qSH30-7.1 RM20866-RM21749 0.00 3.65 12.26 − 1.22 qLTG766, qSL767, qSH12-7.131, qSV7a38
4 12 qSH30-12.1 RM19-RM27879 12.00 2.57 14.65 − 0.56 qCTS1264, qLT1280
5 SH45 3 qSH45-3.1 RM14735-RM3029 6.00 3.63 6.35 − 4.24 qTAA3-125, RZ313, RG36969, qSHL3.124, qSV3b38
6NL30
5 qNL30-5.1 RM17816-RM17900 16.00 2.63 9.72 − 1.09 –
7 5 qNL30-5.2 RM17900-RM8039 32.20 2.65 25.18 − 1.25 RM1336
8 NL45 10 qNL45-10.1 RM25796-RM467 24.10 6.55 17.32 − 0.27 Phyllocron79
9
NT30
5 qNT30-5.1 RM17816-RM17900 16.00 2.84 8.38 − 1.72 –
10 5 qNT30-5.2 RM17900-RM8039 34.20 4.74 39.02 − 0.18 qSV5b38
11 9 qNT30-9.1 RM23901-RM566 10.00 4.06 44.20 0.20 qSV9c38
12
NT45
5 qNT45-5.1 RM18182-RM5592 51.70 3.24 10.47 − 0.63 nt5.178
13 5 qNT45-5.2 RM5592-RM18156 61.40 3.46 11.40 − 1.19 –
14 10 qNT45-10.1 RM25796-RM467 24.10 7.35 17.91 − 0.08 qSV10b38
15
LA15
2 qLA15-2.1 RM12434-RM12749 62.20 3.98 6.52 − 0.58 qLER-271
16 7 qLA15-7.1 RM21749-RM22131 20.90 3.86 10.63 − 0.16 QRI768
17 7 qLA15-7.2 RM21992-RM5847 28.30 3.38 9.34 − 0.04 QRI768
18 LA30 9 qLA30-9.1 RM23901-RM566 10.00 2.54 36.54 0.51 qLA-931
19 LA45 9 qLA45-9.1 RM23901-RM566 14.00 2.83 38.89 − 28.08 qLA-931
20SFW30
4 qSFW30-4.1 RM17377-RM3524 44.70 6.57 29.26 − 0.08 qCTS4-338
21 6 qSFW30-6.1 RM19819-RM19660 49.00 3.74 14.18 − 0.09 qRS6-125, qSFWd670
22SFW45
2 qSFW45-2.1 RM12434-RM12749 54.20 2.68 4.82 − 0.02 –
23 5 qSFW45-5.1 RM18182-RM5592 51.70 2.57 10.84 − 0.59 qLTG563
24SDW15
2 qSDW15-2.1 RM13962-RM1385 163.10 38.86 57.63 0.00 qCSH2 and qSDW274, qSV2c38
25 11 qSDW15-11.1 RM26558-SSR11.21.1 75.20 2.93 11.96 0.00 qSV11b38
26SDW30
2 qSDW30-2.1 RM13155-RM13962 130.80 3.62 12.12 0.02 qCSH2 and qSDW274, qSDWT2.133, RM34136, qSV2c38
27 9 qSDW30-9.1 RM23901-RM566 6.00 5.54 31.85 − 0.01 qSDW977, rdq976, SUB175, qSV9c38
28SDW45
7 qSDW45-7.1 RM20866-RM21749 16.00 2.90 27.81 − 0.06 qTN780
29 9 qSDW45-9.1 RM23901-RM566 14.00 3.54 47.72 − 0.23 qSV9c38
30 AGR15 12 qAGR15-12.1 SSR12.7.4- SSR12.4.8 110.30 2.74 24.62 0.06 –
31 AGR30 2 qAGR30-2.1 RM12434-RM12749 54.20 3.11 5.77 − 0.01 –
32 AGR45 3 qAGR45-3.1 RM14735-RM3029 4.00 3.38 5.21 − 0.27 –
33
SLA15
2 qSLA15-2.1 RM13155-RM13962 138.80 5.40 42.71 20.19 –
34 5 qSLA15-5.1 RM17900-RM8039 38.20 5.40 10.47 32.68 –
35 5 qSLA15-5.2 RM18182-RM5592 51.70 5.66 8.04 − 193.33 –
36 5 qSLA15-5.3 RM5592-RM18156 61.40 5.97 4.91 − 198.11 –
37 6 qSLA15-6.1 RM19569-RM20181 17.80 7.31 13.24 − 172.93 –
38 7 qSLA15-7.1 RM20866-RM21749 18.00 6.33 42.79 85.66 –
39 9 qSLA15-9.1 RM23901-RM566 14.00 4.42 45.27 12.16 –
40 10 qSLA15-10.1 RM25796-RM467 26.10 7.17 33.82 − 4.30 –
41 SLA30 8 qSLA30-8.1 RM38-RM22585 68.10 2.71 3.38 66.32 –
42
SLA45
2 qSLA45-2.1 RM13155-RM13962 136.80 14.10 38.73 − 44.01 –
43 2 qSLA45-2.2 RM13962-RM1385 151.10 13.34 36.90 − 35.24 –
44 2 qSLA45-2.3 RM1385-RM13761 205.40 15.96 11.13 − 162.16 –
45 12 qSLA45-12.1 RM27879-RM28067 41.40 16.02 42.42 − 36.61 –
46 12 qSLA45-12.2 RM28067-RM28157 51.80 20.05 58.99 − 40.00 –
47LAI15
7 qLAI15-7.1 RM21749-RM22131 20.90 4.69 13.32 0.00 –
48 7 qLAI15-7.2 RM21992-RM5847 28.30 4.11 11.77 0.00 –
49 LAI30 9 qLAI30-9.1 RM23901-RM566 8.00 2.53 34.40 0.02 –
50 LAI45 9 qLAI45-9.1 RM23901-RM566 14.00 2.83 38.90 − 0.84 –
Continued

8
Vol:.(1234567890)
Scientific Reports | (2020) 10:22103 | https://doi.org/10.1038/s41598-020-78675-7
www.nature.com/scientificreports/
Performance of mapping population for weed competitive ability traits. Based on mean perfor-mance, it was observed that, most of the lines in mapping population had lower seedling height than both par-ents at SH15. However, mapping population displayed rapid increase in the seedling height at SH30 and SH45 as compared to the parents. It was evidenced by higher absolute growth rate of mapping population as compared to the recurrent parent (i.e. IR64) at AGR30 and both the parents at AGR45. Vigorous growth of O. glaber-rima accessions after initial establishment has been well documented in earlier studies12,43,52. Recently, a study53 reported significant variability for plant height (8 DAS-28DAS) in introgression lines derived from O. glaber-rima. The mean number of tillers and number of leaves were found higher than both parents at 30 DAS and 45 DAS. The higher number of tillers and leaves in the mapping population expected to produce large canopy and increase in the ground coverage at early stage of crop development. However, a study52 reported lower number of tillers in the mapping population as compared to O. glaberrima parent in inter-specific cross derived progenies. The shoot fresh weight and dry weight was on lower side than that both the parents at SFW15 and SDW15. However, significant improvement over parents was observed at 30 and 45 DAS sampling as mapping population produced more biomass at exponential rate. The increased biomass accumulation in introgression lines can be attributed to rapid increase in the seedling height, tiller number, number of leaves at 30 and 45 DAS. The higher biomass indicates ability of genotype to produce more plant organs for given amount of assimilates. However, a study52 observed intermediate dry weight values for O. glaberrima derived inter-specific progenies. In support to
Sl. No Trait Chr QTL Name Marker Interval Position (cM) LOD PVE (%) Additive effect Co-localizations with previous QTLs/genes
51
LAR15
2 qLAR15-2.1 RM13962-RM1385 149.10 7.84 19.60 − 30.07 –
52 3 qLAR15-3.1 RM14391-RM15679 57.80 6.68 28.49 − 6.16 –
53 5 qLAR15-5.1 RM17900-RM8039 38.20 11.48 17.39 26.38 –
54 5 qLAR15-5.2 RM8039-RM18182 43.40 6.71 19.00 − 9.58 –
55 6 qLAR15-6.1 RM19569-RM20181 21.80 12.33 52.01 − 27.54 –
56 8 qLAR15-8.1 RM433-RM22622 51.10 4.57 13.08 − 8.88 –
57 8 qLAR15-8.2 RM38-RM22585 66.10 10.89 39.33 − 12.73 –
58 9 qLAR15-9.1 RM23901-RM566 8.00 14.05 53.29 0.64 –
59 10 qLAR15-10.1 RM25796-RM467 26.10 13.70 55.08 − 1.39 –
60 11 qLAR15-11.1 SSR11-25.5-RM26352 38.00 6.53 19.59 − 37.66 –
61
LAR30
8 qLAR30-8.1 RM38-RM22585 66.10 5.39 29.13 21.38 –
62 9 qLAR30-9.1 RM23901-RM566 6.00 5.73 29.71 6.08 –
63 12 qLAR30-12.1 RM19-RM27879 24.00 6.49 15.27 43.83 –
64LAR45
12 qLAR45-12.1 RM27879-RM28067 43.40 19.23 31.60 − 10.44 –
65 12 qLAR45-12.2 RM28067-RM28157 51.80 24.55 30.60 − 10.56 –
66 CGR15 11 qCGR15-11.1 RM26558-SSR11-21.1 75.20 5.23 18.26 − 0.03 –
67CGR30
2 qCGR30-2.1 RM13155-RM13962 130.80 3.45 12.82 0.04 –
68 9 qCGR30-9.1 RM23901-RM566 6.00 5.26 31.34 − 0.02 –
69
CGR45
2 qCGR45-2.1 RM13962-RM1385 159.10 2.70 47.50 − 0.08 –
70 5 qCGR45-5.1 RM17900-RM8039 36.20 3.44 36.27 0.54 –
71 9 qCGR45-9.1 RM23901-RM566 14.00 3.66 43.80 − 0.24 –
72 RGR45 3 qRGR45-3.1 RM14735-RM3029 0.00 2.84 3.20 − 0.02 –
Table 1. QTLs identified for weed competitive ability traits in BC1F2:3 mapping population derived from IR64*1/O. glaberrima. PVE (%) Phenotypic variance explained.
Table 2. QTL hotspots identified for weed competitive ability traits.
Sl. No Chr QTL hotspot Genomic region Position (cM) Physical size (Mb) No. of QTLs Co-localized QTLs
1 2 qWCA2a RM12434-RM12749 61.59–115.44 5.03 4 qSH30-2.1, qFW45-2.1, qAGR30-2.1 and qLA15-2.1
2 2 qWCA2b RM13155-RM13962 153.75–186.77 16.0 4 qSDW30-2.1, qSLA15-2.1, qSLA45-2.1 and qCGR30-2.1
3 2 qWCA2c RM13962-RM13585 186.77–269.77 4.70 4 qSDW15-2.1, qSLA45-2.2, qLAR15-2.1 and qCGR45-2.1
4 3 qWCA3 RM14735-RM3029 0.00–16.95 2.65 3 qSH45-3.1, qAGR45-3.1 and qRGR45-3.1
5 5 qWCA5 RM17900-RM5592 21.37–79.86 19.19 8 qNL30-5.2, qNT30-5.2, qSLA15-5.1, qLAR15-5.1, qCGR45-5.1, qNT45-5.1, qFW45-5.1 and qSLA15-5.2
6 7 qWCA7 RM20866-RM21749 0.00–25.14 19.32 3 qSH30-7.1, qSDW45-7.1 and qSLA15-7.1
7 8 qWCA8 RM38-RM22585 84.98–90.53 3.97 3 qSLA30-8.1, qLAR15-8.2 and qLAR30-8.1
8 9 qWCA9 RM23901-RM566 4.12–69.84 7.71 12qSDW30-9.1, qLAR30-9.1, qCGR30-9.1, qLAI30-9.1, qLAR15-9.1, qNT30-9.1, qLA30-9.1, qLA45-9.1, qSDW45-9.1, qSLA15-9.1, qLAI45-9.1 and qCGR45-9.1
9 10 qWCA10 RM25796-RM467 26.10–30.82 7.61 4 qNL45-10.1, qNT45-10.1, qSLA15-10.1 and qLAR15-10.1,

9
Vol.:(0123456789)
Scientific Reports | (2020) 10:22103 | https://doi.org/10.1038/s41598-020-78675-7
www.nature.com/scientificreports/
our observations in the this study, a recent study53 reported higher dry biomass accumulation in introgression lines of O. glaberrima at 28 DAS. Rapid biomass accumulation in mapping population was evidenced by higher means of crop growth rate and relative growth rate in mapping population at 30 DAS and 45 DAS. The leaf area at 15 DAS did not show any significant variability in the mapping population and none of introgression lines were found better than the O. glaberrima parent. However, range of phenotypic variability significantly widened at later stages and mapping population had higher mean leaf area than IR64 at 30 DAS and both parents at 45 DAS. These results indicate introgression lines/progenies have the ability to put up more rapid leaf area. In support to our findings, a study43 suggested the rapid initial growth of O. glaberrima interspecific progenies was associated with faster leaf growth. Another study54 also reported large variability for leaf area in introgression lines. Our findings showed similar trends with respect to leaf area index. Specific leaf area at 15 DAS showed that, most of the introgression lines had higher specific leaf area than the recurrent parent IR64 but lesser than the O. glaber-rima parent. However, at later sampling stages (30 and 45 DAS), mean specific leaf area of mapping population shown decreasing trends. These results indicate leaves will get thicker as growth progresses and found to be having intermediary values of both parents. As opined by Dingkhun45, cultivars that have large specific leaf area during early developmental stages (more ground coverage) and small specific leaf area (for yield benefit) during advance stage is desirable for weed competitiveness. Several earlier studies43,44 have reported O. glaberrima inter-specific progenies had intermediate specific leaf area during early growth stages, followed by a decrease as that of O. sativa parent. Similar results were also reported52,54 in O. glaberrima interspecific progenies. In our study, the mapping population had lower leaf area ratio than both the parents at all sampling stages. It indicates mapping population produced less leaf area per unit dry weight and same dry matter might be diverted to development of seedling height, tillers and leaves. There is lack of reports on leaf area ratio in O. glaberrima and their progenies.
Interspecific linkage map. The result found that, 137 out of 428 (32%) SSR markers were polymorphic. The polymorphism% in the present study was found to be low when compared to other studies involving inter-specific cross between O. sativa × O. glaberrima parents. For instance a study55 reported 100 out of 140 (71.40%) SSRs were polymorphic, while other56,57 reported higher an even higher 79.3% (130 out of 164) and 77.9% (109 out of 140 microsatellites) polymorphism, respectively. However, there are studies58,59, which reported lower level of polymorphism (27–38% and ~ 40% respectively). Another study60, reported polymorphism % ranging from 23.87 to 50.66%. Based on these reports, there is a large variation for polymorphism % and results are con-fined to specific particular studies and they cannot be generalized. The factors such as, extent of genetic diversity between the parents, gene pool they belong to and distribution of chosen markers on chromosome affects results of polymorphism.
In our study, linkage map with length of 1423 cM was constructed using 81 polymorphic SSR markers. The length of linkage map and marker interval varies with number of markers used, recombination between the mark-ers and population type. Hence, there is no common agreement between linkage maps of different studies which used O. glaberrima as donor parent. The first interspecific O. sativa × O. glaberrima microsatellite based genetic linkage map was of 1923 cM (129 markers)61. Later studies reported linkage map of 1050 cM (100 SSR markers) with 10.5 cM marker interval in O. sativa*O. glaberrima population (Caiapo × IRGC 103,544)55. Similarly56,57 reported linkage map of 1725 cM (130 SSR markers) and 1162 cM (60 SSR markers) length respectively in inter-specific rice populations derived from O. sativa × O. glaberrima (WAB56-104 × CG14 and IR64 × TOG5681). Other studies59,60 reported physical map length of 371 Mb (86 SSR and 87 STS markers) and linkage map length of 2183.13 cM (114 microsatellites) in interspecific populations respectively. Very recently, a study62 reported linkage map with length of 2426.17 cM using 652 SNP markers.
O. glaberrima as source of weed competitiveness ability traits. In the present study, 59 major QTLs were detected with phenotypic variance of 10.47–58.99%. Among the 59 major QTLs, 38 QTLs were derived from O. glaberrima. These 38 major QTLs from O. glaberrima were identified for weed competitive traits such as seedling height, number of tillers, number of leaves, leaf area, shoot fresh weight, shoot dry weight, specific leaf area, leaf area index, leaf area ratio and crop growth rate. Whereas, QTLs from O. glaberrima for traits such as absolute growth rate and relative growth rate were observed to be minor. The QTLs such as qSH30-7.1 (qLTG766, qSL767, qSH12-7.131, qSV7a38), qSH45-3.1 (qTAA3-125, RZ313, RG36969, qSHL3.124, qSV3b38), qNT30-5.2(qSV5b38), qNT45-10.1 (qSV10b38), qLA30-9.1 & qLA45-9.1 (qLA-931), qSFW30-6.1 (qRS6-125, qSFWd670) and qSDW30-9.1 & qSDW45-9.1 (qSDW977, rdq976, SUB175, qSV9c38) were had beneficial alleles from O. glaberrima with major QTL effects. Hence, these QTLs can be employed in marker-assisted selection for developing weed competitive cultivars. These results indicates, O. glaberrima species inherits genes/allele essential for development of weed competitive traits and could be used as potential donor in breeding for weed competitiveness. The QTLs identified in present study will pave for development of weed competitive rice geno-types suitable for DSR.
Dynamic expression of weed competitive QTLs. In rice, several studies have reported QTL associated with WCA traits present on 12 chromosomes24–40. Each study used different determinants to assess and identify genomic regions associated with WCA viz., shoot length, shoot weight, coleoptile length, shoot dry weight, leaf area and specific leaf area. Most of the QTLs identified for WCA traits have been carried out under controlled conditions using petri dishes, slant plates, paper rolls, hydroponics, sand and hydroponics and soil filled pipes2, while the major QTLs associated with WCA traits were identified through a thorough field screening experi-ment. It was also observed that, traits such as seedling/plant height and shoot/total dry weight were used as major determinants of WCA in most the studies and large number of QTLs were reported for these two traits. The traits such as fresh biomass, number of leaves and leaf area were also given relative importance. However,

10
Vol:.(1234567890)
Scientific Reports | (2020) 10:22103 | https://doi.org/10.1038/s41598-020-78675-7
www.nature.com/scientificreports/
trait such as number of tillers and physiological parameters such as specific leaf area, growth rate estimates were sparsely used and relatively less number of QTLs were reported.
In our study, relatively equal number of QTLs was identified at each sampling stage. Among the 72 QTLs, 28 QTLs were identified at 15 DAS, 21 QTLs at 30 DAS and 23 QTLs at 45 DAS. It was also observed that, QTLs shown stage specific or dynamic expression as none of QTL region commonly found across three sampling stages. However, QTL region on chromosome 9 (RM23901-RM566) found common at two sampling intervals for several traits such as LA30, LA45, SDW30, SDW45, LAI30, LAI45, LAR15, LAR30, CGR30 and CGR45. Similarly, QTL region on chromosome 2 (RM13155-RM13962) found common SLA15 and SLA45. These stable QTLs can be further analysed and characterized for future studies. Similar to our findings, stage specific or dynamic expres-sion of WCA QTLs has been well documented in previous studies. Recently a study38 reported that, 33.3% (plant height), 10.7% (tiller number) and 3.4% (above ground dry weight) of the total QTLs were detected in all three sampling stages. Our study indicates that, QTL identified are specific to either 15 DAS or 30 or 45 DAS and we could not find common QTLs across all three stages. Therefore, it can be concluded that QTLs expression is highly dynamic and stage specific. The consistent QTLs and stage specific QTLs associated with weed competitive in our study plays significant role in understanding the genetic architecture of weed competitive traits.
Comparison of QTLs identified in the present study with those from previous reports. The QTLs identified in the present study were compared with previously reported QTLs (using QTARO, Gramene QTL database and research reports with physical positions). The QTLs identified for cold or low temperature tol-erance/submergence tolerance/drought tolerance in the previous studies were taken into consideration as they are directly correlated with vigour24,31,33,36,38,63–80. Based on these findings, QTLs identified in the present study for traits such as seedling height, number of leaves, number of tillers, leaf area, shoot fresh weight, shoot dry weight at all sampling co-localized with those identified in previous studies except qNL30-5.1, qNT30-5.1 and qSFW45-2.1. These three minor QTLs were derived from O. glaberrima parent and found to be novel. As most of the identified QTLs were co-localized with previous reports, which are based on different mapping population and diverse environments, the QTLs identified in the present study can be utilized in developing WCA varieties with greater confidence. However, QTLs for the traits such as absolute growth rate, specific leaf area, leaf area index, leaf area ratio crop growth rate and relative growth rate have been sparsely studied so far and only few QTLs have been reported with respect to WCA in rice.
QTL hotspots for weed competitive ability traits. The QTL “hotspots” for WCA and related traits were reported by many studies23,24,29,30,36,67,70 on different chromosomes for various co-localized traits. The pos-sible reasons for co-localization may be due to linkage or pleiotropy. Similarly, significant correlations among co-localized traits provide possible explanation for QTL “hotspots”. The study25 also pointed out that, co-locali-zation may have occurred by chance, whenever large numbers of QTLs were detected. In the present study, QTL hotspot qWCA9 (7.71 Mb) harboured 12 major QTLs with average phenotypic variance of 39.65%. Whereas, QTL hotspot qWCA5 (19.19 Mb) had eight co-localized QTLs with average phenotypic variance of 18.66%. The QTL hotspots on chromosome 2, qWCA2a (5.03 Mb), qWCA2b (16.0 Mb), and qWCA2c (4.70 Mb) found to harbour four QTLs each with average phenotypic variance of 6.0%, 26.59% and 40.40%. However, all the QTLs in qWCA2a and qWCA2c had positive alleles from O. glaberrima and in qWCA2b, recurrent parent IR64 con-tributed positive alleles. Similarly, the QTL hotspot qWCA10 (7.61 Mb) co-localized with four major QTLs con-tributed from O. glaberrima with average phenotypic variance of 31.03%. The QTL hotspot qWCA3 (2.65 Mb) and qWCA5 (13.17 Mb) had three QTLs each with average phenotypic variance of 4.92% and 9.78% respectively with positive alleles contribution from O. glaberrima. While, QTL hotspots qWCA7 (19.32 Mb) and qWCA8 (3.97 Mb) had average phenotypic variance of 27.62% and 23.94% respectively with positive alleles contribu-tion from both parents. These results indicate both parents associated with positive alleles of WCA associated traits and presence wide range of molecular and phenotypic diversity for WCA associated traits among mapping population23. These genomic regions need to be further characterized and used as potential target in marker assisted breeding for improvement of rice varieties for WCA. However, QTL hotspots identified in multiple environments could be ideal for understanding its regulatory role and further use in molecular breeding.
Segregation distortion in O. sativa × O. glaberrima mapping population. Segregation distortion (deviation of observation of marker ratio from the expected ratio) is the strong evolutionary force, commonly encountered in mapping populations derived from diverse genotypes81,82. In QTL mapping, the segregation distortion known to affect precision of QTL mapping by altering the genetic distance between the markers and the order of the markers on the linkage group. However, Zhang et al.,83 concluded that, in general, segregation distortion will not produce more false QTL, nor will it have significant impact on the estimation of QTL position and effect. As Zhang et al.83 and Xu84 suggested, dense linkage map with large-size mapping population would minimize power loss even in the presence of segregation distortion. In the present study, mapping population showed presence of segregation distortion for all the markers used. Presence of hybrid sterility genes and game-tophyte competition gene55,59,61,85 in O. sativa × O. glaberrima interspecific population were found to cause seg-regation distortion. A recent study85 reported 10 hybrid sterility loci (S1-glab, S19-glab, S20-glab, S37-glab, S38-glab, S39-glab) as gamete eliminator or pollen killer between O. sativa × O. glaberrima interspecific population. We also observed high amount of spikelet sterility in the backcross progenies. Similar to our findings, several studied in have reported presence of sterility and segregation distortion in O. sativa × O. glaberrima interspecific populations55,59,61,62. Very recently, Neelam et al.62, reported segregation distortion in SNP genotyping while mapping QTL for bacterial leaf blight from O. glaberrima derived population. As Xu and Hu86 opined, for a long period of time distorted markers were simply discarded from QTL mapping for the reason of precaution
11
Vol.:(0123456789)
Scientific Reports | (2020) 10:22103 | https://doi.org/10.1038/s41598-020-78675-7
www.nature.com/scientificreports/
and they also found that if distorted markers handled properly, they can be beneficial to QTL mapping with no detrimental effects. Previous studies used statistical package Proc QTL86 (SAS) and MapDisto 2.055 for handling of segregation distortion in F2 and BC1F1, RIL and DH population only. However, there is a need develop suit-able package for BC1F2 population. The QTLs identified in the present study can be considered as least affected by segregation distortion as most of the QTLs identified were co-localized with previously identified QTLs. In support of our observation, Xian-Liang81 also opined that, effect of segregation distortion is minimal with the use of co-dominant markers like SSRs and also in backcross population.
ConclusionsShift towards DSR cultivation has been gaining importance in recent years, which offer considerable saving of water and labour resources. However, it inherited the threat of weed infestation. Hence, breeding for weed competitive rice cultivars is need of the hour to tackle problem of weed infestation under DSR. The African endemic rice species O. glaberrima has the weed competitive ability due to their early vigorous growth and high specific leaf area. However, there are no systemic studies till date to identify the genomic regions (QTLs/genes) associated with weed competitiveness in O. glaberrima. The present study is, first of its kind, in which inter-specific mapping population developed from IR64 × O. glaberrima (BC1F2:3) was employed to dissect QTLs for WCA traits. Phenotyping of mapping population revealed significant variability and presence of transgressive segregants for all the traits under study. Based on SSR genotyping linkage map of 1423 cM was constructed using 81 polymorphic markers which showed segregation distortion. The composite interval mapping identified 72 QTLs for 33 WCA traits which are stage specific. Of the 72 QTLs, 59 found to be major QTLs with more than 10% PVE. Among the 59 major QTLs, 38 QTLs were derived from O. glaberrima. These results indicate superiority of O. glaberrima in contributing favourable alleles for WCA traits. The study identified nine QTLs hotspot in the genome, wherein at least three QTLs were co-localized. Further, there is need for validation of putative QTLs, identification of candidate genes in QTL hot spots, fine mapping of major QTLs and development of functional markers in exploiting O. glaberrima for WCA traits.
Received: 1 August 2020; Accepted: 20 November 2020
References 1. Alexandratos, N. & Bruinsma, J. World agriculture towards 2030/2050: the 2012 revision. ESA Working paper No. 12–03. Rome,
FAO (2012). 2. Mahender, A., Anandan, A. & Pradhan, S. K. Early seedling vigour, an imperative trait for direct-seeded rice: An overview on
physiomorphological parameters and molecular markers. Planta 241, 1027–1050 (2015). 3. Pathak, H. et al. Direct-seeded rice: Potential, performance and problems-a review. Curr. Adv. Agril. Sci. 3, 77–88 (2011). 4. Kumar, V. & Ladha, J. K. Direct seeding of rice: Recent developments and future research needs. Adv. Agron. 111, 299–391 (2011). 5. Kaur, J. & Singh, A. Direct seeded rice: Prospects, problems/constraints and researchable issues in India. Curr. Agric. Res. J. 5,
13–32 (2017). 6. Anwar, M. P. et al. Weed suppressive ability of rice (Oryza sativa L.) germplasm under aerobic soil conditions. Aust. J. Crop Sci. 4,
706–717 (2010). 7. Fischer, A. J., Ateh, C. M., Bayer, D. E. & Hill, J. E. Herbicide resistant Echinochloa oryzoides and E. phyllopogon in California Oryza
sativa fields. Weed Sci. 48, 225–230 (2000). 8. Rahman, M. Agroecological and socioeconomic significance of different rice establishment methods. Acta Sci. Agric. 3, 33–37
(2019). 9. Jannink, J. L., Orf, J. H., Jordan, N. R. & Shaw, R. G. Index selection for weed suppressive ability in soybean. Crop Sci. 40, 1087–1094
(2000). 10. Jordan, N. Prospects for weed control through crop interference. Ecol. Appl. 3, 84–91 (1993). 11. Zhao, D. L., Atlin, G. N., Bastiaans, L. & Spiertz, J. H. J. Developing selection protocols for weed competitiveness in aerobic rice.
Field Crop Res. 97, 272–285 (2006). 12. Johnson, D. E., Dingkuhn, M., Jones, M. P. & Mahamane, M. C. The influence of rice plant type on the effect of weed competition
on Oryza sativa and Oryza glaberrima. Weed Res. 38, 207–216 (1998). 13. Ni, H., Moody, K., Robles, R. P., Paller, E. C. & Lales, J. S. Oryza sativa plant traits conferring competitive ability against weeds.
Weed Sci. 48, 200–204 (2000). 14. Fischer, A. J., Ramierz, H. V., Gibson, K. D. & Pinheiro, B. D. S. Competitiveness of semi dwarf rice cultivars against palisadegrass
(Brachiaria brizantha) and signalgrass (Brachiaria decumeans). Agron. J. 93, 967–973 (2001). 15. Caton, B. P., Cope, A. E. & Mortimer, M. Growth traits of diverse rice cultivars under severe competition: Implications for screen-
ing for competitiveness. Field Crops Res. 83, 157–172 (2003). 16. Zhao, D. L., Atlin, G. N., Bastiaans, L. & Spiertz, J. H. J. Cultivar weed competitiveness in aerobic rice: Heritability, correlated traits
and the potential for indirect selection in weed-free environments. Crop Sci. 46, 372–380 (2006). 17. Namuco, O. S., Cairns, J. E. & Johnson, D. E. Investigating early vigour in upland rice (Oryza sativa L.): Part I. Seedling growth
and grain yield in competition with weeds. Field Crops Res. 113, 197–206 (2009). 18. Moukoumbi, Y. D., Sié, M., Vodouhe, R., Toulou, B. & Ahanchede, A. Screening of rice varieties for their weed competitiveness.
Afr. J. Agril. Res. 6, 5446–5456 (2011). 19. Mahajan, G., Ramesha, M. S. & Chauhan, B. S. Response of rice genotypes to weed competition in dry direct-seeded rice in India.
Sci. World J. 4, 1–8 (2014). 20. Chauhan, B. S., Opena, J. L. & Ali, J. Response of 10 elite “Green Super Rice” genotypes to weed infestation in aerobic rice systems.
Plant Prod. Sci. 18, 228–233 (2015). 21. Dimaano, N. G. B. et al. Performance of newly developed weed-competitive rice cultivars under lowland and upland weedy condi-
tions. Weed Sci. 65, 798–817 (2017). 22. Jiang, L., Hou, M. Y., Ming, W. C. & Min, W. J. Quantitative trait loci and epistatic analysis of seed anoxia germinability in rice
(Oryza sativa). Rice Sci. 11, 238–244 (2004). 23. Dimaano, N. G. B. et al. Novel quantitative trait loci for weed competitive ability traits using the early generation backcross rice
populations. Biology https ://doi.org/10.20944 /prepr ints2 01808 .0493.v1 (2018).

12
Vol:.(1234567890)
Scientific Reports | (2020) 10:22103 | https://doi.org/10.1038/s41598-020-78675-7
www.nature.com/scientificreports/
24. Singh, U. M. et al. QTL hotspots for early vigor and related traits under dry direct-seeded system in rice (Oryza sativa L.). Front. Plant Sci. 8, 1–14 (2017).
25. Cui, K. H., Peng, S. B., Xing, Y. Z., Yu, S. B. & Zhang, Q. Molecular dissection of seedling vigor and associated physiological traits in the rice. Theor. Appl. Genet. 105, 745–753 (2002).
26. Yang, W., Yuan, G. & Lin, H. D. Discovery of elite alleles for seed vigor traits in two populations of japonica rice in Taihu lake region. AAS. 36, 754–763 (2010).
27. Abe, A. et al. OsGA20ox1, a candidate gene for major QTL controlling seedling vigor in rice. Theor. Appl. Genet. 125, 647–657 (2012).
28. Xi, L. et al. Identification and fine mapping of quantitative trait loci for seed vigor in germination and seedling establishment in rice. J. Integr. Plant Biol. 56, 749–759 (2014).
29. Redona, E. D. & Mackill, D. J. Mapping quantitative trait loci for seedling vigor in rice using RFLPs. Theor. Appl. Genet. 92, 395–402 (1996).
30. Lu, X. et al. Genetic dissection of seedling and early vigour in a recombinant inbred line population in rice. Plant Sci. 172, 212–220 (2007).
31. Cairns, J. E. et al. Investigating early vigour in upland rice (Oryza sativa L.): Part II. Identification of QTLs controlling early vigour under greenhouse and field conditions. Field Crops Res. 3, 207–217 (2009).
32. Lee, H., Kazuhiro, S., Atsushi, H. & Tadashi, A. Mapping and characterization of quantitative trait loci for mesocotyl elongation in rice (Oryza sativa L.). Rice. 5, 13 (2012).
33. Diwan, J., Channbyregowda, M., Shenoy, V., Salimath, P. & Bhat, R. Molecular mapping of early vigour related QTLs in rice. Res. J. Biol. 1, 24–30 (2013).
34. Dang, X. et al. Genetic diversity and association mapping of seed vigor in rice (Oryza sativa L.). Planta 239, 1309–1319 (2014). 35. Cheng, X. X. et al. Dynamic quantitative trait loci analysis of seed reserve utilization during three germination stage. PLoS ONE
8, 1–11 (2013). 36. Anandan, A., Anumalla, M., Pradhan, S. K. & Ali, J. Population structure, diversity and trait association analysis in rice (Oryza
sativa L.) germplasm for early seedling vigor (ESV) using trait linked SSR markers. PLoS ONE 11, 1–22 (2016). 37. Cordero-Lara, K. I., Kim, H. & Tai, T. H. Identification of seedling vigor- associated quantitative trait loci in temperate japonica
rice. Plant Breed. Biotechnol. 4, 426–440 (2016). 38. Chen, K. et al. Genetic dissection of seedling vigour in a diverse rice panel from the 3000 rice (Oryza sativa L.) genome project.
Nature 9, 1–15 (2019). 39. Sandhu, N. et al. Deciphering the genetic basis of root morphology, nutrient uptake, yield and yield related traits in rice under dry
direct-seeded cultivation systems. Sci. Rep. 9, 9334 (2019). 40. Najeeb, S. et al. Identification of main-effect quantitative trait loci (QTLs) for low-temperature stress tolerance germination and
early seedling vigour related traits. Mol. Breed. 40, 1–25 (2020). 41. Sarla, N. & Swamy, B. P. M. Oryza glaberrima: A source for the improvement of Oryza sativa. Curr. Sci. 89, 955–963 (2005). 42. Ndjiondjop, M. N. et al. Oryza glaberrima Steud. The Wild Oryza Genomes, Compendium of Plant genomes, Mondal, T. K. and
Henry, R. J. (eds). (2018). 43. Jones, M. P., Dingkuhn, M., Aluko, G. K. & Semon, M. Interspecific Oryza sativa L. × O. glaberrima Steud. progenies in upland
rice improvement. Euphytica 92, 237–246 (1997). 44. Jones, M. P., Mande, S. & Aluko, K. Diversity and potential of O. glaberrima Steud. in upland rice breeding. Breed. Sci. 47, 395–398
(1997). 45. Dingkuhn, M., Johnson, D. E., Sow, A. & Audebert, A. Y. Relationships between upland rice canopy characteristics and weed
competitiveness. Field Crops Res. 61, 79–95 (1999). 46. Fofana, B. & Rauber, R. Weed suppression ability of upland rice under low-input conditions in West Africa. Weed Res. 40, 271–280
(2000). 47. Amanullah, A., Hassan, M. J., Nawab, K. & Ali, A. Response of specific leaf area (SLA), leaf area index (LAI) and leaf area ratio
(LAR) of maize (Zea mays L.) to plant density, rate and timing of nitrogen application. World Appl. Sci. J. 2, 235–243 (2007). 48. Aravind, J., Shankar, M. S., Wankhede, D. P. & Kaur, V. Analysis of Augmented Randomised Complete Block Designs. pp. 1–17,
(2019). 49. Murray, M. & Thompson, W. F. Rapid isolation of molecular weight plant DNA. Nucleic Acids Res. 8, 4321–4325 (1980). 50. Wang, J., Li, H., Zhang, L. & Meng, L. Integrated software for analysis and genetic mapping in biparental populations. User’s manual
of QTL ICiMapping v4.2. pp. 1–292, (2019). 51. McCouch, S. R. Gene nomenclature system for rice. Rice. 1, 72–84 (2008). 52. Dingkhun, M., Jones, M. P., Johnson, D. E. & Sow, A. Growth and yield of Oryza sativa and O. glaberrima upland rice cultivars
and their interspecific progenies. Field Crops Res. 57, 57–69 (1998). 53. Kaur, B. Genetic variability for coleoptile length and seedling vigour in rice species, Oryza sativa L. and O. glaberrima Steud. and
molecular characterization of introgression in interspecific progenies. M. Sc. Thesis, Punjab Agric. Univ. Ludhiana, India. (2016). 54. Asch, F., Sow, A. & Dingkuhn, M. Reserve mobilization, dry matter partitioning and specific leaf area in seedlings of African rice
cultivars differing in early vigour. Field Crops Res. 62, 191–202 (1999). 55. Aluko, G. et al. QTL mapping of grain quality traits from the interspecific cross Oryza sativa × O. glaberrima. Theor. Appl. Genet.
109, 630–639 (2004). 56. Semagn, K. et al. Molecular profiling of an interspecific rice population derived from a cross between WAB 56–104 (Oryza sativa)
and CG14 (Oryza glaberrima). Afr. J. Biotechnol. 6, 2014–2022 (2007). 57. Ndjiondjop, M. N. et al. Molecular profiling of interspecific lowland rice population derived from IR64 (Oryza sativa) and TOG5681
(Oryza glaberrima). Afr. J. Biotechnol. 7, 4219–4229 (2008). 58. Bimpong, I. K. et al. Evaluation of Oryza sativa × O. glaberrima derived progenies for resistance to root-knot nematode and
identification of introgressed alien chromosome segment using SSR markers. Afr. J. Biotechnol. 9, 3988–3997 (2010). 59. Bimpong, I. K. et al. Identification of QTLs for drought related traits in alien introgression lines derived from crosses of rice (Oryza
sativa cv.IR64) and O. glaberrima under low land moisture stress. J. Plant Biol. 54, 237–250 (2011). 60. Moukoumbi, Y. D., Kolade, O., Drame, K. N., Sie, M. & Ndjiondjop, M. N. Genetic relationship between interspecific lines derived
from Oryza glaberrima and Oryza sativa crosses using microsatellites and agro-morphological markers. Spanish J. Agril. Res. 13, 1–10 (2015).
61. Lorieux, M., Ndjionjop, M. N. & Ghesquiere, A. A first interspecific Oryza sativa×Oryza glaberrima microsatellite based genetic linkage map. Theor. Appl. Genet. 100, 593–601 (2000).
62. Neelam, K. et al. High-resolution genetic mapping of a novel bacterial blight resistance gene Xa-45 (t) identified from Oryza glaberrima and transferred to Oryza sativa. Theor. Appl. Genet. https ://doi.org/10.1007/s0012 2-019-03501 -2.pp.1-17 (2019).
63. Suh, J. P., Ahn, S. N., Moon, H. P. & Suh, H. S. QTL analysis of low temperature germinability in a Korean weedy rice (Oryza sativa L.). Rice Genet. Newslett. 16, 1 (1999).
64. Andaya, V. & Tai, T. Fine mapping of the qCTS12 locus, a major QTL for seedling cold tolerance in rice. Theor. Appl. Genet. 133, 467–475 (2006).
65. Mao, B., Cai, W., Zhang, Z. & Hu, Z. Characterization of QTLs for harvest index and source-sink characters in a DH population of rice (Oryza sativa L.). Acta Genet. Sin. 30, 1118–1126 (2004).

13
Vol.:(0123456789)
Scientific Reports | (2020) 10:22103 | https://doi.org/10.1038/s41598-020-78675-7
www.nature.com/scientificreports/
66. Hou, M. Y., Wang, C. M., Jiang, L. & Wan, J. M. Inheritance and QTL mapping of low temperature germinability in rice (Oryza sativa L.). Acta Genet. Sin. 31, 701–706 (2004).
67. Zhang, Z. H., Yu, S. B., Yu, T., Huang, Z. & Zhu, Y. G. 2005c, Mapping quantitative trait loci (QTLs) for seedling-vigor using recombinant inbred lines of rice (Oryza sativa). Field Crops Res. 91, 161–170 (2005).
68. Xu, J. L., Zhong, D. B., Yu, S. B., Lou, L. J. & Li, Z. K. QTL affecting leaf rolling and folding in rice. Rice Genet. Newslett. 16, 15–53 (1999).
69. Kanbar, A., Janamatti, M., Sudheer, E., Vinod, M. S. & Shashidhar, H. E. Mapping QTLs underlying seedling vigour traits in rice (Oryza sativa L.). Curr. Sci. 90, 24–26 (2006).
70. Cui, K., Huang, J., Xing, Y. & Yu, S. Mapping QTLs for seedling characteristics under different water supply conditions in rice (Oryza sativa). Physiol. plant. 105, 745–753 (2008).
71. Dong, Y. et al. Mapping of QTLs for leaf developmental behaviour in rice (Oryza sativa L.). Euphytica 138, 169–175 (2004). 72. Andaya, V. C. & Mackill, D. J. Mapping of QTL associated with cold tolerance during the vegetative stage in rice. J. Exp. Bot. 54,
2579–2585 (2003). 73. Qu, Y. et al. Mapping QTLs of root morphological traits at different growth stages in rice. Genetica 133, 187–200 (2008). 74. Han, L. et al. 2007, Identification of quantitative trait loci for cold response of seedling vigor traits in rice. J. Genet. Genom. 34,
239–246 (2007). 75. Xu, K., Xu, X., Ronald, P. C. & Mackill, D. J. A high resolution linkage map of the vicinity of rice submergence tolerance locus
Sub1. Mol. Gen Genet 263, 681–689 (2000). 76. Li, Z. et al. QTL mapping of root traits in a double haploid population from a cross between upland and lowland japonica rice in
three environments. Theor. Appl. Genet. 110, 1244–1252 (2005). 77. Courtois, B., Shen, L., Petalcorin, W., Carandang, S. & Mauleon, R. Locating QTLs controlling constitutive root trait in the rice
population IAC 165 × Co39. Euphytica 134, 335–345 (2003). 78. Marri, P. R., Sarla, N., Reddy, L. V. & Siddiq, E. A. Identification and mapping of yiels and yield related QTL from an Indian acces-
sion of Oryza rufipogon. BMC Genet. 6, 33 (2005). 79. Miyamoto, N. et al. Quantitative trait loci for phyllochron and tillering in rice. Theor. Appl. Genet. 109, 700–706 (2004). 80. Onishi, K. et al. QTL cluster for plant architecture and its ecological significance in Asian wild rice. Breed. Sci. 57, 7–16 (2007). 81. Xian-Liang, S., Xue-Zhen, S. & Tian-Zhen, Z. Segregation distortion and its effect on genetic mapping in plants. Chin. J. Agril.
Biotech. 3(03), 163–169 (2006). 82. Reflinur, A. et al. Analysis of segregation distortion and its relationship to hybrid barriers in rice. Rice 7(3), 1–12 (2014). 83. Zhang, L. et al. Effects of missing marker and segregation distortion on QTL mapping in F2 populations. Theor. Appl. Genet. 121,
1071–1082 (2010). 84. Xu, S. Quantitative trait locus mapping can benefit from segregation distortion. Genetics 180, 2201–2208 (2008). 85. Li, J. et al. Neutral alleles at hybrid sterility loci of Oryza glaberrima from AA genome relatives in Genus Oryza. Breed. Sci. 68,
343–351 (2018). 86. Xu, S. & Hu, Z. Mapping quantitative trait loci using distorted markers. Int. J. Plant Genom. 2009, 1–11 (2009).
AcknowledgementsWe appreciate the financial support from Department of Biotechnology (DBT), Government of India under the project BT/PR17115/NER/95/434/2015. We thank ICAR-Indian Institute of Rice Research for providing phenotyping and genotyping facility.
Author contributionsExperimental idea and design: G.C., M.B., A.M.S. and L.R. Execution and performing experiment: G.C., M.B., B.P., M.A., Phenotyping facility: S.B., M.D.T. and B.P. Data analysis: S.R. and M.B. Manuscript preparation: M.B. and G.C., Editing manuscript: S.M.M., R.M.S., S.K.S., L.V.S., S.P., K.M.B., S.K. and T.K.M.
Competing interests The authors declare no competing interests.
Additional informationSupplementary Information The online version contains supplementary material available at https ://doi.org/10.1038/s4159 8-020-78675 -7.
Correspondence and requests for materials should be addressed to G.C.
Reprints and permissions information is available at www.nature.com/reprints.
Publisher’s note Springer Nature remains neutral with regard to jurisdictional claims in published maps and institutional affiliations.
Open Access This article is licensed under a Creative Commons Attribution 4.0 International License, which permits use, sharing, adaptation, distribution and reproduction in any medium or
format, as long as you give appropriate credit to the original author(s) and the source, provide a link to the Creative Commons licence, and indicate if changes were made. The images or other third party material in this article are included in the article’s Creative Commons licence, unless indicated otherwise in a credit line to the material. If material is not included in the article’s Creative Commons licence and your intended use is not permitted by statutory regulation or exceeds the permitted use, you will need to obtain permission directly from the copyright holder. To view a copy of this licence, visit http://creat iveco mmons .org/licen ses/by/4.0/.
© The Author(s) 2020
Copyright © 2022 FDOKUMEN