Relationships between upland rice canopy characteristics and weed competitiveness
Upload
khangminh22Category
view
3download
0
International Journal of
Environmental Research
and Public Health
Article
Invasive Weed Asystasia gangetica as a Potential Biomonitorand a Phytoremediator of Potentially Toxic Metals: A CaseStudy in Peninsular Malaysia
Chee Kong Yap 1,* , Weiyun Chew 1,† , Khalid Awadh Al-Mutairi 2, Salman Abdo Al-Shami 3 ,Rosimah Nulit 1 , Mohd Hafiz Ibrahim 1, Koe Wei Wong 1 , Alireza Riyahi Bakhtiari 4, Moslem Sharifinia 5 ,Wan Hee Cheng 6, Hideo Okamura 7, Mohamad Saupi Ismail 8 and Muhammad Saleem 9
�����������������
Citation: Yap, C.K.; Chew, W.;
Al-Mutairi, K.A.; Al-Shami, S.A.;
Nulit, R.; Ibrahim, M.H.; Wong, K.W.;
Bakhtiari, A.R.; Sharifinia, M.; Cheng,
W.H.; et al. Invasive Weed Asystasia
gangetica as a Potential Biomonitor
and a Phytoremediator of Potentially
Toxic Metals: A Case Study in
Peninsular Malaysia. Int. J. Environ.
Res. Public Health 2021, 18, 4682.
https://doi.org/10.3390/
ijerph18094682
Academic Editor: Paul B. Tchounwou
Received: 22 February 2021
Accepted: 26 March 2021
Published: 28 April 2021
Publisher’s Note: MDPI stays neutral
with regard to jurisdictional claims in
published maps and institutional affil-
iations.
Copyright: © 2021 by the authors.
Licensee MDPI, Basel, Switzerland.
This article is an open access article
distributed under the terms and
conditions of the Creative Commons
Attribution (CC BY) license (https://
creativecommons.org/licenses/by/
4.0/).
1 Department of Biology, Faculty of Science, Universiti Putra Malaysia, UPM, Serdang 43400, Malaysia;[email protected] (W.C.); [email protected] (R.N.); [email protected] (M.H.I.);[email protected] (K.W.W.)
2 Department of Biology, Faculty of Science, University of Tabuk, Tabuk 741, Saudi Arabia; [email protected] Indian River Research and Education Center, IFAS, University of Florida, Fort Pierce, FL 34945, USA;
[email protected] Department of Environmental Sciences, Faculty of Natural Resources and Marine Sciences,
Tarbiat Modares University, Noor 46417-76489, Iran; [email protected] Shrimp Research Center, Iranian Fisheries Science Research Institute, Agricultural Research, Education and
Extension Organization (AREEO), Bushehr 75169-89177, Iran; [email protected] Faculty of Health and Life Sciences, Inti International University, Persiaran Perdana BBN,
Nilai 71800, Malaysia; [email protected] Graduate School of Maritime Sciences, Faculty of Maritime Sciences, Kobe University, Kobe 658-0022, Japan;
[email protected] Fisheries Research Institute, Pulau Pinang 11960, Malaysia; [email protected] Department of Chemistry, Government Post Graduate College Mirpur, Affiliated Mirpur University of
Science and Technology, Mirpur 10250, Pakistan; [email protected]* Correspondence: [email protected]† Present address: Centre for Pre-University Study, Level, 6, Unity Building, MAHSA University, Bandar
Saujana Putra, Jenjarom 42610, Malaysia.
Abstract: The invasive weed Asystasia gangetica was investigated for its potential as a biomonitorand as a phytoremediator of potentially toxic metals (PTMs) (Cd, Cu, Ni, Pb, and Zn) in PeninsularMalaysia owing to its ecological resistance towards unfavourable environments. The biomonitoringpotential of PTMs was determined based on the correlation analysis of the metals in the differentparts of the plant (leaves, stems, and roots) and its habitat topsoils. In the roots, the concentrations(mg/kg dry weight) of Cd, Cu, Ni, Pb, and Zn ranged from 0.03 to 2.18, 9.22 to 139, 0.63 to 5.47, 2.43to 10.5, and 50.7 to 300, respectively. In the leaves, the concentrations (mg/kg dry weight) of Cd,Cu, Ni, Pb, and Zn ranged from 0.03 to 1.16, 7.94 to 20.2, 0.03 to 6.13, 2.10 to 21.8, and 18.8 to 160,respectively. In the stems, the concentrations (mg/kg dry weight) of Cd, Cu, Ni, Pb, and Zn rangedfrom 0.03 to 1.25, 5.57 to 11.8, 0.23 to 3.69, 0.01 to 7.79, and 26.4 to 246, respectively. On the otherhand, the phytoremediation potential of the five metals was estimated based on the bioconcentrationfactor (BCF) and the translocation factor (TF) values. Correlation analysis revealed that the rootsand stems could be used as biomonitors of Cu, the stems as biomonitors of Ni, the roots and leavesas biomonitors of Pb, and all three parts of the plant as biomonitors of Zn. According to the BCFvalues, in the topsoil, the “easily, freely, leachable, or exchangeable” geochemical fractions of the fivemetals could be more easily transferred to the roots, leaves, and stems when compared with totalconcentrations. Based on the TF values of Cd, Ni, and Pb, the metal transfer to the stems (or leaves)from the roots was efficient (>1.0) at most sampling sites. The results of BCF and TF showed thatA. gangetica was a good phytoextractor for Cd and Ni, and a good phytostabilizer for Cu, Pb, and Zn.Therefore, A. gangetica is a good candidate as a biomonitor and a phytoremediator of Ni, Pb, and Znfor sustainable contaminant remediation subject to suitable field management strategies.
Int. J. Environ. Res. Public Health 2021, 18, 4682. https://doi.org/10.3390/ijerph18094682 https://www.mdpi.com/journal/ijerph

Int. J. Environ. Res. Public Health 2021, 18, 4682 2 of 28
Keywords: potentially toxic metals; invasive weeds; phytoremediation; biomonitoring
1. Introduction
The natural ability to withstand harsh environments, such as degraded land, of theinvasive weed Asystasia gangetica (L.) makes this species a potential biomonitor and phytore-mediator for potentially toxic metal (PTM) pollution [1]. Its potential in the biomonitoringand phytoremediation of PTMs is owing to its ecological characteristics, as shown below:
(a) It has a wide geographical distribution. It is a herb originally from India and SriLanka [2], but it is now a highly invasive weed species that is widely naturalised inSoutheast Asia (Malaysia and Indonesia in particular) and in the Pacific Islands [3],Taiwan [4], and Northern Australia [5,6].
(b) It has high abundance. It produces seeds in large quantities [7]. This causes the weedto be utilised as a cover crop in oil palm plantations [8,9]. It is an evergreen herb thatforms mat-like structures that smother more desirable ground plants, hence affectingthe biodiversity and agricultural aspects of a particular environment [6].
(c) It is easy to grow and at a fast growth rate [10]. Under experimental polybags ingreenhouse conditions, Kumalasari et al. [11] reported that the dry matter yields ofboth the leaf and stem of A. gangetica increased (p < 0.001) progressively with ageand reached 11.6 g leaf dry matter, 19.0 g stem dry matter/plant, and 30.6 g totaldry matter/plant at 90 days after transplanting. Even though the biomass is notsubstantial when compared with other plants, the fast growth rate of the weeds canstill justify A. gangetica as a phytoremediator of PTMs.
(d) It is adaptable to different environmental conditions [12], being high shade toler-ant [10], it can even grow well under 90% shade [7]. It thrives best in full light andopen areas [3,13]. It has high resistance towards metals stress and toxic effects, able totranslocate metals from root to shoot, highly resistant towards pathogens and pests,easy adaptability to the climatic conditions of the growth area, and is not part of thefood chain as it is not edible by nature [14–17].
(e) It grows well in various types of soil all year round [18] and it can tolerate high levelsof pollutants [19]. Thus, the plant is widely distributed and is found in abundance inunattended open areas such as roadsides and riverbanks [2].
(f) It had been reported to enhance the contents of N, P, and K in the soil and to create anutrient balance [20]. In addition to contributing N, P, and K to the soil [20], it is alsorapidly decomposed [21], and hence can serve as a soil carbon stock [20].
(g) It was proposed as a biomonitor for PTM metal pollution such as Hg [22,23]. InPeninsular Malaysia, it is an invasive non-native weed that can be potentially usedas a good biomonitor in different land uses because this weed species is widelydistributed here [24].
To study the plant’s potential for phytoremediation (phytoextraction and phytosta-bilisation) quantitatively, the bioconcentration factor (BCF) and the translocation factor(TF) can be used [25–28]. For the selection of good hyperaccumulators for the phytoex-traction of metals, both BCF and TF are equally crucial to select plants that are capable ofphytoextracting metals from the surrounding environment [29].
The BCF is the evaluation of the ability of a plant to accumulate metals from itssurrounding environment (such as habitat soil) into its tissues (such as roots, stems, andleaves) [30]. On the other hand, TF is the evaluation of a plant’s ability to transfer theaccumulated metals from its below-ground parts (such as roots) to the plant above-groundparts (shoots such as stems or leaves) via the translocation pathway [31].
Reports using plants as biomonitors of anthropogenic sources of PTM pollution arecommonly found in the literature [32–36]. These showed that the metal levels in plantparts (leaves and roots) reflect the ambient air pollutant levels and the anthropogenicsources of pollutants in the habitats. In the study by Divan et al. [37], the wild plant

Int. J. Environ. Res. Public Health 2021, 18, 4682 3 of 28
species (Elephantopus mollis) appeared to have the highest Cd accumulation, suggestingit as a potential bioindicator for Cd. Yildirim and Sasmaz [38] suggested that differentparts of various plants could be used as biomonitors. Furthermore, De Paula et al. [39]proposed that the herb Struthanthus flexicaulis be utilised as a biomonitor of anthropogenicPTMs. Petrovic et al. [40] reported that the herbaceous perennial weed species, sunspurge (Euphorbia helioscopia), served as a good phytoextractor for Cu because it exhibitedelevated levels of Cu accumulation, denoting its potential as a Cu-phytoremediator. Theyrecommended the use of this herb as a seasonal biomonitor to screen the general metalpollution levels in the environment.
As there is no detailed study on A. gangetica from biomonitoring and phytoremediationaspects, this study aimed to determine the potentials of A. gangetica as (1) a biomonitorand (2) a phytoremediator of the PTMs (Cd, Cu, Ni, Pb, and Zn). The evaluation of itspotential as a biomonitor of PTMs was based on the correlation analysis of the metals inthe different plant parts (leaves, stems, and roots) and its habitat topsoil. Its potential as aphytoremediator of the five PTMs was evaluated based on the TF and BCF values. Theresults of this study aim at making a weed whose growth had to be regularly controlledinto a useful biomonitor and phytoremediator of PTMs.
2. Materials and Methods2.1. Sampling Site Descriptions and Soil Collection
Samplings of topsoils (0–10 cm) and Asystasia were done on 23 sites from 8 June 2011to 17 January 2012, in Peninsular Malaysia (Figure 1; Table 1). Once the samples werecollected, they were stored in polyethylene bags.
Int. J. Environ. Res. Public Health 2021, 18, x FOR PEER REVIEW 3 of 29
parts (leaves and roots) reflect the ambient air pollutant levels and the anthropogenic sources of pollutants in the habitats. In the study by Divan et al. [37], the wild plant species (Elephantopus mollis) appeared to have the highest Cd accumulation, suggesting it as a po-tential bioindicator for Cd. Yildirim and Sasmaz [38] suggested that different parts of var-ious plants could be used as biomonitors. Furthermore, De Paula et al. [39] proposed that the herb Struthanthus flexicaulis be utilised as a biomonitor of anthropogenic PTMs. Pe-trovic et al. [40] reported that the herbaceous perennial weed species, sun spurge (Euphor-bia helioscopia), served as a good phytoextractor for Cu because it exhibited elevated levels of Cu accumulation, denoting its potential as a Cu-phytoremediator. They recommended the use of this herb as a seasonal biomonitor to screen the general metal pollution levels in the environment.
As there is no detailed study on A. gangetica from biomonitoring and phytoremedia-tion aspects, this study aimed to determine the potentials of A. gangetica as (1) a biomoni-tor and (2) a phytoremediator of the PTMs (Cd, Cu, Ni, Pb, and Zn). The evaluation of its potential as a biomonitor of PTMs was based on the correlation analysis of the metals in the different plant parts (leaves, stems, and roots) and its habitat topsoil. Its potential as a phytoremediator of the five PTMs was evaluated based on the TF and BCF values. The results of this study aim at making a weed whose growth had to be regularly controlled into a useful biomonitor and phytoremediator of PTMs.
2. Materials and Methods 2.1. Sampling Site Descriptions and Soil Collection
Samplings of topsoils (0–10 cm) and Asystasia were done on 23 sites from 8 June 2011 to 17 January 2012, in Peninsular Malaysia (Figure 1; Table 1). Once the samples were collected, they were stored in polyethylene bags.
Figure 1. Sampling sites in Peninsular Malaysia (list of sampling sites as in Table 1). Figure 1. Sampling sites in Peninsular Malaysia (list of sampling sites as in Table 1).
Int. J. Environ. Res. Public Health 2021, 18, 4682 4 of 28
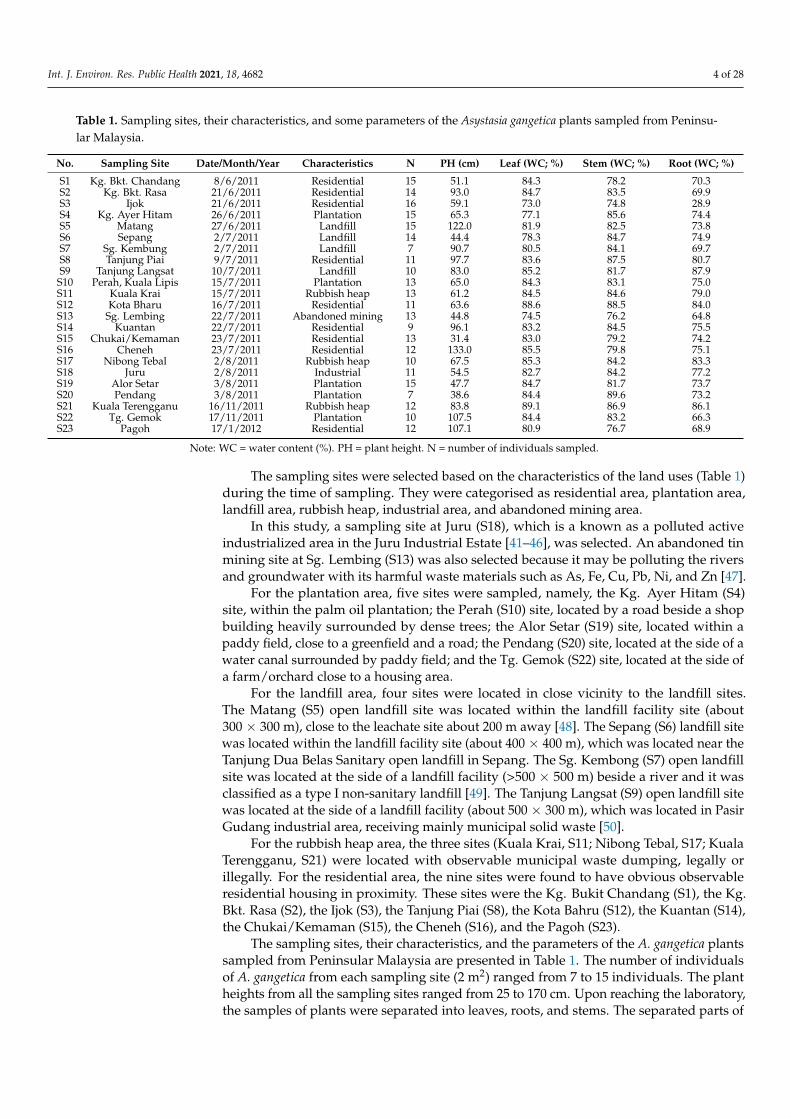
Table 1. Sampling sites, their characteristics, and some parameters of the Asystasia gangetica plants sampled from Peninsu-lar Malaysia.
No. Sampling Site Date/Month/Year Characteristics N PH (cm) Leaf (WC; %) Stem (WC; %) Root (WC; %)
S1 Kg. Bkt. Chandang 8/6/2011 Residential 15 51.1 84.3 78.2 70.3S2 Kg. Bkt. Rasa 21/6/2011 Residential 14 93.0 84.7 83.5 69.9S3 Ijok 21/6/2011 Residential 16 59.1 73.0 74.8 28.9S4 Kg. Ayer Hitam 26/6/2011 Plantation 15 65.3 77.1 85.6 74.4S5 Matang 27/6/2011 Landfill 15 122.0 81.9 82.5 73.8S6 Sepang 2/7/2011 Landfill 14 44.4 78.3 84.7 74.9S7 Sg. Kembung 2/7/2011 Landfill 7 90.7 80.5 84.1 69.7S8 Tanjung Piai 9/7/2011 Residential 11 97.7 83.6 87.5 80.7S9 Tanjung Langsat 10/7/2011 Landfill 10 83.0 85.2 81.7 87.9S10 Perah, Kuala Lipis 15/7/2011 Plantation 13 65.0 84.3 83.1 75.0S11 Kuala Krai 15/7/2011 Rubbish heap 13 61.2 84.5 84.6 79.0S12 Kota Bharu 16/7/2011 Residential 11 63.6 88.6 88.5 84.0S13 Sg. Lembing 22/7/2011 Abandoned mining 13 44.8 74.5 76.2 64.8S14 Kuantan 22/7/2011 Residential 9 96.1 83.2 84.5 75.5S15 Chukai/Kemaman 23/7/2011 Residential 13 31.4 83.0 79.2 74.2S16 Cheneh 23/7/2011 Residential 12 133.0 85.5 79.8 75.1S17 Nibong Tebal 2/8/2011 Rubbish heap 10 67.5 85.3 84.2 83.3S18 Juru 2/8/2011 Industrial 11 54.5 82.7 84.2 77.2S19 Alor Setar 3/8/2011 Plantation 15 47.7 84.7 81.7 73.7S20 Pendang 3/8/2011 Plantation 7 38.6 84.4 89.6 73.2S21 Kuala Terengganu 16/11/2011 Rubbish heap 12 83.8 89.1 86.9 86.1S22 Tg. Gemok 17/11/2011 Plantation 10 107.5 84.4 83.2 66.3S23 Pagoh 17/1/2012 Residential 12 107.1 80.9 76.7 68.9
Note: WC = water content (%). PH = plant height. N = number of individuals sampled.
The sampling sites were selected based on the characteristics of the land uses (Table 1)during the time of sampling. They were categorised as residential area, plantation area,landfill area, rubbish heap, industrial area, and abandoned mining area.
In this study, a sampling site at Juru (S18), which is a known as a polluted activeindustrialized area in the Juru Industrial Estate [41–46], was selected. An abandoned tinmining site at Sg. Lembing (S13) was also selected because it may be polluting the riversand groundwater with its harmful waste materials such as As, Fe, Cu, Pb, Ni, and Zn [47].
For the plantation area, five sites were sampled, namely, the Kg. Ayer Hitam (S4)site, within the palm oil plantation; the Perah (S10) site, located by a road beside a shopbuilding heavily surrounded by dense trees; the Alor Setar (S19) site, located within apaddy field, close to a greenfield and a road; the Pendang (S20) site, located at the side of awater canal surrounded by paddy field; and the Tg. Gemok (S22) site, located at the side ofa farm/orchard close to a housing area.
For the landfill area, four sites were located in close vicinity to the landfill sites.The Matang (S5) open landfill site was located within the landfill facility site (about300 × 300 m), close to the leachate site about 200 m away [48]. The Sepang (S6) landfill sitewas located within the landfill facility site (about 400 × 400 m), which was located near theTanjung Dua Belas Sanitary open landfill in Sepang. The Sg. Kembong (S7) open landfillsite was located at the side of a landfill facility (>500 × 500 m) beside a river and it wasclassified as a type I non-sanitary landfill [49]. The Tanjung Langsat (S9) open landfill sitewas located at the side of a landfill facility (about 500 × 300 m), which was located in PasirGudang industrial area, receiving mainly municipal solid waste [50].
For the rubbish heap area, the three sites (Kuala Krai, S11; Nibong Tebal, S17; KualaTerengganu, S21) were located with observable municipal waste dumping, legally orillegally. For the residential area, the nine sites were found to have obvious observableresidential housing in proximity. These sites were the Kg. Bukit Chandang (S1), the Kg.Bkt. Rasa (S2), the Ijok (S3), the Tanjung Piai (S8), the Kota Bahru (S12), the Kuantan (S14),the Chukai/Kemaman (S15), the Cheneh (S16), and the Pagoh (S23).
The sampling sites, their characteristics, and the parameters of the A. gangetica plantssampled from Peninsular Malaysia are presented in Table 1. The number of individualsof A. gangetica from each sampling site (2 m2) ranged from 7 to 15 individuals. The plantheights from all the sampling sites ranged from 25 to 170 cm. Upon reaching the laboratory,the samples of plants were separated into leaves, roots, and stems. The separated parts of

Int. J. Environ. Res. Public Health 2021, 18, 4682 5 of 28
the plants and topsoils were oven-dried at 80 ◦C for 72 h. The ranges of the water contentsin each part of the plant were 73.0–89.1% for leaves, 74.8–89.6% for stems, and 69.9–87.9%for roots.
2.2. Metal Analysis2.2.1. Direct Aqua-Regia Method
The direct aqua-regia method was used to digest the samples of plants and soils.The dried plant samples (leaves, stems, and roots) were digested with 10 mL of nitricacid (HNO3; AnalaR grade, BDH 69%) in a digestion tube. For topsoil, the samples weredigested with 10 mL of the solvent mixture of nitric acid (HNO3; AnalaR grade, BDH 69%)and perchloric acid (HClO3; AnalaR grade, BDH 60–70%) in the ratio 4:1. The digestiontook place in a digestion block at 40 ◦C in the first hour and subsequently at 140 ◦C for3 h [51]. Whatman No.1 filter paper was used to filter the solution. An acid-washedpolyethylene bottle was used to store the solution [51]. The solutions were analysed usinga flame atomic absorption spectrometry (FAAS, Perkin Elmer Model AAnalyst 800; PerkinElmer LLC., Shelton, CT, USA).
2.2.2. Sequential Extraction Technique for Metals
Badri and Aston’s [52] methods of the sequential extraction technique were adoptedin this study to achieve the first geochemical fractionations of metals (Cd, Cu, Fe, Ni, Pb,and Zn) from the collected topsoils samples. These were the ‘easily, freely, leachable, orexchangeable’ (EFLE) fractions. Metal fractions were extracted as follows: 10 g of samplewas agitated continuously at room temperature for 3 h with 50 mL of 1.0 M ammoniumacetate (NH4CH3COO, pH 7.0).
2.3. Quality Control for Metal Analysis
All quality control procedures were conducted, such as the use of acid-washed glass-ware and equipment and analysis of samples together with procedural blanks and standardsolution for each metal, in order to ensure the accuracy of the results. The accuracy of theprocedural method for the analysis of Cd, Cu, Fe, Ni, Pb, and Zn was checked with thecertified reference material (CRM) (Table 2). The comparisons of the percentage recoveriesfor the six metals between the certified values of CRM and the measured concentrationsare presented in Table 2.
Table 2. Comparisons of metals analysis recovery percentages with the certified reference materials (CRMs).
CRM Cd Cu Fe Ni Pb Zn
NSC DC73319 Soil China 110.7% 85.0% NA NA 99.8% 99.7%MESS-3 NRC NA 93.1% NA 102.0% 115.6% 82.8%
TH-1 sediment Canada 102.4% 92.9% 95.6% 112.3% 100.0% 110.2%SRM 1547 NA NA 105.6% NA NA 114.9%
IAEA soil-5 156.3% 91.3% NA 103.0% 115.7% 94.8%
Note: NA—data not available.
2.4. Data Interpretation2.4.1. Ecological Risk Index (ERI)
The ecological risk index (ERI) was used to determine the potential risk of a singlemetal in the habitat topsoil [53]. Firstly, the calculation of the contamination factor (Cf) wasbased on the pollution of a single metal factor as shown in Equation (1).
Cf =Cs
CB(1)
where Cs is the concentration of PTM in topsoil. CB is the background value of each PTM intopsoil. The background concentrations of the metals in the Earth’s upper continental crust

Int. J. Environ. Res. Public Health 2021, 18, 4682 6 of 28
(UCC) were taken from Wedepohl [54], which were Cd (0.10 mg/kg), Cu (25.0 mg/kg), Fe(43,000 mg/kg), Ni (56.0 mg/kg), Pb (15.0 mg/kg), and Zn (65.0 mg/kg). Secondly, ERIwas calculated based on Equation (2).
ERI = TR × Cf (2)
where TR is the toxic response factor of a single element. The TR values used in thepresent study were Cd = 30.0, Cu = 5.00, Ni = 5.00, Pb = 5.00, and Zn = 1.00, accordingto Hakanson [53]. Based on Hakanson [53], the five classifications for the ERI were “lowpotential ecological risk” (ERI < 40); “moderate potential ecological risk” (40 ≤ ERI < 80);“considerable potential ecological risk” (80 ≤ ERI < 160); “high potential ecological risk”(160 ≤ ERI < 320), and “very high ecological risk” (ERI ≥ 320).
2.4.2. Calculation of Translocation Factor and Bioconcentration Factor
The translocation factor (TF) and the bioconcentration factor (BCF) were utilisedto calculate the plant’s ability to uptake and withstand PTMs. These two indices arecommonly used to determine the suitability of plants as good phytoremediators [26,55].BCF is used to determine the plant’s ability to bioaccumulate PTMs from soils. It is definedas in Equation (3):
BCFroot =RootmetalSoilmetal
BCFstem =StemmetalSoilmetal
BCFleaf =LeafmetalSoilmetal
(3)
TF is used to determine the ability of the plant to translocate metals from the roots tothe shoots (stem or leaf). It is defined as in Equation (4):
TFstem =StemmetalRootmetal
TFleaf =LeafmetalRootmetal
(4)
The principle of phytoextraction is to remove PTMs from the soil by uptaking andtranslocating them from the roots of the plant to the leaves and stems (the easily harvestedcomponents of the plants).
2.5. Data Analysis
All graphical histograms were made by using the KaleidaGraph (Version 3.08, Sygn-ergy Software, Eden Prairie, MN, USA). In order to reduce the variance [56], Pearson’scorrelation analysis was based on log10 transformed data of the metals using STATISTICA(Version 10; StatSoft. Inc., Tulsa, OK, USA, 1984–2011). After the log10 transformation onthe data of Cd, Cu, Ni, Pb, and Zn, the plants and the topsoils showed that all the data werewithin the normality ranges for skewness (−2 to +2) [57–59] and kurtosis (−7 to +7) [57,58].
3. Results3.1. Potentially Toxic Metals in Asystasia gangetica
Figures 2–6 show the mean concentrations of Cd, Cu, Ni, Pb, and Zn in the roots,stems, and leaves of plants from all the sampling sites of this study. The overall statistics ofmetal concentrations in the roots, stems, and leaves are shown in Table 3.
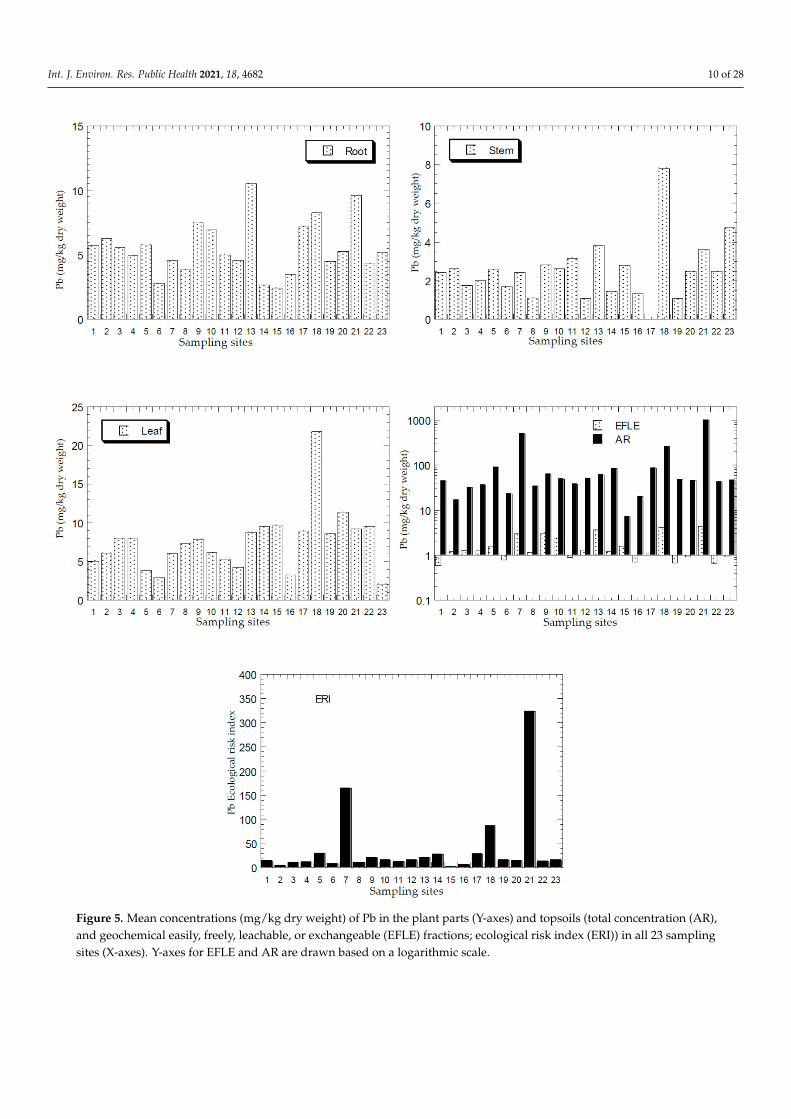
For the roots (Table 3), the metal concentrations (mg/kg dry weight) for Cd, Cu, Ni,Pb, and Zn ranged from 0.03 to 2.18, 9.22 to 139, 0.63 to 5.47, 2.43 to 10.5, and 50.7 to 300,respectively. For the root samples, S13 (Cd: 2.18) and S17 (Cd: 1.94) were found to havehigher Cd concentrations. Among all the sites, S13 had the highest Cu concentration (139) inroots, followed by S6 (58.4). As for Ni, S13 (5.47) and S19 (5.02) had higher concentrationsin roots. S9 (7.49), S10 (6.95), S13 (10.5), and S21 (9.62) were found to have higher Pbconcentrations. The highest Zn concentrations in roots were found in S13 (296) and S21(300), followed by S11 (210), S17 (160), and S18 (161). Generally, S13 had higher PTMconcentrations in the roots when compared with the other sites, while S21 showed elevatedlevels of Pb and Zn, and S18 of the level of Zn.

Int. J. Environ. Res. Public Health 2021, 18, 4682 7 of 28
Int. J. Environ. Res. Public Health 2021, 18, x FOR PEER REVIEW 7 of 29
the data were within the normality ranges for skewness (−2 to +2) [57–59] and kurtosis (−7 to +7) [57,58].
3. Results 3.1. Potentially Toxic Metals in Asystasia gangetica
Figures 2–6 show the mean concentrations of Cd, Cu, Ni, Pb, and Zn in the roots, stems, and leaves of plants from all the sampling sites of this study. The overall statistics of metal concentrations in the roots, stems, and leaves are shown in Table 3.
Figure 2. Mean concentrations (mg/kg dry weight) of Cd in the plant parts (Y-axes) and topsoils (total concentration (AR), and geochemical easily, freely, leachable, or exchangeable (EFLE) fractions; ecological risk index (ERI)) in all 23 sampling sites (X-axes). Y-axes for EFLE and AR are drawn based on a logarithmic scale.
Figure 2. Mean concentrations (mg/kg dry weight) of Cd in the plant parts (Y-axes) and topsoils (total concentration (AR),and geochemical easily, freely, leachable, or exchangeable (EFLE) fractions; ecological risk index (ERI)) in all 23 samplingsites (X-axes). Y-axes for EFLE and AR are drawn based on a logarithmic scale.

Int. J. Environ. Res. Public Health 2021, 18, 4682 8 of 28
Int. J. Environ. Res. Public Health 2021, 18, x FOR PEER REVIEW 8 of 29
Figure 3. Mean concentrations (mg/kg dry weight) of Cu in the plant parts (Y-axes) and topsoils (total concentration (AR), and geochemical easily, freely, leachable, or exchangeable (EFLE) fractions; ecological risk index (ERI)) in all 23 sampling sites (X-axes). Y-axes for EFLE and AR are drawn based on a logarithmic scale.
Figure 3. Mean concentrations (mg/kg dry weight) of Cu in the plant parts (Y-axes) and topsoils (total concentration (AR),and geochemical easily, freely, leachable, or exchangeable (EFLE) fractions; ecological risk index (ERI)) in all 23 samplingsites (X-axes). Y-axes for EFLE and AR are drawn based on a logarithmic scale.

Int. J. Environ. Res. Public Health 2021, 18, 4682 9 of 28
Int. J. Environ. Res. Public Health 2021, 18, x FOR PEER REVIEW 9 of 29
Figure 4. Mean concentrations (mg/kg dry weight) of Ni in the plant parts (Y-axes) and topsoils (total concentration (AR), and geochemical easily, freely, leachable, or exchangeable (EFLE) fractions; ecological risk index (ERI)) in all 23 sampling sites (X-axes). Y-axes for EFLE and AR are drawn based on a logarithmic scale.
Figure 4. Mean concentrations (mg/kg dry weight) of Ni in the plant parts (Y-axes) and topsoils (total concentration (AR),and geochemical easily, freely, leachable, or exchangeable (EFLE) fractions; ecological risk index (ERI)) in all 23 samplingsites (X-axes). Y-axes for EFLE and AR are drawn based on a logarithmic scale.
Int. J. Environ. Res. Public Health 2021, 18, 4682 10 of 28
Int. J. Environ. Res. Public Health 2021, 18, x FOR PEER REVIEW 10 of 29
Figure 5. Mean concentrations (mg/kg dry weight) of Pb in the plant parts (Y-axes) and topsoils (total concentration (AR), and geochemical easily, freely, leachable, or exchangeable (EFLE) fractions; ecological risk index (ERI)) in all 23 sampling sites (X-axes). Y-axes for EFLE and AR are drawn based on a logarithmic scale.
Figure 5. Mean concentrations (mg/kg dry weight) of Pb in the plant parts (Y-axes) and topsoils (total concentration (AR),and geochemical easily, freely, leachable, or exchangeable (EFLE) fractions; ecological risk index (ERI)) in all 23 samplingsites (X-axes). Y-axes for EFLE and AR are drawn based on a logarithmic scale.

Int. J. Environ. Res. Public Health 2021, 18, 4682 11 of 28Int. J. Environ. Res. Public Health 2021, 18, x FOR PEER REVIEW 11 of 29
Figure 6. Mean concentrations (mg/kg dry weight) of Zn in the plant parts (Y-axes) and topsoils (total concentration (AR), and geochemical easily, freely, leachable, or exchangeable (EFLE) fractions; ecological risk index (ERI)) in all 23 sampling sites (X-axes). Y-axes for EFLE and AR are drawn based on a logarithmic scale.
Table 3. Overall statistics of metal concentrations (mg/kg dry weight) in the plant parts, topsoils (total metal concentration (AR) and geochemical easily, freely, leachable, and exchangeable (EFLE) fractions, and ecological risk index (ERI)), and values and ratios of translocation factor (TF) and bioconcentration factor (BCF) from the present study. N = 23.
Plant Topsoils TF-1 TF-2 BCF-1root BCF-2root BCF-1leaf BCF-2leaf BCF-1stem BCF-2stem Metal Root Stem Leaf EFLE AR ERI Stem/Root Leaf/Root Root/AR Root/EFLE Leaf/AR Leaf/EFLE Stem/AR Stem/EFLE
Cd Min 0.03 0.03 0.03 0.01 0.23 71.2 0.03 0.01 0.01 0.06 0.00 0.06 0.02 0.15 Max 2.18 1.25 1.16 0.51 12.4 3729 27.8 35.4 2.00 258 2.66 48.8 2.89 105 Mean 0.40 0.55 0.29 0.16 1.94 583 9.91 5.30 0.35 16.4 0.34 4.67 0.68 12.4 SE 0.13 0.07 0.08 0.03 0.58 173 2.03 1.96 0.12 11.1 0.13 2.17 0.14 5.27
Cu Min 9.22 5.57 7.94 0.11 4.66 0.93 0.08 0.13 0.01 0.37 0.01 0.46 0.00 0.29 Max 139 11.8 20.2 40.1 2363 473 0.75 1.50 7.52 9254 2.61 148 1.52 72.0 Mean 27.0 7.71 12.9 3.41 242 43.3 0.40 0.70 1.49 504 0.90 50.0 0.53 29.2
Figure 6. Mean concentrations (mg/kg dry weight) of Zn in the plant parts (Y-axes) and topsoils (total concentration (AR),and geochemical easily, freely, leachable, or exchangeable (EFLE) fractions; ecological risk index (ERI)) in all 23 samplingsites (X-axes). Y-axes for EFLE and AR are drawn based on a logarithmic scale.

Int. J. Environ. Res. Public Health 2021, 18, 4682 12 of 28
Table 3. Overall statistics of metal concentrations (mg/kg dry weight) in the plant parts, topsoils (total metal concentration (AR) and geochemical easily, freely, leachable, and exchangeable(EFLE) fractions, and ecological risk index (ERI)), and values and ratios of translocation factor (TF) and bioconcentration factor (BCF) from the present study. N = 23.
Plant Topsoils TF-1 TF-2 BCF-1root BCF-2root BCF-1leaf BCF-2leaf BCF-1stem BCF-2stem
Metal Root Stem Leaf EFLE AR ERI Stem/Root Leaf/Root Root/AR Root/EFLE Leaf/AR Leaf/EFLE Stem/AR Stem/EFLE
Cd Min 0.03 0.03 0.03 0.01 0.23 71.2 0.03 0.01 0.01 0.06 0.00 0.06 0.02 0.15Max 2.18 1.25 1.16 0.51 12.4 3729 27.8 35.4 2.00 258 2.66 48.8 2.89 105
Mean 0.40 0.55 0.29 0.16 1.94 583 9.91 5.30 0.35 16.4 0.34 4.67 0.68 12.4SE 0.13 0.07 0.08 0.03 0.58 173 2.03 1.96 0.12 11.1 0.13 2.17 0.14 5.27
Cu Min 9.22 5.57 7.94 0.11 4.66 0.93 0.08 0.13 0.01 0.37 0.01 0.46 0.00 0.29Max 139 11.8 20.2 40.1 2363 473 0.75 1.50 7.52 9254 2.61 148 1.52 72.0
Mean 27.0 7.71 12.9 3.41 242 43.3 0.40 0.70 1.49 504 0.90 50.0 0.53 29.2SE 5.68 0.30 0.71 1.99 128 23.1 0.04 0.08 0.34 398 0.16 8.88 0.09 4.85
Ni Min 0.63 0.23 0.03 0.02 2.38 0.21 0.14 0.01 0.02 1.27 0.01 0.05 0.01 0.52Max 5.47 3.69 6.13 1.94 75.7 6.32 2.18 3.70 0.89 148 0.72 70.0 0.56 61.0
Mean 2.14 1.48 2.18 0.39 16.1 1.42 0.83 1.18 0.25 23.6 0.20 9.78 0.14 10.6SE 0.26 0.18 0.35 0.09 3.59 0.31 0.11 0.21 0.05 8.70 0.04 2.97 0.03 3.25
Pb Min 2.43 0.01 2.10 0.59 7.22 2.41 0.00 0.41 0.01 0.73 0.01 2.00 0.00 0.01Max 10.5 7.79 21.8 4.38 1004 323 1.14 4.02 0.37 86.1 1.35 14.6 0.38 5.10
Mean 5.52 2.52 7.55 1.68 117 38.4 0.48 1.50 0.12 8.43 0.19 5.80 0.06 1.87SE 0.43 0.32 0.83 0.24 45.8 14.8 0.05 0.19 0.02 3.60 0.06 0.75 0.02 0.26
Zn Min 50.7 26.9 18.7 0.05 11.0 0.17 0.47 0.25 0.02 0.00 0.01 0.74 0.01 0.76Max 300 246 160 130 3820 58.8 1.07 1.10 11.6 2931 3.33 481 7.99 674
Mean 121 86.5 61.7 15.3 514 7.88 0.73 0.54 1.98 390 0.89 89.3 1.44 135SE 14.6 11.1 7.93 6.40 217 3.34 0.04 0.04 0.54 175 0.20 28.7 0.41 43.6
Note: min = minimum; max = maximum; SE = standard error.

Int. J. Environ. Res. Public Health 2021, 18, 4682 13 of 28
For the stems (Table 3), the metal concentrations (mg/kg dry weight) for Cd, Cu, Ni,Pb, and Zn ranged from 0.03 to 1.25, 5.57 to 11.8, 0.23 to 3.69, 0.01 to 7.79, and 26.4 to246, respectively. For stems samples, S13 and S11 had higher Cd concentrations (1.25 and1.21, respectively). S13 was found to have the highest Cu concentration in stems (11.8).It was followed by S7 (10.0) and S18 (5.94). S11 and S21 were found to have higher Niconcentrations in stems (3.69 and 3.44, respectively). The highest concentration of Pb instems was found at S18 (7.79). As for Zn, S7 (246 µg/g) had the highest concentration,followed by S21 (189). Again, in general, S13 was higher in PTM concentrations in stemswhen compared with the other sites, while S18 was found to have elevated levels of Cuand Pb, and S21 of the levels of Ni and Zn.
For the leaves (Table 3), metal concentrations (mg/kg dry weight) for Cd, Cu, Ni, Pb,and Zn ranged from 0.03 to 1.16, 7.94 to 20.2, 0.03 to 6.13, 2.10 to 21.8, and 18.8 to 160,respectively. For leaves samples, several sites were found to have the highest concentrationsof PTMs. S18 showed the highest levels of Cu, Pb, and Zn in the leaves. Meanwhile, S2,S13, and S21 were found to have elevated levels of Cu. For Ni concentrations, S19 wasfound to have the highest Ni concentration (6.13), followed by S5 (4.95). The highest Pbconcentrations were found at S18 (160), followed by S21 (145) and S10 (114). In general,S18 had the highest concentrations of Cu, Pb, and Zn in leaves, while S13 (an abandonedmining site), S18, and S21 were found to have elevated levels of Pb, and S21 of the levelof Cu.
3.2. Potentially Toxic Metals in Habitat Topsoils3.2.1. Total Metal Concentrations and EFLE
The mean concentrations of Cd, Cu, Ni, Pb, and Zn in the topsoil total concentrations(AR) and the EFLE from all the sampling sites are presented in Figures 2–6. The overallstatistics of the values of topsoil AR and EFLE from the present study are also presented inTable 3. For the topsoil AR, the metal concentrations (mg/kg dry weight) for Cd, Cu, Ni,Pb, and Zn ranged from 0.23 to 12.4, 4.66 to 2363, 2.38 to 75.7, 7.22 to 1004, and 11.0 to 3820,respectively. For the topsoil EFLE, metal concentrations (mg/kg dry weight) for Cd, Cu,Ni, Pb, and Zn ranged from 0.01 to 0.51, 0.11 to 40.1, 0.02 to 1.94, 0.59 to 4.38, and 0.05 to130, respectively.
Based on Cd AR (Figure 2), four sites (S7, S13, S18, and S21) were found to besignificantly higher than the other sites, while the Cd EFLE values of all the sampling siteswere below 1.00. Based on Cu AR (Figure 3), four sites (S1, S7, S13, and S21) were found tobe significantly higher (>100 mg/kg dry weight) than the other sites, while the Cu EFLE offour sites (S7, S13, and S21) were above 5.0.
Based on Ni AR (Figure 4), two sites (S7, and S21) were found to be significantlyhigher (>60 mg/kg dry weight) than the other sites, while the Ni EFLE of two sites (S7, andS21) were above 1.0. Based on Pb AR (Figure 5), three sites (S7, S18, and S21) were found tobe significantly higher (>200 mg/kg dry weight) than the other sites, while the Pb EFLEof three sites (S13, S18, and S21) were above 3.0. Based on Zn AR (Figure 6), three sites(S7, S18, and S21) were found to be significantly higher (>1000 mg/kg dry weight) thanthe other sites, while the Zn EFLE of three sites (S7, S18, and S21) were above 40.0. Lumet al. [60] conducted a study in Cameroon in 2011 and reported the PTMs in soils as Cu:70–179, Pb: 8–130, Zn: 200–971, and Ni: 74–296 mg/kg dry weight.
3.2.2. Ecological Risk Index (ERI)
The mean ERI of Cd, Cu, Ni, Pb, and Zn in the topsoils ERI from all sampling sitesis presented in Figures 2–6. The overall statistics of the ERI values are also presented inTable 3. The ERI values for Cd, Cu, Ni, Pb, and Zn ranged from 71.2 to 3729, 0.93 to 473,0.21 to 6.31, 2.41 to 323, and 0.17 to 58.8, respectively.
Three sites (S7, S18, and S21) had significantly higher ERI values for Cd when com-pared with the other sites (Figure 2). Fourteen sites (S1, S5, S7, S8, S9, S10, S12, S13, S14,S17, S18, S19, S20, and S21) were all categorised as “very high ecological risk” (ERI ≥ 320).

Int. J. Environ. Res. Public Health 2021, 18, 4682 14 of 28
Therefore, Cd in the topsoil had a high contribution to the increment of the total ERI valuesof all metals. Based on Cu ERI (Figure 3), three sites (S7, S13, and S21) were shown tohave significantly higher ERI values when compared with the other sites. S7 and S13 werecategorised as “high potential ecological risk” (160 ≤ ERI < 320), while S21 as “very highecological risk” (ERI ≥ 320). Based on Ni ERI (Figure 4), two sites (S7 and S21) were shownto have significantly higher ERI values when compared with the other sites. However, allsites were categorised as “low potential ecological risk” (ERI < 40).
Based on Pb ERI (Figure 5), three sites (S7, S18, and S21) were shown to have sig-nificantly higher ERI values when compared with the other sites. Sites S7 and S21 werecategorised as “high potential ecological risk” (160 ≤ ERI < 320), while S18 as “considerablepotential ecological risk” (80 ≤ ERI < 160). Based on Zn ERI (Figure 6), three sites (S7, S18,and S21) were shown to have significantly higher ERI values when compared with theother sites. However, only S7 and S21 were categorised as “moderate potential ecologicalrisk” (80 ≤ ERI < 160).
S7 consistently showed elevated values of ERI for Cd, Cu, Ni, Pb, and Zn. Hence, S7was found to be more polluted and had higher ecological risk. The abandoned mininglocation, S13, was reported to have high ERI for Cd and Cu, because of its waste materials.With elevated levels of PTMs, this area was identified as the source of pollution to riversand groundwater [47].
S18 at Juru was found to have high ERI for Cd, Pb, and Zn. Juru is known as a pollutedactive industrial area in the Juru Industrial Estate [41–43].
S21, a rubbish heap site, was found to have high ERI for Cd, Cu, Ni, Pb, and Zn. Thiscould be related to municipal wastes including electronic waste from the nearby locations.
3.3. Correlations of Potentially Toxic Metals between Topsoil and Plants Parts (Leaves, Stems,and Roots)
The correlation coefficients of Cd, Cu, Ni, Pb, and Zn concentrations between theplant parts (root, stem, and leaf) and the topsoils (AR and EFLE) are presented in Table 4.
Table 4. Correlation coefficients of metals between the plant parts (root, stem, and leaf) and theirhabitat topsoils (EFLE and total metal concentration (AR)). N = 23.
EFLE AR
Cd Root 0.25 ns 0.17 ns
Stem 0.09 ns 0.03 ns
Leaf 0.04 ns 0.03 ns
Cu Root 0.48 * 0.41 ns
Stem 0.54 * 0.48 *Leaf 0.30 ns 0.26 ns
Ni Root 0.03 ns 0.02 ns
Stem 0.33 ns 0.48 *Leaf 0.40 ns 0.36 ns
Pb Root 0.58 * 0.53 *Stem 0.29 ns 0.05 ns
Leaf 0.42 * 0.28 ns
Zn Root 0.63 * 0.50 *Stem 0.56 * 0.44 *Leaf 0.69 * 0.60 *
Note: The correlation analysis was based on log10 transformed data of the metals. * = significant at p < 0.05;ns = not significant (p > 0.05).
For Cd, there were no correlations (or weak and insignificant correlations) foundbetween the three plant parts and the topsoil EFLE (0.04–0.25; p < 0.05) and the topsoilAR (0.03–0.17; p > 0.05). For Cu, obvious higher positive and significant correlations werefound for topsoil EFLE and roots (R = 0.48; p < 0.05), stems (R = 0.54; p < 0.05), and leaves

Int. J. Environ. Res. Public Health 2021, 18, 4682 15 of 28
(R = 0.30; p > 0.05) when compared with those of topsoil AR for roots (R = 0.41; p > 0.05),stems (R = 0.48; p > 0.05), and leaves (R = 0.26; p > 0.05).
For Ni, relatively weak R values and insignificant correlations were found betweenplant parts and topsoil EFLE and AR (R = 0.02–0.40; p > 0.05), except for stem and topsoilAR (R = 0.48; p < 0.05). For Pb, obvious higher positive and significant correlations werefound between root and topsoil AR and EFLE (R = 0.53–0.58; p < 0.05), compared with leafand topsoil EFLE (R = 0.42; p > 0.05). For Zn, obvious higher positive significant correlationswere found between all the plant parts and topsoils (EFLE and AR (R = 0.44–0.69; p < 0.05).
3.4. Bioconcentration Factors and Translocation Factors of Potentially Toxic Metals inAsystasia gangetica
The values of BCF and TF of all PTMs from all the sampling sites from PeninsularMalaysia are presented in Figures 7–11. The overall statistics of the values of TF and BCFare also given in Table 3.
Int. J. Environ. Res. Public Health 2021, 18, x FOR PEER REVIEW 15 of 29
Figure 7. Bioaccumulation factors (BCFs) and translocation factors (TFs) (y-axis) of Cd in all sampling sites (x-axis). Note: BCF (Root) = BCF-1root; BCF (Root EFLE) = BCF-2root; BCF (Leaf) = BCF-1leaf; BCF (Leaf EFLE) = BCF-2leaf; BCF (Stem) = BCF-1stem; BCF (Stem EFLE) = BCF-2stem; TF (Stem/Root) = TF-1; TF (Leaf/Root) = TF-2.
Figure 7. Bioaccumulation factors (BCFs) and translocation factors (TFs) (y-axis) of Cd in all sampling sites (x-axis).Note: BCF (Root) = BCF-1root; BCF (Root EFLE) = BCF-2root; BCF (Leaf) = BCF-1leaf; BCF (Leaf EFLE) = BCF-2leaf;BCF (Stem) = BCF-1stem; BCF (Stem EFLE) = BCF-2stem; TF (Stem/Root) = TF-1; TF (Leaf/Root) = TF-2.
The values of BCF-1root for Cd, Cu, Ni, Pb, and Zn ranged from 0.01 to 2.00, 0.01 to7.52, 0.02 to 0.89, 0.01 to 0.37, and 0.02 to 11.6, respectively. The values of BCF-2root for Cd,Cu, Ni, Pb, and Zn ranged from 0.06 to 258, 0.37 to 9254, 1.27 to 148, 0.73 to 86.1, and 0.00to 2931, respectively. The values of BCF-1leaf for Cd, Cu, Ni, Pb, and Zn ranged from 0.00to 2.66, 0.01 to 2.61, 0.01 to 0.72, 0.01 to 1.35, and 0.01 to 3.33, respectively. The values ofBCF-2leaf for Cd, Cu, Ni, Pb, and Zn ranged from 0.06 to 48.8, 0.46 to 148, 0.05 to 70.0, 2.00to 14.6, and 0.74 to 481, respectively. The values of BCF-1stem for Cd, Cu, Ni, Pb, and Zn

Int. J. Environ. Res. Public Health 2021, 18, 4682 16 of 28
ranged from 0.02 to 2.89, 0.00 to 1.52, 0.01 to 0.56, 0.00 to 0.38, and 0.01 to 7.99, respectively.The values of BCF-2stem for Cd, Cu, Ni, Pb, and Zn ranged from 0.15 to 105, 0.29 to 72.0,0.52 to 61.0, 0.01 to 5.10, and 0.76 to 674, respectively. The values of TF-1stem for Cd, Cu, Ni,Pb, and Zn ranged from 0.03 to 27.8, 0.08 to 0.75, 0.14 to 2.18, 0.00 to 1.14, and 0.47 to 1.07,respectively. The values of TF-2leaf for Cd, Cu, Ni, Pb, and Zn ranged from 0.01 to 35.4, 0.13to 1.50, 0.01 to 3.70, 0.41 to 4.02, and 0.25 to 1.10, respectively.
Based on the values of Cd BCF in the roots (Figure 7), there were only two sites (S17and S23) with BCF-1root > 1.0, while 10 sites were found with BCF-2root > 1.0. Based onthe values of Cd BCF in the leaves (Figure 7), there were only two sites (S6 and S23) withBCF-1leaf > 1.0, while 10 sites were found with BCF-2leaf > 1.0. Based on values of CdBCF in the stems (Figure 7), there were only six sites (S1, S11, S15, S16, S22, and S23) withBCF-1stem > 1.0, while 18 sites were found with BCF-2stem > 1.0. This showed that the Cdin the topsoil EFLE fraction could be more easily transferred to the roots, leaves, and stemswhen compared with those in the topsoil total concentrations of Cd. Based on the values ofCd TF (Figure 7), 17 sites (74%) with TF-1stem > 1.0 were found, while 9 sites (39%) werefound with TF-2leaf > 1.0. This showed that Cd transfer to the stems from the roots wasvery efficient in most sampling sites, while Cd transfer to the leaves from the roots was lessefficient. Values of BCF > 1.0 and TF > 1.0 make A. gangetica a potential phytoextractionagent for Cd [26].
Int. J. Environ. Res. Public Health 2021, 18, x FOR PEER REVIEW 16 of 29
Figure 8. Bioaccumulation factors (BCFs) and translocation factors (TFs) (Y-axes) of Cu in all sampling sites (X-axes). Note: All Y-axes are drawn based on logarithmic scale. BCF (Root) = BCF-1root; BCF (Root EFLE) = BCF-2root; BCF (Leaf) = BCF-1leaf; BCF (Leaf EFLE) = BCF-2leaf; BCF (Stem) = BCF-1stem; BCF (Stem EFLE) = BCF-2stem; TF (Stem/Root) = TF-1; TF (Leaf/Root) = TF-2.
Figure 8. Bioaccumulation factors (BCFs) and translocation factors (TFs) (Y-axes) of Cu in all sampling sites (X-axes). Note: All Y-axes are drawn based on logarithmic scale. BCF (Root) = BCF-1root; BCF (Root EFLE) = BCF-2root;BCF (Leaf) = BCF-1leaf; BCF (Leaf EFLE) = BCF-2leaf; BCF (Stem) = BCF-1stem; BCF (Stem EFLE) = BCF-2stem;TF (Stem/Root) = TF-1; TF (Leaf/Root) = TF-2.

Int. J. Environ. Res. Public Health 2021, 18, 4682 17 of 28
Based on values of Cu BCF in the roots (Figure 8), there were 11 sites with BCF-1root > 1.0,while 21 sites appeared to have BCF-2root > 1.0. Based on the values of Cu BCF in theleaves (Figure 8), there were 10 sites with BCF-1leaf > 1.0, while 21 sites were found withBCF-2leaf > 1.0. Based on values of Cu BCF in the stems (Figure 8), there were only 3 sites(S2, S3, and S4) with BCF-1stem > 1.0, while 21 sites were found with BCF-2stem > 1.0. Thisshowed that the Cu in the topsoil EFLE fraction could be more easily transferred to theroots, leaves, and stems when compared with those in the topsoil total concentrations ofCu. Based on the values of Cu TF (Figure 8), all 23 sites (100%) had TF-1stem < 1.0, whilethere were 19 sites (83%) were found with TF-2leaf < 1.0. This showed that the transfer ofCu from the roots to the leaves was less efficient and limited, while there was no apparentCu transfer to the stems from the roots. With most of the values of BCF >1.0 and TF < 1.0,A. gangetica has the potential to be used in phytostabilisation of Cu [26].
Int. J. Environ. Res. Public Health 2021, 18, x FOR PEER REVIEW 17 of 29
Figure 9. Bioaccumulation factors (BCFs) and translocation factors (TFs) (Y-axes) of Ni in all sampling sites (X-axes). Note: All Y-axes are drawn based on logarithmic scale. BCF (Root) = BCF-1root; BCF (Root EFLE) = BCF-2root; BCF (Leaf) = BCF-1leaf; BCF (Leaf EFLE) = BCF-2leaf; BCF (Stem) = BCF-1stem; BCF (Stem EFLE) = BCF-2stem; TF (Stem/Root) = TF-1; TF (Leaf/Root) = TF-2.
Figure 9. Bioaccumulation factors (BCFs) and translocation factors (TFs) (Y-axes) of Ni in all sampling sites (X-axes). Note: All Y-axes are drawn based on logarithmic scale. BCF (Root) = BCF-1root; BCF (Root EFLE) = BCF-2root;BCF (Leaf) = BCF-1leaf; BCF (Leaf EFLE) = BCF-2leaf; BCF (Stem) = BCF-1stem; BCF (Stem EFLE) = BCF-2stem;TF (Stem/Root) = TF-1; TF (Leaf/Root) = TF-2.
Based on values of Ni BCF in the roots (Figure 9), all 23 sites had BCF-1root < 1.0, whileall 23 sites had BCF-2root > 1.0. Based on the values of Ni BCF in the leaves (Figure 9), all23 sites had BCF-1leaf < 1.0, while 20 sites had BCF-2leaf > 1.0. Based on the values of Ni BCFin the stems (Figure 9), all 23 sites had BCF-1stem < 1.0, while 21 sites had BCF-2stem > 1.0.This showed that the Ni in the topsoil EFLE fraction could be more easily transferred tothe roots, leaves, and stems when compared with those in the topsoil total concentrations

Int. J. Environ. Res. Public Health 2021, 18, 4682 18 of 28
of Ni. Based on values of Ni TF (Figure 9), there were 7 sites (30%) with TF-1stem > 1.0,while there were 12 sites (52%) found with TF-2leaf > 1.0. This showed that the transfer ofNi from the roots to the leaves was more efficient than those to the stems. With the valuesof BCF > 1.0 and TF > 1.0, A. gangetica has the potential to be used in phytoextraction ofNi [26].
Int. J. Environ. Res. Public Health 2021, 18, x FOR PEER REVIEW 18 of 29
Figure 10. Bioaccumulation factors (BCFs) and translocation factors (TFs) (Y-axes) of Pb in all sampling sites (X-axes). Note: All Y-axes are drawn based on logarithmic scale. N = 23. BCF (Root) = BCF-1root; BCF (Root EFLE) = BCF-2root; BCF (Leaf) = BCF-1leaf; BCF (Leaf EFLE) = BCF-2leaf; BCF (Stem) = BCF-1stem; BCF (Stem EFLE) = BCF-2stem.
Figure 10. Bioaccumulation factors (BCFs) and translocation factors (TFs) (Y-axes) of Pb in all sampling sites (X-axes).Note: All Y-axes are drawn based on logarithmic scale. N = 23. BCF (Root) = BCF-1root; BCF (Root EFLE) = BCF-2root;BCF (Leaf) = BCF-1leaf; BCF (Leaf EFLE) = BCF-2leaf; BCF (Stem) = BCF-1stem; BCF (Stem EFLE) = BCF-2stem.
Based on values of Pb BCF in the roots (Figure 10), all 23 sites were found with BCF-1root < 1.0, while 21 sites were found with BCF-2root > 1.0. Based on values of Pb BCF inthe leaves (Figure 10), there was only 1 site (S15) with BCF-1leaf > 1.0, while all 23 siteswere found with BCF-2leaf > 1.0. Based on values of Pb BCF in the stems (Figure 10), all23 sites had BCF-1stem < 1.0, while 17 sites were found with BCF-2stem > 1.0. This showedthat the Pb in the topsoil EFLE fraction could be more easily transferred to the roots, leaves,and stems when compared with those in the topsoil total concentrations of Pb. Based onvalues of Pb TF (Figure 10), 22 sites (96%) were found with TF-1stem < 1.0, while 9 sites(39%) were found with TF-2leaf < 1.0. This showed that Pb transfer to the leaves from theroots was efficient in most sampling sites, while Pb transfer to the stems from the roots wasless efficient. With most sites with the values of BCF > 1.0 and TF < 1.0, A. gangetica has thepotential to be used in the phytostabilisation of Pb [26].
Based on the values of Zn BCF in the roots (Figure 11), there were 14 sites withBCF-1root > 1.0, while 21 sites were found with BCF-2root > 1.0. Based on the values of Zn

Int. J. Environ. Res. Public Health 2021, 18, 4682 19 of 28
BCF in the leaves (Figure 11), there were 7 sites with BCF-1leaf > 1.0, while 22 sites hadBCF-2leaf > 1.0. Based on values of Zn BCF in the stems (Figure 11), there were 12 siteswith BCF-1stem > 1.0, while 22 sites were found with BCF-2stem > 1.0. This showed that theZn in the topsoil EFLE fraction could be more easily transferred to the roots, leaves, andstems when compared with those in the topsoil total concentrations of Zn. Based on thevalues of Zn TF (Figure 11), 22 sites (96%) were found with TF-1stem < 1.0 and TF-2leaf < 1.0.This showed that Zn transfer to the leaves and stems from the roots was less efficientand limited in almost all sampling sites. With most sites with the values of BCF >1.0 andTF < 1.0, A. gangetica has the potential to be used in phytostabilisation of Zn [26]. Subhaand Srinivas [61] reported BCF: Cd (2.68), Cu (1.48), Ni (6.80), Pb (1.02), and Zn (1.27) inthe common marsh buckwheat Polygonum glabrum collected from The Hussain Sagar Lake,Hyderabad, Telangana, India.
Int. J. Environ. Res. Public Health 2021, 18, x FOR PEER REVIEW 19 of 29
Figure 11. Bioaccumulation factors (BCFs) and translocation factors (TFs) (Y-axes) of Zn in all sampling sites (X-axes). Note: All Y-axes are drawn based on logarithmic scale. BCF (Root) = BCF-1root; BCF (Root EFLE) = BCF-2root; BCF (Leaf) = BCF-1leaf; BCF (Leaf EFLE) = BCF-2leaf; BCF (Stem) = BCF-1stem; BCF (Stem EFLE) = BCF-2stem.
The values of BCF-1root for Cd, Cu, Ni, Pb, and Zn ranged from 0.01 to 2.00, 0.01 to 7.52, 0.02 to 0.89, 0.01 to 0.37, and 0.02 to 11.6, respectively. The values of BCF-2root for Cd, Cu, Ni, Pb, and Zn ranged from 0.06 to 258, 0.37 to 9254, 1.27 to 148, 0.73 to 86.1, and 0.00 to 2931, respectively. The values of BCF-1leaf for Cd, Cu, Ni, Pb, and Zn ranged from 0.00 to 2.66, 0.01 to 2.61, 0.01 to 0.72, 0.01 to 1.35, and 0.01 to 3.33, respectively. The values of BCF-2leaf for Cd, Cu, Ni, Pb, and Zn ranged from 0.06 to 48.8, 0.46 to 148, 0.05 to 70.0, 2.00 to 14.6, and 0.74 to 481, respectively. The values of BCF-1stem for Cd, Cu, Ni, Pb, and Zn ranged from 0.02 to 2.89, 0.00 to 1.52, 0.01 to 0.56, 0.00 to 0.38, and 0.01 to 7.99, respectively. The values of BCF-2stem for Cd, Cu, Ni, Pb, and Zn ranged from 0.15 to 105, 0.29 to 72.0, 0.52 to 61.0, 0.01 to 5.10, and 0.76 to 674, respectively. The values of TF-1stem for Cd, Cu, Ni, Pb, and Zn ranged from 0.03 to 27.8, 0.08 to 0.75, 0.14 to 2.18, 0.00 to 1.14, and 0.47 to 1.07, respectively. The values of TF-2leaf for Cd, Cu, Ni, Pb, and Zn ranged from 0.01 to 35.4, 0.13 to 1.50, 0.01 to 3.70, 0.41 to 4.02, and 0.25 to 1.10, respectively.
Based on the values of Cd BCF in the roots (Figure 7), there were only two sites (S17 and S23) with BCF-1root > 1.0, while 10 sites were found with BCF-2root > 1.0. Based on the values of Cd BCF in the leaves (Figure 7), there were only two sites (S6 and S23) with BCF-1leaf > 1.0, while 10 sites were found with BCF-2leaf > 1.0. Based on values of Cd BCF in the stems (Figure 7), there were only six sites (S1, S11, S15, S16, S22, and S23) with BCF-1stem > 1.0, while 18 sites were found with BCF-2stem > 1.0. This showed that the Cd in the topsoil EFLE fraction could be more easily transferred to the roots, leaves, and stems when com-pared with those in the topsoil total concentrations of Cd. Based on the values of Cd TF (Figure 7), 17 sites (74%) with TF-1stem > 1.0 were found, while 9 sites (39%) were found with TF-2leaf > 1.0. This showed that Cd transfer to the stems from the roots was very effi-
Figure 11. Bioaccumulation factors (BCFs) and translocation factors (TFs) (Y-axes) of Zn in all sampling sites (X-axes). Note: All Y-axes are drawn based on logarithmic scale. BCF (Root) = BCF-1root; BCF (Root EFLE) = BCF-2root;BCF (Leaf) = BCF-1leaf; BCF (Leaf EFLE) = BCF-2leaf; BCF (Stem) = BCF-1stem; BCF (Stem EFLE) = BCF-2stem.
4. Discussion4.1. Biomonitoring of Potentially Toxic Metals
In this study, the potential of Asystasia being a biomonitor of PTMs was mainly basedon (1) accumulation of PTMs and (2) the correlations of PTMs between the topsoil and theplants parts.

Int. J. Environ. Res. Public Health 2021, 18, 4682 20 of 28
Based on Baker and Brooks [62], A. gangetica was found to be not a hyperaccumulatorweed plant of PTMs because all three parts of the plants (leaves, stems, and roots) from allthe sites did not accumulate high concentrations (mg/kg) of Cd, Cu, Ni, and Pb from thehabitat topsoils. Baker and Brooks [62] stated that hyperaccumulator plants are those thatcan accumulate high concentration of metals from the soils (>1000 mg/kg of Cu, Ni, or Pb;>10,000 mg/kg of Zn; 100 mg/kg of Cd).
Correlation analysis revealed that the roots and stems could be used as biomonitors ofCu, while stems as biomonitors of Ni, roots and leaves as biomonitors of Pb, and all threeplant parts as biomonitors of Zn. The higher correlations (R values) between plant andtopsoil EFLE than between plant and topsoil total metal concentrations could be becauseof the metals in the EFLE fraction being more easily assimilated and accumulated in theplant parts [63].
These positive and significant correlations indicated the plant parts of Asystasia wereable to reflect the metal concentrations (especially of the EFLE fraction) in the habitattopsoils. The positive relationships of metals between the topsoil EFLE fractions and plantroots indicated a close relationship between soil metal concentration and root metabolism,which should be further examined to understand how soil metal concentrations couldaffect the root metal accumulation efficiency. According to Gallagher et al. [64], when thesoil metal concentration exceeded the plant tolerance limit, growth and metabolism wouldbe inhibited and, eventually, the plant species would be excluded from the site vegetationassemblage even though there were still seeds present in the regional pool. Therefore, theroots, leaves, and stems of Aystasia are good biomonitors of Cu, Ni, Pb, and Zn pollution intheir habitat environmental soils.
The main uptakes of pollutants from the surroundings into the plants are from de-position on leaves and absorptions from root cells [34,36,65] This could be the reason theroots were found to be reflective of Cu, Pb, and Zn in the habitat topsoils. Metals bound inthe soils must be mobilised before they can be absorbed by the root cells of the plants [66].Mobilised metals penetrate the roots either through apoplastic or symplastic pathways [66].Metals are capable of being transported to the entire plant via the xylem or phloem [67].
4.2. Asystasia as Phytoextractor of Cd and Ni
The use of other plants and weeds (both invasive and non-invasive) as phytoextractorof Cd and Ni as reported in the literature (Table 5) supported the present finding usingA. gangetica. For example, Wei et al. [68] recommended the potential use of the invasiveplant species, Chromolaena odorata, Bidens pilosa, and Praxelis clematidea, as candidates forsoil Cd phytoextraction based on their abilities to accumulate metals and their advantagesin growth and tolerance traits. Favas et al. [69] studied the correlation between Ni concen-tration in the soil and its concentration in the non-invasive plant (Alyssum serpyllifolium) inthe ultramafic areas of Portugal. Yu et al. [70] reported that the non-invasive Celosia argenteacould potentially decontaminate Cd-contaminated soils by acting as a phytoextractor. Theyrevealed positive results on Cd phytoextraction in Cd-contaminated soils using C. argentea.
Table 5. Plants under the medium of soils (except where indicated) employed for phytoremediation technologies throughthe process of phytoextraction, especially of Cd and Ni.
No. Plants Type Contaminant (s) Country References
1 Chromolaena odorata Invasive Crude oil and Cd, Ni, Zn South Africa [71]2 Ipomoea carnea Invasive Cd, Pb, Cu, Cr, Mn, and Ni India [72] *3 Amaranthus spinosus Invasive Cu, Zn, Cr, Pb, and Cd India [73]
4 Arundo donax Invasive
Improved pH, EC, OC,microbial counts, and soil
enzyme activities and uptakeCd, Pb, Co, Ni, and Fe
Hungary [74] **
5 Typha latifolia Invasive Zn, Mn, Cu, Pb, Cd, Cr, and Ni India [75]

Int. J. Environ. Res. Public Health 2021, 18, 4682 21 of 28
Table 5. Cont.
No. Plants Type Contaminant (s) Country References
6 Typha latifolia Invasive Al, As, Cd, Cr, Cu, Hg, Mn, Ni,Pb, and Zn Italy [76]
7 Alternanthera philoxeroides Invasive Cd China [77]
8 Ambrosia artemisiifolia Invasive As, Cd, Cr, Cu, Mn, Ni, Pb, V,and Zn China [78]
9Ageratum conyzoides, Bidens
pilosa, Senecio scandens, Imperatacylindrical, Buddleja davidii
Invasive Cd, Pb, and Zn China [79]
10 Chromolaena odorata, Bidenspilosa, and Praxelis clematidea Invasive Cd China [68]
11 Alyssum serpyllifolium sp.Lusitanicum Non-invasive Ni Portugal [69]
12 Celosia argentea Non-invasive Cd Field experiment [70]
13 Saccharum spontaneum andSaccharum munja Non-invasive Zn, Pb, Cu, Ni, Cd, and As Pot experiments [80] ***
14 Euphorbia helioscopia andUrtica dioica Non-invasive As, Cd, Pb, Cu, and Zn Bor (Serbia) [40]
15Helianthus annuus, Brassica
napus, and Chyrsopogonzizanioides
Non-invasive Cd Greenhouse potexperiments [81]
16 Helianthus annuus Non-invasive Cd Experimental [82]
Note: * medium was fly ash deposits; ** = medium was Bauxite-derived red mud; *** = included phytoextraction and phytostabilisation.
In this study, the results showed that the phytoextraction process helped to concentrateCd and Ni in the roots and stems. Phytoextraction, the absorption and accumulation ofPTMs in the plant shoots, and their removal from the treatment site through harvesting theplant parts is one of the many strategies for the phytoremediation of the soil [26,83]. Thismethod requires the uptake of pollutants from the plant roots and the translocation of themetals to the other parts (stems and leaves) of the weeds [15,84]. This is followed by thebiomass harvest of theses plant parts for safe disposal of the accumulated metals.
However, it should be noted that many abiotic factors could influence the efficiency ofthe phytoextraction processes, such as physico-chemical properties of soil, metal bioavail-ability to the weeds, metal speciation, climatic conditions, and the weed’s characteris-tics [14,85–87].
In theory, the weeds that act as phytoextractors could accumulate massive amounts ofpollutants [85]. However, the suitability of a plant as a phytoextractor species for PTMs isbased on the metal accumulation in the shoot (stems and leaves) and the shoot biomass.Being a non-hyperaccumulator, the phytoextraction approach that fits A. gangetica wellis the relatively higher above ground biomass production owing to its fast growth ratedespite its lower metal accumulation. This had also been reported in plants such as Brassicajuncea [15,88].
Ali et al. [89] stated that the phytoextraction ability of the multi-cut plant species(Trifolium spp.) surpassed those of mono-harvest plant species. Weeds are more favourableas compared with shrubs and trees because weeds have literal shorter life cycles, a highergrowth rate, higher resistance towards abiotic stresses, and are able to produce morebiomass [90]. Hence, in the case of A. gangetica, being a non-hyperaccumulator weed ofPTMs, the phytoextraction requires several harvesting periods in order to remove PTMs toacceptable levels so as to reduce the potential risk for food chain contamination.
4.3. Asystasia as Phytostabiliser of Cu, Pb, and Zn
The use of other plants and weeds (both invasive and non-invasive) as phytostabiliserof Cu, Pb, and Zn as reported in the literature (Table 6) supported the present finding usingA. gangetica. For example, Drozdova et al. [91] studied the potential of phytoextraction andphytostabilisation of non-invasive Brassica campestris for the concentrations of Cd, Cu, Ni,

Int. J. Environ. Res. Public Health 2021, 18, 4682 22 of 28
Pb, and Zn in the plant organs (leaves, roots, stems, and inflorescences), and the BCF andTF. Mataruga et al. [92] reported that the BCF and TF factors indicated that the non-invasiveelm (Ulmus glabra) was suitable for the phytostabilisation of As, Cu, Cr, Ni, and Pb.
Table 6. Plants under the medium of soils employed for phytoremediation technologies with the process of phytostabilisa-tion, especially of Cu, Pb, and Zn.
No. Non-Invasive Plant (s) Type Metals Country References
1 Phyla nodiflora Non-invasive Cu and Zn Field; NorthFlorida, USA [26]
2 Gentiana pennelliana Non-invasive Pb, Cu, and Zn Field; NorthFlorida, USA [26]
3 Festuca rubra Non-invasive Pb and Mn Field experiment [93]
4 Tamarix gallica
Indigenous toSaudi Arabiaand the Sinai
Peninsula
Trace elements pot experiment [94]
5 Lolium perenne,
Native toEurope, Asia,and northern
Africa
Cu, Pb, Mn, and Znhighway soil in
southwest BritishColumbia, Canada
[95]
6 Loudetia simplex
Native toSouthern
Africa andMadagascar
Cu South D. R. Congo [96]
7 Tamarix africana Non-invasive As, Cd, Cr, Cu, Pb, and Zn Coina River [97] *
8 Piptatherum miliaceum Native toEurasia Trace elements
Sierra Minera of LaUnión-Cartagena
(SE Spain)[98]
9 Microchloa altera Non-invasive Heavy metalsDemocratic
Republic of theCongo (DRC)
[99]
10Silybum marianum, Piptatherummiliaceum, Nicotiana glauca and
Helianthus annuusNon-invasive Trace metals Pot experiment [100]
11 Spartina alterniflora Invasive Cu, Zn, Pb, and Cr China [101] **
12 Brassica campestris Non-invasive Cd, Cu, Ni, Pb, and Zn
Botanical Gardenof Komarov
Botanical Institute,Russia
[91] ***
13 Saccharum spontaneum andSaccharum munja Non-invasive Zn, Pb, Cu, Ni, Cd, and As Pot experiments [80] ***
14 Ulmus glabra Non-invasive As, Cd, Cr, Cu, Ni, Pb, and Zn Sava River [92]
Note: * = saline-contaminated soils; ** = sediment; *** = Potentials as phytoextraction and phytostabilisation.
Yoon et al. [26] reported the native plants (Phyla nodiflora) were suitable phytostabilis-ers of Cu and Zn, mainly attributed to P. nodiflora’s Cu and Zn accumulating abilities in itsshoots (TF = 12 and 6.3). They also recommended Gentiana pennelliana as a good candidatefor the phytostabilisation of Pb, Cu, and Zn (BCF = 11, 22, and 2.6, respectively) in pollutedsites. Santos et al. [97] reported that the salt marsh non-invasive Tamarix africana helps tostabilise the natural condition of soils, and thus serve as a good phytostabilising agent forsaline-contaminated soils. The two main mechanisms of the tolerance in the T. africana wereits high excretion of the elements through its salt glands and the relatively low transloca-tion of metals from its roots to the other plant parts. Varun et al. [102] reported the weedAbutilon indicum displayed BCF >1 at all concentrations. A. indicum had translocated mostof the metals in its root.
According to Patra et al. [83], the plants phytostabilised the soils by immobilisingthe pollutants in the rhizospheric region through adsorption or precipitation, thus pre-

Int. J. Environ. Res. Public Health 2021, 18, 4682 23 of 28
venting the pollutants from entering the environment as well as into the food chain ofthe ecosystem [15,85,103]. Phytostabilisers function through inhibiting the movements ofPTMs into the ecosystem, environment, or food chain, via various mechanisms in the rootsof the plants such as adsorption, precipitation, and complexation [104]. Phytostabilisationinvolves metal immobilisation for metal toxicity reduction in the roots, eliminating toxicmetal bioavailability in soils. Metals accumulated by A. gangetica will be channeled to theroot tissues through phytostabilisation processes or transported through xylem vessels tothe aerial parts of the plant.
4.4. General Discussion
The three sites (S7, S18, and S21) with significant elevated PTM levels in the topsoilsshowed lower BCF-1 values than the other sites. It was possible that the defensive mecha-nisms of the plants acted to mitigate the over accumulation of PTMs in highly contaminatedtopsoils [105]. This behaviour was similar to that reported in a study on H. verticillate wherethe plant gradually decreased the rate of metal uptake with increasing metal toxicity. Theplant displayed resistance to metal stress by increasing antioxidant activities to preventunessential elements (Pb and Cd) from hampering biological metabolism [106]. Moreover,the bioavailability of PTMs in the soil depends on the physico-chemical properties in thesoil (pH, organic matter, root exudates, microbial biomass, and competitive cations) [107].
In the literature, many studies documented the use of weeds as phytoremediators ofmetals [26–28,102,108,109]. Generally, the translocations of Cu and Zn from roots to stemsand leaves of plants from across the sampling sites were low (TF < 1). Plants from landfillsites (S5, S6, S7, and S9) had high TF-1 and TF-2 values of Cd, Ni, and Pb (TF > 1). Thisshowed the plants were actively translocating toxic metals from the roots. These plantshave potentials as phytoextractors with their high BCF values (>1) and as phytostabiliserswith their high BCF (>1) and low TF (<1) values [26].
Hence, based on the BCF values of Cd, Cu, Ni, Pb, and Zn, the metals in the topsoilEFLE fraction could be more easily transferred to the roots, leaves, and stems whencompared with those in the topsoil total concentrations of the metals. Based on the TFvalues of Cd, Ni, and Pb, the metal transferred to the stems (or leaves) from the roots wasefficient (>1.0) in most sampling sites. Therefore, the results of BCF and TF showed thatA. gangetica would be a good choice for use as a phytoextractor of Cd and Ni, and as aphytostabiliser of Cu, Pb, and Zn.
Asystasia from the industrial site at S18 had lower TFleaf (Cu, Pb, Ni, and Zn) thanweeds in the industrial areas of Islamabad [90] and the contaminated urban area ofFlorida [26]. Most of the plants sampled in the plantation areas had lower TFleaf (Cd,Cu, Ni, Pb, and Zn) than plants from contaminated urban areas in Florida [26] and theindustrial areas in Islamabad [90]. Plants sampled in the mining area (S13) had higherTFleaf values than those of plants from the mining area of Mahad AD’Dabah [55]. Theplants from the landfill areas had lower TFleaf (Cu, Pb, and Zn) than the plants from thewaste dumpsites of South-eastern Nigeria [110]. The rubbish heap plants generally hadlower TFleaf (Cu, Pb, and Zn) than the plants from the waste dumpsites in South-easternNigeria [110].
The phytoremediation using Asystasia is also classified as green technology owing to(i) its environmental friendly approach that maintains and does not destroy the site and (ii)its facilitation of the restoration process after the excavation of the site [83].
5. Conclusions
The current study analysed PTM levels in the topsoils and various parts (leaf, stem,and root) of A. gangetica plants collected from Peninsular Malaysia. Among all the sites, anabandoned mining site (S13) showed the highest levels of Cd, Cu, Ni, Pb, and Zn in theroots, while a rubbish heap site (S21) was found to have the highest levels of Ni and Znin stems and roots, respectively, and an industrial site at Juru (S18) showed the highestconcentrations of Pb and Zn in the leaves. Correlation analysis revealed that the roots and

Int. J. Environ. Res. Public Health 2021, 18, 4682 24 of 28
stems could be used as biomonitors of Cu, while stems as biomonitors of Ni, roots andleaves as biomonitors of Pb, and all the three plant parts as biomonitors of Zn. Based onthe BCF values of Cd, Cu, Ni, Pb, and Zn, the metals in the topsoil EFLE fraction could bemore easily transferred to the roots, leaves, and stems when compared with those in thetopsoil total concentrations of the metals. Hence, we conclude that the results of BCF andTF indicate that A. gangetica is a good phytoextraction agent for Cd and Ni, and a goodphytostabilisation agent for Cu, Pb, and Zn.
Author Contributions: Conceptualization, C.K.Y.; Data curation, W.C.; Formal analysis, W.C.; Fund-ing acquisition, C.K.Y. and R.N.; Methodology, W.C.; Project administration, C.K.Y.; Resources,C.K.Y., K.A.A.-M., and S.A.A.-S.; Supervision, C.K.Y.; Validation, S.A.A.-S. and M.H.I.; Visualization,K.A.A.-M.; Writing—Original draft, C.K.Y.; Writing—Review & editing, W.C., K.A.A.-M., S.A.A.-S.,R.N., M.H.I., K.W.W., A.R.B., M.S. (Moslem Sharifinia), W.H.C., H.O., M.S.I., and M.S. (MuhammadSaleem). All authors have read and agreed to the published version of the manuscript.
Funding: This study was funded by Research University Grant Scheme (RUGS-6), provided byUniversiti Putra Malaysia (cost number: 9316800, and code project: 01-01-12-1599RU).
Institutional Review Board Statement: Not applicable.
Informed Consent Statement: Not applicable.
Data Availability Statement: Not applicable.
Conflicts of Interest: The authors declare no conflict of interest.
References1. Prabakaran, K.; Li, J.; Anandkumar, A.; Leng, Z.; Zou, C.B.; Du, D. Managing Environmental Contamination through Phytoreme-
diation by Invasive Plants: A Review. Ecol. Eng. 2019, 138, 28–37. [CrossRef]2. Wiart, C. Medicinal Plants of South East Asia; Pelanduk Publications: Subang Jaya, Malaysia, 2000; ISBN 978-967-978-725-2.3. Kiew, R.; Vollesen, K. Asystasia (Acanthaceae) in Malaysia. Kew Bull. 1997, 52, 965–971. [CrossRef]4. Hsu, T.-W.; Chiang, T.-Y.; Peng, J.-J. Asystasia Gangetica (L.) T. Anderson Subsp. Micrantha (Nees) Ensermu (Acanthaceae), A Newly
Naturalized Plant in Taiwan. Taiwania 2005, 50, 117–122. [CrossRef]5. Skinner, J. The Invasive Weed Chinese Violet (Asystasia Gangetica Subspecies Micrantha) Now Threatens Northern Australia. Plant
Prot. Q. 2015, 30, 126–132.6. Chandler, G.; Westaway, J.; Alford, L.; Schmid, M. Asystasia Gangetica Subsp. Micrantha, a New Record of an Exotic Plant in the
Northern Territory. North. Territ. Nat. 2016, 27, 29–35.7. Adetula, O.A. Asystasia Gangetica (L.) T.Anderson. Available online: https://www.prota4u.org/database/protav8.asp?g=pe&p=
Asystasia+gangetica+(L.)+T.Anderson (accessed on 9 February 2021).8. Asbur, Y.; Yahya, S.; Murtilaksono, K.; Sudradjat, R.; Sutarta, E.S. The Roles of Asystasia Gangetica (L.) T. Anderson and Ridge
Terrace in Reducing Soil Erosion and Nutrient Losses in Oil Palm Plantation in South Lampung, Indonesia. J. Trop. Crop Sci. 2016,3, 49–55. [CrossRef]
9. Ariyanti, M.; Mubarok, S.; Asbur, Y. Study of Asystasia Gangetica (L.) T. Anderson as Cover Crop Against Soil Water Content inMature Oil Palm Plantation. J. Agron. 2017, 16, 154–159. [CrossRef]
10. Asbur, Y.; Yahya, S.; Murtilaksono, K.; Sudradjat; Sutarta, E. Study of Asystasia Gangetica (L.) Anderson Utilization as Cover Cropunder Mature Oil Palm with Different Ages. Int. J. Sci. Basic Appl. Res. IJSBAR 2015, 19, 137–148.
11. Kumalasari, N.R.; Abdullah, L.; Khotijah, L.; Wahyuni, L.; Indriyani, I.; Ilman, N.; Janato, F. Evaluation of Asystasia Gangetica asa Potential Forage in Terms of Growth, Yield and Nutrient Concentration at Different Harvest Ages. Trop. Grassl.-Forrajes Trop.2020, 8, 153–157. [CrossRef]
12. Sandoval, J.R.; Rodriguez, P.A. Asystasia Gangetica (Chinese Violet); Department of Botany-Smithsonian National Museum ofNatural History: Washington, DC, USA, 2012.
13. Samedani, B.; Juraimi, A.S.; Anwar, M.P.; Rafii, M.Y.; Sheikh Awadz, S.H.; Anuar, A.R. Competitive Interaction of AxonopusCompressus and Asystasia Gangetica under Contrasting Sunlight Intensity. Sci. World J. 2013, 2013, 308646. [CrossRef]
14. Patra, D.K.; Pradhan, C.; Patra, H.K. Chromium Bioaccumulation, Oxidative Stress Metabolism and Oil Content in Lemon GrassCymbopogon Flexuosus (Nees Ex Steud.) W. Watson Grown in Chromium Rich over Burden Soil of Sukinda Chromite Mine, India.Chemosphere 2019, 218, 1082–1088. [CrossRef]
15. Ali, H.; Khan, E.; Sajad, M.A. Phytoremediation of Heavy Metals—Concepts and Applications. Chemosphere 2013, 91, 869–881.[CrossRef] [PubMed]
16. Tong, Y.P.; Kneer, R.; Zhu, Y.G. Vacuolar Compartmentalization: A Second-Generation Approach to Engineering Plants forPhytoremediation. Trends Plant Sci. 2004, 9, 7–9. [CrossRef]

Int. J. Environ. Res. Public Health 2021, 18, 4682 25 of 28
17. Shabani, N.; Sayadi, M.H. Evaluation of Heavy Metals Accumulation by Two Emergent Macrophytes from the Polluted Soil: AnExperimental Study. Environmentalist 2012, 32, 91–98. [CrossRef]
18. Aksoy, A.; Sahin, U. Elaeagnus Angustifolia L. as a Biomonitor of Heavy Metal Pollution. Turk. J. Bot. 1999, 23, 83–88.19. Chakrabortty, S.; Paratkar, G.T. Biomonitoring of Trace Element Air Pollution Using Mosses. Aerosol Air Qual. Res. 2006, 6,
247–258. [CrossRef]20. Asbur, Y.; Yahya, S.; Murtilaksono, K.; Sudradjat, S.E.S. Peran tanaman penutup tanah terhadap neraca hara di perkebunan
kelapa sawit menghasilkan di Lampung Selatan. J. Penelit. Kelapa Sawit 2015, 23, 53–60.21. Asbur, Y.; Yahya, S.; Purwaningrum, Y.; Ariyanti, M. The Potentials of Asystasia Gangetica (L.) T. Anderson as Cover Crop under
Mature Oil Palm Plantation. In Proceedings of the Multidisciplinary Knowledge for a Better Life; University Science of Malaysia(USM), Universitas Syiah Kuala (Unsyiah), and Universitas Islam Sumatera Utara (UISU): Medan, Indonesia, 2014; pp. 124–128.
22. Chew, W.; Yap, C.K.; Ismail, A.; Zakaria, M.; Tan, S.G. Mercury Distribution in an Invasive Species (Asystasia Gangetica) fromPeninsular Malaysia. Sains Malays. 2012, 41, 395–401.
23. Yap, C.K.; Chew, W. The Invasive Weed, Asystasia gangetica as a Biomonitor of Heavy Metal Bioavailability and Pollution. InFrom Sources to Solution, Proceedings of the International Conference on Environmental Forensics 2013; Aris, A.Z., Tengku Ismail, T.H.,Harun, R., Abdullah, A.M., Ishak, M.Y., Eds.; Springer: Singapore, 2014; pp. 519–523.
24. Wittig, R. General aspects of biomonitoring heavy metals by plants. In Plants as Biomonitors; Markert, B., Ed.; VCH Publisher:Weinheim, Germany, 1993; pp. 3–28, ISBN 3-527-30001-5.
25. Zhuang, P.; Ye, Z.H.; Lan, C.Y.; Xie, Z.W.; Shu, W.S. Chemically Assisted Phytoextraction of Heavy Metal Contaminated SoilsUsing Three Plant Species. Plant Soil 2005, 276, 153–162. [CrossRef]
26. Yoon, J.; Cao, X.; Zhou, Q.; Ma, L.Q. Accumulation of Pb, Cu, and Zn in Native Plants Growing on a Contaminated Florida Site.Sci. Total Environ. 2006, 368, 456–464. [CrossRef]
27. Ashraf, S.; Ali, Q.; Zahir, Z.A.; Ashraf, S.; Asghar, H.N. Phytoremediation: Environmentally Sustainable Way for Reclamation ofHeavy Metal Polluted Soils. Ecotoxicol. Environ. Saf. 2019, 174, 714–727. [CrossRef]
28. Ashraf, M.A.; Maah, M.J.; Yusoff, I. Heavy Metals Accumulation in Plants Growing in Ex Tin Mining Catchment. Int. J. Environ.Sci. Technol. 2011, 8, 401–416. [CrossRef]
29. Wu, Q.; Wang, S.; Thangavel, P.; Li, Q.; Zheng, H.; Bai, J.; Qiu, R. Phytostabilization Potential of Jatropha Curcas L. in PolymetallicAcid Mine Tailings. Int. J. Phytoremediation 2011, 13, 788–804. [CrossRef] [PubMed]
30. Ladislas, S.; El-Mufleh, A.; Gérente, C.; Chazarenc, F.; Andrès, Y.; Béchet, B. Potential of Aquatic Macrophytes as Bioindicators ofHeavy Metal Pollution in Urban Stormwater Runoff. Water. Air. Soil Pollut. 2012, 223, 877–888. [CrossRef]
31. Padmavathiamma, P.K.; Li, L.Y. Phytoremediation Technology: Hyper-Accumulation Metals in Plants. Water. Air. Soil Pollut.2007, 184, 105–126. [CrossRef]
32. Aksoy, A.; Demirezen, D. Fraxinus Excelsior as a Biomonitor of Heavy Metal Pollution. Pol. J. Environ. Stud. 2006, 15, 27–33.33. Akgüç, H.; Özy, L.; Yarci, C. Pyracantha Coccinea Roem. (Rosaceae) as a Biomonitor for Cd, Pb, and Zn in Mugla Province (Turkey).
Pak. J. Bot. 2008, 40, 1767–1776.34. De Nicola, F.; Maisto, G.; Prati, M.V.; Alfani, A. Leaf Accumulation of Trace Elements and Polycyclic Aromatic Hydrocarbons
(PAHs) in Quercus Ilex L. Environ. Pollut. 2008, 153, 376–383. [CrossRef]35. Khan, S.; Aijun, L.; Zhang, S.; Hu, Q.; Zhu, Y.-G. Accumulation of Polycyclic Aromatic Hydrocarbons and Heavy Metals in
Lettuce Grown in the Soils Contaminated with Long-Term Wastewater Irrigation. J. Hazard. Mater. 2008, 152, 506–515. [CrossRef]36. Hoodaji, M.; Tahmourespour, A.; Amini, H. Assessment of Copper, Cobalt and Zinc Contaminations in Soils and Plants of
Industrial Area in Esfahan City (in Iran). Environ. Earth Sci. 2010, 61, 1353–1360. [CrossRef]37. Divan, A.M.; de Oliveira, P.L.; Perry, C.T.; Atz, V.L.; Azzarini-Rostirola, L.N.; Raya-Rodriguez, M.T. Using Wild Plant Species as
Indicators for the Accumulation of Emissions from a Thermal Power Plant, Candiota, South Brazil. Ecol. Indic. 2009, 9, 1156–1162.[CrossRef]
38. Yildirim, D.; Sasmaz, A. Phytoremediation of As, Ag, and Pb in Contaminated Soils Using Terrestrial Plants Grown on GumuskoyMining Area (Kutahya Turkey). J. Geochem. Explor. 2017, 182, 228–234. [CrossRef]
39. de Paula, P.H.M.; Mateus, V.L.; Araripe, D.R.; Duyck, C.B.; Saint’Pierre, T.D.; Gioda, A. Biomonitoring of Metals for Air PollutionAssessment Using a Hemiepiphyte Herb (Struthanthus Flexicaulis). Chemosphere 2015, 138, 429–437. [CrossRef] [PubMed]
40. Petrovic, J.V.; Alagic, S.C.; Milic, S.M.; Tošic, S.B.; Bugarin, M.M. Chemometric Characterization of Heavy Metals in Soils andShoots of the Two Pioneer Species Sampled near the Polluted Water Bodies in the Close Vicinity of the Copper Mining andMetallurgical Complex in Bor (Serbia): Phytoextraction and Biomonitoring Contexts. Chemosphere 2021, 262, 127808. [CrossRef][PubMed]
41. Yap, C.K.; Pang, B.H. Assessment of Cu, Pb, and Zn Contamination in Sediment of North Western Peninsular Malaysia by UsingSediment Quality Values and Different Geochemical Indices. Environ. Monit. Assess. 2011, 183, 23–39. [CrossRef]
42. Yap, C.K.; Pang, B.H. Anthropogenic Concentrations of Cd, Ni and Zn in the Intertidal, River and Drainage Sediments Collectedfrom North Western Peninsular Malaysia. Pertanika J. Sci. Technol. 2011, 19, 93–107.
43. Halmi, M.I.E.; Gunasekaran, B.; Othman, A.R.; Kamaruddin, K.; Dahalan, F.A.; Ibrahim, N.; Shukor, M.Y. A Rapid InhibitiveEnzyme Assay for Monitoring Heavy Metals Pollution in the Juru Industrial Estate. Bioremediation Sci. Technol. Res. 2015, 3, 7–12.
44. Yap, C.K.; Tan, S. Heavy Metal Pollution in the Juru River Basin Receiving Industrial Effluents: The Need for Biochemical andMolecular Studies in the Edible Cockles Anadara Granosa. Malays. Appl. Biol 2008, 37, 63–68.

Int. J. Environ. Res. Public Health 2021, 18, 4682 26 of 28
45. Yap, C.K.; Hatta, Y.; Edward, F.; Tan, S. Comparison of Heavy Metal Concentrations (Cd, Cu, Fe, Ni and Zn) in the Shells andDifferent Soft Tissues of Anadara Granosa Collected from Jeram, Kuala Juru and Kuala Kurau, Peninsular Malaysia. Pertanika J.Trop. Agric. Sci. 2008, 31, 205–215.
46. Yap, C.K.; Noorhaidah, A.; Azlan, A.; Nor Azwady, A.A.; Ismail, A.; Ismail, A.R.; Siraj, S.S.; Tan, S.G. Telescopium Telescopium asPotential Biomonitors of Cu, Zn, and Pb for the Tropical Intertidal Area. Ecotoxicol. Environ. Saf. 2009, 72, 496–506. [CrossRef]
47. Alshaebi, F.; Yaacob, W.Z.; Samsudin, A.; Alsabahi, E. Risk Assessment at Abandoned Tin Mine in Sungai Lembing, Pahang,Malaysia. Electron. J. Geotech. Eng. 2009, 14, 1–9.
48. Mohd Zin, N.S.; Abdul Aziz, H.; Adlan, M.N.; Ariffin, A. Characterization of Leachate at Matang Landfill Site, Perak, Malaysia.Acad. J. Sci. 2012, 1, 317–322.
49. Rashid, R.I.; Ibrahim, M.Z.; Abdullah, M.A.; Ishak, A.R. Characterization and Toxicity Study of Leachate from Closed Landfills inSelangor. Asia Pac. Environ. Occup. Health J. 2018, 4, 16–20.
50. Kalantarifard, A.; Yang, G.S. Energy Potential from Municipal Solid Waste in Tanjung Langsat Landfill, Johor, Malaysia. Int. J.Eng. Sci. Technol. 2011, 3, 8560–8568.
51. Yap, C.K.; Ismail, A.; Tan, S.G.; Omar, H. Correlations between Speciation of Cd, Cu, Pb and Zn in Sediment and TheirConcentrations in Total Soft Tissue of Green-Lipped Mussel Perna Viridis from the West Coast of Peninsular Malaysia. Environ.Int. 2002, 28, 117–126. [CrossRef]
52. Badri, M.A.; Aston, S.R. Observations on Heavy Metal Geochemical Associations in Polluted and Non-Polluted EstuarineSediments. Environ. Pollut. Ser. B Chem. Phys. 1983, 6, 181–193. [CrossRef]
53. Hakanson, L. An Ecological Risk Index for Aquatic Pollution Control.a Sedimentological Approach. Water Res. 1980, 14, 975–1001.[CrossRef]
54. Wedepohl, K.H. The Composition of Earth’s Upper Crust, Natural Cycles of Elements, Natural Resources. In Elements and TheirCompounds in the Environment; John Wiley & Sons, Ltd.: Hoboken, NJ, USA, 2004; pp. 2–16. ISBN 978-3-527-61963-4.
55. Al-Farraj, A.S.; Al-Wabel, M.I.; Al-Shahrani, T.S.; El-Maghraby, S.E.; Al-Sewailem, M.A.S. Accumulation Coefficient and Transloca-tion Factor of Heavy Metals through Rhazya Stricta Grown in the Mining Area of Mahad AD’Dahab, Saudi Arabia. In Proceedingsof the Waste Management and the Environment, V; WIT Press: Tallinn, Estonia, 2010; pp. 325–336.
56. Zar, J.H. Biostatistical Analysis, 3rd ed; Prentice Hall: Hoboken, NJ, USA, 1996.57. Hair, J.F.; Black, W.C.; Babin, B.J. Multivariate Data Analysis: A Global Perspective; Pearson Education: Cranbury, New Jersey, USA,
2010; ISBN 978-0-13-515309-3.58. Byrne, B.M. Structural Equation Modeling With AMOS: Basic Concepts, Applications, and Programming, 2nd ed; Routledge: New York,
NY, USA, 2010; ISBN 978-0-203-80553-4.59. Garson, G.D. Partial Least Squares: Regression and Path Modelling; Statistical Publishing Associates: Asheboro, NC, USA, 2012.60. Lum, A.F.; Ngwa, E.S.A.; Chikoye, D.; Suh, C.E. Phytoremediation Potential of Weeds in Heavy Metal Contaminated Soils of the
Bassa Industrial Zone of Douala, Cameroon. Int. J. Phytoremediation 2014, 16, 302–319. [CrossRef] [PubMed]61. Subha, M.; Srinivas, N. Phytoremediation Potential of Weedy Plants in Heavy Metal Contaminated Benthic Lake Sludge. Int. J.
Appl. Eng. Res. 2017, 12, 4534–4538.62. Baker, A.; Brooks, R. Terrestrial Higher Plants Which Hyperaccumulate Metallic Elements, A Review of Their Distribution. Ecol.
Phytochem Biorecovery 1989, 1, 81–126.63. Yap, C.K.; Omar, H.; Nulit, R.; Ong, G.H.; Bakhtiari, A.R.; Karami, A.; Al-Shami, S.A. Relationships of Zn Between Centella
Asiatica and Geochemical Fractions of the Habitat Topsoils: Implications of Biomonitoring of Zn. Open Biol. Sci. J. 2017, 3, 26–35.[CrossRef]
64. Gallagher, F.J.; Pechmann, I.; Bogden, J.D.; Grabosky, J.; Weis, P. Soil Metal Concentrations and Vegetative Assemblage Structurein an Urban Brownfield. Environ. Pollut. Barking Essex 1987 2008, 153, 351–361. [CrossRef]
65. Cheng, S. Heavy Metal Pollution in China: Origin, Pattern and Control. Environ. Sci. Pollut. Res. 2003, 10, 192–198. [CrossRef][PubMed]
66. Raskin, I.; Kumar, P.N.; Dushenkov, S.; Salt, D.E. Bioconcentration of Heavy Metals by Plants. Curr. Opin. Biotechnol. 1994, 5,285–290. [CrossRef]
67. Vollenweider, P.; Bernasconi, P.; Gautschi, H.-P.; Menard, T.; Frey, B.; Günthardt-Goerg, M.S. Compartmentation of Metals inFoliage of Populus Tremula Grown on Soils with Mixed Contamination. II. Zinc Binding inside Leaf Cell Organelles. Environ.Pollut. 2011, 159, 337–347. [CrossRef]
68. Wei, H.; Huang, M.; Quan, G.; Zhang, J.; Liu, Z.; Ma, R. Turn Bane into a Boon: Application of Invasive Plant Species to RemedySoil Cadmium Contamination. Chemosphere 2018, 210, 1013–1020. [CrossRef] [PubMed]
69. Favas, P.J.C.; Morais, I.; Campos, J.; Pratas, J. Nickel phytoextraction by a native population of Alyssum serpyllifolium subsp.lusitanicum on ultramafic soils (Portugal): Prospects for phytomining. Comun. Geol. 2020, 107, 115–117.
70. Yu, G.; Jiang, P.; Fu, X.; Liu, J.; Sunahara, G.I.; Chen, Z.; Xiao, H.; Lin, F.; Wang, X. Phytoextraction of Cadmium-ContaminatedSoil by Celosia Argentea Linn.: A Long-Term Field Study. Environ. Pollut. 2020, 266, 115408. [CrossRef] [PubMed]
71. Atagana, H.I. Bioremediation of Co-Contamination of Crude Oil and Heavy Metals in Soil by Phytoremediation Using ChromolaenaOdorata (L) King & H.E. Robinson. Water. Air. Soil Pollut. 2011, 215, 261–271. [CrossRef]
72. Pandey, V.C. Invasive Species Based Efficient Green Technology for Phytoremediation of Fly Ash Deposits. J. Geochem. Explor.2012, 123, 13–18. [CrossRef]

Int. J. Environ. Res. Public Health 2021, 18, 4682 27 of 28
73. Chinmayee, M.D.; Mahesh, B.; Pradesh, S.; Mini, I.; Swapna, T.S. The Assessment of Phytoremediation Potential of Invasive WeedAmaranthus Spinosus L. Appl. Biochem. Biotechnol. 2012, 167, 1550–1559. [CrossRef]
74. Alshaal, T.; domokos-szabolcsy, E.; Marton, L.; Czako, M.; Katai, J.; Balogh, P.; Elhawat, N.; El-Ramady, H.; Fári, M. Phytoremedi-ation of Bauxite-Derived Red Mud by Giant Reed. Environ. Chem. Lett. 2013, 11, 295–302. [CrossRef]
75. Pandey, V.C.; Singh, N.; Singh, R.P.; Singh, D.P. Rhizoremediation Potential of Spontaneously Grown Typha Latifolia on Fly AshBasins: Study from the Field. Ecol. Eng. 2014, 71, 722–727. [CrossRef]
76. Bonanno, G.; Cirelli, G.L. Comparative Analysis of Element Concentrations and Translocation in Three Wetland Congener Plants:Typha Domingensis, Typha Latifolia and Typha Angustifolia. Ecotoxicol. Environ. Saf. 2017, 143, 92–101. [CrossRef] [PubMed]
77. Li, J.; Du, Z.; Zou, C.B.; Dai, Z.; Du, D.; Yan, C. The Mutual Restraint Effect between the Expansion of Alternanthera Philoxeroides(Mart.) Griseb and Cadmium Mobility in Aquatic Environment. Ecotoxicol. Environ. Saf. 2018, 148, 237–243. [CrossRef]
78. Yousaf, B.; Liu, G.; Abbas, Q.; Ali, M.U.; Wang, R.; Ahmed, R.; Wang, C.; Al-Wabel, M.I.; Usman, A.R.A. Operational Control onEnvironmental Safety of Potentially Toxic Elements during Thermal Conversion of Metal-Accumulator Invasive Ragweed toBiochar. J. Clean. Prod. 2018, 195, 458–469. [CrossRef]
79. Zhu, G.; Xiao, H.; Guo, Q.; Song, B.; Zheng, G.; Zhang, Z.; Zhao, J.; Okoli, C.P. Heavy Metal Contents and EnrichmentCharacteristics of Dominant Plants in Wasteland of the Downstream of a Lead-Zinc Mining Area in Guangxi, Southwest China.Ecotoxicol. Environ. Saf. 2018, 151, 266–271. [CrossRef]
80. Banerjee, R.; Jana, A.; De, A.; Mukherjee, A. Phytoextraction of Heavy Metals from Coal Fly Ash for Restoration of Fly AshDumpsites. Bioremediation J. 2020, 24, 41–49. [CrossRef]
81. Benavides, B.J.; Drohan, P.J.; Spargo, J.T.; Maximova, S.N.; Guiltinan, M.J.; Miller, D.A. Cadmium Phytoextraction by HelianthusAnnuus (Sunflower), Brassica Napus Cv Wichita (Rapeseed), and Chyrsopogon Zizanioides (Vetiver). Chemosphere 2021, 265, 129086.[CrossRef] [PubMed]
82. Xu, L.; Li, J.; Najeeb, U.; Li, X.; Pan, J.; Huang, Q.; Zhou, W.; Liang, Z. Synergistic Effects of EDDS and ALA on Phytoextraction ofCadmium as Revealed by Biochemical and Ultrastructural Changes in Sunflower (Helianthus Annuus L.) Tissues. J. Hazard. Mater.2021, 407, 124764. [CrossRef] [PubMed]
83. Patra, D.K.; Pradhan, C.; Patra, H.K. Toxic Metal Decontamination by Phytoremediation Approach: Concept, Challenges,Opportunities and Future Perspectives. Environ. Technol. Innov. 2020, 18, 100672. [CrossRef]
84. He, Z.L.; Yang, X.E.; Stoffella, P.J. Trace Elements in Agroecosystems and Impacts on the Environment. J. Trace Elem. Med. Biol.2005, 19, 125–140. [CrossRef] [PubMed]
85. Barceló, J.; Poschenrieder, C. Phytoremediation: Principles and Perspectives. Contrib. Sci. 2003, 2, 333–344.86. Patra, D.K.; Pradhan, C.; Patra, H.K. An in Situ Study of Growth of Lemongrass Cymbopogon Flexuosus (Nees Ex Steud.) W.
Watson on Varying Concentration of Chromium (Cr+6) on Soil and Its Bioaccumulation: Perspectives on PhytoremediationPotential and Phytostabilisation of Chromium Toxicity. Chemosphere 2018, 193, 793–799. [CrossRef]
87. Patra, D.; Pradhan, C.; Patra, H. Chromium Stress Impact on Lemongrass Grown in Over Burden Soil of Sukinda Chromite OreMine (Odisha), India. Ann. Plant Sci. 2018, 7, 2394. [CrossRef]
88. Robinson, B.H.; Leblanc, M.; Petit, D.; Brooks, R.R.; Kirkman, J.H.; Gregg, P.E.H. The Potential of Thlaspi Caerulescens forPhytoremediation of Contaminated Soils. Plant Soil 1998, 203, 47–56. [CrossRef]
89. Ali, H.; Naseer, M.; Sajad, M.A. Phytoremediation of Heavy Metals by Trifolium Alexandrinum. Int. J. Environ. Sci. 2012, 2,1459–1469.
90. Malik, R.; Husain, S.; Nazir, I. Heavy Metal Contamination and Accumulation in Soil and Wild Plant Species from IndustrialArea of Islamabad, Pakistan. Pak. J. Bot. 2010, 42, 291–301.
91. Drozdova, I.; Alekseeva-Popova, N.; Dorofeyev, V.; Bech, J.; Belyaeva, A.; Roca, N. A Comparative Study of the Accumulation ofTrace Elements in Brassicaceae Plant Species with Phytoremediation Potential. Appl. Geochem. 2019, 108, 104377. [CrossRef]
92. Mataruga, Z.; Jaric, S.; Kostic, O.; Markovic, M.; Jakovljevic, K.; Mitrovic, M.; Pavlovic, P. The Potential of Elm Trees (Ulmus GlabraHuds.) for the Phytostabilisation of Potentially Toxic Elements in the Riparian Zone of the Sava River. Environ. Sci. Pollut. Res.2020, 27, 4309–4324. [CrossRef]
93. Padmavathiamma, P.K.; Li, L.Y. Phytostabilisation–An Appropriate Remediation Technique for Metals in Soils along Highways.In Construction for a Sustainable Environment; CRC Press: Boca Raton, FL, USA, 2009; pp. 265–270.
94. Moreno-Jiménez, E.; Esteban, E.; Carpena-Ruiz, R.O.; Lobo, M.C.; Peñalosa, J.M. Phytostabilisation with Mediterranean Shrubsand Liming Improved Soil Quality in a Pot Experiment with a Pyrite Mine Soil. J. Hazard. Mater. 2012, 201–202, 52–59. [CrossRef]
95. Padmavathiamma, P.K.; Li, L.Y. Rhizosphere Influence and Seasonal Impact on Phytostabilisation of Metals—A Field Study.Water Air Soil Pollut. 2012, 223, 107–124. [CrossRef]
96. Boisson, S.; Stradic, S.L.; Collignon, J.; Séleck, M.; Malaisse, F.; Shutcha, M.N.; Faucon, M.-P.; Mahy, G. Potential of Copper-TolerantGrasses to Implement Phytostabilisation Strategies on Polluted Soils in South D. R. Congo. Environ. Sci. Pollut. Res. 2016, 23,13693–13705. [CrossRef]
97. Santos, E.S.; Abreu, M.M.; Peres, S.; Magalhães, M.C.F.; Leitão, S.; Pereira, A.S.; Cerejeira, M.J. Potential of Tamarix Africanaand Other Halophyte Species for Phytostabilisation of Contaminated Salt Marsh Soils. J. Soils Sediments 2017, 17, 1459–1473.[CrossRef]
98. Arco-Lázaro, E.; Martínez-Fernández, D.; Bernal, M.P.; Clemente, R. Response of Piptatherum Miliaceum to Co-Culture with aLegume Species for the Phytostabilisation of Trace Elements Contaminated Soils. J. Soils Sediments 2017, 17, 1349–1357. [CrossRef]

Int. J. Environ. Res. Public Health 2021, 18, 4682 28 of 28
99. Boisson, S.; Séleck, M.; Le Stradic, S.; Collignon, J.; Garin, O.; Malaisse, F.; Shutcha, M.N.; Mahy, G. Using Phytostabilisation toConserve Threatened Endemic Species in Southeastern Democratic Republic of the Congo. Ecol. Res. 2018, 33, 789–798. [CrossRef]
100. Bernal, M.P.; Gómez, X.; Chang, R.; Arco-Lázaro, E.; Clemente, R. Strategies for the Use of Plant Biomass Obtained in thePhytostabilisation of Trace-Element-Contaminated Soils. Biomass Bioenergy 2019, 126, 220–230. [CrossRef]
101. Zhang, Q.; Yan, Z.; Li, X.; Xu, Y.; Sun, X.; Liang, Q. Formation of Iron Plaque in the Roots of Spartina Alterniflora and Its Effect onthe Immobilization of Wastewater-Borne Pollutants. Ecotoxicol. Environ. Saf. 2019, 168, 212–220. [CrossRef] [PubMed]
102. Varun, M.; Jaggi, D.; D’Souza, R.; Paul, M.S.; Kumar, B. Abutilon Indicum L.: A Prospective Weed for Phytoremediation. Environ.Monit. Assess. 2015, 187, 527. [CrossRef] [PubMed]
103. Sharma, P.; Pandey, S. Status of Phytoremediation in World Scenario. Int. J. Environ. Bioremediation Biodegrad. 2014, 2, 178–191.[CrossRef]
104. Erakhrumen, A.A. Phytoremediation: An Environmentally Sound Technology for Pollution Prevention, Control and Remediationin Developing Countries. Educ. Res. Rev. 2007, 2, 151–156.
105. Sousa, A.I.; Caçador, I.; Lillebø, A.I.; Pardal, M.A. Heavy Metal Accumulation in Halimione Portulacoides: Intra- and Extra-Cellular Metal Binding Sites. Chemosphere 2008, 70, 850–857. [CrossRef] [PubMed]
106. Zhang, H.; Zhang, L.-L.; Li, J.; Chen, M.; An, R.-D. Comparative Study on the Bioaccumulation of Lead, Cadmium and Nickeland Their Toxic Effects on the Growth and Enzyme Defence Strategies of a Heavy Metal Accumulator, Hydrilla Verticillata (L.f.)Royle. Environ. Sci. Pollut. Res. 2020, 27, 9853–9865. [CrossRef]
107. Sarwar, N.; Malhi, S.S.; Zia, M.H.; Naeem, A.; Bibi, S.; Farid, G. Role of Mineral Nutrition in Minimizing Cadmium Accumulationby Plants. J. Sci. Food Agric. 2010, 90, 925–937. [CrossRef] [PubMed]
108. Lorestani, B.; Yousefi, N.; Cheraghi, M.; Farmany, A. Phytoextraction and Phytostabilization Potential of Plants Grown in theVicinity of Heavy Metal-Contaminated Soils: A Case Study at an Industrial Town Site. Environ. Monit. Assess. 2013, 185,10217–10223. [CrossRef]
109. Chang Kee, J.; Gonzales, M.J.; Ponce, O.; Ramírez, L.; León, V.; Torres, A.; Corpus, M.; Loayza-Muro, R. Accumulation of HeavyMetals in Native Andean Plants: Potential Tools for Soil Phytoremediation in Ancash (Peru). Environ. Sci. Pollut. Res. Int. 2018,25, 33957–33966. [CrossRef] [PubMed]
110. Uka, U.N.; Chukwuka, K.S.; Afoke, C. Heavy Metal Accumulation by Telfairia Occidentalis Hook, F Grown on Waste Dumpsites inSouth-Eastern Nigeria. Res. J. Environ. Toxicol. 2013, 7, 47–53. [CrossRef]
Copyright © 2022 FDOKUMEN