Relationships between upland rice canopy characteristics and weed competitiveness
17
Relationships between upland rice canopy characteristics and weed competitiveness M. Dingkuhn * , D.E. Johnson, A. Sow, A.Y. Audebert West Africa Rice Development Association, B.P. 01, Bouake 2551, Ivory Coast Received 5 March 1998; accepted 11 September 1998 Abstract Weed-competitive upland rices with an acceptable yield potential are needed for labor-limited systems in Africa, particularly where shortened fallow periods have increased weed pressure. Crosses between weed-competitive but low-yielding African rice, Oryza glaberrima, and improved Oryza sativa tropical-japonica rices, might reduce tradeoffs between competitiveness and yield potential. Parallel field studies under moist upland conditions were conducted during the 1996 and 1997 wet seasons at Mbe in Cote d’Ivoire to (1) characterize canopy properties, growth vigor and yield for O. glaberrima, O. sativa and interspecific progenies under monoculture, and (2) determine their competitiveness when grown in single rows in competition with natural weed growth, maize (removed 50 days after sowing [DAS]), the highly weed-competitive O. glaberrima IG10, and with themselves. In the monoculture study with 21 lines, dry matter, leaf area index (LAI), PAR extinction coefficient (K df ), mean tip elevation angle (MTA) and specific leaf area (SLA) were measured 31, 46 and 64 DAS. Across lines, LAI was positively correlated with SLA, dry matter partitioning to leaves (31 and 46 DAS) and K df (46 DAS); and negatively with MTA (46 and 64 DAS). Plant height was negatively correlated with tiller number. In the competition study with 16 lines, the O. glaberrima landraces had superior relative yield (yield under interspecific competition/yield under intraspecific competition). Some breeding lines were competitive with specific competitors. Correlations between canopy characteristics under monoculture and competition indicated that LAI, SLA and tillering ability were predictive of competitiveness regardless of the competing species, whereas partitioning, K df and MTA were correlated with competitiveness only for specific growth stages and/or competitors. Competitiveness was negatively but weakly correlated with yield potential, and positively, with crop duration. The authors conclude that SLA and tillering ability, which are major determinants of vegetative vigor, and crop duration, which affects the ability to recover from early competition, are useful traits in the selection of weed-competitive rices, particularly in breeding programs that use O. glaberrima. The traits are compatible with high yield potential if cultivars have large SLA during early developmental stages and small SLA during advanced stages. Major knowledge gaps remain on weed competitiveness under drought- and flood-prone conditions, which are frequently associated with weed problems. # 1999 Elsevier Science B.V. All rights reserved. Keywords: Oryza sativa L.; Oryza glaberrima Steud.; Weed competition; Vigor; Leaf area index; Specific leaf area; Mean tip angle; Extinction coefficient Field Crops Research 61 (1999) 79–95 *Corresponding author. E-mail: [email protected] 0378-4290/99/$ – see front matter # 1999 Elsevier Science B.V. All rights reserved. PII: S0378-4290(98)00152-X
-
Upload
independent -
Category
Documents
-
view
0 -
download
0
Transcript of Relationships between upland rice canopy characteristics and weed competitiveness

Relationships between upland rice canopy characteristics
and weed competitiveness
M. Dingkuhn*, D.E. Johnson, A. Sow, A.Y. Audebert
West Africa Rice Development Association, B.P. 01, Bouake 2551, Ivory Coast
Received 5 March 1998; accepted 11 September 1998
Abstract
Weed-competitive upland rices with an acceptable yield potential are needed for labor-limited systems in Africa, particularly
where shortened fallow periods have increased weed pressure. Crosses between weed-competitive but low-yielding African
rice, Oryza glaberrima, and improved Oryza sativa tropical-japonica rices, might reduce tradeoffs between competitiveness
and yield potential. Parallel ®eld studies under moist upland conditions were conducted during the 1996 and 1997 wet seasons
at Mbe in Cote d'Ivoire to (1) characterize canopy properties, growth vigor and yield for O. glaberrima, O. sativa and
interspeci®c progenies under monoculture, and (2) determine their competitiveness when grown in single rows in competition
with natural weed growth, maize (removed 50 days after sowing [DAS]), the highly weed-competitive O. glaberrima IG10,
and with themselves. In the monoculture study with 21 lines, dry matter, leaf area index (LAI), PAR extinction coef®cient
(Kdf), mean tip elevation angle (MTA) and speci®c leaf area (SLA) were measured 31, 46 and 64 DAS. Across lines, LAI was
positively correlated with SLA, dry matter partitioning to leaves (31 and 46 DAS) and Kdf (46 DAS); and negatively with MTA
(46 and 64 DAS). Plant height was negatively correlated with tiller number. In the competition study with 16 lines, the O.
glaberrima landraces had superior relative yield (yield under interspeci®c competition/yield under intraspeci®c competition).
Some breeding lines were competitive with speci®c competitors. Correlations between canopy characteristics under
monoculture and competition indicated that LAI, SLA and tillering ability were predictive of competitiveness regardless of the
competing species, whereas partitioning, Kdf and MTA were correlated with competitiveness only for speci®c growth stages
and/or competitors. Competitiveness was negatively but weakly correlated with yield potential, and positively, with crop
duration. The authors conclude that SLA and tillering ability, which are major determinants of vegetative vigor, and crop
duration, which affects the ability to recover from early competition, are useful traits in the selection of weed-competitive
rices, particularly in breeding programs that use O. glaberrima. The traits are compatible with high yield potential if cultivars
have large SLA during early developmental stages and small SLA during advanced stages. Major knowledge gaps remain
on weed competitiveness under drought- and ¯ood-prone conditions, which are frequently associated with weed problems.
# 1999 Elsevier Science B.V. All rights reserved.
Keywords: Oryza sativa L.; Oryza glaberrima Steud.; Weed competition; Vigor; Leaf area index; Speci®c leaf area; Mean tip angle;
Extinction coef®cient
Field Crops Research 61 (1999) 79±95
*Corresponding author. E-mail: [email protected]
0378-4290/99/$ ± see front matter # 1999 Elsevier Science B.V. All rights reserved.
P I I : S 0 3 7 8 - 4 2 9 0 ( 9 8 ) 0 0 1 5 2 - X
1. Introduction
Weed competition is a major constraint to rainfed
rice production in West Africa. Yield-gap studies on
farmers' ®elds in various agro-climatic zones in Cote
d'Ivoire revealed that weed competition is the most
important yield-reducing factor, contributing about
50% to the yield gaps, followed in importance by
nitrogen nutrition and pests and diseases (WARDA,
1996; Becker and Johnson, 1997). Current trends
towards shorter fallow periods and more intensive
use of uplands further aggravate weed problems. Due
to the unavailability and limited effectiveness of her-
bicides, and despite the limited availability of labor
(Johnson, 1995; Dingkuhn and Randolph, 1997),
farmers rely largely on hand weeding in combination
with the use of comparatively weed-competitive but
low-yielding traditional O. sativa tropical-japonica
rices. Indigenous O. glaberrima upland rices, which
are highly weed-competitive but low-yielding due to
small panicles, grain shattering and lodging (Kof®,
1980; Dingkuhn et al., 1998; Johnson et al., 1998), have
been largely displaced from the production systems.
Efforts to utilize O. glaberrima genes to improve
Asian rice cultivars have recently intensi®ed after a
breakthrough in interspeci®c hybridization yielded
genetically stable and fully fertile progenies (Jones
et al., 1997a). The sterility barrier, which commonly
prevents interspeci®c breeding beyond the F1 genera-
tion, was partly avoided by selecting parental materi-
als with maximal genetic compatibility, and partly
overcome by backcrossing, anther culture and double-
haploidization (Jones et al., 1997a). On this basis, a
breeding program at the West Africa Rice Develop-
ment Association (WARDA) in Cote d'Ivoire aims at
developing low-management rice plant types for
labor-limited, weed- and drought-prone production
systems. The program seeks to combine the superior
weed competitiveness (Fofana et al., 1995) and resis-
tance to other stresses of O. glaberrima with the
higher yield potential of improved O. sativa tropi-
cal-japonica upland rices (WARDA, 1996; Dingkuhn
et al., 1997a, b).
The present study was conducted to identify mor-
phological properties of rice lines in monoculture that
would be predictive of interspeci®c competitiveness.
The work was based on descriptive studies in mono-
culture and a simultaneously conducted competition
experiment. A wide spectrum of genetic materials was
used to include O. sativa japonica and indica, O.
glaberrima and O. glaberrima � O. sativa interspe-
ci®c progenies.
2. Materials and methods
2.1. Site characteristics and general setup
Three ®eld experiments were conducted on adjacent
plots on an upland rice ®eld at WARDA's research
station at Mbe in Cote d'Ivoire (78520N, 5860W, 300 m
asl). The soil is an al®sol, characterized by loamy sand
texture (22% clay, 31% silt [12% ®ne, 19% coarse],
and 46% sand [23% ®ne, 23% coarse]) and frequent
iron concretions. Plots received supplemental over-
head sprinkler irrigation as necessary to keep the soil
at ®eld capacity.
Experiment 1 was conducted during the 1997 wet
season and served to characterize canopy properties,
growth dynamics and grain yield of 21 rice lines
grown in mono-culture. Experiment 2 was conducted
simultaneously to study the competitiveness with
weeds of a subset of 16 lines. It was part of a larger
trial to screen 100 lines for weed competitiveness.
Experiment 3, which was conducted during the 1996
wet season and repeated during the 1997 wet season,
was similar to experiment 2, but used a further subset
of eight lines. This setup served to determine whether
morphological and agronomic differences among cul-
tivars observed in monoculture (experiment 1) can be
correlated with weed competitiveness (experiments 2
and 3). All sowing dates were uniformly between 17
and 18 June. Weather data are presented in Table 2.
2.2. Experiment 1
Twenty-one diverse rice cultivars and breeding lines
were grown in clean-weeded plots, based on a rando-
mized complete-block design with three replications.
Plants were dry-seeded in moist, harrowed soil at three
to four seeds per hill at 0.25 m spacing and, after
emergence, thinned to two plants per hill.
Plots measured 3 m � 5 m and were fertilized with
a basal application of 40 kg N as urea, 20 kg P as triple
superphosphate and 20 kg K and KCl per hectare; an
additional topdressing of 20 kg N as urea was made at
80 M. Dingkuhn et al. / Field Crops Research 61 (1999) 79±95

Table 1
Summary of selected genetic materials and results of experiment 1 (grain yield at maturity (MAT) and canopy architecture parameters in monoculture at 31, 46 and 64 days after
sowing), experiments 2 and 3 (relative grain yield under competition with natural weeds (WEE), maize (MAI) and the O. glaberrima landrace IG10). Mbe, Cote d'Ivoire
Cultivar/line Stature Origin Observations under monoculture (experiment 1, 1997) Relative yield under competition
DUR
(day)
GY
(t haÿ1)
TN
(mÿ2)
LAI SLA (m2 kgÿ1) Kdf MTA
(deg)
Lp Experiment 2,
1997
Experiment 3,
1996/97
WEE MAI IG10 WEE MAI IG10
MAT MAT MAT 31 46 64 31 46 64 46 46 46 MAT MAT MAT MAT MAT MAT
O. sativa indica (improved lowland)
Bouake 189 Semidwarf Indonesia 126 3.86 329 0.4 1.2 2.3 41 28.8 22 0.5 62 0.5 0.58 0.82 0.58 0.71 0.82 0.52
Suakoko 8 Med.-tall Liberia 145 2.67 335 0.5 1.2 3.96 43 28.1 33 0.6 56 0.5 1.7 1.05 0.41
O. sativa japonica (improved upland)
IDSA 6 Med.-tall Cote d'Ivoire 115 3.22 197 0.3 1.1 1.95 34 23.4 20 0.6 54 0.53 0.93 1.28 0.42 0.68 0.66 0.66
Moroberekana Tall Cote d'Ivoire 126 2.81 112 0.3 1.1 3.37 32 28.2 24 0.6 49 0.56 0.61 1.38 0.83 1.05 0.93 0.88
OS6 Med.-tall Nigeria 116 3.46 182 0.3 1.5 2.26 33 27.6 23 0.5 60 0.5 0.94 0.57 0.73 1.39 0.99 1.13
WAB56-104 Med.-tall Cote d'Ivoire 100 3.52 141 0.2 0.7 1.7 27 20.6 19 0.6 60 0.52 0.49 0.79 0.31 0.33 0.22 0.61
O. glaberrima
(traditional upland)
CG14 Med.-tall Senegal 106 2.67 359 0.5 1.9 4.9 42 31.3 30 0.5 46 0.6 1.25 1.25 0.98 0.98 1.1 0.84
IG10 Med.-tall Cote d'Ivoire 132 2.48 336 0.6 2.4 3.83 47 33.5 26 0.6 48 0.6 1.39 1.61 0.75 1.28 1.31 1.12
WAB56-104 � CG14 hybrids (upland)
WAB450-I-B-P26-1-1 Med.-tall Cote d'Ivoire 113 2.76 169 0.3 1.5 2.09 35 28 22 0.5 50 0.57 0.62 0.65 0.36
WAB450-24-3-2-P18 Tall Cote d'Ivoire 102 3.51 133 0.4 1.3 3.04 37 25 24 0.5 57 0.51 0.63 0.57 0.58 0.65 0.75 0.97
WAB450-I-B-B122-HB Med.-tall Cote d'Ivoire 105 3.12 125 0.4 1.2 2.55 30 26.2 21 0.6 51 0.51 0.67 0.47 0.46
WAB450-11-1-P60-1-2-1 Med.-tall Cote d'Ivoire 100 2.49 140 0.3 0.8 1.35 33 23.5 20 0.4 61 0.49 0.97 0.72 0.64
WAB450-I-B-P37-3-1 Med.-tall Cote d'Ivoire 105 3.12 143 0.3 0.8 1.37 43 25.8 19 0.5 57 0.52 0.23 0.53 0.27
WAB450-6-2-9-MB-2-1 Med.-tall Cote d'Ivoire 100 3 149 0.4 1.1 2.21 24 24.3 22 0.5 59 0.52 0.39 0.22 0.46
WAB450-9-2-6-1-1 Med.-tall Cote d'Ivoire 115 3.87 158 0.3 0.8 1.66 29 21.6 18 0.5 59 0.54 0.92 0.66 0.59
WAB450-16-3-6-1-1 Med.-tall Cote d'Ivoire 119 2.55 225 0.3 1.3 2.77 33 29.5 24 0.5 55 0.53 0.64 1.38 1.08
Mean 114 3.07 202 0.3 1.2 2.58 35 26.6 23 0.5 55 0.53 0.81 0.87 0.59 0.88 0.85 0.84
CV (%) 1 22 18 28 26 30 15 8 12 19 8 7 71 71
S.E. 1 0.4 20.6 0.1 0.2 0.44 3.1 1.2 1.6 0.1 2.6 0.02 0.28 0.24
Number of replications 3 3 4
Number of entries 21 16 8
aMoroberekan is a traditional type.
DUR, duration to maturity; GY, grain yield at 14% MC; TN, tiller number; LAI, leaf area index; SLA, specific leaf area; Kdf, PAR extinction coefficient; MTA, mean tip elevation
angle; Lp, dry matter partitioning to leaves; MAT, maturity.
M.
Din
gku
hn
eta
l./Field
Cro
ps
Resea
rch61
(1999)
79±95
81

55 days after sowing (DAS). Weeds were controlled
by post-emergence herbicide (oxadiazon, 1 kg haÿ1)
and two cycles of manual weeding, 1 and 2 months
after sowing.
The test lines were selected to cover the morpho-
logical and genetic diversity of rices relevant to West
Africa (Table 1) and included: two upland-adapted O.
glaberrima landraces; three lowland-adapted O. sativa
indica cultivars (among them, two `modern' semi-
dwarfs and one medium-tall traditional type, Suakoko
8); three traditional, upland, O. sativa tropical-japo-
nica types; three improved, upland, O. sativa tropical-
japonica types; and 10 stable and fertile, O. sativa
tropical-japonica (WAB56-104) � O. glaberrima
(CG14) interspeci®c hybrids selected from breeder's
trials for morphological diversity. In addition, the
creeping, leguminous weed Mucuna pruriens var utilis
was included to provide for an extreme architectural
type for canopy structure measurements.
At 31, 46 and 64 DAS, above-ground growth para-
meters and canopy properties were measured on all
plots. Dry weights (dw) were determined destructively
from six hills per plot separately for stems (culm and
sheath) and green leaf blades. Leaf area index (LAI)
was measured destructively for six hills using an LI-
3000 (LI-COR, Lincoln, Nebraska) leaf area meter,
and non-destructively, with the LI-COR LAI2000
canopy analyzer. The combined area of leaf blades
and stems (SLAI) was determined by separate area
measurements for stems using the LI-3000 area meter.
To avoid errors in non-destructive LAI measure-
ments caused by direct solar radiation (LI-COR,
1989), measurements with the LAI2000 were con-
ducted only at dawn or, if the sky was completely
overcast, during the day. Independent measurements
conducted on breeder's plots gave a good agreement
between direct (destructive) and indirect (LAI-2000)
measurements (Y � 0.03 � 1.04X; R2 � 0.83;
N � 34; LAI range 0.5±2.0); and between PAR inter-
ception measurements with the LAI2000 (reciprocal
of the instrument output parameter `difn') and mea-
surements using conventional, ¯at PAR interceptors
(SOLEMS, Palaiseau, France; length 0.6 m, range
400±750 nm) placed diagonally through the rectangle
formed by six hills (Y � ÿ0.08 � 1.09X; R2 � 0.90;
range 0.2±0.75). The LAI2000 equipment was used to
simultaneously measure LAI, PAR transmission and
mean tip elevation angle (MTA).
The PAR extinction coef®cient for diffuse light
(Kdf), which is thought to be between 0.4 and 0.6
for rice (Kropff et al., 1994), was calculated from PAR
transmission and LAI using the following equation,
under the assumption that re¯ectance of the canopy
was 0.06 (Kropff and van Laar, 1993; Wopereis et al.,
1996):
Kdf � ÿln�0:94 PAR transmission�LAIÿ1
Kdf was calculated for individual datasets using
destructively measured LAI and the `difn' parameter
of the LA2000 canopy analyzer (Table 1), and across
lines, dates and replications, by regressing ÿln(PAR
transmission) vs. LAI (Fig. 1). Fig. 1(c) and (f) pre-
sents the results of Kdf calculations using six different
combinations of input parameters for the Kdf calcula-
tions (destructive or non-destructive LAI, PAR trans-
mission measured with interceptor bars or with
LAI2000, area values including stems [SLAI] or
excluding stems [LAI]). Differences between trans-
mission measurements using bars or LAI2000 were
small, but the exclusion of stem area led to a marked
increase in Kdf. Calculation of Kdf using exclusively
parameters measured by LAI2000 gave even larger
values. The Kdf based on destructive SLAI and the
transmission measured with LAI2000 (`difn' para-
meter) are henceforth used because it gave the best
agreement with published data for rice (Kropff and
van Laar, 1993; Casanova et al., 1998), and because it
differentiated well between Mucuna and rice. It
remains unclear, however, which combination of para-
meters provides the most accurate results.
Light penetration pro®les through the canopy were
conducted with PAR interceptor bars in 10 cm hight
movements for each plot and sampling date, and
strictly under overcast sky conditions. Speci®c leaf
area (SLA) was calculated on the basis of LAI and leaf
dw. Results obtained with destructive and non-
destructive LAI measurements were similar, and only
the former are reported. Plant height and tiller number
were measured and averaged for six hills per plot.
At maturity, yield and yield components were
determined from 5 m2 per plot following methods
described by Dingkuhn et al. (1998). Graphic repre-
sentations and calculations of con®dence intervals for
regressions were conducted with SIGMA-PLOT 1.03
(Jandel Scienti®c, Erkrath, Germany, 1994). ANOVA
analyses were conducted with MSTATC software.
82 M. Dingkuhn et al. / Field Crops Research 61 (1999) 79±95

2.3. Experiment 2
In the 1997 screening experiment for weed compe-
titiveness, 100 rice lines, comprising O. glaberrima,
O. sativa and interspeci®c hybrids, were sown in
single rows 1.5 m long. Only the results for 16 lines
(Table 1) that were also studied in experiment 1 are
presented. The rows were bordered on either side with
a spacing of 0.25 m by rows of the same lines, natural
weed growth, O. glaberrima (IG10) or the local maize
cultivar Bouake 9449SR. The experiment was a split-
plot design with competitors as main plots and test
cultivars as sub-plots and there were three replicates.
Weed growth was controlled by an application 0.75 kg
Fig. 1. Determination of the PAR extinction coefficient (Kdf) by regressing ln of diffuse PAR transmission, with an estimated 6% reflection
subtracted, against leaf area index (LAI); for each of four genetic rice groups (Fig. 1(a)±(d); details in Table 1); and across all 21 test lines
(Fig. 1(e) and (f)), using data from experiment 1. Kdf is -(slope) of the relationships. Fig. 1(e) and (f) compares different methodologies for Kdf
determination, using the LAI2000 fisheye system (output parameter `difn') or interceptor bars (LTR) to measure relative PAR transmission;
and indirectly (LAI2000) or destructively measured LAI or stem-and-leaf area index (SLAI). Lines indicate linear regressions, in Fig. 1(e) and
(f) with 0.05-confidence intervals. DAS, days after sowing. Mbe, Cote d'Ivoire, 1997 wet season.
M. Dingkuhn et al. / Field Crops Research 61 (1999) 79±95 83

oxadiazon per hectare after sowing, except for 0.25 m
strips with intended weed growth that were shielded
during the herbicide application. Maize caused exces-
sive shading and was removed at 50 DAS. Prior to
sowing, a basal fertilizer dose of 20 kg P haÿ1 as triple
superphosphate was applied, and 46 kg N haÿ1 as urea
was applied at 28 and 56 DAS. Yields were obtained
from 1 m of the central row, and were expressed as
yields of rice grown with competitors relative to the
yield in the monoculture treatments.
2.4. Experiment 3
In a second screening experiment conducted during
the 1996 wet season and repeated in 1997 (Table 2),
14 rice cultivars comprising O. glaberrima, O. sativa
and interspeci®c hybrids, were sown in single rows
2.5 m long. The rows were bordered on either side at a
spacing of 0.25 m by rows of the same cultivar, natural
weed growth, O. glaberrima (IG10), or maize. The
design and management were the same as for experi-
ment 2, except that there were four replicates each
year. The results for eight lines, which were also
studied in experiments 1 and 2, are presented here
(Table 1). Data for the 2 years were averaged.
3. Results and discussion
3.1. Canopy properties and agronomic performance
in monoculture (experiment 1)
The 21 lines matured between 100 and 145 DAS
and produced between 96 and 364 surviving tillers
mÿ2 and between 2.5 and 3.9 t grain per hectare at
maturity (Table 1). The highest tiller numbers were
observed for lowland-adapted O. sativa indica rices
(329±364) and O. glaberrima upland rices (336±359).
Upland-adapted O. sativa japonica cultivars produced
between 112 (traditional-tall Moroberekan) and 197
tillers mÿ2 (improved IDSA 6), and interspeci®c O.
sativa � O. glaberrima hybrids produced between 96
and 225 tillers mÿ2. The highest yields (�3.5 t haÿ1)
were observed in locally cultivated cultivars, namely
an O. sativa indica (Bouake 189) and two O. sativa
japonica cultivars (WAB56-104 and Iguape Cateto).
Two interspeci®c hybrids also yielded over 3.5 t haÿ1,
whereas the two O. glaberrima cultivars yielded only
2.5 and 2.7 t haÿ1.
The greatest LAI was observed at 64 DAS for the
two O. glaberrima cultivars CG14 (4.9) and IG10
(3.8) and the long-duration indica type Suakoko 8
(4.0). IG10 has been previously described as being
highly competitive with weeds, while IDSA6 and
WAB56-104 have been described as relatively poor
competitors (Johnson et al., 1997). WAB56-104 and
IDSA6, both improved O. sativa japonica types,
developed LAIs of only 1.5 and 2.0, respectively.
SLA decreased gradually in most lines between 31
and 64 DAS and was comparatively uniform among
the O. sativa japonica and O. glaberrima upland
groups, but varied widely among the interspeci®c
hybrids. SLA, which has previously been found to
be strongly related to vegetative growth vigor and LAI
(Dingkuhn et al., 1998), was generally greatest in the
O. glaberrima and O. sativa indica groups. The two
parents of the interspeci®c crosses, WAB56-104 and
CG14, had the smallest and greatest mean SLA among
the test lines (hybrids excluded), which probably
explains the heterogeneity of SLA among the hybrids.
Kdf, as determined for individual plots and sampling
dates by destructive area determination for SLAI and
independent measurements of diffusive light transmis-
sion (difn) using the LAI2000 canopy analyzer, varied
Table 2
Weather data for the wet season 1997 as monthly means (cumulative for rainfall) at the experimental site at Mbe, Cote d'Ivoire
Period T (max) T (min) Rs Wind ETo Epan Rainfall
8C 8C MJ m sÿ1 mm mm mm
June 31.0 21.4 14.4 0.8 4.2 2.9 134
July 29.7 21.2 12.6 0.8 3.8 2.6 81
August 30.9 21.3 13.3 0.6 4.0 2.8 13
September 32.7 21.5 13.5 0.4 4.1 3.1 39
October 33.7 21.7 16.0 0.4 5.5 4.5 154
T, air temperature at 2 m; Rs, solar radiation; ETo, Penman evaporation; Epan, class-A pan evaporation.
84 M. Dingkuhn et al. / Field Crops Research 61 (1999) 79±95
between 0.29 and 0.64 among lines and sampling
dates, with no apparent pattern in relation to genetic
groups. Similar values (0.44 to 0.65; Fig. 1) were
obtained when Kdf was determined across genetic
groups by linear regression (ln[0.94 difn] vs. SLAI),
following the approach described by Casanova et al.
(1998). Measurements of Kdf were highly sensitive to
methodology, however, and depended on the inclusion
of stems in the area determinations, the choice of
destructive or non-destructive (LAI2000 analyzer)
area measurements, and PAR transmission measure-
ments with either the LAI2000 ®sheye system or
conventional interceptor bars. The combination of
destructive measurements of SLAI and the difn para-
meter of the canopy analyzer is used hereafter in this
report.
The mean elevation angle of leaf tips (MTA;
Table 1), varied between 468 (CG14) and 628 (Bouake
189) at 46 DAS; the smallest values were found in the
two O. glaberrima cultivars and the traditional tropi-
cal-japonica upland cultivar, Moroberekan, which are
known for having comparatively lax leaves. The
leaves of the O. glaberrima landraces were bent along
the entire length of the blades, whereas those of
Moroberekan were mainly bent towards the tip.
Two interspeci®c hybrids, WAB450-I-B-P26-1-1
and WAB450-I-B-B122-HB, which have been speci-
®cally selected for droopy leaves, had a similar MTA
(508 and 518, respectively).
Partitioning ratios for dry matter between 31 and 46
DAS (dw increase for leaf blades over the increase of
the total above-ground dw) were greatest for the two
O. glaberrima cultivars (0.60) and the smallest for the
three O. sativa indica lines (0.50). Comparatively high
leaf partitioning ratios have previously been reported
for O. glaberrima cultivars (Dingkuhn et al., 1997b;
Johnson et al., 1998).
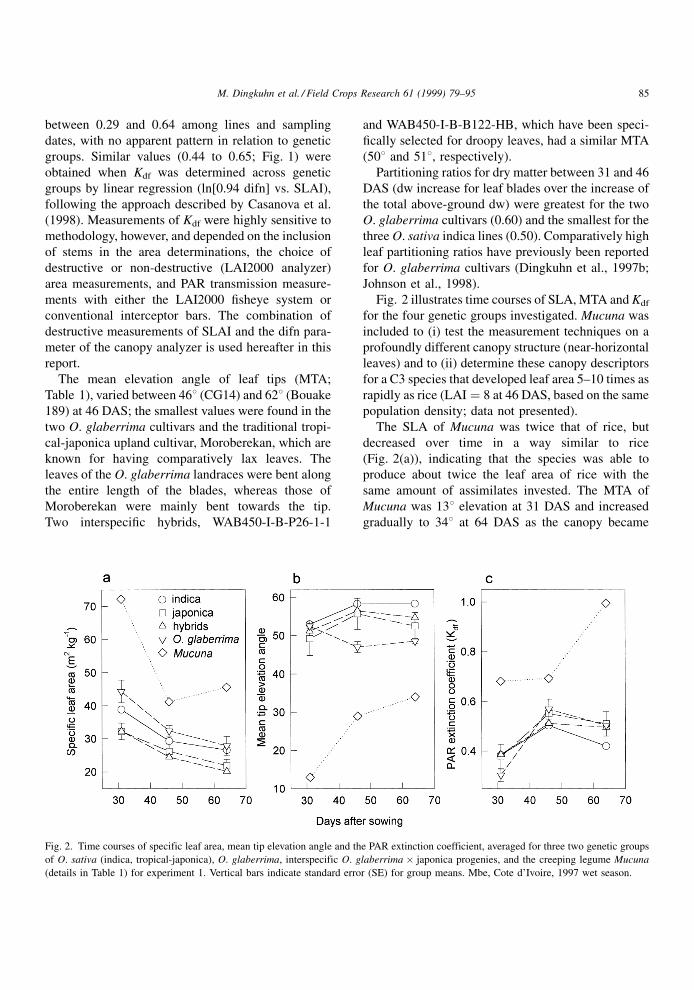
Fig. 2 illustrates time courses of SLA, MTA and Kdf
for the four genetic groups investigated. Mucuna was
included to (i) test the measurement techniques on a
profoundly different canopy structure (near-horizontal
leaves) and to (ii) determine these canopy descriptors
for a C3 species that developed leaf area 5±10 times as
rapidly as rice (LAI � 8 at 46 DAS, based on the same
population density; data not presented).
The SLA of Mucuna was twice that of rice, but
decreased over time in a way similar to rice
(Fig. 2(a)), indicating that the species was able to
produce about twice the leaf area of rice with the
same amount of assimilates invested. The MTA of
Mucuna was 138 elevation at 31 DAS and increased
gradually to 348 at 64 DAS as the canopy became
Fig. 2. Time courses of specific leaf area, mean tip elevation angle and the PAR extinction coefficient, averaged for three two genetic groups
of O. sativa (indica, tropical-japonica), O. glaberrima, interspecific O. glaberrima � japonica progenies, and the creeping legume Mucuna
(details in Table 1) for experiment 1. Vertical bars indicate standard error (SE) for group means. Mbe, Cote d'Ivoire, 1997 wet season.
M. Dingkuhn et al. / Field Crops Research 61 (1999) 79±95 85
crowded and leaves were physically forced into arbi-
trary positions (visual observations), whereas MTA of
rice was comparatively constant. Among the genetic
groups of rice, the O. sativa japonica and indica
groups, as well as the interspeci®c progenies, had
lower MTA at 31 DAS than thereafter (corresponding
to a visibly laxer foliage for seedlings than for plants at
tillering stage (46 and 64 DAS), whereas no such
change was observed for the two O. glaberrima land-
races.
The Kdf of rice for individual plots and dates was
mostly below 0.4 at 31 DAS (Fig. 2(c)) and increased
to values between 0.5 and 0.6 at 46 DAS, whereas that
of Mucuna was about 0.7 at 31 and 46 DAS, and
increased to nearly 1.0 at 64 DAS, indicating that the
canopy behaved like a single, horizontal and opaque
sheet. The relatively low Kdf observed for seedlings of
all species (31 DAS) was probably not due to leaf
elevation angle (which was rather small at that stage),
but to gaps in the canopy resulting from the 0.25 m
spaces between hills (Kropff and van Laar, 1993).
Regression-based calculations of Kdf did not show a
markedly lower Kdf at 31 DAS (Fig. 1).
In summary, the canopies of genetically and agro-
ecologically diverse rices revealed strong commonal-
ities when compared with a contrasting type such as
Mucuna (Fig. 2), although differences were evident
between the two upland rice groups, O. glaberrima
and O. sativa japonica. The O. glaberrima cultivars
were among the lines with the lowest grain yields,
highest tiller numbers, greatest SLA, lowest MTA and
highest leaf partitioning ratios for dry matter. The
interspeci®c progenies varied widely in all parameters
but were mostly, with a few notable exceptions, closer
to the O. sativa japonica parental group than to O.
glaberrima, probably because the main selection cri-
teria in the breeding program had been yield potential
at various input levels, and not weed competitiveness.
3.2. Profiles of PAR penetration and time courses of
shading (experiment 1)
The ability of a rice crop to deprive a competitor of
light resources depends on interception of PAR at the
highest stratum attained by the foliage of the compe-
titor. Taller growth may in some cases be the most
effective strategy, but more assimilates are required to
achieve a given light interception at a greater height.
Four examples of PAR penetration pro®les through
the canopy, as well as the optical density distribution
derived from these, are presented in Fig. 3. At 31
DAS, the density of all canopies was greatest near the
ground and tailed off to the top. That pattern was
associated with very erect top (young) leaves and lax
lower leaves. This density distribution was observed
also at 46 and 64 DAS for the three O. sativa indica
lines (exempli®ed by Bouake 189), allowing deep
light penetration into an erect foliage. By contrast,
in the traditional upland rice Moroberekan, a sharp
density maximum was located at mid-height of the
canopy, resulting from the broad, long and lax leaves.
The O. glaberrima CG14 had a near-normal (Gaus-
sian) distribution of canopy density on the vertical
pro®le (Dingkuhn et al., 1997a) owing to a large
number of tillers inserting at different angles and
lax leaves. Different canopy architectures were found
among the interspeci®c progenies. Some had an archi-
tecture resembling that of maize with a broad plateau-
like maximum of canopy density at mid-height
(Fig. 3, bottom).
The different canopy architectures translated into
diverse patterns over time of PAR interception at any
given distance from the ground (Fig. 4). At 31 DAS,
no rice cultivar intercepted more than 20% of PAR at
ground level, whereas Mucuna intercepted about 50%
PAR. At 46 DAS, differences between rice lines
emerged, with the O. glaberrima landraces, CG14
and IG10, intercepting more light than the other lines
at 0 and 20 cm above ground. At 40 cm, however,
these landraces lost some of their advantage due to
their intermediate height. At 64 DAS, the short-sta-
tured and erect-leaved Bouake 189 achieved only 25%
light interception at 40 cm, whereas the other rices
intercepted between 50 and 70%.
The behavior of three interspeci®c progenies
selected by the breeder for their vegetative vigor
was intermediate to that of their parents (Fig. 4,
bottom row), but these lines had no advantage relative
to the tall-traditional, japonica cultivar Moroberekan.
Consequently, breeding for progenies having much
of the lea®ness and vigor of O. glaberrima rices was
partially successful, but the choice of the poorly weed
competitive WAB56-104 as O. sativa parent was
not optimal. In fact, parent selection in this recent
interspeci®c breeding program was initially more
driven by genetic compatibility than potentiality
86 M. Dingkuhn et al. / Field Crops Research 61 (1999) 79±95

as donor for weed competitiveness (Jones et al.,
1997a, b).
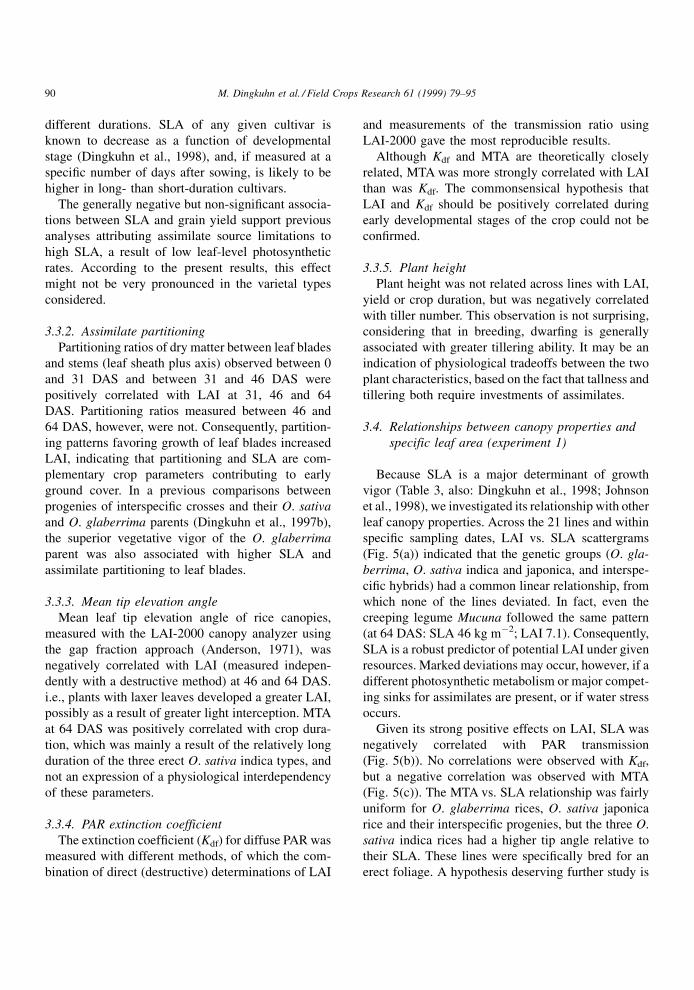
3.3. Relationships between crop performance and
canopy architecture (experiment 1)
A correlation matrix across lines between canopy
architectural properties and growth parameters
(Table 3) revealed signi®cant parameter relationships,
some of which depended on the developmental stage
of the crop. The most important ones are discussed
below.
3.3.1. Specific leaf area
The most consistent and generally positive correla-
tions (P � 0.05) across development stages were
Fig. 3. Profiles of diffuse PAR transmission (left) and PAR extinction per 10 cm stratum (fraction of incoming PAR; right) for four contrasting
rice cultivars (details in Table 1) at 31, 46 and 64 days after sowing (DAS) in experiment 1. Schematic drawings indicate the visually observed
architecture of the cultivars at 64 DAS. Mbe, Cote d'Ivoire, 1997 wet season.
M. Dingkuhn et al. / Field Crops Research 61 (1999) 79±95 87

observed between SLA and LAI at three sampling
dates, tiller number at maturity, and crop duration.
Correlations between SLA and yield were generally
negative, but not signi®cant. Among these correla-
tions, the SLA vs. LAI relationships, which were
signi®cant both within and across sampling dates,
are consistent with previous reports (Dingkuhn et
al., 1997a, b) and can be readily explained on a
physiological basis. A high SLA reduces the amount
of assimilates needed to produce a given leaf area,
resulting in earlier ground cover, and therefore, a
greater light harvest and higher canopy photosynthesis
rates early in the season.
The same principle might have been responsible for
the positive correlations between SLA and tiller num-
ber, as tillering depends on the daily assimilate sur-
plus, and therefore, on the relative growth rate of the
crop (Schnier et al., 1990; Dingkuhn et al., 1991).
Across lines, however, this relationship was certainly
confounded by genetic tillering abilities and SLA. The
present observed correlation between SLA during
vegetative growth and tiller number at maturity was
partly due to the inclusion of diverse genetic groups in
the experiment, such as short-statured and high-tiller-
ing O. sativa indica types (high-SLA), extremely high-
tillering O. glaberrima types (high-SLA) and low-
tillering O. sativa japonica types (frequently, low-
SLA).
The correlations between SLA and crop duration
are likely to have a phenological basis as SLA obser-
vations made at common dates necessarily correspond
to different developmental stages in lines having
Fig. 4. Time courses of diffuse PAR at ground level and 20 cm and 40 cm heights (fraction of ambient PAR), for seven rice cultivars
(including the interspecific progenies WAB450-24-3-2-P18 (1) and WAB450-I-B-B122-HB (2); details in Table 1) and the creeping legume
Mucuna grown in monoculture in experiment 1. Vertical bars indicate standard error (SE) across cultivars. Mbe, Cote d'Ivoire, 1997 wet
season.
88 M. Dingkuhn et al. / Field Crops Research 61 (1999) 79±95

Table 3
Correlation matrix across 21 rice lines for descriptors of canopy architecture observed at 31, 46 and 64 days after sowing (DAS) (horizontal) vs. leaf area index (LAI) at 31, 46 and
64 DAS; and tiller number, grain yield and crop duration at maturity (MAT) in experiment 1
Specific leaf area Leaf partitioning ratio Mean tip elevation angle Extinction coefficient (Kdf) Plant height
31 DAS 46 DAS 64 DAS 31 DAS 46 DAS 64 DAS 31 DAS 46 DAS 64 DAS 31 DAS 46 DAS 64 DAS 31 DAS 46 DAS 64 DAS
LAI (31 DAS) 0.51 0.55 0.53 0.52 0.33 0.21 0.28 ÿ0.4 ÿ0.4 ÿ0.41 0.47 ÿ0.16 ÿ0.22 0.07 ÿ0.04
LAI (46 DAS) 0.49 0.81 0.68 0.63 0.63 0.42 0.12 ÿ0.65 ÿ0.44 ÿ0.15 0.26 0 ÿ0.32 ÿ0.21 ÿ0.04
LAI (64 DAS) 0.51 0.62 0.87 0.48 0.58 0.3 0.17 ÿ0.68 ÿ0.51 ÿ0.27 0.44 ÿ0.51 ÿ0.19 ÿ0.09 0.12
Tillers (MAT) 0.61 0.73 0.72 0.2 0.27 0.16 ÿ0.12 ÿ0.24 0.06 0.06 ÿ0.02 ÿ0.29 ÿ0.54 ÿ0.56 ÿ0.59
Yield (MAT) ÿ0.26 ÿ0.41 ÿ0.27 ÿ0.41 ÿ0.27 ÿ0.13 0.25 0.47 0.49 0 ÿ0.01 ÿ0.07 0.22 ÿ0.23 0.15
Duration (MAT) 0.48 0.62 0.63 0.23 0.1 0.44 0.17 ÿ0.18 ÿ0.14 0.01 0.17 ÿ0.32 ÿ0.18 ÿ0.16 ÿ0.3
Critical R (1-tail) for P � 0.05 0.37
Critical R (2-tail) for P � 0.05 0.43
Significant (P < 0.05) correlations are in bold print. Mbe, Cote d'Ivoire, 1997 wet season.
M.
Din
gku
hn
eta
l./Field
Cro
ps
Resea
rch61
(1999)
79±95
89
different durations. SLA of any given cultivar is
known to decrease as a function of developmental
stage (Dingkuhn et al., 1998), and, if measured at a
speci®c number of days after sowing, is likely to be
higher in long- than short-duration cultivars.
The generally negative but non-signi®cant associa-
tions between SLA and grain yield support previous
analyses attributing assimilate source limitations to
high SLA, a result of low leaf-level photosynthetic
rates. According to the present results, this effect
might not be very pronounced in the varietal types
considered.
3.3.2. Assimilate partitioning
Partitioning ratios of dry matter between leaf blades
and stems (leaf sheath plus axis) observed between 0
and 31 DAS and between 31 and 46 DAS were
positively correlated with LAI at 31, 46 and 64
DAS. Partitioning ratios measured between 46 and
64 DAS, however, were not. Consequently, partition-
ing patterns favoring growth of leaf blades increased
LAI, indicating that partitioning and SLA are com-
plementary crop parameters contributing to early
ground cover. In a previous comparisons between
progenies of interspeci®c crosses and their O. sativa
and O. glaberrima parents (Dingkuhn et al., 1997b),
the superior vegetative vigor of the O. glaberrima
parent was also associated with higher SLA and
assimilate partitioning to leaf blades.
3.3.3. Mean tip elevation angle
Mean leaf tip elevation angle of rice canopies,
measured with the LAI-2000 canopy analyzer using
the gap fraction approach (Anderson, 1971), was
negatively correlated with LAI (measured indepen-
dently with a destructive method) at 46 and 64 DAS.
i.e., plants with laxer leaves developed a greater LAI,
possibly as a result of greater light interception. MTA
at 64 DAS was positively correlated with crop dura-
tion, which was mainly a result of the relatively long
duration of the three erect O. sativa indica types, and
not an expression of a physiological interdependency
of these parameters.
3.3.4. PAR extinction coefficient
The extinction coef®cient (Kdf) for diffuse PAR was
measured with different methods, of which the com-
bination of direct (destructive) determinations of LAI
and measurements of the transmission ratio using
LAI-2000 gave the most reproducible results.
Although Kdf and MTA are theoretically closely
related, MTA was more strongly correlated with LAI
than was Kdf. The commonsensical hypothesis that
LAI and Kdf should be positively correlated during
early developmental stages of the crop could not be
con®rmed.
3.3.5. Plant height
Plant height was not related across lines with LAI,
yield or crop duration, but was negatively correlated
with tiller number. This observation is not surprising,
considering that in breeding, dwar®ng is generally
associated with greater tillering ability. It may be an
indication of physiological tradeoffs between the two
plant characteristics, based on the fact that tallness and
tillering both require investments of assimilates.
3.4. Relationships between canopy properties and
specific leaf area (experiment 1)
Because SLA is a major determinant of growth
vigor (Table 3, also: Dingkuhn et al., 1998; Johnson
et al., 1998), we investigated its relationship with other
leaf canopy properties. Across the 21 lines and within
speci®c sampling dates, LAI vs. SLA scattergrams
(Fig. 5(a)) indicated that the genetic groups (O. gla-
berrima, O. sativa indica and japonica, and interspe-
ci®c hybrids) had a common linear relationship, from
which none of the lines deviated. In fact, even the
creeping legume Mucuna followed the same pattern
(at 64 DAS: SLA 46 kg mÿ2; LAI 7.1). Consequently,
SLA is a robust predictor of potential LAI under given
resources. Marked deviations may occur, however, if a
different photosynthetic metabolism or major compet-
ing sinks for assimilates are present, or if water stress
occurs.
Given its strong positive effects on LAI, SLA was
negatively correlated with PAR transmission
(Fig. 5(b)). No correlations were observed with Kdf,
but a negative correlation was observed with MTA
(Fig. 5(c)). The MTA vs. SLA relationship was fairly
uniform for O. glaberrima rices, O. sativa japonica
rice and their interspeci®c progenies, but the three O.
sativa indica rices had a higher tip angle relative to
their SLA. These lines were speci®cally bred for an
erect foliage. A hypothesis deserving further study is
90 M. Dingkuhn et al. / Field Crops Research 61 (1999) 79±95

that the comparative laxness (smaller MTA) of leaves
with high SLA is partly due to greater mechanical
¯exibility.
3.5. Competitiveness with natural and simulated
weeds (experiments 2 and 3)
In experiment 2, the relative grain yields of 16 lines
(subset from experiment 1) were determined under
interspeci®c competition and expressed as a fraction
of yields under monoculture in the same experiment
(Table 1). The competitors were chosen to create
contrasting competition environments: (1) natural
weed growth of the site dominated by the grass
Digitaria horizontalis during the ®rst month, gradu-
ally replaced by broadleaf species (Synedrella nodi-
¯ora, Ageratum conyzoides and other Compositae
species thereafter); (2) maize rows removed at 50
DAS to simulate intense initial competition for
resources, after which cultivars could demonstrate
their recovery ability; and (3) the O. glaberrima land-
race IG10, which, with its high vigor, tillering rate and
long duration, simulates a continuous pressure from a
grassy weed ¯ora.
In competition with the natural weed ¯ora, the
greatest relative yields were observed for Suakoko 8
(1.70), a highly weed-competitive, traditional, O.
sativa indica cultivar; and in the two O. glaberrima
landraces (IG10, 1.39; CG14, 1.25). Yields of these
cultivars increased when their neighboring rows were
substituted with natural weeds. The same three culti-
vars had the largest LAI in experiment 1 under mono-
culture. By contrast, two interspeci®c progenies and
their O. sativa parent, WAB56-104, had relative yields
of less than 0.5, indicating a >50% reduction. CG14
and IG10 have previously been identi®ed as being
good weed competitors, and WAB56-104 as being
poorly competitive (Fofana et al., 1995; Johnson et al.,
1997).
Under competition with maize sown simulta-
neously, and removed at 50 DAS, the greatest relative
yields were observed for IG10 (1.61), followed by the
traditional, tall upland cultivar Moroberekan and the
interspeci®c progeny WAB450-16-3-6-1-1 (both
1.38). These three cultivars had the longest durations
within their respective genetic groups, indicating that
late maturity provided a decisive advantage under
severe, but temporary competition. All other interspe-
Fig. 5. Relationships between leaf area index (a), PAR transmission at ground level (b) and mean tip elevation angle (c) vs. specific leaf area
at 31, 46 and 64 days after sowing (DAS) in experiment 1, across 21 diverse rice cultivars. Solid lines indicate linear regressions and dotted
lines, 0.05-confidence intervals. Mbe, Cote d'Ivoire, 1997 wet season.
M. Dingkuhn et al. / Field Crops Research 61 (1999) 79±95 91

ci®c progenies (relative yields between 0.22 and 0.72)
competed poorly with maize, possibly because of their
early maturity.
Except CG14 and the same interspeci®c progeny
that competed well with maize, the competitiveness of
none of the test lines was equal or better than IG10, the
most weed-competitive O. glaberrima cultivar so far
identi®ed. When competing with itself, the center row
of IG10 lodged, thus explaining the its low relative
yield (0.75).
For comparison, results of an identical competition
trial using a subset of eight cultivars in 1996 and 1997
are also presented in Table 1. Again, IG10 and CG14
were the best competitors across environments, and
WAB56-104 was among the poorest. In summary, the
two O. glaberrima landraces competed consistently
well across the three treatments and 2 years. Other
cultivars performed well in speci®c environments,
such as Suakoko 8 in the neighborhood of natural
weeds.
3.6. Determinants of weed competitiveness
(experiment 1 vs. 2 and 3)
A major objective of the study was to identify crop
parameters under monoculture that would be predic-
tive of competitiveness in mixed stands. A correlation
matrix between crop architectural and agronomic
parameters under monoculture vs. actual competitive-
ness with three species (natural weed ¯ora, maize, O.
glaberrima cv. IG10.) is presented in Table 4. The
parameters most predictive of weed competitiveness
were LAI (positive), SLA (positive), tiller number
(positive) and crop duration (positive). Wherever leaf
partitioning ratios were correlated with competitive-
ness (46 and 64 DAS, with maize as competitor), the
slope was also positive. The mean tip angle was
generally negatively correlated with competitiveness
(signi®cant only at 46 DAS), indicating that lax leaf
canopies compete better with weeds than erect ones.
No signi®cant correlations were observed for Kdf,
except for 31 DAS in experiment 3.
Patterns of parameters predictive of competitive-
ness differed between competition treatments (natural
weeds, maize, IG10). MTA (46 DAS) and leaf parti-
tioning ratios (46 and 64 DAS) were signi®cantly
correlated only with competitiveness with maize
whereas LAI and SLA were correlated with competi-
tiveness in all treatments (but not necessarily at all
dates). Tiller number and crop duration in monocul-
ture were correlated with competitiveness with natural
weeds and maize, but not with IG10. This might have
been a result of the high tillering ability and duration
of IG10 (Table 1), a `strategy' that could possibly not
be beaten by rice lines having the same properties. The
advantage of long crop duration and high tiller number
under competition with maize was due to the fact that
maize was removed at 50 DAS, thus giving an advan-
tage to rice lines that were capable of compensatory
tillering and vegetative growth.
Crop parameters that correlated positively with
competitiveness, correlated negatively, although not
signi®cantly, with yield under monoculture, and vice
versa (compare Tables 3 and 4). This ®nding indicates
that there were tradeoffs between weed competitive-
ness and yield potential for all traits measured. To
reduce these tradeoffs, Jones et al. (1997a, b) proposed
selecting cultivars having high SLA to improve com-
petitiveness with weeds during vegetative growth.
Such leaves would be replaced with erect leaves
having low SLA and high chlorophyll content during
the reproductive growth period.
Stepwise, linear, multiple regression analyses were
conducted for canopy architectural properties vs.
competitiveness (means of competition treatments)
(Table 5). SLA ®gured signi®cantly in all models,
whereas plant height was generally rejected. Kdf
and MTA were rejected in all models that were based
on individual sampling dates, but were retained in the
model using averaged canopy observations for the
vegetative growth period (31 and 46 DAS). Dry matter
partitioning to leaves ®gured only in the model cor-
relating monoculture observations at 64 DAS with
competitiveness, but this effect might be partially a
result of a physiological linkage of leaf partitioning
ratios with crop duration during advanced growth
stages. Dynamics of partitioning are commonly seen
as a function of developmental stage and not time, and
lines with longer duration competed well with maize
due to their ability to recover after maize was
removed.
The overall model predicting mean competitiveness
(across competitor species) with averaged canopy
observations during the vegetative growth period
had a probability of 0.0004, and included SLA (posi-
tive), MTA (negative) and Kdf (positive) as predictor
92 M. Dingkuhn et al. / Field Crops Research 61 (1999) 79±95

Table 4
Correlation matrix across rice lines for descriptors of canopy structure and grain yield observed in monoculture (experiment 1) vs. competitiveness (yield under competition/
monoculture treatments) in Experiment 2 (16 entries) and Experiment 3 (8 entries)
Experiment Competitor Leaf area index Leaf partitioning ratio Specific leaf area Mean tip elevation angle
31 DAS 46 DAS 64 DAS 31 DAS 46 DAS 64 DAS 31 DAS 46 DAS 64 DAS 31 DAS 46 DAS 64 DAS
2 Natural weeds 0.52 0.51 0.62 0.36 0.27 0.22 0.5 0.41 0.7 ÿ0.08 ÿ0.31 ÿ0.06
2 Maize 0.3 0.52 0.57 0.27 0.58 0.64 0.48 0.57 0.44 ÿ0.19 ÿ0.56 ÿ0.44
2 IG10 0.23 0.5 0.55 0.23 0.4 0.27 0.13 0.57 0.37 ÿ0.28 ÿ0.34 ÿ0.43
2 Mean 0.45 0.63 0.72 0.37 0.52 0.48 0.5 0.63 0.64 ÿ0.21 ÿ0.51 ÿ0.37
3 Natural weeds 0.58 0.72 0.46 0.52 0.4 0.53 0.43 0.76 0.57 0.53 ÿ0.41 ÿ0.36
3 Maize 0.87 0.9 0.73 0.59 0.6 0.53 0.79 0.95 0.79 0.78 ÿ0.61 ÿ0.41
3 IG10 0.52 0.66 0.43 0.57 0.34 0.18 0.3 0.49 0.49 0.2 ÿ0.37 ÿ0.42
3 Mean 0.72 0.83 0.59 0.6 0.49 0.48 0.57 0.82 0.67 0.58 ÿ0.51 ÿ0.42
Experiment Competitor Extinction coefficient (Kdf) Plant
height
Tillers
maturity
Yield
maturity
Duration
maturity
31 DAS 46 DAS 64 DAS 31 DAS 46 DAS 64 DAS
2 Natural weeds ÿ0.38 0.31 ÿ0.22 ÿ0.46 ÿ0.43 ÿ0.29 0.67 ÿ0.38 0.56 Critical R (P � 0.05):
2 Maize 0.06 0.38 ÿ0.1 ÿ0.14 ÿ0.24 0.02 0.54 ÿ0.47 0.53 1-tail 0.43
2 IG10 0.25 0.08 ÿ0.23 0.06 ÿ0.17 0.25 0.34 ÿ0.35 0.17 2-tail 0.49
2 Mean ÿ0.08 0.35 ÿ0.21 ÿ0.27 ÿ0.37 ÿ0.05 0.67 ÿ0.51 0.57 N 16
3 Natural weeds ÿ0.76 0.04 0.07 ÿ0.05 ÿ0.4 0.03 0.29 ÿ0.53 0.6 Critical R (P � 0.05):
3 Maize ÿ0.69 0.08 0.1 ÿ0.26 ÿ0.3 ÿ0.05 0.58 ÿ0.64 0.63 1-tail 0.63
3 IG10 ÿ0.91 0.1 ÿ0.13 0.23 ÿ0.08 0.44 ÿ0.04 ÿ0.5 0.21 2-tail 0.7
3 Mean ÿ0.86 0.08 0 ÿ0.06 ÿ0.31 0.11 0.33 ÿ0.61 0.56 N 8
Significant correlations (P < 0.05) in bold italic print. Mbe, Cote d'Ivoire.
M.
Din
gku
hn
eta
l./Field
Cro
ps
Resea
rch61
(1999)
79±95
93

variables. Consequently, rice lines with thin and lax
leaves and a high extinction coef®cient were the best
competitors.
4. Conclusions
Our study con®rmed that the O. glaberrima land-
races IG10 and CG14 are more weed competitive than
the most important O. sativa cultivars available in
West Africa, and that they owe this advantage largely
to superior SLA (which leads to a high LAI at an early
stage) and tillering ability. Leaf partitioning ratio and
parameters related to foliage architecture (Kdf and
MTA) also contributed to competitiveness, but only
at speci®c developmental stages and/or under compe-
tition with speci®c species. Plant height was not
correlated with competitiveness under the experimen-
tal conditions.
The interspeci®c progenies did not match the com-
petitiveness of their O. glaberrima parent, except for
one case, possibly because an essential trait, high
tillering ability, was not present. It is evident that
several traits need to be combined to achieve competi-
tiveness with weeds. Competitiveness was negatively
but weakly correlated with yield potential, and posi-
tively, with crop duration. Tradeoffs between compe-
titiveness and yield potential were, therefore,
signi®cant, but could possibly be reduced by speci®-
cally expressing traits for competitiveness, such as
high SLA and tillering ability, at an early develop-
mental stage.
Major knowledge gaps remain with respect to weed
competitiveness under drought- and ¯ood-prone con-
ditions, which are frequently associated with weed
problems in West Africa. It is possible that traits for
lea®ness, such as high SLA, affect drought resistance
negatively. The present study, therefore, needs to be
extended to drought- and ¯ood-prone environments
(to which most O. glaberrima types, but few O. sativa
types are well-adapted) in order to develop a screening
system for weed-competitiveness suited to a broad
range of physical environments.
Acknowledgements
This research was partly funded by the Department
for International Development (DFID), UK. D.E.
Johnson is employed by the Natural Resources Insti-
tute, University of Greenwich, UK.
References
Anderson, R.S., 1971. Radiation and crop structure. In: Sestak, Z.,
Catsky, J., Jarvis, P.G. (Eds.), Plant Photosynthetic Production.
Manual of Methods. W. Junk, The Hague, Netherlands, pp.
412±466.
Becker, M., Johnson, D.E., 1997. Leguminosen zur nachhaltigen
Verbesserung von Trockenreis-Brache Rotationen in West
Africa. In: Ottow, J.C.G., Sauerborn, J. (Eds.), Leguminosen
zur Verbesserung und nachhaltigen Sicherung der Agrarpro-
duktion. Giessener Beitraege zur Entwicklungsforschung,
series 1, vol. 24. Justus-Liebig-Universitaet, Giessen, Germany
(in press).
Casanova, D., Epema, G.F., Goudriaan, J., 1998. Monitoring rice
reflectance at field level for estimating biomass and LAI. Field
Crops Res. 55, 83±92.
Dingkuhn, M., Randolph, T.F., 1997. The potential role of low-
management rice technologies during the agricultural transition
in West Africa. In: Jones, M.P., Dingkuhn, M., Johnson, D.E.,
Fagade, S.O. (Eds.), Interspecific Hybridization: Progress and
Table 5
Multiple, linear regression analyses across 16 rice lines for descriptors of canopy structure (experiment 1, monoculture) vs. mean
competitiveness with natural weed growth, maize and the O. glaberrima landrace IG10 (experiment 2). Mbe, Cote d'Ivoire, 1997 wet season
Lp SLA MTA Kdf Plant height
Coefficient P Coefficient P Coefficient P Coefficient P Coefficient P Intercept R P
31 DAS Ns Ns 0.212 0.049 Ns Ns Ns Ns Ns Ns 0.0126 0.5 0.049
46 DAS Ns Ns 0.05 0.009 Ns Ns Ns Ns Ns Ns ÿ0.565 0.63 0.009
64 DAS 2.76 0.032 0.041 0.005 Ns Ns Ns Ns Ns Ns ÿ1.38 0.77 0.003
31�46 DAS Ns Ns 0.038 0.005 ÿ0.03 0.028 2.11 0.08 Ns Ns 0.438 0.81 0.0004
DAS, days after seeding; Lp, dry matter partitioning ratio to leaf blades; SLA, specific leaf area (kg mÿ2); MTA, mean tip elevation angle
(deg); Kdf, PAR; extinction coefficient; Ns, not significant (P > 0.05).
94 M. Dingkuhn et al. / Field Crops Research 61 (1999) 79±95

Prospects. West Africa Rice Development Association, Cote
d'Ivoire, ISBN 929113113X, pp. 3±20.
Dingkuhn, M., Schnier, H.F., De Datta, S.K., Doerffling, K.,
Javellana, C., 1991. Relationship between ripening phase
productivity and crop duration, canopy photosynthesis and
senescence in transplanted and direct seeded lowland rice. Field
Crops Res. 26, 327±345.
Dingkuhn, M., Jones, M.P., Johnson, D.E., Fofana, B., Sow, A.,
1997a. Oryza sativa and O. glaberrima genepools for high-
yielding, weed-competitive rice plant types. In: Fukai, S.,
Cooper, S., Salisbury, J. (Eds.), Breeding Strategies for Rainfed
Lowland Rice in Drought-Prone Environments. ACIAR
Proceedings No. 77, Australian Centre for International
Agricultural Research, Canberra, Australia, 277 pp.
Dingkuhn, M., Jones, M.P., Fofana, B., Sow, A., 1997b. New high-
yielding, weed competitive rice plant types drawing from O.
sativa and O. glaberrima genepools. In: Kropff, M.J., Teng,
P.S., Aggarwal, P.K., Bouma, J., Bouman, B.A.M., Jones, J.W.,
van Laar, H.H. (Eds.), Application of Systems Approaches at
the Field Level, vol. 2. Kluwer Academic Publishers,
Dordrecht, The Netherlands, pp. 37±52.
Dingkuhn, M., Jones, M.P., Johnson, D.E., Sow, A., 1998. Growth
and yield potential of Oryza sativa and O. glaberrima upland
rice cultivars and their interspecific progenies. Field Crops Res.
57, 57±69.
Fofana, B., Koupeur, T., Jones, M.P., Johnson, D.E., 1995. The
development of rice varieties competitive with weeds. Brighton
Crop Protection Conference, vol. 1. The British Crop Protec-
tion Council, Farnham, Surrey, UK, pp. 187±192.
Johnson, D.E., 1995. Weed management strategies for smallholder
rice production. Brighton Crop Protection Conference, vol. 3.
The British Crop Protection Council, Farnham, Surrey, UK, pp.
1171±1180.
Johnson, D.E., Jones, M.P., Dingkuhn, M., Mahamane, M.C., 1997.
The response of O. glaberrima, O. sativa and interspecific
hybrid rice cultivars to weed competition. Proc. 1997 Brighton
Crop Protection Conference. The British Crop Protection
Council, Farnham, Surrey, UK, pp. 197±202.
Johnson, D.E., Dingkuhn, M., Jones, M.P., Mahamane, M.C., 1998.
The influence of rice plant type on the effect of weed
competition on O. sativa and O. glaberrima. Weed Res. 38,
207±216.
Jones, M.P., Dingkuhn, M., Aluko, G.K., MandeÂ, S., 1997a.
Interspecific Oryza sativa L. � O. glaberrima Steud. progenies
in upland rice improvement. Euphytica 92, 237±246.
Jones, M.P., MandeÂ, S., Aluko, K., 1997b. Diversity and potential
of Oryza glaberrima Steud. in upland rice breeding. Breeding
Sci. 47, 395±398.
Koffi, G., 1980. Collection and conservation of existing rice
species and varieties of Africa. Agronomie Tropicale 34, 228±
237.
Kropff, M.J., van Laar, H.H., 1993. Modelling Crop-Weed
Interactions. CAB International, UK, and IRRI, Los Banos,
Philippines, 274 pp.
Kropff, M.J., van Laar, H.H., Matthews, R.B., 1994. ORYZA_1. A
Basic Model for Irrigated Lowland Rice Production. IRRI,
Manila, Philippines, 110 pp.
LI-COR, 1989. LAI-2000 Plant Canopy Analyzer. Technical
Information. LI-COR, Inc., Lincoln, Nebraska, USA, 24 pp.
Schnier, H.F., Dingkuhn, M., De Datta, S.K., Mengel, K.,
Wijangco, E., Javellana, C., 1990. Nitrogen economy and
canopy CO2 assimilation in tropical lowland rice. Agron. J. 82,
451±459.
WARDA, 1996, Annual Report for 1995. West Africa Rice
Development Association, Bouake, Cote d'Ivoire.
Wopereis, M.C.S., Bouman, B.A.M., Tuong, T.P., ten Berge,
H.F.M., Kropff, M.J., 1996. ORYZA_W: rice growth model for
irrigated and rainfed environments. SARP Research Proceed-
ings. DLO and WAU, Wageningen, The Netherlands, and IRRI,
Los Banos, Philippines, 159 pp.
M. Dingkuhn et al. / Field Crops Research 61 (1999) 79±95 95