Influence on Weed Communities, Soil Microbial Community St
177
University of Nebraska - Lincoln University of Nebraska - Lincoln DigitalCommons@University of Nebraska - Lincoln DigitalCommons@University of Nebraska - Lincoln Theses, Dissertations, and Student Research in Agronomy and Horticulture Agronomy and Horticulture Department Spring 4-6-2012 Diversification of Organic Cropping Systems with Cover Crop Diversification of Organic Cropping Systems with Cover Crop Mixtures: Influence on Weed Communities, Soil Microbial Mixtures: Influence on Weed Communities, Soil Microbial Community Structure, Soil Moisture and Nitrogen, and Crop Yield Community Structure, Soil Moisture and Nitrogen, and Crop Yield Samuel E. Wortman University of Nebraska-Lincoln Follow this and additional works at: https://digitalcommons.unl.edu/agronhortdiss Part of the Agriculture Commons, and the Plant Sciences Commons Wortman, Samuel E., "Diversification of Organic Cropping Systems with Cover Crop Mixtures: Influence on Weed Communities, Soil Microbial Community Structure, Soil Moisture and Nitrogen, and Crop Yield" (2012). Theses, Dissertations, and Student Research in Agronomy and Horticulture. 47. https://digitalcommons.unl.edu/agronhortdiss/47 This Article is brought to you for free and open access by the Agronomy and Horticulture Department at DigitalCommons@University of Nebraska - Lincoln. It has been accepted for inclusion in Theses, Dissertations, and Student Research in Agronomy and Horticulture by an authorized administrator of DigitalCommons@University of Nebraska - Lincoln.
-
Upload
khangminh22 -
Category
Documents
-
view
0 -
download
0
Transcript of Influence on Weed Communities, Soil Microbial Community St

University of Nebraska - Lincoln University of Nebraska - Lincoln
DigitalCommons@University of Nebraska - Lincoln DigitalCommons@University of Nebraska - Lincoln
Theses, Dissertations, and Student Research in Agronomy and Horticulture Agronomy and Horticulture Department
Spring 4-6-2012
Diversification of Organic Cropping Systems with Cover Crop Diversification of Organic Cropping Systems with Cover Crop
Mixtures: Influence on Weed Communities, Soil Microbial Mixtures: Influence on Weed Communities, Soil Microbial
Community Structure, Soil Moisture and Nitrogen, and Crop Yield Community Structure, Soil Moisture and Nitrogen, and Crop Yield
Samuel E. Wortman University of Nebraska-Lincoln
Follow this and additional works at: https://digitalcommons.unl.edu/agronhortdiss
Part of the Agriculture Commons, and the Plant Sciences Commons
Wortman, Samuel E., "Diversification of Organic Cropping Systems with Cover Crop Mixtures: Influence on Weed Communities, Soil Microbial Community Structure, Soil Moisture and Nitrogen, and Crop Yield" (2012). Theses, Dissertations, and Student Research in Agronomy and Horticulture. 47. https://digitalcommons.unl.edu/agronhortdiss/47
This Article is brought to you for free and open access by the Agronomy and Horticulture Department at DigitalCommons@University of Nebraska - Lincoln. It has been accepted for inclusion in Theses, Dissertations, and Student Research in Agronomy and Horticulture by an authorized administrator of DigitalCommons@University of Nebraska - Lincoln.

i
DIVERSIFICATION OF ORGANIC CROPPING SYSTEMS WITH COVER CROP
MIXTURES: INFLUENCE ON WEED COMMUNITIES, SOIL MICROBIAL
COMMUNITY STRUCTURE, SOIL MOISTURE AND NITROGEN,
AND CROP YIELD
by
Sam E. Wortman
A DISSERTATION
Presented to the Faculty of
The Graduate College at the University of Nebraska
In Partial Fulfillment of Requirements
For the Degree of Doctor of Philosophy
Major: Agronomy
Under the Supervision of Professor John L. Lindquist
Lincoln, Nebraska
May, 2012

ii
DIVERSIFICATION OF ORGANIC CROPPING SYSTEMS WITH COVER CROP
MIXTURES: INFLUENCE ON WEED COMMUNITIES, SOIL MICROBIAL
COMMUNITY STRUCTURE, SOIL MOISTURE AND NITROGEN,
AND CROP YIELD
Sam E. Wortman, Ph.D.
University of Nebraska, 2012
Advisor: John L. Lindquist
Organic grain cropping systems typically depend on intensive mechanical
cultivation for weed control and manure or compost applications to meet plant nutrient
demands. However, cover crops may contribute to weed suppression and soil fertility,
potentially increasing crop yield and sustainability of the system. The utility of individual
cover crop species have been well documented, but the agronomic benefits of diverse
cover crop mixtures have received less attention. Cover crop mixtures are an appealing
option for farmers, as increasing species diversity has been shown to increase resource-
use efficiency, stability, resiliency, and productivity of plant communities. Despite the
growing interest in cover crop mixtures, little is known about the effect of increasing
cover crop diversity on cropping system performance. Moreover, organic farmers have
questions about the most effective method for cover crop mixture termination.
In an effort to increase knowledge about cover crop mixtures and management for
the western Corn Belt, an organic cropping systems trial was initiated in 2009 at the UNL
ARDC near Mead, NE. Spring-sown mixtures of cover crops, ranging from two to eight
species, were included in a sunflower – soybean – corn crop rotation. Cover crops were

iii
planted in late-March and terminated mechanically with either a field disk or sweep plow
undercutter in late-May. Changes in cover crop mixture influenced cover crop
productivity and early-season weed biomass, while termination method drove differences
in weed community composition, soil microbial community structure, soil moisture and
nitrogen, and crop yield. Interestingly, the management of ambient weed communities as
a cover crop led to unique shifts in soil microbial community structure, but did not alter
soil nitrogen or crop yield when compared to cover crop mixtures. When considering
cropping system performance in combination with potential environmental benefits,
diverse cover crop mixtures paired with a sweep plow undercutter for termination seems
to be a profitable and sustainable management option for organic grain farmers in the
western Corn Belt.

iv
ACKNOWLEDGEMENTS
I would like to thank the many people who made this dissertation possible. First,
I would like to thank Dr. John Lindquist who served as my major advisor and offered
valuable guidance, support, and advice throughout my graduate studies. John has helped
me to become a better writer, scientist, and analytical thinker with his probing questions
like, “So, what’s your hypothesis?” I would also like to thank Dr. Charles (Chuck)
Francis, my M.S. advisor and Ph.D. supervisory committee member, for his constant
support and for introducing me to the exciting field of agroecology. Thank you to Drs.
Rhae Drijber, Mark Bernards, and Erin Blankenship for their service as members of my
Ph.D. supervisory committee and as advisers on various research issues. Dr. Adam Davis,
of the USDA-ARS, was also a great mentor providing statistical advice and numerous
publication opportunities. Fellow graduate student, Jared Schmidt, has been a great
teaching and research collaborator over the last few years and was always willing to get
to the bottom of any research issue with me. Next, I would like to thank Tom Galusha for
his tireless efforts in the field. Tom never hesitates to put in a long day if it means getting
the job done for a student. I would also like to thank the many undergraduate student
workers who survived the infamous weed biomass harvests during the heat of the
summer. Finally, I would like to thank my wife, Suk, for her unwavering love and
support over the last five years of graduate school. By way of listening to me practice
countless presentations, Suk is now an expert on organic agriculture and cover crop
mixtures.

v
TABLE OF CONTENTS
Prologue ..............................................................................................................................1
Chapter 1: Cover Crop Mixtures for the Western Corn Belt: Opportunities for Increased
Productivity and Stability ..................................................................................................10
Chapter 2: Weed Biomass, Density, and Community Response to Cover Crop Mixtures
and Mechanical Termination Method ................................................................................35
Chapter 3: Relative Influence of Cover Crop Diversity, Weed Communities, and
Termination Method on Soil Microbial Community Structure .........................................81
Chapter 4: Cover Crop Mixtures and an Alternative Termination Method for Organic
Grain Cropping Systems: Influence on Soil Moisture and Nitrogen, Crop Yield, and
Profitability ......................................................................................................................115
Epilogue ..........................................................................................................................160

1
PROLOGUE
Cover crops are most often planted for conservation purposes providing soil
coverage between cash crop cycles to reduce soil erosion (Pimentel et al., 1995).
Depending on what species are planted, cover crops may provide additional benefits to
crops and surrounding ecosystems. Some of these benefits may help farmers to increase
grain yield and profitability, while others are less tangible. For example, cover crops can
help to build long-term soil quality that contributes value to farmers, the environment,
and society as a whole (Dabney et al., 2001).
Cover Crops Options for the Western Corn Belt
Cover crop plantings in the western Corn Belt are often limited by the length of
the growing season. As defined by the average last and first freeze, the growing season in
east-central Nebraska begins 27 April and ends 6 October. Corn and soybeans are
typically planted prior to the second week of May and harvested in mid- to late-October
which leaves only a narrow window, if any, for growing cover crops. In grain-based
rotations, the best opportunity for cover crop growth is following a winter annual crop
like wheat, which is harvested in July and provides a large window for establishment and
growth of a productive cover crop. However, for many agronomic, social, and especially
economic reasons the widespread adoption of a corn – soybean – winter wheat crop
rotation throughout the Midwest US seems unlikely. Therefore, our challenge as
researchers is to work with farmers to create a window for cover crop growth where one
does not currently exist in corn – soybean cropping systems.
The most common option for cover crop establishment within the corn – soybean
rotation is to plant a winter annual cover crop (e.g., rye or hairy vetch) immediately

2
following soybean harvest. Soybeans are typically harvested sooner than corn and
soybean is a low-residue crop; thus, the soil surface following soybean is far more
susceptible to erosion (Kessavalou and Walters, 1997). Therefore, planting cover crops
following soybean in a two-year rotation is often the highest priority for farmers.
However, planting a cover crop in the fall can become challenging. Soybean harvest
could be delayed or corn harvest may need to be expedited, and typically activities to get
crops out of the field will take priority over cover crop planting. Unfortunately, the result
is often a late-planted cover crop, resulting in poor establishment and minimal growth
prior to corn planting the following spring. Another possibility for cover crop
establishment is to broadcast the seed via airplane prior to summer crop harvest. If
successful, this option certainly creates a longer period for cover crop growth, but may be
a relatively expensive option potentially resulting in a spatially heterogeneous cover crop
stand. A similar option attracting recent interest is attaching a broadcast spreader to a
“high-boy” spray tractor and spreading cover crop seed after leaf drop in soybean but
before harvest.
If none of these fall seeding options is viable for a farmer, the only other
possibility for cover crop establishment is in early spring. This option has promise but is
often viewed as a less desirable option because of the opportunity to reduce late-fall and
early-spring soil erosion with fall-planted winter annual cover crops. Despite the short-
comings of a spring-sown cover crop, this is the most practical cover crop option for
many farmers. For example, farmers with integrated crop – livestock operations will
graze livestock on crop residue in the winter months, which may damage the cover crop
stand and reduce the benefits of fall-sown cover crops. Indeed, spring-sown cover crops

3
provide farmers the opportunity to receive at least a portion of the ecological and
economic benefits of cover crops in rotation while maintaining the flexibility to graze
livestock on crop residue post-harvest. Regardless of the desired strategy, inclusion of
cover crops in a corn – soybean cropping system will require management changes and
potential sacrifices to ensure maximum benefit of the cover crop. For example, traditional
corn and soybean planting dates may need to be delayed or harvest may need to occur
earlier to allow sufficient growth of cover crops, which may mean that shorter-season
corn hybrids and soybean varieties need to be considered. However, this option may
cause a reduction in corn and soybean yields. In short, diversification of the corn –
soybean rotation with cover crops is possible, but it will present unique management
challenges that require further research.
Benefits of Cover Crop Mixtures
Traditionally, cover crop use and management have followed the conventional
single species paradigm. Monoculture systems were developed to facilitate ease of
mechanical cultural practices including planting, fertilization, weed control, and harvest.
However, with the exception of planting, farmers do not have to consider these
management factors when growing a cover crop. Realizing this has prompted many
farmers to consider using multiple species cover crop mixtures.
Cover crop species are generally chosen to meet specific farmer goals. Not
surprisingly, the specific benefits associated with a cover crop vary by species and
management method. For example, species in the Fabaceae (legume) family are typically
chosen due to their capacity to utilize atmospheric nitrogen through a mutualistic
relationship with nitrogen-fixing bacteria. Properly managed legume cover crops can

4
reduce or eliminate the need for synthetic nitrogen additions for the subsequent cash crop
(Biederbeck et al., 1996; Burket et al., 1997). Another benefit often sought in a cover
crop species is the capacity for reducing soil compaction. Species with long tap roots,
typical of cover crops in the Brassicaceae (mustard) family, can often penetrate
compacted soil layers up to six feet deep (Williams and Weil, 2004). The potential for
specific cover crop species to suppress weeds is another area of increasing interest,
especially in organic cropping systems where the use of synthetic herbicides is
prohibited. While many species offer specific benefits, many of the biological advantages
associated with a healthy cover crop are not unique to individual species. The potential
benefits of most cover crops include reduced topsoil erosion, increased nutrient cycling
and reduced nitrate leaching, improved soil aggregation and water retention, increased
organic matter content and soil carbon sequestration, and a reduction in the incidence of
disease and insect pests (Hartwig and Ammon, 2002).
Given that many cover crop benefits are species- or family-specific, there may be
an advantage for farmers to grow multiple species in cover crop mixtures. Moreover,
growing mixtures of cover crops should increase resource-use efficiency of the entire
community (Tilman et al., 1997). Species with a variety of canopy and root structures,
along with variable demands for water and nutrients, will ensure that the entire plant
community maximizes productivity given the available resources. The positive
relationship between plant community diversity and productivity has been well
documented in grassland ecosystems (Tilman et al., 2001). However, certain species may
be extremely competitive or antagonistic toward other species when grown in mixed
species communities, so cover crop mixtures should not be chosen carelessly. In addition

5
to the specific benefits of individual species in a mixture and the potential for increased
resource-use efficiency and productivity, a multi-species mixture will drastically increase
biodiversity within the corn – soybean rotation. The immediate increase in vegetative
diversity during cover crop growth will likely lead to increased diversity of other species
in associated trophic levels such as beneficial insects, birds, and microorganisms that may
use the cover crop community as a source of food, habitat, or refuge (Altieri, 1999).
While the benefits of biodiversity are not always immediately realized by the farmer,
most agree that conservation of biodiversity is intrinsically valuable (Ghilarov, 2000).
Economic Advantages of Cover Crop Mixtures
There are both immediate and long-term economic incentives for using cover
crops. In general, the immediate economic advantages of cover crop use include the cost
savings associated with replacing off-farm inputs such as synthetic nitrogen, fuel,
herbicides, and labor, as well as any associated yield increases. Cover crop mixtures
provide further economic advantage to farmers by reducing economic risk. Depending on
annual weather patterns, certain cover crop species perform better than others in a given
year and this outcome is somewhat unpredictable. Therefore, a mixture of cover crop
species may reduce the economic risk of choosing an unsuccessful single cover crop
species and losing the investment of seed and labor associated with establishment. For
example, seed of many legume cover crops can be expensive and also more difficult to
establish compared to other cover crops. Therefore, combining legumes in mixture with
other broadleaf and grass species could reduce the initial cost of seeding the cover crops
and also ensure the farmer gains some biological and economic benefit, even if growth of
the legume is unsuccessful in a given year. In some cases, competition among species

6
may increase the productivity of each individual species compared to growth in
monoculture. For example, if nitrogen fixation per legume plant can be maximized in a
multi-species mixture, the economic return per seed in the form of replaced nitrogen cost
would increase. While not directly related to the biology of cover crops, another
economic incentive is through USDA Natural Resource Conservation Service (NRCS)
conservation programs. Several options provide payments to farmers for individual cover
crop use, and there is currently one provision in the Conservation Stewardship Program
that provides economic incentive for planting cover crop mixtures (USDA-NRCS, 2012).
In addition to short-term economic incentives associated with cover crop use,
there are recognized long-term benefits. The long-term economic advantages are related
to reductions in soil erosion and improved soil organic matter. Reducing soil erosion
long-term is in the best interest of the farmer, local communities, and society. It has been
estimated that soil erosion costs farmers in the US over 27 billion dollars annually. Most
of this cost is due to the nutrients lost in eroded topsoil, but this estimate also includes the
cost of lost water and thickness of topsoil (Pimentel et al., 1995). Equally troubling is the
cost of soil erosion to society, which is estimated at 17 billion dollars per year in the US.
The off-farm societal impacts of erosion include costs associated with the siltation of
navigable waterways, sewers, and roadways, and the associated clean-up costs (Pimentel
et al., 1995). Including cover crop mixtures in the corn – soybean rotation will not
eliminate the economic burden of soil erosion, but it would certainly be a step in the right
direction. The second long-term economic advantage of cover crop use may be more
easily observed by farmers. Cover crop use over time has been shown to increase organic
matter content (stable carbon) in soils (Lotter et al., 2003). For the farmer, increasing
7
organic matter is generally a sign of improved soil quality and productivity, and has also
been shown to lead to greater yield stability. Increased organic matter in soils increases
soil water retention, which improves the likelihood of yield stability in exceptionally dry
years (Lotter et al., 2003). This is an important economic consequence in a climate and
society where water for agriculture is increasingly scarce and there is competition from
other sectors of the economy.
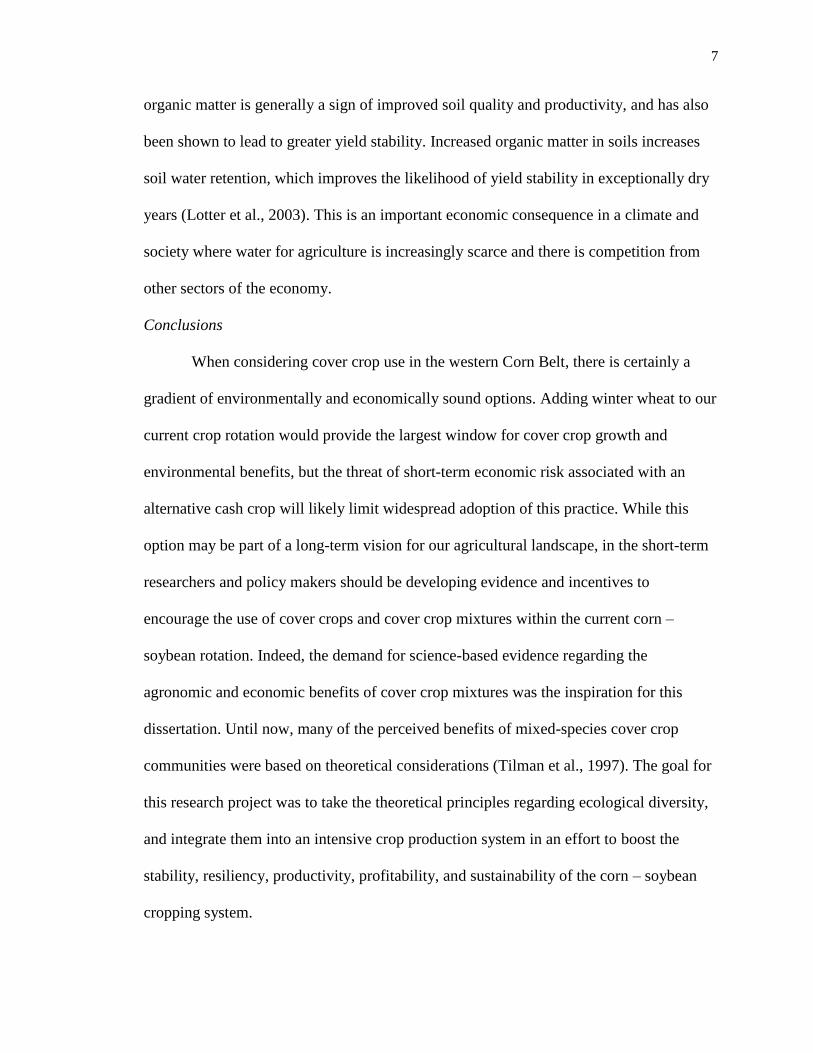
Conclusions
When considering cover crop use in the western Corn Belt, there is certainly a
gradient of environmentally and economically sound options. Adding winter wheat to our
current crop rotation would provide the largest window for cover crop growth and
environmental benefits, but the threat of short-term economic risk associated with an
alternative cash crop will likely limit widespread adoption of this practice. While this
option may be part of a long-term vision for our agricultural landscape, in the short-term
researchers and policy makers should be developing evidence and incentives to
encourage the use of cover crops and cover crop mixtures within the current corn –
soybean rotation. Indeed, the demand for science-based evidence regarding the
agronomic and economic benefits of cover crop mixtures was the inspiration for this
dissertation. Until now, many of the perceived benefits of mixed-species cover crop
communities were based on theoretical considerations (Tilman et al., 1997). The goal for
this research project was to take the theoretical principles regarding ecological diversity,
and integrate them into an intensive crop production system in an effort to boost the
stability, resiliency, productivity, profitability, and sustainability of the corn – soybean
cropping system.

8
Literature Cited
Biederbeck, V. O., O. T. Bouman, C. A. Campbell, L. D. Bailey, and G. E. Winkelman.
1996. Nitrogen benefits from four green-manure legumes in dryland cropping
systems. Canadian Journal of Plant Science 76:307–315.
Blevins, R. L., M. S. Smith, G. W. Thomas, and W. W. Frye. 1983. Influence of
conservation tillage on soil properties. Journal of Soil and Water Conservation
38:301-305.
Burket, J. Z., D. D. Hemphill, and R. P. Dick. 1997. Winter cover crops and nitrogen
management in sweet corn and broccoli rotations. HortScience 32:664–668.
Dabney S. M., J. A. Delgado, D. W. Reeves. 2001. Using winter cover crops to improve
soil and water quality. Communications in Soil Science and Plant Analysis 32:1221-
1250.
Ghilarov, A. M. 2000. Ecosystem functioning and intrinsic value of biodiversity. Oikos
90:408–412.
Hartwig, N. L., and H. U. Ammon. 2002. Cover crops and living mulches. Weed Science
50:688–699.
Kessavalou, A., and D. T. Walters. 1997. Winter rye as a cover crop following soybean
under conservation tillage. Agronomy Journal 89:68–74.
Lotter, D.W., R. Seidel, and W. Liebhardt. 2003. The performance of organic and
conventional cropping systems in an extreme climate year. American Journal of
Alternative Agriculture 18:1-9.
Pimentel, D., C. Harvey, P. Resosudarmo, K. Sinclair, D. Kurz, M. McNair, S. Crist, L.
Shpritz, L. Fitton, R. Saffouriand, and R. Blair. 1995. Environmental and economic
costs of soil erosion and conservation benefits. Science 267:1117-1123.
Tilman, D. 1996. Biodiversity: population versus ecosystem stability. Ecology 77:350–
363.
Tilman, D., C. L. Lehman, and K. T. Thomson. 1997. Plant diversity and ecosystem
productivity: theoretical considerations. Proceedings of the National Academy of
Science 94:1857–1861.
Tilman, D., P. B. Reich, J. Knops, D. Wedin, T. Mielke, and C. Lehman. 2001. Diversity
and productivity in a long-term grassland experiment. Science 294:843–845.
USDA-NRCS. 2011. Conservation Stewardship Program.
<http://www.nrcs.usda.gov/programs/new_csp/csp.html> Verified 8 March 2012.

9
Williams, S. M., and R. R. Weil. 2004. Crop cover root channels may alleviate soil
compaction effects on soybean crop. Soil Science Society of America Journal
68:1403–1409.

10
Chapter 1
Cover Crop Mixtures for the Western Corn Belt: Opportunities for Increased Productivity
and Stability
Abstract
Achieving agronomic and environmental benefits associated with cover crops
often depends on reliable establishment of a highly productive cover crop community.
The objective of this study was to determine if cover crop mixtures can increase
productivity and stability compared to single species cover crops, and to identify those
components most active in contributing to or detracting from mixture productivity. A
rainfed field experiment was conducted near Mead, NE in 2010 and 2011. Eight
individual cover crop species (in either the Brassicaceae [mustard] or Fabaceae [legume]
family) and four mixtures of these species (2, 4, 6, and 8 species combinations) were
broadcast planted and incorporated in late March and sampled in late May. Shoot dry
weights were recorded for sole crops and individual species within all mixtures. Sole
crops in the mustard family were twice as productive (2428 kg ha-1
) as sole crops in the
legume family (1216 kg ha-1
), averaged across two years. The land equivalent ratios
(LERs) for all mixtures in 2011 were greater than 1.0, indicating mixtures were more
productive than the individual components grown as sole crops. Improved performance in
mixture may be related to the ecological resilience of mixed species communities in
response to extreme weather events, such as hail. Partial LERs of species in the mustard
family were consistently greater than those in the legume family, indicating that mustards
dominated the mixtures. Results provide the basis for yield-stability rankings of spring-
sown cover crop species and mixtures for the western Corn Belt.

11
Introduction
Cover crops have been shown to provide a variety of benefits within
agroecosystems. These include reduced soil erosion, increased biological diversity (e.g.,
microbes, insects, and birds), increased nutrient cycling and biological nitrogen fixation,
increased soil organic matter, improved weed control, and increased crop yields
(Pimentel et al., 1992; Pimentel et al., 1995; Sainju and Singh, 1997; Williams II et al.,
1998; Altieri, 1999; Reddy et al., 2003; Teasdale et al., 2007). While cover crops may
provide a number of agronomic and environmental benefits, achieving these benefits
(e.g., weed suppression) often depends on establishing a highly productive cover crop
community (Teasdale et al., 1991). Planting multi-species cover crop mixtures may be a
viable solution for increasing the ecological stability and resilience of cover crop
communities, which can contribute to higher and more consistent productivity.
Production benefits of multi-species plant communities include the potential for
increased resource-use efficiency and crop yields (Francis, 1986). Intercropping systems
typically include the production of two crop species (e.g., one cereal grain and one
legume species) within a given field in the same season, most commonly oriented in
alternating rows or strips of rows (e.g., Chen et al., 2004). While there are logistical
challenges related to planting and harvesting intercrop systems, the potential for
increased yield of the entire system makes these potentially attractive cropping systems
when labor and appropriate equipment are available. Indeed, there are many examples of
intercropping systems that have demonstrated greater grain or forage yield compared to
monoculture systems on an equivalent land area basis (Ikeorgu et al., 1989; Chen et al.,
2004; Agegnehu et al., 2006; Ghosh et al., 2006). There are several potential mechanisms

12
contributing to the increased yield observed in intercropping systems, including increased
resource-use efficiency (light and soil resources) and increased ecological stability and
resilience (Reddy and Willey, 1981; Tilman, 1996; Trenbath, 1999; Szumigalski and Van
Acker, 2008). While two-species intercropping systems are most common, there are
potential benefits associated with further increases in plant community diversity
including increased productivity, community stability, and nutrient-use efficiency
(Tilman, 1996; Tilman et al., 1997; Tilman et al., 2001).
Multi-species cover cropping systems have been tested in previous studies, but
most research was not designed to quantify the benefits of increasing cover crop
diversity. Typically, cover crop mixture studies compare monoculture species with
biculture combinations of those species (Akemo et al., 2000; Creamer and Baldwin,
2000; Odhiambo and Bomke, 2001; Kuo and Jellum, 2002). While there has been some
focus on more diverse mixtures of cover crops (Creamer et al., 1997; Teasdale and
Abdul-Baki, 1998; Madden et al., 2004), characterization of the benefits associated with
increasing diversity are often limited to simple dry weight comparisons.
Many studies have demonstrated increased productivity of cover crop mixtures
relative to monoculture cover crops, but the differences were likely due in part to higher
seeding rates in the mixtures (Teasdale and Abdul-Baki, 1998; Odhiambo and Bomke,
2001; Kuo and Jellum, 2002). To accurately evaluate benefits of mixtures and the
contributions of individual species to the mixtures, seeding rates of the mixtures should
be proportional to the monocultures via a substitutive approach to avoid the confounding
effects of variable seeding densities (e.g., seeding rate for a component of the mixture
should be equal to its monoculture seeding rate divided by the number of species in the

13
mixture; Joliffe, 2000). It is possible that some other optimum seeding density or mixture
proportion exists for cover crop mixtures, but addressing this question requires an
additive seeding approach which would limit the utility of intercropping indices like the
land equivalent ratio (Joliffe, 2000). Moreover, a fully additive seeding approach to
mixture seeding rates (combining 1x rates of each species) would be impractical and
cost-prohibitive for farmers.
Many cover crop mixture studies fail to include monoculture control treatments
necessary to evaluate the potential benefits or antagonisms of the different mixtures
(Creamer et al., 1997; Madden et al., 2004). Similarly, many of these studies do not
quantify the productivity of the mixtures, or the individual components of the mixture,
relative to sole cropped cover crops on an equivalent land area basis as calculated in
traditional intercropping studies (Teasdale and Abdul-Baki, 1998; Creamer and Baldwin,
2000; Odhiambo and Bomke, 2001; Kuo and Jellum, 2002). Instead, the dry weights of
each mixture and sole crop are typically reported; such methods provide limited
information about the relative contribution or aggressiveness of each species in a cover
crop mixture.
The aim of this study was to quantify the productivity and stability of spring-sown
cover crop mixtures relative to sole cropped cover crops in the western Corn Belt, and to
identify those species contributing to or detracting most from mixture productivity. With
respect to this objective, we hypothesized that increasing cover crop diversity will
increase cover crop productivity and stability.

14
Materials and Methods
To accomplish this objective, a rainfed field experiment was conducted at the
University of Nebraska – Lincoln Agricultural Research and Development Center near
Mead, NE in 2010 and 2011. Dominant soil type at the site is a Sharpsburg silty clay
loam (fine, smectitic, mesic typic Argiudoll; pH = 6.3, organic matter content = 3.6%)
with 0 to 5% slopes. The experimental layout was a randomized complete block design
with four replications and twelve cover crop treatments. Experimental units were 3 x 3 m
and randomized to treatment within each replication. Cover crop treatments included
eight individual cover crop species and four mixtures of these species (Table 1.1). Cover
crops used belong to either the Fabaceae (legume) or Brassicaceae (mustard) plant
families. Mixtures were a 1:1 ratio of legume and mustard species where, for example,
the eight species mixture included four legume species and four mustard species. The
four cover crop mixtures ranged from two to eight species with an objective to quantify
the effects of increasing plant diversity. The seeding rates for individual species in a
mixture were determined by dividing the recommended seeding rate for that species by
the number of species in mixture (Table 1.1), previously described as the substitutive
approach. Recommended seeding rates for individual species were obtained from a
combination of USDA Natural Resource Conservation Service, Cooperative Extension,
cover crop seed distributor, and farmer recommendations. If recommendations among
sources differed, values were averaged to determine the most appropriate seeding rate.
Most recommendations were based on an assumption of drilled seeding methods.
However, cover crops in this study were broadcast seeded; therefore, drilled seeding

15
recommendations were increased by approximately 20% to compensate for reduced plant
stands when using broadcast seeding methods (Clark et al., 1978).
Cover crops were broadcast planted by hand and surface incorporated with a John
Deere “cultipacker” (Deere and Company, Moline, IL, USA) on March 30, 2010 and
March 21, 2011. Plants received no supplemental irrigation or nutrition throughout the
growing period, but large weeds were removed by hand from experimental units on a bi-
weekly basis to limit competitive effects from non-cover crop species. Plants were
harvested on May 25, 2010 and May 31, 2011 from two randomly placed quadrats (0.19
m2) in each experimental unit. This harvest time was intended to simulate the termination
period for a cover crop grown prior to summer annual crop species (e.g., Glycine max
[soybean], Sorghum bicolor [sorghum], Helianthus annuus [sunflower], or possibly Zea
mays [maize]). Shortly following cover crop harvest and sampling, shoot dry weights
were determined for sole crops and individual species within all mixtures by drying
samples at 54o C to constant mass and weighing each sample.
The land equivalent ratio (LER) was used to compare the productivity of sole
cropped cover crops to those cover crops planted in mixture. The LER indicates the
relative amount of land required when growing sole crops to achieve the productivity
observed in the mixture (Willey and Osiru, 1972). LER is widely considered a robust and
useful indicator of mixture productivity relative to sole crops (Bedoussac and Justes,
2011). LER is typically utilized to evaluate marketable yield in intercropping systems,
but to our knowledge has not been previously applied in the evaluation of diverse cover
crop mixtures. Total LER is calculated as:
LER = LERi + LERj …. + LERn

16
where LERi is the partial LER of species i, LERj is the partial LER of species j, and so
forth for n number of species. Partial LER is calculated as:
LERi = YMIi / YSCi
where YMIi is the yield of species i planted in mixture and YSCi is the yield of species i
planted as a sole crop. A total LER value greater than 1.0 indicates the mixture was more
productive than the component sole crops, whereas a value less than 1.0 suggests sole
crops were more productive (e.g., antagonistic effects). For example, a total LER value
of 1.5 suggests that 15 hectares of sole cropped cover crops (the components of the
mixture) would need to be planted to achieve an equivalent level of productivity (yield)
achievable on 10 hectares when all species are grown together in a mixture. The partial
LER values for individual species in a mixture were also used to compare the relative
contribution or competitive ability of each species (Bedoussac and Justes, 2011).
To accomplish all objectives, shoot dry weight data, LER, and partial LER values
were analyzed with ANOVA implemented using the MIXED procedure in SAS (SAS
Institute, Inc., NC, USA). Fixed effects in the model included cover crop treatment, year,
and the interaction of treatment*year, while the random effect was the interaction of
block*year. Least-squares means and standard errors were reported for all cover species
and mixtures for statistical comparisons. Ecological stability of cover crop communities
was compared using the coefficient of variation (C.V.) for each cover crop treatment
pooled across replications (n=4) and years (n=2). A lower coefficient of variation implies
less variation about the mean and greater ecological stability (Tilman et al., 1998). Lastly,
mean contrasts were used to compare the productivity (shoot dry weights) and stability
(C.V.’s) of mixtures versus sole crops (legumes and/or mustards).

17
Results and Discussion
Productivity and Stability of Sole Crops and Mixtures
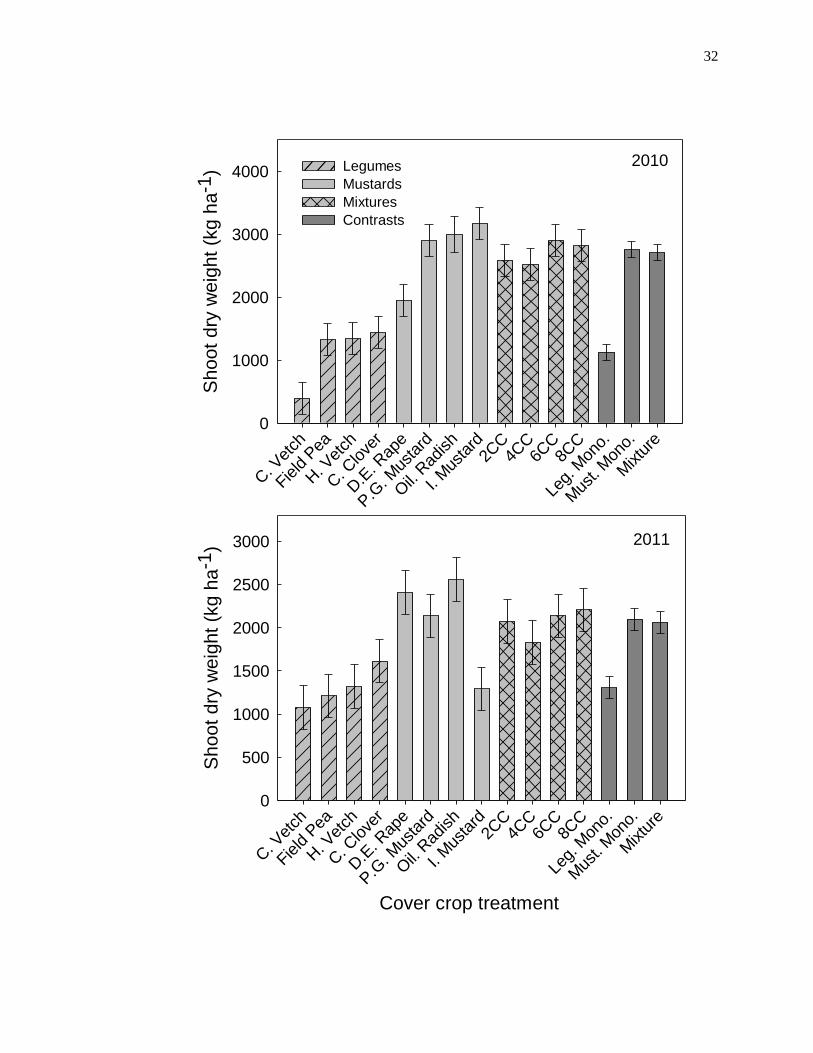
Shoot dry weight of sole cropped cover crop species in 2010 ranged from 397 kg
ha-1
± 252 kg ha-1
(mean ± one standard error) for Lathyrus sativus (chickling vetch) to
3175 kg ha-1
± 252 kg ha-1
for Sinapus alba (Idagold mustard; Figure 1.1). Shoot dry
weight of mustard cover crop species (2757 kg ha-1
± 126 kg ha-1
) was consistently
greater than legumes (1127 kg ha-1
± 126 kg ha-1
) in 2010. However, a contrast of
mixtures vs. mustard sole crops indicated that shoot dry weight of mustard sole crops was
not different from the average shoot dry weight of mixtures (2709 kg ha-1
± 126 kg ha-1
).
Shoot dry weight of sole cropped cover crop species in 2011 ranged from 1076 kg ha-1
±
252 kg ha-1
for chickling vetch to 2556 kg ha-1
± 252 kg ha-1
for Raphanus sativus
(oilseed radish; Figure 1.1). Consistent with 2010, shoot dry weight of mustard cover
crop species (2099 kg ha-1
± 126 kg ha-1
) was consistently greater than legumes (1305 kg
ha-1
± 126 kg ha-1
) but not different from the average shoot dry weight of the mixtures
(2062 kg ha-1
± 126 kg ha-1
). Within the cover crop mixtures, productivity did not
increase with diversity as there was no difference in shoot dry weight among any of the
four possible mixtures in 2010 or 2011 (Figure 1.1). Overall, the productivity of all cover
crops in this study was far greater than the previously reported dry matter yields of
spring-sown cover crops in eastern Nebraska (Power and Koerner, 1994). The greater
productivity observed in this study may be related to the earlier cover crop planting date
used in this study (late-March) compared to the delayed plantings (late-April and early-
May) tested by Power and Koerner (1994).

18
The coefficient of variation, accounting for spatial (replication) and temporal
(year) variation differed among individual cover crop treatments. Among legume species,
C.V. values ranged from 16.9 to 55.2% (mean = 33.5%) for Trifolium incarnatum
(crimson clover) and chickling vetch, respectively. Among mustard species, values
ranged from 20.6 to 46.6% (mean = 31.6%) for oilseed radish and Idagold mustard,
respectively (Figure 1.2). The variability of Idagold mustard was related to its
susceptibility to hail damage. While Idagold mustard was the most productive cover crop
in 2010, a May 12, 2011 hail storm limited its productivity in 2011. The hail storm was
damaging to all cover crop treatments, but Idagold mustard seemed to recover much more
slowly than the other species and mixtures. The coefficient of variation for cover crop
mixtures only ranged from 19.8 to 30.7% (mean = 25.9%), but a contrast of mixtures vs.
monocultures indicated no difference (p = 0.35) in the stability of the two cover cropping
strategies. Similarly, the coefficient of variation was relatively uninfluenced by
increasing diversity within the mixtures (Figure 1.2). It is possible that the number of
replications (n=4) and years (n=2) was insufficient to detect differences in the stability of
different monoculture and mixture cover crop strategies. A more robust measure of
stability would require data from a long-term or multi-site experiment. Nonetheless,
knowledge of the spatial and temporal variability (though limited) may be useful in
selecting an appropriate cover crop species or mixture.
Land Equivalent Ratios (LER) for Mixtures and Mixture Components
The land equivalent ratio (LER) was not affected by cover crop mixture or the
interaction of mixture by year. However, LER was influenced by year and was greater in
2011 (LER = 1.38 ± 0.09) than in 2010 (LER = 1.05 ± 0.09) for all mixtures (Figure 1.3).

19
All mixtures across both years were equal to or greater than 1.0, while all mixtures in
2011 were greater than 1.0. A value greater than 1.0 suggests the mixture resulted in
more efficient use of land than the alternative of growing the individual mixture
components as sole crops. The primary difference between 2010 and 2011 was the May
12, 2011 hail storm that severely damaged all cover crop treatments. Cover crops were
not harvested until May 31, 2011 (approximately one week later than the harvest date in
2010), in an effort to allow the cover crops to recover and regrow after the substantial
hail damage. While the objective of this study was not to measure the ecological
resilience of cover crop mixtures, the 2011 hail storm did provide anecdotal information
about the ability of these species and mixtures to recover after extreme perturbation.
Given our observations, we hypothesize that the increased LER in 2011 from 2010 is
directly related to the potential for increased resilience in mixtures relative to sole crops.
Indeed, the ability to quickly recover from disturbance (resiliency) can contribute to
productivity and is often a characteristic of diverse plant communities (Lavorel, 1999;
Hooper et al., 2005).
The over-yielding potential of plant species grown in mixture for agricultural use
is consistent with many previous studies (e.g., Ikeorgu et al., 1989; Chen et al., 2004;
Agegnehu et al., 2006; Ghosh et al., 2006). Undoubtedly, over-yielding characteristics
have been observed for decades in cover crop mixtures, but the documentation of this
phenomenon requires appropriate data collection and indices like the LER. To our
knowledge, this is the first reported evidence of over-yielding properties in a mixture of
plant species specifically designed for cover crop use. Contrary to our expectations, LER
did not increase with diversity of the mixture (from 2 to 8 species). Increasing

20
community diversity has been shown to increase resource-use efficiency, primary
productivity (Tilman et al., 1997; Tilman et al., 2001), and presumably the efficiency of
land use (LER), but this was not observed here.
Partial land equivalent ratios were consistently greater for mustards in mixture
compared to legumes (Table 1.2). Idagold mustard was the most competitive cover crop
species in all mixtures as indicated by the highest (or among the highest) partial LER
pooled across both years (0.98, 0.43, 0.48, and 0.33 in the 2CC, 4CC, 6CC, and 8CC
mixtures, respectively). In contrast, all legume species were least competitive in all
mixtures pooled across both years (0.33, 0.14, 0.10, and 0.07 in the 2CC, 4CC, 6CC, and
8CC mixtures, respectively; Table 1.2). If all species were contributing equally to the
productivity of a mixture, we would expect the partial LER of a given species to be 0.5,
0.25, 0.167, and 0.125 in the 2, 4, 6, and 8 species mixtures, respectively. A partial LER
greater than these expected values for species i within a given mixture suggests species i
was benefiting from the increased interspecific and reduced intraspecific competitive
environment of the multi-species mixture. Conversely, a partial LER less than these
expected values would suggest that species i is inhibited more by the interspecific
competitive interactions in the mixture. Partial LER values for the mustards were always
greater than or equal to these expected values, suggesting all mustard species used in this
experiment benefited from the mustard-legume mixture combinations. In contrast, the
legumes were always less than or equal to these expected values suggesting the legume
species used in this experiment tended to be negatively influenced by the competitive
interactions in the mustard-legume mixture combinations.

21
While these results suggest mustards benefited most from the mixture
combinations, it is important to note that total LER was always greater than or equal to
1.0. Despite the negative competitive effects on most legume species, the substantial gain
in mustard productivity in mixture (relative to monoculture) led consistently to LER
values greater than or equal to 1.0. These results are congruent with the results of
Szumigalski and Van Acker (2008) who found that canola (a mustard species) was quite
competitive and tended to over-yield in mixture with field pea and wheat. The over-
yielding effect of the mustards when grown in mixture with legumes may have at least
two possible explanations. First, the canopy architecture of mustards compared to
legumes may give the mustards a competitive advantage in these mixtures (Tremmel and
Bazzaz, 1993). The shoot and canopy architecture of the mustard species used in this
experiment is generally erect with large leaves, whereas the legume species are low
growing (vine, rosette, or prostrate growth habit) with relatively small leaves. The
morphology of mustard species creates a very competitive environment for light
resources (Szumigalski and Van Acker, 2008); thus, when the mustard densities were
reduced and replaced with a less light competitive species the mustards were released
from this strong intraspecific competitive interaction. A second explanation may be that
the monoculture seeding densities for the mustard species were too high, and reducing the
proportional seeding densities in the mixtures created an over-yielding environment.
Many plant species exhibit a quadratic yield response to increasing plant density;
therefore, it is possible the seeding densities in this study were beyond optimum (Cox,
1996). However, the recommended seeding rates for the mustard species were consistent

22
across many information resources, and it is reasonable to assume that the densities used
in this study were sufficiently close to optimum.
Cover Crop Choice
When making decisions about which cover crop or mixture of cover crops to
plant, one must consider both the potential productivity and ecological stability of all
available options. To aid in a simple and effective cover crop selection process, rankings
of each cover crop species and mixture were determined for shoot yield in 2010 and
2011, yield stability, and for a combined measure of yield and stability with varying
weights distributed between the two variables (1:1, 2:1, and 4:1 for yield:stability). This
method and similar ranking methods have been used in the selection of high yielding and
stable maize hybrids (Kang, 1988; Kang and Pham, 1991). The ranking system proposed
by Kang and Pham (1991), which combines yield and stability ranks, provides an
example of how the “best” or highest ranked option can vary depending on the relative
importance placed on yield and stability. Consistent with the results of Kang and Pham
(1991), the relative ranking of cover crop options in this experiment varied depending on
the importance (weight) placed on yield or stability (Table 1.3). Kang and Pham (1991)
found that placing more than a 2x weight on yield (relative to stability) results in a
ranking that tends to reflect solely the yield ranks. In this study, the 4:1 yield-stability
rankings were only slightly different from the yield rankings; however, the 1:1 and 2:1
yield-stability rankings were substantially different from both the 4:1 yield-stability
rankings and yield rankings. Therefore, in order to choose a cover crop option that is
most likely to demonstrate stability over time, in addition to high productivity, one

23
should choose a combined yield-stability ranking with a 1:1 or 2:1 relative weight
assigned to yield and stability ranks, respectively (Kang, 1988).
When considering productivity and stability, regardless of the relative weight of
each, oilseed radish seems to be the most promising cover crop option observed in this
study, followed by the six-species mixture (6CC; Table 1.3). In contrast, chickling vetch
and Vicia villosa (hairy vetch) grown alone seem to be the two least promising cover crop
options when considering both yield and stability (Table 1.3). These rather simple
categorical rankings do not account for the over-yielding characteristics of cover crop
mixtures identified by the LER or the potential for biological nitrogen fixation of
legumes. However, depending on the management objective of the farmer, these rankings
could be expanded to include additional factors. Thus, the rankings presented here
should instead be used as a starting point for recommendations. It is also interesting to
note that cover crop mixtures were never ranked higher than second, but never lower than
eighth (of twelve). While mixtures may not provide the greatest potential for maximum
productivity in a given year, they do seem to buffer against unacceptably low
productivity.
Conclusions
The mustard species (Idagold mustard, Brassica juncea [Pacific Gold mustard],
oilseed radish, and Brassica napus [dwarf essex rape]) tested here proved to be fast
growing, competitive, and productive cover crops well suited for early spring growth in
the western Corn Belt. Conversely, the legume species tested (hairy vetch, Pisum sativum
[field pea], crimson clover, and chickling vetch) were far less competitive and almost half

24
as productive as the mustards. While the legume species were generally less impressive,
the potential for biological nitrogen fixation and utility as a green manure may
compensate for the limited productivity. Though generally lower, yield variability of
mixtures was not significantly different from monocultures. Instead, the primary benefit
of cover crop mixtures seemed to be the potential for over-yielding (LER values greater
than 1.0) that was observed in one year of this research.
This study provides specific recommendations about productive and stable spring-
sown cover crop options for the western Corn Belt, but also offers broad evidence and
insight regarding the ecological benefits of cover crop mixtures that should be applicable
to a variety of cover crop species, mixture combinations, planting dates, seasonal
weather, and agroecoregions. Ultimately, cover crop species or mixture choice will
depend on the specific management objective and the available threshold for risk. These
results provide an example of the information necessary for making these decisions as
part of a production package.

25
Literature Cited
Agegnehu, G., A. Ghizaw, and W. Sinebo. 2006. Yield performance and land-use
efficiency of barley and faba bean mixed cropping in Ethiopian highlands. European
Journal of Agronomy 25:202-207.
Akemo, M. C., E. E. Regnier, and M. A. Bennett. 2000. Weed suppression in spring-
sown rye (Secale cereale)–pea (Pisum sativum) cover crop mixes. Weed Technology
14:545-549.
Altieri, M. 1999. The ecological role of biodiversity in agroecosystems. Agriculture,
Ecosystems and Environment 74:19-31.
Bedoussac, L., and E. Justes. 2011. A comparison of commonly used indices for
evaluating species interactions and intercrop efficiency: Application to durum wheat–
winter pea intercrops. Field Crops Research 124:25-36.
Chen, C., M. Westcott, K. Neill, D. Wichman, and M. Knox. 2004. Row configuration
and nitrogen application for barley-pea intercropping in Montana. Agronomy Journal
96:1730-1738.
Clarke, J. M., F. R. Clarke, and G. M. Simpson. 1978. Effects of method and rate of
seeding on yield of Brassica napus. Canadian Journal of Plant Science 58:549-550.
Cox, W. J. 1996. Whole-plant physiological and yield responses of maize to plant
density. Agronomy Journal 88:489-496.
Creamer, N. G., and K. R. Baldwin. 2000. An evaluation of summer cover crops for use
in vegetable production systems in North Carolina. HortScience 35:600-603.
Creamer, N. G., M. A. Bennett, and B. R. Stinner. 1997. Evaluation of cover crop
mixtures for use in vegetable production systems. HortScience 32:866-870.
Francis, C. A. (ed.). 1986. Multiple cropping systems. Macmillan, New York.
Ghosh, P. K., M. C. Manna, K. K. Bandyopadhyay, Ajay, A. K. Tripathi, R. H. Wanjari,
K. M. Hati, A. K. Misra, C. L. Acharya, and A. Subba Rao. 2006. Interspecific
interaction and nutrient use in soybean/sorghum intercropping system. Agronomy
Journal 98:1097-1108.
Hooper, D. U., F. S. Chapin, J. J. Ewel, A. Hector, P. Inchausti, S. Lavorel, J. H. Lawton,
D. M. Lodge, M. Loreau, S. Naeem, B. Schmid, H. Setälä, A. J. Symstad, J.
Vandermeer, and D. A. Wardle. 2005. Effects of biodiversity on ecosystem
functioning: A consensus of current knowledge. Ecological Monographs 75:3–35.
Ikeorgu, J. E. G., H. C. Ezumah, and T. A. T. Wahua. 1989. Productivity of species in
cassava/maize/okra/ egusi melon complex mixtures in Nigeria. Field Crops Research 21:1-7.

26
Jolliffe, P. A. 2000. The replacement series. Journal of Ecology 88:371-385.
Kang, M. S. 1988. A rank-sum method for selecting high-yielding, stable corn genotypes.
Cereal Research Communications 16:113-115.
Kang, M. S., and H. N. Pham. 1991. Simultaneous selection for high yielding and stable
crop genotypes. Agronomy Journal 83:161-165.
Kuo, S., and E. J. Jellum. 2002. Influence of winter cover crop and residue management
on soil nitrogen availability and corn. Agronomy Journal 94:501–508.
Lavorel, S. 1999. Ecological diversity and resilience of Mediterranean vegetation to
disturbance. Diversity and Distributions 5:3-13.
Madden, N. M., J. P. Mitchell, W. T. Lanini, M. D. Cahn, E. V. Herrero, S. Park, S. R.
Temple, and M. Van Horn. 2004. Evaluation of conservation tillage and cover crop
systems for organic processing tomato production. HortTechnology 14:243-250.
Odhiambo, J. J. O., and A. A. Bomke. 2001. Grass and legume cover crop effects on dry
matter and nitrogen accumulation. Agronomy Journal 93:299–307.
Pimentel, D., C. Harvey, P. Resosudarmo, K. Sinclair, D. Kurz, M. McNair, S. Crist, L.
Shpritz, L. Fitton, R. Saffouriand, and R. Blair. 1995. Environmental and economic
costs of soil erosion and conservation benefits. Science 267:1117-1123.
Pimentel, D., U. Stachow, D. A. Takacs, H. W. Brubaker, A. R. Dumas, J. J. Meaney, J.
A. S. O'Neil, D. E. Onsi, and D. B. Corzilius. 1992. Conserving biological diversity
in agricultural/forestry systems. BioScience 42:354-362.
Power, J. E., and P. T. Koerner. 1994. Cover crop production for several planting and
harvest dates in eastern Nebraska. Agronomy Journal 86:1092-1097.
Reddy, K. N., R. M. Zablotowicz, M. A. Locke, and C. H. Koger. 2003. Cover crop,
tillage, and herbicide effects on weeds, soil properties, microbial populations, and
soybean yield. Weed Science 51:987-994.
Reddy, M. S., and R. W. Willey. 1981. Growth and resource use studies in an intercrop of
pearl millet/groundnut. Field Crops Research 4:13-24.
Sainju, U. M., and B. P. Singh. 1997. Winter cover crops for sustainable agricultural
systems: influence on soil properties, water quality, and crop yields. HortScience
32:21-28.
Szumigalski, A. R., and R. C. Van Acker. 2008. Land equivalent ratios, light
interception, and water use in annual intercrops in the presence or absence of in-crop
herbicides. Agronomy Journal 100:1145-1154.

27
Teasdale, J. R., and A. A. Abdul-Baki. 1998. Comparison of mixtures vs. monocultures
of cover crops for fresh-market tomato production with and without herbicide.
HortScience 33:1163-1166.
Teasdale, J. R., C. E. Beste, and W. E. Potts. 1991. Response of weeds to tillage and
cover crop residue. Weed Science 39:195-199.
Teasdale, J. R., L. O. Brandsaeter, A. Calegari, and F. Skora Neto. 2007. Cover crops and
weed management. In Non-chemical Weed Management. Eds. M. K. Upadhyaya and
R. E. Blackshaw. CAB International.
Tilman, D., C. L. Lehman, and C. E. Bristow. 1998. Diversity-stability relationships:
Statistical inevitability or ecological consequence? American Naturalist 151:277-282.
Tilman, D. 1996. Biodiversity: population versus ecosystem stability. Ecology 77:350–
363.
Tilman, D., C. L. Lehman, and K. T. Thomson. 1997. Plant diversity and ecosystem
productivity: theoretical considerations. Proceedings of the National Academy of
Science 94:1857–1861.
Tilman, D., P. B. Reich, J. Knops, D. Wedin, T. Mielke, and C. Lehman. 2001. Diversity
and productivity in a long-term grassland experiment. Science 294:843–845.
Tremmel, D. C., and F. A. Bazzaz. 1993. How neighbor canopy architecture affects target
plant performance. Ecology 74:2114-2124.
Trenbath, B. R. 1999. Multispecies cropping systems in India: Predictions of their
productivity, stability, resilience and ecological sustainability. Agroforestry Systems
45:81–107.
Willey, R. W., and D. S. O. Osiru. 1972. Studies on mixtures of maize and beans
(Phaseolus vulgaris) with special reference to plant population. Journal of
Agricultural Science 79:519–529.
Williams II, M. M., D. A. Mortensen, and J. W. Doran. 1998. Assessment of weed and
crop fitness in cover crop residues for integrated weed management. Weed Science
46:595-603.

28
Tables and Figures
Table 1.1. Common name, scientific name, and seeding rates for eight cover crop species planted as sole crops (SC) or mixtures
(2CC, 4CC, 6CC, and 8CC) in 2010 and 2011 near Mead, NE.
Cover Crop Seeding Rate
Common Name Scientific Name SC 2CC 4CC 6CC 8CC
________ kg ha
-1 ________
Hairy Vetch Vicia villosa 44.8 22.4 11.2 7.5 5.6
Idagold Mustard Sinapus alba 13.4 6.7 3.4 2.2 1.7
Field Pea Pisum sativum 112.0
28.0 18.7 14.0
Pacific Gold Mustard Brassica juncea 8.8
2.2 1.7 1.1
Crimson Clover Trifolium incarnatum 28.2
4.7 3.5
Oilseed Radish Raphanus sativus 16.8
2.8 2.1
Chickling Vetch Lathyrus sativus 67.2
8.4
Dwarf Essex Rape Brassica napus 13.6 1.7
28

29
Table 1.2. Partial land equivalent ratios (LERi) for eight cover crop species in the four possible mixtures (2CC, 4CC, 6CC, and 8CC)
pooled across 2010 and 2011. Numbers in parentheses indicate the standard error of the least squares mean. Different letters indicate
differences among means within a mixture.
Cover Crop Mixture
Cover Crop Species 2CC 4CC 6CC 8CC
Hairy Vetch 0.33 (0.14) b 0.15 (0.06) b 0.08 (0.05) d 0.07 (0.03) c
Idagold Mustard 0.98 (0.14) a 0.43 (0.06) a 0.48 (0.05) a 0.33 (0.03) a
Field Pea
0.13 (0.06) b 0.15 (0.05) cd 0.10 (0.03) c
Pacific Gold Mustard
0.39 (0.06) a 0.33 (0.05) b 0.19 (0.03) b
Crimson Clover
0.07 (0.05) d 0.04 (0.03) c
Oilseed Radish
0.17 (0.05) c 0.21 (0.03) b
Chickling Vetch
0.06 (0.03) c
Dwarf Essex Rape 0.19 (0.03) b
Total LER 1.31 (0.11) 1.10 (0.11) 1.27 (0.11) 1.19 (0.11)
29

30
Table 1.3. Rankings for each cover crop option considering shoot yield (2010 and 2011), yield stability (C.V.), and a combination of
yield and stability with varying weights (1:1, 2:1, and 4:1) attributed to each.
Shoot Yield C.V. Proportion of Yield to C.V.
2010 2011 1:1 2:1 4:1
Legumes
Crimson Clover 9 8
1
3 7 8
Field Pea 11 11
5
9 10 11
Hairy Vetch 10 9
10
11 11 10
Chickling Vetch 12 12
12
12 12 12
Mustards
Oilseed Radish 2 1
3
1 1 1
Dwarf Essex Rape 8 2
6
5 3 5
Pacific Gold Mustard 4 4
9
7 6 4
Idagold Mustard 1 10
11
10 9 7
Mixtures
2CC 6 6
4
4 3 6
4CC 7 7
7
8 8 8
6CC 3 4
2
2 2 2
8CC 5 3 8 6 3 3
30

31
Figure 1.1. Shoot dry weights (kg ha-1
) of eight cover crop species and four possible
mixtures of the eight species in 2010 and 2011 (see Table 1.1 for species and mixture
components and seeding rates). Pooled means of monoculture treatments vs. mixture
treatments is presented for each year. Error bars represent the standard error of the mean.
32
C. V
etch
Field P
ea
H. V
etch
C. C
love
r
D.E
. Rap
e
P.G
. Mus
tard
Oil. R
adish
I. M
usta
rd2C
C4C
C6C
C8C
C
Leg.
Mon
o.
Mus
t. M
ono.
Mixtu
re
Shoo
t dry
weig
ht
(kg h
a-1
)
0
1000
2000
3000
40002010
Cover crop treatment
C. V
etch
Field P
ea
H. V
etch
C. C
love
r
D.E
. Rap
e
P.G
. Mus
tard
Oil. R
adish
I. M
usta
rd2C
C4C
C6C
C8C
C
Leg.
Mon
o.
Mus
t. M
ono.
Mixtu
re
Shoo
t dry
weig
ht
(kg h
a-1
)
0
500
1000
1500
2000
2500
3000 2011
Legumes
Mustards
Mixtures
Contrasts

33
Figure 1.2. Coefficient of variation (C.V. %) for each cover crop monoculture and
mixture combination (2, 4, 6, and 8 species) pooled across replications (n=4) and years
(n=2). The mean and standard error of C.V.’s pooled within monoculture treatments
(n=8) and within mixture treatments (n=4) is also presented.
Cover crop treatments
C. V
etch
Field P
ea
H. V
etch
C. C
love
r
D. E
. Rap
e
P. G
. Mus
tard
Oil. R
adish
I. M
usta
rd2C
C4C
C6C
C8C
C
Mon
o.
Mixtu
re
C.V
. (%
)
0
10
20
30
40
50
60
Legumes
Mustards
Mixtures
Mono. vs. Mix.

34
Figure 1.3. Total land equivalent ratios (LER) for the four cover crop mixtures
(combinations of 2, 4, 6, and 8 species) in 2010 and 2011. Error bars represent the
standard error of the mean. A LER value greater than 1.0 suggests a given mixture is
more productive than its component sole crops.
Cover crop treatments
C. V
etch
Field P
ea
H. V
etch
C. C
love
r
D. E
. Rap
e
P. G
. Mus
tard
Oil. R
adish
I. M
usta
rd2C
C4C
C6C
C8C
C
Mon
o.
Mixtu
re
C.V
. (%
)
0
10
20
30
40
50
60
Legumes
Mustards
Mixtures
Mono. vs. Mix.

35
Chapter 2
Weed Biomass, Density, and Community Response to Cover Crop Mixtures and
Mechanical Termination Method
Abstract
Cover crops can provide many benefits in agroecosystems, including the
opportunity for improved weed control. However, the weed suppressive potential of
cover crops may depend on the species (or mixture of species) chosen, and the method of
cover crop termination and residue management. The objective of this study was to
determine the effects of increasing cover crop species diversity and mechanical
termination method on weed biomass, density, and community composition, and relative
crop yield in an organic cropping system. A field experiment was conducted from 2009
through 2011 near Mead, NE where spring-sown mixtures of 2, 4, 6, and 8 cover crop
species were included in a sunflower – soybean – corn crop rotation. Cover crops were
planted in late-March, terminated in late-May using a field disk or sweep plow
undercutter and main crops were planted within one week of termination. Terminating
cover crops with the undercutter consistently reduced early-season grass weed biomass
and late-season broadleaf weed cover, whereas termination with the field disk typically
stimulated grass weed biomass and total weed cover. The effects of cover crop mixture
were not evident in 2009, but the combination of the undercutter and the most diverse
mixture reduced early-season weed biomass by 48% relative to the no cover crop control
in 2010. Cover crops provided less weed control in 2011, where only the combination of
the undercutter and the two-species mixture reduced weed biomass (by 31%) relative to
the control. Weed community composition and species diversity were not influenced by

36
cover crop mixture. However, termination with the undercutter reduced abundance of
later-emerging summer annual weeds (velvetleaf and redroot pigweed) and promoted the
presence of common lambsquarters – an earlier-emerging summer annual weed.
Termination with the undercutter resulted in relative yield increases of 16.6 and 22.7% in
corn and soybean, respectively. In contrast, termination with the field disk resulted in a
relative yield reduction of 13.6% in soybean. The strong influence of termination method
highlights the importance of appropriate cover crop residue management in maximizing
potential agronomic benefits associated with cover crops.

37
Introduction
Cover crops can provide many benefits to agroecosystems, and there is growing
interest in cover crop use among a diverse range of agricultural stakeholders. The
potential for weed suppression is one benefit of cover crops of particular interest to
farmers in the Corn – Soybean Belt of the USA (Corn and Soybean Digest, 2010). Cover
crops have been shown to suppress weeds through physical interference (Teasdale et al.,
1991), light interception (Teasdale et al., 2007), buffered soil temperatures (Teasdale and
Mohler, 1993), increased habitat for weed seed predators (Gallandt et al., 2005), delayed
release of plant available nitrogen (Dyck et al., 1995; Moonen and Barberi, 2004), and
release of allelopathic phytotoxins (Blackshaw et al., 2001; Sarrantonio and Gallandt,
2003). The capacity for cover crops as a long-term weed management tool will depend on
a combination of these factors, but the mechanisms of physical interference and
allelopathy are often viewed as near-term weed management solutions.
Regardless of the mechanism, the success of cover crops as a weed management
tool will depend on the high-level production of biomass and resulting soil coverage
(Teasdale et al., 2007). Relative to light interception, it may be necessary to achieve 97%
soil coverage with cover crop residue to reduce weed density by 75% (Teasdale et al.,
1991). However, many cover crops are not grown to full maturity, so achieving
maximum biomass and soil coverage is difficult. Therefore, it is necessary to choose
cover crop species that provide additional mechanisms of weed control through
allelopathic activity or effects on germination cues (Teasdale et al., 2007). When cover
crop residue is decomposed in the soil, phytotoxins may be released that can inhibit the
emergence and growth of many weed species (Blackshaw et al., 2001; Dabney et al.,

38
1996; Davis and Liebman, 2003; Sarrantonio and Gallandt, 2003). There are many cover
crop species with demonstrated phytotoxicity such as rye (Secale cereale), crimson
clover (Trifolium incarnatum), hairy vetch (Vicia villosa), and members of the
Brassicaceae family (Putnam and Barnes, 1986; White et al., 1989; Norsworthy et al.,
2007).
All Brassicaceae spp. contain glucosinolates (Rosa et al., 1997), which are
hydrolyzed upon decomposition releasing biologically active compounds, such as
isothiocyanates, that inhibit weed seed germination (Petersen et al., 2001; Teasdale and
Taylorson, 1986, Norsworthy et al., 2007). The potential of glucosinolates to suppress
weed emergence and growth has been widely demonstrated in the greenhouse; thus,
Brassicaceae spp. are increasingly popular cover crops (Bialy et al., 1990; Boydston and
Hang, 1995; Al-Khatib et al., 1997; Eberlein et al., 1998; Krishnan et al., 1998; Petersen
et al., 2001; Norsworthy, 2003). Phytotoxin composition differs among and within
species and total production may depend on a variety of biotic and abiotic stresses (Ju et
al., 1980; Louda and Rodman, 1983; Branca et al., 2002). Moreover, the specific
allelopathic effects of individual phytotoxic compounds may be weed species specific
(Norsworthy et al., 2007). Therefore, a diverse mixture of allelopathic cover crop species
may be effective in targeting a broad range of weed species. Moreover, mixed species
communities may help to ensure stable, resilient, and productive cover crop yields that
will contribute to improved soil coverage and physical mechanisms of weed suppression
(Tilman et al., 2001; Teasdale et al., 2007; Wortman et al., 2012).
Cover crop choice is important, but appropriate cover crop termination method
and residue management may be the most critical factors in successfully using cover

39
crops for weed suppression. Cover crops can be terminated climatically (e.g., winterkill),
chemically, or through various mechanical measures (e.g., plowing, disking, mowing,
roller-crimping, or undercutting). The most appropriate termination method will depend
on the farm management objective. When managing for improved weed control, previous
studies have shown that termination methods resulting in maximum surface residue and
minimal soil disturbance have the greatest potential to inhibit weed germination and
growth (Teasdale et al., 1991; Teasdale et al., 2007). To this end, a sweep plow
undercutter may have great potential, especially in organic cropping systems where
chemical termination is prohibited. Creamer et al. (1995) demonstrated that cover crop
termination with a sweep plow undercutter created a thick and uniform cover crop mulch
and subsequent weed suppression was greater than when cover crops were terminated via
mowing (which finely shredded the cover crop). While other mechanical termination
methods such as the roller-crimper have shown great promise for weed control (Davis,
2010; Mischler et al., 2010), the sweep plow undercutter may be more effective in killing
cover crops at less mature growth stages (Creamer et al., 1995; Mirsky et al., 2009).
Moreover, the sweep plow undercutter is a traditional tillage implement in the US Great
Plains that may be more easily accessible compared to newer implements such as the
roller-crimper not yet widely distributed.
A three-year field experiment was conducted to determine the capacity of cover
crop mixtures to contribute to weed management in organic cropping systems. More
specifically, the objectives of this study were to (1) quantify the weed suppressive
potential of four cover crop mixtures of different levels of species diversity and two cover
crop termination methods; (2) determine the effects of cover crop mixture and

40
termination method on weed community composition and species diversity; and (3)
quantify the effects of cover crop mixture and termination method on crop yields relative
to a traditional organic cropping system with no cover crops. With respect to these
objectives, we hypothesized that increasing cover crop mixture diversity coupled with
termination via the undercutter would suppress a broad range of weed species leading to
distinct shifts in weed community composition and increased crop yield.
Materials and Methods
Experimental Site and Treatment Design
A field experiment was conducted in 2009, 2010 and 2011 at the University of
Nebraska-Lincoln Agricultural Research and Development Center (ARDC) near Mead,
Nebraska. Dominant soil type at the site is a Sharpsburg silty clay loam (fine, smectitic,
mesic typic Argiudoll) with 0 to 5% slopes. The experimental 2.8 ha field is certified for
organic production (OCIA International, Lincoln, NE), and is managed without irrigation.
This field was in organic alfalfa hay production for the five seasons prior to 2009. In the
fall of 2008 the experimental area was amended with 50 Mg ha-1
of liquid beef feedlot
manure that was incorporated via field disk. On March 15, 2009, the entire field
(excluding a weed-free control treatment) was seeded with 8.1 kg ha-1
of velvetleaf
(Abutilon theophrasti; ABUTH) seed, 2.6 kg ha-1
of common lambsquarters
(Chenopodium album; CHEAL) seed, 1.2 kg ha-1
of redroot pigweed (Amaranthus
retroflexus; AMARE) seed, and 3.7 kg ha-1
of green foxtail (Setaria viridis; SETVI) seed
to establish a common weed seedbank throughout the field.

41
The experiment was designed as a split-plot randomized complete block design
within 4 replications of a 3-year crop rotation. The rotation sequence consisted of
confectionery sunflower (Helianthus annuus L. ‘Seeds 2000 Jaguar’) – soybean (Glycine
max L. Merr. ‘Blue River Hybrids 2A71’) – corn (Zea mays L. var. ‘Blue River Hybrids
57H36’). Within each crop species, whole-plots (9.1 x 21.3 m; 12 crop rows spaced 0.76
m apart) were defined by cover crop mixture, while split-plots (4.6 x 21.3 m; 6 crop rows
spaced 0.76 m apart) were defined by cover crop termination method. Each “crop x cover
crop mixture x termination method” treatment combination was replicated within each
block so that each phase of the 3-year crop sequence was present each year within each
block. There were six whole-plot cover crop treatments: 1) two-species cover crop
mixture (2CC), 2) four-species cover crop mixture (4CC), 3) six-species cover crop
mixture (6CC), 4) eight-species cover crop mixture (8CC), 5) weedy but cover crop-free
(prior to main crop planting) control (WD), and 6) weed-free and cover crop-free (prior
to main crop planting) control (NC). The NC whole-plots were field disked and hand-
hoed twice prior to main crop planting, while the WD whole-plots were left unmanaged
until cover crop termination. Details on the individual species and seeding rates included
in each cover crop treatment whole-plot are included in Table 2.1.
Split-plot cover crop termination methods included either disking or undercutting.
Termination method was randomized within the first replication (southernmost) and
duplicated in the remaining three replications (north of the first replication) to facilitate
adequate speed for effective tillage operations driving north-south through the field.
Disking was conducted with a 4.6 m wide Sunflower 3300 (Sunflower Mfg., Beloit, KS,
USA) disk to an approximate depth of 15 cm. Undercutting was conducted with either a

42
Buffalo 6000 (Buffalo Equipment, Columbus, NE, USA) cultivator (modified for
undercutting) with seven overlapping 0.75 m wide sweep blades (2009) or a Miller Flex-
Blade sweep plow undercutter (2010 and 2011) with three overlapping 1.5 m sweep
blades. The undercutter sweeps are designed to cut a level plane through the soil at an
approximate depth of 10 cm, severing plant roots and minimizing soil inversion, resulting
in a layer of intact surface residue. Details on the design of the undercutter can be found
in Creamer et al. (1995).
Cover crop mixtures were planted via hand-crank broadcast seeding followed by
light incorporation with a John Deere 950 cultipacker (Deere and Company, Moline, IL,
USA). Generally, cover crops were planted in late-March, terminated in late-May, and
the main crop was planted within one week of termination. Specific dates for field
operations across all years are detailed in Table 2.2. Seeding rates for confectionery
sunflower, soybean, and corn were 62,000, 556,000, and 86,000 seeds ha-1
, respectively.
All crops were inter-row cultivated once (2009) or twice (2010 and 2011) approximately
30 days after planting the main crop. Seeds of all legume cover crop and crop species
were inoculated with appropriate rhizobia bacterial species prior to planting in 2009 and
2010.
Data Collection
Three (2009) or four (2010 and 2011) aboveground plant samples were taken
from each whole-plot experimental unit prior to cover crop termination to determine
productivity of the cover crop mixtures and weed communities. Samples were combined
within each experimental unit, dried at 60° C to constant mass and weighed. Three (2009)
or four (2010 and 2011) aboveground plant samples were taken from each split-plot

43
experimental unit approximately 30 days after planting the main crop (DAP) to quantify
weed species density and aboveground biomass. Samples were combined within each
split-plot experimental unit, sorted by species, and each component counted. In 2010 and
2011, the samples were then divided by broadleaf and grass weeds, dried at 60° C to
constant mass and weighed. The 2009 samples were divided by broadleaf and grass
weeds, fresh weights were recorded, and one composite sample (containing all weeds)
was dried to constant mass and weighed. A second sampling interval was conducted in
2010 at 50 DAP to quantify mid-season grass and broadleaf weed suppression.
The sampling quadrat area in 2009 consisted of three 0.3 x 0.3 m samples per
experimental unit. The sampling quadrat area in 2010 and 2011 was increased to four 0.3
x 0.6 m samples per experimental unit. Quadrats were placed at random locations
between (2009 and 2010) or within (2010 sampling at 50 DAP and 2011) crop rows of
each split-plot. Sample quadrats were placed within crop rows at the 2010 50 DAP
interval and in 2011 to avoid the inter-row area that was previously cultivated. The
second plant sampling interval (at 50 DAP in 2010) was replaced with a mid-season
visual rating of weed cover in 2009 and 2011. Ratings were determined by walking
through three rows of each split-plot experimental unit and assessing the proportion of
the plant canopy occupied by each of the four weed species planted prior to the 2009
growing season (ABUTH, ALBUM, AMARE, and all grass species combined including
SETVI). The visual rating was conducted in each experimental unit by three (2009) or
four (2011) individuals, and the mean of all ratings was used to estimate weed cover for
each species.

44
Grain yield was determined for each main crop by harvesting the middle 4 rows
of each split-plot experimental unit. Contents were weighed using a Weigh-Tronix 400
combine scale (Avery Weigh-Tronix, Fairmont, MN, USA) and adjusted for moisture
content in the lab. Corn grain yields were adjusted to 0.155, soybean to 0.130, and
sunflower to 0.10 g kg-1
moisture. Relative yield for each experimental unit was
calculated as:
Relative Yield = ((CCE - NC) / (NC)) * 100%
where CCE is the grain yield from one split-plot cover crop experimental unit and NC is
the grain yield from the no cover crop control (NC) experimental units averaged across
all replications within a given year.
Data Analysis
Weed biomass and weed cover data were either log- or root-transformed prior to
statistical analysis to improve normality and homogeneity of variances when necessary.
Least square means obtained from these analyses were back-transformed for presentation
in all tables and figures. After transformation (if necessary), values for weed biomass,
weed cover, and relative yield were compared among treatments using a linear mixed
model analysis of variance in the GLIMMIX procedure of SAS 9.2 (SAS Institute Inc.,
Cary, NC, USA). Weed species density data were compared among treatments using a
generalized Poisson mixed model for overdispersed count data, also using the GLIMMIX
procedure (SAS 9.2 User’s Guide, 2nd
ed.). Fixed effects in both models included main
crop, cover crop mixture, termination method and all possible interactions of these
effects. The random effects were block and the interaction of block by current crop by
cover crop mixture. Effects were tested within individual years due to experimental
45
changes in the cover crop mixture (buckwheat was replaced in all mixtures with Idagold
mustard after 2009) and interactions with year when initially included as a fixed effect.
Least square means and standard errors were calculated for all significant fixed effects at
an alpha level of 0.05. Lastly, a simple linear regression of cover crop biomass and weed
biomass at the first sampling interval between 2009 and 2011 was conducted using the
REG procedure in SAS 9.2 to quantify the potential role of physical interference in the
weed suppressive capacity of cover crop residue.
To aid in the visualization of statistical interactions, data were often plotted as
lines with cover crop mixture on the x-axis (Sosnoskie, 2006). The cover crop treatments
were arranged in order (left-to-right) of increasing species diversity (from zero in the NC
treatment to eight species in the 8CC treatment) along the x-axis, similar to the figures
presented by Tilman et al. (2001). However, we recognize that these data are not truly
continuous as is traditionally expected in line plots.
To further characterize weed species community composition, broadleaf weed
species density data were used to calculate indices of weed species diversity, evenness,
and richness for each split-plot experimental unit. Diversity (H’) was calculated using the
Shannon diversity index:
H’ = - ∑ Pi(Ln Pi), where Pi = Ni / Ntotal
where Ni = number of individuals of species i (plants m-2
) and Ntotal = total number of
individuals (plants m-2
). Evenness (J) was then calculated as:
J = H’ /Ln (S)
where S = species richness calculated as the total number of species per plot (Sosnoskie
et al. 2006; Wortman et al. 2010). Estimates of H’, J, and S for broadleaf weeds were

46
compared among management treatments using the GLIMMIX procedure in SAS 9.2 as
described previously.
Results and Discussion
Early-Season Weed Suppression
Grass weed biomass (fresh shoot weight) was influenced by the effects of main
crop and termination method at 32 DAP in 2009 (Table 2.3). Grass biomass was lowest
following termination with the undercutter (1137 g m-2
) compared to both disk
incorporation and the NC control (1254 g m-2
and 1279 g m-2
, respectively). In addition,
grass weed biomass was lowest in sunflower (1115 g m-2
) and greatest in corn (1288 g m-
2). Indeed, sunflower may be a competitive crop choice, especially in organic systems,
due to its capacity for early light interception (Geier et al., 1996) and allelopathic effects
on weed seed germination and growth (Leather, 1983). In 2010 (at 23 DAP), grass weed
biomass was influenced by the interaction of mixture and termination method (Table 2.3).
Termination with the undercutter in the 4CC and 8CC mixtures reduced biomass by 39
and 45%, respectively, relative to the NC control (Figure 2.1a). In contrast, termination
with the disk in the 6CC and 8CC mixtures stimulated grass weed biomass by 56 and
32%, respectively, relative to the NC control (Figure 2.1a). While grass weed biomass
was generally not influenced by the effect of increasing cover crop diversity, the
differences among mixtures within termination methods suggests there may be unique
characteristics associated with each mixture (e.g., biomass quantity, quality, biochemical
composition, or phytotoxins) driving this variable response.

47
Grass weed biomass was influenced by the effects of mixture and the interaction
of termination method by crop at 36 DAP in 2011 (Table 2.3). In general, grass weed
biomass was stimulated by the presence of cover crops (not weeds) regardless of
termination method (data not shown). However, the termination method by crop
interaction indicated that disk termination stimulated grass weed biomass in all crops
while termination with the undercutter reduced grass weed biomass only in soybean (data
not shown). The results in 2011 highlight the challenges of using high quality (low C:N
ratio) residue to suppress weeds regardless of termination strategy. As cover crops
increase nutrient availability, both crops and weeds are likely to respond with greater
growth if the weeds are not managed properly (Liebman and Davis, 2000). Moreover,
low quantities of legume cover crop residue (perhaps similar to levels found in a diverse
mixture) have been shown to stimulate weed seed germination and radicle elongation
(Teasdale and Pillai, 2005; Hill et al., 2006).
Broadleaf weed biomass was not affected by any of the fixed effects or
interactions at 32 DAP in 2009 (Table 2.3). Similarly, only the effect of main crop
influenced broadleaf weeds at 23 DAP in 2010, where weed biomass in sunflower was
reduced by 53 and 44% relative to weeds in corn and soybean. This is consistent with
grass weed response, and provides further support for the alleged competitiveness of the
sunflower crop. In 2011 (at 36 DAP), broadleaf weed biomass was again influenced by
the effect of crop, but also by the interaction of mixture by termination method (Table
2.3). In contrast to the 2010 results, broadleaf weed biomass was lowest in soybean (13.5
g m-2
) and greatest in corn and sunflower (26.2 and 22.2 g m-2
, respectively). This may be
related to the low level of weed biomass seen in the 2010 sunflower crop, which precedes

48
soybean in the rotation. This conclusion is based on the assumption that lower biomass at
23 DAP resulted in lower fecundity of broadleaf weeds and reduced emergence the
following year (Aarssen and Taylor, 1992). Managing weed populations for reduced
biomass and seed production is an essential component of integrated weed management
strategies in low-external-input cropping systems, especially when growing less
competitive crops like soybean (Kegode et al., 1999).
The interaction of mixture by termination method in 2011 was the result of
exceptionally high broadleaf weed biomass (51.8 g m-2
) in the WD/undercutter treatment
combination, relative to all other treatments combined (18.8 g m-2
). The large amount of
broadleaf weed biomass in the WD/undercutter treatment combination was related to the
ineffectiveness of the undercutter in terminating small weed seedlings. Creamer et al.
(1995) also found that plants were difficult to terminate with the undercutter if they had
not yet reached the mid- to late-bloom stage of maturity. The continuous and unmanaged
emergence of weed seedlings throughout the spring in the WD treatment resulted in a
weed community representing various growth stages. The undercutter sweeps travel at a
depth of 10 cm beneath the soil surface; thus, recently emerged weed seedlings with
shallow root systems may not have been effectively killed by the undercutting operation.
Presumably, this was not an issue in the cover crop mixtures as there were fewer weeds
growing in the mixtures, and those that were established were likely mature enough to
compete with the mixtures; thus, the root systems would be mature enough to be
effectively terminated by the undercutter.
Broadleaf weed density during the first sampling interval was influenced by crop
and termination method (2010 and 2011) or the interaction of termination by crop (2009;

49
Table 2.4). With regard to termination method, broadleaf weed density following
termination with the undercutter was always at least 36% less than the densities observed
following termination with the disk or the NC control (Table 2.5). Broadleaf weed
density spiked upward in 2010, where 115.2 plants m-2
were observed in the NC control
compared to 38.6 and 24.7 plants m-2
following termination with disk and undercutter,
respectively (Table 2.5). The interaction effect in 2009 was due to the lack of a
termination effect in sunflower, whereas trends in corn and soybean were consistent with
those observed across all other years and crops. It is possible that the competitive effects
of sunflower masked any additional weed suppressive potential of termination with the
undercutter. With regard to the influence of crop, broadleaf weed density was always
greatest in corn and lowest in either sunflower (2010) or soybean (2011; Table 2.5).
Consistent with the response of broadleaf biomass, reduced broadleaf weed density in
2011 soybean may be related to the strong competitive effects and reduced weed pressure
observed in sunflower in 2010. Indeed, sunflower is typically a more competitive crop
species than soybean (Geier et al., 1996).
When pooling grass and broadleaf weed biomass into a measure of total weed
biomass, results were similar to those for grass weed biomass in 2009 and 2010, as these
weeds dominated the community (Table 2.3; Figure 2.1b). However, a more even
distribution of grass and broadleaf weeds led to unique results for total weed biomass in
2011. Total weed biomass was influenced by the interactions of termination by main crop
and also termination by cover crop mixture at 36 DAP in 2011. Undercutting cover crop
mixtures for weed suppression was most effective in soybean, which led to the
termination by crop interaction. Overall, the undercutter was less effective in suppressing

50
weeds in 2011 as only the 2CC/undercutter treatment combination successfully reduced
total weed biomass relative to the NC control (Figure 2.2). While the undercutter was less
beneficial in 2011, using the field disk for termination was largely detrimental as total
weed biomass was stimulated by 58, 52, and 51% in the 2CC, 6CC, and 8CC mixtures,
respectively (Figure 2.2). Consistent with the results for broadleaf weed biomass, total
weed biomass in the WD/undercutter treatment combination was greater than that in the
WD/disk treatment combination. As observed in 2010, total weed biomass was greater in
the 6CC mixture regardless of termination method. Given the consistency of this result
across two consecutive years, it appears likely that the composition of species in the 6CC
mixture (Table 2.1) is uniquely beneficial to weed growth. Whereas increasing cover crop
diversity did not predictably decrease weed biomass and density as we hypothesized, we
did observe variable levels of weed suppression or stimulation across the four mixtures of
cover crops. The consistency of these trends (i.e., weed stimulation following the 6CC
mixture) suggests there is something unique to each mixture driving these differences.
There may be species interactions between/among cover crops in mixtures or
between/among cover crop mixtures and main crops that we could not detect in this
experimental design.
Variability in the weed suppressive capacity of cover crops is most often related
to cover crop biomass and productivity, especially when the residue is managed on the
soil surface to promote physical interference with weed seed emergence and growth
(Teasdale et al., 1991; Teasdale et al., 2007; Mirsky et al., 2011). Therefore, using
regression analysis we tested the hypothesis that the observed variability in weed
suppression among cover crop mixtures was related to variability in the biomass

51
productivity of the mixtures. However, we observed no relationship between these two
factors in any year of this study, regardless of termination method (data not shown). This
result suggests that the variability in weed suppression observed among mixtures is
related to the biochemical composition and quality of the mixture residue, and largely
independent of the quantity of mixture residue. This finding offers support for an
allelopathic (or facilitative in the case of the 6CC mixture), rather than a physical
mechanism of weed suppression for these cover crop mixtures, and opens the door for
further research on inter-specific allelopathic interactions.
The composition and concentration of individual allelopathic plant compounds is
often species and variety dependent (Branca et al., 2002); thus, it is possible that a
diversity of allelopathic interactions between cover crops and the numerous target weed
species resulted in lower weed emergence and growth for various mixtures (Norsworthy
et al., 2007). Though often documented in greenhouse studies, allelopathic effects of
cover crop residue on weed seed emergence and growth has been difficult to observe in
field studies (Haramoto and Gallandt, 2005). While we do not have the biochemical
analyses to directly support an allelopathic mechanism of suppression, elimination of the
physical interference hypothesis seems to leave few other logical alternatives. However,
one additional explanation for these results may be the potential for negative soil
microbial feedback effects. The negative soil feedback hypothesis suggests that changes
in the soil microbial community during cover crop growth create a soil environment less
suitable for germination and growth of certain weed species (Klironomos, 2002).
Unfortunately, elucidation of these mechanisms will require fundamental research
beyond the scope of this study.

52
Early-Season Weed Community Composition
Density of ABUTH was influenced by the three-way interaction of mixture,
termination method, and current crop at 32 DAP in 2009 (Table 2.4), but there were few
consistent differences among crops or cover crop mixtures. Despite this interaction, the
most noticeable trend in ABUTH density was driven by termination method where
density was greatest following termination with the disk (12.2 plants m-2
), followed by
the NC control (9.9 plants m-2
), and lowest following termination with the undercutter
(4.3 plants m-2
). Termination method strongly influenced ABUTH at 23 DAP also in
2010, but density was greatest in the NC treatment (55.5 plants m-2
), followed by
termination with the disk (19.9 plants m-2
), and lowest after termination with the
undercutter (10.3 plants m-2
). ABUTH density also was influenced by current crop with
the lowest densities occurring in the sunflower crop (10.7 plants m-2
) – substantially less
than the densities found within the corn crop (27.2 plants m-2
). Similar to results for 2009,
ABUTH density was influenced by the three-way interaction of mixture, termination
method, and current crop at 36 DAP in 2011 (Table 2.4). Again, the only consistent trend
was the effect of termination method, where the undercutter reduced ABUTH density by
51 and 60% relative to termination with the disk and the NC control, respectively.
Suppression of ABUTH density with cover crop surface mulch is consistent with
previous findings (Liebl et al., 1992). Moreover, the reduction in soil mixing with
conservation tillage implements like the undercutter can aid in reduced emergence of
dicot weed species like ABUTH (Buhler and Daniel, 1988; Liebl et al., 1992).
Density of AMARE was not different among cover crop mixtures, termination
methods, or crops at 32 DAP in 2009, but was influenced by the three-way interaction of

53
these factors at 23 DAP in 2010 (Table 2.4). This interaction was the result of
extraordinarily high densities of AMARE in the NC control and WD/disk treatment
combination in soybean (123.2 and 78.2 plants m-2
, respectively), along with elevated
densities in the NC control and the WD/disk treatment combination in corn (50.1 and
77.8 plants m-2
, respectively). In contrast, AMARE density was relatively low in the
sunflower crop with minor differences among mixtures and termination methods (Figure
2.3). Again, the strong competitive effects of sunflower seem to have masked any
potential effects of mixture or termination method on weed suppression. However,
reduced densities of AMARE in the cover crop mixtures (regardless of termination
method) provide evidence for the utility of cover crop mixtures as a weed management
tool. While the weed suppressive effects of cover crops are often inconsistent and species
specific, these results suggest that cover crop mixtures may be most effective when used
as a component of more diversified and integrated approaches to weed management
(Liebman and Davis, 2000).
Differences in AMARE densities were influenced by the interaction of
termination method by current crop at 36 DAP in 2011 (Table 2.4). Termination with the
undercutter reduced AMARE density by 61% relative to termination with the disk in
soybean. In sunflower, termination with the undercutter reduced AMARE density by 55
and 54% relative to the NC control and termination with the disk, respectively. In
contrast, AMARE density was elevated in corn but not influenced by the effect of
termination method. Similar to ABUTH, AMARE density was most effectively
suppressed with conservation tillage and the associated reduction in soil mixing (Liebl et
al., 1992).

54
Density of CHEAL was not different among cover crop mixtures, termination
methods, or crops at the first sampling intervals in 2009 or 2010; however, CHEAL was
influenced by the interaction of mixture by termination and the interaction of mixture by
crop at 36 DAP in 2011 (Table 2.4). The interaction of mixture by termination method
was strongest, where termination with an undercutter in the WD, 6CC, and 8CC
treatments led to increased CHEAL densities of 6.2, 2.2, and 1.5 plants m-2
, respectively
(Figure 2.4). Densities of CHEAL in all other mixture/termination method treatment
combinations were essentially zero. This result is consistent with the increased broadleaf
biomass following termination with the undercutter in 2011. Of the dominant broadleaf
weeds observed in this study, CHEAL was consistently the earliest emerging species in
the spring (Myers et al., 2004). Therefore, this was the most abundant weed species at the
time of cover crop/weed termination and thus the most probable species to survive the
undercutting operation. In contrast, ABUTH and AMARE typically emerged after the
termination operation, which explains improved suppression of these weeds following
termination with the undercutter (Liebl et al., 1992; Myers et al., 2004).
Broadleaf weed species richness, evenness, and diversity at the first sampling
interval (approximately 30 DAP) were not influenced by cover crop mixture in any year
of this study (data not shown). It was hypothesized that increasing the diversity of
allelopathic cover crop species in a mixture would suppress a broad range of weed
species, resulting in a more diverse but less dense weed community. Initially diverse
plant communities (polycultures) have previously been shown to beget subsequently
diverse weed communities (Palmer and Maurer, 1997). In contrast, increasing diversity of
crop rotations has been shown to reduce weed species diversity (Smith and Gross, 2007).

55
It is possible that spatial and temporal diversity of crop communities have unique
influences (potentially opposite) on weed community composition and species diversity.
The lack of differences observed in this study may be related to the short-term duration of
this cropping systems trial; typically, changes in weed community composition and
diversity have been observed in longer-term trials (e.g., Menalled et al., 2001; Sosnoskie
et al., 2006; Wortman et al., 2010).
Mid-Season Weed Biomass, Cover, and Community Composition
Weed cover (%) for grasses, ABUTH, CHEAL, AMARE, and total broadleaf
weeds was most commonly influenced by the effects of current main crop and
termination method at 74 DAP in 2009 (Table 2.6). Weed cover of most broadleaf and
grass weed species was lowest in the sunflower crop compared to both corn and soybean,
while broadleaf cover was typically greatest in soybean (Table 2.8). This is consistent
with the levels of weed biomass and densities observed in these crops at 32 DAP. With
regard to termination method, broadleaf weeds were typically greatest in the NC control
and lowest following termination with the undercutter (Table 2.8).
Grass biomass at 50 DAP in 2010 was influenced by the interaction of mixture by
current main crop, as cover crop mixtures tended to stimulate weed growth (relative to
the WD and NC controls) in corn and soybean, but not sunflower (Table 2.7). While
cover crops may aid in early season weed suppression via physical interference or
allelopathic effects, decomposition and mineralization of the cover crop residue may lead
to increased growth of both crops and weeds later in the growing season. This is
consistent with results of Teasdale et al. (1991), who found no difference in late-season
weed biomass despite early-season reductions in weed density with cover crop residue.

56
Broadleaf and total weed biomass responded similarly, where both were influenced by
the effect of current crop and the interaction of mixture by termination method (Table
2.7). Broadleaf and total weed biomass were consistently lowest in sunflower, followed
by corn, and greatest in soybean (data not shown). The interaction of mixture by
termination method was largely the result of a 33 and 220% increase in the WD/disk
relative to the WD/undercut treatment combination for total and broadleaf weed biomass,
respectively (Figure 2.5).
Despite several interactions, weed cover was most strongly influenced by current
crop and termination method at 57 DAP in 2011 (Table 2.6). Results in 2011 were
similar to those in 2009, where weed cover (both grasses and broadleaves) was lowest in
sunflower (Table 2.8). However, in contrast to 2009, weed cover was greater in corn
compared to soybean in 2011 (Table 2.8). Also similar to 2009 results, weed cover was
greatest following termination with the disk and lowest following termination with the
undercutter or in the NC control (Table 2.8). However, CHEAL cover was greatest
following termination with the undercutter (6.7%) compared to termination with the disk
(0.8%) and the NC control (0.5%; Table 2.8). This result is consistent with the increase in
CHEAL density at 36 DAP in 2011 following termination with the undercutter, which is
likely related to the early emergence timing of CHEAL relative to ABUTH and AMARE
(Myers et al., 2004).
Relative Crop Yield
Despite the effect of cover crop mixtures on weed biomass early in the growing
season, relative crop yield was only influenced by termination method in this study.
Relative to a traditional organic cropping system (NC control), cover crop termination

57
with the undercutter increased corn yield by 16.6%, while termination with the disk did
not alter yield (Figure 2.6). In soybean, the effect of cover crop termination method was
more pronounced. Termination with the undercutter increased yield by 22.7%, while
termination with the disk reduced yield by 13.6% relative to the NC control (Figure 2.6).
Despite an apparent yield benefit following the disk and undercutter for termination in
sunflower, the increase was not statistically different from the NC control due to
substantial variation in relative yield within and among years (Figure 2.6).
Many studies have demonstrated peripheral benefits of including cover crops in
agroecosystems, but yield gains are often difficult to detect (Reddy et al., 2003;
Haramoto and Gallandt, 2005; Russo et al., 2006). However, recent studies have
demonstrated the potential for cover crop mulches to increase or maintain grain yield
relative to a no cover crop control (Mischler et al., 2010). Many of these systems have
depended on herbicides for termination of cover crops and weeds (Swanton et al., 1999;
Shrestha et al., 2002; Teasdale et al., 2007), which has limited applicability for organic
farmers. The results of this study demonstrate the potential of cover crop mixtures to
increase crop yield in organic cropping systems when combined with a sweep plow
undercutter for termination.
Conclusions
Changes in weed biomass, density, and community composition were largely
driven by the current main crop and differences in cover crop termination strategies.
Reduced weed pressure following termination with the undercutter observed here is
congruent with the results of Creamer et al. (1995), who found reduced weed biomass

58
following cover crop termination with an undercutter compared to a flail mower.
Moreover, the stimulation of weed growth commonly observed following termination
with the disk and in the no cover control is consistent with previous work demonstrating
the risks of using intensive tillage for early-season weed control and seedbed preparation
(Liebl et al., 1992; Yenish et al., 1992; Mulugeta and Stoltenberg, 1997). Use of the
undercutter for weed control and cover crop termination has typically been limited to
sandier soils of the western US Great Plains. However, these results demonstrate
potential for this unique conservation tillage implement in the silty clay loam soils of
eastern Nebraska to aid in profitable cover crop and weed management for increased crop
yields in organic systems.
The influence of cover crop mixture and increasing cover crop diversity in this
study were far more subtle than the impacts of current main crop and termination method.
However, changes in weed biomass among cover crop mixtures were detectable early in
the growing season in two of three years. The lack of a relationship between cover crop
biomass and early-season weed biomass suggests that allelopathic or negative soil
microbial feedback mechanisms contributed to weed suppression in this study. While
allelopathic mechanisms of weed suppression are well understood for individual cover
crop species (e.g., Norsworthy et al., 2007), future studies should focus on the complex
interactions occurring at the plant-soil interface between diverse cover crop communities
and weed seed germination and growth.

59
Literature Cited
Aarssen, L. W., and D. R. Taylor. 1992. Fecundity allocation in herbaceous plants. Oikos
65:225-232.
Al-Khatib, K., C. Libbey, and R. Boydston. 1997. Weed suppression with Brassica green
manure crops in green pea. Weed Science 45:439-445.
Bialy, Z., W. Oleszek, J. Lewis and G. R. Fenwick. 1990. Allelopathic potential of
glucosinolates (mustard oil glycosides) and their degradation products against wheat.
Plant and Soil 129:277-281.
Blackshaw, R. E., J. R. Moyer, R. C. Doram, and A. L. Boswell. 2001. Yellow
sweetclover, green manure, and its residues effectively suppress weeds during fallow.
Weed Science 49:406-413.
Boydston, R. A., and A. Hang. 1995. Rapeseed (Brassica napus) green manure crop
suppresses weeds in potato (Solanum tuberosum). Weed Technology 9:669-675.
Branca, F., G. Li, S. Goyal, and C. F. Quiros. 2002. Survey of glucosinolates in Sicilian
wild and cultivated Brassicaceae. Phytochemistry 59:717-724.
Buhler, D. D., and T. C. Daniel. 1988. Influence of tillage systems on giant foxtail and
velvetleaf density and control in corn. Weed Science 36:642-647.
Creamer, N. G., B. Plassman, M. A. Bennett, R. K. Wood, B. R. Stinner, and J. Cardina.
1995. A method for mechanically killing cover crops to optimize weed suppression.
American Journal of Alternative Agriculture 10:157-162.
Corn and Soybean Digest. 2010. Why corn and soybean farmers don’t use cover crops.
<http://cornandsoybeandigest.com/conservation/why-corn-and-soybean-farmers-
dont-use-cover-crops> Verified 8 Jan. 2012.
Dabney, S. M., J. D. Schreiber, C. S. Rothrock, and J. R. Johnson. 1996. Cover crops
affect sorghum seedling growth. Agronomy Journal 88:961-970.
Davis, A. S. and M. Liebman. 2003. Cropping system effects on giant foxtail
demography I. Green manure and tillage timing. Weed Science 51:919-929.
Davis, A. S. 2010. Cover-crop roller-crimper contributes to weed management in no-till
soybean. Weed Science 58:300-309.
Dyck, E., M. Liebman, and M. S. Erich. 1995. Crop-weed interference as influenced by a
leguminous or synthetic fertilizer nitrogen source: I. Double cropping experiments
with crimson clover, sweet corn and lambsquarters. Agriculture, Ecosystems and
Environment 56:93-108.

60
Eberlein, C. V., M. J. Morra, M. J. Gittieri, P. D. Brown, and J. Brown. 1998.
Glucosinolate production by five field-grown Brassica napus cultivars used as green
manures. Weed Technology 12:712-718.
Gallandt, E. R., T. Molloy, R. P. Lynch, and F. A. Drummond. 2005. Effect of cover-
cropping systems on invertebrate seed predation. Weed Science 53:69-76.
Geier, P. W., L. D. Maddux, L. J. Moshier, and P. W. Stahlman. 1996. Common
sunflower (Helianthus annuus) interference in soybean (Glycine max). Weed
Technology 10:317-321.
Haramoto, E. R. and E. R. Gallandt. 2005. Brassica cover cropping: II. Effects on growth
and interference of green bean (Phaseolus vulgaris) and redroot pigweed
(Amaranthus retroflexus). Weed Science 53:702-708.
Hill, E. C., M. Ngouajio, and M. G. Nair. 2006. Differential response of weeds and
vegetable crops to aqueous extracts of hairy vetch and cowpea. HortScience 41:695–
700.
Ju, H. Y., C. Chong, B. B. Bible, and W. J. Mullin. 1980. Seasonal variation in
glucosinolate composition of rutabaga and turnip. Canadian Journal of Plant Science
60:1295-1302.
Kegode, G. O., F. Forcella, and S. Clay. 1999. Influence of crop rotation, tillage, and
management inputs on weed seed production. Weed Science 47:175-183.
Klironomos, J. 2002. Feedback with soil biota contributes to plant rarity and invasiveness
in communities. Nature 417:67-70.
Krishnan, G., D. L. Holshouser, and S. J. Nissen. 1998. Weed control in soybean
(Glycine max) with green manure crops. Weed Technology 12:97-102.
Leather, G. R. 1983. Sunflowers (Helianthus annuus) are allelopathic to weeds. Weed
Science 31:37-42.
Liebl, R., F. W. Simmons, L. M. Wax, and E. W. Stoller. 1992. Effect of rye (Secale
cereale) mulch on weed control and soil moisture in soybean (Glycine max). Weed
Technology 6:838-846.
Liebman, M., and A. S. Davis. 2000. Integration of soil, crop and weed management in
low-external-input farming systems. Weed Research 40:27–47.
Louda, S. M. and J. E. Rodman. 1983. Ecological patterns in the glucosinolate content of
a native mustard, Cardamine cordifolia, in the Rocky Mountains. Journal of
Chemical Ecology 9:397-422.

61
Menalled, F. D., K. L. Gross, and M. Hammond. 2001. Weed aboveground and seedbank
community responses to agricultural management systems. Ecological Applications
11:1586–1601.
Mirsky, S. B., W. S. Curran, D. A. Mortensen, M. R. Ryan, D. L. Shumway. 2009.
Control of cereal rye with a roller/crimper as influenced by cover crop phenology.
Agronomy Journal 101:1589-1596.
Mirsky, S. B., W. S. Curran, D. M. Mortensen, M. R. Ryan, and D. L. Shumway. 2011.
Timing of cover-crop management effects on weed suppression in no-till planted
soybean using a roller-crimper. Weed Science 59:380-389.
Mischler, R. A., W. S. Curran, S. W. Duiker, and J. A. Hyde. 2010. Use of a rolled-rye
cover crop for weed suppression in no-till soybeans. Weed Technology 24:253-261.
Moonen, A. C., and P. Barberi. 2004. Size and composition of the weed seedbank after 7
years of different cover-crop-maize management systems. Weed Research 44:163-
177.
Mulugeta, D., and D. E. Stoltenberg. 1997. Increased weed emergence and seed bank
depletion by soil disturbance in a no-tillage system. Weed Science 45:234-241.
Norsworthy, J. K. 2003. Allelopathic potential of wild radish (Raphanus raphanistrum).
Weed Technology 17:307-313.
Norsworthy, J. K., M. S. Malik, P. Jha, and M. B. Riley. 2007. Suppression of Digitaria
sanguinalis and Amaranthus palmeri using autumn-sown glucosinolate-producing
cover crops in organically grown bell pepper. Weed Research 47:425-432.
Palmer, M. W., and T. A. Maurer. 1997. Does diversity beget diversity? A case study of
crops and weeds. Journal of Vegetation Science 8:235-240.
Petersen, J., R. Belz, F. Walker, and K. Hurle. 2001. Weed suppression by release of
isothiocyanates from turnip-rape mulch. Agronomy Journal 93:37-43.
Reddy, K. N., R. M. Zablotowicz, M. A. Locke, and C. H. Koger. 2003. Cover crop,
tillage, and herbicide effects on weeds, soil properties, microbial populations, and
soybean yield. Weed Science 51:987-994.
Rosa, E., R. Heaney, G. Fenwick, and C. Portas. 1997. Glucosinolates in crop plants.
Pages 99-215, in J. Janick, ed. Horticultural Reviews. Volume 19. New York, Wiley.
Russo, V. M., B. Kindiger, and C. L. Webber, III. 2006. Pumpkin yield and weed
populations following annual ryegrass. Journal of Sustainable Agriculture 28:85-96.
Sarrantonio, M. and E. R. Gallandt. 2003. The role of cover crops in North American
cropping systems. Journal of Crop Production 8:53-73.

62
Shrestha, A., S. Z. Knezevic, R. C. Roy, B. R. Ball-Coelho, C. J. Swanton. 2002. Effect
of tillage, cover crop and crop rotation on the composition of weed flora in a sandy
soil. Weed Research 42:76-87.
Smith, R. G., Gross, K. L. 2007. Assembly of weed communities along a crop diversity
gradient. Journal of Applied Ecology 44:1046–1056.
Sosnoskie, L. M., C. P. Herms, and J. Cardina. 2006. Weed seedbank composition in a
35-yr-old tillage and rotation experiment. Weed Science 54:263-273.
Swanton, C. J., A. Shrestha, R. C. Roy, B. R. Ball-Coelho, and S. Z. Knezevic. 1999.
Effect of tillage systems, N, and cover crop on the composition of weed flora. Weed
Science 47:454-461.
Teasdale, J.R., C.E. Beste, and W.E. Potts. 1991. Response of weeds to tillage and cover
crop residue. Weed Science 39:195-199.
Teasdale, J. R., and C. L. Mohler. 1993. Light transmittance, soil temperature, and soil
moisture under residue of hairy vetch and rye. Agronomy Journal 85:673–680.
Teasdale, J. R. and R. B. Taylorson. 1986. Weed seed response to methyl isothiocyanate
and metham. Weed Science 34:520-524.
Teasdale, J. R., and P. Pillai. 2005. Contribution of ammonium to stimulation of smooth
pigweed (Amaranthus hybridus L.) germination by extracts of hairy vetch (Vicia
villosa Roth) residue. Weed Biology and Management 5:19–25.
Teasdale, J. R., L. O. Brandsaeter, A. Calegari, and F. Skora Neto. 2007. Cover crops and
weed management. In Non-chemical Weed Management. Eds. M.K. Upadhyaya and
R.E. Blackshaw. CAB International.
Tilman, D., P. B. Reich, J. Knops, D. Wedin, T. Mielke, and C. Lehman. 2001. Diversity
and productivity in a long-term grassland experiment. Science 294:843-845.
White, R. H., A. D. Worsham, and U. Blum. 1989. Allelopathic potential of legume
debris and aqueous extracts. Weed Science 37:674-679.
Wortman, S. E., J. L. Lindquist, M. Haar, and C. A. Francis. 2010. Increased weed
diversity, density and aboveground biomass in long-term organic crop rotations.
Renewable Agriculture and Food Systems 25:281-295.
Wortman, S. E., C. A. Francis, and J. L. Lindquist. 2012. Cover crop mixtures for the
western Corn Belt: Opportunities for increased productivity and stability. In Press.
Agronomy Journal.
Yenish, J. P., J. D. Doll, and D. D. Buhler. 1992. Effects of tillage on vertical distribution
and viability of weed seed in soil. Weed Science 40:429-433

63
Tables and Figures
Table 2.1. Cover crop species and seeding rates used in individual cover crop mixtures for 2009 and 2010-11 (2CC = 2 species
mixture; 4CC = 4 species mixture; 6CC = 6 species mixture; 8CC = 8 species mixture).
Cover Crop Seeding Rate
2CC 4CC 6CC 8CC
Common Name Scientific Name ____________
kg ha-1 _____________
Hairy Vetch Vicia villosa 22.4 11.2 7.5 5.6
Buckwheat (2009) Fagopyrum sagittatum 28.0 14.0 9.3 7.0
Idagold Mustard (2010-11) Sinapus alba 6.7 3.4 2.2 1.7
Field Pea Pisum sativum
28.0 18.7 14.0
Pacific Gold Mustard Brassica juncea
2.2 1.7 1.1
Oilseed Radish Raphanus sativus
2.8 2.1
Crimson Clover Trifolium incarnatum
4.7 3.5
Dwarf Essex Rape Brassica napus
1.7
Chickling Vetch Lathyrus sativus 8.4
63

64
Table 2.2. Timing of field operations and data collection for each year of the study.
Year
Operation 2009 2010 2011
Cover Crop Planting 20 March 30 March 21 March
Cover Crop Termination 22 May 28 May 3 June
Main Crop Planting 28 May 1-3 June 6 June
1st Weed Biomass Sampling 29-30 June 24-25 June 12-13 July
1st Inter-row Cultivation 1 July 28 June 30 June
2nd Inter-row Cultivation
1 July 8 July
2nd Weed Biomass Sampling/Visual Rating 10 August 19-26 July 2 August
64

65
Table 2.3. F-values from linear mixed model analyses of variance for fixed effects and all possible interactions of cover crop mixture,
termination method, and current crop on grass, broadleaf, and total weed biomass at 32, 23, and 36 DAP for the years 2009, 2010, and
2011, respectively. Significance of F-values is designated as * = P < 0.05, ** = P < 0.01, and *** = P < 0.001.
65

66
Source df a Grass biomass Broadleaf biomass Total biomass
2009
Mixture 4 0.81 1.47 0.72
Termination 1 5.59* 1.70 6.47*
Crop 2 4.94* 0.07 2.50
Mixture x termination 4 1.55 1.08 2.55
Mixture x crop 8 0.93 0.78 0.74
Termination x crop 2 0.85 2.74 0.60
Mixture x termination x crop 8 1.74 1.91 1.70
2010
Mixture 4 2.75* 2.54 2.18
Termination 1 95.84*** 0.39 94.98***
Crop 2 0.17 5.07** 0.41
Mixture x termination 4 3.30* 0.70 4.13**
Mixture x crop 8 0.42 0.50 0.59
Termination x crop 2 2.24 0.38 1.97
Mixture x termination x crop 8 1.62 0.33 1.48
2011
Mixture 4 3.32* 2.11 0.64
Termination 1 69.45*** 0.76 16.76***
Crop 2 3.19* 5.04** 5.04**
Mixture x termination 4 0.04 3.91** 4.61**
Mixture x crop 8 0.98 0.59 0.73
Termination x crop 2 3.65* 1.85 4.28*
Mixture x termination x crop 8 0.93 1.30 1.51
a Abbreviation: df, degrees of freedom.
66

67
Table 2.4. F-values from linear mixed model analyses of variance for fixed effects and all possible interactions of cover crop mixture,
termination method, and current crop on ABUTH, CHEAL, AMARE, and total broadleaf weed density at 32, 23, and 36 DAP for the
years 2009, 2010, and 2011, respectively. Significance of F-values is designated as * = P < 0.05, ** = P < 0.01, and *** = P < 0.001.
67

68
Source df a ABUTH CHEAL AMARE Broadleaves
2009
Mixture 4 1.09 1.12 0.03 1.67
Termination 1 23.55*** 1.29 0.01 27.68***
Crop 2 0.59 0.16 0.01 0.07
Mixture x termination 4 0.94 0.80 0.28 0.68
Mixture x crop 8 1.69 0.82 0.15 0.76
Termination x crop 2 4.37* 0.06 0.01 3.90*
Mixture x termination x crop 8 2.57* 0.47 1.10 1.43
2010
Mixture 4 1.07 0.03 3.08* 0.68
Termination 1 41.58*** 0.01 1.75 17.65***
Crop 2 7.20** 0.01 11.10*** 10.85***
Mixture x termination 4 0.49 0.01 3.69* 1.36
Mixture x crop 8 1.01 0.04 0.37 0.44
Termination x crop 2 0.03 0.01 1.71 0.64
Mixture x termination x crop 8 0.82 0.25 2.30* 1.46
2011
Mixture 4 1.94 108.80 1.92 1.00
Termination 1 40.18*** 0.04 9.31** 13.17***
Crop 2 11.98*** 0.01 25.70*** 23.12***
Mixture x termination 4 1.28 1.7 E +31*** 1.18 0.97
Mixture x crop 8 1.79 2.62* 1.27 1.12
Termination x crop 2 3.33* 0.01 3.35* 2.81
Mixture x termination x crop 8 2.91* 1.39 0.56 1.16 a Abbreviation: df, degrees of freedom.
68

69
Table 2.5. Total broadleaf weed density (plants m-2
) in response to current crop and
cover crop termination method at 32, 23, and 36 DAP for the years 2009, 2010, and 2011,
respectively. Data shown are back-transformed LS means, which eliminated the
possibility to present error terms. Instead, differences (α = 0.05) among transformed LS
means are indicated by different letters adjacent to the back-transformed value.
Year
2009 2010 2011
Effect Total broadleaf weed density (plants m-2
)
Crop
Corn 21.7 a 53.4 a 26.3 a
Soybean 19.3 a 37.9 b 8.3 b
Sunflower 18.5 a 20.8 c 21.7 a
Termination
No cover 25.3 a 115.2 a 24.2 a
Disk 24.1 a 38.6 b 20.3 a
Undercutter 10.1 b 24.7 c 12.9 b

70
Table 2.6. F-values from linear mixed model analyses of variance for fixed effects and all possible interactions of cover crop mixture,
termination method, and current crop on grass, ABUTH, CHEAL, AMARE, and total broadleaf weed cover at 74 and 57 DAP for the
years 2009 and 2011, respectively. Significance of F-values is designated as * = P < 0.05, ** = P < 0.01, and *** = P < 0.001.
Source df a Grasses ABUTH CHEAL AMARE Broadleaves
2009
Mixture 4 0.95 0.92 1.37 1.27 1.44
Termination 1 3.87 21.69*** 2.18 5.00* 8.21**
Crop 2 10.60*** 14.85*** 4.50* 2.98 19.92***
Mixture x termination 4 0.71 0.09 0.92 0.84 0.12
Mixture x crop 8 0.41 0.95 0.57 0.97 1.29
Termination x crop 2 0.73 0.96 1.20 1.76 1.73
Mixture x termination x crop 8 1.47 1.66 0.44 0.46 0.68
2011
Mixture 4 2.83* 3.77** 1.87 0.18 0.90
Termination 1 93.49*** 123.09*** 64.71*** 6.24* 20.06***
Crop 2 13.92*** 22.18*** 2.02 26.61*** 34.37***
Mixture x termination 4 0.74 1.28 2.28 0.30 1.62
Mixture x crop 8 1.29 0.72 1.46 0.56 0.68
Termination x crop 2 5.75** 4.18* 0.85 1.64 3.48*
Mixture x termination x crop 8 1.23 1.72 0.49 0.76 2.64*
a Abbreviation: df, degrees of freedom.
70

71
Table 2.7. F-values from linear mixed model analyses of variance for fixed effects and all possible interactions of cover crop mixture,
termination method, and current crop on grass, broadleaf, and total weed shoot biomass at 50 DAP in 2010. Significance of F-values
is designated as * = P < 0.05, ** = P < 0.01, and *** = P < 0.001.
Source df a Grass biomass Broadleaf biomass Total biomass
Mixture 4 4.07** 0.51 2.95*
Termination 1 2.08 0.05 3.32
Crop 2 22.48*** 13.98*** 40.21***
Mixture x termination 4 1.69 3.22* 4.11**
Mixture x crop 8 2.33* 0.65 1.96
Termination x crop 2 0.98 0.85 0.34
Mixture x termination x crop 8 0.46 0.64 0.87
a Abbreviation: df, degrees of freedom.
71

72
Table 2.8. Percent weed cover in response to main crop and cover crop termination
method at 74 and 57 DAP for the years 2009 and 2011, respectively. Data shown are
back-transformed LS means, which eliminated the possibility to present error terms.
Instead, differences (α = 0.05) among transformed LS means are indicated by different
letters adjacent to the back-transformed value.
Effect Grasses ABUTH CHEAL AMARE Broadleaves
__________ % weed cover
___________
2009
Crop
Corn 87.2 a 10.8 a 3.2 b 4.6 b 23.1 b
Soybean 85.8 a 10.7 a 5.7 a 5.7 a 27.6 a
Sunflower 82.5 b 5.4 b 3.4 b 3.8 b 15.6 c
Termination
No cover 82.6 b 13.6 a 2.3 b 6.0 a 27.8 a
Disk 86.1 a 9.9 b 3.8 a 4.8 ab 22.4 b
Undercutter 84.8 b 6.9 c 4.7 a 4.1 b 19.8 c
2011 Crop Corn 47.7 a 28.8 a 2.9 a 16.1 a 54.5 a
Soybean 36.7 b 23.6 b 2.9 a 11.2 b 46.8 b
Sunflower 32.5 c 14.4 c 1.8 b 6.1 c 26.8 c
Termination
No cover 28.2 b 20.3 b 0.5 b 11.2 ab 37.8 b
Disk 48.2 a 29.5 a 0.8 b 12.2 a 50.1 a
Undercutter 31.8 b 15.6 c 6.7 a 9.4 b 37.4 b

73
Figure 2.1. Grass (a) and total (b) weed shoot biomass (g m-2
) as influenced by the
interaction of cover crop mixture and termination method at 23 DAP in 2010. Data
shown are back-transformed LS means, which eliminated the possibility to present error
terms. Instead, differences (α = 0.05) among transformed LS means are indicated by
different letters above back-transformed data points. NC = no cover control; WD =
weedy mixture; 2-, 4-, 6-, and 8CC = 2, 4, 6, and 8 cover crop species mixtures,
respectively (Table 2.1).
Gra
ss w
ee
d s
ho
ot
bio
ma
ss (
g m
-2)
40
60
80
100
120
140
160
180
200
No Cover
Disk
Undercutter
a
cd cd
bc bc
ab
efde
f
cde
f
Cover crop mixture (no. of species)
NC WD 2CC 4CC 6CC 8CC
To
tal w
ee
d s
ho
ot
bio
ma
ss (
g m
-2)
40
60
80
100
120
140
160
180
200No Cover
Disk
Undercutter
bc
cd
bc bc
a
ab
de e
f
cde
f
a.
b.

74
Figure 2.2. Total weed shoot biomass (g m-2
) as influenced by the interaction of cover
crop mixture and termination method at 36 DAP in 2011. Data shown are back-
transformed LS means, which eliminated the possibility to present error terms. Instead,
differences (α = 0.05) among transformed LS means are indicated by different letters
above back-transformed data points. NC = no cover control; WD = weedy mixture; 2-, 4-,
6-, and 8CC = 2, 4, 6, and 8 cover crop species mixtures, respectively (Table 2.1).
Cover crop mixture (no. of species)
NC WD 2CC 4CC 6CC 8CC
Tota
l w
eed s
hoot
bio
mass (
g m
-2)
20
40
60
80
100No cover
Disk
Undercutter
cdefdefg
a
abcd
ab ab
abc
g
efg
bcde
fg

75
Figure 2.3. Total AMARE weed density (plants m-2
) as influenced by the interaction of
cover crop mixture, termination method, and current crop at 23 DAP in 2010. Data
shown are LS means and standard errors with a generalized Poisson distribution; thus, the
standard error varies with the mean for each treatment. NC = no cover control; WD =
weedy mixture; 2-, 4-, 6-, and 8CC = 2, 4, 6, and 8 cover crop species mixtures,
respectively (Table 2.1).

76
0
20
40
60
80
100
120
140
160No Cover
Disk
Undercutter
CornA
MA
RE
density (
pla
nts
m-2
)
0
20
40
60
80
100
120
140
160Soybean
Cover crop mixture (no. of species)
NC WD 2CC 4CC 6CC 8CC
0
20
40
60
80
100
120
140
160Sunflower

77
Figure 2.4. Total CHEAL weed density (plants m-2
) as influenced by the interaction of
cover crop mixture and termination method at 36 DAP in 2011. Data shown are LS
means and standard errors with a generalized Poisson distribution; thus, the standard
error varies with the mean for each treatment. NC = no cover control; WD = weedy
mixture; 2-, 4-, 6-, and 8CC = 2, 4, 6, and 8 cover crop species mixtures, respectively
(Table 2.1).
Cover crop mixture (no. of species)
NC WD 2CC 4CC 6CC 8CC
CH
EA
L d
ensity (
pla
nts
m-2
)
0
2
4
6
8
10
No Cover
Disk
Undercutter

78
Figure 2.5. Broadleaf (a) and total (b) weed shoot biomass (g m-2
) as influenced by the
interaction of cover crop mixture and termination method at 50 DAP in 2010. Data
shown are back-transformed LS means, which eliminated the possibility to present error
terms. Instead, differences (α = 0.05) among transformed least square means are indicated
by different letters above back-transformed data points. NC = no cover control; WD =
weedy mixture; 2-, 4-, 6-, and 8CC = 2, 4, 6, and 8 cover crop species mixtures,
respectively (Table 2.1).
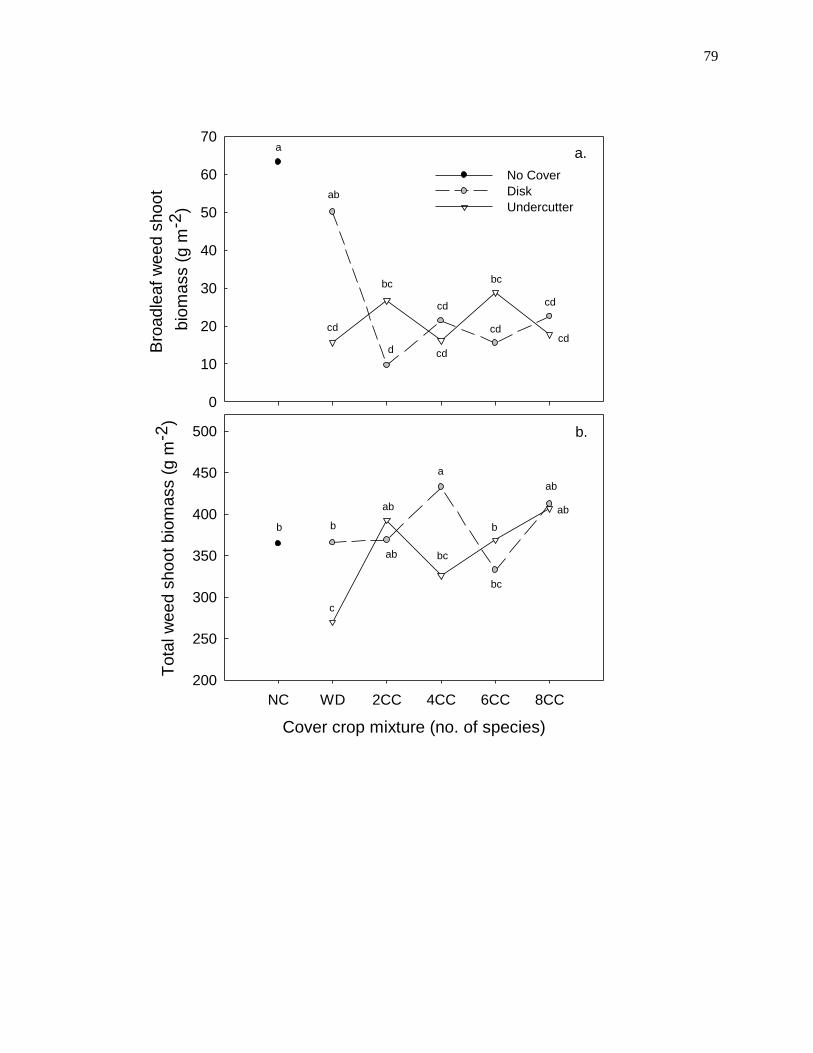
79
Cover crop mixture (no. of species)
NC WD 2CC 4CC 6CC 8CC
Tota
l w
eed s
hoot
bio
mass (
g m
-2)
200
250
300
350
400
450
500
a
ab
ab
b
ab
b
ab
b
bc
bc
c
Bro
adle
af
weed s
hoot
bio
mass (
g m
-2)
0
10
20
30
40
50
60
70
No Cover
Disk
Undercutter
a
ab
d
cd
cd
cd
cd
bc
cd
bc
cd
a.
b.

80
Figure 2.6. The effect of cover crop termination method (disk or undercutter) on crop
yield relative to the no cover crop control treatment pooled across 2009, 2010, and 2011
for each crop. Error bars indicate ± one standard error of the LS means.
Current crop
Corn Soybean Sunflower
Rela
tive y
ield
(%
)
-20
-10
0
10
20
30
Disk
Undercutter

81
Chapter 3
Relative influence of cover crop diversity, weed communities, and termination method on
soil microbial community structure
Abstract
Many studies have demonstrated microbial community response to individual
cover crop species, but the effect of increasing cover crop diversity has received less
attention. Moreover, the relationship between agricultural weeds and soil microbial
communities is not well understood. The objective of this study was to determine the
relative influence of cover crop diversity, spring weed communities, and plant
termination method on soil microbial community structure in an organic cropping system
through the extraction of fatty acid methyl esters (FAMEs). A field experiment was
conducted in 2009 and 2010 near Mead, NE where spring-sown mixtures of zero
(control), two, and eight cover crop species were included in a sunflower – soybean –
corn crop rotation. A mixture of four weed species was planted in all experimental units
(excluding the no-cover control), and also included as an individual treatment (e.g.,
weeds as a potential cover crop). Cover crops and weeds were planted in late-March,
terminated in late-May using a field disk or sweep plow undercutter, and main crops were
planted within one week of termination. Three (2009) or four (2010) soil cores were
taken to a depth of 20 cm in all experimental units at 45 and 32 days following cover crop
termination in 2009 and 2010, respectively. Total FAMEs were greatest in the 2 species
mixture – undercutter treatment combination (140.8 ± 3.9 nmol g-1
) followed by the 8
species mixture – undercutter treatment combination (132.4 ± 3.9 nmol g-1
). Five FAME

82
biomarkers (iC16:0, i10MeC17:0, i10MeC18:0, C16:1(cis11), C18:1(cis11)) were
reduced in the weedy treatment relative to both cover-cropped treatments and the no-
cover control. Termination with the undercutter reduced abundance of most actinomycete
biomarkers while termination with the field disk reduced abundance of C18:1(cis11) and
iC16:0. Canonical discriminant analysis of the microbial community successfully
segregated most cover crop mixture by termination method treatment combinations.
Segregation was most pronounced between the cover-cropped and weedy treatments,
which was due in part to reduced abundance of the biomarkers C18:1(cis11) and
i10MeC18:0 in the weedy treatment. While termination method did impact actinomycete
abundance, microbial communities were most strongly influenced by the presence and
type of early-spring plant communities (i.e., weeds vs. cover crops). Weeds may alter soil
microbial community structure as a means of increasing competitive success and this
relationship warrants further investigation.

83
Introduction
Soil microbial community composition is often responsive to a broad range of
ecosystem and management factors. Knowledge of microbial community composition
and diversity can provide valuable insight into soil function such as soil organic carbon
and nitrogen retention, nutrient cycling and overall soil stability and health (van Bruggen
and Semenov, 2000; Jackson et al., 2003). Several specific factors that may influence soil
microbial community structure include soil type, plant community composition, climatic
conditions, soil water availability, and soil management (Waldrop et al., 2000;
Drenovsky et al., 2004; Cookson et al., 2008). In agricultural management systems both
tillage and cover cropping are thought to influence microbial community structure,
though these changes to the community are likely the result of complex interactions
(Drijber et al., 2000; Buckley and Schmidt, 2001; Carrera et al., 2007). For example, one
management decision (e.g., cover cropping) can substantially alter the subsequent weed
community, labile soil carbon, and soil moisture; all of which may have unique impacts
on microbial community structure (Buyer et al., 2010).
One management factor that consistently alters microbial community composition
is the addition of organic carbon substrates, typical of organic cropping systems (Bossio
et al., 1998). Microbial communities are often limited by organic carbon availability;
thus, it is not surprising that the addition of labile organic matter (e.g., compost, manure,
and plant residue) will result in changes to community structure (Drenovsky et al., 2004).
In the short-term, organic management (e.g., cropping systems dependent on organic
carbon substrates for soil fertility) selects for microbial species that have the highest
growth rate and ability to absorb nutrients (Alden et al., 2001). Among other changes,

84
previous studies have reported increased abundance and diversity of bacteria and
arbuscular mycorrhizal fungi (AMF), as well as greater physiological diversity of
microbes in organically managed soils (Shannon et al., 2002; Oehl et al., 2003; van
Diepeningen et al., 2006). Cover crops are a common source of labile organic carbon in
organic cropping systems and have been shown to increase abundance of gram-negative
bacteria, fungi and AMF, actinomycetes, and protozoa for several months following
cover crop termination (Schutter et al., 2001; Carrera et al., 2007; Buyer et al., 2010).
Moreover, the presence of cover crops has been identified as the primary factor affecting
microbial community composition, despite differences in soil moisture and temperature
(Buyer et al., 2010). In contrast, one recent study found that species of cover crop (rye vs.
vetch) had little effect on community composition (Buyer et al., 2010); rather, the
addition of any labile organic matter (e.g., cover crops or compost) will likely result in
similar community changes (Drenovsky et al., 2004). However, differences in the
biochemical composition of plant species and the subsequent organic compounds
available to microbes may alter the composition of microbial communities (Zak et al.,
2003).
Several recent studies have reported plant species-dependent changes in microbial
communities of either the root rhizosphere or bulk soil (Germida et al., 1998; Kowalchuk
et al., 2002; Zak et al., 2003; van Diepeningen et al., 2006). Individual plant species and
communities have been shown to foster different levels of bacterivorous nematode
species (van Diepeningen et al., 2006), bacterial diversity (Germida et al., 1998),
microbial group abundance and overall community composition (Zak et al., 2003). Zak et
al. (2003) found that increasing plant community diversity reduced the abundance of soil

85
bacteria and actinomycetes, and increased abundance of soil fungi, though the effects
were confounded by differences in plant primary productivity (productivity increased
with diversity). Nonetheless, these studies suggest that a diverse plant community and the
individual species therein have the capacity to influence the composition of the soil
microbial community.
Weed communities may also exert species-specific impacts on soil microbial
community composition. Indeed, previous studies have demonstrated substantial effects
of weed species (e.g., Centaurea maculosa) on soil microbial functional group abundance
and community composition (Marler et al., 1999; Lutgen and Rillig, 2004; Batten et al.,
2006). These changes in microbial community composition are often viewed as a novel
competitive strategy and defense mechanism adapted by certain weedy and invasive
species (Marler et al., 1999; Callaway and Ridenour, 2004). However, many of these
observations have been limited to invasive weeds of unmanaged ecosystems and studies
on the effects of agricultural weeds on soil microbial community composition are rare.
Soil tillage is another agricultural management factor that results in immediate
and long-term changes to microbial community structure (Drijber et al., 2000; Jackson et
al., 2003). In general, tillage shifts soil microbial communities toward aerobic species
with high metabolic rates typical of bacteria species (Roper and Gupta, 1995). Indeed,
several studies have shown that switching from a no-tillage system to a disk or plow
management system reduces the ratio of fungi to bacteria (Frey et al., 1999; Pankhurst et
al., 2002). Soil tillage has also been shown to reduce diversity of soil bacteria and
abundance of microeukaryotes (Lupwayi et al., 1998; Jackson et al., 2003). While general
soil disturbance often results in predictable changes to the microbial community, there is

86
some evidence that different tillage practices (e.g., disk, moldboard plow, chisel plow)
will have variable effects on community structure, as one study demonstrated unique
community differences between a moldboard plow and a sub plow undercutter tillage
system (Drijber et al., 2000). With regard to cover crops, soil tillage associated with
different plant termination methods may influence microbial community structure.
Typically, cover crops are used as green manures for increasing soil nitrogen,
especially in organic cropping systems. To this end, soil incorporation of the cover crop
with a field disk or moldboard plow is usually most effective. This management practice
has been shown to increase abundance of total bacteria and gram-negative bacteria, while
the abundance of actinomycetes and fungi either decrease or remain stable (Zelles et al.,
1992; Lundquist et al., 1999; Drenovsky et al., 2004; Elfstrand et al., 2007). In contrast,
utilizing cover crops for weed control may require that residue be mulched and left on the
soil surface (Teasdale and Mohler, 1993). In general, residue placement on the soil
surface leads to greater abundance of fungi and AMF compared to soil incorporation of
residue (Doran, 1980; Holland and Coleman, 1987; Roper and Gupta, 1995; Elfstrand et
al., 2007). In addition to weed suppressive benefits, maintenance of cover crop residue on
the soil surface appears to create a favorable habitat for fungal growth characterized by
greater soil moisture and limited soil disturbance (Elfstrand et al., 2007). Fungal species
generally have a greater efficiency of carbon assimilation; thus, increasing the abundance
of fungi may increase soil carbon storage in agricultural systems (Holland and Coleman,
1987).
The objectives of this study were to quantify changes in total microbial
community structure and individual functional group abundance in response to increasing

87
cover crop diversity, spring weed communities, and different weed/cover crop residue
termination methods. To accomplish these objectives, we used soil extractions of fatty
acid methyl esters (FAMEs) to quantify the relative abundance of soil microbial
functional groups and changes in total community structure. We hypothesized that the
combined effects of increasing cover crop diversity and the management of residue on
the soil surface (via termination with a sweep plow undercutter) will result in a unique
microbial community structure characterized by an increased abundance of fungal
biomarkers.
Materials and Methods
Experimental Site and Design
A field experiment was conducted in 2009 and 2010 at the University of
Nebraska-Lincoln Agricultural Research and Development Center (ARDC) near Mead,
Nebraska. Dominant soil type at the site is a Sharpsburg silty clay loam (fine, smectitic,
mesic typic Argiudoll) with 0 to 5% slopes. The experiment was conducted in a 2.8 ha
field that is certified for organic production (OCIA International, Lincoln, NE), and is
managed without irrigation. This field was in organic alfalfa hay production between the
2004 and 2008 cropping seasons. In the fall of 2008 the experimental area was amended
with 50 Mg ha-1
of liquid beef feedlot manure that was incorporated with a field disk.
The experiment was designed as a split-plot randomized complete block design
within a 3-year crop rotation with 4 replications. The rotation sequence consisted of
confectionery sunflower (Helianthus annuus) – soybean (Glycine max) – corn (Zea
mays). Within each crop species, whole-plots (9.1 x 21.3 m; 12 crop rows spaced 0.76 m

88
apart) were defined by cover crop treatment, while split-plots (4.5 x 21.3 m; 6 crop rows
spaced 0.76 m apart) were defined by plant termination method. Each “crop x cover crop
mixture x termination method” treatment combination was replicated within each block
so that each phase of the 3-year crop sequence was present each year within each block.
There were four whole-plot cover crop treatments: 1) two-species cover crop mixture
(2CC), 2) eight-species cover crop mixture (8CC), 3) weedy but no cover crop prior to
main crop planting (WD), and 4) no cover crop and weed-free prior to main crop planting
(NC control). The NC whole-plots were field disked and hand-hoed twice prior to main
crop planting to remove emerged weed seedlings, while weeds in the WD whole-plots
were left unmanaged until cover crop termination. Details on the individual species and
seeding rates included in each cover crop treatment whole-plot are included in Table 3.1.
On March 15, 2009, the 2CC, 8CC, and WD treatments were seeded with 8.1 kg ha-1
of
velvetleaf (Abutilon theophrasti) seed, 2.6 kg ha-1
of common lambsquarters
(Chenopodium album) seed, 1.2 kg ha-1
of redroot pigweed (Amaranthus retroflexus)
seed, and 3.7 kg ha-1
of green foxtail (Setaria viridis) seed to establish a common weed
seedbank for weed suppression data collection.
Split-plot cover crop residue management methods included either disking or
undercutting. Management method was randomized within the first replication
(southernmost) and duplicated in the remaining three replications (north of the first
replication) to facilitate adequate speed for effective tillage operations driving north-
south through the field. Disking was conducted with a 4.6 m wide Sunflower 3300
(Sunflower Mfg., Beloit, KS, USA) disk to an approximate depth of 15 cm. Undercutting
was conducted with either a Buffalo 6000 (Buffalo Equipment, Columbus, NE, USA)

89
cultivator (modified for undercutting) with seven overlapping 0.75 m wide sweep blades
(2009) or a Miller Flex-Blade sweep plow undercutter (2010 and 2011) with three
overlapping 1.5 m sweep blades. The undercutter sweeps are designed to cut a level plane
through the soil at an approximate depth of 10 cm, severing plant roots and minimizing
soil inversion, resulting in a layer of intact surface residue. Details on the design of the
undercutter can be found in Creamer et al. (1995).
Cover crop mixtures were planted via hand-crank broadcast seeding followed by
light incorporation with a John Deere 950 cultipacker (Deere and Company, Moline, IL,
USA). Generally, cover crops were planted in late-March, terminated in late-May, and
main crops were planted within one week of termination. Specific dates for field
operations across both years are detailed in Table 3.2. Seeding rates for confectionery
sunflower, soybean, and corn were 62,000, 556,000, and 86,000 seeds ha-1
, respectively.
All crops were inter-row cultivated once (2009) or twice (2010) approximately 30 days
after planting the main crops. Seeds of all legume cover crop and crop species were
inoculated with appropriate rhizobia bacterial species prior to planting in 2009 and 2010.
Soil Sampling
Soil samples were taken for fatty acid methylated esters (FAME) soil microbial
analysis from 84 experimental units at 45 and 32 days after cover crop termination (DAT)
in 2009 and 2010, respectively. These samples represented four whole-plot treatments,
two split-plot treatments, three main crops, and four replications in each of two years.
The NC control treatment did not include split-plots, as there were no plants to terminate
and compare methods. This resulted in 168 composite samples for extraction and
analysis.

90
Soil sampling was conducted in an aseptic manner whenever possible. To this
end, nitrile gloves were worn during sampling and all supplies (soil probe, buckets, and
gloves) were sprayed with 91% isopropyl alcohol between sampling each experimental
unit. Three (2009) or four (2010) soil cores (3.2 cm diameter by 20 cm depth) were taken
within crop rows in each experimental unit. Cores were sampled from undisturbed soil
within crop rows to avoid the effects of inter-row cultivation that occurred prior to
sampling. Cores from each experimental unit were pooled in a plastic bucket and mixed
by hand to break up large aggregates and create a homogenous mixture of soil profiles.
A subsample of approximately 300 grams was then placed in a plastic freezer bag, sealed
and placed in an iced cooler for no more than 2 hours. When soil sampling was complete,
subsamples were stored in a refrigerator at 2° C for less than 24 hours until processing.
Soil samples were then sieved with a 0.47 cm sieve to remove large organic
residues. Similar to the sampling process, sieving was conducted aseptically by wearing
nitrile gloves, and spraying all equipment (gloves and sieves) with 91% isopropyl alcohol
between each sample. After sieving, 100 g of soil was weighed and placed back in each
plastic freezer bag. Sieved samples were then stored at -20° C until the time of FAME
extraction (approximately 6 months after sampling).
FAME Extraction
Microbial community composition was determined from fatty acid methyl esters
(FAMEs). The method, adapted from White et al. (1979), results in a direct hydrolysis,
derivatization, and extraction of FAMEs from soil microorganisms in situ. First, 10 g of
each frozen soil sample was weighed and placed in a 50 ml Teflon centrifuge tube.
Twenty ml of MeOH-KOH was then added to each Teflon tube in 10 ml increments, and

91
vortexed thoroughly after each addition. Samples were then placed in a 37° C water bath
for one hour, and mixed every 15 minutes during this hour. Upon removal from the water
bath, 2 ml of acetic acid were added to each sample to restore solution neutrality. Next, 5
ml of hexane was added to each sample. Samples were thoroughly vortexed and then
centrifuged for 10 minutes at 6000 rpm. The resulting hexane layer (with extracted
FAMEs in solution) was transferred via pipette to a 15 ml Pyrex tube. The extraction
procedure (hexane addition, centrifugation, and transfer) was repeated one time, and each
sample was then filtered through a PTFE 0.2 μm syringe filter into a Pyrex tube. The
filtered solvent was then evaporated under N2 gas to a small volume. Several drops of
benzene were added to each sample, mixed, and again evaporated under N2 gas until
visibly dry. The remaining sample was then redissolved in 1 ml of hexane and transferred
to a 2 ml vial. Samples were then stored at -20° C until preparation for gas
chromatography (GC) analysis. In preparation for GC analysis, hexane in each sample
was evaporated under N2 gas until completely dry and then 500 µl of hexane with C19:0
(0.05 mg/ml; as an internal standard) was added to each vial. A 50 µl aliquot of each
sample was then transferred to the GC vial and capped for analysis.
Individual FAMEs were separated by capillary gas chromatography on a Hewlett
Packard 5890 Series II gas chromatograph (Hewlett-Packard Company, Palo Alto, CA)
with helium as the carrier gas. Oven temperature in the GC was held at 100° C for 1 min
and then increased at 2.5° C min-1
to a final temperature of 225° C. Injector and flame
ionization detector temperatures were 250° C and 280° C, respectively. Determination of
FAME identity was accomplished through a comparison of retention times and
equivalent chain lengths with known standards (Bacterial Acid Methyl Esters CP Mix,

92
Supelco USA). FAME identities were then confirmed by gas chromatography mass
spectrometry (GC-MS). FAMEs were represented and written as the total number of
carbon atoms followed by a colon, the number of double bonds followed by the position
of those double bonds from the carboxyl end of the molecule, and its cis or trans
configuration in brackets (e.g., C16:1(cis11)).
Data Analysis
Consistent with previous studies, individual FAMEs were reported as a ratio (%
nmol) of total FAMEs (Petersen et al., 1997; Reichardt et al., 1997). FAMEs with
retention times less than C14:0 and greater than C20:0 were deleted from the data matrix.
Remaining FAME ratios or quantities in the data set were first analyzed by analysis of
variance (Proc MIXED; SAS 9.2, SAS Institute Inc., Cary, NC, USA) to determine
differences in total FAMEs and individual biomarkers among cover crop mixture,
termination, and main crop treatments.
Stepwise discriminant analysis and canonical discriminant analysis (Proc
STEPDISC and Proc CANDISC; SAS 9.2) were then performed to characterize changes
in overall soil microbial community structure in response to cover crop mixture and
termination method treatment combinations. Stepwise discriminant analysis was used to
identify individual FAMEs contributing most to treatment segregation. The resulting
discriminant model was then subjected to a canonical discriminant analysis. Mahalanobis
distances and the associated probabilities of significance (p-values) were used to detect
differences among treatment combinations. The number of significant (p < 0.05)
canonical discriminant functions (linear combinations of important FAME markers –
those identified in stepwise discriminant analysis) determined the number of dimensions

93
used to segregate among treatment groups. The first canonical discriminant function
always explains the most variation among treatment groups, followed by the second
function, and so on. Canonical coefficients were used to determine the relative magnitude
and directional relationship of FAME variables contributing to the canonical discriminant
functions. Discriminant scores were then calculated for each experimental unit across
both years (N = 168) with each significant discriminant function. Class means for all
discriminant scores within treatment combinations were plotted along with the canonical
coefficients for FAMEs in the significant discriminant functions.
To aid in the visualization of statistical interactions, FAME abundance and ratios
were often plotted as lines with cover crop mixture on the x-axis (Sosnoskie, 2006). The
cover crop treatments were arranged in order (left-to-right) of increasing species diversity
(from zero in the WD treatment to eight species in the 8CC treatment) along the x-axis
similar to the figures presented by Tilman et al. (2001). However, we recognize that these
data are not truly continuous as is traditionally expected in line plots.
Results and Discussion
Total FAMEs
While total extracted FAMEs is not a direct measure of microbial biomass, this
method has been well correlated with more traditional measures of biomass (Zelles et al.,
1992). Total FAMEs were greatest in the 2CC – undercutter treatment combination
(140.8 ± 3.9 nmol g-1
) followed by the 8CC– undercutter treatment combination (132.4 ±
3.9 nmol g-1
; Figure 3.1). However, there was no difference in total FAMEs among the
remaining treatment combinations. In contrast to our hypothesis, increasing carbon inputs

94
(in the form of cover crop and weed residue) did not consistently increase short-term total
FAMEs. However, cover crop termination with the undercutter generally increased total
FAMEs. This suggests that tillage with the undercutter resulted in a more favorable
microbial habitat early in the growing season. In previous studies, incorporation of plant
residue via disking or plowing typically increased bacterial abundance and reduced the
ratio of fungi to bacteria (Zelles et al., 1992; Lundquist et al., 1999; Pankhurst et al.,
2002; Drenovsky et al., 2004; Elfstrand et al., 2007). However, the results of this study
suggest that disk incorporation will reduce total FAMEs regardless of functional group,
relative to cover crop termination and surface residue management with a conservation
tillage implement like the undercutter. These results may indicate a general reduction in
microbial abundance and biomass as tillage intensity increases. This is consistent with
previous studies where microbial biomass was greater in surface soils of no-till
treatments relative to plowed treatments in a long-term wheat-fallow cropping system
(Doran et al., 1987; Drijber et al., 2000).
Individual FAME Ratios
Five FAME biomarkers (iC16:0, i10MeC17:0, i10MeC18:0, C16:1(cis11),
C18:1(cis11)) were influenced by the effect of cover crop treatment. More specifically,
abundance of these biomarkers was reduced in response to the WD treatment
(unmanaged spring weed communities; Table 3.3). Despite the relationship between plant
and microbial communities, there was no difference in individual FAME abundance
between the 2CC and 8CC treatments. The effects of increasing aboveground plant
diversity on soil microbial diversity and community composition are often subtle and
only detected within the root rhizosphere (Kowalchuk et al., 2002). Moreover, individual

95
FAME abundance was typically not different between cover-cropped treatments (2CC
and 8CC) and the NC control (Table 3.3). These results suggest that early-season weed
communities (primarily Chenopodium album, Abutilon theophrasti, Amaranthus
retroflexus, Thlaspi arvense, and Setaria viridis in this study) were altering microbial
communities by reducing the abundance of several functional groups relative to soil with
and without cover crop growth.
The unique influence of weedy and invasive plant species on soil microbial
community composition and specific functional groups has been observed previously
(Batten et al., 2006). However, the influence of weedy and invasive plants on microbial
community composition is not always consistent. Previous studies have found that weedy
species (i.e., Centaurea maculosa, Centaurea solstitialis, and Aegilops triuncialis) can
alter microbial community composition and increase the abundance of beneficial
microbial groups (i.e., AMF species; Marler et al., 1999; Batten et al., 2006). In addition,
these changes in microbial community structure have been shown to increase the
competitive advantage of the weedy species relative to native competitors (Marler et al.,
1999). In contrast, others have reported that C. maculosa reduces the abundance and
diversity of AMF (Lutgen and Rillig, 2004; Mummey and Rillig, 2006), which is more
consistent with the results of this study. The reduction of C16:1(cis11) and C18:1(cis11)
following spring weed growth in this study is especially relevant, as these markers have
been cited as FAME biomarkers for AMF (Olsson et al., 1995; Olsson et al., 1999; van
Aarle and Olsson, 2003). Mycorrhizal fungi can form mutualistic relationships with many
crop species, improving nutrient uptake and subsequent crop yield (Mosse, 1973); thus, it

96
would seem reduction of AMF abundance could be an effective competitive strategy for
weeds.
While invasive plant species (primarily C. maculosa) have been extensively
studied for effects on soil microbial communities, there have been relatively few studies
examining the role of arable system weeds on soil microbial community structure in
agroecosystems. Soil microbes have been viewed as a potential weed management tool
(e.g., seedbank depletion and plant pathogenic fungi; Schaefer and Kotanen, 2003;
Okalebo et al., 2011), but the influence of unmanaged weed communities on soil
microbial community dynamics represents a new frontier in weed and soil ecology.
Indeed, changes in the soil microbial community may influence competitive outcomes
between weed and crop species (Marler et al., 1999); thus, these interactions warrant
further investigation.
Plant termination with the undercutter reduced abundance of four actinomycete
biomarkers (8MeC16:0, i10MeC17:0, i10MeC18:0, a10MeC18:0) but increased
abundance of the actinomycete marker 10MeC18:0 relative to termination with the field
disk (Table 3.4). This result contradicts previous findings, where actinomycete
abundance was typically unaffected or reduced following cover crop termination with a
field disk or plow (Zelles et al., 1992; Lundquist et al., 1999; Drenovsky et al., 2004;
Elfstrand et al., 2007). It was hypothesized that termination with the undercutter would be
a less intensive termination strategy and more closely mimic soil community response to
no-till management observed in previous studies. Termination with the field disk did
reduce abundance of the fungal marker C18:1(cis11) and the bacterial marker iC16:0
relative to termination with the undercutter (Table 3.4). Reduced abundance of the

97
C18:1(cis11) fungal marker highlights the potentially negative effects of inversion tillage
(e.g., field disking) on soil fungi. C18:1(cis11) is part of the neutral lipid fraction in
arbuscular mycorrhizal fungi (AMF), which is essential to AMF metabolism (Graham et
al., 1995). These lipids are thought to be the substrate for extraradical mycelium
respiration (Bago et al., 2002). The majority of AMF biomass in the soil exists as
extraradical mycelium, so it has been hypothesized that C18:1(cis11) originates primarily
from AMF biomass (Olsson et al., 1999; van Aarle and Olsson, 2003). The reduction in
C18:1(cis11) following disk incorporation (relative to undercutting and the NC control)
observed here is congruent with many previous studies demonstrating that residue
placement on the soil surface leads to greater abundance of fungi and AMF compared to
full soil incorporation of residue (Doran, 1980; Holland and Coleman, 1987; Roper and
Gupta, 1995; Elfstrand et al., 2007). Reduced fungal abundance in the disk treatment may
be due to the complex interaction of factors associated with the soil habitat, including
reduced soil moisture and increased soil disturbance (Elfstrand et al., 2007).
Individual FAMEs were less influenced by the main crop, but the presence of
sunflower reduced the abundance of bacterial biomarkers iC15:0 and aC15:0 relative to
soil sampled in the corn crop (Table 3.5). In contrast, sunflower promoted the abundance
of the C18:2 (cis9,12) fungal biomarker (6.32 ± 0.18%) relative to soil sampled in the
corn (5.74 ± 0.18%) or soybean (5.77 ± 0.18%) crops (Table 3.5). The relatively weak
influence of individual plant species on soil microbial community composition is
consistent with previous studies (Buyer et al., 1999; Kielak et al., 2008). However,
changes in soil microbial community composition may be more pronounced as the crop
community matures throughout the growing season. Indeed, current crop can be a strong

98
driver of microbial community composition, often masking alternative influences like
tillage (Drijber et al., 2000).
The FAME C16:1(cis11) is commonly cited as a biomarker for AMF (Olsson et
al., 1995; Drijber et al., 2000), and was influenced by the three way interaction of cover
crop treatment, termination method, and year (F = 13.11, dfn = 2, dfd = 122, p < 0.0001).
Abundance of C16:1(cis11) in the 8CC – undercutter treatment combination (3.53 ± 0.28
nmol g-1
) was greater than the 8CC – disk treatment (2.77 ± 0.28 nmol g-1
) and both the
WD – disk and WD – undercutter treatment combinations (2.93 ± 0.28 nmol g-1
and 2.71
± 0.28 nmol g-1
, respectively) in 2009 (Figure 3.2). C16:1(cis11) abundance was also
elevated in the 2CC – disk and 2CC – undercutter treatment combinations (3.56 ± 0.28
nmol g-1 and 3.61 ± 0.28 nmol g
-1, respectively), but none of the treatment combinations
in 2009 was different from the NC control (3.15 ± 0.28 nmol g-1
).
Generally, C16:1(cis11) abundance was greater in cover-cropped treatments
compared to both WD treatments and the NC control in 2010 (Figure 3.2). The response
to termination method was inconsistent across cover crop treatments as the undercutter
increased C16:1(cis11) abundance in the 2CC cover crop mixture (4.18 ± 0.28 nmol g-1
)
but reduced abundance in the 8CC cover crop mixture (3.54 ± 0.28 nmol g-1
) relative to
termination with the disk. We hypothesized that cover crop termination with the disk
would reduce AMF abundance as intensive tillage has been shown to reduce ratios of
fungi to bacteria and AMF hyphal length and abundance (Frey et al., 1999; Drijber et al.,
2000; Pankhurst et al., 2002). While the effect of termination method was inconsistent,
the presence of cover crops often led to increased abundance of C16:1(cis11). This result
is consistent with Drijber et al. (2000) who found that abundance of C16:1(cis11)

99
decreased in the absence of carbon substrates (fallow period). However, it is unique that
the type of plant residue (weeds vs. cover crops) affected the abundance of C16:1(cis11).
Despite the addition of fresh carbon substrates in the WD treatments, C16:1(cis11) was
often lower (though not always significantly so) than levels in the cover-cropped
treatments (Figure 3.2). This reduction in AMF abundance following growth of weedy
species is consistent with previous studies (Lutgen and Rillig, 2004; Mummey and Rillig,
2006). However, information on the effects of agricultural weeds remains scarce.
Microbial Community Composition
Of the 42 FAMEs identified among all soil samples, 9 were included in the
discriminant function after stepwise discriminant analysis. Canonical discriminant
analysis then identified two significant disciminant functions (DA1 and DA2; p < 0.05),
which explained 65.2 and 14.3% of the variance, respectively, for a total explained
variance of 79.5%. The p-values associated with pairwise squared Mahalanobis distances
indicated that a majority of cover crop – termination method treatment groups segregate
from one another when using a rejection level of α = 0.10 (Table 3.6). However, when
using the more traditional α = 0.05 rejection level, segregation among treatments required
broader classifications. The most obvious segregation occurred between the WD
treatments (both disk and undercutter termination methods) and all other treatment
groups. This finding is consistent with univariate analyses indicating that the WD
treatments reduced five FAME ratios relative to both cover-cropped treatments and the
NC control (Table 3.3).
Termination method was effective in treatment segregation within the 2CC
mixture, but not within the 8CC or WD treatments. Cover-cropped treatments only

100
segregated from the NC control when combined with the undercutter for termination. In
contrast to our hypothesis, there were relatively minor differences in microbial
community composition among the 2CC and 8CC treatments. Instead, the early-season
weed communities were driving the most substantial changes in microbial community
composition (Table 3.6; Figure 3.3a). Indeed, the effect of increasing plant diversity on
soil microbial community composition is often limited to the soil rhizosphere or is not
detectable (Kowalchuk et al., 2002; Kielak et al., 2008). Few studies have addressed the
role of increasing plant diversity on soil microbial diversity and community composition
(Waldrop et al., 2006), but the results of this study in combination with others would
suggest that the proposed relationship is relatively weak.
FAME marker ratios positively correlated to DA1 (as indicated by positive
canonical coefficients) included i10MeC18:0, C18:1(cis11), C16:1(cis5), C17:1(cis9),
and C20:n (in order of highest to lowest canonical coefficients; Figure 3.3b). FAME
ratios for these biomarkers were generally greatest in cover-cropped treatment groups and
lowest in the WD treatments. The i10MeC18:0 marker has been cited as a FAME
biomarker for actinomycetes while C17:1(cis9) has been cited as a biomarker for bacteria
(Wortmann et al., 2008). Increased ratios of actinomycetes and fungi (C18:1(cis11)) in
the cover-cropped soils are congruent with previous studies (Schutter et al., 2001; Carrera
et al., 2007; Buyer et al., 2010). In contrast, negative canonical coefficients were found
for a10MeC18:0, C18:0, C18:1(cis13), and cyC19(9,10) (in order of most to least
negative canonical coefficients; Figure 3.3b). However, these are less common FAME
biomarkers that are not typically associated with major soil microbial function groups.

101
DA2 was positively correlated with FAME ratios for C17:1(cis9), C20:n,
cyC19(9,10), and C18:1(cis13), and negatively correlated with FAME ratios for
C18:1(cis11), i10MeC18:0, and C18:0 (Figure 3.3b). The largest segregation among
treatment groups by DA2 was between the NC control treatment and the undercutter
treatments (Figure 3.3a). This segregation suggests that ratios of C17:1(cis9) (a bacterial
biomarker), C20:n, cyC19(9,10), and C18:1(cis13) were greater in treatments with plant
residue managed on the soil surface (cover crops or weeds), whereas ratios of
C18:1(cis11) (a fungal biomarker), i10MeC18:0 (an actinomycete marker), and C18:0
were greatest in the NC treatment without any plant growth or subsequent residue cover.
The negative relationship between the cover crop – undercutter treatment combinations
and i10MeC18:0 is consistent with univariate analyses (Table 3.4) and suggests that the
soil environment following an undercutting operation is not conducive to actinomycete
growth. Previous studies have found that intensive tillage and full soil incorporation of
cover crop residue reduces actinomycete abundance (Zelles et al., 1992; Lundquist et al.,
1999; Drenovsky et al., 2004; Elfstrand et al., 2007), but this is the first evidence that the
sweep plow undercutter for cover crop termination negatively affects actinomycetes.
Another unexpected result was the negative relationship observed between C18:1(cis11)
and the undercutter – cover crop treatment combinations in the second discriminant
function. This was not consistent with univariate analysis (Table 3.4) and may not
represent a predictable shift in microbial community composition given that DA2
explained only 14.3% of the total variation in the data.

102
Conclusions
While the results for individual FAMEs and overall community composition were
sometimes inconsistent with previous studies, it is clear from this work that the type of
residue (cover crops vs. weeds) and the method of plant termination and residue
management resulted in unique changes to microbial community structure. While tillage
is often a strong driver of soil microbial community structure in managed ecosystems
(Drijber et al., 2000), the results of this study highlight the unique influence of weed
communities on specific soil microbial function groups and community structure as a
whole. Previous studies have found that plant species, community composition, and
diversity are relatively weak drivers of microbial community composition (Kielak et al.,
2008), but these results demonstrate the potential influence of plants when comparing
different plants classifications (weedy species vs. cultivated crops). Future studies should
be directed toward understanding the prominent role of agricultural weed communities in
driving microbial community composition and also toward determining the functions of
these unique communities and functional groups (Torsvik et al., 2002).

103
Literature Cited
Alden, L., F. Demoling, and E. Baath. 2001. Rapid method of determining factors
limiting bacterial growth in soil. Applied and Environmental Microbiology 67:1830-
1838.
Bago, B., W. Zipfel, R. M. Williams, J. Jun, R. Arreola, P. J. Lammers, P. E. Pfeffer, and
Y. Shachar-Hill. 2002. Translocation and utilization of fungal storage lipid in the
arbuscular mycorrhizal symbiosis. Plant Physiology 128:108–124.
Batten, K. M, K. M. Scow, K. F. Davies, S. P. Harrison. 2006. Two invasive plants alter
soil microbial community composition in serpentine grasslands. Biological Invasions
8:217–230.
Bossio, D. A., K. M. Scow, N. Gunapala, and K. J. Graham. 1998. Determinants of soil
microbial communities: effects of agricultural management, season, and soil type on
phospholipid fatty acid profiles. Microbial Ecology 36:1-12.
Buckley, D. H., and T. M. Schmidt. 2001. The structure of microbial communities in soil
and the lasting impact of cultivation. Microbial Ecology 42:11-21.
Buyer, J. S., D. P. Roberts, and E. Russek-Cohen. 1999. Microbial community structure
and function in the spermosphere as affected by soil and seed type. Canadian Journal
of Microbiology 45:138–144.
Buyer, J. S., J. R. Teasdale, D. P. Roberts, I. A. Zasada, and J. E. Maul. 2010. Factors
affecting soil microbial community structure in tomato cropping systems. Soil
Biology and Biochemistry 42:831-841.
Callaway, R. M., and W. M. Ridenour. 2004. Novel weapons: Invasive success and the
evolution of increased competitive ability. Frontiers in Ecology and the Environment
2:436–443.
Carrera, L. M., J. S. Buyer, B. Vinyard, A. A. Abdul-Baki, L. J. Sikora, and J. R.
Teasdale. 2007. Effects of cover crops, compost, and manure amendments on soil
microbial community structure in tomato production systems. Applied Soil Ecology
37:247-255.
Cookson, W. R., D. V. Murphy, and M. M. Roper. 2008. Characterizing the relationships
between soil organic matter components and microbial function and composition
along a tillage disturbance gradient. Soil Biology and Biochemistry 40:763-777.
Creamer, N. G., B. Plassman, M. A. Bennett, R. K. Wood, B. R. Stinner, and J. Cardina.
1995. A method for mechanically killing cover crops to optimize weed suppression.
American Journal of Alternative Agriculture 10:157-162.
Doran, J. 1980. Microbial changes associated with residue management with reduced
tillage. Soil Science Society of America Journal 44:518-524.

104
Doran, J.W. 1987. Microbial biomass and mineralizable nitrogen distributions in no-
tillage and plowed soils. Biology and Fertility of Soils 5:68-75.
Drenovsky, R. E., D. Vo, K. J. Graham, and K. M. Scow. 2004. Soil water content and
organic carbon availability are major determinants of soil microbial community
composition. Microbial Ecology 48:424-430.
Drijber, R. A., and W. B. McGill. 1994. Sulfonolipids as a biomarker to monitor the
population dynamics of the genera Cytophaga and Flexibacter in soil worked by the
earthworm Aporrectodea turgida. Soil Biology and Biochemistry 26:1395 -1403.
Drijber, R. A., J. W. Doran, A. M. Parkhurst, and D. J. Lyon. 2000. Changes in soil
microbial community structure with tillage under long-term wheat-fallow
management. Soil Biology and Biochemistry 32:1419-1430.
Elfstrand, S., B. Bath, and A. Martensson. 2007. Influence of various forms of green
manure amendment on soil microbial community composition, enzyme activity and
nutrient levels in leek. Applied Soil Ecology 36:70-82.
Frey, S. D., E. T. Elliott, and K. Paustian. 1999. Bacterial and fungal abundance and
biomass in conventional and no-tillage agroecosystems along two climatic gradients.
Soil Biology and Biochemistry 31:573-585.
Germida, J. J., S. D. Siciliano, J. R. de Freitas, A. M. Seib. 1998. Diversity of root-
associated bacteria associated with field-grown canola (Brassica napus L.) and wheat
(Triticum aestivum L.). FEMS Microbiology Ecology 26:43-50.
Graham, J. H., N. C. Hodge, J. B. Morton. 1995. Fatty acid methyl ester profiles for
characterization of Glomalean fungi and their endomycorrhizae. Applied and
Environmental Microbiology 61:58–64.
Grogan, D.W., J. E. Cronan Jr. 1997. Cyclopropane ring formation in membrane lipids of
bacteria. Microbiology and Molecular Biology Reviews 61:429-441.
Holland, E. A., and D. C. Coleman. 1987. Litter placement effects on microbial and
organic matter dynamics in an agroecosystem. Ecology 68:425-433.
Jackson, L. E., F. J. Calderon, K. L. Steenworth, K. M. Scow, and D. E. Rolston. 2003.
Responses of soil microbial processes and community structure to tillage events and
implications for soil quality. Geoderma 114:305-317.
Kates, M. 1986. Techniques of lipidology: isolation, analysis and identification of lipids.
In: Burdon, R.H., van Kippenberg, P.H. (Eds.), Laboratory Techniques in
Biochemistry and Molecular Biology, vol. 3, Part 2. Elsevier, NY.
Kielak, A., A. S. Pijl, J. A. Van Veen, and G. A. Kowalchuk. 2008. Differences in
vegetation composition and plant species identity lead to only minor changes in soil-

105
borne microbial communities in a former arable field. FEMS Microbiology Ecology
63:372–382.
Kowalchuk, G. A., D. S. Buma, W. de Boer, P. G. L. Klinkhamer, J. A. van Veen. 2002.
Effects of above-ground plant species composition and diversity on the diversity of
soil-borne microorganisms. Antonie van Leeuwenhoek 81:509-520.
Lutgen, E. R., and M. C. Rillig. 2004. Influence of spotted knapweed (Centaurea
maculosa) management treatments on arbuscular mycorrhizae and soil aggregation.
Weed Science 52:172–177.
Lundquist, E. J., L. E. Jackson, K. M. Scow, and C. Hsu. 1999. Changes in microbial
biomass and community composition, and soil carbon and nitrogen pools after
incorporation of rye into three California agricultural soils. Soil Biology and
Biochemistry 31:221-236.
Lupwayi, N. Z., W. A. Rice, and G. W. Clayton. 1998. Soil microbial diversity and
community structure under wheat as influenced by tillage and crop rotation. Soil
Biology and Biochemistry 30:1733-1741.
Marler, M. J., C. A. Zabinski, and R. M. Callaway. 1999. Mycorrhizae indirectly enhance
competitive effects of an invasive forb on a native bunchgrass. Ecology 80:1180–
1186.
Mosse, B. 1973. Advances in the study of vesicular-arbuscular mycorrhiza. Annual
Review of Phytopathology 11:171-196.
Nichols, P. D., J. B. Guckert, and D. C. White. 1986. Determination of monounsaturated
fatty acid double-bond position and geometry for microbial monocultures and
complex consortia by capillary GC-MS of their dimethyl disulphide adducts. Journal
of Microbiological Methods 5:49-55.
Oehl, F., E. Sieverding, K. Ineichen, P. Mader, T. Boller, and A. Wiemken. 2003. Impact
of land use intensity on the species diversity of arbuscular mycorrhizal fungi in
agroecosystems of central Europe. Applied and Environmental Microbiology
69:2816-2824.
Okalebo, J., G. Y. Yuen, R. A. Drijber, E. E. Blankenship, C. Eken, and J. L. Lindquist.
2011. Biological suppression of velvetleaf (Abutilon theophrasti) in an eastern
Nebraska soil. Weed Science 59:155-161.
Olsson, P. A., Baath, E., Jakobsen, I., Soderstrom, B. 1995. The use of phospholipid and
neutral lipid fatty acids to estimate biomass of arbuscular mycorrhizal fungi in soil.
Mycological Research 99:623-629.
Olsson, P. A., I. Thingstrup, I. Jakobsen, and E. Baath. 1999. Estimation of biomass of
arbuscular mycorrhizal fungi in a linseed field. Soil Biology and Biochemistry 31:
1879-1887.

106
Pankhurst, C. E., C. A. Kirkby, and B. G. Hawke. 2002. Impact of a change in tillage and
crop residue management practice on soil chemical and microbiological properties in
a cereal-producing red duplex soil in NSW, Australia. Biology and Fertility of Soils
35:189-196.
Petersen, S. O., K. Debosza, P. Schjùnning, B. T. Christensen, and S. Elmholt. 1997.
Phospholipid fatty acid profiles and C availability in wet-stable macro-aggregates
from conventionally and organically farmed soils. Geoderma 78:181-196.
Reichardt, W., G. Mascarina, B. Padre, and J. Doll. 1997. Microbial communities in
continuously cropped, irrigated rice fields. Applied and Environmental Microbiology
63:233-238.
Roper, M. M., and V. V. S. R. Gupta. 1995. Management practices and soil biota.
Australian Journal of Soil Research 33:321–339.
Schafer, M., and P. M. Kotanen. 2003. The influence of soil moisture on losses of buried
seeds to fungi. Acta Oecologia 24:255–263.
Schutter, M. E., J. M. Sandeno, and R. P. Dick. 2001. Seasonal, soil type, and alternative
management influences on microbial communities of vegetable cropping systems.
Biology and Fertility of Soils 34:397-410.
Shannon, D., A. M. Sen, and D. B. Johnson. 2002. A comparative study of the
microbiology of soils managed under organic and conventional regimes. Soil Use and
Management 18:274-283.
Sosnoskie, L. M., C. P. Herms, and J. Cardina. 2006. Weed seedbank composition in a
35-yr-old tillage and rotation experiment. Weed Science 54:263-273.
Teasdale, J. R., and C. L. Mohler. 1993. Light transmittance, soil temperature, and soil
moisture under residue of hairy vetch and rye. Agronomy Journal 85:673-680.
Tilman, D., P. B. Reich, J. Knops, D. Wedin, T. Mielke, and C. Lehman. 2001. Diversity
and productivity in a long-term grassland experiment. Science 294:843–845.
Torsvik, V., and L. Øvreås. 2002. Microbial diversity and function in soil: from genes to
ecosystems. Current Opinion in Microbiology 5:240–245.
van Aarle, I. M., and P. A. Olsson. 2003. Fungal lipid accumulation and development of
mycelial structures by two arbuscular mycorrhizal fungi. Applied and Environmental
Microbiology 69:6762–6767.
van Bruggen A. H. C., and A. M. Semenov. 2000. In search of biological indicators for
soil health and disease suppression. Applied Soil Ecology 15:13-24.

107
van Diepeningen, A. D., O. J. de Vos, G. W. Korthals, and A. H. C. van Bruggen. 2006.
Effects of organic versus conventional management on chemical and biological
parameters in agricultural soils. Applied Soil Ecology 31:120-135.
Waldrop, M. P., T. Balser, and M. K. Firestone. 2000. Linking microbial community
composition to function in a tropical soil. Soil Biology and Biochemistry 32:1837-
1846.
Waldrop, M. P., D. R. Zak, C. B. Blackwood, C. D. Curtis, and D. Tilman. 2006.
Resource availability controls fungal diversity across a plant diversity gradient.
Ecology Letters 9:1127–1135.
White, D. C., W. M. Davis, J. S.Nickels, J. D. King, R. J. Bobbie. 1979. Determination of
the sedimentary microbial biomass by extractable lipid phosphate. Oecologia 40:51-
62.
Wortmann, C. S., J. A. Quincke, R. A. Drijber, M. Mamo, and T. Franti. 2008. Soil
microbial community change and recovery after one-time tillage of continuous no-till.
Agronomy Journal 100:1681-1686.
Yu, Q. T., B. N. Liu, J. Y. Zhang, Z. H. Huang. 1989. Location of double bonds in fatty
acids of fish oil and rat testis lipids. Gas chromatography-mass spectrometry of the
oxazoline derivatives. Lipids 24:79-83.
Zak, D. R., W. E. Holmes, D. C. White, A. D. Peacock, and D. Tilman. 2003. Plant
diversity, soil microbial communities, and ecosystem function: are there any links?
Ecology 84:2042-2050.
Zelles, L., Q. Y. Bai, T. Beck, and F. Beese. 1992. Signature fatty acids in phospholipids
and lipopolysaccharides as indicators of microbial biomass and community structure
in agricultural soils. Soil Biology and Biochemistry 24:317-323.

108
Tables and Figures
Table 3.1. Cover crop species and seeding rates (kg ha-1
) used in individual cover crop
mixtures for the years 2009 and 2010 (2CC = 2 species mixture; 8CC = 8 species
mixture).
Seeding rate
Common name Scientific name 2CC 8CC
__ kg ha
-1 __
Hairy Vetch Vicia villosa 22.4 5.6
Buckwheat (2009) Fagopyrum sagittatum 28.0 7.0
Idagold Mustard (2010) Sinapus alba 6.7 1.7
Field Pea Pisum sativum
14.0
Pacific Gold Mustard Brassica juncea
1.1
Oilseed Radish Raphanus sativus
2.1
Crimson Clover Trifolium incarnatum
3.5
Dwarf Essex Rape Brassica napus
1.7
Chickling Vetch Lathyrus sativus 8.4
Table 3.2. Timing of field operations and data collection for each year of the study.
Date
2009 2010
Operation
Cover crop planting 20 March 30 March
Cover crop termination 22 May 28 May
Main crop planting 28 May 1-3 June
1st inter-row cultivation 1 July 28 June
2nd inter-row cultivation
1 July
Soil sampling 6-7 July 29-30 June

109
Table 3.3. LS means and standard errors of ratios of FAME peak area to total FAMEs
(nmol %) as influenced by cover crop mixture.
Cover crop mixture
NC WD 2CC 8CC
Bacteria
iC16:0 4.53 (0.08) 4.38 (0.06) 4.56 (0.06) 4.55 (0.06)
Actinomycetes
i10MeC17:0 1.31 (0.08) 1.15 (0.06) 1.36 (0.06) 1.28 (0.06)
i10MeC18:0 3.65 (0.28) 3.13 (0.20) 3.79 (0.20) 3.60 (0.20)
AMF
C16:1 (cis11) 2.59 (0.13) 2.41 (0.10) 2.85 (0.10) 2.69 (0.10)
C18:1 (cis11) 4.70 (0.10) 4.42 (0.07) 4.74 (0.07) 4.77 (0.07)
Table 3.4. LS means and standard errors of ratios of FAME peak area to total FAMEs
(nmol %) as influenced by cover crop termination method.
Cover crop termination method
No cover Disk Undercutter
Bacteria
C17:0 0.736 (0.011) 0.718 (0.006) 0.739 (0.006)
Actinomycetes
8MeC16:0 1.85 (0.08) 1.88 (0.04) 1.71 (0.04)
i10MeC17:0 1.31 (0.08) 1.33 (0.05) 1.20 (0.05)
i10MeC18:0 3.65 (0.28) 3.71 (0.16) 3.30 (0.16)
a10MeC18:0 0.453 (0.020) 0.467 (0.012) 0.441 (0.012)
10MeC18:0 1.438 (0.028) 1.430 (0.016) 1.468 (0.016)
AMF
C18:1 (cis11) 4.70 (0.10) 4.56 (0.06) 4.72 (0.06)

110
Table 3.5. LS means and standard errors of ratios of FAME peak area to total FAMEs
(nmol %) as influenced by current crop.
Current crop
Corn Soybean Sunflower
Bacteria
iC15:0 5.46 (0.06) 5.37 (0.06) 5.30 (0.06)
aC15:0 3.71 (0.06) 3.69 (0.06) 3.58 (0.06)
Fungi
C18:2 (cis9,12) 5.74 (0.18) 5.77 (0.18) 6.32 (0.18)

111
Table 3.6. Pairwise squared Mahalanobis distance for FAMEs between cover crop mixture by termination method treatment groups
pooled across main crops and years.
Treatment 2CC/D 2CC/U 8CC/D 8CC/U WD/D WD/U NC
Squared Mahalanobis distance/(probability>Mahalanobis distance)
2CC/Da 0.000 2.186 1.492 1.939 1.774 2.328 1.385
(1.000) (0.005) (0.057) (0.012) (0.022) (0.004) (0.082)
2CC/U 2.186 0.000 1.525 0.696 4.270 5.135 2.618
(0.005) (1.000) (0.051) (0.543) (0.0001) (0.0001) (0.001)
8CC/D 1.492 1.525 0.000 0.483 3.171 4.264 1.377
(0.057) (0.051) (1.000) (0.786) (0.000) (0.0001) (0.084)
8CC/U 1.939 0.696 0.483 0.000 3.700 4.917 2.265
(0.012) (0.543) (0.786) (1.000) (0.0001) (0.0001) (0.004)
WD/D 1.774 4.270 3.171 3.700 0.000 0.408 1.903
(0.022) (0.0001) (0.0001) (0.0001) (1.000) (0.869) (0.014)
WD/U 2.328 5.135 4.264 4.917 0.408 0.000 2.482
(0.004) (0.0001) (0.0001) (0.0001) (0.869) (1.000) (0.002)
NC 1.385 2.618 1.377 2.265 1.903 2.482 0.000
(0.082) (0.001) (0.084) (0.004) (0.014) (0.002) (1.000) a 2CC/D = 2 species mix + disk; 2CC/U = 2 species mix + undercutter; 8CC/D = 8 species mix + disk; 8CC/U = 8 species mix +
undercutter; WD/D = weedy control + disk; WD/U = weedy control + undercutter; NC = no cover crop (or weeds) control.
11
1

112
Figure 3.1. Effects of cover crop mixture and termination method on total FAMEs (nmol
g-1
) at 45 and 32 days after cover crop termination in 2009 and 2010, respectively. Error
bars represent the standard error of the LS means. NC = no cover control; WD = weedy
mixture; 2- and 8CC = 2 and 8 cover crop species mixtures, respectively (Table 3.1).
Cover crop mixture (no. of species)
NC WD 2CC 8CC
Tota
l F
AM
Es (
nm
ol g-1
)
110
120
130
140
150
No Cover
Disk
Undercutter

113
Figure 3.2. Effects of cover crop mixture and termination method on the AMF biomarker
C16:1(cis11) (nmol g-1
) at 45 and 32 days after cover crop termination in 2009 and 2010,
respectively. Error bars represent the standard error of the LS means. NC = no cover
control; WD = weedy mixture; 2- and 8CC = 2 and 8 cover crop species mixtures,
respectively (Table 3.1).
2009
2.5
3.0
3.5
4.0
4.5No Cover
Disk
Undercutter
2010
Cover crop mixture (no. of species)
NC WD 2CC 8CC
C16:1
(cis
11)
(nm
ol g-1
)
2.5
3.0
3.5
4.0
4.5 No Cover
Disk
Undercutter

114
Figure 3.3. Discriminant score means for all cover crop mixture by termination method
treatment groups (a), and standardized canonical coefficients for FAMEs (b) contributing
to the two significant discriminant functions DA1 and DA2.
DA 1 score
-1.5 -1.0 -0.5 0.0 0.5 1.0 1.5
DA
2 s
co
re
-0.8
-0.6
-0.4
-0.2
0.0
0.2
0.4
0.6
0.8
1.0
2CC Disk
2CC Undercut
8CC Disk
8CC Undercut
WD Disk
WD Undercut
No Cover
Standardized coefficient for DA1
-2.0 -1.5 -1.0 -0.5 0.0 0.5 1.0 1.5 2.0
Sta
nda
rdiz
ed c
oe
ffic
ien
t fo
r D
A2
-1.5
-1.0
-0.5
0.0
0.5
1.0
C16:1(cis5)
C17:1(cis9)
i10MeC18:0
a10MeC18:0
C18:1(cis11)
C18:1(cis13)
C18:0
cyC19(9,10)
C20:n
a)
b)

115
Chapter 4
Cover crop mixtures and an alternative termination method for organic grain cropping
systems: Influence on soil moisture and nitrogen, crop yield, and profitability
Abstract
Many studies have demonstrated soil quality benefits and fertility contributions of
individual cover crop species, but the value of diverse cover crop mixtures has received
less attention. Moreover, there is increasing interest in conservation tillage strategies for
cover crop termination. The objectives of this research were to determine the effects of
spring-sown cover crop mixture diversity and mechanical cover crop termination method
on cover crop productivity, soil moisture, soil nitrogen, crop yield and profitability in an
organic cropping system. A field experiment was conducted between 2009 and 2011 near
Mead, NE where mixtures of 2, 4, 6, and 8 cover crop species, or a summer annual weed
mixture were included in a sunflower – soybean – corn crop rotation. Cover crops were
planted in late-March, terminated in late-May using a field disk or sweep plow
undercutter and main crops were planted within one week of termination. Aboveground
biomass of cover crops and weeds was consistently greater in cover crop mixtures (307.3
g m-2
) compared to the weed mixture (87.6 g m-2
), and in two of three years biomass
increased with diversity of the cover crop mixture. Undercutting cover crops increased
soil NO3-N (0 to 20 cm) by 1.0 and 1.8 µg NO3-N g-1
relative to disk incorporation at 32
days after termination (DAT) in 2010 and at 55 DAT in 2011, respectively. Cover crop
mixtures reduced soil moisture content (0 to 8 cm) by 0.15 cm3 cm
-3 prior to main crop
planting during an abnormally dry 2009 spring, while cover crop termination with the

116
undercutter increased soil moisture content by as much as 0.024 cm3 cm
-3 compared to
termination with the disk during early main crop growth. Crop yields were not influenced
by cover crop mixture, but termination with the undercutter (relative to disk
incorporation) increased corn and soybean yield by as much as 1.40 and 0.88 Mg ha-1
,
respectively. Despite differences in productivity between spring cover crop mixtures and
weed communities, crop yield was not different among these treatments; thus,
profitability of the weed mixture – undercutter treatment combination was greatest due to
reduced input costs (i.e., no cover crop seed or planting costs). Short-term yield and
economic benefits of using weed communities as cover crops may be offset by reduced
environmental benefits of a less productive and more spatially heterogeneous spring plant
community.

117
Introduction
Cover crops have been shown to provide many environmental and agronomic
services within agroecosystems. These include reduced soil erosion, increased biological
diversity (e.g., microbes, insects, and birds), increased nutrient cycling and biological
nitrogen fixation, increased soil organic matter, improved weed control, and increased
crop yield (Pimentel et al., 1992; Pimentel et al., 1995; Sainju and Singh, 1997; Williams
II et al., 1998; Altieri, 1999; Reddy et al., 2003; Teasdale et al., 2007). While cover crops
have traditionally been used as a soil conservation tool (Pimentel et al., 1995), there is
increasing interest in using cover crops to enhance agronomic crop performance.
However, maximizing agronomic benefits associated with cover crops will depend on
appropriate cover crop choice and residue management (Ashford and Reeves, 2003;
Wortman et al., 2012). Single species cover crops are often popular among farmers due to
the ease of planting, and uniform development and predictable termination efficacy of the
cover crop (Creamer et al., 1995; Mirsky et al., 2009). However, multi-species cover crop
mixtures may increase productivity, stability, resilience, and resource-use efficiency of
the cover crop community (Tilman, 1996; Tilman et al., 1997; Trenbath, 1999; Tilman et
al., 2001; Wortman et al., 2012).
Despite the demonstrated benefits of cover crops, on-farm adoption remains
limited due to farmer concerns about the cost and management implications of planting
cover crops. One of the top concerns among farmers is the amount of soil water used by
cover crops, potentially reducing available soil moisture for the cash crop (Corn and
Soybean Digest, 2010). During seasons with average and above-average rainfall
conditions, differences in available soil moisture among cover crop species and mixtures
are often undetectable (Daniel et al., 1999). However, when cover crop productivity is

118
high and precipitation becomes limiting, cover crop species can differ greatly in their
effects on soil moisture (Unger and Vigil, 1998; Daniel et al., 1999). While transpiration
demands will undoubtedly vary among species, the method of cover crop termination and
residue management may have a greater impact on available soil moisture during main
crop growth. Daniel et al. (1999) found that volumetric soil moisture (%) was increased
by as much as 2.4% to a depth of 61 cm when cover crops were terminated with
herbicides in a no-till system compared to conventional termination with a field disk. Soil
water savings associated with no-till practices have been well documented (Blevins et al.,
1983; De Vita et al., 2007), but the additional benefits of cover crop residue in a
conservation tillage system are not as clear. Liebl et al. (1992) found that cover crop
transpiration reduced available soil moisture during dry periods, but following no-till
termination cover crop residue conserved soil moisture relative to a no-till system without
cover crops. Given that the driest portion of the growing season in eastern Nebraska
typically occurs after cover crop growth (i.e., June – August), potential soil moisture
savings offered by cover crop residues (post-termination) throughout the growing season
may negate moisture deficits observed during cover crop growth.
Despite concerns about water use, many farmers are interested in cover crops
because of the potential for improved nutrient cycling and biological nitrogen fixation
(Corn and Soybean Digest, 2010). As a result, species in the Fabaceae (legume) family
are among the most popular and expensive cover crops. Legume cover crops (e.g., green
manures) have been shown to reduce synthetic N input demands by 50 to 100%
depending on species and the duration of cover crop growth (Biederbeck et al., 1996;
Burket et al., 1997). While legume species have the potential to biologically fix nitrogen,

119
faster growing cover crop species (e.g., grass and mustard spp.) may be more useful in
scavenging nitrates and nutrient cycling (Dabney et al., 2001). A mixture of legume and
non-legume cover crop species may maximize the benefits of biological nitrogen fixation
and nutrient cycling, as legumes can increase N availability to other species in mixture
leading to increased productivity (Kuo and Sainju, 1998; Mulder et al., 2002). Consistent
with impacts on soil moisture, termination method and residue management can influence
nitrogen mineralization, soil availability, and crop uptake (Sainju and Singh, 2001).
Incorporation of cover crop residue via field disk or plow often results in rapid nitrogen
mineralization and plant availability, but management of residue on the soil surface has
been shown to result in greater crop N uptake and yield (Sainju and Singh, 2001).
Therefore, residue management on the soil surface with conservation tillage methods may
be effective in syncing nitrogen mineralization and availability with crop demand and
uptake (Parr et al., 2011).
Overall, the agronomic objective for cover crop management is to minimize soil
water loss and increase the quantity and availability of soil nitrogen to promote increases
in crop yield. However, improper management of cover crops can lead to substantial
yield loss. The timing and method of cover crop termination have both been shown to
affect yield influencing factors including: soil moisture availability, weed communities,
cover crop and soil nitrogen content, and crop nitrogen uptake (Daniel et al., 1999;
Mirsky et al., 2009; Parr et al., 2011; Wortman, 2012). Yield loss associated with cover
crop use is typically attributed to incomplete cover crop control, soil moisture deficit, or
nutrient immobilization and deficiency (Wagger, 1989; Unger and Vigil, 1998; Mischler
et al., 2010); thus, management of cover crop residue should be focused toward

120
termination efficacy, moisture conservation, and optimum soil nitrogen availability
during peak crop growth. To this end, conservation tillage implements like the sweep
plow undercutter may have great potential (Creamer et al., 1995). In contrast to
conventional tillage systems, the undercutter leaves intact cover crop residue on the soil
surface, minimizes soil inversion, and presumably reduces evaporative loss from the soil.
Moreover, the undercutter may be an improvement upon conservation implements like
the roller-crimper, which is often inconsistent in termination efficacy (Mischler et al.,
2010). Despite these production challenges, many cover crop systems have been shown
to maintain or increase crop yield (e.g., Clark et al., 1994; Davis, 2010; Mischler et al.,
2010). Indeed, demonstrating predictable yield and economic benefits associated with
cover crop use will be necessary in increasing on-farm adoption (Corn and Soybean
Digest, 2010).
The objectives of this research were to determine the effects of spring-sown cover
crop mixture diversity and mechanical cover crop termination method on cover crop
productivity, soil moisture, soil nitrogen, crop yield and profitability. We hypothesized
that increasing cover crop diversity will increase total cover crop biomass, and
subsequent grain yield, while soil moisture content will not differ among mixtures
(despite differences in productivity). With regard to cover crop termination, we
hypothesized that mulching cover crops with the sweep plow undercutter will increase
soil moisture content, soil nitrate availability, crop yield, and profitability.

121
Materials and Methods
Experimental Site and Design
A field experiment was conducted in 2009, 2010 and 2011 at the University of
Nebraska-Lincoln Agricultural Research and Development Center (ARDC) near Mead,
Nebraska. Dominant soil type at the site is a Sharpsburg silty clay loam (fine, smectitic,
mesic typic Argiudoll) with 0 to 5% slopes. The experiment was conducted in a 2.8 ha
field that is certified for organic production (OCIA International, Lincoln, NE), and is
managed without irrigation. This field was in organic alfalfa hay production between
2004 and 2008. In the fall of 2008 the experimental area was amended with 50 Mg ha-1
of
liquid beef feedlot manure and incorporated via field disk. In the spring of 2009, the
entire field (excluding the weed-free control) was seeded with 8.1 kg ha-1
of velvetleaf
(Abutilon theophrasti) seed, 2.6 kg ha-1
of common lambsquarters (Chenopodium album)
seed, 1.2 kg ha-1
of redroot pigweed (Amaranthus retroflexus) seed, and 3.7 kg ha-1
of
green foxtail (Setaria viridis) seed to establish a common weed seedbank throughout the
field for a concurrent weed management study.
The experiment was designed as a split-plot randomized complete block design
within a 3-year crop rotation with 4 replications. The rotation sequence consisted of
confectionery sunflower (Helianthus annuus L. ‘Seeds 2000 Jaguar’) – soybean (Glycine
max L. Merr. ‘Blue River Hybrids 2A71’) – corn (Zea mays L. var. ‘Blue River Hybrids
57H36’). Within each crop species, whole-plots (9.1 x 21.3 m; 12 crop rows spaced 0.76
m apart) were defined by cover crop mixture, while split-plots (4.6 x 21.3 m; 6 crop rows
spaced 0.76 m apart) were defined by cover crop termination method. Each “crop x cover
crop mixture x termination method” treatment combination was replicated within each

122
block so that each phase of the 3-year crop sequence was present each year within each
block. There were six whole-plot cover crop treatments: 1) two-species cover crop
mixture (2CC), 2) four-species cover crop mixture (4CC), 3) six-species cover crop
mixture (6CC), 4) eight-species cover crop mixture (8CC), 5) weedy mixture and cover
crop-free (prior to main crop planting) (WD), and 6) weed-free and cover crop-free (prior
to main crop planting) control (NC). The NC whole-plots were field disked and hand-
hoed twice prior to main crop planting, while the WD whole-plots were left unmanaged
until cover crop termination. The goal for the WD treatment was to manage existing
weed populations as a cover crop. Details on the individual species and seeding rates
included in each cover crop mixture whole-plot are included in Table 4.1.
Split-plot cover crop termination methods included either disking or undercutting.
Termination method was randomized within the first replication (southernmost) and
duplicated in the remaining three replications (north of the first replication) to facilitate
adequate speed for effective tillage operations driving north-south through the field.
Disking was conducted with a 4.6 m wide Sunflower 3300 (Sunflower Mfg., Beloit, KS,
USA) disk to an approximate depth of 15 cm. Undercutting was conducted with either a
Buffalo 6000 (Buffalo Equipment, Columbus, NE, USA) cultivator (modified for
undercutting) with seven overlapping 0.75 m wide sweep blades (2009) or a Miller Flex-
Blade sweep plow undercutter (2010 and 2011) with three overlapping 1.5 m sweep
blades. The undercutter sweeps are designed to cut a level plane through the soil at an
approximate depth of 10 cm, severing plant roots and minimizing soil inversion, resulting
in a layer of intact surface residue. Details on the design of the undercutter can be found
in Creamer et al. (1995).

123
Cover crop mixtures were planted via hand-crank broadcast seeding followed by
light incorporation with a John Deere 950 cultipacker (Deere and Company, Moline, IL,
USA). Generally, cover crops were planted in late-March, terminated in late-May, and
the main crop was planted within one week of termination. Specific dates for field
operations across all years are detailed in Table 4.2. Seeding rates for confectionery
sunflower, soybean, and corn were 62,000, 556,000, and 86,000 seeds ha-1
, respectively.
All crops were inter-row cultivated once (2009) or twice (2010 and 2011) approximately
30 days after planting the main crop. Seeds of all legume cover crop and crop species
were inoculated with appropriate rhizobia bacterial species prior to planting in 2009 and
2010.
Data Collection
Monthly precipitation (mm) and temperature (°C) for April to September was
determined for each growing season by summing daily precipitation and temperature
measurements from the High Plains Regional Climate Center station located on the
University of Nebraska Turf Farm near Mead, NE (41°10'12"N lat, 96°28'12"W long,
elevation= 366 m), located 1 km northwest of the experimental site (Table 4.3). Climate
data for the 30-year mean was obtained from a different climate center near Mead, NE
(41°8'24"N and 96°28'48"W) between 1971 and 2000 (long-term data from the
University of Nebraska Turf farm was unavailable).
Three (2009) or four (2010 and 2011) aboveground biomass samples were taken
from each whole plot experimental unit prior to cover crop termination to determine
productivity of the cover crop mixtures and weed communities. Samples were combined
within each experimental unit, dried at 60°C to constant mass and weighed. The biomass

124
harvest area included three 0.3 x 0.3 m samples per experimental unit in 2009, and was
increased to four 0.3 x 0.6 m samples per experimental unit in 2010 and 2011.
Surface soil moisture (0 to 8 cm) was measured weekly from cover crop planting
through the vegetative growth of the main crop. Measurements were taken at three
random points within each whole plot (prior to cover crop termination) or split-plot (after
cover crop termination) experimental unit using a Theta Probe soil water sensor (SM 200
Soil Moisture Sensor, Delta-T Devices Ltd, Cambridge, UK). Accuracy of the soil water
sensor was verified against 21 gravimetric soil samples in 2010 and the ratio between
method outputs was approximately 1:1. Indeed, linear regression analysis indicated a
positive relationship between outputs from the two methods (p=0.003, F=11.68, dfn=1,
dfd=19, R2=0.38; water sensor reading = 1.10 (gravimetric soil moisture) – 2.6).
Soil samples were collected three times during the growing season: 1) prior to
cover crop planting, 2) approximately 30 DAP, and 3) approximately 60 DAP. A
composite soil sample of three (2009) or four (2010 and 2011) soil cores (3.18 cm
diameter x 20 cm) per whole plot (prior to cover crop planting) or split-plot (30 DAP and
60 DAP) experimental unit were taken. Composite soil samples were then air-dried and
sent to Ward Laboratories (Ward Laboratories Inc., Kearney, NE, USA) for analysis of
soil NO3-N. Soil extraction and analyses were conducted according to routine laboratory
procedures at Ward Laboratories, Inc (Ward, 2011).
Crop yield was determined for each main crop by harvesting seed or grain from
the middle four rows of each split-plot experimental unit. Contents were weighed using a
combine scale (Model 400, Weigh-Tronix, Fairmont, MN) and adjusted for moisture

125
content in the lab. Corn grain yields were adjusted to 0.155, soybean to 0.130, and
sunflower to 0.10 g kg-1
moisture.
Data Analysis
Values for cover crop biomass, soil moisture, soil NO3-N, and crop yield were
analyzed with a linear mixed model analysis of variance using the GLIMMIX procedure
in SAS 9.2 (SAS Institute Inc., Cary, NC, USA). Fixed effects in the model included
main crop, cover crop mixture, termination method, and all possible interactions of these
effects. The random effects were block and the interaction of block by current crop by
cover crop mixture. The model for data taken prior to cover crop termination (i.e., cover
crop biomass and soil moisture) excluded fixed effects for main crop and termination
method. In addition, models for soil NO3-N and soil moisture analysis included a fixed
effect for day of year. Effects were often tested within individual years due to
experimental changes in the cover crop mixture (buckwheat was replaced in all mixtures
with Idagold mustard after 2009) and interactions with year when initially included as a
fixed effect (data not shown). Least square means and standard errors were calculated for
all significant fixed effects at an alpha level of 0.05. To aid in the visualization of
statistical interactions, cover crop biomass data were plotted as lines with cover crop
mixture on the x-axis (Sosnoskie, 2006). The cover crop treatments were arranged in
order (left-to-right) of increasing cover crop species diversity (from zero in the WD
treatment to eight species in the 8CC treatment) along the x-axis similar to the figures
presented by Tilman et al. (2001). However, we recognize that these data are not truly
continuous as is traditionally expected in line plots.

126
Results and Discussion
Climate
The average daily air temperature during the growing season for cover crops and
summer annual cash crop crops (1 Apr. – 30 Sept.) was 17.8, 19.5, and 19.0°C in the
years 2009, 2010, and 2011, respectively (Table 4.3). The 30-year mean (1971 to 2000)
air temperature for the growing season near Mead, NE was 19.0°C. The 2009 growing
season was exceptionally cool, especially during early cover crop growth (April) and
vegetative crop growth (June through August; Table 4.3). Average total precipitation
during the growing season for cover crops and summer annual cash crops was 432, 717,
and 547 mm in 2009, 2010, and 2011, respectively. The 30-year mean total precipitation
was 519 mm (Table 4.3). In addition to abnormally cool temperatures, the 2009 growing
season was also relatively dry, especially during cover crop growth and early cash crop
establishment. As a result, plant water stress (e.g., curling and cupping of leaves) was
observed in all crops during June of 2009.
Cover Crop Productivity
Total cover crop mixture and/or weed biomass was greatest in the 6CC treatment
(328.2 ± 21.0 g m-2
), followed by the 4CC (287.6 ± 20.1 g m-2
), 8CC (260.6 ± 20.1 g m-
2), 2CC (155.0 ± 20.1 g m
-2) and WD (73.7 g m
-2 ± 20.1 g m
-2) treatments (LS mean ±
standard error) when harvested 60 days after cover crop planting in 2009 (Figure 4.1).
Cover crop productivity was not different among cover crop mixtures (ranging from
367.2 to 409.3 ± 16.7 g m-2
), but was lowest in the WD treatment (68.8 ± 16.7 g m-2
)
when harvested 55 days after cover crop planting in 2010 (Figure 4.1). Consistent with
trends in 2009, cover crop productivity in 2011 was greatest in the 6CC, 8CC, and 4CC

127
treatments (309.6, 307.2, and 276.2 ± 14.3 g m-2
, respectively), followed by the 2CC
treatment (205.2 ± 14.3 g m-2
), and lowest in the WD treatment (120.4 ± 14.3 g m-2
).
Biomass of weeds in the WD treatment was lower than biomass of cover crop mixtures
primarily due to spatial heterogeneity of weeds growing in this treatment and variable
emergence and growth of various species in the weed community. Though the
productivity of cover crop mixtures was similar in 2009 and 2011, the cause for this
response was different between years.
Differences in cover crop productivity in 2009 were likely due to the presence or
absence of a Brassicaceae (mustard) spp. in the mixture. Cover crop biomass was lowest
in the 2CC mixture as it only included hairy vetch and buckwheat. Both of these species
were slow-growing throughout the relatively cool and dry early growing season in 2009
(Table 4.3), and buckwheat was moderately susceptible to early frost. Buckwheat is often
used as a summer cover crop or later planted main crop due to its susceptibility to frost,
especially during seedling growth (Kalinova and Moudry, 2003); thus, buckwheat may
not be a suitable species for use as a spring-sown cover crop in the western Corn Belt.
Given these results, buckwheat was replaced in all mixtures with Idagold mustard in 2010
and 2011. Idagold mustard, a mustard spp., was selected as the replacement due to the
high level of productivity of the three other mustard spp. used in the 4CC, 6CC, and 8CC
mixtures in 2009. Mustard spp., including Idagold mustard, are well adapted to the cool
climate of the northern Great Plains, and productivity is often maximized when planting
between mid-March and mid-April (Chen et al., 2005). Given the productivity of the
mustard spp. used in this study, it is not surprising that biomass was not different among

128
cover crop mixtures in 2010 when all mixtures contained a 1:1 ratio of mustard and
legume spp.
While cover crop productivity responded positively to the mixture adjustments in
2010, it was a May 12, 2011 hail storm that led to 2011 treatment differences. The hail
storm damaged all cover crop species within mixtures, but Idagold mustard was most
susceptible to hail damage and did not recover well from this extreme disturbance
(Wortman et al., 2012). Idagold mustard was a component of all four cover crop
mixtures; thus, as the diversity of the cover crop mixture increased, the proportion of
Idagold mustard in the mixture decreased. Therefore, we hypothesize that productivity of
the mixtures increased with diversity due to decreased proportions of Idagold mustard.
These results, in combination with the 2009 results, highlight an important benefit of
diverse cover crop mixtures. By reducing the proportion of each species in a diverse
cover crop mixture, we observed increased resilience and productivity of the cover crop
community despite a management error (2009) and extreme weather disturbance (2011).
Similar to a diversified investment portfolio, diverse cover crop mixtures seem poised for
stable productivity and resilience despite potential management errors and an
increasingly unstable climate (Doak et al., 1998).
Surface Soil Moisture
Surface soil moisture (0 to 8 cm) prior to cover crop termination was unaffected
by cover crop mixture, but by day of year (DOY) 141 soil moisture content was greatest
in the NC control (0.310 ± 0.007 cm3 H20 cm
-3 soil), followed by the WD treatment (0.20
± 0.007 cm3 cm
-3) in 2009 (Figure 4.2). Soil moisture was lowest in the cover crop
mixtures (0.161 cm3 cm
-3 averaged across the four mixtures). The reduction in soil

129
moisture in cover-cropped and weedy treatments by DOY 141 was related to an
exceptionally dry early spring in 2009. Between DOY 110 and 145 there were only two
rainfall events totaling more than 10 mm in precipitation, and total precipitation during
April and May was 62 mm. The 30-year mean for precipitation in April and May was 176
mm (Table 4.3). These results highlight the risk associated with planting cover crops in
non-irrigated grain-based production systems (Ewing et al., 1991). While average annual
precipitation is typically sufficient for growth of both a cover crop and cash crop,
exceptionally dry years may cause significant production challenges and potential yield
loss. Following cover crop termination, surface soil moisture was affected by termination
method in 2009. Surface soil moisture was greatest in the NC control (0.249 cm3 cm
-3 ±
0.005), followed by the undercutter treatment (0.160 cm3 cm
-3 ± 0.002), and lowest in the
disk treatment (0.153 cm3 cm
-3 ± 0.002) one week following termination (DOY 149;
Figure 4.2). However, by DOY 183 surface moisture was greatest in the undercutter
treatment (0.112 cm3 cm
-3 ± 0.002), followed by the NC control (0.103 cm
3 cm
-3 ± 0.005),
and lowest in the disk treatment (0.095 cm3 cm
-3 ± 0.002). At this point in the growing
season, all crops were showing severe water stress. While soil moisture was exceptionally
low among all treatments, it is interesting that soil moisture was greatest in the
undercutter treatment at DOY 183 despite 56% less available moisture than the NC
control at DOY 149.
Similar to 2009 results, surface soil moisture was unaffected by cover crop
mixture prior to cover crop termination in 2010. However, surface soil moisture was
greatest in both the NC control (0.259 cm3 cm
-3 ± 0.006) and the WD treatment (0.255
cm3 cm
-3 ± 0.006) at DOY 126 (Figure 4.3). Variable soil moisture in the cover-cropped

130
treatments throughout cover crop growth was related to rainfall patterns in early 2010.
While soil moisture content was reduced in cover-cropped treatments at DOY 126, four
rainfall events totaling 33.8 mm in precipitation over the next six days was sufficient to
eliminate soil moisture differences between cover-cropped and non-cover-cropped
treatments by DOY 137 (Figure 4.3). Following cover crop termination, surface soil
moisture was affected by termination method in 2010. Averaged across the first three
sampling dates (DOY 158, 166, and 169), surface moisture was greatest in the undercut
treatment (0.330 ± 0.003 cm3 cm
-3) compared to both the NC and disk treatments (0.314
± 0.006 cm3 cm
-3 and 0.306 ± 0.002 cm
3 cm
-3, respectively; Figure 4.3). We hypothesize
that greater soil moisture following termination with the undercutter in 2009 and 2010
was due to the layer of cover crop mulch present on the soil surface for 14-21 days
following termination with the undercutter. This is consistent with previous studies where
management of cover crop residue on the soil surface led to increased soil moisture
availability (Teasdale and Mohler, 1993; Kornecki et al., 2009; Davis, 2010). While soil
moisture savings associated with the undercutter for fallow tillage have been discussed
(Zaikin et al., 2007), to our knowledge this is the first report of increased soil moisture
availability following cover crop termination with an undercutter.
Soil moisture content varied by cover crop treatment and day of year (DOY) prior
to termination in 2011. During early cover crop growth, soil moisture was greatest in the
WD and NC treatments (0.161 and 0.156 ± 0.006 cm3 cm
-3, respectively), followed by
the cover-crop mixtures (average of 0.127 ± 0.006 cm3 cm
-3; Figure 4.4). However, by
the end of cover-crop growth (DOY 153) soil moisture content was greatest in the 4CC,
6CC, and 8CC mixtures (average of 0.288 ± 0.006 cm3 cm
-3), followed by the 2CC

131
mixture (0.257 ± 0.006 cm3 cm
-3), and the WD and NC treatments (0.243 and 0.235 ±
0.006 cm3 cm
-3, respectively; Figure 4.4). May 2011 was exceptionally wet (164 mm
precipitation) compared to the 30-year mean for May (106 mm), leading to greater
surface soil moisture content beneath cover crop canopies (Table 4.3). When there was
sufficient soil moisture to meet cover crop transpiration demands, the dense cover crop
canopy may have conserved soil moisture by reducing evaporative loss from the soil
surface occurring in the relatively bare NC and WD treatments. Indeed, soil evaporation
can be reduced through early crop canopy closure (Luening et al., 1994). Following cover
crop termination, surface soil moisture was not influenced by termination method or
DOY in 2011. Instead, soil moisture was influenced by cover crop treatment, where
values were greatest in the 8CC mixture (0.275 ± 0.004 cm3 cm
-3) and lowest in the NC
and WD treatments (0.262 ± 0.006 cm3 cm
-3 and 0.254 ± 0.004 cm
3 cm
-3, respectively)
when pooled across the three post-termination sampling intervals (DOY 159 to 186; data
not shown). Increased soil moisture in the cover-cropped treatments in the third year of
this study may be related to improvements in soil physical structure. Cover-cropping in
organic systems has been shown to increase soil water infiltration and soil water holding
capacity (Colla et al., 2000; Lotter et al., 2003).
Soil Nitrogen
Soil NO3-N at 45 and 81 days after termination (DAT) was affected by the
interaction of cover crop mixture and termination method in 2009. Soil NO3-N was
greatest in the WD – undercut treatment combination (50.2 ± 6.1 µg NO3-N g-1
), but
differences among the remaining cover crop and termination treatments were inconsistent
at 45 DAT (data not shown). At 81 DAT soil NO3-N was greatest in the NC control (30.0

132
± 2.4 µg NO3-N g-1
), followed by the WD – undercut treatment combination (22.5 ± 2.4
µg NO3-N g-1
). Similar to the results at 45 DAT, differences among remaining treatments
were inconsistent (data not shown). Increased soil NO3-N in the WD and NC treatments
at 45 and 81 DAT in 2009 was likely the result of N-immobilization and delayed NO3-N
mineralization following cover crop growth, termination, and decomposition. Previous
studies have demonstrated delayed soil NO3-N release from cover crop residue especially
following late termination (Wagger, 1989; Quemada and Cabrera, 1995; Kuo and Sainju,
1998). Moreover, nitrogen immobilization is most pronounced when cover crop residue
is comprised of over 60% non-leguminous residue (Kuo and Sainju, 1998). In this study,
mustard spp. dominated the mixtures and typically accounted for over 60% of total
mixture biomass (Wortman et al., 2012).
Following the 2008 growing season, the experimental site was amended with 50
Mg ha-1
beef feedlot liquid manure. While available soil NO3-N was greatest in the NC
and WD treatments throughout the 2009 growing season, the immobilization of soil NO3-
N in cover crop residue likely reduced NO3-N leaching and surface runoff from the
manure early in the growing season (Staver and Brinsfield, 1998). Moreover, lower levels
of available soil NO3-N in the cover-cropped treatments early in the growing season may
have aided in the suppression of weeds. High levels of available soil nitrogen have been
shown to shift the competitive advantage to weed species especially following manure
application (Barker et al., 2006; Wortman et al., 2010).
Soil NO3-N at 32 DAT was affected by cover crop termination method in 2010, as
soil NO3-N was greatest in the undercutter treatment (3.2 ± 0.2 µg NO3-N g-1
), followed
by both the disk (2.2 ± 0.2 µg NO3-N g-1
) and NC treatments (2.2 ± 0.4 µg NO3-N g-1
).

133
By 60 DAT, soil NO3-N levels were only influenced by main crop. Soil NO3-N was
greatest in soybean (5.0 ± 0.2 µg NO3-N g-1
), followed by corn (4.4 ± 0.2 µg NO3-N g-1
),
and sunflower (4.0 ± 0.2 µg NO3-N g-1
). Results for soil NO3-N in 2011 were similar to
2010, except that treatment differences were not observed until later in the growing
season. Soil NO3-N was influenced by cover crop termination with the greatest levels
observed in the undercutter treatment (11.4 ± 0.5 µg NO3-N g-1
), followed by the disk
and NC treatments (9.6 ± 0.5 µg NO3-N g-1
and 8.4 ± 1.3 µg NO3-N g-1
, respectively) at
55 DAT in 2011. Also consistent with 2010 results, soil NO3-N was greatest in soybean
(12.4 ± 0.6 µg NO3-N g-1
), followed by corn (11.3 ± 0.6 µg NO3-N g-1
), and sunflower
(7.1 ± 0.6 µg NO3-N g-1
). As expected, soil NO3-N levels were generally lower in 2010
and 2011 compared to 2009, presumably the result of grain N removal. As soil N
becomes limiting with time, management focus should shift from minimizing NO3-N
leaching and runoff towards maximizing availability. The lower soil NO3-N observed in
the disk treatment compared to the undercut treatment at 29 DAP in 2010 was likely the
result of strong N immobilization that is common following soil incorporation of cover
crops (Wyland et al., 1995). In contrast, cover crop surface residue mulch achieved with
the undercutter may result in lower immobilization and a more gradual release of soil
NO3-N throughout the growing season (Groffman et al., 1987; Parr et al., 2011).
Crop Yield
Crop yield for corn, sunflower, and soybean were affected by cover crop
termination method but not cover crop mixture in 2009. Corn grain yield was greater in
the undercutter treatment (8.78 ± 0.36 Mg ha-1
) compared to the disk treatment (7.37 ±
0.36 Mg ha-1
), while yield in the NC control was not different from either termination

134
treatment (8.40 ± 0.80 Mg ha-1
; Table 4.4). Similarly, sunflower seed yield was greater in
the undercutter treatment (2.11 ± 0.09 Mg ha-1
) compared to the disk treatment (1.91 ±
0.09 Mg ha-1
), while yield in the NC control was not different from either termination
treatment (2.18 ± 0.20 Mg ha-1
). Soybean seed yield was greater in the undercutter and
NC treatments (2.43 ± 0.09 Mg ha-1
and 2.59 ± 0.21 Mg ha-1
, respectively) compared to
the disk treatment (1.50 ± 0.09 Mg ha-1
; Table 4.4).
Similarly, crop yield in 2010 was affected by cover crop termination method, not
cover crop mixture. Corn yield was greatest in the undercutter treatment (7.75 ± 0.25 Mg
ha-1
), followed by the disk treatment (6.45 ± 0.25 Mg ha-1
), and lowest in the NC control
(5.29 ± 0.60 Mg ha-1
; Table 4.4). Soybean yield was also greatest in the undercutter
treatment (1.11 ± 0.09 Mg ha-1
), but was not different between the disk and NC
treatments (0.82 ± 0.09 Mg ha-1
and 0.72 ± 0.21 Mg ha-1
, respectively). Sunflower yield
was not affected by termination method in 2010 (Table 4.4). Yield trends in 2011 were
similar to previous years, except that yield for corn was substantially higher than in 2009
and 2010. Again influenced by the effect of cover crop termination, corn grain yield was
greatest in the NC and undercutter treatments (11.12 ± 0.64 Mg ha-1
and 10.97 ± 0.28 Mg
ha-1
, respectively) and lowest in the disk treatment (10.16 ± 0.28 Mg ha-1
). Soybean yield
was greatest in the undercutter treatment (2.96 ± 0.08 Mg ha-1
), followed by the NC
control (2.51 ± 0.18 Mg ha-1
), and lowest in the disk treatment (2.11 ± 0.08 Mg ha-1
;
Table 4.4). Consistent with 2010, there were not treatment effects on sunflower yield in
2011.
Difference in yield among years was the result of unique weather and pest
incidence in each year of the study. The sharp decline in crop yield from 2009 to 2010

135
was the result of crop damage from a severe hail storm on 13 September 2010 at the
experimental site. During this storm, all plants were completely defoliated (95 to 100%)
and severely lodged (>50%) prior to physiological maturity. The timing of the hail
damage was especially detrimental to soybean, as soybean yield can be reduced by as
much as 57% after full defoliation in late reproductive stages (Caviness and Thomas,
1980). Yield loss in corn and sunflower was more related to plant lodging and ear/head
dropping (data not shown). Despite overall yield reduction, damage throughout the field
was relatively uniform and comparisons among treatments were still informative. Corn
yield loss in 2009 relative to 2011 was likely due to a reduction in grain quality in 2009.
The test weight for corn grain was 650 ± 2 kg m-3
in 2009 compared to 724 ± 2 kg m-3
in
2011. Lower test weight values in 2009 were the result of an early frost on 4 October
2009 (low temperature of -1.7°C), which occurred prior to physiological maturity of the
corn crop. When planting a spring-seeded cover crop in the western Corn Belt, it will
often be necessary to delay traditional planting dates of corn and soybean. However, the
yield loss observed in 2009 highlights the importance of selecting appropriate early-
maturing hybrids and crop cultivars to avoid further reductions in crop yield and quality
associated with a later planting date.
Sunflower yield loss in 2010 and 2011, relative to 2009 was primarily due to high
incidence of banded sunflower moth (Cochylis hospes Walsingham) damage in 2010 and
2011. The banded sunflower moth larvae feed on florets and seeds of sunflower, and are
relatively common pests in the northern Great Plains (Charlet and Miller, 1993). Damage
from the banded sunflower moth has been shown to affect up to 46.5% of sunflower
seeds in a given sunflower head (Charlet et al., 2009). Yield loss in 2011 relative to 2009

136
ranged from 27 to 33% across termination treatments, which we hypothesize was related
to banded sunflower head moth damage. Yield loss in 2010 relative to 2009 was far more
severe (61 to 75%), presumably due to the additive effects of banded sunflower moth
damage and the severe hail storm prior to harvest. High populations and damage from the
banded sunflower moth in two of three years of this study indicate a major pitfall of
growing sunflower in the western Corn Belt. This crop will be especially difficult to
manage in organic cropping systems, where reactive chemical control options will be
limited for the banded sunflower moth.
Soil conservation, quality, and fertility benefits associated with cover crops have
been well documented, but increases in crop yield are less commonly reported (Unger
and Vigil, 1998; Kuo and Jellum, 2002; Reddy et al., 2003). The lack of yield benefits
typically realized following cover crop plantings may be related to previous knowledge
gaps regarding the most effective cover crop termination and residue management
strategies. However, novel cover crop management systems, like the winter rye –
soybean no-till cropping system, have created opportunities for increased crop yield and
profitability (Mischler et al., 2010; Davis, 2010). Though unique from the roller-crimper
system, results from this study provide support for another effective cover crop
management strategy for organic cropping systems. Indeed, termination with the
undercutter consistently maintained or increased crop yield relative to disk termination
and the more traditional no cover crop organic cropping system. While the utility of the
undercutter for cover crop termination and weed management has been previously
documented (Creamer et al., 1995; Creamer et al., 2002), this is the first evidence of yield
benefits associated with a “cover crop – undercutter” organic management system.

137
Cropping System Profitability
Throughout the study crop yield was consistently greatest following termination
with the undercutter, although cover crop treatment did not influence yield in any crop or
year of the study. This was a surprising result given that one of the “cover crop”
treatments included a mixture of weeds (WD treatment) managed like a cover crop; thus,
results from this study indicate that mixtures of common weed species may provide
equivalent cropping system benefits relative to species commonly recognized as cover
crops. This result is consistent with at least one previous study, where corn yield
following winter annual weed “cover crop” was equal to or greater than yield following a
crimson clover cover crop (Sainju and Singh, 2001). Similar to the results of this study,
crop yield increase following weed growth occurred despite less than 50% biomass
productivity of the weed community relative to cover crop communities (Sainju and
Singh, 2001).
The potential utility of weed communities as cover crops becomes increasingly
evident after profitability analysis of each cover crop – termination method treatment
combination. Indeed, the WD – undercutter treatment combination resulted in the highest
net profit for all crops and the entire rotation ($1,212 ha-1
yr-1
; Table 4.5). The
“traditional” cover crop mixture – undercutter treatment combinations were also
profitable ($1,035, $1,031, $991, and $986 ha-1
yr-1
for the 2CC – , 4CC –, 6CC –, and
8CC – undercutter treatment combinations, respectively; Table 4.5), but less so than the
WD treatment because of the added annual costs of cover crop seed, seedbed preparation,
and planting (Table 4.6). Termination with a disk, regardless of cover crop mixtures or

138
weeds, was always less profitable than the traditional no cover crop organic cropping
system (Table 4.5).
Large differences in the profitability of each crop in the rotation are also
informative (Table 4.5). Corn was by far the most profitable crop in all experimental
treatments ranging from $2,225 ha-1
yr-1
in the 8CC – disk treatment combination to
$2,962 ha-1
yr-1
in the WD – undercutter treatment combination. Large economic returns
on organic corn are not uncommon (Pimentel et al., 2005), but were especially lucrative
in this cropping system due to relatively low input costs (e.g., fewer tillage passes and
fertility inputs) and high grain prices (Table 4.6). Soybean production was only profitable
in the undercutter management systems ranging from $361 to $587 ha-1
yr-1
in the 8CC –
and WD – undercutter treatment combinations, respectively. Average annual profitability
of soybean production was limited in this study due to the input costs associated with
animal manure in the first year of the study (Table 4.6). While manure application can
improve soil quality and fertility, yield response is typically less consistent in soybean
due to the capacity for biological nitrogen fixation (Schmidt et al., 2001). Sunflower
production in this study was only profitable in the WD – undercutter treatment
combination ($87 ha-1
yr-1
), but profits were modest compared to those for corn and
soybean (Table 4.5). Sunflower profitability was limited by incidence of the banded
sunflower moth in 2010 and 2011 and also by a relatively low market value for sunflower
seed (Table 4.6). While price premiums for organic sunflower seed may exist in the
market, it is often difficult to identify a consistent market value for organic specialty
crops (USDA Market News Service, 2012). A guarantee of substantial price premiums
would be necessary to make organic sunflower production profitable in eastern Nebraska.

139
Conclusions
Increasing diversity of the cover crop mixture generally increased biomass
productivity in two of three years, highlighting the resilience of diverse cover crop
mixtures following management error and severe weather disturbance. Despite
differences in productivity, cover crop mixture composition and diversity did not
influence soil moisture, soil nitrogen, or crop yield. Instead, differences within these
factors were driven by termination method. Cover crop mixtures paired with the
undercutter for termination did increase yield and profitability compared to a traditional
no cover crop organic cropping system (NC control), but undercutter termination of weed
mixtures (WD – undercutter treatment combination) proved to be the most profitable
cropping system in this study. Although weeds are consistently a top management
concern (Walz, 1999; MNDA, 2007), dense weed communities are a common
characteristic of organic cropping systems; thus, it may be useful to identify and develop
potential uses for these weed communities (Wortman et al., 2010).
Results of this study demonstrate the potential for weeds to provide crop yield
benefits and farm profitability in excess of that achieved with traditional cover crop
species. Despite the short-term yield and economic benefits of the WD – undercutter
treatment combination, there are potential pitfalls associated with using weeds as cover
crops. For example, if using weeds as a cover crop farmers should take extra caution to
prevent weed seed production and replenishment of the seedbank (Davis, 2006).
Moreover, many weed species can harbor pests between cropping seasons (Venkatesh et
al., 2000). While yield and economic benefits were observed, substantially lower biomass

140
productivity and spatial heterogeneity of weeds relative to cover crop mixtures will
potentially limit the soil conservation benefits typically expected of cover crops.

141
Literature Cited
Altieri, M. 1999. The ecological role of biodiversity in agroecosystems. Agriculture,
Ecosystems, and Environment 74:19-31.
Ashford, D. L., and D. W. Reeves. 2003. Use of a mechanical roller-crimper as an
alternative kill method for cover crops. American Journal of Alternative
Agriculture18:37–45.
Barker, D. C., S. Z. Knezevic, A. R. Martin, D. T. Walters, and J. L. Lindquist. 2006.
Effect of nitrogen addition on the comparative productivity of corn and velvetleaf
(Abutilon theophrasti). Weed Science 54:354–363.
Biederbeck, V. O., O. T. Bouman, C. A. Campbell, L. D. Bailey, and G. E. Winkelman.
1996. Nitrogen benefits from four green-manure legumes in dryland cropping
systems. Canadian Journal of Plant Science 76:307–315.
Blevins, R. L., M. S. Smith, G. W. Thomas, and W. W. Frye. 1983. Influence of
conservation tillage on soil properties. Journal of Soil and Water Conservation
38:301-305.
Burket, J. Z., D. D. Hemphill, and R. P. Dick. 1997. Winter cover crops and nitrogen
management in sweet corn and broccoli rotations. HortScience 32:664–668.
Caviness, C. C., and J. D. Thomas. 1980. Yield reduction from defoliation of irrigated
and non-irrigated soybeans. Agronomy Journal 72:977–980.
Charlet, L. D. and J. F. Miller. 1993. Seed production after floret removal from sunflower
heads. Agronomy Journal 85:56-58.
Charlet, L. D., G. J. Seiler, J. F. Miller, B. A. Hulke, and J. J. Knodel. 2009. Resistance
among cultivated sunflower germplasm to the banded sunflower moth
(Lepidoptera:Tortricidae) in the northern Great Plains. Helia 32:1-10.
Chen, C., G. Jackson, K. Neill, D. Wichman, G. Johnson, and D. Johnson. 2005.
Determining the feasibility of early seeding canola in the northern Great Plains.
Agronomy Journal 97:1252–1262.
Clark, A. J., A. M. Decker, and J. J. Meisinger. 1994. Seeding rate and kill date effects on
hairy vetch–cereal rye cover crop mixtures for corn production. Agronomy Journal
86:1065–1070.
Colla, G., J. P. Mitchell, B. A. Joyce, L. M. Huyet, W. W. Wallender, S. R. Temple, T. C.
Hsiao, and D. D. Poudel. 2000. Soil physical properties and tomato yield and quality
in alternative cropping systems. Agronomy Journal 92:924–932.

142
Corn and Soybean Digest. 2010. Why corn and soybean farmers don’t use cover crops.
<http://cornandsoybeandigest.com/conservation/why-corn-and-soybean-farmers-
dont-use-cover-crops> Verified 2 March 2012.
Creamer, N. G. and S. M. Dabney. 2002. Killing cover crops mechanically: Review of
recent literature and assessment of research results. American Journal of Alternative
Agriculture 17:32–40.
Creamer, N. G., B. Plassman, M. A. Bennett, R. K. Wood, B. R. Stinner, and J. Cardina.
1995. A method for mechanically killing cover crops to optimize weed suppression.
American Journal of Alternative Agriculture 10:157-162.
Dabney S. M., J. A. Delgado, D. W. Reeves. 2001. Using winter cover crops to improve
soil and water quality. Communications in Soil Science and Plant Analysis 32:1221-
1250.
Daniel, J. B., A. O. Abaye, M. M. Alley, C. W. Adcock, and J. C. Maitland. 1999. Winter
annual cover crops in a Virginia no-till cotton production system: II. Cover crop and
tillage effects on soil moisture, cotton yield, and cotton quality. The Journal of Cotton
Science 3:84-91.
Davis, A. S. 2006. When does it make sense to target the weed seed bank? Weed Science
54:558–565.
Davis, A. S. 2010. Cover-crop roller-crimper contributes to weed management in no-till
soybean. Weed Science 58:300–309.
De Vita, P., E. Di Paolo, G. Fecondo, N. Di Fonzo, and M. Pisante. 2007. No-tillage and
conventional tillage effects on durum wheat yield, grain quality and soil moisture
content in southern Italy. Soil and Tillage Research 92:69–78.
Delate, K., M. Duffy, C. Chase, A. Holste, H. Friedrich, and N. Wantate. 2003. An
economic comparison of organic and conventional grain crops in a long-term
agroecological research (LTAR) site in Iowa. American Journal of Alternative
Agriculture 18:59–69.
Doak, D. F., D. Bigger, E. K. Harding, M. A. Marvier, R. E. O’Malley, and D. Thomson.
1998. The statistical inevitability of stability-diversity relationships in community
ecology. American Naturalist 151:264–276.
Ewing, R. P., M. G. Wagger, and H. P. Denton. 1991. Tillage and cover crop
management effects on soil water and corn yield. Soil Science Society of America
Journal 55:1081-1085.
Groffman, P. M., P. E. Hendrix, and D. A. Crossley, Jr. 1987. Nitrogen dynamics in
conventional and no-tillage agroecosystems with inorganic fertilizer or legume
nitrogen inputs. Plant and Soil 97:315–332.

143
Jose, H. D., and R. Janousek. 2010. 2010 Nebraska farm custom rates. University of
Nebraska – Lincoln Extension, Extension Publication EC823.
Kalinova, J., and J. Moudry. 2003. Evaluation of frost resistance in varieties of common
buckwheat (Fagopyrum esculentum Moench). Plant, Soil and Environment 49:410-
413.
Kornecki, T. S., A. J. Price, R. L. Raper, and A. J. Arriaga. 2009. New roller crimper
concepts for mechanical termination of cover crops in conservation agriculture.
Renewable Agriculture and Food Systems 24:165–173.
Kuo, S., and U.M. Sainju. 1998. Nitrogen mineralization and availability of mixed
leguminous and non-leguminous cover crop residues in soil. Biology and Fertility of
Soils 26:346–355.
Kuo, S., and E. J. Jellum. 2002. Influence of winter cover crop and residue management
on soil nitrogen availability and corn. Agronomy Journal 94:501–508.
Leuning, R., A. G. Condon, F. X. Dunin, S. Zegelin, and O. T. Denmead. 1994. Rainfall
interception and evaporation from soil below a wheat canopy. Agricultural and Forest
Meteorology 67:221-238.
Liebl, R., F. W. Simmons, L. M. Wax, and E. W. Stoller. 1992. Effect of rye (Secale
cereale) mulch on weed control and soil moisture in soybean (Glycine max). Weed
Technology 6:838-846
Lotter, D. W., R. Seidel, and W. Liebhardt. 2003. The performance of organic and
conventional cropping systems in an extreme climate year. American Journal of
Alternative Agriculture 18:146–154.
Mirsky, S., W. S. Curran, D. A. Mortensen, M. R. Ryan, and D. Shumway. 2009. Control
of cereal rye with a roller/crimper as influenced by cover crop phenology. Agronomy
Journal 101:1589–1596.
Mischler, R. A., W. S. Curran, S. W. Duiker, and J. A. Hyde. 2010. Use of a rolled-rye
cover crop for weed suppression in no-till soybeans. Weed Technology 24:253–261.
[MNDA] Minnesota Department of Agriculture. 2007. Overview: Experiences and
outlook of Minnesota organic farmers.
<www.mda.state.mn.us/news/publications/food/organicgrowing/2007orgsurvresults.p
df> Verified 4 March 2012.
Mulder, C. P. H., A. Jumpponen, P. Hogberg, and K. Huss-Danell. 2002. How plant
diversity and legumes affect nitrogen dynamics in experimental grassland
communities. Oecologia 133:412–421.

144
National Sunflower Association. 2012. Sunflower statistics: Historical prices - seed, oil,
and meal. <http://www.sunflowernsa.com/stats/historical-prices-values/> Verified 1
March 2012.
North Carolina State University Extension. 2008. Wheat organic production.
<http://www.ag-econ.ncsu.edu/extension/budgets/wheat/WHEATorganic.pdf.>
Verified 1 March 2012.
Parr, M., J. M. Grossman, S. C. Reberg-Horton, C. Brinton, and C. Crozier. 2011.
Nitrogen delivery from legume cover crops in no-till organic corn production.
Agronomy Journal 103:1578-1590.
Pimentel, D., C. Harvey, P. Resosudarmo, K. Sinclair, D. Kurz, M. McNair, S. Crist, L.
Shpritz, L. Fitton, R. Saffouriand, and R. Blair. 1995. Environmental and economic
costs of soil erosion and conservation benefits. Science 267:1117-1123.
Pimentel, D., P. Hepperly, J. Hanson, D. Douds, and R. Seidel. 2005. Environmental,
energetic and economic comparisons of organic and conventional farming systems.
BioScience 55:573–582.
Pimentel, D., U. Stachow, D. A. Takacs, H. W. Brubaker, A. R. Dumas, J. J. Meaney, J.
A. S. O'Neil, D. E. Onsi, and D. B. Corzilius. 1992. Conserving biological diversity
in agricultural/forestry systems. BioScience 42:354-362.
Quemada, M., and M. L. Cabrera. 1995. Carbon and nitrogen mineralized from leaves
and stems of four cover crops. Soil Science Society of American Journal 59:471–
477.
Reddy, K. N., R. M. Zablotowicz, M. A. Locke, and C. H. Koger. 2003. Cover crop,
tillage, and herbicide effects on weeds, soil properties, microbial populations, and
soybean yield. Weed Science 51: 987-994.
Sainju, U. M., and B. P. Singh. 1997. Winter cover crops for sustainable agricultural
systems: influence on soil properties, water quality, and crop yields. HortScience
32:21-28.
Sainju, U. M., and B. P. Singh. 2001. Tillage, cover crop, and kill planting date effects on
corn yield and soil nitrogen. Agronomy Journal 93:878–886.
Schmidt, J. P., M. A. Schmitt, G. W. Randall, J. A. Lamb, J. H. Orf, and H. T. Gollany.
2001. Soybean varietal response to liquid swine manure application. Agronomy
Journal 93:358–363.
Sosnoskie, L. M., C. P. Herms, and J. Cardina. 2006. Weed seedbank composition in a
35-yr-old tillage and rotation experiment. Weed Science 54:263-273.

145
Staver, K. W., and R. B. Brinsfield. 1998. Using cereal grain winter cover crops to reduce
groundwater nitrate contamination in the mid-Atlantic Coastal Plain. Journal of Soil
and Water Conservation 53:230–240.
Teasdale, J. R., and C. L. Mohler. 1993. Light transmittance, soil temperature, and soil
moisture under residue of hairy vetch and rye. Agronomy Journal 85:673–680.
Teasdale, J.R., L.O. Brandsaeter, A. Calegari, and F. Skora Neto. 2007. Cover crops and
weed management. In Non-chemical Weed Management. Eds. M.K. Upadhyaya and
R.E. Blackshaw. CAB International, Wallingford, UK.
Tilman, D. 1996. Biodiversity: population versus ecosystem stability. Ecology 77:350–
363.
Tilman, D., C. L. Lehman, and K. T. Thomson. 1997. Plant diversity and ecosystem
productivity: theoretical considerations. Proceedings of the National Academy of
Science 94:1857–1861.
Tilman, D., P. B. Reich, J. Knops, D. Wedin, T. Mielke, and C. Lehman. 2001. Diversity
and productivity in a long-term grassland experiment. Science 294:843–845.
Trenbath, B. R. 1999. Multispecies cropping systems in India: Predictions of their
productivity, stability, resilience and ecological sustainability. Agroforestry Systems
45:81–107.
Unger, P. W., and M. F. Vigil. 1998. Cover crop effects on soil water relationships.
Journal of Soil and Water Conservation 53:200–207.
University of Nebraska – Lincoln Extension. 2011. 2011 Cash rental rates up 13-25%.
<http://cropwatch.unl.edu/web/cropwatch/archive?articleID=4499047> Verified 1
March 2012.
USDA Market News Service. 2012. Upper Midwest organic grain and feedstuffs report.
<http://www.ams.usda.gov/mnreports/nw_gr113.txt> Verified 1 March 2012.
Venkatesh, R., S. K. Harrison, and R. M. Riedel. 2000. Weed hosts of soybean cyst
nematode (Heterodera glycines) in Ohio. Weed Technology 14:156-160.
Wagger, M. G. 1989. Cover crop management and nitrogen rate in relation to growth and
yield of no-till corn. Agronomy Journal 81:533–538.
Walz, E. 1999. Third biennial organic farmers survey. Organic Farming Research
Foundation, Santa Cruz, CA.
Ward, R.C. 2011. Ward guide. Ward Laboratories, Inc. [Online]. Available at
<http://www.wardlab.com/WardInfo/WardGuide.pdf> Verified 1 March 2012.

146
Williams II, M. M., D. A. Mortensen, and J. W. Doran. 1998. Assessment of weed and
crop fitness in cover crop residues for integrated weed management. Weed Science
46:595-603.
Wortman, S. E., J. L. Lindquist, M. Haar, and C. A. Francis. 2010. Increased weed
diversity, density and aboveground biomass in long-term organic crop rotations.
Renewable Agriculture and Food Systems 25:281-295.
Wortman, S. E., A. S. Davis, B. Schutte., and J. L. Lindquist. 2011. Integrating
management of soil nitrogen and weeds. Weed Science 59:162-170.
Wortman, S. E., C. A. Francis, and J. L. Lindquist. 2012. Cover crop mixtures for the
western Corn Belt: Opportunities for increased productivity and stability. Agronomy
Journal. In Press: doi:10.2134/agronj2011.0422.
Wortman, S. E. 2012.Weed biomass, density, and community response to cover crop
mixture and mechanical termination method. Doctoral dissertation, Chapter 3,
University of Nebraska – Lincoln.
Wyland, L. J., Jackson, L. E., Schulbach, K. F., 1995. Soil-plant nitrogen dynamics
following incorporation of a mature rye cover crop in a lettuce production system.
Journal of Agricultural Science 124:17-25.
Zaikin, A. A., D. L. Young, and W. F. Schillinger. 2007. Economic comparison of the
undercutter and traditional tillage systems for winter wheat- summer fallow farming.
WSU Farm Business Management Report EB2022E.
<http://cru.cahe.wsu.edu/CEPublications/EB2022E/EB2022E.pdf> Verified 3 March
2012.

147
Tables and Figures
Table 4.1. Cover crop species and seeding rates used in individual cover crop mixtures for 2009 and 2010-11 (2CC = 2 species
mixture; 4CC = 4 species mixture; 6CC = 6 species mixture; 8CC = 8 species mixture).
Cover Crop Seeding Rate
Common Name Scientific Name 2CC 4CC 6CC 8CC
____________ kg ha
-1 _____________
Hairy Vetch Vicia villosa 22.4 11.2 7.5 5.6
Buckwheat (2009) Fagopyrum sagittatum 28.0 14.0 9.3 7.0
Idagold Mustard (2010-11) Sinapus alba 6.7 3.4 2.2 1.7
Field Pea Pisum sativum
28.0 18.7 14.0
Pacific Gold Mustard Brassica juncea
2.2 1.7 1.1
Oilseed Radish Raphanus sativus
2.8 2.1
Crimson Clover Trifolium incarnatum
4.7 3.5
Dwarf Essex Rape Brassica napus
1.7
Chickling Vetch Lathyrus sativus 8.4
14
7

148
Table 4.2. Timing of field operations and data collection for each year of the study.
Year
2009 2010 2011
Operation
Cover crop planting 20 March 30 March 21 March
Cover crop sampling 19-21 May 24 May 1 June
Cover crop termination 22 May 28 May 3 June
Main crop planting 28 May 1-3 June 6 June
1st interrow cultivation 1 July 28 June 30 June
2nd interrow cultivation
1 July 8 July
1st soil sampling 6-7 July 29-30 June 28 June
2nd soil sampling 11-12 August 26-27 July 27-28 July

149
Table 4.3. Monthly precipitation total (mm) and average air temperature (°C) for April to September in 2009, 2010, and 2011, and the
30-year mean from the University of Nebraska Turf Farm near Mead, NE (41°10'12"N lat, 96°28'12"W long, elevation= 366 m).
2009 2010 2011 30-year mean
Month Temp. Precip. Temp. Precip. Temp. Precip. Temp. Precip.
April 9.0 28 12.8 85 9.9 76 10.1 70
May 16.9 34 15.6 53 16.2 164 16.3 106
June 21.4 135 22.5 217 22.3 139 22.0 101
July 21.1 68 24.4 156 26.5 80 24.3 84
August 20.9 135 24.3 71 23.2 78 22.9 85
September 17.2 31 17.4 134 15.7 9 18.2 73
Total 17.8 432 19.5 717 19.0 547 19.0 519
149

150
Table 4.4. Crop yield (Mg ha-1
) ± 1 standard error for corn, soybean, and sunflower as
influenced by termination method in the years 2009, 2010, and 2011. Different letters
within a particular year and crop indicate differences among termination methods.
Crop 2009 2010 2011
Corn __________
Mg ha-1 __________
No cover 8.41 ± 0.64 a 5.29 ± 0.64 c 11.12 ± 0.64 a
Disk 7.37 ± 0.28 b 6.45 ± 0.28 b 10.16 ± 0.28 b
Undercutter 8.78 ± 0.28 a 7.75 ± 0.28 a 10.97 ± 0.28 a
Soybean
No cover 2.59 ± 0.18 a 0.72 ± 0.18 b 2.51 ± 0.18 b
Disk 1.58 ± 0.08 b 0.82 ± 0.08 b 2.11 ± 0.08 c
Undercutter 2.46 ± 0.08 a 1.11 ± 0.08 a 2.96 ± 0.08 a
Sunflower
No cover 2.18 ± 0.15 a 0.55 ± 0.15 a 1.46 ± 0.15 a
Disk 1.91 ± 0.07 b 0.74 ± 0.07 a 1.40 ± 0.07 a
Undercutter 2.11 ± 0.07 a 0.74 ± 0.07 a 1.52 ± 0.07 a

151
Table 4.5. Economic costs, returns, and average annual profit (US dollars ($) ha-1
) for the 11 different cover crop mixture by
termination method treatment combinations in corn, soybean, and sunflower for the years 2009, 2010, 2011, and for the entire
rotation. NC = no cover control; WD = weedy mixture; 2-, 4-, 6-, and 8CC = 2, 4, 6, and 8 cover crop species mixtures, respectively
(Table 4.1); D = disk termination; U = undercutter termination.
15
1

152
Cover crop mixture and termination method
NC WD 2CC 4CC 6CC 8CC
D U D U D U D U D U
Costs ________________________________
US dollars ($) ha-1 ________________________________
2009 1,514 1,472 1,470 1,667 1,665 1,656 1,653 1,690 1,688 1,690 1,688
2010 771 731 729 900 897 912 909 954 951 961 959
2011 771 731 729 899 897 912 909 954 951 961 959
Returns
Corn
2009 3,884 3,404 4,055 3,404 4,055 3,404 4,055 3,404 4,055 3,404 4,055
2010 2,193 2,674 3,212 2,674 3,212 2,674 3,212 2,674 3,212 2,674 3,212
2011 4,609 4,211 4,547 4,211 4,547 4,211 4,547 4,211 4,547 4,211 4,547
Soybean
2009 1,933 1,179 1,836 1,179 1,836 1,179 1,836 1,179 1,836 1,179 1,836
2010 508 578 783 578 783 578 783 578 783 578 783
2011 1,755 1,475 2,069 1,475 2,069 1,475 2,069 1,475 2,069 1,475 2,069
Sunflower
2009 1,591 1,394 1,540 1,394 1,540 1,394 1,540 1,394 1,540 1,394 1,540
2010 401 540 540 540 540 540 540 540 540 540 540
2011 1,065 1,021 1,109 1,021 1,109 1,021 1,109 1,021 1,109 1,021 1,109
Avg. annual profit
Corn 2,543 2,451 2,962 2,274 2,785 2,270 2,781 2,230 2,741 2,225 2,736
Soybean 380 99 587 -78 410 -82 406 -122 366 -127 361
Sunflower 1 7 87 -171 -90 -175 -94 -214 -134 -219 -139
3-crop rotation 975 853 1,212 675 1,035 671 1,031 631 991 626 986
152

153
Table 4.6. Price estimates and information source for costs and returns associated with
each experimental management system.
Costs and returns US dollars ha-1
Source
Costs
Cover crop seed
Idagold mustard 83 L.A. Hearneb
Buckwheata
178 Johnny's Selected Seedsc
Hairy vetcha
118 L.A. Hearneb
Pacific gold mustard 51 L.A. Hearneb
Field peaa
195 L.A. Hearneb
Oilseed radish 115 Johnny's Selected Seedsc
Crimson clovera
363 Johnny's Selected Seedsc
Dwarf essex rape 52 Johnny's Selected Seedsc
Chickling vetcha
298 Johnny's Selected Seedsc
Land rent 445 UNL Extension (2011)
Cover crop planting
Seedbed preparation 17 Jose and Janousek (2010)
Drill planting 30 Jose and Janousek (2010)
Cover crop termination
Disking 25 Jose and Janousek (2010)
Undercutting 22 Jose and Janousek (2010)
Main crop planting
Seedbed preparation 17 Jose and Janousek (2010)
Organic crop seed 74 Delate et al. (2003)
Planting 34 Jose and Janousek (2010)
Weed management
Interrow cultivation 22 Jose and Janousek (2010)
Combine harvest 69 Jose and Janousek (2010)
Fall tillage
Moldboard plow 22 Jose and Janousek (2010)
Feedlot manure 741 Delate et al. (2003)
Certification costs 40 NCSU Extension (2008)
Returns
Corna
$433 Mg-1
USDA Market News Service (2012)
Soybeana
$698 Mg-1
USDA Market News Service (2012)
Sunflower $295 Mg-1
National Sunflower Association (2012) a Certified organic
b L.A. Hearne Co., Monterey County, CA, USA
c Johnny's Selected Seeds, Fairfield, ME, USA

154
Figure 4.1. Cover crop and/or weed biomass combined (g m-2
) for each cover crop
mixture treatment in years 2009, 2010, and 2011 of the study. Mixtures are arranged on
the x-axis in order of increasing cover crop community diversity. WD = weedy mixture;
2-, 4-, 6-, and 8CC = 2, 4, 6, and 8 cover crop species mixtures, respectively (Table 4.1).
Cover crop mixture (no. of species)
WD 2CC 4CC 6CC 8CC
Cove
r cro
p a
nd w
eed
bio
ma
ss (
g m
-2)
0
100
200
300
400
500
2009
2010
2011

155
Figure 4.2. Volumetric soil water content (cm3 H20 cm
-3 soil) during cover crop growth
(top left) and following cover crop termination (top right) in 2009. Daily precipitation
totals (mm) for DOY 110 to 210 are included (bottom left and right). NC = no cover
control; WD = weedy mixture; 2-, 4-, 6-, and 8CC = 2, 4, 6, and 8 cover crop species
mixtures, respectively (Table 4.1).

156
Vo
lum
etr
ic s
oil
wa
ter
co
nte
nt
(cm
3 c
m-3
)
0.10
0.15
0.20
0.25
0.30
0.35
0.40
NC
WD
2CC
4CC
6CC
8CC
0.10
0.15
0.20
0.25
0.30
0.35
0.40
No Cover
Disked
Undercut
Day of year
110 115 120 125 130 135 140 145
Pre
cip
ita
tio
n (
mm
)
0
10
20
30
40
50
Col 1 vs Col 2
150 160 170 180 190 200 210
0
10
20
30
40
50
15
6

157
Figure 4.3. Volumetric soil water content (cm3 H20 cm
-3 soil) during cover crop growth
(top left) and following cover crop termination (top right) in 2010. Daily precipitation
totals (mm) for DOY 100 to 185 are included (bottom left and right). NC = no cover
control; WD = weedy mixture; 2-, 4-, 6-, and 8CC = 2, 4, 6, and 8 cover crop species
mixtures, respectively (Table 4.1).

158
Vo
lum
etr
ic s
oil
wa
ter
co
nte
nt
(cm
3 c
m-3
)
0.15
0.20
0.25
0.30
0.35
0.40NC
WD
2CC
4CC
6CC
8CC
0.15
0.20
0.25
0.30
0.35
0.40
No cover
Disk
Undercutter
Day of year
100 110 120 130 140 150
Pre
cip
ita
tio
n (
mm
)
0
10
20
30
40
50
155 160 165 170 175 180 185
0
10
20
30
40
50
158

159
Figure 4.4. Volumetric soil water content (cm3 H20 cm
-3 soil) during cover crop growth
(top) and daily precipitation totals (mm) for DOY 129 to 155 (bottom). NC = no cover
control; WD = weedy mixture; 2-, 4-, 6-, and 8CC = 2, 4, 6, and 8 cover crop species
mixtures, respectively (Table 4.1).
Day of year
130 135 140 145 150 155
Pre
cip
ita
tio
n (
mm
)
0
10
20
30
40
50
60
130 135 140 145 150 1550.10
0.15
0.20
0.25
0.30
0.35
NC
WD
2CC
4CC
6CC
8CC
Vo
lum
etr
ic s
oil
wa
ter
co
nte
nt
(cm
3 c
m-3
)

160
EPILOGUE
Often the most important findings in a research project are the new research
questions that arise, and this project is no exception. Overall, we were successful in
accomplishing our initial objectives and testing our central hypotheses, but it is hard to
feel satisfied when so many interesting and important questions remain. Throughout this
epilogue I will address some of the questions I believe this research helped to answer, and
other questions this research has spawned. Developing sustainable cropping systems
founded in ecological principles is a work in progress, and hopefully the results of this
study will serve to advance the science of sustainable agriculture.
Are spring-sown cover crops a feasible option for corn – soybean farmers in the western
Corn Belt?
This study has certainly demonstrated that spring-sown cover crops are a realistic
option for corn – soybean farmers in the western Corn Belt. However, our results also
demonstrate the potential pitfalls of this cover cropping strategy. The most obvious short-
coming of this strategy is the lack of soil coverage achieved from late-fall through the
winter months typically achieved with a more traditional winter annual cover crop
species. However, this study demonstrated two additional production pitfalls. First, a
primary objective for planting the cover crops was to increase soil nitrogen through
biological nitrogen fixation. While nodules were observed on most legume roots prior to
termination of cover crops in all years (data not shown), the amount of soil N derived
from biological nitrogen fixation was probably negligible as soil nitrate did not differ
between cover crop mixtures and the WD treatment (ambient weed communities
managed as cover crops) in any year of the study or at any sampling interval. While soil
nitrate is not a direct measure of biological nitrogen fixation, if “new” nitrogen was being

161
added to the soil system via fixation one could expect greater levels of mineralized soil N
upon decomposition of the leguminous cover crop biomass (which was not observed
here). Combined with the reduced potential for biomass productivity (Chapter 1),
legumes are likely not an appropriate cover crop choice for spring planting in the western
Corn Belt.
The second major pitfall of the spring-sown cover crop option is the potential for
yield loss associated with delayed planting of corn and soybean. For a spring-planted
cover crop to achieve a substantial level of productivity, it will need to be grown until at
least mid-May in most years. A late-May planting date for soybean, and especially corn,
can lead to a substantial loss in yield (Lauer et al., 1999). This was observed in 2009
when an early-fall frost terminated the corn crop prior to physiological maturity, reducing
grain test weight and yield. The corn hybrid used in this study (BRH 57H36) is a 107 day
hybrid, which is shorter than the typical 111-116 day hybrids used in this region of the
Corn Belt. This early-maturing hybrid was selected to compensate for the planting dates,
but the 2009 yield loss highlights the risk associated with delayed planting even when
adjusting crop maturities. Regardless of planting in the fall or spring, if cover crops are to
be planted there will need to be some deviation from the traditional corn – soybean
rotation and the full season crop varieties often found in the field from April until
November. The spring-seeded option tested here is possible, but like all options is
accompanied by several challenges and potential pitfalls. Ultimately, the farmer must
weigh these challenges against the array of potential benefits offered by cover crops and
cover crop mixtures demonstrated here and elsewhere.

162
Are cover crop mixtures better than a single species cover crop?
The answer to this question, as is the case for many research questions, is “it
depends”. In this study we demonstrated the potential for increased productivity, stability,
and resiliency in cover crop mixtures compared to the respective monoculture species
(Chapter 1). However, the difference in productivity observed among cover crop
mixtures rarely led to biologically significant changes in the cropping system. For
example, cover crop biomass had no effect on weed suppression, soil nitrogen, or crop
yield. While cover crop mixtures may be the most productive and stable option, our
results also suggest that cover crop species and community composition may have unique
impacts on cropping system properties. This was evident where early-season weed
suppression varied among cover crop mixtures, despite no relationship between cover
crop biomass and weed biomass. Thus, a single species cover crop may be appropriate
when a specific management objective, unrelated to cover crop productivity, is desired.
However, farmers should use caution when choosing a single species cover crop as this
increases risk of establishment failure associated with management errors and extreme
perturbations (Chapter 1; Chapter 3).
Is the undercutter the best tool for mechanical termination of cover crop mixtures?
This study demonstrated that cover crop termination with the undercutter was far
superior to termination with the disk. Termination with the undercutter consistently
reduced weed biomass throughout the growing season, increased early season soil
moisture content, increased soil nitrate availability, and increased crop yield and
profitability, relative to termination with the disk. However, many other mechanical
termination methods exist and have been tested elsewhere (Creamer et al., 2002).

163
Currently, the most popular of the mechanical termination methods is the roller-crimper.
Development of the roller-crimper and its performance has received a great deal of recent
research attention (e.g., Kornecki et al., 2009; Davis, 2010). The roller-crimper is
advantageous because it eliminates soil disturbance, but the undercutter is beneficial
because of its potential to terminate a wide range of species at different growth stages.
The biggest pitfall of the roller-crimper, especially when planting a spring-sown cover
crop, is that most species need to reach full-bloom reproductive stages before termination
can be achieved. While the undercutter was not always effective against small weed
seedlings (Chapter 2), it was generally effective in killing all cover crop species
regardless of cover crop growth stage. Thus, the undercutter may be a more appropriate
tool for termination of cover crop mixtures, whereas the roller-crimper may be most
appropriate for termination of single species cover crops planted in the fall (e.g., winter
rye before soybean; Davis, 2010). The merits and short-comings of both implements have
now been demonstrated, and the “best” tool will ultimately depend on the management
objective, cover crop species/mixture, and cropping system.
How can this experimental cover crop system be improved?
Given the low productivity of legume spp. grown alone and in mixture (Chapter
1), combined with the lack of soil nitrogen contributions from the cover crop mixtures
(Chapter 4), it would seem legume spp. could be removed from spring-sown cover crop
mixtures in the western Corn Belt. Moreover, legume spp. are typically among the most
expensive cover crop options, so removal from the mixture will likely increase the
profitability of this cover crop strategy. In contrast, the mustard spp. tested in this
experiment were all quite productive and well adapted for early-spring growth in eastern

164
Nebraska. To replace the legume spp., it would be interesting to include several grass
species in the mixture – especially those that have demonstrated allelopathic potential.
Potential grass species might include oat (Avena sativa L.), cereal rye (Secale cereale L.),
or wheat (Triticum aestivum L.), all of which have demonstrated allelopathic potential
(Einhellig and Leather, 1988). The results of this study demonstrated the potential
importance of plant and mixture biochemical composition on early-season weed
suppression (Chapter 3), but the addition of grass species to a spring-seeded mixture will
also increase the C:N ratio of the mixture and delay decomposition of surface residues.
Thus, grasses may contribute physical mechanisms of weed suppression to the existing
allelopathic mechanisms observed in this study.
What are the long-term consequences of using ambient weeds as cover crops?
Given the results of these studies, especially with regard to cropping system
profitability, it would be tempting to suggest that farmers should adopt the use of ambient
weeds as cover crops. There may be some merit to this practice, but there are several
biological and social implications that should be considered. When weeds were managed
as cover crops in this study, there were substantial effects on soil microbial community
structure. Some aspects of this community shift have management implications. For
example, the WD treatment reduced ratios of FAME biomarkers commonly associated
with AM fungi (Chapter 3). Reduced AMF populations may not have affected crop yield
in this relatively short-term study, but a long-term reduction in AMF root colonization in
crops like corn or wheat, may cause significant yield loss. There were other detectable
shifts in community structure in the WD treatment, but unfortunately less is known about
the agronomic function and relative value of many microbial groups (e.g.,

165
actinomycetes). Further studies regarding soil microbial group and ecosystem function
will provide insight about the potential agronomic effects of using these weedy species as
cover crops. I believe the link between soil microbial community structure and ecosystem
functions is fascinating, and remains one of the “great frontiers” in agricultural science.
Perhaps more important than the biological implications, are the social
implications of using weeds as cover crops. While some have proposed a paradigm shift
in our thinking about weeds (Marshall et al., 2003; Wortman et al., 2010), a large
negative stigma will always be attached to weeds and their role in agroecoystems. Even if
a farmer were to change their perspective on the role of weeds, it is unlikely that their
neighbors would experience a similar conversion. Farmers are undoubtedly driven by
social forces at work on the community level, and allowing ambient weed communities to
reach reproductive stages would likely draw negative attention in many rural
communities. However, this negative attention is not entirely unfounded as the
persistence of mature weed communities could have serious biological implications on a
landscape level.
One of the most serious weed management issues facing farmers in the Corn Belt
right now is the increased incidence and spread of herbicide resistant weed populations.
Managing ambient weed communities as a cover crop may not provide additional
selection pressures that lead to the incidence of resistant populations, but it may
contribute to the spread of resistant populations as pollen and seed dispersal are not
confined to individual fields. It is possible that cross pollination would occur with
herbicide resistant weeds of neighboring fields; thus, if weedy cover crops were
inadvertently allowed to reach full maturity and set seed this practice could potentially

166
accelerate an already rapidly-growing problem. A similar example, more pertinent
perhaps to organic farmers, is the potential for ambient weed communities to promote the
incidence of soil pathogens like soybean cyst nematode. Many winter annual weeds like
henbit, field pennycress, and purple deadnettle, are alternative hosts for soybean cyst
nematode (Venkatesh et al., 2000), which is a difficult soil pathogen to control, especially
in organic cropping systems where reactive control options will be limited. These issues
(e.g., herbicide resistance and soil pathogens) are often localized to individual farmer
fields, but can quickly spread across landscapes if “best management practices” are not
used. With regard to these management issues, the persistence of ambient weed
communities as a cover crop would not be considered a best management practice by
most standards (e.g., social and scientific).
Are the results of this project only applicable to organic farmers?
There are aspects of this project and the results that will be of most use to organic
farmers in the western Corn Belt. For example, differences in mechanical termination
strategies may not be relevant to conventional farmers in this region who primarily
practice no-till agriculture. However, some of the more general findings in this study
should be relevant to both organic and conventional farmers. First, evidence for increased
productivity, stability, and resiliency with increasing diversity observed in Chapter 1, has
implications beyond cover crop mixtures. Increasing the diversity of any aspect of
cropping systems or farming enterprises, should provide opportunities to realize the same
benefits observed here in our diverse cover crop mixtures. For example, temporal or
spatial diversification of the traditional corn – soybean rotation by adding a small grain

167
like winter wheat to the rotation may increase the long-term productivity and yield
stability of the system (Smith and Gross, 2006).
While the specific mechanical termination methods tested in this study may not be
adopted by conventional farmers, the results should be relevant to conventional farmers
looking to use cover crops. Conventional farmers are often curious about when they
should spray their cover crops relative to corn or soybean planting. The best answer to
this question will depend on a variety of factors (e.g., herbicide chemistry, soil type,
climate, planting dates, and cover crop species), but the agronomic response to the
undercutter may provide insight about this question. The undercutter leaves cover crop
residue fully intact on the soil surface, whereas chemical termination will result in fully
intact residue still standing in the soil. The soil surface to plant contact surface area will
be greater following undercutter termination, presumably increasing decomposition rates,
but these two methods are likely similar in their agronomic response. Thus, if an
appropriate herbicide is used (one that does not have residual planting restrictions) it
would seem cash crops can be planted as early as three days after chemical termination of
similar cover crop mixtures without adverse agronomic effects (e.g., mustards and
legumes; relatively low C:N ratio). Corn, soybean, and sunflower were all planted within
3 to 7 days of undercutter termination without adverse agronomic effects often associated
with cover crop decomposition (e.g., N immobilization and reduced crop stands). This is
contrary to many anecdotal recommendations that exist within the cover crop community,
where 7 to 14 days prior to planting is the usual suggestion for termination. However, this
recommendation is based on the assumption that corn will be planted in early-May, not
late-May as practiced in this study. If a cover crop is terminated in late-April, soil and

168
weather conditions may require a longer planting interval due to slower herbicide activity
and decomposition rates. While this study contributes new information regarding cover
crop termination timing, determination of the most appropriate timing method remains a
complex issue that requires consideration of many management factors.
What is the future of cover crop mixture research?
The science of cover crop mixtures is still in its infancy. While multi-species plant
community dynamics have been well-studied in the field of ecology, the design of multi-
species plant mixtures to meet specific management objectives is unique in many ways.
In a natural ecosystem the objective for multi-species plant communities is to maximize
net primary productivity and fecundity. However, in a managed agroecosystem farmers
may seek to maximize plant characteristics like biological nitrogen fixation or
allelopathic chemical synthesis. Indeed, two areas of future research opportunity include
the design of cover crop mixtures to maximize biological nitrogen fixation of legumes
and also the design of mixtures that will stimulate accumulation of effective phytotoxic
compounds. Plant stress has been shown to increase the production of allelopathic
compounds in several plant species (Hall et al., 1983; Williamson et al., 1992), and
appropriate interspecific competitive interactions in a cover crop mixture may help to
maximize allelopathic mechanisms of weed control.
If the objective for the cover crop is to maximize productivity, there are research
questions that remain regarding appropriate species composition. Specifically, how do
root and canopy architecture contribute to mixture productivity? Is a mixture of species
with similar morphology best (i.e., simulated intraspecific competition), or should a range
of species with very different morphologies be used in mixture? In this study we assumed
169
that a mixture of low growing legumes and upright mustards with variable root
architectures (e.g., branched, fibrous, and tap) would maximize productivity, but this
hypothesis was not directly tested. A great deal of interest and uncertainty remains
regarding the most appropriate mixture composition and selection.
Studying the theories of ecological resilience with regard to cover crop mixtures
is another area of potential future research. We observed anecdotal evidence of increased
resilience in cover crop mixtures relative to monocultures following a 2011 hail storm,
but no formal hypotheses were tested regarding the concept of ecological resilience
(Chapter 1). The concept of maximizing ecological resilience for stable cover crop
productivity is interesting because strong resilience may become problematic when one
seeks to terminate the cover crop mixture. This distinction highlights the difference
between natural multi-species plant communities and those managed in agroecosystems.
The challenge for researchers is to develop cover crop mixtures that are resilient to
extreme natural factors like wind, hail, and drought, but are then susceptible (not
resilient) to management factors like undercutting, roller-crimping, or broad-spectrum
herbicide application.
Though still a management practice used by a minority of farmers, cover crops
and cover crop mixtures are increasing in popularity especially among organic farmers.
This study provides science-based information and practical solutions for more informed
cover crop management decisions, but many knowledge gaps remain. Given the growing
enthusiasm and funding opportunities for sustainable agricultural practices at the local,
regional, and federal level, it is my hope that we can continue to answer some of these
remaining cover crop research questions. Furthering the science of cover crop

170
management will be essential for increased adoption on organic and conventional farms
throughout the western Corn Belt.

171
Literature Cited
Creamer, N. G. and S. M. Dabney. 2002. Killing cover crops mechanically: Review of
recent literature and assessment of research results. American Journal of Alternative
Agriculture 17:32–40.
Davis, A. S. 2010. Cover-crop roller-crimper contributes to weed management in no-till
soybean. Weed Science 58:300-309.
Einhellig. F. A, and G. R. Leather. 1988. Potentials for exploiting allelopathy to enhance
crop production. Journal of Chemical Ecology 14:1829-1844.
Hall, A. B., U. Blum, and R. C. Fites. 1983. Stress modification of allelopathy of
Helianthus anuus L. debris on seedling biomass production of Amaranthus
retroflexus L. Journal of Chemical Ecology 9:1213-1223.
Kornecki, T. S., A. J. Price, R. L. Raper, and A. J. Arriaga. 2009. New roller crimper
concepts for mechanical termination of cover crops in conservation agriculture.
Renewable Agriculture and Food Systems 24:165–173.
Lauer, J. G., P. R. Carter, T. M.Wood, G. Diezel, D. W. Wiersma, R. E. Rand, and M. J.
Mlynarek. 1999. Corn yield response to planting date in the northern Corn Belt.
Agronomy Journal 91:834–839.
Marshall, E. J. P., V. K. Brown, N. D. Boatman, P. J. W. Lutman, G. R. Squire, and L. K.
Ward. 2003. The role of weeds in supporting biological diversity within crop fields.
Weed Research 43:77-89.
Smith, R. G., and K. L. Gross. 2006. Weed community and corn yield variability in
diverse management systems. Weed Science 54:106–113.
Venkatesh, R., S. K. Harrison, and R. M. Riedel. 2000. Weed hosts of soybean cyst
nematode (Heterodera glycines) in Ohio. Weed Technology 14:156-160.
Williamson, G. B., E. M. Obee, and J. D. Weidenhamer. 1992. Inhibition of
Schizachyrium scoparium (Poaceae) by the allelochemical hydrocinnamic acid.
Journal of Chemical Ecology 18:2095–2105.
Wortman, S. E., J. L. Lindquist, M. Haar, and C. A. Francis. 2010. Increased weed
diversity, density and aboveground biomass in long-term organic crop rotations.
Renewable Agriculture and Food Systems 25:281-295.