Spatial and Temporal Biogeography of Soil Microbial Communities in Arid and Semiarid Regions
9
Spatial and Temporal Biogeography of Soil Microbial Communities in Arid and Semiarid Regions Zohar Pasternak 1 * . , Ashraf Al-Ashhab 2. , Joao Gatica 1. , Ron Gafny 3 , Shlomit Avraham 3 , Dror Minz 4 , Osnat Gillor 2 , Edouard Jurkevitch 1 1 Department of Microbiology and Plant Diseases, The Robert H. Smith Faculty of Agriculture, Food and Environment, The Hebrew University of Jerusalem, Rehovot, Israel, 2 Zuckerberg Institute for Water Research, The Jacob Blaustein Institutes for Desert Research, Ben-Gurion University of the Negev, Sede Boqer, Israel, 3 Forensic Biology Laboratory, Division of Identification and Forensic Science (DIFS), Israel Police National Headquarters, Jerusalem, Israel, 4 Institute of Soil, Water and Environmental Sciences, Agricultural Research Organization, The Volcani Center, Bet-Dagan, Israel Abstract Microbial communities in soils may change in accordance with distance, season, climate, soil texture and other environmental parameters. Microbial diversity patterns have been extensively surveyed in temperate regions, but few such studies attempted to address them with respect to spatial and temporal scales and their correlations to environmental factors, especially in arid ecosystems. In order to fill this gap on a regional scale, the molecular fingerprints and abundance of three taxonomic groups – Bacteria, a-Proteobacteria and Actinobacteria – were sampled from soils 0.5–100 km apart in arid, semi-arid, dry Mediterranean and shoreline Mediterranean regions in Israel. Additionally, on a local scale, the molecular fingerprints of three taxonomic groups – Bacteria, Archaea and Fungi – were sampled from soils 1 cm–500 m apart in the semi-arid region, in both summer and winter. Fingerprints of the Bacteria differentiated between all regions (P,0.02), while those of the a-Proteobacteria differentiated between some of the regions (0.01,P,0.09), and actinobacterial fingerprints were similar among all regions (P.0.05). Locally, fingerprints of archaea and fungi did not display distance-decay relationships (P.0.13), that is, the dissimilarity between communities did not increase with geographic distance. Neither was this phenomenon evident in bacterial samples in summer (P.0.24); in winter, however, differences between bacterial communities significantly increased as the geographic distances between them grew (P,0.01). Microbial community structures, as well as microbial abundance, were both significantly correlated to precipitation and soil characteristics: texture, organic matter and water content (R 2 .0.60, P,0.01). We conclude that on the whole, microbial biogeography in arid and semi-arid soils in Israel is determined more by specific environmental factors than geographic distances and spatial distribution patterns. Citation: Pasternak Z, Al-Ashhab A, Gatica J, Gafny R, Avraham S, et al. (2013) Spatial and Temporal Biogeography of Soil Microbial Communities in Arid and Semiarid Regions. PLoS ONE 8(7): e69705. doi:10.1371/journal.pone.0069705 Editor: Purificacio ´n Lo ´ pez-Garcı ´a, Universite ´ Paris Sud, France Received December 22, 2012; Accepted June 11, 2013; Published July 26, 2013 Copyright: ß 2013 Pasternak et al. This is an open-access article distributed under the terms of the Creative Commons Attribution License, which permits unrestricted use, distribution, and reproduction in any medium, provided the original author and source are credited. Funding: Funding for this project was provided by the Technical Support Working Group of the U.S. CTTSO (Combating Terrorism Technical Support Office). The funders had no role in study design, data collection and analysis, decision to publish, or preparation of the manuscript. Competing Interests: The authors have declared that no competing interests exist. * E-mail: [email protected] . These authors contributed equally to this work. Introduction A large number of studies have demonstrated that microbial taxa display non-random environmental distribution. Particularly, bacterial communities may become increasingly different as the geographical distance between them increases [1]. Two mecha- nisms might contribute to this distance-decay relationship: the environmental conditions that are at play and bacteria dispersal limitation. The first mechanism may sort bacterial communities in accordance to their niche adaptations, which reflect specific environmental conditions. Hence, dissimilarity among microbial community compositions could match the disparity in environ- mental conditions, which, in turn, may be linked to geographical distances [2]. A wider view of this observation in the microbial world, namely that ‘everything is everywhere, but the environment selects’ [3], claims that spatial patterns of microbial diversity are driven by environmental heterogeneity rather than by dispersal limitation. Therefore, one might expect to find similar microbial communities in similar habitats and an assortment of microbial communities along an environmental gradient [4]. The second mechanism assumes that if individual bacterial dispersal (migra- tion) is limited to adjacent sites, then spatial proximity will result in similar communities even if the sites are ecologically different. Thus, a distance-decay relationship would emerge even if the environmental conditions are comparable and the community niche requirements similar across regions [5]. In the past decade, a number of studies have centered on the biogeography of microbial species. These studies have indicated some degree of habitat endemicity [4], [6] at scales ranging from a few centimeters [7] to hundreds of kilometers [8], [9]. But although many microbial species might be globally distributed, using molecular techniques to identify microbial taxa, some surveys have shown that the distribution of microorganisms is also spatially limited in the same way as macroorganisms [10]. In fact, coupled with environmental data, the distance-decay relationship offers a mean to assess the relative importance of environmental PLOS ONE | www.plosone.org 1 July 2013 | Volume 8 | Issue 7 | e69705
Transcript of Spatial and Temporal Biogeography of Soil Microbial Communities in Arid and Semiarid Regions
Spatial and Temporal Biogeography of Soil MicrobialCommunities in Arid and Semiarid RegionsZohar Pasternak1*., Ashraf Al-Ashhab2., Joao Gatica1., Ron Gafny3, Shlomit Avraham3, Dror Minz4,
Osnat Gillor2, Edouard Jurkevitch1
1Department of Microbiology and Plant Diseases, The Robert H. Smith Faculty of Agriculture, Food and Environment, The Hebrew University of Jerusalem, Rehovot, Israel,
2 Zuckerberg Institute for Water Research, The Jacob Blaustein Institutes for Desert Research, Ben-Gurion University of the Negev, Sede Boqer, Israel, 3 Forensic Biology
Laboratory, Division of Identification and Forensic Science (DIFS), Israel Police National Headquarters, Jerusalem, Israel, 4 Institute of Soil, Water and Environmental
Sciences, Agricultural Research Organization, The Volcani Center, Bet-Dagan, Israel
Abstract
Microbial communities in soils may change in accordance with distance, season, climate, soil texture and otherenvironmental parameters. Microbial diversity patterns have been extensively surveyed in temperate regions, but few suchstudies attempted to address them with respect to spatial and temporal scales and their correlations to environmentalfactors, especially in arid ecosystems. In order to fill this gap on a regional scale, the molecular fingerprints and abundanceof three taxonomic groups – Bacteria, a-Proteobacteria and Actinobacteria – were sampled from soils 0.5–100 km apart inarid, semi-arid, dry Mediterranean and shoreline Mediterranean regions in Israel. Additionally, on a local scale, the molecularfingerprints of three taxonomic groups – Bacteria, Archaea and Fungi – were sampled from soils 1 cm–500 m apart in thesemi-arid region, in both summer and winter. Fingerprints of the Bacteria differentiated between all regions (P,0.02), whilethose of the a-Proteobacteria differentiated between some of the regions (0.01,P,0.09), and actinobacterial fingerprintswere similar among all regions (P.0.05). Locally, fingerprints of archaea and fungi did not display distance-decayrelationships (P.0.13), that is, the dissimilarity between communities did not increase with geographic distance. Neitherwas this phenomenon evident in bacterial samples in summer (P.0.24); in winter, however, differences between bacterialcommunities significantly increased as the geographic distances between them grew (P,0.01). Microbial communitystructures, as well as microbial abundance, were both significantly correlated to precipitation and soil characteristics:texture, organic matter and water content (R2.0.60, P,0.01). We conclude that on the whole, microbial biogeography inarid and semi-arid soils in Israel is determined more by specific environmental factors than geographic distances and spatialdistribution patterns.
Citation: Pasternak Z, Al-Ashhab A, Gatica J, Gafny R, Avraham S, et al. (2013) Spatial and Temporal Biogeography of Soil Microbial Communities in Arid andSemiarid Regions. PLoS ONE 8(7): e69705. doi:10.1371/journal.pone.0069705
Editor: Purificacion Lopez-Garcıa, Universite Paris Sud, France
Received December 22, 2012; Accepted June 11, 2013; Published July 26, 2013
Copyright: � 2013 Pasternak et al. This is an open-access article distributed under the terms of the Creative Commons Attribution License, which permitsunrestricted use, distribution, and reproduction in any medium, provided the original author and source are credited.
Funding: Funding for this project was provided by the Technical Support Working Group of the U.S. CTTSO (Combating Terrorism Technical Support Office). Thefunders had no role in study design, data collection and analysis, decision to publish, or preparation of the manuscript.
Competing Interests: The authors have declared that no competing interests exist.
* E-mail: [email protected]
. These authors contributed equally to this work.
Introduction
A large number of studies have demonstrated that microbial
taxa display non-random environmental distribution. Particularly,
bacterial communities may become increasingly different as the
geographical distance between them increases [1]. Two mecha-
nisms might contribute to this distance-decay relationship: the
environmental conditions that are at play and bacteria dispersal
limitation. The first mechanism may sort bacterial communities in
accordance to their niche adaptations, which reflect specific
environmental conditions. Hence, dissimilarity among microbial
community compositions could match the disparity in environ-
mental conditions, which, in turn, may be linked to geographical
distances [2]. A wider view of this observation in the microbial
world, namely that ‘everything is everywhere, but the environment
selects’ [3], claims that spatial patterns of microbial diversity are
driven by environmental heterogeneity rather than by dispersal
limitation. Therefore, one might expect to find similar microbial
communities in similar habitats and an assortment of microbial
communities along an environmental gradient [4]. The second
mechanism assumes that if individual bacterial dispersal (migra-
tion) is limited to adjacent sites, then spatial proximity will result in
similar communities even if the sites are ecologically different.
Thus, a distance-decay relationship would emerge even if the
environmental conditions are comparable and the community
niche requirements similar across regions [5].
In the past decade, a number of studies have centered on the
biogeography of microbial species. These studies have indicated
some degree of habitat endemicity [4], [6] at scales ranging from a
few centimeters [7] to hundreds of kilometers [8], [9]. But
although many microbial species might be globally distributed,
using molecular techniques to identify microbial taxa, some
surveys have shown that the distribution of microorganisms is also
spatially limited in the same way as macroorganisms [10]. In fact,
coupled with environmental data, the distance-decay relationship
offers a mean to assess the relative importance of environmental
PLOS ONE | www.plosone.org 1 July 2013 | Volume 8 | Issue 7 | e69705
Biogeography of Arid Soil Microbial Communities
PLOS ONE | www.plosone.org 2 July 2013 | Volume 8 | Issue 7 | e69705
heterogeneity and dispersal in controlling the spatial scaling of
biodiversity. It is interesting to note that while microbial diversity
patterns have been extensively surveyed, relatively few studies
attempted to address microbial abundance patterns with respect to
spatial and temporal scales and their correlations to environmental
factors. Some studies have shown that environmental heterogene-
ity (and thus environmental selection) is the primary factor
underlying microbial spatial differentiation [10]; still others
pointed that the decline in the similarity of genetic structures of
communities could be explained by geographic distance rather
than by environmental heterogeneity, suggesting that dispersal
limitation – especially at large spatial scales – is driving
diversification [4].
Furthermore, most studies explored distance-decay relationships
in temperate regions, while dry ecosystems were seldom investi-
gated. Arid habitats are characterized by long periods of low water
availability, drastic seasonal changes in plant cover and inputs of
fresh organic matter, and large circadian temperature variation.
These environmental characteristics likely have profound impacts
on microbial communities, and this study addresses the gap in
knowledge by exploring spatial and temporal patterns of the
genetic structure of soil microbial communities in arid and semi-
arid regions. We explored naturally occurring soil microbial
communities at regional, local and diminutive scales, trying to
correlate diversity and abundance to (i) ecosystem characteristics
such as precipitation and soil features (type, organic matter
content, etc.), and (ii) geographic distances.
Materials and Methods
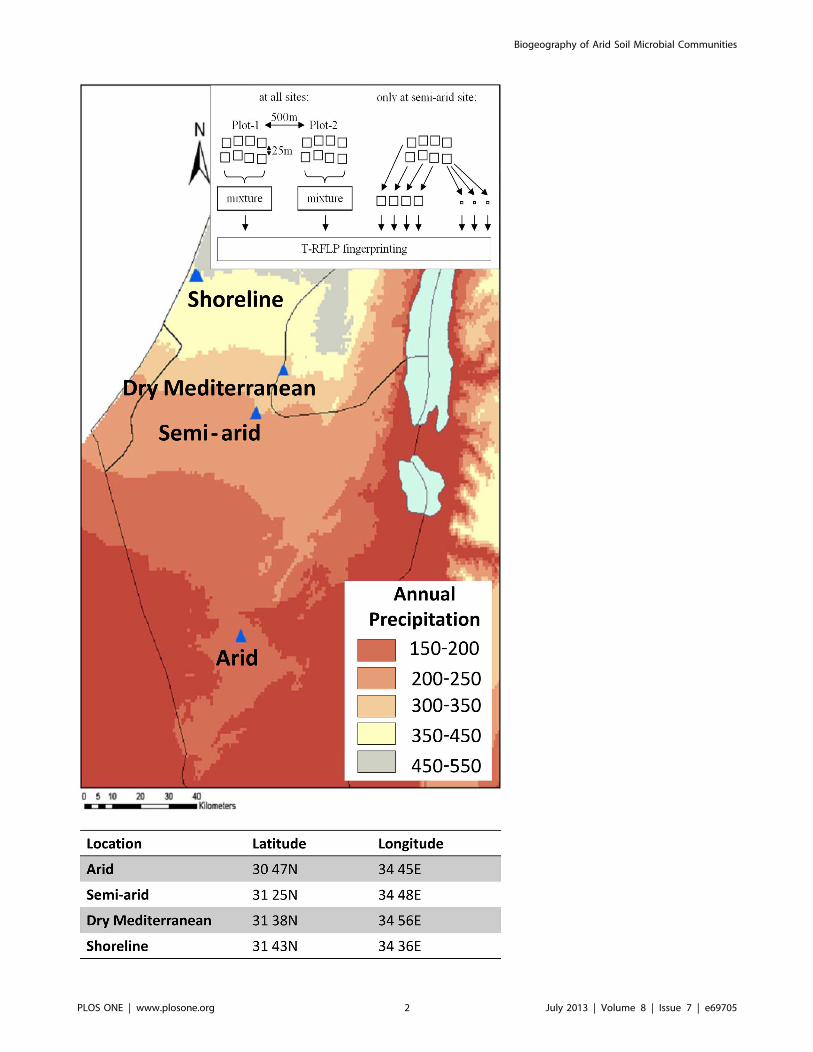
2.1. Soil samplingSix LTER (long-term ecological research; http://www.
hamaarag.org.il/he/node/9) sites were sampled: three were
similar in their soil silt content but different in their climatic
characteristics (arid, semi-arid and dry Mediterranean), and three
adjacent shoreline sites almost identical in their annual precipi-
tation but different in their soil characteristics including shifting
sand (1–10% vegetation cover), stabilized sand (30–60% vegeta-
tion cover) and alluvial red soil. The sites chosen for this study are
illustrated in Fig. 1: dry Mediterranean (Adulam, 31 38N, 34 56E),
450 mm rain/year; shoreline (Nizzanim, 31 43N, 34 36E), 350
mm rain/year; semi-arid (Lehavim, 31 25N, 34 48E), 300 mm
rain/year; and arid (Ovdat, 30 47N, 34 45E), 80 mm rain/year.
No specific permits were required for the described field studies;
the site locations are not privately-owned or protected, and the
field studies did not involve endangered or protected species. Soil
samples were taken from undisturbed, barren patches in plots that
were fenced so that no livestock grazing or human activity
occurred for at least five years prior to sampling. At each of the
sites (except the alluvial shoreline site) two replica plots were
chosen, ca. 500 m apart. Sampling took place during winter
(March) and summer (August) of 2009. Therefore, 2 seasons 65
sites 62 plots = 20 soil samples were taken, to which seasonal
samples from a single plot of red alluvial seasonal soil were added,
for a total of 22 samples. Each sample was an amalgam of eight
200 g sampling points that were randomly selected using a
spatially stratified, random sampling grid. To compare microbial
community structure at a local-scale, in addition to the samples
separated by 500 m, the semi-arid site was further studied by
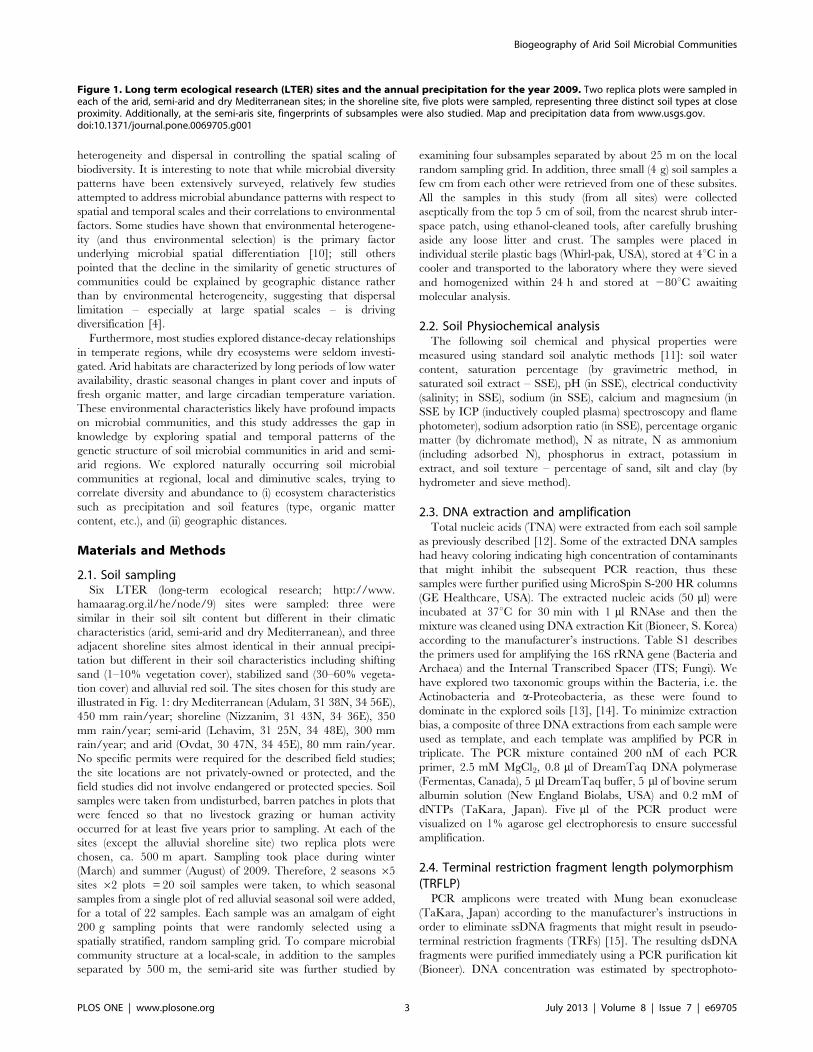
examining four subsamples separated by about 25 m on the local
random sampling grid. In addition, three small (4 g) soil samples a
few cm from each other were retrieved from one of these subsites.
All the samples in this study (from all sites) were collected
aseptically from the top 5 cm of soil, from the nearest shrub inter-
space patch, using ethanol-cleaned tools, after carefully brushing
aside any loose litter and crust. The samples were placed in
individual sterile plastic bags (Whirl-pak, USA), stored at 4uC in a
cooler and transported to the laboratory where they were sieved
and homogenized within 24 h and stored at 280uC awaiting
molecular analysis.
2.2. Soil Physiochemical analysisThe following soil chemical and physical properties were
measured using standard soil analytic methods [11]: soil water
content, saturation percentage (by gravimetric method, in
saturated soil extract – SSE), pH (in SSE), electrical conductivity
(salinity; in SSE), sodium (in SSE), calcium and magnesium (in
SSE by ICP (inductively coupled plasma) spectroscopy and flame
photometer), sodium adsorption ratio (in SSE), percentage organic
matter (by dichromate method), N as nitrate, N as ammonium
(including adsorbed N), phosphorus in extract, potassium in
extract, and soil texture – percentage of sand, silt and clay (by
hydrometer and sieve method).
2.3. DNA extraction and amplificationTotal nucleic acids (TNA) were extracted from each soil sample
as previously described [12]. Some of the extracted DNA samples
had heavy coloring indicating high concentration of contaminants
that might inhibit the subsequent PCR reaction, thus these
samples were further purified using MicroSpin S-200 HR columns
(GE Healthcare, USA). The extracted nucleic acids (50 ml) wereincubated at 37uC for 30 min with 1 ml RNAse and then the
mixture was cleaned using DNA extraction Kit (Bioneer, S. Korea)
according to the manufacturer’s instructions. Table S1 describes
the primers used for amplifying the 16S rRNA gene (Bacteria and
Archaea) and the Internal Transcribed Spacer (ITS; Fungi). We
have explored two taxonomic groups within the Bacteria, i.e. the
Actinobacteria and a-Proteobacteria, as these were found to
dominate in the explored soils [13], [14]. To minimize extraction
bias, a composite of three DNA extractions from each sample were
used as template, and each template was amplified by PCR in
triplicate. The PCR mixture contained 200 nM of each PCR
primer, 2.5 mM MgCl2, 0.8 ml of DreamTaq DNA polymerase
(Fermentas, Canada), 5 ml DreamTaq buffer, 5 ml of bovine serumalbumin solution (New England Biolabs, USA) and 0.2 mM of
dNTPs (TaKara, Japan). Five ml of the PCR product were
visualized on 1% agarose gel electrophoresis to ensure successful
amplification.
2.4. Terminal restriction fragment length polymorphism(TRFLP)PCR amplicons were treated with Mung bean exonuclease
(TaKara, Japan) according to the manufacturer’s instructions in
order to eliminate ssDNA fragments that might result in pseudo-
terminal restriction fragments (TRFs) [15]. The resulting dsDNA
fragments were purified immediately using a PCR purification kit
(Bioneer). DNA concentration was estimated by spectrophoto-
Figure 1. Long term ecological research (LTER) sites and the annual precipitation for the year 2009. Two replica plots were sampled ineach of the arid, semi-arid and dry Mediterranean sites; in the shoreline site, five plots were sampled, representing three distinct soil types at closeproximity. Additionally, at the semi-aris site, fingerprints of subsamples were also studied. Map and precipitation data from www.usgs.gov.doi:10.1371/journal.pone.0069705.g001
Biogeography of Arid Soil Microbial Communities
PLOS ONE | www.plosone.org 3 July 2013 | Volume 8 | Issue 7 | e69705
metric analysis (NanoDrop, USA) and DNA was visualized on an
agarose gel. Three different restriction enzymes (REs) per
taxonomic group were used in order to increase the reliability
of the TRFs’ emerging patterns [16]. The REs were chosen using
MiCA [17] and our in-silico restriction module, based on www.
restrictionmapper.org: Bacteria – HhaI, TaqI, HpyCH4IV; Ar-
chaea – MseI, MspI, AciI; Fungi – MnlI, MseI, AciI; Actinobacteria
– HhaI, HapII, AciI; a-Proteobacteria – HhaI, HapII, HaeIII (all
REs were purchased from Fermentas except HpyCH4IV which
was purchased from NEB). Enzymatic digestion was performed
according to the specification of the manufacturers and was
followed by purification using SigmaPrepTM spin column (Sigma,
USA). The TRFs were visualized with ABI PrismH 3100 genetic
analyzer (Applied Biosystems, USA). The peaks (TRFs) in each
profile were related to specific fragment lengths based on a size
marker (Liz500; Applied Biosystems) and visualized using Peak
Scanner V.1.0 (Applied Biosystems). TRFs with base pair size
below 40 and above 600 were truncated. ‘Noise’ peaks were
filtered according to [18] and the true TRFs were aligned to the
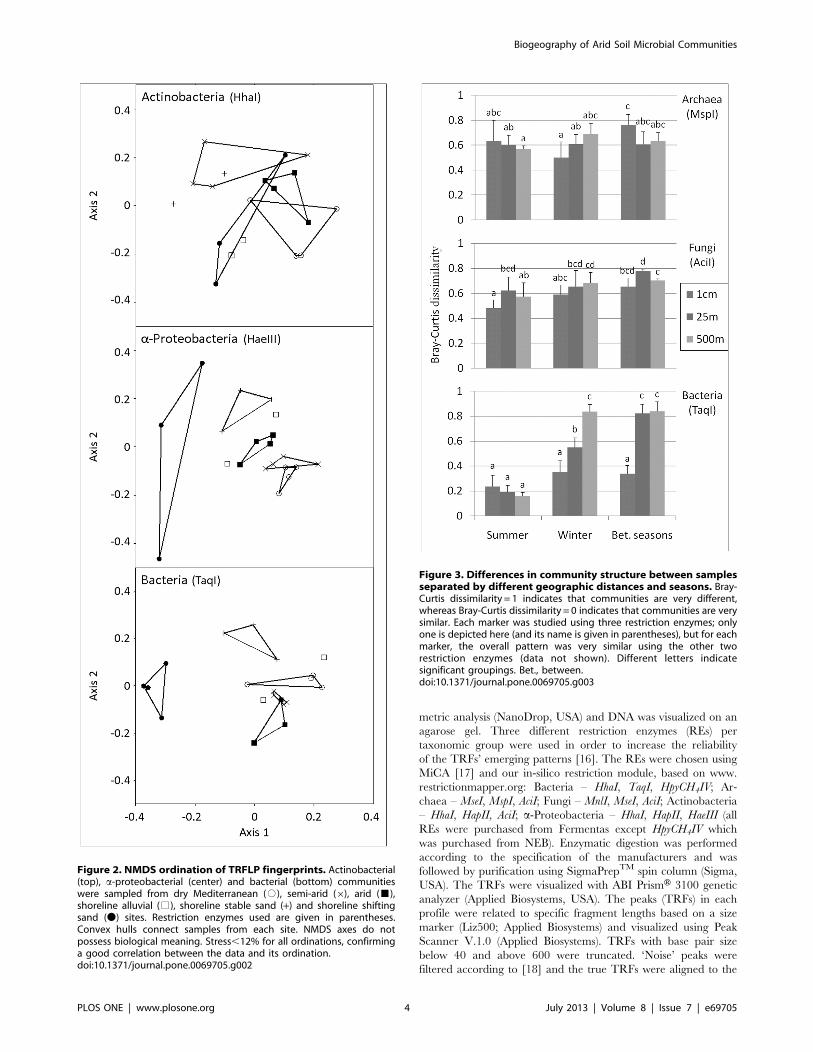
Figure 2. NMDS ordination of TRFLP fingerprints. Actinobacterial(top), a-proteobacterial (center) and bacterial (bottom) communitieswere sampled from dry Mediterranean (#), semi-arid (6), arid (&),shoreline alluvial (%), shoreline stable sand (+) and shoreline shiftingsand (N) sites. Restriction enzymes used are given in parentheses.Convex hulls connect samples from each site. NMDS axes do notpossess biological meaning. Stress,12% for all ordinations, confirminga good correlation between the data and its ordination.doi:10.1371/journal.pone.0069705.g002
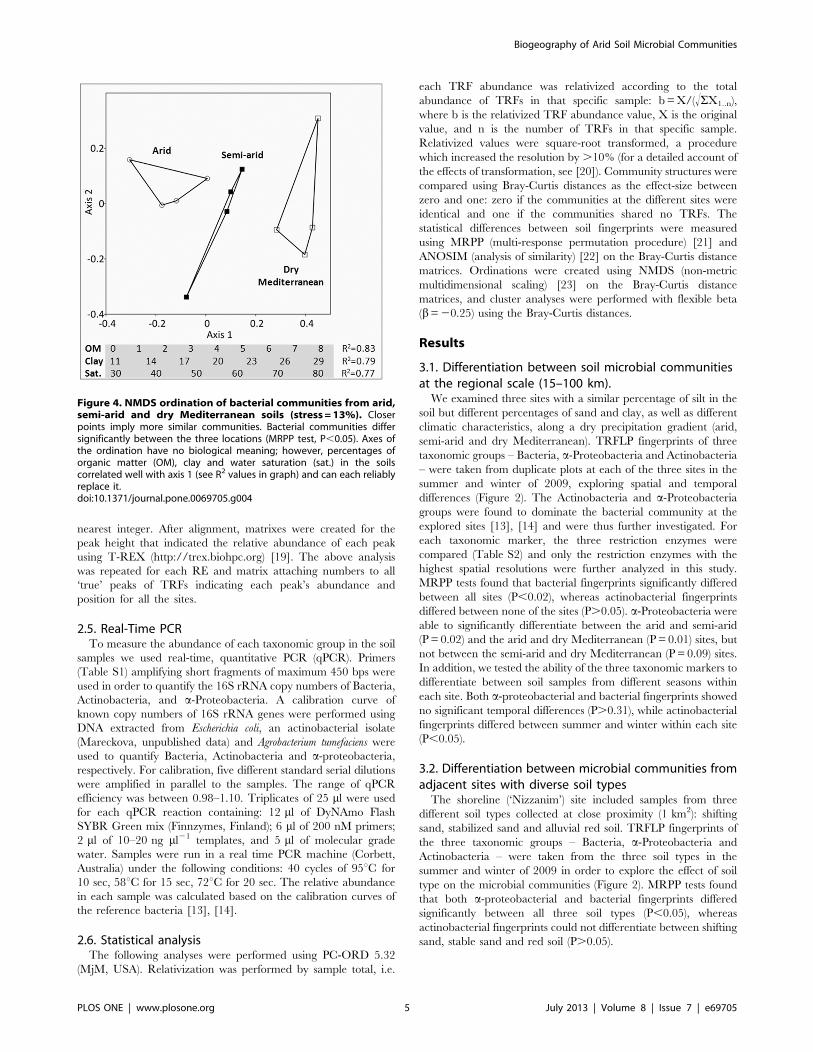
Figure 3. Differences in community structure between samplesseparated by different geographic distances and seasons. Bray-Curtis dissimilarity = 1 indicates that communities are very different,whereas Bray-Curtis dissimilarity = 0 indicates that communities are verysimilar. Each marker was studied using three restriction enzymes; onlyone is depicted here (and its name is given in parentheses), but for eachmarker, the overall pattern was very similar using the other tworestriction enzymes (data not shown). Different letters indicatesignificant groupings. Bet., between.doi:10.1371/journal.pone.0069705.g003
Biogeography of Arid Soil Microbial Communities
PLOS ONE | www.plosone.org 4 July 2013 | Volume 8 | Issue 7 | e69705
nearest integer. After alignment, matrixes were created for the
peak height that indicated the relative abundance of each peak
using T-REX (http://trex.biohpc.org) [19]. The above analysis
was repeated for each RE and matrix attaching numbers to all
‘true’ peaks of TRFs indicating each peak’s abundance and
position for all the sites.
2.5. Real-Time PCRTo measure the abundance of each taxonomic group in the soil
samples we used real-time, quantitative PCR (qPCR). Primers
(Table S1) amplifying short fragments of maximum 450 bps were
used in order to quantify the 16S rRNA copy numbers of Bacteria,
Actinobacteria, and a-Proteobacteria. A calibration curve of
known copy numbers of 16S rRNA genes were performed using
DNA extracted from Escherichia coli, an actinobacterial isolate
(Mareckova, unpublished data) and Agrobacterium tumefaciens were
used to quantify Bacteria, Actinobacteria and a-proteobacteria,respectively. For calibration, five different standard serial dilutions
were amplified in parallel to the samples. The range of qPCR
efficiency was between 0.98–1.10. Triplicates of 25 ml were used
for each qPCR reaction containing: 12 ml of DyNAmo Flash
SYBR Green mix (Finnzymes, Finland); 6 ml of 200 nM primers;
2 ml of 10–20 ng ml21 templates, and 5 ml of molecular grade
water. Samples were run in a real time PCR machine (Corbett,
Australia) under the following conditions: 40 cycles of 95uC for
10 sec, 58uC for 15 sec, 72uC for 20 sec. The relative abundance
in each sample was calculated based on the calibration curves of
the reference bacteria [13], [14].
2.6. Statistical analysisThe following analyses were performed using PC-ORD 5.32
(MjM, USA). Relativization was performed by sample total, i.e.
each TRF abundance was relativized according to the total
abundance of TRFs in that specific sample: b=X/(!SX1..n),
where b is the relativized TRF abundance value, X is the original
value, and n is the number of TRFs in that specific sample.
Relativized values were square-root transformed, a procedure
which increased the resolution by .10% (for a detailed account of
the effects of transformation, see [20]). Community structures were
compared using Bray-Curtis distances as the effect-size between
zero and one: zero if the communities at the different sites were
identical and one if the communities shared no TRFs. The
statistical differences between soil fingerprints were measured
using MRPP (multi-response permutation procedure) [21] and
ANOSIM (analysis of similarity) [22] on the Bray-Curtis distance
matrices. Ordinations were created using NMDS (non-metric
multidimensional scaling) [23] on the Bray-Curtis distance
matrices, and cluster analyses were performed with flexible beta
(b=20.25) using the Bray-Curtis distances.
Results
3.1. Differentiation between soil microbial communitiesat the regional scale (15–100 km).We examined three sites with a similar percentage of silt in the
soil but different percentages of sand and clay, as well as different
climatic characteristics, along a dry precipitation gradient (arid,
semi-arid and dry Mediterranean). TRFLP fingerprints of three
taxonomic groups – Bacteria, a-Proteobacteria and Actinobacteria
– were taken from duplicate plots at each of the three sites in the
summer and winter of 2009, exploring spatial and temporal
differences (Figure 2). The Actinobacteria and a-Proteobacteriagroups were found to dominate the bacterial community at the
explored sites [13], [14] and were thus further investigated. For
each taxonomic marker, the three restriction enzymes were
compared (Table S2) and only the restriction enzymes with the
highest spatial resolutions were further analyzed in this study.
MRPP tests found that bacterial fingerprints significantly differed
between all sites (P,0.02), whereas actinobacterial fingerprints
differed between none of the sites (P.0.05). a-Proteobacteria wereable to significantly differentiate between the arid and semi-arid
(P= 0.02) and the arid and dry Mediterranean (P= 0.01) sites, but
not between the semi-arid and dry Mediterranean (P= 0.09) sites.
In addition, we tested the ability of the three taxonomic markers to
differentiate between soil samples from different seasons within
each site. Both a-proteobacterial and bacterial fingerprints showed
no significant temporal differences (P.0.31), while actinobacterial
fingerprints differed between summer and winter within each site
(P,0.05).
3.2. Differentiation between microbial communities fromadjacent sites with diverse soil typesThe shoreline (‘Nizzanim’) site included samples from three
different soil types collected at close proximity (1 km2): shifting
sand, stabilized sand and alluvial red soil. TRFLP fingerprints of
the three taxonomic groups – Bacteria, a-Proteobacteria and
Actinobacteria – were taken from the three soil types in the
summer and winter of 2009 in order to explore the effect of soil
type on the microbial communities (Figure 2). MRPP tests found
that both a-proteobacterial and bacterial fingerprints differed
significantly between all three soil types (P,0.05), whereas
actinobacterial fingerprints could not differentiate between shifting
sand, stable sand and red soil (P.0.05).
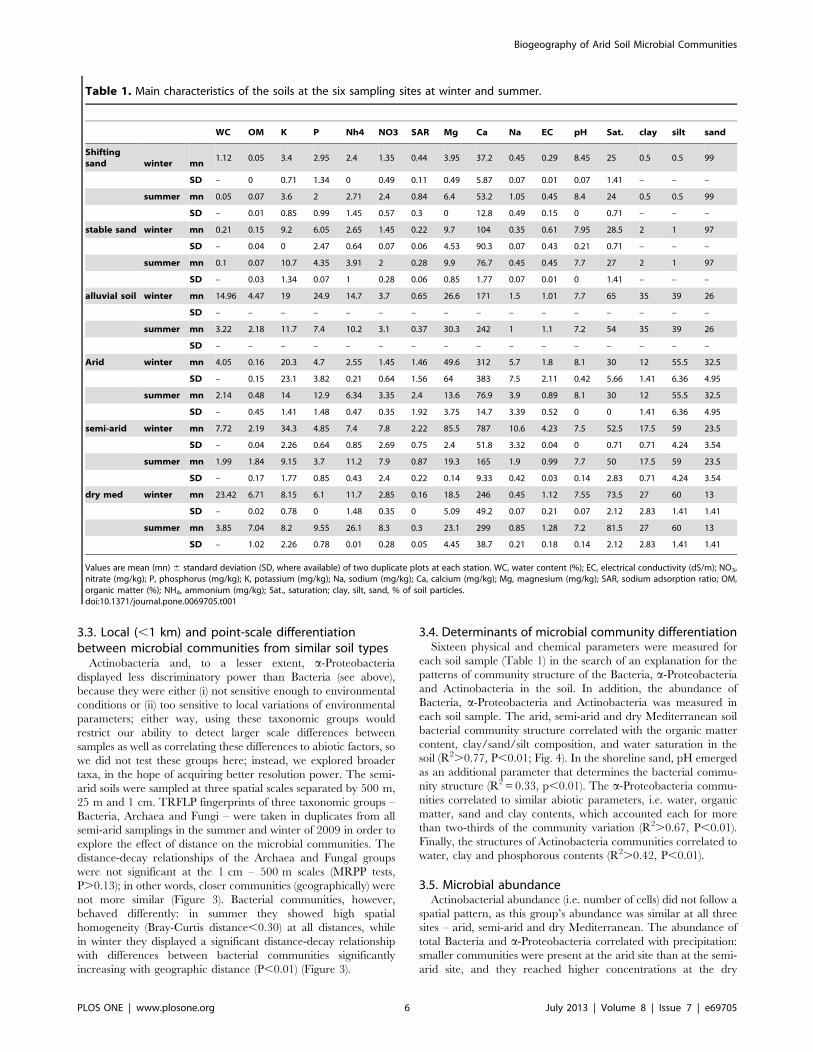
Figure 4. NMDS ordination of bacterial communities from arid,semi-arid and dry Mediterranean soils (stress =13%). Closerpoints imply more similar communities. Bacterial communities differsignificantly between the three locations (MRPP test, P,0.05). Axes ofthe ordination have no biological meaning; however, percentages oforganic matter (OM), clay and water saturation (sat.) in the soilscorrelated well with axis 1 (see R2 values in graph) and can each reliablyreplace it.doi:10.1371/journal.pone.0069705.g004
Biogeography of Arid Soil Microbial Communities
PLOS ONE | www.plosone.org 5 July 2013 | Volume 8 | Issue 7 | e69705
3.3. Local (,1 km) and point-scale differentiationbetween microbial communities from similar soil typesActinobacteria and, to a lesser extent, a-Proteobacteria
displayed less discriminatory power than Bacteria (see above),
because they were either (i) not sensitive enough to environmental
conditions or (ii) too sensitive to local variations of environmental
parameters; either way, using these taxonomic groups would
restrict our ability to detect larger scale differences between
samples as well as correlating these differences to abiotic factors, so
we did not test these groups here; instead, we explored broader
taxa, in the hope of acquiring better resolution power. The semi-
arid soils were sampled at three spatial scales separated by 500 m,
25 m and 1 cm. TRFLP fingerprints of three taxonomic groups –
Bacteria, Archaea and Fungi – were taken in duplicates from all
semi-arid samplings in the summer and winter of 2009 in order to
explore the effect of distance on the microbial communities. The
distance-decay relationships of the Archaea and Fungal groups
were not significant at the 1 cm – 500 m scales (MRPP tests,
P.0.13); in other words, closer communities (geographically) were
not more similar (Figure 3). Bacterial communities, however,
behaved differently: in summer they showed high spatial
homogeneity (Bray-Curtis distance,0.30) at all distances, while
in winter they displayed a significant distance-decay relationship
with differences between bacterial communities significantly
increasing with geographic distance (P,0.01) (Figure 3).
3.4. Determinants of microbial community differentiationSixteen physical and chemical parameters were measured for
each soil sample (Table 1) in the search of an explanation for the
patterns of community structure of the Bacteria, a-Proteobacteriaand Actinobacteria in the soil. In addition, the abundance of
Bacteria, a-Proteobacteria and Actinobacteria was measured in
each soil sample. The arid, semi-arid and dry Mediterranean soil
bacterial community structure correlated with the organic matter
content, clay/sand/silt composition, and water saturation in the
soil (R2.0.77, P,0.01; Fig. 4). In the shoreline sand, pH emerged
as an additional parameter that determines the bacterial commu-
nity structure (R2= 0.33, p,0.01). The a-Proteobacteria commu-
nities correlated to similar abiotic parameters, i.e. water, organic
matter, sand and clay contents, which accounted each for more
than two-thirds of the community variation (R2.0.67, P,0.01).
Finally, the structures of Actinobacteria communities correlated to
water, clay and phosphorous contents (R2.0.42, P,0.01).
3.5. Microbial abundanceActinobacterial abundance (i.e. number of cells) did not follow a
spatial pattern, as this group’s abundance was similar at all three
sites – arid, semi-arid and dry Mediterranean. The abundance of
total Bacteria and a-Proteobacteria correlated with precipitation:
smaller communities were present at the arid site than at the semi-
arid site, and they reached higher concentrations at the dry
Table 1. Main characteristics of the soils at the six sampling sites at winter and summer.
WC OM K P Nh4 NO3 SAR Mg Ca Na EC pH Sat. clay silt sand
Shiftingsand winter mn
1.12 0.05 3.4 2.95 2.4 1.35 0.44 3.95 37.2 0.45 0.29 8.45 25 0.5 0.5 99
SD – 0 0.71 1.34 0 0.49 0.11 0.49 5.87 0.07 0.01 0.07 1.41 – – –
summer mn 0.05 0.07 3.6 2 2.71 2.4 0.84 6.4 53.2 1.05 0.45 8.4 24 0.5 0.5 99
SD – 0.01 0.85 0.99 1.45 0.57 0.3 0 12.8 0.49 0.15 0 0.71 – – –
stable sand winter mn 0.21 0.15 9.2 6.05 2.65 1.45 0.22 9.7 104 0.35 0.61 7.95 28.5 2 1 97
SD – 0.04 0 2.47 0.64 0.07 0.06 4.53 90.3 0.07 0.43 0.21 0.71 – – –
summer mn 0.1 0.07 10.7 4.35 3.91 2 0.28 9.9 76.7 0.45 0.45 7.7 27 2 1 97
SD – 0.03 1.34 0.07 1 0.28 0.06 0.85 1.77 0.07 0.01 0 1.41 – – –
alluvial soil winter mn 14.96 4.47 19 24.9 14.7 3.7 0.65 26.6 171 1.5 1.01 7.7 65 35 39 26
SD – – – – – – – – – – – – – – – –
summer mn 3.22 2.18 11.7 7.4 10.2 3.1 0.37 30.3 242 1 1.1 7.2 54 35 39 26
SD – – – – – – – – – – – – – – – –
Arid winter mn 4.05 0.16 20.3 4.7 2.55 1.45 1.46 49.6 312 5.7 1.8 8.1 30 12 55.5 32.5
SD – 0.15 23.1 3.82 0.21 0.64 1.56 64 383 7.5 2.11 0.42 5.66 1.41 6.36 4.95
summer mn 2.14 0.48 14 12.9 6.34 3.35 2.4 13.6 76.9 3.9 0.89 8.1 30 12 55.5 32.5
SD – 0.45 1.41 1.48 0.47 0.35 1.92 3.75 14.7 3.39 0.52 0 0 1.41 6.36 4.95
semi-arid winter mn 7.72 2.19 34.3 4.85 7.4 7.8 2.22 85.5 787 10.6 4.23 7.5 52.5 17.5 59 23.5
SD – 0.04 2.26 0.64 0.85 2.69 0.75 2.4 51.8 3.32 0.04 0 0.71 0.71 4.24 3.54
summer mn 1.99 1.84 9.15 3.7 11.2 7.9 0.87 19.3 165 1.9 0.99 7.7 50 17.5 59 23.5
SD – 0.17 1.77 0.85 0.43 2.4 0.22 0.14 9.33 0.42 0.03 0.14 2.83 0.71 4.24 3.54
dry med winter mn 23.42 6.71 8.15 6.1 11.7 2.85 0.16 18.5 246 0.45 1.12 7.55 73.5 27 60 13
SD – 0.02 0.78 0 1.48 0.35 0 5.09 49.2 0.07 0.21 0.07 2.12 2.83 1.41 1.41
summer mn 3.85 7.04 8.2 9.55 26.1 8.3 0.3 23.1 299 0.85 1.28 7.2 81.5 27 60 13
SD – 1.02 2.26 0.78 0.01 0.28 0.05 4.45 38.7 0.21 0.18 0.14 2.12 2.83 1.41 1.41
Values are mean (mn) 6 standard deviation (SD, where available) of two duplicate plots at each station. WC, water content (%); EC, electrical conductivity (dS/m); NO3,nitrate (mg/kg); P, phosphorus (mg/kg); K, potassium (mg/kg); Na, sodium (mg/kg); Ca, calcium (mg/kg); Mg, magnesium (mg/kg); SAR, sodium adsorption ratio; OM,organic matter (%); NH4, ammonium (mg/kg); Sat., saturation; clay, silt, sand, % of soil particles.doi:10.1371/journal.pone.0069705.t001
Biogeography of Arid Soil Microbial Communities
PLOS ONE | www.plosone.org 6 July 2013 | Volume 8 | Issue 7 | e69705
Mediterranean site (Table S3). In addition to precipitation, the
abundance of the Bacteria and a-Proteobacteria was also
significantly and positively correlated to soil water saturation,
organic matter content and soil texture (R2.0.6, P,0.04).
Differences in bacterial abundance were not significantly corre-
lated to the geographic distance between the samples (R2 = 0.23,
P = 0.44) or to the microbial communities of soils collected from
the same site (R2 = 0.15, P= 0.19).
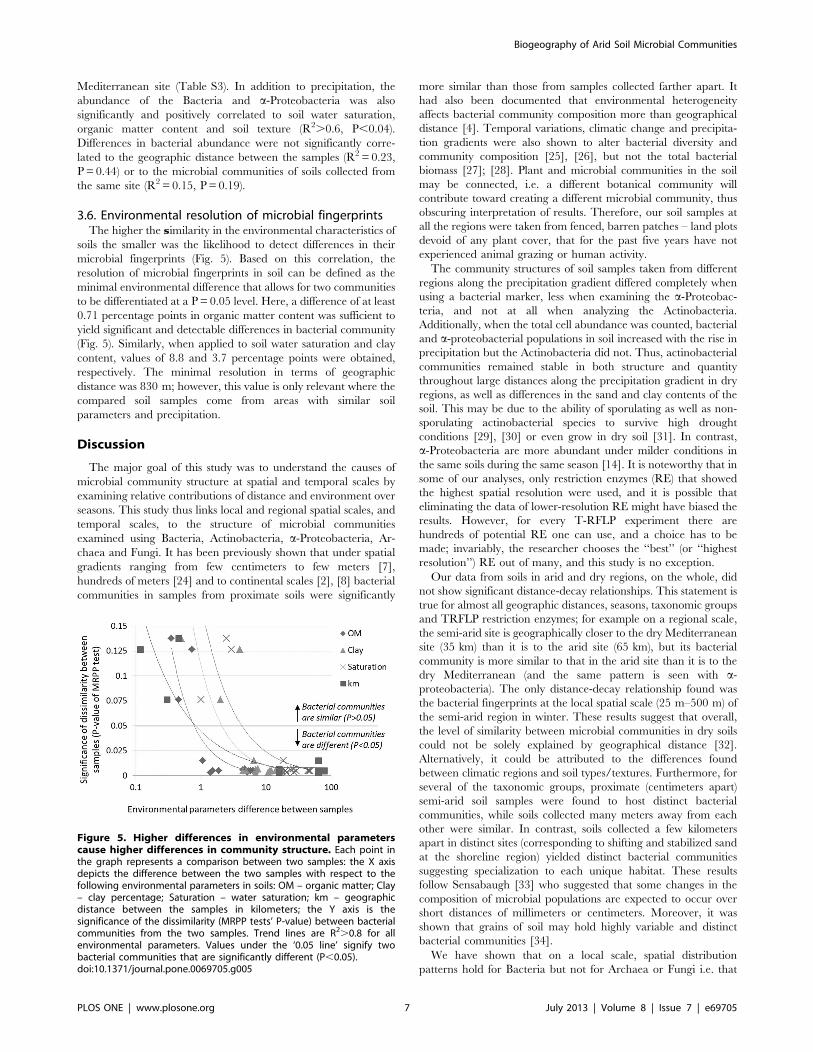
3.6. Environmental resolution of microbial fingerprintsThe higher the similarity in the environmental characteristics of
soils the smaller was the likelihood to detect differences in their
microbial fingerprints (Fig. 5). Based on this correlation, the
resolution of microbial fingerprints in soil can be defined as the
minimal environmental difference that allows for two communities
to be differentiated at a P= 0.05 level. Here, a difference of at least
0.71 percentage points in organic matter content was sufficient to
yield significant and detectable differences in bacterial community
(Fig. 5). Similarly, when applied to soil water saturation and clay
content, values of 8.8 and 3.7 percentage points were obtained,
respectively. The minimal resolution in terms of geographic
distance was 830 m; however, this value is only relevant where the
compared soil samples come from areas with similar soil
parameters and precipitation.
Discussion
The major goal of this study was to understand the causes of
microbial community structure at spatial and temporal scales by
examining relative contributions of distance and environment over
seasons. This study thus links local and regional spatial scales, and
temporal scales, to the structure of microbial communities
examined using Bacteria, Actinobacteria, a-Proteobacteria, Ar-
chaea and Fungi. It has been previously shown that under spatial
gradients ranging from few centimeters to few meters [7],
hundreds of meters [24] and to continental scales [2], [8] bacterial
communities in samples from proximate soils were significantly
more similar than those from samples collected farther apart. It
had also been documented that environmental heterogeneity
affects bacterial community composition more than geographical
distance [4]. Temporal variations, climatic change and precipita-
tion gradients were also shown to alter bacterial diversity and
community composition [25], [26], but not the total bacterial
biomass [27]; [28]. Plant and microbial communities in the soil
may be connected, i.e. a different botanical community will
contribute toward creating a different microbial community, thus
obscuring interpretation of results. Therefore, our soil samples at
all the regions were taken from fenced, barren patches – land plots
devoid of any plant cover, that for the past five years have not
experienced animal grazing or human activity.
The community structures of soil samples taken from different
regions along the precipitation gradient differed completely when
using a bacterial marker, less when examining the a-Proteobac-teria, and not at all when analyzing the Actinobacteria.
Additionally, when the total cell abundance was counted, bacterial
and a-proteobacterial populations in soil increased with the rise in
precipitation but the Actinobacteria did not. Thus, actinobacterial
communities remained stable in both structure and quantity
throughout large distances along the precipitation gradient in dry
regions, as well as differences in the sand and clay contents of the
soil. This may be due to the ability of sporulating as well as non-
sporulating actinobacterial species to survive high drought
conditions [29], [30] or even grow in dry soil [31]. In contrast,
a-Proteobacteria are more abundant under milder conditions in
the same soils during the same season [14]. It is noteworthy that in
some of our analyses, only restriction enzymes (RE) that showed
the highest spatial resolution were used, and it is possible that
eliminating the data of lower-resolution RE might have biased the
results. However, for every T-RFLP experiment there are
hundreds of potential RE one can use, and a choice has to be
made; invariably, the researcher chooses the ‘‘best’’ (or ‘‘highest
resolution’’) RE out of many, and this study is no exception.
Our data from soils in arid and dry regions, on the whole, did
not show significant distance-decay relationships. This statement is
true for almost all geographic distances, seasons, taxonomic groups
and TRFLP restriction enzymes; for example on a regional scale,
the semi-arid site is geographically closer to the dry Mediterranean
site (35 km) than it is to the arid site (65 km), but its bacterial
community is more similar to that in the arid site than it is to the
dry Mediterranean (and the same pattern is seen with a-proteobacteria). The only distance-decay relationship found was
the bacterial fingerprints at the local spatial scale (25 m–500 m) of
the semi-arid region in winter. These results suggest that overall,
the level of similarity between microbial communities in dry soils
could not be solely explained by geographical distance [32].
Alternatively, it could be attributed to the differences found
between climatic regions and soil types/textures. Furthermore, for
several of the taxonomic groups, proximate (centimeters apart)
semi-arid soil samples were found to host distinct bacterial
communities, while soils collected many meters away from each
other were similar. In contrast, soils collected a few kilometers
apart in distinct sites (corresponding to shifting and stabilized sand
at the shoreline region) yielded distinct bacterial communities
suggesting specialization to each unique habitat. These results
follow Sensabaugh [33] who suggested that some changes in the
composition of microbial populations are expected to occur over
short distances of millimeters or centimeters. Moreover, it was
shown that grains of soil may hold highly variable and distinct
bacterial communities [34].
We have shown that on a local scale, spatial distribution
patterns hold for Bacteria but not for Archaea or Fungi i.e. that
Figure 5. Higher differences in environmental parameterscause higher differences in community structure. Each point inthe graph represents a comparison between two samples: the X axisdepicts the difference between the two samples with respect to thefollowing environmental parameters in soils: OM – organic matter; Clay– clay percentage; Saturation – water saturation; km – geographicdistance between the samples in kilometers; the Y axis is thesignificance of the dissimilarity (MRPP tests’ P-value) between bacterialcommunities from the two samples. Trend lines are R2.0.8 for allenvironmental parameters. Values under the ‘0.05 line’ signify twobacterial communities that are significantly different (P,0.05).doi:10.1371/journal.pone.0069705.g005
Biogeography of Arid Soil Microbial Communities
PLOS ONE | www.plosone.org 7 July 2013 | Volume 8 | Issue 7 | e69705
distance decay relationships could not be detected for these two
groups over local spatial scales. Likewise, a previous study
conducted in fragmented forests in Panama showed weak spatial
scale dispersal in mycorrhizal Fungi [35]. We propose that
differences in soil microbial fingerprints could best be explained by
changes in environmental factors, in our case precipitation [18],
organic matter and soil texture. Marked differences in soil organic
content and soil texture resulted in statistically significant
differences between microbial communities (Fig. 4), whereas
temporal patterns had limited effect on bacterial diversity and
abundance. A study exploring the diversity of salt marsh bacteria
over centimeters to continental spatial scale found that environ-
mental factors overruled geographic distance, having crucial
effects on community similarity within the salt marshes but no
detectable effect at larger scales [2]. For instance, within marshes
moisture explained community similarity, while water temperature
and nitrate concentrations were more important at the regional
and continental scales, respectively. Our study suggests that when
soils are characterized by distinct environmental factors, each will
likely host a unique community of microorganisms, regardless of
the geographic distance between them. In arid soils, these factors
are moisture, organic matter, and silt/clay content. An emerging
picture combining ours and others’ results is that the main drivers
shaping the soil microbiota may change according to the climatic
regions and the scale of the analysis [2], [32], [36], requiring
sampling at local scales to uncover them.
Supporting Information
Table S1 PCR primers and procedures used in thisstudy.
(DOCX)
Table S2 Comparison of three restriction enzymes (RE)for TRFLP analysis using each of the five microbialmarkers. For each RE, the power to differentiate between sites
was analyzed as the A-statistic of the MRPP test. For each marker,
the best RE (i.e. highest A) was set as 100%, and the differentiation
power of the other two RE was calculated as percentage of the best
RE (called A%). Asterisk denotes significant differentiation
between sites (MRPP test, P,0.05).
(DOCX)
Table S3 Abundance of a-proteobacterial, actinobacter-ial and bacterial 16S rRNA. Values are mean and standard
deviation (SD) of two qPCR measurements in each season.
(DOCX)
Author Contributions
Conceived and designed the experiments: OG EJ DM RG AA JG.
Performed the experiments: AA JG SA. Analyzed the data: ZP AA JG.
Contributed reagents/materials/analysis tools: RG. Wrote the paper: ZP
AA JG RG SA DM OG EJ.
References
1. Nekola JC, White PS (1999) The distance decay of similarity in biogeography
and ecology. J Biogeog 26: 867–878.
2. Martiny JBH, Eisen JA, Penn K, Allison SD, Horner-Devine MC (2011) Drivers
of bacterial beta-diversity depend on spatial scale. Proc Nat Acad Sci USA 108:
7850–7854.
3. Baas-Becking LGM (1934) Geobiologie of inleiding tot de milieukunde. WP Van
Stockum & Zoon, The Hague, the Netherlands.
4. Green J, Bohannan BJM (2006) Spatial scaling of microbial biodiversity. Trends
Ecol Evol 21: 501–507.
5. Bell T (2010) Experimental tests of the bacterial distance-decay relationship.
Isme J 4: 1357–1365.
6. Martiny JBH, Bohannan BJM, Brown JH, Colwell RK, Fuhrman JA, et al.
(2006) Microbial biogeography: putting microorganisms on the map. Nature
Rev Microbiol 4: 102–112.
7. Franklin RB, Mills AL (2003) Multi-scale variation in spatial heterogeneity for
microbial community structure in an eastern Virginia agricultural field. Fems
Microbiol Ecol 44: 335–346.
8. Cho JC, Tiedje JM (2000) Biogeography and degree of endemicity of fluorescent
Pseudomonas strains in soil. Appl Environ Microbiol 66: 5448–5456.
9. Griffiths RI, Thomson BC, James P, Bell T, Bailey M, et al. (2011) The bacterial
biogeography of British soils. Environ Microbiol 13: 1642–1654.
10. Nemergut DR, Costello EK, Hamady M, Lozupone C, Jiang L, et al. (2011)
Global patterns in the biogeography of bacterial taxa. Environ Microbiol 13:
135–144.
11. Page AL, Miller RH, Keeney DR (1982) Methods of soil analysis, Part 2:
chemical and microbiological properties. American Society of Agronomy,
Madison, WI
12. Angel R, Matthies D, Conrad R (2011) Activation of methanogenesis in arid
biological soil crusts despite the presence of oxygen. Plos One 6.
13. Bachar A, Al-Ashhab A, Soares M, Sklarz M, Angel R, et al. (2010) Soil
microbial abundance and diversity along a low precipitation gradient. Microb
Ecol 60: 453–461.
14. Bachar A, Soares MIM, Gillor O (2012) The effect of resource islands on
abundance and diversity of bacteria in arid soils. Microb Ecol 63(3): 694–700.
15. Egert M, Friedrich MW (2003) Formation of pseudo-terminal restriction
fragments, a PCR-related bias affecting terminal restriction fragment length
polymorphism analysis of microbial community structure. Appl Environ
Microbiol 69: 2555–2562.
16. Moyer CL, Dobbs FC, Karl DM (1994) Estimation of diversity and community
structure through restriction fragment length polymorphism distribution analysis
of bacterial 16S rRNA genes from a microbial mat at an active, hydrothermal
vent system, Loihi Seamount, Hawaii. Appl Environ Microbiol 60: 871–879.
17. Shyu C, Soule T, Bent SJ, Foster JA, Forney LJ (2007) MiCA: a web-based tool
for the analysis of microbial communities based on terminal-restriction fragment
length polymorphisms of 16S and 18S rRNA genes. Microb Ecol 53: 562–570.
18. Angel R, Soares MIM, Ungar ED, Gillor O (2010) Biogeography of soil archaea
and bacteria along a steep precipitation gradient. Isme J 4: 553–563.
19. Culman SW, Bukowski R, Gauch HG, Cadillo-Quiroz H, Buckley DH (2009)
T-REX: software for the processing and analysis of T-RFLP data. Bmc
Bioinformatics 10.
20. Pasternak Z, Al-Ashhab A, Gatica J, Gafni R, Avraham S, et al. (2012)
Optimization of molecular methods and statistical procedures for forensic
fingerprinting of microbial soil communities. Int Res J Microbiol 3(11): 363–372.
21. Mielke P (1984) Meteorological applications of permutation techniques based on
distance functions. Elsevier Science Publishers, 813–830.
22. Clarke KR, Green RH (1988) Statistical design and analysis for a biological
effects study. Mar Ecol Prog Ser 46: 213–226.
23. Mather PM (1976) Computational methods of multivariate analysis in physical
geography. John Wiley and Sons, Inc, London.
24. Horner-Devine MC, Lage M, Hughes JB, Bohannan BJM (2004) A taxa-area
relationship for bacteria. Nature 432: 750–753.
25. Frey SD, Drijber R, Smith H, Melillo J (2008) Microbial biomass, functional
capacity, and community structure after 12 years of soil warming. Soil Biol
Biochem 40: 2904–2907.
26. Moore-Kucera J, Dick RP (2008) PLFA profiling of microbial community
structure and seasonal shifts in soils of a Douglas-fir chronosequence. Microb
Ecol 55: 500–511.
27. Bell CW, Acosta-Martinez V, McIntyre NE, Cox S, Tissue DT, et al. (2009)
Linking microbial community structure and function to seasonal differences in
soil moisture and temperature in a chihuahuan desert grassland. Microb Ecol
58: 827–842.
28. Clark J, Campbell J, Grizzle H, Acosta-Martinez V, Zak J (2009) Soil microbial
community response to drought and precipitation variability in the chihuahuan
desert. Microb Ecol 57: 248–260.
29. Goodfellow M, Williams ST (1983) Ecology of actinomycetes. Ann Rev
Microbiol 37: 189–216.
30. LeBlanc JC, Goncalves ER, Mohn WW (2008) Global response to desiccation
stress in the soil actinomycete Rhodococcus jostii RHA1. Appl Environ Microbiol
74: 2627–2636.
31. Williams ST, Shameemullah M, Watson ET, Mayfield CI (1972) Studies on the
ecology of actinomycetes in soil – VI: The influence of moisture tension on
growth and survival. Soil Biol Biochem 4(2): 215–225.
32. Fierer N, Jackson RB (2006) The diversity and biogeography of soil bacterial
communities. Proc Nat Acad Sci USA 103: 626–631.
33. Sensabaugh G (2009) Microbial community profiling for the characterization of
soil evidence: forensic considerations, In: al Re (Ed), Criminal and environ-
mental soil forensics. Springer Science and Business Media, USA, 49–60.
34. Vetsigian K, Jajoo R, Kishony R (2011) Structure and evolution of streptomyces
interaction networks in soil and in silico. PLoS Biol 9.
Biogeography of Arid Soil Microbial Communities
PLOS ONE | www.plosone.org 8 July 2013 | Volume 8 | Issue 7 | e69705
35. Mangan SA, Eom AH, Adler GH, Yavitt JB, Herre EA (2004) Diversity of
arbuscular mycorrhizal fungi across a fragmented forest in Panama: insularspore communities differ from mainland communities. Oecologia 141: 687–700.
36. Lauber CL, Hamady M, Knight R Fierer N (2009) Pyrosequencing-based
assessment of soil pH as a predictor of soil bacterial community structure at thecontinental scale. Appl Environ Microbiol 75: 5111–5120.
Biogeography of Arid Soil Microbial Communities
PLOS ONE | www.plosone.org 9 July 2013 | Volume 8 | Issue 7 | e69705