
Affinity-based reversed micellar protein extraction: II. Effect of cosurfactant tail length
Upload
khangminh22Category
view
0download
0
International Journal of
Geo-Information
Article
Improved Biogeography-Based OptimizationBased on Affinity Propagation
Zhihao Wang 1,2, Peiyu Liu 1,2,*, Min Ren 1,2,3, Yuzhen Yang 4 and Xiaoyan Tian 5
1 School of Information Science and Engineering, Shandong Normal University, Jinan 250014, China;[email protected] (Z.W.); [email protected] (M.R.)
2 Shandong Provincial Key Laboratory for Distributed Computer Software Novel Technology,Jinan 250014, China
3 School of Mathematic and Quantitative Economics, Shandong University of Finance and Economics,Jinan 250010, China
4 School of computer and Information Engineering, Heze University, Heze 274015, China; [email protected] Shandong Police College, Jinan 250014, China; [email protected]* Correspondence: [email protected]; Tel.: +86-131-8889-9297
Academic Editors: Duccio Rocchini and Wolfgang KainzReceived: 26 May 2016; Accepted: 11 July 2016; Published: 23 July 2016
Abstract: To improve the search ability of biogeography-based optimization (BBO), this workproposed an improved biogeography-based optimization based on Affinity Propagation.We introduced the Memetic framework to the BBO algorithm, and used the simulated annealingalgorithm as the local search strategy. MBBO enhanced the exploration with the Affinity Propagationstrategy to improve the transfer operation of the BBO algorithm. In this work, the MBBO algorithmwas applied to IEEE Congress on Evolutionary Computation (CEC) 2015 benchmarks optimizationproblems to conduct analytic comparison with the first three winners of the CEC 2015 competition.The results show that the MBBO algorithm enhances the exploration, exploitation, convergencespeed and solution accuracy and can emerge as the best solution-providing algorithm amongthe competing algorithms.
Keywords: biogeography-based optimization; affinity propagation; memetic
1. Introduction
As an important branch in artificial intelligence, Evolutionary Algorithms (EAs) are derived fromthe simulation of complex biological systems in nature with the ability to cognize things of humansbased on their interaction with nature. The biogeography-based optimization (BBO) algorithm isa new intelligent optimization algorithm that was proposed by Simon who was enlightened bybiogeography theory [1] in 2008 based on the research of a mathematics model for biological speciesmigration [2]. BBO has been widely studied, and good research achievements in theoretical analysis,improvement, and application have been achieved.
Some variations of BBO have recently been developed to improve the performance of basicBBO [3–7]. However, in these improved BBOs, the migration operation judges only the method of theimmigration operation in terms of the immigration and emigration rates in different habitats withoutconsidering the interactional relationship among habitats. Therefore, there is still an insufficiency inthese improved BBOs regarding the migration operator, which is good for exploitation but poor forexploration. Currently, we need changes that are more important than a simple hybrid.
This work proposes an improved BBO algorithm with Affinity Propagation (AP) [8] based onthe Memetic framework [9–12] (MBBO). This algorithm improves the migration operation of the basicBBO algorithm by using the AP strategy to promote exploration. Further, the MBBO algorithm uses
ISPRS Int. J. Geo-Inf. 2016, 5, 129; doi:10.3390/ijgi5080129 www.mdpi.com/journal/ijgi

ISPRS Int. J. Geo-Inf. 2016, 5, 129 2 of 14
simulated annealing (SA) [13] as a local search strategy to promote exploitation and strengthen theability to get out of the local optimum. This work also tests the MBBO algorithm and the threefirst winners of the CEC 2015 competition [14–16] in the CEC 2015 benchmarks and compares theiroperation results. After the modification of BBO, the Wilcoxon signed-rank test is used to demonstratethe differences between different implementations of the MBBO and the other three algorithms of theCEC 2015 competition, based on which it can be found that MBBO proposed in this work performssignificantly better than do the three algorithms.
To summarize, our contributions are as follows:
• This work proposed an improved BBO algorithm using the AP strategy to modify the migrationoperation to promote exploration and
• proposed a MBBO algorithm using the Memetic framework and SA as the local search strategy topromote exploitation.
2. Improved BBO with Affinity Propagation based on Memetic Framework
2.1. BBO
In an ecosystem, the habitat suitability index (HSI) [17] can be used to describe the fitting degreeof a habitat for species living in it [18]. HSI can be expressed with suitability index variables (SIV),which describe the characteristics of HSI, such as precipitation, humidity, and vegetation diversityin a habitat. A habitat with high HSI has more species living in it, whereas a habitat with low HSIhas fewer species. In other words, HSI is directly proportional to the diversity of species. The largestpossible number of species that a habitat can support is Smax; the immigration of species is λ, witha maximum of I; and the emigration rate is µ, with a maximum of E, with E = I, as shown in Figure 1.
S1 S0 S2
I=E
emigration µ
immigration λ
Smax
rate
number of species
Figure 1. The relationship of fitness of habitats (species count), immigration rate λ and emigration rate µ. S1 isa relatively poor solution, whereas S2 is a relatively good solution.
When the number of species in this habitat is 0, the immigration rate at this time is obviouslythe maximum I. With the immigration of species, the number of species in the habitat increases;further, the immigration rate decreases when the emigration rate increases. When the number ofspecies reaches the upper limit Smax, the habitat achieves the saturation state; thus, the immigrationrate decreases to 0, and the emigration rate reaches the maximum E. In Figure 1, S1 < S2 andHSI at S1 is smaller than that at S2. Obviously, when the number of species in the habitat is S1,
ISPRS Int. J. Geo-Inf. 2016, 5, 129 3 of 14
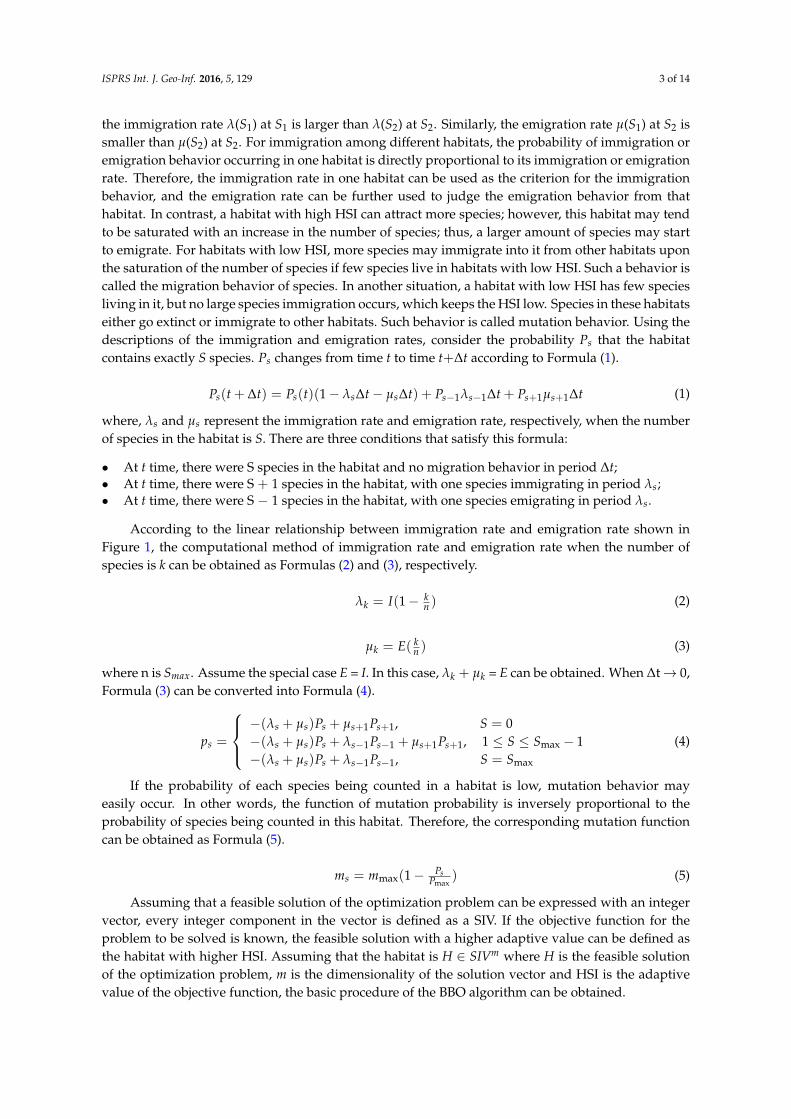
the immigration rate λ(S1) at S1 is larger than λ(S2) at S2. Similarly, the emigration rate µ(S1) at S2 issmaller than µ(S2) at S2. For immigration among different habitats, the probability of immigration oremigration behavior occurring in one habitat is directly proportional to its immigration or emigrationrate. Therefore, the immigration rate in one habitat can be used as the criterion for the immigrationbehavior, and the emigration rate can be further used to judge the emigration behavior from thathabitat. In contrast, a habitat with high HSI can attract more species; however, this habitat may tendto be saturated with an increase in the number of species; thus, a larger amount of species may startto emigrate. For habitats with low HSI, more species may immigrate into it from other habitats uponthe saturation of the number of species if few species live in habitats with low HSI. Such a behavior iscalled the migration behavior of species. In another situation, a habitat with low HSI has few speciesliving in it, but no large species immigration occurs, which keeps the HSI low. Species in these habitatseither go extinct or immigrate to other habitats. Such behavior is called mutation behavior. Using thedescriptions of the immigration and emigration rates, consider the probability Ps that the habitatcontains exactly S species. Ps changes from time t to time t+∆t according to Formula (1).
Ps(t + ∆t) = Ps(t)(1− λs∆t− µs∆t) + Ps−1λs−1∆t + Ps+1µs+1∆t (1)
where, λs and µs represent the immigration rate and emigration rate, respectively, when the numberof species in the habitat is S. There are three conditions that satisfy this formula:
• At t time, there were S species in the habitat and no migration behavior in period ∆t;• At t time, there were S + 1 species in the habitat, with one species immigrating in period λs;• At t time, there were S − 1 species in the habitat, with one species emigrating in period λs.
According to the linear relationship between immigration rate and emigration rate shown inFigure 1, the computational method of immigration rate and emigration rate when the number ofspecies is k can be obtained as Formulas (2) and (3), respectively.
λk = I(1− kn ) (2)
µk = E( kn ) (3)
where n is Smax. Assume the special case E = I. In this case, λk + µk = E can be obtained. When ∆t→ 0,Formula (3) can be converted into Formula (4).
ps =
−(λs + µs)Ps + µs+1Ps+1, S = 0−(λs + µs)Ps + λs−1Ps−1 + µs+1Ps+1, 1 ≤ S ≤ Smax − 1−(λs + µs)Ps + λs−1Ps−1, S = Smax
(4)
If the probability of each species being counted in a habitat is low, mutation behavior mayeasily occur. In other words, the function of mutation probability is inversely proportional to theprobability of species being counted in this habitat. Therefore, the corresponding mutation functioncan be obtained as Formula (5).
ms = mmax(1− PsPmax
) (5)
Assuming that a feasible solution of the optimization problem can be expressed with an integervector, every integer component in the vector is defined as a SIV. If the objective function for theproblem to be solved is known, the feasible solution with a higher adaptive value can be defined asthe habitat with higher HSI. Assuming that the habitat is H ∈ SIVm where H is the feasible solutionof the optimization problem, m is the dimensionality of the solution vector and HSI is the adaptivevalue of the objective function, the basic procedure of the BBO algorithm can be obtained.

ISPRS Int. J. Geo-Inf. 2016, 5, 129 4 of 14
2.2. BBO with Affinity Propagation
Affinity propagation (AP) is a clustering strategy proposed by Frey and Dueck [8]. The basic ideaof this strategy is to calculate the cluster center of all samples, which are treated as nodes in a network,via information transfer in all lines of the network. During the clustering, two types of informationare transferred among nodes: attractiveness and availability. The clustering result is dependent onthe similarity and information transfer among samples. This feature makes the strategy suitable as anauxiliary means for information transfer among habitats in the BBO algorithm. Among all habitats,a habitat with a high immigration rate can attract species from a habitat with a high emigration rate.Definitions related to AP applied to the BBO algorithm are as follows.
Definition 1. Migration matrix of habitat. Assuming that the habitat count is n, the similaritys(Hi, Hj) between any two habitats (the similarity can be either symmetric or asymmetric) can becalculated to represent the probability of habitat Hj attracting species emigrating from habitat Hi andimmigrating into habitat Hj. The similarity matrix sn×n, which is composed of similarities betweentwo habitats, is called the migration matrix of the habitat. s(Hi, Hj) is calculated as Formula (6).
s(
Hi, Hj)= −
∥∥∥SIVmi − SIVm
j
∥∥∥ (6)
Definition 2. Habitat immigration reference (HIR). Similarity s(Hk, Hk) shows whether habitat Hkis more likely to be immigrating which is denoted by HIR(k) (k = 1, 2,. . . , n). The value of HIR(k)can affect the ratio between the number of habitats to be immigrated into and that of habitats to beemigrated from. This ratio can determine whether the migration operation of the MBBO algorithmcan effectively search the global optimum of the optimization problem.
The definition regarding HIR in [8] shows that the number of habitats to be immigrated into isdirectly proportional to HIR(k). According to Formula (1), HIR(k) is proportional to the immigrationrate λk and inversely proportional to the emigration rate for any habitat Hk. In this work, let the valueof s(Hk, Hk) be the ratio between the immigration rate λk and the emigration rate µk of habitat Hk,λk/µk. In Section 3.3, another method for obtaining the value is used for comparison to discuss howto select a more optimal value of HIR(k) (e.g., the mid-value of similarity S in [8], the average ofsimilarity S, half of the mid-value of similarity S, and half of the average of similarity S).
Definition 3. Habitat attractiveness. Let habitat Hj belong to habitat set Hni . For candidate habitat
Hj to be immigrated into, evidence r(Hi, Hj) is collected from habitat Hi (called the attractiveness ofhabitat Hj to habitat Hi) to describe the attractiveness of habitat Hj to attract species emigrating fromhabitat Hi and immigrating into habitat Hj. Such attractiveness can be called habitat attractiveness.
Definition 4. Habitat availability. For habitat Hj, evidence a(Hi, Hj) is collected for habitat Hi tobe emigrated from (called the availability of habitat Hi to habitat Hj) to describe the suitability ofspecies emigrating from habitat Hj and immigrating into habitat Hi. Such availability can be calledhabitat availability.
The stronger the evidence is (the larger the sum of r(Hi, Hj) and a(Hi, Hj)), the largerthe probability is of species emigrating from habitat Hi and immigrating into habitat Hj. The methodsfor calculating and updating information matrix are shown as Formulas (7) and (8), respectively.The basic procedure of AP is shown in Figure 2.
r(Hi, Hj)← s(Hi, Hj)− maxj′s.t.j′ 6=j
a(Hi, Hj′) + s(Hi, Hj′) (7)

ISPRS Int. J. Geo-Inf. 2016, 5, 129 5 of 14
a(Hi, Hj)←
min0, r(Hj, Hj) + ∑
Hi′ s.t.Hi′ /∈Hi ,Hjmax0, r(Hi′ , Hj), i 6= j
∑Hi′ s.t.Hi′ /∈Hi ,Hj
max0, r(Hi′ , Hj), i = j(8)
where r(Hj, Hj) and a(Hi, Hj) can be obtained using the migration immigration matrix of habitats(Hi, Hj) and the habitat immigration reference HIR(k).
r(Hi,Hj)a(Hi,Hj')
Hi Hi
Candidate immigration habitat Hj
Candidate immigration habitat Hj
Competing candidate immigration habitat Hj'
Supporting habitat Hi'
r(Hi',Hj)
a(Hi,Hj)
Sending responsibilities Sending availabilities
Figure 2. Responsibilities r(Hi , Hj) are sent from habitat Hi to candidate immigration habitat Hj and indicatehow strongly each habitat favors the candidate immigration habitat over other immigration habitats. Availabilitiesa(Hi , Hj) are sent from the candidate immigration habitat to habitat Hi and indicate to what degree each candidateimmigration habitat is available as an immigration habitat for the habitat.
2.3. Local Search Strategies
To ensure population diversity under the precondition of fast convergence, this work uses SAas the local search (LS) strategy of the MBBO algorithm. SA uses the Metropolis criterion to acceptnon-prepreerence solutions and prevent them from falling into a local optimum. If the function isf (S), the current solution is f (S1), the new solution is f (S2), and the increment is df = f (S2) − f (S1),then the Metropolis criterion can be expressed as Formula (9).
p =
1, d f < 0
exp(− d fT ), d f ≥ 0
(9)
2.4. MBBO Algorithm
In this section, we provide some definitions as a first step towards formalizing the BBO algorithmand provide an outline of the algorithm.
Definition 5. Habitat migration strategy Ω(r, a) : Hn → H is a probabilistic operator used to controlthe migration operation. It can be judged that when the species emigrate from habitat Hi, theyimmigrate into habitat Hj with habitat attractiveness r and habitat availability a.
Definition 6. Habitat mutation strategy M(λ, µ) : H → H is a probabilistic operator used to controlthe mutation operation. Habitat mutation operation with randomly changing SIVm is determined bythe existing probability of species count Ps. Existing probability of species count Ps can be calculatedusing Formula (4). For the basic procedure of the habitat mutational strategy, refer to the mutationaloperation of the BBO algorithm.
Definition 7. Global search strategy of MBBO G = m, n, λ, µ, Ω, M is a 6-tuple that can iterativelyoptimize the initialized habitat.

ISPRS Int. J. Geo-Inf. 2016, 5, 129 6 of 14
Definition 8. Local search strategy of MBBO L = t, l, P : Hn → H is a 3-tuple set that can conductlocal optimization of the evolution of the habitat in every generation. To provide this ability withoutthe limit of a local optimum to the optimization of a habitat, the non-prepreerence solution can beaccepted for a certain probability. t is a sufficiently large initial temperature, l is the Metropolis chainlength that is, the performance time under temperature T, and P is the probability of acceptance,which can be calculated with using Formula (9).
Definition 9. MBBO algorithm MBBO = Φ, G, L, T is a 4-tuple where Φ = ∅→ Hn,HSIn refersto initializing a set of habitats and calculating the function of the HSI value of a habitat. G isthe global search strategy which can perform global optimization of the habitat. L is the localsearch strategy, which can perform local optimization of the habitat. T = Hn → true, f alse isa termination criterion.
The basic procedure of the MBBO algorithm is as Algorithm 1.
Algorithm 1: MBBOInitialize the BBO parameters, including the habitat modification probability, mutation probability,maximum species count S, maximum migration rates E and I, maximum mutation rate mmax, thegeneration counter: g=0, the Metropolis chain length: L, the initial temperature T;
Create a random initial population H(g)i , i = 1, 2, 3,. . . ,N and g = 0, 1, 2,. . . ,MAXGEN ;
Evaluate f (H(g)i ), i = 1, 2, 3,. . . ,N;
for g = 1 to MAXGEN dofor i = 1 to N do
Sort the population from best f (H(g)i ) to least f (H(g)
i );Map the HSI to the number of species;Calculate the immigration rate λi, the emigration rate µi, the Habitat attractiveness a and theHabitat availability r;
for i = 1 to N doModify the non-elite members of the population probabilistically with the migration operator;
for i = 1 to N doEvaluate the new individuals in the population;Replace the habitats with their new versions;Replace the worst with the previous generation’s elites;
while T 6=0 dofor L = 1 to l do
Create a random H(g)′
i ;
Calculate df = f (H(g)′
i ) − f (H(g)i );
if df < 0 then
H(g)′
i is accepted as the new current solutionelse
H(g)′
i is accepted as the new current solution as probability∝exp(−∆t/kT)T = T − 1; g = g + 1;
3. Experimental Settings and Results
3.1. CEC 2015 Benchmarks
In this work, to investigate the performance of the MBBO, we compared it withSPS-L-SHADE-EIG algorithm [14], DEsPA algorithm [15] and MVMO algorithm [16] using the CEC2015 benchmarks. For convenient description, these functions [19] are denoted as F1-F15, as shownin Table 1. The SPS-L-SHADE-EIG algorithm combines the adaptive differential evolution [20,21]with linear population size reduction(L-SHADE) [22] with the eigenvector-based (EIG) [23] crossover
ISPRS Int. J. Geo-Inf. 2016, 5, 129 7 of 14
and successful-parent-selecting (SPS) frameworks [24]. The DEsPA algorithm is a new DifferentialEvolution algorithm with a success-based parameter adaptation with resizing population space [25].The MVMO algorithm is Mean-variance mapping optimization that uses a special mapping functionfor mutation operation. These three algorithms are state-of-the-art evolutionary mechanisms.
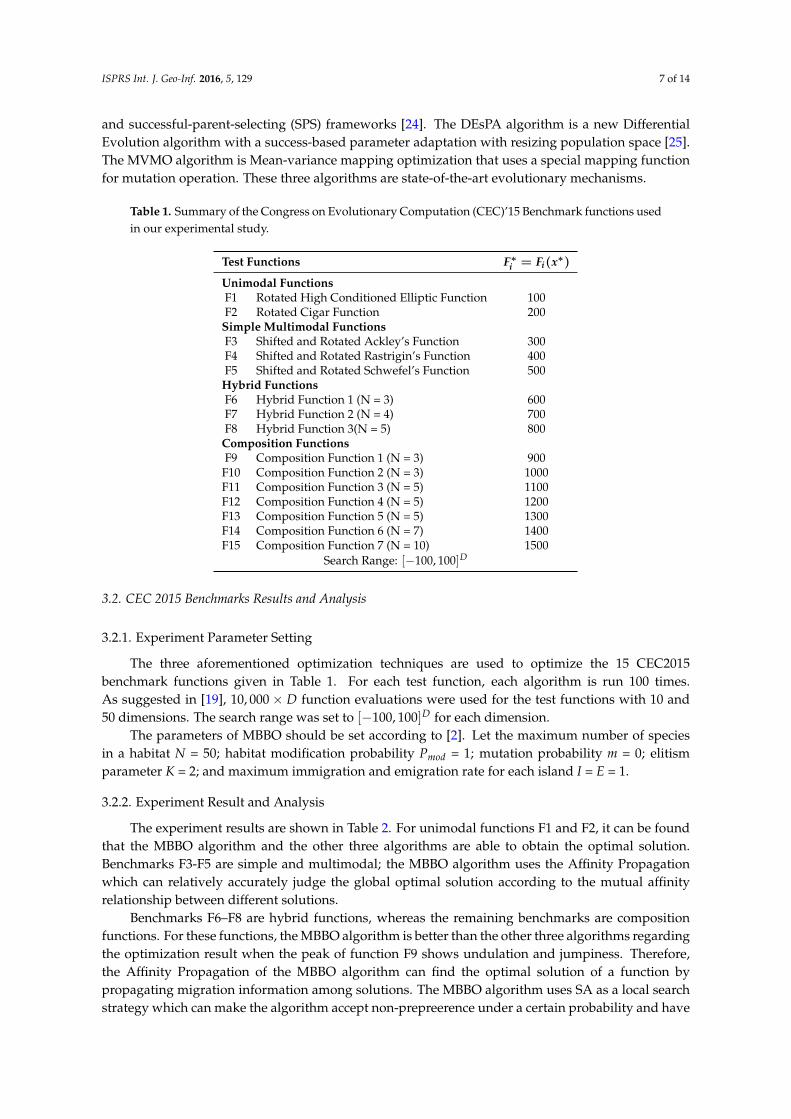
Table 1. Summary of the Congress on Evolutionary Computation (CEC)’15 Benchmark functions usedin our experimental study.
Test Functions F∗i = Fi(x∗)
Unimodal FunctionsF1 Rotated High Conditioned Elliptic Function 100F2 Rotated Cigar Function 200Simple Multimodal FunctionsF3 Shifted and Rotated Ackley’s Function 300F4 Shifted and Rotated Rastrigin’s Function 400F5 Shifted and Rotated Schwefel’s Function 500Hybrid FunctionsF6 Hybrid Function 1 (N = 3) 600F7 Hybrid Function 2 (N = 4) 700F8 Hybrid Function 3(N = 5) 800Composition FunctionsF9 Composition Function 1 (N = 3) 900F10 Composition Function 2 (N = 3) 1000F11 Composition Function 3 (N = 5) 1100F12 Composition Function 4 (N = 5) 1200F13 Composition Function 5 (N = 5) 1300F14 Composition Function 6 (N = 7) 1400F15 Composition Function 7 (N = 10) 1500
Search Range: [−100, 100]D
3.2. CEC 2015 Benchmarks Results and Analysis
3.2.1. Experiment Parameter Setting
The three aforementioned optimization techniques are used to optimize the 15 CEC2015benchmark functions given in Table 1. For each test function, each algorithm is run 100 times.As suggested in [19], 10, 000× D function evaluations were used for the test functions with 10 and50 dimensions. The search range was set to [−100, 100]D for each dimension.
The parameters of MBBO should be set according to [2]. Let the maximum number of speciesin a habitat N = 50; habitat modification probability Pmod = 1; mutation probability m = 0; elitismparameter K = 2; and maximum immigration and emigration rate for each island I = E = 1.
3.2.2. Experiment Result and Analysis
The experiment results are shown in Table 2. For unimodal functions F1 and F2, it can be foundthat the MBBO algorithm and the other three algorithms are able to obtain the optimal solution.Benchmarks F3-F5 are simple and multimodal; the MBBO algorithm uses the Affinity Propagationwhich can relatively accurately judge the global optimal solution according to the mutual affinityrelationship between different solutions.
Benchmarks F6–F8 are hybrid functions, whereas the remaining benchmarks are compositionfunctions. For these functions, the MBBO algorithm is better than the other three algorithms regardingthe optimization result when the peak of function F9 shows undulation and jumpiness. Therefore,the Affinity Propagation of the MBBO algorithm can find the optimal solution of a function bypropagating migration information among solutions. The MBBO algorithm uses SA as a local searchstrategy which can make the algorithm accept non-prepreerence under a certain probability and have
ISPRS Int. J. Geo-Inf. 2016, 5, 129 8 of 14
a stronger ability to skip the local optimum. Therefore, MBBO can accurately obtain the optimalsolution. MBBO uses the Memetic framework to optimize the complex function in global searchand local search. With the strong global optimization ability of Affinity Propagation and the strongability of SA to skip the local optimum, the MBBO algorithm can effectively solve complex functionssuch as F10-F15.
To performance the MBBO algorithm and the other three algorithms for limited budget, weadded the experiment over 50 number of evaluations to compare the performance evolution amongthese algorithms. For 10-D function F3, F4, F7, F8, F14 and F15, the cumulative distribution function(CDF) plots can be found in Figure 3 that compared with the three other algorithms over 50 functionevaluations. Figure 3a–f are the optimization processes of MBBO, SPS-L-SHADE-EIG, DEsPA andMVMO algorithms in F3, F4, F7, F8, F14 and F15 benchmark functions. For hybrid function F7 andF8, it can be found that MBBO algorithm is better than the other three algorithms in Figure 3c,d.For composition Function F14 and F15, it can be found in Figure 3e,f that compared with otherthree algorithms, MBBO algorithm has larger difference, while the result of this function solved withSPS-L-SGADE-EIG algorithm is more stable.
3.2.3. Statistical Analysis
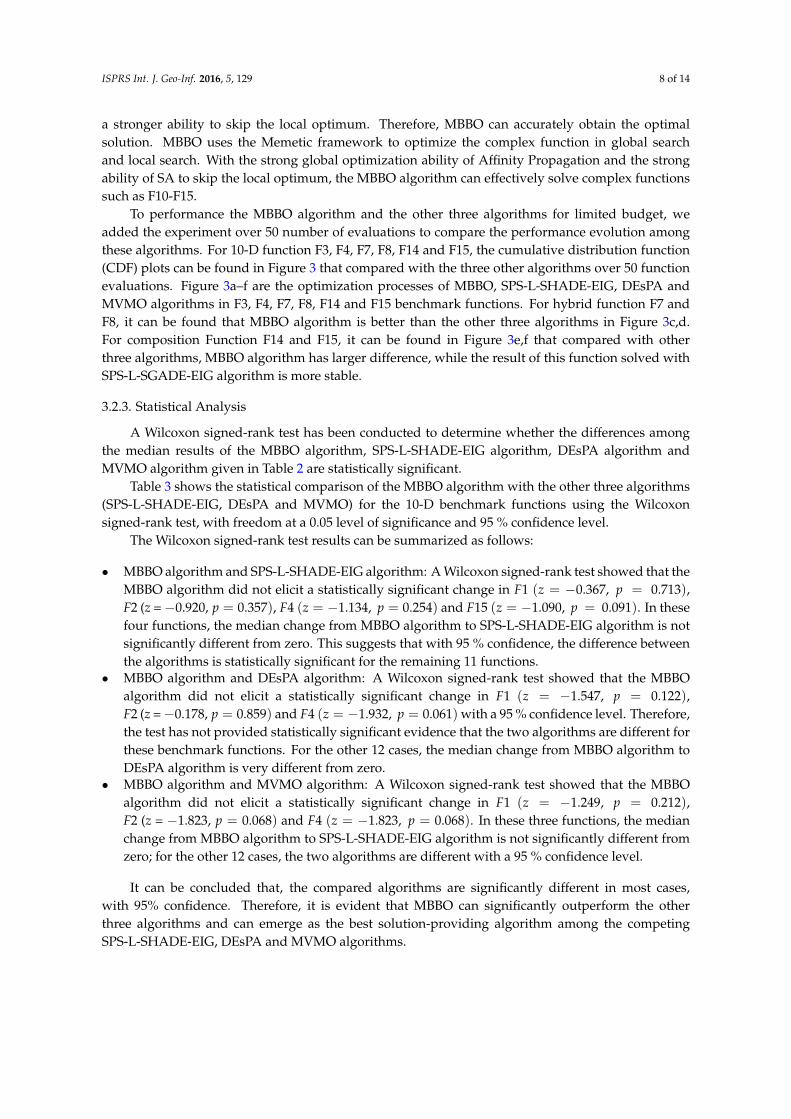
A Wilcoxon signed-rank test has been conducted to determine whether the differences amongthe median results of the MBBO algorithm, SPS-L-SHADE-EIG algorithm, DEsPA algorithm andMVMO algorithm given in Table 2 are statistically significant.
Table 3 shows the statistical comparison of the MBBO algorithm with the other three algorithms(SPS-L-SHADE-EIG, DEsPA and MVMO) for the 10-D benchmark functions using the Wilcoxonsigned-rank test, with freedom at a 0.05 level of significance and 95 % confidence level.
The Wilcoxon signed-rank test results can be summarized as follows:
• MBBO algorithm and SPS-L-SHADE-EIG algorithm: A Wilcoxon signed-rank test showed that theMBBO algorithm did not elicit a statistically significant change in F1 (z = −0.367, p = 0.713),F2 (z =−0.920, p = 0.357), F4 (z = −1.134, p = 0.254) and F15 (z = −1.090, p = 0.091). In thesefour functions, the median change from MBBO algorithm to SPS-L-SHADE-EIG algorithm is notsignificantly different from zero. This suggests that with 95 % confidence, the difference betweenthe algorithms is statistically significant for the remaining 11 functions.
• MBBO algorithm and DEsPA algorithm: A Wilcoxon signed-rank test showed that the MBBOalgorithm did not elicit a statistically significant change in F1 (z = −1.547, p = 0.122),F2 (z =−0.178, p = 0.859) and F4 (z = −1.932, p = 0.061) with a 95 % confidence level. Therefore,the test has not provided statistically significant evidence that the two algorithms are different forthese benchmark functions. For the other 12 cases, the median change from MBBO algorithm toDEsPA algorithm is very different from zero.
• MBBO algorithm and MVMO algorithm: A Wilcoxon signed-rank test showed that the MBBOalgorithm did not elicit a statistically significant change in F1 (z = −1.249, p = 0.212),F2 (z = −1.823, p = 0.068) and F4 (z = −1.823, p = 0.068). In these three functions, the medianchange from MBBO algorithm to SPS-L-SHADE-EIG algorithm is not significantly different fromzero; for the other 12 cases, the two algorithms are different with a 95 % confidence level.
It can be concluded that, the compared algorithms are significantly different in most cases,with 95% confidence. Therefore, it is evident that MBBO can significantly outperform the otherthree algorithms and can emerge as the best solution-providing algorithm among the competingSPS-L-SHADE-EIG, DEsPA and MVMO algorithms.

ISPRS Int. J. Geo-Inf. 2016, 5, 129 9 of 14
Table 2. Comparison of MBBO, SPS-L-SHADE-EIG, DEsPA and MVMO. Statistical results of the 10-D and 50-D benchmark functions, averaged over100 independent runs.
MBBO SPS-L-SHADE-EIG DEsPA MVMO
Best Median Mean Distance Best Median Mean Distance Best Median Mean Distance Best Median Mean Distance
10-DF1 0.00E+00 0.00E+00 0.00E+00 0.00E+00 0.00E+00 0.00E+00 0.00E+00 0.00E+00 0.00E+00 0.00E+00 0.00E+00 0.00E+00 0.00E+00 0.00E+00 0.00E+00 0.00E+00F2 0.00E+00 0.00E+00 0.00E+00 0.00E+00 0.00E+00 0.00E+00 0.00E+00 0.00E+00 0.00E+00 0.00E+00 0.00E+00 0.00E+00 0.00E+00 0.00E+00 0.00E+00 0.00E+00F3 1.10E+01 1.50E+01 1.70E+01 1.10E+01 2.00E+01 2.20E+01 2.60E+01 2.00E+01 1.91E+01 2.19E+01 1.90E+01 1.91E+01 2.01E+01 2.33E+01 1.40E+01 2.01E+01F4 1.34E-01 6.25E-01 1.23E+00 1.34E-01 7.83E-01 8.72E-01 1.95E+00 7.83E-01 8.93E-01 9.95E-01 1.17E+00 8.93E-01 9.83E-01 1.23E+00 9.76E-01 9.83E-01F5 9.93E+00 1.34E+01 2.14E+01 9.93E+00 1.24E+01 1.64E+01 2.35E+01 1.24E+01 1.43E+01 1.86E+01 2.56E+01 1.43E+01 2.19E+01 2.35E+01 2.98E+01 2.19E+01F6 0.00E+00 0.00E+00 1.01E-01 0.00E+00 0.00E+00 0.00E+00 1.23E-01 0.00E+00 0.00E+00 0.00E+00 8.79E-01 0.00E+00 0.00E+00 0.00E+00 7.98E-01 0.00E+00F7 6.70E-03 1.02E-02 2.23E-02 6.70E-03 9.76E-03 1.94E-02 2.78E-02 9.76E-03 1.23E-02 2.31E-02 3.21E-02 1.23E-02 2.35E-02 3.12E-02 5.37E-02 2.35E-02F8 7.63E-05 1.26E-04 7.32E-04 7.63E-05 1.01E-04 1.37E-04 8.81E-04 1.01E-04 2.13E-04 4.34E-04 9.86E-04 2.13E-04 3.98E-04 6.98E-04 9.98E-04 3.98E-04F9 2.39E+01 8.69E+01 9.51E+01 2.39E+01 6.92E+01 1.00E+02 1.50E+02 6.92E+01 9.21E+01 1.02E+02 1.02E+02 9.21E+01 1.02E+02 1.97E+02 1.28E+02 1.02E+02F10 2.03E+02 2.21E+02 2.04E+02 2.03E+02 1.98E+02 3.68E+02 3.53E+02 1.98E+02 2.58E+02 2.76E+02 2.37E+02 2.58E+02 2.98E+02 3.97E+02 3.15E+02 2.98E+02F11 3.28E-02 7.52E-02 4.37E-01 3.28E-02 7.82E-02 9.79E-02 9.27E-01 7.82E-02 8.27E-02 9.86E-01 7.78E-01 8.27E-02 5.24E-02 1.00E-01 3.33E-01 5.24E-02F12 2.39E+01 8.96E+01 1.00E+02 2.39E+01 9.82E+01 1.32E+02 1.06E+02 9.82E+01 1.92E+02 2.94E+02 2.36E+02 1.92E+02 2.01E+02 2.96E+02 2.75E+02 2.01E+02F13 3.30E-03 1.23E-02 2.12E-02 3.30E-03 3.46E-02 8.26E-02 2.31E-02 3.46E-02 8.72E-02 9.26E-02 7.89E-02 8.72E-02 2.05E-02 2.83E-02 7.23E-02 2.05E-02F14 1.03E+02 1.98E+02 3.94E+02 1.03E+02 1.95E+02 2.35E+02 5.21E+02 1.95E+02 4.32E+02 8.92E+02 7.26E+02 4.32E+02 3.95E+02 4.77E+02 5.67E+02 3.95E+02F15 3.61E+01 8.70E+01 9.50E+01 3.61E+01 9.32E+01 1.02E+02 1.67E+02 9.32E+01 1.01E+02 1.36E+02 2.34E+02 1.01E+02 2.51E+02 3.55E+02 2.45E+02 2.51E+0250-DF1 0.00E+00 0.00E+00 0.00E+00 0.00E+00 0.00E+00 0.00E+00 0.00E+00 0.00E+00 0.00E+00 0.00E+00 0.00E+00 0.00E+00 0.00E+00 0.00E+00 0.00E+00 0.00E+00F2 0.00E+00 0.00E+00 0.00E+00 0.00E+00 0.00E+00 0.00E+00 0.00E+00 0.00E+00 0.00E+00 0.00E+00 0.00E+00 0.00E+00 0.00E+00 0.00E+00 0.00E+00 0.00E+00F3 1.09E+01 1.83E+01 1.93E+01 1.09E+01 2.91E+01 3.22E+01 2.32E+01 2.91E+01 2.81E+01 3.11E+01 2.82E+01 2.81E+01 4.15E+01 6.51E+01 2.82E+01 4.15E+01F4 9.23E-01 1.23E+00 1.98E+00 9.23E-01 1.02E+00 3.52E+00 2.55E+00 1.02E+00 1.92E+00 2.46E+00 3.26E+00 1.92E+00 2.24E+00 3.86E+00 4.62E+00 2.24E+00F5 1.70E+03 1.92E+03 1.87E+03 1.70E+03 1.53E+03 2.98E+03 1.75E+03 1.53E+03 2.42E+03 2.99E+03 2.68E+03 2.42E+03 2.73E+03 3.82E+03 3.00E+03 2.73E+03F6 1.35E+02 1.98E+02 1.75E+02 1.35E+02 1.87E+02 2.11E+02 2.39E+02 1.87E+02 2.06E+02 2.67E+02 2.49E+02 2.06E+02 2.94E+02 3.22E+02 3.15E+02 2.94E+02F7 2.31E+01 3.92E+01 2.56E+01 2.31E+01 3.52E+01 4.05E+01 2.74E+01 3.52E+01 3.94E+01 4.96E+01 3.16E+01 3.94E+01 4.52E+01 5.81E+01 4.87E+01 4.52E+01F8 9.23E+00 2.16E+01 4.58E+01 9.23E+00 1.81E+01 2.79E+01 5.57E+01 1.81E+01 2.02E+01 2.62E+01 6.58E+01 2.02E+01 3.31E+01 6.32E+01 5.18E+01 3.31E+01F9 7.20E+01 1.06E+02 1.02E+02 7.20E+01 1.36E+02 2.56E+02 2.37E+02 1.36E+02 1.84E+02 3.35E+02 3.02E+00 1.84E+02 4.89E+02 6.51E+02 5.56E+02 4.89E+02F10 3.29E+02 7.95E+02 6.87E+02 3.29E+02 7.23E+02 8.09E+02 8.35E+02 7.23E+02 7.84E+02 9.86E+02 8.76E+02 7.84E+02 5.91E+02 6.98E+02 7.92E+02 5.91E+02F11 1.36E+02 2.78E+02 2.69E+02 1.36E+02 2.47E+02 3.00E+02 3.00E+02 2.47E+02 2.84E+02 3.76E+02 3.56E+02 2.84E+02 3.34E+02 5.87E+02 4.98E+02 3.34E+02F12 4.50E+01 1.00E+02 1.10E+02 4.50E+01 9.32E+01 1.04E+02 1.23E+02 9.32E+01 1.07E+02 1.98E+02 1.79E+02 1.07E+02 2.04E+02 3.01E+02 2.96E+02 2.04E+02F13 1.32E-02 6.54E-02 5.77E-02 1.32E-02 3.73E-02 7.57E-02 7.62E-02 3.73E-02 6.25E-02 8.27E-02 7.26E-02 6.25E-02 6.13E-02 7.60E-02 6.67E-02 6.13E-02F14 3.47E+04 5.98E+04 4.79E+04 3.47E+04 5.95E+04 6.83E+04 6.35E+04 5.95E+04 5.74E+04 7.89E+04 7.12E+04 5.74E+04 6.95E+04 8.63E+04 8.01E+04 6.95E+04F15 3.72E+01 9.60E+01 1.01E+02 3.72E+01 1.03E+02 1.56E+02 1.35E+02 1.03E+02 1.62E+02 2.32E+02 2.17E+02 1.62E+02 3.74E+02 6.19E+02 5.97E+02 3.74E+02

ISPRS Int. J. Geo-Inf. 2016, 5, 129 10 of 14
3.3. Effect of the HIR on the Performance of MBBO
3.3.1. Experiment Setting
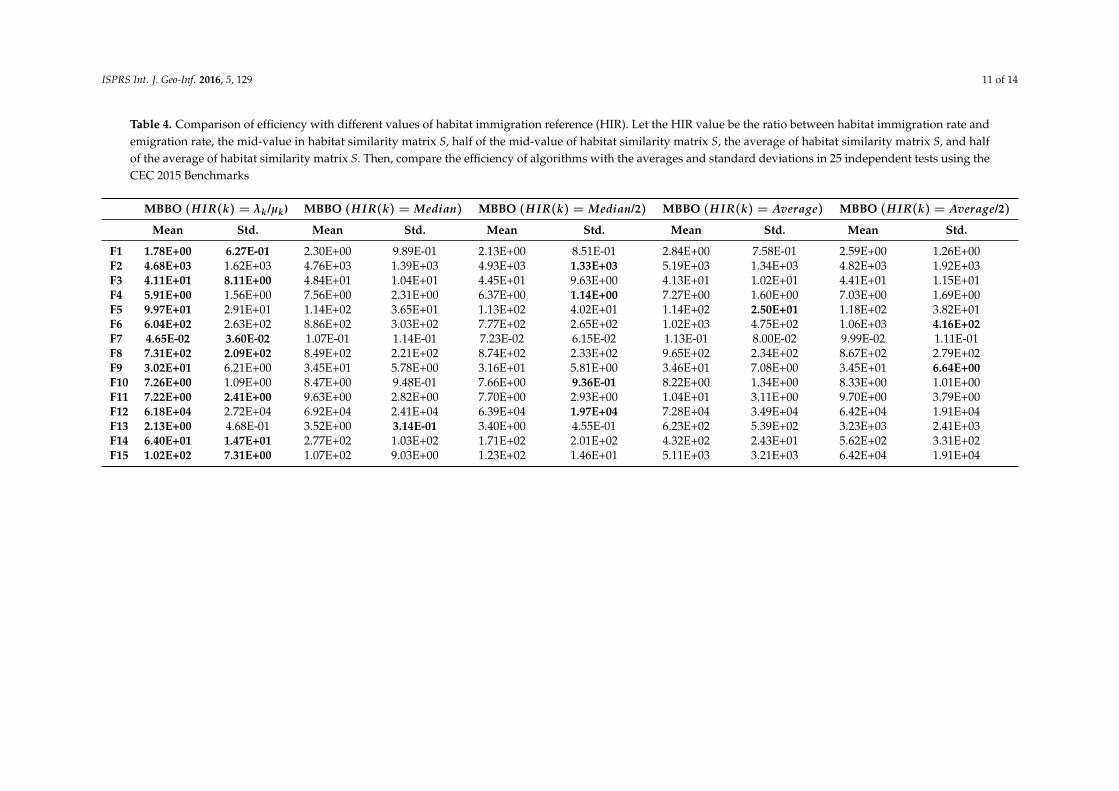
The HIR value in Affinity Propagation of the MBBO algorithm is the ratio between the habitatimmigration rate and habitat emigration rate. To the compare efficiency with different values of HIR,a comparison experiment is set. Let the HIR value be the ratio between the habitat immigrationand emigration rates, the mid-value in habitat similarity matrix S, half of the mid-value of habitatsimilarity matrix S, the average of habitat similarity matrix S, and half of the average of habitatsimilarity matrix S. Then, compare the efficiency of algorithms with the averages and standarddeviations in the 25 independent tests using the CEC 2015 benchmarks. The parameters of the MBBOalgorithm for five HIR sampling methods are set according to Subsection 3.2.1. Let the maximumspecies count in habitat N = 50; habitat modification probability Pmod = 1; mutation probability m = 0;elitism parameter K = 2; and maximum immigration and migration rates for each island I = E = 1.
Table 3. The statistical comparison of the MBBO algorithm with the other three algorithms, using theWilcoxon signed-rank test with freedom at a 0.05 level of significance and 95 % confidence level.
MBBO and SPS-L-SHADE-EIG MBBO and DEsPA MBBO and MVMO
z p-Value (2-Tailed) z p-Value (2-Tailed) z p-Value (2-Tailed)
F1 −0.367 0.713 −1.547 0.122 −1.249 0.212F2 −0.920 0.357 −0.178 0.859 −1.823 0.068F3 −2.077 0.038 −2.505 0.012 −2.716 0.007F4 −1.134 0.254 −1.932 0.061 −1.899 0.058F5 −2.139 0.032 −2.660 0.008 −2.634 0.008F6 −3.696 0.000 −3.705 0.000 −3.702 0.000F7 −2.996 0.003 −2.820 0.004 −2.492 0.013F8 −2.323 0.025 −2.432 0.014 −2.814 0.005F9 −2.928 0.003 −2.413 0.015 −3.203 0.001
F10 −3.222 0.001 −2.995 0.003 −3.220 0.001F11 −2.746 0.006 −2.395 0.017 −2.466 0.014F12 −2.640 0.008 −3.324 0.001 −5.244 0.000F13 −5.376 0.000 −4.278 0.000 −4.437 0.000F14 −2.934 0.003 −2.666 0.008 −2.936 0.003F15 −1.090 0.091 −2.936 0.003 −6.232 0.000
3.3.2. Experimental Results and Analysis
The experimental results are shown in Table 4 According to these results, it can be found thatthe effect of MBBO algorithm (HIR(k) = λk/µk) is better than that of the other four situations forthe solutions of the CEC 2015 benchmarks. The setting of the HIR value as the ratio between thehabitat immigration and emigration rates can use the information regarding the number of species ina habitat. The propagation of information regarding attractiveness and availability among habitatscan more accurately guide the species migration behavior among habitats.
3.4. Experimental Results Analysis
The MBBO algorithm uses Affinity Propagation which can relatively accurately judge the globaloptimal solution according to the mutual affinity relationship between different solutions. The MBBOalgorithm uses SA as the local search strategy which can make the algorithm accept non-prepreerenceunder a certain probability and have a stronger ability to skip the local optimum. Therefore, MBBOcan accurately obtain the optimal solution. MBBO uses the Memetic framework to optimize acomplex function in global search and local search. With the strong global optimization ability ofAffinity Propagation and the strong ability of SA to skip the local optimum, the MBBO algorithm caneffectively solve complex functions.
ISPRS Int. J. Geo-Inf. 2016, 5, 129 11 of 14
Table 4. Comparison of efficiency with different values of habitat immigration reference (HIR). Let the HIR value be the ratio between habitat immigration rate andemigration rate, the mid-value in habitat similarity matrix S, half of the mid-value of habitat similarity matrix S, the average of habitat similarity matrix S, and halfof the average of habitat similarity matrix S. Then, compare the efficiency of algorithms with the averages and standard deviations in 25 independent tests using theCEC 2015 Benchmarks
MBBO (H IR(k) = λk/µk) MBBO (H IR(k) = Median) MBBO (H IR(k) = Median/2) MBBO (H IR(k) = Average) MBBO (H IR(k) = Average/2)
Mean Std. Mean Std. Mean Std. Mean Std. Mean Std.
F1 1.78E+00 6.27E-01 2.30E+00 9.89E-01 2.13E+00 8.51E-01 2.84E+00 7.58E-01 2.59E+00 1.26E+00F2 4.68E+03 1.62E+03 4.76E+03 1.39E+03 4.93E+03 1.33E+03 5.19E+03 1.34E+03 4.82E+03 1.92E+03F3 4.11E+01 8.11E+00 4.84E+01 1.04E+01 4.45E+01 9.63E+00 4.13E+01 1.02E+01 4.41E+01 1.15E+01F4 5.91E+00 1.56E+00 7.56E+00 2.31E+00 6.37E+00 1.14E+00 7.27E+00 1.60E+00 7.03E+00 1.69E+00F5 9.97E+01 2.91E+01 1.14E+02 3.65E+01 1.13E+02 4.02E+01 1.14E+02 2.50E+01 1.18E+02 3.82E+01F6 6.04E+02 2.63E+02 8.86E+02 3.03E+02 7.77E+02 2.65E+02 1.02E+03 4.75E+02 1.06E+03 4.16E+02F7 4.65E-02 3.60E-02 1.07E-01 1.14E-01 7.23E-02 6.15E-02 1.13E-01 8.00E-02 9.99E-02 1.11E-01F8 7.31E+02 2.09E+02 8.49E+02 2.21E+02 8.74E+02 2.33E+02 9.65E+02 2.34E+02 8.67E+02 2.79E+02F9 3.02E+01 6.21E+00 3.45E+01 5.78E+00 3.16E+01 5.81E+00 3.46E+01 7.08E+00 3.45E+01 6.64E+00F10 7.26E+00 1.09E+00 8.47E+00 9.48E-01 7.66E+00 9.36E-01 8.22E+00 1.34E+00 8.33E+00 1.01E+00F11 7.22E+00 2.41E+00 9.63E+00 2.82E+00 7.70E+00 2.93E+00 1.04E+01 3.11E+00 9.70E+00 3.79E+00F12 6.18E+04 2.72E+04 6.92E+04 2.41E+04 6.39E+04 1.97E+04 7.28E+04 3.49E+04 6.42E+04 1.91E+04F13 2.13E+00 4.68E-01 3.52E+00 3.14E-01 3.40E+00 4.55E-01 6.23E+02 5.39E+02 3.23E+03 2.41E+03F14 6.40E+01 1.47E+01 2.77E+02 1.03E+02 1.71E+02 2.01E+02 4.32E+02 2.43E+01 5.62E+02 3.31E+02F15 1.02E+02 7.31E+00 1.07E+02 9.03E+00 1.23E+02 1.46E+01 5.11E+03 3.21E+03 6.42E+04 1.91E+04

ISPRS Int. J. Geo-Inf. 2016, 5, 129 12 of 14
0 5 10 15 20 25 300
0.1
0.2
0.3
0.4
0.5
0.6
0.7
0.8
0.9
1
x
CD
F
MBBOSPS−L−SHADE−EIGDEsPAMVMO
(a)
0 0.5 1 1.5 2 2.5 30
0.1
0.2
0.3
0.4
0.5
0.6
0.7
0.8
0.9
1
x
CD
F
MBBOSPS−L−SHADE−EIGDEsPAMVMO
(b)
0 0.05 0.1 0.15 0.2 0.25 0.3 0.350.2
0.3
0.4
0.5
0.6
0.7
0.8
0.9
1
x
CD
F
MBBOSPS−L−SHADE−EIGDEsPAMVMO
(c)
0 0.5 1 1.5 2 2.5 3
x 10−3
0.2
0.3
0.4
0.5
0.6
0.7
0.8
0.9
1
x
CD
F
MBBOSPS−L−SHADE−EIGDEsPAMVMO
(d)
0 500 1000 15000
0.1
0.2
0.3
0.4
0.5
0.6
0.7
0.8
0.9
1
x
CD
F
MBBOSPS−L−SHADE−EIGDEsPAMVMO
(e)
0 100 200 300 400 500 600 700 800 9000
0.1
0.2
0.3
0.4
0.5
0.6
0.7
0.8
0.9
1
x
CD
F
MBBOSPS−L−SHADE−EIGDEsPAMVMO
(f)
Figure 3. (a–f) are the cumulative distribution function (CDF) plots for 10-D function F3, F4, F7, F8,F14 and F15 of MBBO, SPS-L-SHADE-EIG, DEsPA and MVMO algorithms. (a) F3; (b) F4; (c) F7; (d) F8;(e) F14; (f) F15.
4. Conclusions
This work proposed a MBBO algorithm that uses the AP strategy to modify the migrationoperation of the BBO algorithm and based on the Memetic frame, with SA as the local searchstrategy. According to an analysis of the test results of MBBO regarding the CEC 2015 benchmarks,this algorithm can better solve the limit value of function optimization. Compared with theSPS-L-SHADE-EIG, DEsPA and MVMO algorithms, it can be found that the MBBO algorithm hassignificantly better performance than do the other three algorithms. However, the study of the BBOalgorithm is still in its infancy stage compared with other EAs (such as Genetic Algorithms [26,27] andParticle Swarm Optimizer [28,29]). In future work, other algorithm framework (such as the culturalalgorithm framework [30]) models should be used to modify the performance of the BBO algorithm.
Acknowledgments: This work is partially supported by National Natural Science Foundation (61373148,61502151), National Social Science Foundation (12BXW040), Shandong Province Natural Science Foundation(ZR2012FM038, ZR2014FL010), Shandong Province Social Sciences Project (15CXWJ13). The authors alsogratefully acknowledge the helpful comments and suggestions of the reviewers, which improve thepresentation greatly.
Author Contributions: Zhihao Wang prepared the general research idea and wrote the article. Peiyu Liu andMin Ren gave advice of the paper. Yuzhen Yang and Xiaoyan Tian conducted the computer simulation describedin Section 3. All authors have read and approved the final manuscript.
Conflicts of Interest: The authors declare no conflict of interest.
References
1. MacArthur, R.; Wilson, E. The Theory of Biogeography; Princeton University Press: Princeton, NJ, USA, 1967.2. Simon, D. Biogeography-based optimization. IEEE Trans. Evol. Comput. 2008, 12, 702–713.3. Ma, H.; Simon, D. Analysis of migration models of biogeography-based optimization using Markov theory.
Eng. Appl. Artif. Intell. 2011, 24, 1052–1060.

ISPRS Int. J. Geo-Inf. 2016, 5, 129 13 of 14
4. Ma, H.; Simon, D.; Fei, M.; Xie, Z. Variations of biogeography-based optimization and Markov analysis.Inf. Sci. 2013, 220, 492–506.
5. Yang, G.P.; Liu, S.Y.; Zhang, J.K.; Feng, Q.X. Control and synchronization of chaotic systems by an improvedbiogeography-based optimization algorithm. Appl. Intell. 2013, 39, 132–143.
6. Gong, W.; Cai, Z.; Ling, C.X.; Li, H. A real-coded biogeography-based optimization with mutation.Appl. Math. Comput. 2010, 216, 2749–2758.
7. Bhattacharya, A.; Chattopadhyay, P. Hybrid Differential Evolution With Biogeography-Based Optimizationfor Solution of Economic Load Dispatch. IEEE Trans. Power Syst. 2010, 25, 1955–1964.
8. Frey, B.J.; Dueck, D. Clustering by passing messages between data points. Science 2007, 315, 972–976.9. Moscato, P.; Norman, M.G. A memetic approach for the traveling salesman problem implementation of
a computational ecology for combinatorial optimization on message-passing systems. Parallel Comput.Transput. Appl. 1992, 1, 177–186.
10. Merz, P.; Zell, A. Clustering gene expression profiles with memetic algorithms. In Parallel Problem Solvingfrom Nature-PPSN VII; Springer: Berlin, Germany, 2002; pp. 811–820.
11. Kannan, S.S.; Ramaraj, N. A novel hybrid feature selection via Symmetrical Uncertainty ranking based localmemetic search algorithm. Knowl. Based Syst. 2010, 23, 580–585.
12. Banos, R.; Gil, C.; Reca, J.; Montoya, F. A memetic algorithm applied to the design of water distributionnetworks. Appl. Soft Comput. 2010, 10, 261–266.
13. Kirkpatrick, S.; Gelatt, C.D.; Vecchi, M.P. Optimization by simulated annealing. Science 1983, 220, 671–680.14. Guo, S.M.; Tsai, J.S.H.; Yang, C.C.; Hsu, P.H. A self-optimization approach for L-SHADE incorporated
with eigenvector-based crossover and successful-parent-selecting framework on CEC 2015 benchmark set.In Proceedings of the 2015 IEEE Congress on Evolutionary Computation, Sendai, Japan, 25–28 May 2015.
15. Awad, N.; Ali, M.Z.; Reynolds, R.G. A differential evolution algorithm with success-based parameteradaptation for CEC2015 learning-based optimization. In Proceedings of the 2015 IEEE Congress onEvolutionary Computation, Sendai, Japan, 25–28 May 2015; pp. 1098–1105.
16. Rueda, J.L.; Erlich, I. Testing MVMO on learning-based real-parameter single objective benchmarkoptimization problems. In Proceedings of the 2015 IEEE Congress on Evolutionary Computation (CEC),Sendai, Japan, 25–28 May 2015.
17. Wesche, T.A.; Goertler, C.M.; Hubert, W.A. Modified habitat suitability index model for brown trout insoutheastern Wyoming. N. Am. J. Fish. Manag. 1987, 7, 232–237.
18. Hanski, I.; Gilpin, M.E. Metapopulation Biology; Academic Press: Waltham, MA, USA, 1997.19. Liang, J.; Qu, B.; Suganthan, P.; Chen, Q. Problem Definitions and Evaluation Criteria for the
CEC 2015 Competition on Learning-Based Real-Parameter Single Objective Optimization; Technical Report201411A; Computational Intelligence Laboratory, Zhengzhou University: Zhengzhou, China; NanyangTechnological University: Singapore, 2014.
20. Tanabe, R.; Fukunaga, A. Success-history based parameter adaptation for differential evolution.In Proceedings of the 2013 IEEE Congress on Evolutionary Computation, Cancun, Mexico, 20–23 June 2013;pp. 71–78.
21. Tanabe, R.; Fukunaga, A. Evaluating the performance of SHADE on CEC 2013 benchmark problems.In Proceedings of the 2013 IEEE Congress on Evolutionary Computation, Cancun, Mexico, 20–23 June 2013;pp. 1952–1959.
22. Tanabe, R.; Fukunaga, A.S. Improving the search performance of SHADE using linear population sizereduction. In Proceedings of the 2014 IEEE Congress on Evolutionary Computation (CEC), Beijing, China,6–11 July 2014; pp. 1658–1665.
23. Guo, S.M.; Yang, C.C. Enhancing differential evolution utilizing eigenvector-based crossover operator.IEEE Trans. Evol. Comput. 2015, 19, 31–49.
24. Guo, S.M.; Yang, C.C.; Hsu, P.H.; Tsai, J.S.H. Improving Differencial Evolution with a Successful ParentSelecting Framework. IEEE Trans. Evol. Comput. 2015, 19, 717–730.
25. Zhang, J.; Sanderson, A.C. JADE: adaptive differential evolution with optional external archive. IEEE Trans.Evol. Comput. 2009, 13, 945–958.
26. Holland, J.H. Building blocks, cohort genetic algorithms, and hyperplane-defined functions. Evol. Comput.2000, 8, 373–391.

ISPRS Int. J. Geo-Inf. 2016, 5, 129 14 of 14
27. Booker, L.B.; Goldberg, D.E.; Holland, J.H. Classifier systems and genetic algorithms. Artif. Intell. 1989,40, 235–282.
28. Kennedy, J. Particle swarm optimization. In Encyclopedia of machine learning; Springer: New York, NY, USA,2011; pp. 760–766.
29. Shi, Y.; Eberhart, R. A modified particle swarm optimizer. In Proceedings of the 1998 IEEE InternationalConference on Evolutionary Computation, Anchorage, AK, USA, 4–9 May 1998; pp. 69–73.
30. Reynolds, R.G. An introduction to cultural algorithms. In Proceedings of the Third Annual Conference onEvolutionary Programming, Singapore, 24–26 February 19949.
c© 2016 by the authors; licensee MDPI, Basel, Switzerland. This article is an open accessarticle distributed under the terms and conditions of the Creative Commons Attribution(CC-BY) license (http://creativecommons.org/licenses/by/4.0/).
Copyright © 2022 FDOKUMEN