Biogeography and Diversification of Neotropical Costaceae
186
Federal University of Rio de Janeiro Biodiversity and Evolutionary Biology Graduate Program Biogeography and Diversification of Neotropical Costaceae Thiago José de Carvalho André A thesis submitted to the Biodiversity and Evolutionary Biology Graduate Program of the Federal University of Rio de Janeiro in partial fulfillment of the requirements for the degree of Doctor in Biodiversity and Evolutionary Biology. Advisor: Dr Tânia Wendt Co-Advisor: Dr Clarisse Palma-Silva Co-Advisor: Dr Chelsea Specht Rio de Janeiro February 2015
-
Upload
khangminh22 -
Category
Documents
-
view
0 -
download
0
Transcript of Biogeography and Diversification of Neotropical Costaceae

Federal University of Rio de Janeiro
Biodiversity and Evolutionary Biology Graduate Program
Biogeography and Diversification of
Neotropical Costaceae
Thiago José de Carvalho André
A thesis submitted to the Biodiversity
and Evolutionary Biology Graduate
Program of the Federal University of
Rio de Janeiro in partial fulfillment of
the requirements for the degree of
Doctor in Biodiversity and
Evolutionary Biology.
Advisor: Dr Tânia Wendt
Co-Advisor: Dr Clarisse Palma-Silva
Co-Advisor: Dr Chelsea Specht
Rio de Janeiro
February 2015
Federal University of Rio de Janeiro
Biodiversity and Evolutionary Biology Graduate Program
Biogeography and Diversification of Neotropical Costaceae
Thiago José de Carvalho André
A thesis submitted to the Biodiversity and Evolutionary Biology Graduate Program of the
Federal University of Rio de Janeiro in partial fulfillment of the requirements for the
degree of Doctor in Biodiversity and Evolutionary Biology.
Approved by:
Dr Carlos Eduardo Guerra Schrago
Universidade Federal do Rio de Janeiro (UFRJ)
Dr Catarina da Fonseca Lira de Medeiros
Jardim Botânico do Rio de Janeiro (JBRJ)
Dr Evandro Marsola de Moraes
Universidade Federal de São Carlos (UFSCAR)
Dr Fábio Pinheiro
Universidade Estadual Paulista, Campus de Rio Claro (UNESP)
Dr José Ricardo Miras Mermudes
Universidade Federal do Rio de Janeiro (UFRJ)
Rio de Janeiro (RJ), February 2015!
! iii!
!
André, Thiago José de Carvalho
Biogeography and Diversification of Neotropical
Costaceae / Thiago José de Carvalho André – Rio de
Janeiro: UFRJ, 2015.
168 p.: il.; 29,7 cm.
Advisor: Dr Tânia Wendt; Co-Advisor: Dr Clarisse
Palma-Silva; Co-Advisor: Dr Chelsea Specht
Doctoral Thesis – UFRJ / Biodiversity and Evolutionary
Biology Graduate Program, 2015.
1. Evolutionary Biology. 2. Biogeography. 3. Plant
Speciation.
4. Phylogenetic Systematics. 5. Costaceae.
I. Title. II. Thesis
!

! iv!
para Amanda Mortati
! v!
“Claridade quente da manhã vaidosa.
O sol deve ter posto lente nova,
e areou todas as manchas,
para esperdiçar luz.
Dez esquadrilhas de periquitos verdes
receberam ordem de partida,
deixando para as araras cor de fogo,
o pequizeiro morto.
E a árvore, esgalhada e seca, se faz verde,
vermelha e castanha, entre os
mochoqueiros,
braúnas, jatobás e imbaúbas do morro,
na paisagem que um pintor daltônico
pincelou no dorso de um camaleão.
E o lombo da serra é tão bonito e claro,
que até uma coruja,
tonta e míope na luz,
com grandes óculos redondos,
fica trepada no cupim, o dia inteiro,
imóvel e encolhida, admirando as cores,
fatigada, talvez, de tanta erudição…”
João Guimarães Rosa
In Magma (1936)

! vi!
Agradecimentos / Acknowledgements
Este trabalho é fruto de muitas colaborações que só foram possíveis pela imensa
confiaça e maravilhosa orientação que recebi de Tânia Wendt, Clarisse Palma-Silva e
Chelsea Specht. Muito obrigado!
This is the result of much collaborative work only possible through the huge trust and
awesome guidance I received from Tânia Wendt, Clarisse Palma-Silva and Chelsea Specht.
Thank you very much!
Agradeço:
à CAPES pelas bolsas, de doutorado e de estágio de doutorado sanduíche no
exterior;
à banca de defesa de tese e à banca de exame de qualificação por terem avaliado
este trabalho e pelas valiosas contribuições;
aos professores e técnico do Programa de Pós Graduação em Biodiversidade e
Biologia Evolutiva da UFRJ, em especial à coordenadora Michelle Klatau;
à tantas pessoas e instituições que me auxiliaram nas expedições de campo, no
Amazonas, Pará, Mato Grosso, Amapá, Acre, Rondônia, Goiás, Tocantins, Minas Gerais,
Bahia e Espírito Santo;
aos curadores e equipe técnica das coleções botânicas: do Jardim Botânico do Rio
de Janeiro, do Museu Nacional do Rio de Janeiro, do Instituto de Pesquisas Científicas e
Tecnológicas do Amapá, Jardim Botânico de Brasília, Empresa Brasileira de Pesquisa
Agropecuária, EMPRAPA Amazônia Oriental de Belém, Instituto Brasileiro de Geografia e
Estatística em Brasília, Instituto Nacional de Pesquisas da Amazônia, Museu Paraense
Emílio Goeldi, Universidade de Brasília, Universidade Federal do Acre em Rio Branco,
Universidade Federal de Goiás em Goiânia, e Universidade Federal de Uberlândia;

! vii!
aos pesquisadores, alunos e técnicos do Instituto de Botânica de São Paulo, em
especial ao Rafael, Cecília e Rodrigo;
aos colegas do Laboratório de Sistemática Vegetal da UFRJ, Thiago Coser e
Cristiano Lira;
à minha família - os Carvalho, os Mortati e a Berenice também, claro! - que sempre
me apoiou e incansavelmente torceu com muito amor pelo meu sucesso, em especial aos
meus pais, Rita de Cássia de Carvalho André e Washington Luiz André (in memoriam);
à minha amada e linda esposa, Amanda Mortati: por tudo tudo tudo!
Many thanks to:
the Specht lab: Shayla Salzman, Roxana Yochteng, Chodon Sass, Stephen Yee,
Ana Almeida, Grady Pierroz, Jared Nathanson, Maria Eduarda Maldaner, Kelsie Morioka,
Gracie Benson-Martin, Colin Hill, Susan Hepp, Alma Pineyro Nelson, Riva Bruenn, and of
course, Chelsea Specht and her beautiful view from the bay. I learned so much from each
and every one of you… we really are the champions;
the Evolutionary Genetics Lab of the Museum of Vertebrate Zoology, especially the
amazing Lydia Smith;
staff and curators of US herbaria: the Jepson and University Herbaria at UC
Berekely, the Missouri Botanical Garden, the New York Botanical Garden, and Harvard
Herbaria;
Paul Maas and Dave Skinner, for sharing amazing knowledge on Costaceae;
David Bloom, Rob Guralnick and Michele Koo for help with potential distribution
models; Nick Matzke and Dan Rabosky for helping and teaching me how to run their
amazing analytical softwares; Rasmus Nielsen, Monty Slatkin and Patrick O’Grady for
allowing me to learn from their perfect classes at UC Berkeley, and for unvaluable advices;
staff from the University of California at Berkeley, especially from the Plant and
Microbial Biology Department and the International Office.

! viii!
Summary
Abstract…………………………………………………………………………………...…………xvi
Resumo…………………………………………………………………………………...………...xvii
Chapter 1. Introduction: Speciation in Neotropical Costaceae ………..………………………..1
Chapter 2 – Spatiotemporal dynamics of speciation in Neotropical Costaceae…….……….15
2.1. Introduction…………………………………………………………………….………17
2.2. Methods………………………………………………………………………...…...…21
2.3. Results……………………………………………………………………….…………25
2.4. Discussion……………………………………………………………………...………34
2.5. Acknowledgements…………………………………………………………………...38
2.6. References…………………………………………………………………..………...38
Chapter 3 – Spiraling into history: A molecular phylogeny and investigation of biogeographic
origins and floral evolution for the genus Costus...……………………………………………...51
3.1. Introduction………………………………………………………………….…………53
3.2. Methods………………………………………………………………………...……...58
3.3. Results………………………………………………………………………….………65
3.4. Discussion……………………………………………………………………...………80
3.5. Acknowledgments……………………………………………………………..……...84
3.6. References……………………………………………………………………..……...84
Chapter 4 – Evolution of species diversity in the genus Chamaecostus (Costaceae):
molecular phylogenetics and morphometric approaches.......................................................90
4.1. Introduction……………………………………………………………….……………92
4.2. Methods……………………………………………………………………...………...96
4.3. Results……………………………………………………………………………….…99
4.4. Discussion……………………………………………………………………..…..…105
4.5. Taxonomy……………….…………………………………………………...…….…109
4.6. Acknowledgments…………………………………………………………..….……114
4.7. References……………………………………………………………………...……114
! ix!
Chapter 5 – Speciation in the South American dry understory: lessons from Chamaecostus
(Costaceae, Zingiberales)………………………………………………………………………...120
5.1. Introduction…………………………………………………………………….…..…122
5.2. Methods………………………………………………………………………...….…125
5.3. Results………………………………………………………………………….….…134
5.4. Discussion……………………………………………………………………...….…143
5.5. Acknowledgments……………………………………………………………..….…147
5.6. References……………………………………………………………………..….…147
Chapter 6 – Final remarks……………………………………………………………………..…160
Appendix 1………………………………………………………………………………..………..163
Appendix 2…………………………………………………………………………………..……..166

! x!
List of Figures
Chapter 1. Speciation in Neotropical Costaceae: where are we?
Figure 1. From upper left to bottom right: Monocostus uniflorus K.Schum.; Costus L.
stem showing spiromonistichous ligulate leaves with a closed sheath; Chamaecostus
lanceolatus (Petersen) C.D.Specht & D.W.Stev.; Dimerocostus strobilaceus Kuntze;
Costus ligularis Baker; Tapeinochilos ananassae K. Schum.; Costus L. inflorescence
and fruits…………………......……………..….……………………………………………….4
Figure 2. From upper left to bottom right: Costus spiralis (Jacq.) Roscoe; Costus
arabicus L.; Chamaecostus lanceolatus (Petersen) C.D.Specht & D.W.Stev. flower,
calyx, bract, bracteole and petals; Costus pulverulentus C. Presl; Costus arabicus L.
petaloid stamen and pistil; Chamaecostus subsessilis (Nees & Mart.) C.D.Specht &
D.W.Stev. flower……………………………………………………………………………….5
Chapter 2 – Spatiotemporal dynamics of speciation in Neotropical Costaceae
Figure 1. Maximum clade credibility tree estimated from 1,000 trees. Numbers above
branches refer to posterior probabilities, and numbers at right of nodes are age
estimates in million years. Blue bars denote node height probability density at 95%.
Lower scale in million years before present.………...……………………….……………26
Figure 2. Top: (A) Biogeographical analysis of Costaceae using BioGeoBEARS. (B)
Phylorate plots for speciation rate using BAMM; colors at each point in time along
branches denote instantaneous speciation rates, with warmer colors referring to faster
rates; two distinct shift configurations account for most of the posterior probability of
the data with the dark dot indicating the node of the single shift in configuration.
Bottom: Geographic areas included in biogeographic analysis: ! Central America and
the Caribbean, ! Amazonian, ! Andean, ! Central Brazilian Plateau and Atlantic
Rainforests, ! Africa, ! Asia and Oceania. Outgroups are not shown. Central images
show representative Costaceae (top-down): Costus scaber Ruiz & Pav., Costus
arabicus L., Costus ligularis Baker, Chamaecostus lanceolatus (Petersen) C.D. Specht
& D.W. Stev.; C. ligularis photograph by C.Specht, all others by T.André……………..28

! xi!
Figure 3. Speciation rates comparison within Costaceae phylogeny. Color bar and
squares indicate proportion of similarity between rates. Colors at each point in time
along branches of the phylogeny denote instantaneous speciation rates. Outgroup rate
is underestimated due to limited sampling of outgroup clades………………………….30
Figure 4. Top: Degree of sympatry by node age for (A) the South American clade and
(B) the Neotropical Costus clade. Bottom: Maps showing examples of recovered
potential current distributions superimposed for one selected clade from
Chamaecostus (A) and Costus (B)………………………………………………..……32-33
Chapter 3 – Spiraling into history: A molecular phylogeny and investigation of biogeographic
origins and floral evolution for the genus Costus
Figure 1. Representative photos of Neotropical Costus species. (A) Costus
guanaiensis Rusby var. guanaiensis showing the melittophilous morphology. (B)
Costus comosus and (C) Costus scaber showing the ornithophilous morphology.
Photos by C. D. Specht....………………………………………………………………...…55
Figure 2. Maximum likelihood hypothesis for Neotropical Costus. ML cladogram (with
support values) showing character state reconstruction data and phylogram (with
branch lengths) for the concatenated alignment of ITS, ETS, CaM, rps16, and trnL-F
using TIM3 with gamma distribution and log likelihood score of -23,944. Support values
at nodes are Bayesian posterior probabilities, ML, and MP bootstrap proportions.
Nodes supported by a PAUP* strict consensus of 707,000 most parsimonious trees are
shown in bold with 50% consensus in bold grey. Distributions were obtained from
herbaria records housed in the Global Biodiversity Information Facility. Ecoregions are
based on the World Wildlife Fund’s ecoregion designations (Olsen et al. 2001).
Ancestral distribution for the Neotropical clade indicated (Pacific Coast of Mexico and
Central America) based on S-DIVA and MCMC algorithms implemented in RASP. ML
reconstructions performed in Mesquite and BayesTraits are indicated: shifts to
ornithophilous morphology are denoted with hummingbirds and shifts to melittophilous
morphology denoted with bees. Extant pollination syndromes are denoted with
hummingbirds or bees at tips……………………………………………………………..…67
Figure 3. Reconstruction of ancestral character states for morphology-based pollination
syndrome on ML tree. Generalist, melittophilous and ornithophilous morphologies are
! xii!
indicated with likelihood support values from Mesquite and BayesTraits and posterior
probabilities from BayesTraits………………………………………………………………72
Figure 4. Reconstruction of ancestral character states for morphology-based pollination
syndrome on Bayesian tree. Generalist, melittophilous, and ornithophilous
morphologies are indicated with likelihood support values from Mesquite and
BayesTraits and posterior probabilities from BayesTraits………………………………..73
Chapter 4 – Evolution of species diversity in the genus Chamaecostus (Costaceae):
molecular phylogenetics and morphometric approaches
Figure 1. Schematic representation of measured morphometric variables; LL – Leaf
Length, LW – Leaf Maximum Width, AA – Apex Angle, BA – Base
Angle.………………………………………………...........................................................98
Figure 2. A – Phylogenetic relationships within Chamaecostus (Costaceae). Support
values above branches are Bayesian Posterior Probabilities, while Most Likely
Bootstrap proportions from 1,000 bootstrap replicates are found below branches; B –
Geographic ranges of the Chamaecostus cuspidatus (blue), and Chamaecostus
subsessilis complex: subsessilis clade (orange) and acaulis clade (green). Dashed
lines denote tentative range limits, and the continuous grey line identifies the Araguaia
River……………………………………………………………………………………….…100
Figure 3. Box and whisker plots of three significantly different morphometric variables
between Chamaecostus cuspidatus (n=14), Chamaecostus subsessilis s.str. (n=51)
and Chamaecostus acaulis comb. nov. (n=83), showing means, quartiles and ranges.
A – Leaf length (cm); B – Leaf Maximum Width (cm); C – Leaf Area (cm2)……….…104
Figure 4. Chamaecostus acaulis comb. nov. and Chamaecostus subsessilis s.str.. (B)
photo by W.W.Thomas. (D) photo by D.Skinner……………………………………...…111

! xiii!
Chapter 5 – Speciation in the South American dry understory: lessons from Chamaecostus
(Costaceae, Zingiberales)
Figure 1. Locations of the seventeen sampled sites of Chamaecostus subsessilis (MG,
JA, DF, TG, TO, PK) and C. acaulis (UB, PA, GO, MT, NX, AF, TS, CS, RO, PM, AC).
Topographic variation is shown in the background, with green lowlands.……………126
Figure 2. Relationships of individuals based on the nuclear DNA concatenated
alignment of Chamaecostus subsessilis and C. acaulis.. Maximum Clade Credibility
phylogeny is shown at top, with posterior probabilities of each node shown. The bottom
of the figure shows Bayesian admixture proportions (Q) of individual estimated by
STRUCTURE, assuming K = 7……………………………………………………………137
Figure 3. Relationships of individuals based on the plastid DNA concatenated
alignment. Maximum Clade Credibility phylogeny is shown at top, with posterior
probabilities of each node shown. The bottom of the figure shows Bayesian admixture
proportions (Q) of individual estimated by STRUCTURE, assuming K = 8…………..138

! xiv!
List of Tables
Chapter 3 – Spiraling into history: A molecular phylogeny and investigation of biogeographic
origins and floral evolution for the genus Costus
Table 1. Primer pairs and annealing temperatures used in this study. Primers were
used for both amplification and sequencing....…………………………….………………60
Table 2. Character values and models of evolution for each marker and the
concatenated alignment…………………………………………………………………..…62
Table 3. BayesTraits ML probabilities, Bayesian posterior probabilities, and their
support values at each node tested for ancestral pollination reconstruction using the
ML tree. Nodes supported as having ancestral hummingbird pollination morphology are
underlined……………………………………………………………………………………..75
Table 4. BayesTraits ML probabilities, Bayesian posterior probabilities, and their
support values at each node tested for ancestral state reconstruction of pollination
syndrome using the Bayesian topology. Nodes supported as having ancestral
hummingbird pollination syndrome morphology are underlined…………………………77
Chapter 4 – Evolution of species diversity in the genus Chamaecostus (Costaceae):
molecular phylogenetics and morphometric approaches
Table 1. Morphometric variables tested for diagnose between Chamaecostus
cuspidatus and the Chamaecostus subsessilis complex. Means ± standard deviations;
different letters are indicative of statistical significance (p<0.05; t-test), and F-values
and probabilities of ANOVA are given. Bold values refer to variables that are
significantly different between all three species.…………………………………..........103
Chapter 5 – Speciation in the South American dry understory: lessons from Chamaecostus
(Costaceae, Zingiberales)
Table 1. Name and location of sampled Chamaecostus subsessilis and C. acaulis
populations and respective number of sequences obtained for plastid and nuclear
markers.……………………………………………………………………………..............127
! xv!
Table 2. Outgroup taxa and respective approximate time (Ma) to the most recent
common ancestor with Chamaecostus subsessilis (Nees & Mart.) C.D.Specht &
D.W.Stev……………………………………………………………………………………..128
Table 3. Character values, number of haplotypes, and models of evolution for each
plastid (cp) and nuclear (nr) DNA marker and the concatenated alignments of
Chamaecostus subsessilis and C. acaulis……………………………………….…130-131
Table 4. Parameters for selecting optimal partioning structure. Calculated for plastid
(cp) and nuclear (nr) DNA concatenated alignments of Chamaecostus subsessilis and
C. acaulis. K: Number of population clusters. Likelihood scores for each value of K
genetic clusters from STRUCTURE (Pritchard et al. 2000), Delta K scores for each
value of K genetic clusters following Evanno et al. (2005)……………………………..136
Table 5. Pairwise FST between populations*. Plastid (cp, below diagonal) and nuclear
(nr, above diagonal) DNA concatenated alignments considered individually, of
Chamaecostus subsessilis and C. acaulis**…………………………………………..…139
Table 6. Population molecular diversity. Plastid (cp) and nuclear (nr) DNA
concatenated alignments considered independently……………………………………141

! xvi!
Abstract
The pantropical family of spiral gingers (Costaceae Nakai, Zingiberales) has six genera
comprising about 125 species, distributed primarily in Tropical America, Western Africa,
Southeast Asia and Papuasia-Australia. Here, main aim is to examine spatiotemporal
patterns and processes of speciation in Neotropical Costaceae. A robust dated molecular
phylogeny with most current species reveals a significant variation in speciation rate among
clades. Sympatric processes were likely running Costus radiation in the Neotropics, which
currently comprises nearly half of total familial species richness. Neotropical Costus exhibit
an evolutionary toggle in pollination morphologies, demonstrated by both the multiple
independent evolutions of ornithophily as well as reversals to melittophily. In the Neotropics,
besides Costus, another Costaceae lineage can be found: a small, early divergent clade
endemic to South America (consisting of Monocostus, Dimerocostus and Chamaecostus).
Phylogenetic results show that while Chamaecostus is strongly monophyletic,
Chamaecostus cuspidatus is found to be sister to a clade of some but not all samples of
Chamaecostus subsessilis, making it necessary to acknowledge more than one species in
the Chamaecostus subsessilis complex. Within these lineages there is a deep
phylogeographic structure, recovered at both the population and species level, as inferred
from fixation indices, structure analysis and phylogenetics considered after targeted
hightroughput sequencing by capture using PCR-generated probes. Spatiotemporal patterns
of diversification suggested a divergence between Eastern and Western lineages in the
Eocene. Results uphold Costaceae as an emergening strategic family to understand
speciation patterns and processes in Tropical landscapes.

! xvii!
Resumo
A família botânica das canas-do-brejo ou canas-de-macaco (Costaceae Nakai, Zingiberales)
apresenta distribuição pantropical de seis gêneros compreendendo cerca de 125 espécies,
distribuídas primordialmente na América Tropical, no Oeste da África, no Sudoeste da Ásia
e na Papuásia-Austrália. Aqui, o objetivo prinicipal é examinar os padrões e processos
espaciais e temporais da especiação em Costaceae Neotropicais. Uma filogenia molecular
robusta e datada com ampla maioria das espécies atuais suporta uma varição significantiva
na taxa de especiação entre clados. Processos simpátricos provavelmente levaram à
radiação de Costus na região Neotropical, que compreende praticamente à metade da
riqueza de espécies da família. O clado dos Costus Neotropicais exibe uma alternância
evolutiva na morfologia relacionada à polinização, evidenciado tanto pelas múltiplas origens
independentes da ornitofilia como por reversões à melitofilia. Nos Neotrópicos, além de
Costus, outra linhagem de Costaceae pode ser encontrada: um pequeno clado de
divergência inicial, amplamente endêmico à América do Sul (consistindo em Monocostus,
Dimerocostus e Chamaecostus). Resultados filogenéticos demonstram que, enquanto
Chamaecostus é fortemente monofilético, Chamaecostus cuspidatus é determinado como
clado irmão a algumas mas não todas amostras de Chamaecostus subsessilis, fazendo
necessário o reconhecimento de mais de uma espécie no complexo. Entre essas linhagens
há uma profunda estrutura filogeográfica, revelada tanto na escala populacional quanto
específica, e inferida a partir de índices de fixação, análise de estrutura genética e análise
filogenética, a partir de sequenciamento hightroughput direcionado pelo método de captura
utilizando iscas geradas por PCR. Padrões espaciais e temporais de diversificação sugerem
divergência entre uma linhagem Leste e uma Oeste, durante o Eoceno. Resultados
suportam Costaceae como uma família estratégica emergente para o entendimento de
padrões e processos relacionados à especiação em paisagens tropicais.

! xviii!

!!
! 1!
Chapter 1 – Introduction: Speciation in Neotropical Costaceae

!!
! 2!
The pantropical family of spiral gingers (Costaceae Nakai, Zingiberales) has six genera
comprising about 125 species, distributed primarily in Tropical America, Western Africa,
Southeast Asia and Papuasia-Australia. Spiral gingers can be easily recognised vegetatively
due to their spiromonistichous phyllotaxy and ligulate leaves with a sheath that fully encloses
the stem (Figure 1). Typically, spiral shoots terminate in a condensed, bracteate
inflorescence, from which typically a single fertile flower emerges each day (Stiles 1978;
Schemske 1983; Kay & Schemske 2003). Inflorescences are typically dense, spicate-
capitate, bearing large bracts that are often brightly colored, with or without appendages.
Inflorescence bracts often have extrafloral nectaries (callus) that are visited by ants. In most
species, each inflorescence bract subtends a single axillary flower. Flowers are
monosymmetric with a large labellum comprised from the fusion of five infertile, laminar
staminodes. A single fertile stamen is also petaloid and often blocks entry to the floral tube
and access of pollinators to basal nectaries. The style is very thin and thread-like and is
supported between the two halves (thecae) of the large anther (Figure 2). The stigma in
most species has a protrusion below the stigmatic surface that attaches the stigma to the
fertile thecae and positions the receptive surface above the pollen (Figure 2). Flowers are
unscented and diurnal, producing copious nectar during the hours in which they are open
(Stiles 1978, 1981). There are two to four rows of ovules, and the endosperm is oily
(Panchaksharappa 1963, Tomlinson 1969, Grootjen & Bouman 1981, Kirchoff 1988,
Newman & Kirchoff 1992, Larsen et al. 1998).
All flowers of Costaceae have a tubular labellum comprised of five fused petaloid
staminodes that can be white, yellow, red or orange in color. The labellum may be either
short and broad with a distinct limb bearing red, purple, or yellow stripes and a UV
absorptive ‘landing platform’; or it can form a narrow tube that is largely contained within the
petals (no limb) and lacking in stripes or patterning (Figures 1 and 2). These two
morphologies have been reported to associate with different pollination syndromes,
attracting bees and hummingbirds, respectively. Specht et al. (2001) additionally indicates a

!!
! 3!
generalist pollination syndrome, referencing taxa with a broad broad labellum such as
Chamaecostus subsessilis (Nees & Mart.) C.D.Specht & D.W.Stev., Monocostus uniflorus
(Poepp. ex Petersen) Maas and Dimerocostus strobilaceus Kuntze (Figure 1).

!!
! 4!
Figure 1. From upper left to bottom right: Monocostus uniflorus K.Schum.; Costus L. stem
showing spiromonistichous ligulate leaves with a closed sheath; Chamaecostus lanceolatus
(Petersen) C.D.Specht & D.W.Stev.; Dimerocostus strobilaceus Kuntze; Costus ligularis
Baker; Tapeinochilos ananassae K. Schum.; Costus L. inflorescence and fruits.

!!
! 5!
Figure 2. From upper left to bottom right: Costus spiralis (Jacq.) Roscoe; Costus arabicus L.;
Chamaecostus lanceolatus (Petersen) C.D.Specht & D.W.Stev. flower, calyx, bract,
bracteole and petals; Costus pulverulentus C. Presl; Costus arabicus L. petaloid stamen and
pistil; Chamaecostus subsessilis (Nees & Mart.) C.D.Specht & D.W.Stev flower.

!!
! 6!
In a study on the pollination guilds and variation in floral characteristics of Bornean
gingers (Zingiberaceae and Costaceae), Sakai et al. (1999) verified a limited number of
pollination guilds and low pollinator species diversity, implying that those species of plants
may have evolved without segregating pollinators in each pollination guild. Kay & Schemske
(2003) systematically investigated pollinator relationships in Neotropical Costus L. by
studying 11 species from different sites in Bolivia, Costa Rica and Panama. They
documented visitation rates and pollinator assemblages among a variety of habitats, and
uncovered minimal spatial and temporal variation in visitation rates and pollinator identities.
Pollinator specificity was found to contribute strongly to reproductive isolation for sympatric
species differing in pollination syndrome. Araújo & Oliveira (2007) studied the floral biology
of Costus spiralis (Jacq.) Roscoe and its mechanisms to avoid self-pollination in a gallery
forest of Uberlândia (MG), Brazil. They found that this species is self-compatible but does
not present spontaneous self-pollination, exhibiting movement herkogamy. Verified
pollinators were Phaethornithinae hummingbirds. They found no difference between
germination rates of seeds from self-pollination and cross-pollination, but the seeds
produced from natural fruit-set presented significantly higher germination rates than those
from hand pollination treatments, endorsing the effectiveness and importance of
hummingbirds as pollen vectors for C. spiralis.
On interspecific reproductive barriers, Kathleen Kay’s research group has repetedly
demonstrated (Kay 2006, Kay & Schemske 2008, Yost & Kay 2009, Surget-Groba & Kay
2013) effective reproductive isolation between two closely related hummingbird-pollinated
Costus species: C. pulverulentus C.Presl and C. scaber Ruiz & Pav. Kay (2006) found
evidence of significant prezygotic and evidence of postzygotic isolation, suggesting that
ecological factors, including habitat use and plant-pollinator interactions, may contribute to
speciation in these plants. Kay & Schemske (2008) verified a lower seed set due to pollen-
pistil incompatibility between species pairs that co-occur and experience pollen transfer in
nature compared to species pairs that are otherwise isolated, regardless of genetic distance.
Yost & Kay (2009) review empirical studies of postpollination reproductive isolation in

!!
! 7!
Costus, summarizing isolation due to parental style length differences. They also show that
reduced pollen adhesion, germination, and pollen tube growth contribute to reproductive
isolation between closely related sympatric species, with further geographic separation of
species correlating with greater variation in the strength of these pre-zygotic barriers. More
recently, Surget-Groba & Kay (2013) genotyped microsatellite markers from locations along
the geographical range of both C. scaber and C. pulverulentus, including sympatric sites,
and found high levels of genetic isolation among populations within each species and low
but detectable levels of introgression between species at sympatric sites. These studies
imply that crossing barriers prevent potential hybridization and effectively reinforce the
speciation process.
Specht et al. (2001) presented the first detailed investigation into intrageneric and
interspecific evolutionary relationships within the family Costaceae, based on molecular
markers. Some novel evolutionary trends with respect to floral morphology were proposed
based on that phylogenetic analysis. Phylogenetic results clearly demonstrate that the two
pollination syndromes characterized for Neotropical Costus, ornithophilus and melittophilus
(Maas 1972), display a significant amount of homoplasy, suggesting that transitions between
the two floral forms has been a common event throughout the evolutionary history of this
lineage, and potentially characterize responses to ecological or environmental factors such
as pollinator availability or efficacy. Additionally, the genus Costus was found to be
polyphyletic with respect to genera Tapeinochilos Miq., Dimerocostus and Monocostus.
Later, Specht (2006a) provided a more detailed phylogeny of the family including more
taxonomic units and additional molecular markers. Kay et al. (2005) also estimated
phylogenetic relationships within this family, with sampling focused on reconstructing
biogeographic and pollination history of Costus subgenus Costus Loes (see Maas 1972).
Specht & Stevenson (2006) proposed a generic revision based on these phylogenetic
results. They divided Costus into four genera which largely reflected previous subgeneric
divisions of Costus; Costus L. sensu stricto, Cheilocostus C.D.Specht, Chamaecostus
C.D.Specht & D.W.Stev., and Paracostus C.D.Specht. Cheilocostus was recently shown to

!!
! 8!
be a replacement name for Banksea J.Koenig, which in turn had already been replaced in
1791 by Retzius as Hellenia Retzius (Govaerts 2013). Consequently, species placed in
Cheilocostus are now included in Hellenia. Hellenia is sister to Tapeinochilos Miq., forming
together an Asian-Australian clade. The South American Chamaecostus genus comprises
species previously placed in Costus subgen. Cadalvena (Fenzl) Schumann. These species
are a group of low or diminutive plants, occasionally acaulescent rosettes that do not usually
reach 1m in height. This clade was shown to be sister to the Neotropical Monocostus
K.Schum. + Dimerocostus Kuntze clade in Specht (2006a).
Specht (2006b) tested the hypothesis of an ancient Gondwanan distribution followed
by vicariance via continental drift as the leading cause of the current pantropical distribution
of Costaceae, using a strict clock molecular dating technique of cladogenic events combined
with phylogeny-based dispersal-vicariance biogeographic analyses. Results dated initial
Costaceae diversification to be at least ca. 65 million years, long after the final break up of
the Gondwanan supercontinent, implying Neotropical Costus to have arrived from a long
distance dispersal event of an African ancestral taxon. Kay et al. (2005) calibrated an ITS-
based molecular clock for Neotropical Costus and suggested that diversification of this clade
was recent and rapid, presenting a hypothetical scenario of rapid floral adaptation in
geographic isolation with range shifts in response to environmental changes.
Over 40 species of fossils have been identified as pertaining to the Zingiberales,
comprising a record that extends from the Cretaceous to Pliocene (Berry 1921a, 1921b,
1925, Reid & Chandler 1926, Hickey & Peterson 1978, Friis 1988, Boyd 1992, Manchester &
Kress 1993). However, lack of detailed data on extant and fossil morphology inhibits
confidently determining familial affiliations of many taxa (Smith et al. 2013). Moreover, pollen
- an important source of historical information - lacks an exine in Zingiberales (Kress et al.
1978), impeding efficient fossilization. Nevertheless, there are at least two potential
Costaceae fossils available (J.Benedict pers. comm.): a leaf fossil from the Eocene of Great
Britain (Reid & Chandler 1926) and a stem cast/mold from the Miocene of Trinidad (Berry
1925). The use of these fossils for calibrating phylogenies could help advance our
!!
! 9!
understanding of diversification patterns within Costaceae, although with appropriate caution
given uncertainty in taxonomic affinity (Drummond et al. 2006, Sanders & Lee 2007).
Spiral gingers can be found in many habitats, from Cerrado to Várzeas, and they are
an important element of the understory in Neotropical forests (Drucker et al. 2008,
Figueiredo 2008). Several important evolutionary processes in the family were previously
acknowledged by aformentioned research, such as the importance of prezygotic isolation in
sympatric speciation and the young age of Neotropical taxa indicating rapid diversification.
However, a comprehensive analysis of their biogeographic history using appropriate dating
techniques that take advantage of available fossil calibration within a relaxed molecular clock
approach will help address the spatiotemporal patterns of diversification, both between and
within species, during Costaceae evolution, which are accomplished throughout this thesis.
Main aims of this thesis are: to examine the geographic context of speciation in
Neotropical Costaceae lineages by using diversification analyses and biogeographical
reconstructions through a robust dated molecular phylogeny (CHAPTER 2); to investigate
shifts in pollination syndrome within the Costus clade, with the intention of addressing
potential mechanisms leading to the rapid radiation (CHAPTER 3); to explore the
phylogenetic relationships of species in the Chamaecostus lineage and interpret
evolutionary trends across the entire genus based on a molecular character-based
phylogenetic hypothesis that includes all currently described species of Chamaecostus
(CHAPTER 4); and to examine speciation of Chamaecostus populations from South
American seasonally dry forests of Cerrado and South Amazonia, by estimating
phylogeographic pattern and timing of diversification (CHAPTER 5). A final remarks text
further support major findings (CHAPTER 6). The thesis is presented in the form of scientific
manuscripts. Systematic Botany recently accepted the third chapter for publication, and the
version presented here already features suggestions from anonymous reviewers, and the
fourth chapter was already submitted to Phytoaxa.
!!
! 10!
References
Araújo FP, Oliveira PE. 2007. Biologia floral de Costus spiralis (Jacq.) Roscoe (Costaceae)
e mecanismos para evitar a autopolinização. Revista Brasileira de Botânica 30: 61-70.
Berry EW. 1921a. Tertiary plants from Venezuela. Proceedings of the US National Museum
59: 553-579.
Berry EW. 1921b. Tertiary plants from Costa Rica. Proceedings of the US National Museum
59: 169-185.
Berry EW. 1925. A banana in the Tertiary of Colombia. American Journal of Science. 10:
530-537.
Boyd A. 1992. Musopsis n. gen.: a banana-like leaf genus from the early Tertiary of eastern
North Greenland. American Journal of Botany 79: 1359-1367.
Drucker DP, Costa FRC, Magnusson WE. 2008. How wide is the riparian zone of small
streams in tropical forests? A test with terrestrial herbs. Journal of Tropical Ecology 24:
65-74.
Drummond AJ, Ho SY, Phillips MJ, Rambaut A. 2006. Relaxed phylogenetics and dating
with confidence. PLoS Biol 4:e88.
Figueiredo FOG. 2008. Variação florística e diversidade de Zingiberales em florestas da
Amazônia central e setentrional. Masters Dissertation. Programa de Pós-Graduação em
Biologia Tropical e Recursos Naturais da Amazônia, Manaus, Brazil.
Friis EM. 1988. Spirematospermum chandlerae sp. nov., an extinct species of Zingiberaceae
from the North American Cretaceous. Tertiary Research 9: 7-12.
Govaerts R. 2013. Hellenia Retz., the correct name for Cheilocostus C.D.Specht
(Costaceae). Phytotaxa 151: 63-64.
!!
! 11!
Grootjen CJ, Bouman F. 1981. Development of the ovule and seed in Costus cuspidatus
(Nees & Mart.) Maas (Zingiberaceae), with special reference to the formation of the
operculum. Botanical Journal of the Linnean Society 83: 27-39.
Hickey LJ & Peterson RK.1978. Zingiberopsis, a fossil genus of the ginger family from Late
Cretaceous to early Eocene sediments of western interior North America. Canadian
Journal of Botany 56: 1136-1152.
Kay KM, Schemske DW. 2003. Pollinator Assemblages and Visitation Rates for 11 Species
of Neotropical Costus (Costaceae). Biotropica 35: 198-207.
Kay KM, Schemske DW. 2008. Natural selection reinforces speciation in a radiation of
Neotropical rainforest plants. Evolution 62: 2628-2642.
Kay KM. 2006. Reproductive isolation between two closely related hummingbird-pollinated
Neotropical gingers. Evolution 60: 538-552.
Kay KM, Reeves PA, Olmstead RG, Schemske DW. 2005. Rapid speciation and the
evolution of hummingbird pollination in Neotropical Costus subgenus Costus
(Costaceae): evidence from nrDNA ITS and ETS sequences. American Journal of
Botany 92: 1899-1910.
Kirchoff BK. 1988. Inflorescence and flower development in Costus scaber (Costaceae).
Canadian Journal of Botany 66: 339-345.
Kress WJ, Stone DE, Sellers SC. 1978. Ultrastructure of exine-less pollen: Heliconia
(Heliconiaceae). American Journal of Botany 65: 1064-1076.
Larsen K, Lock JM, Maas H, Maas PJM. 1998. Zingiberaceae. 474-495 pp, In Kubitzki K
(Ed.), The Families and Genera of Vascular Plants. IV. Flowering Plants:
Monocotyledons. Alismatanae and Commelinanae (except Gramineae). Springer, Berlin.

!!
! 12!
Manchester SR & Kress WJ. 1993. Fossil Bananas (Musaceae): Ensete oregonense sp.
nov. from the Eocene of western North America and its phytogeographic significance.
American Journal of Botany 80: 1264-1272.
Newman SWH, Kirchoff BK. 1992. Ovary structure in the Costaceae (Zingiberales).
Internatational Journal of Plant Sciences 153: 471-487.
Panchaksharappa MG. 1963. Embryological studies in the family Zingiberaceae I. Costus
speciosus Smith. Phytomorphology 12: 418-430.
Reid EM & Chandler MEJ. 1926. Catalogue of Cainozoic plants vol. 1: the Bembridge Flora.
British Museum (Natural History): London.
Sakai S, Kato M, Inoue T. 1999. Three pollination guilds and variation in floral characteristics
of Bornean gingers (Zingiberaceae and Costaceae). American Journal of Botany 86(5):
646–658. 1999.
Sanders K, Lee MSY. 2007. Evaluating molecular clock calibrations using Bayesian
analyses with soft and hard bounds. Biol. Lett. 3: 275-279.
Schemske DW. 1983. Breeding system and habitat effects on fitness components in three
Neotropical Costus (Zingiberaceae). Evolution 37: 523-539.
Smith S, Benedict J, Specht C, Collinson M, Leong-Äkornicková J, Kvacek J, Xiao X, Fife J,
Marone F. 2013. Reevaluation of the oldest fossils in Zingiberales and implications for
inferring the evolutionary history of gingers, bananas, and relatives. pp. 43-44. In Botany
2013. Celebrating Diversity! July 27-31 - New Orleans. Abstracts.
Specht CD. 2006a. Systematics and evolution of the tropical monocot family Costaceae
(Zingiberales): A multiple dataset approach. Systematic Botany 31: 89-106.
Specht CD. 2006b. Gondwanan vicariance or dispersal in the tropics? The biogeographic
history of the tropical monocot family Costaceae (Zingiberales). Aliso 22: 633-644.

!!
! 13!
Specht CD, Stevenson DW. 2006. A new phylogeny-based generic classification of
Costaceae (Zingiberales). Taxon 55: 153-163.
Specht CD, Kress WJ, Stevenson DW, DeSalle R. 2001. A molecular phylogeny of
Costaceae (Zingiberales). Molecular Phylogenetics and Evolution 21: 333-345.
Stiles FG. 1978. Temporal Organization of Flowering Among the Hummingbird Foodplants of
a Tropical Wet Forest. Biotropica 10: 194-210.
Stiles FG. 1981. Geographical aspects of bird-flower coevolution, with particular reference to
Central America. Annals of the Missouri Botanical Garden 68: 323-351.
Surget-Groba Y, Kay KM. 2013. Restricted gene flow within and between rapidly diverging
Neotropical plant species. Molecular Ecology 22: 4931-4942.
Tomlinson PB. 1969. In Metcalfe CR (Ed.), Anatomy of Monocotyledons. III. Commelinales-
Zingiberales. Clarendon Press, Oxford.
Yost JM, Kay KM. 2009. The evolution of postpollination reproductive isolation in Costus.
Sex Plant Reprod. 22: 247-255.

!!
! 14!

!!
! 15!
Chapter 2 – Spatiotemporal dynamics of speciation in Neotropical Costaceae
(Zingiberales)
Thiago Andréa,b; Shayla Salzmanc,1; Tânia Wendta; Chelsea Spechtc
a - Departamento de Botânica, Universidade Federal do Rio de Janeiro, Rio de Janeiro (RJ),
Brazil.
c - Departments of Plant and Microbial Biology and Integrative Biology, University of
California at Berkeley, Berkeley (CA), USA.
1 - present address: Department of Organismic and Evolutionary Biology, Harvard
University, Cambridge (MA), USA.

!!
! 16!
Abstract
Allopatric forces as well as ecological and reproductive character displacement in sympatry
can lead to new species formation. In the Neotropics, two Costaceae lineages can be found;
a small, early-divergent clade endemic to South America (consisting of Monocostus,
Dimerocostus and Chamaecostus); and the Neotropical Costus clade (ca. 50 species), a
diverse assemblage of understory herbs, comprising nearly half of total familial species
richness. We use a robust dated molecular phylogeny containing ca. 90% of current species
to inform diversification analyses and biogeographical reconstructions, enabling us to
examine the geographic context of speciation in Neotropical Costaceae lineages. Analyses
of speciation rate revealed a significant rate variation among clades, with a rate shift at the
most recent common ancestor of the Neotropical Costus clade. There is an overall
predominance of allopatric speciation in the older-diverging lineages of the South American
clade, as most extant species display little overlap in geographic ranges. In contrast,
sympatry is much higher within the younger Neotropical Costus clade, independent of node
age. Our results show that speciation dynamics during the history of Costaceae is strongly
heterogeneous, and we propose that the Costus radiation in the Neotropics arose mainly by
sympatric processes.

!!
! 17!
2.1. Introduction
Global biodiversity flourishes in the Neotropical region as the result of an extensive
and complex history of evolutionary trends, mediated by ecological processes (Ricklefs
2004, Rull 2011). Despite the extent and importance of the high species diversity found in
the Neotropics, we are still in the early stages of our understanding of its origins (Antonelli &
Sanmartín 2011, Turchetto-Zolet et al. 2013). A critical component of this task is the
examination of the environment-dependent evolutionary processes by which new biological
species arise, i.e. speciation. Although the geography of speciation has long been debated
(Barraclough & Nee 2001, Coyne & Orr 2004, Fitzpatrick et al. 2009), the phylogenetic
approaches of the last few decades have greatly advanced the study of speciation (Nee et
al. 1994, 1998, Ricklefs 2007, Silvestro et al. 2011, Morlon et al. 2011, Paradis 2011,
Rabosky 2014) and its relationship with geographic diversification (Barraclough & Vogler
2000, Graham et al. 2004, Goldberg et al. 2011). Moreover, speciation leaves discernible
signatures in molecular data that can be used to build phylogenetic trees of extant taxa, and
allows for the assessment of speciation rates from phylogenetic data (Rabosky 2009, 2010,
Cusimano & Renner 2010).
Neotropical ecosystems have a strong historical dynamic (Hoorn et al. 2010), with
intense fluctuation both in overall magnitude and in plant diversity (Jaramillo et al. 2010,
Antonelli & Sanmartin 2011). Numerous mechanisms of speciation have been proposed to
explain high species diversity in tropical systems (Mortiz et al. 2000, Antonelli & Sanmartin
2011), most of which assume allopatric speciation as the predominant geographic mode of
speciation. Undeniably, Oligocene and early Miocene were key periods for the development
of modern Neotropical diversity (Antonelli et al. 2009, Hoorn et al. 2011) due to geographic
alterations, especially Andean uplift and the consequent alterations of Amazonian River
drainage patterns (Räsänen et al. 1990, 1992, Hoorn et al. 1995, Gregory-Wodzicki 2000);
ocean level rise and incursions into the South American continent (Flynn & Wyss 1998,
Wesselingh & Salo 2006); and Central America geomorphological dynamics, such as
!!
! 18!
volcanic activity that resulted in oceanic ground shallowing and the closing of the Isthmus of
Panama (Montes et al. 2012, Bacon et al. 2013). In particular, ecological opportunities
provided by the different environments and microclimates available after the uplift of the
Andes are believed to have resulted in the current high South American diversity (Gentry
1982, Luteyn 2002, Rauscher 2002, Bell & Donoghue 2005, Ortiz-Jaureguizar & Cladera
2006, Hughes & Eastwood 2006, Antonelli et al. 2009, Wagner et al. 2013). Compared to
this intense geographic and topographic dynamic during the Tertiary, significant
environmental changes during the Quaternary have been more related to glacial cycles and
their impact on species range continuousness, which could potentially lead to allopatric
speciation (Haffer 2008). Nonetheless, estimates show that nearly half of the dated extant
Neotropical species originated before the Pleistocene (Rull 2008). To some extent, a
proportion of the Neotropical rainforests have also been shown to be ecologically stable over
long periods of time (Carnaval et al. 2009, Couvreur et al. 2011).
Speciation often results from the evolution of reproductive isolation mechanisms, as
once incipient species may not remain distinct entities in their absence (Coyne & Orr 2004).
An alternative to allopatric forces, ecological and reproductive character displacement in
sympatry can also lead to speciation (Schluter 2000, Wendt et al. 2002, Lovette et al. 2002,
Pfennig & Servedio 2013, Rabosky et al. 2014), and several phenotypic novelties have been
associated with species radiations in plants (e.g. Toon et al. 2014, Werner et al. 2014,
Bouchenak-Khelladi et al. 2014).
Adaptive divergence as a response to ecological factors, such as pollinators and
habitat, commonly drives the evolution of prezygotic barriers in plants (Rieseberg & Willis
2007). In particular, the interactions between plants and pollinators can drive adaptive
divergence in floral traits and contribute to the maintenance of reproductive isolation among
closely related sympatric species (Grant 1981, Kay 2006, Wendt et al. 2008). Pollinator
preference can be a strong selection factor for reinforcement between sympatric closely
related species (Hopkins & Rausher 2012). Furthermore, speciation may also occur by
lineage reticulation, instead of divergence (Stebbins 1959, Arnold 1992). Hybridization has

!!
! 19!
been considered a key phenomenon in plant evolution because it results in large amounts of
genetic recombination and may enable the establishment of new traits and evolutionary
lineages (Grant 1981, Ehrlich & Wilson 1991, Soltis & Soltis 1999). Hybridization and
introgression in isolated populations could actually stimulate speciation by providing standing
genetic variation that can contribute to ecological speciation (Seehausen 2004, Palma-Silva
et al. 2011). Moreover, flowering plants maintain genomes with considerable gene
redundancy, much of which is likely the result of allopolyploidy or whole genome duplication
(Soltis et al. 2003).
Spiral Gingers (Costaceae Nakai) comprises ca. 125 pantropically distributed
species, with its center of species diversity located in South and Central America (ca. 95
neotropical species, ca. 15 African, ca. 23 Southeast Asian). Few species have a broad
geographic range, with most species locally restricted geographically and by habitat
heterogeneity (Maas 1972). Two Costaceae lineages inhabit the Neotropics: a small, early
divergent clade primarily endemic to South America consisting of Monocostus K.Schum. (1
species), Dimerocostus Kuntze (3 species) and Chamaecostus C.D.Specht & D.W.Stev. (7
species); and the Neotropical Costus L. clade (ca. 50 species), which encompasses nearly
half of the family’s total species richness. Phylogenetic studies indicate that Neotropical
Costus diverged from African Costus following a long distance dispersal event that occurred
long after the final break up of the Gondwanan supercontinent (Specht 2006a). Hence, the
current distribution of the genus Costus and perhaps the pantropical distribution of the entire
family is better explained by a series of more recent local vicariance and dispersal events
not related to major vicariant events.
Hummingbird pollination (ornithophily) has evolved several times in Neotropical
Costus from bee pollinated (melittophily) ancestors (Kay et al. 2005, Salzman et al. in press),
and flower morphology reflects pollination type mainly by diversity of coloration patterns
marking the showy labellum (an organ comprised of five fused staminodes, Specht et al.
2012), and in overall flower aperture size (Kay et al. 2005, Specht 2006a). This pollination
shift has been suggested to be particularly important in diversification of Neotropical Costus

!!
! 20!
(Kay & Schemske 2003, Kay et al. 2005, Specht 2006b, Salzman et al. in press) but has not
been investigated for the South American clade, i.e. Dimerocostus, Monocostus and
Chamaecostus. Kay et al. (2005) proposed a scenario for the diversification of Costus, in
which range shifts in response to environmental changes and rapid floral adaptation in
geographic isolation could have promoted reproductive isolation among closely related
species. Interestingly, Costaceae’s South American clade is species-poor as compared to
the Neotropical Costus clade, regardless of being older and having potentially experienced
the same environmental changes. Comprehensive and current chronological and
biogeographic approaches for the analysis of Costaceae diversification have not yet been
fully considered, making the Costaceae an appropriate system for studying spatiotemporal
diversification dynamics in the megadiverse Neotropical region.
Here, we examine the spatiotemporal context of speciation through a phylogenetic
framework in two Neotropical Costaceae lineages (Costus and the South American clade)
with significantly different extant species richness.
!!
! 21!
2.2. Materials and Methods
2.2.1. Taxonomic sampling, DNA extraction, amplification and sequencing
A total of 84 ingroup taxa were sampled, including nearly all known species from the
South American clade, most of Neotropical and African Costus species, and a few
representatives of Asian Costaceae. Alpinia zerumbet (Pers.) B.L. Burtt & R.M. Sm. and
Zingiber officinale Roscoe (Zingiberaceae) were designated as outgroups. Available
sequences were downloaded from GenBank (accession numbers in Appendix 1). For the
remaining taxa, total genomic DNA was isolated from silica-gel dried leaf tissue using CTAB
extraction protocol (Doyle & Doyle 1990). Regions of the chloroplast (trnL-trnLF, rps16-trnk)
and nuclear (rpb2, ETS and ITS) genomes were amplified and sequenced using published
primers (Taberlet et al. 1991, Shaw et al. 2007, Specht et al. 2001, Kay et al. 2005, White et
al. 1990, respectively). Novel primers for the calmoduline (CAM) 23rd intron were designed
following a long PCR protocol using Zingiberales primers cam33F and cam328R (Johansen
2005, Salzman et al. in press). PCR fragments were generated and sequenced on an
Applied Biosystems® 3730 DNA Analyzer automated DNA sequencer, at UC Berkeley’s
Museum of Vertebrate Zoology’s Evolutionary Genetics Laboratory. Nucleotide sequences of
the 2 plastid and 4 nuclear genetic markers were concatenated and analyzed under a
Bayesian phylogenetic framework, using BEAST 1.7.4 (Drummond et al. 2012).
Chromatogram files were examined for biases and possible errors using Geneious version
5.6.3 (Biomatters Ltd.). Alignments were made for each marker using MUSCLE algorithm
(Edgar 2004) implemented in Geneious, and alignments were subsequently checked
manually. Alignment regions that could not be unambiguously interpreted were excluded
from analysis. New sequences were deposited in GenBank (accession numbers in Appendix
1).
2.2.2. Phylogenetic inferences and speciation dynamics

!!
! 22!
Nucleotide sequences of the 2 plastid and 4 nuclear genetic markers were
concatenated and analyzed under a Bayesian phylogenetic framework, using BEAST 1.7.4
(Drummond & Rambaut 2007). Sequence data was partitioned to allow different models of
sequence evolution for each region, based on likelihood analyses ran on jModelTest version
2.0 (Darriba et al. 2012) and selected with Bayesian information criterion. A relaxed clock
with an uncorrelated lognormal model of rate variation was used and a Yule speciation
process for branching rates was selected. Two fossil-based time to the most recent common
ancestor (tmrca) calibrations were used; 45 ± 5 Ma for the Costaceae root (Costus incertis!;
Berry 1925) and 85 ± 5 Ma for Alpinia + Zingiber clade (Zingiberopsis!; Hickey & Peterson
1978), and a CTMC rate prior was selected (Ferreira & Suchard 2008). No monophyletic
prior assignment was made. Markov chain Monte Carlo simulations were run twice
independently for 5x10⁷ generations and sampled every 5x10³. These analyses were
performed on the CIPRES Science Gateway (Miller et al. 2010). We assessed convergence
of model parameters across the independent runs by analyzing plots of the marginal
posterior distributions in Tracer version 1.5 (Rambaut & Drummond 2009), and by ensuring
high effective sample size values (ESS ≥ 200). Tracer was also used to assess burn-in
levels. A maximum clade-credibility tree was obtained from the posterior sample of trees
using TreeAnnotator version 1.7.4 (Drummond et al. 2012), and visualized on FigTree
(http://tree.bio.ed.ac.uk/software/figtree/).
The Bayesian Analysis of Macroevolutionary Mixtures (BAMM; Rabosky 2014) was
used for the analysis of speciation rates on the ultrametric phylogeny, accounting for non-
random taxon sampling. This model assumes that changes in evolutionary regimes occur
across the branches of phylogenetic trees under a compound Poisson process model of rate
variation and explicitly allows rates to vary both through time and among lineages. Four
MCMC chains were run for 5x10⁷ generations and sampled every 5x10³, using the BAMM
default parameters.
2.2.3. Geography of Speciation

!!
! 23!
Locality data for Neotropical Costaceae was downloaded from the Global Biodiversity
Information Facility Data Portal (www.gbif.org, March 2014), and from examination of
herbaria material (A; HAMAB; HEPH; IAN; IBGE; INPA; MG; MO; NY; R; RB; UB; UC;
UFACPZ; UFG, acronyms follows Thiers 2014). Reconstruction of the geographical
distribution of species at the time of speciation is obviously problematic, as the current
distribution of a species is not necessarily a direct indicator of species’ historical
geographical range (Losos & Glor 2003). This issue was addressed by inferring the potential
geographic distribution of species, estimated by ecological niche modeling (Austin 1985,
Graham et al. 2004, Phillips et al. 2006), instead of using geographic range maps based on
locality data. Values were extracted based on specimens’ localities from 43 environmental
variables describing climate (Hijmans et al. 2005, Kriticos et al. 2012), soil (Global Soil Data
Task Group 2000) and net primary productivity (Imhoff & Bounoua 2006). After evaluating
the correlation between each of the variables in R (R Core Team 2014), we removed
variables that had a coefficient -0.75 ≤ r ≥ 0.75, which resulted in 14 correlated variables
describing environmental variation. Extant species potential geographic distributions were
modeled by maximum entropy in MAXENT version 3.3.3k (Phillips et al. 2006), with 25% of
the data used for training. Thresholds for geographic ranges were estimated from median
presence of 50 bootstrap replicates, in QGIS (Quantum GIS Development Team,
www.qgis.org). We then calculated the degree of sympatry between sister clades (Chesser
& Zink 1994: area of overlap in geographic range / range size of clade with smaller range)
for each node of the South American Clade and the Neotropical Costus clade.
Additionally, evolution of the geographic range of Costaceae was interpreted using
historic biogeographic reconstruction. Ancestral ranges were inferred using the
BioGeoBEARS package implemented in R (Matzke 2013), which allows for both probabilistic
inferences of models of range expansion and founder-event speciation (J). An unconstrained
dispersal-extinction-cladogenesis analysis (DEC and DEC+J; Ree et al. 2005, Ree & Smith
2008, Ree & Sanmartín 2009) and the Bayesian analysis for large number of areas
(BAYAREA and BAYAREA+J; Landis et al. 2013), were run using the maximum clade

!!
! 24!
credibility time-calibrated species tree. The Likelihood Ratio Test (LRT) and the Akaike
Information Criterion (AIC; Burnham & Anderson 2002) were used to objectively compare
models (Table 1). Geographic distributions of the terminal taxa were coded based on
environmental discontinuity of Neotropical regions and on extant Costaceae species
distributions: (1) Central America and the Caribbean, (2) Amazonian, (3) Andean, (4) Central
Brazilian Plateau and Atlantic Rainforests, (5) Africa, (6) Asia and Oceania. We set the
maximum number of areas equal to four.
!!
! 25!
2.3. Results
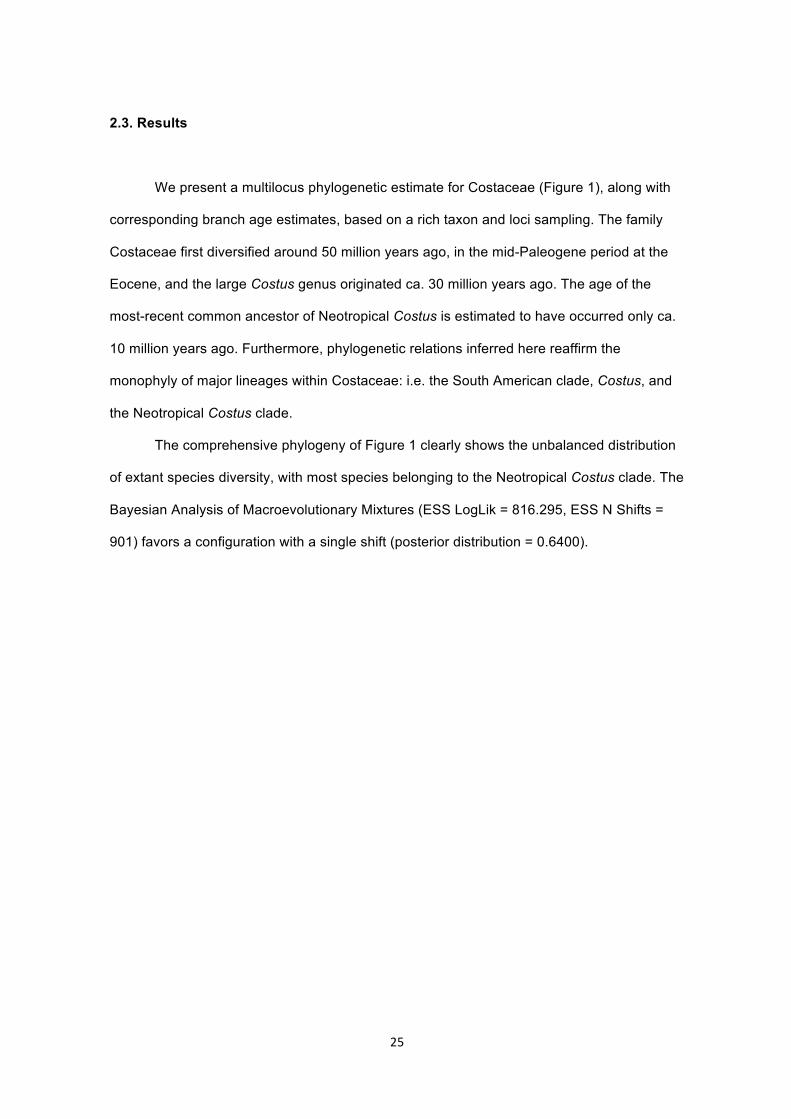
We present a multilocus phylogenetic estimate for Costaceae (Figure 1), along with
corresponding branch age estimates, based on a rich taxon and loci sampling. The family
Costaceae first diversified around 50 million years ago, in the mid-Paleogene period at the
Eocene, and the large Costus genus originated ca. 30 million years ago. The age of the
most-recent common ancestor of Neotropical Costus is estimated to have occurred only ca.
10 million years ago. Furthermore, phylogenetic relations inferred here reaffirm the
monophyly of major lineages within Costaceae: i.e. the South American clade, Costus, and
the Neotropical Costus clade.
The comprehensive phylogeny of Figure 1 clearly shows the unbalanced distribution
of extant species diversity, with most species belonging to the Neotropical Costus clade. The
Bayesian Analysis of Macroevolutionary Mixtures (ESS LogLik = 816.295, ESS N Shifts =
901) favors a configuration with a single shift (posterior distribution = 0.6400).

!!
! 26!
Figure 1. Maximum clade credibility tree estimated from 1,000 trees. Numbers above
branches refer to posterior probabilities, and numbers at right of nodes are age estimates in
million years. Blue bars denote node height probability density at 95%. Lower scale in million
years before present.
!!
! 27!
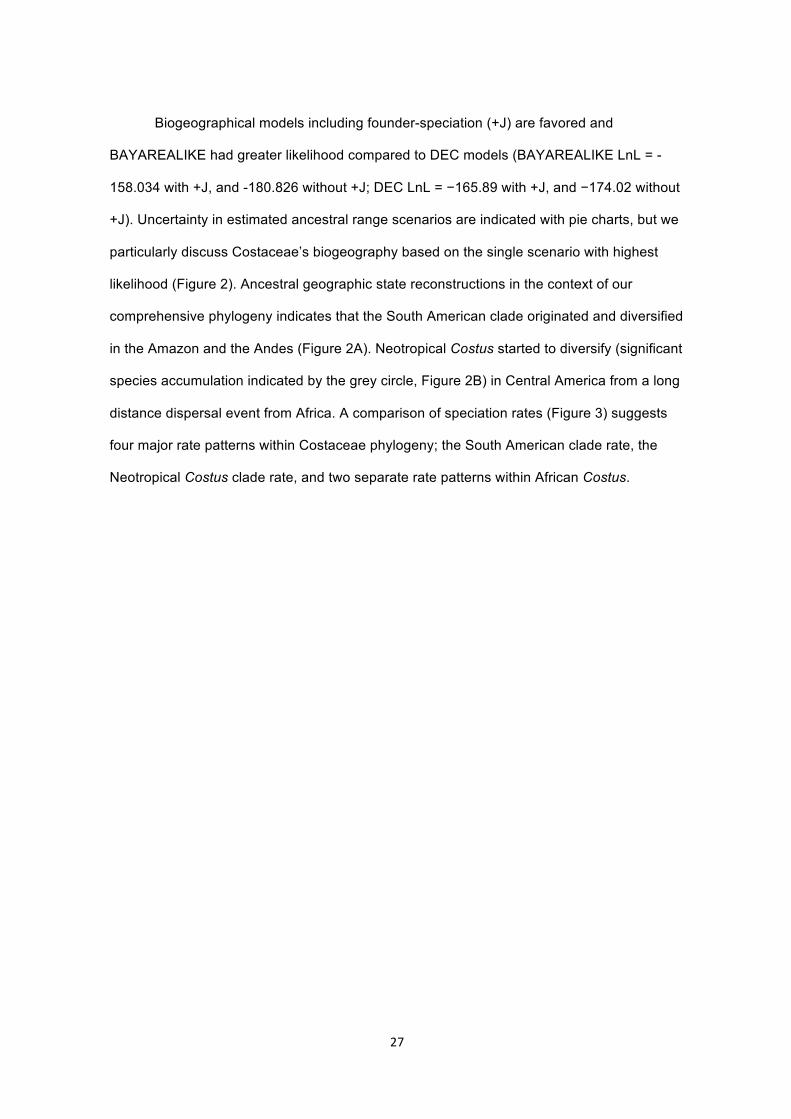
Biogeographical models including founder-speciation (+J) are favored and
BAYAREALIKE had greater likelihood compared to DEC models (BAYAREALIKE LnL = -
158.034 with +J, and -180.826 without +J; DEC LnL = −165.89 with +J, and −174.02 without
+J). Uncertainty in estimated ancestral range scenarios are indicated with pie charts, but we
particularly discuss Costaceae’s biogeography based on the single scenario with highest
likelihood (Figure 2). Ancestral geographic state reconstructions in the context of our
comprehensive phylogeny indicates that the South American clade originated and diversified
in the Amazon and the Andes (Figure 2A). Neotropical Costus started to diversify (significant
species accumulation indicated by the grey circle, Figure 2B) in Central America from a long
distance dispersal event from Africa. A comparison of speciation rates (Figure 3) suggests
four major rate patterns within Costaceae phylogeny; the South American clade rate, the
Neotropical Costus clade rate, and two separate rate patterns within African Costus.

!!
! 28!
(A) (B)
Figure 2. Top: (A) Biogeographical analysis of Costaceae using BioGeoBEARS. (B)
Phylorate plots for speciation rate using BAMM; colors at each point in time along branches
denote instantaneous speciation rates, with warmer colors referring to faster rates; two
distinct shift configurations account for most of the posterior probability of the data with the
dark dot indicating the node of the single shift in configuration. Bottom: Geographic areas
included in biogeographic analysis: ! Central America and the Caribbean, ! Amazonian, !
Andean, ! Central Brazilian Plateau and Atlantic Rainforests, ! Africa, ! Asia and Oceania.
Outgroups are not shown. Central images show representative Costaceae (top-down):
Costus scaber Ruiz & Pav., Costus arabicus L., Costus ligularis Baker, Chamaecostus

!!
! 29!
lanceolatus (Petersen) C.D. Specht & D.W. Stev.; C. ligularis photograph by C.Specht, all
others by T.André.

!!
! 30!
Figure 3. Speciation rates comparison within Costaceae phylogeny. Color bar and squares
indicate proportion of similarity between rates. Colors at each point in time along branches of
the phylogeny denote instantaneous speciation rates. Outgroup rate is underestimated due
to limited sampling of outgroup clades.
0
0.5
1

!!
! 31!
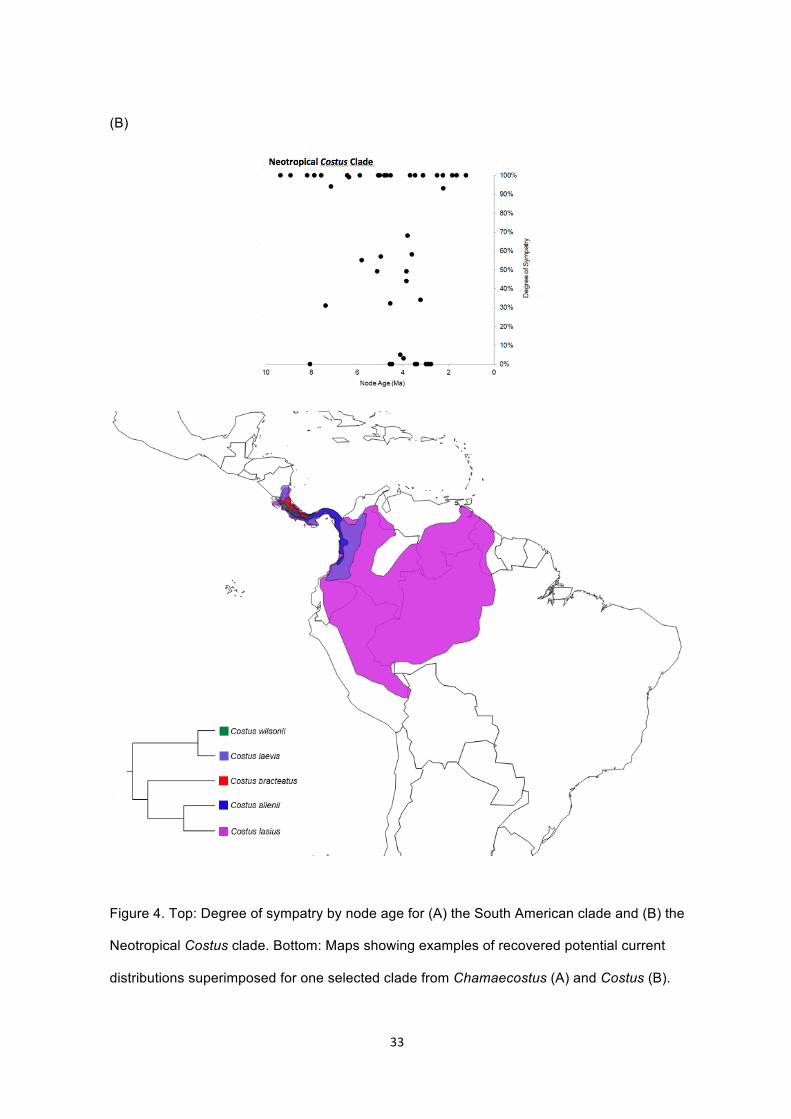
Degree of sympatry plots (Figure 4, A and B) point to the overall predominance of
allopatric speciation in the South American clade (Figure 4A), where most recently diverged
species display little overlap in geographic ranges. In contrast, sympatry is much higher
within the Neotropical Costus clade, independent of node age (Figure 4B).

!!
! 32!
(A)
!!
! 33!
(B)
Figure 4. Top: Degree of sympatry by node age for (A) the South American clade and (B) the
Neotropical Costus clade. Bottom: Maps showing examples of recovered potential current
distributions superimposed for one selected clade from Chamaecostus (A) and Costus (B).

!!
! 34!
2.4. Discussion
As previously inferred (Specht et al. 2001, Specht 2006b), an early lineage
divergence event splits Costaceae into two major clades: a South American clade
[(Monocostus+Dimerocostus)+Chamaecostus], and a large clade containing the remaining
species of Costaceae. There are important differences between species of the early-
diverging South American clade and the Neotropical Costus clade regarding their
geographical distribution. Nearly half of the species richness of Neotropical Costus is
endemic to Central America, with several predominantly South American species having
large ranges that also include Central America. On the other hand, the distributions of
Chamaecostus, Dimerocostus and Monocostus are almost entirely exclusive to South
America with only a single species of Dimerocostus having a large range expanding into
Central America.
The genus Costus maintains an amphi-Atlantic distribution, with ca. 29 known
species in Africa and ca. 51 in the Neotropics. This rare biogeographic condition (Renner
2004) is shared, for example, with Renealmia L.f. (Zingiberaceae), which has ca. 15 species
in Africa and 61 in the Neotropics (Maas 1977). Särkinen et al. (2007) suggested that
Renealmia acquired this distribution by an oceanic long-distance dispersal event from Africa
to South America during the Miocene or Pliocene, and that speciation in the Neotropics
might have been affected by the orogeny of the Andes. Notably, Specht (2006a) and
Salzman et al. (in press) previously suggested an African origin for Neotropical Costus.
Here, we also demonstrate a long distance dispersal from Africa to Central America ca. 10
million years ago. We also infer subsequent successive migration events from Central to
South America, as well as some apparently recent range expansions by some species, such
as Costus scaber Ruiz & Pav., that still maintain most of their distribution in South America.
Long-distance dispersal of plants, such as transatlantic ones, are challenging to research
because they involves rare events determined by complex and highly stochastic processes.
In fact, extreme climatic events and generalized long distance dispersal vectors are more
!!
! 35!
likely to explain drastic deviations from a mean trend in dispersal, and therefore are likely to
turn exceptionally rare dispersal events into reality (Nathan 2006), a suggestion first made
my Darwin in his Origin of Species.
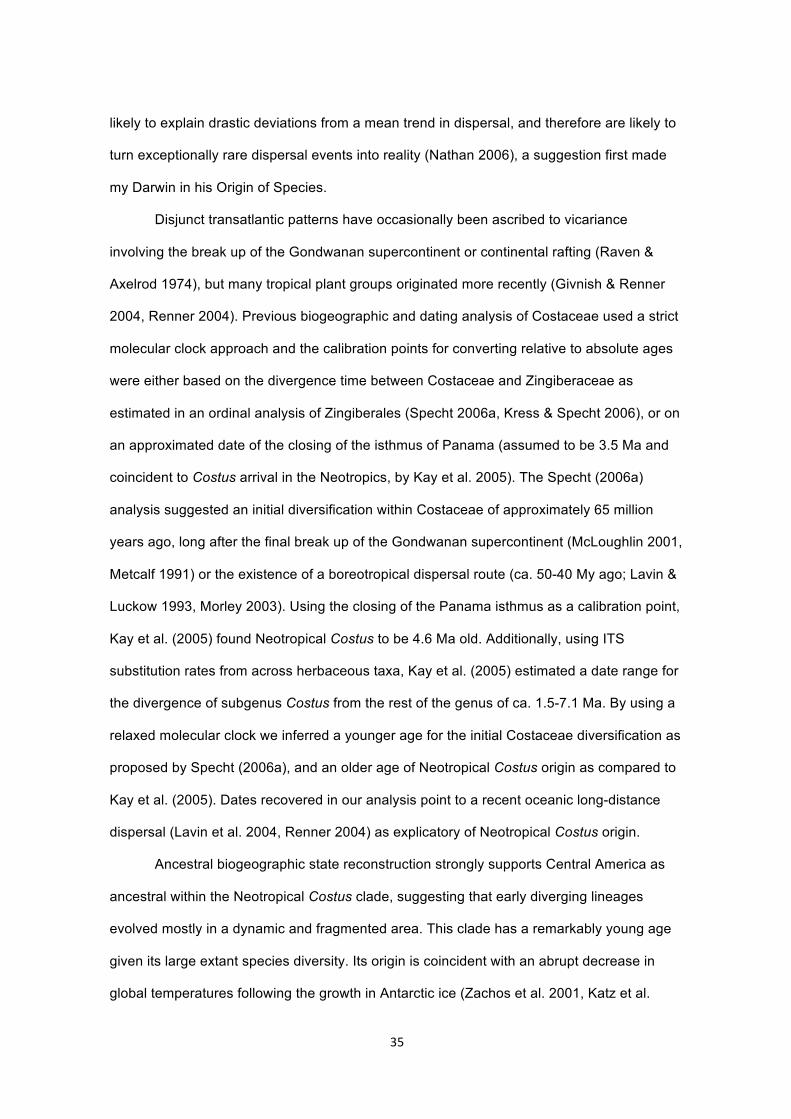
Disjunct transatlantic patterns have occasionally been ascribed to vicariance
involving the break up of the Gondwanan supercontinent or continental rafting (Raven &
Axelrod 1974), but many tropical plant groups originated more recently (Givnish & Renner
2004, Renner 2004). Previous biogeographic and dating analysis of Costaceae used a strict
molecular clock approach and the calibration points for converting relative to absolute ages
were either based on the divergence time between Costaceae and Zingiberaceae as
estimated in an ordinal analysis of Zingiberales (Specht 2006a, Kress & Specht 2006), or on
an approximated date of the closing of the isthmus of Panama (assumed to be 3.5 Ma and
coincident to Costus arrival in the Neotropics, by Kay et al. 2005). The Specht (2006a)
analysis suggested an initial diversification within Costaceae of approximately 65 million
years ago, long after the final break up of the Gondwanan supercontinent (McLoughlin 2001,
Metcalf 1991) or the existence of a boreotropical dispersal route (ca. 50-40 My ago; Lavin &
Luckow 1993, Morley 2003). Using the closing of the Panama isthmus as a calibration point,
Kay et al. (2005) found Neotropical Costus to be 4.6 Ma old. Additionally, using ITS
substitution rates from across herbaceous taxa, Kay et al. (2005) estimated a date range for
the divergence of subgenus Costus from the rest of the genus of ca. 1.5-7.1 Ma. By using a
relaxed molecular clock we inferred a younger age for the initial Costaceae diversification as
proposed by Specht (2006a), and an older age of Neotropical Costus origin as compared to
Kay et al. (2005). Dates recovered in our analysis point to a recent oceanic long-distance
dispersal (Lavin et al. 2004, Renner 2004) as explicatory of Neotropical Costus origin.
Ancestral biogeographic state reconstruction strongly supports Central America as
ancestral within the Neotropical Costus clade, suggesting that early diverging lineages
evolved mostly in a dynamic and fragmented area. This clade has a remarkably young age
given its large extant species diversity. Its origin is coincident with an abrupt decrease in
global temperatures following the growth in Antarctic ice (Zachos et al. 2001, Katz et al.
!!
! 36!
2008, Jaramillo & Cardenas 2013), and with tectonic activities in West Africa (Diester-Haass
& Chamley 1980, Pearson et al. 2008), as well as the intense geomorphological dynamics in
Central and South America (Hoorn et al. 1995, Montes et al. 2012).
Despite this biogeographic background, our results indicate that ecological and
reproductive evolution in sympatry likely played more important roles in the speciation
dynamics of this lineage. In fact, pollinator dissimilarity is generally sufficient to maintain pre-
zygotic isolation between sympatric species (Sakai et al. 1999, Kay & Schemske 2003),
such that pollination shifts may be sufficient to successfully act as reproductive barriers
between incipient species. Salzman et al. (in press.) showed a relative increase in
diversification for lineages within Costus that display specialized pollination morphologies as
compared to the preseumed generalist pollination morphology. Nevertheless, well-developed
pollination differentiation suggested by the floral morphology, and overall reproductive
biology, remains largely unverified for most species in the family (although see Kay &
Schemske 2003). Moreover, polyploidy may result in the evolution of speciose lineages,
since polyploids often exhibit ecological differentiation, high fecundity, perennial life history,
and self-fertilization or asexual reproduction (Rieseberg & Willis 2007).
Timing of the significant increase in diversification rate, coincident with the origin of
the Neotropical Costus clade, further uncovers a scenario of in situ divergence, including
multiple independent invasions to South America presumably occurring overland by the
Panamanian land bridge, which indeed was likely already formed (Montes et al. 2012, Bacon
et al. 2013). The Late Paleocene of South America represents an important time for plant
evolution as it probably witnessed the first paleoflora attributable to modern day tropical
rainforests (Jaramillo et al. 2006, Wing 2009). However, further ecological studies
investigating tolerance limits to relevant environmental gradients across Costus, such as
edaphic, climatic and topographic variables, will help better define evolution of particular
ecological characters involved in spatial occurrence.
Sympatric speciation significantly contributed to diversification in Costaceae, in
addition to orogenic-driven allopatric processes. Based on the high importance of sympatric

!!
! 37!
speciation for the diversification in the Neotropical Costus clade, its subclades could display
some intrinsic characteristic that facilitates in situ diversification, such as susceptibility to the
evolution of intrinsic barriers to reproduction, genes and genome duplications, or unusually
high amounts of structured genetic diversity. Nonetheless, the founder effect of colonization
of this key geographic region certainly presented new ecological niches for the Costus
lineage, and interactions with a different assembly of pollinators could have been an
important trigger of speciation rates.
!!
! 38!
2.5. Acknowledgements
T.A. received a scholarship grant from Coordenação de Aperfeiçoamento de Pessoal de
Nível Superior. T.W. received a productivity grant from Conselho Nacional de
Desenvolvimento Científico e Tecnológico. C.S. received funding from the National
Geographic Society #8994-11, NSF DEB0866601, and UC Berkeley CNR-BSP, SPUR, and
URAP. We are thankful to Heather Driscoll, Tanya Renner, Irene Liao, Stacey Shen and
Roxana Yockteng for help in selecting molecular markers and generating sequences.
2.6. References
Antonelli A, Sanmartín I. 2011. Why are there so many plant species in the Neotropics?
Taxon 60: 403-414.
Antonelli A, Nylander JAA, Persson C, Sanmartín I. 2009. Tracing the impact of the Andean
uplift on Neotropical plant evolution. Proceeding of the National Academy of Sciences
USA 106: 9749-9754.
Arnold SJ. 1992. Constrains on phenotypic evolution. American Naturalist 140: S85-S107.
Austin MP. 1985. Continuum concept, ordination methods and niche theory. Annual Review
of Ecology and Systematics 16: 39-61.
Bacon CD, Mora A, Wagner WL, Jaramillo CA. 2013. Testing geological models of evolution
of the Isthmus of Panama in a phylogenetic framework. Botanical Journal of the Linnean
Society 171: 287-300.
Barraclough TG, Nee S. 2001. Phylogenetics and speciation. Trends in Ecology and
Evolution 16: 391-399.
Barraclough TG, Vogler AP. 2000. Detecting the geographical pattern of speciation from
species-level phylogenies. American Naturalist 155: 419-434.
Bell CD, Donoghue MJ. 2005. Phylogeny and biogeography of the Valerianaceae
(Dipsacales) with special reference to the South American valerians. Organisms,
Evolution, and Diversity 5: 147-159.

!!
! 39!
Berry EW. 1925. A banana in the Tertiary of Colombia. American Journal of Science. 10:
530-537.
Bouchenak-Khelladi Y, Muasya AM, Linder HP. 2014. A revised evolutionary history of
Poales: origins and diversification. Botanical Journal of the Linnean Society 175: 4-16.
Burnham KP, Anderson DR. 2002. Model Selection and Multimodel Inference: A Practical
Information-Theoretic Approach. 2nd ed. Springer. 488 p.
Carnaval AC, Hickerson MJ, Haddad CFB, Rodrigues MT, Moritz C. 2009. Stability Predicts
Genetic Diversity in the Brazilian Atlantic Forest Hotspot. Science 323: 785-789.
Chesser RT, Zink RM. 1994. Modes of speciation in birds: An application of Lynch's (1989)
method. Evolution 48: 490-497.
Couvreur TLP, Forest F, Baker WJ. 2011. Origin and global diversification patterns of
tropical rain forests: inferences from a complete genus-level phylogeny of palms. BMC
Biology 9: 44.
Coyne JA, Orr HA. 2004. Speciation. Sinauer Associates Inc. 545 p.
Cusimano N, Renner SS. 2010. Slowdowns in diversification rates from real phylogenies
may not be real. Systematic Biology 59: 458-464.
Darriba D., G. L. Taboada, R. Doallo, and D. Posada. 2012. jModelTest 2: More models,
new heuristics and parallel computing. Nature Methods 9: 772.
Diester-Haass L, Chamley H. 1980. Oligocene climatic, tectonic and eustatic history of NW
Africa (DSDP Leg 41, Site 369). Oceanologica Acta 3: 115-126.
Doyle JJ, Doyle JL. 1990. A rapid total DNA preparation procedure for fresh plant tissue.
Focus 12:13-15.
Drummond AJ, Rambaut A. 2007. BEAST: Bayesian evolutionary analysis by sampling
trees. BMC Evolutionary Biology 7: 214.
Drummond AJ, Suchard MA, Xie D, Rambaut A. 20120. Bayesian phylogenetics with BEAUti
and the BEAST 1.7. Molecular Biology and Evolution 29: 1969-1973.
!!
! 40!
Edgar RC. 2004. MUSCLE: multiple sequence alignment with high accuracy and high
throughput. Nucleic Acids Research 32: 1792-1797.
Ehrlich PR, Wilson EO. 1991. Biodiversity studies: science and policy. Science 253: 758-
762.
Ferreira MAR, Suchard MA. 2008. Bayesian analysis of elapsed times in continuous-time
Markov chains. Canadian Journal of Statistics 26: 355-368.
Fitzpatrick BM, Fordyce JA, Gavrilets S. 2009. Pattern, process and geographic modes of
speciation. Journal of Evolutionary Biology 22: 2342-2347.
Flynn JJ, Wyss AR. 1998. Recent advances in South American mammalian paleontology.
Trends in Ecology and Evolution 13: 449-454.
Gentry AH. 1982. Neotropical floristic diversity: phytogeographical connections between
Central and South America, Pleistocene climatic fluctuations, or an accident of the
Andean orogeny? Annals of the Missouri Botanical Garden 69: 557–593.
Givnish TJ, Renner SS. 2004. Tropical intercontinental disjunctions: Gondwana breakup,
immigration from the Boreotropics, and transoceanic dispersal. International Journal of
Plant Sciences 165: S1-S6.
Global Soil Data Task Group. 2000. Global Gridded Surfaces of Selected Soil
Characteristics (IGBP-DIS). [Global Gridded Surfaces of Selected Soil Characteristics
(International Geosphere-Biosphere Programme - Data and Information System)]. Data
set. Available on-line [http://www.daac.ornl.gov] from Oak Ridge National Laboratory
Distributed Active Archive Center, Oak Ridge, Tennessee, U.S.A.
Goldberg EE, Lancaster LT, Ree RH. 2011. Phylogenetic Inference of Reciprocal Effects
between Geographic Range Evolution and Diversification. Systematic Biology 60: 451-
465.
Graham CH, Ron SR, Santos JC, Schneider CJ, Moritz C. Integrating phylogenetics and
environmental niche models to explore speciation mechanisms in dendrobatid frogs.
Evolution 58: 1781-1793.
Grant V. 1981. Plant speciation. 2nd Ed. Columbia University Press. 432 p.

!!
! 41!
Gregory-Wodzicki KM. 2000. Uplift history of the Central and Northern Andes: A review.
GSA Bulletin 112: 1091-1105.
Haffer J. 2008. Hypotheses to explain the origin of species in Amazonia. Brazilian Journal of
Biology 68: 917-947.
Hickey LJ, Peterson RK. 1978. Zingiberopsis, a fossil genus of the ginger family from Late
Cretaceous to early Eocene sediments of western interior North America. Canadian
Journal of Botany 56: 1136-1152.
Hijmans RJ, Cameron SE, Parra JL, Jones PG, Jarvis A. 2005. Very high resolution
interpolated climate surfaces for global land areas. International Journal of Climatology
25: 1965-1978.
Hoorn C, Guerrero J, Sarmiento GA, Lorente MA. 1995. Andean tectonics as a cause for
changing drainage patterns in Miocene northern South America. Geology 23: 237-240.
Hoorn C, Wesselingh FP, ter Steege H, Bermudez MA, Mora A, Sevink J, Sanmartín I,
Sanchez-Meseguer A, Anderson CL, Figueiredo JP, Jaramillo C, Riff D, Negri FR,
Hooghiemstra H, Lundberg J, Stadler T, Sarkinen T, Antonelli A. 2010. Amazonia
through time: Andean uplift, climate change, landscape evolution, and biodiversity.
Science 330: 927-931.
Hoorn C, Wesselingh F (Ed). 2011. Amazonia, landscape and species evolution: a look into
the past. Wiley-Blackwell. 464 p.
Hopkins R, Rausher MD. 2012. Pollinator-mediated selection on flower color allele drives
reinforcement. Science 335: 1090-1092.
Hughes C, Eastwood R. 2006. Island radiation on a continental scale: Exceptional rates of
plant diversification after uplift of the Andes. Proceedings of the National Academy of
Sciences 103: 10334-10339.
Imhoff ML, Bounoua L. 2006. Exploring global patterns of net primary production carbon
supply and demand using satellite observations and statistical data. Journal of
Geophysical Research 111: D22S12.

!!
! 42!
Jaramillo C, Cárdenas A. 2013. Global Warming and Neotropical Rainforests: A Historical
Perspective. Annual Review of Earth and Planetary Sciences 41: 28.1-28.26.
Jaramillo C, Rueda M, Mora G. 2006. Cenozoic plant diversity in the Neotropics. Science
311: 1893–1896.
Jaramillo C, Ochoa D, Contreras L, Pagani M, Carvajal-Ortiz H, Pratt LM, Krishnan S,
Cardona A, Romero M, Quiroz L, Rodriguez G, Rueda MJ, Parra F, Morón S, Green W,
Bayona G, Montes C, Quintero O, Ramirez R, Mora G, Schouten S, Bermudez H,
Navarrete R, Parra F, Alvarán M, Osorno J, Crowley JL, Valencia V, Vervoort J. 2010.
Effects of rapid global warming at the Paleocene-Eocene boundary on Neotropical
vegetation. Science 330: 957–961.
Johansen LB. 2005. Phylogeny of Orchidantha (Lowiaceae) and the Zingiberales based on
six DNA regions. Systematic Botany 30: 106-117.
Katz ME, Miller KG, Wright JD, Wade BS, Browning JV, Cramer BS, Rosenthal Y. 2008.
Stepwise transition from the Eocene greenhouse to the Oligocene icehouse. Nature
Geoscience 1: 329-334.
Kay KM. 2006. Reproductive isolation between two closely related hummingbird-pollinated
Neotropical gingers. Evolution 60: 538-552.
Kay KM, Schemske DW. 2003. Pollinator assemblages and visitation rates for 11 species of
Neotropical Costus (Costaceae). Biotropica 35: 198-207.
Kay KM, Reeves PA, Olmstead RG, Schemske DW. 2005. Rapid speciation and the
evolution of hummingbird pollination in Neotropical Costus subgenus Costus
(Costaceae): Evidence from nrDNA ITS and ETS sequences. American Journal of
Botany 92: 1899-1910.
Kress WJ, Specht CD. 2006. The evolutionary and biogeographic origin and diversification of
the tropical monocot oder Zingiberales. Aliso 22: 619–630.
Kriticos DJ, Webber BL, Leriche A, Ota N, Macadam I, Bathols J, Scott JK. 2012. CliMond:
global high-resolution historical and future scenario climate surfaces for bioclimatic
modeling. Methods in Ecology and Evolution 3: 53-64.
!!
! 43!
Landis MJ, Matzke NJ, Moore BR, Huelsenbeck JP. 2013. Bayesian analysis of
biogeography when the number of areas is large. Systematic Biology 62: 789-804.
Lavin M, Luckow M. 1993. Origins and relationships of tropical North America in the context
of the Boreotropics hypothesis. American Journal of Botany 80: 1-14.
Lavin M, Schrire B, Lewis G, Pennington T, Delgado-Salinas A, Thulin M, Hughes C, Beyra
Matos A, Wojciechoswki MF. 2004. Metacommunity process rather than continental
tectonic history better explains geographically structured phylogenies in legumes.
Philosophical Transactions of the Royal Society London (Biological Sciences) 359: 1509-
1522.
Losos JB, Glor RE. 2003. Phylogenetic comparative methods and the geography of
speciation. Trends in Ecology and Evolution 18: 220-227.
Lovette IJ, Bermingham E, Ricklefs RE. 2002. Clade-specific morphological diversification
and adaptive radiation in Hawaiian songbirds. Proceedings of the Royal Society B
(Biological Sciences) 269: 37-42.
Luteyn JL. 2002. Diversity, adaptation, and endemism in neotropical Ericaceae:
biogeographical patterns in the Vaccinieae. Botanical Review 68: 55-87.
Maas PJM. 1972. Costoideae (Zingiberaceae). Flora Neotropica monograph no 8. Hafner,
New York, New York, USA.
Maas PJM. 1977. Renealmia (Zingiberaceae-Zingiberoideae) Costoideae (Additions)
(Zingiberaceae). Flora Neotropica monograph no 18. Hafner, New York, New York, USA.
Matzke NJ. 2013. Probabilistic Historical Biogeography: New Models for Founder-Event
Speciation, Imperfect Detection, and Fossils Allow Improved Accuracy and Model-
Testing. Frontiers of Biogeography 5: 242-248.
McLoughlin S. 2001. The breakup history of Gondwana and its impact on pre-Cenozoic
floristic provincialism. Australian Journal of Botany 49: 271-300.
Metcalfe I. 1991. Late Palaeozoic and Mesozoic palaeogeography of Southeast Asia.
Palaeogeography, Palaeoclimatology, Palaeoecology 87: 211-221.
!!
! 44!
Miller MA, Pfeiffer W, Schwartz T. 2010. Creating the CIPRES Science Gateway for
Inference of Large Phylogenetic Trees. In Proceedings of the Gateway Computing
Environments Workshop (GCE), New Orleans, LA: 1-8.
Montes C, Cardona A, McFadden R, Morón SE, Silva CA, Restrepo-Moreno S, Ramírez DA,
Hoyos N, Wilson J, Farris D, Bayona GA, Jaramillo CA, Valencia V, Bryan J, Flores JA.
2012. Evidence for middle Eocene and younger land emergence in central Panama:
Implications for Isthmus closure. GSA Bulletin 124: 780-799.
Morley RJ. 2003. Interplate dispersal paths for megathermal angiosperms. Perspectives in
Plant Ecology, Evolution and Systematics 6: 5-20.
Morlon H, Parsons TL, Plotkin JB. 2011. Reconciling molecular phylogenies with the fossil
record. Proceedings of the National Academy of Sciences USA 108: 16327-16332.
Moritz C, Patton JL, Schneider CJ, Smith TB. 2000. Diversification of rainforest faunas: An
integrated molecular approach. Annual Review of Ecology and Systematics 31: 533-563.
Nathan R. 2006. Long-Distance Dispersal of Plants. Science 313: 786-788.
Nee S, May RM, Harvey PH. 1994. The reconstructed evolutionary process. Philosophical
Transactions of the Royal Society of London B (Biological Sciences) 344: 305-311.
Ortiz-Jaureguizar E, Cladera G. 2006. Paleoenvironmental evolution of southern South
America during the Cenozoic. Journal of Arid Environments 66: 489-532.
Palma-Silva C, Wendt T, Pinheiro F, Barbará T, Fay MF, Cozzolino S, Lexer C. 2011.
Sympatric bromeliad species (Pitcairnia spp.) facilitate tests of mechanisms involved in
species cohesion and reproductive isolation in Neotropical inselbergs. Molecular Ecology
20: 3185-3201.
Paradis E. 2011. Time-dependent speciation and extinction from phylogenies: a least
squares approach. Evolution 65: 661-67.
Pearson PN, McMillan IK, Wade BS, Jones TD, Coxall HK, Bown PR, Lear CH. 2008.
Extinction and environmental change across the Eocene-Oligocene boundary in
Tanzania. Geology 36: 179-182.

!!
! 45!
Pfennig DW, Servedio MR. 2013. The role of transgenerational epigenetic inheritance in
diversification and speciation. Non-genetic Inheritance 1: 17-26.
Phillips SJ, Anderson RP, Schapire RE. 2006. Maximum entropy modeling of species
geographic distributions. Ecological Modelling 190: 231-259.
R Core Team. 2014. R: A Language and Environment for Statistical Computing. R
Foundation for Statistical Computing. Vienna, Austria.
Rabosky DL. 2009. Heritability of Extinction Rates Links Diversification Patterns in Molecular
Phylogenies and Fossils. Systematic Biology 58: 629-640.
Rabosky DL. 2010. Extinction rates should not be estimated from molecular phylogenies.
Evolution 64: 1816-1824.
Rabosky DL. 2014. Automatic Detection of Key Innovations, Rate Shifts, and Diversity-
Dependence on Phylogenetic Trees. PLoS ONE 9: e89543.
Rabosky DL, Donnellan SC, Grundler M, Lovette IJ. 2014. Analysis and Visualization of
Complex Macroevolutionary Dynamics: An Example from Australian Scincid Lizards.
Systematic Biology 63: 610-627.
Rambaut A, Drummond AJ. 2007. Tracer v1.5, Available from
http://tree.bio.ed.ac.uk/software/tracer/
Räsänen ME, Salo JS, Jungner H, Pittman LR. 1990. Evolution of the western Amazonian
lowland relief: impact of Andean foreland dynamics. Terra Nova 2: 320-332.
Räsänen M, Neller R, Salo J, Jungner H. 1992. Recent and ancient fluvial deposition
systems in the Amazonian foreland basin, Peru. Geological Magazine 129: 293-306.
Rauscher JT. 2002. Molecular phylogenetics of the Espeletia complex (Asteraceae):
evidence from nrDNA ITS sequences on the closest relatives of an Andean adaptive
radiation. American Journal of Botany 89: 1074-1084.
Raven PH, Axelrod DI. 1974. Angiosperm biogeography and past continental movements.
Annals of the Missouri Botanical Garden 61: 539–673.

!!
! 46!
Ree RH, Sanmartín I. 2009. Prospects and challenges for parametric models in historical
biogeographical inference. Journal of Biogeography 36: 1211-1220.
Ree RH, Smith SA. 2008. Maximum likelihood inference of geographic range evolution by
dispersal, local extinction, and cladogenesis. Systematic Biology 57: 4-14.
Ree RH, Moore BR, Webb CO, Donoghue MJ. 2005. A likelihood framework for inferring the
evolution of geographic range on phylogenetic trees. Evolution 59: 2299-2311.
Renner SS. 2004. Tropical trans-Atlantic disjunctions, sea surface currents, and wind
patterns. Interantional Journal of Plant Sciences 165: S23-S33.
Ricklefs RE. 2004. A comprehensive framework for global patterns in biodiversity. Ecology
Letters 7: 1-15.
Ricklefs RE. 2007. Estimating diversification rates from phylogenetic information. Trends in
Ecology and Evolution 22: 601-610.
Rieseberg LH, Willis JH. 2007. Plant Speciation. Science 317: 910-914.
Rull V. 2008. Speciation timing and neotropical biodiversity: the Tertiary-Quaternary debate
in the light of molecular phylogenetic evidence. Molecular Ecology 17: 2722-2729.
Rull V. 2011. Neotropical biodiversity: timing and potential drivers. Trends in Ecology and
Evolution 26: 508-513.
Sakai S, Kato M, Inoue T. 1999. Three pollination guilds and variation in floral characteristics
of bornean gingers (Zingiberaceae And Costaceae). American Journal of Botany 86:
646-658.
Salzman S, Driscoll HE, Renner T, André T, Shen S, Specht CD. Spiraling into history: A
molecular phylogeny and investigation of biogeographic origins and floral evolution for
the genus Costus L. Systematic Botany in press.
Särkinen TE, Newman MF, Maas PJM, Maas H, Poulsen AD, Harris DJ, Richardson JE,
Clark A, Hollingsworth M, Pennington RT. 2007. Recent oceanic long-distance dispersal
and divergence in the amphi-Atlantic rain forest genus Renealmia L.f. (Zingiberaceae).
Molecular Phylogenetics and Evolution 44: 968-980.

!!
! 47!
Schluter D. 2000. Ecological character displacement in adaptive radiation. American
Naturalist 156: S4-S16.
Seehausen O. 2004. Hybridization and adaptive radiation. Trends in Ecology and Evolution
19: 198-207.
Shaw J, Lickey EB, Schilling EE, Small RL. 2007. Comparison of whole chloroplast genome
sequences to choose noncoding regions for phylogenetic studies in angiosperms: the
tortoise and the hare III. American Journal of Botany 94: 275-288.
Silvestro D, Schnitzler J, Zizka G. 2011. A Bayesian framework to estimate diversification
rates and their variation through time and space. BMC Evolutionary Biology 11: 311.
Soltis DE, Soltis PS. 1999. Polyploidy: Recurrent formation and genome evolution. Trends in
Ecology and Evolution 14: 348–352.
Soltis DE, Soltis PS, Tate JA. 2003. Advances in the study of polyploidy since ‘Plant
Speciation’. New Phytologist 161: 173-191.
Specht CD. 2006a. Gondwanan vicariance or dispersal in the tropics? The biogeographic
history of the tropical monocot family Costaceae (Zingiberales). Aliso 22: 633-644.
Specht CD. 2006b. Systematics and evolution of the tropical monocot family Costaceae
(Zingiberales): A multiple dataset approach. Systematic Botany 31: 89-106.
Specht CD, Kress WJ, Stevenson DW, DeSalle R. 2001. A molecular phylogeny of
Costaceae (Zingiberales). Molecular Phylogenetics and Evolution 21: 333-345.
Specht CD, Yockteng R, Almeida AMR, Kirchoff BK, Kress JW. 2012. Homoplasy,
Pollination, and Emerging Complexity During the Evolution of Floral Development in the
Tropical Gingers (Zingiberales). Botanical Review. 78:440-462.
Stebbins Jr GL. 1959. The role of hybridization in evolution. Proceedings of the American
Philosophical Society 103: 231-251.
Taberlet P, Gielly L, Pantou G, Bouvet J. 1991. Universal primers for amplification of three
non-coding regions of chloroplast DNA. Plant Molecular Biology 17: 1105-1109.
!!
! 48!
Thiers B. [continuously updated]. Index Herbariorum: A global directory of public herbaria
and associated staff. New York Botanical Garden's Virtual Herbarium.
http://sweetgum.nybg.org/ih/
Toon A, Cook LG, Crisp MD. 2014. Evolutionary consequences of shifts to bird-pollination in
the Australian pea-flowered legumes (Mirbelieae and Bossiaeeae). BMC Evolutionary
Biology 14: 43
Turchetto-Zolet AC, Pinheiro F, Salgueiro F, Palma-Silva C. 2013. Phylogeographical
patterns shed light on evolutionary process in South America. Molecular Ecology 22:
1193-1213.
Wagner N, Silvestro D, Brie D, Ibisch PL, Zizka G, Weising K, Schulte K. 2013. Spatio-
temporal evolution of Fosterella (Bromeliaceae) in the Central Andean biodiversity
hotspot. Journal of Biogeography 40: 869-880.
Wendt T, Canela MBF, Klein DE, Rios RI. 2002. Selfing facilitates reproductive isolation
among three sympatric species of Pitcairnia (Bromeliaceae). Plant Systematics and
Evolution 232: 201-212.
Wendt T, Coser TS, Matallana G, Guilherme FAG. 2008. An apparent lack of prezygotic
reproductive isolation among 42 sympatric species of Bromeliaceae in southeastern
Brazil. Plant Systematics and Evolution 275: 31-41.
Werner GDA, Cornwell WK, Sprent JI, Kattge J, Kiers ET. 2014. A single evolutionary
innovation drives the deep evolution of symbiotic N2-fixation in angiosperms. Nature
Communications 5: 4087.
Wesselingh FP, Salo J. 2006. A Miocene perspective on the evolution of Amazonian biota.
Scripta Geologica, 133: 439-458.
White TJ, Bruns T, Lee S, Taylor J. 1990. Amplification and direct sequencing of fungal
ribosomal RNA genes for phylogenetics. Pp. 315-322 in PCR protocols: A guide to
methods and applications. Innis M, Gelfand D, Sninsky J, White T (Eds). San Diego:
Academic Press.

!!
! 49!
Wing SL, Herrera F, Jaramillo CA, Gómez-Navarro C, Wilf P, Labandeira CC. 2009. Late
Paleocene fossils from the Cerrejón Formation, Colombia, are the earliest record of
Neotropical rainforest. Proceedings of the National Academy of Sciences USA 106:
18627-18632.
Zachos J, Pagani M, Sloan L, Thomas E, Billups K. 2001. Trends, rhythms, and aberrations
in global climate 65 Ma to present. Science 292: 686-693.

!!
! 50!
!!
! 51!
Chapter 3 – Spiraling into history: A molecular phylogeny and investigation of
biogeographic origins and floral evolution for the genus Costus L.
Shayla Salzman,1, 2 Heather E. Driscoll,1,3 Tanya Renner,1,4 Thiago André,1,5 Stacy Shen,1
and Chelsea D. Specht1,6
1 – Departments of Plant and Microbial Biology and Integrative Biology and The University
and Jepson Herbaria, University of California at Berkeley, Berkeley CA, U.S.A.
2 – Current address: Department of Organismic and Evolutionary Biology, Harvard
University, Cambridge MA, U.S.A.
3 – Current address: Vermont Genetics Network, Department of Biology and Physical
Education, Norwich University, Northfield VT, U.S.A.
4 – Current address: Center for Insect Science and the Department of Entomology,
University of Arizona, Tucson AZ, U.S.A.
5 – Current address: Laboratório Integrado de Sistemática Vegetal, Departamento de
Botânica, Universidade Federal do Rio de Janeiro, Rio de Janeiro RJ, Brazil
6 – Author for Correspondence ([email protected])
*manuscript accepted in Systematic Botany
(ISSN, Print: 0363-6445; Online: 1548-2324)

!!
! 52!
Abstract
Rapid radiations are notoriously difficult to resolve, yet understanding phylogenetic patterns
in such lineages can be useful for investigating evolutionary processes associated with
bursts of speciation and morphological diversification. Here we present an expansive
molecular phylogeny of Costus L. (Costaceae Nakai) with a focus on the Neotropical species
within the clade, sampling 47 of the known 51 Neotropical species and including five
molecular markers for phylogenetic analysis (ITS, ETS, rps16, trnL-F, and CaM). We use the
phylogenetic results to investigate shifts in pollination syndrome, with the intention of
addressing potential mechanisms leading to the rapid radiation documented for this clade.
Our ancestral reconstruction of pollination syndrome presents the first evidence in this genus
of an evolutionary toggle in pollination morphologies, demonstrating both the multiple
independent evolutions of ornithophily (bird pollination) as well as reversals to melittophily
(bee pollination). We show that the ornithophilous morphology has evolved at least eight
times independently with four potential reversals to melittophilous morphology, and confirm
prior work showing that neither pollination syndrome defines a monophyletic lineage. Based
on the current distribution for the Neotropical and African species, we reconstruct the
ancestral distribution of the Neotropical clade to the Pacific Coast of Mexico and Central
America. Our results indicate an historic dispersal of a bee-pollinated taxon from Africa to
the Pacific Coast of Mexico/Central America, with subsequent diversification leading to the
evolution of a bird-pollinated floral morphology in multiple derived lineages.
!!
! 53!
3.1. Introduction
Costus L. is a pantropical genus in the monocot family Costaceae. Costus is the most
diverse genus within the Costaceae, with approximately 80 species in total. It comprises two
main biogeographic groups; a paraphyletic assemblage of low-diversity clades native to
tropical Africa and a large derived clade containing approximately 51 species and distributed
exclusively in the Neotropics. The derived Neotropical clade appears to have arisen from a
single long distance dispersal event from Africa occurring approximately 34 ma (Specht
2006b). Costus species can be recognized by their characteristic monistichous spiral
phyllotaxy, tubular sheathing leaf bases each with a pronounced ligule, and terminal (mostly)
inflorescences with imbricate bracts arranged in several series of parastichies. While most
species are terrestrial rhizomatous herbs, a few African species are epiphytic (C. talbotii, C.
lateriflorus) and these have axillary rather than terminal inflorescences. Costus range in
vegetative height from less that one meter to over 3 m tall. They tend to grow most
abundantly in moist low-lands, wet-thickets, clearings or stream beds at relatively low
elevations (< 800 m) but some species have been collected at 2,000 m above sea level.
The evolution of two specific pollination syndromes sets Costus apart from other
genera in the family (Kay et al. 2006). Ornithophilous (hummingbird attracting) Costus have
inflorescences constructed of mostly red, orange or yellow bracts and flowers with narrow,
tubular openings. Melittophilous (bee attracting) Costus have mostly green-bracted
inflorescences and flowers with a wider floral opening and a broad labellum that is white or
yellow with distinct red or purple stripes forming a ‘landing platform’ (Fig. 1). These
morphologies have been shown to be consistent with hummingbird and bee pollination
respectively (Kay and Schemske 2003) and such morphology-based signaling appears to be
more important than reward for defining pollination type, as both types of flowers produce
copious nectar (see Thomson and Wilson 2008). Work done in Bornean gingers
(Zingerberaceae and Costaceae) found no significant difference in sugar concentration
between hummingbird and bee pollinated flowers but a highly elevated daily sugar

!!
! 54!
production in hummingbird plants (Sakai et al. 1999). However, this has not been
investigated within Costus alone. Previous work shows that bee pollination originally evolved
in Africa and is ancestral to the Neotropical clade (Specht et al. 2001; Kay et al. 2005;
Specht 2006b), and that hummingbird pollination is derived within the Neotropical clade and
has evolved at least seven times independently (Specht 2006a).
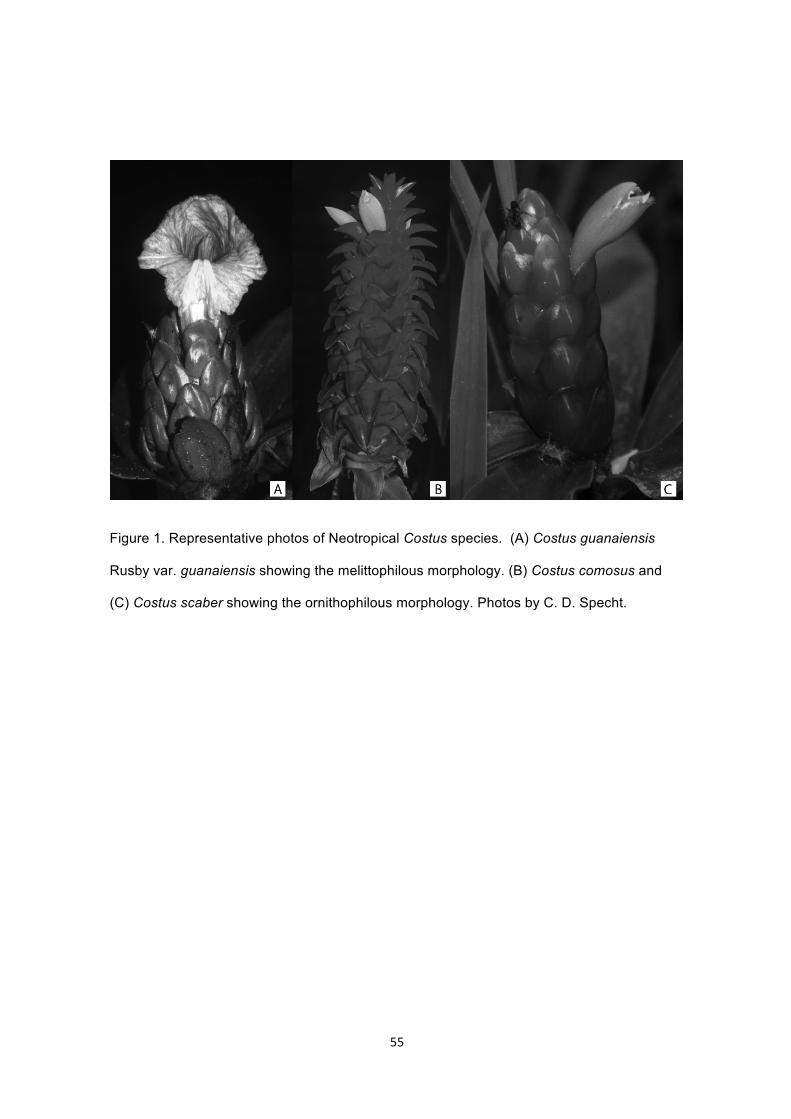
!!
! 55!
Figure 1. Representative photos of Neotropical Costus species. (A) Costus guanaiensis
Rusby var. guanaiensis showing the melittophilous morphology. (B) Costus comosus and
(C) Costus scaber showing the ornithophilous morphology. Photos by C. D. Specht.

!!
! 56!
It has been suggested that shifts in pollinator-specific morphologies may account for
the rapid radiation seen in the Neotropical clade (Kay et al. 2005). Indeed, diversification
rates with in the New World Costus clade have been shown to be the second highest in the
family, just behind the Asian genus Tapeinochilos Miq. (Specht 2005). Within Costaceae,
Tapeinochilos is the only other genus with species displaying a distinct bird-pollination
syndrome, associated with pollination by native sunbirds (O. Gideon pers. comm.).
Fossil calibrated molecular dating analyses using chloroplast markers (trnL-F and
trnK) puts the diversification of Costus at around 40 million years ago (ma) with early
diverging lineages occurring exclusively in Africa and maintaining a plesiomorphic floral
morphology that is neither specifically associated with bee nor hummingbird pollination
(Specht 2006b). Melittophilous Costus are suggested to have evolved around 34 ma. One of
these melittophilous Costus dispersed to the New World, and the fossil calibrated dating
places the New World radiation at around 22 ma (Specht 2006b) with both floral forms
present by 20 ma. An ITS molecular clock analysis suggests that the Neotropical
diversification occurred much more rapidly, with the ca. 50 species diversifying within the last
four million years (Kay et al. 2005). Parsimony ancestral state reconstruction using broad
geographic species ranges placed the dispersal from Africa to Central America (Kay et al.
2005).
Here we present a phylogenetic hypothesis for the genus Costus with expanded
taxon sampling, including 47 of approximately 51 Neotropical taxa, and increased character
sampling including chloroplast (rps16, trnL-F), nuclear (CaM), and nuclear ribosomal (ITS,
ETS) molecular data. We analyze ancestral pollination syndromes using Bayesian,
maximum parsimony, and maximum likelihood approaches and investigate biogeographic
patterns of dispersal and vicariance using narrowly defined geographic ranges for ancestral
area reconstruction. We confirm the multiple independent origins of the melittophilous and

!!
! 57!
ornithophilous morphologies, and show the first evidence for reversal from ornithophilous to
melittophilous morphology. We hypothesize that the origin and evolution of these specific
pollination-driven morphologies are important contributors to the rapid radiation seen in this
clade.
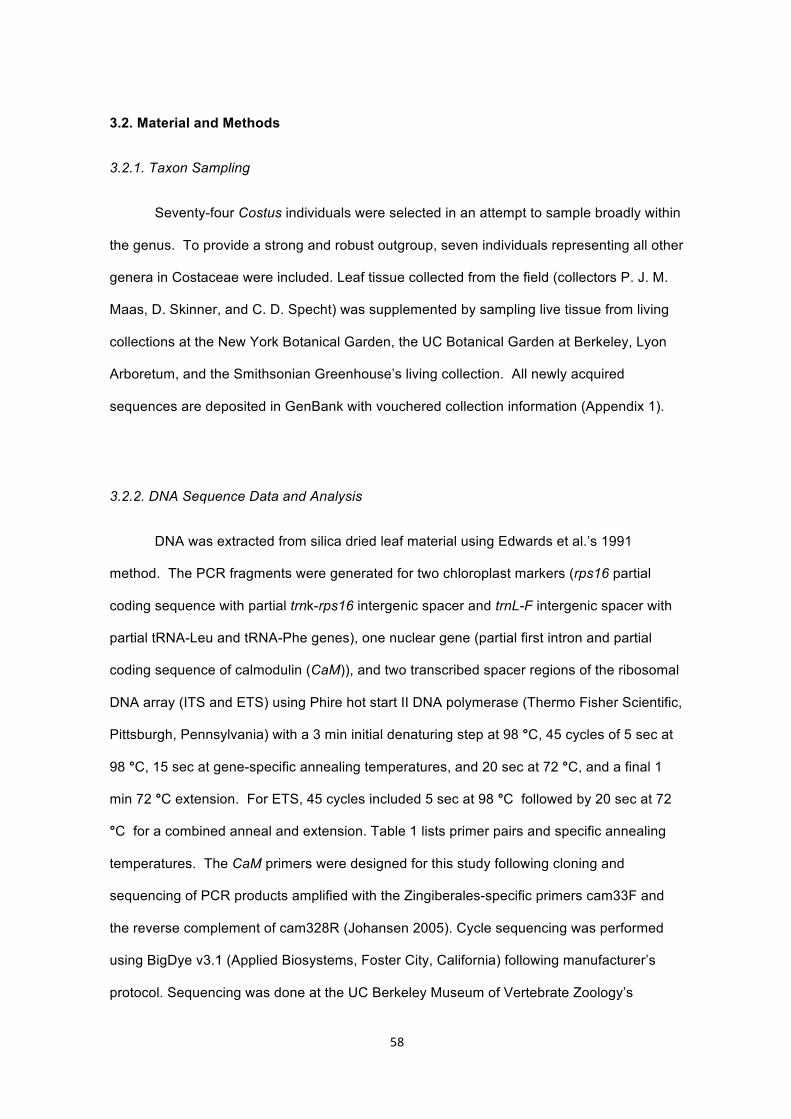
!!
! 58!
3.2. Material and Methods
3.2.1. Taxon Sampling
Seventy-four Costus individuals were selected in an attempt to sample broadly within
the genus. To provide a strong and robust outgroup, seven individuals representing all other
genera in Costaceae were included. Leaf tissue collected from the field (collectors P. J. M.
Maas, D. Skinner, and C. D. Specht) was supplemented by sampling live tissue from living
collections at the New York Botanical Garden, the UC Botanical Garden at Berkeley, Lyon
Arboretum, and the Smithsonian Greenhouse’s living collection. All newly acquired
sequences are deposited in GenBank with vouchered collection information (Appendix 1).
3.2.2. DNA Sequence Data and Analysis
DNA was extracted from silica dried leaf material using Edwards et al.’s 1991
method. The PCR fragments were generated for two chloroplast markers (rps16 partial
coding sequence with partial trnk-rps16 intergenic spacer and trnL-F intergenic spacer with
partial tRNA-Leu and tRNA-Phe genes), one nuclear gene (partial first intron and partial
coding sequence of calmodulin (CaM)), and two transcribed spacer regions of the ribosomal
DNA array (ITS and ETS) using Phire hot start II DNA polymerase (Thermo Fisher Scientific,
Pittsburgh, Pennsylvania) with a 3 min initial denaturing step at 98 °C, 45 cycles of 5 sec at
98 °C, 15 sec at gene-specific annealing temperatures, and 20 sec at 72 °C, and a final 1
min 72 °C extension. For ETS, 45 cycles included 5 sec at 98 °C followed by 20 sec at 72
°C for a combined anneal and extension. Table 1 lists primer pairs and specific annealing
temperatures. The CaM primers were designed for this study following cloning and
sequencing of PCR products amplified with the Zingiberales-specific primers cam33F and
the reverse complement of cam328R (Johansen 2005). Cycle sequencing was performed
using BigDye v3.1 (Applied Biosystems, Foster City, California) following manufacturer’s
protocol. Sequencing was done at the UC Berkeley Museum of Vertebrate Zoology’s

!!
! 59!
Evolutionary Genetics Laboratory (EGL) on an Applied Biosystems 3730xl DNA analyzer.
Reads were assembled and edited and multiple sequence alignments generated in
Geneious (v5.6.3) using the Geneious alignment algorithm. Manual alignment editing was
done in Geneious (v5.6.3) and Mesquite (Maddison and Maddison 2011).
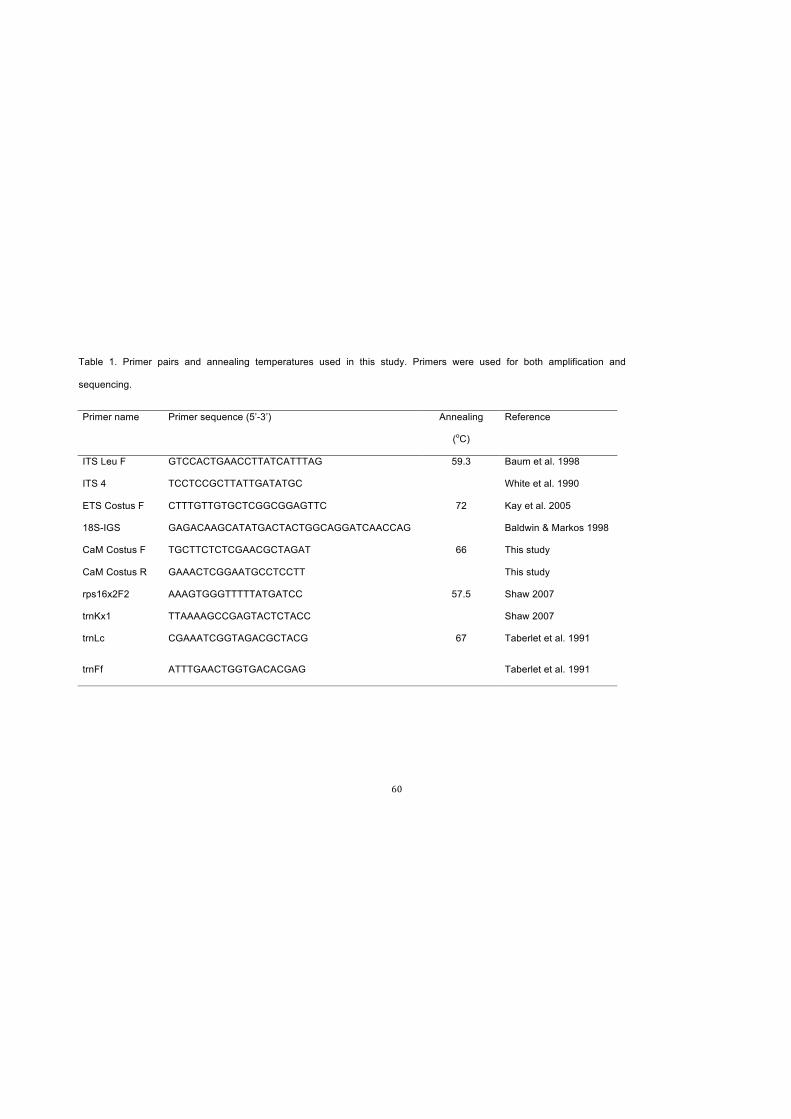
! 60!
Table 1. Primer pairs and annealing temperatures used in this study. Primers were used for both amplification and
sequencing.
Primer name Primer sequence (5’-3’) Annealing
(oC)
Reference
ITS Leu F GTCCACTGAACCTTATCATTTAG 59.3 Baum et al. 1998
ITS 4 TCCTCCGCTTATTGATATGC White et al. 1990
ETS Costus F CTTTGTTGTGCTCGGCGGAGTTC 72 Kay et al. 2005
18S-IGS GAGACAAGCATATGACTACTGGCAGGATCAACCAG Baldwin & Markos 1998
CaM Costus F TGCTTCTCTCGAACGCTAGAT 66 This study
CaM Costus R GAAACTCGGAATGCCTCCTT This study
rps16x2F2 AAAGTGGGTTTTTATGATCC 57.5 Shaw 2007
trnKx1 TTAAAAGCCGAGTACTCTACC Shaw 2007
trnLc CGAAATCGGTAGACGCTACG 67 Taberlet et al. 1991
trnFf ATTTGAACTGGTGACACGAG Taberlet et al. 1991
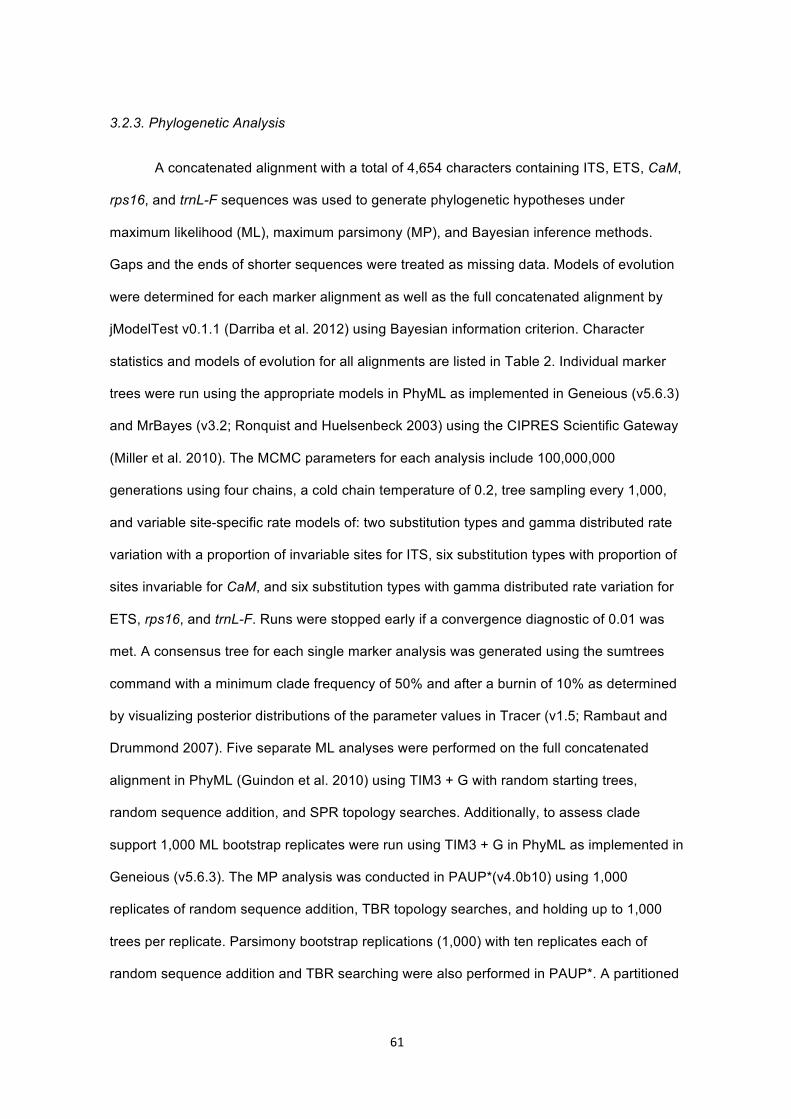
!!
! 61!
3.2.3. Phylogenetic Analysis
A concatenated alignment with a total of 4,654 characters containing ITS, ETS, CaM,
rps16, and trnL-F sequences was used to generate phylogenetic hypotheses under
maximum likelihood (ML), maximum parsimony (MP), and Bayesian inference methods.
Gaps and the ends of shorter sequences were treated as missing data. Models of evolution
were determined for each marker alignment as well as the full concatenated alignment by
jModelTest v0.1.1 (Darriba et al. 2012) using Bayesian information criterion. Character
statistics and models of evolution for all alignments are listed in Table 2. Individual marker
trees were run using the appropriate models in PhyML as implemented in Geneious (v5.6.3)
and MrBayes (v3.2; Ronquist and Huelsenbeck 2003) using the CIPRES Scientific Gateway
(Miller et al. 2010). The MCMC parameters for each analysis include 100,000,000
generations using four chains, a cold chain temperature of 0.2, tree sampling every 1,000,
and variable site-specific rate models of: two substitution types and gamma distributed rate
variation with a proportion of invariable sites for ITS, six substitution types with proportion of
sites invariable for CaM, and six substitution types with gamma distributed rate variation for
ETS, rps16, and trnL-F. Runs were stopped early if a convergence diagnostic of 0.01 was
met. A consensus tree for each single marker analysis was generated using the sumtrees
command with a minimum clade frequency of 50% and after a burnin of 10% as determined
by visualizing posterior distributions of the parameter values in Tracer (v1.5; Rambaut and
Drummond 2007). Five separate ML analyses were performed on the full concatenated
alignment in PhyML (Guindon et al. 2010) using TIM3 + G with random starting trees,
random sequence addition, and SPR topology searches. Additionally, to assess clade
support 1,000 ML bootstrap replicates were run using TIM3 + G in PhyML as implemented in
Geneious (v5.6.3). The MP analysis was conducted in PAUP*(v4.0b10) using 1,000
replicates of random sequence addition, TBR topology searches, and holding up to 1,000
trees per replicate. Parsimony bootstrap replications (1,000) with ten replicates each of
random sequence addition and TBR searching were also performed in PAUP*. A partitioned

!!
! 62!
Bayesian analysis was performed on the concatenated alignment using the same models for
each partition as described for individual marker analyses and the same MCMC parameters,
with the exception of the temperature parameter (here set to 0.1). A consensus tree was
generated using the sumtrees command with a minimum clade frequency of 50% and after a
burnin of 10% as determined by visualizing posterior distributions of the parameter values in
Tracer (v1.5; Rambaut and Drummond 2007). Phylogenetic analyses and alignments are
accessible on TreeBASE (study number TB2:S16238).
Table 2. Character values and models of evolution for each marker and the concatenated
alignment.
Marker Number of Characters
Proportion of Missing
Data
Parsimony Informative Characters
Constant Characters
Model of Evolution
ITS 841 0.0958 219 393 K80+I+G ETS 651 0.1228 291 210 TPM2uf+G CaM 818 0.1207 247 381 TPM3+I rps16 1164 0.1270 45 924 TPM1uf+G trnL-F 1180 0.1230 59 949 TrN+G Concatenated 4654 0.1191 861 2857 TIM3+G
3.2.4. Ancestral State Reconstruction Analysis
The topology recovered in the ML analysis (Fig. 2) was used for reconstructing
ancestral character states for pollination syndrome and to reconstruct ancestral areas based
on current distributions. The Bayesian phylogeny showed a slightly different topology
(discussed below) and was also used for ancestral state reconstruction; in this case,
polytomies were resolved to have branch lengths of 0 prior to analyses using the Mesquite
command ‘resolve polytomies.’ Pollination type was coded as generalist, bee, or bird based
on the pollination syndrome morphologies tested by Kay and Schemske (2003; Fig. 1).
Models of pollination rate shift variation were tested in BayesTraits (Pagel and Meade
2004a). All rate shifts were found to be independent. Shifts between generalist and bee or

!!
! 63!
between generalist and bird were below 10 and shifts between bee and bird were above
100. Ancestral state reconstruction for pollination syndrome was tested using a ML
approach. Rates were permitted to be independent and vary in both Mesquite using
StochChar model Mk1 with a decision threshold of 2.0 (Maddison and Maddison 2006) and
in BayesTraits using BayesMultiState (Pagel et al. 2004). Bayesian reconstruction was also
tested in BayesTraits using BayesMultiState with 5,050,000 generations with sampling every
300. A prior of uniform distribution of 0-10 was designated for rates between generalist
pollination and either bird or bee, while a prior of uniform distribution of 50-150 was set for
rates between bee and bird. The rate deviation was set to 15 so as to allow for an
acceptance rate of around 20 percent for new models with each generation. Bayesian
results were tested for statistical significance using the Bayes factor test of twice the
difference between the harmonic means of runs, where the node in question was forced as
bee and then as bird pollination. Any positive value favors the model; a value greater than
(>) two is positive evidence, > five is strong evidence, and > 10 is very strong evidence for
the model. Similarly, the significance of likelihood values given in BayesTraits analyses were
tested using the likelihood ratio test. A significant result is defined as the difference of at
least two log likelihood scores between runs when the node in question was forced as either
bee or bird pollination (Pagel 1999).
Current distributions for all Costus species sampled were assembled as point data
using locality data from the Global Biodiversity Information Facility (GBIF), and point data
were coded as pertaining to any of 14 individual geographic ecoregions (Olsen et al. 2001;
see map, Fig. 2). Data points from GBIF were culled from inclusion (assumed erroneous)
when only one collection for a given species was found in any particular ecoregion, unless
the collection was positively identified and expertly curated. Ancestral distribution was tested
with statistical dispersal-vicariance analysis (S-DIVA) (Yu et al. 2010) and Bayesian
analyses in reconstruct ancestral state in phylogenies (RASP) (Yu et al. 2012). The S-DIVA
reconstruction was set to a maximum of four possible ancestral distribution areas and the

!!
! 64!
bound and hold values were allowed to be the maximum. RASP’s Bayesian binary method
includes two models, the fixed character state JC model and the estimated character state
F81 model. As distributions gathered from GBIF are extensive yet may not cover the breadth
of distribution, both were tested and with and without gamma distribution. All runs used a
wide root distribution at 50,000 generations, sampling every 100, using 10 chains, with a
cold chain temperature of 0.1 and a maximum of four possible ancestral distribution areas.
Additionally, elevations were acquired for the GBIF data points using ArcGIS 9.3 elevation
and imagery data and tested for correlation with pollination syndrome using BayesTraits
(Pagel et al. 2004). A MCMC of 1,010,000 generations was run twice using a continuous
random walk model with autotune rate deviation and a uniform prior of 0 to 1,500 for alpha-
elevation and a uniform prior of 0 to 2 for alpha-pollination. The two runs were compared
after a burnin of 10,000 and the significance of positive or negative correlation was tested
with the Bayes factor test.
3.2.5. Diversification Analysis
The topology recovered in the ML analyses was tested for shifts in diversification
rates using Bayesian analysis of macroevolutionary mixtures (BAMM) version 2.0.0
(Rabosky 2014) and analyzed using BAMMtools version 1.0.1 (Rabosky et al. 2014). The
ML tree was first trimmed of outgroup taxa and made ultrametric using the R package ape
version 3.1-2 (Paradis et al. 2004). Bayesian priors for BAMM were determined with
setBAMMpriors in BAMMtools. 1,000,000,000 generations were tested for convergence with
the coda package (Plummer et al. 2006) in R after a burnin of ten percent.

!!
! 65!
3.4. Results
3.4.1. Molecular Data and Phylogenetic Inference
Single-marker Bayesian and ML trees show similar assemblages of African Costus
taxa and a monophyletic Neotropical clade (data available in TreeBASE TB2:S16238).
However, relationships among African clades and within Neotropical Costus are unresolved
and/or poorly supported in most single marker topologies. Despite some discordance at the
single-marker level, well supported nodes were largely congruent and the cumulative signal
from the concatenated data yielded well-supported trees in Bayesian and ML analyses. As a
result, a multi-marker approach was favored to maximize phylogenetic information (Smith
2000). The following results and discussion are based on analyses using the concatenated
alignment.
The ML tree (one of five topologically identical random starts maximum likelihood
trees of a concatenated alignment of ITS, ETS, CaM, trnL-F, and rps16 using TIM3 with
gamma distribution) has a log-likelihood of -23,899.35952 (Fig. 2). The 1,000 replication ML
bootstrap consensus tree, using TIM3 with gamma distribution, gave largely the same
topology with low bootstrap support scattered across the Neotropical Costus clade.
The MP analysis of the full data set resulted in 707,000 most parsimonious trees with
a score L = 3,027. A strict consensus of these trees supports a number of clades (Fig. 2,
bold) with further 50% consensus support (Fig. 2, bold grey). The parsimony bootstrap
obtained low support values scattered across the tree, however overall the topology does
not disagree with the ML tree with the exception of a few relationships discussed below.
The combined Bayesian analysis shows an average standard deviation of split
frequencies between the two runs of 0.0047 at 100,000,000 generations. After a burnin of
10%, the remaining 180,020,000 trees have a mean log likelihood of -22,178.236 with an
effective sample size of 17,281. All other statistics between runs have mean values with

!!
! 66!
effective sample sizes greater than 16,500. The topology reconstructed by Bayesian
analysis largely supports the ML tree. The exceptions are discussed further below.
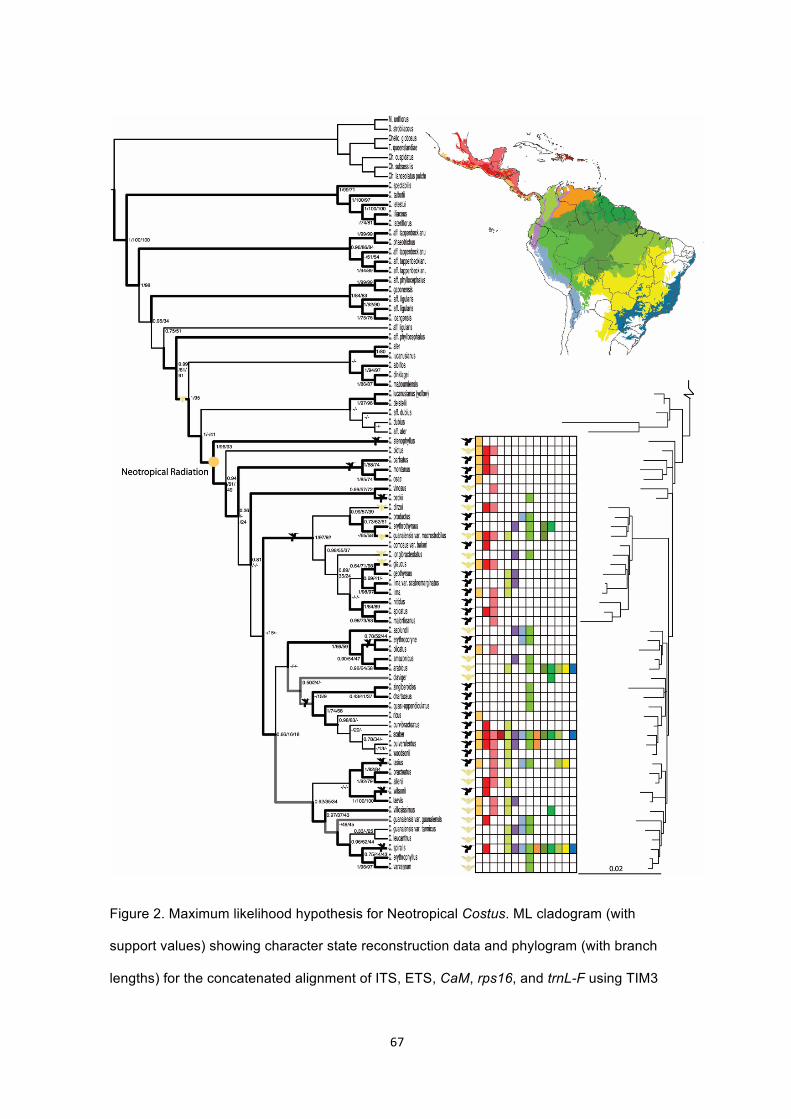
!!
! 67!
Figure 2. Maximum likelihood hypothesis for Neotropical Costus. ML cladogram (with
support values) showing character state reconstruction data and phylogram (with branch
lengths) for the concatenated alignment of ITS, ETS, CaM, rps16, and trnL-F using TIM3

!!
! 68!
with gamma distribution and log likelihood score of -23,944. Support values at nodes are
Bayesian posterior probabilities, ML, and MP bootstrap proportions. Nodes supported by a
PAUP* strict consensus of 707,000 most parsimonious trees are shown in bold with 50%
consensus in bold grey. Distributions were obtained from herbaria records housed in the
Global Biodiversity Information Facility. Ecoregions are based on the World Wildlife Fund’s
ecoregion designations (Olsen et al. 2001). Ancestral distribution for the Neotropical clade
indicated (Pacific Coast of Mexico and Central America) based on S-DIVA and MCMC
algorithms implemented in RASP. ML reconstructions performed in Mesquite and
BayesTraits are indicated: shifts to ornithophilous morphology are denoted with
hummingbirds and shifts to melittophilous morphology denoted with bees. Extant pollination
syndromes are denoted with hummingbirds or bees at tips.
!!
! 69!
3.4.2. Phylogenetic Relationships
Costus is reconstructed as monophyletic, with African species forming numerous
small clades as early diverging lineages (Fig. 2). The New World clade is monophyletic and
sister to a clade of African species with a bee-pollinated morphology. Small differences in
relationships suggested by each of the phylogenetic methods make clear that further
nucleotide sampling is necessary to completely resolve species relationships within the
Neotropical lineage. However, questions regarding ancestral distribution and pollination
shifts in the Neotropical clade can be addressed given the resolution acquired. Taxa that
show different placement or form polytomies when using different inference methods are
discussed below.
In the Old World, C. dubius is strongly supported as sister to the C. albiflos/C.
maboumiensis clade in the Bayesian tree (1 posterior probability) and the MP strict
consensus tree. This relationship is weakly supported in the ML tree (BS 49%), yet remains
sister to C. maculatus (a proposed synonym for C. dubius) in all ML runs.
Within the Neotropical lineage, the clade formed by C. vinosus and C. beckii is
weakly supported as sister to the C. dirzoi/C. malortieanus clade in parsimony (BS 21%) and
Bayesian (PP 0.62). Interestingly, however, these two taxa are placed as sister to the
remainder of the New World clade in the ML tree. While C. longebracteolatus clearly
belongs in the C. glaucous/C. malortieanus clade as supported by all methods, its exact
placement is unresolved. Similarly, the placement of the C. asplundii/C. arabicus clade is
unresolved, as Bayesian and ML bootstrap methods very weakly support it as sister to the C.
claviger/C. woodsonii clade (0.22 posterior probability and 16% respectively), while
parsimony methods maintain a polytomy among these taxa. Finally, it is unclear if the C.
laevis/C. wilsonii clade is indeed sister (ML) to the C. lasius/C. allenii clade, as other
inference methods very weakly support it as sister to the larger C. lasius/C. varzearum clade
(0.35 PP, MLBS 35%, MPBS 19%).

!!
! 70!
We feel most confident with the topology represented in the ML tree as, in the four
cases discussed, only the C. vinosus/C. beckii clade shows a different placement altogether.
The other three cases resolved in the ML tree are merely unresolved with other methods,
which could be expected as rapid radiations may not have sufficient data to inform the priors
in Bayesian analysis. However, because these differences were seen between the ML tree
and the Bayesian tree, ancestral pollination reconstruction was run on both, specifically to
investigate if the placement of the C. vinosus/C. beckii clade would affect the number of
hypothesized ancestral character state shifts in pollination syndrome.
3.4.3. Ancestral Character State Reconstruction: Pollination Syndromes
A presumed generalist pollination morphology is recovered as ancestral to the genus,
with a monophyletic shift to a melittophilous morphology within the Old World grade (Fig. 3;
Fig. 4). We recognize that generalist pollination used as the plesiomorphic state may reflect
a lack of knowledge of the pollination biology of the early diverging lineages within the
Costaceae (ex. Dimerocostus, Monocostus and Chamaecostus) which have been
historically treated as generalists because pollination syndromes based on flower
morphology are not conclusive for these lineages, as with the melittophilous and
ornithophilous pollination syndromes of Costus tested by Kay and Schemske (2003). The
monophyletic New World clade was reconstructed as being ancestrally melittophilous,
despite the resolution of ornithophilous taxon C. stenophyllus as the sister to all remaining
Neotropical Costus: this result indicates that bird pollination evolved in C. stenophyllus after
it diverged from the remaining taxa. Based on our recovered topology, there have been up to
nine shifts to hummingbird pollination morphology from the bee-pollinated ancestral form,
with four reversals to a bee pollination syndrome (Fig. 2). Pollination syndromes were weakly
correlated with elevations. The MCMC run showed an average correlation coefficient, R, of

!!
! 71!
0.2 with a standard deviation of 0.01. This correlation is positively supported with a Bayes
factor of 2.78.

!!
! 72!
Figure 3. Reconstruction of ancestral character states for morphology-based pollination
syndrome on ML tree. Generalist, melittophilous and ornithophilous morphologies are
indicated with likelihood support values from Mesquite and BayesTraits and posterior
probabilities from BayesTraits.

!!
! 73!
Figure 4. Reconstruction of ancestral character states for morphology-based pollination
syndrome on Bayesian tree. Generalist, melittophilous, and ornithophilous morphologies are
indicated with likelihood support values from Mesquite and BayesTraits and posterior
probabilities from BayesTraits.

!!
! 74!
3.4.4. Pollination Syndromes Reconstructed on ML Phylogeny
Overall, reconstruction of ancestral character states on the ML tree recover much
stronger statistical significance for nodes tested than are recovered on the Bayesian tree.
The ML pollination syndrome reconstruction tree (Fig. 3) has a negative log likelihood of
69.57 and a rate of 21.479 as determined by the Mk1 model in Mesquite. Bayesian runs had
an average acceptance rate of new models for each generation of 19% showing ideal mixing
of chains. Reconstruction with Mesquite supports nodes along the backbone as statistically
significant for both ornithophilous and melittophilous morphologies even with moderately
high likelihoods pointing to bee pollination. Reconstructed ancestral morphlogies of the
more derived clades, except for C. chartaceus/C. woodsonii (discussed below), are
statistically supported as follows: hummingbird pollination syndrome for the ancestor of the
clade containing C. dirzoi/C. lima; hummingbird for C. dirzoi/C. erythrothyrsus; hummingbird
for C. comosus var. bakeri/C. lima; and bee pollination syndrome morphology for the
ancestor of C. laevis/C. varzearum (Fig. 3). The Bayes factor positively supports all tested
nodes with Bayes factors greater than 2 except for the ancestor of C. chartaceus and C.
woodsonii. However, this ancestor’s posterior probability of 0.95 for the hummingbird
morphology is highly supported (Bayes factor =1.88) and all extant taxa in this clade display
a hummingbird pollination morphology (Fig. 3; Table 3). The ancestor of C. dirzoi and C. lima
shows very strong evidence for having a hummingbird pollination morphology (Bayes factor
= 18.92; posterior probability = 0.77; Mesquite likelihood reconstruction = 0.95), but
interestingly, has only moderate support from BayesTraits likelihood reconstruction (delta
log-likelihood = 0.88; likelihood = 0.72). In fact, the three nodes tested in this C. dirzoi/C.
lima clade are supported as ornithophilous with Mesquite’s likelihood reconstruction, Bayes
factor test and BayesTraits (Fig. 3; Table 3). All three of these methods tested on the ML
tree support a total of nine shifts to the ornithophilous pollination syndrome with four
reversals to a melittophilous pollination syndrome in the C. dirzoi/C. lima clade.

! 75!
Table 3. BayesTraits ML probabilities, Bayesian posterior probabilities, and their support values at each
node tested for ancestral pollination reconstruction using the ML tree. Nodes supported as having
ancestral hummingbird pollination morphology are underlined.
Most Recent Common Ancestor of:
ML Probability
(Bee)
ML Probability
(Bird) Δ log-
likelihood
Posterior Probability
(Bee)
Posterior Probability
(Bird) Bayes Factor
stenophyllus/woodsonii 0.77 0.23 1.76 0.66 0.34 3.11
barbatus/ woodsonii 0.61 0.39 1.89 0.50 0.50 3.22
beckii/ woodsonii 0.80 0.20 1.90 0.73 0.27 3.32
dirzoi/ woodsonii 0.93 0.07 2.33 0.88 0.12 4.11
dirzoi/lima 0.28 0.72 0.88 0.23 0.77 18.92
dirzoi/erythrothyrsus 0.52 0.48 0.78 0.48 0.52 2.12
comosus v. bakeri/lima 0.23 0.76 1.07 0.19 0.81 2.99
laevis/ woodsonii 0.97 0.03 2.59 0.93 0.07 4.78
laevis/varzearum 0.99 0.01 3.10 0.98 0.02 6.85
asplundii/ woodsonii 0.59 0.41 2.61 0.50 0.50 4.72
chartaceus/ woodsonii 0.07 0.93 1.25 0.05 0.95 1.88

!!
! 76!
3.4.5. Pollination Syndromes Reconstructed on Bayesian Phylogeny
The Mesquite ML reconstruction on the Bayesian tree (Fig. 4) has a log likelihood of 69.02
and a rate of 20.96 as determined by the Mk1 model. Bayesian runs had an average
acceptance rate of new models for each generation of 21% again showing ideal mixing of
chains. Mesquite counts all nodes values as statistically significant for both hummingbird and
bee morphologies, supporting neither as exclusive, except for the three ancestors tested
within the C. dirzoi/C. lima clade, which are all statically significantly for hummingbird
pollination morphology. ML methods in BayesTraits only show strong statistical support for
the ancestor of C. laevis and C. varzearum as having bee pollination morphology, with
moderate to high support for bee pollination morphology in the ancestors of C.
stenophyllus/C. woodsonii, C. pictus/C. woodsonii, C. beckii/C. woodsonii, and C. laevis/C.
woodsonii (Fig. 4; Table 4). Bayesian posterior probabilities at nodes tested in BayesTraits,
however, are all favorably supported with Bayes factors greater than 2, except where there
is positive support for hummingbird pollination morphology in the ancestor of C. beckii and
C. lima (Bayes factor =1.40, posterior probability = 0.70) and an equal probability of
hummingbird or bee pollination syndrome morphologies in the ancestor of C. dirzoi and C.
erythrothrysus (Table 4). The differing topology seen in the Bayesian tree regarding the
placement of C. beckii (hummingbird) and C. vinosus (bee) as sister to the C. dircoi/C. lima
clade, strongly reconstructed as having a hummingbird pollination syndrome as the ancestral
morphology on the ML tree, reduced the number of shifts to ornithophilous morphology to
eight and increased the number of reversals to five with low support (Fig. 4; Table 4).

! 77!
Table 4. BayesTraits ML probabilities, Bayesian posterior probabilities, and their support values at each node tested
for ancestral state reconstruction of pollination syndrome using the Bayesian topology. Nodes supported as having
ancestral hummingbird pollination syndrome morphology are underlined.
Most Recent Common Ancestor of:
ML Probability
(Bee)
ML Probability
(Bird) Δ log-
likelihood
Posterior Probability
(Bee)
Posterior Probability
(Bird) Bayes Factor
stenophyllus/ woodsonii 0.72 0.28 1.71 0.57 0.43 2.67
pictus/ woodsonii 0.86 0.14 1.75 0.71 0.29 2.73
beckii/ woodsonii 0.80 0.20 1.56 0.65 0.36 2.36
beckii/lima 0.33 0.67 1.07 0.30 0.70 1.40
dirzoi/lima 0.32 0.68 0.62 0.26 0.74 2.23
dirzoi/erythrothrysus 0.56 0.44 0.56 0.50 0.50 1.83
comosus v. bakeri/lima 0.23 0.77 0.70 0.20 0.80 2.92
laevis/ woodsonii 0.93 0.07 1.72 0.82 0.18 2.72
laevis/varzearum 0.97 0.03 2.27 0.95 0.05 4.26

!!
! 78!
3.4.6. Reconstruction of Ancestral Distribution
S-DIVA as implemented in RASP with a maximum of four possible areas gives a relative
probability = 1.00 for the Pacific Coast of Mexico and Central America as the combined
ancestral area for Neotropical Costus (light yellow area on map, Fig. 2). The Bayesian binary
method was run four times, once with each model, all of which point to a Mexican/Central
American origin in the New World, with the strongest probability of being located along the
Central American Pacific Coast (CAPC; Fig. 2 light yellow), and much smaller probabilities
associated with distributions along the Central American Atlantic Coast (CAAC; Fig.2 pink),
or the Central American Interior (CAI; Fig. 2 red). After 50,000 generations, the F81 model
had a distance between runs of 0.0049 and gave the probabilities of the ancestral
distribution at the Neotropical node (indicated Fig. 2) as CAPC = 69.48%, CAPC plus CAAC
= 5.12%, Old World = 5.17%, and CAPC plus Old World = 8.69%. F81 with gamma
distribution had a distance between runs of 0.0056 and probabilities of CAPC = 36.58%,
CAPC plus CAI = 12.90%, CAPC plus CAAC = 10.64%, CAI = 9.87%, and CAAC = 8.14%.
The JC model had a distance between runs of 0.0060 and probabilities of CAPC = 66.39%,
CAPC plus Old World = 11.05%, Old World = 8.46%. The JC model with gamma distribution
had a distance of 0.0073 and probabilities of CAPC = 48.23%, CAPC plus CAI = 13.67%,
CAI = 8.20%, and CAPC plus CAAC = 7.98%. These methods all support a Mexican/Central
American origin with the Pacific Coast as the most likely area of ancestral distribution (Fig. 2;
light yellow).
3.4.7. Diversification Analysis
Increased rates of speciation seen in Costus appear to be correlated with specialized
pollination morphology. The mean lambda for the clade of all ornithophilous and
melittophilous species (C. afer/C. varzearum) is 78.3732 with a 90% highest density
probability (HDP) of 59.23909 – 100.95127. This is a large increase over the relative rate for

!!
! 79!
species with generalist pollination morphology: 7.680111 (HPD 3.87069 – 13.64808). The
Neotropical clade is further increased with a mean lambda of 205.4129 (HDP 156.0841 –
261.9265). Sub-clades within the Neotropical clade do not show relative rate differences
regardless of pollination morphologies present in the clade. The hummingbird-pollinated
clade of C. chartaceus/C. woodsonii has a mean lambda of 434.3955 (HDP 333.0779 –
558.5928) where the mostly bee-pollinated clade of C. laevis/C. varzearum has 434.322
(HDP 332.7832 – 558.0226). The C. dirzoi/C. lima clade with reversals to melittophilous
morphology has a similar mean lambda of 434.2816 (HDP 332.6214 – 557.7095).
!!
! 80!
3.5. Discussion
Here we have presented a phylogeny for the genus Costus that shows the first
evidence of an evolutionary toggle between hummingbird and bee pollination morphologies
among species in the Neotropical clade. This expanded taxon and molecular marker
phylogeny supports prior work showing that there have been multiple shifts in pollination
syndromes in the genus. The increased sampling and resolution provided in this study
suggests a greater number of origins of hummingbird pollination and finds for the first time
the reversal from ornithophilous to melittophilous morphology, laying the ground work for
further discussion of the factors related to the rapid radiation observed in this clade.
Phylogenetic inference is notoriously difficult for groups that have undergone rapid
radiations, and even the use of rapidly evolving ribosomal spacers and a nuclear intron did
not provide sufficient phylogenetic signal to resolve all evolutionary relationships within this
lineage with strong support. ML analyses, however, resulted in a single topology that was
largely reproduced with a 50% majority rule parsimony tree, excepting only a few close
relationships that were unresolved in parsimony. Bayesian methods supported the same
topology except, again, for a few unresolved polytomies and the placement of the C.
vinosus/C. beckii clade, which was resolved with low support (0.54 posterior probability).
Despite these phylogenetic uncertainties, hypotheses regarding shifts in pollination
morphology can still be tested as can the biogeographic origins of the lineage.
Our results indicate that there have confidently been at least eight independent shifts
to hummingbird pollination from a bee-pollinated ancestor, with the strongest evidence
pointing to nine total shifts. All analyses strongly support Costus stenophyllus, with an
ornithophilous morphology, as sister to the remaining Neotropical taxa suggesting that this
early diverging lineage evolved hummingbird pollination independently from other
hummingbird pollinated species. Further studies investigating the developmental genetics
and morphometrics of floral traits associated with bird pollination across Costus will help
!!
! 81!
define the particular characters involved in the hummingbird pollination trait, and define how
these characters might evolve to produce the complex morphologies associated with the bird
pollination syndrome.
Several unresolved areas of the phylogeny impeded our ability to conclusively state
the total number of character state transitions for the complex pollination syndrome
character, however the support for nodes at which transitions occurred is significant and
indicates that we have arrived at a conservative number of potential shifts for the genus. In
analyses performed on the ML tree, all shifts to hummingbird pollination shown are
statistically significant and nodes are well supported save the C. zingiberoides/C. woodsonii
clade (Fig. 2), which was found in 51 percent of the 707,000 most parsimonious trees; all
extant species of this clade, however, are ornithophilous and are the result of a single
evolution of the bird pollination syndrome. The relationship between the C. asplundii/C.
arabicus and C. quasi-appendiculatus/C. woodsonii clade is still uncertain, as is the
relationship between C. laevis/C. wilsonii and C. lasius/C. allenii, yet the clades themselves
are well supported and indicate the occurrence of multiple, independent shifts to the
ornithophilous morphology from a bee pollinated ancestral form regardless of their
placement. The placement of the C. vinosus/C. beckii clade is still unclear: attempts to infer
the effect of this phylogenetic uncertainty on the hypothesized number of shifts in pollination
morphology were also inconclusive due to low support for a reconstruction of bee pollination
for the most recent common ancestor of C. beckii and C. woodsonii (Table 4) in addition to
the polytomy present in the C. laevis/C. woodsonii clade. Ancestral state reconstruction for
pollination syndrome performed on the Bayesian tree had lower support all around,
suggesting that the phylogenetic uncertainty found in the polytomies confounded ancestral
state reconstruction attempts.
This is the first study to demonstrate there has been a toggle in pollination
morphology, with reversals back to the ancestral bee pollination morphology occurring in the
C. dirzoi/C. lima clade. The monophyly of the pollination-syndrome-toggling C. dirzoi/C. lima

!!
! 82!
clade is very strongly supported with all methods. The ancestral state is strongly supported
as hummingbird pollination morphology with the Bayesian and the Mesquite likelihood
reconstructions (and moderately supported with BayesTraits likelihood reconstruction), and
there is strong support for the ancestral character state reconstructions for nodes within this
clade (Tables 3; Table 4). With only the phylogenetic placement of C. longibracteolatus
remaining to be clarified, this clade clearly shows reversals to melittophilous morphologies
after an initial evolution of ornithophilous morphology. While there appear to have been
eight or nine independent origins of an ornithophilous floral form, there are fewer reversals to
a melittophilous morphology, all of which occur in the C. dirzoi/C. lima clade.
Ancestral area reconstruction analyses all strongly support a Mexican/Central
American point of dispersal to the New World with the highest probability of arrival occurring
along the Pacific Coast. Further dating analyses are required to discuss the biogeographic
history of this group and the effect of distribution on speciation, as temporal evidence is
needed to discuss past biogeographic scenarios (Crisp et al. 2011). We can, however,
discuss the results here in the light of prior work. If the previous fossil calibrated dating is
assumed and the Neotropical radiation occurred around 22 ma, then biogeographic
upheavals such as the Andean uplift (~10 ma) and the near closure of the Isthmus of
Panama [recently shown to be earlier than thought at about 15 ma (Montes et al. 2012) or
perhaps even 31 -16 ma (Bacon et. Al. 2012)], would certainly have played an important role
in speciation through vicariance. Additionally, at that time there were few Costaceae taxa as
part of the flora of the Neotropics, suggesting that intra-lineage competition may not have
had a strong effect on diversification (Specht 2005). This could support the hypothesis that
changing geography pushed populations into higher elevations better populated by
hummingbirds, leading to floral forms that resulted in specific pollination syndromes leading
to reproductive isolation, further supported by the positive support for a weak correlation
between elevation and pollination syndromes shown here with current distributions. If,
however, the ITS molecular clock dating is assumed, with a Neotropical radiation at around

!!
! 83!
four ma (Kay et al. 2005), the factors influencing diversification may be quite the opposite,
with less geographic and climatic upheaval and more competition among Zingiberales taxa
or other bird/bee pollinated plants driving extremely rapid rates of diversification.
The sister clade to Costus, a South American clade consisting of Chamecostus
(seven species), Monocostus (one species), and Dimerocostus (three to five species), would
have experienced a similar biogeographic history, yet failed to diversify either taxonomically
or morphologically to the extent of the diversity exemplified by Costus. These three genera
comprise species that lack the extreme pollination-specific morphologies associated with the
Neotropical Costus clade. Such data support our hypothesis that the rapid radiation
observed in Neotropical Costus is correlated with the specialized pollination morphologies
characteristic of this lineage. An expanded Costaceae phylogeny with outgroup fossil dating
is needed to revisit these questions, and may provide greater insight into the biogeography
of this group and the impact of pollinator-mediated vs. vicariance-related speciation through
means of reproductive isolation and their combined effect on diversification rates.

!!
! 84!
3.6. Acknowledgements
The authors thank Dr. Paul M.J. Maas and Hiltje Maas for their shared expertise in
Costaceae systematics; Y. Wang, I. Liao, H. Cooper, L. Lagomarsino, K. Yu, B. Wong, and
A. Almeida for generating sequence data; Members of the Specht Lab, especially A. Almeida
and R.Yockteng for helpful comments on data generation, analysis and manuscript
preparation. Funding for this project was provided by the National Geographic Society
#8994-11 and UC Berkeley CNR-BSP, SPUR, and URAP.
3.7. References
Bacon, C. D., A. Mora, W. L. Wagner, and C. A. Jaramillo. 2013. Testing geological models
of evolution of the Isthmus of Panama in a phylogenetic framework. Botanical Journal of
the Linnean Society 171: 287-300.
Baldwin, B. G. and S. Markos. 1998. Phylogenetic utility of the external transcribed spacer
(ETS) of 18S–26S rDNA: Congruence of ETS and ITS trees of Calycadenia
(Compositae). Molecular Phylogenetics and Evolution 10: 449-463.
Baum, D., R. Small, and J. Wendel. 1998. Biogeography and floral evolution of baobabs
(Adansonia Bombacaceae) as inferred from multiple data sets. Systematic Biology 47:
181-207.
Crisp, M. D., S. A. Trewick, and L. G. Cook. 2011. Hypothesis testing in biogeography.
Trends in Ecology and Evolution 26: 66-72
Darriba D., G. L. Taboada, R. Doallo, and D. Posada. 2012. jModelTest 2: More models,
new heuristics and parallel computing. Nature Methods 9: 772.
Edwards, K., C. Johnstone, and C. Thompson. 1991. A simple and rapid method for the
preparation of plant genomic DNA for PCR analysis. Nucleic Acids Research 19: 1349.

!!
! 85!
Guindon, S., J. F. Dufayard, V. Lefort, M. Anisimova, W. Hordijk, and O. Gascuel. 2010. New
algorithms and methods to estimate maximum-likelihood phylogenies: Assessing the
performance of PhyML 3.0. Systematic Biology 59: 307-331.
Huelsenbeck, J. P. and F. Ronquist. 2001. MRBAYES: Bayesian inference of phylogeny.
Bioinformatics 17: 754-755.
Johansen, L. B. 2005. Phylogeny of Orchidantha (Lowiaceae) and the Zingiberales based on
six DNA regions. Systematic Botany 30: 106-117.
Kay, K. M. 2006. Reproductive isolation between two closely related hummingbird-pollinated
Neotropical gingers. Evolution 60: 538-552.
Kay, K. M. and D. W. Schemske. 2003. Pollinator assemblages and visitation rates for 11
species of Neotropical Costus (Costaceae). Biotropica 35: 198-207.
Kay, K. M., P. A. Reeves, R. G. Olmstead, and D. W. Schemske. 2005. Rapid speciation
and the evolution of hummingbird pollination in Neotropical Costus subgenus Costus
(Costaceae): Evidence from nrDNA ITS and ETS sequences. American Journal of
Botany 92: 1899-1910.
Maddison, W. P. and D. R. Maddison. 2006. StochChar: A package of Mesquite modules for
stochastic models of character evolution. Version 1.1 Available from
http://mesquiteproject.org
Maddison, W. P. and D. R. Maddison. 2011. Mesquite: A modular system for evolutionary
analysis. Version 2.75 Available from http://mesquiteproject.org.
Miller, M. A., W. Pfeiffer, and T. Schwartz. 2010. Creating the CIPRES science gateway for
inference of large phylogenetic trees. New Orleans, Louisiana: Proceedings of the
Gateway Computing Environments Workshop (GCE).
Montes, C., A. Cardona, R. McFadden, S. E. Morón, C. A. Silva, S. Restrepa-Moreno, D. A.
Ramírez, N. Hoyos, J. Wilson, D. Farris, G. A. Bayona, C. A. Jaramillo, V. Valencia, J.
Bryan, and J. A. Flores. 2012. Evidence for middle Eocene and younger land emergence
in central Panama: Implications for Isthmus closure. Geological Society of America
Bulletin 124: 780-799.

!!
! 86!
Olson, D. M., E. Dinerstein, E. D. Wikamanayake, N. D. Burgess, G. V. N. Powell, E.C.
Underwood, J. A. D’Amico, I. Itoua, H.E. Strand, J. C. Morrison, C. J. Loucks, T. F.
Allnutt, T. H. Ricketts, Y. Kura, J. F. Lamoreux, W. W. Wettengel, P. Hedao, and K. R.
Kassem. 2001. Terrestrial ecoregions of the world: A new map of life on Earth.
Bioscience 51: 933-938.
Paradis, E., J. Claude, and K. Strimmer. 2004. APE: Analyses of phylogenetics and
evolution in R language. Bioinformatics 20: 289-290.
Pagel, M. 1999. The maximum likelihood approach to reconstructing ancestral character
states of discrete characters on phylogenies. Systematic Biology 48:612-622
Pagel, M. and A. Meade. 2004a. BayesTraits. Available from http://www.evolution.rdg.ac.uk
Pagel, M., A. Meade, and D. Barker. 2004. Bayesian estimation of ancestral character states
on phylogenies. Systematic Biology 53: 673-684.
Plummer, M., N. Best, K. Cowles, and K. Vines. 2006. CODA: Convergence diagnosis and
output analysis for MCMC. R News 6: 7-11.
Rabosky, D. L. 2014. Automatic detection of key innovations, rate shifts, and diversity-
dependence on phylogenetic trees. PLoS ONE 9: e89543.
Doi:10.1371/journal.pone.0089543
Rabosky, D. L., M. Grundler, C. Anderson, P. Title, J. J. Shi, J. W. Brown, H. Huang, and J.
G. Larson. 2014. BAMMtools: An R package for the analysis of evolutionary dynamics on
phylogenetic trees. Methods in Ecology and Evolution. Doi: 10.1111/2041-210X.12199
Rambaut, A. and A. J. Drummond, 2007. Tracer v1.5, Available from
http://tree.bio.ed.ac.uk/software/tracer/
Ronquist, F. and J. P. Huelsenbeck. 2003. MRBAYES 3: Bayesian phylogenetic inference
under mixed models. Bioinformatics 19: 1572-1574.
Sakai, S., M. Kato, and T. Inoue. 1999. Three pollination guilds and variation in floral
characteristics of Bornean gingers (Zingiberaceae and Costaceae). American Journal of
Botany 86: 646-658.
!!
! 87!
Shaw, J., E. B. Lickey, E. E. Schilling, and R. Small. 2007. Comparison of whole chloroplast
genomes sequences to choose noncoding regions for phylogenetic studies in
angiosperms: The tortoise and the hare III. American Journal of Botany 94: 275-288.
Smith, J. F. 2000. Phylogenetic signal common to three data sets: Combining data which
initially appear heterogeneous. Plant Systematics and Evolution 221: 179–198.
Specht, C. D. 2005. Phylogenetics, floral evolution, and rapid radiation in the tropical
Monocotyledon family Costaceae (Zingiberales). Plant Genome Biodiversity and
Evolution 1B: 29-60.
Specht, C. D. 2006a. Systematics and evolution of the tropical monocot family Costaceae
(Zingiberales): A multiple dataset approach. Systematic Botany 31: 89-106.
Specht, C. D. 2006b. Gondwanan vicariance or dispersal in the tropics? The biogeographic
history of the tropical monocot family Costaceae (Zingiberales). Pp. 631-642 in
Monocots: Comparative biology and evolution. eds. J. T. Columbus, E. A. Friar, C. W.
Hamilton, J. M. Porter, L. M. Prince, and M. G. Simpson. Claremont, California: Rancho
Santa Ana Botanic Garden.
Specht, C. D., W. J. Kress, D. W. Stevenson, and R. DeSalle. 2001. A molecular phylogeny
of Costaceae (Zingiberales). Molecular Phylogenetics and Evolution 21: 333-345.
Swofford, D. L. 2003. PAUP*. Phylogenetic analysis using parsimony (*and other methods).
Version 4. Sunderland: Sinauer Associates.
Taberlet, P., L. Gielly, G. Pantou, and J. Bouvet. 1991. Universal primers for amplification of
three non-coding regions of chloroplast DNA. Plant Molecular Biology 17: 1105-1109.
Thomson, J. D., and P. Wilson. 2008. Explaining evolutionary shifts between bee and
hummingbird pollination: Convergence, divergence and directionality. International
Journal of Plant Sciences 169: 23–38.
White, T. J., T. Bruns, S. Lee, and J. Taylor. 1990. Amplification and direct sequencing of
fungal ribosomal RNA genes for phylogenetics. Pp. 315-322 in PCR protocols: A guide
to methods and applications. eds. M. Innis, D. Gelfand, J. Sninsky, and T. White. San
Diego: Academic Press.

!!
! 88!
Yu, Y., A. J. Harris, and X. J. He. 2010. S-DIVA (statistical dispersal-vicariance analysis): A
tool for inferring biogeographic histories. Molecular Phylogenetics and Evolution 56: 848-
850.
Yu, Y., A. J. Harris, and X. J. He. 2012. RASP (reconstruct ancestral state in phylogenies), v.
2.1b. Available at http://mnh.scu.edu.cn/soft/blog/RASP

!!
! 89!
!!
! 90!
Chapter 4 – Evolution of species diversity in the genus Chamaecostus (Costaceae):
molecular phylogenetics and morphometric approaches
Thiago André1,2, Chelsea Specht3, Shayla Salzman4, Clarisse Palma-Silva5, Tânia Wendt2
1 – [email protected]; corresponding author.
2 – Universidade Federal do Rio de Janeiro, Rio de Janeiro (RJ), Brazil.
3 – University of California, Berkeley (CA), USA.
4 – Harvard University, Cambridge (MA), USA.
5 – Universidade Estadual Paulista, Rio Claro (SP), Brazil.
*manuscript submitted to Phytotaxa
(ISSN, Print: 1179-3155; Online 1179-3163)

!!
! 91!
Abstract
While most species within the genus Chamaecostus (Costaceae) are well defined, the broad
geographic range and long list of synonyms associated with Chamaecostus subsessilis led
us to believe there may be some cryptic species within the complex. We thus investigate the
phylogenetic relationships of species in the Chamaecostus lineage and specifically test the
monophyly and diversity of the Chamaecostus subsessilis species complex from a
population perspective by analyzing molecular sequence data and leaf morphometrics. We
interpret evolutionary trends across the entire genus based on a molecular character-based
phylogenetic hypothesis that includes all currently described species of Chamaecostus. Our
results show that while Chamaecostus is strongly monophyletic, C. cuspidatus is found to be
sister to a clade of some but not all samples of C. subsessilis, making it necessary to
acknowledge more than one species in the C. subsessilis complex. Herbarium specimens of
the C. subsessilis complex could be assigned based on geographic proximity to one of the
major three clades recovered in the phylogenetic analysis. Leaf morphometric
measurements were performed on each of these lineages and traits were tested to detect
differences among phylogenetic lineages. We conclude by proposing the recognition of a
new combination, Chamaecostus acaulis, which we describe.
!!
! 92!
4.1. Introduction
Most species are identified on the basis of incongruent patterns and discontinuity of
trait variation, typically using morphological characters. Individuals of a species are
phenomena manifesting itself in rather continuous variation across a population and can
only be understood by sampling through the range of this variation (Frost & Kluge 1994),
which then commonly provide the basis for ascertaining trends. However, perceived
morphological discontinuity it is not always a product of lineage splitting and speciation:
isolated subpopulations bearing genetic structure can lack phenotypic differences between
them (DeSalle et al. 2005, Padial & De La Riva 2009, Padial et al. 2010, Florio et al. 2012).
Such cryptic speciation is characterized by two or more morphologically indistinguishable
groups of organisms that are found to belong to different evolutionary lineages (Sáez &
Lozano 2005). Perceived cryptic speciation can also derive from our inability to distinguish
important, and not always prominent, morphological differences (Shaffer & Thomson 2007).
Using a phylogenetic lineage approach, species-level phylogenies and networks are
able to provide a consistent and predictive evolutionary understanding of species limits
(Funk & Omland 2003, Goldstein & DeSalle 2000). The phylogenetic approach to species
delimitation is particularly promising because distinct species are interpreted as being on
separate evolutionary trajectories (Hey & Pinho 2012), which, in some cases, are expected
to continue to diverge even in the absence of reproductive barriers (Rieseberg et al. 2004).
Here, we investigate the Chamaecostus subsessilis (Nees & Mart.) Specht &
Stevenson (2006: 158) species complex from a population perspective. The broad
geographic range of the complex and the long list of synonyms associated with taxa in this
group indicate that there may be more than one species present, given a phylogenetic
species concept (Nixon & Wheeler 1990). We use DNA sequences to test for monophyly of
species and lineages within Chamaecostus, and study leaf morphometrics to test for
morphological integrity of the lineages examined. Finally, we present a comprehensive

!!
! 93!
molecular phylogeny of Chamaecostus Specht & Stevenson (2006: 157), on which we
interpret evolutionary trends within this genus.
With the sole exception of Chamaecostus subsessilis, species of Chamaecostus are
fairly distinguishable from one another. Taxonomic disputes regarding C. subsessilis are
largely due to its widespread distribution and various subtle morphological differences that
occur across its geographic range. C. subsessilis is a nearly acaulescent herb that inhabits
the seasonally dry forests of Central South America. Individuals placed within this group
comprise the largest geographic range for any species of Chamaecostus, ultimately forming
a species complex that encompasses eleven historically described species. Maas (1972,
1977) emphasized in his monographs that these eleven species could not be separated from
one another based on floral characters alone, which are rather constant throughout the
geographic distribution. Previous taxonomic descriptions referred mainly to variation in
vegetative characters like plant height, leaf shape, and leaf hairiness which were
hypothesized by Maas (1972) to be driven by environmental factors as no clear geographic
isolation separating any of the described forms was observed. Maas combined all eleven
taxa under one species name (Maas 1972, 1976, 1977); initially Maas (1972) used Costus
warmingii Petersen as described in Martius (1890: 57), but later (Maas 1976) revised the
name based on the previously described type of Globba subsessilis, described by Nees and
Martius (1823: 29) but not cited in Martius’ Flora Brasilensis (1890). Maas identified Globba
subsessilis as an earlier synonym of Costus warmingii and replaced the species name with
Costus subsessilis (Nees & Mart.) Maas (1976: 469). Subsequently, Specht and Stevenson
(2006), when describing the new genus Chamaecostus, proposed a new combination
resulting in Chamaecostus subsessilis, a lineage that has henceforth been treated as the
Chamaecostus subsessilis complex.
The C. subsessilis species complex has been considered (Specht 2006, Maas 1972,
Schumann in Engler 1904) to be closely related to Chamaecostus cuspidatus (Nees & Mart.)
Specht & Stevenson (2006: 158), as these taxa share significant morphological similarities

!!
! 94!
such as appendaged green bracts and sheaths that grow beyond the stem node, commonly
covering internodes entirely. Additionally, C. subsessilis and C. cuspidatus have adjacent
geographic distributions, with limited but existing range overlap in the Atlantic Rain Forest
and in the Cerrado transition, Eastern Brazil.
Maas (1972, 1977) comprehensively reviewed all Neotropical Costaceae, in which all
current members of the genus Chamaecostus were included as members of Costus
subgenus Cadalvena (Fenzl) K.Schum. in Engler (1904: 381). The first investigation of the
phylogenetic relationships within Costaceae was presented by Specht et al. (2001), using a
dataset of both morphological and molecular characters. Phylogenetic relationships revealed
members of Maas’ new world Costus subgenus Cadalvena group to be monophyletic, but
more closely related to Dimerocostus and Monocostus than to other Costus lineages,
rendering Costus paraphyletic (Specht et al. 2001; Specht 2006). This analysis also
supported the position of the Cadalvena type species, Costus spectabilis (Fenzl) Schumann
(1892: 422), with other lineages of African taxa within a clade of Costus. Therefore, Specht &
Stevenson (2006) formally placed Maas’ Cadalvena members in the genus Chamaecostus,
with the etymology (chamae-) being indicative of their small stature (≤1 m) relative to plants
remaining in the genus Costus. Together with Monocostus Schumann (1904: 427) and
Dimerocostus Kuntze (1891: 687), these three genera form an early-diverging clade of
approximately 17 species with a distribution encompassing Central and South America
(“South American Clade”, Specht 2006). Morphologically, Chamaecostus, Monocostus and
Dimerocostus share cup-shaped stigmas; tubular and bicarinate bracteoles; presence of
unicellular hairs; and a general flower morphology with long and narrow labellum (fused
petaloid staminodes) opening into a wide and distinct limb. Additionally, Monocostus and
Dimerocostus share a bilocular ovary, while the Chamaecostus ovary is trilocular similar to
that found in Costus L.
As their name implies, Chamaecostus are low plants, even occasionally emerging as
acaulescent rosettes, typically not exceeding 1 m in height and with stems commonly less

!!
! 95!
than 1 cm in diameter. Specht and Stevenson (2006) cite the following synapomorphies for
identification of Chamaecostus: small stature; cup-shaped stigma; open labellum; ovary and
tube of labellum red-brown punctate. Also noteworthy are their very fragile shoots and nodes
that are commonly purplish and lightly geniculate. Additionally, intermittency of aerial shoots
during dry season and presence of subterraneous reserve organs are also very common.
The staminodial labellum is large, ovate at the apex, yellow, orange, red, or white.
Distribution of Chamaecostus is restricted to South America, from the Guyana Shield to the
Amazonian lowlands of Bolivia and Brazil, the western edge of the Brazilian shield and the
Brazilian Atlantic Rainforest. In addition, Chamaecostus species seem to show an
aggregated distribution, with high local abundance but naturally rare occurrence along the
landscape. The genus currently consists of seven known species, all endemic to South
America. Geographic distribution is varied and includes seasonally dry forests of Southwest
Amazonia and Cerrado forest ecosystems of Central Brazil (Chamaecostus subsessilis);
Central Atlantic Forest (Chamaecostus cuspidatus); Amazonian (Chamaecostus fusiformis
(Maas) Specht & Stevenson (2006: 158), Chamaecostus fragilis (Maas) Specht & Stevenson
(2006: 158), Chamaecostus lanceolatus (Petersen) Specht & Stevenson (2006: 158)); and
endemic to the Guyana shield (Chamaecostus congestiflorus (Rich. ex L. F. Gagnep.)
Specht & Stevenson (2006: 158), Chamaecostus curcumoides (Maas) Specht & Stevenson
(2006: 158)).
!!
! 96!
4.2. Material and Methods
4.2.1. Phylogenetic relationships
We analyzed the phylogenetic relationships of species within Chamaecostus, using
Maximum Likelihood (ML; PhyML, Guidon & Gascuel 2003) and Bayesian (MrBayes,
Huelsenbeck & Ronquist 2001) approaches based on a combined dataset of nuclear (ETS,
Kay et al. 2005; ITS, White et al. 1990; rpb2, Specht et al. 2001; CaM, Salzman et al. in
press) and plastid (rps16-trnK, Shaw et al. 2007; petG-trnP, Hwang et al. 2000; tnrL-trnLF,
Taberlet et al. 1991) sequences. All sequences were deposited in GenBank (accession
numbers in appendix 1).
We included individuals from all known species within the genus, and designated
samples of Monocostus uniflorus, two species of Dimerocostus and two species of Costus
as outgroups. For the Chamaecostus subsessilis complex, we analyzed samples from 12
populations collected across its distributional range. Total genomic DNA was isolated from
silica-gel dried leaf tissue using CTAB extraction protocol (Doyle & Doyle 1990). PCR
fragments of the molecular markers above were generated using Phire Hot Start II DNA
Polymerase (Thermo Scientific) with a 3 min. initial denaturing step at 98 °C, 45 cycles of 5
sec. at 98 °C, 15 sec. at gene-specific annealing temperatures, and 20 sec. at 72 °C, with a
final 1 min. 72 °C extension. Cycle sequencing was performed using BigDye v3.1 (Applied
Biosystems) following manufacture’s protocols. Cycle sequencing products were sequenced
on an Applied Biosystems 3730 DNA Analyzer automated DNA sequencer, at UC Berkeley’s
Evolutionary Genetics Laboratory.
We aligned each marker using the MUSCLE algorithm (Edgar 2004) implemented in
Geneious version 6.1.7 (www.geneious.com), and subsequently checked the multiple
sequence alignments manually. Sequence data was partitioned to allow different models of
sequence evolution for each region, with the best model for sequence evolution determined
with jModelTest version 2 (Darriba et al. 2012).
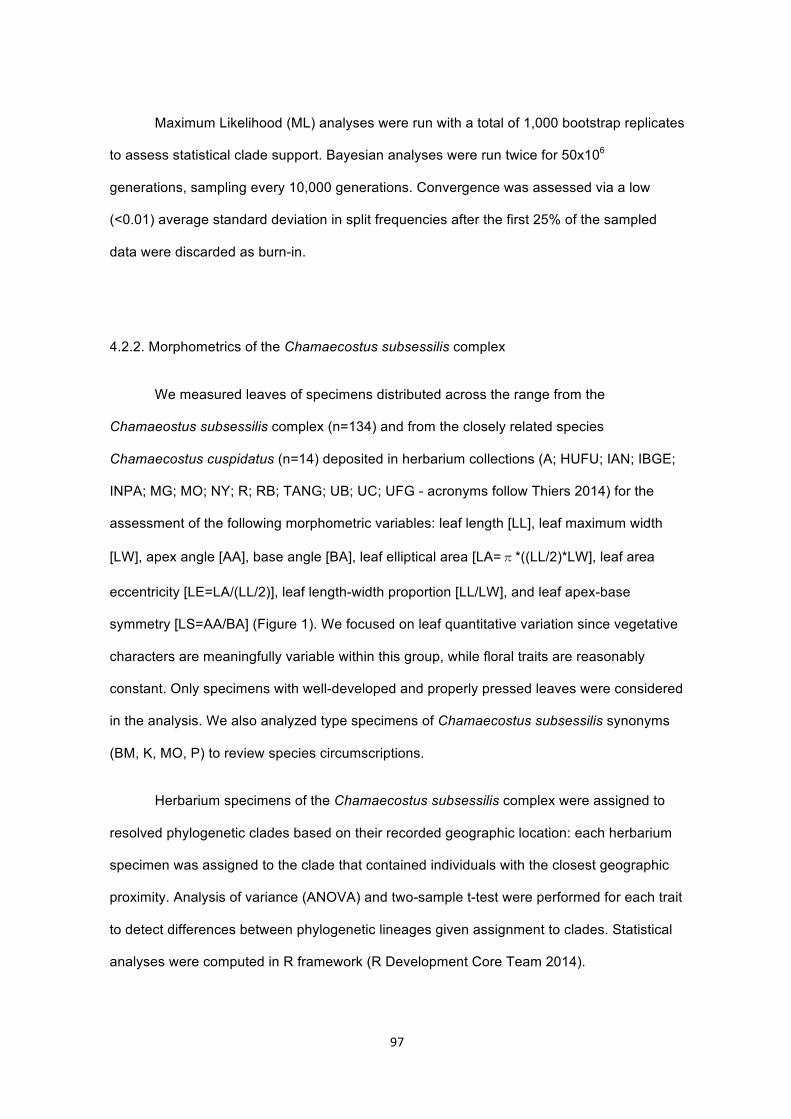
!!
! 97!
Maximum Likelihood (ML) analyses were run with a total of 1,000 bootstrap replicates
to assess statistical clade support. Bayesian analyses were run twice for 50x106
generations, sampling every 10,000 generations. Convergence was assessed via a low
(<0.01) average standard deviation in split frequencies after the first 25% of the sampled
data were discarded as burn-in.
4.2.2. Morphometrics of the Chamaecostus subsessilis complex
We measured leaves of specimens distributed across the range from the
Chamaeostus subsessilis complex (n=134) and from the closely related species
Chamaecostus cuspidatus (n=14) deposited in herbarium collections (A; HUFU; IAN; IBGE;
INPA; MG; MO; NY; R; RB; TANG; UB; UC; UFG - acronyms follow Thiers 2014) for the
assessment of the following morphometric variables: leaf length [LL], leaf maximum width
[LW], apex angle [AA], base angle [BA], leaf elliptical area [LA=�*((LL/2)*LW], leaf area
eccentricity [LE=LA/(LL/2)], leaf length-width proportion [LL/LW], and leaf apex-base
symmetry [LS=AA/BA] (Figure 1). We focused on leaf quantitative variation since vegetative
characters are meaningfully variable within this group, while floral traits are reasonably
constant. Only specimens with well-developed and properly pressed leaves were considered
in the analysis. We also analyzed type specimens of Chamaecostus subsessilis synonyms
(BM, K, MO, P) to review species circumscriptions.
Herbarium specimens of the Chamaecostus subsessilis complex were assigned to
resolved phylogenetic clades based on their recorded geographic location: each herbarium
specimen was assigned to the clade that contained individuals with the closest geographic
proximity. Analysis of variance (ANOVA) and two-sample t-test were performed for each trait
to detect differences between phylogenetic lineages given assignment to clades. Statistical
analyses were computed in R framework (R Development Core Team 2014).

!!
! 98!
Figure 1. Schematic representation of measured morphometric variables; LL – Leaf Length,
LW – Leaf Maximum Width, AA – Apex Angle, BA – Base Angle.
A A
B A
L W
L L

!!
! 99!
4.3. Results
4.3.1. Chamaecostus systematics and phylogenetic relationships
The concatenated multiple sequence alignment is 3,480 base pairs long and the
resulting topology (Figure 2A) is recovered in both Maximum Likelihood (ML) and Bayesian
Inference analyses. The phylogeny is well supported overall, as shown by high node
confidence provided by both Bayesian posterior probabilities and ML bootstrap replicates,
with the exception of the position of Chamaecostus fragilis. In this analysis, Chamaecostus
subsessilis was found to be paraphyletic. Two well-supported major clades are recovered
(Figure 2A; subsessilis and acaulis), one of which is sister to Chamaecostus cuspidatus.
These two clades correspond to previous species definitions and delimitations (see
discussion below), bearing high morphological variability and overlapping characters
between them.
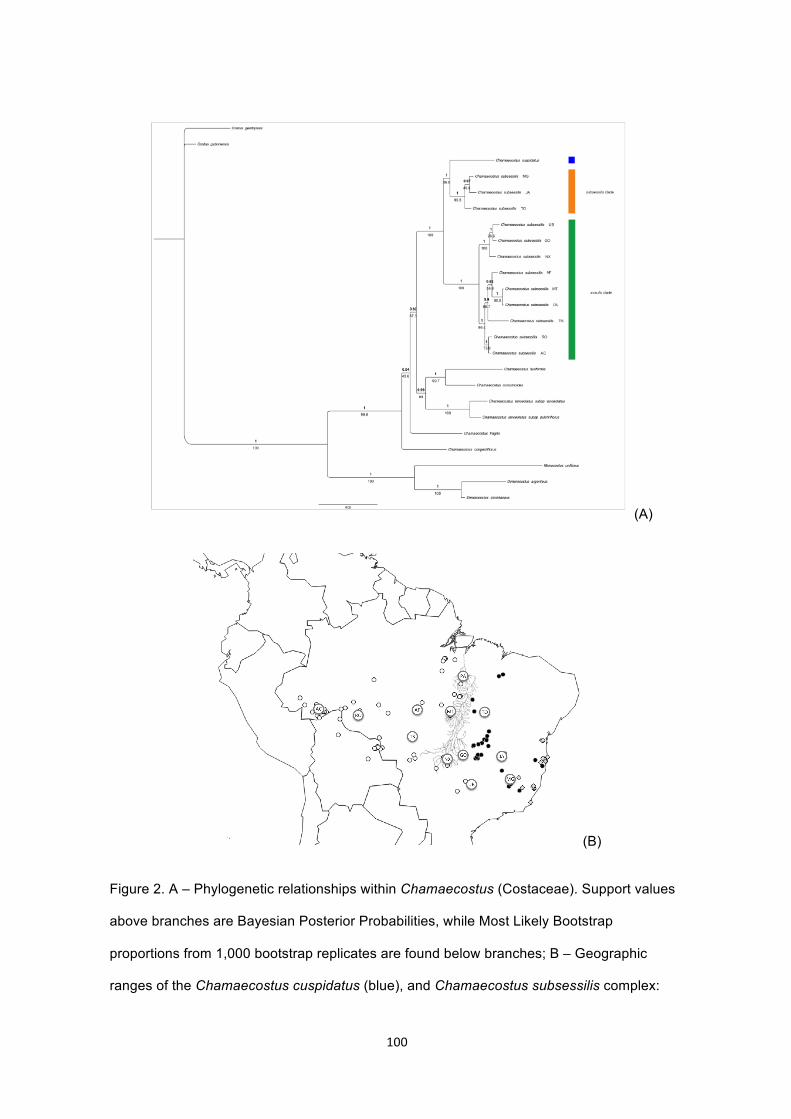
!!
! 100!
(A)
(B)
Figure 2. A – Phylogenetic relationships within Chamaecostus (Costaceae). Support values
above branches are Bayesian Posterior Probabilities, while Most Likely Bootstrap
proportions from 1,000 bootstrap replicates are found below branches; B – Geographic
ranges of the Chamaecostus cuspidatus (blue), and Chamaecostus subsessilis complex:

!!
! 101!
subsessilis clade (orange) and acaulis clade (green). Dashed lines denote tentative range
limits, and the continuous grey line identifies the Araguaia River.

!!
! 102!
4.3.2. Morphometrics of the Chamaecostus subsessilis complex
Analysis of variance and two-sample t-test detected significant morphometric
differences in three leaf traits between specimens assigned to either acaulis (n=83) or
subsessilis (n=51) clades: leaf length, leaf maximum width, and leaf area (Figure 3). With the
exception of apex-base symmetry, all other morphometric variables significantly separate
Chamaecostus cuspidatus from the other two clades (Table 1). In our molecular phylogeny,
the subsessilis clade is sister to C. cuspidatus, but subssessilis and acaulis clades are highly
similar in morphology, underscoring the significance of these quantitative differences.

!!
! 103!
Table 1. Morphometric variables tested for diagnose between Chamaecostus cuspidatus and
the Chamaecostus subsessilis complex. Means ± standard deviations; different letters are
indicative of statistical significance (p<0.05; t-test), and F-values and probabilities of ANOVA
are given. Bold values refer to variables that are significantly different between all three
species.
Leaf variables
Chamaecostus cuspidatus
Chamaecostus subsessilis
s.str.
Chamaecostus acaulis
ANOVA
(n=14) (n=51) (n=83) F p
Length (cm) 14.9 ± 4.5a 18.6 ± 6.2 b 22.3 ± 5.6 c 13.2 0.000
Maximum Width (cm) 4.5 ± 1.5 a 7.4 ± 2.6 b 8.6 ± 2.1 c 21.2 0.000
Length-Width Proportion
3.4 ± 0.6 a 2.6 ± 0.7 b 2.6 ± 0.4 b 14.5 0.000
Area (cm2) 113.4 ± 87.5 a 235.7 ± 152.9 b 316.0 ± 149.8 c 13.5 0.000
Eccentricity 0.6 ± 0.1 a 0.8 ± 0.2 b 0.8 ± 0.1 b 12.1 0.000
Apex Angle 84.4 ± 37.0 a 44.5 ± 17.4 b 78.6 ± 25.8 b 10.2 0.000
Base Angle 30.4 ± 6.5 a 53.4 ± 18.6 b 52.0 ± 14.3 b 13.1 0.000
Apex-Base Symmetry 1.5 ± 0.6 a 1.7 ± 0.9 a 1.6 ± 0.5 a 0.7 0.508

!!
! 104!
Figure 3. Box and whisker plots of three significantly different morphometric variables
between Chamaecostus cuspidatus (n=14), Chamaecostus subsessilis s.str. (n=51) and
Chamaecostus acaulis comb. nov. (n=83), showing means, quartiles and ranges. A – Leaf
length (cm); B – Leaf Maximum Width (cm); C – Leaf Area (cm2).

!!
! 105!
4.4. Discussion
4.4.1. Chamaecostus systematics and phylogenetic relationships
Here we present a robust molecular phylogeny of Chamaecostus (Figure 2A), from
which novel evolutionary inferences can be inferred. Within Chamaecostus, major clades
generally reflect relationships previously suggested from taxonomic studies (Schumann in
Engler 1904, Maas 1972). A close relationship between Chamaecostus curcumoides and
Chamaecostus fusiformis was suggested by Maas (1972) when he described both species.
Indeed, the well-supported clade formed by these two species is supported morphologically
by various synapomorphies of these species, such as a more complex capitate
inflorescence, ovate-triangular yellow bracts, and a strongly tubular labellum. Likewise,
green, appendaged bracts and a full-grown sheath are synapomorphies of Chamaecostus
cuspidatus and Chamaecostus subsessilis, a species pair whose close taxonomic
relationship had been previously hypothesized (Nees & Martius 1823, Petersen in Martius
1890, Schumann in Engler 1904, Maas 1972). Perhaps the most remarkable implication of
this Chamaecostus phylogeny (Figure 2A) is the paraphyly of Chamaecostus subsessilis,
indicating the need for a revision of the genus.
Our phylogeny suggests some new interpretations and indicates alternative
evolutionary scenarios with respect to biogeography and morphology. Amazonian
distribution is most likely ancestral for the genus, with the appearance in Southern and
Eastern portions of South America being more derived; only C. cuspidatus has a distribution
lying completely outside of the Amazonian domain. Also noteworthy is the position of C.
congestiflorus as sister to the remaining species in the genus; this species has white flowers,
with a conspicuous fimbriate labellum, while all other species have either a yellow, orange,
red or pink glabrous labellum (at least when fully developed and opened), suggesting that a
shift from white flowers and a reduction of the labellum margin complexity evolved only once
in the genus leading to a radiation of colorful-flowered species with a glabrous labellum.
!!
! 106!
4.4.2. Morphometrics of the Chamaecostus subsessilis complex
Redefining species limits in the Chamaecostus subsessilis complex can be rather
problematic, particularly because of the limited extent of morphological diagnostic
characters, especially when considering morphological differences from every other species
in the genus, which can be exceptionally divergent. Indeed, distinct species criteria describe
different stages in the divergence of lineages, and differences among the many species
concepts are at least partly attributable to the complex and temporally extended nature of
speciation (de Queiroz 2007), and therefore no single definition will be appropriate for all
organisms. Morphological similarity has the disadvantage of using arbitrary determinations of
the threshold of differences (de Queiroz 1998) and is especially challenging to apply when
quantitative character continua are significant. Such is indicated to be the case for the C.
subsessilis complex, where character variation among and between populations was thought
to be solely due to environment (Maas 1972,1977). Nevertheless, determining these two
distinct C. subsessilis lineages to be a single species in face of the strong population genetic
structure would be unfitting and would not reflect the evolutionary differentiation among
sampled populations condition.
Results do show significant morphometric size differences between the two lineages
(Table 1, Figure 3). Additionally, a posteriori interpretation of the descriptions of
Chamaecostus subsessilis synonyms from the historic record also reveals traits that are
useful to separate these lineages. Petersen (in Martius’ Flora Brasiliensis 1890) describes a
Costus warmingii as being over 1 m tall with elliptic to obovate-elliptic leaves, variable in
size, abaxially densely hirsute and adaxially glabrous. Later, Schumann (in Engler 1904)
mentioned other individuals under the synonyms Costus gagnepainii K.Schum. in Engler
(1904: 420), Costus latifolius Gagnepain (1902: 100), Costus paucifolius Gagnepain (1902:
100), Costus pumilus Petersen in Martius (1890: 58), and Costus rosulifer Gagnepain (1902:

!!
! 107!
101), as having either both or at least one leaf side glabrous. All of the types for the
synonyms occur East of the Araguaia River valley. Moore (1895: 480) described Costus
acaulis (=Chamaecostus subsessilis) as having oblong-obovate puberulous leaves based on
a type from Mato Grosso, in the upper Paraguay River basin, Brazil. This specimen greatly
reassembles Loesener’s (1929) descriptions and types for Costus steinbachii Loesener
(1929: 714) and Costus kaempferoides Loesener (1929: 714), from Bolivia and Peru,
respectively. Interestingly, Specht (2006) noted that although indument characters in general
tend to be homoplasious in Costaceae, certain aspects of the indument do help to define
some lineages.
Hence, external morphology, anatomy, ecology, life history and reproductive biology
should be further investigated in a finer and more detailed fashion to help accumulate
diagnostic features for Chamaecostus species, with a specific focus on detecting
synapomorphies between C. cuspidatus and C. subsessilis s.str. (subsessilis clade in Figure
2A), since compilation of relevant information often leads to an improved comprehension of
boundaries between species (e.g. Wendt et al. 2011, Faria et al. 2010). One or only a few
individuals may not be representative of the species as a whole, especially for taxa with
widespread distributions (Goldstein et al. 2000; Walsh 2000). An integrative approach,
combining population genetics, historical biogeography, and environmental data, could be of
great help to elucidate the speciation scenario and demographic history involved. Our
inspection of several individuals from multiple localities across the range of the species
provides discernible differences between clades, highlighting the particular efficacy of
population sampling to fully determine species integrity. Thus, we encourage broad
geographic and genetic sampling to investigate the possibility of cryptic evolutionary
lineages in species complexes.
Species polyphyly can result as an artifact of phylogenetic reconstruction from weak
phylogenetic signal or incomplete lineage sorting, or from taxonomically underestimating or
overestimating genetic exchange among individuals and populations (Funk & Omland 2003).

!!
! 108!
Furthermore, the use of morphological or genetic markers alone could mislead our
understanding of evolutionary history; phylogeographic breaks can form within a
continuously distributed species even when there are no barriers to gene flow if the average
individual dispersal distance and local population size are small (Irwin 2002).
Correspondingly, morphometric data commonly convey ontogenetically or ecologically
governed plasticity and could obscure genetically governed morphological variation relevant
to taxonomic decisions (Tetsana et al. 2014). Our comprehensive approach, combining
phylogenetic analysis of multiple molecular markers and leaf morphometrics, objectively
reveals the recognition of at least two species within the Chamaecostus subsessilis complex
as necessary to appropriately reflect evolutionary relationships, and we formally
acknowledge distinct names below.
!!
! 109!
4.5. Taxonomy
Chamaecostus acaulis (S.Moore) T.André & C.D.Specht comb. nov. = Costus acaulis
S.Moore. Transactions of the Linnean Society of London 4: 480, pl. 33, f. 1–5. 1895; Type:
—BRAZIL. Mato Grosso: Santa Cruz (i.e. Barra do Bugres), November 1891, Spencer
Moore 679 (holotype, BM!).
= Costus steinbachii Leoesener, Notizbl. Bot. Gart. Berl. 10: 714. 1929; Loesener in Engler
& Prantl, Nat. Pflanzenfam. ed. 2. 15A: 634. 1930. Type: — BOLIVIA. Sara: Santa Cruz, 31
December 1925, Steinbach 7386 (lectotype, F; isolectotypes, K!, MO!). Lectotype assigned
by Maas (1972) since the holotype was destroyed at Berlin in 1943.
= Costus kaempferoides Leoesener, Notizbl. Bot. Gart. Berl. 10: 714. 1929. Type: — PERU.
Madre de Dios: Seringal São Francisco, September 1911, Ule 9197 (lectotype, K!).
Lectotype assigned by Maas (1972) since the holotype was destroyed at Berlin in 1943.
Acaulescent or very low plants with stems up to 30 cm long and 1-10 mm wide; Internode
1.0—8.5 (3.5 ± 1.6) cm long; Roots fleshy, with tubers; root tubers fusiform to ellipsoid;
Sheaths membranaceous, 1.5—3.0 (1.6 ± 0.6) cm long, 1.5—8.5 (4.5 ± 1.7) cm wide, obtuse
at the apex, puberulous. Ligule 1 mm long. Leaves (4—6), rosulate, elongate, oblong-
obovate, 22.3 ± 5.6 cm long, 8.6 ± 2.1 cm wide, densely strigose or densely to sparsely
puberulous on both sides, cuneate at the base, shortly acuminate at the apex, apex up to
2.0 cm (0.6 ± 0.4), margins densely ciliate; Inflorescence compact, terminal and short; bracts
herbaceous, green to 30—70 (50 ± 30) mm long, 5—15 (10 ± 5) mm wide, densely
puberulous; appendages foliaceous, green, narrowly triangular to deltate, mucronate at the
apex, densely puberulous. Bracteole membranaceous, tubular, 2—3 cm long. Calyx tubular,
membranaceous to herbaceous, 10—40 mm long, lobes narrowly triangular, mucronate, 1—
15 mm long. Corolla white, 50—70 mm long, tube 25—30 mm long, lobes narrowly elliptic,
mucronate, 30—40 mm long, 6—12 mm wide. Labellum yellow, with white, yellow or orange
nectar guides at the middle, broadly obovate, 60—70 mm long, 70—95 mm wide, margins

!!
! 110!
undulate, lightly fimbriate or glabrous. Stamen yellow, oblong-oblanceolate, Stamen 20—50
mm long, up to 20 mm wide, apex obtuse, irregularly lobed or acuminate, anther attached at
the base, caudate at the apex. Style filiform, glabrous; Stigma cup-shaped; Fruits and seeds
not analyzed.
Chamaecostus acaulis strongly resembles Chamaecostus subsessilis sensu stricto,
but differs by developing shorter habit, bigger oblong-obovate leaves (22.3 ± 5.6 cm long x
8.6 ± 2.1 cm wide), and by possessing puberulous leaves. Chamaecostus subsessilis sensu
stricto have adaxially strigose to glabrous leaves, more elliptical and smaller leaves (18.6 ±
6.2 cm long x 7.4 ± 2.6 cm wide), and variable height, from 0.3 to over 1.0 m.
Since there is substantial overlap in characters between the two (Figure 3, Table 1),
we strongly suggest that location should be taken into account when identifying both
species, in particular because of the strong geographic structure resolved between the
populations analyzed here. Chamaecostus acaulis occurs West of the Araguaia River valley,
through Peruvian, Bolivian and Brazilian South Amazonia, and in Western and Southern
portions of the Central Brazilian Shield, while Chamaecostus subsessilis occurs East from
the Araguaia River valley, and within most of the Central Brazilian Shield and in transition
forests between Cerrado and Central Atlantic Rain Forest (Figure 2B). However, potentially
sympatric populations may occur within the Araguaia River valley, and further detailed
analyses of the populations in this transition zone are necessary.

!!
! 111!
Figure 4. Chamaecostus acaulis comb. nov. and Chamaecostus subsessilis s.str.. (B) photo
by W.W.Thomas. (D) photo by D.Skinner.

!!
! 112!
Measured specimens
Chamaecostus acaulis. BRAZIL. ACRE. Porto Acre: Lowrie 526 (INPA, MG, NY); Rio
Branco: Albuquerque 1389 (NY), Cid 2806 (INPA, NY), Ehrich 8 (NY), Lowrie 445 (INPA, R);
Santa Rosa: Daly 11103 (NY); Sena Madureira: Daly 7855 (NY), Daly 7860 (NY), Prance
7623 (MO), Ramos 682 (INPA); Tarauacá: Prance 7416 (INPA, NY); Xapuri: Alves 2365
(NY), Daly 7195 (MO, NY). GOIÁS. Cabeceiras: Irwin 10358 (MO); Caipônia: Prance 59644
(A, NY); Cidade de Goiás: Kirkbridge 3399 (UB); Santa Rita do Araguaia: Rocha sn (UB).
MATO GROSSO. Alta Floresta: André 804 (RB), Richter 39 (RB); Aripuanã: Berg 18519
(INPA, NY); Cuiabá: Andersson 1623 (A, UB); Barra do Garças: Philcox 4000 (UB);
Palmeiras: Lindman 2485 (A); Poconé: Maciel 144 (INPA); Santa Teresinha: Oliveira 3094
(RB), Thomas 4384 (INPA, MG). Tangará da Serra: Silva 498 (TANG). MINAS GERAIS.
Ituitaba: Macedo 1316 (RB), Macedo 1993 (MO); Uberlândia: Arantes 1124 (HUFU),
Barbosa 281 (HUFU). PARÁ. Altamira: Balée 1996 (NY), Dias 1109 (MG), Ferreira 1068
(NY), Lima 6020 (RB), Nascimento 1177 (NY), Souza 1068 (MG), Souza 1177 (MG);
Conceição do Araguaia: Plowman 8448 (A, INPA, MG, MO, NY); Nova Canaã dos Carajás:
Lobato 2596 (MG); Redenção: Cordeiro 2851 (IAN); Serra do Cachimbo: Prance 25218
(MG). RONDÔNIA. Abunã: Prance 8338 (INPA, MG, NY); Ariquemes: Zarucchi 2677 (A,
INPA, MG, MO, NY, R, RB), Mota 440 (NY), Vieira 440 (MO, R), Vieira 443 (INPA);
Mutumparaná: Prance 8975 (A, INPA, MG, NY, R). BOLIVIA. Bela Vista: Steinbach 7386
(MO); Beni: Maas 8660 (MO, NY, RB), Surubi 313 (NY), Rusby 1399 (A, NY), Ledezma 893
(MO); Ñuflo de Chaves: Ortiz 39 (NY); Santa Cruz: Arroyo sn (MO), Carrión 506 (MO),
Castro 60 (MO), Garvizu 513 (MO), Guillén 3035 (MO), Guillén 3623 (MO), Killeen 7168
(MO), Mamani 1091 (MO), Quevedo 2473 (MO), Rodriguez 572 (MO).
Chamaecostus subsessilis s.str.. BRAZIL. BAHIA. Itamaraju: Mori 10753 (NY, RB); Jussari:
Belém 2274 (UB), Thomas 11937 (MO), Thomas 13401 (MO, NY). DISTRITO FEDERAL.
Brasilia: Barroso 639 (RB), Heringer 10751 (IAN, UB), Irwin 19440 (NY, RB, UB), Pereira
2251 (IBGE, RB), Pires 51 (RB), Pires 57147 (UB). GOIÁS. Alto Paraíso: Felfili 379 (IBGE),
!!
! 113!
Mendonça 2898 (IBGE); Alvorada do Norte: Hatschbach 39011 (NY, UC); Caldas Novas:
Vieira 1652 (RB); Catalão Hatschbach 55820 (MO); Cocalzinho: Mendonça 2206 (IBGE);
Corumbá: Maguire 57147 (MG, MO); Formosa: Irwin 9066 (UB); Goiânia: Rizzo 2566 (UFG),
Rizzo 12305 (UFG); Inhumas: Rizzo 2779 (UFG); Luziânia: Coradin 7397 (RB); Monte
Alegre: Mendonça 4512 (RB); Mossâmedes: Forzza 2500 (RB); Niquelândia: Cordovil 106
(RB), Fonseca 1245 (IBGE, UFG); Nova Roma: Forzza 2541 (RB); São Domingo: Oliveira
1117 (IBGE), Santos 2367 (RB); Trindade: Rizzo 3113 (UFG). MARANHÃO. Tuntum:
Santos 707 (MG, NY). MINAS GERAIS. Abre Caminho: Pereira 59 (RB); Jacinto: Leitman 51
(RB); Januária: Filgueiras 1950 (IBGE), Ratter 2630 (IAN, NY, UB, RB), Ratter 6410 (IBGE);
Lagoa Santa: Hoehne 6206 (R); Minas: Duarte sn (RB); Serra do Cipó: Heringer 7343 (UB);
Unaí: Brina sn (RB); Várzea da Palma: Duarte 7547 (RB). TOCANTINS. Aurora do Norte:
Pereira 2009 (IBGE); Lajeado: Árbocz 6293 (IBGE); Presidente Kennedy: Plowman sn
(INPA).
Chamaecostus cuspidatus. BRAZIL. BAHIA. Belmonte: Mattos 368 (NY), Mattos 1804 (NY),
Santos 828 (RB); Eunápolis: Santos 893 (NY, RB), Mello Filho 2980 (R); Gandú: Santos
1157 (NY, UB); Porto Seguro: Duarte 5668 (RB), Pinheiro 1747 (RB); Wanceslau
Guimarães: Thomas 9329 (MO). ESPÍRITO SANTO. Colatina: Kuhlmann 6660 (RB); Santa
Teresa: Boone 984 (MO).

!!
! 114!
4.6. Acknowledgments
We are thankful to visited herbaria curators and staff. This paper is part of the D.Sc.
requirements of TA at the Biodiversity and Evolutionary Biology Graduate Program of the
Federal University of Rio de Janeiro. TA received a scholarship grant from Coordenação de
Aperfeiçoamento de Pessoal de Nível Superior. TW received a productivity grant from
Conselho Nacional de Desenvolvimento Científico e Tecnológico. CS received support from
the US National Geographic Society (CRE Grant #8994-11) that helped support this
research.
4.7. References
Darriba D, Taboada GL, Doallo R, Posada D. 2012. jModelTest 2: more models, new
heuristics and parallel computing. Nature Methods 9: 772.
de Queiroz K. 1998. The general lineage concept of species, species criteria, and the
process of speciation: A conceptual unification and terminological recommendations.
Pages 57–75 in Endless forms: Species and speciation (D. J. Howard, and S. H.
Berlocher, eds.). Oxford University Press, New York.
de Queiroz K. 2007. Species concepts and species delimitation. Systematic Biology 56: 879-
886.
DeSalle R, Egan M, Sidall M. 2005. The unholy trinity: taxonomy, species delimitation and
DNA barcoding. Philos. Trans. R. Soc. B 360: 1905-1916.
Doyle JJ, Doyle JL. 1990. A rapid total DNA preparation procedure for fresh plant tissue.
Focus 12:13-15.

!!
! 115!
Edgar RC. 2004. MUSCLE: multiple sequence alignment with high accuracy and high
throughput. Nucleic Acids Research 32:1792–1797.
Engler HGA. (Ed). 1904. Pflanzenreich IV. 46 (Heft 20).
Faria APG, Wendt T, Brown GK. 2010. A revision of Aechmea subgenus Macrochordion
(Bromeliaceae) based on phenetic analyses of morphological variation. Botanical Journal
of the Linnean Society 162: 1-27.
Florio AM, Ingram CM, Rakotondravony HA, Louis Jr EE, Raxworthy CJ. 2012. Detecting
cryptic speciation in the widespread and morphologically conservative carpet chameleon
(Furcifer lateralis) of Madagascar. J. Evol. Biol. 25: 1399-1414.
Frost DR, Kluge AG. 1994. A consideration of epistemology in systematic biology, with
special reference to species. Cladistics 10: 259-294.
Funk DJ, Omland KE. 2003. Species-level paraphyly and polyphyly: frequency, causes, and
consequences, with insights from animal mitochondrial DNA. Annu. Rev. Ecol. Evol.
Syst. 34: 397-423.
Gagnepain F. 1902. Bulletin de la Société Botanique de France. Series 4. Volume 2: 102,
103.
Goldstein PZ, DeSalle R. 2000. Phylogenetic species, nested hierarchies, and character
fixation. Cladistics 16: 364-384.
Goldstein PZ, DeSalle R, Amato G, Vogler AP. 2000. Conservation genetics and the species
boundary. Conserv. Biol. 14: 120-131.
Guindon S, Gascuel O. 2003. A simple, fast, and accurate algorithm to estimate large
phylogenies by maximum likelihood. Systematic Biology 52:696-704.
Hey J, Pinho C. 2012. Population genetics and objectivity in species diagnosis. Evolution 66:
1413-1429.
!!
! 116!
Huelsenbeck JP, Ronquist F. 2001. MRBAYES: Bayesian inference of phylogenetic trees.
Bioinformatics 17:754-755.
Hwang LH, Hwang SY, Lin TP. 2000. Low chloroplast DNA variation and population
differentiation of Chamaecyparis formosensis and Chamaecyparis taiwanensis. Taiwan
Journal of Forest Science 15:229-236.
Irwin DE. 2002. Phylogeographic breaks without geographic barriers to gene flow. Evolution
56: 2383-2394.
Kay KM, Reeves PA, Olmstead RG, Schemske DW. 2005. Rapid speciation and the
evolution of hummingbird pollination in neotropical Costus subgenus Costus
(Costaceae): evidence from nrDNA ITS and ETS sequences. American Journal of
Botany 92:1899–1910.
Kuntze CEO. 1891. Revisio Generum Plantarum. Volume 2: 687.
Linnaeus C. 1753. Species Plantarum. Volume 1: 1-560.
Loesener LET.1929. Notizbl. Bot. Gart. Berl. 10: 714.
Maas PJM. 1972. Costoideae (Zingiberaceae). Flora Neotropica monograph no 8. Hafner,
New York, New York, USA.
Maas PJM. 1976. Notes on New World Zingiberaceae. Acta Botanica Neerlandica 24: 469.
Maas PJM. 1977. Renealmia (Zingiberaceae-Zingiberoideae) Costoideae (Additions)
(Zingiberaceae). Flora Neotropica monograph no 18. Hafner, New York, New York, USA.
Martius CFP. (Ed.). 1890. Flora Brasiliensis. Volume III. Pars III: 1-128.
Moore S. 1895. Trans. Linn. Soc. series 2. 4: 480.
Nees CGD, Martius CFP. 1823. Nova Acta Phys.-Med. Acad. Caes. Leop.-Carol. Nat. Cur.
Volume
!!
! 117!
Nixon KC, Wheeler QD. 1990. An amplification of the phylogenetic species concept.
Cladistics 6: 211-223.
Padial J, De La Riva I. 2009. Integrative taxonomy reveals cryptic Amazonian species of
Pristimantis (Anura: Strabomantidae). Zool. J. Linn. Soc. 155: 97-122.
Padial J, Miralles A, De la Riva I, Vences M. 2010. The integrative future of taxonomy. Front.
Zool. 7: 16.
R Development Core Team 2014. R: A Language and Environment for Statistical
Computing. R Foundation for Statistical Computing. http://www.R-project.org.
Rieseberg LH, Church SA, Morjan CL. 2004. Integration of populations and differentiation of
species. New Phytol. 161: 59-69.
Sáez AG, Lozano E. 2005. Body doubles. Nature 433:111.
Salzman S, Driscoll HE, Renner T, André T, Shen S, Specht CD. in press. Spiraling into
history: A molecular phylogeny and investigation of biogeographic origins and floral
evolution for the genus Costus L. Systematic Botany.
Schumann K. 1892. Botanische Jahrbücher für Systematik, Pflanzengeschichte und
Pflanzengeographie 15: 422.
Shaffer HB, Thomson RC. 2007. Delimiting Species in Recent Radiations. Syst. Biol. 56:
896–906.
Shaw J, Lickey EB, Schilling EE, Small RL. 2007. Comparison of whole chloroplast genome
sequences to choose noncoding regions for phylogenetic studies in Angiosperms: the
tortoise and the hare III. American Journal of Botany 94:275–288.
Specht CD, Kress WJ, Stevenson DW, DeSalle R. 2001. A Molecular Phylogeny of
Costaceae (Zingiberales). Molecular Phylogenetics and Evolution 21:333-345.

!!
! 118!
Specht CD, Stevenson DW. 2006. A new phylogeny-based generic classification of
Costaceae (Zingiberales). Taxon 55:153-163.
Specht CD. 2006. Systematics and Evolution of the Tropical Monocot Family Costaceae
(Zingiberales): A Multiple Dataset Approach. Systematic Botany 31: 89-106.
Taberlet P, Gielly L, Pautou G, Bouvet J. 1991. Universal primers for amplification of three
non-coding regions of chloroplast DNA. Plant Molecular Biology 17:1105–1109.
Tetsana N, Pedersen HÆ, Sridith K. 2014. Character intercorrelation and the potential role
of phenotypic plasticity in orchids: a case study of the epiphyte Liparis resupinata. Plant
Syst Evol 300:517–526
Thiers B. 2014. Index Herbariorum: A global directory of public herbaria and associated staff.
New York Botanical Garden's Virtual Herbarium. http://sweetgum.nybg.org/ih/
Walsh P. 2000 Sample size for the diagnosis of conservationunits. Conserv. Biol. 14: 1533-
1535.
Wendt, T, da Cruz DD, Demuner VG, Guilherme FAG, Boudet-Fernandes, H. 2011. An
evaluation of the species boundaries of two putative taxonomic entities of Euterpe
(Arecaceae) based on reproductive and morphological features. Flora 206: 144-150.
White TJ, Bruns T, Lee S, Taylor J. 1990. Amplification and direct sequencing of fungal
ribosomal RNA genes for phylogenetics. In “PCR Protocols: A Guide to Methods and
Applications,” Academic Press, San Diego.

!!
! 119!

!!
! 120!
Chapter 5 – Speciation in the South American dry understory: lessons from
Chamaecostus (Costaceae, Zingiberales)
Thiago André1,2, Chodon Sass3, Roxana Yockteng3, Tânia Wendt2, Chelsea Specht3,
Clarisse Palma-Silva4
1 – [email protected]; corresponding author.
2 – Universidade Federal do Rio de Janeiro, Rio de Janeiro (RJ), Brazil.
3 – University of California, Berkeley (CA), USA.
4 – Universidade Estadual Paulista, Rio Claro (SP), Brazil.
!!
! 121!
Abstract
Central South America is largely comprised of seasonally dry ecoregions, where a sharp
rainy season largely defines growth patterns. Here we examine speciation of the understory
herbs Chamaecostus subsessilis and C. acaulis, inhabitants of South American seasonally
dry forests of Cerrado and South Amazonia. We studied 20 kb of sequence data from
targeted hightroughput sequencing by capture using PCR-generated probes so as to
estimate the phylogeographic pattern and timing of diversification in this Chamaecostus
lineage. We found deep phylogeographic structure at both the population and species level,
as inferred from fixation indices, structure analysis and phylogenetics. Spatiotemporal
patterns of diversification implies that divergence between Eastern and Western lineages
unlikely predates the formation of the Araguaia-Tocantins River system but it may relate to
the uplift of the central Brazilian plateau and the intense shifts in hidrography that likely
occurred during the Miocene due to ocean level variation and Andean orogeny. We also
found a strong supported phylogenetic topological incongruence between plastid and
nuclear genomes. New high-throughput sequencing technologies based on range-wide
sampling of populations allowed us to uncover speciation outlines in a Central South
American lineage adapted to dry ecoregions.
!!
! 122!
5.1. Introduction
South America encompasses exceptional biological diversification (Turchetto-Zolet et
al. 2013) and a complex geomorphological history (Hoorn et al. 2010). Central South
America is largely comprised of seasonally dry ecoregions, mostly by Cerrado savannas and
dry forest patches (Pennington et al. 2009). This biome displays high environmental
heterogeneity due to extremely complex geological history and heterogeneous edaphic and
climatic conditions (Silva et al. 2011). Cerrado landscapes are dominated by vast plateaus
that uplifted from Late Tertiary to Early Quaternary, followed by recent Quaternary cycles of
erosion (Cole 1986, Silva & Bates 2002). Additionally, climatic oscillations from late Tertiary
throughout the Pleistocene lead to alternate contractions and expansions of forests and
savannas on this landscape (Behling & Hooghiemstra 2001). Both Tertiary geological events
and Pleistocene climatic fluctuations were discovered to have promoted divergences among
organism lineages in this region (Turchetto-Zolet et al. 2013). Phylogeography of Cerrado
tree species (Caryocar brasiliense by Collevatti et al. 2003, and Hymenaea stigonocarpa by
Ramos et al. 2007) recovered three genetically differentiated groups essentially congruent
with the Cerrado’s main plateaus. Gallery forests are believed to have maintained the
connectivity between the central Brazil Plateau and adjacent forest formations, i.e. Amazonia
and Atlantic Rainforest, even during the dry and cold climatic periods, offering refuge to a
stable forest biota (Brown & Gifford 2002, Costa 2003, Werneck 2011). Consequently,
savanna formations are scattered with forests and xerophytic communities (Felfili et al. 2001,
Silva et al. 2006). A rainy season, during summer, largely defines growth patterns and
survival for plant species, thus making the Cerrado domain a major barrier to gene flow
between South American rainforest taxa (Prado & Gibbs 1993, Turchetto-Zolet et al. 2012),
and Cerrado itself is not a barrier-free habitat (Silva & Bates 2002, Werneck et al. 2011,
Prado et al. 2012).
!!
! 123!
Chamaecostus subsessilis (Nees & Mart.) C.D.Specht & D.W.Stev. and C. acaulis
(S.Moore) T.André & C.D.Specht are perennial understory herb species from South
American seasonally dry forests. These species represents an ancient lineage of Costaceae
Nakai, a typical component of moist understory of Tropical Rainforests. Taxonomic status of
Chamaecostus subsesilis populations occurring from Bolivia to Atlantic rainforest, including
Southern Amazonia is controversial. Some authors have considered these populations as a
single species, or a species complex, namely C. subsessilis (Maas 1972, 1977). However,
C. acaulis was recently recovered from a synonym of C. subsessilis (André et al.
unpublished), with very limited morphological variation recognized between this two species,
despite a strongly supported paraphyly identified by a phylogenetic approach, involving the
relationship to the Atlantic Rainforest species C. cuspidatus (Nees & Mart.) C.D.Specht &
D.W.Stev. In this novel interpretation, C. subsessilis refers to populations found mainly East
from the Tocantins-Araguaia River Basin, while C. acaulis refers to those found West and
South of it. Populations of both species are commonly locally dense, while these dense
clusters are rare along the landscape. We know very little about reproductive biology of
these plants, but seeds in the family are thought to be ant-dispersed, mainly because of the
presence of an aril (Maas 1972). These species are the only Costaceae species clearly
adapted to climatic seasonality (Maas 1972, Lage et al. 2012).
Studies on population genetic structure are essential to comprehend speciation
processes and lineage divergence. Weak genetic structure is indicative of high rates of gene
flow and species cohesion, while marked structure points to low levels of gene flow and
independent evolutionary trajectories and a possible emerging speciation. In such context,
phylogeography particularly focus on spatial and temporal dimensions of genealogies, within
and among closely related species (Avise 2009) will greatly help to understand speciation
processes. Besides, phylogeographic evidence can distinguish between secondary contacts
of previously isolated lineages and the establishment of phenotypic or genetic clines within a
continuous population across a sharp environmental gradient (Endler 1982, Swenson &
!!
! 124!
Howard 2005, Whinnett et al. 2005, Moritz et al. 2009). Most processes involved in
speciation are not driven by any intrinsic mechanism that operates independently of
environment, and for a lineage to diverge genetic differentiation is necessary, but not
exclusive (Brown 1995). Ecological or geographic variations are widely important, and the
investigation of spatial arrangements among genetic lineages can reveal much of the
historical nature of intraspecific evolution (Avise et al. 1987). To address most questions in
phylogenetics and phylogeography we need a high number of orthologous loci from multiple
individuals of nonmodel species, representing between them a gradient of divergence
(McCormack et al. 2013, Lemmon & Lemmon 2013, Mamanova et al. 2010). The sequence
capture using PCR-generated probes (SCPP) protocol (Peñalba et al. 2014) generates
massive multilocus datasets of homologous loci from the genomic DNA of a nonmodel
organism by its reduction to a targeted genomic subset of interest, removing the need for a
reference genome. Targeting is achieved by hybridizing DNA libraries to short nucleic acid
probes, discarding fragments that did not hybridize, and sequencing the fragments that were
successfully captured. This approach allows to affordably sequencing multiple loci from for
several individuals using individual barcoding.
Here, we take advantage of cutting-edge next-generation sequencing methods to
undertake a range-wide analysis of speciation within this putative cryptic lineage of South
American dry understory plants. We present and examine patterns of nuclear and plastid
DNA diversity in C. subsessilis and C. acaulis. Specifically, our aims are: (1) to determine
the extent of genetic differentiation among populations of the current distribution range,
within and between species; and (2) to test if lineages diverged during Pleistocene. We
further discuss genetic structure in view of available information on the biogeographic history
of South American seasonally dry ecosystems.

!!
! 125!
5.2. Materials and Methods
5.2.1. Sampling and DNA extraction
We sampled leaf tissue of 8-10 individuals from 15 populations (summing 125
individuals) along Chamaecostus acaulis (9 populations) and Chamaecostus subsessilis (6
populations) geographic range (Figure 1, Table 1) and 10 outgroup taxa (Table 2). Genomic
DNA was extracted following the CTAB protocol (Doyle & Doyle 1990) at the Molecular
Biology Lab of the Botanical Institute of São Paulo.

!!
! 126!
Figure 1. Locations of the seventeen sampled sites of Chamaecostus subsessilis (MG, JA,
DF, TG, TO, PK) and C. acaulis (UB, PA, GO, MT, NX, AF, TS, CS, RO, PM, AC).
Topographic variation is shown in the background, with green lowlands.

! 127!
Table 1. Name and location of sampled Chamaecostus subsessilis and C. acaulis populations and respective number
of sequences obtained for plastid and nuclear markers.
Population name and location Species Number of sequences Latitude Longitude cp nr
PK - Presidente Kennedy, Tocantins, Brazil C. subsessilis 9 9 -8.4857 -48.5762 JA - Januária, Minas Gerais, Brazil C. subsessilis 8 8 -15.4320 -44.4162 MG - Rodeador, Minas Gerais, Brazil C. subsessilis 9 9 -18.2941 -44.0363 TG - Teresina de Goiás, Goiás, Brazil C. subsessilis 9 9 -13.6832 -47.2247 DF - Brasília, Distrito Federal, Brazil C. subsessilis 5 5 -15.7413 -47.8854 TO - Lajeado, Tocantins, Brazil C. subsessilis 8 8 -9.9542 -48.3426 UB - Uberlândia, Minas Gerais, Brazil C. acaulis 9 9 -19.1705 -48.3926 GO - Cidade de Goiás, Goiás, Brazil C. acaulis 7 6 -16.0229 -50.0756 NX - Nova Xavantina, Mato Grosso, Brazil C. acaulis 9 9 -14.7665 -52.4688 PA - Canaã dos Carajás, Pará, Brazil C. acaulis 8 8 -6.4523 -50.0735 MT - Confresa, Mato Grosso, Brazil C. acaulis 5 4 -10.5378 -51.4402 AF - Alta Floresta, Mato Grosso, Brazil C. acaulis 9 9 -9.8001 -55.9235 TS - Tangará da Serra, Mato Grosso, Brazil C. acaulis 9 9 -14.6498 -57.4206 CS - Lago Caiman, JM de Velasco, Bolivia C. acaulis 1 1 -13.6100 -60.9112 RO - Ariquemes, Rondônia, Brazil C. acaulis 8 8 -9.9490 -63.0537 AC - Porto Acre, Acre, Brazil C. acaulis 7 7 -9.7539 -67.6755 PM - Pando, Bolivia C. acaulis 1 1 -11.1415 -67.5468
Outgroup C. cuspidatus 1 1 - -
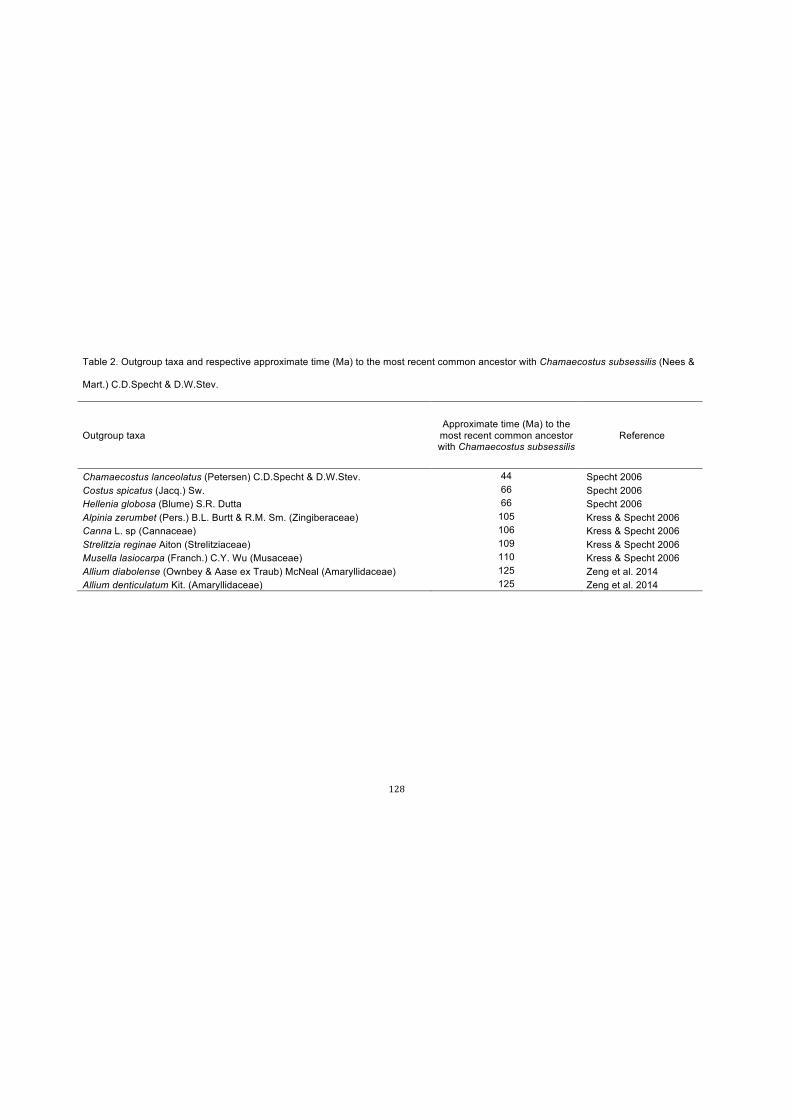
! 128!
Table 2. Outgroup taxa and respective approximate time (Ma) to the most recent common ancestor with Chamaecostus subsessilis (Nees &
Mart.) C.D.Specht & D.W.Stev.
Outgroup taxa Approximate time (Ma) to the
most recent common ancestor with Chamaecostus subsessilis
Reference
Chamaecostus lanceolatus (Petersen) C.D.Specht & D.W.Stev. 44 Specht 2006 Costus spicatus (Jacq.) Sw. 66 Specht 2006 Hellenia globosa (Blume) S.R. Dutta 66 Specht 2006 Alpinia zerumbet (Pers.) B.L. Burtt & R.M. Sm. (Zingiberaceae) 105 Kress & Specht 2006 Canna L. sp (Cannaceae) 106 Kress & Specht 2006 Strelitzia reginae Aiton (Strelitziaceae) 109 Kress & Specht 2006 Musella lasiocarpa (Franch.) C.Y. Wu (Musaceae) 110 Kress & Specht 2006 Allium diabolense (Ownbey & Aase ex Traub) McNeal (Amaryllidaceae) 125 Zeng et al. 2014 Allium denticulatum Kit. (Amaryllidaceae) 125 Zeng et al. 2014

!!
! 129!
5.2.2. High-throughput sequencing
Individual genomic DNA was sheared to a mean 200 base pairs size using a
Bioruptor®, and resulting libraries were double-indexed (Kircher et al. 2012). Probes were
selected from an independent and diverse array of loci: PCR products were generated from
plant genome regions previously acknowledged as informative (Table 3), such as several
plastid (Shaw et al. 2007) and nuclear markers (Specht et al. 2001, Kay et al. 2005, Salzman
et al. in press). Additional nuclear regions were obtained from Costus spicatus flower
transcriptome assembled reads (C. Specht, unpublished) aligned to the banana genome
(D’Hont et al. 2012), allowing the design of primers for the amplification of Chamaecostus
genomic DNA (Appendix 2, Table 3) at the ‘Specht Lab’ at UC Berkeley. Amplicon fragments
of the molecular markers listed in Table 1 were generated using ChoiceTaq® DNA
Polymerase with a 2 min. initial denaturing step at 94 °C, 45 cycles of 45 sec. at 94°C, 15
sec. at gene-specific annealing temperatures (Appendix 2), and 30 sec. at 72 °C, with a final
2 min. 72 °C extension. We largerly prevented paralogous loci because amplicon baits are
predominantly composed of introns. Plastid bait loci were pooled together with nuclear baits
in 1:20 concentrations based on quantification with a Qubit fluorometer (Life Technologies)
to a total of 1.3 µg. Three aliquots of baits were prepared to allow for enrichment
hybridizations.
Genomic libraries were pooled together in three aliquots of 50 individual samples
each at equimolar concentrations based on quantification with NanoDrop spectrophotometer
(ThermoScientific) to a total of 2 µg. Each aliquot was then enriched by hybridization to baits
linked to magnetic beads (Maricic et al. 2010, Peñalba et al. 2014) at the ‘Evolutionary
Genetics Lab’ at UC Berkeley, and then sequenced (100-bp paired-end reads) in one lane of
a Illumina® HiSeq® 2000 platform at ‘Vincent J. Coates Genomics Sequencing Laboratory’
at UC Berkeley.

! 130!
Table 3. Character values, number of haplotypes, and models of evolution for each plastid (cp) and nuclear (nr) DNA marker and the
concatenated alignments of Chamaecostus subsessilis and C. acaulis.
Marker Number of Characters
(bp)
Number of Reads per Sample (Mean ±
Standard Deviation)
Parsimony Informative Characters
Singletons Proportion of
Constant Characters (%)
Number of Haplotypes
Model of Evolution
cpDNA atpF 970 6642.2 ± 3176.2 7 2 99 10 F81+I petG-trnP 626 4675.8 ± 2347.1 5 0 99 6 F81 rbcL 1297 8405.6 ± 4153.8 2 3 99.6 5 F81 rps4-trnS 1021 8535.9 ± 4088.0 7 3 99 9 HKY rps16-trnK 1250 3849.0 ± 1694.5 23 6 96.3 18 TPM1uf trnC-ycf6 1283 4327.4 ± 2453.1 20 3 98.1 10 F81+G trnH-psbA 1631 5444.8 ± 2167.8 22 3 97.5 13 F81+I trnL-rpl32 1233 4165.7 ± 2048.9 40 6 94.2 19 TPM1uf+I trnL-trnLF 1135 9046.9 ± 4599.5 26 0 97.7 15 F81+I trnQ-rps16 1789 3433.0 ± 1238.4 58 10 96.2 34 F81+I concatenated 12235 - 210 36 97.5 50 -
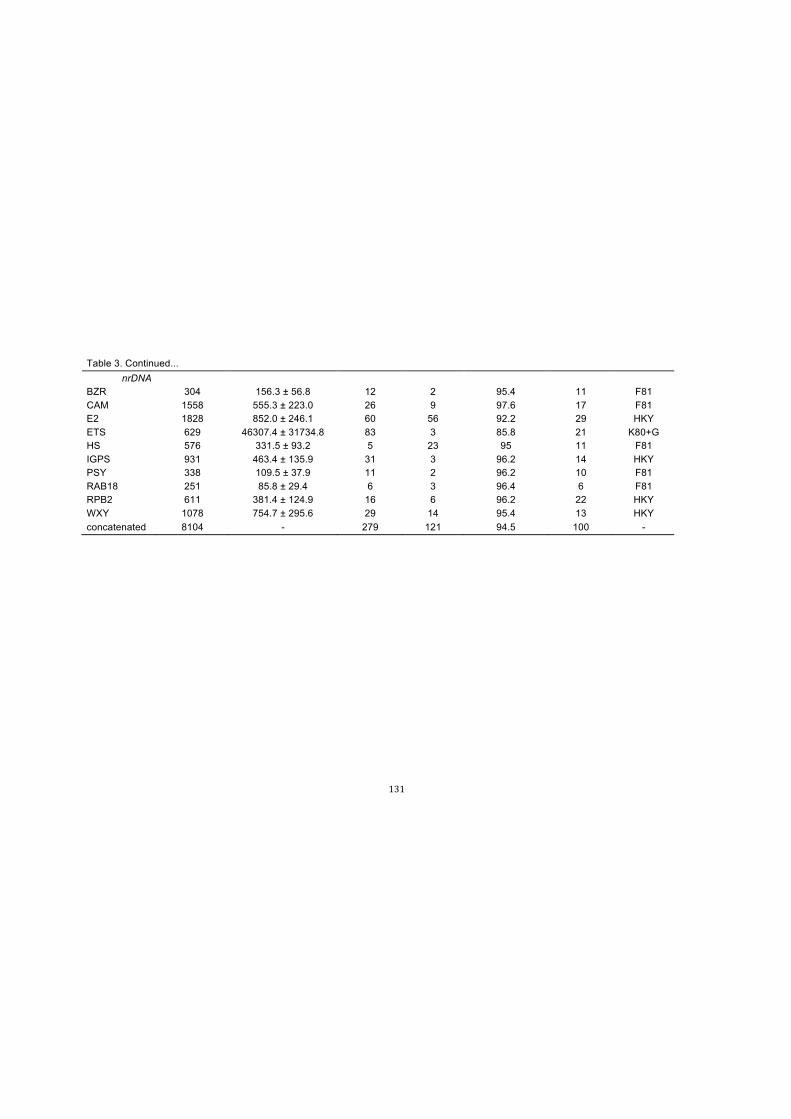
! 131!
Table 3. Continued... nrDNA
BZR 304 156.3 ± 56.8 12 2 95.4 11 F81 CAM 1558 555.3 ± 223.0 26 9 97.6 17 F81 E2 1828 852.0 ± 246.1 60 56 92.2 29 HKY ETS 629 46307.4 ± 31734.8 83 3 85.8 21 K80+G HS 576 331.5 ± 93.2 5 23 95 11 F81 IGPS 931 463.4 ± 135.9 31 3 96.2 14 HKY PSY 338 109.5 ± 37.9 11 2 96.2 10 F81 RAB18 251 85.8 ± 29.4 6 3 96.4 6 F81 RPB2 611 381.4 ± 124.9 16 6 96.2 22 HKY WXY 1078 754.7 ± 295.6 29 14 95.4 13 HKY concatenated 8104 - 279 121 94.5 100 -

!!
! 132!
5.2.3. Bioinformatics
Reads were assembled with ABySS (Simpson et al. 2009) with k-mers of sizes
between 21 and 81, and also varying e/c to e2c2, e10c10 and e20c20. All the assemblies
were merged to get the final assemblies, from which we did reciprocal blast to reference
sequences of the enriched regions. Cleaned reads were then aligned to contigs using
NovoAlign (NovoCraft), with maxscore set at 90. SNPs were called and filtered with GATK
(McKenna et al. 2010). We avoided sequence erros mistaken to rare variants by a
conservative cut-off of coverage values (≥10).
5.2.4. Molecular Evolution and Phylogenetics
We analysed two datasets: (1) with Chamaecostus acaulis, Chamaecostus
subsessilis and Chamaecostus cuspidatus samples (N=120), with sequences fully trimmed
at beginning and at the end, and completely lacking missing information; and (2) dataset (1)
with sequences not fully trimmed and accommodating low level of missing data for a few
sites or samples, plus Costus spicatus and Hellenia globosa sequences. We aligned each
dataset for each marker using the MUSCLE algorithm (Edgar 2004) implemented in
GENEIOUS version 6.1.7 (www.geneious.com), and subsequently checked the multiple
sequence alignments manually. Models of evolution were determined for each marker
alignment in jModelTest version 2 (Darriba et al. 2012) using the Bayesian information
criterion.
5.2.5. Population Structure and Molecular Diversity
Individual and population assignments were conducted using the program
STRUCTURE version 2.3.4 (Pritchard et al. 2000) for dataset (1), which lacks missing data.

!!
! 133!
We explored an admixture model to determine the number of population clusters (k) from 1
through 15 using a burn-in of 1x10⁵ and 2x10⁶ MCMC replications after the burn-in. Five
iterations were run for each k value. The average and standard deviation of the likelihood of
each model were used to calculate Δk (Evanno et al. 2005) using STRUCTURE
HARVESTER web version 0.6.94 (Earl & von Holdt 2011), and the partitioning scheme with
the highest Δk was selected as the model with the most support. To cluster the five iterations
of the optimal partitioning scheme, we used CLUMPP 1.1.2 (Jakobsson & Rosenberg 2007).
Genetic structure was further examined by population pairwise FST comparisons (p < 0.001),
where populations were grouped according to optimal STRUCTURE partitioning scheme,
using ARLEQUIN 3.5 (Excoffier & Lischer 2010). Additionally, molecular diversity indices
were also calculated considering STRUCTURE’s output groups, in ARLEQUIN 3.5.
5.2.6. Divergence time
Nucleotide sequences of the plastid and nuclear genetic markers of the dataset (2)
were independently concatenated and analyzed under a Bayesian phylogenetic framework,
using BEAST 1.7.4 (Drummond & Rambaut 2007). Sequence data was partitioned to allow
different models of sequence evolution for each region, based on likelihood analyses ran on
jModelTest version 2.0 (Darriba et al. 2012). A relaxed clock with an uncorrelated lognormal
model of rate variation was used and a Yule speciation process for branching rates was
selected. One fossil-based time to the most recent common ancestor (tmrca) calibrations
was used: 45 ± 5 Ma for the Costaceae root (Costus incertis!; Berry 1925), and a CTMC rate
prior was selected (Ferreira & Suchard 2008). Markov chain Monte Carlo simulations were
run twice independently for 5x10⁷ generations and sampled every 5x10³. These analyses
were performed on the CIPRES Science Gateway (Miller et al. 2010). We assessed
convergence of model parameters across the independent runs by analyzing plots of the
marginal posterior distributions in Tracer version 1.5 (Rambaut & Drummond 2007), and by

!!
! 134!
ensuring high effective sample size values (ESS ≥ 200). Tracer was also used to assess
burn-in levels. A maximum clade-credibility tree was obtained from the posterior sample of
trees using TreeAnnotator version 1.7.4 (Drummond et al. 2012), and visualized on FigTree
(http://tree.bio.ed.ac.uk/software/figtree/).
5.3. Results
5.3.1. High-throughput sequencing
Overall, 11,616.88 ± 8,750.14 reads per sample did not match our targeted
sequences. Two molecular markers (Ih5GT and FT) and three samples, besides non-
Costaceae out-groups, were removed from analysis. Aligned filtered reads per populations
and outgroup taxa for each molecular marker are presented in Supplementary Figures 1 and
2 of Appendix 2. Character statistics, mean number of reads per sample, total number of
haplotypes, and models of evolution for alignments in dataset (1) are listed in Table 3.
5.3.2. Population Structure and Molecular Diversity
The highest Δk value derived from STRUCTURE replicates was found at k = 8 for
plastid DNA and k = 7 for nuclear DNA (Table 4). Resulting clusters denotes: populations
from Western Amazonia (hereafter, WAZ), populations from Southern Brazilian Amazonia
(SBA) and populations from Cerrados West of the Araguaia River (WCR), which comprises
Chamaecostus acaulis; and populations from Cerrados East and South of the Araguaia
River (ECR), the sampled population from upper São Francisco River (SFR), and the
sampled population from the Araguaia-Tocantins interfluve (ATI), which refers to
Chamaecostus subsessilis. Few Chamaecostus subsessilis individuals had a significant
portion (Q > 20) of their nuclear genome assigned to C. cuspidatus (blue in Figure 2).

!!
! 135!
Moreover, haplotype-based phylogenetic tree provides evidence of a strong
phylogeographic structure (Figures 2 and 3) between C. acaulis populations from Amazonia
(WAZ and SBA) and Cerrado (WCR). FST values also indicate geographically heterogeneous
populations (Table 5).

! 136!
Table 4. Parameters for selecting optimal partioning structure. Calculated for plastid (cp) and nuclear (nr) DNA
concatenated alignments of Chamaecostus subsessilis and C. acaulis. K: Number of population clusters. Likelihood
scores for each value of K genetic clusters from STRUCTURE (Pritchard et al. 2000), Delta K scores for each value of
K genetic clusters following Evanno et al. (2005).
K Mean LnP(K) cp / nr
Stdev LnP(K) cp / nr
Ln'(K) cp / nr
|Ln''(K)| cp / nr
Delta K cp / nr
1 -2647.6/-2485.44 0.2828/0.313 - - -
2 -1955.1/-1796.24 110.801/30.9448 692.5/689.2 307.32/297.16 2.773621/9.602894
3 -1569.92/-1404.2 46.9366/20.5926 385.18/392.04 140.12/193.76 2.985302/9.409207
4 -1324.86/-1205.92 53.5869/95.8363 245.06/198.28 69.28/103.68 1.292853/1.081845
5 -1149.08/-1111.32 31.8822/197.0423 175.78/94.6 211.22/62.08 6.625006/0.315059
6 -1184.52/-1078.8 162.1479/105.1456 -35.44/32.52 83.52/120.44 0.515085/1.145459
7 -1303.48/-925.84 494.4949/9.7048 -118.96/152.96 440.5/488.78 0.890808/50.364806
8 -981.94/-1261.66 122.1021/342.4732 321.54/-335.82 989.54/356.74 8.104204/1.041658
9 -1649.94/-1240.74 1280.7859/368.4694 -668/20.92 772.54/54.38 0.603177/0.147583
10 -1545.4/-1274.2 578.0299/411.7445 104.54/-33.46 7.68/71.9 0.013287/0.174623
11 -1433.18/-1379.56 705.1315/821.3339 112.22/-105.36 348.06/463.04 0.49361/0.563766
12 -1669.02/-1021.88 2242.5251/60.3688 -235.84/357.68 432.12/326.58 0.192693/5.409752
13 -1472.74/-990.78 1117.1607/64.9089 196.28/31.1 106.12/32.84 0.094991/0.50594
14 -1170.34/-992.52 571.2659/65.8149 302.4/-1.74 146.1/22.2 0.255748/0.33731
15 -1014.04/-972.06 278.6757/21.7308 156.3/20.46 - -
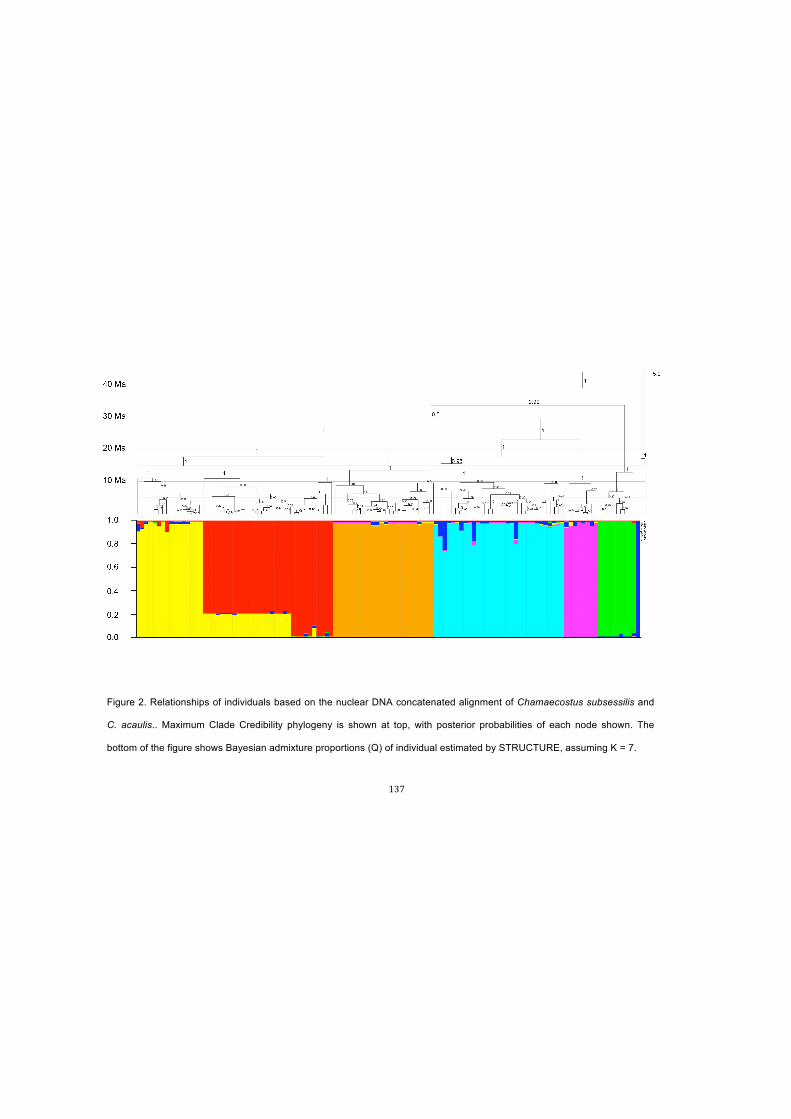
! 137!
Figure 2. Relationships of individuals based on the nuclear DNA concatenated alignment of Chamaecostus subsessilis and
C. acaulis.. Maximum Clade Credibility phylogeny is shown at top, with posterior probabilities of each node shown. The
bottom of the figure shows Bayesian admixture proportions (Q) of individual estimated by STRUCTURE, assuming K = 7.

! 138!
Figure 3. Relationships of individuals based on the plastid DNA concatenated alignment. Maximum Clade Credibility phylogeny
is shown at top, with posterior probabilities of each node shown. The bottom of the figure shows Bayesian admixture proportions
(Q) of individual estimated by STRUCTURE, assuming K = 8.

! 139!
Table 5. Pairwise FST between populations*. Plastid (cp, below diagonal) and nuclear (nr, above
diagonal) DNA concatenated alignments considered individually, of Chamaecostus subsessilis and
C. acaulis**.
Pairwise FST WCR SBA WAZ ATI SFR ECR
WCR 0.84516 0.87396 0.95247 0.94480 0.91097
nr SBA 0.63175 0.32231 0.90629 0.89137 0.88017 WAZ 0.65019 0.29127 0.90812 0.89007 0.87573 ATI 0.80102 0.84026 0.90871 0.87687 0.87770 SFR 0.81881 0.86619 0.96967 0.87541 0.61835 ECR 0.84652 0.86381 0.90535 0.86559 0.76868
cp *All FST values are significant (p=0.000).
** Chamaecostus acaulis populations = WAZ: Western Amazonia; SBA: Southern Brazilian
Amazonia; WCR: Cerrados West of the Araguaia River.
** Chamaecostus subsessilis populations = ECR: Cerrados East and South of the Araguaia River;
SFR: Upper São Francisco River; ATI: Araguaia-Tocantins Interfluve.

!!
! 140!
Genetic diversity (Nei 1978) ranged from 0.57 to 1.00, and the nucleotide diversity
from 0.0004 to 0.006, between all populations (Table 6). Highest diversity in C. acaulis was
observed in populations from the Cerrados West of the Araguaia River (WCR), and in
populations of Cerrados East of the Araguaia River in C. subsessilis. Overall, total haplotype
and nucleotide diversities were 0.98 and 0.014, and 1.00 and 0.018, respectively for plastid
and nuclear DNA.

! 141!
Table 6. Population molecular diversity. Plastid (cp) and nuclear (nr) DNA concatenated alignments considered
independently.
n Number of
haplotypes Gene diversity Mean number of
pairwise differences
Nucleotide diversity*
C. acaulis
WAZ cp 17 7 0.78 ± 0.07 6.91 ± 3.42 0.001 ± 0.000
nr 17 17 1.00 ± 0.02 16.99 ± 7.95 0.002 ± 0.001
SBA cp 31 8 0.84 ± 0.03 37.94 ± 16.95 0.003 ± 0.002
nr 29 17 0.95 ± 0.02 19.20 ± 8.75 0.002 ± 0.001
WCR cp 25 16 0.96 ± 0.02 70.92 ± 31.62 0.006 ± 0.003
nr 24 19 0.98 ± 0.02 4.74 ± 2.40 0.001 ± 0.000
C. subsessilis
ECR cp 31 11 0.89 ± 0.03 28.77 ± 12.93 0.002 ± 0.001
nr 31 29 1.00 ± 0.01 30.98 ± 13.90 0.004 ± 0.002
SFR cp 8 2 0.57 ± 0.10 4.57 ± 2.51 0.0004 ± 0.0002
nr 8 7 0.96 ± 0.08 35.14 ± 17.17 0.004 ± 0.002
ATI cp 9 5 0.81 ± 0.12 47.89 ± 22.96 0.004 ± 0.002
nr 9 9 1.00 ± 0.05 27.36 ± 13.26 0.003 ± 0.002
*Average over sites. ** Chamaecostus acaulis populations = WAZ: Western Amazonia; SBA: Southern Brazilian
Amazonia; WCR: Cerrados West of the Araguaia River. Chamaecostus subsessilis populations = ECR: Cerrados East
and South of the Araguaia River; SFR: Upper São Francisco River; ATI: Araguaia-Tocantins Interfluve.

!!
! 142!
5.3.3. Divergence Time
Bayesian phylogenetic analysis suggests that each species is monophyletic, with
very high support (posterior probability = 1.0). Moreover, population phylogenetic divergence
reflected STRUCTURE results. Direct observation of population relationships clearly points
to topological incongruence between cpDNA and nrDNA trees: C. subsessilis is sister to C.
cuspidatus in the cpDNA phylogeny (Figure 2), while it is sister to C. acaulis in the nrDNA
tree (Figure 3).

!!
! 143!
5.4. Discussion
New high-throughput sequencing technologies coupled with operational advances in
species-tree phylogeny estimation allow us to concomitantly estimate population divergence
and structure to a level previously unmanageable. Results presented here reveal a deep
phylogenetic structure based on range-wide sampling of populations of a Central South
American lineage adapted to dry ecoregions. We found deep phylogeographic structure at
both the population and species level, in plastid and nuclear genomes, as inferred from
fixation indices, structure analysis and phylogenetics.
The Amazon Basin had high environmental heterogeneity during the last 250,000
years, especially in precipitation amounts and distribution between Western (wetter) and
Eastern (drier) Amazonia (Cheng et al. 2013). Modern Amazonia is a product of terrain
development within an erosional regime since ∼2.5 Ma (Campbell Jr. et al. 2006). The main
lineage split is spatially coincident to the Brasiliano thermo-tectonic event that built the
Araguaia orogenic belt during the Neoproterozoic, between 550 and 1000 Ma (Moura &
Gaudette 1999, Chaves et al. 2008), which could have built an environmental filter to
occurrence and dispersal, isolating surrounding populations. Moreover, the divergence
between Eastern and Western lineages unlikely predates the formation of the Araguaia-
Tocantins River system but it may relate to the intense shifts in level and course that likely
occurred during the Miocene due to ocean level variation and Andean orogeny, which
greatly affected Amazonian hydrography (Campbell Jr. et al. 2006, Hoorn et al. 2010), and
the uplift of the central Brazilian plateau (Saadi et al. 2005).
Population structure of rainforest understory organisms is particularly affected by
integrity and continuity of forest cover (Smith et al. 2014), and in such dynamic scenario,
isolated populations at highlands almost certainly were formed. Morphological similarity
between these close-related populations could have been sustained by stabilizing selection
(Morjan & Rieseberg 2004), thus hiding a strong genetic structure. Hence, the Araguaia-
!!
! 144!
Tocantins River represents a secondary contact zone for the Chamaecostus lineages
considered, once it is a region where long-isolated lineages establish secondary contact
(Swenson & Howard 2005), it is spatially clustered at the approximate mid-point between
taxa extant distributions and divergence times between lineages are similar (Moritz et al.
2009). Indeed, this South American suture zone (Anderson 1949) was also found to have
affected other organism’s evolutionary history, such as lizards (Werneck et al. 2012),
primates (Couette 2007), and Lepidoptera (Brown & Gifford 2002).
Species of Chamaecostus investigated here display a strong supported phylogenetic
topological incongruence between plastid and nuclear genomes. Conflict between plastid
and nuclear datasets commonly indicates reticulating histories due to hybridization (Kellogg
et al. 1996, Rieseberg et al. 1996; Rieseberg 1997, Sang et al. 1997, Seelanan et al. 1997).
Particularly at genus level and below, phylogenetic relationships can be biased by
chloroplast capture resulting from hybridization (Rieseberg & Soltis 1991, Soltis & Kuzoff
1995). Nonetheless, genetic structure depends on species ecological attributes and life
history traits distinctively at nuclear and plastid markers once they represent different gene
dispersal mechanisms in plants, i.e. pollen and seed, respectively (Petit et al. 2005). Once
phylogenetic conservatism and covariation among traits are taken into account, plant genetic
structure is related with mating system for nuclear markers and seed dispersal mode or
geographic range size for organelle markers (Duminil et al. 2007), supporting that topology
inconcruency does relate to distinctive evolutionary processes (Bull et al. 1993, Soltis &
Kuzoff 1995, Huelsenbeck et al. 1996).
In a phylogenetic species concept perspective (Cracraft 1989), species can
frequently exchange individuals and genes with neighbouring species (Isaac et al. 2004). In
C. subsessilis, introgression from C. cuspidatus is further supported by admixture seen in
nrDNA structure. Shared haplotypes in recently diverging taxa can be ascribed to shared
ancestral polymorphism, since descendant lineages are expected to share genetic
polymorphism for some time (Lexer et al. 2006, Nosil et al. 2009). Moreover, divergence
!!
! 145!
between the taxa under consideration here is several million years old, so an ancestral
polymorphism hypotesis is a more likely explanation. Indeed, several Costus species are
interfertile in greenhouse crosses (Kay & Schemske 2008). Straightforward evidence for
hybridization among closely related species might also be achieved from crossing
experiments (Wendt et al. 2001, 2002). Hence, a full range sampling of C. cuspidatus,
including sympatric populations of both, would shed light into a hypothesis of introgression.
Surget-Groba & Kay (2013) found very restrictive gene flow between the sister
species Costus pulverulentus C.Presl and Costus scaber Ruiz & Pav, recovered from
microsatellite loci, and proposed that it could have been a causative factor to the rapid
radiation of Neotropical Costus. They even suggested that to formally test this hypothesis, it
would be necessary to expand taxa sampling, and compare results with lineages that did not
go through such a radiation. Chamaecostus are considerably more ancient than Costus
(Specht 2006, André et al. unpubl.), but it encompasses much less extant species, and we
still found significant strong phylogeographic structure and limited gene flow. Considerable
progress has been made on discerning the importance of different factors and traits
generating reproductive isolation (Schluter 2001, 2009). Gene flow holds species together
much by facilitating the spread of beneficial mutants and associated hitchhiking events
(Morjan & Rieseberg 2004), and additionally by homogenizing neutral loci (Wright 1931).
Reproductive barriers are important mainly to preserve adaptations, but they rarely protect
the entire genome from gene flow in recently diverged species (Rieseberg & Wendel 1993,
Arnold 1997, Rieseberg et al. 2004, Wu 2011). In this sense, populations within a species
evolve collectively due a combination of gene flow and selective sweeps at different spatial
scales (Morjan & Rieseberg 2004, Kane & Rieseberg 2007, Lexer & Widmer 2008, Arnold &
Martin 2010).
Although the clustered and isolated aspects of Chamaecostus populations could
indicate clonal reproduction, the high number of haplotypes in concatenated alignments
sustains that most individuals are genetically distinctive. Rarity along landscape plus the

!!
! 146!
elevated local genetic structure might categorize interglacial refugia (Stewart et al. 2010,
Bonatelli et al. 2014), which will consecutively be verified through a historic demography
approach (DeChaine & Martin 2006). Future works will also focus on comparing coding and
non-coding sequences to understand selection signatures across geographic space and its
relation with environmental tolerance and gene flow.
!!
! 147!
5.5. Acknowledgments
TA received a scholarship grant from Coordenação de Aperfeiçoamento de Pessoal de Nível
Superior. TW received a productivity grant from Conselho Nacional de Desenvolvimento
Científico e Tecnológico. CS received support from the US National Geographic Society
(CRE Grant #8994-11) and CPS received support from BIOTA-FAPESP (2009/52725-3),
which helped support this research. We are thankful to Lydia Smith for assistance with
targeted enrichment, and Grady Pierroz for helping to select and amplify probes.
5.6. References
Almeida FC, Bonvicino CR, Cordeiro-Estrela P. 2007. Phylogeny and temporal
diversification of Calomys (Rodentia, Sigmodontinae): implications for the biogeography
of an endemic genus of the open/dry biomes of South America. Molecular Phylogenetics
and Evolution 42: 449-466.
Anderson E. 1949. Introgressive hybridization. Wiley. 109 p.
Arnold ML, Martin NH. 2010. Hybrid fitness across time and habitats. Trends in Ecology and
Evolution 25: 530-536.
Arnold ML. 1997. Natural Hybridization and Evolution. Oxford Series in Ecology and
Evolution. Oxford University Press USA. 232 p.
Avise JC, Arnold J, Ball RM, Bermingham E, Lamb T, Neigel JE, Reeb CA, Saunders NC.
1987. Intraspecific phylogeography: the mitochondrial DNA bridge between population
genetics and systematics. Annual Review of Ecology and Systematics 18: 489-522.
Avise JC. 2009. Phylogeography: retrospect and prospect. Journal of Biogeography 36: 3-
15.

!!
! 148!
Behling H, Hooghiemstra H. 2001. Neotropical savanna environments in space and time:
Late Quaternary interhemispheric comparisons. In Markgraf V. (Ed.). Interhemispheric
Climate Linkages. Academic Press. 307-323 p.
Berry EW. 1925. A banana in the Tertiary of Colombia. American Journal of Science. 10:
530-537.
Bonatelli IAS, Perez MF, Peterson AT, Taylor NP, Zappi DC, Machado MC, Koch I, Pires
AHC, Moraes EM. 2014. Interglacial microrefugia and diversification of a cactus species
complex: phylogeography and palaeodistributional reconstructions for Pilosocereus
aurisetus and allies. Molecular Ecology 23: 3044-3063.
Brown JH. 1995. Macroecology. University of Chicago Press. 284 p.
Brown KS, Gifford DR. 2002. Lepidoptera in the Cerrado landscape and the conservation of
vegetation, soil, and topographical mosaics. In Oliveira PS, Marquis RJ. (Eds.). The
Cerrados of Brazil: Ecology and Natural History of a Neotropical Savanna. Columbia
University Press. 201-222 p.
Bull JJ, Huelsenbeck JP, Cunningham CW, Swofford DL, Waddell PJ. 1993. Partitioning and
combining data in phylogenetic analysis. Systematic Biology 42: 384-397.
Campbell Jr. KE, Frailey CD, Romero-Pittman L. 2006. The Pan-Amazonian Ucayali
Peneplain, late Neogene sedimentation in Amazonia, and the birth of the modern
Amazon River system. Palaeogeography, Palaeoclimatology, Palaeoecology 239: 166-
219.
Chaves CL, Gorayeb PSS, Moura CAV. 2008. Geologia, geocronologia e litoquímica dos
granitos paleoproterozóicos do tipo A no setor setentrional da Província Tocantins.
Revista Brasileira de Geociências 38: 366-378.
Cheng H, Sinha A, Cruz FW, Wang X, Edwards RL, d’Horta FM, Ribas CC, Vuille M, Scott

!!
! 149!
LD, Auler AS. 2013. Climate change patterns in Amazonia and biodiversity. Nature
Communications 4: 1411.
Cole M. 1986. The Savannas: Biogeography and Geobotany. Academic Press. 438&p.
Collevatti RG, Grattapaglia D, Hay JD. 2003. Evidences for multiple maternal lineages of
Caryocar brasiliense populations in the Brazilian Cerrado based on the analysis of
chloroplast DNA sequences and microsatellite haplotype variation. Molecular Ecology
12: 105-115.
Costa LP. 2003. The historical bridge between the Amazon and the Atlantic Forest of Brazil:
a study of molecular phylogeography with small mammals. Journal of Biogeography 30:
71-86.
Couette S. 2007. Différenciation morphologique et génétique des populations de
douroucoulis (Aotus infulatus, Primates, Platyrhiniens, Cebidae) provenant des rives
droite et gauche du rio Tocantins (Brésil). Comptes Rendus Biologies 330: 148-158.
Cracraft J. 1989. Speciation and its ontology: the empirical consequences of alternative
species concepts for understanding patterns and processes of differentiation. In Otte D,
Endler JA (Eds). Speciation and its Consequences. Sinauer Associates. pp. 28-59.
D’Hont A, Denoeud F, Aury JM, Baurens FC, Carreel F, Garsmeur O, Noel B, Bocs S, Droc
G, Rouard M, Silva C, Jabbari K, Cardi C, Poulain J, Souquet M, Labadie K, Jourda C,
Lengellé J, Rodier-Goud M, Alberti A, Bernard M, Correa M, Ayyampalayam S, Mckain
MR, Leebens-Mack J, Burgess D, Freeling M, Mbéguié-A-Mbéguié D, Chabannes M,
Wicker T, Panaud O, Barbosa J, Hribova E, Heslop-Harrison P, Habas R, Rivallan R,
Francois P, Poiron C, Kilian A, Burthia D, Jenny C, Bakry F, Brown S, Guignon V, Kema
G, Dita M, Waalwijk C, Joseph S, Dievart A, Jaillon O, Leclercq J, Argout X, Lyons E,
Almeida A, Jeridi M, Dolezel J, Roux N, Risterucci AM, Weissenbach J, Ruiz M,
Glaszmann JC, Quétier F, Yahiaoui N, Wincker P. 2012. The banana (Musa acuminata)

!!
! 150!
genome and the evolution of monocotyledonous plants. Nature 488: 213-217.
Darriba D., G. L. Taboada, R. Doallo, and D. Posada. 2012. jModelTest 2: More models,
new heuristics and parallel computing. Nature Methods 9: 772.
DeChaine EG, Martin AP. 2006. Using coalescent simulations to test the impact of
Quaternary climate cycles on divergence in an alpine plant-insect association. Evolution
60: 1004-1013.
Doyle JJ, Doyle JL. 1990. A rapid total DNA preparation procedure for fresh plant tissue.
Focus 12:13-15.
Drummond AJ, Rambaut A. 2007. BEAST: Bayesian evolutionary analysis by sampling
trees. BMC Evolutionary Biology 7: 214.
Drummond AJ, Suchard MA, Xie D, Rambaut A. 2012. Bayesian phylogenetics with BEAUti
and the BEAST 1.7. Molecular Biology and Evolution 29: 1969-1973.
Duminil J, Fineschi S, Hampe A, Jordano P, Salvini D, Vendramin GG, Petit RJ. 2007. Can
Population Genetic Structure Be Predicted from Life‐History Traits? American Naturalist
169: 662-672.
Earl DA, vonHoldt BM. 2011. STRUCTURE HARVESTER: a website and program for
visualizing STRUCTURE output and implementing the Evanno method. Conservation
Genetics Resources DOI: 10.1007/s12686-011-9548-7
Edgar RC. 2004. MUSCLE: multiple sequence alignment with high accuracy and high
throughput. Nucleic Acids Research 32: 1792-1797.
Endler JA. 1982. Problems in distinguishing historical from ecological factors in
biogeography. American Zoologist 22: 441-452.
Evanno G, Regnaut S, Goudet J. 2005. Detecting the number of clusters of individuals using

!!
! 151!
the software STRUCTURE: a simulation study. Molecular Ecology 14: 2611-2620.
Excoffier L, Lischer HEL. 2010. Arlequin suite ver 3.5: A new series of programs to perform
population genetics analyses under Linux and Windows. Molecular Ecology Resources.
10: 564-567.
Felfili JM, Mendonça RC, Walter BMT, Silva Júnior MC, Fagg CW, Nóbrega MGG, Sevilha
AC, Silva MA. 2001. Flora fanerogâmica das matas de galeria e ciliares do Brasil
Central. In Ribeiro JF, Fonseca CEL, Sousa-Silva JC (Eds) Cerrado: caracterização e
recuperação de Matas de Galeria. Embrapa. 195-263 p.
Ferreira MAR, Suchard MA. 2008. Bayesian analysis of elapsed times in continuous-time
Markov chains. Canadian Journal of Statistics 26: 355-368.
Ho SYW, Jermiin LS. 2004. Tracing the decay of the historical signal in biological sequence
data. Systematic Biology 53: 628-637.
Hoorn C, Wesselingh FP, ter Steege H, Bermudez MA, Mora A, Sevink J, Sanmartín I,
Sanchez-Meseguer A, Anderson CL, Figueiredo JP, Jaramillo C, Riff D, Negri FR,
Hooghiemstra H, Lundberg J, Stadler T, Sarkinen T, Antonelli A. 2010. Amazonia
through time: Andean uplift, climate change, landscape evolution, and biodiversity.
Science 330: 927-931.
Huelsenbeck JP, Bull JJ, Cunningham CW. 1996. Combining data in phylogenetic analysis.
Trends in Ecology and Evolution 11: 152-157.
Isaac NJB, Purvis A. 2004. The ‘species problem’ and testing macroevolutionary
hypotheses. Divers. Distrib. 10, 275–281
Jakobsson M, Rosenberg NA. 2007. CLUMPP: a cluster matching and permutation program
for dealing with label switching and multimodality in analysis of population structure.
Bioinformatics 23: 1801-1806.
!!
! 152!
Kane NC, Rieseberg LH. 2007. Selective sweeps reveal candidate genes for adaptation to
drought and salt tolerance in common sunflower, Helianthus annuus. Genetics
175:1803-1812.
Kay KM, Schemske DW. 2008. Natural selection reinforces speciation in a radiation of
Neotropical rainforest plants. Evolution 62: 2628-2642.
Kay KM, Reeves PA, Olmstead RG, Schemske DW. 2005. Rapid speciation and the
evolution of hummingbird pollination in Neotropical Costus subgenus Costus
(Costaceae): Evidence from nrDNA ITS and ETS sequences. American Journal of
Botany 92: 1899-1910.
Kellogg EA, Appels R, Mason-Gamer RJ. 1996. When genes tell different stories: the diploid
genera of Triticeae (Gramineae). Systematic Botany 21: 321-347.
Kircher M, Sawyer S, Meyer M. 2012. Double indexing overcomes inaccuracies in multiplex
sequencing on the Illumina platform. Nucleic Acids Research 40: e3.
Lage LA, Silva IV, André T. 2012. Root tuber morphoanatomy of Chamaecostus subsessilis
(Costaceae), a drought-tolerant ground herb from seasonal forests of central South
America. Bulletin of the Heliconia Society International 18: 10-11.
Lemmon EM, Lemmon AR. 2013. High-Throughput Genomic Data in Systematics and
Phylogenetics. Annual Review of Ecology, Evolution and Systematics 44: 99-121.
Lexer C, Widmer A. 2008.The genic view of plant speciation: recent progress and emerging
questions. Philosophical Transactions of the Royal Society B 363: 3023-3036.
Lexer C, Kremer A, Petit R. 2006. Shared alleles in sympatric oaks: recurrent gene flow is a
more parsimonious explanation than ancestral polymorphism. Comment. Molecular
Ecology 15: 2007-2012.
Librado P, Rozas J. 2009. DnaSP v5: A software for comprehensive analysis of DNA
!!
! 153!
polymorphism data. Bioinformatics 25: 1451-1452.
Lomolino MV, Riddle BR, Whittaker RJ, Brown JH. 2010. Biogeography. 4th Ed. Sinauer
Associates 560 p.
Maas PJM. 1972. Costoideae (Zingiberaceae). Flora Neotropica monograph no 8. Hafner,
New York, New York, USA.
Maas PJM. 1977. Renealmia (Zingiberaceae-Zingiberoideae) Costoideae (Additions)
(Zingiberaceae). Flora Neotropica monograph no 18. Hafner, New York, New York, USA.
Mamanova L, Coffey AJ, Scott CE, Kozarewa I, Turner EH, Kumar A, Howard E, Shendure
J, Turner DJ. 2010. Target-enrichment strategies for next-generation sequencing. Nature
Methods 7: 111-118.
Maricic T, Whitten M, Pääbo S. 2010. Multiplexed DNA sequence capture of mitochondrial
genomes using PCR products. PLoS ONE 5: e14004.
McCormack JE, Hird SM, Zellmer AJ, Carstens BC, Brumfield RT. 2013. Applications of
next-generation sequencing to phylogeography and phylogenetics. Molecular
Phylogenetics and Evolution 66: 526-538.
McKenna A, Hanna M, Banks E, Sivachenko A, Cibulskis K, Kernytsky A, Garimella K,
Altshuler D, Gabriel S, Daly M, DePristo MA. 2010. The Genome Analysis Toolkit: a
MapReduce framework for analyzing next-generation DNA sequencing data. Genome
Research 20: 1297-1303.
Miller MA, Pfeiffer W, Schwartz T. 2010. Creating the CIPRES Science Gateway for
Inference of Large Phylogenetic Trees. In Proceedings of the Gateway Computing
Environments Workshop (GCE), New Orleans, LA: 1-8.
Moritz C, Hoskin CJ, MacKenzie JB, Phillips BL, Tonione M, Silva N, VanDerWal J, Williams
SE, Graham CH. 2009. Identification and dynamics of a cryptic suture zone in tropical

!!
! 154!
rainforest. Proceedings of the Royal Society B 276: 1235-1244.
Morjan CL, Rieseberg LH. 2004. How species evolve collectively: implications of gene flow
and selection for the spread of advantageous alleles. Molecular Ecology 13: 1341-1356.
Moura CAV, Gaudette HE. 1999. Zircon ages of basement orthogneisses from the northern
of the Araguaia Belt, Brazil. Basement Tectonics 13: 155-178.
Nosil P, Funk DJ, Ortiz-Barrientos D. 2009. Divergent selection and heterogeneous genomic
divergence. Molecular Ecology 18: 375-402.
Peñalba JV, Smith LL, Tonione MA, Sass C, Hykin SM, Skipwith PL, McGuire JA, Bowie
RCK, Moritz C. 2014.Sequence capture using PCR-generated probes: a cost-effective
method of targeted high-throughput sequencing for nonmodel organisms. Molecular
Ecology Resources 14: 1000-1010.
Pennington RT, Lavin M, Oliveira-Filho A. 2009. Woody plant diversity, evolution, and
ecology in the tropics: perspectives from seasonally dry tropical forests. Annual Review
of Ecology, Evolution and Systematics 40: 437-457.
Petit RJ, Duminil J, Fineschi S, Hampe A, Salvini D, Vendramin GG. 2005. Comparative
organisation of chloroplast, mitochondrial and nuclear diversity in plant populations.
Molecular Ecology 14: 689-711.
Prado DE, Gibbs PE. 1993. Patterns of species distributions in the dry seasonal forests of
South America. Annals of the Missouri Botanical Garden 80: 902-927.
Prado CPA, Haddad CFB, Zamudio KR. 2012. Cryptic lineages and Pleistocene population
expansion in a Brazilian Cerrado frog. Molecular Ecology 21: 921-941.
Pritchard JK, Stephens M, Donnelly P. 2000. Inference of population structure using
multilocus genotype data. Genetics 155: 945-959.
!!
! 155!
Rambaut A, Drummond AJ. 2007. Tracer v1.5, Available from
http://tree.bio.ed.ac.uk/software/tracer/
Ramos ACS, Lemos-Filho JP, Ribeiro RA, Santos FR, Lovato MB. 2007. Phylogeography of
the tree Hymenaea stigonocarpa (Fabaceae: Caesalpinioideae) and the influence of
Quaternary climate changes in the Brazilian cerrado. Annals of Botany 100: 1219-1228.
Reiseberg LH, Soltis DE. 1991. Phylogenetic consequences of cytoplasmic gene flow in
plants. Evolutionary Trends in Plants 5: 65-84.
Rieseberg LH, Wendel J. 1993. Introgression and its consequences in plants. In Harrison R.
(Ed). Hybrid Zones and the Evolutionary Process. Oxford University Press USA. 70-114
p.
Rieseberg LH, Church S, Morjan CL. 2004. Integration of populations and differentiation of
species. New Phytologist 161: 59-69.
Rieseberg LH, Whitton J, Linder CR. 1996. Molecular marker incongruence in plant hybrid
zones and phylogenetic trees. Acta Botanica Neerlandica 45: 243-262.
Rieseberg LH. 1997. Hybrid origins of plant species. Annual Review of Ecology and
Systematics 28: 359–389.
Saadi A, Bezerra FHR, Costa RD, Igreja HLS, Franzinelli E. 2005. Neotectônica da
plataforma brasileira. In Souza CRG, Suguio K, Oliveira AMS, Oliveira PE (Eds).
Quaternário do Brasil. Holos Editora. 211-234 pp.
Salzman S, Driscoll HE, Renner T, André T, Shen S, Specht CD. Spiraling into history: A
molecular phylogeny and investigation of biogeographic origins and floral evolution for
the genus Costus L. Systematic Botany in press.
Sang T, Crawford DJ, Stuessy TF. 1997. Chloroplast DNA phylogeny, reticulate evolution,
and biogeography of Paeonia (Paeoniaceae). American Journal of Botany 84: 1120–
!!
! 156!
1136.
Schluter D. 2001. Ecology and the origin of species. Trends in Ecology and Evolution 16:
372-380.
Schluter D. 2009. Evidence for ecological speciation and its alternative. Science 323: 737-
741.
Seelanan T, Schnabel A, Wendel JF. 1997. Congruence and consensus in the cotton tribe
(Malvaceae). Systematic Botany 22: 259-290.
Shaw J, Lickey EB, Schilling EE, Small RL. 2007. Comparison of whole chloroplast genome
sequences to choose noncoding regions for phylogenetic studies in angiosperms: the
tortoise and the hare III. American Journal of Botany 94: 275-288.
Silva IA, Silva DM, Carvalho GH, Batalha MA. 2011. Reproductive phenology of Brazilian
savannas and riparian forests: environmental and phylogenetic issues. Annals of Forest
Science 68: 1207-1215.
Silva JF, Farinas MR, Felfili JM, Klink CA. 2006. Spatial heterogeneity, land use and
conservation in the Cerrado region of Brazil. Journal of Biogeography 33: 536-548.
Silva JMC, Bates JM. 2002. Biogeographic patterns and conservation in the South American
Cerrado: a tropical savanna hotspot. BioScience 52: 225-234.
Simpson JT, Wong K, Jackman SD, Schein JE, Jones SJM, Birol İ. 2009. ABySS: A parallel
assembler for short read sequence data. Genome Research 19: 1117-1123.
Smith BT, McCormack JE, Cuervo AM, Hickerson MJ, Aleixo A, Cadena CD, Pérez-Emán J,
Burney CW, Xie X, Harvey MG, Faircloth BC, Glenn TC, Derryberry EP, Prejean J,
Fields S, Brumfield RT. 2014. The drivers of tropical speciation. Nature 515: 406-409.
Soltis DE, Kuzoff RK. 1995. Discordance between nuclear and chloroplast phylogenies in

!!
! 157!
the Heuchera group (Saxifragaceae). Evolution 49: 727-742.
Specht CD. 2006. Gondwanan vicariance or dispersal in the tropics? The biogeographic
history of the tropical monocot family Costaceae (Zingiberales). Aliso 22: 633-644.
Specht CD, Kress WJ, Stevenson DW, DeSalle R. 2001. A molecular phylogeny of
Costaceae (Zingiberales). Molecular Phylogenetics and Evolution 21: 333-345.
Stewart JR, Lister AM, Barnes I, Dalén L. 2010. Refugia revisited: individualistic responses
of species in space and time. Proceedings of the Royal Society of London Series B 277:
661-671.
Surget-Groba Y, Kay KM. 2013. Restricted gene flow within and between rapidly diverging
Neotropical plant species. Molecular Ecology 22: 4931-4942.
Swenson N G, Howard DJ. 2005. Clustering of contact zones, hybrid zones, and
phylogeographic breaks in North America. American Naturalist 166: 581-591.
Turchetto-Zolet AC, Pinheiro F, Salgueiro F, Palma-Silva C. 2013. Phylogeographical
patterns shed light on evolutionary process in South America. Molecular Ecology 22:
1193-1213.
Turchetto-Zolet AC, Cruz F, Vendramin GG, Simon MF, Salgueiro F, Margis-Pinheiro M,
Margis R. 2012. Large-scale phylogeography of the disjunct Neotropical tree species
Schizolobium parahyba (Fabaceae-Caesalpinioideae). Molecular Phylogenetics and
Evolution 65: 174-182.
Wendt T, Canela MBF, Faria APG, Rios RI. 2001. Reproductive biology and natural
hybridization between two endemic species of Pitcairnia (Bromeliaceae). American
Journal of Botany 88: 1760-1767.
Wendt T, Canela MBF, Klein DE, Rios RI. 2002. Selfing facilitates reproductive isolation
among three sympatric species of Pitcairnia (Bromeliaceae). Plant Systematics and
Evolution 232: 201-212.

!!
! 158!
Werneck FP. 2011. The diversification of eastern South American open vegetation biomes:
historical biogeography and perspectives. Quaternary Science Reviews, 30: 1630-1648.
Werneck FP, Costa GC, Colli GR, Prado DE, Sites Jr JW. 2011. Revisiting the historical
distribution of seasonally dry tropical forests: new insights based on palaeodistribution
modelling and palynological evidence. Global Ecology and Biogeography 20: 272-288.
Werneck FP, Gamble T, Colli GR, Rodrigues MT, Sites Jr JW. 2012. Deep diversification
and long-term persistence in the South American ‘dry diagonal’: integrating continent-
wide phylogeography and distribution modeling of Geckos. Evolution 66: 3014-3034.
Whinnett A, Zimmermann M, Willmott KR, Herrera N, Mallarino R, Simpson F, Joron M,
Lamas G, Mallet J. 2005. Strikingly variable divergence times inferred across an
Amazonian butterfly ‘suture zone’. Proceedings of the Royal Society B 272: 2525-2533.
Wright S. 1931. Evolution in Mendelian populations. Genetics 16: 97-169.
Wu CI. 2001. The genic view of the process of speciation. Journal of Evolutionary Biology
14: 851-865.
Zeng L, Zhang Q, Sun R, Kong H, Zhang N, Ma H. 2014. Resolution of deep angiosperm
phylogeny using conserved nuclear genes and estimates of early divergence times.
Nature Communications 5: 4956.

!!
! 159!

!!
! 160!
Chapter 6 – Final remarks

!!
! 161!
Biological diversity varies through space, time, and among different kinds of
organisms. The conspicuous disparities in both species richness and morphological diversity
that exist between close-related groups of organisms comprise a common pattern in the
organization of biological diversity, and such cases appear in nearly any taxonomic group.
The genus Costus is by far the most species-rich in the spiral gingers family (Costaceae
Nakai), with species occurring natively in tropical Africa as well as Central and South
America. The majority of the diversity in Costus species number and morphology occurs in
the Neotropics. However, an ancient lineage of Costaceae also inhabits the New World
tropics (consisting of Monocostus, Dimerocostus and Chamaecostus) and is likely to have
played a role in Neotropical forest ecosystems long before the arrival of Costus from Africa.
The causes of phylogenetic, temporal, and geographic variation are at least partially related
to the evolutionary process of diversification. Results presented in this thesis erect
propositions related to speciation and the evolution of species diversity in the spiral gingers.
Costaceae display a significant variation in speciation rate among clades, with a
significant rate shift at the most recent common ancestor of the Neotropical Costus clade.
The geographic context of speciation in Neotropical Costaceae lineages uncovers an overall
predominance of allopatric speciation in the older divergent South American clade, where
most extant species display little overlap in geographic ranges. In contrast, sympatry is much
higher within the Neotropical Costus clade, independent of node age.
Rapid radiations are fundamental to examining evolutionary processes associated
with bursts of speciation and morphological diversification. Ancestral reconstruction of
pollination syndrome within Costus presents an evolutionary toggle in pollination
morphologies, demonstrating both the multiple independent evolutions of ornithophily (bird
pollination) as well as reversals to melittophily (bee pollination). Based on the current
distribution for the Neotropical and African species, an historic dispersal of a bee-pollinated
taxon from Africa occurred to the Pacific Coast of Mexico and Central America, subsequently
diversificating and leading to the evolution of a bird-pollinated floral morphology in multiple
!!
! 162!
derived lineages.
Most species within the genus Chamaecostus (Costaceae) are well defined, but there
is a broad geographic range and long list of synonyms associated with Chamaecostus
subsessilis, which could indicate the presence of some cryptic species within this species
complex. Indeed, while Chamaecostus is strongly monophyletic, C. cuspidatus is found to be
sister to a clade of some but not all samples of C. subsessilis, making it necessary to
acknowledge more than one species in the C. subsessilis complex. Leaf morphometric
measurements of herbarium specimens reveal limited distinction among phylogenetic
lineages, demonstrating a cryptic speciation scenario.
A further examination of speciation of the understory herbs from the Chamaecostus
subsessilis complex along South American seasonally dry forests of Cerrado and South
Amazonia support a deep phylogeographic structure at both the population and species
level, as inferred from fixation indices, structure analysis and phylogenetics. These lineages
exhibit a strong supported phylogenetic topological incongruence between plastid and
nuclear genomes and admixture analysis.
Biogeography and trait evolution in Costaceae is still insufficiently investigated, and
to advance in the study of the evolutionary scenarios of diversification, other approaches
would be largely valuable, such as the analysis of differences in niche dimensions and of
niche conservation over evolutionary time, the correlation of species’ phenotypic variability
and geographic range attributes, and the assessment of selection signature, and of the
timing and geographical pattern of demographic evolution. Their charismatic spiral foliage
and normally bold-colored inflorescences make Costaceae species prominent features of
most lowland Neotropical forests, and as for its manageable species richness, variable
morphological traits, and easy of cultivation, they are emergening as a strategic family to
understand speciation patterns and processes in Tropical landscapes.
!!
! 163!
Appendix 1. Voucher Information for species sampled and GenBank accession numbers for
DNA sequences. Information is as follows: species name, voucher information, GenBank
accession numbers for five loci: ITS, ETS, CaM, rsp16-trnK, trnL-trnLF. Genbank accessions
beginning KJ were created in this study. Previously generated sequences for a species that
used a separate vouchered individual have the voucher information indicated in
parentheses. Dashes denote missing data. Collector abbreviations for herbarium vouchers:
BS = B. Stahl; BTM = B.T. Meise; CS = Chelsea Specht; M = P.J.M. Maas; Mood = John
Mood; KMN = Lyon Arboretum Herbarium (HLA) collector Ken Nagata; R = David Skinner;
TvA = Tinde van Andel; US = Uwe Scharf; WJK = W. John Kress. Abbreviations for living
collections: NMNH = Smithsonian Greenhouse Collections; L = Lyon Arbortetum; BB =
Burgers Bush; NY = New York Botanical Garden Living Collection; RB = Rio de Janeiro
Botanical Garden herbarium collections.
Chamaecostus lanceolatus (Petersen) var. pulchriflorus (Ducke) C. D. Specht & D. W. Stev., RB550388, KJ011475, KJ011224, KJ011299, KJ011419, KJ011347; Chamaecostus cuspidatus (Nees & Mart.) C. D. Specht & D. W. Stev., RB584184, AY994739 (WJK94-3681), KJ011223, KJ011298, KJ011418, KJ011346; Chamaecostus subsessilis (Nees & Mart.) C. D. Specht & D. W. Stev., RB584183, KJ011476, KJ011225, KJ011300, KJ011420, KJ011348; Hellenia globosa (Blume) S.R. Dutta, CS02-351 as Cheilocostus globosus, KJ011479, KJ011228, -, KJ011423, AY994592 (Mood 1713); Costus afer Ker Gawl., M10205, KJ011425, KJ011151, KJ011230, KJ011351, KJ011304; Costus albiflos Maas & H. Maas , M9968, KJ011426, KJ011152, KJ011231, KJ011352, KJ011305; Costus allenii Maas, M9563, AY994743 (NY347/95A), KJ011153, -, KJ011353, AY994587 (NY347/95A); Costus amazonicus J. F. Macbr., M9036 , AY994742 (CS02-327), KJ011154, KJ011232, KJ011354, AY994586 (CS02-327); Costus arabicus L., CS98-193, AY041034, KJ011155, KJ011233, KJ011355, KJ011306; Costus asplundii (Maas) Maas, R2976, KJ011427, KJ011156, KJ011234, KJ011356, KJ011307; Costus barbatus Suess., CS01-256, AY994741 (NY1413/91B), KJ011157, KJ011235, KJ011357, KJ011308; Costus beckii Maas & H. Maas, CS99-232 , KJ011428, KJ011158, KJ011236, KJ011358, KJ011309; Costus bracteatus Rowlee, M9409, KJ011429, KJ011159, KJ011237, KJ011359, KJ011310; Costus chartaceus Maas, WJK90-3124, AY994719 (WJK99-6356), KJ011160, KJ011238, KJ011360, AY994559 (WJK 99-6356); Costus claviger Benoist, M9306, AY994740 (KMN2361), KJ011161, KJ011239, KJ011361, AY994584 (KMN 2361); Costus comosus var. bakeri (K. Schum.) Maas, BB1999-0126011, KJ011430, KJ011162, KJ011240, KJ011362, KJ011311; Costus curvibracteatus Maas, M9381, KJ011431, KJ011163, KJ011241, KJ011363, AY994583 (NY356-95A); Costus deistelii K. Schum., M9298, AY994752, KJ011165, KJ011242, KJ011365, AY994599; Costus aff. dubius, L92.0048, KJ011434, KJ011167, KJ011244, KJ011367, AY994596 (M3549); Costus dinklagei K. Schum., TvA3549, KJ011433, KJ011166, KJ011243, KJ011366, KJ011312; Costus dirzoi García-Mend. & Ibarra-Manr., 1996-0228002, KJ011435, KJ011168, KJ011245, KJ011368, KJ011313; Costus dubius K. Schum., M10206, KJ011436, KJ011169, KJ011246, KJ011369, KJ011314; Costus erythrocoryne, K. Schum., AY994738 (CS02-326), AY972950 (KK98.73), -, -, AY994579 (CS02-326); Costus erythrophyllus Loes., R2847, KJ011437, KJ011170,
!!
! 164!
KJ011247, -, KJ011315; Costus erythrothyrsus Loes., M9317, KJ011438, KJ011171, KJ011248, KJ011370, KJ011316; Costus gabonensis Koechlin, M10291, KJ011439, KJ011172, KJ011249, KJ011371, KJ011317; Costus geothyrsus K. Schum., BS6782, KJ011440, KJ011173, KJ011250, KJ011372, KJ011318; Costus glaucus Maas, Delft 46-325, KJ011441, KJ011174, KJ011251, KJ011373, KJ011319; Costus guanaiensis var. guanaiensis Rusby, R2666, AY994737 (L94.0306), KJ011175, KJ011252, KJ011374, AY994577 (L94.0306); Costus guanaiensis var. macrostrobilus (K. Schum.) Maas, CS00-253, KJ011442, KJ011176, KJ011253, KJ011375, KJ011320; Costus guanaiensis var. tarmicus (Loes.) Maas, KMN2811, AY994751, KJ011177, KJ011254, KJ011376, AY994597; Costus laevis Ruiz & Pav., CS01-257, KJ011443, KJ011178, KJ011255, KJ011377, AY994576 (NY351/95A); Costus lasius Loes., M9155, AY994735 (NMNH 94-670), KJ011179, -, KJ011378, AY994575 (NMNH 94-670); Costus lateriflorus Gagnep., M10331, KJ011444, KJ011180, KJ011256, KJ011379, KJ011321; Costus letestui Pellegr., CS02-331, AY994733, KJ011181, KJ011257, KJ011380, AY994573; Costus leucanthus Maas, BB1996-1105001, KJ011445, KJ011182, KJ011258, KJ011381, KJ011322; Costus aff. ligularis, BB1998-0923003, KJ011446, KJ011183, KJ011259, KJ011382, KJ011323; Costus aff. ligularis , M10226, KJ011448, KJ011185, KJ011261, KJ011384, -; Costus aff. ligularis , US237, KJ011447, KJ011184, KJ011260, KJ011383, KJ011324; Costus sp. nov., M9995, KJ011449, KJ011186, KJ011262, KJ011385, KJ011325; Costus lima K. Schum., R3014, KJ011450, KJ011187, KJ011263, KJ011386, -; Costus lima var. scabremarginatus Maas, BTM75-0400, KJ011451, KJ011188, KJ011264, KJ011387, KJ011326; Costus loangensis H. Maas & Maas, M10184, KJ011452, KJ011189, KJ011265, KJ011388, KJ011327; Costus longibracteolatus Maas, R3003, KJ011453, KJ011190, KJ011266, KJ011389, KJ011328; Costus lucanusianus J. Braun & K. Schum., M10000, KJ011455, KJ011192, KJ011268, KJ011391, -; Costus maboumiensis Pellegr., M10227, KJ011456, KJ011193, KJ011269, KJ011392, KJ011330; Costus aff. afer, WJK94-3683, AY994731, KJ011194, KJ011270, KJ011393, AY994571; Costus malortieanus H. Wendl., M9791, KJ011457, KJ011195, KJ011271, KJ011394, KJ011331; Costus montanus Maas, R2972, AY994729 (KKsn), KJ011196, -, -, AY994569 (KKsn); Costus nitidus Maas, M9524, KJ011458, KJ011197, KJ011272, -, KJ011332; Costus osae Maas & H. Maas, M9501, KJ011459, KJ011198, KJ011273, KJ011395, KJ011333; Costus phaeotrichus Loes., CS02-323, AY994721, KJ011199, KJ011274, KJ011396, AY994561; Costus aff. phyllocephalus, BB870057, KJ011460, KJ011200, KJ011275, KJ011397, KJ011334; Costus aff. phyllocephalus, M10389, KJ011461, KJ011201, KJ011276, KJ011398, KJ011335; Costus pictus D.Don ex Lindl., WJK94-3691, AY994726, KJ011202, KJ011277, KJ011399, AY994566; Costus plicatus Maas, WJK94-5376, AY994725, KJ011203, KJ011278, KJ011400, AY994565; Costus productus Gleason ex Maas, R2693, KJ011462, KJ011204, KJ011279, KJ011401, KJ011336; Costus pulverulentus C. Presl, WJK94-3680, AY994723, KJ011205, KJ011280, KJ011402, AY994563; Costus quasi-appendiculatus Woodson ex Maas, CS99-233, KJ011463, KJ011206, KJ011281, KJ011403, KJ011337; Costus ricus Maas & H. Maas, R2970, KJ011464, KJ011207, KJ011282, KJ011404, KJ011338; Costus scaber Ruiz & Pav., R2253, KJ011465, KJ011208, KJ011283, KJ011405, KJ011339; Costus spectabilis K. Schum., WJK97-6118, AY994718, KJ011209, -, KJ011406, AY994556; Costus spicatus Sw., WJK02-7143, KJ011432, KJ011164, KJ011284, KJ011364, KJ011340; Costus spiralis Roscoe, M9335, KJ011466, KJ011210, KJ011285, KJ011407, -; Costus stenophyllus Standl. & L. O. Williams, L75.0305, KJ011467, KJ011211, KJ011286, KJ011408, AY994560 (CS02-313); Costus talbotii Ridl., 2003-0109009, KJ011471, KJ011216, KJ011291, KJ011412, KJ011343; Costus aff. tappenbeckianus, WJK94-3697, AY994715, KJ011215, KJ011290, -, AY994553; Costus aff. tappenbeckianus, TvA3675, KJ011468, KJ011212, KJ011287, KJ011409, -; Costus aff. tappenbeckianus , US235, KJ011469, KJ011213, KJ011288, KJ011410, KJ011341; Costus aff. tappenbeckianus , US236, KJ011470, KJ011214, KJ011289, KJ011411, KJ011342; Costus varzearum Maas, WJK94-5379, AY994722, KJ011217, KJ011292, KJ011413, AY994551 (CS01-277); Costus villosissimus Jacg., KMN632, AY994713, KJ011218, KJ011293, KJ011414, AY994550; Costus vinosus Maas, M9568, KJ011472 (WJK94-3727), KJ011219, KJ011294, -, KJ011344; Costus

!!
! 165!
wilsonii Maas, M9507, KJ011473, KJ011220, KJ011295, KJ011415, -; Costus woodsonii Maas, CS01-264, AY994712, KJ011221, KJ011296, KJ011416, AY994549; Costus aff. lucanusianus (yellow flower form), Breteler5297, KJ011454, KJ011191, KJ011267, KJ011390, KJ011329; Costus zingiberoides J. F. Macbr., BTM86-00-01, KJ011474, KJ011222, KJ011297, KJ011417, KJ011345; Dimerocostus strobilaceus Kuntze, CS01-272, KJ011478, KJ011227, KJ011302, KJ011422, KJ011350; Monocostus uniflorus (Peterson) Maas, WJK75-0065, KJ011477, KJ011226, KJ011301, KJ011421, KJ011349; Tapeinochilos queenslandiae K. Schum., DavisB68.168, KJ011480, KJ011229, KJ011303, KJ011424, AY994542 (Hay7052)
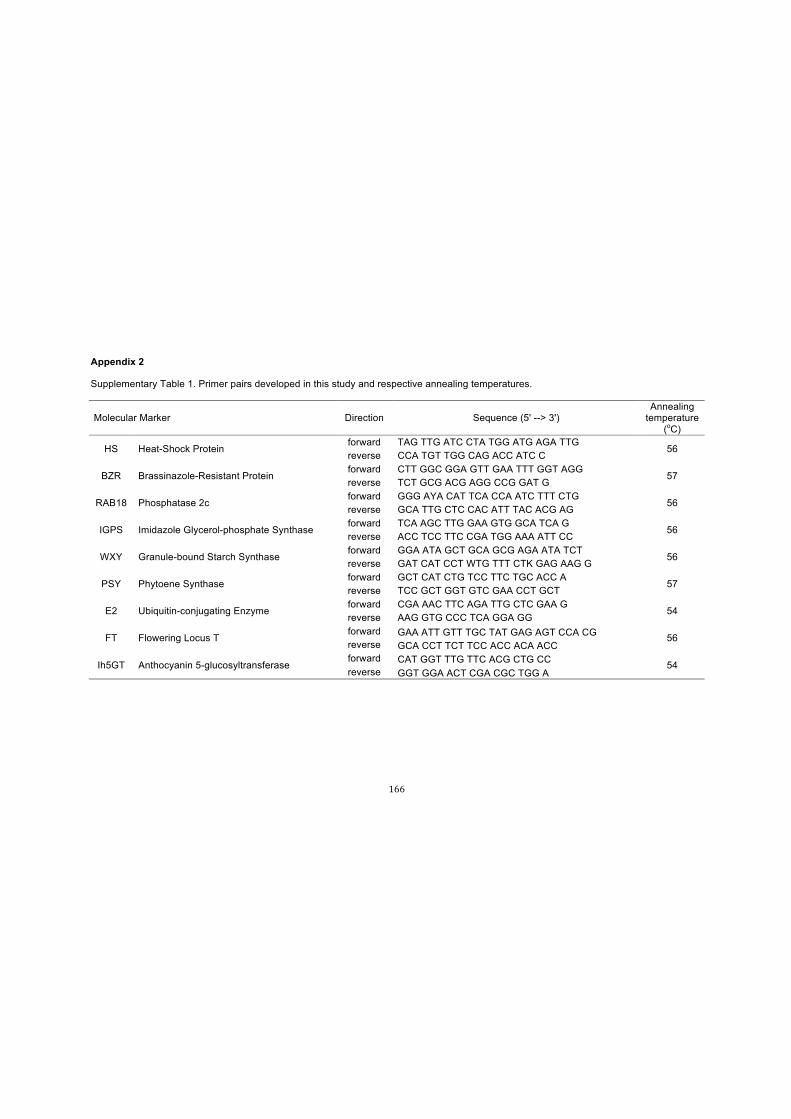
! 166!
Appendix 2
Supplementary Table 1. Primer pairs developed in this study and respective annealing temperatures.
Molecular Marker Direction Sequence (5' --> 3') Annealing
temperature (oC)
HS Heat-Shock Protein forward TAG TTG ATC CTA TGG ATG AGA TTG
56 reverse CCA TGT TGG CAG ACC ATC C
BZR Brassinazole-Resistant Protein forward CTT GGC GGA GTT GAA TTT GGT AGG
57 reverse TCT GCG ACG AGG CCG GAT G
RAB18 Phosphatase 2c forward GGG AYA CAT TCA CCA ATC TTT CTG
56 reverse GCA TTG CTC CAC ATT TAC ACG AG
IGPS Imidazole Glycerol-phosphate Synthase forward TCA AGC TTG GAA GTG GCA TCA G
56 reverse ACC TCC TTC CGA TGG AAA ATT CC
WXY Granule-bound Starch Synthase forward GGA ATA GCT GCA GCG AGA ATA TCT
56 reverse GAT CAT CCT WTG TTT CTK GAG AAG G
PSY Phytoene Synthase forward GCT CAT CTG TCC TTC TGC ACC A
57 reverse TCC GCT GGT GTC GAA CCT GCT
E2 Ubiquitin-conjugating Enzyme forward CGA AAC TTC AGA TTG CTC GAA G
54 reverse AAG GTG CCC TCA GGA GG
FT Flowering Locus T forward GAA ATT GTT TGC TAT GAG AGT CCA CG 56 reverse GCA CCT TCT TCC ACC ACA ACC
Ih5GT Anthocyanin 5-glucosyltransferase forward CAT GGT TTG TTC ACG CTG CC 54 reverse GGT GGA ACT CGA CGC TGG A
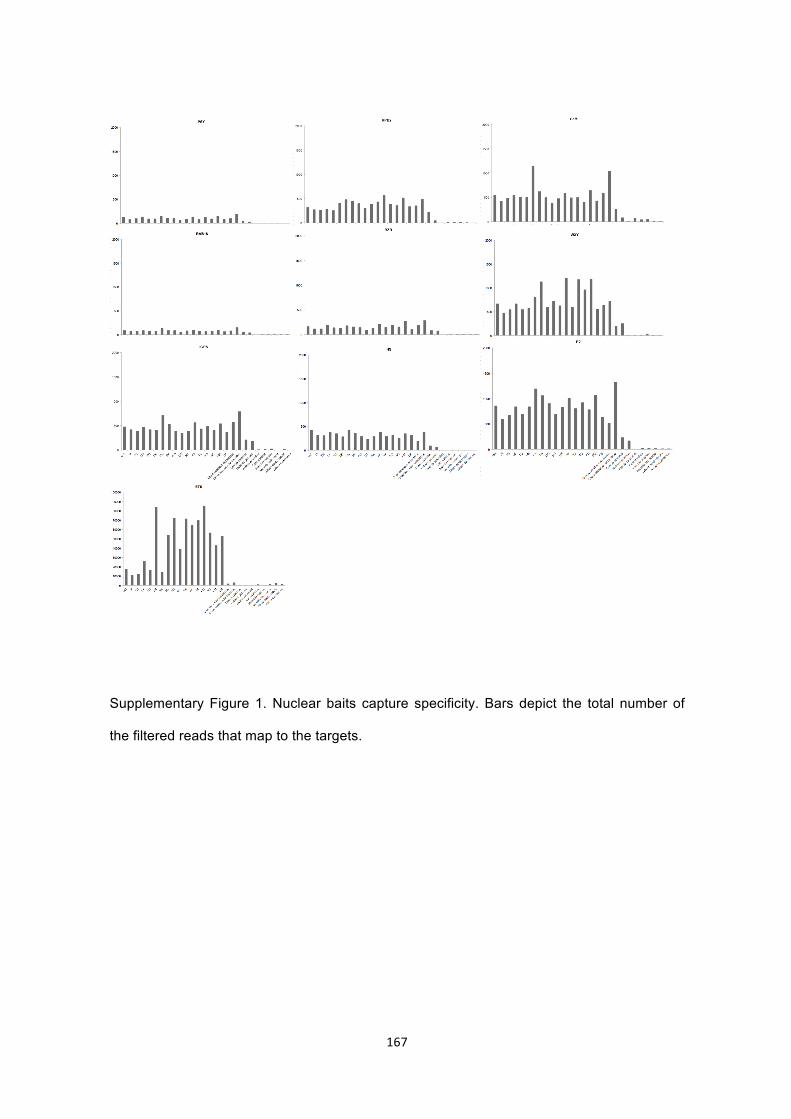
!!
! 167!
Supplementary Figure 1. Nuclear baits capture specificity. Bars depict the total number of
the filtered reads that map to the targets.
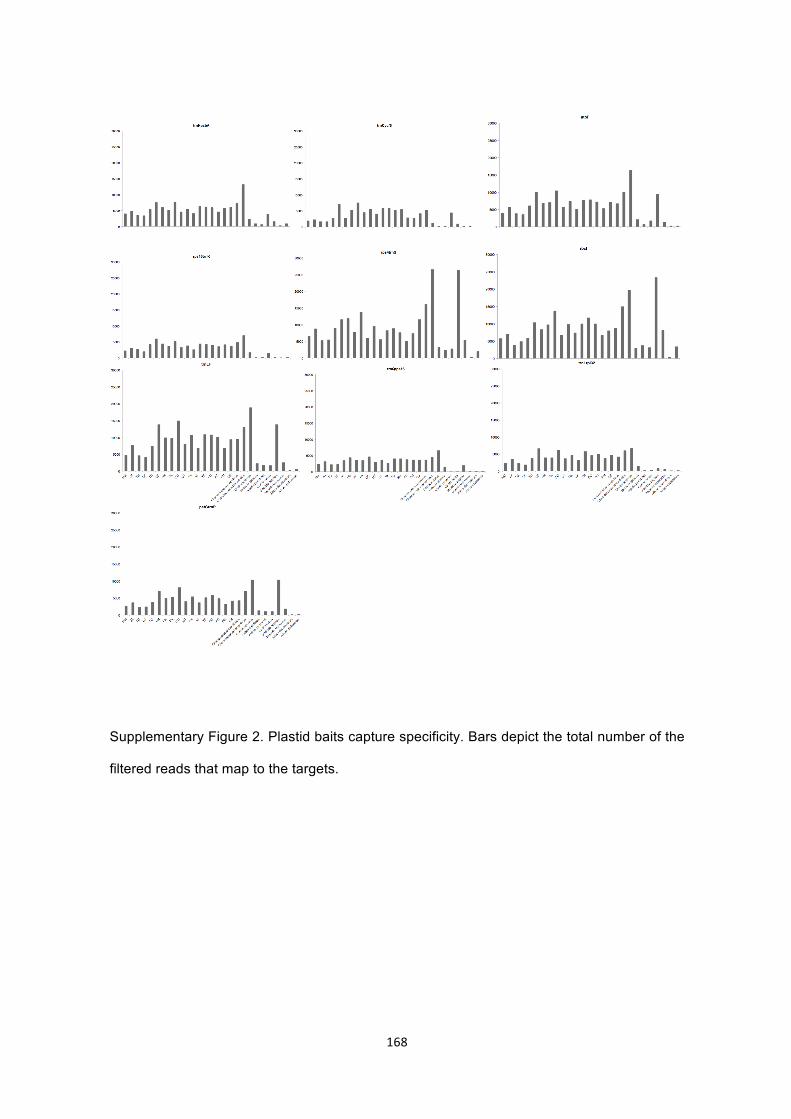
!!
! 168!
Supplementary Figure 2. Plastid baits capture specificity. Bars depict the total number of the
filtered reads that map to the targets.