
Origin, diversification, and historical biogeography of the genus Trachurus (Perciformes: Carangidae
12
Origin, diversiWcation, and historical biogeography of the genus Trachurus (Perciformes: Carangidae) Leyla Cárdenas a , Cristián E. Hernández a , Elie Poulin a,b , Antonios Magoulas c , Irv KornWeld d , F. Patricio Ojeda a,¤ a Center for Advanced Studies in Ecology and Biodiversity (CASEB), Facultad de Ciencias Biológicas, PontiWcia Universidad Católica de Chile, Alameda 340, Casilla 114D, Santiago 6513677, Chile b Departamento de Ciencias Ecológicas, Facultad de Ciencias, Universidad de Chile, Las Palmeras 3425, Casilla 653, Nuñoa, Santiago, Chile c Institute of Marine Biology and Genetics, Hellenic Centre for Marine Research, P.O. box 2214, GR 710 013, Iraklio, Greece d School of Marine Sciences, 5751 Murray Hall, University of Maine, Orono, Maine 04469-5751, USA Abstract We addressed phylogenetic relationships in the genus Trachurus using cytochrome b gene and D-loop sequences. The trees showed Wve groups: (1) the Southwest PaciWc species (T. japonicus, T. novaezelandiae, and T. declivis); (2) The Mediterranean Sea and Eastern Atlantic species (T. mediterraneus); (3) The Atlantic Ocean species (T. lathami and T. trecae); (4) Eastern Atlantic species (T. trachurus and T. capensis); and (5) a group of highly mobile pelagic species, two from the Eastern PaciWc (T. symmetricus and T. mur- phyi) and one from the Eastern Atlantic (T. picturatus). The phylogeny based on Cyt b, supports the molecular clock hypothesis and our results agree with the reported fossil indicating that the origin of this genus occur when the Thetys Sea closed (around 18.4 MYA). In addition, a very slow neutral substitution rate is reported identiWed only two periods of maximum diversiWcation: the Wrst occurring between 18.4 and 15.0 MYA and the second between 8.4 MYA and present day. Keywords: Trachurus; Biodiversity; Molecular clock; Fish evolution; Biogeography; Evolutionary rate 1. Introduction The species of the genus Trachurus are widely distrib- uted along the coasts and throughout oceanic waters of temperate, tropical and subtropical seas (Eschmeyer, 2003). The most recent review of mackerels identiWed 14 species in the genus Trachurus (Nekrasov, 1994): T. ale- evi, T. capensis, T. declives, T. delagoa, T. indicus, T. japo- nicus, T. lathami, T. mediterraneus, T. murphyi, T. novaezelandiae, T. picturatus, T. symmetricus, T. tra- churus, and T. trecae. Later, Eschmeyer (2003) incorpo- rated T. longimanus, although this author recognizes that the current status of this species in the genus is question- able given that it is considered a synonym of T. picturatus (Smith-Vaniz et al., 1990). Researchers have centered the majority of their eVorts on morphological and ecological studies of species in this group, nevertheless, the taxo- nomic and phylogenetic relationships within this taxon remain controversial (Ben Salem, 1995; Berry and Cohen, 1972; Karaiskou et al., 2003; Kijima et al., 1988; Oyarzún, 1998; Poulin et al., 2004; Shaboneyev, 1981; Stepien and Rosenblatt, 1996; Suda et al., 1995). The taxonomy of the genus Trachurus was Wrst described by Nichols (1920, 1940) who recognized a total of 12 species, and suggested that this taxon should be rep- resented by three geographically isolated races (i.e., trachurus, mediterraneus, and picturatus). Later, Berry and Cohen (1972) used additional morphological ¤ Corresponding author. Fax: +56 2 6862621. E-mail address: [email protected] (F.P. Ojeda).
Transcript of Origin, diversification, and historical biogeography of the genus Trachurus (Perciformes: Carangidae

Origin, diversiWcation, and historical biogeography of the genus Trachurus (Perciformes: Carangidae)
Leyla Cárdenasa, Cristián E. Hernándeza, Elie Poulina,b, Antonios Magoulasc,Irv KornWeldd, F. Patricio Ojedaa,¤
a Center for Advanced Studies in Ecology and Biodiversity (CASEB), Facultad de Ciencias Biológicas, PontiWcia Universidad Católica de Chile, Alameda 340, Casilla 114D, Santiago 6513677, Chile
b Departamento de Ciencias Ecológicas, Facultad de Ciencias, Universidad de Chile, Las Palmeras 3425, Casilla 653, Nuñoa, Santiago, Chilec Institute of Marine Biology and Genetics, Hellenic Centre for Marine Research, P.O. box 2214, GR 710 013, Iraklio, Greece
d School of Marine Sciences, 5751 Murray Hall, University of Maine, Orono, Maine 04469-5751, USA
Abstract
We addressed phylogenetic relationships in the genus Trachurus using cytochrome b gene and D-loop sequences. The treesshowed Wve groups: (1) the Southwest PaciWc species (T. japonicus, T. novaezelandiae, and T. declivis); (2) The Mediterranean Sea andEastern Atlantic species (T. mediterraneus); (3) The Atlantic Ocean species (T. lathami and T. trecae); (4) Eastern Atlantic species (T.trachurus and T. capensis); and (5) a group of highly mobile pelagic species, two from the Eastern PaciWc (T. symmetricus and T. mur-phyi) and one from the Eastern Atlantic (T. picturatus). The phylogeny based on Cyt b, supports the molecular clock hypothesis andour results agree with the reported fossil indicating that the origin of this genus occur when the Thetys Sea closed (around 18.4MYA). In addition, a very slow neutral substitution rate is reported identiWed only two periods of maximum diversiWcation: the Wrstoccurring between 18.4 and 15.0 MYA and the second between 8.4 MYA and present day.
Keywords: Trachurus; Biodiversity; Molecular clock; Fish evolution; Biogeography; Evolutionary rate
1. Introduction the current status of this species in the genus is question-
The species of the genus Trachurus are widely distrib-uted along the coasts and throughout oceanic waters oftemperate, tropical and subtropical seas (Eschmeyer,2003). The most recent review of mackerels identiWed 14species in the genus Trachurus (Nekrasov, 1994): T. ale-evi, T. capensis, T. declives, T. delagoa, T. indicus, T. japo-nicus, T. lathami, T. mediterraneus, T. murphyi,T. novaezelandiae, T. picturatus, T. symmetricus, T. tra-churus, and T. trecae. Later, Eschmeyer (2003) incorpo-rated T. longimanus, although this author recognizes that
¤ Corresponding author. Fax: +56 2 6862621.E-mail address: [email protected] (F.P. Ojeda).
able given that it is considered a synonym of T. picturatus(Smith-Vaniz et al., 1990). Researchers have centered themajority of their eVorts on morphological and ecologicalstudies of species in this group, nevertheless, the taxo-nomic and phylogenetic relationships within this taxonremain controversial (Ben Salem, 1995; Berry and Cohen,1972; Karaiskou et al., 2003; Kijima et al., 1988; Oyarzún,1998; Poulin et al., 2004; Shaboneyev, 1981; Stepien andRosenblatt, 1996; Suda et al., 1995).
The taxonomy of the genus Trachurus was Wrstdescribed by Nichols (1920, 1940) who recognized a totalof 12 species, and suggested that this taxon should be rep-resented by three geographically isolated races (i.e.,trachurus, mediterraneus, and picturatus). Later, Berryand Cohen (1972) used additional morphological

L. Cárdenas et al.
characteristics to raise the subspecies T. mediterraneusindicus to the rank of species (T. indicus) and to rede-scribe T. delagoa as a new species (T. margaretae), result-ing in a total of 13 described species. Shortly after,Nekrasov (1976) revised this taxonomy, consideringT. capensis to be a subspecies of T. trachurus, thereforereducing the count to 12 species. Subsequently, Shabon-eyev (1981) proposed a new classiWcation for the genus, inwhich groups were built by considering that closelyrelated species share communities of origin and have sim-ilar morpho-ecological characteristics. Based on this clas-siWcation, Shaboneyev presented a taxonomy with 11species and 6 subspecies, which were divided into threegroups: (1) the trachurus group (T. trachurus trachurus,T. t. capensis, T. novaezelandiae, T. delagoa, T. japonicus,and T. declives), characterized by having large scutes andremnants of many primitive characters; (2) the picturatusgroup (T. picturatus, T. symmetricus murphyi, and T. s.symmetricus) characterized by having low body depth, alarge number of scutes, and inhabiting areas beyond thecontinental shelf; and (3) the mediterraneus group(T. mediterraneus , T. m. ponticus, T. trecae, T. indicus,and T. lathami) characterized by small scutes, high bodydepth, and inhabiting coastal areas. This author sug-gested that the genus Trachurus originated in the TethysSea (present day Mediterranean Sea) during the Miocene.According to the evolutionary pattern proposed by Sha-boneyev, the most primitive forms are present in the med-iterraneus group, while the most advanced forms occur inthe picturatus group. The third group, trachurus, isregarded as a new and independent branch, characterizedby the presence of both primitive and advanced forms.To ratify this evolutionary hypothesis, Ben Salem (1988,1995) and Ben Salem and Ktari (1992) utilized thenumerical taxonomy of 13 external morphological fea-tures to develop a more theoretical construction of thephylogenetic relationship. As mentioned above, the mostrecent revision of the genus by Nekrasov (1994) lists 14species.
Phylogenetic analyses based only on morphologymay result in misleading phylogenetic information, sincethis type of characteristic increases the chance of usinghomoplasy in the phylogenetic tree reconstruction (e.g.,Kocher and Stepien, 1997). A molecular phylogeneticapproach decreases the chance of using homoplasy (e.g.,Nei and Kumar, 2000). Nevertheless, in the genus Tra-churus molecular studies have been limited to resolvingtaxonomic conXicts at local scales (Astorga and Galle-guillos, 1998; Kijima et al., 1988; Oyarzún, 1998; Poulinet al., 2004; Smolenski et al., 1994; Stepien and Rosenbl-att, 1996). Recently, Karaiskou et al. (2003) studied thephylogeny of three species in this genus (T. trachurus, T.mediterraneus, and T. picturatus) based on partial mito-chondrial DNA (mtDNA) sequences of Cyt b and the16S rDNA segment. These authors found that, amongthe three species, T. picturatus and T. mediterraneus were
more closely related, and they suggested that the originof the three species was in the Straits of Gibraltar 2–5MYA, showing a split during the Pliocene (Messinian).However, in this study the absence of species from otherregions and the use of incomplete gene sequences for thephylogenetic analysis, does not allow researchers todraw Wrm conclusions regarding the evolutionary his-tory of the genus Trachurus.
In this study, we assessed the phylogenetic relation-ships among 11 recognized species of the Trachurusgenus, using two mitochondrial molecular markers: theCyt b gene and D-loop. Here we reevaluate the previoushypothesis (Shaboneyev, 1981) regarding the evolution-ary history, origin, and diversiWcation patterns of Tra-churus. We use phylogenetic analyses and molecularclock calibrations to resolve the biogeographic contro-versy surrounding the divergence time of the genus andbetween species in the genus.
2. Materials and methods
2.1. Samples
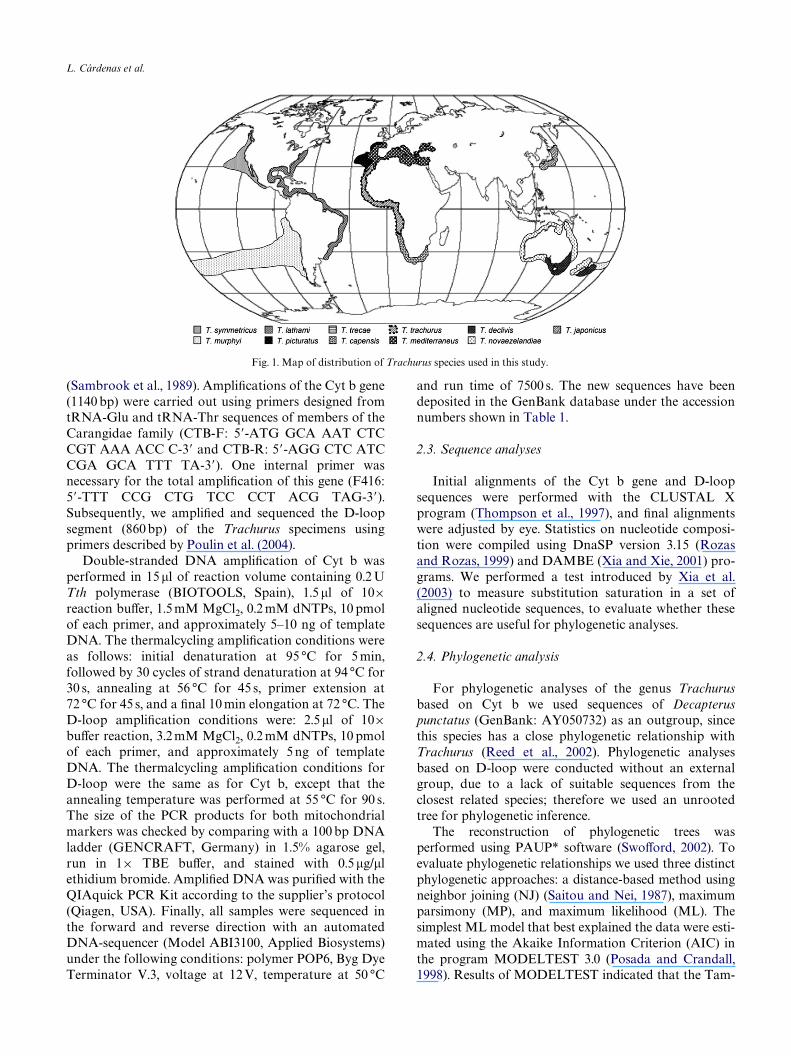
Of the 14 well-recognized species of the genus Trachu-rus we used the 11 species presenting the most represen-tative geographical distribution of the genus and whichare of major economic importance (Fig. 1): Wve from thePaciWc Ocean (T. japonicus, T. declives, T. novaezelan-diae, T. symmetricus, and T. murphyi); Wve species inhab-iting the Atlantic Ocean and Mediterranean Sea (T.mediterraneus, T. lathami, T. picturatus, T. trachurus, andT. trecae) and one species from the coast of South Africa(T. capensis). The three species inhabiting the westernIndian Ocean (T. aleevi, T. delagoa, and T. indicus) arenot included in this study because it was diYcult toobtain access to samples.
Cyt b sequences for the molecular phylogenetic analy-ses of three species were obtained from the GenBankdatabase (T. japonicus, Accession No.: AP003092; T.lathami, AF363748; and T. trecae, AY050740; see Reedet al., 2002). Sequences for the remaining eight specieswere obtained from tissue samples of specimens (twospecimens per species with the exception of T. murphyi,in which three specimens were used) collected from theirnative ranges of distribution.
An additional molecular analysis was performed usingthe mtDNA Control Region (D-loop). For this analysis weobtained sequences from the same eight species mentionedabove, and the sequence for T. japonicus was obtainedfrom the GenBank database (Accession No. AP003092).
2.2. DNA extraction, ampliWcation, and sequencing
Total DNA was extracted from muscle tissue using thestandard phenol:chloroform:isoamyl alcohol procedure
L. Cárdenas et al.
(Sambrook et al., 1989). AmpliWcations of the Cyt b gene(1140 bp) were carried out using primers designed fromtRNA-Glu and tRNA-Thr sequences of members of theCarangidae family (CTB-F: 5�-ATG GCA AAT CTCCGT AAA ACC C-3� and CTB-R: 5�-AGG CTC ATCCGA GCA TTT TA-3�). One internal primer wasnecessary for the total ampliWcation of this gene (F416:5�-TTT CCG CTG TCC CCT ACG TAG-3�).Subsequently, we ampliWed and sequenced the D-loopsegment (860 bp) of the Trachurus specimens usingprimers described by Poulin et al. (2004).
Double-stranded DNA ampliWcation of Cyt b wasperformed in 15�l of reaction volume containing 0.2 UTth polymerase (BIOTOOLS, Spain), 1.5 �l of 10£reaction buVer, 1.5 mM MgCl2, 0.2 mM dNTPs, 10 pmolof each primer, and approximately 5–10 ng of templateDNA. The thermalcycling ampliWcation conditions wereas follows: initial denaturation at 95 °C for 5 min,followed by 30 cycles of strand denaturation at 94 °C for30 s, annealing at 56 °C for 45 s, primer extension at72 °C for 45 s, and a Wnal 10 min elongation at 72 °C. TheD-loop ampliWcation conditions were: 2.5�l of 10£buVer reaction, 3.2 mM MgCl2, 0.2 mM dNTPs, 10 pmolof each primer, and approximately 5 ng of templateDNA. The thermalcycling ampliWcation conditions forD-loop were the same as for Cyt b, except that theannealing temperature was performed at 55 °C for 90 s.The size of the PCR products for both mitochondrialmarkers was checked by comparing with a 100 bp DNAladder (GENCRAFT, Germany) in 1.5% agarose gel,run in 1£ TBE buVer, and stained with 0.5�g/�lethidium bromide. AmpliWed DNA was puriWed with theQIAquick PCR Kit according to the supplier’s protocol(Qiagen, USA). Finally, all samples were sequenced inthe forward and reverse direction with an automatedDNA-sequencer (Model ABI3100, Applied Biosystems)under the following conditions: polymer POP6, Byg DyeTerminator V.3, voltage at 12 V, temperature at 50 °C
and run time of 7500 s. The new sequences have beendeposited in the GenBank database under the accessionnumbers shown in Table 1.
2.3. Sequence analyses
Initial alignments of the Cyt b gene and D-loopsequences were performed with the CLUSTAL Xprogram (Thompson et al., 1997), and Wnal alignmentswere adjusted by eye. Statistics on nucleotide composi-tion were compiled using DnaSP version 3.15 (Rozasand Rozas, 1999) and DAMBE (Xia and Xie, 2001) pro-grams. We performed a test introduced by Xia et al.(2003) to measure substitution saturation in a set ofaligned nucleotide sequences, to evaluate whether thesesequences are useful for phylogenetic analyses.
2.4. Phylogenetic analysis
For phylogenetic analyses of the genus Trachurusbased on Cyt b we used sequences of Decapteruspunctatus (GenBank: AY050732) as an outgroup, sincethis species has a close phylogenetic relationship withTrachurus (Reed et al., 2002). Phylogenetic analysesbased on D-loop were conducted without an externalgroup, due to a lack of suitable sequences from theclosest related species; therefore we used an unrootedtree for phylogenetic inference.
The reconstruction of phylogenetic trees wasperformed using PAUP* software (SwoVord, 2002). Toevaluate phylogenetic relationships we used three distinctphylogenetic approaches: a distance-based method usingneighbor joining (NJ) (Saitou and Nei, 1987), maximumparsimony (MP), and maximum likelihood (ML). Thesimplest ML model that best explained the data were esti-mated using the Akaike Information Criterion (AIC) inthe program MODELTEST 3.0 (Posada and Crandall,1998). Results of MODELTEST indicated that the Tam-
Fig. 1. Map of distribution of Trachurus species used in this study.

L. Cárdenas et al.
ura–Nei model (TrN + I, variable base frequencies, equal for the rate of divergence (1% per site per million years)
Table 1Geographical origin and GenBank Accession No. for mtDNA gene sequences of Trachurus species sequenced in this study
A hyphen indicates that the D-loop was not sequenced.
Species Origin Locality GenBank Accession No.
Latitude Longitude Cyt b D-loop
T. capensis 10 34.29S 18.43E South Africa AY526535 AY533480T. capensis 13 34.22S 17.43E South Africa AY526536 AY533481T. declives I1 37.27S 177.51E Tauranga, NZ AY526542 AY533476T. declives I2 37.27S 177.51E Tauranga, NZ AY526543 —T. mediterraneus 4 38.10N 21.05E Ionian Sea, Greece AY526548 AY533479T. mediterraneus 5 38.10N 21.05E Ionian Sea, Greece AY526549 —T. murphyi IQ 20.07S 70.11W Iquique, Chile AY526537 AY532708T. murphyi TL 39.37S 75.17W Valdivia, Chile AY526538 AY532709T. murphyi NZ 37.25S 178.12E Tauranga, NZ AY526539 —T. novaezelandiae J1 37.25S 178.12E Tauranga, NZ AY526544 AY533475T. novaezelandiae J2 37.25S 178.12E Tauranga, NZ AY526545 —T. picturatus 21 38.50N 20.20E Ionian Sea, Greece AY526546 AY533477T. picturatus 35 38.50N 20.20E Ionian Sea, Greece AY526547 AY533478T. symmetricus 25 33.0N 125.2W San Diego, USA AY526540 AY532699T. symmetricus 07 33.0N 125.2 W San Diego, USA AY526541 AY532700T. trachurus 01 38.50N 20.20E Ionian Sea, Greece AY526533 AY533482T. trachurus 05 38.50N 20.20E Ionian Sea, Greece AY526534 AY533483
transversion frequencies, and variable transition frequen-cies; see Tamura and Nei, 1993) was the most appropriatemodel of evolution for this data set. Consequently, weincorporated this model of nucleotide evolution inPAUP* software for ML and NJ analyses. To Wnd thephylogenetic tree in MP we implemented a branch andbound search of the tree space, and in the ML method weimplemented an heuristic search using random sequenceaddition (n D20) and TRB branch swapping (Nei andKumar, 2000). Additionally, bootstrap resampling (Fel-senstein, 1985) was applied to assess support for individ-ual nodes using 1000 bootstrap replicates.
2.5. Molecular clock
We used the Likelihood Ratio Test (LRT) to evaluatewhether our ML phylogenetic tree based on Cyt b recon-struction Wt to a molecular clock (Felsenstein, 1981). TheLRT statistic is deWned as: LRT D ¡2 ln (H0/H1), with H0representing the likelihood score associated with the nullhypothesis (clock-like model) that the rate of evolutionis homogeneous among all branches in the phylogeny,and H1 representing the likelihood score associated withthe alternative model (non-clock model). The LRT sta-tistic is asymptotically distributed as �2. To test for amolecular clock the degrees of freedom are s ¡ 2, where sis the number of taxa in the phylogeny (Felsenstein,1981). We used the �2 statistic with a signiWcance level ofp < 0.05. Our results supported the molecular clockmodel, allowing us to calibrate the molecular clock toestimate the divergence time of the Trachurus species.Two approaches were followed for the calibration ofmolecular clock. First, in accordance with the suggestionby Karaiskou et al. (2003) we used a conservative value
of teleost Wsh obtained from Johns and Avise (1998) andBermingham et al. (1997). Second, we used two availablepaleontological records for a fossil calibration. The Wrstpoint of fossil calibration (C1) corresponded to theancestral node in the root of phylogenetic tree of thegenus Trachurus. In accordance with Shaboneyev (1981),this point was calibrated using the oldest representativeof the genus Trachurus in the fossil record of Lebanonand Caucasus, which has an estimated age of 16.4–23.8MYA linked with closure of Tethys Sea (Miocene;Danil’Chenko, 1964). The second point of calibration(C2) was the node of most recent divergence between T.symmetricus and T. murphyi, currently the only speciesinhabiting the Eastern PaciWc coast (Poulin et al., 2004).This point was calibrated using the most primitive fossilmember of the genus Trachurus in the Eastern PaciWc,corresponding to specimens from Ecuador (Landiniet al., 2002) from the late Pliocene (between 3.7 and 3MYA, Ibaraki, 1997). The date of divergence betweenspecies was calculated for each node with bootstrap sup-port above 50%, in the ML clock tree reconstruction.The divergence time for the nodes (C1 and C2) wasestimated with the Tree-Explorer program (Tamura,1999), using the midpoint between the upper and lowerbounds of the fossil record date (Marko, 2002).
3. Results
3.1. Sequence variation: Cyt b
No variation in length was detected in Cyt b sequences(1140 bp) among diVerent species of the genus Trachurus.Of the 1140 nucleotide positions sampled, 1014 were

L. Cárdenas et al.
invariant and 126 were variable sites. The total number ofmutations was 137, with 116 synonymous mutations, and111 phylogenetic informative sites. Mean nucleotide com-position revealed an unequal structure of bases: 23.5% A,34.1% C, 27.1% T, and 15.3% G. The substitution satura-tion test demonstrated that our sequences have little satu-ration (Iss D 0.2229 < Iss.cD 0.7682; df D 280 andp < 0.0001), thus validating their use for phylogeneticinference. The average number of pairwise diVerencesbetween sequences was 38.5 § 14.1, and the mean diver-gence detected among members of Trachurus genus was4.03 § 1.5%. The least interspeciWc divergence wasobserved between T. capensis and T. trachurus, and thegreatest divergence was found between T. murphyi and T.novaezelandiae (Table 2).
3.2. Sequence variation: D-loop
No variation in length was detected among TrachurusD-loop sequences. Of the 825 nucleotide positionssampled, 745 were invariant and 80 were variable siteswith 92 total mutations and 61 phylogenetic informativesites. Base composition was strongly biased: A and Twere represented roughly equally, occurring at meanpercentages of 31.1 and 30.2%, respectively, while Coccurred at 22.2% of the sites, and G at only 16.5%. Thesubstitution saturation test showed little saturation(Iss D 0.3185 < Iss.c D 0.7467; df D 108, p < 0.0001). Themean number of pairwise diVerences between D-loopsequences was 29.45 § 10.2, and the mean divergenceamong members of Trachurus was 5.2 § 2.2%. The great-est interspeciWc divergence was observed betweenT. mediterraneus and T. murphyi, and the least betweenT. capensis and T. Trachurus (Table 3).
3.3. Phylogenetic analyses
In the MP approach for Cyt b only intraspeciWctopological diVerences (with 0 branch length) weredetected between the three most parsimonious trees,resulting in a consensus tree with 210 steps (consistencyindex CI D 0.6429, homoplasy index HI D 0.3571, reten-tion index RI D 0.8231; Fig. 2). The MP consensus treeshowed the same topology as the NJ phylogeneticreconstruction. All nodes on the tree had bootstrap sup-port greater than 52%. The node root showed highbootstrap support (100%) suggesting a monophyleticstatus of the genus Trachurus.
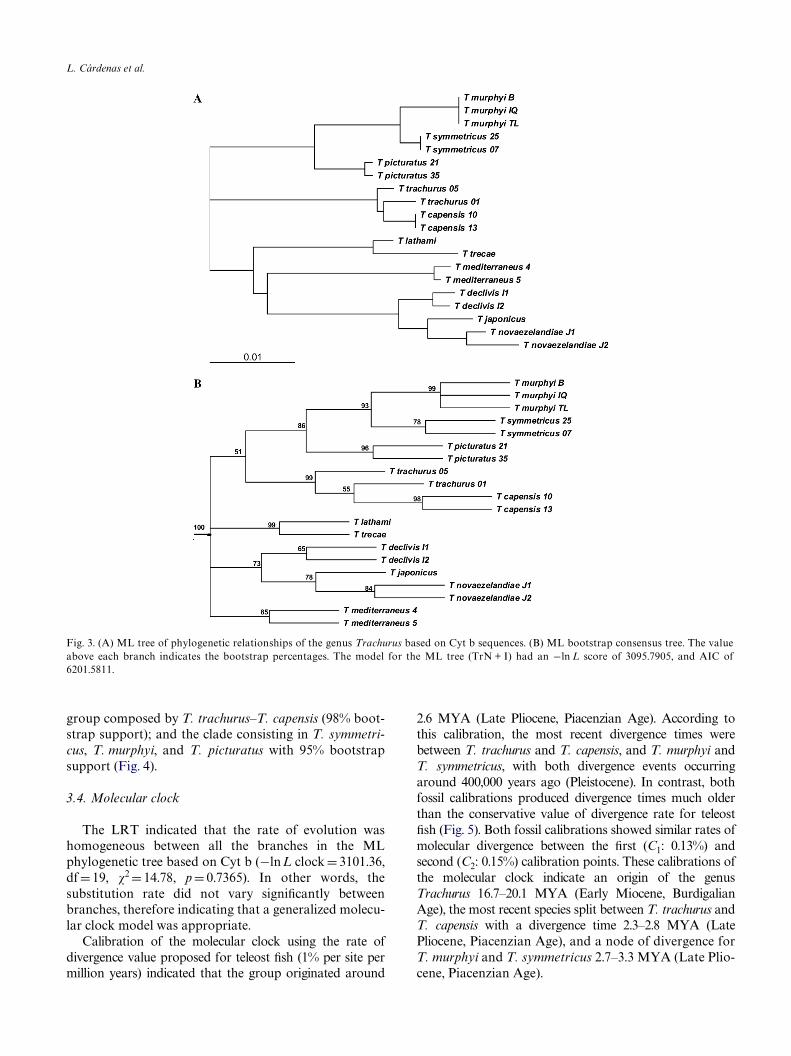
Results of the ModelTest showed that the mostdescriptive model of evolution for both genes wasTrN + I with a proportion of invariable sites. For Cyt b,the TrN + I model contained the following nucleotidesubstitution rate parameters: A–C D 1.0, A–GD 18.62, A–T D 1.0, C–G D 1.0, C–TD 8.95, and G–T D 1.0. The heu-ristic search found a single ML phylogenetic tree with alog likelihood (¡lnL) score of 3093.97 (Fig. 3A). In thiscase, the topology showed the same distribution ofgroups as the MP and NJ trees. However, the diVerencewas that the ML analysis of the bootstrap consensus treeshowed a basal politomy (Fig. 3B).
We obtained similar gene tree-topologies using thethree diVerent methods. The branching pattern indi-cated Wve distinct groups: the Wrst group included allspecies from the Southwest PaciWc (T. japonicus, T.novaezelandiae, and T. declivis: bootstrap support of66% in MP, 55% in NJ, and 73% in ML); the secondgroup consisted in only one species which inhabits theMediterranean Sea and Eastern Atlantic Ocean(T. mediterraneus: bootstrap support of 100% in MP,
Table 2Pairwise sequence divergences show as percentage for Cyt b
ML distance using the model described in the text (TrN + I).
1 2 3 4 5 6 7 8 9 10 11 12 13 14 15 16 17 18 19
1. T. japonicus2. T. lathami 4.333. T. trecae 4.72 1.194. T. trachurus 01 5.12 4.07 4.725. T. trachurus 05 4.84 3.81 4.45 0.636. T. capensis 10 5.38 4.07 4.72 0.72 0.637. T. capensis 13 5.38 4.07 4.72 0.72 0.63 0.008. T. murphyi IQ 5.50 4.79 5.86 4.88 4.60 4.76 4.769. T. murphyi TL 5.50 4.79 5.86 4.88 4.60 4.76 4.76 0.00
10. T. murphyi NZ 5.50 4.79 5.86 4.88 4.60 4.76 4.76 0.00 0.0011. T. symmetricus 25 5.25 4.66 5.73 4.63 4.35 4.76 4.76 0.90 0.90 0.9012. T. symmetricus 07 5.25 4.66 5.73 4.63 4.35 4.76 4.76 0.90 0.90 0.90 0.0013. T. declivis I1 1.47 3.64 4.01 4.61 4.35 4.86 4.86 5.36 5.36 5.36 5.11 5.1114. T. declivis I2 1.37 3.77 4.14 4.75 4.49 5.01 5.01 4.99 4.99 4.99 5.00 5.00 0.4415. T. novaezelandiae J1 1.09 3.88 4.49 4.87 4.60 5.13 5.13 5.63 5.63 5.63 5.14 5.14 1.66 1.5716. T. novaezelandiae J2 1.56 4.20 4.82 5.09 4.82 5.35 5.35 5.86 5.86 5.86 5.37 5.37 1.75 1.66 0.8117. T. picturatus 21 4.84 3.94 4.67 4.37 4.10 4.48 4.48 2.31 2.31 2.31 1.80 1.80 4.82 4.72 4.61 4.9518. T. picturatus 35 4.86 3.96 4.69 4.38 4.12 4.50 4.50 2.31 2.31 2.31 1.81 1.81 4.84 4.74 4.63 4.97 0.1819. T. mediterraneus 4 4.36 4.06 4.67 5.23 4.95 4.99 4.99 4.69 4.69 4.69 4.68 4.68 4.12 4.25 4.36 4.69 4.34 4.3620. T. mediterraneus 5 4.23 3.92 4.53 5.20 4.92 4.96 4.96 4.78 4.78 4.78 4.77 4.77 3.99 4.12 4.23 4.56 4.43 4.45 0.27

L. Cárdenas et al.
90% in NJ, and 85% in ML); the third cluster exclu-sively included Atlantic Ocean species (T. lathami andT. trecae: bootstrap support of 99% in MP, NJ, andML); the fourth group included two species with broaddistributions, covering a wider range of the Mediterra-nean Sea and Eastern Atlantic Ocean than the secondgroup (T. trachurus and T. capensis: bootstrap supportof 100% in MP and NJ, and 99% in ML); and Wnally,the Wfth group encompassed three highly mobile pelagicspecies, two from the Eastern PaciWc Ocean (T. symmet-ricus and T. murphyi) and one with distribution in theEastern Atlantic Ocean and the Mediterranean Sea(T. picturatus) (bootstrap support of 99% in MP, 93% inNJ, and 86% in ML).
The unrooted ML tree reconstruction based on D-loop sequences and an heuristic search resulted in onlyone phylogenetic tree with ¡lnL D 1869.97, andbootstrap support between 50 and 100% (Fig. 4). In thisreconstruction, two species were excluded due to the lackof available tissue samples and sequences (T. lathamiand T. trecae). Nevertheless, the branching patterns werecongruent with four of the Wve groups resolved by Cytb tree reconstruction: the Southwest PaciWc groupwith 95% bootstrap support (T. japonicus, T. novaeze-landiae, and T. declivis); the clade containing T. mediter-raneus (61% bootstrap support) which appeared in theSouthwest PaciWc group, but with large genetic diVeren-tiation (4%) relative to all other species separations; the
Table 3Pairwise sequence divergences show as percentage for D-loop
ML distance using the model described in the text (TrN + I).
1 2 3 4 5 6 7 8 9 10 11 12 13
1. T. symetricus 252. T. symetricus 07 0.123. T. murphyi IQ 2.53 2.374. T. murphyi TL 2.37 2.22 0.125. T. japonicus 7.38 7.14 7.63 7.386. T. novaezelandiae J1 7.64 7.89 7.64 7.39 1.437. T. declivis I1 7.70 7.46 7.21 6.97 2.61 1.878. T. picturatus 21 3.85 3.67 3.85 3.67 5.50 6.36 5.829. T. picturatus 35 3.80 3.63 3.80 3.63 5.41 5.83 5.32 0.76
10. T. mediterraneus 4 9.06 9.37 10.30 10.00 4.45 4.65 5.73 7.28 7.1211. T. capensis 13 6.82 6.60 6.13 5.91 5.93 5.92 5.40 6.14 5.16 8.0512. T. capensis 10 5.90 5.68 5.27 5.06 5.32 5.32 4.46 5.07 4.59 7.20 0.7713. T. trachurus 01 6.60 6.37 5.91 5.70 5.73 5.73 4.85 5.49 4.59 7.19 1.04 1.0314. T. trachurus 05 6.60 6.37 5.91 5.70 5.73 5.32 4.46 5.49 4.59 7.19 1.31 1.31 0.25
Fig. 2. MP tree of phylogenetic relationships of the genus Trachurus based on Cyt b sequences. On the MP tree the value above each branch indicatesthe bootstrap percentages for the MP analysis, and the value below each branch indicates bootstrap percentages for the NJ analysis. (The MP and NJtrees have the same topology.)
L. Cárdenas et al.
group composed by T. trachurus–T. capensis (98% boot-strap support); and the clade consisting in T. symmetri-cus, T. murphyi, and T. picturatus with 95% bootstrapsupport (Fig. 4).
3.4. Molecular clock
The LRT indicated that the rate of evolution washomogeneous between all the branches in the MLphylogenetic tree based on Cyt b (¡lnL clock D 3101.36,df D 19, �2 D 14.78, p D 0.7365). In other words, thesubstitution rate did not vary signiWcantly betweenbranches, therefore indicating that a generalized molecu-lar clock model was appropriate.
Calibration of the molecular clock using the rate ofdivergence value proposed for teleost Wsh (1% per site permillion years) indicated that the group originated around
2.6 MYA (Late Pliocene, Piacenzian Age). According tothis calibration, the most recent divergence times werebetween T. trachurus and T. capensis, and T. murphyi andT. symmetricus, with both divergence events occurringaround 400,000 years ago (Pleistocene). In contrast, bothfossil calibrations produced divergence times much olderthan the conservative value of divergence rate for teleostWsh (Fig. 5). Both fossil calibrations showed similar rates ofmolecular divergence between the Wrst (C1: 0.13%) andsecond (C2: 0.15%) calibration points. These calibrations ofthe molecular clock indicate an origin of the genusTrachurus 16.7–20.1 MYA (Early Miocene, BurdigalianAge), the most recent species split between T. trachurus andT. capensis with a divergence time 2.3–2.8 MYA (LatePliocene, Piacenzian Age), and a node of divergence forT. murphyi and T. symmetricus 2.7–3.3 MYA (Late Plio-cene, Piacenzian Age).
Fig. 3. (A) ML tree of phylogenetic relationships of the genus Trachurus based on Cyt b sequences. (B) ML bootstrap consensus tree. The valueabove each branch indicates the bootstrap percentages. The model for the ML tree (TrN + I) had an ¡ln L score of 3095.7905, and AIC of6201.5811.

L. Cárdenas et al.
4. Discussion
4.1. Phylogenetic relationships
The only previous hypothesis of evolutionary historyof the genus Trachurus was presented by Shaboneyev(1981) using morphological characteristics. This authordeWned three historical groups: trachurus, picturatus,and mediterraneus. In our study, we did not Wnd evi-dence to support the trachurus and mediterraneusgroups; however, the picturatus group was a consistent
Fig. 4. ML unrooted tree of phylogenetic relationships of the genusTrachurus based on D-loop sequences. On the ML tree the value neareach node indicates the bootstrap percentages. The model for the MLtree (TrN + I) had an ¡ln L score of 1871.4075, and AIC of 3752.8149.
clade throughout all phylogenetic reconstructionapproaches. The picturatus group is composed of T.picturatus, T. murphyi, and T. symmetricus, of which T.murphyi and T. symmetricus were phylogenetically theclosest (Figs. 2–4). The species T. murphyi is a highlymigratory Wsh, which is widely distributed in the SouthPaciWc; it is found oV the Chilean and Peruvian coastsreaching across to New Zealand and Tasmania (Suda etal., 1995). T. symmetricus is distributed in the Northeast-ern PaciWc, resulting in an antitropical distribution of theclade T. murphyi–T. symmetricus (Poulin et al., 2004).The latter component of this group, T. picturatus, has amore restricted distribution reaching from the Bay ofBiscay (France) southward to Morocco and eastwardinto the Mediterranean Sea (Eschmeyer, 2003; Karai-skou et al., 2003). Shaboneyev (1981) used morphologi-cal traits (i.e., low body depth, a large number of scutes)and ecological aspects (i.e., inhabiting far beyond thecontinental shelf) to characterize the picturatus group asmore advanced. Our results conWrm this hypothesis indi-cating a greater number of synapomorphisms withrespect to other members of the genus Trachurus (Fig. 2).Shaboneyev (1981) considered that the picturatus groupwas closely related to members of the mediterraneusgroup, however, our study revealed that the genetic dis-tance between T. mediterraneus and the picturatus groupwas greater than for all other species pairs compared inthis study (e.g., D-loop divergence T. mediterraneus–T.symmetricus was 9.1%; T. mediterraneus–T. murphyi wasgreater than 9.4%; and T. mediterraneus–T. picturatuswas greater than 5.7%, see Table 3). Moreover, phyloge-netic analyses showed that T. mediterraneus has a topo-logical position in the phylogenetic trees that is distantfrom the picturatus group (Figs. 2–4). Additionally, the
Fig. 5. ML tree with molecular clock calibrations of phylogenetic relationships of the genus Trachurus based on Cyt b sequences. The values aboveeach branch indicate the divergence time in millions of years with a calibration of 1% per site per million years. The Wrst value below each branchindicates the divergence time using the Wrst point of fossil calibration (C1: Miocene of the Lebanon and Caucasus), and the second value below eachbranch indicates the divergence time using the second point of fossil calibration (C2: the Late Pliocene of Ecuador). We only indicate divergence timefor nodes with bootstrap support over 50%.
L. Cárdenas et al.
other members of Shaboneyev’s mediterraneus group,the Atlantic Ocean species (T. lathami and T. trecae)were located in an independent phylogenetic clade.
The other highly consistent group in our molecularanalyses was conformed by the Southwest PaciWc spe-cies (T. japonicus, T. novaezelandiae, and T. declives;Figs. 2–4). These results reject the hypothesis proposedby Shaboneyev (1981), that T. japonicus and T. novaeze-landiae are members of the trachurus group, and that T.declives is an evolutionarily aberrant form relative toother members of the genus. Furthermore, our studydemonstrates that all Trachurus species from the South-west PaciWc are well-deWned species (bootstrap supportabove 60%, Figs. 2 and 3) and represent a monophyleticlineage (bootstrap support of 66% in MP, 55% in NJ,and 73% in ML). These results contrast with the Wndingsof Kijima et al. (1988), who used isoenzyme loci to sug-gest that T. declives may have been derived from anancestor of T. murphyi from the Southeastern PaciWc,and concluded that T. novaezelandiae and T. japonicusare subspecies that radiated from the Indian Ocean tothe entire coasts of the west PaciWc Ocean. Karaiskouet al. (2003) showed that T. mediterraneus and T. pictu-ratus are more closely related than T. trachurus, how-ever, our results do not support this hypothesis andshowed that the three species belong to diVerent evolu-tionary clades (Figs. 2–4).
4.2. Divergence time
The percentage of sequence divergence based on Cytb among Trachurus species (mean 3.43 § 1%, Table 2)constitutes the lowest values reported for marine Wshspecies (mean 3.7–13%, Billington and Hebert, 1991;Johns and Avise, 1998). The D-loop sequences showedthe same low level of divergence (mean 3.5 § 1%, Table3) suggesting that this may be a common characteristicfor the mtDNA of the genus Trachurus. In a previousstudy by Stepien and Rosenblatt (1996), using electro-phoresis protein analysis, the researchers reported littlegenetic divergence between T. murphyi and T. symmet-ricus, suggesting that both taxa belong to the same spe-cies. At the DNA level, Cantatore et al. (1994), basedon Cyt b sequences of seven Perciform Wsh species(including T. trachurus), suggested that the nucleotidesubstitution rate is three to Wve times lower than inmammals. Additionally, Smolenski et al. (1994) per-formed enzyme restriction analyses of mtDNA, observ-ing a low level of genetic diversity in T. declives.Finally, Karaiskou et al. (2003), based on partial Cyt bsequences (239 bp), reported a low value of sequencedivergence among three Mediterranean Trachurus spe-cies (2.13–5.25%). These evidently lower levels ofgenetic divergence between Trachurus species may indi-cate that: (1) these species are very recent and thereforehave not had suYcient time to accumulate many muta-
tions, or (2) that the nucleotide substitution rate isintrinsically lower in the mitochondrial genes of thegenus Trachurus. In our results, the two fossil calibra-tions of the molecular clock produce much older diver-gence times than the conservative rate of divergencevalue estimated for teleost Wsh (Fig. 5), indicating thatthe alternative of a lower nucleotide substitution rate isbetter supported.
Rates of genetic change can vary between taxa orgenes, therefore the molecular clock should be calibratedindependently for each data set, using a known date ofdivergence, which is commonly based on evidence fromthe fossil record (e.g., Marko, 2002; Near and Sanderson,2004). The oldest paleontological record of the genusTrachurus found in the Early Miocene of the Lebanonand Caucasus (Burdigalian Age: Danil’Chenko, 1964),suggests a rate of divergence around 0.13% per millionyears for Cyt b, the lowest value currently reported forteleost Wsh species. Furthermore, the second paleonto-logical record, associated with the Eastern PaciWc Eastclade (T. murphyi–T. symmetricus) in the late Pliocene ofthe Ecuador (Canoa formation: Landini et al., 2002),suggests a rate of divergence around 0.15% per millionyears for Cyt b. Both calibrations, using diVerent fossils,showed similar rates of divergence and times of originfor the genus Trachurus. The high congruence betweenthis two independent points of fossil calibration suggestslow error in the estimation of a node divergence (seeNear and Sanderson, 2004).
Our molecular clock calibration for the evolutionaryevent linked to the origin and diversiWcation of the genusTrachurus was in agreement with Shaboneyev’s proposi-tion (1981). This author proposed that the biogeo-graphic history of the genus Trachurus began when theancestral groups present in the Tethys Sea were sepa-rated by the division of this single body of water intotwo parts: the present day Mediterranean Sea (westernpart of the Tethys) and the present day Indian Ocean(eastern part of the Tethys) during the Early Miocene(18 MYA) (Berggren and Hollister, 1975).
The original fauna of the Tethys Sea was tropical, butthe temperatures decreased during the Oligocene andEarly Miocene (Berggren and Hollister, 1975). Thesevariations in water temperature potentially increased thediversity of environmental conditions and caused anupsurge in the speciation process, forcing the most prim-itive forms of the western part, to split into twobranches, one moving across the Mediterranean Sea,then southward along the coast of west Africa to warmwaters and westward to the Atlantic Ocean. The othergroup remained in the Northern Hemisphere where newspecies developed as a consequence of adaptation toharsher environmental conditions. Since the cooling didnot aVect most of the Indian Ocean, Shaboneyev sug-gested that the eastern part of the ancestral stockremained in the Indian Ocean.

L. Cárdenas et al.
Part of the ancestral stock of the western Tethysacquired several adaptive traits for an active pelagicmode of life. This is the case for the picturatus group(T. picturatus, T. murphyi, and T. symmetricus) whichbegan to diversify 7.7–9.2 MYA (Late Miocene, Torto-nian Age; Fig. 4). One part of the ancestral stock of T.picturatus, the ancestor of the Eastern PaciWc species(T. murphyi and T. symmetricus), extended its rangewestward across the Atlantic. This group then pene-trated into the PaciWc Ocean passing over the sub-merged Isthmus of Panama, spreading along thewestern coasts of North and South America. Thenorthern part of this group originated into T. symmet-ricus and the southern part gave rise to T. murphyiabout 2.7–3.3 MYA (Late Pliocene, Piacenzian Age;Fig. 5). This event occurred together with the origin ofthe actual PaciWc current system and the Isthmus ofPanama, and is conWrmed by the paleontologicalrecord (Fitch, 1969; Landini et al., 2002). According toCoates and Obando (1996) the emergence of theCentral American Isthmus had major consequences onocean circulation and global climatic patterns. Weconsider the formation of the Isthmus of Panama to bean important event of diversiWcation in the genusTrachurus.
Using a divergence rate for teleosts of about 1%(Bermingham et al., 1997), Karaiskou et al. (2003) sug-gested that the diversiWcation of the ancient Trachurusstock occurred between 2 and 5 MYA. However, ourresults, based on fossil record calibrations of themolecular clock suggest that the diversiWcation of theancestral stock of Trachurus occurred between 16 and20 MYA (Fig. 4), probably associated with the divi-sion of the Tethys sea. Later, two important eventsoccurred in the Mediterranean Sea that may be associ-ated with the diversiWcation of the Trachurus speciesin this area: (1) the isolation of Mediterranean Seafrom the Atlantic Ocean and (2) the division of theMediterranean and the Paratethys Sea (presently theBlack, Caspian, and Aral Seas). The most ancestralspecies of the genus (T. mediterraneus) found refuge inthe western part of the Mediterranean Sea, while theancestral population of Trachurus in the AtlanticOcean diVerentiated into T. trachurus, T. capensis, andT. trecae in the east Atlantic (i.e., coast of SouthAfrica) and T. lathami in the Southwestern AtlanticOcean.
An analysis of the number of lineages versus meandivergence times for each node shows two periods ofmaximum diversiWcation (Fig. 6), corresponding to themajor geological events described above. The Wrstperiod occurred between 18.4 and 15.0 MYA (duration3.4 million years) and the second period occurredbetween 8.4 MYA and present day, both with very simi-lar diversiWcation rates of 0.77 and 0.78, respectively(for an explanation of diversiWcation rates see Barrac-
lough and Nee, 2001; Nee, 2001). This analysis shows aperiod of transition of 6.5 million years (15.0–8.4 MYA)with either a very low diversiWcation rate, or a highextinction rate. The Wrst and second period of diversiW-
cation shows a simple model of constant speciation rate,where the probability of a speciation event occurring ina given time is constant both over time and betweenspecies (Barraclough and Nee, 2001; Nee, 2001). TheWrst period includes the origin of the genus Trachurus,and of the Wve principal lineages observed in the phylo-genetic reconstruction (Figs. 5 and 6), including the cur-rent species, T. mediterraneus. The second periodincludes the diversiWcation processes within each of theWve lineages originated in the Wrst period, as well as theorigin of the current species of Trachurus around theworld.
In summary, our study resolves the controversyregarding the phylogenetic relationships of the genusTrachurus, and our molecular clock calibration supportsthe paleobiogeographic history originally proposed byShaboneyev (1981). The contemporary species have acommon ancestor which comes from the present dayMediterranean Sea, and the current geographical distri-bution is related to past events. Here, we propose thatthe current species originated from Wve ancient and inde-pendent lineages, characterized by an evolutionary his-tory with two large diversiWcation processes. Newphylogeographic studies are required to elucidate themicroevolutionary processes that potentially explain themacroevolutionary pattern of diversiWcation in thegenus Trachurus.
Fig. 6. Number of lineages plotted against mean divergence time (con-sidering both fossil calibration times: (C1 + C2)/2) of each node. ThisWgure shows the two principal periods of diversiWcation in the genusTrachurus (First and Second Period), where under the simplest model(i.e., constant speciation rate model) a straight line with slope equal tothe per lineage speciation rate, b, is expected. The regression analysisto assess the diversiWcation rate b was performed in EcoSim 7 software(Gotelli and Entsminger, 2003) using a randomization approach(10,000 random matrices, random seed D 12345). A signiWcance levelof p < 0.05 was assumed.

L. Cárdenas et al.
Acknowledgments
We are very grateful to Paul Taylor and Peter Smithof New Zealand, Rob Cooper of South Africa, J. Welshof the Monterrey Bay Aquarium, and Fernando Ogaldeof Chile for providing tissue samples of Trachurus spe-cies from the native ranges. We thank Andrea Silva fortechnical support and Paula E. Neill for comments andsuggestions that greatly improved the manuscript. Thisstudy was funded by grants awarded by CORPESCAS.A., FONDAP-FONDECYT 1501-0001 Program 5 tothe Center for Advanced Studies in Ecology and Biodi-versity, and an IDEA WILD equipment grant to C.E.Hernández. Both L. Cárdenas and C.E. Hernández weresupported by CONICYT Doctoral Fellowships. Sam-ples from Greece were collected in the context of the EUfunded project HOMSIR (QLK5-CT-1999-01438). IKthanks Maryhaven for continued support.
References
Astorga, M., Galleguillos, R., 1998. Genetic divergence of jack mack-erel of genus Trachurus from northwestern and southeasternPaciWc. Rev. Biol. Mar. Oceanogr. 33, 155–161.
Barraclough, T.G., Nee, S., 2001. Phylogenetic and speciation. TrendsEcol. Evol. 16, 391–399.
Ben Salem, M., 1988. Numerical taxonomy of the species of TrachurusRaWnesque, 1810 (Pisces, Teleosteans, Carangidae). Cybium 12, 45–58.
Ben Salem, M., Ktari, H.H., 1992. Enzymatic polymorphism of Tra-churus trachurus (Linnaeus, 1758) and T. mediterraneus (Steind-achner, 1886) (Teleostei, Carangidae) of Tunisian coast. Cybium16, 73–79.
Ben Salem, M., 1995. Key to the genus Trachurus RaWnesque, 1810(Teleostei, Carangidae). J. Ichthyol. 35, 40–53.
Berggren, W.A., Hollister, C.D., 1975. Paleogeography, paleobiogeog-raphy and the history of circulation in the Atlantic Ocean. WoodHole Oceanogr. Inst. Coll. Rep. 1974, Pt1.
Bermingham, E., McCaVerty, S.S., Martin, A.P., 1997. Fish biogeographyand molecular clocks: Perspectives from the Panamanian Isthmus.In: Kocher, T.D., Stepien, C.A. (Eds.), Molecular Systematic ofFishes. Academic Press, New York, pp. 113–128.
Berry, F.H., Cohen, L., 1972. Synopsis of the species of Trachurus(Pisces, Carangidae). Q. J. Florida Acad. Sci. 35, 177–211.
Billington, N., Hebert, P.D.N., 1991. Mitochondrial DNA diversity inWshes and its implications for introductions. Can. J. Fish Aquat. Sci.48, 80–94.
Cantatore, P., Roberti, M., Pesole, G., Ludovico, A., Milella, F., Gadal-eta, M.N., Saccone, C., 1994. Evolutionary analysis of cytochrome bsequences in some Perciformes: Evidence for a slower rate ofevolution than in mammals. J. Mol. Evol. 39, 589–597.
Coates, A.G., Obando, F.A., 1996. The geologic evolution of CentralAmerican Isthmus. In: Jackson, J.B.C., Budd, A.F., Coates, A.G.(Eds.), Evolution and Environment in Tropical America.University of Chicago Press, Chicago, pp. 21–56.
Danil’Chenko, P.G., 1964. Superorder Teleostei. In: OsnovyPaleontologiy (Principles of Paleontology), Agnatha, Pisces. NaukaPress, Moscow.
Eschmeyer, W.N. (Ed.) 2003. Catalog of Wshes. Updated databaseversion of March 2003.. Catalog databases as made available toFishBase in March 2003. World Wide Web electronic publication.Available from: www.Wshbase.org.
Felsenstein, J., 1981. Related articles, links evolutionary trees fromDNA sequences: A maximum likelihood approach. J. Mol. Evol.17, 368–376.
Felsenstein, J., 1985. ConWdence limits on phylogenies: An approachusing the bootstrap. Evolution 39, 783–791.
Fitch, J.E., 1969. Fossil records of certain schooling Wshes of the Cali-fornia current system. Rapp. CALCOFI. 13.
Gotelli, N.J., Entsminger, G.L., 2003. EcoSim: Null models softwarefor ecology. Version 7. Acquired Intelligence Inc. and Kesey-Bear.Burlington, VT 05465. Available from: http://homepages.together.net/~gentsmin/ecosim.htm.
Ibaraki, M., 1997. Closing of the Central American seaway and Neo-gene coastal upwelling along the PaciWc coast of South America.Tectonophysics 281, 99–104.
Johns, G.C., Avise, J.C., 1998. A comparative summary of genetic dis-tances in the vertebrates from the mitochondrial cytochrome bgene. Mol. Biol. Evol. 15, 1481–1490.
Karaiskou, N., Apostolidis, A., Triantafyllidis, A., Kouvatsi, A., Trian-tafyllidis, C., 2003. Genetic identiWcation and phylogeny of threespecies of the genus Trachurus based on mitochondrial DNA analy-sis. Mar. Biotechnol. 5, 493–504.
Kijima, A., Taniguchi, N., Ochiai, A., 1988. Genetic divergence andrelationship among Wfteen species of genera Trachurus, Decapterus,Selar, and Selaroides. Jpn. J. Ichthyol. 35, 167–175.
Kocher, T.D., Stepien, C.A., 1997. Molecular Systematics of Fishes.Academic Press, San Diego, CA.
Landini, W., Bianucci, G., Carnevale, G., Ragaine, L., Sorbini, C., Val-leri, G., Bisconti, M., Cantalamessa, G., Di Celma, C., 2002. LatePliocene fossils of Ecuador and their role in the development of thePanamic Bioprovince after the rising of Central American Isthmus.Can. J. Earth Sci. 39, 27–41.
Marko, P.B., 2002. Fossil calibration of molecular clock and the diver-gence time of germinates species pair separates by the Isthmus ofPanama. Mol. Biol. Evol. 19, 2005–2021.
Near, T.J., Sanderson, M.J., 2004. Assessing the quality of moleculardivergence time estimates by fossil calibrations and fossil-basedmodel selection. Phil. Trans. R. Soc. Lond. B 359, 1477–1483.
Nee, S., 2001. Inferring speciation rates from phylogenies. Evolution55, 661–668.
Nei, M., Kumar, S., 2000. Molecular Evolution and Phylogenetics.Oxford University Press, New York.
Nekrasov, V.V., 1976. Systematic position, morphological characteris-tics and range of Carangidae of the Indian Ocean. Moscow, CentralWsheries Technical and Economic Information Research Institute.Manuscript Department 6.
Nekrasov, V.V., 1994. Mackerels of the World Ocean (genus Trachu-rus). VINRO, Moscow pp. 1–228.
Nichols, J.T., 1920. A key to the species of Trachurus. Bull. Am.Museum Nature History 42, 3.
Nichols, J.T., 1940. Notes on Carangin Wshes. V. Young Trachurus inthe Gulf of Mexico. Am. Museum Novit., 4.
Oyarzún, C., 1998. El Jurel, De que estamos hablando? In: Arcos, D.(Ed.) Biología y ecología del Jurel en aguas chilenas. Instituto deInvestigaciones Pesqueras S.A. Chile. pp. 37–45.
Posada, D., Crandall, K.A., 1998. Modeltest: Testing the model ofDNA substitution. Bioinformatics 1, 817–818.
Poulin, E., Cárdenas, L., Hernández, C.E., KornWeld, I., Ojeda, F.P.,2004. Resolution of the taxonomic status of Chilean andCalifornian jack mackerels using mitochondrial DNA sequence. J.Fish Biol. 65, 1160–1164.
Reed, D.L., Carpenter, K.E., deGravelle, M.J., 2002. Molecular systematicsof the Jacks (Perciformes: Carangidae) based on mitochondrial cyto-chrome b sequences using parsimony, likelihood, and Bayesianapproaches. Mol. Phylogenet. Evol. 23, 513–524.
Rozas, J., Rozas, R., 1999. DnaSP version 3.15: An integrated programfor molecular population genetics and molecular evolution analy-sis. Bioinformatics 15, 174–175.

L. Cárdenas et al.
Saitou, N., Nei, M., 1987. The neighbor-joining method: A newmethod for reconstructing phylogenetic trees. Mol. Biol. Evol. 4,406–425.
Sambrook, J., Fritsch, E.F., Maniatis, T., 1989. Molecular Cloning:A Laboratory Manual. Cold Spring Harbor Laboratory, NewYork.
Shaboneyev, I.Y., 1981. Systematics, morpho-ecological characteris-tics and origin of Carangids of the genus Trachurus. J. Ichthyol.20, 15–24.
Smith-Vaniz, W.F., Quéro, J.C., Desoutter, M., 1990. Carangidae. In:Quéro, J.C., Hureau, J.C., Karrer, C., Post, A., Saldanha, L., 1990.Check list of the Wshes of the eastern tropical Atlantic. Paris, Une-sco. vol. 3. CLOFETA. pp. 729–755.
Smolenski, A.J., Ovenden, J.R., White, R.W.G., 1994. Preliminaryinvestigation of mitocondrial DNA variation in Jack Mackerel(Trachurus declives: Carangidae) from South-eastern AustralianWaters. Aust. J. Mar. Freshwater Res. 45, 495–505.
Stepien, C.A., Rosenblatt, R.H., 1996. Genetic divergence in antitropi-cal pelagic marine Wshes (Trachurus, Merluccius, and Scomber)between North and South America. Copeia 3, 586–598.
SwoVord, D.L., 2002. PAUP*: Phylogenetic analysis using parsimony(and other methods), Version 4.0 Beta. Sinauer Associates, Sunder-land, MA.
Suda, Y., Machii, T., Orrego, H., 1995. Some Wshery and biologicalaspects of jack mackerels, genus Trachurus (Carangidae). Sci. Mar.59, 571–580.
Tamura, K., Nei, M., 1993. Estimation of the number of nucleotidesubstitutions in the control region of mitochondrial DNA inhumans and chimpanzees. Mol. Biol. Evol. 10, 512–526.
Tamura, K., 1999. TreeExplorer. Available from: http://evol-gen.biol.metro-u.ac.jp/TE/TE_man.html.
Thompson, J.D., Gibson, T.J., Plewniak, F., Jeanmougin, F., Higgins,D.G., 1997. The Clustal X windows interface: Flexible strategies formultiple sequence alignment aided by quality analysis tools.Nucleic Acids Res. 24, 4876–4882.
Xia, X., Xie, Z., 2001. DAMBE: Data analysis in molecular Biologyand evolution. J. Hered. 92, 371–373.
Xia, X., Xie, Z., Salemi, M., Lu, Ch., Wang, Y., 2003. An index of sub-stitution saturation and its application. Mol. Phylogenet. Evol. 26,1–7.