The global biogeography of semi-arid periodic vegetation patterns
9
© 2008 The Authors DOI: 10.1111/j.1466-8238.2008.00413.x Journal compilation © 2008 Blackwell Publishing Ltd www.blackwellpublishing.com/geb 1 Global Ecology and Biogeography, (Global Ecol. Biogeogr.) (2008) RESEARCH PAPER Blackwell Publishing Ltd The global biogeography of semi-arid periodic vegetation patterns Vincent Deblauwe 1 *, Nicolas Barbier 2 , Pierre Couteron 3 , Olivier Lejeune 4 and Jan Bogaert 1 ABSTRACT Aim Vegetation exhibiting landscape-scale regular spatial patterns has been reported for arid and semi-arid areas world-wide. Recent theories state that such structures are bound to low-productivity environments and result from a self- organization process. Our objective was to test this relationship between periodic pattern occurrence and environmental factors at a global scale and to parametrize a predictive distribution model. Location Arid and semi-arid areas world-wide. Methods We trained an empirical predictive model (Maxent) for the occurrence of periodic vegetation patterns, based on environmental predictors and known occurrences verified on Landsat satellite images. Results This model allowed us to discover previously unreported pattern locations, and to report the first ever examples of spotted patterns in natural systems. Relation- ships to the main environmental drivers are discussed. Main conclusions These results confirm that periodic patterned vegetations are ubiquitous at the interface between arid and semi-arid regions. Self-organized patterning appears therefore to be a biome-scale response to environmental conditions, including soil and topography. The set of correlations between vegetation patterns and their environmental conditions presented in this study will need to be reproduced in future modelling attempts. Keywords Aridity, banded vegetation, bioclimatic envelope, hierarchical partitioning, maximum entropy, periodic vegetation pattern, self-organization, tiger bush. *Correspondence: Vincent Deblauwe, Université Libre de Bruxelles, Laboratoire d’Écologie du Paysage, CP 169, Avenue F. Roosevelt 50, B-1050 Bruxelles, Belgium. E-mail: [email protected] 1 FRIA Fellow, Laboratoire d’Ecologie du Paysage, Université Libre de Bruxelles, CP 169, B-1050 Bruxelles, Belgium, 2 FNRS – Wiener Anspach Post-Doctoral Research Fellow, Service de Botanique Systématique et Phytosociologie, Université Libre de Bruxelles, CP 169, B-1050 Bruxelles, Belgium/Oxford University Center for the Environment (OUCE-ECI), Oxford OX1 3QY, UK, 3 French Institute of Pondicherry (IFP), Pondicherry 605 001, India/Institut de Recherche pour le Développement (IRD), Joint Research Unit (UMR) botAny and coMputAtional Plant architecture (AMAP), Montpellier, F-34398 France, 4 Département de Mathématiques Appliquées, Ecole Normale Supérieure, 75230 Paris Cedex 05, France/ Faculté des Sciences, Université Libre de Bruxelles, CP 231, B-1050 Bruxelles, Belgium INTRODUCTION Competition for resources is obvious in (semi-)arid regions and is reflected by the low overall vegetation biomass. However, plant cover is usually not homogenously sparse, and dense vegetated patches are often dispersed within areas of lower (Dunkerley, 2002) or null productivity (e.g. Mabbutt & Fanning, 1987; Cornet et al., 1988; Valentin & D’herbes, 1999), suggesting the involvement of other kinds of inter-plant interactions and/or redistribution mechanisms. In fact, limiting resources and important biogeochemical processes have been found to be concentrated within these dense patches, for which the term ‘islands of fertility’ has been coined (Schlesinger et al., 1990; Ludwig et al., 2005). In a number of cases, patchy arid vegetation can display landscape-scale patterns that are strikingly regular in space and easy to recognize on aerial views. These spatially periodic vegetation patterns (PVP) have been reported as being formed of gaps, labyrinths or stripes (Fig. 1) at scales ranging from tens to hundreds of metres, therefore exceeding by more than one order of magnitude the size of individual plants. The observed heterogeneities of surface and soil properties, such as soil crusting, structure, texture, organic matter content, salt concentration or even a consistent microtopography, can be explained directly by feedbacks induced by the vegetation itself (Valentin et al., 1999; Saco et al., 2007). Most field studies have focused on the case of stripes on gently sloped terrains (but see Barbier et al., 2008), which are sometimes referred to as ‘tiger bush’, and have been interpreted as natural, runoff-based, water harvesting systems (Tongway et al., 2001). Beyond stripes, progress towards a unified understanding of this patterning phenomenon has been achieved recently within the framework of self-organization theory (Nicolis & Prigogine,
-
Upload
independent -
Category
Documents
-
view
1 -
download
0
Transcript of The global biogeography of semi-arid periodic vegetation patterns

© 2008 The Authors DOI: 10.1111/j.1466-8238.2008.00413.xJournal compilation © 2008 Blackwell Publishing Ltd www.blackwellpublishing.com/geb
1
Global Ecology and Biogeography, (Global Ecol. Biogeogr.)
(2008)
RESEARCHPAPER
Blackwell Publishing Ltd
The global biogeography of semi-arid periodic vegetation patterns
Vincent Deblauwe
1
*, Nicolas Barbier
2
, Pierre Couteron
3
, Olivier Lejeune
4
and
Jan Bogaert
1
ABSTRACT
Aim
Vegetation exhibiting landscape-scale regular spatial patterns has beenreported for arid and semi-arid areas world-wide. Recent theories state that suchstructures are bound to low-productivity environments and result from a self-organization process. Our objective was to test this relationship between periodicpattern occurrence and environmental factors at a global scale and to parametrize apredictive distribution model.
Location
Arid and semi-arid areas world-wide.
Methods
We trained an empirical predictive model (Maxent) for the occurrenceof periodic vegetation patterns, based on environmental predictors and knownoccurrences verified on Landsat satellite images.
Results
This model allowed us to discover previously unreported pattern locations,and to report the first ever examples of spotted patterns in natural systems. Relation-ships to the main environmental drivers are discussed.
Main conclusions
These results confirm that periodic patterned vegetations areubiquitous at the interface between arid and semi-arid regions. Self-organizedpatterning appears therefore to be a biome-scale response to environmental conditions,including soil and topography. The set of correlations between vegetation patternsand their environmental conditions presented in this study will need to be reproducedin future modelling attempts.
Keywords
Aridity, banded vegetation, bioclimatic envelope, hierarchical partitioning, maximum
entropy, periodic vegetation pattern, self-organization, tiger bush.
*Correspondence: Vincent Deblauwe, Université Libre de Bruxelles, Laboratoire d’Écologie du Paysage, CP 169, Avenue F. Roosevelt 50, B-1050 Bruxelles, Belgium. E-mail: [email protected]
1
FRIA Fellow, Laboratoire d’Ecologie du
Paysage, Université Libre de Bruxelles, CP 169,
B-1050 Bruxelles, Belgium,
2
FNRS – Wiener
Anspach Post-Doctoral Research Fellow, Service
de Botanique Systématique et Phytosociologie,
Université Libre de Bruxelles, CP 169, B-1050
Bruxelles, Belgium/Oxford University Center for
the Environment (OUCE-ECI), Oxford OX1
3QY, UK,
3
French Institute of Pondicherry
(IFP), Pondicherry 605 001, India/Institut de
Recherche pour le Développement (IRD),
Joint Research Unit (UMR) botAny and
coMputAtional Plant architecture (AMAP),
Montpellier, F-34398 France,
4
Département
de Mathématiques Appliquées, Ecole Normale
Supérieure, 75230 Paris Cedex 05, France/
Faculté des Sciences, Université Libre de
Bruxelles, CP 231, B-1050 Bruxelles, Belgium
INTRODUCTION
Competition for resources is obvious in (semi-)arid regions and
is reflected by the low overall vegetation biomass. However, plant
cover is usually not homogenously sparse, and dense vegetated
patches are often dispersed within areas of lower (Dunkerley,
2002) or null productivity (e.g. Mabbutt & Fanning, 1987;
Cornet
et al
., 1988; Valentin & D’herbes, 1999), suggesting the
involvement of other kinds of inter-plant interactions and/or
redistribution mechanisms. In fact, limiting resources and
important biogeochemical processes have been found to be
concentrated within these dense patches, for which the term
‘islands of fertility’ has been coined (Schlesinger
et al
., 1990; Ludwig
et al
., 2005). In a number of cases, patchy arid vegetation can
display landscape-scale patterns that are strikingly regular in
space and easy to recognize on aerial views. These spatially
periodic vegetation patterns (PVP) have been reported as being
formed of gaps, labyrinths or stripes (Fig. 1) at scales ranging
from tens to hundreds of metres, therefore exceeding by more
than one order of magnitude the size of individual plants. The
observed heterogeneities of surface and soil properties, such as
soil crusting, structure, texture, organic matter content, salt
concentration or even a consistent microtopography, can be
explained directly by feedbacks induced by the vegetation itself
(Valentin
et al
., 1999; Saco
et al
., 2007).
Most field studies have focused on the case of stripes on gently
sloped terrains (but see Barbier
et al
., 2008), which are sometimes
referred to as ‘tiger bush’, and have been interpreted as natural,
runoff-based, water harvesting systems (Tongway
et al
., 2001).
Beyond stripes, progress towards a unified understanding of this
patterning phenomenon has been achieved recently within the
framework of self-organization theory (Nicolis & Prigogine,

V. Deblauwe
et al.
© 2008 The Authors
2
Global Ecology and Biogeography
, Journal compilation © 2008 Blackwell Publishing Ltd
1977; Cross & Hohenberg, 1993). Mechanistic models have
shown that the observed variety of landscape-scale vegetation
patterns can result from plant–plant interactions mediated by
the collection, sheltering and consumption of key resources. Due
to the lack of sufficient field observations and experiments, the
effective pattern formation mechanisms still remain hypothetical.
Those models either invoke an active transport of resources,
mainly water, through roots (see Lefever & Lejeune, 1997,
Couteron & Lejeune, 2001, for theory and Barbier
et al
., 2008, for
field account) or a passive transport via diffusion underground
or flow over the soil surface (Klausmeier, 1999; Hillerislambers
et al
., 2001; Von Hardenberg
et al
., 2001; Rietkerk
et al
., 2002).
The latter case may also involve redistribution of sediments (Saco
et al
., 2007). However, all self-organization models converge on
the prediction that regular patterning occurs when the negative
effects of individual plants on resource availability (competition)
are balanced by positive effects (facilitation) and when the scale
of resource transport, either the root system size or the diffusion
range, exceeds the other spatial scales, namely the facilitation or
the plant dispersion ranges. As environmental constraints limit-
ing biological productivity increase, competition gets harsher
and correlatively the role of facilitation becomes more important
(Callaway, 1995). Self-organization models predict the following
sequence of PVP morphologies in isotropic environments as
constraints increase above a critical threshold (Lejeune & Tlidi,
1999; Couteron & Lejeune, 2001; Von Hardenberg
et al
., 2001;
Rietkerk
et al
., 2002): (1) gaps of bare soil appear in an initially
uniform vegetation cover; (2) bare gaps elongate and merge
to form stripes without dominant orientation, i.e. labyrinths;
(3) the corresponding stripes of vegetation break into spots that
eventually disappear. To our knowledge no field account of
the latter has yet been reported. Anisotropic factors such as
ground slope may induce a shift from gaps, labyrinths or
spots of vegetation to stripes with a dominant orientation, i.e.
tiger bush (Lefever & Lejeune, 1997; Von Hardenberg
et al
.,
2001).
So far, this fundamental prediction of self-organization
models has not been verified at the biogeographical scale. The
increasing accessibility and resolution of global-scale data sets of
both satellite imagery and environmental variables offers an
unprecedented opportunity to address its relevance. Indeed, the
validity of self-organization models necessitates that: (1) PVPs
should consistently be observed within a restricted range of
environmental conditions, determined by the existence of critical
thresholds; (2) it should be possible to identify key environmental
predictors among the available set of climatic and edaphic variables
documented at a global scale; (3) all periodic morphologies
predicted by self-organization models should be found in natural
systems. We addressed these hypotheses by means of an empirical
model in which the environmental envelope encompassing
Figure 1 Oblique (a, b, d, e) and vertical (c) satellite images of periodic vegetation patterns. These are formerly unrecordedlocations the occurrence of which was predicted by the potential distribution model that include spots (a, 11°37′ N, 27°57′ E), labyrinths (b, 11°08′ N, 27°50′ E) and stripes and gaps (c, 11°04′ N, 28°18′ E) in the Sudan, gaps in eastern Africa (d, 0°42′ N, 40°24′ E) and bands in Baja California Peninsula (e, 26°49′ N, 112°52′ W). QuickBird © DigitalGlobe, distributed by Eurimage (a, b, d, e). European OASIS project, © CNES 2001 – Spot Image distribution (c).
Global biogeography of periodic vegetation patterns
© 2008 The Authors
Global Ecology and Biogeography
, Journal compilation © 2008 Blackwell Publishing Ltd
3
known PVP occurrences was defined and served as a predictive
tool to outline potential areas of occurrence.
MATERIALS AND METHODS
Occurrences
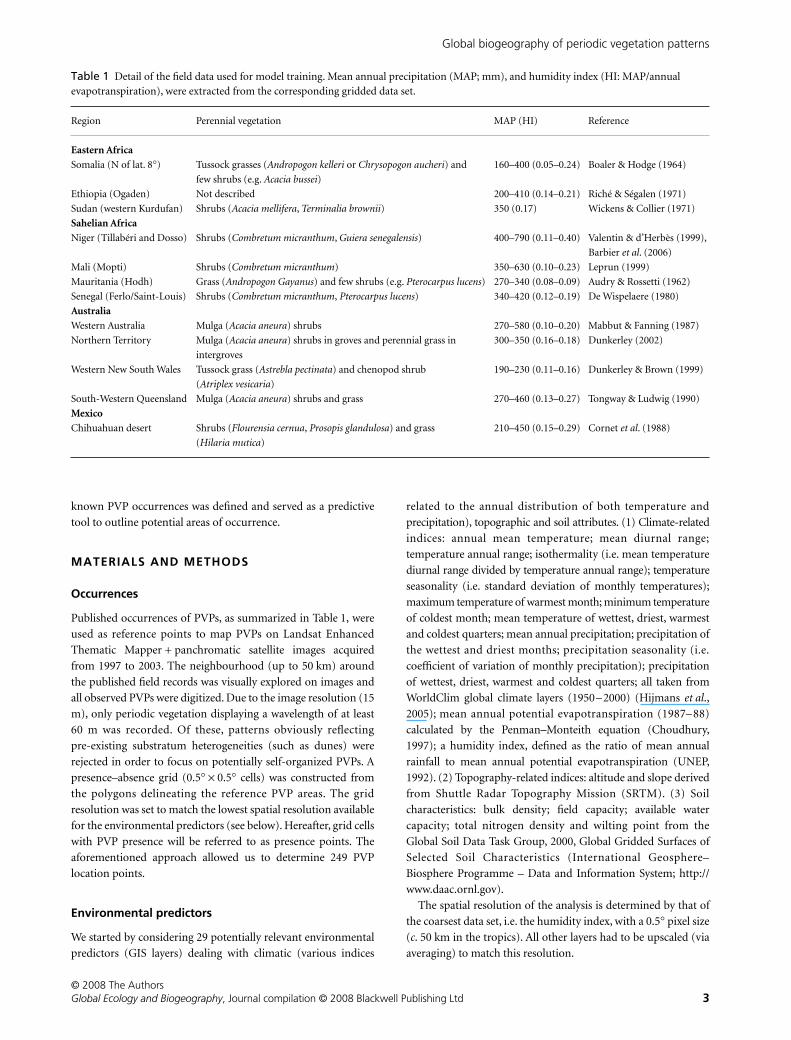
Published occurrences of PVPs, as summarized in Table 1, were
used as reference points to map PVPs on Landsat Enhanced
Thematic Mapper + panchromatic satellite images acquired
from 1997 to 2003. The neighbourhood (up to 50 km) around
the published field records was visually explored on images and
all observed PVPs were digitized. Due to the image resolution (15
m), only periodic vegetation displaying a wavelength of at least
60 m was recorded. Of these, patterns obviously reflecting
pre-existing substratum heterogeneities (such as dunes) were
rejected in order to focus on potentially self-organized PVPs. A
presence–absence grid (0.5
°
×
0.5
°
cells) was constructed from
the polygons delineating the reference PVP areas. The grid
resolution was set to match the lowest spatial resolution available
for the environmental predictors (see below). Hereafter, grid cells
with PVP presence will be referred to as presence points. The
aforementioned approach allowed us to determine 249 PVP
location points.
Environmental predictors
We started by considering 29 potentially relevant environmental
predictors (GIS layers) dealing with climatic (various indices
related to the annual distribution of both temperature and
precipitation), topographic and soil attributes. (1) Climate-related
indices: annual mean temperature; mean diurnal range;
temperature annual range; isothermality (i.e. mean temperature
diurnal range divided by temperature annual range); temperature
seasonality (i.e. standard deviation of monthly temperatures);
maximum temperature of warmest month; minimum temperature
of coldest month; mean temperature of wettest, driest, warmest
and coldest quarters; mean annual precipitation; precipitation of
the wettest and driest months; precipitation seasonality (i.e.
coefficient of variation of monthly precipitation); precipitation
of wettest, driest, warmest and coldest quarters; all taken from
WorldClim global climate layers (1950–2000) (Hijmans
et al
.,
2005); mean annual potential evapotranspiration (1987–88)
calculated by the Penman–Monteith equation (Choudhury,
1997); a humidity index, defined as the ratio of mean annual
rainfall to mean annual potential evapotranspiration (UNEP,
1992). (2) Topography-related indices: altitude and slope derived
from Shuttle Radar Topography Mission (SRTM). (3) Soil
characteristics: bulk density; field capacity; available water
capacity; total nitrogen density and wilting point from the
Global Soil Data Task Group, 2000, Global Gridded Surfaces of
Selected Soil Characteristics (International Geosphere–
Biosphere Programme – Data and Information System; http://
www.daac.ornl.gov).
The spatial resolution of the analysis is determined by that of
the coarsest data set, i.e. the humidity index, with a 0.5
°
pixel size
(
c
. 50 km in the tropics). All other layers had to be upscaled (via
averaging) to match this resolution.
Table 1 Detail of the field data used for model training. Mean annual precipitation (MAP; mm), and humidity index (HI: MAP/annual evapotranspiration), were extracted from the corresponding gridded data set.
Region Perennial vegetation MAP (HI) Reference
Eastern Africa
Somalia (N of lat. 8°) Tussock grasses (Andropogon kelleri or Chrysopogon aucheri) and
few shrubs (e.g. Acacia bussei)
160–400 (0.05–0.24) Boaler & Hodge (1964)
Ethiopia (Ogaden) Not described 200–410 (0.14–0.21) Riché & Ségalen (1971)
Sudan (western Kurdufan) Shrubs (Acacia mellifera, Terminalia brownii) 350 (0.17) Wickens & Collier (1971)
Sahelian Africa
Niger (Tillabéri and Dosso) Shrubs (Combretum micranthum, Guiera senegalensis) 400–790 (0.11–0.40) Valentin & d’Herbès (1999),
Barbier et al. (2006)
Mali (Mopti) Shrubs (Combretum micranthum) 350–630 (0.10–0.23) Leprun (1999)
Mauritania (Hodh) Grass (Andropogon Gayanus) and few shrubs (e.g. Pterocarpus lucens) 270–340 (0.08–0.09) Audry & Rossetti (1962)
Senegal (Ferlo/Saint-Louis) Shrubs (Combretum micranthum, Pterocarpus lucens) 340–420 (0.12–0.19) De Wispelaere (1980)
Australia
Western Australia Mulga (Acacia aneura) shrubs 270–580 (0.10–0.20) Mabbut & Fanning (1987)
Northern Territory Mulga (Acacia aneura) shrubs in groves and perennial grass in
intergroves
300–350 (0.16–0.18) Dunkerley (2002)
Western New South Wales Tussock grass (Astrebla pectinata) and chenopod shrub
(Atriplex vesicaria)
190–230 (0.11–0.16) Dunkerley & Brown (1999)
South-Western Queensland Mulga (Acacia aneura) shrubs and grass 270–460 (0.13–0.27) Tongway & Ludwig (1990)
Mexico
Chihuahuan desert Shrubs (Flourensia cernua, Prosopis glandulosa) and grass
(Hilaria mutica)
210–450 (0.15–0.29) Cornet et al. (1988)
V. Deblauwe
et al.
© 2008 The Authors
4
Global Ecology and Biogeography
, Journal compilation © 2008 Blackwell Publishing Ltd
A jackknife procedure (Guisan & Zimmermann, 2000) was
applied to remove the environmental predictors displaying only
a weak influence on model goodness of fit.
Potential distribution
We used a maximum entropy (Maxent version 2.3) modelling
approach to delineate the environmental envelope encompassing
a random 75% subset (the rest being kept for validation, see
below) of recorded occurrences of PVPs. This enabled us to
generate a potential distribution model for PVP occurrence and
to derive a global predictive map.
Maxent is a machine learning algorithm available as PC-
implemented software (Phillips
et al
., 2006) that has been shown
to be particularly efficient for modelling species distributions
(Elith
et al
., 2006). It is a nonparametric method offering a good
trade-off between interpretability and ability to take into account
complex response curves. The algorithm iteratively computes the
probability distribution of the response that maximizes entropy
(i.e. is closest to a uniform distribution) while meeting the constraint
that the expected value of each environmental predictor (or its
transform) under this estimated distribution matches its empirical
average (Phillips
et al
., 2006). The output values for the predicted
distributions are cumulative, with the output value of a grid cell
being the sum of the probabilities of all grid cells of lower or equal
value to the probability of the considered grid cell. In other
words, the set of values higher than 5% incorporates the 95% of
the probability distribution around the ecological optimum.
Partition of explained variability
Hierarchical partitioning (HP) (Chevan & Sutherland, 1991;
Mac Nally, 2000) aims at partitioning the explained variability
(goodness-of-fit) in a multivariate setting between individual
predictors displaying substantial multicolinearity, and at
estimating the independent versus the conjoint effects of each
predictor. The main purpose of HP is not to select the most
parsimonious model but rather to give a basis for inferring probable
causality. HP was applied with our own Matlab® implemented
routines, on the log-likelihood (deviance) of the potential distribution
map computed with the training presence points, which was
used as a measure of goodness of fit (Phillips
et al
., 2006).
Performance evaluation
We tested the predictive success of the potential distribution
model by cross-validation (Guisan & Zimmermann, 2000) using
independent test points (i.e. the 25% of known location points
excluded from model building) for presence and a random set of
1000 pseudo-absence points (Phillips
et al
., 2006). The latter
were taken in arid and semi-arid regions (i.e. for a humidity
index ranging from 0.05 to 0.5; UNEP, 1992) in order to avoid an
overestimation of the rate of well-predicted absence. Per-
formance of the model was assessed by calculating the area under
the curve (AUC) of a receiver operating characteristic (ROC)
plot (Fielding & Bell, 1997; Guisan & Zimmermann, 2000). This
index has been extensively used in the literature on the
prediction of species distribution since it is a nonparametric,
class-prevalence-insensitive and threshold-independent index of
overall accuracy. An AUC of 0.5 indicates a random relationship
between predicted and observed classes, while an AUC of 1
corresponds to perfect prediction.
RESULTS
Jackknifing of the environmental variables allowed us to exclude
indirect (e.g. altitude), redundant or irrelevant predictors. Only
nine predictors were kept to build the final potential distribution
map (Figs 2 & 3): humidity index, mean temperature of wettest
quarter, temperature seasonality, wilting point, mean annual
precipitation, temperature mean diurnal range, precipitation of
warmest quarter, precipitation seasonality and slope. The values
on the map represent the statistical envelope surrounding the
modelled ecological optimum based on these predictors. Each
predictor kept in the model independently contributed to a
substantial part of the explained variability in the occurrence of
PVPs, according to the ‘hierarchical partitioning approach’
(Fig. 3). A notable multicolinearity was still present in the data
set, as was shown by the conjoint effects (i.e. effects shared by at
least two predictors). The humidity index, given by the ratio of
the mean annual rainfall to the mean annual potential evapotran-
spiration, was the predictor accounting for the largest independent
part of variance explained by our model.
Figure 4 shows the observed (bars) and predicted (line)
frequency distribution of PVPs as a function of the four most
important explanatory variables in terms of independent effect.
The relation between PVP occurrence and the humidity index
was clearly unimodal, and was situated between 0.04 and 0.33. It
shows that PVPs only occur when the evapotranspiration is at
least three times as high as the rainfall. For the second most
important variable, namely the mean temperature of the wettest
quarter, the distribution was slightly bimodal, showing an
anecdotic peak for PVPs occurring in wet winter areas (south-west
Australian ‘mediterranean’ areas), whilst the great majority of
PVPs belonged to tropical wet summer areas. The third factor,
temperature seasonality, showed a clearer bimodal distribution,
distinguishing the subtropical African PVPs, which were found
for nearly constant temperature regimes, from PVPs occurring in
Mexico and Australia (including the aforementioned ‘mediterranean’
areas as a special case) where temperature seasonality is higher.
The fourth explanatory variable, soil wilting point, showed that
soil properties, and in particular soil texture, are a determining
factor in addition to climatic features. For instance, low wilting
point values, associated with sandy soils, appeared to be unsuitable
for the occurrence of PVPs. Other important environmental
predictors (figures not shown) were, in order of decreasing
independent contribution: the annual precipitation, which must
be less than 400 mm except in the Sahelian band where it can
reach up to 700 mm; the temperature diurnal range which is
characteristically high in arid environments, with patterns
occurring within the 12–18
°
C range; the precipitation seasonality
which shows a bimodal distribution, with a less marked seasonal

Global biogeography of periodic vegetation patterns
© 2008 The Authors
Global Ecology and Biogeography
, Journal compilation © 2008 Blackwell Publishing Ltd
5
regime in Australia and Mexico than in Africa, which is the
opposite pattern to temperature seasonality; finally the slope,
which must be less than 2%.
The AUC (Fielding & Bell, 1997; Guisan & Zimmermann,
2000) reached a score of 0.96 (95% CI,
±
0.01). This index is com-
puted as the probability for randomly selected presence points to
obtain a higher predicted score than a random selection of
absence points (Elith
et al
., 2006; Phillips
et al
., 2006). This result
therefore indicated a strong predictive power of the potential
distribution model. Visual examination of images from the area
encompassing 75% of the probability distribution function around
the ecological optimum (i.e. all values on the map superior to
0.25) confirmed the pertinence of these predictions by revealing
extensive, yet previously unreported, areas featuring PVPs. These
areas include the Sonoran Desert down to the Baja California
Peninsula (Figs 1e, 2d), the Argentinean arid Chaco (Fig. 2a), the
fringes of the Kalahari Desert, some areas in East Africa (Figs 1d,
2b) and the Australian Gibson Desert (Fig. 2c) (see Appendix S1
in Supplementary Material for a complete global map). Small
isolated areas of PVPs were also noticed on images from mediter-
ranean North Africa (33
°
47
′
N, 2
°
35
′
W) and from the Thar
Desert of India (27
°
23
′
N, 70
°
44
′
E), thereby closing the bound-
ary between the extremely arid Saharo-Sindian Desert and the
surrounding semi-arid regions.
Some types of patterns, though predicted by self-organization
models, had not or had only rarely been observed in the field.
Labyrinthine patterns, previously described from the African
Sahel (Tongway
et al
., 2001), were also found to occur in
Figure 2 Predicted and real distribution map of periodic vegetation patterns with enlarged subsets. Orange levels correspond to envelopes of the cumulative probability distribution around the ecological optima. For instance, the 5% envelope delineates the area including 95% of the distribution. Blue areas represent periodic vegetation patterns localized using the available literature and used for constructing and testing the map. Areas with periodic vegetation discovered using map predictions are shown in green. See Appendix S1 for the complete global map.

V. Deblauwe
et al.
© 2008 The Authors
6
Global Ecology and Biogeography
, Journal compilation © 2008 Blackwell Publishing Ltd
Australia, and we report here for the very first time observations
of ‘spots’, that is thickets regularly distributed in a bare matrix
(Fig. 1a). They were found in the Sudan, at the arid extreme of a
sequence of patterns of varying morphology including labyrinths
(Fig. 1b), bands and gaps (Fig. 1c).
DISCUSSION AND CONCLUSIONS
This study represents the first attempt to produce an empirical
predictive model for PVPs. Using known arid and semi-arid PVP
locations and global-scale environmental predictors, new
locations were discovered and the ubiquity of the phenomenon
in all tropical and subtropical arid areas was evidenced. There is
now verified PVP occurrence for 0.4% of arid to semi-arid lands,
sensu
UNEP (1992), which cover one-third of emerged land. This
figure still underestimates the reality, as patterns with wavelengths
below 60 m were not taken into account in our analysis, due to
imagery resolution constraints. These include, for instance,
known large areas of gapped bush in south-west Niger displaying
wavelengths of
c
. 50 m (Barbier
et al
., 2006) or the Sudanese
Butana grass patterns, with wavelengths of
c
. 30 m (Worrall,
1959). Moreover, other stressful non-arid environments are
favourable for the occurrence of PVPs (see for examples Rietkerk
& Van De Koppel, 2008), which our model, designed to deal with
arid PVPs, cannot predict.
Despite the coarseness imposed by the environmental pre-
dictors fed into the model, false positives, i.e. areas clearly devoid
of PVPs while predicted to be highly suitable, were relatively rare.
Such false positives are mostly related to long histories of human
occupation, which may have suppressed natural PVPs, as in the
Thar Desert of India for instance. The spatial resolution of
variables related to the substratum (wilting point derived from
the United Nations Food and Agriculture Organization soil map
and slope) was also too low to match with the local extension of
PVPs and to thoroughly explore their influence on patterning
occurrence (see discussion on wilting point, below).
Our aim was not to build the most parsimonious model in
terms of predictors but rather to optimize the prediction power
as well as to explore the potentially causal/explanatory relation-
ships between PVP occurrence and environmental predictors.
However, as always in correlative studies, evidence for strict
causality remains hard to come by, especially in the presence of a
set of highly intercorrelated predictors.
Figure 4 Relative observed and predicted frequency distributions of periodic vegetation patterns in relation to the four most important environmental predictors. Bars: distribution of patterns used for model training and evaluation (249 point locations). Lines: world average model prediction.
Figure 3 Proportion of explained variability accounted for by the nine most relevant environmental predictors used to build the distribution model. Hierarchical partitioning of the log-likelihood goodness of fit (deviance) was used to assess the independent (open bars) and conjoint (black bars) contribution of each predictor. HI, humidity index; TWQ, mean temperature of wettest quarter; TS, temperature seasonality; WP, wilting point; AP, mean annual precipitation; TDR, temperature mean diurnal range; PWQ, precipitation of warmest quarter; PS, precipitation seasonality and S, slope.

Global biogeography of periodic vegetation patterns
© 2008 The Authors Global Ecology and Biogeography, Journal compilation © 2008 Blackwell Publishing Ltd 7
Published empirical and theoretical knowledge (Tongway
et al., 2001, and references therein; Rietkerk et al., 2004) points
towards aridity, soil infiltration rate and slope as important
environmental drivers for PVP formation. Aridity, as summarized
by the humidity index does indeed come first in the hierarchy of
predictors. Mean annual precipitation alone lacks explanatory
power, as shown by the Sahelian case, where PVPs occur under
relatively high rainfall, but where evapotranspiration is also
higher. Precipitation seasonality also accounts for a substantial
part of independent predictive power. The temporal distribution
of resources is known indeed to be a critical parameter for plant
survival in arid areas (Noy-Meir, 1973). Models showed that
seasonal (dry season length) and interannual variations in
precipitation (not included in this study) can modulate patterning
even when the average (e.g. precipitation) values are kept
constant (see, for example, D’odorico et al., 2006; Ursino &
Contarini, 2006; Guttal & Jayaprakash, 2007). The importance
of temperature, and more particularly of its seasonality (mean
temperature of wettest quarter, temperature seasonality and
temperature mean diurnal range), is difficult to interpret directly
from the existing set of simplified mechanistic models, which do
not take into account the seasonal patterns of rainfall and
temperatures. As for rainfall seasonality, these variables possibly
add a stress component which is not integrated by the average
value of the humidity index. The seasonal variation and timing
of the evaporative demand might play a prominent role in
pattern triggering. Overall, PVPs seem to belong to either one of
two possible classes: PVPs with a seasonal pattern of rainfall and
a constant temperature versus those with a more homogeneous
distribution of rainfall but a seasonally varying temperature. As a
matter of fact, temperature has also been hypothesized as a
controlling factor (S. Kéfi, pers. comm.) via its physiological
effect on productivity.
The physical properties of soil (wilting point) also come early
in the partition of explained variance, although the importance
of soil parameters is still, to a large extent, undermined by the
low resolution and reliability of the available global information.
In western Africa for instance, PVPs that were used for model
training are known to only occur on shallow loamy soils on iron-
capped plateaus. However, as Aeolian sand deposits dominate
the landscape, the whole area is mapped with a low wilting point
(see reference in Table 1). Fortunately, very large and homogeneous
sandy areas (e.g. the Kalahari Sands and the Simpson Desert)
which are deprived of patterns can still be used as evidence for
the fact that sandy areas are not favourable to PVP formation and
to confirm the wilting point as a relevant predictor. Finer-scale
soil maps, and in particular estimates of soil depth or of its
inclination to form impermeable biological crusts, would be
particularly needed.
Soil texture is of course central in hydrological processes.
However, the fact that PVPs do not develop on sand does not
permit one to decide between the different mechanistic pattern
formation processes which have been proposed, namely root
competition (Lefever & Lejeune, 1997; Barbier et al., 2008) or
water redistribution through runoff (Hillerislambers et al., 2001;
Von Hardenberg et al., 2001). A high soil infiltration rate indeed
both precludes runoff and promotes deep pivoting root systems
at the expense of shallow tracing ones (Schenk & Jackson, 2005).
Slope did not grade high in terms of explanatory power. This
could be due to several reasons beginning with the resolution of
the slope data set, averaged from a 2.5 arcmin (c. 4.5 km in the
tropics) to a 0.5° resolution. This pixel size, of nearly 50 km in
the tropics, generally encompasses several geomorphological
features, while patterns are known to be limited to very flat
landscapes (e.g. plateaus).
Beyond the correlations evidenced, field studies are needed to
understand how the environmental variables influence growth
or spatial interactions at the plant scale. Similarly, new modelling
attempts will have to reflect and explain the observed frequency
distribution of PVPs along the main environmental variables (see
Fig. 4). The broad-scale occurrence of PVPs on all continents
shows that the phenomenon is not limited to the dominance of
any given botanical taxa, as is also apparent from numerous field
accounts (Table 1). However, global patterns of common functional
traits could possibly be found between dominant species. For
instance, in the rare case where the root systems of the dominant
species have been examined, shallow, laterally extended root
systems were reported: namely for Acacia aneura (mulga) in
Australia (Anderson & Hodgkinson, 1997), Combretum micranthum
in West Africa (Barbier et al., 2008), Acacia mellifera in Sudan
(Adams, 1967) and Acacia bussei in the Horn of Africa (Glover,
1951). In accordance with the concept of a self-organized
response to aridity, PVPs appear in a predictable way within a
specific range of environmental conditions. Although a number
of local studies had already given fragmented information on
these ranges (Tongway et al., 2001), this study is the first systematic
approach to characterize the parameter space in which PVPs
develop. The confirmed existence of threshold effects is crucial,
as there must be an upper and a lower limit to the existence of
PVPs in terms of average productivity and biomass. When the
aridity is not limiting, vegetation reaches the maximum biomass
corresponding to a uniform close-packed distribution of plants,
at least for the herbaceous strata as in tropical savannas. In the
opposite limit, the population becomes so sparse that plant–
plant interactions are negligible and self-organization becomes
impossible. Self-organized patterning can therefore be viewed as
a biome-scale feature of arid and semi-arid vegetation.
The objective of this study was not to systematically quantify
pattern succession (i.e. the variation in wavelength and morphology
along gradients), even though our observations generally agree
with theoretical predictions in this regard (Lejeune & Tlidi, 1999;
Von Hardenberg et al., 2001; Rietkerk et al., 2002). Formal
demonstration of the phenomenon requires a more detailed
(and thus local) approach, involving the quantitative character-
ization of pattern properties (e.g. via Fourier textural analysis;
Barbier et al., 2006), and will be addressed elsewhere.
PVPs have been shown to respond to variations in climate and
human activities (Barbier et al., 2006), in accordance with
self-organization models predicting that PVPs are modulated by
the balance between biomass production and suppression
(Lefever & Lejeune, 1997; Couteron & Lejeune, 2001; Von Harden-
berg et al., 2001; Rietkerk et al., 2002). A straightforward

V. Deblauwe et al.
© 2008 The Authors8 Global Ecology and Biogeography, Journal compilation © 2008 Blackwell Publishing Ltd
extension of the present work would be to incorporate environ-
mental layers as predicted by different climate change scenarios.
Moreover, in semi-arid regions such as in the West African Sahel,
regional climate is known to be subjected to strong positive
feedbacks induced by vegetation, through the enhancement of
evapotranspiration and the lowering of surface albedo (Zeng
et al., 1999). Dekker et al. (2007) recently suggested that local
plant–water feedback occurring in PVPs might increase this
large-scale positive effect exerted by vegetation on precipitation
by up to 35%. The PVP distribution map presented here should
therefore help climate modellers to take these local-scale
processes into account.
ACKNOWLEDGEMENTS
We thank R. Lefever, M. Rietkerk and one anonymous referee for
constructive suggestions and T. Brncic, M. Visser, K. Parr, J. Fisher
and J. Curtis for improving the manuscript. This research was
supported by FRIA, FNRS and Wiener Anspach grants. We are
grateful to the Global Land Cover Facility, http://www.landcover.org/,
for providing the Landsat imagery free of charge.
REFERENCES
Adams, M.E. (1967) A study of the ecology of Acacia mellifera,
A. seyal and Balanites aegyptiaca in relation to land-clearing.
Journal of Applied Ecology, 4, 221–237.
Anderson, V.J. & Hodgkinson, K.C. (1997) Grass-mediated
capture of resource flows and the maintenance of banded
mulga in a semi-arid woodland. Australian Journal of Botany,
45, 331–342.
Audry, P. & Rossetti, C. (1962) Observations sur les sols et la
végétation en Mauritanie de Sud-Est et sur la bordure
adjacente du Mali (1959 et 1961). Prospection écologique.
Études en Afrique occidentale (ed. by F.S.N.U.C. Pélerin),
p. 267. FAO, Rome.
Barbier, N., Couteron, P., Lejoly, J., Deblauwe, V. & Lejeune, O.
(2006) Self-organized vegetation patterning as a fingerprint of
climate and human impact on semi-arid ecosystems. Journal of
Ecology, 94, 537–547.
Barbier, N., Couteron, P., Lefever, R., Deblauwe, V. & Lejeune, O.
(2008) Spatial decoupling of facilitation and competition at
the origin of gapped vegetation patterns. Ecology, 89, 1521–
1531.
Boaler, S.B. & Hodge, C.A.H. (1964) Observations on vegetation
arcs in the Northern region, Somali republic. Journal of
Ecology, 52, 511–544.
Callaway, R.M. (1995) Positive interactions among plants. The
Botanical Review, 61, 306–349.
Chevan, A. & Sutherland, M. (1991) Hierarchical partitioning.
American Statistician, 45, 90–96.
Choudhury, B.J. (1997) Global pattern of PET calculated from
the Penman–Monteith equation using satellite and assimilated
data. Remote Sensing of Environment, 61, 64–81.
Cornet, A.F., Delhoume, J.P. & Montana, C. (1988) Dynamics of
striped vegetation patterns and water balance in the Chihuahuan
desert. Diversity and pattern in plant communities (ed. by H.J.
During, M.J.A. Werger and J.H. Willems), pp. 221–231. SPB
Academic Publishing, The Hague.
Couteron, P. & Lejeune, O. (2001) Periodic spotted patterns in
semi-arid vegetation explained by a propagation-inhibition
model. Journal of Ecology, 89, 616–628.
Cross, M.C. & Hohenberg, P.C. (1993) Pattern-formation
outside of equilibrium. Reviews of Modern Physics, 65, 851–
1112.
Dekker, S.C., Rietkerk, M. & Bierkens, M.F.P. (2007) Coupling
microscale vegetation-soil water and macroscale vegetation-
precipitation feedbacks in semiarid ecosystems. Global Change
Biology, 13, 671–678.
De Wispelaere, G. (1980) Les photographies aériennes témoins
de la dégradation du couvert ligneux dans un géosystème
sahélien sénégalais : influence de la proximité d’un forage.
Cahiers O.R.S.T.O.M., Série Sciences Humaines, 17, 155–
166.
D’odorico, P., Laio, F. & Ridolfi, L. (2006) Vegetation patterns
induced by random climate fluctuations. Geophysical Research
Letters, 33, L19404.
Dunkerley, D.L. (2002) Infiltration rates and soil moisture in a
groved mulga community near Alice Springs, arid central
Australia: evidence for complex internal rainwater redistribution
in a runoff-runon landscape. Journal of Arid Environments, 51,
199–219.
Dunkerley, D.L. & Brown, K.J. (1999) Banded vegetation near
Broken Hill, Australia: significance of surface roughness and
soil physical properties. Catena, 37, 75–88.
Elith, J., Graham, C.H., Anderson, R.P., Dudik, M., Ferrier, S.,
Guisan, A., Hijmans, R.J., Huettmann, F., Leathwick, J.R.,
Lehmann, A., Li, J., Lohmann, L.G., Loiselle, B.A., Manion, G.,
Moritz, C., Nakamura, M., Nakazawa, Y., Overton, J.M.,
Peterson, A.T., Phillips, S.J., Richardson, K., Scachetti-Pereira,
R., Schapire, R.E., Soberon, J., Williams, S., Wisz, M.S. &
Zimmermann, N.E. (2006) Novel methods improve prediction
of species’ distributions from occurrence data. Ecography, 29,
129–151.
Fielding, A.H. & Bell, J.F. (1997) A review of methods for the
assessment of prediction errors in conservation presence/
absence models. Environmental Conservation, 24, 38–49.
Glover, P.E. (1951) The root systems of some British Somaliland
plants-IV. The East African Agricultural Journal, 17, 38–50.
Guisan, A. & Zimmermann, N.E. (2000) Predictive habitat
distribution models in ecology. Ecological Modelling, 135,
147–186.
Guttal, V. & Jayaprakash, C. (2007) Self-organization and
productivity in semi-arid ecosystems: implications of seasonality
in rainfall. Journal of Theoretical Biology, 248, 490–500.
Hijmans, R.J., Cameron, S.E., Parra, J.L., Jones, P.G. & Jarvis, A.
(2005) Very high resolution interpolated climate surfaces for
global land areas. International Journal of Climatology, 25,
1965–1978.
Hillerislambers, R., Rietkerk, M., Van Den Bosch, F., Prins,
H.H.T. & De Kroon, H. (2001) Vegetation pattern formation
in semi-arid grazing systems. Ecology, 82, 50–61.

Global biogeography of periodic vegetation patterns
© 2008 The Authors Global Ecology and Biogeography, Journal compilation © 2008 Blackwell Publishing Ltd 9
Klausmeier, C.A. (1999) Regular and irregular patterns in semiarid
vegetation. Science, 284, 1826–1828.
Lefever, R. & Lejeune, O. (1997) On the origin of tiger bush.
Bulletin of Mathematical Biology, 59, 263–294.
Lejeune, O. & Tlidi, M. (1999) A model for the explanation of vegeta-
tion stripes (tiger bush). Journal of Vegetation Science, 10, 201–208.
Leprun, J.C. (1999) The influences of ecological factors on tiger
bush and dotted bush patterns along a gradient from Mali to
northern Burkina Faso. Catena, 37, 25–44.
Ludwig, J.A., Wilcox, B.P., Breshears, D.D., Tongway, D.J. & Imeson,
A.C. (2005) Vegetation patches and runoff-erosion as interacting
ecohydrological processes in semiarid landscapes. Ecology, 86,
288–297.
Mabbutt, J.A. & Fanning, P.C. (1987) Vegetation banding in arid
Western Australia. Journal of Arid Environments, 12, 41–59.
Mac Nally, R. (2000) Regression and model-building in con-
servation biology, biogeography and ecology: the distinction
between and reconciliation of ‘predictive’ and ‘explanatory’
models. Biodiversity and Conservation, 9, 655–671.
Nicolis, G. & Prigogine, I. (1977) Self-organization in nonequilibrium
systems: from dissipative structures to order through fluctuations.
Wiley, New York.
Noy-Meir, I. (1973) Desert ecosystems: environment and
producers. Annual Review of Ecology and Systematics, 4, 25–41.
Phillips, S.J., Anderson, R.P. & Schapire, R.E. (2006) Maximum
entropy modeling of species geographic distributions. Ecological
Modelling, 190, 231–259.
Riché, G. & Ségalen, P. (1971) Evolution du relief et pédogenèse
dans la basse vallée du Wabi-Shebelli (Ethiopie). Cahiers
O.R.S.T.O.M., Série Pédologie, 9, 189–203.
Rietkerk, M. & Van De Koppel, J. (2008) Regular pattern formation
in real ecosystems. Trends in Ecology and Evolution, 23, 169–75.
Rietkerk, M., Boerlijst, M.C., Van Langevelde, F., Hillerislambers, R.,
Van De Koppel, J., Kumar, L., Prins, H.H.T. & De Roos, A.M.
(2002) Self-organization of vegetation in arid ecosystems. The
American Naturalist, 160, 524–530.
Rietkerk, M., Dekker, S.C., De Ruiter, P.C. & Van De Koppel, J.
(2004) Self-organized patchiness and catastrophic shifts in
ecosystems. Science, 305, 1926–1929.
Saco, P.M., Willgoose, G.R. & Hancock, G.R. (2007) Eco-geomor-
phology of banded vegetation patterns in arid and semi-arid
regions. Hydrology and Earth System Sciences, 11, 1717–1730.
Schenk, H.J. & Jackson, R.B. (2005) Mapping the global
distribution of deep roots in relation to climate and soil
characteristics. Geoderma, 126, 129–140.
Schlesinger, W.H., Reynolds, J.F., Cunningham, G.L., Huenneke, L.F.,
Jarrell, W.M., Virginia, R.A. & Whitford, W.G. (1990) Biological
feedbacks in global desertification. Science, 247, 1043–1048.
Tongway, D.J. & Ludwig, J.A. (1990) Vegetation and soil patterning
in semi-arid mulga lands of Eastern Australia. Australian
Journal of Ecology, 15, 23–34.
Tongway, D.J., Valentin, C. & Seghieri, J. (2001) Banded vegeta-
tion patterning in arid and semiarid environments. Springer-
Verlag, New York.
UNEP (1992) World atlas of desertification (ed. by N.J. Middleton
and D.S.G. Thomas). Edward Arnold, London.
Ursino, N. & Contarini, S. (2006) Stability of banded vegetation
patterns under seasonal rainfall and limited soil moisture
storage capacity. Advances in Water Resources, 29, 1556–1564.
Valentin, C. & D’herbes, J.M. (1999) Niger tiger bush as a natural
water harvesting system. Catena, 37, 231–256.
Valentin, C., D’herbes, J.M. & Poesen, J. (1999) Soil and water
components of banded vegetation patterns. Catena, 37, 1–24.
Von Hardenberg, J., Meron, E., Shachak, M. & Zarmi, Y. (2001)
Diversity of vegetation patterns and desertification. Physical
Review Letters, 87, 198101.
Wickens, G.E. & Collier, F.W. (1971) Some vegetation patterns in
the republic of the Sudan. Geoderma, 6, 43–59.
Worrall, G.A. (1959) The Butana grass patterns. Journal of Soil
Science, 10, 34–53.
Zeng, N., Neelin, J.D., Lau, K.M. & Tucker, C.J. (1999) Enhancement
of interdecadal climate variability in the Sahel by vegetation
interaction. Science, 286, 1537–1540.
SUPPORTING INFORMATION
Additional supporting information may be found in the online
version of this article:
Appendix S1 High-resolution predicted and real distribution
map of periodic vegetation patterns.
Please note: Blackwell Publishing is not responsible for the con-
tent or functionality of any Supporting Information supplied by
the authors. Any queries (other than missing material) should be
directed to the corresponding author for the article.
Editor: Brad Murray
BIOSKETCHES
Vincent Deblauwe is a spatial ecologist who specializes
in studying macroecological patterns in vegetation at
multiple scales.
Nicolas Barbier is a post-doctoral FNRS fellow. The
main focus of his research concerns the characterization,
causality and dynamics of spatial structure in tropical
vegetation.
Pierre Couteron is researcher at the Institut de
Recherche pour le Développement (IRD) and has
contributed to several studies about periodic vegetation
patterns. His present fields of interest also include spatial
patterns of tree diversity in the tropical forests.
Olivier Lejeune is a theoretical physicist. Population
dynamics is the general framework of his research. His
interest covers diverse topics such as pattern formation in
vegetation, immune response to cancer or control of
infectious diseases.
Jan Bogaert is a landscape ecologist. Quantitative
analysis of landscape and vegetation patterns and their
dynamics are the focus of his research unit.