International Portfolio Diversification: A Malaysian Perspective
31
1 INTERNATIONAL PORTFOLIO DIVERSIFICATION: A MALAYSIAN PERSPECTIVE Sazali Zainal Abidin Ph.D. Candidate, Universiti Putra Malaysia Mohamed Ariff, Ph.D., CMA, Universiti Putra Malaysia Annuar Md. Nassir, Ph.D., Universiti Putra Malaysia Shamsher Mohamad, Ph.D., Universiti Putra Malaysia ABSTRACT The main purpose of this study is to provide evidence whether international portfolio diversification gain exists in equity investment from a Malaysian perspective. The study considers currency risk (based on selected countries) besides incorporating the effects of price volatility in the portfolio construction. Risk of foreign equity investments is represented by the standard deviation of returns and the currency exchange rate risk. The Markowitz Efficient Frontier Model as amended by Solnik (1973) is estimated using standard procedures in forming efficient portfolios. A computer programme to plot the efficient frontier has been specially developed for the purpose of this study. Several divisions of studies have been done to gain a better understanding of the benefits of international portfolio diversification. Besides comparing the internationally diversified portfolio to a locally diversified portfolio, countries are also grouped into those of developed and emerging nations to evaluate the benefits of diversifying into a group of countries. A time series analysis of 20 countries stock market indices is broken into several series of pre-, during- and post-crisis periods where comparisons are made to evaluate the benefits of international portfolio diversification during these periods. This study also includes an analysis of the effects of international portfolio diversification if the allocation of asset for Malaysia is fixed at several minimum pre-determined levels. The results from this study are expected to reveal evidence on gains from international portfolio diversification for Malaysian investors after considering currency risk and price volatility. Keywords: International, portfolio, diversification
Transcript of International Portfolio Diversification: A Malaysian Perspective

1
INTERNATIONAL PORTFOLIO DIVERSIFICATION:A MALAYSIAN PERSPECTIVE
Sazali Zainal AbidinPh.D. Candidate, Universiti Putra Malaysia
Mohamed Ariff, Ph.D., CMA, Universiti Putra MalaysiaAnnuar Md. Nassir, Ph.D., Universiti Putra Malaysia
Shamsher Mohamad, Ph.D., Universiti Putra Malaysia
ABSTRACT
The main purpose of this study is to provide evidence whether international portfolio
diversification gain exists in equity investment from a Malaysian perspective. The study
considers currency risk (based on selected countries) besides incorporating the effects of
price volatility in the portfolio construction. Risk of foreign equity investments is
represented by the standard deviation of returns and the currency exchange rate risk. The
Markowitz Efficient Frontier Model as amended by Solnik (1973) is estimated using
standard procedures in forming efficient portfolios. A computer programme to plot the
efficient frontier has been specially developed for the purpose of this study. Several
divisions of studies have been done to gain a better understanding of the benefits of
international portfolio diversification. Besides comparing the internationally diversified
portfolio to a locally diversified portfolio, countries are also grouped into those of
developed and emerging nations to evaluate the benefits of diversifying into a group of
countries. A time series analysis of 20 countries stock market indices is broken into
several series of pre-, during- and post-crisis periods where comparisons are made to
evaluate the benefits of international portfolio diversification during these periods. This
study also includes an analysis of the effects of international portfolio diversification if
the allocation of asset for Malaysia is fixed at several minimum pre-determined levels.
The results from this study are expected to reveal evidence on gains from international
portfolio diversification for Malaysian investors after considering currency risk and price
volatility.
Keywords: International, portfolio, diversification
2
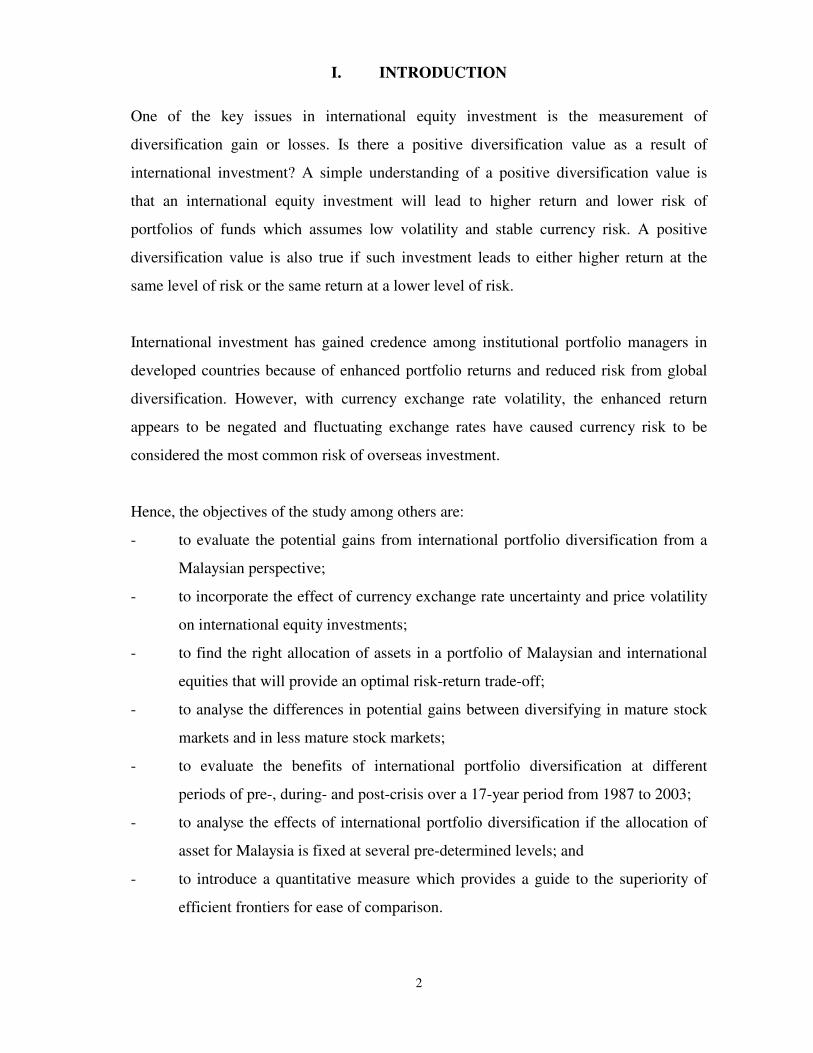
I. INTRODUCTION
One of the key issues in international equity investment is the measurement of
diversification gain or losses. Is there a positive diversification value as a result of
international investment? A simple understanding of a positive diversification value is
that an international equity investment will lead to higher return and lower risk of
portfolios of funds which assumes low volatility and stable currency risk. A positive
diversification value is also true if such investment leads to either higher return at the
same level of risk or the same return at a lower level of risk.
International investment has gained credence among institutional portfolio managers in
developed countries because of enhanced portfolio returns and reduced risk from global
diversification. However, with currency exchange rate volatility, the enhanced return
appears to be negated and fluctuating exchange rates have caused currency risk to be
considered the most common risk of overseas investment.
Hence, the objectives of the study among others are:
- to evaluate the potential gains from international portfolio diversification from a
Malaysian perspective;
- to incorporate the effect of currency exchange rate uncertainty and price volatility
on international equity investments;
- to find the right allocation of assets in a portfolio of Malaysian and international
equities that will provide an optimal risk-return trade-off;
- to analyse the differences in potential gains between diversifying in mature stock
markets and in less mature stock markets;
- to evaluate the benefits of international portfolio diversification at different
periods of pre-, during- and post-crisis over a 17-year period from 1987 to 2003;
- to analyse the effects of international portfolio diversification if the allocation of
asset for Malaysia is fixed at several pre-determined levels; and
- to introduce a quantitative measure which provides a guide to the superiority of
efficient frontiers for ease of comparison.

3
The cost of participation in foreign markets previously has been high due to high
transaction costs, the high cost of acquiring information, and other related expense.
However, globalisation and dissemination of information is eliminating these hurdles,
allowing investors to diversify internationally. Investors are no longer constrained by high
transaction costs or by the difficulty of acquiring information to invest abroad. Over the
past two decades, many national markets have been deregulated and opened to foreign
investment. Good-quality information on most markets is more easily available and
transaction costs have been drastically reduced. In recent years, cross-border portfolio
investment has become an increasingly important feature of global capital markets, with
capital controls being relaxed and transactions costs declining in many securities markets.
The globalisation of securities markets is re-focusing attention on stock markets
throughout the world. Investment managers and pension consultants in many developed
countries continue to extol the fundamental virtue of diversification into overseas
investing, suggesting potential high returns by a reduction in overall risk. International
diversification in a portfolio reduces exposure to risk specific to a particular economy. It
protects investors from substantial losses if one equity market or one currency faces a
sudden crisis.
The importance of currency risk to international investments can be traced back to the
collapse of the globally exchange rate systems (The Bretton Wood Agreement) in 1971.
As a result of international financial instability, the currency exchange rates started to
fluctuate and become volatile; hence exposed investors to greater currency risk
internationally. If the hypothesis that investing internationally offers benefits in terms of
portfolio risk reduction and return enhancement is true for many developed countries,
then it is likely to be true for emerging or less developed markets. This study on Malaysia
market provides a case of international portfolio diversification gain for an emerging
country. As Malaysia recently faced a currency turmoil and volatile share price
movement, this study evaluates if there is still a portfolio diversification gain of investing
abroad for Malaysian investors even with significant changes in currency exchange rate
and volatile share price movement.

4
II. LITERATURE REVIEW
THEORIES
This study focuses on two main subjects namely Modern Portfolio Theory by Harry
Markowitz and theory of international portfolio diversification by Bruno Solnik.
Markowitz (1952 : 1958) conveyed two significant insights with regard to Modern
Portfolio Theory. Firstly, he realised that the mathematics could not pick out a single
optimal portfolio but rather could only identify a set of efficient portfolios. Secondly, he
recognised that the appropriate risk facing an investor was portfolio risk which leads to a
fundamental point that the riskiness of a stock should not be measured just by the variance
of the stock but also by their covariances.
Markowitz discovered that it is the covariance that determines the risk of a portfolio and
not the variance of individual assets in the portfolio. The best portfolio will consist of
assets which are perfectly negatively (inversely) correlated. However, the benefits of
diversification need not only exist if the assets are perfectly negatively correlated. In fact,
as long as the correlation coefficient between two assets is less than 1.0, there will be a
reduction in risk by combining both assets in a portfolio. Markowitz proposed that
investors should instead consider variances of return along with expected returns, and
choose portfolios that offer the highest expected return for a given level of variance. He
called this rule the E-V maxim (Markowitz, 1959). In Modern Portfolio Theory, the
Markowitz stock portfolio model is optimised by minimising the risk of the portfolio as
measured by the variance of stock prices, subject to a given portfolio return. In short,
Modern Portfolio Theory is a way to determine just how many eggs to put in each of
several specified baskets.
Markowitz also demonstrated that for a given level of risk, an investor can identify
particular combinations of securities that maximise expected return. Markowitz referred
to a continuum of such portfolios in dimensions of expected return and standard deviation
as the ‘efficient frontier’. According to Markowitz’s E-V maxim, investors should restrict
their choice of portfolio to those that are located along the efficient frontier. The efficient

5
frontier considers a universe of risky investments and explores what might be an optimal
portfolio based upon those possible investments. The notion of ‘optimal’ portfolio can be
defined in one of two ways:
- for any level of risk (standard deviation), consider all the portfolios which have
that level of risk. From among them all, select the one which has the highest
expected return; and
- For any expected return, consider all the portfolios which have that expected
return. From among them all, select the one which has the lowest risk (standard
deviation).
The first definition produces an optimal portfolio for each possible level of risk while the
second definition produces an optimal portfolio for each expected return. However, the
two definitions are equivalent as the set of optimal portfolios obtained using one
definition is exactly the same set which is obtained from the other. The efficient frontier
comprises of a series of points, each of which represents a particular allocation of assets
across the clusters. Each allocation produces a specific return at a specific level of risk.
In 1956, Harry Markowitz published the ‘critical line algorithm’ for tracing out the
efficient frontier given estimates of expected returns, variances and covariances, for any
number of securities subject to various kinds of constraints. There are two restrictions in
solving the efficient frontier. Firstly, the sum of the proportions of each assets represented
in the portfolio must equal one and secondly, all assets must have positive or zero
representation in the portfolio. Returns are varied between the minimum-risk portfolio
and the maximum-return portfolio to sketch the portfolio. The formula is given as:
Minimize ijin
iixi
n
iix σσσ ∑
=+∑
= 1
22
1
2 (1)
subject to ∑ x i = 1Rp = ∑ x i Ri
x i ≥ 0, i = 1, ..., N
where Rp = total return to the portfoliox i = fraction of portfolio represented by asset iRi = return to asset i, i = 1, ..., Nσ2
i = variance of asset i

6
σij = covariance of assets i and j, i = 1, ..., N, j = 1, ..., N, i ≠ j
Bruno Solnik (1974) made a significant impact on development of international portfolio
diversification. He showed that substantial advantages in risk reduction can be attained
through portfolio diversification in foreign securities. He also highlighted that there is
little evidence that either stock or bond markets have become more volatile world-wide,
and correlation between markets remain low. However, correlations do appear to increase
when market volatility increases, that is, just when the diversification potential offered by
low correlation is most needed. While the biggest advantage for investing internationally
is diversification, the biggest disadvantage is the currency risk. However, it is worth noted
that although international diversification of equity portfolios represents an exposure to
security risk and currency risk, it also offers an opportunity to benefit from security
returns and currency returns.
Solnik (1991) studied the correlation coefficients of monthly returns from 1971 to 1989
for 17 countries. The study proves that although the correlation coefficients between stock
markets vary over time, they are always far from unity. For investors, this means there is
ample room for successful risk diversification. It allows investors to spread risk, since
some foreign markets are likely to go up when others go down. This reasoning is actually
a variation on the traditional domestic diversification argument, except that it is extended
to a larger universe of fairly independent markets. The degree of independence of a stock
market is directly linked to the independence of a nation’s economy and government
policies. Constraints and regulations imposed by national governments, technological
specialisation, independent fiscal and monetary policies, and cultural and sociological
differences all contribute to the degree of a capital market’s independence.
Combining the two main theories together, this study stands behind Markowitz portfolio
analysis with an extension to Bruno Solnik’s international portfolio diversification. Low
international correlation across markets is at the root of global portfolio diversification.
By diversifying across national markets with low correlation of returns, investors hope to
reduce their total portfolio risk without sacrificing return.

7
EVIDENCE
The initial application of portfolio theory in an international context to securities was by
Grubel (1968) who extended the concept of modern portfolio analysis, pioneered by
Markowitz (1952) and Tobin (1958) to global markets. Then, Sharpe (1972) argued that
because all stock prices on the same stock exchange tend to move together, the rate of
return on any reasonable well diversified portfolio will be highly correlated with that of
the market as a whole. Solnik (1974) made a study which shows that increasing the size of
a domestic portfolio beyond 20 stocks will only achieve a small incremental reduction in
risk but a substantial reduction can be achieved by an international portfolio of the same
size.
Eun and Resnick (1988) made a study covering a 10-year period from 1973 to 1982, and
derived an average correlation of 0.41. Kaplanis and Schaefer (1991) made a similar study
that covers a period from February 1978 to June 1987 and found an average correlation of
0.32. Hunter and Coggin (1990) found that international diversification could have
reduced investment risk to about 56% of the level that could have been achieved using
only national diversification. Bailey and Stulz (1990) found that the benefits to U.S.
investors of diversifying into Pacific Basin markets are substantial. Price and Ring (1990)
suggested that funds need at least 30% in foreign equities to maximise the risk reduction
associated with international diversification.
Eaker, Grant, Berry and Woodard (1991) also showed that there are risk reduction
opportunities available through international equity investing. Wignall and Shute (1991)
argued that adding international investments to a pure U.S. portfolio can lessen volatility
and increase returns. Fosberg and Madura (1991) found that approximately 90% of the
risk of the individual stocks can be diversified away if investors hold portfolios of as few
as 10 stocks. Le (1991) conducted a study on correlation coefficients between the U.S.
and foreign markets and found that the correlation coefficients made a dramatic increase
after the October 1987 crash. Madura and Soenen (1992) concluded that gains from
international diversification continue to exist regardless of country’s perspective. In
addition, Odier and Solnik (1993) found that investing internationally offers benefits in
8
terms of portfolio risk reduction and return enhancement, regardless of investor’s
nationality. Hauser and Marcus (1994) studied the effects of hedging currency exchange
rate and found that the hedging of currency risk is an inferior policy because of the
negative correlation between the exchange rate and stock returns when measured in the
local currencies of emerging markets. Tang (1995) found that the correlation coefficients
between stock indices increase in general with an increase in the investment horizon.
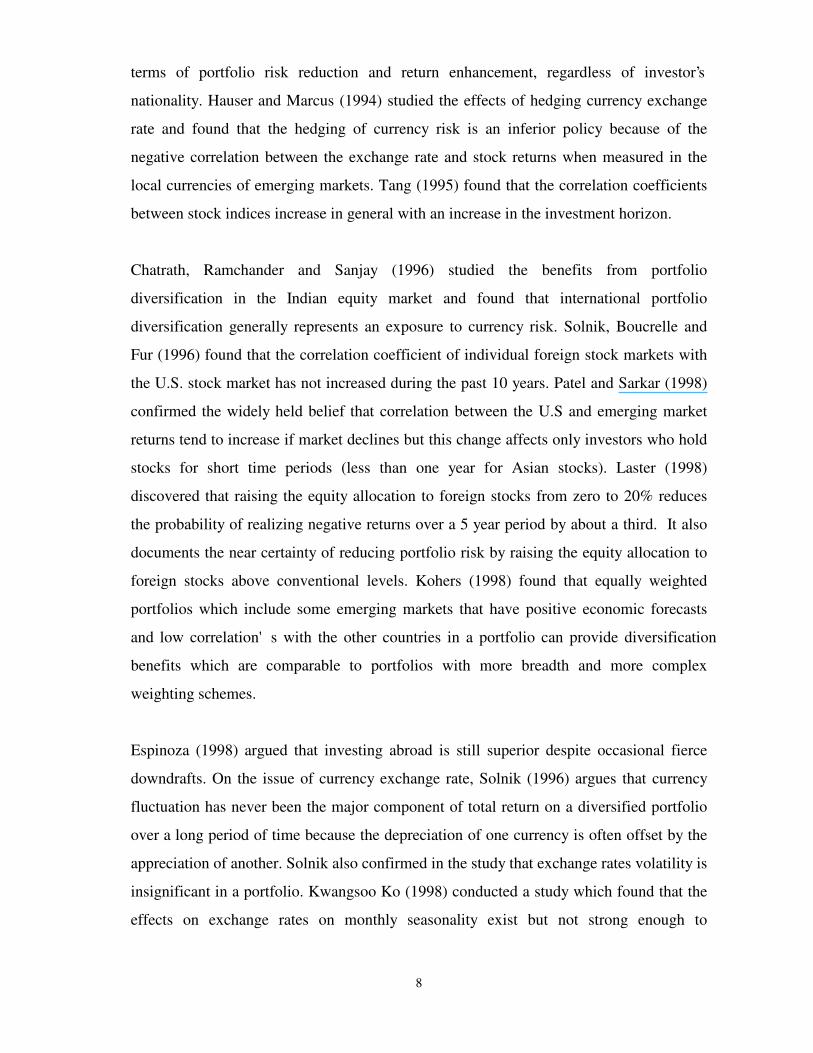
Chatrath, Ramchander and Sanjay (1996) studied the benefits from portfolio
diversification in the Indian equity market and found that international portfolio
diversification generally represents an exposure to currency risk. Solnik, Boucrelle and
Fur (1996) found that the correlation coefficient of individual foreign stock markets with
the U.S. stock market has not increased during the past 10 years. Patel and Sarkar (1998)
confirmed the widely held belief that correlation between the U.S and emerging market
returns tend to increase if market declines but this change affects only investors who hold
stocks for short time periods (less than one year for Asian stocks). Laster (1998)
discovered that raising the equity allocation to foreign stocks from zero to 20% reduces
the probability of realizing negative returns over a 5 year period by about a third. It also
documents the near certainty of reducing portfolio risk by raising the equity allocation to
foreign stocks above conventional levels. Kohers (1998) found that equally weighted
portfolios which include some emerging markets that have positive economic forecasts
and low correlation's with the other countries in a portfolio can provide diversification
benefits which are comparable to portfolios with more breadth and more complex
weighting schemes.
Espinoza (1998) argued that investing abroad is still superior despite occasional fierce
downdrafts. On the issue of currency exchange rate, Solnik (1996) argues that currency
fluctuation has never been the major component of total return on a diversified portfolio
over a long period of time because the depreciation of one currency is often offset by the
appreciation of another. Solnik also confirmed in the study that exchange rates volatility is
insignificant in a portfolio. Kwangsoo Ko (1998) conducted a study which found that the
effects on exchange rates on monthly seasonality exist but not strong enough to

9
significantly influence the international portfolio returns. Addae-Dapaah (1998) also
found that the impact of currency volatility on return and risk is statistically insignificant.
Bugar and Maurer (1998) found evidence which supports the benefits from international
diversification of stock portfolios from Hungarian as well as German point of view.
Garrett and Spyrou (1999) concluded that even though common trends are detected
among emerging countries, their impact is very limited and therefore emerging equity
markets still offer benefits in terms of diversification, even in the long run. Papadamou
and Tsopoglou (1999) study showed that the benefits of international portfolio
diversification are higher for investors with clear downward trend of domestic currency,
stock, and money markets (like Japanese) for any specified level of risk.
In a more recent study, Schroder (2002) found that investors could mostly increase the
performance of their portfolios by investing in international asset and holding only
domestic assets is only an inferior solution. A study by Li, Sarkar and Wang (2003) shows
that international diversification benefits remain substantial for U.S. equity investors even
when they are prohibited from short selling in emerging markets. Driessen and Laeven
(2003) found that the benefits of investing abroad are largest for investors in developing
countries. They also found that a large part of the diversification benefits disappears when
controlling for short-sales constraints and currency effects, even for developing countries.
III. DATA AND METHODOLOGY
DATA
In an international portfolio, the effects of currency exchange risks cannot be ignored. As
the study focuses on the perspective of Malaysian investors, the exchange rate risks
between Malaysia and other selected countries must be taken into account in calculating
the expected return and standard deviation of the portfolios. For this, the study used data
of weekly closing figures of 20 stock market indices (including KLSE Composite Index of
Kuala Lumpur Stock Exchange, Malaysia) which represent the most widely-used stock
market index in each country over a 17-year period from January 1987 to December 2003.

10
The 20 countries were selected based on geographical dispersion and availability of data.
A list of the selected countries, stock exchanges and stock market indices is presented in
Table 1 below.
TABLE 1
LIST OF SELECTED COUNTRIES, STOCK EXCHANGES AND STOCK MARKET INDICES
Countries Stock Exchanges Stock Market Indices1 Malaysia Kuala Lumpur Stock Exchange KLSE Composite Index2 Singapore Stock Exchange of Singapore OCBC Index3 Thailand Stock Exchange of Thailand SET Index4 Philippines Philippines Stock Exchange PSE Composite Index5 Indonesia Jakarta Stock Exchange JSX Composite Index6 Hong Kong Stock Exchange of Hong Kong Hang Seng Index7 Korea Korea Stock Exchange Korea Composite Price Index8 Taiwan Taiwan Stock Exchange Composite Stock Price Index9 China Shanghai Stock Exchange Shanghai All Share Index10 India Bombay Stock Exchange Bombay National Index11 Pakistan Karachi Stock Exchange KSE-100 Index12 Australia Australian Stock Exchange All Ordinaries Index13 New Zealand New Zealand Stock Exchange NZSE 40 Capital Index14 Japan Tokyo Stock Exchange Nikkei 22515 Canada Toronto Stock Exchange Toronto Composite Index16 United States New York Stock Exchange Dow Jones Industrial Average17 United Kingdom London Stock Exchange Financial Times 250 Index18 Germany Frankfurt Stock Exchange Dax Index19 France Paris Stock Exchange CAC 40 Index20 Switzerland Zurich Stock Exchange Credit Suisse Index
To consider the currency exchange rate in the study, a set of data on the currency
exchange rates between Malaysian Ringgit and currency of the selected countries over a
17-year period from January 1987 to December 2003 are gathered. A list of the countries
and currency exchange rate is presented in Table 2 below.
TABLE 2
LIST OF SELECTED COUNTRIES AND CURRENCY EXCHANGE RATES
Countries Currency Exchange Rates1 Singapore Ringgit Malaysia VS Singapore Dollar2 Thailand Ringgit Malaysia VS Thai Baht3 Philippines Ringgit Malaysia VS Philippines Peso4 Indonesia Ringgit Malaysia VS Indonesia Rupiah5 Hong Kong Ringgit Malaysia VS Hong Kong Dollar6 Korea Ringgit Malaysia VS Korean Won7 Taiwan Ringgit Malaysia VS Taiwan Dollar8 China Ringgit Malaysia VS Renmimbi9 India Ringgit Malaysia VS Indian Rupee
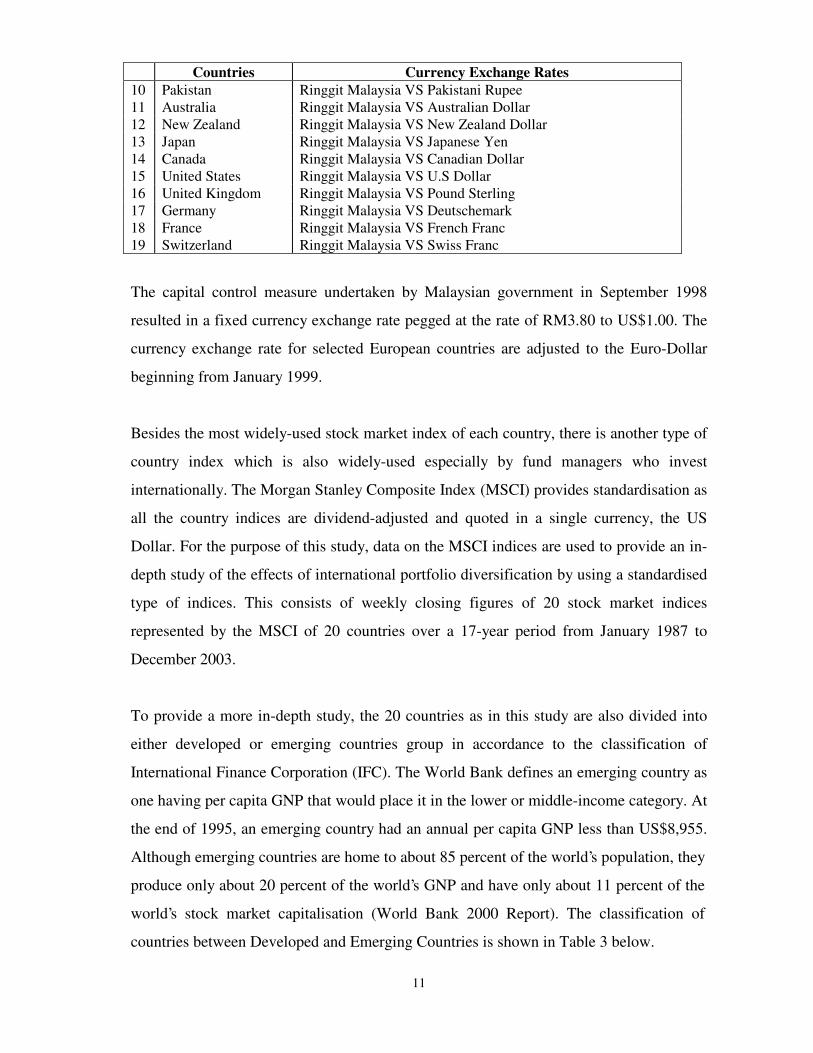
11
Countries Currency Exchange Rates10 Pakistan Ringgit Malaysia VS Pakistani Rupee11 Australia Ringgit Malaysia VS Australian Dollar12 New Zealand Ringgit Malaysia VS New Zealand Dollar13 Japan Ringgit Malaysia VS Japanese Yen14 Canada Ringgit Malaysia VS Canadian Dollar15 United States Ringgit Malaysia VS U.S Dollar16 United Kingdom Ringgit Malaysia VS Pound Sterling17 Germany Ringgit Malaysia VS Deutschemark18 France Ringgit Malaysia VS French Franc19 Switzerland Ringgit Malaysia VS Swiss Franc
The capital control measure undertaken by Malaysian government in September 1998
resulted in a fixed currency exchange rate pegged at the rate of RM3.80 to US$1.00. The
currency exchange rate for selected European countries are adjusted to the Euro-Dollar
beginning from January 1999.
Besides the most widely-used stock market index of each country, there is another type of
country index which is also widely-used especially by fund managers who invest
internationally. The Morgan Stanley Composite Index (MSCI) provides standardisation as
all the country indices are dividend-adjusted and quoted in a single currency, the US
Dollar. For the purpose of this study, data on the MSCI indices are used to provide an in-
depth study of the effects of international portfolio diversification by using a standardised
type of indices. This consists of weekly closing figures of 20 stock market indices
represented by the MSCI of 20 countries over a 17-year period from January 1987 to
December 2003.
To provide a more in-depth study, the 20 countries as in this study are also divided into
either developed or emerging countries group in accordance to the classification of
International Finance Corporation (IFC). The World Bank defines an emerging country as
one having per capita GNP that would place it in the lower or middle-income category. At
the end of 1995, an emerging country had an annual per capita GNP less than US$8,955.
Although emerging countries are home to about 85 percent of the world’s population, they
produce only about 20 percent of the world’s GNP and have only about 11 percent of the
world’s stock market capitalisation (World Bank 2000 Report). The classification of
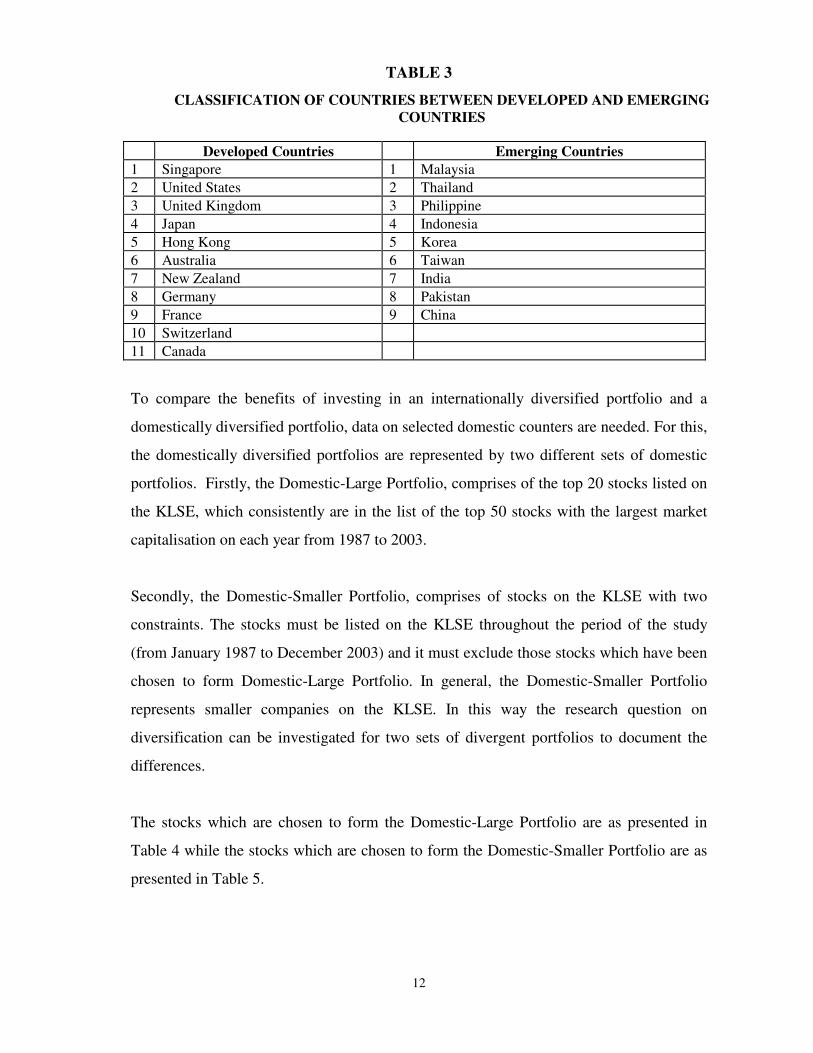
countries between Developed and Emerging Countries is shown in Table 3 below.
12
TABLE 3
CLASSIFICATION OF COUNTRIES BETWEEN DEVELOPED AND EMERGINGCOUNTRIES
Developed Countries Emerging Countries1 Singapore 1 Malaysia2 United States 2 Thailand3 United Kingdom 3 Philippine4 Japan 4 Indonesia5 Hong Kong 5 Korea6 Australia 6 Taiwan7 New Zealand 7 India8 Germany 8 Pakistan9 France 9 China10 Switzerland11 Canada
To compare the benefits of investing in an internationally diversified portfolio and a
domestically diversified portfolio, data on selected domestic counters are needed. For this,
the domestically diversified portfolios are represented by two different sets of domestic
portfolios. Firstly, the Domestic-Large Portfolio, comprises of the top 20 stocks listed on
the KLSE, which consistently are in the list of the top 50 stocks with the largest market
capitalisation on each year from 1987 to 2003.
Secondly, the Domestic-Smaller Portfolio, comprises of stocks on the KLSE with two
constraints. The stocks must be listed on the KLSE throughout the period of the study
(from January 1987 to December 2003) and it must exclude those stocks which have been
chosen to form Domestic-Large Portfolio. In general, the Domestic-Smaller Portfolio
represents smaller companies on the KLSE. In this way the research question on
diversification can be investigated for two sets of divergent portfolios to document the
differences.
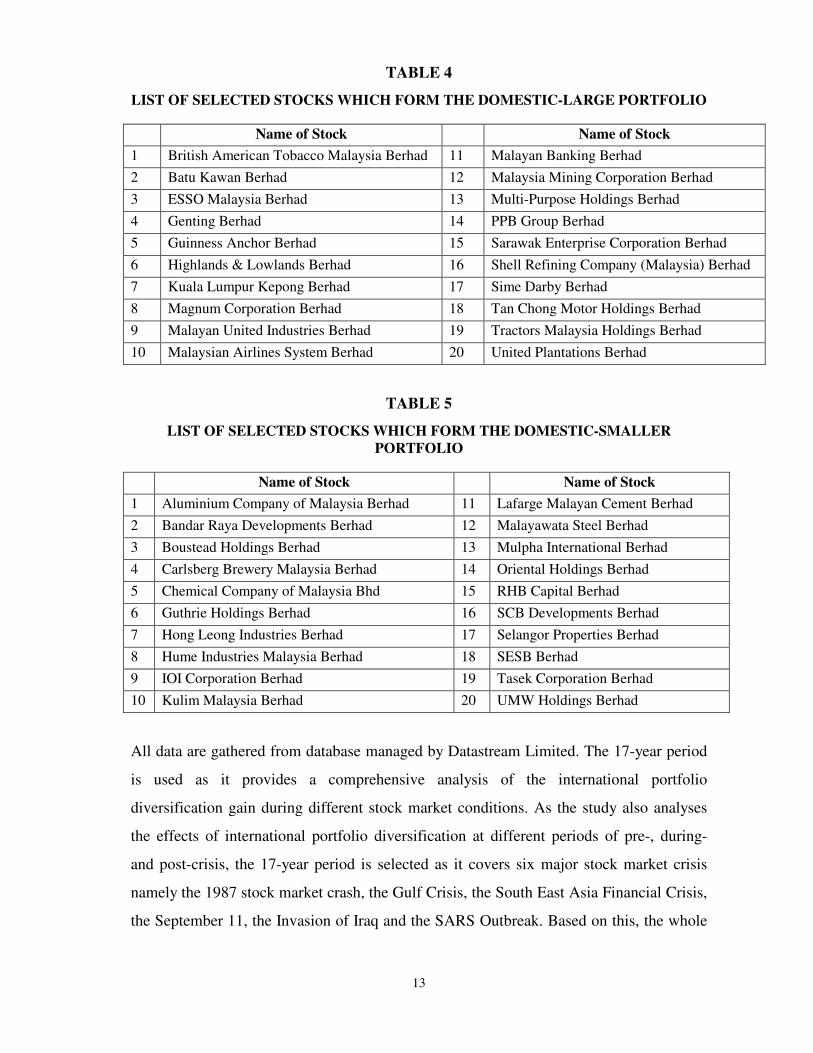
The stocks which are chosen to form the Domestic-Large Portfolio are as presented in
Table 4 while the stocks which are chosen to form the Domestic-Smaller Portfolio are as
presented in Table 5.
13
TABLE 4
LIST OF SELECTED STOCKS WHICH FORM THE DOMESTIC-LARGE PORTFOLIO
Name of Stock Name of Stock1 British American Tobacco Malaysia Berhad 11 Malayan Banking Berhad2 Batu Kawan Berhad 12 Malaysia Mining Corporation Berhad3 ESSO Malaysia Berhad 13 Multi-Purpose Holdings Berhad4 Genting Berhad 14 PPB Group Berhad5 Guinness Anchor Berhad 15 Sarawak Enterprise Corporation Berhad6 Highlands & Lowlands Berhad 16 Shell Refining Company (Malaysia) Berhad7 Kuala Lumpur Kepong Berhad 17 Sime Darby Berhad8 Magnum Corporation Berhad 18 Tan Chong Motor Holdings Berhad9 Malayan United Industries Berhad 19 Tractors Malaysia Holdings Berhad10 Malaysian Airlines System Berhad 20 United Plantations Berhad
TABLE 5
LIST OF SELECTED STOCKS WHICH FORM THE DOMESTIC-SMALLERPORTFOLIO
Name of Stock Name of Stock1 Aluminium Company of Malaysia Berhad 11 Lafarge Malayan Cement Berhad2 Bandar Raya Developments Berhad 12 Malayawata Steel Berhad3 Boustead Holdings Berhad 13 Mulpha International Berhad4 Carlsberg Brewery Malaysia Berhad 14 Oriental Holdings Berhad5 Chemical Company of Malaysia Bhd 15 RHB Capital Berhad6 Guthrie Holdings Berhad 16 SCB Developments Berhad7 Hong Leong Industries Berhad 17 Selangor Properties Berhad8 Hume Industries Malaysia Berhad 18 SESB Berhad9 IOI Corporation Berhad 19 Tasek Corporation Berhad10 Kulim Malaysia Berhad 20 UMW Holdings Berhad
All data are gathered from database managed by Datastream Limited. The 17-year period
is used as it provides a comprehensive analysis of the international portfolio
diversification gain during different stock market conditions. As the study also analyses
the effects of international portfolio diversification at different periods of pre-, during-
and post-crisis, the 17-year period is selected as it covers six major stock market crisis
namely the 1987 stock market crash, the Gulf Crisis, the South East Asia Financial Crisis,
the September 11, the Invasion of Iraq and the SARS Outbreak. Based on this, the whole

14
17-year period is then divided into additional thirteen sub-periods which are identified in
this study as in Table 6 below:
TABLE 6
PERIOD AND SUB-PERIODS OF STUDY
Period Name of Period Date Started and EndedPeriod 1 17 Years from January 1987 to
December 200302 January 1987 to 31 December 2003
Period 2 Pre Crash 1987 02 January 1987 to 09 October 1987Period 3 During Crash 1987 16 October 1987 to 25 December 1987Period 4 Post Crash 1987 01 January 1988 to 27 July 1990Period 5 During Gulf Crisis 03 August 1990 to 01 March 1991Period 6 Post Gulf Crisis 08 March 1991 to 27 June 1997Period 7 During Asian Financial Crisis 04 July 1997 to 25 December 1998Period 8 Post Asian Financial Crisis 01 January 1999 to 07 September 2001Period 9 During September 11 14 September 2001 to 28 December 2001Period 10 Post September 11 04 January 2002 to 14 March 2003Period 11 During Invasion of Iraq 21 March 2003 to 18 April 2003Period 12 Post Invasion of Iraq 25 April 2003 to 31 December 2003Period 13 During SARS Outbreak 14 March 2003 to 27 June 2003Period 14 Post SARS Outbreak 04 July 2003 to 31 December 2003
METHODOLOGY
The main concern of the study is to create a portfolio of stock market indices that
maximises return at a given level of risk, or minimises risk at a given level of return. The
expected return on the portfolio is given by the weighted average returns of the stock
market indices for each country. This is shown as below:
∑=
=n
iiRiWpR
1(2)
where
∑Wi = 1Rp = the expected return on portfolio pWi = the proportion of stock market indices of the country in the total
portfolioRi = the expected return on stock market index in = the number of stock market indices in the portfolio
15
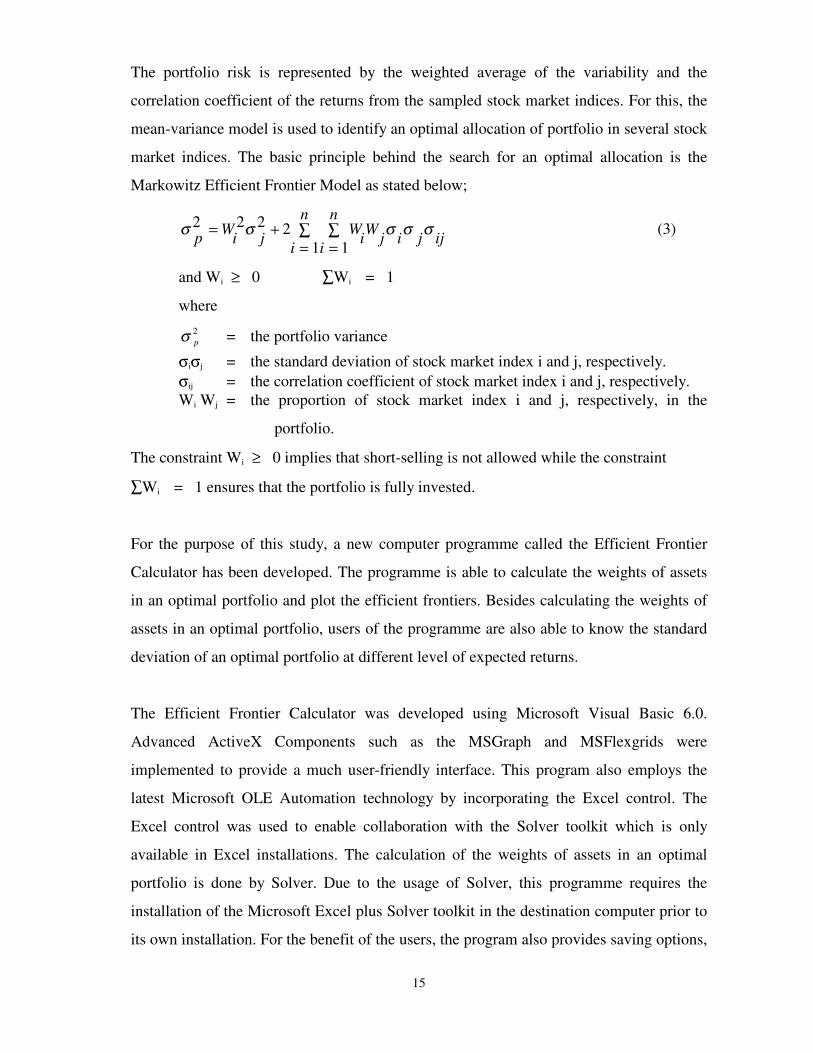
The portfolio risk is represented by the weighted average of the variability and the
correlation coefficient of the returns from the sampled stock market indices. For this, the
mean-variance model is used to identify an optimal allocation of portfolio in several stock
market indices. The basic principle behind the search for an optimal allocation is the
Markowitz Efficient Frontier Model as stated below;
σ σ σ σ σp Wi j Wii
n
i
nWj i j ij
2 2 2 211
= +=∑
=∑ (3)
and Wi ≥ 0 ∑Wi = 1
where
σ p2 = the portfolio variance
σiσj = the standard deviation of stock market index i and j, respectively.σij = the correlation coefficient of stock market index i and j, respectively.Wi Wj = the proportion of stock market index i and j, respectively, in the
portfolio.
The constraint Wi ≥ 0 implies that short-selling is not allowed while the constraint
∑Wi = 1 ensures that the portfolio is fully invested.
For the purpose of this study, a new computer programme called the Efficient Frontier
Calculator has been developed. The programme is able to calculate the weights of assets
in an optimal portfolio and plot the efficient frontiers. Besides calculating the weights of
assets in an optimal portfolio, users of the programme are also able to know the standard
deviation of an optimal portfolio at different level of expected returns.
The Efficient Frontier Calculator was developed using Microsoft Visual Basic 6.0.
Advanced ActiveX Components such as the MSGraph and MSFlexgrids were
implemented to provide a much user-friendly interface. This program also employs the
latest Microsoft OLE Automation technology by incorporating the Excel control. The
Excel control was used to enable collaboration with the Solver toolkit which is only
available in Excel installations. The calculation of the weights of assets in an optimal
portfolio is done by Solver. Due to the usage of Solver, this programme requires the
installation of the Microsoft Excel plus Solver toolkit in the destination computer prior to
its own installation. For the benefit of the users, the program also provides saving options,

16
printing options, customisation of solver variables and ‘cut & paste’ options. All these
options make operations much easier and efficient.
With the formation of an optimal portfolio using the Markowitz mean-variance model, the
study proceeded with several divisions of studies which are differentiated in data used in
the studies and the constraint pre-set on the minimum level of an asset. Results of these
studies are presented in the form of efficient frontiers for each study which are calculated
and graphically constructed using the Efficient Frontier Calculator programme. In each
graph, there are two sets of efficient frontier plotted to provide a visual evaluation of the
superiority of the efficient frontier sets.
In the universe of expected return and standard deviation, it is known and accepted that
the more ‘north-west’ a portfolio is, the more superior it is. This is easy to understand as a
portfolio, which is located more ‘north-west’ will have higher expected return and lower
standard deviation than a portfolio which is not as ‘north-west’ as the earlier portfolio.
The more ‘south-east’ a portfolio is in the universe of expected return and standard
deviation, the more inferior it is. Also, those that are below the frontier are inefficient
objects for investment choice. For a given subset of securities, no superior portfolio exists
above the frontier. These are standard results of the theory in practice.
On some results, visual evaluation is sufficient to tell which set of efficient frontier is
more superior. However, this is not the case for all results. In some other results, it is
difficult to tell the superiority level of each of the efficient frontier sets. It is even more
difficult for users to compare multiple or more than two sets of efficient frontier by just
visually evaluating them. As such, visual evaluation can turn into an art form rather than a
mathematical evaluation. An efficient frontier curve in the eye of an individual may be
different in the eye of another individual.
To provide an alternative to a visual evaluation of the superiority of efficient frontiers,
this study introduced the Efficient Frontier Index. It is a quantitative measure developed
to provide a guide to the superiority of efficient frontiers for ease of comparison. It

17
provides an indication of the superiority of a set of optimal portfolios by indicating a
value to an efficient frontier. The formulation of Efficient Frontier Index is as below:
−−
= ∑∑
==
n
i lowesti
lowestin
i i
i RRRIndexEF
11 σσσ(4)
WhereRI = all points of Expected Return on a set of an optimal portfolios.σi = all points of Standard Deviation on a set of an optimal portfolios.Rlowest = the lowest Expected Return at a point where the optimal Standard
Deviation is also the lowest.σlowest = the lowest point of Standard Deviation on a set of an optimal
portfolios.
A set of efficient frontier which has a higher value of EF Index can be regarded as more
superior than a set of efficient frontier with a lower value of EF Index.
IV. RESEARCH FINDINGS AND DISCUSSION
Chart 1 below provides a visual evaluation of the superiority of five different portfolios,
three of which represent internationally diversified portfolios and two of which represent
purely domestic portfolios. The efficient frontiers are plotted using the Efficient Frontier
Calculator program.
Chart 1 - Efficient Frontiers for MSCI International, MSCI Developed Countries, MSCI Emerging Countries, Domestic-Large and Domestic-Random Portfolios
- January 1987 to December 2003
0
0.1
0.2
0.3
0.4
0.5
0.6
0.7
0 1 2 3 4 5 6 7 8 9
Standard Deviation (X)
Exp
ecte
d R
etur
n (%
)
MSCI-International MSCI-Developed MSCI-EmergingDomestic-Large Domestic-Random

18
The internationally diversified portfolios are MSCI-International (comprises of all 20
selected MSCI countries indices), MSCI-Developed (comprises of 11 MSCI developed
countries indices) and MSCI-Emerging (comprises of 9 MSCI emerging countries
indices). The purely domestic portfolios are Domestic-Large (comprises of 20 large
market capitalisation stocks on the KLSE) and Domestic-Smaller (comprises of 20
smaller market capitalisation stocks on the KLSE). The data used are for the whole period
of study of 17 years from 1987 to 2003 (Period 1).
Efficient frontiers are also plotted for all the five portfolios for all the thirteen sub-periods
of the study using the Efficient Frontier Calculator program. Nonetheless, the charts are
not presented in this study as it is difficult to ascertain the ranking of superiority through
visual evaluation alone. From Chart 1, visually, it may be seen that MSCI-International
and Domestic-Smaller portfolios both are more superior than the other three portfolios as
both are quite clearly being positioned more ‘north-west’ in the universe of expected
return and standard deviation.
However, in many cases, there are crossing of efficient frontiers and the steepness of the
efficient frontiers also vary, which make it difficult to evaluate their relative superiority.
Thus, the study provides a quantitative measure of the superiority of efficient frontiers
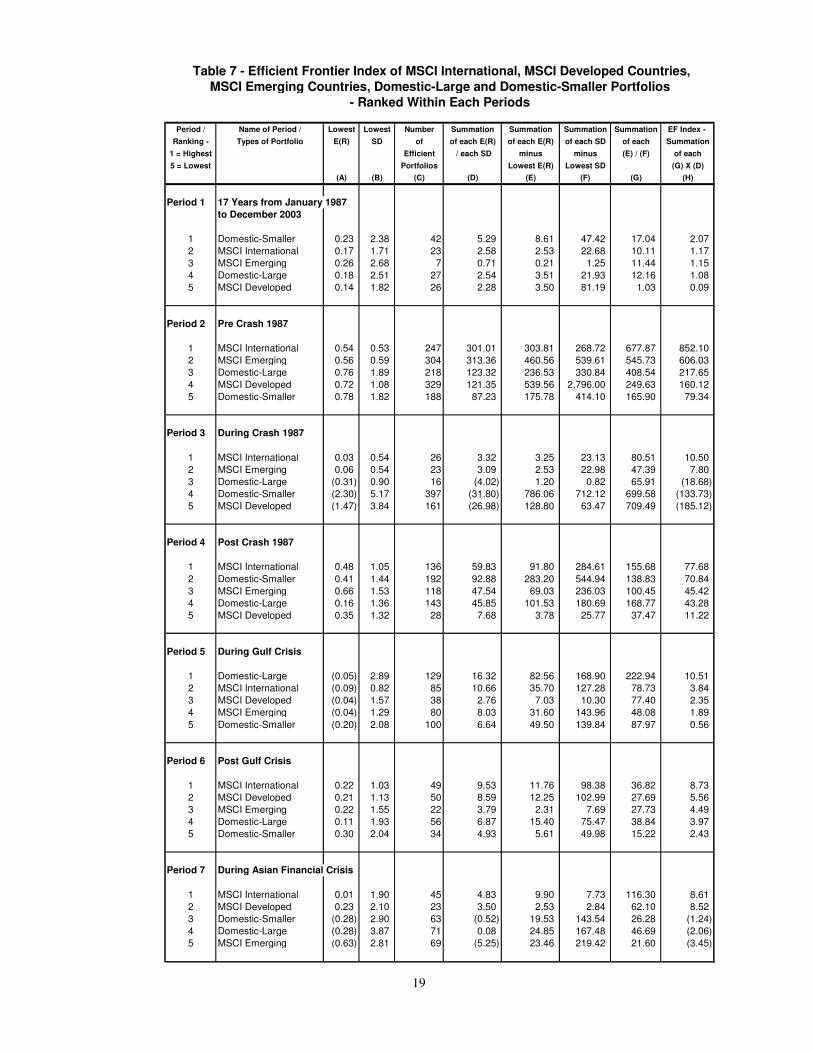
through the computation of Efficient Frontier Index which is presented in Table 7. With
the results for Efficient Frontier Index. This enables readers to make meaningful
comparisons among efficient frontiers either within the same period, between different
periods or any other comparisons.
19
Period / Name of Period / Lowest Lowest Number Summation Summation Summation Summation EF Index - Ranking - Types of Portfolio E(R) SD of of each E(R) of each E(R) of each SD of each Summation
1 = Highest Efficient / each SD minus minus (E) / (F) of each5 = Lowest Portfolios Lowest E(R) Lowest SD (G) X (D)
(A) (B) (C) (D) (E) (F) (G) (H)
Period 1 17 Years from January 1987to December 2003
1 Domestic-Smaller 0.23 2.38 42 5.29 8.61 47.42 17.04 2.07 2 MSCI International 0.17 1.71 23 2.58 2.53 22.68 10.11 1.17 3 MSCI Emerging 0.26 2.68 7 0.71 0.21 1.25 11.44 1.15 4 Domestic-Large 0.18 2.51 27 2.54 3.51 21.93 12.16 1.08 5 MSCI Developed 0.14 1.82 26 2.28 3.50 81.19 1.03 0.09
Period 2 Pre Crash 1987
1 MSCI International 0.54 0.53 247 301.01 303.81 268.72 677.87 852.10 2 MSCI Emerging 0.56 0.59 304 313.36 460.56 539.61 545.73 606.03 3 Domestic-Large 0.76 1.89 218 123.32 236.53 330.84 408.54 217.65 4 MSCI Developed 0.72 1.08 329 121.35 539.56 2,796.00 249.63 160.12 5 Domestic-Smaller 0.78 1.82 188 87.23 175.78 414.10 165.90 79.34
Period 3 During Crash 1987
1 MSCI International 0.03 0.54 26 3.32 3.25 23.13 80.51 10.50 2 MSCI Emerging 0.06 0.54 23 3.09 2.53 22.98 47.39 7.80 3 Domestic-Large (0.31) 0.90 16 (4.02) 1.20 0.82 65.91 (18.68) 4 Domestic-Smaller (2.30) 5.17 397 (31.80) 786.06 712.12 699.58 (133.73) 5 MSCI Developed (1.47) 3.84 161 (26.98) 128.80 63.47 709.49 (185.12)
Period 4 Post Crash 1987
1 MSCI International 0.48 1.05 136 59.83 91.80 284.61 155.68 77.68 2 Domestic-Smaller 0.41 1.44 192 92.88 283.20 544.94 138.83 70.84 3 MSCI Emerging 0.66 1.53 118 47.54 69.03 236.03 100.45 45.42 4 Domestic-Large 0.16 1.36 143 45.85 101.53 180.69 168.77 43.28 5 MSCI Developed 0.35 1.32 28 7.68 3.78 25.77 37.47 11.22
Period 5 During Gulf Crisis
1 Domestic-Large (0.05) 2.89 129 16.32 82.56 168.90 222.94 10.51 2 MSCI International (0.09) 0.82 85 10.66 35.70 127.28 78.73 3.84 3 MSCI Developed (0.04) 1.57 38 2.76 7.03 10.30 77.40 2.35 4 MSCI Emerging (0.04) 1.29 80 8.03 31.60 143.96 48.08 1.89 5 Domestic-Smaller (0.20) 2.08 100 6.64 49.50 139.84 87.97 0.56
Period 6 Post Gulf Crisis
1 MSCI International 0.22 1.03 49 9.53 11.76 98.38 36.82 8.73 2 MSCI Developed 0.21 1.13 50 8.59 12.25 102.99 27.69 5.56 3 MSCI Emerging 0.22 1.55 22 3.79 2.31 7.69 27.73 4.49 4 Domestic-Large 0.11 1.93 56 6.87 15.40 75.47 38.84 3.97 5 Domestic-Smaller 0.30 2.04 34 4.93 5.61 49.98 15.22 2.43
Period 7 During Asian Financial Crisis
1 MSCI International 0.01 1.90 45 4.83 9.90 7.73 116.30 8.61 2 MSCI Developed 0.23 2.10 23 3.50 2.53 2.84 62.10 8.52 3 Domestic-Smaller (0.28) 2.90 63 (0.52) 19.53 143.54 26.28 (1.24) 4 Domestic-Large (0.28) 3.87 71 0.08 24.85 167.48 46.69 (2.06) 5 MSCI Emerging (0.63) 2.81 69 (5.25) 23.46 219.42 21.60 (3.45)
Table 7 - Efficient Frontier Index of MSCI International, MSCI Developed Countries,MSCI Emerging Countries, Domestic-Large and Domestic-Smaller Portfolios
- Ranked Within Each Periods

20
Period Name of Period / Lowest Lowest Number Summation Summation Summation Summation EF Index - Types of Portfolio E(R) SD of of each E(R) of each E(R) of each SD of each Summation
Efficient / each SD minus minus (E) / (F) of eachPortfolios Lowest E(R) Lowest SD (G) X (D)
(A) (B) (C) (D) (E) (F) (G) (H)
Period 8 Post Asian Financial Crisis
1 Domestic-Smaller (0.06) 1.90 89 9.39 39.16 118.64 56.76 3.95 2 MSCI Developed 0.04 1.81 69 7.86 23.46 97.78 49.81 3.85 3 Domestic-Large (0.04) 2.41 57 4.32 15.96 29.33 89.95 2.91 4 MSCI International (0.09) 1.58 62 4.67 18.91 51.08 65.02 1.00 5 MSCI Emerging (0.11) 1.72 34 0.55 5.61 18.63 31.08 (0.77)
Period 9 During September 11
1 Domestic-Smaller 0.80 0.53 206 264.89 211.15 238.89 494.10 763.64 2 MSCI Emerging (0.02) 1.81 281 115.92 393.40 343.83 646.48 166.63 3 MSCI International (0.29) 1.52 206 61.69 211.15 125.29 576.25 87.18 4 Domestic-Large 0.27 0.55 171 88.61 145.35 318.03 125.82 69.03 5 MSCI Developed (0.38) 2.04 174 24.05 150.51 140.78 415.61 11.34
Period 10 Post September 11
1 Domestic-Smaller 0.03 1.03 115 26.60 65.55 166.38 112.02 18.72 2 MSCI Emerging (0.12) 1.48 126 23.20 78.75 113.33 205.88 16.43 3 MSCI International (0.16) 1.21 130 24.61 83.85 123.14 225.01 13.16 4 Domestic-Large 0.13 0.85 46 7.80 10.35 78.26 34.69 6.41 5 MSCI Developed (0.12) 1.60 43 1.83 9.03 9.94 85.45 (0.49)
Period 11 During Invasion of Iraq
1 Domestic-Smaller 0.74 0.20 338 1,569.61 569.53 137.55 3,015.29 14,647.05 2 MSCI International (0.39) 0.13 240 817.57 286.80 16.39 6,130.90 12,987.51 3 Domestic-Large 0.54 0.14 118 417.38 69.03 33.71 970.97 4,238.51 4 MSCI Developed (0.13) 0.37 252 397.94 316.26 147.16 3,792.63 4,205.70 5 MSCI Emerging (0.38) 0.20 339 602.44 572.91 158.80 3,395.14 3,239.35
Period 12 Post Invasion of Iraq
1 MSCI International 0.88 0.89 147 162.19 107.31 92.95 349.06 390.43 2 MSCI Emerging 1.09 1.34 126 120.51 78.75 59.45 332.61 311.36 3 Domestic-Large 0.30 0.73 91 56.48 40.95 42.70 160.01 91.72 4 MSCI Developed 0.85 1.07 49 38.23 11.76 18.65 82.08 67.16 5 Domestic-Smaller 0.38 0.94 84 40.43 129.78 292.39 44.25 22.99
Period 13 During SARS Outbreak
1 MSCI International 1.16 0.77 164 205.37 133.66 170.39 338.08 500.57 2 MSCI Emerging 0.92 1.19 188 174.16 175.78 163.65 541.44 489.78 3 Domestic-Smaller 0.80 0.63 202 212.21 203.01 286.91 353.90 445.23 4 Domestic-Large 0.58 0.43 121 141.51 72.60 110.83 283.21 401.19 5 MSCI Developed 1.27 0.99 98 88.79 47.53 122.90 113.04 133.01
Period 14 Post SARS Outbreak
1 MSCI Emerging 1.09 1.34 126 120.51 78.75 59.45 332.61 311.36 2 MSCI International 0.71 0.82 124 119.39 76.26 70.77 167.24 161.78 3 Domestic-Smaller 0.21 0.79 157 73.32 122.46 230.39 186.90 81.19 4 MSCI Developed 0.85 1.07 49 38.23 11.76 18.65 82.08 67.16 5 Domestic-Large 0.26 0.60 91 50.93 40.95 63.32 113.26 61.83
- Continuation- Ranked Within Each Periods
Table 7 - Efficient Frontier Index of MSCI International, MSCI Developed Countries,MSCI Emerging Countries, Domestic-Large and Domestic-Smaller Portfolios
21
For Period 1 (17-year period from 1987 to 2003), the results show that Domestic-Smaller
portfolio provides the highest Efficient Frontier Index of 2.07 points. This is followed by
MSCI International portfolio with an Efficient Frontier Index of 1.17 points, MSCI
Emerging portfolio of 1.15 points, Domestic-Large portfolio of 1.08 points and lastly
MSCI Developed Countries portfolio recorded the lowest Efficient Frontier Index of 0.09
points.
The results for Period 1 above show that, over a long term period of 17 years from 1987
to 2003, a portfolio of selected smaller market capitalisation stocks on the KLSE is the
most superior investment asset since it provides the highest risk-return trade-off among
portfolios of international assets and a portfolio of large market capitalisation stocks on
the KLSE. This is in contrast with many earlier studies which supported that in the longer
term, internationally diversified portfolio is always more superior than a purely domestic
portfolio. The results suggest that in the long term, there are smaller stocks on the KLSE
which are correlated at low values with each other as compared to assets of international
market portfolios or a portfolio of larger stocks on the KLSE.
The low correlation coefficients among the selected smaller market capitalisation stocks
on the KLSE are the basis for the superiority of the efficient frontiers constructed from the
Domestic-Smaller portfolio. This suggests that for a long-term investment period,
Malaysian investors are able to construct a superior efficient portfolio by selecting smaller
stocks on the KLSE which are lowly correlated to each other and combining this with a
portfolio consisting of international assets.
Although the Domestic-Smaller portfolio is the most superior portfolio in the long-term
period, this is not the case for all sub-periods. The results from Table 7 shows that for the
first three sub-periods, namely Pre-Crash 1987 (Period 2), During Crash 1987 (Period 3)
and Post-Crash 1987 (Period 4), the MSCI International portfolio is the superior portfolio
among the five portfolios. That is, the KLSE failed to yield normal returns in the period
and the two periods surrounding the crash. This makes the KLSE a very risky market,
particularly since it has a history of crashes. For both periods of Pre-Crash 1987 and
During Crash 1987, the second best portfolio is the MSCI Emerging market portfolio. In
22
fact, the Domestic-Smaller portfolio is the inferior portfolio for the period Pre-Crash
1987, suggesting that in the period of Pre-Crash 1987, the best investment strategy would
have been to invest in an internationally diversified portfolio.
It is interesting to note that for the period of During Crash 1987, only MSCI International
and MSCI Emerging portfolios provided positive figures in their Efficient Frontier Index.
The other three portfolios recorded negative Efficient Frontier Index for the period while
the MSCI Emerging Portfolio is the most inferior with an Efficient Frontier Index of –
185.12 points. This suggests that if a stock market crash almost similar to the 1987 stock
market crash happens again, the best investment strategy for Malaysian investors is to
have a position in international markets or emerging markets plus avoid investing in
markets of developed countries.
During the Gulf Crisis (Period 5), the results from Table 7 shows that Domestic-Large
portfolio is the most superior portfolio for the sub-period. All the internationally
diversified portfolios are ranked from the second spot to the fourth spot while the most
inferior portfolio for the period is the Domestic-Smaller portfolio. This shows that both
the domestic-based portfolios are very much diverse to each other that they can be as far
apart as being the most superior and most inferior portfolios in a crisis period. On the
other hand, during the Post-Gulf Crisis (Period 6), it is clearly evidenced that
internationally diversified portfolios are more superior to domestic-based portfolios. The
top three portfolios during this period are the internationally diversified portfolios,
followed by the domestic-based portfolios.
As stocks markets in emerging Asian countries suffered significantly during the Asian
Financial Crisis (Period 7), it is not surprising that the results from Table 7 for that period
shows that the MSCI International and MSCI Developed portfolios are the superior ones:
recall similar results for the 1987 crash. It is also not surprising to note that the MSCI
Emerging portfolio and both the domestic-based portfolios recorded negative Efficient
Frontier Index values for the period. As the KLSE recovered from the Asian Financial
Crisis, the results for the period of Post Asian Financial Crisis (Period 8) show that the
Domestic-Smaller portfolio is the most superior portfolio for Malaysian investors during

23
the period. Nonetheless, the results also show that some Asian stock markets took a
longer time to recover as the MSCI Emerging portfolio still recorded a negative Efficient
Frontier Index of –0.77 points for the period.
The event of September 11 (Period 9) affected stocks markets globally but in general,
those in developed countries were badly affected than those in emerging countries. As
such, Domestic-Smaller portfolio is the most superior portfolio as opposed to MSCI
Developed portfolio which is the most inferior portfolio for the period. MSCI Emerging
portfolio is at the second spot, followed by MSCI International portfolio and Domestic-
Large portfolio. Interestingly, the rankings of all the five portfolios for the periods of
During September 11 (Period 9) and Post September 11 (Period 10) are exactly the same,
suggesting that there is no significant different on the superiority of the portfolios, during
and post September 11. That means that crises in developed markets make domestic
positioning more valuable.
The biggest surprise from the results presented in Table 7 is for Period 11 (During
Invasion of Iraq). Contrary to the results for Period 5 (During Gulf Crisis) where all the
portfolios produced low Efficient Frontier Index, the Efficient Frontier Index of the
portfolios in the period of During Invasion of Iraq are the highest for all the five portfolios
among all the period and sub-periods. The Domestic-Smaller portfolio for period 11
(During Invasion of Iraq) recorded the highest Efficient Frontier Index among the
portfolios for all periods and sub-periods at 14,647.05 points.
If the Domestic-Smaller portfolio is the most superior portfolio in the period During
Invasion of Iraq, it is the opposite in the period of Post Invasion of Iraq (Period 12) as it
turns to be the most inferior portfolio for the period. In other words, the world markets
recovered, and performed well above, and a position in such markets would have been
superior to one in domestic market. MSCI International becomes the most superior
portfolio for the period although its Efficient Frontier Index for the period of 390.43 is
very much lower than any of the portfolios in the period of During Invasion of Iraq.

24
In the period of During SARS Outbreak (Period 13), MSCI International portfolio turns
out to be the most superior portfolio among the five portfolios, followed by MSCI
Emerging Countries, Domestic-Smaller, Domestic-Large and lastly the MSCI Developed
Countries portfolio as the most inferior portfolio for the period. The sequence does not
change much for the period of Post SARS Outbreak (Period 14) where MSCI Emerging
Countries portfolio becomes the portfolio with the highest Efficient Frontier Index for the
period, followed by MSCI International, Domestic-Smaller, MSCI Developed Countries
and lastly the Domestic-Large portfolio.
The Efficient Frontier Calculator is relatively flexible that it is able to produce results
with constraint imposed on the weight of individual assets in the portfolio. For the
purpose of this study, efficient frontiers of MSCI International are produced with variable
minimum weight constraint imposed on Malaysia, one of the countries in the MSCI
International portfolio. A total of ten different efficient frontiers are formed with the
variable minimum weight constraint imposed on Malaysia ranging from 0 percent to 10
percent with an interval of 10 percent. This is presented in Chart 2 as below:
Chart 2 - Efficient Frontiers for MSCI International - 17 Years from January 1987 to December 2003 - with Variable Minimum Weightage Constraint for Malaysia Ranging from 0% to 90%
0.15
0.2
0.25
0.3
0.35
0.4
0 1 2 3 4 5 6 7
Standard Deviation (X)
Exp
ecte
d R
etur
n (%
)
0% 10% 20% 30% 40% 50% 60% 70% 80% 90%

25
The figure shows that unconstrained efficient frontier is more superior to constrained
efficient frontiers. As the level of minimum weight constraint increases, the efficient
frontiers formed become more and more inferior (moving towards ‘south-east’). In the
financial market operations, many restrictions are imposed on fund managers and one of
them is to have a limit on the maximum exposure in a single asset to ensure safety to
invested funds. The result of this analysis shows that any constraint imposed on a
portfolio will only result in a more inferior efficient frontier as compared to those with no
restriction(s).
There are several factors that affect the valuation of Efficient Frontier Index. First, the
position of each point of the optimal portfolios is plotted in the universe of expected
return and standard deviation. An optimal portfolio which is located in a position where it
has a high expected return at a low standard deviation will have a more positive impact on
the level of Efficient Frontier Index than an optimal portfolio which is located in a
position where it has a lower expected return at a higher standard deviation. The positions
of each expected return and each standard deviation will also determine the ‘steepness’ of
the efficient frontier. As for the Domestic-Smaller portfolio in the period of During
Invasion of Iraq (Period 11), its lowest expected return (Column A in Table 7) is as high
as 0.74 percent while its lowest standard deviation (Column B in Table 7) is as low as
0.20. Compared with the portfolio which recorded the lowest Efficient Frontier Index in
Table 7, the MSCI Developed Countries portfolio for Period 3 (during Crash 1987), its
lowest expected return is as low as –1.47 percent while its lowest standard deviation is as
high as 3.84.
Second, the summation of each expected return of the optimal portfolios divided by each
of the standard deviation of the optimal portfolios (Column D in Table 7) may also
provide an indication of the superiority of an efficient frontier. Table 7 shows that the
summation of each expected return of the optimal portfolios divided by each of the
standard deviation of the optimal portfolios for Domestic-Smaller portfolio in Period 11
was the highest among all the results at 1,569.61 while at the same time, those of the
MSCI Developed Countries portfolio for Period 3 was the second lowest among all the
results at –26.98.
26
Third, the superiority of an efficient frontier may also be affected by the number of
optimal portfolios which form the efficient frontier (Column C of Table 7). The number
of optimal portfolios which form the efficient frontier of the Domestic-Smaller portfolio
for Period 11 was the second highest at 338 optimal portfolios as compared to only 161
optimal portfolios which form the efficient frontier of the MSCI Developed Countries
portfolio for Period 3.
V. CONCLUSION
The results from Table 7 show mixed outcomes on the most superior efficient frontier for
all the periods and sub-periods. Internationally diversified portfolios are the most superior
portfolios in eight of the sub-periods while domestic-based portfolios are most superior
portfolios in six of the period/sub-periods including the main period of 17-years from
January 1987 to December 2003. It is interesting to note that the results also show a
general change in the superiority of portfolios over time during the period of the study.
From January 1987 to December 1998 (from Period 2 to Period 7), in general
internationally diversified portfolios are more superior to domestic-based portfolios.
However, this seems to change after the Asian Financial Crisis as from this period until
the period of Invasion of Iraq (from January 1999 to April 2003), in general, domestic-
based portfolios are superior to internationally diversified portfolios.
Undeniably, the findings are not in full support of international portfolio diversification to
Malaysian investors when the Efficient Frontier Index of domestic-based portfolios
proved to be more superior to those of internationally diversified portfolios under certain
market conditions. The results proved that an internationally diversified portfolio need not
necessarily be more superior to one domestic-based portfolio in any stock market or
economic conditions. In some crisis periods and even non-crisis periods, domestic-based
portfolios proved to be superior to internationally diversified portfolios.
The study also found a general change in the superiority of portfolios over time during the
period of the study. From January 1987 to December 1998 (from Period 2 to Period 7), in
general internationally diversified portfolios are superior to a domestic-based portfolios.

27
However, this seems to change after the Asian Financial Crisis as from this period until
the period of Invasion of Iraq (from January 1999 to April 2003), in general, domestic-
based portfolios are superior to internationally diversified portfolios.
The study also analyses the effect of imposing investment restrictions to a portfolio. The
results show that as the minimum weight constraint for Malaysia increases, the value of
Efficient Frontier Index of the portfolio decreases. This means that there is an inverse
relationship between level of investment constraints or restrictions imposed on a portfolio
and the superiority of the portfolio. Efficient frontiers of a portfolio with no or less
constraints or restrictions will always be more ‘north-east’ than efficient frontiers of a
portfolio with constraints or restrictions.
Given the findings which are not in full support of international portfolio diversification,
the basic question on practical point of view is ‘can Malaysian investors form a domestic-
based portfolio which is superior to an internationally diversified portfolio?’ The study
shows that it depends on two main aspects: the selection of domestic stocks in the
portfolio and the stock market or economic condition of the investment period. On the
first aspect, as evidenced in this study, it is possible to construct a purely domestic
portfolio which is superior to an internationally diversified portfolio under conditions of
strengthening currency, worsening market conditions and away from large market
capitalisation stocks. The main determinant for the superiority of the domestic-based
portfolio is the correlation among stocks in the portfolio.
Naturally, the lower the correlation among stocks in the portfolio, the more superior the
portfolio is. Contrary to the general belief, the results show that the average correlation
coefficients of domestic-based portfolios are generally lower than those of internationally
diversified portfolios. This means that the selected domestic stocks are less correlated to
each other as compared to equity markets of the selected countries. Furthermore, the
results also show that selected smaller market capitalisation stocks on the KLSE are less
correlated with each other compared to large market capitalisation stocks on the KLSE.
.

28
On the second aspect, the results show that the other determinant of whether a domestic-
based portfolio is superior to an internationally diversified portfolio is the stocks market
or economic condition(s) of the investment period. In this aspect, the results are not very
consistent. For the crisis periods, a domestic-based portfolio is the superior portfolio
during the Gulf Crisis, September 11 and Invasion of Iraq while an internationally
diversified portfolio is the most superior portfolio during the Stock Market Crash 1987,
the Asian Financial Crisis and the SARS Outbreak.
For the non-crisis periods, a domestic-based portfolio is the most superior portfolio during
the period of Post Asian Financial Crisis and Post September 11 and while an
internationally diversified portfolio is the most superior portfolio during the period of Pre
Stock Market Crash 1987, Post Stock Market Crash 1987, Post Gulf Crisis, Post Invasion
of Iraq and Post SARS Outbreak. Malaysian investors thus may construct a superior
portfolio by matching the assets which are lowly correlated to each other during certain
stock market or economic condition(s) rather than generalise the stock selection
throughout the investment periods.
The findings above may be summarised as suggesting that it is feasible for Malaysian
investors to construct a purely domestic portfolio which is more superior to an
internationally diversified portfolio under certain conditions peculiar to this market. To do
this, investors must select stocks in the KLSE which are lowly correlated to each other
during certain stock market or economic conditions. The study shows that the KLSE is
not short of stocks which are lowly correlated to each other. In the context of portfolio
diversification, this is good. If the stocks on the KLSE are highly correlated to each other,
it will be difficult to construct a portfolio which is superior for risk reduction purposes.
.

29
REFERENCES
Addae-Dapaah, Kwame; Young, Goh Li Fall 1998 Currency risk and office investment inAsia Pacific Real Estate Finance Vol: 15 Iss: 3 p: 67-85.
Bailey, Warren; Stulz, Rene M. 1990. Benefits of International Diversification: The Caseof Pacific Basin Stock Markets. Journal of Portfolio Management Vol: 16 Iss: 4 Summerpp 57-61.
Bugar, Gyongyi; Maurer, Raimond. 1998. International Portfolio Diversification forEuropean Countries: The Viewpoint of Hungarian and German Investors, ResearchPaper, Faculty of Business and Economics, Janus Pannonius University of Pecs & Facultyof Business Administration, University of Mannheim.
Chatrath, Arjun; Ramchander, Sanjay; Song, Frank. 1996. Benefits from PortfolioDiversification into the Indian Equity Market. American Business Review Vol: 14 Iss: 1Jan pp 1-10.
Driessen, Joost; Laeven, Luc. 2003. International Portfolio Diversification Benefits:Cross-Country Evidence from a Local Perspective, Working Paper, The World BankConference, October.
Eaker, Mark R; Grant, Dwight M; Berry, Michael; Woodard, Nelson. 1991. Investment inForeign Equities: Diversification, Hedging and Risk. Journal of Multinational FinancialManagement; 1(1) pp 1-21.
Espinoza, Galina; Sivy, Michael Mar 1998 Does it really make any sense to invest inforeign stocks? Money Vol: 27 Iss: 3 p: A6-A7.
Eun, Cheol S.; Resnick, Bruce G. 1988. Exchange Rate Uncertainty, Forward Contractsand International Portfolio Selection. Journal of Finance, Iss: 43 March pp 197-215.
Fosberg, Richard H; Madura, Jeff. 1991. Risk Reduction Benefits from InternationalDiversification: A Reassessment. Journal of Multinational Financial Management; 1(1) pp 35-42.
Garrett, Ian; Spyrou, Spyros. 1999. Common Stochastic Trends in Emerging EquityMarkets, The Manchester School Working Paper Vol: 67 (6), The Manchester School, pp649-660.
Grubel, H. 1968. Internationally Diversified Portfolios: Welfare Gains and CapitalFlows. American Economic Review, Iss: 58 pp 1299-1314.
Hauser, Shmuel; Marcus Matiyahu; Yaari, Uzi. 1994. Investing in Emerging StockMarkets: Is It Worthwhile Hedging Foreign Exchange Risk? Journal of PortfolioManagement; 20(3), Spring pp 76-81.
30
Hunter, John E; Coggin, T. Daniel. 1990. An Analysis of the Diversification Benefit fromInternational Equity Investment. Journal of Portfolio Management Vol: 17 Iss: 1 Fall pp33-36.
Kaplanis, E.; Schaefer, S. 1991. Exchange Risk and International Diversification in Bondand Equity Prices. Working Paper, London Business School.
Kohers, Theodor; Kohers, Gerald; Pandey, Vivek Oct 1998 The contribution of emergingmarkets in international diversification strategies Applied Financial Economics Vol: 8Iss: 5: p: 445-454.
Kwangsoo Ko, March 1998, Strategic International Diversification and MonthlySeasonality, Journal of Business Finance and Accounting, p: 203-223.
Laster, David S Fall 1998 Measuring gains from international equity diversification: Thebootstrap approach Journal of Investing Vol: 7 Iss: 3 p: 52-60.
Le, S. V. 1991. International Investment Diversification Before and After the October 19,1987 Stock Market Crisis. Journal of Business Research Vol: 22 Iss: 4 Jun pp 305-310.
Li, Kai; Sarkar, Asani; Wang, Zhenyu. 2003. Diversification Benefits of EmergingMarkets Subject to Portfolio Constraints, Journal of Empirical Finance, Vol: 10 (1-2), pp57-80.
Madura, Jeff; Soenen, Luc. 1992. Benefits from International Diversification: AcrossTime and Country Perspectives. Managerial Finance Vol: 18 Iss: 2 pp 1-14.
Markowitz, H. 1952. Portfolio Selection. Journal of Finance, Iss: 7, pp 77-91.
Markowitz, H; Portfolio Selection, Journal of Finance, March 1952.
Markowitz, Harry M. 1991. Foundations of Portfolio Theory, Journal of Finance, June pp469-472.
Odier, Patrick; Solnik, Bruno. 1993. Lessons for International Asset Allocation. FinancialAnalysts.Journal Vol: 49 Iss: 2 Mar/Apr , pp 63-77.
Papadamou, Stephanos; Tsopoglou, Stavros. 1999. Exploring the Benefits of InternationalDiversification and Currency Hedging for International Fund Portfolios, Working Paper,University of Macedonia.
Patel, Sandeep A; Sarkar, Asani Nov/Dec 1998 Crises in developed and emerging stockmarkets Financial Analysts Journal Vol: 54 Iss: 6 p: 50-61.
Price, Margaret; Ring, Trudy 1990. Foreign Asset Boost Urged. Pensions & InvestmentsVol: 18 Iss: 26 Dec 10, pp 47.
31
Schröder, Michael. 2002. A Note on Benefits of Diversification and Integration forInternational Equity and Bond Portfolios, Presented Paper, Centre for EuropeanEconomic Research, European Financial Services Roundtable, Brussels.
Sharpe, W. F. 1972. Diversification and Portfolio Risk. Financial Analysts Journal, Iss:Jan/Feb pp 74-79.
Solnik, B., Summer 1998, Global Asset Management, The Journal of PortfolioManagement, p: 43-51.
Solnik, Bruno. 1991. International Investments, Reading, Mass.: Addison-Wesley Pub.Co.
Solnik, Bruno.1974. Why Not Diversify Internationally Rather Than Domestically?Financial Analysts Journal Date: July/Aug, pp 48-54.
Solnik, Bruno; Boucrelle, Cyril; and Fur, Yann Le. 1996. International MarketCorrelation and Volatility. Financial Analysts Journal, Iss: Sep/Oct pp 17-34.
Tang, Gordon Y N. 1995. Effect of investment horizon on international portfoliodiversification International. Journal of Management Vol: 12 Iss: 2, Jun , pp 240-246.
Tobin, J. 1958. Liquidity Preference as Behaviour towards Risk. Review of EconomicStudies, Iss: 26 , pp 65-86.
Wignall, Christian; Shute, Don. 1991. Portfolio Guidelines for Investing Internationally.Journal of Financial Planning Vol: 4 Iss: 2, Apr , pp 74-78.
World Bank Publications. 2000. Classification of Economies, The World Bank Group,http://www.worldbank.org/data/databytopic/class.htm