Adani Listed Portfolio
49
Adani Listed Portfolio Q1 FY22 Results – Compendium
-
Upload
khangminh22 -
Category
Documents
-
view
3 -
download
0
Transcript of Adani Listed Portfolio

Adani Listed Portfolio
Q1 FY22
Results – Compendium

2
1 . As on July 30th , 2021, USD/INR – 74.4 | Note - Percentages denote promoter holding and Light blue color represent public traded listed verticals 2. NQXT – North Queensland Export Terminal | 3. ATGL – Adani Total Gas Ltd, JV with Total Energies | 4. Data center, JV with EdgeConnex
Transport & LogisticsPortfolio
APSEZPort & Logistics
100% 57.7%63.8% 75%
75%
100% 75% 37.4%
ATLT&D
APL IPP
NQXT2AGEL
Renewables
ATGL3
Gas DisCom
Energy & UtilityPortfolio
SRCPLRail
AELIncubator
~USD 89 bn1
Combined Market Cap
AAHLAirports
100% 100%100% 50%
AWLWater
ARTLRoads
AdaniConneX4
Data Centre
Opportunity identification, development and beneficiation is intrinsic to diversification and growth of the group.
Adani
• Marked shift from B2B to B2C businesses–
• ATGL – Gas distribution network to serve key geographies across India
• AEML – Electricity distribution network that powers the financial capital of India
• Adani Airports – To operate, manage and develop eight airports in the country
• Locked in Growth –
• Transport & Logistics -Airports and Roads
• Energy & Utility –Water and Data Centre
Adani Group: A world class infrastructure & utility portfolio

25%
132%
Industry AGEL
4%
12%
Industry APSEZ
30%
45%
Industry AGL
7%
20%
Industry ATL
3
Port Cargo Throughput (MMT) Renewable Capacity (GW) Transmission Network (ckm) CGD7 (GAs8 covered)
Adani Adani
2016 320,000 ckm 6,950 ckm
2021 441,821 ckm 18,801 ckm
2014 972 MMT 113 MMT
2021 1,246 MMT 247 MMT
2016 46 GW 0.3 GW
2021 140 GW9 19.3 GW6
2015 62 GAs 6 GAs
2021 228 GAs 38 GAs
Transformative model driving scale, growth and free cashflow
3x 5x 3x 1.5x
Note: 1 Data for FY21; 2 Margin for ports business only, Excludes forex gains/losses; 3 EBITDA = PBT + Depreciation + Net Finance Costs – Other Income; 4 EBITDA Margin represents EBITDA earned from power supply 5 . Operating EBITDA margin of transmission business only, does not include distribution business. 6. Contracted & awarded capacity 7. CGD – City Gas distribution 8. GAs - Geographical Areas - Including JV | Industry data is from market intelligence 9. This includes 17GW of renewable capacity where PPA has been signed and the capacity is under various stages of implementation and 29GW of capacity where PPA is yet to be signed’
Highest Margin among
Peers globally
EBITDA margin: 70%1,2
Next best peer margin: 55%
Worlds largest
developer
EBITDA margin: 91%1,4
Among the best in Industry
APSEZ ATLAGEL ATGL
Highest availability
among Peers
EBITDA margin: 92%1,3,5
Next best peer margin: 89%
India’s Largest private CGD
business
EBITDA margin: 41%1
Among the best in industry
Adani Group: Decades long track record of industry best growth rates across sectors

55%31%
14% 30%
20%
50%
4
Adani Group: Repeatable, robust & proven transformative model of investmentA
cti
vit
yP
erf
orm
an
ce
OperationsDevelopment Post Operations
• Analysis & market intelligence
• Viability analysis
• Strategic value
• Site acquisition
• Concessions & regulatory agreements
• Investment case development
• Engineering & design
• Sourcing & quality levels
• Equity & debt funding atproject
• Life cycleO&M planning
• Asset Management plan
• Redesigning capital structure of assets
• Operational phase funding consistent with asset life
Site Development Construction Operation Capital MgmtOrigination
Issuance of 20 & 10 year dual tranche bond of USD 750 mn - APSEZ the only infrastructure company to do so
India’s Largest Commercial Port (at Mundra)
Longest Private HVDC Line in Asia(Mundra - Mohindergarh)
648 MW Ultra Mega Solar Power Plant(at Kamuthi, TamilNadu)
Highest Margin among Peers
Highest line availability
Constructed and Commissioned in nine months
March 2016 March 2021
Phase
PSU Pvt. Banks Bonds
Energy Network Operation Center (ENOC)
Revolving project finance facility of $1.35Bn at AGEL – fully funded project pipeline
Debt structure moving from PSU’s banks to Bonds
Centralized continuous monitoring of plants across India on a single cloud based platform
First ever GMTN1 of USD 2Bn by an energy utility player in India - an SLB2 in line with COP26 goals - at AEML
1. GMTN – Global Medium Term Notes 2. SLB – Sustainability Linked Bonds

5
Adani Listed Portfolio : Highlights of Q1 FY22 Results
Robust performance across all businesses led to significant growth in EBITDA and return to shareholders
Operations Strategy Finance
• APSEZ - As part of east coast westcoast parity Krishnapatnam acquisitioncompleted. Working towards gaining100% stake at Gangavaram Port.
• AEL - Currently incubating data center& road asset business and hosting thelargest airport platform.
• AGEL - Continued focus on capacityexpansion. Acquiring SB Energy’s 5 GWIndia renewable portfolio for fasttracking 2025 guidance of 25 GW.
• ATL - To capitalize on locked-in growthwith project pipeline of Rs. 185 bn intransmission segment. AEMLpositioned as reliable, affordable andsustainable service provider
• APSEZ continues its dominant positionwith market share increasing to 29% ofall India cargo volume.
• In AEL, developed businessesoutperformed, new businesses (airport,roads, and data center) on fast trackmode.
• At AGEL, higher capacity results insignificant increase sale of energy (up48%)
• ATL operationalized 207 ckt kms lineduring the quarter. Currently totalnetwork of 18,801 ckm.
• In ATGL, CNG volume (up 180%) andPNG volume (up 80%) drive growth
• At APL, Unit sales at 16.2 BU, a 28%growth.
(YoY)
• EBITDA of listed portfolio grew by48%
• All listed entities reported positivePAT with 98%# growth.
• APSEZ became the first Indianinfrastructure company to haveraised a dual-tranche of 10.5-year and20-year unsecured bonds for USD750 mn at attractive fixed coupon of3.8% and 5% respectively,
• First ever GMTN1 of USD 2bn by anenergy utility player in India’s – anSLB2 in line with COP26 goals atAEML
*EBITDA includes other income#Excludes APL which had a negative PAT in Q1 FY211 GMTN – Global Medium Term Notes2 SLB – Sustainability Lined Bonds

1,895
3,001
0
500
1,000
1,500
2,000
2,500
3,000
3,500
Q1 FY21 Q1 FY22
301
948
0
100
200
300
400
500
600
700
800
900
1,000
Q1 FY21 Q1 FY22
3,798
4,895
0
1,000
2,000
3,000
4,000
5,000
6,000
Q1 FY21 Q1 FY22
6
Adani Listed Portfolio : EBITDA from Transport, Incubation and Utilities Rs. In cr.
Transport & Logistics Platform
Note – Transport and Logistics platform = APSEZ | Utility platform includes EBITDA of ATL, ATGL, APL and AGEL | Carbon Sinks includes EBITDA of AGEL and solar mfg.
Incubator (AEL) Utility Platform
29%215%
58%
Performance of Utility Platform
• Growing at exceptional rate (29%); and
• Within Utility platform Deep Green (Carbon Sinks) growing at 47%.
Incubation Portfolio
• Four operating airports, will expand to eight catering to 300mn + consumer base
• Developing Roads (toll-roads) and Data Centre portfolio ( construction underway)

1,895
3,001
Q1 FY21 Q1 FY22
680
892
Q1 FY21 Q1 FY22
1,491 1,496
Q1 FY21 Q1 FY22
86
215
Q1 FY21 Q1 FY22
1,541
2,292
Q1 FY21 Q1 FY22
301
948
Q1 FY21 Q1 FY22
7
Adani Listed Portfolio : Significant EBITDA growth in Q1 FY22
APSEZ^ APL
ATGLAGELATL
Strong growth in combined EBITDA of listed portfolio by 48% in Q1 FY22 demonstrates the utility nature of businesses
(Rs. In cr.)
AEL
215%58%
49%
0.3%
31%
150%
*EBITDA includes other income^APSEZ EBITDA for Q1 FY21 excludes forex gain/loss and one time donation of Rs.80 cr.
• AEL EBIDTA grew due to higherrevenues in all the segmentsand better margins in IRM
• APSEZ EBITDA growth is onaccount of increase in cargovolume, operational efficiencyand capacity utilization
• APL EBITDA for the quarterimproved mainly due to highervolumes, improved merchanttariffs, and higher prior periodincome recognition.
• AGEL EBITDA grew on accountof increase in revenues andcost-efficient O&M driven bythrust on data analytics
• ATGL EBITDA grew mainly dueto growth in volumes
Note : AEL – Adani Enterprises Limited; AGEL – Adani Green Energy Limited; APL – Adani Power Limited ; APSEZ – Adani Ports and SEZ Limited, ATGL – Adani Total Gas Limited and ATL – Adani Transmission Limited

Adani Listed Portfolio : Robust ESG Assurance Framework
Guiding principle
Policies
ESG
Assurance(see slide 11)
Commitment
Guiding principles
United Nations Global Compact
Sustainable Development Goals
TCFD SBTi CDP disclosure
GRI Standards
• Climate Action
• No poverty
• Zero hunger
• Good health and well being
• Quality education
• Clean water and sanitization
• Affordable and clean energy
• Decent work and economic growth
• Industry, innovation & infrastructure
Policy framework backed by robust assurance program
Disclosure Standards
Policy Structure Focus Area - UNSDG
• Board Diversity • Dividend Distribution and Shareholder
Return Policy• Related Party Transaction Policy
• Environment Policy• Energy and Emission Policy • Water Stewardship Policy
• Human Rights • Corporate Social Responsibility Policy• Occupational Health and Safety Policy
E
S
G
8

Adani Listed Portfolio : Environmental Philosophy
CDP - Carbon Disclosure ProjectTCFD - Task Force on Climate related Financial DisclosureSBTi- Science Based Target initiative
Aligning business and future investments with globally accepted ESG principles for sustainable growth (Disclosure in public domain)
• Participating in CDP – Climate Change disclosure.
• ESG disclosures vide corporate sustainability assessment platform of DJSI-S&P Global.
• Supporting TCFD recommendations and signatory to SBTi – Business Ambition for 1.5℃.
• Participating in CDP – Water Security disclosure and aiming for alliance for water stewardship certification.
• Research & Development and Innovation for low carbon technology.
• Biodiversity Management & Conservation.
• Reduce freshwater withdrawal
• Reuse, recycle and replenish
• Net Water neutrality by 2025#
• Optimize land use
• Increase Renewable Energy share –30% by FY23 and 60% by FY27^^
• Promote low carbon technology
• Afforestation and Conservation
• Material Recovery Facility
• Biogas Plant (Waste to Energy)
• Organic Waste Converter
• Reduce waste outcome
• Carbon Neutrality by 2025^
• Supporting low carbon Economy
• Carbon sequestration by afforestation
• Improving Carbon Efficiency
• Reducing water footprint by 60%
• Land use and cover management
• Energy Management
• Optimizing Input Consumption
• Biodiversity conservation
• Zero waste to landfill by 2025
• Circular Economy
• Scientific Disposal of Hazardous Waste
• Single Use Plastic free sites by 2025
Offsetting Carbon Emission Conservation of Resource Waste Management
Climate Awareness
ClimateReadiness
Climate Alignment
^ Target for APSEZ
^^ Target for AEML
# Net water neutrality of plant capacity exceeding 200 MW at AGEL
9

Adani Listed Portfolio : Social philosophy
United NationsSustainable Development Goals 2030
Our Key Social Initiatives mapped to UNSDG
Women’s Education
Women’s Health
Women’s Empowerment
Ecology
Local & Rural infra Development
Sarguja
Trivandrum
Mundra
• Partnered with self help group to educate andprovide sanitary pads for safe menstrual hygiene toensure better health.
• Livelihood projects for sustenance in multiple areas
Godda • Social licensing by Community engagement forcoexistence and creating sustainable livelihood andinfrastructure
All Locations • Own schools, digitalization and up gradation of Govt.school to provide cost free education to the needy.
• Conservation of mangroves in coordination withGUIDE
Social philosophy drives initiatives that are aligned with UN Sustainable Development Goals
1. No Poverty4. Quality Education
3. Good Health & Well Being
2. Zero Hunger5. Gender Equality8. Decent Work & Economic Growth
7. Affordable and Clean Energy13. Climate Action 14. Life Below Water15. Life on Land
9. Industry, Innovation & Infra Structure11. Sustainable Cities & Communities
Water Secure Nation
Multiple Locations
• Deepening of ponds and tanks, Rooftop RainwaterHarvesting, Recharging Bore wells
6. Clean Water and Sanitation
10

• Corporate Responsibility Committee• Risk Management Committee
Adani Listed Portfolio : Governance Philosophy
Committees Policies Assurance
• Related Party Transaction Policy• Dividend Distribution and
Shareholder Return• Nomination and Remuneration• Code for Fair Disclosure of UPSI
hfp
Corporate Responsibility
Committee
Establishment of “CRC” of the board
to provide assurance for all
ESG commitments
(100% Independent directors)
• Environment Policy• Energy and Emission Policy• Water Stewardship Policy
• Corporate Social Responsibility Policy
• Occupational Health and Safety Policy
• Human Rights
• Corporate Social Responsibility Committee• Stakeholder Relationship Committee
• Audit Committee (100% independent directors)
• Nomination and Remuneration Committee (100% independent directors)
• Risk Management committee• Info tech and data security committee
Governance philosophy encompassing strong policy and structure backed by robust assurance mechanism11

12
Adani Portfolio
Business wise performance - Q1 FY22

13
Adani Ports and SEZ Ltd.

14
Operations Strategy Finance
• As part of east coast west coast parityKrishnapatnam acquisition completed.
• Working towards gaining 100% stakeat Gangavaram Port.
• Increasing foot print in the regionalspace, will develop container terminalat Colombo port.
• Consolidating existing rail assetsunder one roof for integrating Adaniand non Adani ports and also toparticipate in Indian Railways PPPprojects thus further integrating itslogistics business.
• Continues its dominant position withmarket share increasing to 29% of allIndia cargo volume.
• Market share in container businessnow stands at 43% of all Indiacontainer volume.
• Registered a cargo volume growth of83% by handling 76 MMT.
• In logistics business, continue to buildon increasing asset base, added 5 newbulk rakes under GPWIS.
• Under capital management programissued USD 750 mn (10.5 and 20 year )dual tranche bond, thus giving a longeryield curve to investors and elongatingdebt profile.
• Growth in operating revenue led byports (75%), logistics (34%) and SEZport led development income.
• Port EBITDA margin expanded by 100bps to 71% due to capacity utilizationand operational efficiency
• Strong operational performance led toan EPS growth of 72%
(YoY)
Leadership position backed by consistent outperformance
Adani Ports and SEZ Ltd : Q1 FY22 Result Highlights

*Compared to Q1 FY21 #Current Capacity
• CDP – Climate Change Score improved to “B-” from “C+” in 2019
• CDP – Supplier engagement rating improved to “B” from “B-” in 2019
• CDP – Obtained an initial Water Security Score “B”, which is same as Asia regional average
• Sustainalytics – ESG Risk Rating improved to “Low” from “Medium” in 2019
• MSCI – ESG Rating ‘CCC’
Managed through 5R
15
Solar Energy#Wind Energy #
Terrestrial Plantation Mangrove
1.7 MillionTrees Planted
14 MW6 MW
2989 Ha - Afforestation 2596 Ha - Conservation
Initiatives till date
Energy Intensity*
0.27 ML/Revenue
23 tCO2e/Revenue
1% ↑
35 % ↓
0.3 % ↑
83%
Q1 FY22 Performance
184 GJ/Revenue
Water Intensity*
Emission Intensity*
Waste Management*
Current ESG Rating
Adani Ports and SEZ Ltd : ESG update Q1 FY22
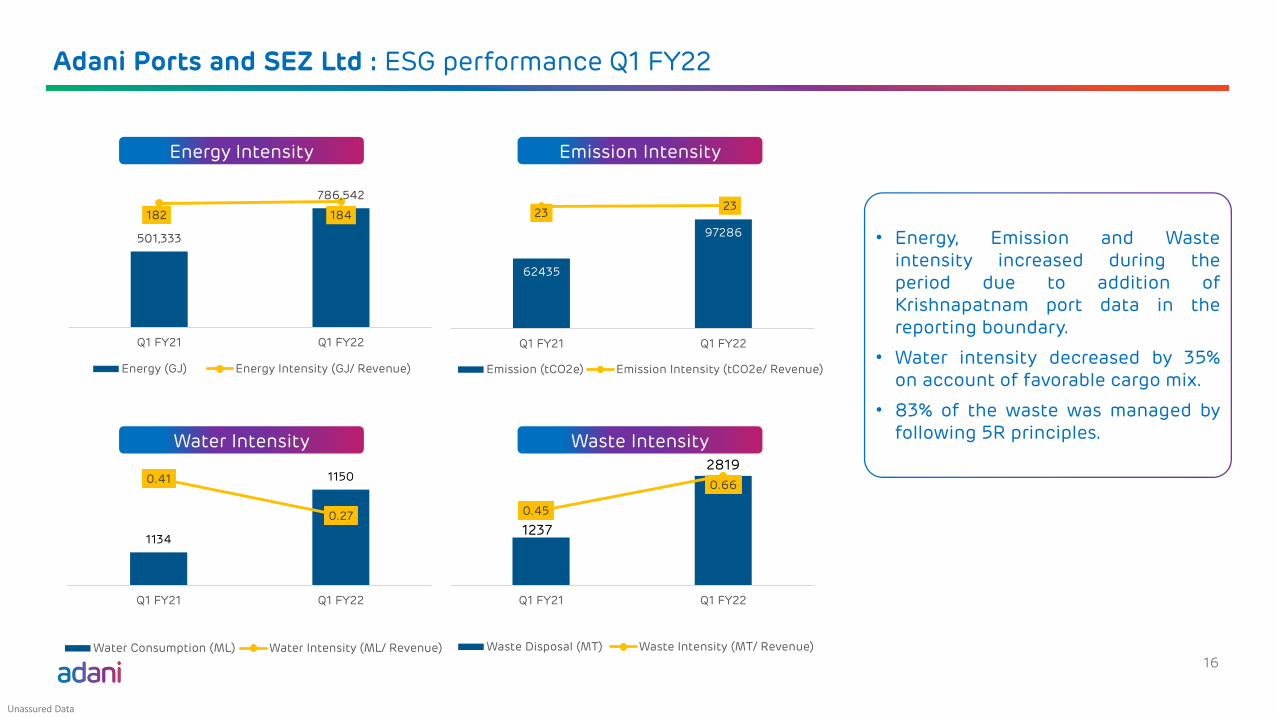
62435
97286
2323
0
5
10
15
20
25
0
20000
40000
60000
80000
100000
120000
Q1 FY21 Q1 FY22
Emission (tCO2e) Emission Intensity (tCO2e/ Revenue)
• Energy, Emission and Wasteintensity increased during theperiod due to addition ofKrishnapatnam port data in thereporting boundary.
• Water intensity decreased by 35%on account of favorable cargo mix.
• 83% of the waste was managed byfollowing 5R principles.
16
Unassured Data
Energy Intensity Emission Intensity
Water Intensity Waste Intensity
501,333
786,542
182 184
0
20
40
60
80
100
120
140
160
180
200
0
100000
200000
300000
400000
500000
600000
700000
800000
900000
Q1 FY21 Q1 FY22
Energy (GJ) Energy Intensity (GJ/ Revenue)
1134
11500.41
0.27
0.00
0.05
0.10
0.15
0.20
0.25
0.30
0.35
0.40
0.45
1125
1130
1135
1140
1145
1150
1155
Q1 FY21 Q1 FY22
Water Consumption (ML) Water Intensity (ML/ Revenue)
1237
2819
0.45
0.66
0.00
0.10
0.20
0.30
0.40
0.50
0.60
0.70
0
500
1000
1500
2000
2500
3000
Q1 FY21 Q1 FY22
Waste Disposal (MT) Waste Intensity (MT/ Revenue)
Adani Ports and SEZ Ltd : ESG performance Q1 FY22

17
• Renewable energy share at similar levels.
• 53% reduction in Injury rate with two lost time injuries. Adherence to SOPs and safety protocols laid down help minimize and eliminate LTIs and injuries.
Unassured Data
Renewable Energy Share Safety
5.93%5.55%
0.00%
1.00%
2.00%
3.00%
4.00%
5.00%
6.00%
7.00%
Q1 FY21 Q1 FY22
RE Share (%)
2
4
3
0.54
0.25
0.00
0.10
0.20
0.30
0.40
0.50
0.60
0
1
2
3
4
5
6
7
Q1 FY21 Q1 FY22
Fatal (No.) LTI (No.) Injury Rate
Dedicated training programs and regular assurance programs ensures improvement and continuity
Adani Ports and SEZ Ltd : ESG performance Q1 FY22

18
Adani Green Energy Ltd.

19
Adani Green Energy Ltd : Q1 FY22 Result Highlights
Operations Strategy Finance
• Continued focus on capacityexpansion. To reach 25 GW capacity by2025.
• Acquiring SB Energy’s 5 GW Indiarenewable portfolio for a fullycompleted EV of USD 3.5 billion forfast tracking 2025 guidance.
• Post SB Energy’s acquisition,Operational Capacity to increase from3,520 MW to 5,370 MW1 and totalLocked-in Growth2 to increase from18,190 MW to 24,294 MW1
• Resource planning in place forachieving targeted guidance
• Renewable projects of 200 MWcommissioned, operating portfolio isnow at 3520 MW
• Higher capacity results in significantincrease sale of energy (up 48%)
• Solar portfolio CUF up by 20 bps at25% on the back of consistently highplant availability of 99.6%.
• Significant improvement in Wind CUF,up by 160 bps at 38.5% backed bytechnologically advanced and moreefficient newly added Wind TurbineGenerators.
• Higher renewable power sales resultsin 23% growth in total income.
• Increase in revenues and cost-efficientO&M driven by thrust on data analyticsresults in 120 bps improvement inEBITDA margin (at 92.5%)
• Significant increase in cash profits, upby 35% (at Rs.460 cr)
(YoY)
Stellar operational performance results in highest Revenue & Cash Profit ever in a quarter
1. Includes (i) 5 GW renewable portfolio under acquisition from SoftBank and Bharti group including 1.7 GW operational solar assets and (ii) 150 MW operational wind assets under acquisition from Inox as well.2. Locked-in growth includes operational, under implementation, awarded and L1 bid projects. The L1 bid projects are solar projects of 300 0 MW with green shoe option for 1,500 MW for which AGEL is declared L1 bidder
in a tender issued by Andhra Pradesh Green Energy Corporation Ltd. Allotment of this tender is sub judice.
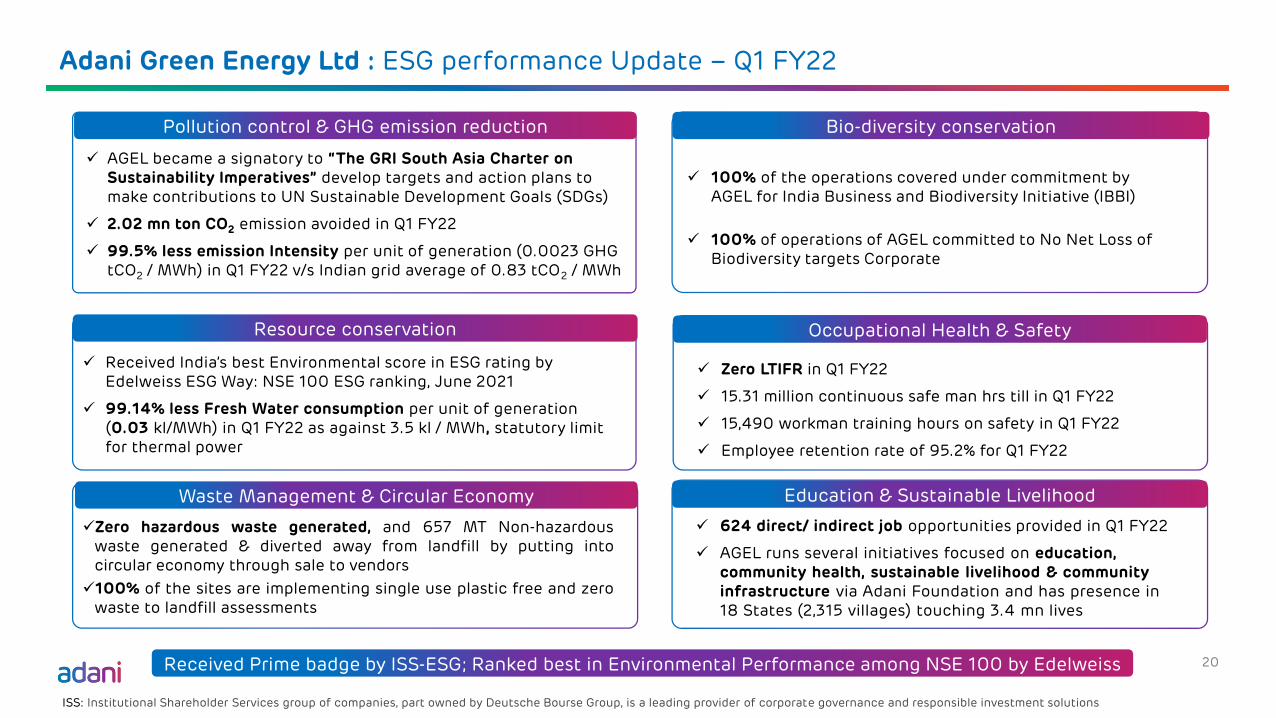
Received India’s best Environmental score in ESG rating by Edelweiss ESG Way: NSE 100 ESG ranking, June 2021
99.14% less Fresh Water consumption per unit of generation (0.03 kl/MWh) in Q1 FY22 as against 3.5 kl / MWh, statutory limit for thermal power
624 direct/ indirect job opportunities provided in Q1 FY22
AGEL runs several initiatives focused on education, community health, sustainable livelihood & community infrastructure via Adani Foundation and has presence in 18 States (2,315 villages) touching 3.4 mn lives
Zero LTIFR in Q1 FY22
15.31 million continuous safe man hrs till in Q1 FY22
15,490 workman training hours on safety in Q1 FY22
Employee retention rate of 95.2% for Q1 FY22
AGEL became a signatory to “The GRI South Asia Charter on Sustainability Imperatives” develop targets and action plans to make contributions to UN Sustainable Development Goals (SDGs)
2.02 mn ton CO2 emission avoided in Q1 FY22
99.5% less emission Intensity per unit of generation (0.0023 GHG tCO2 / MWh) in Q1 FY22 v/s Indian grid average of 0.83 tCO2 / MWh
100% of the operations covered under commitment by AGEL for India Business and Biodiversity Initiative (IBBI)
100% of operations of AGEL committed to No Net Loss of Biodiversity targets Corporate
Zero hazardous waste generated, and 657 MT Non-hazardouswaste generated & diverted away from landfill by putting intocircular economy through sale to vendors
100% of the sites are implementing single use plastic free and zerowaste to landfill assessments
Received Prime badge by ISS-ESG; Ranked best in Environmental Performance among NSE 100 by Edelweiss
Pollution control & GHG emission reduction Bio-diversity conservation
Resource conservation
Waste Management & Circular Economy
Occupational Health & Safety
Education & Sustainable Livelihood
ISS: Institutional Shareholder Services group of companies, part owned by Deutsche Bourse Group, is a leading provider of corporate governance and responsible investment solutions
Adani Green Energy Ltd : ESG performance Update – Q1 FY22
20

21
Adani Transmission Ltd.

22
Adani Transmission Ltd : Q1 FY22 Result Highlights
Operations
* EBITDA excluding other income Note: Cash profit calculated as PAT + Depreciation + Deferred Tax + MTM option loss
Strategy Finance
• To capitalize on locked-in growth withproject pipeline of Rs. 185 bn intransmission segment.
• AEML positioned as reliable, affordableand sustainable service provider
• Aiming for 60% RE power procurementmix by FY27
• Strategic partner like QIA lendscredibility to business.
• Amendment in Electricity Act tofurther offer growth opportunities inDistribution side
Transmission Business:
• Currently total network of 18,801 ckm.Operationalized 207 ckt kms lineduring the quarter.
• Transmission Lines operated at greaterthan 99.85% (average) availability
Distribution Business:
• Maintained supply reliability of 99.99%
• High double digit growth in units sold(2,036 million units, up 18%)
• Distribution loss continues to decline,reduced to 6.88%
• Collection efficiency remains above100%
• Under capital management programAdani Electricity successfully placedUS$ 300 million under its USD 2billion Global Medium-Term NotesProgram through a sustainabilitylinked (SLB) 10-year bond.
• Increase in transmission lineavailability, rebound in electricityconsumption by commercialestablishments results in revenue andEBITDA increase
• PAT grew by 22% to Rs.433 cr.
(YoY)
Unique combination of Predictable and Annuity Returns in transmission and strong growth in distribution segment

• ADTPS (Dahanu plant) has become 1st power plant in Adani Energy
vertical to be certified for “Water Efficiency Management System ISO
46001:2019”
• At the outset of ‘World Environment Day’, ATL has planted 6228
saplings
• Adani Transmission's entity Adani Electricity Mumbai became First in
India’s Energy Sector to Issue Sustainability Linked Bond
• ATL has published its Integrated Report of FY21 during the quarter
with enhanced disclosures and adoption of world-class standards
• ATL has initiated its project of “Zero Waste to Landfill” at portfolio
level and expected to have certification by Q-3, FY22
Auxiliary Power Consumption
4 % 37.7%
Scope 1 Emission
211%(3)
Solar Power Generation
Note: 1) ESG performance data is provisional and subject to external assurance and audit; 2) We have changed the methodology for calculation of emissions which leads to increase in the scope-2 emission; 3) Solar power capacity has increased resulting into higher generation
13.52% Fresh Water Consumption
• ATL has secured 2nd position in India and 42nd in the world in electric utility sector amongst 283 companies as per DJSI- S&P global CSA for year 2020
• Improve ESG ratings assigned by agencies such as FTSE, MSCI, DJSI • Reduction of emission levels• Zero tolerance for fatalities
ESG Standing ESG Focus Area
ESG Initiatives during the quarterESG Performance (Q1FY22 vs. Q1FY21)1
369%(2)
Scope 2 Emission
Cumulative Mangrove
289.04 Ha - Afforestation
Adani Transmission Ltd : ESG Performance and Initiatives in Q1FY22
23

Safety Initiatives During Q1FY22 Safety Performance in Q1FY22
Safety Parameters Q1FY22 Q1FY21
LTI 1 0
Fatalities 0 0
LTIFR (LTI Frequency Rate) 5.84 0
LTI (LTI Severity Rate) 0.29 4.62
Safety training by Safety team (in Men-Hours)
48,488 16,669
• 48,488 man-hours of safety training and awareness during the quarter
• Training session on basic fire fighting was conducted in June
• Release of Safety Performance Index (SPI) for project and O&M locations
• May Safe – Training sessions were conducted covering the aspects on JSA, SCA, Gensuite awareness and PSAP
• As part of Technology initiative trial was conducted on usage of Smart wearable at one of our Sub stations
Notes: JSA – Job Safety Analysis, SCA - Safety Checks and Assurance (SCA), PSAP - Public Safety Action Plan
Adani Transmission Ltd : Inculcating Safety Culture
24

25
Adani Enterprises Ltd.

26
AEL : Q1 FY22 Result Highlights
Operations
1. IRM – Integrated Resources Management 2. BOT – Build Operate Transfer | TOT – Toll Operate Transfer | HAM – Hybrid Annuity Model
Strategy Finance
• Developed businesses –
• Mining services, productionincreased by 114% to 4.7 MMT
• Solar module manufacturing up247% to 271 MW
• IRM1 volume stood at 17.6 MMT up138%
• Developing Businesses –
• Currently operating four airports inIndia, handled 3.5 mn passengers
• Signed four concession agreementfor development of roads acrossIndia
• Data center construction atAdaniConneX’s Chennai facilitystarted.
• Developed businesses outperformed.
• Mining revenue increased by 38%, solar by 194% and IRM by 193% due to higher production and strong dispatches,
• Significant increase in EBITDA due to higher revenue across all segments and better margin in IRM.
(YoY)
Incubating new wave of infrastructure and utility assets like airports, data centers with strong growth prospects
• To be the largest airport operator inIndia with 300 mn+ consumer base
• Participating in India’s roaddevelopment journey through BOT2,TOT2 and HAM2 model, targeted to be12,000 lane km by 2026
• Contributing to India’s “Aatma NirbharBharat Abhiyan” through solar cell andmodule manufacturing
• Data Centers - Goal to have a 1GW DataCenter Platform in a decade thatempowers a Digital India.

• Efficient use of water and energy • Reduction of emission levels• Zero tolerance for fatalities at mine sites• Faster reclamation of de-coaled areas
Mining Certification Focus Areas
Energy Intensity5624 GJ/MMT
Water Intensity187 Litres / MT
Waste Managed through 5RWaste Management Terrestrial Plantation CA Land & Excavation Area
Emission Intensity0.20 tCO2/MT
12 % ↓* 2.5 % ↓*
6.48 LakhTrees Planted
3797 Ha - C Afforestation 261 Ha - Reclamation
99%
AEL : ESG performance (March-21) - Mining Services
ISO 2600:2010, ISO 31000: 2009, ISO 9001:2015, ISO 14001:2015, OHSAS-18001:2007
*Compared to Base year FY 18#Current Capacity
ISO – International Organization for StandardizationOHSAS – Occupational Health and Safety Assessment Series
27

AEL : ESG performance as on March 21 - Solar Manufacturing
Natural Resource Conservation
Rooftop Solar plants helped to substitute ~5% of Power requirement
Energy Conservation initiatives helped to achieve 18% reduction in Specific Power Consumption vs FY 20 (KwH/MW)
21% reduction in Specific Consumption (KL/MW) of RO Water vs FY 20 due to 28% reduction in DI water consumption (KL/MW)
19,656 plantations cultivated despite low fertility soil and semi arid conditions.
Sewage Treatment Plant operations restored in Aug-2020 & all parameters of discharge water are now meeting GPCB norms
Certification Focus Areas
IEC – International Electro Technical CommissionMCS – Microgeneration Certification Scheme
Waste to Wealth Generation
Installed Bio-gas plant for treatment of 100% food waste and generation of cooking gas
Conceptualised in-house wood recycling plant for recycling of pallets (14,042 pallets recycled ~456MT of wood saved till FY21)
Safety
Nil LTI (Lost Time Injuries) for consecutive three years
Consistent Improvement in EHS parameters
75 improvements in process flow related to Fire, Chemical Slippage, Gas Control & other High Risk activities
IEC 61215, IEC 61730, UL61730, IEC 62716, IEC 61701, BIS/IS 14286, IEC 62804, IEC 62759, IEC 60068, MCS, PVEL-PQP, Black & Veatch
• Conservation of Natural Resources• Waste Management• Safety
PVEL-PQP – PV Evolution Labs – Product Qualification ProgramsEHS – Environment Health and Safety
28

100
60
80 8082
32
10.419.6
0
20
40
60
80
100
120
PM 10 (µg/m3) PM 2.5 (µg/m3) SOx (µg/m3) NOx (µg/m3)
GPCB Limit Result
AEL : Delivering Best in Class Environmental Compliances in Solar Mfg. (Mar-2021)E
TP
Tre
ate
d W
ate
r
ST
P T
rea
ted
Wa
ter
Am
bie
nt
Air
Dri
nkin
g W
ate
r
6.5 - 8.5
100
157.61
14 11.2
0102030405060708090
100
pH @ 25 ° C Total Suspended Solids(mg/L)
Fluoride (as F)(mg/L)
GPCB Limit Result
6.5 - 8.5
500
200
120
7.41
12276 78
0
100
200
300
400
500
600
pH @ 25 ° C TDS (PPM) Total Hardness (inPPM as CaCO3)
Calcium (in PPM asCaCO3)
100
30
7.1811 9.17.12
28
14
0
20
40
60
80
100
120
pH@25°C Total Suspended Solids(mg/L)
Biomedical Oxygen Demand(BOD) (mg/L)
GPCB Limit MSTPL MSPVL
Adani Solar spends USD 1.9Mn/Annum for effluent treatment29

Project Annapurna : Organic Farming
Objective : Increasing average income of farmers
Activities : Providing training and distribution of organic manure and seeds are done
Impact : 200 acres of land brought under organic farming thus making Parsa into a modern organic village
Project Unnayan : Women Empowerment
Objective : Economic development with social transformation
Activities : Sanitary Pad making, clothes stitching, vermi compost making, Clean drinking water facility
Impact : 250 women of 14 villages earning average income Rs. 5000 per month
Project Gokuldham : Animal Husbandary
Objective : To increase animal husbandary in 14 villages
Activities : Educating and training villagers for animal husbandary & enabling their economic development through sale of milk
Impact : 110 litre milk being produced per day (from 10 litreearlier); to increase to 200 litre
Adani Vidya Mandir & Adani Skill Development Center
Objective : Socio economic development through education
Activities : Teaching in school & providing training for mining equipments, electrification, tools etc
Impact : Increase in average students results and decrease in school drop-out ration. Improving skill sets of youth leading to reduction in unemployment
Achieving UN-Sustainability Development Goals… ... through our initiatives with Adani Foundation
Reaching 14 villages… Enriching 9000+ lives at Parsa site
UN-SDG – United Nations Sustainable Development Goals
UN-Sustainable Development Goal Adani Foundation Project
No Poverty Project Unnayan, Project Annapurna, Project Gokuldham
Zero Hunger Project Unnayan, Project Annapurna, Project Gokuldham
Good Health & Well-being Project Swasth Gram, Project Sanitary Pad, Jeewan Amrut
Quality Education Adani Vidya Mandir & Adani Skill Development Center (ASDC)
Gender EqualityCo-education in Adani Vidya Mandir & ASDC, Mahila Udyami Bahuddeshiy Sahakari Samiti (MUBSS) & Self-Help Group (SHG)
Clean Water & Sanitization Project Jeewan Amrut, Project Sanitory Pad, Phenyl Mfg
Affordable & Clean Energy Usage of Solar Energy
Decent Work & Economic Growth Project Unnayan, MUBSS & SHGs, ASDC, Project Gokuldham
Industry, innovation &infrastructureIntegrated Multi purpose Business Model - Project Unnayan, Project Annapurna, Project Gokuldham, ASDC
Reduced Inequalities Project Unnayan & MUBSS
Sustainable Cities & Communities Organic Farming, Integrated Multi purpose Business Model
Responsible Consumption & Production
Systematic Rice Intensification Technology (SRIT), Organic Farming, Solar Energy usage
Climate ActionProject Clean Village Green Village, Organic Farming, Vermi Compost, SRIT
Life below Water Natural recycling of water through series of ponds
Life on Land Organic Farming, Grazing Land, SRIT
Peace, Justice & Strong Institutions MUBSS & SHGs
Partnerships for Goals Co-existence of Society, Business & Government
30
AEL : Social philosophy - Showcasing social initiatives at Parsa site

31
Adani Total Gas Ltd.

32
Adani Total Gas Ltd : Q1 FY22 Result Highlights
Operations Strategy Finance
• To Roll out CNG faster for earlymonetization
• To build the Steel Network as early aspossible
• Strategic and Agile Gas SourcingFunction to respond to immediatemarket dynamics
• Focus on Automation & Digitizationof Customer Facing Processes andfor operational excellence
• To develop L-CNG : L-PNG stations inNew GAs where there are distantpipelines
• Added seven new CNG stations,currently operating 224 stationsacross India.
• Over 75 Kms (~ 670 Inch Km) of SteelPipeline laid
• CNG and PNG volume drive growth
• CNG volume at 68 MMSCM, up 180%and PNG volume at 72 MMSCM, up80%.
• PNG Home connection increased to4.88 Lacs (9,223 New connectionsadded)
• PNG Commercial & Industrialconnection customers increased to5,065 (added 99 connections)
• Revenue from Operations stood atRs.522 Cr, up 153%
• EBITDA at Rs.215 Cr, up 151%
• PBT increased by 196% to Rs.185 Cr
• PAT increased by 199% to Rs.138 Cr
(YoY)
All round growth in - CNG stations, industrial and domestic customer segments, supported strong financials performance

33
Aligning business and future investments with globally accepted ESG principles for sustainable growth
• Carbon disclosure in Public domain.
• Water Neutrality and alliance for water stewardship certification
• Innovation for low carbon technology.
• Biodiversity Management & Conservation.
• Reduce freshwater withdrawal
• Reuse, recycle and replenish
• Water neutrality
• Promote e-billing to reduce paper usage of 1.2 mn A-4 sheets
• Increase Renewable Energy
• Promote low carbon technology
• Use of Solar energy
• Afforestation and Conservation
• Material Recovery Facility
• Biogas Plant (Waste to Energy)
• Reduce waste outcome
• Supporting low carbon Economy
• Carbon sequestration by afforestation
• Improving Carbon Efficiency
• Carbon Neutrality
• Low carbon society foundation
• Reducing water footprint
• Energy Management
• Optimizing Input Consumption
• Reduce paper, save trees, save water
• Zero waste to landfill
• Circular Economy
• Scientific Disposal of Hazardous Waste
Offsetting Carbon Emission Conservation of Resource Waste Management
Climate Awareness
ClimateReadiness
Climate Alignment
ATGL is promoting the use of Natural Gas which reduces 1200 Tonnes per day of CO2 emissions
Adani Total Gas Ltd : Environmental Philosophy

34
Social Initiatives through Adani Foundation : Core Areas
Access to quality health care -Providing to quality health care atremote places, especially tomarginalized sections of society
Community Health
Education
Igniting minds - nurtures talented kidsfrom socio-economically challengedcommunities by providing cost free,high quality education
Sustainable Livelihood
Innovation and Empowerment -Meticulously designed interventionsby driving innovation in localeconomies, SHGs
Community Infrastructure
Improvement in quality of lifethrough investments in irrigation,potable water, upgradation of basicfacilities e.g. check dams andcommunity health care center
Our Key Social Initiatives mapped to UNSDG
Low Carbon Society
Foundation
EmpoweringLocal
Merchandizers
• Through local lead Generation
Bio-Gas Plants
• With ATGL, Adani Foundation is developing Biogas plant to provide free energy and will empower sustainable employment for over 200 people
• Mass Plantation• ATGL Green School• Energy conservation
for consumer
Social philosophy drives initiatives that are aligned with UN Sustainable Development Goals
Adani Total Gas Ltd : Social philosophy

35
Adani Power Ltd.

36
Adani Power Ltd : Q1 FY22 Result Highlights
Operations Strategy Finance
• Average Plant Load Factor of 65%achieved in Q1 FY22 vs 51% in Q1 FY21.
• Rise in PLF was a result of improvedpower demand in various States apartfrom better tariffs and volumes in themerchant and short-term markets.
• 28% growth in Unit sales at 16.2 BU inQ1 FY22 vs 12.7 BU in Q1 FY21.
• Consolidated total revenue for Q1 FY22stood higher at Rs. 7,213 Crore ascompared to Rs. 5,356 Crore in Q1FY21.
• Consolidated EBITDA grew by 49% toRs. 2,292 cr. EBITDA for the quarterimproved mainly due to highervolumes, improved merchant tariffs,and higher prior period incomerecognition, which was partially offsetby higher import coal prices.
• Total Comprehensive Income for Q1FY22 was Rs. 270 Crore, as comparedto Total Comprehensive Loss of Rs. (-)705 Crore for Q1 FY 21.
(YoY)
• The Committee of Creditors of M/s.Essar Power M P Ltd. [‘EPMPL’], acompany undergoing insolvencyresolution has approved the ResolutionPlan submitted by APL. EPMPL owns a1,200 MW power plant in SingrauliDist., Madhya Pradesh.
• Pursuant to this approval, theResolution Professional has issued aLetter of Intent to APL.
• The closure of the transaction shall besubject to obtaining necessaryapproval from the NCLT andsatisfaction of conditions precedentunder the Resolution Plan.
Delivered strong financial performance despite drop in demand demonstrating resilience in business

37
Quick Links to Q1 FY22 results of Adani listed portfolio

38
Adani Portfolio : Q1 FY22 Result Quick Links – AGEL and ATL
• Financials as per SEBI format –• https://www.adanigreenenergy.com/-/media/Project/GreenEnergy/Investor-
Downloads/Financial-Statements-Dynamic/Q1-FY22.pdf
• FY21 Results Presentation –• https://www.adanigreenenergy.com/-/media/Project/GreenEnergy/Investor-
Downloads/Result-Presentation-Dynamic/Q1-FY22.pdf
• Contact • Mr. Viral Raval• Email - [email protected]
Adani Green Energy Limited Adani Transmission Limited
• Financials as per SEBI format –• https://www.adanitransmission.com/-
/media/Project/Transmission/Investor/documents/Financial-Statements/Quarterly-Financial-Results/ATL_Q1FY22-results_IFRS-Statement.pdf
• FY21 Results Presentation –• https://www.adanitransmission.com/-
/media/Project/Transmission/Investor/documents/Results-Presentations/ATL_Q1FY22_Results-Presentation.pdf
• Contact • Mr. Vijil Jain • Email - [email protected]

39
Adani Portfolio : Q1 FY22 Result Quick Links – ATGL and APSEZ
• Financials as per SEBI format –• https://www.adaniports.com/-/media/Project/Ports/Investor/Investor-
Downloads/Quarterly-Results/Q1-FY22.pdf
• FY21 Results Presentation -• https://www.adaniports.com/-/media/Project/Ports/Investor/Investor-
Downloads/Operational-Highlights/Operational-and-Financial-Highlights-Q1-FY22-030821-WL.pdf
• Contact • Mr. Satya Prakash Mishra• Email - [email protected]
• Mr. Atharv Atre• Email - [email protected]
Adani Total Gas Limited Adani Ports and SEZ Limited
• Financials as per SEBI format –• https://www.bseindia.com/xml-data/corpfiling/AttachLive/72993551-de05-4ee2-
a455-f626af15866a.pdf
• FY21 Results Presentation –• https://www.adanigas.com/-
/media/Project/AdaniGas/Investors/Financials/Quarterly-Result-Presentation/Q1-FY22_Investor_Presentation.pdf?la=en
• Contact • Mr. Priyansh Shah• Email - [email protected]

40
Adani Portfolio : Q1 FY22 Result Quick Links – AEL and APL
• Financials as per SEBI format –• https://www.bseindia.com/xml-data/corpfiling/AttachLive/951f3d8f-78a5-
49cb-93c2-f3f32b56ed86.pdf
• Contact • Mr. Nishit Dave• Email - [email protected]
Adani Enterprises Limited Adani Power Limited
• Financials as per SEBI format –• https://www.adanienterprises.com/-
/media/Project/Enterprises/Investors/Investor-Downloads/Financial/AEL-Financial-Performance-Q1-FY22.pdf
• FY21 Results Presentation –• https://www.adanienterprises.com/-
/media/Project/Enterprises/Investors/Investor-Downloads/Results-Presentations/AEL-Performance-Highlights-Q1FY22.pdf
• Contact –• Mr. Akshay Ramani• Email - [email protected]
41
Annexure – Snapshot of Adani Listed Portfolio

ATGL – Adani Total Gas LtdAGEL – Adani Green Energy Ltd
42IRM – Integrated Resources ManagementCAGR – Compounded Annual Growth Rate
• Delivered returns at 32% CAGR sincelisting in 1994
• Unlocked value at CAGR of 123% inlast four years
• Created five infrastructure unicornsince inception
• Demerged ATGL and AGEL in last threeyears.
Operations
Value Creation
Solar Mfg
Successful Incubator
ESGCore Portfolio
Capital Management
Established Businesses
• IRM continues to maintain leadershipposition in India
• 50%+ market share in MiningServices space
Entry in B2CDeveloping Businesses
Development
Solar Mfg ESGCore Portfolio Solar Mfg ESGNatural Resources Solar Mfg Adani Wilmar
Value to Shareholders
• Robust Leverage Profile with Debt to equity ratio of 0.8x as on March 21
• External Debt to EBIDTA ratio of 3.6x as on March 21
MIAL – Mumbai International Airport Ltd
• In food business, maintained its leadership position with its “Fortune” brand and continues to lead the refined edible oil market with more than 20% market share.
• India’s largest manufacturing facilityof 1.5 GW capacity for producingsolar cells and modules
• Order book of construction of 450+Km of roads
• Formed a joint venture“AdaniConneX” with EdgeConnex todevelop and operate data centersthroughout India
• Planning to scale up Solar Mfg.capacity to 3+ GW
• Mining portfolio of 125+ MMT• End-to-end logistics capabilities
• Portfolio of 8 Airports out of whichtook over Ahmedabad, Lucknow andMangaluru Airports
• Took over control of MIAL and NMIALon 13th July, 2021
• Serving ~ 20% of total passenger base
NMIAL – Navi Mumbai International Airport Ltd
Adani Enterprises Ltd : A Successful Incubator

43
(2) COSO – Committee of sponsoring organizations
(1) Average Turnaround Time (TAT) for Mundra is 0.46 days in FY21 vs 1.95 days for Major Ports in FY19
Adani Ports and SEZ Ltd : Transformational journey
Double digit CAGR in cargo volume in last ten years and 36% CAGR of non Mundra ports in last seven years
• From a single port single commodity to an integrated logistics platform.
• Strategic partnerships to unlock value.
• 90% of economic hinterland coverage.
• Business transformation from a port operator to transport and logistics utility.
• Formation of Corporate Responsibility committee• Risk management through application of COSO(2)
principles• Social philosophy drives initiatives that are aligned
with UN Sustainable Development Goals• Independent board• Disclosures as per CDP, TCFD and SBTi• Achieving carbon neutrality by 2025
• 3x growth compared to market achieved without dilution in equity.
• Driving efficiency through mechanization at large scale.
• Growing responsibly with a sustainable approach.
• Integrated logistics solution to customers through a single window mechanism.
• Digitization of the platform through technology solutions (e.g. remote operating nerve center)
• In sourced operations (e.g. in house dredging and marine operations) leading to efficiency and cost reduction.
• Out performed market by providing best in class efficiency - TAT of Mundra is better by 4x that of its peers (1)
Industry Business
ESGO & M

44
Operations
Development
Solar Mfg
Secure Sites & Connectivity
ESGCore Portfolio
Construction Readiness
Construction facility Investment Grade (IG) RatingsEfficient Capital Management
Value Creation
Solar Mfg ESGCore Portfolio Solar Mfg ESG100% Contracted Capacity1 Technology enabled O&M Industry leading EBITDA margin
Resource Assessment
Adani Green Energy Ltd : Transformational Growth Profile
200,000 acresResource rich Sites in strategic locations with ~31 GW potential
ENOCAnalytics driven O&M with AI based
technology to maximize generation and perform predictive maintenance
85+ Wind data locations Solar resource
assessment completed
PPA life: 25 years Tariff profile
Fixed tariff
Access to International markets
Diversified sources of fundingElongated maturities up to 20 years
Geotechnical studies and detailed design planning,
simulations completed
US$ 1.35bnRevolving construction facility from
international banks to fully fund under construction pipeline
Average Portfolio tariff: INR 3.02/unit2
First IG rated Issuance Transformational transaction set the
template and market access for all future take-outs. Broaden capital pools - 144A, REG S, REG D, Indian
bond markets
Sweat assets to its fullest (Highest Generation) + Lowest Operating Costs = Highest EBITDA per MW
91% 3
1. Excluding a small merchant solar capacity of 50 MW2. Average tariff for locked-in growth of 24.3 GW3. EBITDA margin from power supply in FY21PPA - Power Purchase Agreement ; ENOC: Energy Network Operations Centre ; EBITDA: Earnings before Interest, tax, depreciation & amortization;

45
Operations
Development
Solar Mfg
Execution Prowess
ESGCore Portfolio
Healthy pool mix
Capital ManagementSelf-funded growth model ensuring
efficient capital churn
ROE optimization via Efficiency-led
Development
Value Creation
Solar Mfg ESGCore Portfolio Solar Mfg ESGOperating Efficiency and Strong
Margins (FY21)Consumer-centricity ESG
Strategic Presence
Adani Transmission Ltd: A platform well-positioned to leverage growth opportunities in T&D business
Transmission Network of
18,801 ckt km1;
Longest Private HVDC Line in Asia
Transmission - Presence in 12 states with 27 transmission
lines
Distribution - Integrated utility catering to gateway city of
Mumbai
Transmission (FY21):
51% of EBITDA - Central pool
49% of EBITDA - State pool
Embedded ESG Framework for enhanced value creation
Integration of Customer and Technology enabling AEML as a
supplier of choice
Robust network availability of 99.87% and supply reliability of
99.99%One of the lowest O&M cost per
ckm2
Transmission/Distribution EBITDA Margin – 92% / 27%
Development and O&M efficiencies resulted into
savings of ~Rs.5 bnoptimizing ROE at 55%
Re-designing capital structure though low cost
capital and elongated maturity
Every Rs. 1 bn of Equity Invested allows creation of Rs.
2.25 bn of Equity Employed
Note: 1) Transmission network is as of June’21 and includes operational, under-construction and LOI assets; 2) As per internal benchmarking on global transmission peers

46
Operations
Development
Solar Mfg
Largest Private CGD player
ESGCore Portfolio
Infrastructure Creation
EBITDA Growth Return RatiosInfrastructure Growth
Value Creation
Solar Mfg ESGCore Portfolio Solar Mfg ESGBalance Volume Mix Optimal Gas Sourcing Digitization
Execution Excellence
Adani Total Gas Ltd: Largest private player in India’s City Gas space with a decade of experience
38 Geographical Areas
ATGL through its JV has presence in 38 GAs across India covering 8% of
population
STRATEGIC and AGILE
Gas Sourcing Function to respond to immediate market dynamics
Commissioned 18 GAs15+ years of experience with faster Execution . Out of 19 GAs, ATGL has
commissioned 18 GAs
48 : 52
ConsistentInfrastructure growth in terms of
CNG station , Household connection and pipeline network
Focus onLaying CNG Stations and Pipeline Network for faster Infrastructure
creation
~21 % 5 years CAGR growth in EBITDA from
INR 288 crs in FY16 to 749 Crs in FY21
Balance mix volume for CNG : PNG segment
(As on Q1FY22)
> 27%Of ROCE and ROE
;
Of payment through Digital Mode. Through various Digital Initiatives ATGL has set a vision to be Smart
and Digital Utility Company
>90%

47
Adani Power Ltd : At a glance
Operational Efficiency
Development
Solar Mfg
Generation capacity
ESGCore Portfolio
Project Capex / MW
Coal tie-up Coal sourcing & logistics5Long-term PPA tie-up
Financial Value Creation
Solar Mfg ESGCore Portfolio Solar Mfg ESGCommercial Availability(for Long Term PPAs)
Water usage3 Fly ash utilization4
Largest private sector IPP2
1. Includes 40 MW solar power plant at Bitta; 2. Source: CEA, Mar 2021; 3. As on Mar 31, 2021; 4. Based on current generation at portfolio level; 5. At 80% PLF
14 GW(12,4501 MW Operational /
1,600 MW under construction)
16.4% / 5.9%(of India’s private/aggregate coal +
lignite generation capacity)
Rs. 5.2 Cr/MW(Operational projects)
FY 2020-21
89% (FY 2020-21)
2.32 m3/MWh(statutory limit of 3.5 m3/MWh for fresh
water based thermal power plants)
106%FY 2020-21
74% Capacity Secured
84% of Fuel Requirement
secured(of domestic coal based capacity
49 MTPA(Largest customer of Indian Railways
after NTPC)

Thank you

Certain statements made in this presentation may not be based on historical information or facts and may be “forward-looking statements,” including thoserelating to general business plans and strategy of Adani Enterprises Limited (“AEL”),the future outlook and growth prospects, and future developments of thebusiness and the competitive and regulatory environment, and statements which contain words or phrases such as ‘will’, ‘expected to’, etc., or similar expressions orvariations of such expressions. Actual results may differ materially from these forward-looking statements due to a number of factors, including future changesor developments in their business, their competitive environment, their ability to implement their strategies and initiatives and respond to technologicalchanges and political, economic, regulatory and social conditions in India. This presentation does not constitute a prospectus, offering circular or offeringmemorandum or an offer, or a solicitation of any offer, to purchase or sell, any shares and should not be considered as a recommendation that any investor shouldsubscribe for or purchase any of AEL’s shares. Neither this presentation nor any other documentation or information (or any part thereof) delivered or suppliedunder or in relation to the shares shall be deemed to constitute an offer of or an invitation by or on behalf of AEL.
AEL, as such, makes no representation or warranty, express or implied, as to, and does not accept any responsibility or liability with respect to, the fairness, accuracy,completeness or correctness of any information or opinions contained herein. The information contained in this presentation, unless otherwise specified is onlycurrent as of the date of this presentation. AEL assumes no responsibility to publicly amend, modify or revise any forward-looking statements, on the basis of anysubsequent development, information or events, or otherwise. Unless otherwise stated in this document, the information contained herein is based onmanagement information and estimates. The information contained herein is subject to change without notice and past performance is not indicative of futureresults. AEL may alter, modify or otherwise change in any manner the content of this presentation, without obligation to notify any person of such revision orchanges.
No person is authorised to give any information or to make any representation not contained in and not consistent with this presentation and, if given or made,such information or representation must not be relied upon as having been authorised by or on behalf of AEL.
This presentation does not constitute an offer or invitation to purchase or subscribe for any securities in any jurisdiction, including the United States. No partof its should form the basis of or be relied upon in connection with any investment decision or any contract or commitment to purchase or subscribe for anysecurities. None of our securities may be offered or sold in the United States, without registration under the U.S. Securities Act of 1933, as amended, or pursuantto an exemption from registration therefrom.
MR. D.BALASUBRAMANYAM
Group Head - Investor Relations
+91 79 2555 9332
Disclaimer
49