Adani Green Energy Limited
42
Renewables Adani Green Energy Limited Earnings Presentation Q2 & H1 FY21 Consolidated Financials
-
Upload
khangminh22 -
Category
Documents
-
view
3 -
download
0
Transcript of Adani Green Energy Limited

Renewables
Adani Green Energy Limited
Earnings Presentation
Q2 & H1 FY21 Consolidated F inancials

CONTENTS09-10 AGEL – Company Profile04-07 Adani Group 12-15
Operational & Financial
HighlightsRenewable Growth Story
& Investment Rationale17-26
ESG28-30
Appendix
32-42
Adani: World class infrastructure& utility portfolio 04
Adani: Repeatable, robust & proven model of infrastructure development 05
Adani: Repeatable, robust business model applied to drive value 06
AGEL: Replicating Group’s Transformational Growth Profile 07
AGEL: Transformational Renewable Company 09
AGEL: Large, Geographically Diversified Portfolio 10
AGEL: Receivable Details 37
RG1 & RG2: Financials &Key Operational Numbers 39-40
AGEL: Locked-in Growth with improving counterparty mix 32
AGEL: Renewable Growth Story 33
AGEL: A Compelling Investment Case 34
AGEL – Environment Awareness & Initiatives 28
AGEL – Social Engagement: Giving back to the Society 29
AGEL - Corporate Governance: Adopting best practices 30
AGEL: Key Highlights 17
AGEL: Solar & Wind Plant Availability 18
AGEL: Solar Portfolio Performance 19
AGEL: Wind Portfolio Performance 20
AGEL: Financial Performance 21-22
AGEL: Bridge of EBITDA from Power Supply 23-24
AGEL: Debt Evolution & Summary 25-26
AGEL: Transformational
Advantage
AGEL: Overall pipeline Development and de-risking philosophy 12
AGEL: Transformational Advantage driven by de-risked pipeline 13
AGEL: Operational Excellence driving Value 14
AGEL: Value Creation through Transformative Investment Philosophy 15
Renewables
Adani Group
Amongst the Largest Infrastructure & Utility
Portfolio of the World

4
Transport & Logistics Portfolio
63.5% 100%
APSEZ SRCPLPort & Logistics Rail
100%
AAPT
Adani
75%
ATLT&D
Energy & Utility Portfolio
75%
AGELRenewables
75% 37.4%
APLIPP
Adani
Marked shift from B2B to
B2C businesses -
AGL - Gas distributionnetwork to serve keygeographies across India
AGL
100%
AAHLAirports
Abbot Point
100%
ATrLRoads
75%
AELIncubator
100%
AWLWater
~USD 42 bn Combined market cap
1
100%
DataCentre
Gas DisComAEML - Electricitydistribution network thatpowers the financial capital ofIndia
Locked in Growth 2020 -
Transport & Logistics -Airports and Roads
Energy & Utility - Waterand Data Centre
Adani Airports - To operate,manage and develop sixairports in the country
Adani Group: A world class infrastructure & utility portfolio
1 . As on October 30, 2020, USD/INR – 74.5 | Note - Percentages denote promoter holdingLight purple color represent public traded listed verticals
Opportunity identification, development and beneficiation is intrinsic to diversification and growth of the group

5
Phase
Activity
Performance
Development
Origination
Analysis & marketintelligence
Viability analysis
Strategic value
Redefining thespace e.g. Mundra
Port
Site Development
Site acquisition
Concessionsand regulatoryagreements
Investment case
development
Envisaging evolutionof sector e.g. Adani
Transmission
Construction
Engineering & design
Sourcing & qualitylevels
Equity & debt
funding at project
Complexdevelopments ontime & budget e.g.APL
Operations
Operation
Life cycle O&M
planning
Asset Managementplan
O&M optimisations
e.g. Solar plants
Post Operations
Capital Mgmt
Redesigning the capital
structure of the asset
Operational phase
funding consistent with
asset life
Successfully placed 7 issuances totaling~USD 4 Bn in FY20
Low capital cost, time bound & quality completion providing long term stable cash flow & enhanced RoE
Adani Group: Repeatable, robust & proven model of infrastructure development
Focus on liquidity planning ensures remaining stress free.
All listed entities maintain liquidity cover of 1.2x- 1.8x for FY21.
Low capital cost, time bound & quality completion providing long term stable cash flow & enhanced RoE

6
Successfully applied across Infrastructure & utility platform
Development at largescale & within time andbudget
Excellence in O&M -benchmarked to globalstandards
Diverse financingsources - onlyIndian infrastructureportfolio with four (4)Investment Grade (IG)issuers
India’s LargestCommercial Port(at Mundra)
APSEZ
Highest Marginamong Peers in theWorldEBITDA margin: 64%
PSU 55%
Bonds 14%
Longest Private HVDCLine in Asia(Mundra - Dehgam)
ATL
Highest availabilityamong PeersEBITDA margin: 91%
648 MW Ultra MegaSolar Power Plant(at Kamuthi, Tamil Nadu)
AGEL
Constructed andCommissioned 9monthsEBITDA margin: 89%
Largest Single LocationPrivate Thermal IPP(at Mundra)
APL
PSU 33%
Bonds 47%
1,21,3
1,4
March 2016 March 2020
Key
Business
Model
Attributes
Private Banks 31% Private Banks 20%
Adani Group: Repeatable, robust business model applied to drive value
Note: 1 Data for FY20; 2 Excludes forex gains/losses; 3 EBITDA = PBT + Depreciation + Net Finance Costs – Other Income; 4 EBITDAMargin represents EBITDA earned from power sales and excludes other items; 5 FY20 data for commercial availability declared under long term power purchase agreements.
High declared capacity of 89%5`
The dominant Infrastructure platform that re-defines respective industry landscape

7
Development
Operations
Value Creation
14,195 MW 1
6,195 MW in Operation & ramp-up
8,000 MW Awarded Pipeline
Sovereign: 78%State DISCOMs: 15% ~90%
11 states74% solar; 12% wind; 14% wind-solar hybrid
PPA life: 25 years Tariff profile
Fixed tariff
Access to International marketsDiversified sources of funding
Elongated maturities up to 20 years
Pure-play Solar & Wind Assets
Note:1. Includes 50*3 MW of wind projects under-acquisition from Inox2. Based on estimated revenue-mix on fully built-up basis for overall portfolio of 14 GW3. EBITDA margin from power supply4. Design Build Finance Operate Transfer5. TOTAL SA invested INR 3707 Cr in the first phase and INR 310 Crore in the second phase towards 50% stake and other instruments in the JV that houses these assetsPPA - Power Purchase Agreement ; AGEL: Adani Green Energy Limited
Total Portfolio Diversified Portfolio ESG
100% Contracted Capacity Counterparty profile2
Monetization (DBFOT4)
EBITDA margin 3
Efficient Capital Management Investment Grade (IG) Ratings
AGEL : Replicating Group’s Transformational Growth Profile
50% stake 5
bought by TOTAL SA in Operational Solar ProjectsFirst phase - 2,148 MW Second phase - 205 MW
Non-govt.: 7%Average Portfolio tariff: INR 3.26/unit
First IG rated Issuance Endeavor to maintain IG rating in all future issuances

Renewables
Adani Green Energy LimitedCompany Profile
8
9
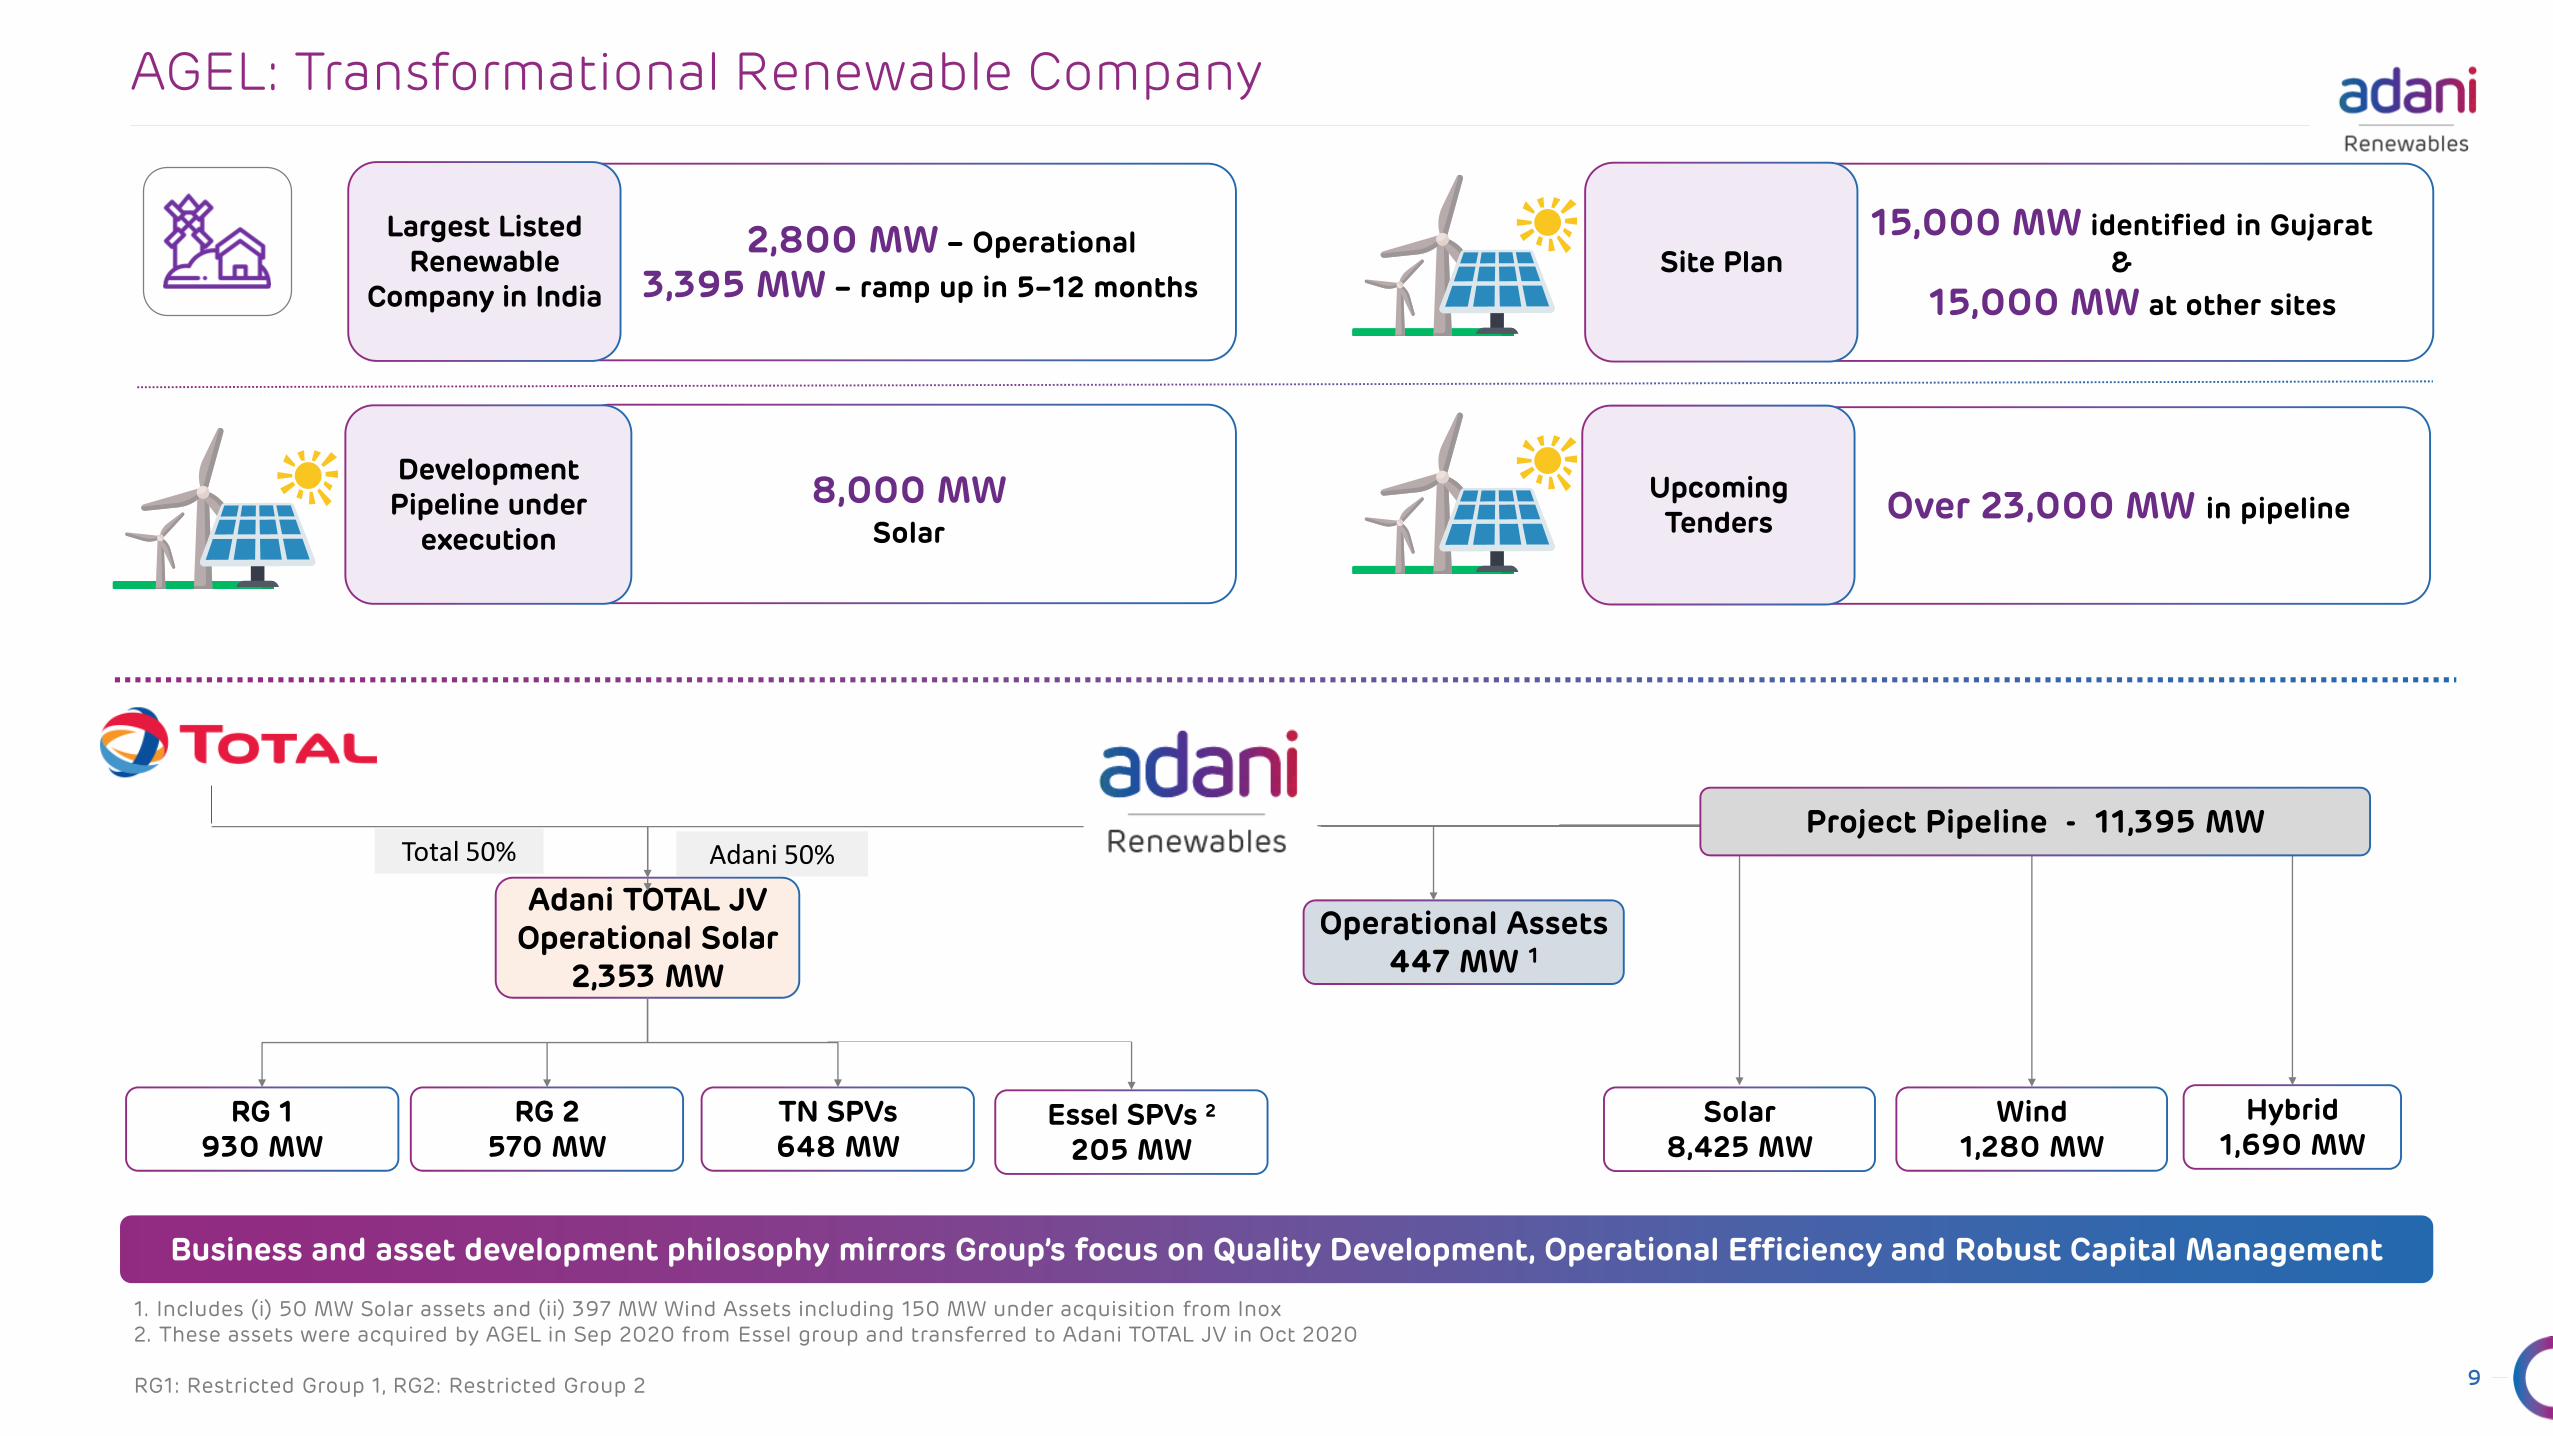
AGEL: Transformational Renewable Company
Business and asset development philosophy mirrors Group’s focus on Quality Development, Operational Efficiency and Robust Capital Management
Total 50% Adani 50%
Solar8,425 MW
Wind1,280 MW
Hybrid1,690 MW
RG 1930 MW
TN SPVs648 MW
Operational Assets 447 MW 1
RG 2570 MW
Adani TOTAL JV Operational Solar
2,353 MW
2,800 MW – Operational
3,395 MW – ramp up in 5–12 months
Largest Listed Renewable
Company in India
8,000 MWSolar
Development Pipeline under
execution
15,000 MW identified in Gujarat
&
15,000 MW at other sites
Site Plan
Over 23,000 MW in pipelineUpcoming Tenders
Project Pipeline - 11,395 MW
Essel SPVs 2
205 MW
1. Includes (i) 50 MW Solar assets and (ii) 397 MW Wind Assets including 150 MW under acquisition from Inox2. These assets were acquired by AGEL in Sep 2020 from Essel group and transferred to Adani TOTAL JV in Oct 2020
RG1: Restricted Group 1, RG2: Restricted Group 2

10
14,195 MW Portfolio 1 | 2,800 MW operational
Ranked as Largest Solar Power Developer in the World by US based MERCOM Capital
Operational Under Implementation
Wind Solar
Solar-Wind Hybrid
130
270
385
20
810
12
100
100
125
648
175 200
5,690
5,530
Presence acrossmultiple statesreduces resource risk
3.2 2.5 2.4 2.7 2.3 3.26
Apr'17 Dec'17 Jan'18 Aug'18 Jun'20 AGELPortfolio Avg.
Tariff
APPC @ 3.60/kWh
AGEL: Large, Geographically Diversified Portfolio
Average AGEL tariff below APPC 2
1. Includes 150 MW of wind projects under-acquisition from Inox2. APPC: National average power purchase cost
Lowest Tariff discovered in renewable bidding across months
Presence across
11 resource-rich states
13 different counterparties
Resource and Counterparty
Diversification
25-year fixed tariff PPAsFully Contracted
Portfolio
78%Sovereign
Counterparties
100%Contracted
portfolio

AGEL: Transformational Advantage
11

12
De-risking activity underway for Potential pipeline
AGEL: Overall pipeline Development and de-risking philosophy
Origination 85+ Wind data locations 2,00,000+ acres land identified across India
~10% Cost Efficiency
Resource Assessment Land Identification Design Optimisation
Development 1,00,000 acres of Land under Acquisition
Stage-I connectivity Approval for Prospective Land is already obtained
100% of the sites under
execution
Land Acquisition Statutory Approvals Connectivity
ConstructionCentre of Excellence –Project Management & Control Group (PMCG)
20,000+ Vendor Base across India
Experience of
execution over 320
sites across India
Engineering Supply Chain Management Site Execution

13
Map – Khavda, 15,000 MW site
De-risked GW scale construction and operational plan
AGEL: Transformational Advantage driven by de-risked pipeline
15,000 MW - Advanced Site Readiness
Wind potential map - Gujarat
Solar potential map - Gujarat
Resource Assessment
Land Acquisition
Construction Readiness
Over 3 years of on site resource estimation
70,000 acres of land allocated by Govt.
Geotech studies and logistics infra completed
Technical Studies
Detailed design planning and simulations completed
Supply Chaindevelopment
Detailed Supply chain planning is completed
Site area 2.7x Paris City
Source : Solar GIS, Global Wind Atlas; RE stands for Renewable energy

14
AGEL: Operational Excellence driving Value
Plant level O&M Centralized Operations via. ENOC
• Predictive O&M processes leading to reduction in:
Frequency of scheduled maintenance
On-site labor costs
Overall O&M cost
• On a fleet of 11 Mn modules, capability to collect Data at string level of 22 modules
• Predictive Analytics allows identification of faults preventing malfunction
• Reduces degradation of modules and need for replacement
Predictive Analytics leading to cost efficient O&M and high performance
86% 90% 89%
FY 18 FY 19 FY 20
EBITDA Margin (Power Supply)
99% 99% 99%
FY 18 FY 19 FY 20
Plant Availability (Solar)
100% 100% 100%
FY 18 FY 19 FY 20
Grid Availability (Solar)
20%22% 23%
FY 18 FY 19 FY 20
CUF (Solar)
Traditional Approach AGEL’s approach

15
AGEL: Value Creation through Transformative Investment Philosophy
1 Includes 50*3 MW of wind projects under-acquisition from Inox2 S&P & Fitch Credit rating for RG23 Capital Employed for Operational Assets4 Estimated EBITDA for full year of operations; Solar at P50; Wind at P75
CAGR: Cummulative Annual Growth Rate; RG: Restricted Group
Capacity (MW)
Credit Rating
Capital Employed3
CAGR of 47%
Investment Grade Rating
CAGR of 42%
748 MW
Not Rated
INR 50 bn
FY 17
2,545 MW 1
BBB- 2
INR 145 bn
FY 20
Run-rate EBITDA4 CAGR of 45%INR 8 bn INR 25 bn
Historic EBITDA Return & Strong Cash Generation expected to continue in coming future
EBITDA Return on Capital Employed
~ 16% ~ 17%Consistent
Cash Flow from Operations
28301
1625
1965
0
500
1000
1500
2000
2500
FY17 FY18 FY19 FY20
INR
Cro
re

Renewables
Operational & Financial Highlights
16

17
AGEL: Key Highlights - H1 & Q2 FY 21
Acquisition of 205 MW operational solar assets from Essel group completed in Sep 2020
AGEL expands TOTAL JV with addition of 205 MW solar assets at EV of INR 1,632 Cr taking the total operating portfolio under the JV to2,353 MW
Net Export of Energy up by 25% YoY at 2,540 mnunits•Solar portfolio CUF at 22.7% better than P75 target of 22.5% with strong plant availability of ~ 100%
Sale of Energy of 2,569 Mn units, up by 23% YoY
Solar CUF of 22.7% better than P75 target of 22.5%with plant availability of ~ 100%
Wind CUF improved from 33.5% to 34.8% YoY withstrong plant availability of 95%
Operational Performance H1 FY21 (YoY)
Capacity Addition
Revenue fromPower Supply
EBITDA fromPower Supply
Total Income
Financial Performance H1 FY21 (YoY)
Rs 1,596 Cr
Up 15%
Rs 1,139 Cr
Up 12%
Rs 1,050 Cr
Up 15%
Cash Profit
Rs 593 Cr
Up 69%
*Cash Profit is before deduction of distribution to TOTAL (INR 119 Cr in Q2 FY21 and INR 229 Cr in H1 FY21) which is part of Finance Cost as per Ind-AS
Revenue fromPower Supply
EBITDA fromPower Supply
Total Income
Financial Performance Q2 FY21 (YoY)
Rs 718 Cr
Up 1%
Rs 530 Cr
Up 15%
Rs 490 Cr
Up 19%
Cash Profit*
Rs 250 Cr
Up 80%
Sale of Energy of 1,187 Mn units, up by 22% YoY
Solar CUF of 20.7% better than P75 target of 20.6%backed by ~100% plant availability
Wind CUF of 30.3% with improved plant availabilityfrom 85% to 94%
Operational Performance Q2 FY21
Continued Robust Operational & Financial Performance despite ongoing pandemic

18
Consistent Strong Solar Plant availability & Improved Wind Plant availability backed by Analytics driven O&M
AGEL: Solar & Wind Plant Availability
• ENOC enhancing Plant availability performance through
Identification of faults preventing malfunction
Reduced degradation of modules and need for replacement
• Solar portfolio continues to operate near 100% Plant availability
• Wind portfolio Plant availability improves by:
900 bps YoY in Q2 FY21
970 bps YoY in H1 FY21
Q2 FY 21 H1 FY21
99.6% 99.6%
Q2 FY20 Q2 FY21
Solar - Plant availability
99.5% 99.6%
H1 FY20 H1 FY21
Solar - Plant availability
85.4%
94.4%
Q2 FY20 Q2 FY21
Wind - Plant Availability
85.3%
95.0%
H1 FY20 H1 FY21
Wind - Plant Availability
Centralized Operations via Energy Network Operation Centre (ENOC)

19
• Sale of Energy up by 11% on the back of:
- Capacity increase from 1,948 MW to 2,403_MW YoY
- Continued strong CUF performance
• CUF performance better than P75 target of 22.5% on theback of:
- Continued high plant availability
- Consistent solar irradiation
H1 FY21 Solar portfolio CUF performance at 22.7% better than P75 target of 22.5% backed by strong plant availability
22.7% 22.7%
1981
2206
1200
1400
1600
1800
2000
2200
0%
10%
20%
H1 FY20 H1 FY21
CUF (AC) Sale of Energy (mn units)
AGEL: Solar Portfolio Performance
• Sale of Energy up by 11% on the back of:
- Capacity increase from 1,948 MW to 2,403_MW YoY
- Continued strong CUF performance
• CUF performance better than P75 target of 20.6% on theback of:
- Continued high plant availability
- Consistent solar irradiation
20.1% 20.7%
9211025
80
280
480
680
880
1080
0%
10%
20%
Q2 FY20 Q2 FY21
CUF (AC) Sale of Energy (mn units)
Q2 FY21
H1 FY21
Q2 FY21 Solar portfolio CUF performance at 20.7% better than P75 target of 20.6% backed by strong plant availability

20
• Sale of Energy up by 246% Y-o-Y on the back of:
- Capacity increase from 72 MW to 247_MW YoY
- Improved overall CUF performance
• Improved Wind CUF performance on the back of improvedplant availability
33.5%
34.8%
105
363
10
110
210
310
25%H1 FY20 H1 FY21
CUF (AC) Sale of Energy (mn units)
Wind portfolio CUF performance in H1 FY21 improved from 33.5% to 34.8% YoY backed by strong plant availability
AGEL: Wind Portfolio Performance
Q2 FY21
H1 FY21
31.2% 30.3%
49
162
5
55
105
155
20%
30%
Q2 FY20 Q2 FY21
CUF (AC) Sale of Energy (mn units)
• Sale of Energy up by 230% Y-o-Y on the back of:
- Capacity increase from 72 MW to 247_MW YoY
- Consistent CUF
• Consistent CUF with significant improvement in plant availability from 85% to 94% although lower wind speed

21
AGEL: Financial Performance - Q2 FY21
Total Income up by 1% YoY
Revenue from Power Supply was up by 15%YoY with added capacities and consistentSolar & Wind CUF
EBITDA from Power Supply up by 19% YoY onback of improved revenue performance andoptimization of O&M cost
EBITDA margin from Power supply improvesby ~300 bps to 92% backed by improvedplant availability leading to higher energygeneration and optimization of O&M cost
Cash Profit* up by 80% YoY backed byincreased revenue and other income
Robust financial performance on the back of consistent Solar & Wind CUF
*Cash Profit is before deduction of distribution to TOTAL (INR 119 Cr in Q2 FY21) which is part of Finance Cost as per Ind-AS
712 718
Q2 FY20 Q2 FY21
+1%
Total Income
461530
Q2 FY20 Q2 FY21
+15%
Revenue (Power Supply)
139
250
Q2 FY20 Q2 FY21
+80%
Cash Profit*
413490
Q2 FY20 Q2 FY21
+19%
EBITDA (Power Supply) & EBITDA %
89% 92%
(All figures in INR Crore)

22
AGEL: Financial Performance - H1 FY21
Total Income up by 15% YoY
Revenue from Power Supply was up by 12%YoY with added capacities, steady Solar CUF& improved Wind CUF
EBITDA from Power Supply up by 15% YoY onback of improved revenue performance andoptimization of O&M cost
EBITDA margin from Power supply improvesbuy ~ 300 bps to 92% backed by improvedplant availability leading to higher energygeneration and optimization of O&M cost
Cash Profit* up by 69% YoY backed byincreased revenue and other income
Robust financial performance on the back of steady Solar CUF & improved Wind CUF
*Cash Profit is before deduction of distribution to TOTAL (INR 229 Cr in H1 FY21) which is part of Finance Cost as per Ind-AS
13871596
H1 FY20 H1 FY21
+15%
Total Income
1012 1139
H1 FY20 H1 FY21
+12%
Revenue (Power Supply)
352
593
H1 FY20 H1 FY21
+69%
Cash Profit*
9151050
H1 FY20 H1 FY21
+15%
EBITDA (Power Supply) & EBITDA %
89% 92%
(All figures in INR Crore)

23
AGEL: Bridge of EBITDA from Power Supply - Q2 FY20 to Q2 FY21
EBITDA up by 19% YoY on back of improved revenue performance and optimization of O&M cost
(All figures in INR Crore)

24
AGEL: Bridge of EBITDA from Power Supply: H1 FY20 to H1 FY21
EBITDA up by 15% YoY on back of improved revenue performance and optimization of O&M cost
(All figures in INR Crore)

25
11,470 13,362
1,579
1,670 894
1,289
Mar-20 Sep-20
Net Debt Cash & Bank Receivables
Net Debt Evolution
AGEL: Debt Evolution
Gross Debt1
1. Gross debt does not include inter corporate deposits taken from related party and others of INR 309 Cr, Lease liability of INR 271 Cr and Stapled instruments of Rs 3,703 Cr2. Cash & Bank includes Investment in liquid mutual fund and Balances held as Margin Money or security against borrowings3. Receivables includes unbilled revenue
+17%13,94316,321
2 3
11,199, 84%
2,163, 16%
Debt for operational projects
Debt for U/c projects
Net Debt
(All figures in INR Crore)

26
Consolidated Debt Rs 16,321 Cr (Sep’20)
Vs. 13,943 Cr (Mar’20)
Average interest rate 10.4%
Average door to door tenure for LT debt
12.4 years
LT vs. ST Debt Split (INR Cr)Debt Split by Currency (INR Cr)
Repayment Schedule of Long-term Debt up to FY30 (INR Cr)
Average interest rate - based on fully hedged basis and does not includes upfront fees and processing fees amortization
FX Rate INR 73.77 / USD
Consolidated debt does not include inter corporate deposits taken from related party and others of INR 309 Cr, Lease liability of INR 271 Cr and Stapled instruments of Rs 3703 Cr
First 4 years repayment includes INR 1444 Cr of Holdco mezzanine debt which is likely to be refinanced.
AGEL Debt Summary as on 30th Sept 20
6,712,41%
9,609,59%
Foreign Debt Indian Rupee Debt
15,055, 92%
1,266, 8%
Long Term Debt Short Term Debt
Includes Trade Credits of
INR1,067 Cr to be replaced with long term debt
400959 1,177
536
4,227
563 579 581 580 568
FY 21 FY 22 FY 23 FY 24 FY 25 FY 26 FY 27 FY 28 FY 29 FY 30
Long Term Debt capital with low staggered repayment schedule de-risks Debt servicing
Includes RG1 bond maturity of INR 3,688 Cr (USD 500 mn) to be
refinanced through long term maturity bond placement similar to RG2

Renewables
Adani Green Energy LimitedESG
27

28
AGEL – Environment Awareness & Initiatives
• 2.5 million ton CO2 emission reduced in H1 FY21
• Matching the load curve through hybrid (solar + wind) power plant
• ENOC launched as digital monitoring platform for optimised responsiveness
• Creation of solar parks for better provision of infrastructure
• Effective usage of unproductive land for development
• Working towards Water Reduction & Water Harvesting to become Water Positive company
• Lesser utilization of steel and concrete for structures
• Waste module recycling ensured at all sites
• To be zero single use plastic company by FY22
Offsetting Carbon Emission & Increased
efficiency
Resource Management
Waste Management
• Committed to Science Based Targets initiative (SBTi)
• Supporter of Task Force on Climate-related Financial Disclosures (TCFD)
• Signatory to UN Global Compact (UNGC)
• Disclosure as per CDP from Q2 FY21 onwards
Committed to a Greener Future
5.0
3.2
FY15 FY20
Land use in Acres/MW
Efficiency in land usage

29
AGEL – Social Engagement: Giving back to the Society
Ensuring Health & Safety
Community Engagement
Fair treatment to Land Beneficiaries
• 546 safety trainings arranged over 17,094 hours in H1 FY21
• 4.29 mn Continuous Safe man-hours in H1 FY21
• No minor labor deployment, documented safety procedures for services contracts
• Field Safety Audits conducted at sites
• Distribution of books and sports equipment to local schools
• Construction of washrooms and provision of water coolers to nearby schools
• Distribution of (3200) winter wear in Jaisalmer recognized by state officials
• Barren/Non-cultivated land used for plant setup preventing the impact on livelihood of farmers
• Land beneficiaries compensated at market determined rates
• Land policy and land selection checklist in place and published on website
• Screening is done for all projects before purchasing land

30
AGEL - Corporate Governance: Adopting best practices
• 50% of the Board comprises of Independent Directors
• Separate Chairman and CEO Positions
• 4 out of 5 Board Committees comprising of Majority of Independent Directors
• Review of performance of Non-Independent Directors and Board as a Whole by independent directors
• Code of Conduct in place for Board of Directors and Senior Management
• Senior Management Remuneration linked to growth and profitability of business with focus on safety and capital management
• 12 Policies in place from the perspective of Good Governance, available on AGEL website, including policies on Insider Trading, Related Party Transactions, Whistle Blower, Land acquisition and so on
• Zero tolerance to Bribery & Corruption - Policy regularly reviewed by the Board and posted on employee portals and company website
• IT enabled compliance management
• Audit Committee headed by Independent Director
• Statutory auditors of repute and strong internal control framework
• Comprehensive ERP solution implemented for accounting & end to end procure-to-pay process
• Bankruptcy Remote Structure for RG1 & RG2 assets
• Published 1st Integrated report in FY20
• Strategic partnership with TOTAL
Independent Board
Strong Governance Framework
Sound Accounting Oversight & Financial
Control

Renewables
31
Renewable Growth Story &
Investment Rationale - AGEL

32
313 808 1,958 1,970 2,545 2,800
25,000
485 1,192612 2,590
3,445
11,395
FY 16 FY 17 FY 18 FY 19 FY 20 H1 FY 21 FY 25E
Operational (MW) UC (MW)
14,195
AGEL: Locked-in Growth with improving counterparty mix
Strong Execution Track Record…
Note:
7982,570
4,5605,990
2,000
Operational Fully built-up
2,800 MW 14,195 MW
Sovereign Offtakers 78%
State DISCOMS 15%
Sovereign
Off-takers 46%
StateDISCOMs 54%
25,000
Non-govt Offtakers 7%
# Includes (a) 50*3 MW of wind projects under-acquisition from Inox; * Estimated Revenue mix
**
#
…Improving Counterparty mix

33
AGEL: Renewable Growth Story
AGEL’s accelerated growth to continue
Mar’16 Mar'20 Mar'22 Mar'30
4687
175
450
India: Renewable Installed Capacity (GW) 2
Mar’16 Mar '20 Mar'22 Mar'25
0.3 2.56.3
25.0
AGEL: Market Leading Consistent Robust Growth in Capacity (GW)
• GW scale Development with up to 15 GW sites to optimize costs and delivery timelines
• Value driven Resource mix including Solar, Wind, Hybrid & RTC
• Automation & Analytics driven O&M (ENOC)
• Focus on Sovereign equivalent Counterparties
• Strategic partnerships with OEMs for optimal pricing and quality
• Unlocking value through strategic partnerships such as TOTAL
• Access to global capital markets for long debt maturities & optimized financing cost
Historic
Targeted
Historic
Targeted
1. Source: India wind energy potential as estimated by National Institute of Wind Energy (NIWE) on wastelands at 120 m height. Solar energy potential as estimated by National Institute of Solar Energy Central Electricity Authority (CEA), CRISIL Report, Bloomberg New Energy Finance2. Source: Annual Reports of Ministry of New and Renewable Energy, Government of India and Hon’ble Prime Minister Narendra Modi’s statement at Climate Action Summit at UN Headquarters in Sep 2020
RTC: Round The Clock power generation model; ENOC: Energy Network Operation Centre
35
749
InstalledCapacity
Potential
>21x potential
38
347
InstalledCapacity
Potential
>9x potential
15
45
InstalledCapacity
Potential
3x potential
Solar Capacity (GW) Wind Capacity (GW) Other Capacity (GW)
Untapped renewable resources - Significant potential for growth 1
Adani’s Strategy for Future Development
Projected CAGR: 18%
Historic CAGR: 17%
Projected CAGR: ~ 60%
Historic CAGR: 67%

34
AGEL: A Compelling Investment Case
Significant Growth Opportunity
Locked-in capacity growth of 5x from 2.8 GW to 14 GW with already awarded projects
Targeted capacity growth of 9x to 25 GW by 2025
Disciplined Capital Management with ring fenced structures such as RG1 & RG2
De-risked Project Pipeline
200,000+ acres of land identified across India and out of this 70,000 acres tied up
Revolving Construction Facility of USD 1.8 bn being set up for project pipeline
India targets Renewable capacity of 175 GW by 2022 & 450 GW by 2030 from 87 GW currently
‘Must-run’ status to renewable plants in India ensures continuous off-take of energy
O&M driven by Analytics & Continuous monitoring with Energy Network Operation Centre
Plant availability of ~ 100% (solar)
Pedigree of Adani Group: leader in infrastructure –transport, logistics, energy and utility space
Proven track record of excellence in development, O&M and capital management
Strong Government Push
Long term PPA’s (~25 years); ~78% sovereign counterparties
Operations continued normally even during crises situations like COVID-19
EBITDA from Power Supply of ~90% over the past years
Predictable & Stable cash-flows
World-class O&M practice
Infrastructure lineage

Appendix
35

AppendixAGEL: Receivable Details
36

37
TANGEDCO has applied for in Central scheme, whereby it is expecting to receive disbursement in earlyNovember 2020, which will help it clear its outstanding
DISCOMs availing prompt pre-payment discount
With higher share of NTPC/SECI in portfolio, receivables ageing expected to further improve in mediumterm
Not Due30-Sep-20
Overdue30-Sep-20
Off Takers 0-60 days 61-90 days 91-120 days 121-180 days >180 days Total Overdue
TANGEDCO1147 109 57 69 121 437 793
NTPC255 - - - - - -
SECI3 57 - - - - - -Others 137 27 17 14 21 20 99 Total 397 136 74 82 142 457 892
AGEL: Receivables Ageing Profile
(in INR Cr)
1. Tamil Nadu Generation and Distribution Corporation2. National Thermal Power Corporation3. Solar Energy Corporation of India Limited
LC received

AppendixRG1 & RG2: Financials &Key Operational Numbers
38

39
AGEL: RG1 Portfolio (930 MW) Performance in H1 FY21
• Net Export of Energy up by 2% YoY on the back ofincreased effective capacity of 17 MW and continuedstrong CUF performance
• CUF performance better than P90 target of 22.6% andnear P75 target of 23.4% on the back of:
- Continued high plant availability
- Consistent solar irradiation
RG1 CUF at 23.3% better than P90 target of 22.6% and near P75 target of 23.4%
99.3% 99.5%98.8% 99.1%
23.3% 23.3%
934 952
820
840
860
880
900
920
940
960
0%10%20%30%40%50%60%70%80%90%
100%
H1'20 H1'21
Plant Availability Grid Availability CUF (AC) Net Export (mn units)
Key Financials
Particulars (INR Cr.) H1 FY20 FY20
Revenue from Power supply 455 882
Total Income 515 951
EBITDA including Other income & VGF / GST receipt under change in law 520 828
Gross Debt 4,472 4,577
Net Debt 4,134 4,140
Off Takers (INR Cr)
Not Due*30-Sep-20
Overdue
0-60 days
61-90 days
91-120
days
121-180
days
>180
days
Total
Overdue
NTPC 51 - - - - - -
SECI 30 - - - - - -
UPPCL 4 - - - - - -
KREDEL** 27 12 5 6 14 15 53
PSPCL 30 2 3 - 0 - 5
GESCOM 2 2 1 1 1 3 7 Total 145 15 9 7 15 19 65
Power Generation receivables Ageing
* includes unbilled revenue of INR 67 Cr ; ‘Not Due’ includes receivables in which as per PPA
** HESCOM, BESCOM, CESE, MESCOM are part of KREDEL.NTPC: National Thermal Power Corporation: SECI: Solar Energy Corporation of India Limited: UPPCL: Uttar Pradesh Power Corporation Limited PSPCL: Punjab State Power Corporation Limited:KREDEL: Karnataka Renewable Energy Development Ltd: GESCOM: Gulbarga Electricity Supply Company Limited: HESCOM: Hubli Electricity Supply Company Ltd; BESCOM: Bangalore Electricity supply company Ltd; MESCOM: Mangalore Electricity Supply Company Limited
EBITDA = Revenue from Operation + Other income & VGF / GST receipt under change in law (net of amortization) – Cost of Material consumed - Admin and General Expense including Employee benefit expense
Gross Debt = Long Term Borrowings + Short Term Borrowings + Current Maturities of long term borrowings – Unsecured loans from related parties – Lease Liablities – Derivative Assets – Hedge reserve fund
Net debt = Gross Debt - cash and cash equivalents - bank and other bank balances - current investments - Balance held as margin money

40
AGEL: RG2 Portfolio (570 MW) Performance in H1 FY21
40
RG2 achieved a record CUF of 26.4% even higher than P50 target of 26.3%
99.5% 99.8%95.9% 99.1%
24.6% 26.4%
399
661
0
100
200
300
400
500
600
700
0.0%
20.0%
40.0%
60.0%
80.0%
100.0%
H1'20 H1'21
Plant Availability Grid Availability CUF (AC) Net Export (mn units)
• Net Export of Energy up by 65% YoY on the back of:
- Capacity increase from 370 MW to 570_MW YoY
- Continued strong CUF performance
• CUF performance not only better than P90 target of 24.5%but also better than P50 target of 26.3% on the back of:
- Continued high plant availability
- Consistent solar irradiation
Key Financial number
Particulars (INR Cr) H1 FY21 FY20
Revenue from Power supply 243 416
Total Income 276 428
EBITDA including Other income & VGF / GST receipt under change in law 362 442
Gross Debt 2,582 2,623
Net Debt 2,242 2,289
Particulars 30-Sep-20
Receivables - Not due 47
Receivables – Overdue 0
* includes unbilled revenue of INR 36 Cr ; ‘Not Due’ includes receivables in which as per PPA
EBITDA = Revenue from Operation + Other income & VGF / GST receipt under change in law (net of amortization) – Cost of Material consumed - Admin and General Expense including Employee benefit expense
Gross Debt = Long Term Borrowings + Short Term Borrowings + Current Maturities of long term borrowings – Unsecured loans from related parties – Lease Liablities – Derivative Assets
Net debt = Gross Debt - cash and cash equivalents - bank and other bank balances - current investments - Balance held as margin money
(INR Cr) (INR Cr)

41
Certain statements made in this presentation may not be based on historical information or facts and may be “forward-looking statements,” including those relatingto general business plans and strategy of Adani Green Energy Limited (“AGEL”),the future outlook and growth prospects, and future developments of the business andthe competitive and regulatory environment, and statements which contain words or phrases such as ‘will’, ‘expected to’, etc., or similar expressions or variations ofsuch expressions. Actual results may differ materially from these forward-looking statements due to a number of factors, including future changes or developments intheir business, their competitive environment, their ability to implement their strategies and initiatives and respond to technological changes and political, economic,regulatory and social conditions in India. This presentation does not constitute a prospectus, offering circular or offering memorandum or an offer, or a solicitation ofany offer, to purchase or sell, any shares and should not be considered as a recommendation that any investor should subscribe for or purchase any of AGEL’s shares.Neither this presentation nor any other documentation or information (or any part thereof) delivered or supplied under or in relation to the shares shall be deemed toconstitute an offer of or an invitation by or on behalf of AGEL.
AGEL, as such, makes no representation or warranty, express or implied, as to, and does not accept any responsibility or liability with respect to, the fairness, accuracy,completeness or correctness of any information or opinions contained herein. The information contained in this presentation, unless otherwise specified is only currentas of the date of this presentation. AGEL assumes no responsibility to publicly amend, modify or revise any forward looking statements, on the basis of any subsequentdevelopment, information or events, or otherwise. Unless otherwise stated in this document, the information contained herein is based on management informationand estimates. The information contained herein is subject to change without notice and past performance is not indicative of future results. AGEL may alter, modifyor otherwise change in any manner the content of this presentation, without obligation to notify any person of such revision or changes.
No person is authorized to give any information or to make any representation not contained in and not consistent with this presentation and, if given or made, suchinformation or representation must not be relied upon as having been authorized by or on behalf of AGEL.
This presentation does not constitute an offer or invitation to purchase or subscribe for any securities in any jurisdiction, including the United States. No part of itsshould form the basis of or be relied upon in connection with any investment decision or any contract or commitment to purchase or subscribe for any securities. Noneof our securities may be offered or sold in the United States, without registration under the U.S. Securities Act of 1933, as amended, or pursuant to an exemption fromregistration therefrom.
Investor Relations Team :
VIRAL RAVAL
AGM - Investor [email protected]
+91 79 2555 8581
Disclaimer
UDAYAN SHARMA
DGM - Investor [email protected]
+91 79 2555 8114

Renewables
Thank You42