MCB - Arif Habib Savings and Investments Limited - PSX Data ...
Upload
khangminh22Category
view
1download
0
THIS CIRCULAR IS IMPORTANT AND REQUIRES YOUR IMMEDIATE ATTENTION
The definitions and interpretations commencing on page 9 of this Circular apply to the entire Circular, including this cover.
ACTION REQUIRED:1. This entire Circular is important and should be read with particular attention to the section entitled “Action required by
Capespan Shareholders in relation to the Scheme”, which commences on page 4.2. If you are in any doubt as to what action to take, you should consult your Broker, CSDP, banker, accountant, attorney
or other professional advisor immediately.3. If you have disposed of all your Capespan Shares, please forward this Circular and the attached form of proxy in
respect of the General Meeting of Capespan Shareholders (yellow) and form of surrender, transfer and acceptance (blue) to the purchaser to whom, or the Broker, CSDP, banker or other agent through whom, the disposal was effected.
Capespan and Zeder do not accept responsibility, and will not be held liable, for any action of, or omission by, any CSDP or Broker including, without limitation, any failure on the part of the CSDP or Broker of any beneficial owner of Capespan Shares to notify such beneficial owner of the Scheme set out in this Circular.
CAPESPAN GROUP LIMITED(Incorporated in the Republic of South Africa)
(Registration number 2008/016971/06)(“Capespan”)
ZEDER INVESTMENTS LIMITED(Incorporated in the Republic of South Africa)
(Registration number 2006/019240/06)Share code: ZED ISIN code: ZAE000088431
(“Zeder”)
COMBINED CIRCULAR TO CAPESPAN SHAREHOLDERS
relating to: – the scheme of arrangement in terms of section 114(1) of the Companies Act, proposed by the Capespan Board
between Capespan and Capespan Shareholders (excluding the Capespan Management Shareholders), in terms of which, if implemented, Zeder will acquire all of the Scheme Shares from Scheme Participants for the Scheme Consideration of 85 (eighty five) Zeder Shares for every 100 (one hundred) Scheme Shares disposed of in terms of the Scheme;
and incorporating: – a report prepared by the Independent Expert in terms of sections 114(2) and 114(3) of the Companies Act; – extracts of section 115 of the Companies Act dealing with the approval requirements for the Scheme and section
164 of the Companies Act dealing with Dissenting Shareholders’ Appraisal Rights; – the Notice of General Meeting of Capespan Shareholders; – a form of proxy in respect of the General Meeting of Capespan Shareholders (yellow) for use by Capespan
Shareholders; and
– a form of surrender, transfer and acceptance in respect of the Scheme (blue) for use by Capespan Shareholders.
Transaction Advisor and Sponsor to Zeder
Independent Reporting Accountants to Zeder and Capespan
Independent Expert to Capespan Legal Advisor to Zeder and Capespan
Date of issue: Monday, 25 May 2015This Circular is only available in English. Copies of this Circular may be obtained during normal business hours from the registered office of Capespan, the registered office of Zeder, the offices of PSG Capital Proprietary Limited and the Transfer Secretaries at their respective addresses set out in the “Corporate Information and Advisors” section of this Circular, and on the websites www.zeder.co.za and www.capespangroup.com, from the date of issue hereof until the date of the General Meeting.

IMPORTANT LEGAL NOTES
The definitions and interpretations commencing on page 9 of this Circular apply to this section on Important Legal Notes.
FORWARD-LOOKING STATEMENTS
This Circular contains statements about Capespan and Zeder that are or may be forward-looking statements. All statements other than statements of historical fact are, or may be deemed to be, forward-looking statements. These forward-looking statements are not based on historical facts, but rather reflect current expectations concerning future results and events and generally may be identified by the use of forward-looking words or phrases such as “believe”, “aim”, “expect”, “anticipate”, “intend”, “foresee”, “forecast”, “likely”, “should”, “planned”, “may”, “estimated”, “potential” or similar words and phrases.
By their nature, forward-looking statements involve risks and uncertainties because they relate to events and depend on circumstances that may or may not occur in the future. Capespan and Zeder caution that forward-looking statements are not guarantees of future performance. Actual results, financial and operating conditions, liquidity and the developments within the industries in which Capespan and Zeder operate may differ materially from those made in, or suggested by, the forward-looking statements contained in this Circular.
All these forward-looking statements are based on estimates and assumptions, as regards Capespan, made by Capespan or, as regards Zeder, made by Zeder, as communicated in publicly available documents by the respective companies, all of which estimates and assumptions, although Capespan and Zeder believe them to be reasonable, are inherently uncertain. Such estimates, assumptions or statements may not eventuate. Factors which may cause the actual results, performance or achievements to be materially different from any future results, performance or achievements expressed or implied in those statements or assumptions include other matters not yet known to Capespan or Zeder or not currently considered material by Capespan or Zeder.
Capespan Shareholders should keep in mind that any forward-looking statement made in this Circular or elsewhere is applicable only at the date on which such forward-looking statement is made. New factors that could cause the business of either Capespan or Zeder not to develop as expected may emerge from time to time and it is not possible to predict all of them. Further, the extent to which any factor or combination of factors may cause actual results to differ materially from those contained in any forward-looking statement is not known. Capespan and Zeder have no duty to, and do not intend to, update or revise the forward-looking statements contained in this Circular after the date of this Circular, except as may be required by law.
FOREIGN CAPESPAN SHAREHOLDERS
This Circular has been prepared for the purposes of complying with the laws of South Africa and is subject to applicable laws and regulations, including but not limited to the Companies Act and the Companies Regulations and the information disclosed may not be the same as that which would have been disclosed if this Circular had been prepared in accordance with the laws and regulations of any jurisdiction outside of South Africa.
The release, publication or distribution of this Circular in jurisdictions other than South Africa may be restricted by law and therefore any persons who are subject to the laws of any jurisdiction other than South Africa should inform themselves about, and observe, any applicable requirements. Any failure to comply with the applicable requirements may constitute a violation of the securities laws of any such jurisdiction.
This Circular is not intended to, and does not constitute, or form part of, an offer to sell or an invitation to purchase or subscribe for any securities or a solicitation of any vote or approval in any jurisdiction other than South Africa. This Circular does not constitute a prospectus or a prospectus equivalent document. Capespan Shareholders are advised to read this Circular, which contains the full terms and conditions of the Scheme, with care. Any decision to approve the Scheme or any other response to the proposals should be made only on the basis of the information in this Circular.
Any Capespan Shareholder who is in doubt as to his position, including, without limitation, his tax status, should consult an appropriate independent professional advisor in the relevant jurisdiction without delay.

1
CORPORATE INFORMATION AND ADVISORS
The definitions and interpretations commencing on page 9 of this Circular apply mutatis mutandis to this Corporate Information and Advisors section.Directors of Capespan Directors of ZederN Celliers (Chairman) * JF Mouton (Chairman) *
JJ Dique (Managing Director) N Celliers (Chief Executive Officer)AJ de Haast (Financial Director) WL Greeff (Financial Director)J de V du Toit * AE Jacobs *
CA Otto * PJ Mouton *
AZ Farr *# GD Eksteen *#
FA Jacobs *# WA Hanekom *#
JA le Roux *# CA Otto *#
* non-executive # independent * non-executive # independent
Independent Expert to Capespan Transaction Advisor and Sponsor to ZederErnst & Young Advisory Services Proprietary Limited PSG Capital Proprietary Limited(Registration number 2006/018260/07) (Registration number 2006/015817/07)La Gratitude, 1st Floor 1st Floor, Ou Kollege95 – 97 Dorp Street 35 Kerk StreetStellenbosch, 7599 Stellenbosch, 7599(PO Box 656, Cape Town, 8000) (PO Box 7403, Stellenbosch, 7599)
and atCapespan Company Secretary 1st Floor, Building 8PB Fourie Inanda Greens Business ParkVineyards Square North 54 Wierda Road WestVineyards Office Estate Wierda Valley99 Jip de Jager Road Sandton, 2196Bellville, 7530 (PO Box 650957, Benmore, 2010)(PO Box 6133, Tyger Valley, 7536)
Registered office of Capespan Independent Reporting Accountants of Zeder and CapespanVineyards Square North PricewaterhouseCoopers IncorporatedVineyards Office Estate (Registration number 1998/012055/21)99 Jip de Jager Road Capital PlaceBellville, 7530 15 – 21 Neutron Avenue(PO Box 6133, Tyger Valley, 7536) Technopark, Stellenbosch, 7600
(PO Box 57, Stellenbosch, 7599)
Date and place of incorporation of Capespan Legal Advisor to Zeder and Capespan14 July 2008, South Africa Cliffe Dekker Hofmeyr Incorporated
(Registration number 2008/018923/21)Transfer Secretaries 11 Buitengracht StreetComputershare Investor Services Proprietary Limited Cape Town, 8001(Registration number 2004/003647/07) (PO Box 695, Cape Town, 8000)Ground Floor70 Marshall Street Zeder Company SecretaryJohannesburg, 2001 PSG Corporate Services Proprietary Limited(PO Box 61763, Marshalltown, 2107) (Registration number 1996/004840/07)
1st Floor, Ou Kollege35 Kerk StreetStellenbosch, 7600(PO Box 7403, Stellenbosch, 7599)
Registered Office of Zeder1st Floor, Ou Kollege35 Kerk StreetStellenbosch, 7600(PO Box 7403, Stellenbosch, 7599)
Date and place of incorporation of Zeder21 June 2006, South Africa

2
TABLE OF CONTENTS
Page
CORPORATE INFORMATION AND ADVISORS 1
ACTION REQUIRED BY CAPESPAN SHAREHOLDERS IN RELATION TO THE SCHEME 4
IMPORTANT DATES AND TIMES RELATING TO THE SCHEME 7
DEFINITIONS AND INTERPRETATION 9
COMBINED CIRCULAR TO CAPESPAN SHAREHOLDERS
1. Introduction 13
2. Purpose of this Circular 13
3. Information on Zeder 14
4. The Scheme 15
5. Interests of Zeder and Zeder Directors in Capespan securities 20
6. Interests of Zeder Directors in Zeder securities 21
7. Interests of Capespan and Capespan Directors in Zeder securities 21
8. Interests of Capespan Directors in Capespan securities 22
9. Irrevocable undertakings 22
10. Dealings by providers of irrevocable undertakings 22
11. Remuneration of Capespan Directors 22
12. Agreements in relation to the Scheme 22
13. Financial information of Capespan and Zeder 23
14. Intentions regarding the continuation of Capespan’s business and the Capespan Board 23
15. Report of the Independent Expert 23
16. The views of the Independent Board and the Zeder Board on the Scheme 23
17. Capespan Directors’ service contracts 24
18. Other service contracts 24
19. Intended action of Capespan Directors 24
20. Foreign Capespan Shareholders and Exchange Control Regulations 24
21. Tax implications for Capespan Shareholders 24
22. Independent Board responsibility statement 24
23. Zeder responsibility statement 24
24. Advisors’ consents 24
25. Documents available for inspection 25
Annexure 1 Report of the Independent Expert regarding the Scheme 26
Annexure 2 Three-year audited historical financial information of Capespan 31
Annexure 3 Three-year audited historical financial information of Zeder 98
Annexure 4 Pro forma financial information of Zeder 180
Annexure 5 Independent Reporting Accountants’ report on the pro forma financial information of Zeder 185

3
Page
Annexure 6 Pro forma financial effects of the Proposed Transaction on a Capespan Shareholder 187
Annexure 7 Independent Reporting Accountants’ report on the pro forma financial effects on a Capespan Shareholder 188
Annexure 8 Foreign Capespan Shareholders and Exchange Control Regulations 190
Annexure 9 Wording of section 115 and section 164 of the Companies Act 192
Annexure 10 Table of entitlements 198
Annexure 11A Irrevocable undertakings by Capespan Shareholders 199
Annexure 11B Dealings by providers of irrevocable undertakings 201
Notice of General Meeting of Capespan Shareholders 202
Form of proxy in respect of the General Meeting of Capespan Shareholders (yellow) Attached
Form of surrender, transfer and acceptance (blue) Attached

4
ACTION REQUIRED BY CAPESPAN SHAREHOLDERS IN RELATION TO THE SCHEME
The definitions and interpretations commencing on page 9 of the Circular apply to this section on the action required by Capespan Shareholders in relation to the Scheme.
This Circular is important and requires your immediate attention. The action you need to take is set out below. If you are in any doubt as to what action to take, you should consult your Broker, CSDP, banker, accountant, attorney or other advisor. If you have disposed of all of your Capespan Shares, this Circular should be handed to the purchaser to whom, or the Broker, CSDP or other agent through whom, the disposal was effected.
A General Meeting of Capespan Shareholders will be held at 11:00 on Wednesday, 24 June 2015 at Spier Wine Estate, Baden Powell Drive, Stellenbosch, to consider and, if deemed fit, to pass the Scheme Resolution required to approve the Scheme, in terms of which Zeder will acquire all the issued Capespan Shares (save for the Treasury Shares and the Capespan Shares held by the Zeder Group, the Capespan Management Shareholders and by Dissenting Shareholders who do not withdraw their respective demands made in terms of sections 164(5) to 164(8) of the Companies Act or allow any offers by the Company to them in terms of section 164(11) of the Companies Act to lapse). A notice convening such General Meeting is attached to, and forms part of, this Circular.
ACTION REQUIRED BY CAPESPAN SHAREHOLDERS IN RELATION TO THE SCHEME
WHERE IT IS INDICATED BELOW THAT CAPESPAN SHAREHOLDERS SHOULD RETURN THE ATTACHED FORM OF PROXY IN RESPECT OF THE GENERAL MEETING OF CAPESPAN SHAREHOLDERS (YELLOW) OR THE ATTACHED FORM OF SURRENDER, TRANSFER AND ACCEPTANCE (BLUE) OR THEIR DOCUMENTS OF TITLE TO THE TRANSFER SECRETARIES, CAPESPAN SHAREHOLDERS MAY INSTEAD RETURN SUCH DOCUMENTS TO CAPESPAN’S COMPANY SECRETARY (MR PB FOURIE) AT VINEYARDS SQUARE NORTH, VINEYARDS OFFICE ESTATE, 99 JIP DE JAGER ROAD, BELLVILLE, 7530 (P O BOX 6133, TYGER VALLEY, 7536), SHOULD THIS BE MORE CONVENIENT FOR CAPESPAN SHAREHOLDERS.
1. VOTING, ATTENDANCE AND REPRESENTATION AT THE GENERAL MEETING
You may attend, speak and vote at the General Meeting in person (or, if you are a company or other body corporate, be represented by a duly authorised natural person). Alternatively, you may appoint a proxy to represent you at the General Meeting by completing the attached form of proxy in respect of the General Meeting of Capespan Shareholders (yellow) in accordance with its instructions and returning it to the Transfer Secretaries at Ground Floor, 70 Marshall Street, Johannesburg, 2001 (PO Box 61763, Marshalltown, 2107), to be received by them no later than 11:00 on Monday, 22 June 2015, alternatively, such completed forms of proxy may be handed to the chairman of the General Meeting prior to the holding of the vote in respect of the Scheme Resolution.
2. SURRENDER OF DOCUMENTS OF TITLE
2.1 Should you wish to vote in favour of the Scheme at the General Meeting (whether in person or by proxy), or should you wish to surrender your Documents of Title in anticipation of the Scheme becoming operative, kindly also complete the attached form of surrender, transfer and acceptance (blue) in accordance with its instructions and return it, together with the Documents of Title representing all your Capespan Shares, to the Transfer Secretaries at Ground Floor, 70 Marshall Street, Johannesburg, 2001 (PO Box 61763, Marshalltown, 2107), to be received by them by no later than 12:00 on the Scheme Consideration Record Date.
2.2 Documents of Title surrendered prior to 12:00 on the Scheme Consideration Record Date in anticipation of the Scheme becoming operative will be held in trust by the Transfer Secretaries, at the risk of the Capespan Shareholder, pending the Scheme becoming operative.
2.3 Should the Scheme Conditions be fulfilled and the Scheme become operative, Documents of Title held by Capespan Shareholders in respect of their Capespan Shares will cease to be of any value, and shall not be good for delivery, from the Operative Date onwards, other than for surrender in terms of the Scheme and/or the Appraisal Rights.

5
2.4 Should the Scheme not become operative, any Documents of Title surrendered to and held by the Transfer Secretaries will be returned to you by the Transfer Secretaries, at your own risk, by registered post within five Business Days from the date of receipt of the Documents of Title or the date on which it becomes known that the Scheme will not become operative, whichever is the later.
3. SETTLEMENT OF SCHEME CONSIDERATION
3.1 In order to comply with recent legislative changes, the Scheme Consideration Shares may only be issued in Dematerialised form. In this regard, should the Scheme become operative:
3.1.1 Capespan Shareholders who wish to receive the Scheme Consideration in Dematerialised form and who already have an account with a Broker or CSDP, will have their accounts at their Brokers or CSDPs credited with the Scheme Consideration;
3.1.2 Capespan Shareholders who wish to receive the Scheme Consideration in Dematerialised form, but who do not have an account with a Broker or CSDP, will be issued with statements of allocation and will be required to appoint a Broker or CSDP so that Dematerialised Scheme Consideration Shares can be made available to them following implementation of the Scheme; and
3.1.3 Capespan Shareholders who do not wish to hold their Scheme Consideration Shares in Dematerialised form and prefer to hold their Scheme Consideration Shares in certificated form, will be afforded the option to “withdraw” their Dematerialised Scheme Consideration Shares and replace these with a physical Document of Title (please see paragraph 3.5 below).
3.2 If the Scheme becomes operative and you have surrendered your Documents of Title to the Transfer Secretaries at Ground Floor, 70 Marshall Street, Johannesburg, 2001 (PO Box 61763, Marshalltown, 2107) on or before 12:00 on the Scheme Consideration Record Date, then:
3.2.1 should you be a Capespan Shareholder referred to in paragraph 3.1.1 above, your accounts at your Broker or CSDP will be credited with the Scheme Consideration on the Operative Date;
3.2.2 should you be a Capespan Shareholder referred to in paragraph 3.1.2 above, your statement of allocation in respect of the Scheme Consideration will be posted to you, at your risk, within five Business Days of the Operative Date; and
3.2.3 should you be a Capespan Shareholder referred to in paragraph 3.1.3 above, the share certificates in respect of your Scheme Consideration Shares will be posted to you, at your risk, within five Business Days of the Operative Date.
3.3 If the Scheme becomes operative and you surrender your Documents of Title to the Transfer Secretaries at Ground Floor, 70 Marshall Street, Johannesburg, 2001 (PO Box 61763, Marshalltown, 2107) after 12:00 on the Scheme Consideration Record Date, then:
3.3.1 should you be a Capespan Shareholder referred to in paragraph 3.1.1 or 3.1.2 above, as applicable, a statement of allocation in respect of the Scheme Consideration will be posted to you, at your risk, within five Business Days of receipt of your Documents of Title and completed form of surrender, transfer and acceptance; and
3.3.2 should you be a Capespan Shareholder referred to in paragraph 3.1.3 above, the share certificates in respect of your Scheme Consideration Shares will be posted to you, at your risk, within five Business Days of receipt of your Documents of Title and completed form of surrender, transfer and acceptance,
provided that should you:
3.3.3 be a Dissenting Shareholder who subsequently becomes a Scheme Participant pursuant to paragraph 4.7.1 of this Circular, you will still need to surrender your Documents of Title, together with a completed form of surrender, transfer and acceptance (blue), to the Transfer Secretaries at Ground Floor, 70 Marshall Street, Johannesburg, 2001 (PO Box 61763, Marshalltown, 2107) and:
3.3.3.1 your Broker or CSDP account will only be credited with your Scheme Consideration Shares; or

6
3.3.3.2 your statement of allocation in respect of your Scheme Consideration Shares will only be posted to you, at your risk; or
3.3.3.3 the share certificates in respect of your Scheme Consideration Shares will only be posted to you, at your risk,
(as the case may be) on the date set out in paragraph 4.7.1 of this Circular.
3.4 If the Scheme becomes operative and you fail to surrender your Documents of Title and completed form of surrender, transfer and acceptance (blue) to the Transfer Secretaries within three years after the Operative Date or, if you are a Dissenting Shareholder who subsequently becomes a Scheme Participant pursuant to paragraph 4.7.1 of this Circular, within three years after the date on which you subsequently became a Scheme Participant pursuant to paragraph 4.7.1 of this Circular, the Scheme Consideration due to you will be disposed of at the ruling market price and the disposal consideration, less the costs incurred in disposing of the Scheme Consideration, will be paid to the benefit of the Guardian’s Fund of the Master of the High Court, from which it may be claimed by you, subject to the requirements imposed by the Master of the High Court. In this regard, such Scheme Participants irrevocably authorise and appoint Zeder, in rem suam, with full power of substitution, to act as agent in the name, place and stead of such Scheme Participants to dispose of the Scheme Consideration and to pay the proceeds to the benefit of the Guardian’s Fund in the aforesaid manner.
3.5 In the case of the Capespan Shareholders who wish to “withdraw” their Dematerialised Scheme Consideration Shares as provided for above and whose registered addresses in the Register are outside of the Common Monetary Area, or where the relevant Capespan Shares certificates are restrictively endorsed in terms of the Exchange Control Regulations, the following will apply:
3.5.1 for non-residents who are emigrants, the replacement Documents of Title will be sent to the Capespan Shareholder’s authorised dealer in foreign exchange in South Africa controlling their blocked assets; and
3.5.2 for all other non-residents, the replacement Documents of Title will be restrictively endorsed “non-resident” in terms of the Exchange Control Regulations.
Should you have any questions regarding the above, please contact your broker or CSDP or telephone the Transfer Secretaries on 086 110 0634 (or +27 11 370 5000 if phoning from outside South Africa) on every Business Day between 08:30 and 16:00, and they will be able to assist and advise you on what you need to do.

7
IMPORTANT DATES AND TIMES RELATING TO THE SCHEME
The definitions and interpretations commencing on page 9 of this Circular shall apply to this section.
2015
Last Practicable Date Friday, 15 May
Record date for Capespan Shareholders to be recorded in the Register in order to receive this Circular Friday, 15 May
Circular posted to Capespan Shareholders and notice convening the General Meeting released on SENS on Monday, 25 May
Notice of General Meeting published in the South African press on Tuesday, 26 May
Scheme Voting Record Date being 17:00 on Friday, 19 June
Proxy forms to be lodged at the Transfer Secretaries or Capespan’s company secretary by 11:00 on Monday, 22 June
Last date and time for Capespan Shareholders to give notice to Capespan objecting, in terms of section 164(3) of the Companies Act, to the special resolution approving the Scheme for purposes of the Appraisal Rights by 11:00 on Wednesday, 24 June
Proxy forms not lodged with the Transfer Secretaries or Capespan’s company secretary to be handed to the chairman of the General Meeting before 11:00 Wednesday, 24 June
General Meeting of Capespan Shareholders to be held at 11:00 on Wednesday, 24 June
Results of General Meeting released on SENS on Wednesday, 24 June
Results of General Meeting published in the South African press on Thursday, 25 June
If the Scheme is approved by Capespan Shareholders at the General Meeting:
Last date for Capespan Shareholders who voted against the Scheme to require Capespan to seek court approval for the Scheme in terms of section 115(3)(a) of the Companies Act (where applicable) on Wednesday, 1 July
Last date for Capespan Shareholders who voted against the Scheme to be granted leave by the court to apply for a review of the Scheme in terms of section 115(3)(b) of the Companies Act on Wednesday, 8 July
Last date for Capespan to send objecting Capespan Shareholders notices of the adoption of the special resolution approving the Scheme, in accordance with section 164(4) of the Companies Act, on Wednesday, 8 July

8
2015
Action
The following dates assume that neither court approvals nor the review of the Scheme is required and all other Scheme Conditions are fulfilled and will be confirmed in the finalisation announcement if the Scheme becomes unconditional:
Finalisation Date expected to be on Thursday, 9 July
Finalisation Date announcement expected to be released on SENS on Thursday, 9 July
Finalisation Date announcement expected to be published in the South African press on Friday, 10 July
Scheme LDT expected on Friday, 17 July
Scheme Consideration Record Date to be recorded in the Register in order to receive the Scheme Consideration expected to be on or about Friday, 24 July
Expected Operative Date of the Scheme on Monday, 27 July
Issue of Scheme Consideration Shares expected to take place on and trading in the Scheme Consideration Shares expected to commence on Monday, 27 July
Notes:
1. The above dates and times are subject to such changes as may be agreed to by Capespan and Zeder and approved by the JSE and/or the Takeover Panel, if required. If the Scheme Conditions are not met by 31 August 2015, an updated timetable will be released on SENS and published in the South African press.
2. Capespan Shareholders who wish to exercise their Appraisal Rights are referred to Annexure 9 to this Circular for purposes of determining the relevant timing for the exercise of their Appraisal Rights.
3. If the General Meeting is adjourned or postponed, forms of proxy submitted for the initial General Meeting will remain valid in respect of any adjournment or postponement of the General Meeting.
4. Although the salient dates and times are stated to be subject to change, such statement may not be regarded as consent or dispensation for any change to time periods which may be required in terms of the Companies Regulations, where applicable, and any such consents or dispensations must be specifically applied for and granted.
5. All times referred to in this Circular are references to South African time.

9
DEFINITIONS AND INTERPRETATION
In this Circular, unless the context indicates a contrary intention, a word or an expression which denotes any gender includes the other genders, a natural person includes a juristic person and vice versa, the singular includes the plural and vice versa and the following words and expressions bear the meanings assigned to them below:
“Appraisal Rights” the rights afforded to Capespan Shareholders in terms of section 164 of the Companies Act as set out in Annexure 9 to this Circular;
“Broker” any person registered as a “broking member (equities)” in terms of the Rules of the JSE and in accordance with the provisions of the Financial Markets Act;
“Business Day” a day which is not a Saturday, Sunday or official public holiday in South Africa;
“Capespan” or “the Company” Capespan Group Limited (Registration number 2008/016971/06), a public company duly registered and incorporated with limited liability in South Africa;
“ Capespan Board” or “Capespan Directors”
the directors of Capespan as at the Last Practicable Date, whose names are set out in the “Corporate Information and Advisors” section of this Circular;
“ Capespan Management Shareholders”
collectively Messrs JJ Dique, AJ de Haast, DI Ferreira, AF Fuchs, L van Biljon and AG Peterson, being members of Capespan’s management who hold a direct and/or indirect beneficial interest in Capespan Shares;
“Capespan Shareholders” means the holders of Capespan Shares;
“Capespan Shares” ordinary shares of no par value in the share capital of Capespan;
“cents” South African cents, in the official currency of South Africa;
“Certificated” in relation to a share of a company, such share as evidenced by a Document of Title;
“Circular” this circular to Capespan Shareholders, dated Monday, 25 May 2015, together with the annexures hereto, and including the Notice of General Meeting, the form of proxy (yellow) in relation to the General Meeting and the form of surrender, transfer and acceptance (blue);
“Common Monetary Area” South Africa, the Republic of Namibia and the Kingdoms of Lesotho and Swaziland;
“Companies Act” the Companies Act, No. 71 of 2008, as amended from time to time;
“Companies Regulations” the Companies Regulations, 2011, promulgated under the Companies Act, as amended from time to time;
“Consideration Shares” the Zeder Shares to be issued to the Scheme Participants in terms of the Scheme;
“CPL” Capespan Proprietary Limited (Registration number 1998/022574/07), a private company duly registered and incorporated with limited liability in South Africa, being a wholly-owned subsidiary of Capespan;
“CPL Treasury Shares” 32 231 189 Capespan Shares held by CPL, constituting 9.1% of the issued share capital of Capespan;
“CSDP” Central Securities Depository Participant as defined in the Financial Markets Act;

10
“Dematerialise” or “Dematerialised” or “Dematerialisation”
the process by which Certificated shares are converted into an electronic format as Dematerialised shares and recorded in a company’s uncertificated securities register administered by a CSDP;
“Dissenting Shareholders” Capespan Shareholders who validly exercise their Appraisal Rights by demanding, in terms of sections 164(5) to 164(8) of the Companies Act, that the Company pay them the fair value of all of their Capespan Shares;
“Document of Title” share certificates, certified transfer deeds, balance receipts or any other physical documents of title pertaining to the Capespan Shares in question acceptable to the Capespan Board;
“Exchange Control Regulations” the Exchange Control Regulations, 1961, as amended from time to time, issued in terms of section 9 of the Currency and Exchanges Act, No. 9 of 1933, as amended from time to time;
“Finalisation Date” the date on which all the Scheme Conditions shall have been fulfilled or waived, as the case may be, as set out in paragraph 4.4 of this Circular;
“Financial Markets Act” the Financial Markets Act, No. 19 of 2012, as amended from time to time;
“Firm Intention Offer Letter” the letter from Zeder to the Capespan Board, dated Tuesday, 7 April 2015, confirming Zeder’s conditional firm intention to make an offer to acquire all Capespan Shares (excluding the Treasury Shares) not held by the Zeder Group and the Capespan Management Shareholders by way of the Scheme, the terms of which letter were accepted by the Capespan Board (and upon the subsequent fulfilment and waiver of certain preconditions, the Firm Intention Offer Letter became unconditional);
“Foreign Capespan Shareholder” a Capespan Shareholder who is a non-resident of South Africa, as contemplated in the Exchange Control Regulations;
“FSB” Financial Services Board;
“General Meeting” the general meeting of Capespan Shareholders to be held at 11:00 on Wednesday, 24 June 2015 at Spier Wine Estate, Baden Powell Drive, Stellenbosch, to consider and, if deemed fit, approve the Scheme Resolution;
“Independent Board” collectively, Messrs AZ Farr, JA le Roux and FA Jacobs, being the Capespan Directors that the Company has indicated are independent directors in relation to the Scheme for purposes of the Companies Regulations;
“Independent Expert” Ernst & Young Advisory Services Proprietary Limited (Registration number 2006/018260/07), a private company duly registered and incorporated with limited liability in South Africa;
“ Independent Reporting Accountants”
PricewaterhouseCoopers Incorporated (Registration number 1998/012055/21), a personal liability company incorporated under the laws of South Africa;
“JSE” the exchange, licensed under the Financial Markets Act, operated by JSE Limited (Registration number 2005/022939/06), a public company incorporated under the laws of South Africa;
“JSE Listings Requirements” the Listings Requirements of the JSE in force as at the Last Practicable Date;
“Last Practicable Date” the last practicable date prior to the finalisation of this Circular, being Friday, 15 May 2015;

11
“Notice of General Meeting” the notice of the General Meeting of Capespan Shareholders forming part of this Circular;
“Operative Date” the date on which the Scheme becomes operative, being the first Business Day immediately following the Scheme Consideration Record Date, which operative date is expected to be Monday, 27 July 2015;
“Proposed Transaction” the transaction pursuant to which Zeder intends to acquire all of the issued Capespan Shares, excluding the Treasury Shares and the Capespan Shares already owned by the Zeder Group and by the Capespan Management Shareholders, pursuant to the Scheme;
“Rand” or “R” South African Rand, in the official currency of South Africa;
“Register” Capespan’s securities register;
“Scheme” the scheme of arrangement in terms of section 114(1) of the Companies Act, proposed by the Capespan Board between Capespan and the Capespan Shareholders (excluding the Zeder Group and Capespan Management Shareholders), as more fully described in paragraph 4 of this Circular, in terms of which Zeder will, if the Scheme becomes operative, acquire all Scheme Shares held by Scheme Participants for the Scheme Consideration, subject to any modification or amendment to the scheme of arrangement agreed to in writing by Zeder and Capespan and, if necessary, the Takeover Panel, which modification or amendment may not be detrimental to Scheme Participants;
“Scheme Conditions” the conditions precedent to which the Scheme is subject, as set out in paragraph 4.4 of this Circular;
“Scheme Consideration” the scheme consideration of 85 (eighty five) Zeder Shares for every 100 (one hundred) Scheme Shares disposed of by Scheme Participants in terms of the Scheme, rounded to the nearest whole number and credited as fully paid (the Scheme Consideration will not have a cash alternative);
“Scheme Consideration Record Date”
the latest time and date for holders of Capespan Shares to be registered as such in the Register in order to receive the Scheme Consideration, being 17:00 on Friday, 24 July 2015;
“Scheme Consideration Shares” the Zeder Shares to be issued by Zeder as the Scheme Consideration, with a maximum of 69 557 940 Zeder Shares to be issued to Scheme Participants as consideration for their Capespan Shares;
“Scheme LDT” the last day to trade Capespan Shares in order to be registered in the Register on the Scheme Consideration Record Date, which is expected to be at 17:00 on Friday, 17 July 2015;
“Scheme Participants” Capespan Shareholders who are entitled to receive the Scheme Consideration, being those Capespan Shareholders who are registered as such in the Register on the Scheme Consideration Record Date, except for the Zeder Group, Capespan Management Shareholders, the holders of the Treasury Shares and Dissenting Shareholders who have not withdrawn their demands made in terms of sections 164(5) to 164(8) of the Companies Act or allowed any offers made to them in terms of section 164(11) of the Companies Act to lapse;
“Scheme Resolution” means the special resolution by Capespan Shareholders, as contemplated in section 115(2) of the Companies Act, required for the approval of the Scheme, as detailed in the Notice of General Meeting;
“Scheme Shares” all Capespan Shares, excluding the Treasury Shares, held by Scheme Participants on the Scheme Consideration Record Date;

12
“Scheme Voting Record Date” the last time and date for Capespan Shareholders to be recorded in the Register in order to be eligible to attend, speak and vote at the General Meeting (or any adjournment thereof), being 17:00 on Friday, 19 June 2015;
“SENS” the Stock Exchange News Service of the JSE;
“Share Incentive Scheme” the Capespan Group Share Incentive Scheme implemented in terms of the Trust Deed in order to enable participants to obtain and exercise options and pursuant thereto to acquire Capespan Shares upon the exercise of such options, the full details of which are set out in the Trust Deed;
“South Africa” the Republic of South Africa;
“Strate” the settlement and clearing system used by the JSE, managed by Strate Proprietary Limited (Registration number 1998/022242/07), a limited liability private company duly incorporated in South Africa;
“Takeover Panel” the Takeover Regulation Panel established in terms of section 196 of the Companies Act;
“Transfer Secretaries” or “Computershare”
Computershare Investor Services Proprietary Limited (Registration number 2004/003647/07), a private company incorporated under the company laws of South Africa;
“Treasury Shares” the CPL Treasury Shares and the Trust Treasury Shares;
“Trust” the trustees for the time being of the Capespan Group Share Incentive Trust (Master’s reference number IT020273/2014), established in terms of the Trust Deed to facilitate and govern the implementation of the Share Incentive Scheme;
“Trust Deed” the written trust deed entered into between Capespan, Messrs CA Otto, N Celliers and A Rossouw (as the first trustees) on or about 13 May 2014, pursuant to which, inter alia, the Trust was established, all on the terms and conditions contained therein;
“Trust Treasury Shares” 653 651 Capespan Shares held by the Trust, constituting 0.2% of the issued share capital of Capespan;
“VWAP” volume weighted average price;
“Zeder” Zeder Investments Limited (Registration number 2006/019240/06), a public company incorporated under the laws of South Africa, the shares of which are listed on the JSE;
“Zeder Board” or “Zeder Directors” the directors of Zeder as at the Last Practicable Date, whose names are set in the “Corporate Information and Advisors” section of this Circular;
“Zeder Group” Zeder and its subsidiaries; and
“Zeder Shares” ordinary no par value shares in the issued share capital of Zeder.
13
CAPESPAN GROUP LIMITED(Incorporated in the Republic of South Africa)
(Registration number 2008/016971/06)(“Capespan”)
ZEDER INVESTMENTS LIMITED(Incorporated in the Republic of South Africa)
(Registration number 2006/019240/06)Share code: ZED ISIN code: ZAE000088431
(“Zeder”)
COMBINED CIRCULAR TO CAPESPAN SHAREHOLDERS
Directors of Capespan Directors of ZederN Celliers (Chairman) * JF Mouton (Chairman) *
JJ Dique (Managing Director) N Celliers (Chief Executive Officer)AJ de Haast (Financial Director) WL Greeff (Financial Director)J de V du Toit * AE Jacobs *
CA Otto * PJ Mouton *
AZ Farr *# GD Eksteen *#
FA Jacobs *# WA Hanekom *#
JA le Roux *# CA Otto *#
* non-executive # independent
1. INTRODUCTION
1.1 Capespan Shareholders are referred to the joint announcement published by Zeder and Capespan on SENS and on their respective websites (www.zeder.co.za and www.capespangroup.com) on 8 April 2015 and in the press on 9 April 2015, advising of the firm intention of Zeder to make an offer to acquire all the Capespan Shares (excluding the Treasury Shares) not already held by the Zeder Group and the Capespan Management Shareholders by way of a scheme of arrangement in terms of section 114 of the Companies Act, on the terms set out in paragraph 4 of this Circular.
1.2 Should the Scheme be implemented:
1.2.1 Zeder will become the registered and beneficial owner of all the issued Capespan Shares (other than the Treasury Shares and the Capespan Shares held by the Capespan Management Shareholders and Dissenting Shareholders that do not withdraw their respective demands made in terms of sections 164(5) to 164(8) of the Companies Act or allow any offers by the Company to them in terms of section 164(11) of the Companies Act to lapse, as more fully described in paragraph 4.7 below);
1.2.2 Scheme Participants will receive 85 (eighty five) Zeder Shares for every 100 (one hundred) Capespan Shares held by them on the Scheme Consideration Record Date (the Scheme Consideration will not have a cash alternative); and
1.2.3 pursuant to an exemption granted by the Takeover Panel in terms of section 119(6) of the Companies Act, the Share Incentive Scheme will run its course.
2. PURPOSE OF THIS CIRCULAR
The purpose of this Circular is to:
2.1 provide Capespan Shareholders with information regarding the Scheme;
2.2 provide Capespan Shareholders with the Independent Expert’s report in respect of the Scheme, prepared in terms of section 114(3) of the Companies Act;
2.3 advise Capespan Shareholders of the Independent Board’s opinion in respect of the Scheme (as supported by the Independent Expert’s report); and

14
2.4 convene the General Meeting to consider and, if deemed fit, approve the Scheme Resolution as set out in the Notice of General Meeting.
3. INFORMATION ON ZEDER
3.1 Zeder is a long-term value investor with a primary focus on agribusinesses, specifically in the food and beverages sectors, and is listed on the JSE’s main board.
3.2 Zeder’s portfolio of investments has been refined in recent years by moving from several smaller investments to fewer, larger commitments. This is in line with Zeder’s value creation strategy, which relies heavily on focusing efforts and resources on specific investments, and influencing strategy, operations, structures and financing.
3.3 Zeder’s current core investments provide an ideal platform for Zeder to pursue its growth strategy and provide Zeder with a strong presence across the agribusiness industry. Zeder will continue to look actively at adding specific investments to their portfolio in strategic and sizable businesses, with proven track records and sound leadership.
3.4 Zeder’s portfolio includes the following investments:
3.4.1 Zeder holds a 31.7% economic interest and a 27.3% voting interest in Pioneer Food Group Limited (“Pioneer Foods”). Pioneer Foods is a leading food and beverage producer and distributor in Southern Africa, with annual revenue in excess of R20 billion. It boasts an impressive leadership team, intent on optimising current operations and growing into new and international markets by leveraging its broad consumer product basket and state-of–the-art infrastructure. Supplying over 80 countries, Pioneer Foods’ product portfolio spans bread, pasta and biscuits to fruit juices, fresh produce and some of the best-known cereal brands;
3.4.2 Zeder holds a 26.4% direct interest in Quantum Foods Holdings Limited (“Quantum Foods”) following its unbundling from Pioneer Foods. Quantum Foods is a diversified feeds and poultry business providing quality animal protein to selected South African and African markets. After weathering a volatile industry cycle the past couple of years, Quantum Foods released encouraging results for the year ended 30 September 2014 reporting headline earnings per share of 11 cents compared to a 34 cents per share headline loss in the previous year. Although Quantum Foods will remain exposed to a highly cyclical industry, it has restructured its business and embarked on a clearly defined growth strategy to generate sustainable profits and cash flows from its established South African operations, while growing its footprint in the rest of Africa;
3.4.3 Zeder has a 71.2% shareholding in Capespan (net of the Treasury Shares). Capespan is involved in global fruit production, procurement, marketing, logistics, warehousing and distribution. Over the past 70 years, Capespan has developed its portfolio into three complementary divisions, namely Fruit, Farming and Logistics, which are increasingly less interdependent and individually more profitable. Capespan has an annual turnover in excess of R7 billion and has operations in 12 countries, providing services and produce to more than 60 countries across four continents;
3.4.4 Zeder has a 37.9% voting interest in Kaap Agri Limited (“Kaap Agri”). Kaap Agri is predominantly a retail, trade and services group which supplies a wide variety of products and services to the agricultural sector and general public, with a market reach that spans over 183 operating points in Southern Africa. Retail trading represents approximately 80% of group operating profits, while group revenue is in excess of R4.8 billion;
3.4.5 Zeder holds 92% of Zaad Holdings Limited (“Zaad”), which acts as the holding company for Zeder’s investments in two seed companies – Agricol Proprietary Limited and Klein Karoo Seed Marketing Proprietary Limited. With over half a century of expertise and trusted heritage to support them, the two companies are well-established producers, marketers and distributors of a wide variety of agricultural seeds across several countries in Africa. Zaad delivered over R900 million in turnover in its most recent financial year and is driving an aggressive growth strategy in Southern Africa; and

15
3.4.6 Zeder holds 76.5% of Agrivision Africa (previously Chayton Africa) (“Agrivision”), a Mauritian-based investment company focusing on the grain value chain. It currently has three main investments: Chobe Agrivision Company Limited and Somawhe Estates Limited, being companies focused on the acquisition, development and management of large-scale commercial grain operations, and Mpongwe Milling (2009) Limited, a staple foods manufacturer located in the Zambian copperbelt. Despite the high entry cost and challenges associated with farming development in the region, Agrivision is in a prime industry position to maximise opportunities in the local and global primary food market. The total irrigated land capacity in the past 18 months of ownership has increased to over 4 100 hectares and continues to grow.
3.5 For further information regarding Zeder, Capespan Shareholders are referred to Zeder’s website, www.zeder.co.za.
4. THE SCHEME
4.1 Rationale for Zeder
4.1.1 Zeder wishes to acquire all the Capespan Shares (excluding the Treasury Shares) not already held by the Zeder Group and the Capespan Management Shareholders, for the following reasons:
4.1.1.1 Zeder and the Capespan Management Shareholders collectively hold nearly 75% of the issued share capital of Capespan and basically control Capespan;
4.1.1.2 Zeder has no intention to list Capespan in the short to medium term; and
4.1.1.3 Zeder can improve cash management and various operational initiatives throughout the larger group for the benefit of all shareholders if it owned all of the shares in Capespan.
4.1.2 Accordingly, Zeder wishes to implement the Scheme in order to be fair to minority shareholders, reduce the administrative and corporate burden of Capespan, while at the same time maximising the financial returns to all current Capespan and Zeder shareholders.
4.2 Rationale for Capespan
4.2.1 The Capespan Board wishes to propose the Scheme for the following reasons:
4.2.1.1 Capespan is basically controlled by Zeder and the Capespan Management Shareholders who together hold nearly 75% of the issued share capital of Capespan (net of the Treasury Shares);
4.2.1.2 the administrative costs and corporate burden associated with a very large group of fragmented minority shareholders, who jointly do not exert influence over Capespan, are not ideal or sustainable;
4.2.1.3 Capespan Shares historically traded through Capespan’s over-the-counter (“OTC”) platform;
4.2.1.4 following the publication of the final directive issued by the FSB on 11 July 2014 regarding the facilitation by companies of trading in their shares, Capespan initially decided to suspend its OTC platform as well as all “over-the-counter” trading in Capespan Shares with effect from 31 July 2014 and has thereafter allowed trading on an amended basis that complies with FSB regulations, but with very little liquidity; and
4.2.1.5 Capespan wishes to find an attractive liquidity mechanism or alternative for its minority shareholders.
4.2.2 Accordingly, the Scheme will provide Capespan Shareholders with:
4.2.2.1 an opportunity to align themselves fully with Zeder shareholders and benefit from group synergies that may be derived;

16
4.2.2.2 an opportunity to convert their illiquid investment in Capespan, at a substantial premium, to a more liquid instrument in a listed entity, Zeder; and
4.2.2.3 an opportunity to diversify their investment in Capespan into a more diversified agri, food and beverage portfolio.
4.2.3 Given the aforementioned factors, the Independent Board believes that it is in the interests of Capespan and Capespan Shareholders that they be given the opportunity to consider the Proposed Transaction.
4.3 Terms and conditions of the Scheme
4.3.1 In terms of section 114(1) of the Companies Act, the Capespan Board proposes the Scheme as set out in this paragraph 4 between the Company and the Capespan Shareholders (other than the Zeder Group and the Capespan Management Shareholders). The Scheme will constitute an “affected transaction” as defined in section 117(1)(c) of the Companies Act and will be regulated by the Companies Act, the Companies Regulations and the Takeover Panel.
4.3.2 In terms of the Scheme, Zeder will acquire the Scheme Shares from the Scheme Participants for the Scheme Consideration, resulting in Zeder holding all of the issued Capespan Shares, other than the Treasury Shares and the Capespan Shares held by the Capespan Management Shareholders.
4.3.3 If the Scheme takes effect and becomes operative:
4.3.3.1 the Scheme Participants (whether they voted in favour of the Scheme or not, or failed to vote) shall be deemed to have disposed of their Scheme Shares, free of encumbrances, to Zeder on the Operative Date in exchange for the Scheme Consideration and Zeder shall be deemed to have acquired registered and beneficial ownership of all the Scheme Shares as of the Operative Date;
4.3.3.2 the disposal and transfer by each Scheme Participant of the Scheme Shares held by such Scheme Participant to Zeder and the acquisition of ownership of these Scheme Shares by Zeder pursuant to the provisions of the Scheme, shall be effected on the Operative Date;
4.3.3.3 each Scheme Participant shall be deemed to have transferred to Zeder, on the Operative Date, all of the Scheme Shares held by such Scheme Participant, without any further act or instrument being required; and
4.3.3.4 Scheme Participants shall be entitled to receive the Scheme Consideration, subject to the remaining provisions of this paragraph 4.
4.3.4 Each Scheme Participant irrevocably and in rem suam authorises Capespan, as principal, with full power of substitution, to cause the Scheme Shares disposed of by the Scheme Participants in terms of the Scheme to be transferred to, and registered in the name of, Zeder on or at any time after the Operative Date, and to do all such things and take all such steps (including the signing of any transfer form) as Capespan in its discretion considers necessary in order to effect that transfer and registration.
4.3.5 The Scheme Consideration shall be settled, in full, in accordance with the terms of the Scheme without regard to any lien, right of set-off, counterclaim or other analogous right to which Zeder may otherwise be, or claim to be, entitled against any Scheme Participant.
4.3.6 Capespan, as principal, shall procure that Zeder complies with its obligations under the Scheme, and Capespan alone shall have the right to enforce those obligations (if necessary) against Zeder.
4.3.7 The rights of the Scheme Participants to receive the Scheme Consideration will be rights enforceable by Scheme Participants against Capespan only. Scheme Participants will be entitled to require Capespan to enforce its rights in terms of the Scheme against Zeder.
4.3.8 The effect of the Scheme, inter alia, will be that Zeder will, with effect from the Operative Date, become the registered and beneficial owner of all the Scheme Shares.

17
4.3.9 Zeder and Capespan agreed that, upon the Scheme becoming operative, they will give effect to the terms and conditions of the Scheme and will take all actions and sign all necessary documents to give effect to the Scheme.
4.3.10 The Scheme shall be governed by the laws of South Africa only. Every Scheme Participant shall be deemed to have irrevocably submitted to the non-exclusive jurisdiction of the courts of South Africa in relation to all matters arising out of or in connection with the Scheme.
4.4 Scheme Conditions
4.4.1 The Scheme will be subject to (and will become operative on the Operative Date upon) the fulfilment of the following Scheme Conditions on or before 31 August 2015:
4.4.1.1 that the Scheme be approved by the requisite majority of Capespan Shareholders, as contemplated in section 115(2)(a) of the Companies Act, and, to the extent required, by a High Court in terms of section 115(2)(c) of the Companies Act, and, if applicable, that Capespan does not treat the Scheme Resolution as a nullity, as contemplated in section 115(5)(b) of the Companies Act;
4.4.1.2 that, in relation to any objections to the Scheme by Capespan Shareholders:
4.4.1.2.1 no Capespan Shareholders give notice objecting to the Scheme, as contemplated in section 164(3) of the Companies Act and vote against the Scheme Resolution proposed at the General Meeting to approve the Scheme; or
4.4.1.2.2 if Capespan Shareholders give notice objecting to the Scheme, as contemplated in section 164(3) of the Companies Act, and vote against the Scheme Resolution proposed at the General Meeting, Capespan Shareholders holding no more than 5% of all Capespan Shares eligible to be voted at the General Meeting give such notice and vote against the resolutions proposed at the General Meeting; or
4.4.1.2.3 if Capespan Shareholders holding more than 5% of all Capespan Shares eligible to vote at the General Meeting give notice objecting to the Scheme, as contemplated in section 164(3) of the Companies Act, and vote against the resolution proposed at the General Meeting, the relevant Capespan Shareholders do not exercise their appraisal rights, by giving valid demands in terms of sections 164(5) to 164(8) of the Companies Act within 30 Business Days following the General Meeting, in respect of more than 5% of the Capespan Shares eligible to be voted at the General Meeting; and
4.4.1.3 that, in respect of the implementation of the Scheme and only to the extent that same may be applicable, the approval of the Takeover Panel and any other relevant regulatory authorities (either unconditionally or subject to conditions acceptable to Zeder) be obtained.
4.4.2 The Scheme Conditions in paragraphs 4.4.1.1 and 4.4.1.3 cannot be waived.
4.4.3 The Scheme Condition in paragraph 4.4.1.2 may be waived by Zeder upon written notice to Capespan, prior to the date for fulfilment of the relevant Scheme Condition.
4.4.4 Zeder will be entitled to extend the date for the fulfilment of any of the Scheme Conditions, by up to 60 days, in its own discretion, upon written notice to Capespan, but shall not be entitled to extend the date to a date later than the aforesaid 60 day period without the prior written consent of Capespan.
4.5 Scheme Consideration
4.5.1 Subject to paragraph 4.6, if the Scheme becomes unconditional and is implemented, each Scheme Participant will receive the Scheme Consideration for each Scheme Share held by such Scheme Participant as at the Scheme Consideration Record Date.

18
4.5.2 Zeder’s 30-day VWAP as at 31 March 2015 was R7.64, thereby implying an offer value of R6.50 per Capespan Share, representing a 64% premium to Capespan’s 30-day VWAP price of R3.97 per share as at the same date.
4.5.3 On 31 March 2015, the share price of Zeder was R8.34 per share, valuing the offer for the Scheme Shares at R7.09 per share or a premium of 79% to the 30-day VWAP of Capespan of R3.97 per share, as at 31 March 2015.
4.5.4 No fraction of a Scheme Consideration Share will be issued and any fraction of a Scheme Consideration Share to which any Scheme Participant is entitled in terms of the Scheme will, if it comprises 0.5 or more of a Scheme Consideration Share, be rounded up, otherwise it will be rounded down, to the nearest whole Scheme Consideration Share, as set out in the table of entitlements provided in Annexure 10.
4.6 Settlement of the Scheme Consideration
Capespan Shareholders are referred to the section entitled “Action required by Capespan Shareholders in relation to the Scheme” , commencing on page 4 of the Circular, for further information regarding the steps to be taken by Capespan Shareholders in relation to the settlement of the Scheme Consideration.
4.6.1 Capespan or its agents will administer and effect settlement of the Scheme Consideration to Scheme Participants.
4.6.2 In order to comply with recent legislative changes, the Scheme Consideration Shares may only be issued in Dematerialised form.
4.6.3 Should the Scheme become operative:
4.6.3.1 Scheme Participants who wish to receive the Scheme Consideration in Dematerialised form and who already have an account with a Broker or CSDP, will have their accounts at their Brokers or CSDPs credited with the Scheme Consideration;
4.6.3.2 Scheme Participants who wish to receive the Scheme Consideration in Dematerialised form, but who do not have an account with a Broker or CSDP, will be issued with statements of allocation and will be required to appoint a Broker or CSDP so that Dematerialised Scheme Consideration Shares can be made available to them following implementation of the Scheme; and
4.6.3.3 Scheme Participants who do not wish to hold their Scheme Consideration Shares in Dematerialised form and prefer to hold their Scheme Consideration Shares in certificated form, will be afforded the option to “withdraw” their Dematerialised Scheme Consideration Shares and replace these with a physical Document of Title (please see paragraph 4.6.7 below).
4.6.4 Should the Scheme become operative and should Scheme Participants have surrendered their Documents of Title to the Transfer Secretaries (or Capespan’s company secretary) on or before 12:00 on the Scheme Consideration Record Date, then:
4.6.4.1 those Scheme Participants referred to in paragraph 4.6.3.1 above will have their accounts at their Brokers or CSDPs credited with the Scheme Consideration on the Operative Date;
4.6.4.2 those Scheme Participants referred to in paragraph 4.6.3.2 above will have their statements of allocation in respect of the Scheme Consideration posted to them, at their risk, within five Business Days of the Operative Date; and
4.6.4.3 those Scheme Participants referred to in paragraph 4.6.3.3 above will have the share certificates in respect of their Scheme Consideration Shares posted to them, at their risk, within five Business Days of the Operative Date.

19
4.6.5 Should the Scheme become operative and should Scheme Participants surrender their Documents of Title to the Transfer Secretaries (or Capespan’s company secretary) after 12:00 on the Scheme Consideration Record Date, then:
4.6.5.1 those Scheme Participants referred to in paragraph 4.6.3.1 or 4.6.3.2 above, as applicable, will have statements of allocation in respect of the Scheme Consideration posted to them, at their risk, within five Business Days of receipt of their Documents of Title and completed form of surrender, transfer and acceptance;
4.6.5.2 those Scheme Participants referred to in paragraph 4.6.3.3 above will have the share certificates in respect of their Scheme Consideration Shares posted to them, at their risk, within five Business Days of receipt of their Documents of Title and completed form of surrender, transfer and acceptance,
provided that Dissenting Shareholders who subsequently become Scheme Participants pursuant to paragraph 4.7.1 will still need to surrender their Documents of Title, together with a completed form of surrender, transfer and acceptance, to the Transfer Secretaries (or Capespan’s company secretary) and:
(i) their Broker or CSDP accounts will only be credited with their Scheme Consideration Shares; or
(ii) their statements of allocation in respect of their Scheme Consideration Shares will only be posted to them, at their risk; or
(iii) the share certificates in respect of their Scheme Consideration Shares will only be posted to them, at their risk,
(as the case may be) on the date set out in paragraph 4.7.1 of this Circular.
4.6.6 Should the Scheme become operative and any Scheme Participant fail to surrender their Documents of Title and completed forms of surrender, transfer and acceptance to the Transfer Secretaries (or Capespan’s company secretary) within three years after the Operative Date or, if they are Dissenting Shareholders who subsequently become Scheme Participants pursuant to paragraph 4.7.1, within three years after the date on which they subsequently became Scheme Participants pursuant to paragraph 4.7.1, the Scheme Consideration due to those Scheme Participants will be disposed of at the ruling market price and the disposal consideration, less the costs incurred in disposing of the Scheme Consideration, will be paid to the benefit of the Guardian’s Fund of the Master of the High Court, from which it may be claimed by such Scheme Participant, subject to the requirements imposed by the Master of the High Court. In this regard such Scheme Participants irrevocably authorise and appoint Zeder, in rem suam, with full power of substitution, to act as agent in the name, place and stead of such Scheme Participants to dispose of the Scheme Consideration and to pay the proceeds to the benefit of the Guardian’s Fund in the aforesaid manner.
4.6.7 In the case of the Scheme Participants who wish to “withdraw” their Dematerialised Scheme Consideration Shares as provided for above and whose registered addresses in the Register are outside of the Common Monetary Area, or where the relevant Capespan Shares certificates are restrictively endorsed in terms of the Exchange Control Regulations, the following will apply:
4.6.7.1 for non-residents who are emigrants, the replacement Documents of Title will be sent to the Scheme Participant’s authorised dealer in foreign exchange in South Africa controlling their blocked assets; and
4.6.7.2 for all other non-residents, the replacement Documents of Title will be restrictively endorsed “non-resident” in terms of the Exchange Control Regulations.

20
4.7 Dissenting Shareholders
4.7.1 Any Dissenting Shareholder that withdraws its demand made in terms of sections 164(5) to 164(8) of the Companies Act, either voluntarily or pursuant to an order of Court, or that allows an offer by the Company in terms of section 164(11) of the Companies Act to lapse without exercising its rights in terms of section 164(14) of the Companies Act, shall, if that Dissenting Shareholder withdrew its demand or allowed the offer to lapse:
4.7.1.1 on or prior to the Scheme LDT, be deemed to be a Scheme Participant and be subject to the provisions of the Scheme; and
4.7.1.2 after the Scheme LDT, be deemed to have been a Scheme Participant as at the Operative Date of the Scheme, provided that settlement of the Scheme Consideration due to such Dissenting Shareholder shall take place on the later of (i) the Operative Date, (ii) the date which is five Business Days after that Dissenting Shareholder so withdrew its demand or allowed the Company’s offer to lapse, as the case may be, and (iii) the date which is five Business Days after that Dissenting Shareholder shall have surrendered its Documents of Title and completed form of surrender, transfer and acceptance (blue) to the Transfer Secretaries (or Capespan’s company secretary).
4.7.2 The wording of section 164 of the Companies Act (which sets out the Appraisal Rights) is included in Annexure 9 to this Circular.
4.8 Foreign Capespan Shareholders and Exchange Control Regulations
Annexure 8 to this Circular contains a summary of the Exchange Control Regulations as they apply to Scheme Participants. Scheme Participants who are not resident in, or who have a registered address outside of South Africa, must satisfy themselves as to the full observance of the laws of any relevant territory concerning the receipt of the Scheme Consideration, including obtaining any requisite governmental or other consents, observing any other requisite formalities and paying any issue, transfer or other taxes due in such territory.
4.9 Sufficient securities
4.9.1 Should the Scheme be implemented and assuming there are no Dissenting Shareholders, a maximum of 69 557 940 Zeder Shares will be issued to Scheme Participants in consideration for all the Capespan Shares held by them (being a total of 81 832 865 Capespan Shares).
4.9.2 Zeder has sufficient authorised but unissued share capital available from which to issue the abovementioned maximum of 69 557 940 Zeder Shares.
4.10 Restricted jurisdictions
4.10.1 To the extent that the distribution of this Circular in certain jurisdictions outside of South Africa may be restricted or prohibited by the laws of such foreign jurisdiction then this Circular is deemed to have been provided for information purposes only and neither the Capespan Board nor the Zeder Board accepts any responsibility for any failure by Capespan Shareholders to inform themselves about, and to observe, any applicable legal requirements in any relevant foreign jurisdiction.
4.10.2 Capespan Shareholders who are in doubt as to their position should consult their professional advisors.
5. INTERESTS OF ZEDER AND ZEDER DIRECTORS IN CAPESPAN SECURITIES
5.1 As at the Last Practicable Date, Zeder held 229 955 324 Capespan Shares, equal to 71.2% of the issued Capespan Shares (net of the Treasury Shares).
5.2 Zeder had no dealings in Capespan Shares during the six-month period prior to 8 April 2015 and during the period from 8 April 2015 up to the Last Practicable Date.
5.3 As at the Last Practicable Date, no Zeder Director held any Capespan Shares and no Zeder Director had any dealings in Capespan Shares during the six month period prior to 8 April 2015 and the period from 8 April 2015 up to the Last Practicable Date.

21
6. INTERESTS OF ZEDER DIRECTORS IN ZEDER SECURITIES
6.1 As at the Last Practicable Date, the following Zeder Directors held an interest in Zeder Shares:
Beneficial Non-beneficial Total
Zeder Director Direct Indirect Direct Indirect Number %
N Celliers – 3 073 676 – – 3 073 676 0.2GD Eksteen – 6 683 585 – 250 000 6 933 585 0.5WL Greeff 80 000 – – – 80 000 –AE Jacobs – 70 000 – – 70 000 –JF Mouton – – – 80 000 80 000 –CA Otto – – – 80 000 80 000 –
Total 80 000 9 827 261 – 410 000 10 317 261 0.7
6.2 Save as set out in paragraph 6.3, the Zeder Directors had no dealings in Zeder Shares during the six month period prior to 8 April 2015 and the period from 8 April 2015 up to the Last Practicable Date.
6.3 The following Zeder Directors had dealings in Zeder Shares during the six month period prior to 8 April 2015 and the period from 8 April 2015 up to the Last Practicable Date:
6.3.1 on 23 April 2015, Mr N Celliers, through his associate, Namron Investments Proprietary Limited, disposed of 61 615 Zeder Shares at an average price of R8.91 per share;
6.3.2 on 22 April 2015, Mr N Celliers, through his associate, Namron Investments Proprietary Limited, disposed of 677 385 Zeder Shares at an average price of R8.92 per share;
6.3.3 on 21 April 2015, Mr N Celliers, through his associate, Namron Investments Proprietary Limited, disposed of 36 581 Zeder Shares at an average price of R8.97 per share;
6.3.4 on 20 April 2015, Mr N Celliers, through his associate, Namron Investments Proprietary Limited, acquired 437 743 Zeder Shares at R2.57 per share pursuant to the exercise of options awarded to him;
6.3.5 on 27 February 2015, Mr N Celliers, through his associate, Namron Investments Proprietary Limited, acquired 337 838 Zeder Shares at R3.33 per share pursuant to the exercise of options awarded to him; and
6.3.6 on 17 February 2015, Mr CA Otto disposed of 39 123 Zeder Shares at R7.56 per share.
7. INTERESTS OF CAPESPAN AND CAPESPAN DIRECTORS IN ZEDER SECURITIES
7.1 As at the Last Practicable Date, Capespan held no direct or indirect interest in Zeder. Capespan had no dealings in Zeder Shares during the six month period prior to 8 April 2015 and during the period from 8 April 2015 and ending on the Last Practicable Date.
7.2 Save as set out in paragraph 6.1 above, no Capespan Director held any interest in issued Zeder Shares.
7.3 Save as set out in paragraph 6.3 above, the Capespan Directors had no dealings in Zeder Shares during the six month period prior to 8 April 2015 and the period from 8 April 2015 up to the Last Practicable Date.
22
8. INTERESTS OF CAPESPAN DIRECTORS IN CAPESPAN SECURITIES
8.1 As at the Last Practicable Date, the following Capespan Directors held a beneficial interest in issued Capespan Shares:
Capespan Director Direct Indirect
% of Capespan issued share
capital
JJ Dique 6 600 000 – 1.9AJ de Haast 1 028 610 – 0.3
Total 7 628 610 – 2.2
8.2 The Capespan Directors had no dealings in Capespan Shares during the six month period prior to 8 April 2015 and the period from 8 April 2015 up to the Last Practicable Date.
9. IRREVOCABLE UNDERTAKINGS
Details regarding the Capespan Shareholders who have provided irrevocable undertakings to vote in favour of all Capespan shareholder resolutions necessary to approve and implement the Scheme are set out in Annexure 11A.
10. DEALINGS BY PROVIDERS OF IRREVOCABLE UNDERTAKINGS
Details regarding dealings by the Capespan Shareholders referred to in paragraph 9 above, during the six month period prior to 8 April 2015 and during the period from 8 April 2015 up to the Last Practicable Date, are set out in Annexure 11B.
11. REMUNERATION OF CAPESPAN DIRECTORS
The remuneration of the Capespan Directors will not be affected by the Scheme.
12. AGREEMENTS IN RELATION TO THE SCHEME
12.1 Save for:
12.1.1 the Firm Intention Offer Letter;
12.1.2 the irrevocable undertakings referred to in this Circular; and
12.1.3 the waivers provided by the participants in the Share Incentive Scheme, pursuant to which they waived their rights to participate in the Scheme in relation to the Share Incentive Scheme,
no agreements have been entered into between Zeder, Zeder Directors (or persons who were directors of Zeder in the past 12 months) and/or Zeder Shareholders (or persons who were Zeder Shareholders in the past 12 months) and any of Capespan, the Capespan Directors (or persons who were directors of Capespan in the past 12 months) or Capespan Shareholders (or persons who were Capespan Shareholders in the past 12 months) in relation to the Scheme.
12.2 Zeder confirms that it is the ultimate prospective purchaser of the Scheme Shares and, save for the Capespan Management Shareholders, it is acting alone and not in concert with any party. However, in terms of Regulation 84 of the Companies Regulations a presumption automatically exists that Zeder Directors are acting in concert with Zeder in respect of the Scheme. Accordingly, any Zeder Directors and any persons who were Zeder Directors at the time the Zeder Board resolved to make the offer to Capespan Shareholders pursuant to the Scheme and who hold Capespan Shares on the Scheme Voting Record Date, will not be able to vote on the Scheme Resolution at the General Meeting.

23
13. FINANCIAL INFORMATION OF CAPESPAN AND ZEDER
13.1 Financial information of Zeder
13.1.1 The audited historical financial information of Zeder for the last three financial years ended 28 February 2013, 28 February 2014 and 28 February 2015 is annexed hereto as Annexure 3.
13.1.2 The pro forma financial effects of the Proposed Transaction on Zeder are annexed hereto at Annexure 4, while the Independent Reporting Accountants’ report thereon is annexed hereto as Annexure 5.
13.2 Financial information of Capespan
13.2.1 The audited historical financial information of Capespan for the last three financial years ended 31 December 2012, 31 December 2013 and 31 December 2014 is annexed hereto as Annexure 2.
13.2.2 The pro forma financial effects of the Proposed Transaction on a Capespan Shareholder are annexed hereto at Annexure 6, while the Independent Reporting Accountants’ report thereon is annexed hereto as Annexure 7.
14. INTENTIONS REGARDING THE CONTINUATION OF CAPESPAN’S BUSINESS AND THE CAPESPAN BOARD
Should the Scheme be implemented, Zeder will hold all of the issued Capespan Shares (save for the Treasury Shares and the Capespan Shares held by the Capespan Management Shareholders), following which the future size and composition of the Capespan Board will be considered.
15. REPORT OF THE INDEPENDENT EXPERT
15.1 The report of the Independent Expert prepared in accordance with section 114(3) of the Companies Act and regulation 90 of the Companies Regulations is provided in Annexure 1 to this Circular.
15.2 Having considered the terms and conditions of the Scheme and based on the conditions set out in its report, the Independent Expert has concluded that the terms and conditions of the Scheme are both fair and reasonable to Capespan Shareholders, as each of these terms is defined in the Companies Regulations.
16. THE VIEWS OF THE INDEPENDENT BOARD AND THE ZEDER BOARD ON THE SCHEME
16.1 In accordance with the Companies Regulations, the Capespan Board has appointed the Independent Board comprising Messrs AZ Farr, JA le Roux and FA Jacobs. The Independent Board has appointed the Independent Expert to compile a report on the Scheme. The Zeder Board and the Capespan Board have provided all relevant information on Zeder and Capespan, respectively, requested by the Independent Expert in order to compile the report.
16.2 The Independent Board, after due consideration of the report of the Independent Expert, has determined that it will place reliance on the valuation performed by the Independent Expert for the purposes of reaching its own opinion regarding the Scheme and the Scheme Consideration as contemplated in Companies Regulation 110(3)(b). The Independent Board has formed a view of the range of the swap ratio of Zeder Shares for Capespan Shares, which accords with the range contained in the Independent Expert’s report, in considering its opinion and recommendation. The Independent Board is not aware of any factors which are difficult to quantify or are unquantifiable (as contemplated in Companies Regulation 110(6)) and has not taken any such factors into account, in forming its opinion.
16.3 The Independent Board, taking into account the report of the Independent Expert, has considered the terms and conditions of the Scheme and the members of the Independent Board are unanimously of the opinion that the terms and conditions thereof are fair and reasonable to Capespan Shareholders and, accordingly, recommend that Capespan Shareholders vote in favour of the Scheme Resolution at the General Meeting.

24
16.4 The Zeder Directors are also unanimously of the opinion that the terms and conditions of the Scheme are fair and reasonable to Capespan Shareholders.
16.5 The Capespan Board has not received any offers, other than the Scheme.
17. CAPESPAN DIRECTORS’ SERVICE CONTRACTS
Service contracts have been concluded between CPL and each of Capespan’s executive Directors on terms and conditions that are standard for such appointments. There are no service contracts between Capespan and any of its non-executive Directors.
18. OTHER SERVICE CONTRACTS
No service contracts have been entered into or amended by Capespan within the six month period prior to the Last Practicable Date.
19. INTENDED ACTION OF CAPESPAN DIRECTORS
Since the only Capespan Directors who hold Capespan Shares in their own beneficial capacity are also Capespan Management Shareholders, no Capespan Director shall be eligible to vote at the General Meeting.
20. FOREIGN CAPESPAN SHAREHOLDERS AND EXCHANGE CONTROL REGULATIONS
Information regarding Foreign Capespan Shareholders and Exchange Control Regulations is set out in Annexure 8 to this Circular.
21. TAX IMPLICATIONS FOR CAPESPAN SHAREHOLDERS
Scheme Participants will not incur an immediate tax obligation upon the Scheme being implemented, as a result of the section 42 roll-over relief provisions in the Income Tax Act, 1962. However, the deferred tax obligation may arise in future, should Scheme Participants dispose of the Scheme Consideration Shares issued to them under the Scheme. The tax position of a Capespan Shareholder under the Scheme is dependent on such shareholder’s individual circumstances, including but not limited to whether they hold the shares as capital assets or as trading stock, whether the shares are held by a Collective Investment Scheme or Pension Fund and on the tax jurisdiction in which the shareholder is resident. It is recommended that the Scheme Participants seek appropriate advice in this regard.
22. INDEPENDENT BOARD RESPONSIBILITY STATEMENT
The Independent Board accepts responsibility for the information contained in this Circular which relates to Capespan and confirms that, to the best of its knowledge and belief, such information which relates to Capespan is true and the Circular does not omit anything likely to affect the importance of such information.
23. ZEDER RESPONSIBILITY STATEMENT
The Zeder Board accepts responsibility for the information contained in this Circular which relates to Zeder and confirms that, to the best of its knowledge and belief, such information which relates to Zeder is true and the Circular does not omit anything likely to affect the importance of such information.
24. ADVISORS’ CONSENTS
The parties referred to in the “Corporate Information and Advisors” section of this Circular, have consented in writing to act in the capacities stated and to the inclusion of their names and, where applicable, reports, in this Circular in the form and context in which they appear and have not withdrawn their consent prior to the publication of this Circular.

25
25. DOCUMENTS AVAILABLE FOR INSPECTION
The following documents, or copies thereof, will be available for inspection by the Capespan Shareholders at Capespan’s registered office and at Zeder’s registered office from the date of posting of this Circular until the end of the Operative Date:
25.1 the audited annual financial statements of Capespan for the three financial years ended 31 December 2012, 31 December 2013 and 31 December 2014;
25.2 the audited annual financial statements of Zeder for the three financial years ended 28 February 2013, 28 February 2014 and 28 February 2015;
25.3 the reports of the Independent Reporting Accountants, as reproduced at Annexures 5 and 7 to this Circular;
25.4 the consent letter of the Independent Reporting Accountants and all other consent letters referred to in paragraph 24 of this Circular;
25.5 irrevocable commitments received by Zeder from Capespan Shareholders;
25.6 a signed copy of this Circular;
25.7 the signed report of the Independent Expert;
25.8 the approval letter of the Takeover Panel;
25.9 the memorandum of incorporation of Capespan;
25.10 the memorandum of incorporation of Zeder; and
25.11 the exemption granted by the Takeover Panel as contemplated in paragraph 1.2.3 above.
SIGNED AT BELLVILLE ON THURSDAY, 21 MAY 2015 ON BEHALF OF THE CAPESPAN BOARD
AZ FARRDirector
SIGNED AT STELLENBOSCH ON THURSDAY, 21 MAY 2015 ON BEHALF OF THE ZEDER BOARD
WL GREEFFFinancial Director

26
Annexure 1
REPORT OF THE INDEPENDENT EXPERT REGARDING THE SCHEME
The Independent Board of Directors 19 May 2015Capespan Group Limited (“Capespan”)Vineyards Square NorthVineyards Office Estate99 Jip de Jager RoadBellville7530
Dear Sirs
Independent Expert Opinion on the firm intention of Zeder Investments Limited (“Zeder”) to make an offer to acquire all the ordinary shares in Capespan, not already held by Zeder and members of Capespan’s management, excluding treasury shares, by way of a scheme of arrangement (“Scheme”).
Introduction
Zeder, a company listed on the main board of the JSE, has submitted a firm intention to make an offer for the shares in Capespan that are not already held by Zeder and by Capespan’s management (the “Proposed Transaction”). Zeder and Capespan management hold nearly 75% of the issued share capital of Capespan and have control of Capespan.
In terms of the Scheme, Capespan shareholders will receive 85 Zeder shares in exchange for every 100 Capespan shares (the “Scheme Ratio”).
The Scheme will constitute an “affected transaction” as defined in Section 117(1)(c) of the Companies Act, No 71 of 2008 (“the Companies Act”) and will be regulated by the Companies Act, the Companies Regulations and the Takeover Regulation Panel (“TRP”). The Scheme will be implemented in terms of section 114 of the Companies Act.
Scope
An Independent Expert’s opinion is required to be obtained by the Independent Board in terms of Section 114 of the Companies Act. Section 114 of the Companies Act provides that the company must retain an Independent Expert who meets the requirements of section 114(2) and 114(3) to compile a report to the Independent Board concerning the proposed scheme of arrangement.
Ernst & Young Advisory Services Proprietary Limited (“EY”) has been appointed by the Independent Board as the Independent Expert to advise on whether the terms and conditions of the Proposed Transaction are fair and reasonable to the shareholders of Capespan.
Responsibility
The compliance with the Companies Act is the responsibility of the Independent Board. Our responsibility is to report on the terms and conditions of the Proposed Transaction in compliance with the related provisions of the Companies Act.
We confirm that our fair and reasonable opinion has been provided to the Independent Board for the sole purpose of assisting them in forming and expressing an opinion for the benefit of Capespan shareholders.

27
Definition of the terms “fair” and “reasonable”
An offer is generally considered to be fair; if the consideration received in terms of that offer is above the fair value range of the shares which form the subject matter of the offer.
An offer is generally considered to be reasonable; if the consideration received in terms of that offer is above the regulated price of the shares – at the time the offer was announced or at some other more appropriate identifiable time – which form the subject matter of the offer.
Our approach in considering the Proposed Transaction
In considering the Proposed Transaction, we have independently calculated the fair value of the shares of Zeder and Capespan.
Information utilised
In the course of our analysis, we relied upon financial and other information, including prospective financial information, obtained from Zeder (including its underlying investments) and Capespan’s management teams, together with industry-related and other information in the public domain. Our conclusion is dependent on such information being complete and accurate in all material respects.
The principal sources of information used in formulating our opinion regarding the terms and conditions of the Proposed Transaction include:
• Zeder and Capespan’s initial joint SENS announcement dated 8 April 2015;
• Zeder’s firm intention offer letter dated 7 April 2015;
• Representations and assumptions made available by, and discussions held with, the management of Capespan and Zeder (that include the relevant underlying investments);
• Representations and assumptions made available by, and discussions held with, the Independent Board;
• S&P Capital IQ;
• Published market data on Capespan and Zeder (including its underlying investments);
• Audited annual financial statements of Zeder, Pioneer Group Limited, and Quantum Foods Limited;
• Audited and unaudited financial statements/management accounts of Capespan, Zaad Holdings, Agrivision Africa and Kaap Agri; and
• Management forecasts for Capespan, Zaad Holdings and Agrivision Africa.
Where practical, we have corroborated the reasonableness of the information provided to us for the purpose of our opinion, whether in writing or obtained through discussions with the respective management teams.
Procedures performed
In arriving at our opinion we have undertaken the following procedures in evaluating the fairness and reasonableness of the Proposed Transaction:
• Supplemented our knowledge and understanding of Zeder and Capespan as well as the industries in which they operate.
• Held discussions with management on the prospects of the underlying investments/divisions/assets within Zeder and Capespan.
• Reviewed and analysed the historical financial information of Capespan and Zeder (including its underlying investments).
• For the underlying investments in Zeder, Zaad Holdings and Agrivision Africa, we assessed the budgets/forecasts as prepared by the relevant management team and challenged certain assumptions. In the case of Zeder’s investment in Pioneer and Quantum Foods, we were not provided with any budget/forecasts as prepared by its management team. We reviewed and analysed publicly available company information, multiples, analyst reports and market multiples of comparable companies.
• Prepared a sum-of-the-parts valuation of Zeder from the underlying discounted cash flow and market multiple valuations.

28
• Assessed the budget/forecasts of Capespan as prepared by its management team and challenged certain assumptions.
• Prepared a discounted cash flow valuation of Capespan.• Corroborated the above values using market multiples of comparable companies. Corroborated the value
of Zeder’s investment in Pioneer using the 30 – and 90 day VWAP of Pioneer shares.
• Used the price of recent transactions where applicable.
• Reviewed Capespan’s and Zeder’s historic traded share prices and trading volumes.
• Examined the scheme circular considering the terms and conditions contained in the scheme circular as well as the commercial issues relating to the Proposed Transaction. Specifically, we considered the rights of the minority Capespan shareholders pre and post the implementation of the Scheme.
• Considered any other/qualitative aspects which we believe are of importance.
• Determined the fairness and the reasonableness of the transaction.
We have not interviewed any of the minority shareholders of Capespan to obtain their views on the Proposed Transaction.
Based on the results of the procedures mentioned above, we determined the fairness and reasonableness of the Proposed Transaction to Capespan minority shareholders. We believe that the above considerations justify the conclusion outlined below.
We have further assumed that, as at the Last Practicable Date:
• Capespan and Zeder are not involved in any legal proceedings that would have a material adverse effect on either of their share values.
• Capespan and Zeder (including its underlying investments) have no material outstanding disputes with the South African Revenue Service.
• There are no other contingencies that could affect the value of Capespan’s or Zeder’s shares.
Valuation
Zeder
We valued Zeder on the sum-of-the parts basis as follows:
• For the underlying investments in Zeder, Zaad Holdings and Agrivision Africa, we performed a discounted cash flow valuation.
• For the underlying investments in Zeder, Pioneer and Quantum Foods, we performed valuations with reference to publicly available company information, multiples, analyst reports and market multiples of comparable companies.
• Corroborated the above values using market multiples of comparable companies and VWAP’s/share prices’ of the relevant entities.
• Incorporated an appropriate discount to Zeder’s calculated Equity Value for the performance and management fees paid.
The business of Zeder (including its underlying investments) is highly dependent upon:
• Commodity prices such as maize, wheat and soya;
• Weather conditions;
• Consumer behaviour; and
• Global exchange rates.
The valuation was performed taking cognisance of risk and other market and industry factors affecting Zeder (including its underlying investments). Additionally, sensitivity analyses were performed considering key assumptions. Prevailing market and industry conditions were also considered in assessing the risk profile of Zeder (including its underlying investments).
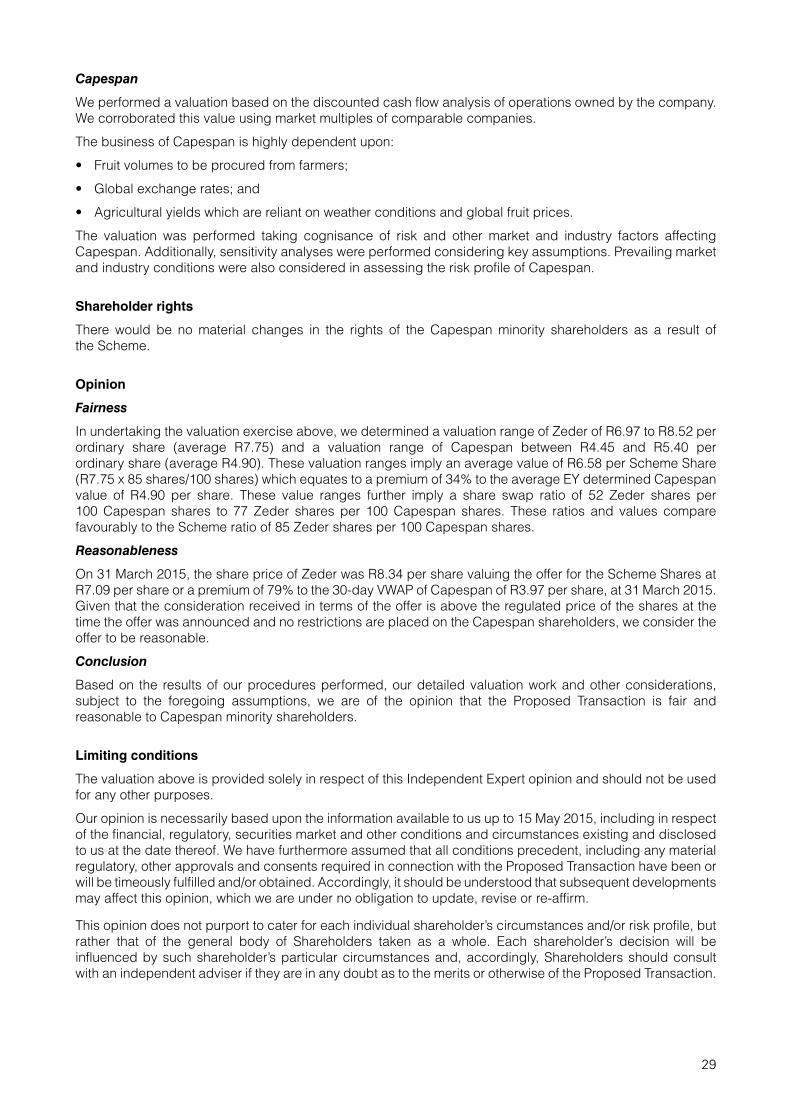
29
Capespan
We performed a valuation based on the discounted cash flow analysis of operations owned by the company. We corroborated this value using market multiples of comparable companies.
The business of Capespan is highly dependent upon:
• Fruit volumes to be procured from farmers;
• Global exchange rates; and
• Agricultural yields which are reliant on weather conditions and global fruit prices.
The valuation was performed taking cognisance of risk and other market and industry factors affecting Capespan. Additionally, sensitivity analyses were performed considering key assumptions. Prevailing market and industry conditions were also considered in assessing the risk profile of Capespan.
Shareholder rights
There would be no material changes in the rights of the Capespan minority shareholders as a result of the Scheme.
Opinion
Fairness
In undertaking the valuation exercise above, we determined a valuation range of Zeder of R6.97 to R8.52 per ordinary share (average R7.75) and a valuation range of Capespan between R4.45 and R5.40 per ordinary share (average R4.90). These valuation ranges imply an average value of R6.58 per Scheme Share (R7.75 x 85 shares/100 shares) which equates to a premium of 34% to the average EY determined Capespan value of R4.90 per share. These value ranges further imply a share swap ratio of 52 Zeder shares per 100 Capespan shares to 77 Zeder shares per 100 Capespan shares. These ratios and values compare favourably to the Scheme ratio of 85 Zeder shares per 100 Capespan shares.
Reasonableness
On 31 March 2015, the share price of Zeder was R8.34 per share valuing the offer for the Scheme Shares at R7.09 per share or a premium of 79% to the 30-day VWAP of Capespan of R3.97 per share, at 31 March 2015. Given that the consideration received in terms of the offer is above the regulated price of the shares at the time the offer was announced and no restrictions are placed on the Capespan shareholders, we consider the offer to be reasonable.
Conclusion
Based on the results of our procedures performed, our detailed valuation work and other considerations, subject to the foregoing assumptions, we are of the opinion that the Proposed Transaction is fair and reasonable to Capespan minority shareholders.
Limiting conditions
The valuation above is provided solely in respect of this Independent Expert opinion and should not be used for any other purposes.
Our opinion is necessarily based upon the information available to us up to 15 May 2015, including in respect of the financial, regulatory, securities market and other conditions and circumstances existing and disclosed to us at the date thereof. We have furthermore assumed that all conditions precedent, including any material regulatory, other approvals and consents required in connection with the Proposed Transaction have been or will be timeously fulfilled and/or obtained. Accordingly, it should be understood that subsequent developments may affect this opinion, which we are under no obligation to update, revise or re-affirm.
This opinion does not purport to cater for each individual shareholder’s circumstances and/or risk profile, but rather that of the general body of Shareholders taken as a whole. Each shareholder’s decision will be influenced by such shareholder’s particular circumstances and, accordingly, Shareholders should consult with an independent adviser if they are in any doubt as to the merits or otherwise of the Proposed Transaction.

30
This opinion is provided solely for the use of the Independent Board and Capespan Shareholders for the sole purpose of assisting the Independent Board in forming and expressing an opinion on the Proposed Transaction for the benefit of the Shareholders. Unless as stipulated in this letter, this opinion shall not, in whole or in part, be disclosed, reproduced, disseminated, quoted, summarised or referred to at any time, in any manner or for any purpose, nor shall any public references to EY or Ernst & Young Advisory Services (Pty) Limited be made by Capespan or any of its affiliates, without the prior consent of Ernst & Young Advisory Services (Pty) Limited.
We have relied upon the accuracy of the information used by us in deriving our opinion albeit that, where practicable, we have corroborated the reasonableness of such information through, amongst other things, reference to work performed by independent third party/ies, historic precedent or our own knowledge and understanding. While our work has involved an analysis of the annual financial statements and other information provided to us, our engagement does not constitute, nor does it include, an audit conducted in accordance with generally accepted auditing standards. Accordingly, we assume no responsibility and make no representations with respect to the accuracy of any information provided to us in respect of Capespan and Zeder (including its underlying investments).
Forecasts relate to uncertain future events and are based on assumptions, which may not remain valid for the whole of the forecast period. Consequently, forecast financial information cannot be relied upon to the same extent as that derived from audited financial statements for completed accounting purposes. We express no opinion as to how closely actual results will correspond to projections made by the management of Capespan and Zeder (including its underlying investments) and made available to us during the course of our review.
Independence, competence and fees
We confirm that we have no direct or indirect interest in Capespan and Zeder (including its underlying investments) shares or the Proposed Transaction. We also confirm that we have the necessary qualifications and competence to provide the independent opinion on the Proposed Transaction.
Furthermore, we confirm that our professional fees are not contingent upon the success of the Proposed Transaction.
Consent
We consent to the inclusion of this letter and the reference to our opinion in the Circular to be issued to the shareholders of Capespan in the form and context in which it appears and in any required regulatory announcement or documentation.
Yours faithfully
Steve AltDirectorErnst & Young Advisory Services Proprietary Limited

31
Annexure 2
THREE-YEAR AUDITED HISTORICAL FINANCIAL INFORMATION OF CAPESPAN
BASIS OF PREPARATION
The consolidated income statements, statements of financial position, comprehensive income, changes in equity, cash flows and notes thereto, of Capespan for the financial years ended 31 December 2012 (restated), 31 December 2013 (restated) and 31 December 2014, have been extracted and compiled from the audited consolidated annual financial statements of Capespan, which are available on Capespan’s website. The aforementioned consolidated annual financial statements were compiled under the supervision of the group financial director, AJ de Haast, CA(SA), and were approved by the Capespan Directors on 16 April 2013, 14 April 2014 and 30 March 2015, respectively. The financial statements for 2012 and 2013 years have been restated taking into account the changes in the accounting policies of the Capespan group implemented in 2014. The 2013 restated financial statements formed part of the Capespan 2014 annual financial statements and the 2012 restatements have been audited by KPMG. The preparation of this Annexure 2 is the responsibility of the Capespan Directors.
The historical financial information of Capespan has previously been audited by KPMG and reported on without qualification for all of the aforementioned financial periods.
NATURE OF BUSINESS
Capespan Group Limited, incorporated in South Africa, is the holding company for a number of businesses that focuses on businesses of the Capespan group including the international marketing of fruit, logistical services, the operation of depot, storage and port facilities and farming.
OPERATING RESULTS
The operating results and state of affairs of the group are set out in th attached income statements and balance sheets, comprehensive income, changes in equity and cash flows. For the year under review, the group’s recurring headline earnings amounted to R159 million (2013: R139 million), headline earnings amounted to R97 million (2013: R127 million) and earnings attributable to owners of the parent amounted to R108 million (2013: R120 million; 2012: R140 million).
COMMENTARY
Detailed commentary on the historical financial information of Capespan is provided in the selected consolidated financial information of Capespan, included in this Circular.
HISTORICAL FINANCIAL INFORMATION
No material change in the nature of the business of Capespan and its subsidiaries occurred, and no material fact or circumstance has occurred between the end of the latest financial year of Capespan and the date of this Circular, in so far as not already dealt with in historical financial information outlined in this Annexure.

32
BALANCE SHEETS
at 31 December 2014
Group Company
Restated Restated
2014 2013 2012 2014 2013 2012
Notes R’000 R’000 R’000 R’000 R’000 R’000
Assets
Non-current assets 1 393 568 1 123 506 1 012 639 646 893 645 757 645 757
Property, plant and equipment 8 434 900 321 482 296 418 – – –
Bearer plants 9 181 523 117 122 128 484 – – –
Intangible assets 10 27 672 36 673 41 090 – – –
Goodwill 11 294 913 274 996 241 250 – – –
Investment in subsidiary 12 – – – 646 893 645 757 645 757
Investments in associates 13 325 081 240 828 163 645 – – –
Other financial assets 14 33 294 41 633 62 530 – – –
Employee benefits 25.3 34 462 33 090 25 184 – – –
Deferred tax assets 15 61 723 57 682 54 038 – – –
Current assets 1 594 519 1 581 495 1 515 881 1 464 1 296 2 186
Biological assets 16 43 877 43 484 48 847 – – –
Inventories 17 241 256 312 658 205 994 – – –
Income tax receivables 20 710 21 723 18 362 198 – –
Trade and other receivables 18 931 569 777 508 801 223 57 – 32
Cash and cash equivalents 19 357 107 426 122 441 455 1 209 1 296 2 154
Non-current assets held for sale 20 30 378 – 3 000 – – –
Total assets 3 018 465 2 705 001 2 531 520 648 357 647 053 647 943
Equity and liabilities
Equity
Share capital and premium 21 476 919 462 024 462 024 476 919 462 024 462 024
Treasury shares (20 130) (25 012) (28 251) – – –
Other reserves 291 178 245 105 101 751 1 136 – –
Retained earnings 747 657 701 645 620 676 25 646 29 466 30 861
Total equity attributable to equity holders of the parent 1 495 624 1 383 762 1 156 200 503 701 491 490 492 885
Non-controlling interest 61 769 31 394 20 929 – – –
Total equity 1 557 393 1 415 156 1 177 129 503 701 491 490 492 885
Non-current liabilities 403 317 306 509 431 978 135 679 148 302 149 064
Interest-bearing borrowings 23 237 311 121 804 172 372 – – –
Non-interest-bearing borrowings 24 – 18 617 106 795 113 976 127 842 127 936
Deferred taxation 15 34 028 41 949 42 958 – – –
Employee benefits 25 131 978 124 139 109 853 21 703 20 460 21 128
Current liabilities 1 057 755 983 336 922 413 8 977 7 261 5 994
Bank overdraft and short-term borrowings 26 316 873 120 611 246 755 – – –
Interest-bearing borrowings 23 33 706 25 581 10 882 – – –
Non-interest-bearing borrowings 24 19 837 113 342 – – – –
Income tax payables 24 556 14 168 9 520 – – –
Trade and other payables 27 587 698 632 351 601 629 8 977 7 261 5 994
Employee benefits 25 52 195 60 902 32 720 – – –
Provisions 28 22 890 16 381 20 907 – – –
Total equity and liabilities 3 018 465 2 705 001 2 531 520 648 357 647 053 647 943

33
INCOME STATEMENTS
for the year ended 31 December 2014
Group Company
Restated Restated
2014 2013 2012 2014 2013 2012
Notes R’000 R’000 R’000 R’000 R’000 R’000
Revenue 7 392 421 7 149 021 5 632 286 848 806 1 045
Cost of sales, distribution and selling expenses 2 (6 486 298) (6 251 814) (4 879 859) – – –
Gross profit 906 123 897 207 752 427 848 806 1 045
Operating expenses 2 (737 055) (706 429) (626 911) (1 349) (1 109) (1 725)
Operating profit/(loss) 169 068 190 778 125 516 (501) (303) (680)
Financial income 3 45 605 38 256 38 209 51 037 35 236 70 052
Financial expenses 4 (48 582) (47 134) (37 448) (1 217) (1 414) (1 409)
Share of profits of associates 13 60 651 28 810 26 048 – – –
Fair value adjustment on non-current biological assets – – 12 570 – – –
Profit before non-recurring items 226 742 210 710 164 895 49 319 33 519 67 963
Other income: 5
Deemed profit on sale of associate – – 67 004 – – –
Recoveries 16 103 – – – – –
Profit on disposal of investments, property, plant and equipment 6 252 154 35 143 – – –
Reversal of impairment of assets 11 893 – – – – –
Other expenses: 6 –
Contingent consideration (65 657) – – – – –
Restructuring costs (502) (7 138) – – – –
Impairment of long-term loans (54) (3 310) – – – –
Impairment of assets, goodwill and investments (9 368) (10 627) (46 138) – – –
Profit before taxation 185 409 189 789 220 904 49 319 33 519 67 963
Taxation 7 (67 981) (57 315) (74 032) (198) – –
Profit for the year 117 428 132 474 146 872 49 121 33 519 67 963
Profit attributable to:
Owners of the company 108 356 120 098 139 417 49 121 33 519 67 963
Non-controlling interest 9 072 12 376 7 455 – – –
Profit for the year 117 428 132 474 146 872 49 121 33 519 67 963
Earnings per share (cents)
Basic 22 33.7 37.7 44.2
Headline 22 30.3 39.7 27.5
Diluted 22 33.1 37.7 44.2

34
STATEMENTS OF OTHER COMPREHENSIVE INCOME
for the year ended 31 December 2014
Group Company
Restated Restated
2014 2013 2012 2014 2013 2012
Note R’000 R’000 R’000 R’000 R’000 R’000
Profit for the year 117 428 132 474 146 872 49 121 33 519 67 963
Other comprehensive income/(loss)
Items that will never be reclassified to profit and loss
Defined benefit plan actuarial (losses)/gains (20 705) 328 (13 736) (2 014) 208 (473)
Taxation on other comprehensive income 7 6 506 193 4 803 – – –
(14 199) 521 (8 933) (2 014) 208 (473)
Items that are or may be reclassified to profit and loss
Foreign currency translation differences on foreign operations 33 642 145 489 23 760 – – –
Cash flow hedge effective portion of changes in fair value 4 495 (1 861) – – – –
Change in fair value of available-for-sale financial assets 16 56 (682) – – –
38 153 143 684 23 078 – – –
Other comprehensive income/(loss) for the year 23 954 144 205 14 145 (2 014) 208 (473)
Total comprehensive income for the year 141 382 276 679 161 017 47 107 33 727 67 490
Total comprehensive income attributable to:
Owners of the company 132 070 261 902 154 037 47 107 33 727 67 490
Non-controlling interest 9 312 14 777 6 980 – –
Total comprehensive income for the year 141 382 276 679 161 017 47 107 33 727 67 490

35
STA
TE
ME
NT
S O
F C
HA
NG
ES
IN E
QU
ITY
for t
he y
ear e
nded
31
Dec
embe
r 201
4
Att
ribu
tab
le to
eq
uit
y h
old
ers
of
the
par
ent
Sh
are
cap
ital
Sh
are
pre
miu
m
Tran
s-la
tio
n
rese
rves
Oth
er
rese
rves
Sh
are-
b
ased
p
aym
ent
rese
rves
Ret
ain
ed
earn
ing
sTr
easu
ry
shar
esTo
tal
No
n-
con
tro
llin
g
inte
rest
Tota
l eq
uit
yG
rou
p –
201
4R
’00
0R
’00
0R
’00
0R
’00
0R
’00
0R
’00
0R
’00
0R
’00
0R
’00
0R
’00
0
Res
tate
d b
alan
ce 1
Jan
uar
y 20
143
512
458
512
238
517
6 58
8–
701
645
(25
012)
1 38
3 76
231
394
1 41
5 15
6
Tota
l co
mp
reh
ensi
ve in
com
e fo
r th
e ye
ar
Prof
it fo
r the
yea
r–
––
––
108
356
–10
8 35
69
072
117
428
Oth
er c
ompr
ehen
sive
inco
me/
(loss
)
FCTR
– fo
reig
n op
erat
ions
, net
of t
ax
––
30 4
61–
––
–30
461
240
30 7
01
FCTR
– a
ssoc
iate
s re
cogn
ised
in e
quity
, net
of t
ax–
–2
941
––
––
2 94
1–
2 94
1
Cas
h flo
w h
edge
effe
ctiv
e po
rtio
n of
cha
nges
in
fair
valu
e–
––
4 49
5–
––
4 49
5–
4 49
5
Cha
nge
in fa
ir va
lue
of a
vaila
ble-
for-s
ale
finan
cial
as
sets
, net
of t
ax–
––
16–
––
16–
16
Def
ined
ben
efit
plan
act
uaria
l los
ses,
net
of t
ax–
––
––
(14
199)
–(1
4 19
9)–
(14
199)
Tota
l oth
er c
ompr
ehen
sive
inco
me
––
33 4
024
511
–(1
4 19
9)–
23 7
1424
023
954
Tota
l co
mp
reh
ensi
ve in
com
e fo
r th
e ye
ar–
–33
402
4 51
1–
94 1
57–
132
070
9 31
214
1 38
2
Tran
sfer
(fr
om
)/to
res
erve
s–
––
(2 4
05)
–2
405
––
––
Tran
sact
ion
s w
ith
ow
ner
s re
cord
ed d
irec
tly
in e
qu
ity
Shar
e is
sue
4514
850
––
––
–14
895
–14
895
Trea
sury
sha
res
purc
hase
d an
d so
ld–
––
––
–18
518
5–
185
Shar
e-ba
sed
paym
ent r
eser
ve
––
––
10 5
65–
–10
565
–10
565
Non
-con
trolli
ng in
tere
st d
ispo
sed
––
––
–5
567
–5
567
13 0
4818
615
Non
-con
trolli
ng in
tere
st a
cqui
red
––
––
–(5
190
)–
(5 1
90)
10 2
575
067
Div
iden
ds p
aid
––
––
–(5
0 92
7)4
697
(46
230)
(2 2
42)
(48
472)
Tota
l tra
nsa
ctio
ns
wit
h o
wn
ers
reco
rded
dir
ectl
y in
eq
uit
y45
14 8
50–
–10
565
(50
550)
4 88
2(2
0 20
8)21
063
855
Res
tate
d b
alan
ce 3
1 D
ecem
ber
201
43
557
473
362
271
919
8 69
410
565
747
657
(20
130)
1 49
5 62
461
769
1 55
7 39
3

36
STA
TE
ME
NT
S O
F C
HA
NG
ES
IN E
QU
ITY
(con
tinue
d)fo
r the
yea
r end
ed 3
1 D
ecem
ber 2
014
Att
ribu
tab
le to
eq
uit
y h
old
ers
of
the
par
ent
Sh
are
cap
ital
Sh
are
pre
miu
m
Tran
s-la
tio
n
rese
rves
Oth
er
rese
rves
Ret
ain
ed
earn
ing
sTr
easu
ry
shar
esTo
tal
No
n-
con
tro
llin
g
inte
rest
Tota
l eq
uit
yR
esta
ted
Gro
up
– 2
013
R’0
00
R’0
00
R’0
00
R’0
00
R’0
00
R’0
00
R’0
00
R’0
00
R’0
00
Op
enin
g b
alan
ce 1
Jan
uar
y 20
133
512
458
512
96 2
345
517
620
676
(28
251)
1 15
6 20
020
929
1 17
7 12
9
Tota
l co
mp
reh
ensi
ve in
com
e fo
r th
e ye
ar
Prof
it fo
r the
yea
r as
prev
ious
ly re
port
ed–
––
–10
8 97
4–
108
974
8 61
1 11
7 58
5
Perio
d ad
just
men
t (re
fer n
ote
40)
––
––
11 1
24–
11 1
243
765
14 8
89
Res
tate
d p
rofit
for
the
year
––
––
120
098
120
098
12 3
7613
2 47
4
Oth
er c
ompr
ehen
sive
inco
me/
(loss
)
FCTR
– fo
reig
n op
erat
ions
, net
of t
ax
––
120
822
––
–12
0 82
2 2
401
123
223
FCTR
– a
ssoc
iate
s re
cogn
ised
in e
quity
, net
of t
ax–
–22
266
–
––
22 2
66
–22
266
Cas
h flo
w h
edge
effe
ctiv
e po
rtio
n of
cha
nges
in fa
ir va
lue
––
––
(1 8
61)
–(1
861
)–
(1 8
61)
Cha
nge
in fa
ir va
lue
of a
vaila
ble-
for-s
ale
finan
cial
ass
ets,
net
of t
ax–
–(1
5)71
––
56–
56
Def
ined
ben
efit
plan
act
uaria
l los
ses,
net
of t
ax–
––
–52
1 –
521
–52
1
Tota
l oth
er c
ompr
ehen
sive
inco
me
––
143
073
71
(1 3
40)
–14
1 80
4 2
401
144
205
Tota
l co
mp
reh
ensi
ve in
com
e fo
r th
e ye
ar–
–14
3 07
371
118
758
–26
1 90
214
777
276
679
Tran
sfer
(fr
om
)/to
res
erve
s–
–(7
90)
1 0
00
(210
)–
––
–
Tran
sact
ion
s w
ith
ow
ner
s re
cord
ed d
irec
tly
in e
qu
ity
Non
-con
trolli
ng in
tere
st a
cqui
red
––
––
(2 4
57)
–(2
457
)(2
591
)(5
048
)
Div
iden
d pa
id–
––
–(3
5 12
2)3
239
(31
883)
(1 7
21)
(33
604)
Tota
l tra
nsa
ctio
ns
wit
h o
wn
ers
reco
rded
dir
ectl
y in
eq
uit
y–
––
–(3
7 57
9)3
239
(34
340)
(4 3
12)
(38
652)
Res
tate
d b
alan
ce 3
1 D
ecem
ber
201
33
512
458
512
238
517
6 58
870
1 64
5(2
5 01
2)1
383
762
31 3
941
415
156

37
STA
TE
ME
NT
S O
F C
HA
NG
ES
IN E
QU
ITY
(co
ntin
ued)
for t
he y
ear e
nded
31
Dec
embe
r 201
4
Att
ribu
tab
le to
eq
uit
y h
old
ers
of
the
par
ent
Sh
are
cap
ital
Sh
are
pre
miu
m
Tran
s-la
tio
n
rese
rves
Oth
er
rese
rves
Ret
ain
ed
earn
ing
sTr
easu
ry
shar
esTo
tal
No
n-
con
tro
llin
g
inte
rest
Tota
l eq
uit
y
Res
tate
d G
rou
p –
201
2R
’00
0R
’00
0R
’00
0R
’00
0R
’00
0R
’00
0R
’00
0R
’00
0R
’00
0
Bal
ance
1 J
anu
ary
2012
as
pre
vio
usl
y re
po
rted
3 31
241
0 71
271
999
9 07
251
2 79
5(3
1 16
7)97
6 72
313
865
990
588
Prio
r per
iod
adju
stm
ent
––
––
6 13
36
133
2 04
48
177
Res
tate
d o
pen
ing
bal
ance
1 J
anu
ary
2012
3 31
241
0 71
271
999
9 07
251
8 92
8(3
1 16
7)98
2 85
615
909
998
765
Tota
l co
mp
reh
ensi
ve in
com
e fo
r th
e ye
ar
Prof
it fo
r the
yea
r–
––
–13
9 41
7–
139
417
7 45
514
6 87
2
Oth
er c
ompr
ehen
sive
inco
me/
(loss
)–
FCTR
– fo
reig
n op
erat
ions
, net
of t
ax
––
19 0
52–
––
19 0
52(4
75)
18 5
77
FCTR
– a
ssoc
iate
s re
cogn
ised
in e
quity
, net
of t
ax–
–5
183
––
–5
183
–5
183
Cha
nge
in fa
ir va
lue
of a
vaila
ble-
for-s
ale
finan
cial
ass
ets,
net
of t
ax–
––
14(6
96)
–(6
82)
–(6
82)
Def
ined
ben
efit
plan
act
uaria
l los
ses,
net
of t
ax–
––
–(8
933
)–
(8 9
33)
–(8
933
)
Tota
l oth
er c
ompr
ehen
sive
inco
me
––
24 2
3514
(9 6
29)
–14
620
(475
)14
145
Tota
l co
mp
reh
ensi
ve in
com
e fo
r th
e ye
ar–
–24
235
1412
9 78
8–
154
037
6 98
016
1 01
7
Tran
sfer
(fr
om
)/to
res
erve
s–
––
(3 5
69)
3 56
9–
––
–
Tran
sact
ion
s w
ith
ow
ner
s re
cord
ed d
irec
tly
in e
qu
ity
Shar
e an
d sh
are
prem
ium
issu
ed20
047
800
––
––
48 0
00–
48 0
00
Non
-con
trolli
ng in
tere
st–
––
––
––
1 47
81
478
Div
iden
d pa
id–
––
–(3
1 60
9)2
916
(28
693)
(3 4
38)
(32
131)
Tota
l tra
nsa
ctio
ns
wit
h o
wn
ers
reco
rded
dir
ectl
y in
eq
uit
y20
047
80
0–
–(3
1 60
9)2
916
19 3
07(1
960
)17
347
Bal
ance
31
Dec
emb
er 2
012
3 51
245
8 51
296
234
5 51
762
0 67
6(2
8 25
1)1
156
200
20 9
291
177
129

38
STATEMENTS OF CHANGES IN EQUITY (continued)for the year ended 31 December 2014
Share capital
Sharepremium
Share-based payment
reserveRetained earnings Total equity
Company R’000 R’000 R’000 R’000 R’000
Balance 1 January 2014 3 512 458 512 – 29 466 491 490
Total comprehensive income for the year
Profit for the year – – – 49 121 49 121
Other comprehensive income – – – (2 014) (2 014)
Total comprehensive income for the year – – – 47 107 47 107
Transactions with owners recorded directly in equity
Share and share premium issue 45 14 850 – – 14 895
Equity-settled share-based payment – – 1 136 – 1 136
Dividend paid – – – (50 927) (50 927)
Total transactions with owners recognised in equity 45 14 850 1 136 (50 927) (34 896)
Balance 31 December 2014 3 557 473 362 1 136 25 646 503 701
Balance 1 January 2013 3 512 458 512 – 30 861 492 885
Total comprehensive income for the year
Profit for the year – – – 33 519 33 519
Other comprehensive loss – – 208 208
Total comprehensive income for the year – – – 33 727 33 727
Transactions with owners recorded directly in equity
Dividend paid – – – (35 122) (35 122)
Total transactions with owners recognised in equity – – – (35 122) (35 122)
Balance 31 December 2013 3 512 458 512 – 29 466 491 490
Balance 1 January 2012 3 312 410 712 – (5 020) 409 004
Total comprehensive income for the year
Profit for the year – – – 67 963 67 963
Other comprehensive loss – – – (473) (473)
Total comprehensive income for the year – – – 67 490 67 490
Transactions with owners recorded directly in equity
Share and share premium issue 200 47 800 – – 48 000
Dividend paid – – – (31 609) (31 609)
Total transactions with owners recognised in equity 200 47 800 – (31 609) 16 391
Balance 31 December 2012 3 512 458 512 – 30 861 492 885

39
STATEMENTS OF CASH FLOWS
for the year ended 31 December 2014
Group Company
Restated Restated2014 2013 2012 2014 2013 2012
Notes R’000 R’000 R’000 R’000 R’000 R’000
Cash generated by operating activities
Cash received from customers 7 273 107 7 075 096 5 354 369 848 806 1 045
Cash paid to suppliers and employees (7 147 760) (6 837 825) (5 211 253) (461) (268) (948)
Cash generated by operations 29.1 125 347 237 271 143 116 387 538 97
Investment income received 2 126 129 51 000 35 200 70 000
Interest received 45 603 38 130 38 080 37 36 52
Interest paid (31 091) (30 805) (37 448) (1 217) (1 414) (1 409)
Taxation paid 29.2 (69 090) (56 247) (55 078) (396) – –
Net cash flows from operating activities 70 771 188 475 88 799 49 811 34 360 68 740
Cash flows from investing activities
Proceeds from disposal of property, plant and equipment 5 121 14 354 53 261 – – –
Proceeds from disposal of non-current assets held for sale – 3 000 – – – –
Proceeds from disposal of farms 29.3.2 21 250 35 000 – – – –
Net proceeds from the sale of investments 3 959 – 5 714 – – –
Dividends received from associate – 8 340 – – – –
Contingent consideration paid (177 548) – – – – –
Acquisition of property, plant and equipment (175 554) (84 760) (33 540) – – –
– to maintain operations (153 204) (23 810) (28 112) – – –
– to expand operations (22 350) (60 950) (5 428) – – –
Acquisition of subsidiary 29.4 (7 271) – (88 776) – – (88 776)
Acquisition of intangible assets (3 734) (1 730) (3 826) – – –
Acquisition of non-controlling interest 29.4 – (5 007) – – – –
Investment in bearer plants (74 281) (22 047) (6 420) – – –
– to maintain operations (10 312) (22 047) 6 420 – – –
– to expand operations (63 969) – – – – –
Investment in associates 29.4 (28 887) (9 202) – – – –
(Increase)/decrease in other financial assets (6 388) 19 693 11 111 – – –
Advances to subsidiary – – – – – (343)
Net cash flows from investing activities (443 333) (42 359) (62 476) – – (89 119)
Cash flows from financing activities
Share issue – – – 14 895 – –
Interest-bearing borrowings raised 150 255 – 104 435 – – –
Interest-bearing borrowings repaid (26 623) (35 869) – – – –
Treasury shares acquired (6 138) – – – – –
Non-interest-bearing borrowings raised/(repaid) 19 837 (80) (1 203) (13 866) (96) 52 250
Dividends paid (47 354) (30 778) (32 131) (50 927) (35 122) –
Net cash flows from financing activities 89 977 (66 727) 71 101 (49 898) (35 218) 52 250
Net (decrease)/increase in cash and cash equivalents (282 585) 79 389 97 424 (87) (858) 262
Cash and cash equivalents at beginning of year 305 511 194 700 33 761 1 296 2 154 1 892
Net cash acquired through business combinations/disposals – – 57 695 – – –
Effects of exchange fluctuations on cash and cash equivalents 17 308 31 422 5 820 – – –
Cash and cash equivalents at end of year 40 234 305 511 194 700 1 209 1 296 2 154

40
NOTES TO THE FINANCIAL STATEMENTS
for the year ended 31 December 2014
1. SIGNIFICANT ACCOUNTING POLICIES
Basis of preparation
The consolidated financial statements have been prepared in accordance with International Financial Reporting Standards (IFRS) and the interpretations adopted by the International Accounting Standards Board (IASB) and the requirements of the Companies Act of South Africa.
The consolidated financial statements are presented in South African Rand, rounded to the nearest thousand. They are prepared on the historical cost and going concern bases, unless otherwise stated.
The preparation of financial statements in conformity with IFRS requires management to make judgements, estimates and assumptions that affect the application of policies and reported amounts of assets and liabilities, income and expenses. The estimates and associated assumptions are based on historical experience and various other factors that are believed to be reasonable under the circumstances, the results of which form the basis of making the judgements about carrying values of assets and liabilities that are not readily apparent from other sources. Actual results may differ from these estimates.
The estimates and underlying assumptions are reviewed on an ongoing basis. Revisions to accounting estimates are recognised in the period in which the estimate is revised, if the revision affects only that period, or in the period of the revision and future periods if the revision affects both current and future periods.
Judgements made by management in the application of IFRS that have a significant effect on the financial statements and estimates with a significant risk of material adjustment in the next year are discussed in note 37.
The accounting policies set out below have been applied consistently to all years presented in these financial statements except for the items as disclosed (refer note 40) for restatement of disclosures and the adoption of certain new accounting standards which became effective during the current year (refer note 41). The Group elected to use the title ”Income statements” instead of Statements of comprehensive income and ”Balance sheets” instead of Statements of financial position.
Basis of consolidation
The consolidated financial statements of the company consolidate the financial information of the company and its subsidiaries (together referred to as the “Group”) and the Group’s interest in associates.
Non-controlling interests in subsidiaries are identified separately from the Group’s equity therein. The interest of non-controlling shareholders may be initially measured either at fair value or at the non-controlling interests’ proportionate share of the fair value of the acquiree’s identifiable net assets. The choice of measurement basis is made on an acquisition-by-acquisition basis. Subsequent to acquisition, the carrying amount of non-controlling interests is the amount of those interests at initial recognition plus the non-controlling interests’ share of subsequent changes in equity. Total comprehensive income is attributed to non-controlling interests even if this results in the non-controlling interests having a deficit balance.
Subsidiaries
Subsidiaries are entities controlled by the company. Control exists when the company has the power, directly or indirectly, to govern the financial and operating policies of an entity so as to obtain benefits from its activities. The results of subsidiaries are included in the consolidated financial statements from the date that control commences to the date that control ceases.
Where necessary, accounting policies of subsidiaries are changed to ensure consistency with the policies adopted by the Group. Intra-Group balances and any unrealised gains or losses or income and expenses arising from intra-Group transactions are eliminated in preparing the consolidated financial statements, except to the extent that they provide evidence of impairment.
Investments in subsidiaries are recognised at cost less any impairments.
A listing of the Group’s principal subsidiaries is set out in Annexure 1 on page 96 of these financial statements.

41
Property, plant and equipment
Owned assets
Items of property, plant and equipment are stated at cost less accumulated depreciation and impairment losses. Where parts of an item of property, plant and equipment have different useful lives, they are accounted for as separate items of property, plant and equipment.
Expenditure incurred to replace part of an item of property, plant and equipment is capitalised if it is probable that the future economic benefits embodied with the item will flow to the Group and the cost of the item can be measured reliably. All other expenditure, including repairs and maintenance, are recognised in profit or loss as an expense as incurred.
Costs associated with the acquisition and installation of off-the-shelf and certain purpose-written software are capitalised. Such assets are depreciated using the amortisation methods and periods applicable to computer equipment, from the date of commissioning.
Financing costs directly associated with the construction or acquisition of qualifying assets are capitalised at interest rates relating to loans specifically raised for that purpose, or at the average borrowing rate where the general pool of Group borrowing was utilised.
Gains and losses on the disposal of property, plant and equipment are taken to profit or loss. Gains and losses on disposals are determined by comparing the net proceeds received with the carrying amount of the item.
Leased assets
Leases involving property, plant and equipment in terms of which the Group assumes substantially all the risks and rewards of ownership are classified as finance leases and depreciated over the shorter of the useful life of the asset and the lease term. Items of plant and equipment held under a finance lease are stated at an amount equal to the lower of its fair value and the present value of the minimum lease payments at inception of the lease, less accumulated depreciation and impairment losses. The capital element of future obligations under the lease is included as a liability in the balance sheet. Each lease payment is allocated between the outstanding liability and finance charges so as to achieve a constant rate on the finance balance outstanding. The interest element of the finance charge is charged to profit or loss over the lease period.
For a sale and leaseback transaction that results in a finance lease, any excess of sales proceeds over the carrying amount, if any, is not recognised as income.
Leases of assets under which all the risks and benefits of ownership are effectively retained by the lessor, are classified as operating leases. Payments made under operating leases are charged to profit or loss on a straight-line basis over the period of the lease.
Depreciation
Depreciation is charged on the straight-line basis over the estimated useful lives of the assets. Freehold land is not depreciated. Leasehold improvements are depreciated over the shorter of the useful lives and term of the lease.
The estimated useful lives of items of property, plant and equipment are:
Buildings 50 yearsLeasehold improvements 5 – 20 yearsPlant and machinery 5 – 10 yearsMotor vehicles 4 – 5 yearsOffice equipment, furniture and fittings 3 – 10 yearsComputer equipment 3 – 7 years
The residual value of assets and useful lives of assets are reassessed annually.
Bearer plants
Background
In June 2014, the International Accounting Standards Board issued changes regarding “IAS 16 Property, plant and equipment” and “IAS 41 Agriculture”, which leads to changes in the accounting for biological assets that meet the definition of bearer plants, such as vineyards and orchards.

42
The changes comes down to bearing orchards/vineyards be regarded similar to equipment used in a manufacturing process. This has resulted in the International Accounting Standards Board deciding that bearing orchards are accounted in the same way and must be treated as property, plant and equipment within the scope of IAS 16.
Long-term biological assets consist of bearer plants used in the production of agricultural produce and they are expected to bear produce for more than one period. Management’s intention is to recover the economic benefit of the assets through use.
Management have chosen to apply the cost model in terms of IAS 16 Property, Plant and Equipment to bearer plants. Therefore, production costs, capital expenditure and borrowing costs are capitalised to the biological asset until Management consider the agricultural transformation to be substantially complete.
Management considered the amendments to provide a more reliable basis of quantifying the value of bearer plants with a commensurate depreciation charge over the remaining useful lives of the vineyards and orchards.
The changes are effective for annual periods beginning on or after 1 January 2016 with early adoption permissible.
Capespan Group decided well in advance of implementing the changes effective for the financial year ended 31 December 2014. In line with the requirements of the relevant standards the following accounting policies have been formulated.
Cost price
Under the amendments to IAS 41 Biological Assets, Management have elected to use the fair value of the long-term biological assets at the earliest period presented, 1 January 2013, as the deemed cost at this date. Management retrospectively applied the amendments to the financial year ended 31 December 2013 by eliminating the fair value adjustments recognised previously in 2013 in terms of the accounting policy at the time (before adopting the amendments to Biological Assets) and by capitalising production and related borrowing costs and depreciation of matured assets.
Lifespan of orchards/vineyards
The lifespan of the orchards/vineyards begins effectively the day the physical tree is planted in the ground. The useful life is determined in collaboration with the technical department, and is as follows:
Apples 36 years Oranges and lemons 30 yearsPears 36 years Grapefruit and soft citrus 20 yearsGrapes 18 years Plums 20 years
Non-bearing, bearing and full bearing
A distinction is made between non-bearing and partially bearing orchards/vineyards and when the transformation has been sustainably completed i.e. full bearing orchards. In collaboration with the technical department the orchards/vineyards are deemed to be full bearing when they reach the following ages:
Full bearing
Apples 7 Oranges and lemons 7Pears 7 Grapefruit and soft citrus 7Grapes 4 Plums 3
Establishment costs in respect of orchards established after 31 December 2012
All costs relating to the development of an orchard/vineyard are capitalised to respective orchard/block planted. The establishment costs are allocated per orchard/block based on establishment costs allocated per hectare.
Production costs, capital expenditure and borrowing costs are capitalised to the bearer plant until the plant has reached the age of full bearing. Income that is received related to the orchard/vineyard prior to it becoming full bearing is credited to the capitalised costs.

43
Depreciation
Depreciation in respect of orchards/vineyards is calculated from the date the orchard/vineyard reaches the state of full bearing and calculated by taking the cost per orchard/vineyard and dividing by the relevant remaining life.
Remove from orchards
All orchards/vineyards to be removed during a financial year will be deemed to be removed from the date the last crop was harvested from the orchard/vineyard. No depreciation will be charged from that date for the specific orchard that is to be removed.
The value of the orchards/vineyards removed is the book value of the orchard/vineyard at the deemed date of removal.
Accounting treatment
Orchards/vineyards form effectively part of property, plant and equipment and will be separately disclosed as bearer plants in the balance sheet.
Depreciation on orchards/vineyards forms part of the annual depreciation on property, plant and equipment. The carrying value of the orchards removed during the year is recognised as a charge to the income statement.
Establishment costs in respect of orchards established before 31 December 2012
All costs relating to the development of an orchard/vineyard are capitalised to respective orchard/block planted. The establishment costs are allocated per orchard/block based on establishment costs allocated per hectare.
Production costs, capital expenditure and borrowing costs where not capitalised and have been expensed in the income statement. Income that was received related to the orchard/vineyard prior to it becoming full bearing was credited to the income statement.
No depreciation was calculated and the fair value was remeasured in accordance with IAS 41 and credit/debited to the income statement.
Inventories
Cost is determined on a standard cost basis, which approximates actual costs, on the first-in, first-out method. Inventories are stated at the lower of cost and net realisable value. Net realisable value is the estimated selling price in the ordinary course of business less the estimated costs of completion and the estimated costs necessary to make the sale. Consignment inventory is not recognised in the balance sheet on the basis that the risks and rewards of ownership remain with the supplier until the inventory is sold. Agricultural produce at the point of harvest is classified as inventory and is measured at fair value less cost to sell.
Biological assets
Biological assets representing agricultural produce on vines/orchards are stated at fair value less estimated point-of-sale costs, with any resultant gain or loss recognised in profit or loss. Point-of-sale costs include all costs that would be necessary to sell the assets, excluding costs necessary to get the assets to the market.
Business combinations and goodwill
Business combinations from 1 January 2010
Business combinations occurring on or after 1 January 2010 are accounted for using the acquisition method. The cost of an acquisition is measured as the aggregate of the consideration transferred, measured at acquisition date fair value and the amount of any non-controlling interest in the acquiree. For each business combination, the acquirer measures the non-controlling interest in the acquiree either at fair value or at the proportionate share of the acquiree’s identifiable net assets. Acquisition costs incurred are expensed.

44
When the Group acquires a business, it assesses the financial assets and liabilities assumed for appropriate classification and designation in accordance with the contractual terms, economic circumstances and pertinent conditions as at the acquisition date. If the business combination is achieved in stages, the acquisition date fair value of the acquirer’s previously held equity interest in the acquiree is remeasured to fair value as at the acquisition date through profit or loss.
Any contingent consideration to be transferred by the acquirer will be recognised at fair value at the acquisition date. Subsequent changes to the fair value of the contingent consideration which is deemed to be an asset or liability will be recognised in accordance with IAS 39 either in profit or loss or as a change to other comprehensive income.
Goodwill is initially measured at cost being the excess of the consideration transferred over the Group’s net identifiable assets acquired and liabilities assumed. If this consideration is lower than the fair value of the net assets of the subsidiary acquired, the difference is recognised in profit or loss. After initial recognition, goodwill is measured at cost less any accumulated impairment losses.
Where goodwill forms part of a cash-generating unit and part of the operation within that unit is disposed of, the goodwill associated with the operation disposed of is included in the carrying amount of the operation when determining the gain or loss on disposal of the operation. Goodwill disposed of in this circumstance is measured based on the relative values of the operation disposed of and the portion of the cash-generating unit retained.
In comparison to the abovementioned requirements, the following differences applied:
Business combinations were accounted for using the purchase method. Transaction costs directly attributable to the acquisition formed part of the acquisition costs. The non-controlling interest (formerly known as minority interest) was measured at the proportionate share of the acquiree’s identifiable net assets.
Where the Group purchased additional shares in subsidiaries such purchases are reflected as separate acquisition processes and no revised fair valuation was required. The difference between the costs of acquisition and the share of the net assets acquired was capitalised as goodwill.
Contingent consideration was recognised if, and only if, the Group had a present obligation, the economic outflow was more likely than not and a reliable estimate was determinable. Subsequent adjustments to the contingent consideration affected goodwill.
Transactions and non-controlling interests
Changes in the Group’s interest in a subsidiary that do not result in a loss of control are accounted for as equity transactions. The carrying amounts of the Group’s interests and the non-controlling interests are adjusted to reflect the changes in their relative interests in the subsidiary. Any difference between the amount by which the non-controlling interests are adjusted and the fair value of the consideration paid or received is recognised directly in equity and attributed to owners of the company.
When the Group loses control of a subsidiary, the profit or loss on disposal is calculated as the difference between (i) the aggregate of the fair value of the consideration received and the fair value of any retained interest and (ii) the previous carrying amount of the assets (including goodwill), and liabilities of the subsidiary and any non-controlling interests. Amounts previously recognised in other comprehensive income in relation to the subsidiary are accounted for (i.e. reclassified to profit or loss or transferred directly to distributable reserve) in the same manner as would be required if the relevant assets or liabilities were disposed of.
The fair value of any investment retained in the former subsidiary at the date when control is lost is regarded as the fair value on initial recognition for subsequent accounting under IAS 39: Financial Instruments: Recognition and Measurement or, when applicable, the cost on initial recognition of an investment in an associate.
Intangible assets (other than goodwill)
Intangible assets (other than goodwill) are initially recognised at cost if acquired externally, or at fair value if acquired as part of a business combination. Expenditure on internally generated development activity is capitalised if the product or process is technically and commercially feasible, the Group has sufficient resources to complete development, the Group has intention to complete and use or sell it, it is probable that future economic benefits relating to the asset will flow to the Group and the cost can be measured

45
reliably. The expenditure capitalised includes the cost of materials, direct labour and an appropriate proportion of overheads.
Subsequent expenditure
Subsequent expenditure is capitalised only when it increases the future economic benefits embodied in the specific asset to which it relates. All other expenditure, including expenditure on internally generated goodwill and brands, is recognised in profit or loss as incurred.
Amortisation
Amortisation of intangible assets with a finite useful life is recognised in profit or loss on a straight-line basis over the estimated useful life of intangible assets. Goodwill and intangibles with indefinite useful lives are not amortised and tested for impairment annually.
The estimated useful lives of intangible assets with finite lives are as follows:
Capitalised software development 5 to 10 yearsLeasehold rights 5 to 10 yearsCustomer listing 20 yearsPatent and trademarks on the basis of the anticipated benefits expected to arise
from each patent and trademark
Amortisation methods, residual values and remaining useful lives of intangible assets with finite useful lives are reassessed annually.
Research and development costs
Research costs undertaken with the prospect of gaining new scientific or technical knowledge and understanding, is recognised in profit or loss as an expense as incurred. Development costs are expensed when incurred unless they result in projects that are technically and commercially feasible and the Group has sufficient resources to complete development, in which event these development costs are capitalised and amortised over the estimated useful life of the project. Capitalised development costs are stated at cost less accumulated amortisation and impairment losses.
Investments in associates
An associate is an entity in which the Group has a long-term interest of between 20% and 50% and over which the Group exercises significant influence or joint control, but not control, over the financial and operating policies. Investments in associate companies are accounted for in the Group financial statements initially at cost and subsequently using the equity method from the date significant influence commences to the date significant influence ceases. Equity accounted income represents the Group’s proportionate share of profits or losses of associates and the share of taxation thereon.
Unrealised gains arising from transactions with associates are eliminated to the extent of the Group’s interest in the entity.
When the net assets attributable to the Group change due to a dilution of shareholding, the change in net assets is recognised directly in equity.
The Group’s interest in associated companies is carried in the balance sheet at an amount that reflects its share of the net assets and the carrying value of goodwill on acquisition. When the Group’s share of losses exceeds its interest in an associate, the Group’s carrying amount is reduced to nil and recognition of further losses is discontinued except to the extent that the Group has incurred legal or constructive obligations or made payments on behalf of an associate. Where necessary the accounting policies of the associates are changed to ensure consistency with the policies adopted by the Group.
A listing of the Group’s investments in associates is shown in Annexure 2 on page 97 of these financial statements.
Earnings per share
Earnings per share is based on earnings attributable to shareholders and is calculated on the weighted average number of shares in issue, net of treasury shares, during the financial year.
46
Impairment of assets
Non-financial assets
The carrying amounts of the Group’s non-financial assets other than biological assets (which are stated at fair value less costs to sell), inventories (which are carried lower of cost and net realisable value), except for agricultural produce which is valued at fair value less costs to sell and deferred tax assets (which are recognised based on recoverability), are reviewed at each reporting date to determine whether there is any indication of impairment. If any such an indication exists, the asset’s recoverable amount is estimated.
For goodwill, intangible assets with an indefinite useful life and intangible assets that are not yet available for use, the recoverable amount is estimated at each reporting date.
Whenever the carrying amount of an asset or its cash-generating unit exceeds its recoverable amount, an impairment loss is recognised in profit or loss.
As goodwill is not capable of generating cash flows independently of other assets, in assessing the recoverable amount of goodwill, the goodwill is allocated to cash-generating units on a reasonable and consistent basis. Where appropriate, corporate assets are also allocated to cash-generating units on a reasonable and consistent basis. The recoverable amount of the cash-generating unit (including an allocation of goodwill and corporate assets) is assessed with reference to the future cash flows of the cash-generating unit. Where an impairment is identified for a cash-generating unit, the impairment is applied first to the goodwill allocated to the cash-generating unit and then to other assets on a pro rata basis comprising the cash-generating unit provided that each identifiable asset is not reduced to below its recoverable amount.
Recoverable amount
The recoverable amount of an asset is the greater of its fair value less cost to sell and its value in use. Recoverable amounts are estimated for individual assets or, if an asset does not generate largely independent cash flows, for a cash-generating unit. A cash-generating unit is the smallest collection of assets capable of generating cash flows independent of other assets or cash-generating units.
The fair value less cost to sell is the amount obtainable from the sale of an asset or cash-generating unit in an arm’s length transaction. Value in use is the present value of estimated future cash flows expected to arise from the continuing use of an asset or cash-generating unit and from its disposal at the end of its useful life. The estimated future cash flows are discounted using a pre-tax discount rate that reflects current market assessments of the time value of money and the risks specific to the asset.
Reversal of impairment losses
Impairment losses recognised in prior years are assessed at each reporting date for any indicators that the losses have decreased or no longer exist. Reversal of impairment losses recognised in prior years are recorded when there is an indication that the impairment losses recognised for the asset no longer exist or have decreased, either as a result of an event occurring after the impairment loss was recognised or if there has been a change in the estimates used to calculate the recoverable amount.
An impairment loss is reversed only to the extent that the carrying amount of the affected asset is not increased to an amount higher than the carrying amount that would have been determined, net of depreciation or amortisation, had no impairment loss been recognised in prior years. The reversal is recorded in profit or loss. An impairment loss in respect of goodwill is never reversed.
Financial assets
At each reporting date, an assessment is made as to whether objective evidence exists that a financial asset or a group of financial assets is impaired. A financial asset is considered to be impaired if objective evidence indicates that one or more events had a negative effect on the estimated future cash flows of the asset.
An impairment loss in respect of a financial asset measured at amortised cost is calculated as the difference between its carrying amount, and the present value of the estimated future cash flows discounted at the original effective interest rate.
Individually significant financial assets are tested for impairment on an individual basis. The remaining financial assets are assessed collectively in groups that share similar credit risk characteristics.
All impairment losses are recognised in profit or loss.

47
An impairment loss is reversed if the reversal can be related objectively to an event occurring after the impairment loss was recognised. For financial assets measured at amortised cost and available-for-sale financial assets that are debt securities, the reversal is recognised in profit or loss.
Available-for-sale financial assets
Impairment losses on available-for-sale financial assets are recognised by reclassifying the losses accumulated in the fair value reserve in equity, to profit or loss. The cumulative loss that is reclassified from equity to profit or loss is the difference between the acquisition cost, net of any principal repayment and amortisation, and the current fair value, less any impairment loss recognised previously in profit or loss. Changes in impairment provisions attributable to application of the effective interest method are reflected as a component of interest income. If, in a subsequent period, the fair value of an impaired available-for-sale debt security increases and the increase can be related objectively to an event occurring after the impairment loss was recognised in profit or loss, then the impairment loss is reversed, with the amount of the reversal recognised in profit or loss. However, any subsequent recovery in the fair value of an impaired available-for-sale equity security is recognised in other comprehensive income.
Share capital
Ordinary share capital
Ordinary share capital represents the par value of ordinary shares issued.
Share premium
Share premium represents the excess consideration received by the company over the par value of ordinary shares issued, and is classified as equity. Incremental costs directly attributable to the issue of ordinary shares are recognised as a deduction from equity, net of any tax effect.
Treasury shares
Ordinary shares in Capespan Group Limited which have been acquired by a subsidiary company are classified as treasury shares. The cost of these shares is deducted from equity and the number of shares is deducted from the weighted average number of shares. Dividends received on treasury shares are eliminated on consolidation.
When treasury shares are sold or reissued, the amount received is recognised as an increase in equity, and the resulting surplus or deficit on the transaction is transferred to or from retained earnings.
Foreign currencies
Functional and presentation currency
All items in the financial statements of the Group’s subsidiaries are measured using the currency of the primary economic environment in which the subsidiary operates (“the functional currency”). The Group’s consolidated financial statements are presented in Rands, which is the company’s functional and the Group’s presentation currency.
Foreign currency transactions
Transactions in foreign currencies are translated to the respective functional currency of the Group at the rate of exchange ruling at the transaction date. Monetary items denominated in foreign currencies at the reporting date are translated at the rate of exchange ruling at that date. Foreign exchange differences arising on translation are recognised in profit or loss.
Foreign operations
Assets and liabilities of foreign operations, including goodwill and fair value adjustments arising on consolidation, are translated to South African Rand at foreign exchange rates ruling at the reporting date. The revenues and expenses of foreign operations are translated to South African Rand at the weighted average exchange rate for the financial period. Foreign exchange differences arising on translation are recognised in other comprehensive income. This component of equity is released to profit or loss upon disposal (in part or in full) of the foreign operation and the related amount in the Foreign Currency Translation Reserve (FCTR) is transferred to profit or loss.

48
Revenue
Revenue, which excludes value-added tax and sales between Group companies, represents gross sales of fruit, management fees, port charges, shipping and related services.
Revenue from the sale of goods to third parties are recognised when significant risks and rewards of ownership of the goods are transferred to the buyer and is net of rebates.
Revenue arising from services is recognised on an accrual basis in accordance with the substance of the relevant agreements.
No revenue is recognised if there are significant uncertainties regarding recoveries of the consideration due, associated costs or the possible return of goods.
Financial income and dividend income
Financial income comprises interest and dividend income. Interest is recognised on a time proportion basis, taking account of the principal outstanding and the effective rate over the period to maturity, when it is determined that such income will accrue to the Group. Dividends are recognised when the right to receive payment is established. Dividends received in specie are accounted for at fair value.
Financial expenses
Financial expenses comprise interest payable on borrowings calculated using the effective interest method, and unwinding of the discount on provisions and long-term employee benefits.
Borrowing costs are capitalised in line with the accounting policy outlined under property, plant and equipment.
The interest expense component of finance lease payments is recognised in profit or loss using the effective interest method.
Taxation
Taxation on profit or loss for the year comprises current and deferred tax. Taxation is recognised in profit or loss except to the extent that it relates to items recognised in other comprehensive income or directly in equity, in which case the related tax is recognised in other comprehensive income or directly in equity.
Current tax is the expected tax payable on the income tax for the year, using tax rates and laws that have been enacted or substantially enacted at the reporting date, and any adjustment to tax payable in respect of previous years.
Deferred tax is provided on all temporary differences between the taxation base of an asset or liability and its balance sheet carrying amount. The following temporary differences are not provided for: goodwill not deductible for tax purposes, the initial recognition of assets or liabilities that affect neither accounting nor taxable profit and differences relating to investments in subsidiaries to the extent that they will probably not reverse in the foreseeable future. The amount of deferred tax provided is based on the expected manner of realisation or settlement of the carrying amount of assets and liabilities, using tax rates and laws that have been enacted or substantially enacted at the reporting date.
A deferred tax asset is recognised only to the extent that it is probable that future taxable profits will be available against which the deferred tax asset can be utilised in the foreseeable future. Deferred tax assets are reduced to the extent that it is no longer probable that the related tax benefit will be realised.
Provision for taxes, which could arise on the remittance of retained earnings, principally relating to subsidiaries, is only made where there is a current intention to remit such earnings. Provision for tax that arise from the distribution of dividends are recognised at the same time as the liability to pay the related dividend.
Dividends withholding tax is a tax on shareholders and is applicable on all dividends declared on or after 1 April 2012.
The Company withholds dividends tax on behalf of its shareholders at a rate of 15% on dividends declared where shareholders are subject to this tax. Amounts withheld are not recognised as part of the Company’s tax charge but as part of the dividend paid recognised directly in equity.

49
Employee benefits
Short-term employee benefits
The cost of all short-term employee benefits is recognised as an expense during the period in which the employee renders the related service. Accruals for employee entitlements to wages, salaries, bonuses and annual leave represent the amount which the Group has a present obligation to pay as a result of employees’ services provided up to the reporting date. The accruals have been calculated at undiscounted amounts based on current wage and salary rates.
Other long-term employee benefits
Liabilities for long-term employee benefits, other than pension plans, which are not due to be settled within twelve months, are discounted to present value using the market yields at the reporting date on high-quality bonds with maturity dates that most closely match the terms of maturity of the Group’s related liabilities.
Defined contribution plans
The Group provides defined contribution funds for employees. Current contributions to these funds are charged against income when incurred. Retirement surpluses of defined contribution funds are not recognised in profit or loss.
Medical funds
Medical aid costs are recognised as an expense in the period during which the employees render services to the Group.
Defined benefit plans
Pension plans
The Group’s net obligation in respect of defined benefit pension plans is calculated separately for each plan by estimating the amount of future benefit that employees have earned in return for their service in the current and prior periods; that benefit is discounted to determine its present value, and the fair value of any plan assets is deducted. The discount rate is the yield at the reporting date on risk free government credit rated bonds that have maturity dates approximating the terms of the Group’s obligations. The calculation is performed by a qualified actuary using the projected unit credit method.
When the benefits of a plan are improved, the portion of the increased benefit relating to past service by employees is recognised as an expense in profit or loss on a straight-line basis over the average period until the benefits become vested. To the extent that the benefits vest immediately, the expense is recognised immediately in profit or loss.
When the calculation results in a benefit to the Group, the recognised asset is limited to the net total of any unrecognised actuarial losses and past service costs and the present value of any future refunds from the plan or reductions in future contributions to the plan.
Post-retirement medical aid benefits
The Group provides for post-retirement medical costs of certain retired employees. Current contributions to these funds are charged against the provision for post-retirement medical costs when incurred. The unwinding of interest and current service costs are recognised in profit or loss. The calculation is performed by a qualified actuary every year using the projected unit credit method. Actuarial gains and losses on defined benefit plans are recognised in other comprehensive income.
Equity-settled share-based payments
The Company and Group operate an equity-settled share incentive scheme. For the share incentive schemes, the fair value of the employee services received in exchange for the grant of the schemes shares/share options, less the amount paid by the employee, is recognised as an expense. The total amount to be expensed over the vesting period, which is between one and five years, is determined by reference to the fair value of the scheme shares/share options granted, excluding the impact of any non-market vesting conditions.
At each reporting date, the Group revises its estimates of the number of scheme shares/share options that are expected to become exercisable. It recognises the impact of the revision of original estimates, if any, in profit or loss, and a corresponding adjustment to equity over the remaining vesting period.
50
If the Group cancels or settles a grant of equity instruments during the vesting period, the company accounts for the cancellation or settlement of the grant and recognise immediately the amount that otherwise would have been recognised for services received over the remainder of the vesting period.
The share-based payment costs are recognised in profit or loss and a share-based payment reserve is recognised as part of equity and represents the fair value at grant date of the shares/share options that will be delivered on vesting.
Provisions
Provisions are recognised when the Group has a present legal or constructive obligation as a result of past events, for which it is probable that an outflow of economic benefits will be required to settle the obligation, and a reliable estimate can be made of the amount of the obligation.
Financial instruments
Non-derivative financial instruments are initially recognised at fair value plus directly attributable transaction costs except for financial instruments that are classified as being carried at fair value through profit or loss. Subsequent to initial recognition, these instruments are classified according to their nature.
Financial instruments are classified at fair value through profit or loss if they are held for trading or are designated as such upon initial recognition. Financial instruments are designated at fair value through profit or loss if the Group manages such investments and makes purchase and sale decisions based on their fair value in accordance with the Group’s documented risk management or investment strategy. Upon initial recognition attributable transaction costs are recognised in profit or loss when incurred. Financial instruments at fair value through profit or loss are measured at fair value, and changes therein are recognised in profit or loss.
The Group has the following financial instruments and the subsequent measurement of each financial instrument is explained in more detail below.
Trade and other receivables and loans receivable
Trade and other receivables and loans receivable are categorised as loans and receivables. These financial assets originate by the Group providing goods, services or money directly to a debtor and are subsequent to initial recognition measured at amortised cost using the effective interest method less any accumulated impairment losses.
Cash and cash equivalents
Cash and cash equivalents are categorised in the balance sheet as loans and receivables and subsequent to initial recognition are measured at amortised cost.
For the purpose of the statement of cash flows, cash and cash equivalents comprise cash on hand, deposits held on call with banks, and investments in money market instruments, net of bank overdrafts, all of which are available for use by the Group unless otherwise stated.
Available-for-sale financial assets
The Group’s investments in equity securities are classified as available-for-sale financial assets. Subsequent to initial recognition, they are measured at fair value and changes therein, other than impairment losses, are recognised in other comprehensive income. When an investment is derecognised, the cumulative gain or loss in equity is transferred to profit or loss. If fair values cannot be reliably determined, the investments are shown at cost less impairment losses.
Derivative financial instruments and hedging activities
The Group uses derivative financial instruments to hedge its exposure to foreign exchange risk arising from operational activities. In accordance with its treasury policy, the Group does not hold or issue derivative financial instruments for trading purposes.

51
Subsequent to initial recognition, derivatives are measured at fair value. The method of recognising the resulting gain or loss depends on whether the derivative is designated as a hedging instrument and if so, the nature of the item being hedged. Where a derivative financial instrument is used to hedge the variability in cash flows of the foreign exchange exposure of a recognised monetary asset or liability, hedge accounting may be applied. These derivatives are designated as cash flow hedges.
Cash flow hedges
Hedge accounting was applied for the first time in 2013 in respect of derivatives (i.e. FEC) that were designated as hedging instruments. The impact of the effective portion of the hedge is disclosed on the face of the income statement under “other comprehensive income”.
A “cash flow hedge” is a hedge of the exposure to variability in cash flows associated with a recognised asset or liability or a highly probable forecast transaction that is attributable to a particular risk and could affect profit or loss.
Fruit sales hedged by means of a FEC would fall into the definition above. IAS 39 allows the application of hedge accounting:
If the hedging instrument is a derivative, then the hedging instrument is measured at fair value, with the effective portion of changes in its fair value recognised in other comprehensive income and presented within equity, normally in a hedging reserve.
The ineffective portion of the gain or loss on the hedging instrument is recognised immediately in profit or loss.
The change in fair value of the hedging instrument that is recognised in other comprehensive income is reclassified to profit or loss when the hedged item affects profit or loss.
Hedge relationships are formally documented at inception. The documentation includes identification of the hedged item and the hedging instrument, details the risk that is being hedged and the way in which effectiveness will be assessed at inception and during the period of the hedge. If the hedge is not highly effective in off-setting changes in fair value or cash flows attributable to the hedge risk, consistent with the documented risk management strategy, hedge accounting is discontinued.
Where a derivative financial instrument is designated as a hedge of the variability in cash flow of a recognised asset or liability or a highly probable forecast transaction, the effective portion of the gain or loss on the hedging instrument is recognised in other comprehensive income. The ineffective portion is recognised in profit or loss. When the forecast transaction results in the recognition of a financial asset or financial liability, the cumulative gain or loss is reclassified from other comprehensive income in the same period in which the hedge forecast cash flow/ hedged item affects profit or loss. Otherwise the cumulative gain or loss is removed from other comprehensive income and recognised in profit or loss at the same time as the hedge transaction.
When the forecast transaction that is hedged results in the recognition of a non-financial asset (for example, inventory or property, plant and equipment) the gains and losses previously deferred in equity are transferred from equity and included in the initial measurement of the cost of the asset. The deferred amounts are ultimately recognised in cost of goods sold in the case of inventory or in depreciation in the case of property, plant and equipment. Hedge accounting is discontinued if the hedge no longer meets the criteria for hedge accounting; if the hedging instrument expires or is sold, terminated or exercised; if the forecast transaction is no longer expected to occur; or if hedge designation is revoked. On the discontinuance of hedge accounting (except where a forecast transaction is no longer expected to occur), the cumulative unrealised gain or loss recognised in other comprehensive income is recognised in profit or loss when the forecast transaction occurs and affects profit or loss. Where a forecast transaction is no longer expected to occur, the cumulative gain or loss is recognised immediately in profit or loss.
Derivatives not qualifying for hedge accounting
Certain derivative instruments do not qualify for hedge accounting. Such derivatives are classified at fair value through profit or loss and changes in the fair value of any derivative instrument that do not qualify for hedge accounting are recognised immediately in profit or loss. The fair value of forward exchange contracts is the quoted market price at the reporting date.

52
Interest-bearing loans and borrowings
Interest-bearing loans and borrowings are financial liabilities with fixed or determinable payments. Subsequent to initial recognition these financial instruments are measured at amortised cost with any difference between cost and redemption value being recognised in profit or loss over the period of the borrowings on an effective interest basis.
Trade and other payables
Subsequent to initial recognition, trade and other payables are measured at amortised cost.
Derecognition
Financial assets
A financial asset (or, where applicable, a part of a financial asset or part of a group of similar financial assets) is derecognised when the contractual rights to the cash flows from the asset expire, or it transfers the rights to receive the contractual cash flows on the financial asset in a transaction in which substantially all the risks and rewards of ownership of the financial asset are transferred.
Where the Group has transferred its rights to receive cash flows from an asset and has neither transferred nor retained substantially all the risks and rewards of the asset nor transferred control of the asset, the asset is recognised to the extent of the Group’s continuing involvement in the asset. Continuing involvement that takes the form of a guarantee over the transferred asset is measured at the lower of the original carrying amount of the asset and the maximum amount of consideration that the Group could be required to repay.
Financial liabilities
A financial liability is derecognised when the obligation under the liability is discharged or cancelled or expires. Where an existing financial liability is replaced by another from the same lender on substantially different terms, or the terms of an existing liability are substantially modified, such an exchange or modification is treated as a derecognition of the original liability and the recognition of a new liability, and the difference in the respective carrying amounts is recognised in profit or loss.
Offset
Financial assets and financial liabilities are off-set and the net amount reported in the balance sheet when the Group has a legally enforceable right to set off the recognised amounts, and intends either to settle on a net basis, or to realise the asset and settle the liability simultaneously.
Hedge of monetary assets and liabilities
Where a derivative financial instrument is used to hedge the foreign exchange exposure of a recognised monetary asset or liability, no hedge accounting is applied and gains or losses on the hedging instrument is recognised in profit or loss.
Restructuring
A provision for restructuring is recognised when the Group has approved a detailed and formal restructuring plan, and the restructuring has either commenced or has been announced publicly. Future operating costs are not provided for.
Onerous contracts
A provision for onerous contracts is recognised when the expected benefits to be derived by the Group from a contract are lower than the unavoidable cost of meeting its obligations under the contract.
Guarantees
A financial guarantee is a contract that requires the issuer to make specified payments to reimburse the holder for a loss it incurs because a specified debtor fails to make payment when due in accordance with the original or modified terms of a debt instrument. These financial guarantees are classified as insurance contracts as defined in IFRS 4: “Insurance Contracts”. A liability is recognised when it is

53
probable that an outflow of resources embodying economic benefits will be required to settle the contract and a reliable estimate can be made of the amount of the obligation. The amount recognised is the best estimate of the expenditure required to settle the contract at the reporting date. Where the effect of discounting is material, the liability is discounted. The discount rate used is a pre-tax rate that reflects current market assessments of the time value of money and, where appropriate, the risks specific to the liability. The Group performs liability adequacy tests on financial guarantee contract liabilities to ensure that the carrying amount of the liability is sufficient in view of estimated future cash flows. When performing the liability adequacy test, the Group discounts all expected contractual cash flows and compares this amount to the carrying value of the liability. Where a shortfall is identified, an additional provision is made.
Non-current assets held for sale
Non-current assets (or disposal groups comprising assets and liabilities) that are expected to be recovered primarily through sale rather than through continuing use are classified as held for sale. This condition is regarded as met only when the sale is highly probable and expected to be completed within one year from classification and the asset is available for immediate sale in its present condition. Immediately before classification as held for sale, the assets (or components of a disposal group) are remeasured in accordance with the Group’s accounting policies. Thereafter assets classified as held for sale are measured at the lower of carrying value and fair value less costs to sell. Any impairment loss on a disposal group is first allocated to goodwill, and then to remaining assets and liabilities on a pro rata basis, except that no loss is allocated to inventories, financial assets, deferred tax assets and employee benefit assets, which continue to be measured in accordance with the Group’s accounting policies. Impairment losses on initial classification as held for sale and subsequent gains or losses on remeasurement are recognised in profit or loss. Gains are not recognised in excess of any cumulative impairment loss.
Discontinued operations
Disposal groups are classified as discontinued operations where they represent a major line of business or geographical area of operations that has been disposed of or is held for sale. Classification as a discontinued operation occurs upon disposal or when the operation meets the criteria to be classified as held for sale, if earlier. When an operation is classified as a discontinued operation, the comparative income statement is re-presented as if the operation had been discontinued from the start of the comparative period.
Segment reporting
An operating segment is a component of the Group that engages in business activities from which it may earn revenues and incur expenses, including revenues and expenses that relate to transactions with any of the Group’s other components. All operating segments’ operating results are reviewed regularly by the executive team (who has been identified as the chief operating decision-maker) to make decisions about resources to be allocated to the segment and assess its performance, and for which discrete financial information is available.

54
Group Company
Restated Restated
2014 2013 2012 2014 2013 2012R’000 R’000 R’000 R’000 R’000 R’000
2. COST OF SALES, DISTRIBUTION AND ADMINISTRATION EXPENSES
Cost of sales, distribution and selling expenses 6 486 298 6 251 814 4 879 859 – – –
Operating expenses 737 055 706 429 626 911 1 349 1 109 1 725
7 223 353 6 958 243 5 06 770 1 349 1 109 1 725
The above costs are stated after:
Depreciation of property, plant and equipment 46 164 37 300 35 516 – – –
Buildings 2 183 1 756 2 472 – – –
Leasehold improvements 8 502 7 682 7 443 – – –
Plant and machinery 20 812 15 797 13 942 – – –
Motor vehicles 6 284 5 480 5 917 – – –
Office equipment, furniture and fittings 1 195 1 317 984 – – –
Computer equipment 7 188 5 268 4 758 – – –
Depreciation of bearer plants 7 721 8 581 – – – –
Amortisation of intangible assets 3 563 6 147 5 194 – – –
Impairment loss raised/(reversed) on trade receivables 948 (2 945) 405 – – –
Fair value – realised through harvest (43 484) (48 847) (19 141) – – –
Change in fair value 43 877 43 484 48 847 – – –
Fair value adjustment biological assets (2 259) 156 (24 467) – – –
Employee costs 437 176 418 298 433 022 – – –
Retrenchment and restructuring costs 502 7 138 1 999 – – –
Operating lease charges 104 773 87 153 94 808 – – –
Property 78 989 60 231 62 682 – – –
Equipment 17 971 19 037 25 136 – – –
Other 7 813 7 885 6 990 – – –
Auditors’ remuneration 9 593 11 983 9 138 – – –
Audit fees – current year 7 930 8 316 7 418 – – –
Audit fees – prior year 445 3 213 1 368 – – –
Other services 1 140 390 328 – – –
Expenses 78 64 24 – – –
Foreign exchange gains (10 029) (10 902) (13 768) – – –
Realised gain (8 075) (10 643) (12 561) – – –
Unrealised gain (1 954) (259) (1 207) – – –
Equity-settled share-based payment 1 136 – – – – –
3. FINANCIAL INCOMEInterest income 45 603 38 130 38 080 37 36 52
Dividend income 2 126 129 – – –
Income from subsidiaries
– Dividends – – – 51 000 35 200 70 000
45 605 38 256 38 209 51 037 35 236 70 052

55
Group Company
Restated Restated2014 2013 2012 2014 2013 2012
R’000 R’000 R’000 R’000 R’000 R’000
4. FINANCIAL EXPENSES
Interest expense – financial institutions 31 091 30 805 34 681 – – –
Interest expense – employee benefits 17 491 16 329 2 767 1 217 1 414 1 409
48 582 47 134 37 448 1 217 1 414 1 409
– During 2014 the Group capitalised R3,0 million for bearer plants (2013: R1,5 million and 2012: Rnil).
Group Company
Restated Restated2014 2013 2012 2014 2013 2012
R’000 R’000 R’000 R’000 R’000 R’000
5. OTHER INCOME
Deemed profit on disposal of associate 16 103 – 67 004 – – –
Profit on disposal of investments 3 559 – 1 508 – – –
Profit on disposal of property, plant and equipment 2 693 154 33 635 – – –
Reversal of impairment in property, plant and equipment 11 893 – – – – –
34 248 154 102 417 – – –
– During 2014 the Group recovered a liquidation settlement in Capespan International Limited together with backdated rates recoveries in FPT Group (Pty) Ltd.
– During 2014 the Group generated a profit on disposal of its investment in Stellenbosch Vineyards (Pty) Ltd.
– The reversal of impairment in property, plant and equipment relates to the assets previously impaired in Addo Cold Store (Pty) Ltd.
– During 2013 the Group disposed of the farming operations at Queen Anne, Warmzand and Vaalhoek.
– The deemed profit on disposal of the associate arose from the conversion of Capespan International Holdings Limited from an associate to a subsidiary.
– During 2012 the Group disposed of of Altius Trading 237 (Pty) Ltd and Genetwister Africa (Pty) Ltd.
– During 2012 the fair value adjustment relates to the revaluation of fruit and vines classified as non-current Biological assets.
– During 2012 the majority of the profit on disposal of property, plant and equipment relates to the sale of the previous Capespan owned sectional title building, Parc du Cap, situated in Bellville, Cape Town.

56
Group Company
Restated Restated
2014 2013 2012 2014 2013 2012
R’000 R’000 R’000 R’000 R’000 R’0006. OTHER EXPENSES
Contingent consideration 65 657 – – – – –Restructuring costs 502 7 138 – – – –Impairment of loans 54 3 310 – – – –Impairment of intangible assets 9 166 – 6 500 – – –Impairment of plant, property and equipment – 205 16 350 – – –Impairment of other assets – 590 – – – –Impairment of investments – 1 204 22 004 – – –Impairment of goodwill (refer note 11) 202 4 795 1 284 – – –Disposal of Queen Anne goodwill – 3 833 – – – –
75 581 21 075 46 138 – – –
– The contingent consideration relates to the remeasurement of the contingent liability for the associate Golden Wing Mau.
– During 2014 the Group impaired the Prophet System R8,3 million and certain marketing rights R0,8 million in Capespan South Africa (Pty) Ltd.
– During 2013 the Group impaired R0,8m, property, plant and equipment in various subsidiaries together with a R1,2 million impairment in investments in unlisted companies.
– The impairment of goodwill in 2013 relates to the impairment of Addo Cold Store (Pty) Ltd.
– The disposal of Queen Anne goodwill arose following the sale of the farm in the 2013 year.
– The impairment of investment in associate in 2012 relates to the full impairment of the carrying value in Stellenbosch Vineyards Group Limited.
– The impairment of property, plant and equipment in 2012 includes the impairment of Addo Cold Store (Pty) Limited plant, machinery and buildings (R13,5 million).
Group Company
Restated Restated
2014 2013 2012 2014 2013 2012
R’000 R’000 R’000 R’000 R’000 R’0007. TAXATION
Income tax expense – profit or lossCurrent taxation 78 720 56 760 40 415 198 – – Current year 77 866 55 873 39 760 – – – Prior years 854 887 655 198 – –Deferred taxation (12 510) (219) 26 016 – – – Current year (15 119) (2 434) 24 041 – – – Prior years 2 239 2 221 1 975 – – – Rate change 370 (6) – – – –Withholding taxes 1 771 774 3 503 – – –Secondary tax on companies – – 4 098 – – –Total income tax expense 67 981 57 315 74 032 198 – –Comprising: Local taxation 7 719 5 779 33 674 198 – – Foreign taxes 50 991 50 762 32 757 – – – Foreign withholding taxes 9 271 774 3 503 – – – Secondary tax on companies – – 4 098 – – –
67 981 57 315 74 032 198 – –

57
Income tax expense – other comprehensive income
Restated Restated
2014 2013 2012
Gross Tax Net Gross Tax Net Gross Tax Net
Group R’000 R’000 R’000 R’000 R’000 R’000 R’000 R’000 R’000
Defined benefit plan actuarial (gains)/ losses 20 705 (6 506) 14 199 (328) (193) (521) 13 736 (4 803) 8 933
Company
Defined benefit plan actuarial (gains)/ losses 2 014 – 2 014 (208) – (208) 473 – 473
Group Company
Restated Restated
2014 2013 2012 2014 2013 2012
Reconciliation of taxation rates R’000 R’000 R’000 R’000 R’000 R’000
Taxation as a percentage of profit before taxation and share of profits of associates 54.5 35.9 38.0 – – –
Tax effect of
– Effect of tax losses utilised 2.1 6.4 1.4 – – –
– Exempt income 1.2 0.6 9.5 29.0 29.4 28.8
– Deferred tax assets reversed (7.4) (2.3) (8.8) – – –
– Deferred purchase consideration (14.7) – – – – –
– Disallowed expenditure (3.7) (8.9) (8.1) (0.9) (0.3) (0.1)
– Prior period adjustment (2.5) (2.1) (0.6) (0.4) – –
– Rate adjustment (0.3) – – – –
– Other 0.2 (1.0) 1.0 0.3 (1.1) (0.7)
– STC on dividends – – (2.4) – – –
– Withholding taxes (1.4) (0.6) (2.0) – – –
Standard tax rate 28.0 28.0 28.0 28.0 28.0 28.0
Estimated Group tax losses available for set-off against future taxable income (gross) 383 453 311 802 277 058 – – –
Of the tax losses available R53 758 000 (2013: R48 634 000; 2012: R54 285 000) has been recognised as a deferred tax asset (refer note 15). Of the tax losses available, R53 500 000 has not been recognised as a deferred tax asset as there is no certainty whether these assets will be utilised in future years.

58
Land and buildings
Leasehold improvements
Plant and machinery
Motor vehicles
Office equipment
furniture and fittings
Computer equipment Total
R’000 R’000 R’000 R’000 R’000 R’000 R’000
8. PROPERTY, PLANT AND EQUIPMENTAt 31 December 2014
Cost 140 509 220 094 244 140 65 414 19 566 97 882 787 605
Accumulated depreciation and impairment (21 205) (85 899) (129 077) (33 618) (15 421) (67 485) (352 705)
Carrying amount 119 304 134 195 115 063 31 796 4 145 30 397 434 900
Reconciliation
Carrying amount value at the beginning of year 129 321 62 452 100 001 14 645 4 204 10 859 321 482
Additions 5 897 78 446 38 964 24 324 1 149 26 774 175 554
Disposals (237) – (1 119) (996) (40) (36) (2 428)
Depreciation (2 183) (8 502) (20 812) (6 284) (1 195) (7 188) (46 164)
Reversal of impairment of assets 8 277 – 3 616 – – – 11 893
Transferred to held for sale (refer note 21) (20 454) – (9 533) – (11) – (29 998)
Exchange rate movements (1 317) (545) 3 946 107 38 (12) 2 217
Carrying amount 119 304 134 195 115 063 31 796 4 145 30 397 434 900
At 31 December 2013
Cost 178 484 146 529 227 296 43 073 18 827 74 059 688 268
Accumulated depreciation and impairment (49 163) (84 077) (127 295) (28 428) (14 623) (63 200) (366 786)
Carrying amount 129 321 62 452 100 001 14 645 4 204 10 859 321 482
Reconciliation
Carrying amount value at the beginning of year 128 169 62 975 76 922 14 654 4 059 9 639 296 418
Additions 22 384 6 938 43 945 4 572 1 125 5 796 84 760
Disposals (20 501) – (6 876) (613) – – (27 990)
Depreciation (1 756) (7 682) (15 797) (5 480) (1 317) (5 268) (37 300)
Impairments – – (203) – (2) – (205)
Exchange rate movements 1 025 221 2 010 1 512 339 692 5 799
Carrying amount 129 321 62 452 100 001 14 645 4 204 10 859 321 482
At 31 December 2012
Cost 171 009 139 777 233 612 40 509 15 321 80 151 680 379
Accumulated depreciation and impairment (42 840) (76 802) (156 690) (25 855) (11 262) (70 512) (383 961)
Carrying amount 128 169 62 975 76 922 14 654 4 059 9 639 296 418
Reconciliation
Carrying amount value at the beginning of year 137 153 66 295 85 465 13 653 3 131 9 837 315 534
Additions 5 472 3 076 9 798 7 903 2 327 4 964 33 540
Disposals – – (1 402) (710) (245) (174) (2 531)
Depreciation (2 472) (7 443) (13 942) (5 917) (984) (4 758) (35 516)
Impairments (9 000) – (7 228) (3) (30) (89) (16 350)
Exchange rate movements (2 018) 1 047 470 (428) (140) (128) (1 197)
Carrying amount 128 169 66 731 73 492 14 328 4 059 9 639 296 418
Continuing general notarial bond to the value of R3 000 000 (2013: R3 000 000; 2012: R3 000 000) over equipment. Property, plant and equipment with a carrying amount of R27 800 000 (2013: R58 800 000; 2012: R90 800 000) have been encumbered in terms of liens given as security for loans (refer note 23).

59
Restated Restated
2014 2013 2012
Group R’000 R’000 R’000
9. BEARER PLANTS
Bearer plants
Carrying value at the beginning of the year – 128 484 119 132
Change in accounting policy – 943 –
Restated carrying value 117 122 129 427 119 132
Additions 49 145 22 047 6 420
Production cost and borrowing cost capitalised 25 136 6 780 –
Disposals of farms – (32 551) (2 557)
Transferred to held for sale – – (1 842)
Change in fair value less estimated point-of-sale costs – – 7 331
Removals/impairment (2 159) – –
Depreciation (7 721) (8 581) –
Restated carrying value at the end of the year 181 523 117 122 128 484
Comprising:
Cost 197 825 125 703 128 484
Accumulated depreciation (16 302) (8 581) –
181 523 117 122 128 484
Comprising:
Grapes 129 217 69 195 64 833
Apples and pears 39 841 32 703 46 838
Citrus 12 465 15 224 16 813
181 523 117 122 128 484
Software development
Patents and trademarks
Leasehold rights
Cultivar/marketing
rightsCustomer
listing TotalGroup – 2014 R’000 R’000 R’000 R’000 R’000 R’000
10. INTANGIBLE ASSETS
Comprising:
Cost 24 417 2 811 19 686 5 358 16 716 68 988
Accumulated amortisation (19 738) – (16 346) (1 888) (3 344) (41 316)
4 679 2 811 3 340 3 470 13 372 27 672
Carrying amount at beginning of year 11 023 2 811
3 8094 822 14 208 36 673
Additions 3 734 – – – – 3 734
Amortisation (1 748) – (469) (510) (836) (3 563)
Impairment (8 324) – – (842) – (9 166)
Movement in foreign exchange (6) – – – – (6)
4 679 2 811 3 340 3 470 13 372 27 672

60
Software development
Patents, trademarks
and otherLeasehold
rights
Cultivar/marketing
rightsCustomer
lsting TotalGroup – 2013 R’000 R’000 R’000 R’000 R’000 R’000
Comprising:
Cost 20 692 2 811 19 686 5 358 16 716 65 263
Accumulated amortisation (9 669) – (15 877) (536) (2 508) (28 590)
11 023 2 811 3 809 4 822 14 208 36 673
Carrying amount at beginning of year 12 832 2 811 5 045 5 358 15 044 41 090
Additions 730 – 1 000 – – 1 730
Amortisation (2 539) – (2 236) (536) (836) (6 147)
11 023 2 811 3 809 4 822 14 208 36 673
Group – 2012
Comprising:
Cost 19 962 2 811 18 686 5 358 16 716 63 533
Accumulated amortisation (630) – (13 641) – (1 672) (15 943)
Impairment (6 500) – – – – (6 500)
12 832 2 811 5 045 5 358 15 044 41 090
Carrying amount at beginning of year 16 132 2 811 8 777 5 358 15 880 48 958
Additions 3 826 – – – – 3 826
Amortisation (626) – (3 732) – (836) (5 194)
Impairment (6 500) – – – – (6 500)
12 832 2 811 5 045 5 358 15 044 41 090
• Software development is amortised over an expected useful life of six to eight years. In accordance with the Group’s accounting policy, an impairment test was performed on the carrying value of intangible assets with finite useful lives.
• During 2014, the Group implemented as new software system in Capespan South Africa (Pty) Ltd, resulting in the impairment charge on the previously capitalised software system of R8,3 million in 2014 and R6,5 million had been impaired in 2012.
• The marketing rights impairment calculation indicated an impairment of R0,8 million in the 2014 year.
• Trademarks are considered to have indefinite useful lives. There is no apparent legal or other restriction to the use of the trademarks or risk of technical or other obsolescence. Given the strategic importance of the trademarks to the future sustainability of the Group, the Group’s intention is to continue to use the trademarks indefinitely. In accordance with the Group’s accounting policy, an impairment test was performed on the carrying value of intangible assets with indefinite useful lives. Impairment calculations indicated that the trademarks are not impaired.
• Leasehold rights are amortised over their expected useful lives with the balance tested for impairment where indicators of impairment exist.

61
Group Company
Restated Restated
2014 2013 2012 2014 2013 2012
R’000 R’000 R’000 R’000 R’000 R’00011. GOODWILL
Comprising:Cost 323 895 303 777 265 236 – – –Accumulated impairment (28 982) (28 781) (23 986) – – –
294 913 274 996 241 250 – – –Carrying amount at beginning of year 274 996 241 250 72 524 – – –Additions – – 154 926 – – –Impairment of goodwill (202) (4 795) (1 284) – – –Disposal – (3 833) – – – –Effects of movement in foreign exchange 20 119 42 374 15 084 – – –Carrying amount at end of year 294 913 274 996 241 250 – – –Goodwill composition:Capespan North America 19 970 19 970 19 970 – – –Metspan – Hong Kong 31 361 22 213 22 213 – – –Capespan International Holdings Limited 223 299 212 328 169 956 – – –Other subsidiary companies 20 283 20 485 29 111 – – –
294 913 274 996 241 250 – – –
In 2014, in accordance with the Group’s accounting policy of testing goodwill annually, R0,2 million relating to foreign subsidiary’s goodwill was impaired.
In 2013, the tests performed indicated R4,8 million relating to Addo Cold Store (Pty) Ltd was impaired while R3,8 million of goodwill was realised as part of the Queen Anne farm disposal.
In 2012, the tests performed indicated R1,3 million relating to Chris Ida Boerdery (Pty) Limited was impaired.
A standard methodology of testing of goodwill ie “discounted cash flow model” to each applicable entity was performed which includes:
• cash flow projections for a five-year forecast horizon including a terminal value;
• cash flows were discounted at an appropriate rate, being the entity’s weighted average cost of capital;
• growth in perpetuity of cash flows beyond the five-year horizon was estimated between 0 and 2%;
• the present value of the cash flows was translated to the reporting currency at the exchange rate prevailing at the reporting date; and
2014 2013 2012Discount rates used for major goodwill carrying values % % %Capespan North America 3.9 6.3 6.1Metspan – Hong Kong 7.7 12.2 12.4Capespan International Holdings Limited 7.9 6.0 6.3

62
R’000 R’000 R’00012. INVESTMENT IN SUBSIDIARY
Capespan Group Holdings Limited – Indebtedness 508 980 508 980 508 980Capespan International Holdings Limited – Shares 136 777 136 777 136 777Investment in subsidiaries 1 136 – –
646 893 645 757 645 757
The loan to Capespan Group Holdings Limited is unsecured and interest free with no fixed payment terms.
Details of the direct and indirect subsidiary companies and the nature of their operations are disclosed in Annexure 1 on page 96 of these financial statements.
The increase in investment in subsidiaries relates to capital contributions made by the holding company in respect of the Group share option scheme.
Restated Restated
2014 2013 2012
Group R’000 R’000 R’000
13. INVESTMENTS IN ASSOCIATES
Associate companies (unlisted)
Cost 174 721 154 056 119 609
Opening balance 154 056 119 609 162 921
Associate converted to subsidiary (8 222) – (34 354)
Impairment of cost of associate – – (8 335)
Additions* 28 887 9 202 –
Foreign currency translation movement – 25 245 –
Disposal of associate – – (623)
Post-acquisition reserves 150 360 86 772 44 036
– Opening balance 86 772 44 036 39 803
– Current year share of profits 60 651 28 810 26 048
– Dividends received – (8 340) –
– Disposal of associate – – 1 163
– Foreign currency translation gains 2 937 22 266 5 244
– Impairment of post-acquisition reserves of associate – – (13 669)
– Associate converted to subsidiary – – (14 553)
Total 325 081 240 828 163 645
Summarised financial position of associates – 100%
AssetsR’000
LiabilitiesR’000
EquityR’000
RevenueR’000
2014 1 448 427 625 973 822 454 5 307 453
2013 1 504 185 954 143 550 042 3 632 697
2012 1 389 066 1 053 750 335 316 2 780 950
Details of associated companies and the nature of their operations are disclosed in Annexure 2 on page 97 of these financial statements.
* During 2014 the Group formed a 50% associate Mayfresh (Turkey) and acquired a 25.1% shareholding in Goodview (Hong Kong).
During 2013 the Group formed Capespan Capital and holds a 49% stake in the company and acquired 405 shares in Gestão de Terminais.

63
During 2012 the Group impaired the investment in Stellenbosch Vineyards (Pty) Ltd.
Group Company
Restated Restated
2014 2013 2012 2014 2013 2012
R’000 R’000 R’000 R’000 R’000 R’000
14. OTHER FINANCIAL ASSETS
Employee loans 21 218 – – – – –
Receivables 56 065 51 104 72 236 – – –
Other investments 4 729 3 756 6 190 – – –
82 012 54 860 78 426 – –
Current portion of receivables (refer note 18) (48 718) (13 227) (15 896) – – –
33 294 41 633 62 530 – – –
Other investments
Investments in unlisted companies
Members’ share funds and unlisted shares 3 408 2 749 5 272 – – –
Other investments
3.5% United Kingdom Government War Loan Stock at valuation 1 321 1 007 918 – – –
Total 4 729 3 756 6 190 – – –
Directors’ valuation 4 729 3 756 6 190 – – –
During the year management reviewed the carrying value of the investment in unlisted companies and impaired Rnil (2013: R1,2 million; 2012: Rnil).
15. DEFERRED TAXATIONDeferred taxation is calculated on all temporary differences using the applicable statutory tax rate.
Group Company
Restated Restated
2014 2013 2012 2014 2013 2012
R’000 R’000 R’000 R’000 R’000 R’000
The movement on the deferred tax account is as follows:
Opening balance (as previously stated) 15 733 11 080 25 350 – – –
Prior period adjustment – – (8 267) – – –
Restated opening balance – – 17 083 – – –
Temporary differences in profit or loss 12 880 213 (26 016) – – –
Change in tax rate (370) 6 – – – –
Items recognised in other comprehensive income 6 506 193 3 702 – – –
Disposal/acquisition of subsidiaries – – 15 452 – – –
Effects of movement in foreign exchange (7 054) 4 241 859 – – –
Balance at end of year 27 695 15 733 11 080 – – –

64
Deferred tax assets and liabilities
Assets Liabilities Net
2014 2013 2012 2014 2013 2012 2014 2013 2012
Restated Restated Restated Restated Restated Restated
Group R’000 R’000 R’000 R’000 R’000 R’000 R’000 R’000 R’000
The balance on the deferred tax account comprises:
Property, plant and equipment 21 126 17 607 10 446 (23 027) (19 424) (30 493) (1 901) (1 817) (20 047)
Bearer plants – – – (45 034) (56 242) (39 356) (45 034) (56 242) (39 356)
Intangibles – – – (432) (4 287) (5 052) (432) (4 287) (5 052)
Other financial assets 181 1 152 1 331 (370) (275) – (189) 877 1 331
Trade and other receivables 3 175 3 334 5 475 (876) (650) (344) 2 299 2 684 5 131
Trade and other payables 1 375 4 627 5 712 – – – 1 375 4 627 5 712
Provisions 10 557 12 072 7 213 (12 027) (12 077) (13 996) (1 470) (5) (6 783)
Post-retirement fund obligations 27 500 22 659 16 251 – – – 27 500 22 659 16 251
Other 1 967 1 209 1 392 (2 705) (2 606) (1 784) (738) (1 397) (392)
Withholding taxes – – – (7 500) – – (7 500) – –
Recognised tax losses 53 785 48 634 54 285 – – – 53 785 48 634 54 285
Total assets/(liabilities) 119 666 111 294 102 105 (91 971) (95 561) (91 025) 27 695 15 733 11 080
Set-off of tax (57 943) (53 612) (48 067) 57 943 53 612 48 067 – – –
Net assets/(liabilities) 61 723 57 682 54 038 (34 028) (41 949) (42 958) 27 695 15 733 11 080
Restated Restated
2014 2013 2012
Group R’000 R’000 R’000
16. BIOLOGICAL ASSETS
Biological assets
Carrying amount at the beginning of the year 43 484 48 847 19 141
Realised harvest and sales (43 484) (48 847) (19 141)
Change in fair value of estimated point of sale costs 43 877 43 484 48 847
Carrying amount at the end of the year 43 877 43 484 48 847
Comprising:
Agricultural produce unharvested 43 877 43 484 48 847
Measurement of fair values
• The fair value measurement of the current biological assets below, which comprises grapes, pome, citrus and sugar cane at year-end, was valued at R43,9 million (2013: R43,5 million; 2012: R48,9 million).
• These fair value assets have been categorised as a level 3 fair value, based on the inputs to the valuation techniques used.
Biological assets comprise grapes on the vineyards and fruit in the orchards, have been valued using the following assumptions:
• expected sales realisation of all grapes, citrus and pome at free on board value for export fruit and net value for local sales;
• budgeted costs to harvest and sell per the approved budget for the following financial years (2015, 2014 and 2013);
• packing and cooling costs as per the approved budget; and
• overheads directly attributable to the operation for the year.

65
Risk management strategy related to agricultural activities
The Group is exposed to the following risks relating to its vineyards, orchards and cane fields:
Laws and regulations
The Group is subject to laws and regulations in various countries in which it operates. The Group has established environmental policies and procedures aimed at compliance with local and environmental and other laws.
Supply and demand risk
The Group is exposed to risks arising from fluctuations in the price and sales volume of grapes, citrus and pome fruit. The Group exports all export fruit through a fellow Group subsidiary, Capespan South Africa, who manages the supply and demand risk as part of its marketing agreement with the farm.
Inherent risk factors
The Group’s vineyards, orchards and cane fields are exposed to risk of damage from climate change and diseases as well as other natural forces. The Group follows extensive fertiliser and spray programmes to mitigate these risk, in line with global accepted practices. Comprehensive crop insurance is also taken out against climate conditions such as extreme winds, rain and hail.
Group Company
Restated Restated
2014 2013 2012 2014 2013 2012
R’000 R’000 R’000 R’000 R’000 R’000
17. INVENTORIES
Packaging 8 280 6 445 6 250 – – –
Fresh produce 219 058 290 567 190 124 – – –
Consumables 13 918 15 646 9 620 – – –
241 256 312 658 205 994 – – –
18. TRADE AND OTHER RECEIVABLES
Trade receivables – external (net of impairment) 708 586 693 609 606 572 – – –
Other receivables and prepayments 174 265 70 672 178 755 57 – 32
Current portion of other financial assets (refer note 14) 48 718 13 227 15 896 – – –
931 569 777 508 801 223 57 – 32
Of the total trade receivables, Capespan North America trade receivables amounting to R30,9 million (2013: R28,7 million; 2012: R18,9 million) are provided as security for their business banking facility.
Group Company
Restated Restated
2014 2013 2012 2014 2013 2012
R’000 R’000 R’000 R’000 R’000 R’00019. CASH AND CASH EQUIVALENTS
Bank balances 273 076 418 604 433 385 1 209 1 296 2 154
Call deposits 84 031 7 518 8 070 – – –
Cash and cash equivalents 357 107 426 122 441 455 1 209 1 296 2 154

66
2014 2013 2012
Group R’000 R’000 R’000
20. NON-CURRENT ASSETS HELD FOR SALE
Property, plant and equipment (carrying value) (refer note 8) 29 998 – 1 144
Biological assets – – 1 842
Other 380 – 14
30 378 – 3 000
Addo Cold Store (Pty) Ltd has been presented as a non-current asset held for sale following the successful negotiations to sell the company with an effective date in 2015.
In 2012, farm Uizip in the Northern Cape has been presented as a non-current asset held for sale following the conclusion of the sale of the farm on 16 October 2012. Proceeds of R3 million were received in 2013 upon disposal of the farm.
Group Company
Restated Restated
2014 2013 2012 2014 2013 2012
R’000 R’000 R’000 R’000 R’000 R’000
21. SHARE CAPITAL AND PREMIUM
Share capital at par value
Authorised
600 000 000 ordinary shares of one cent each 6 000 6 000 6 000 6 000 6 000 6 000
Issued
Issued share capital 355 720 294(2013: 351 220 294) of one cent each 3 557 3 512 3 512 3 557 3 512 3 512
Opening balance(351 220 294 of one cent each) 3 512 3 512 3 312 3 512 3 512 3 312
Shares issued during the year(4 500 000 of one cent each) 45 – 200 45 – 200
Share premium 473 362 458 512 458 512 473 362 458 512 458 512
Opening balance 458 512 458 512 410 712 458 512 458 512 410 712
Issued during the year 14 850 – 47 800 14 850 – 47 800
Total 476 919 462 024 462 024 476 919 462 024 462 024
During the year the company issued 4 500 000 shares in terms of the funded subscription scheme approved at the general meeting on 15 May 2014.
On 31 December 2014 the joint direct and indirect beneficial interests of all directors in the shares of the company totalled 7 628 610 (2013: 5 028 610; 2012: 5 028 610) shares.
A subsidiary company, Capespan (Pty) Limited, holds 32 231 189 (2013: 32 395 997; 2012: 32 395 997) treasury shares in Capespan Group Limited.
The holders of ordinary shares are entitled to receive dividends as declared from time to time and are entitled to one vote per share (excluding the treasury shares owned by Capespan (Pty) Limited) at meetings of the company.

67
21.1 Equity-settled share-based payment reserve
Share option scheme
During the year under review, Capespan Group Ltd replaced its long-term bonus scheme (refer note 25.4) with a share option scheme. In terms of the share option scheme, share options are granted to participants (being executive directors and senior management) on grant date at market price. The settlement of the purchase consideration payable by the participant in terms of the share options granted occurs on vesting. Vesting of share options occurs in tranches of 25% each after two, three, four and five years from grant date, respectively.
Participants with ‘in the money’ entitlements in terms of the long-term bonus scheme were awarded their first tranche of share options at a reduced exercise price. Accordingly, the previously recognised liability of R9,4 million (net at tax) was reclassified to the share-based payment reserve and the remainder of the equity-settled share-based payment charge (calculated making use of a Black-Scholes valuation model and the inputs set out below) will be recognised over the specified service periods. The equity-settled share-based payment charge recognised in the income statement amounted to R1,1 million. This charge, net of the related tax effect, was credited to the share-based payment reserve (refer statement of changes in equity).
During the year under review, 14 745 737 share options were granted to participants at a total consideration of R35 717 000. Each share option awarded entitles the participant to acquire one ordinary share in the issued share capital of Capespan Group Ltd. The maximum number of shares which may be offered to participants is 38 818 693. During the year under review, the Capespan Group Share Incentive Trust acquired 403 111 ordinary shares in Capespan Group Ltd in order to assist in meeting its obligations in terms of the share options granted.
2014 Number of
share options
Number of share options allocated during the year 14 745 737
Number of share options forfeited during the year (906 344)
Number of share options outstanding at end of the year 13 839 393
Granting of share options occurred as follows:
Number of
share options
Price R
Volatility %
Dividend yield
%
Risk-free rate
%
Fair value
R
1 January 2014 2 256 798 0,99 31.2 4.4 6.1 – 7.3 2,07
1 January 2014 1 325 801 1,08 31.2 4.4 6.1 – 7.3 2,00
1 January 2014 2 636 918 1,45 31.2 4.4 6.1 – 7.3 1,72
1 January 2014 7 619 876 3,31 31.2 4.4 6.1 – 7.3 0,73
13 839 393
2014
Analysis of outstanding share options by financial year of maturity:
Weighted average
strike price R
Number of share options
31 December 2016 2,36 3 459 848
31 December 2017 2,36 3 459 848
31 December 2018 2,36 3 459 848
31 December 2019 2,36 3 459 849
13 839 393

68
22. EARNINGS AND DIVIDENDS PER SHARE
Basic attributable earnings per share is calculated by dividing the profit attributable to equity holders of the parent by the weighted average number of ordinary shares issued during the year:
Group Company
Restated Restated
2014 2013 2012 2014 2013 2012
R’000 R’000 R’000 R’000 R’000 R’000
Basic earnings per share
Profit attributable to owners of the company (R’000) 108 356 120 098 139 417 49 121 33 519 67 963
Weighted average number of ordinary shares in issue (’000) 321 189 318 824 315 537 353 710 351 220 347 933
Basic earnings per share (cents) 33.7 37.7 44.2 13.9 9.5 19.5
Group Company
2014 Restated 2013 Restated 2012 2014 2013 2012
Gross Net of tax Gross Net of tax Gross Net of tax
Headline earnings
Profit attributable to owners of the parent (R’000) 108 356 – 120 098 – 139 417 49 121 33 519 67 963
Adjusted for: (R’000)
– Profit on disposal of investments (3 559) (3 559) – – (1 508) (1 208) – – –
– Profit on disposal of property, plant and equipment (2 693) (2 295) 3 679 (165) (33 635) (30 702) – – –
– Impairment of goodwill 202 202 4 795 4 795 1 284 1 284 – – –
– Impairment of intangible asset 9 166 6 599 – – 6 500 6 500 – – –
– (Reversal)/impairment of property, plant and equipment in subsidiary (11 893) (11 893) 795 795 22 004 22 004 – – –
– Impairment of investments – – 1 204 1 017 (67 004) (67 004) – – –
– Impairment of property, plant and equipment in subsidiary – – – – 16 350 16 350 – – –
Headline earnings (R’000) 97 410 126 540 86 641 49 121 33 519 67 963
Headline earnings per share (cents) 30.3 39.7 27.5 13.9 9.5 19.5

69
Group Company
2014 Restated 2013 Restated 2012 2014 2013 2012
Recurring earnings Gross Net of tax Gross Net of tax Gross Net of tax
Headline earnings (R’000) 97 410 126 540 86 641 49 121 33 519 67 963
Duplicate grape income – – – – (21 587) (14 633) – – –
Recoveries (16 103) (12 315) – – – – – – –
Contingent consideration 65 657 65 657 – – – – – – –
Restructuring costs 502 361 7138 5 018 – – – – –
Impairment of long-term loans 54 54 3 310 2 383 – – – – –
Deferred taxation reversals 7 588 7 588 4 987 4 987 16 400 16 400 – – –
Recurring earnings (R’000) 158 755 138 928 88 408 49 121 33 519 67 963
Recurring earnings per share (cents) 49.4 43.6 28.0 13.9 9.5 13.9
Diluted earnings per share is calculated by adjusting the weighted average number of ordinary shares in issue to assume conversion of all dilutive potential ordinary shares (arising from the share incentive set out in note 20.1).
Group Company
Restated Restated
2014 2013 2012 2014 2013 2012
R’000 R’000 R’000 R’000 R’000 R’000
Diluted earnings per share
Profit attributable to owners of the company (R’000) 108 356 120 098 139 417 49 121 33 519 67 963
Weighted average number of ordinary shares in issue (’000) 321 189 318 824 315 537 353 710 351 220 347 933
Number dilutive shares under the option at nil consideration (’000) 6 404 – – 6 404 – –
327 593 318 824 315 537 360 114 351 220 347 933
Diluted earnings per share (cents) 33.1 37.7 44.2 13.6 9.5 19.5
Diluted headline earnings per share (cents) 29.7 39.7 27.5 13.6 9.5 19.5
Dividend per share
Dividend paid to ordinary shareholders (R’000) 46 230 31 883 28 693 50 927 35 122 31 609
Ordinary shares in issue (’000) 318 824 318 824 318 824 351 220 351 220 351 220
Dividend per share (cents) 14.5 10.0 9.0 14.5 10.0 9.0
23. INTEREST-BEARING BORROWINGS
Secured
Loans secured by lien on certain property, plant and equipment (refer note 8) 271 017 147 385 183 254 – – –
271 017 147 385 183 254 – – –
Current portion of borrowings (33 706) (25 581) (10 882) – – –
237 311 121 804 172 372 – – –

70
Group Company
Restated Restated
2014 2013 2012 2014 2013 2012
R’000 R’000 R’000 R’000 R’000 R’000
Schedule of repayment:
Within 1 year 33 706 25 581 10 882 – – –
From 2 to 5 years 229 907 121 436 131 963 – – –
Over 5 years 7 404 368 40 409 – – –
271 017 147 385 183 254 – – –
Interest rates are variable and range between 2.0% and 9.25% per annum (2013: 6.5% and 9.5%; 2012: 6.5% and 9.5%).
2014 Interest rates vary per region:
Hong Kong – 2.8%Japan – 2.0%South Africa – 7.4% – 9.25%
Group Company
Restated Restated
2014 2013 2012 2014 2013 2012
R’000 R’000 R’000 R’000 R’000 R’000
24. NON-INTEREST-BEARING BORROWINGS
Non-interest-bearing shareholder loans 19 837 18 617 18 698 113 976 127 842 127 936
Deferred purchase consideration – 113 342 88 097 – – –
19 837 131 959 106 795 113 976 127 842 127 936
Current portion of borrowing 19 837 113 342 – – – –
– 18 617 106 795 113 976 127 842 127 936
Group Company
Restated Restated
2014 2013 2012 2014 2013 2012
Note R’000 R’000 R’000 R’000 R’000 R’000
25. EMPLOYEE BENEFITS
Long-term employee benefits
Post-retirement medical aid benefits 25.1 23 823 21 260 22 243 21 703 20 460 21 128
Retirement funds – Capespan Japan 25.2 3 751 4 257 5 209 – – –
Pension schemes – Europe and UK 25.3 104 404 85 529 66 930 – – –
Long-term employee benefits 25.4 – 26 183 15 471 – – –
131 978 137 229 109 853 21 703 20 460 21 128
Current portion of long-term employee benefits – (13 090) – – – –
131 978 124 139 109 853 21 703 20 460 21 128

71
25.1 Post-retirement medical aid benefits
The Group provides for post-employment medical aid benefits in respect of certain retired employees. This liability is for a relatively small group of staff and their dependants who were already retired from International Harbour Services (Proprietary) Limited, Outspan International Limited and Unifruco Limited prior to the merger between Unifruco and Outspan in 1999. To qualify for the scheme they had to be permanently employed, be a member of the company designated scheme at retirement and remain resident in South Africa until their retirement. The obligation was quantified by an independent actuary as at 31 December 2014, 2013 and 2012.
Group Company
Restated Restated
2014 2013 2012 2014 2013 2012
R’000 R’000 R’000 R’000 R’000 R’000
Present value of funded obligations 23 823 21 260 22 243 21 703 20 460 21 128
Fair value of plan assets – – – – – –
Net liability provided at reporting date 23 823 21 260 22 243 21 703 20 460 21 128
Amounts in the balance sheet:
Liabilities 23 823 21 260 22 243 21 703 20 460 21 128
Assets – – – – – –
Net liability at reporting date 23 823 21 260 22 243 21 703 20 460 21 128
The amounts recognised in profit or loss and other comprehensive income are as follows:
Interest on obligation in profit or loss 1 264 1 481 1 988 1 217 1 414 1 409
Actuarial losses/(gains) recognised in other comprehensive income 3 367 (515) 433 2 014 (208) 473
Impact on comprehensive income before taxation 4 631 966 2 421 231 1 206 1 882
Movements in net liability recognised in the balance sheet are as follows:
Net liability at beginning of year (21 260) (22 243) (30 233) (20 460) (21 128) (21 005)
Expense recognised in profit or loss (1 264) (1 481) (1 988) (1 217) (1 414) (1 409)
Actuarial (losses)/gains recognised in other comprehensive income (3 367) 515 (433) (2 014) 208 (473)
Settlement of liabilities – – – – – 8 080
Contributions 2 068 1 949 2 331 1 988 1 874 1 759
Net liability at end of year (23 823) (21 260) (22 243) (21 703) (20 460) (21 128)
Principal actuarial assumptions at the reporting date (expressed as weighted averages):
Discount rate at 31 December 2014 (source: GOVI bonds at 31 December 2014) 8.50% 6.25% 6.25% 8.50% 6.25% 6.25%
Sensitivity analysis
2014 2013
Increase Decrease Increase Decrease
R’000 R’000 R’000 R’000
Discount rate (0.5%) movement 899 (842) 765 (817)
Medical cost trends (1%) movement (1 549) 1 726 (1 779) 1 587
Future mortality (1 year) movement (1 173) 1 217 (1 105) 1 064

72
The Group reviewed the contributions and benefit structures of its medical schemes, to ensure that these are well positioned against steeply rising health care costs and to establish the existence and extent of any future obligations towards current retired employees.
25.2 Retirement funds
South African permanent employees belong to the Capespan Provident Fund, a defined contribution fund. This fund is administered independently of the Group and is subject to the Pension Funds Act of South Africa.
The employer’s contribution of between 12% and 19% is expensed as incurred.
Non-South African employees contribute towards different defined contribution schemes at variable rates of contributions with the exception of certain employees who still belong to defined benefit schemes in Germany and Belgium. These schemes are all closed to new employees.
No account is taken of surpluses which may arise in the fund as the Group does not consider itself entitled to the benefits of such surpluses.
RETIREMENT FUNDS – Capespan Japan
2014 2013 2012Group R’000 R’000 R’000Present value of funded obligations 3 751 4 257 5 209Fair value of plan assets – – –Net liability provided at reporting date 3 751 4 257 5 209Amounts in the balance sheet:
Liabilities 3 751 4 257 5 209Assets – – –Net liability at reporting date 3 751 4 257 5 209The amounts recognised are as follows:
Interest on obligation in profit or loss 26 42 55Actuarial gain recognised in other comprehensive income (177) (719) (143)Impact on comprehensive income before taxation (151) (677) (88)Movements in net liability recognised in the balance sheet are as follows:
Net liability at beginning of year (4 257) (5 209) (5 207)Expense recognised in profit or loss (26) (42) 88Actuarial gain recognised in other comprehensive income 177 719 –Effects of movement in foreign exchange 103 (27) (90)Settlements 252 302 –Net liability at end of year (3 751) (4 257) (5 209)Principal actuarial assumptions at the reporting date (expressed as weighted averages): Discount rates 31 December 2014. 0.5% 0.8% 0.8%% rates of salary increases 1.0% 1.0% 1.0%Provision has been made for early disability retirements.
No account is taken of surpluses which may arise in the fund as the Group does not consider itself entitled to the benefits of such surpluses.
25.3 Pension schemes – Europe and UK
The Group operates a number of externally funded defined benefit and defined contribution pension schemes across Europe. The schemes are set up under trusts and the assets of the schemes are therefore held separately from those of the Group.

73
The accompanying disclosures relate to all of the Group’s defined benefit retirement schemes in the UK and Continental Europe: The South African Co-operative Citrus Exchange Limited pension and life assurance schemes (SACCE), and the Capespan Continent NV and Fresh Fruit Services CV plan (CCNV). In addition, the Group has a pension scheme in Germany called the Capespan Germany GmbH pension scheme (Germany). Actuarial valuations of these schemes, for the purposes of these disclosures, were completed for the year ended 31 December 2014. The SACCE scheme has a full valuation done on a triannual basis and the next valuation date is 1 February 2015 and will be available in May 2015. All calculations were carried out by independent actuaries using the projected unit credit method. The scheme assets do not include any shareholdings in the Group.
PENSION SCHEME – EUROPE AND UK
2014 2013 2012
Group R’000 R’000 R’000
Present value of funded obligations 104 404 85 529 66 930
Fair value of plan assets (34 462) (33 090) (25 184)
Net liability provided at reporting date 69 942 52 439 41 746
Amounts in the balance sheet:
Liabilities 104 404 85 529 66 930
Assets* (34 462) (33 090) (25 184)
Net liability at reporting date 69 942 52 439 41 746
The amounts recognised are as follows:
Interest on obligation in profit or loss 16 201 14 806 724
Actuarial loss recognised in other comprehensive income 17 515 906 13 446
Impact on comprehensive income before taxation 33 716 15 712 14 170
Movements in net liability recognised in the balance sheet are as follows:
Net liability at beginning of year (52 439) (41 746) –
Additional net liability – business combinations – – (25 261)
Effect of movement in foreign exchange (896) (10 005) (3 846)
Expense recognised in profit or loss (16 201) (14 806) (724)
Expected return on plan assets 13 889 12 003 692
Actuarial losses recognised in other comprehensive income (17 515) (906) (13 446)
Contributions 3 220 3 021 839
Net liability at end of year (69 942) (52 439) (41 746)
Principal actuarial assumptions at 31 December 2014:
Discount rates Salary increase Inflation rate
SACCE 4.4% – 2.75%
CCNV 1.2% 3.0% 2.0%
Germany 1.2% 3.5% 2.2%
Principal actuarial assumptions at 31 December 2013:
Discount rates Salary increase Inflation rate
SACCE 4.4% – 2.75%
CCNV 3.25% 3.0% 2.0%
Germany 3.4% 3.5% 2.2%

74
Principal actuarial assumptions at 31 December 2012:
Discount rates Salary increase Inflation rate
SACCE 4.1% – 2.0%
CCNV 3.25% 3.0% 2.0%
Germany 3.5% 3.5% 2.0%
Sensitivity analysis
Reasonably possible changes at the reporting date of one of the relevant actuarial assumptions, holding other assumptions constant, would have affected the defined benefit obligation by the amounts shown below:
2014 2013
Defined benefit obligation
Defined benefit obligation
Increase Decrease Increase Decrease
R’000 R’000 R’000 R’000
Discount rate (0.5%) movement 6 645 (6 630) 5 150 (5 275)
Medical cost trends (1%) movement (1 569) 3 970 (1 329) 3 502
Future mortality (1 year) movement (22 298) 21 729 (14 645) 14 105
* The assets are represented by a reinsurance policy and are disclosed separately in employee post-retirement benefits under non-current assets on the Group balance sheet as there is no right for set-off.
25.4 Long-term employee benefits – Capespan Group Limited
Restated Restated
2014 2013 2012
Group R’000 R’000 R’000
Long-term incentive scheme
Balance at beginning of year 13 093 15 471 –
Current service cost – 10 712 15 471
Transferred to share-based payment reserve (refer note 20.1) (13 093) – –
Current portion of long-term employee benefits (refer note 25.5) – (13 090) –
Balance at 31 December 2014 – 13 093 15 471
The long-term employee benefit scheme has been cancelled and replaced by the share option scheme for executive and senior management, with the accrued benefit being transferred net of tax to a share-based payment reserve.
25.5 Short-term employee benefits
Short-term incentives
Leave pay and other Total
Group 2014 R’000 R’000 R’000
Balance 1 January 2014 49 134 11 768 60 902
Provisions utilised during the year (49 432) (7 106) (56 538)
Provisions made during the year 39 790 8 041 47 831
Balance as at 31 December 2014 39 492 12 703 52 195

75
Short-term incentives
Leave pay and other Total
Group 2013 R’000 R’000 R’000
Balance 1 January 2013 20 209 12 511 32 720
Provisions utilised during the year (10 580) (8 203) (18 783)
Provisions made during the year 26 415 7 460 33 875
Current portion of long-term employee benefits (refer note 25.4) 13 090 – 13 090
Balance as at 31 December 2013 49 134 11 768 60 902
Short-term incentives
Leave pay and other Total
Group 2012 R’000 R’000 R’000
Balance 1 January 2013 24 192 11 307 35 499
Provisions utilised during the year (17 607) (4 577) (22 184)
Provisions made during the year 13 324 5 781 19 405
Current portion of long-term employee benefits (refer note 25.4) – – –
Balance as at 31 December 2013 20 209 12 511 32 720
Group Company
Restated Restated
2014 2013 2012 2014 2013 2012
R’000 R’000 R’000 R’000 R’000 R’000
26. BANK OVERDRAFT AND SHORT-TERM BORROWINGS
Bank overdraft 2 394 8 968 10 823 – – –
Short-term borrowings 314 479 111 643 235 932 – – –
Bank overdraft and short-term borrowings 316 873 120 611 246 755 – – –
27. TRADE AND OTHER PAYABLES
Trade payables due to associates 69 2 786 412 – – –
Trade payables 353 072 326 726 339 906 – – –
Non-trade payables and accrued expenses 203 201 248 153 261 311 8 977 7 261 5 994
Income received in advance 31 356 54 686 – – – –
587 698 632 351 601 629 8 977 7 261 5 994
Group
2014 2013 2012
R’000 R’000 R’000
28. PROVISIONS
Balance 1 January 2014 16 381 20 907 30 523
Provisions utilised during the year (3 851) (8 712) (20 836)
Provisions made during the year 10 360 4 186 11 220
Balance as at 31 December 2014 22 890 16 381 20 907

76
Group Company
Restated Restated
2014 2013 2012 2014 2013 2012
R’000 R’000 R’000 R’000 R’000 R’000
29. NOTES TO THE STATEMENTS OF CASH FLOWS
29.1 Cash generated by operations
– Operating profit/(loss) 169 068 190 778 125 516 (501) (303) (680)
Adjusted for
– Depreciation of property, plant and equipment 46 164 37 300 35 516 – – –
– Depreciation and write off of bearer plants 9 880 8 581 – – – –
– Gain on settlement of post-retirement medical aid liability – – (2 943) – – –
– Recoveries 11 100 – – – – –
– Fair value adjustment on biological assets (43 877) (43 328) (24 467) – – –
– Restructuring costs (502) (7 138) – – – –
– Amortisation of intangible assets 3 563 6 147 5 194 – – –
– Harvest of biological assets 43 484 48 847 – – – –
– Movements in post-retirement medical aid benefits – – 2 767 – – –
– Equity-settled share-based payment 1 136 – – – – –
– Translation differences (524) 11 540 1 985 – – –
– Working capital movements (114 145) (15 456) (452) 888 841 777
– Decrease in inventory 72 478 (239 654) (137 132) – – –
– (Increase)/decrease in trade and other receivables (119 314) 95 889 18 151 (57) 32 (28)
– (Decrease)/increase in trade and other payables (39 159) 124 307 120 127 1 716 1 267 805
– (Decrease)/increase in provisions and employee benefits (28 150) 4 002 (1 598) (771) (458) –
125 347 237 271 143 116 387 538 97
29.2 Taxation paid
Amount prepaid at beginning of year 7 555 8 842 (433) – – –
Current tax charged to profit or loss (78 720) (56 760) (40 415) (198) – –
Withholding tax charged to profit or loss (1 771) (774) (3 503) – – –
Secondary tax on companies charged to profit or loss – – (4 098) – – –
Taxation recognised in other comprehensive income – – 4 803 – – –
Effect of movement in foreign exchange – – 302 – – –
Subsidiary acquired – – (2 892) – – –
Amount unpaid/(prepaid) at end of year 3 846 (7 555) (8 842) (198) – –
(69 090) (56 247) (55 078) (396) – –

77
29.3 Disposal of investments and operations
29.3.1 Disposals – 2014
During the year the Group disposed of its interest in Stellenbosch Vineyards for R4,0 million.
R’000
Carrying value of associate disposed –
Profit on disposal 4 000
Proceeds from disposal 4 000
29.3.2 Disposals – 2013
During the previous year the company disposed of the farm Queen Anne:
R’000
Carrying value of property, plant and equipment at date of disposal 42 415
Loss on disposal (7 415)
Proceeds from disposal 35 000
During the previous year the Group disposed of the farms Warmzand and Vaalhoek:
R’000
Carrying value of farms at date of disposal 17 585
Profit on disposal 3 665
Proceeds outstanding at 31 December 2013 21 250
29.3.3 Disposals – 2012
During the year the company disposed of its investment in Genetwister Africa (Pty) Ltd:
R’000
Carrying value of share investment and loan account at date of disposal 2 211
Profit on disposal 1 517
Proceeds from disposal 3 728
During the year the company disposed of its shares in Altius Trading 237 (Pty) Ltd:
R’000
Carrying value of investment at date of disposal 1 995
Loss on disposal (9)
Proceeds from disposal 1 986
29.4 Acquisition of business – 2014
29.4.1 Acquisition of subsidiary – 2014
In October 2014, the Group increased the shareholding in the Mozambique customs terminal Gestão de Terminais, SA by 10% from 40% to 50% and have accounted for the investment as a subsidiary.
R’000
Carrying value of 26% of net assets acquired 2 081
Purchase price paid (7 271)
Recognised directly in equity (5 190)

78
29.4.2 Investment in associates – 2014During the year the Group invested in certain associate companies and joint ventures:
R’000
Mayfresh (Turkey) 501
Goodview (Hong Kong) 28 083
Capespan Capital (South Africa) 303
28 887
29.4.3 Increased shareholding in subsidiary – 2013The Group acquired the remaining 26% of the shares in FPT Port Leasing (Pty) Limited in 2013.
R’000
Carrying value of 26% of net assets acquired 2 591
Purchase price paid (5 007)
Recognised directly in equity (2 416)
29.4.4 Investment in associates – 2013During the year the Group invested in certain associate companies and joint ventures:
R’000
Capespan Capital 980
Gestão de Terminais 8 222
9 202
29.4.5 Acquisitions – 2012The Group acquired the remaining 50% shares in the European business marketing entity Capespan International Holdings Limited with an effective date of 3 January 2012. The shareholding increased from 50% to 100%.
R’000
Fair value of assets acquired 97 761
Carrying value of associate before conversion to subsidiary (48 907)
Deemed profit on conversion of associate to subsidiary (refer note 3) (67 004)
Goodwill on acquisition (refer note 11) 154 926
136 776
Purchase price paid in cash 88 776
Share issue in Capespan Group Limited 48 000
Total consideration for 50% shareholding in Capespan International Holdings Limited 136 776
30. FINANCIAL INSTRUMENTS
Exposure to currency, interest rate and credit risks arise in the normal course of the Group’s business. The risks are managed with policies and guidelines approved by the Board.
Market risk
Market risk is the risk that changes in market prices, such as foreign exchange rates, interest rates and equity prices will affect the Group’s income or the value of its holdings of financial instruments. The objective of market risk management is to manage and control market risk exposures within acceptable parameters, while optimising the return on risk.
30.1 Currency managementThe Group is exposed to currency risk on sales, purchases and borrowings that are denominated in a currency other than the respective functional currencies of Group entities.

79
Furthermore, the Group is exposed to currency risk as a result of purchases, sales and borrowings which are accounted for in a functional currency other than the Group’s reporting currency. The Group hedges trade debtors and trade creditors denominated in a foreign currency, as well as estimated foreign currency exposure resulting from sales and purchases.
Exposure to currency risk
Based on notional amounts the balance sheet exposure to foreign currency risk at 31 December 2014 is as follows:
USD GBP EUR JPY HKD MZN
’000 ’000 ’000 ’000 ’000 ’000
Trade receivables 12 145 10 284 12 502 509 857 5 654 25 234
Cash and cash equivalents 9 288 3 714 1 464 189 702 8 412 242 310
Trade payables (4 652) (35) (1 799) (325 080) – (835)
16 781 13 963 12 167 374 479 14 066 266 709
Based on notional amounts the balance sheet exposure to foreign currency risk at 31 December 2013 is as follows:
USD GBP EUR JPY HKD MZN
’000 ’000 ’000 ’000 ’000 ’000
Trade receivables 12 130 12 270 11 276 577 178 4 673 15 564
Cash and cash equivalents 18 266 2 764 4 218 413 730 3 636 223 060
Trade payables (7 690) (3 653) (3 135) (93 586) – (2 581)
22 706 11 381 12 359 897 322 8 309 236 043
Based on notional amounts the balance sheet exposure to foreign currency risk at 31 December 2012 is as follows:
USD GBP EUR JPY MZN
’000 ’000 ’000 ’000 ’000
Trade receivables 8 524 12 019 15 403 594 313 26 644
Cash and cash equivalents 12 767 3 033 1 888 479 047 176 997
Trade payables (6 400) (6 963) (9 150) (127 200) (3 340)
14 891 8 089 8 141 946 160 200 301
The Group has entered into certain forward exchange contracts which relate to specific foreign commitments not yet due and export earnings of which the proceeds have not yet been received.

80
Details of the contracts are as follows:
31 December 2014 31 December 2013 31 December 2012
Foreign currency
Foreignamount
(’000)
Randvalue*(’000)
Foreignamount
(’000)
Randvalue*(’000)
Foreign amount
(’000)
Randvalue*(’000)
Exports – FECs
United States Dollar 16 534 191 196+ 28 562 296 555+ 10 800 91 528
Pound Sterling 3 496 62 909+ 5 155 88 190+ 4 148 56 802
Euro 3 298 46 347+ 6 038 86 436+ 6 588 73 667
Canadian Dollar – – – – 74 630
Japanese Yen 201 432 19 454 149 866 14 817 175 243 8 464
319 906 485 998 231 091
Imports – FECs
United States Dollar – – – – – –
Pound Sterling – – – – – –
Euro 160 2 249 690 9 971 350 3 916
Canadian Dollar – – – – – –
Japanese Yen – – – – – –
2 249 9 971 3 916
*Rand value at contracted rate.+Included in the FEC is an amount of R71,3 million (2013: R42,6 million) which is designated as cash flow hedges.
The following were the significant exchange rates applied:
Average rate Reporting date spot rate
2014 2013 2012 2014 2013 2012
R R R R R R
United States Dollars 10,83 9,62 8,20 11,56 10,38 8,48
Pound Sterling 17,83 15,05 12,99 17,99 17,11 13,70
Euro 14,38 12,78 10,53 14,05 14,32 11,20
Canadian Dollars 9,84 9,38 8,21 9,96 9,76 8,51
Japanese Yen 0,10 0,10 0,10 0,10 0,10 0,10
Mozambique Meticais 0,35 0,32 0,29 0,34 0,34 0,28
Renminbi 1,76 1,56 1,30 1,72 1,56 1,36
Sensitivity analysis
The effect of a 10% strengthening of the Rand against the following currencies could result in a decrease/(increase) in other comprehensive income (OCI) and revenue by the amounts shown below. This analysis assumes that all variables, in particular interest rates, remain constant. A 10% weakening of the Rand would show the equal but opposite effect, on the basis that all other variables remain constant. The sensitivity analysis was performed on the same basis for 2013 and 2012.

81
Effect 2014
OCI Revenue
R’000 R’000
United States Dollars 19 404 179 556
Pound Sterling 24 123 130 742
Euro 17 094 218 418
Japanese Yen 3 617 7 723
Hong Kong Dollar 2 097 19 430
Mozambique Meticais 9 163 11 903
Effect 2013
OCI Revenue
R’000 R’000
United States Dollars 23 576 173 414
Pound Sterling 19 473 116 718
Euro 17 693 218 620
Japanese Yen 8 872 8 981
Hong Kong Dollar 1 113 14 158
Mozambique Meticais 8 086 10 783
Effect 2012
OCI Revenue
R’000 R’000
United States Dollars 12 620 101 363
Pound Sterling 11 078 79 758
Euro 9 103 145 938
Japanese Yen 9 318 8 693
Hong Kong Dollar 1 404 10 178
Mozambique Meticais 5 659 8 913
30.2 Interest rate management
The Group is exposed to interest rate risk as it borrows and places funds at both fixed and floating interest rates. The Group adopts a policy of ensuring that its borrowings are at market-related rates to address its interest rate risk.
30.3 Credit risk managementCredit risk relates to potential exposure on cash and cash equivalents, trade receivables and hedged positions. The Group limits its counterparty exposure arising from money market and derivative instruments by only dealing with well-established financial institutions of high credit standing. The Group’s exposure and the credit ratings of its counterparties are continuously monitored and the aggregate value of transactions concluded is spread amongst approved counterparties.

82
The carrying amount of financial assets represents the maximum credit exposure. The maximum exposure to credit risk at the reporting date was:
2014 2013 2012
Notes R’000 R’000 R’000
Other financial assets 14 28 565 37 877 56 340
Trade and other receivables 18 931 569 777 508 801 223
Cash and cash equivalents 19 357 107 426 122 441 455
1 317 241 1 241 507 1 299 018
Trade and other receivables
– Trade receivables – gross external 720 999 707 475 635 045
– Trade receivables – impairment (12 413) (13 866) (28 473)
– Other receivables and prepayments 222 983 83 899 194 651
18 931 569 777 508 801 223
Trade receivables consist of a large number of customers, spread across diverse industries and geographical areas. Ongoing credit evaluation is performed on the financial condition of receivables and, where appropriate, credit guarantee insurance cover is purchased.
Credit guarantee insurance cover is limited to R375 million in the annual aggregate, subject to a R3,0 million aggregate excess.
The Group establishes an allowance for impairment that represents its estimate of incurred losses in respect of trade and other receivables and investments. The main component of this allowance is a specific loss component that relates to individually significant exposures, and a collective loss component established for groups of similar assets in respect of losses that have been incurred but not yet identified. The collective loss allowance is determined based on historical data of payment statistics for similar financial assets.
The maximum exposure to credit risk for external trade receivables at the reporting date by geographic region was:
2014 2013 2012
R’000 R’000 R’000
Geographical area
Southern Africa 145 566 181 920 170 263
UK 201 755 218 818 140 351
Europe 208 733 165 408 172 642
Far East 77 575 74 336 83 438
North America 32 109 28 657 18 863
Middle East 36 079 22 146 34 529
Russia 19 182 16 190 14 959
720 999 707 475 635 045
Industry
Wholesale customers 325 488 324 998 334 909
Seasonal loans 11 735 93 734 108 828
Retail customers 282 160 229 694 170 592
End-user customers 11 203 9 001 1 135
Other 90 413 50 048 19 581
720 999 707 475 635 045

83
30.4 Impairment losses
The ageing of trade receivables (external parties) at the reporting date was:
Gross receivable Impairment
2014 2013 2012 2014 2013 2012
R’000 R’000 R’000 R’000 R’000 R’000Not past due 619 535 605 446 479 011 4 486 7 168 985Past due 0 – 30 days 55 411 58 316 35 799 8 22 22Past due 31 – 120 days 35 693 34 705 50 110 86 1 646 2 508More than 120 days 10 360 9 008 70 125 7 833 5 030 24 958
720 999 707 475 635 045 12 413 13 866 28 473
2014 2013 2012R’000 R’000 R’000
Balance as at 1 January 13 866 28 473 34 893Amounts written off (2 401) (11 662) (6 825)Impairment expenses raised (reversed) (refer note 2) 948 (2 945) 405Balance as at 31 December 12 413 13 866 28 473
30.5 Liquidity risk
Liquidity risk is the risk that the Group will not be able to meet its financial obligations as they fall due. The Group’s approach to managing liquidity is to ensure, as far as possible, that it will always have sufficient liquidity to meet its liabilities when due, under both normal and stressed conditions, without incurring unacceptable losses or risking damage to the Group’s reputation.
The Group manages liquidity risk by monitoring forecast cash flows and ensuring that adequate cash resources are available to meet future cash flow requirements.
The following are the repayment profiles of financial liabilities:
Carrying amount
Contractual cash flows
1 year or less
After 1 year
31 December 2014 R’000 R’000 R’000 R’000
Non-interest-bearing loans 19 837 19 837 19 837 –
Interest-bearing loans 271 017 344 189 54 575 289 614
Trade payables 353 072 353 072 353 072 –
Accruals 160 858 160 858 160 858 –
Other payables 42 412 42 412 42 412 –
Bank overdraft and short-term borrowings 316 873 316 873 316 873 –
1 164 069 1 237 241 947 627 289 614
Carrying amount
Contractual cash flows
1 year or less
After 1 year
31 December 2013 R’000 R’000 R’000 R’000Non-interest-bearing loans 131 959 131 959 113 342 18 617Interest-bearing loans 147 385 168 171 35 831 132 340Trade payables 326 726 326 726 326 726 –Accruals 157 897 157 897 157 897 –Other payables 93 042 93 042 93 042 –Bank overdraft and short-term borrowings 120 611 120 611 120 611 –
977 620 998 406 847 449 150 957

84
Carrying amount
Contractual cash flows
1 year or less
After 1 year
31 December 2012 R’000 R’000 R’000 R’000
Non-interest-bearing loans 106 795 106 795 – 106 795
Interest-bearing loans 183 254 183 399 16 048 167 351
Trade payables 301 048 301 048 339 906 –
Accruals 164 911 164 911 245 675 –
Other payables 39 270 39 270 39 270 –
Bank overdraft and short-term borrowings 246 755 246 755 246 755 –
1 042 033 1 042 178 768 032 274 146
30.6 Fair values
At year-end, the fair values of all financial instruments are substantially identical to carrying values reflected in the balance sheet. The fair value of financial instruments that are interest-free without repayment terms is considered to approximate the carrying value.
Fair value hierarchy
IFRS 7 specifies a hierarchy of valuation techniques for assets and liabilities measured at fair value based on whether the inputs of those techniques are observable or unobservable. Observable inputs reflect market data obtained from independent sources and unobservable inputs reflect the Group’s market assumptions.
No adjustment to the carrying amounts of the Group’s financial assets and liabilities was done, as the fair values of these approximate the carrying amounts. Financial instruments that are interest-free with no repayment terms are carried at face value.
The table below provides the valuation method of financial instruments carried at fair value. The different levels have been defined as follows:
Level 1 – Quoted prices (unadjusted) in active markets for identical assets and liabilities.
Level 2 – Inputs other than quoted prices included within level 1 that are observable for the assets or liability, either directly (i.e. prices) or indirectly (i.e. derived from prices).
Level 3 – Input for the asset or liability that is not based on observable market data (unobservable inputs).
The fair value of financial instruments that are not traded in an active market is determined by using valuation techniques. These valuation techniques maximise the use of observable market data where it is available and rely as little as possible on entity-specific estimates. If all significant inputs required to fair value an instrument are observable, the instrument is included in level 2. If one or more of the significant inputs is not based on observable market data, the instrument is included in level 3.
According to these levels, the company’s financial instruments carried at fair value (i.e. forward exchange contract derivatives) have all been included as level 2.
According to these levels, the company’s biological assets are carried at fair value have all been included as level 3, based on the inputs to the valuation techniques used.
There were no further reclassifications between the level 2 and level 3 fair value hierarchy.
30.7 Capital management
The Board’s policy is to maintain a strong capital base so as to maintain investor, creditor and market confidence and to sustain future development of the business. The Board of directors monitors both the demographic spread of shareholders, as well as the return on capital, which the Group defines as total shareholders’ equity, excluding non-controlling interests, and the level of dividends to ordinary shareholders.
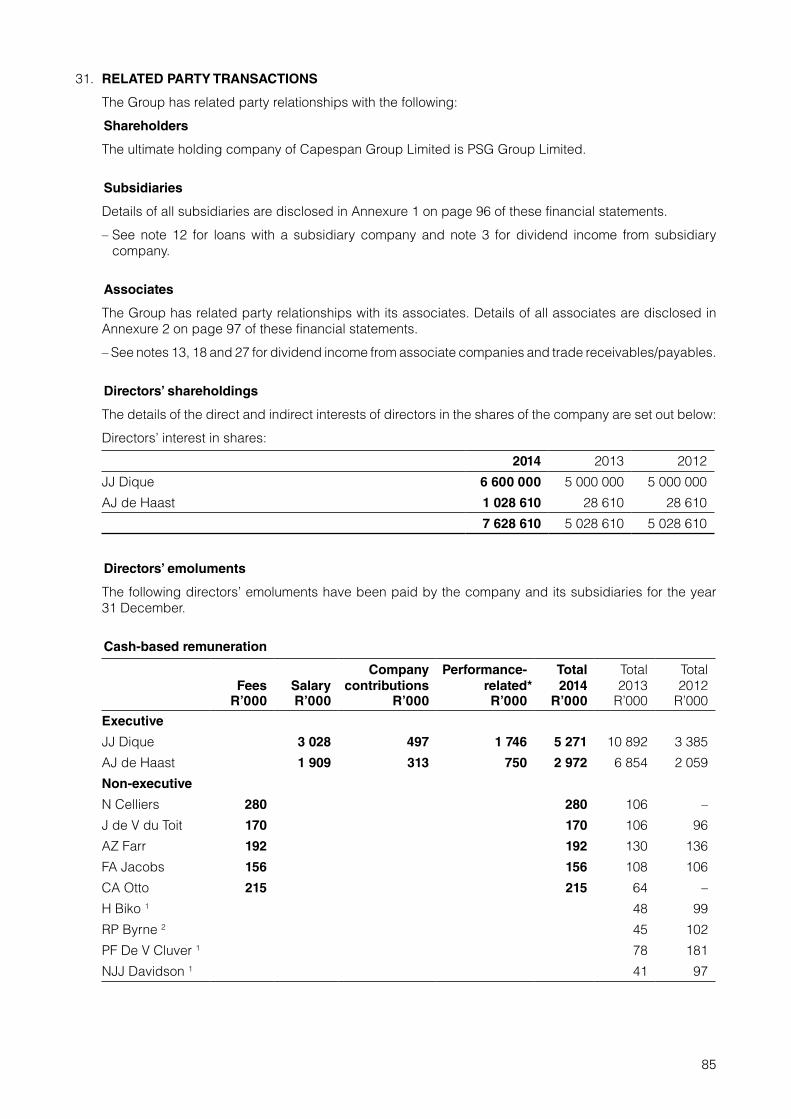
85
31. RELATED PARTY TRANSACTIONS
The Group has related party relationships with the following:
Shareholders
The ultimate holding company of Capespan Group Limited is PSG Group Limited.
Subsidiaries
Details of all subsidiaries are disclosed in Annexure 1 on page 96 of these financial statements.
– See note 12 for loans with a subsidiary company and note 3 for dividend income from subsidiary company.
Associates
The Group has related party relationships with its associates. Details of all associates are disclosed in Annexure 2 on page 97 of these financial statements.
– See notes 13, 18 and 27 for dividend income from associate companies and trade receivables/payables.
Directors’ shareholdings
The details of the direct and indirect interests of directors in the shares of the company are set out below:
Directors’ interest in shares:
2014 2013 2012
JJ Dique 6 600 000 5 000 000 5 000 000
AJ de Haast 1 028 610 28 610 28 610
7 628 610 5 028 610 5 028 610
Directors’ emoluments
The following directors’ emoluments have been paid by the company and its subsidiaries for the year 31 December.
Cash-based remuneration
Fees SalaryCompany
contributionsPerformance-
related*Total2014
Total2013
Total2012
R’000 R’000 R’000 R’000 R’000 R’000 R’000Executive
JJ Dique 3 028 497 1 746 5 271 10 892 3 385
AJ de Haast 1 909 313 750 2 972 6 854 2 059
Non-executive
N Celliers 280 280 106 –
J de V du Toit 170 170 106 96
AZ Farr 192 192 130 136
FA Jacobs 156 156 108 106
CA Otto 215 215 64 –
H Biko 1 48 99
RP Byrne 2 45 102
PF De V Cluver 1 78 181
NJJ Davidson 1 41 97

86
Fees SalaryCompany
contributionsPerformance-
related*Total2014
Total2013
Total2012
R’000 R’000 R’000 R’000 R’000 R’000 R’000
AE Jacobs 1 44 106
TD van Zyl 1 47 97
CF Sonn 55
Total 1 013 4 937 810 2 496 9 256 18 563 6 519* Payment related to performance for the year ended 31 December are paid in March the following year. However, these amounts
are provided for in the relevant financial year. 1 Retired with effect 27 May 2013.
2 Retired with effect 26 April 2013.
32. TRANSACTIONS WITH KEY MANAGEMENT PERSONNEL
The key management personnel’s compensations are as follows:
Group Group Group
2014 2013 2012
R’000 R’000 R’000
Short-term employee benefits (including amounts paid by associates) 32 772 28 212 27 194
Short-term incentives 6 711 9 975 2 231
Termination benefits – 7 929 411
Total 39 483 46 116 29 836
The company considers the executive directors, divisional CEOs and the managing directors of the Group companies to be the only key management personnel. The number of key personnel comprises 12 individuals (2013: 10, 2012: 13).
33. BORROWING POWERS
Borrowing powers, in terms of the articles of association of the company, are unlimited.
34. CONTINGENT LIABILITIES
Contingent liabilities at the reporting date, not otherwise provided for in these financial statements, arising from:
Group
• Various sundry guarantees not exceeding in total R8,8 million (2013: R7,3 million).• A several suretyship was issued in favour of a financial institution to secure credit facility in an
associate company. The Group’s exposure is limited to 49% per individual claim and to the maximum of R122,5 million.
Company
• The company has provided various guarantees to lenders of its subsidiary companies.
35. SEGMENT INFORMATION
The Group’s segment reporting is by operational business sector. The business sectors consist of farming, fruit, logistics and corporate. The business sector information includes an allocation of corporate costs to each sector on an appropriate basis.

87
Farming Fruit Logistics CorporateInter-
Group ConsolidatedGroup – 12 months to Dec 2014 R’000 R’000 R’000 R’000 R’000 R’000
Revenue 456 175 6 680 813 507 966 – (252 533) 7 392 421Cost of sales, distribution and selling costs (370 934) (6 210 946) (156 951) – 252 533 (6 486 298)Gross profit 85 241 469 867 351 015 – – 906 123Operating expenses (39 423) (430 141) (229 023) (38 468) – (737 055)Operating profit/(loss) 45 818 39 726 121 992 (38 468) – 169 068Finance income 2 646 8 834 11 602 39 931 (17 408) 45 605Finance expenses (9 690) (24 601) (2 513) (29 186) 17 408 (48 582)Equity profit from associates after tax – 60 651 – – – 60 651Profit/(loss) before non- recurring items 38 774 84 610 131 081 (27 723) – 226 742Contingent consideration – (65 657) – – – (65 657)Other income 1 110 11 487 18 092 3 559 – 34 248Other expenses – (9 186) (683) (55) – (9 924)Profit/(loss) before taxation 39 884 21 254 148 490 (24 219) – 185 409Group – 12 months to Dec 2013 RestatedRevenue 395 167 6 445 163 587 427 56 (278 792) 7 149 021Cost of sales, distribution and selling costs (320 778) (5 949 965) (259 863) – 278 792 (6 251 814)Gross profit 74 389 495 198 327 564 56 – 897 207Operating costs (38 855) (397 313) (227 175) (43 086) – (706 429)Operating profit/(loss) 35 534 97 885 100 389 (43 030) – 190 778Finance income 2 135 12 381 9 203 32 667 (18 130) 38 256Finance expenses (12 298) (24 908) (3 824) (24 234) 18 130 (47 134)Equity profit from associates after tax – 28 806 4 – – 28 810Profit/(loss) before non- recurring items 25 371 114 164 105 772 (34 597) – 210 710Other income (99) (131) 383 1 – 154Other expenses (7 158) (590) (8 042) (5 285) – (21 075)Profit/(loss) before taxation 18 114 113 443 98 113 (39 881) – 189 789Group – 12 months to Dec 2012 RestatedRevenue 340 701 4 956 505 498 990 – (163 910) 5 632 286Cost of sales, distribution and selling costs (260 789) (4 530 441) (252 539) – 163 910 (4 877 583)Gross profit 79 912 426 064 246 451 – – 754 703Operating expenses (34 281) (347 542) (210 581) (34 507) – (692 187)Operating profit/(loss) 45 631 78 522 35 870 (34 507) – 125 516Finance income 496 17 073 8 078 47 747 (35 185) 38 209Finance expenses (24 151) (17 103) (4 505) (26 874) 35 185 (37 448)Equity profit from associates after tax – 26 108 – (60) – 26 048Fair value adjustment on long-term biological assets 12 570 – – – – 12 570Profit/(loss) before non- recurring items 34 546 104 600 39 443 (13 694) – 164 895Other income 288 66 842 490 34 527 – 102 147Other expenses (1 283) (8 501) (14 350) (22 004) – (46 138)Profit/(loss) before taxation 33 551 162 941 25 583 (1 171) – 220 904
During the year the Group reviewed the composition of its reportable segments and has separated the farming reportable segment from the fruit reportable segment. The comparative information has been restated accordingly.

88
Group Company
Restated Restated
2014 2013 2012 2014 2013 2012
R’000 R’000 R’000 R’000 R’000 R’000
36. COMMITMENTS
Capital commitments (including Bio-assets)
– Capital expenditure contracted for property, plant and equipment 7 143 31 874 13 254 – – –
– Capital expenditure authorised for property, plant and equipment but not contracted for 564 241 28 435 59 533 – – –
571 384 60 309 72 787 – – –
Operating lease commitments
– Land and buildings 961 242 830 760 713 162 – – –
– Equipment 49 644 39 937 54 340 – – –
– Other 14 892 15 341 18 857 – – –
1 025 778 886 038 786 359 – – –
The above commitments under non-cancellable operating leases are payable as follows:
Within 1 year 109 781 90 366 81 193 – – –
From 2 to 4 years 307 784 252 748 224 896 – – –
Over 4 years 608 213 542 924 480 270 – – –
1 025 778 886 038 786 359 – – –
37. ACCOUNTING ESTIMATES AND JUDGEMENTS
Management lists below the Group’s main judgements and estimates used in the preparation of these financial statements.
Goodwill
In determining whether to impair goodwill, assumptions are made on the future performance and growth of the cash-generating unit. In addition, the Group makes assumptions on the operational horizon over which estimated performance is calculated and discounts this performance using a comparable discount rate. Estimates are performed using a range of the key assumptions to obtain a reasonable estimate of the entities recoverable amount (refer note 11).
Deferred tax
In the Group, each entity determines the recoverability of deferred tax assets and the recognition of estimated tax losses. The recognition is based on the entities’ ability to utilise these estimated losses based on expected future taxable earnings. In note 7 the total unrecognised estimated losses are disclosed while recognised tax losses are disclosed in note 15.
Financial instruments
Each entity in the Group makes assumptions on the recoverability of its financial assets. These instruments mainly cover trade and other receivables and production loans. Where the recoverability of these instruments is considered to be doubtful management applies judgement in the calculation of the amount to be impaired.

89
Biological assets
The fair value of agricultural produce is determined based on market prices. The calculation of the fair value is sensitive to changes in the key variables used. Actual results may differ from these estimates having a direct impact on the value of biological assets.
38. LIST OF MATERIAL SUBSIDIARIES
Set out below is a list of material subsidiaries of the Group:

90
39. NON-CONTROLLING INTEREST (NCI)
The following table summarises the information relating to each of the Group’s subsidiaries that has material NCI before any group eliminations:
2014
Matola Cargo
Terminals SARL
Capespan North
America
Capespan Namibia (Pty) Ltd
Gestão de Termianls,
SAAddo Cold
Store
Other individually immaterial
subsidiaries TotalNon-controlling interest (NCI) R’000 R’000 R’000 R’000 R’000 R’000 R’000
NCI percentage 10% 20% 25% 50% 50.1%
Non-current assets 42 003 18 046 23 073 63 396 –
Current assets 168 136 81 111 168 576 16 752 –
Non-current liabilities – 24 920 29 218 – –
Current liabilities 17 581 50 101 107 598 60 804 –
Net assets 192 558 24 136 54 833 19 344 –
Non-current asset held for sale – – – – 30 378
Carrying value of NCI 19 256 4 827 13 708 9 672 15 186 (880) 61 769
Revenue 123 263 863 869 237 623 – –
Profit 52 551 5 122 13 831 (1 300) –
OCI (50) 204 – 6 160
Profit allocated to NCI 5 255 1 024 3 458 (665) – – 9 072
2013 restated
Non-controlling interest (NCI)
NCI percentage 10% 20% 25%
Non-current assets 38 923 13 092 6 202
Current assets 118 913 82 533 218 654
Non-current liabilities – 24 488 27 906
Current liabilities 17 331 50 187 149 340
Net assets 140 505 20 950 47 610
Carrying value of NCI 14 051 4 190 11 903 1 250 31 394
Revenue 121 762 781 352 134 923
Profit 42 395 5 387 26 614
OCI 1 853 197 – 2 050
Profit allocated to NCI 4 240 1 077 6 654 405 12 376
Matola Cargo
Terminals SARL
Capespan North
America
Capespan Namibia (Pty) Ltd
Other individually
immaterially subsidiaries Total
2012 R’000 R’000 R’000 R’000 R’000
NCI percentage 10% 20% 25%
Non-current assets 25 028 13 061 4 783
Current assets 69 833 64 128 196 240
Non-current liabilities – 21 294 22 517
Current liabilities 15 281 40 306 151 208
Net assets 79 580 15 589 27 298
Carrying value of NCI 7 958 3 118 6 824 3 029 20 929
Revenue 90 465 536 869 123 092
Profit 34 186 1 801 11 945
OCI (480) 12 – (7) (475)
Profit allocated to NCI 3 419 360 2 986 690 7 455
91
Acquisition of non-controlling interest: 2014
In October 2014, the Group increased the shareholding in the Mozambique customs terminal Gestão de Terminais, SA by 10% from 40% to 50% and have accounted the investment as a subsidiary. The non-controlling interest at the date of acquisition has been accounted for in equity at R10,3 million.
Acquisition of non-controlling interest: 2013
In November 2013, the Group acquired the remaining 26% portion of the non-controlling interest in FPT Port Leasing (Pty) Limited, increasing the ownership from 74% to 100%. The Group recognised the decrease in NCI of R2,6 million. The carrying value of the FPT Port Leasing (Pty) Limited net assets at 30 November 2013 on the date of acquisition was R7,3 million.
The following summaries the change in the company ownership of FPT Port Leasing (Pty) Limited at acquisition:
R’000
The Group’s ownership interest at 1 January 2013 6 624
Decrease in non-controlling interest 2 591
The Group’s ownership interest at 30 November 2013 9 215
40. RESTATEMENT OF COMPARATIVES DISCLOSURE – 2014
(a) Reclassification of production costs within farming entities
During 2014 management reallocated certain production costs from other expenses to cost of sales to correctly disclose the appropriate expenditure. The prior year comparatives have been restated appropriately.
(b) Capespan Namibia (Pty) Ltd allocation of grape income and accounting for the sales and cost of sales of product sold
During the year the management reassessed the agreement it has with the Namibian Grape Company (Pty) Ltd and after consultation with KPMG and PWC it was agreed that the agreement falls within IFRIC 4 and therefore IAS 17 was applied. This has resulted in the fair value being calculated on products harvested prior to year-end and the effect has been to change the accounting of the profits from 10 months in arrears to the current season and is in line with the treatment of our other grape farms owned.
(c) Change in accounting policy: Bearer plants
Background
In June 2014, the International Accounting Standards Board issued changes regarding “IAS 16 Property, plant and equipment” and “IAS 41 Agriculture”, which leads to changes in the accounting for biological assets that meet the definition of bearing plants, such as vineyards and orchards.
The changes comes down to bearing orchards/vineyards be regarded similar to equipment used in a manufacturing process. This has resulted in the International Accounting Standards Board deciding that bearing orchards are accounted in the same way and must be treated as property, plant and equipment within the scope of IAS 16.
Long-term biological assets consist of bearer plants used in the production of agricultural produce and they are expected to bear produce for more than one period. Management’s intention is to recover the economic benefit of the assets through use.
Management have chosen to apply the cost model in terms of IAS 16 Property, Plant and Equipment to the long-term biological assets. Therefore, production costs, capital expenditure and borrowing costs are capitalised to the biological asset until management consider the agricultural transformation to be substantially complete.

92
Management considered the amendments to provide a more reliable basis of quantifying the value of long-term biological assets with a commensurate depreciation charge over the remaining useful lives of the vineyards and orchards.
The changes are effective for annual periods beginning on or after 1 January 2016 with early adoption permissible.
Capespan Group decided well in advance of implementing the changes effective for the financial year ended 31 December 2014. In line with the requirements of the relevant standards, the accounting policies have been updated (refer to page 42).

93
Inco
me
stat
emen
t ef
fect
Bal
ance
Sh
eet
effe
ct
Rev
enu
eC
ost
of
sale
sO
ther
ex
pen
ses
Inte
rest
Taxa
tio
nM
ino
riti
es
Eff
ect
on
p
rofit
/lo
ss
Trad
e an
d o
ther
re
ceiv
able
sIn
ven
tory
Lo
ng
-ter
m
bio
log
ical
as
sets
Ret
ain
ed
earn
ing
s
Def
erre
d
taxa
tio
n
liab
ility
Bea
rer
pla
nts
Trad
e p
ayab
les
Min
ori
ties
R’0
00
R’0
00
R’0
00
R’0
00
R’0
00
R’0
00
R’0
00
R’0
00
R’0
00
R’0
00
R’0
00
R’0
00
R’0
00
R’0
00
R’0
00
Ch
ang
e in
acc
ou
nti
ng
po
licy
and
pri
or
year
ad
just
men
t 20
12 a
nd
201
3
Bal
ance
sta
ted
at
31 D
ecem
ber
201
1 (a
s p
revi
ou
sly
stat
ed)
3 18
1 11
0(3
087
524
)–
–(4
4 10
6)(4
436
)–
524
440
––
512
795
20 7
59–
254
663
13 8
65
Cap
espa
n N
amib
ia (P
ty) L
td a
lloca
tion
of
seas
onal
gra
pe in
com
e an
d co
st a
djus
tmen
t28
342
–(1
1 89
8)–
(8 2
67)
(2 0
44)
6 13
328
342
––
6 13
38
267
–11
898
2 04
4
Bal
ance
sta
ted
at
31 D
ecem
ber
201
1 (r
esta
ted
)3
209
452
(3 0
87 5
24)
(11
898)
–(5
2 37
3)(6
480
)6
133
552
782
––
518
928
29 0
26–
266
561
15 9
09
Bal
ance
sta
ted
at
31 D
ecem
ber
201
2 (a
s p
revi
ou
sly
stat
ed)
5 63
1 15
2 (4
795
972
)(7
08 5
23)
–
(74
409
) (
7 64
7)
44 6
01 8
01 2
23
71 0
7012
8 48
4 6
15 1
16
35
068
– 4
82 0
07
19
077
Cap
espa
n N
amib
ia (P
ty) L
td a
lloca
tion
of
seas
onal
gra
pe in
com
e an
d co
st a
djus
tmen
t
Adj
ustm
ent r
elat
ing
to 2
012
1 13
4–
(2 2
76)
–37
719
2(5
73)
–13
4 92
4–
(573
)(3
77)
–11
9 62
2(1
92)
Adj
ustm
ent r
elat
ing
to 2
011
and
prio
r yea
rs–
––
––
––
––
–6
133
8 26
7–
–2
044
Bal
ance
sta
ted
at
31 D
ecem
ber
201
2 (r
esta
ted
)5
632
286
(4 7
95 9
72)
(710
799
)–
(74
032)
(7 4
55)
44 0
2880
1 22
320
5 99
412
8 48
462
0 67
642
958
–60
1 62
920
929
Bal
ance
sta
ted
at
31 D
ecem
ber
201
3 (a
s p
revi
ou
sly
stat
ed)
7 18
2 21
3 (
6 22
5 52
8)
(786
854
) (1
0 37
8)
(49
757
) (
8 61
1)
101
085
859
734
9
6 69
6 1
17 9
79
684
961
2
6 79
3 5
36 9
31
25
777
Cap
espa
n N
amib
ia (P
ty) L
td a
lloca
tion
of
seas
onal
gra
pe in
com
e an
d co
st a
djus
tmen
t
Net
adj
ustm
ent r
elat
ing
to 2
013
(incl
udin
g
inte
r-co.
elim
inat
ion)
(33
192)
4
8 85
4 7
351
(7
953
) (3
765
) 11
295
(82
226)
2
15 9
62
–
11
295
15
842
95
420
5 6
17
Prio
r yea
r pro
fit im
pact
5 56
0
Farm
ing
entit
ies
allo
catio
n of
cos
ts a
djus
tmen
t
Adj
ustm
ent r
elat
ing
to 2
013
allo
catio
n of
cos
ts
(81
655
) 8
1 65
5
Farm
ing
entit
ies
chan
ge in
acc
ount
ing
polic
y ad
just
men
t:
Net
fair
valu
e ad
just
men
t 201
3(8
57)
Dee
med
cos
t of v
iney
ards
and
orc
hard
s tra
nsfe
rred
to b
eare
r pla
nts
(117
122
)11
7 12
2
Elim
inat
ion
of fa
ir va
lue
adju
stm
ent p
revi
ousl
y re
cogn
ised
943
943
943
Prod
uctio
n co
sts
capi
talis
ed in
resp
ect o
f im
mat
ure
vine
yard
s an
d or
char
ds5
572
5 57
2 5
572
Bor
row
ing
cost
s ca
pita
lised
in re
spec
t of
imm
atur
e vi
neya
rds
and
orch
ards
1 5
00
1 50
0 1
500
Dep
reci
atio
n (8
581
)(8
581
) (
8 58
1)
Taxa
tion
395
395
3
95
(686
)
Net
adj
ustm
ent r
elat
ing
to 2
013
(33
192
) (2
6 28
6)
80
425
(1
500)
(
7 55
8)
(3
765)
11
124
(82
226
) 2
15 9
62
(117
979
)16
684
15
156
117
122
9
5 42
0 5
617
Bal
ance
sta
ted
at
31 D
ecem
ber
201
3 (r
esta
ted
)7
149
021
(6 2
51 8
14)
(706
429
)(8
878
)(5
7 31
5)(1
2 37
6)11
124
777
508
312
658
–70
1 64
541
949
117
122
632
351
31 3
94

94
41. NEW ACCOUNTING STANDARDS ADOPTED IN CURRENT YEAR
a. Investment Entities (Amendments to IFRS 10, IFRS 12 and IAS 27)b. Offsetting Financial Assets and Financial Liabilities (Amendments to IAS 32)c. Recoverable Amount closures for Non-Financial Assets (Amendments to IAS 36)d. Novation of Derivatives and Continuation of Hedge Accounting (Amendments IAS 39)e. IFRIC 21 Levies
The adoption and implementation of the above standards have been evaluated by management and does not have a significant impact in the Group.
(a) Amendments to IFRS 10, IFRS 12 and IAS 27 Investment Entities
The amendments to IFRS 10 define an investment entity and introduce an exception from the requirements to consolidate subsidiaries for an investment entity. In terms of the exception, an investment entity is required to measure its interests in subsidiaries at fair value through profit or loss. The exception does not apply to subsidiaries of investment entities that provide services that relate to the investment entity’s investment activities.
To qualify as an investment entity, certain criteria have to be met. Specifically, an entity is an investment entity when it:
• obtains funds from one or more investors for the purpose of providing them with investment management services;
• commits to its investor(s) that its business purpose is to invest funds solely for returns from capital appreciation, investment income, or both; and
• measures and evaluates performance of substantially all of its investments on a fair value basis.
Consequential amendments to IFRS 12 and IAS 27 have been made to introduce new disclosure requirements for investment entities.
In general, the amendments require retrospective application, with specific transitional provisions.
(b) Amendments to IAS 32 Offsetting Financial Assets and Financial Liabilities
The amendments to IAS 32 clarify the requirements relating to the offset of financial assets and financial liabilities. Specifically, the amendments clarify the meaning of “currently has a legally enforceable right of set-off” and “simultaneous realisation and settlement”. The amendments require retrospective application.
(c) Amendments to IAS 36 Recoverable Amount Disclosures for Non-Financial Assets
The amendments to IAS 36 remove the requirement to disclose the recoverable amount of a cash-generating unit (CGU) to which goodwill or other intangible assets with indefinite useful lives had been allocated when there has been no impairment or reversal of impairment of the related CGU. Furthermore, the amendments introduce additional disclosure requirements applicable to when the recoverable amount of an asset or a CGU is measured at fair value less costs of disposal. These new disclosures include the fair value hierarchy, key assumptions and valuation techniques used which are in line with the disclosure required by IFRS 13 Fair Value Measurements. The amendments require retrospective application.
(d) Amendments to IAS 39 Novation of Derivatives and Continuation of Hedge Accounting
The amendments to IAS 39 provide relief from the requirement to discontinue hedge accounting when a derivative designated as a hedging instrument is novated under certain circumstances. The amendments also clarify that any change to the fair value of the derivative designated as a hedging instrument arising from the novation should be included in the assessment and measurement of hedge effectiveness. The amendments require retrospective application.
(e) IFRIC 21 Levies
IFRIC 21 addresses the issue of when to recognise a liability to pay a levy. The Interpretation defines a levy, and specifies that the obligating event that gives rise to the liability is the activity that triggers the payment of the levy, as identified by legislation. The interpretation provides guidance on how different levy arrangements should be accounted for, in particular, it clarifies that neither economic compulsion nor the going concern basis of financial statements preparation implies that an entity has a present obligation to pay a levy that will be triggered by operating in a future period. IFRIC 21 requires retrospective application.

95
42. STANDARDS AND INTERPRETATIONS ISSUED BUT NOT YET ADOPTED
Standard amendments and interpretations not yet effective and under review as to their effect on the Group:
The International Accounting Standards Board (IASB) and IFRIC issued the following standards, amendments and interpretations, that are applicable to the Group with an effective date after the date of these financial statements, which management believes could impact the Group in future periods.
Below is a list of new and revised IFRSs that are not yet mandatorily effective (but allow early application) for the year ended 31 December 2014:
• IFRS 9 Financial Instruments
• IFRS 14 Regulatory Deferral Accounts
• IFRS 15 Revenue from Contracts with Customers
• Amendments to IFRS 11 Accounting for Acquisitions of Interests in Joint Operations
• Amendments to IAS 16 and IAS 38 Clarification of Acceptable Methods of Depreciation and Amortisation
• Amendments to IAS 16 and IAS 41 Agriculture: Bearer Plants (Adopted 2014 retrospectively) – refer note 40
• Amendments to IAS 19 Defined Benefit Plans: Employee Contributions
• Annual Improvements to IFRSs 2010 – 2012 Cycle – various standards
• Annual Improvements to IFRSs 2011 – 2013 Cycle – various standards
• Annual Improvements to IFRSs 2012 – 2014 Cycles – various standards
• Equity Method in Separate Financial Statements (Amendments to IAS 27); and
• Sale or contribution of Assets between an Investor and its Associate or Joint Venture (Amendments to IFRS 10 and IAS 26)

96
ANNEXURE 1 (SUBSIDIARY COMPANIES)
Company nameCountry ofincorporation
31 December2014
%
31 December2013
%
31 December2012
%Nature ofoperations
Addo Cold Store (Pty) Ltd RSA 49.9 99.99 99.99 Cold storage facility
Aggrigate Investments (Pty) Ltd RSA 100 100 100 Farming
AM Valentin Boerdery (Pty) Ltd RSA 100 100 100 Farming
Amval (Pty) Ltd RSA 100 100 100 Farming
Applethwaite Farm (Pty) Ltd RSA 100 100 100 Farming
Attie Valentin (Pty) Ltd RSA 100 100 100 Farming
Capespan (Pty) Ltd RSA 100 100 100 Investment and services
Capespan Austria Gmbh Austria 100 100 100 Fruit marketing
Capespan Canada Investments Inc Canada 100 100 100 Holding company
Capespan Chile Chile 100 100 100 Fruit export
Capespan Continent NV Belgium 100 100 100 Fruit import and distribution
Capespan Egypt Export SA Egypt 100 100 100 Fruit import and distribution
Capespan Farms (Pty) Ltd RSA 100 100 100 Primary agriculture
Capespan France SAS France 100 100 100 Fruit marketing
Capespan Germany Gmbh Germany 100 100 100 Fruit marketing
Capespan Group Holdings Limited RSA 100 100 100 Holding company
Capespan International Holdings Limited UK 100 100 100 Holding company
Capespan International Ltd UK 100 100 100 Fruit import and distribution
Capespan Japan Limited Japan 100 100 100 Marketing Japan
Capespan Namibia Farm Management Services Proprietary Limited Namibia 75 75 75 Farm management
Capespan North America Canada 80 80 80 Marketing Canada
Capespan North America LLC USA 80 80 80 Marketing USA
Capespan Schweiz AG Switzerland 100 100 100 Fruit marketing
Capespan South Africa (Pty) Ltd RSA 100 100 100 Fruit export
Dormell Properties (Pty) Ltd RSA 100 100 100 Farming
Fedfa Exports (Pty) Ltd RSA 100 100 100 Fruit exporter
FPT Empowerment Holdings (Pty) Ltd RSA 49 – – Holding company
FPT Group (Pty) Ltd RSA 74 100 100 Port terminal operations
FPT Holdings (Pty) Ltd RSA 100 – – Holding company
FPT Mineral Terminal Lda Mozambique 67 67 67 Inland terminal
FPT Mozambique Lda Mozambique 100 100 100 Port terminal operations
FPT Port Leasing (Pty) Ltd RSA 100 100 74 Port terminal operations
Fresh Fruit Services Continent CVBA Belgium 100 100 100 Fruit distribution
Gestão de Terminais, SA Mozambique 50 – – Customs terminal
Matola Cargo Terminal Sarl Mozambique 90 90 90 Inland terminal
Metspan Hong Kong Limited Hong Kong 100 100 100 Marketing Far East
Mulungisi Investments Limited Isle of Man 100 100 100 Holding company
Oorkant Boerdery (Pty) Ltd RSA 100 100 100 Farming
Oraculim Investments (Pty) Ltd RSA 100 100 100 Farming
Pedal Trading 152 (Pty) Ltd RSA 100 99.99 99.99 Dormant
Penhill Farms (Pty) Ltd RSA 100 100 100 Farming
Servagro Trading (Pty) Ltd RSA – 100 100 Property company
Sikisa Trading Corporation (Pty) Ltd RSA 100 100 100 Packhouse operations
Universal Reefers Limited Isle of Man 100 100 100 Shipping
Valam (Pty) Ltd RSA 100 100 100 Farming

97
AN
NE
XU
RE
2 (
AS
SO
CIA
TE
D C
OM
PAN
IES
– 2
014)
2014
Po
st-a
cqu
isit
ion
res
erve
s
Co
mp
any
nam
eC
ou
ntr
y o
f in
corp
ora
tio
nN
atu
re o
f o
per
atio
ns
Ho
ldin
g a
t ye
ar-e
nd %
Sh
ares
at
cost
R’0
00
Acc
um
ula
ted
re
serv
esR
’00
0
Fore
ign
curr
ency
tr
ansl
atio
nR
’00
0
Imp
aire
d
asso
ciat
eR
’00
0
Car
ryin
g
valu
eR
’00
0
Pro
fit o
r (l
oss
)R
’00
0C
apes
pan
Cap
ital
Sout
h A
frica
Fina
nce
491
283
(110
)–
–1
173
30G
olde
n W
ing
Mau
Chi
naFr
uit d
istri
butio
n25
144
854
52 1
3337
713
–29
5 32
460
621
May
fresh
Turk
eyFr
uit m
arke
ting
5050
1–
–50
1–
Goo
dvie
wH
ong
Kon
gFr
uit
25.1
28 0
83–
––
28 0
83–
174
721
52 0
2337
713
–32
5 08
160
651
2013
Po
st-a
cqu
isit
ion
res
erve
s
Co
mp
any
nam
eC
ou
ntr
y o
f in
corp
ora
tio
nN
atu
re o
f o
per
atio
ns
Ho
ldin
g a
t ye
ar-e
nd %
Sh
ares
at
cost
R’0
00
Acc
um
ula
ted
re
serv
esR
’00
0
Fore
ign
curr
ency
tr
ansl
atio
nR
’00
0
Imp
aire
d
asso
ciat
eR
’00
0
Car
ryin
g
valu
eR
’00
0
Pro
fit o
r (l
oss
)R
’00
0C
apes
pan
Cap
ital
Sout
h A
frica
Fina
nce
4998
0(1
37)
––
843
(137
)G
estã
o de
Ter
min
ais,
SA
Moz
ambi
que
Cus
tom
s te
rmin
al36
8 22
24
––
8 22
64
Gol
den
Win
g M
auC
hina
Frui
t dis
tribu
tion
2514
4 85
452
133
34 7
72–
231
759
28 9
4315
4 05
652
000
34 7
72–
240
828
28 8
10
2012
Po
st-a
cqu
isit
ion
res
erve
s
Co
mp
any
nam
eC
ou
ntr
y o
f in
corp
ora
tio
nN
atu
re o
f o
per
atio
ns
Ho
ldin
g a
t ye
ar-e
nd %
Sh
ares
at
cost
R’0
00
Acc
um
ula
ted
re
serv
esR
’00
0
Fore
ign
curr
ency
tr
ansl
atio
nR
’00
0
Imp
aire
d
asso
ciat
eR
’00
0
Car
ryin
g
valu
eR
’00
0
Pro
fit o
r (l
oss
)R
’00
0St
elle
nbos
ch V
iney
ards
G
roup
Lim
ited
Sout
h A
frica
Win
e m
arke
ting
27.3
8 33
514
103
(434
)(2
2 00
4)–
–G
enet
wis
ter A
frica
(Pty
) Li
mite
dSo
uth
Afri
caR
esea
rch
nil
––
––
–(6
0)G
olde
n W
ing
Mau
Chi
naFr
uit d
istri
butio
n25
119
609
31 5
2812
508
–16
3 64
526
108
127
944
45 6
3112
074
(22
004)
163
645
26 0
48
Dur
ing
the
year
the
Gro
up r
evie
wed
the
com
posi
tion
of it
s re
port
able
seg
men
ts a
nd h
as s
epar
ated
the
far
min
g re
port
able
seg
men
t fro
m t
he f
ruit
repo
rtab
le
segm
ent.
The
com
para
tive
info
rmat
ion
has
been
rest
ated
acc
ordi
ngly
.
98
Annexure 3
THREE-YEAR AUDITED HISTORICAL FINANCIAL INFORMATION OF ZEDER
BASIS OF PREPARATION
The consolidated income statements, statements of financial position, comprehensive income, changes in equity, cash flows and notes thereto, of Zeder for the financial years ended 28 February 2013, 28 February 2014 and 28 February 2015, have been extracted and compiled from the audited consolidated annual financial statements of Zeder, which are available on Zeder’s website. The aforementioned consolidated annual financial statements were compiled under the supervision of the group financial director, Mr WL Greeff, CA(SA), and were approved by the Zeder Directors on 8 April 2013, 7 April 2014 and 7 April 2015, respectively. The preparation of this Annexure 3 is the responsibility of the Zeder Directors.
The historical financial information of Zeder has previously been audited by PwC and reported on without qualification for all of the aforementioned financial periods.
NATURE OF BUSINESS
Zeder Investments Ltd (“Zeder”) is an investor in the broad agribusiness industry with a specific focus on the food and beverage sectors. The activities of the Zeder group of companies are set out in detail in the review of operations section of Zeder’s annual reports, being available at www.zeder.co.za or may be requested and obtained in person, at no charge, at the registered office of Zeder during office hours.
OPERATING RESULTS
During the year under review, Zeder made an offer to acquire all the shares in Agri Voedsel Ltd (“Agri Voedsel”) (which in turn held an interest of 26,0% in JSE-listed Pioneer Food Group Ltd) not already held by Zeder, whereby Agri Voedsel shareholders were offered 16,2 Zeder shares for every one Agri Voedsel share. This transaction was approved on 15 September 2014 and implemented on 20 October 2014. Following completion of same, Zeder now owns a direct interest of 27,3% in Pioneer Food Group Ltd. As purchase consideration, 463,7m Zeder shares were issued to Agri Voedsel shareholders. Furthermore, the group invested R154m in its existing core investments, namely Capespan Group Ltd, Zaad Holdings Ltd, Agrivision Africa (previously Chayton Africa), Pioneer Food Group Ltd, Quantum Foods Holdings Ltd and Kaap Agri Ltd. The group also disposed of its remaining shareholding in Capevin Holdings Ltd for cash proceeds of R193,5m.
The operating results and state of affairs of the group and company are set out in the attached income statements and statements of financial position, comprehensive income, changes in equity and cash flows, as well as the segment report and the notes to the aforementioned.
The earnings attributable to equity holders of the group for the year under review were R241,8m (2014: R306,8m) (2013: R511,7m). During the year under review, recurring headline earnings per share increased by 15,4% to 35,3 cents (2014: 30,6 cents) (2013: 25,7 cents), due to improved earnings contributions from the majority of Zeder’s underlying investments.
Headline earnings per share decreased by 17,3% to 22 cents (2014: 26,6 cents) (2013: 20,1 cents), due to the higher non-recurring performance fee payable following Zeder’s strong share price growth and the increased number of shares in issue as a consequence of the merger with Agri Voedsel. In addition, Pioneer Food Group Ltd incurred higher BEE share-based payment costs as a result of its strong share price growth, and Capespan Group Ltd made a deferred purchase consideration loss adjustment as a result of Golden Wing Mau, an associate, performing better than originally anticipated.
Attributable earnings per share decreased by 34,2% to 20,6 cents (2014: 31,3 cents) (2013: 52,3 cents), following the aforementioned decrease in headline earnings and a non-headline fair value gain made during the previous financial year following Capespan Group Ltd becoming a subsidiary.
The results of the 28 February 2015 year included the first time full year consolidation of Capespan Group Ltd, which formed part of the group for eight months during the 2014 year. The results for the year ended 28 February 2013 for the first time included the consolidated 11-month results of Zaad and Chayton.

99
STATED CAPITAL
During the year under review, the company issued 463 655 674 (2014: 2 099 814) (2013: nil) ordinary shares as part of asset-for-share exchanges and thereby increased its total number of ordinary shares in issue to 1 443 843 985 (2014: 980 188 311) (2013: 978 088 517). During the previous year, the company converted its issued ordinary and unissued preference shares to shares with no par value. Details regarding the authorised and issued share capital are disclosed in note 15 to the annual financial statements.
DIVIDENDS
On 7 April 2015, the company declared a final dividend of 5,5 cents (2014: 4,5 cents) (2013: 4 cents) per share in respect of the year ended 28 February 2015, which was paid on 4 May 2015.
SECRETARY
The secretary of the company is PSG Corporate Services (Pty) Ltd. Please refer to the “Corporate Information and Advisors” section of this Circular for its business and postal addresses.
AUDITOR
At the date of the financial statements being approved, PricewaterhouseCoopers Inc held office in accordance with the Companies Act of South Africa.
HISTORICAL FINANCIAL INFORMATION
No material change in the nature of the business of Zeder and its subsidiaries occurred, and no material fact or circumstance has occurred between the end of the latest financial year of Zeder and the date of this Circular, in so far as not already dealt with in historical financial information outlined in this Annexure.

100
STATEMENTS OF FINANCIAL POSITION
at 28 February 2015
GROUP COMPANY2015 2014* 2013 2015 2014 2013
Notes R’000 R’000 R’000 R’000 R’000 R’000
ASSETS
Non-current assets 8 003 349 3 637 184 2 838 505 6 214 060 2 125 732 2 117 521
Property, plant and equipment 1 1 223 209 924 975 381 818Intangible assets 2 600 729 375 795 158 906Biological assets 9 181 524 117 121Investment in subsidiary 3 6 214 060 2 125 732 2 117 521Investment in ordinary shares of associates 4.1 5 703 989 1 821 814 2 126 535Loans to associates 4.2 30 030 18 239 54 470Investment in ordinary shares of joint ventures 5.1 39 67Loans granted to joint ventures 5.2 81 1 553Equity securities 6 51 008 206 528 100 515Loans and advances 7 114 409 78 614 16 261Deferred income tax assets 17 63 869 59 388Employee benefits 8 34 462 33 090
Current assets 3 132 123 3 122 922 1 059 233 – – –
Biological assets 9 92 808 83 447 31 264Inventories 10 988 105 955 724 174 625Trade and other receivables 11 1 259 979 1 045 000 100 729Derivative financial assets 12 24 1 299Current income tax receivables 21 208 22 684Cash, money market investments and other cash equivalents 13 769 999 1 014 768 752 615
Non-current assets held for sale 14 30 378 177 570 287 733
Total assets 11 165 850 6 937 676 4 185 471 6 214 060 2 125 732 2 117 521
EQUITY AND LIABILITIES
Equity attributable to owners of the parentStated/share capital 15 5 095 256 1 748 061 9 781 5 095 256 1 748 061 9 781Share premium 1 730 071 1 730 071Other reserves 16 54 067 76 121 5 529Retained earnings 1 983 375 1 796 330 1 538 100 413 893 309 620 323 711
7 132 698 3 620 512 3 283 481 5 509 149 2 057 681 2 063 563
Non-controlling interest 607 845 544 679 109 109
Total equity 7 740 543 4 165 191 3 392 590 5 509 149 2 057 681 2 063 563
Non-current liabilities 1 273 712 1 028 346 544 912 – – –
Deferred income tax liabilities 17 105 627 119 768 53 895Borrowings 18 969 938 738 533 445 351Derivative financial liabilities 19 63 644 45 666 45 666Employee benefits 8 134 503 124 379
Current liabilities 2 151 595 1 744 139 247 969 704 911 68 051 53 958
Borrowings 18 902 373 459 699 59 981 701 911 68 051 53 925
Trade and other payables 20 1 153 236 1 176 719 184 866 33
Derivative financial liabilities 19 417 15 236Current income tax payables 30 928 19 299 502 3 000Employee benefits 8 64 641 73 186 2 620
Total equity and liabilities 11 165 850 6 937 676 4 185 471 6 214 060 2 125 732 2 117 521
* Restated as set out in note 33.

101
INCOME STATEMENTS
for the year ended 28 February 2015
GROUP COMPANY2015 2014* 2013 2015 2014 2013
Notes R’000 R’000 R’000 R’000 R’000 R’000
Revenue 21 8 691 968 5 977 508 328 113Cost of sales 22 (7 423 794) (5 204 533) (234 437)
Gross profit 1 268 174 772 975 93 676 – – –
IncomeChange in fair value of biological assets 9 144 019 134 150 28 703Investment income 23 74 848 65 854 13 102 151 380 25 000 50 000Net fair value gains 24 37 717 143 953 32 521Other operating income 25 44 714 16 342 5 480
Total income 301 298 360 299 79 806 151 380 25 000 50 000
ExpensesManagement fees 26.1 (235 514) (118 044) (58 560)Marketing, administration and other expenses 26.2 (1 129 819) (660 828) (120 105)
Total expenses (1 365 333) (778 872) (178 665) – – –
Income from associates and joint venturesShare of profits of associates and joint ventures 4 and 5 299 892 218 011 300 249Impairment of associates and joint ventures 4 and 5 (132) (21 421)Loss on dilution of interest in associates 4 (155 276)Loss on disposal of investment in associates (3 836) 502 890
Net income from associates and joint ventures 299 760 192 754 647 863 – – –
Profit before finance costs and taxation 503 899 547 156 642 680 151 380 25 000 50 000
Finance costs 27 (142 864) (85 962) (37 199)
Profit before taxation 361 035 461 194 605 481 151 380 25 000 50 000Taxation 28 (77 289) (104 686) (95 918) (3 000)
Profit for the year 283 746 356 508 509 563 148 380 25 000 50 000
Profit attributable to:Owners of the parent 241 816 306 753 511 741 148 380 25 000 50 000Non-controlling interest 41 930 49 755 (2 178)
283 746 356 508 509 563 148 380 25 000 50 000
Earnings per share (cents) 32
Attributable – basic and diluted 20,6 31,3 52,3
* Restated as set out in note 33.

102
STATEMENTS OF OTHER COMPREHENSIVE INCOME
for the year ended 28 February 2015
GROUP COMPANY2015 2014* 2013 2015 2014 2013
R’000 R’000 R’000 R’000 R’000 R’000
Profit for the year 283 746 356 508 509 563 148 380 25 000 50 000
Other comprehensive (loss)/income for year, net of taxation (30 963) 118 138 44 619 – – –
Items that will be reclassified to profit or loss
Currency translation movements (19 012) 157 391 13 351Reclassification of foreign exchange gains on long-term loan forming part of net foreign investment (1 015)Fair value gains on available-for-sale investments 792 391 363Reclassification of gains on available-for-sale investments (678)Share of other comprehensive (loss)/income of associates (12 725) 31 200 32 317Reclassification of share of associates’ other comprehensive income and equity movements upon disposal (55 887) (1 225)Cash flow hedges (5 709) (15 428)Recycling of cash flow hedges 25 010Share of other equity movements of associates (187)
Items that will not be reclassified to profit or loss
Actuarial (losses)/gains on employee defined benefit plans (18 304) 1 149
Total comprehensive income for year 252 783 474 646 554 182 148 380 25 000 50 000
Attributable to:
Owners of the parent 217 522 383 979 552 594 148 380 25 000 50 000Non-controlling interest 35 261 90 667 1 588
252 783 474 646 554 182 148 380 25 000 50 000
* Restated as set out in note 33.
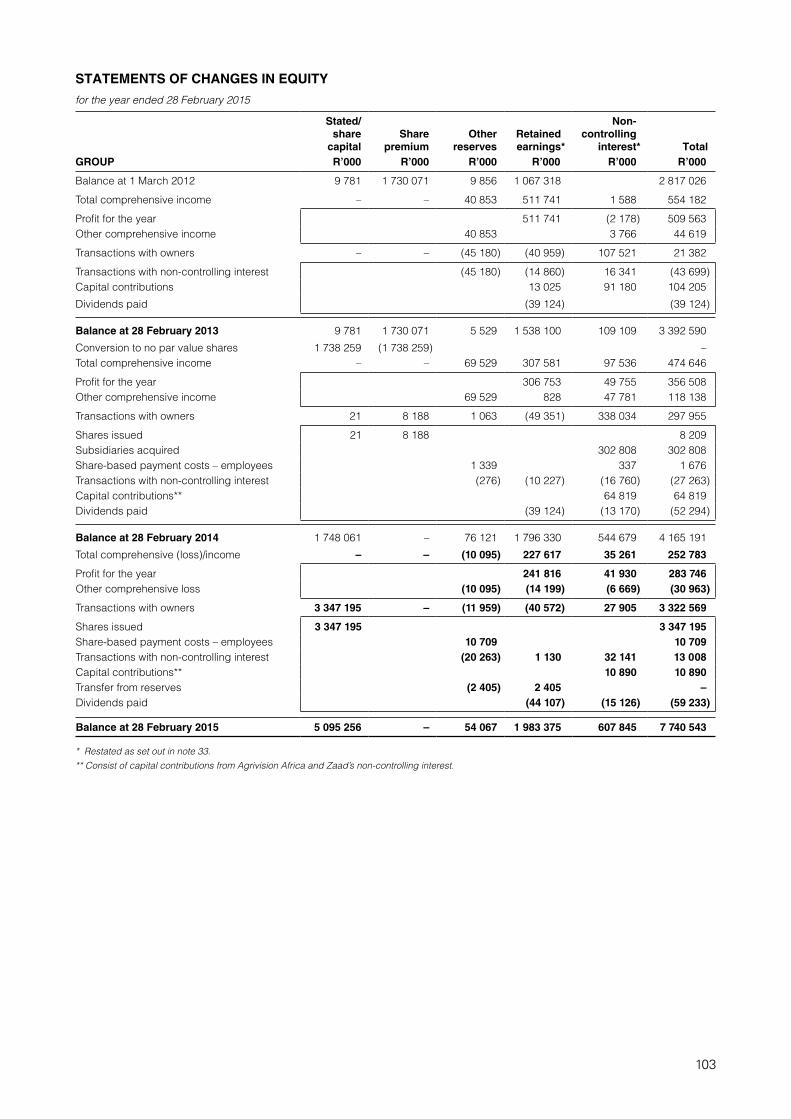
103
STATEMENTS OF CHANGES IN EQUITY
for the year ended 28 February 2015
Stated/share
capitalShare
premiumOther
reservesRetainedearnings*
Non-controlling
interest* TotalGROUP R’000 R’000 R’000 R’000 R’000 R’000
Balance at 1 March 2012 9 781 1 730 071 9 856 1 067 318 2 817 026
Total comprehensive income – – 40 853 511 741 1 588 554 182
Profit for the year 511 741 (2 178) 509 563Other comprehensive income 40 853 3 766 44 619
Transactions with owners – – (45 180) (40 959) 107 521 21 382
Transactions with non-controlling interest (45 180) (14 860) 16 341 (43 699)Capital contributions 13 025 91 180 104 205
Dividends paid (39 124) (39 124)
Balance at 28 February 2013 9 781 1 730 071 5 529 1 538 100 109 109 3 392 590
Conversion to no par value shares 1 738 259 (1 738 259) –Total comprehensive income – – 69 529 307 581 97 536 474 646
Profit for the year 306 753 49 755 356 508Other comprehensive income 69 529 828 47 781 118 138
Transactions with owners 21 8 188 1 063 (49 351) 338 034 297 955
Shares issued 21 8 188 8 209Subsidiaries acquired 302 808 302 808Share-based payment costs – employees 1 339 337 1 676Transactions with non-controlling interest (276) (10 227) (16 760) (27 263)Capital contributions** 64 819 64 819Dividends paid (39 124) (13 170) (52 294)
Balance at 28 February 2014 1 748 061 – 76 121 1 796 330 544 679 4 165 191
Total comprehensive (loss)/income – – (10 095) 227 617 35 261 252 783
Profit for the year 241 816 41 930 283 746Other comprehensive loss (10 095) (14 199) (6 669) (30 963)
Transactions with owners 3 347 195 – (11 959) (40 572) 27 905 3 322 569
Shares issued 3 347 195 3 347 195Share-based payment costs – employees 10 709 10 709Transactions with non-controlling interest (20 263) 1 130 32 141 13 008Capital contributions** 10 890 10 890Transfer from reserves (2 405) 2 405 –Dividends paid (44 107) (15 126) (59 233)
Balance at 28 February 2015 5 095 256 – 54 067 1 983 375 607 845 7 740 543
* Restated as set out in note 33.** Consist of capital contributions from Agrivision Africa and Zaad’s non-controlling interest.

104
STATEMENTS OF CHANGES IN EQUITY
for the year ended 28 February 2015
Stated/share capital
Share premium
Retained earnings Total
COMPANY R’000 R’000 R’000 R’000
Balance at 1 March 2012 9 781 1 730 071 312 835 2 052 687
Profit for the year 50 000 50 000
Dividends paid (39 124) (39 124)
Balance at 28 February 2013 9 781 1 730 071 323 711 2 063 563
Shares issued 21 8 188 8 209
Conversion to no par value shares 1 738 259 (1 738 259) –
Profit for the year 25 000 25 000
Dividends paid (39 124) (39 124)
Other 33 33
Balance at 28 February 2014 1 748 061 – 309 620 2 057 681
Shares issued 3 347 195 3 347 195
Profit for the year 148 380 148 380
Dividends paid (44 107) (44 107)
Balance at 28 February 2015 5 095 256 – 413 893 5 509 149
Final dividends per share
2012: 4 cents (declared on 7 March 2012 and paid on 2 April 2012)2013: 4 cents (declared on 8 April 2013 and paid on 6 May 2013)2014: 4,5 cents (declared on 7 April 2014 and paid on 5 May 2014)2015: 5,5 cents (declared on 7 April 2015 and payable on 4 May 2015)

105
STATEMENTS OF CASH FLOWS
for the year ended 28 February 2015
2015 2014 2013
GROUP Notes R’000 R’000 R’000
Cash flow from operating activities (108 584) 255 058 44 770
Cash (utilised by)/generated from operations 31.1 (75 699) 300 642 34 752Interest received 68 675 50 775 7 258Dividends received 132 817 77 128 123 281Interest paid (125 373) (89 001) (28 053)Taxation paid 31.2 (109 004) (84 486) (92 468)
Cash flow from investment activities (741 132) 189 397 386 334
Acquisition of subsidiaries 31.3 (300 233) (36 361) (397 615)Acquisition of associates 4 (264 849) (242 184) (124 319)Acquisition of equity securities 6 (177 797) (24)Additions to property, plant and equipment 1 (256 475) (160 646) (46 826)Additions to intangible assets 2 (75 828) (16 164)Proceeds from disposal of associates 91 707 795 467Proceeds from disposal of equity securities 124 567 138 627Proceeds from disposal of non-current assets held for sale 193 458 504 524Proceeds on redemption of preference share investment 66 101Proceeds from disposal of property, plant and equipment 8 953 53 863 9 393Proceeds from intangible assets 41Net (decrease)/increase in the amounts receivable from associates and joint ventures (10 319) 41 505 (54 470)(Increase)/decrease in loans and advances (35 880) 6 383
Cash flow from financing activities 579 514 (228 389) 242 689
Capital contributions by non-controlling interest 6 400 64 819 91 180Transaction with non-controlling interest (9 052) (23 241)Dividends paid to group shareholders (44 107) (39 124) (39 124)Dividends paid to non-controlling interest (15 126) (13 170)Borrowings repaid (79 386) (252 058)Borrowings drawn 720 785 34 385 190 633
Net (decrease)/increase in cash and cash equivalents (270 202) 216 066 673 793
Cash and cash equivalents at beginning of year 1 014 768 752 615 77 478Exchange gains on cash and cash equivalents 25 433 46 087 1 344
Cash and cash equivalents at end of year 13 769 999 1 014 768 752 615

106
ACCOUNTING POLICIES
for the year ended 28 February 2015
The principal accounting policies applied in the preparation of these consolidated and standalone financial statements are set out below. The accounting policies applied in the preparation of the consolidated financial statements are consistent in all material respects with those used in the prior financial year, taking cognisance of the retrospective early applications as set out below.
1. BASIS OF PREPARATION
The consolidated and separate financial statements have been prepared on the going concern basis and in accordance with International Financial Reporting Standards (“IFRS”); the SAICA Financial Reporting Guides, as issued by the Accounting Practices Committee; the Financial Reporting Pronouncements, as issued by the Financial Reporting Standards Council; the manner required by the Companies Act of South African and the Listings Requirements of the JSE Ltd. The financial statements have been prepared under the historical cost convention, as modified by the revaluation of financial assets classified as “available-for-sale”, financial assets and liabilities (including derivative financial instruments) classified as “at fair value through profit or loss”, employee defined benefit assets and liabilities, and biological assets, as well as investments in associates and joint ventures being accounted for according to the equity method of accounting.
The preparation of financial statements in conformity with IFRS requires the use of certain critical accounting estimates. It also requires management to exercise its judgement in the process of applying the group’s accounting policies. The areas involving a higher degree of judgement or complexity, or areas where assumptions and estimates are significant to the consolidated and separate financial statements are disclosed in accounting policy note 26 below.
2. STANDARDS, INTERPRETATIONS AND AMENDMENTS TO PUBLISHED STANDARDS AND AMENDMENTS THAT ARE EFFECTIVE FOR THE FIRST TIME IN 2015
2.1 New standards, interpretations and amendments adopted by the group during the year
– Amendments to IAS 16 Property, plant and equipment and IAS 41 Agriculture: Bearer plants (effective 1 January 2016)
Biological assets that meet the definition of bearer plants are measured either at cost or revalued amounts, less accumulated depreciation and impairment losses. Accordingly, bearer plants are measured similar to self-constructed items of property, plant and equipment.
– Amendments to IAS 36 Impairment of assets (effective 1 January 2014)
The group has adopted the amendments that addresses the disclosure of information about the recoverable amount of impaired assets if that amount is based on fair value less cost of disposal.
2.2 New standards, interpretations and amendments not currently relevant to the group’s operations
The following new standards, interpretations and amendments, which are not currently relevant to the group’s operations, had no impact on the measurement of amounts or disclosures in the current or prior year:
– Amendments to IAS 32 Financial instruments: Presentation – Offsetting financial assets and financial liabilities (effective 1 January 2014)
– Amendments to IFRS 10 Consolidated Financial Statements, IFRS 12 Disclosure of interest in other entities and IAS 27 Separate financial statements – Investment entities (effective 1 January 2014)
– Amendments to IAS 39 Financial instruments: Recognition and measurement – Novation of derivatives and continuation of hedge accounting
– IFRIC 21 Levies (effective 1 January 2014)
– Improvements to IFRSs 2012

107
3. CONSOLIDATION
3.1 Subsidiaries
Subsidiaries are all entities over which the group has control. The group controls an entity when the group is exposed to, or has rights to, variable returns from its involvement with the entity and has the ability to affect those returns through its power over the entity. Subsidiaries are fully consolidated from the date on which control is transferred to the group. They are deconsolidated from the date that control ceases.
The group applies the acquisition method to account for business combinations. The consideration transferred for the acquisition of a subsidiary is the fair values of the assets transferred, the liabilities incurred to the former owners of the acquiree and the equity interests issued by the group. The consideration transferred includes the fair value of any asset or liability resulting from a contingent consideration arrangement. Identifiable assets acquired and liabilities and contingent liabilities assumed in a business combination are measured initially at their fair values at the acquisition date. The group recognises any non-controlling interest in the acquiree on an acquisition-by-acquisition basis, either at fair value or at the non-controlling interest’s proportionate share of the recognised amounts of acquiree’s identifiable net assets.
Acquisition-related costs are expensed as incurred.
If the business combination is achieved in stages, the acquisition date carrying value of the acquirer’s previously held equity interest in the acquiree is remeasured to fair value at the acquisition date; any gains or losses arising from such remeasurement are recognised in the income statement.
Any contingent consideration to be transferred by the group is recognised at fair value at the acquisition date. Subsequent changes to the fair value of the contingent consideration that is deemed to be an asset or liability is recognised in accordance with IAS 39 either in profit or loss or as a change to other comprehensive income. Contingent consideration that is classified as equity is not re-measured, and its subsequent settlement is accounted for within equity.
The excess of the consideration transferred, the amount of any non-controlling interest in the acquiree and the acquisition date fair value of any previous equity interest in the acquiree over the fair value of the identifiable net assets acquired is recorded as goodwill. If the total of consideration transferred, non-controlling interest recognised and previously held interest measured is less than the fair value of the net assets of the subsidiary acquired in the case of a bargain purchase, the difference is recognised directly in the income statement.
Inter-company transactions, balances and unrealised gains on transactions between group companies are eliminated. Unrealised losses are also eliminated. When necessary, amounts reported by subsidiaries have been adjusted to conform with the group’s accounting policies.
Investments in subsidiaries are accounted for at cost less impairment in the separate financial statements. Cost is adjusted to reflect changes in consideration arising from contingent consideration amendments. Cost also includes directly attributable costs of investment.
3.2 Changes in ownership interests in subsidiaries without change of control
Transactions with non-controlling interests that do not result in loss of control are accounted for as equity transactions – that is, as transactions with the owners in their capacity as owners. The difference between fair value of any consideration paid and the relevant share acquired of the carrying value of net assets of the subsidiary is recorded in equity. Gains or losses on disposals to non-controlling interests are also recorded in equity.
3.3 Disposal of subsidiaries
When the group ceases to have control, any retained interest in the entity is remeasured to its fair value at the date when control is lost, with the change in carrying amount recognised in profit or loss. The fair value is the initial carrying amount for the purposes of subsequently accounting for the retained interest as an associate, joint venture or financial asset. In addition, any amounts previously recognised in other comprehensive income in respect of that entity are accounted for as if the group had directly disposed of the related assets or liabilities. This may mean that amounts previously recognised in other comprehensive income are reclassified to profit or loss.
108
3. CONSOLIDATION (continued)
3.4 Associates
Associates are all entities over which the group has significant influence but not control, generally accompanying a shareholding of between 20% and 50% of the voting rights. Investments in associates are accounted for using the equity method of accounting. Under the equity method, the investment is initially recognised at cost, and the carrying amount is increased or decreased to recognise the investor’s share of the profit or loss of the investee after the date of acquisition. The group’s investment in associates includes goodwill identified on acquisition.
If the ownership interest in an associate is reduced but significant influence is retained, only a proportionate share of the amounts previously recognised in other comprehensive income is reclassified to profit or loss, where appropriate.
The group’s share of post-acquisition profit or loss is recognised in the income statement, and its share of post-acquisition movements in other comprehensive income and other equity movements are recognised in other comprehensive income with a corresponding adjustment to the carrying amount of the investment. When the group’s share of losses in an associate equals or exceeds its interest in the associate, including any other unsecured receivables, the group does not recognise further losses, unless it has incurred legal or constructive obligations or made payments on behalf of the associate.
The group determines at each reporting date whether there is any objective evidence that the investment in the associate is impaired. If this is the case, the group calculates the amount of impairment as the difference between the recoverable amount of the associate and its carrying value and recognises the amount as an impairment in the income statement.
Profits and losses resulting from upstream and downstream transactions between the group and its associates are recognised in the group’s financial statements only to the extent of unrelated investor’s interests in the associates. Unrealised losses are eliminated unless the transaction provides evidence of an impairment of the asset transferred. Accounting policies of associates have been changed where necessary to ensure consistency with the policies adopted by the group.
Dilution gains and losses arising from investments in associates are recognised in the income statement.
3.5 Joint arrangements
In terms of IFRS 11, investments in joint arrangements are classified as either joint operations or joint ventures depending on the contractual rights and obligations of each investor. The group has assessed the nature of its joint arrangements and determined them to be joint ventures. Joint ventures are accounted for using the equity method of accounting.
Under the equity method of accounting, interests in joint ventures are initially recognised at cost and adjusted thereafter to recognise the group’s share of the post-acquisition profits or losses, movements in other comprehensive income and other equity movements. When the group’s share of losses in a joint venture equals or exceeds its interests in the joint ventures, the group does not recognise further losses, unless it has incurred obligations or made payments on behalf of the joint ventures.
Unrealised gains on transactions between the group and its joint ventures are eliminated to the extent of the group’s interest in the joint ventures. Unrealised losses are also eliminated unless the transaction provides evidence of an impairment of the asset transferred. Accounting policies of the joint ventures have been changed where necessary to ensure consistency with the policies adopted by the group.
4. SEGMENT REPORTING
Operating segments are reported in a manner consistent with the internal reporting provided to the chief operating decision-maker (refer segment report). The chief operating decision-maker, who is responsible for allocating resources and assessing performance of the operating segments, has been identified as the executive committee that makes strategic decisions.

109
5. FOREIGN CURRENCY TRANSLATION
5.1 Functional and presentation currency
Items included in the financial statements of each of the group’s entities are measured using the currency of the primary economic environment in which those entities operate (“functional currency”). The consolidated and standalone financial statements are presented in South African rand, being the company’s functional and presentation currency.
5.2 Transactions and balances
Foreign currency transactions are translated into the functional currency using the exchange rates prevailing at the dates of the transactions or valuation where items are re-measured. Foreign exchange gains and losses resulting from the settlement of such transactions and from the translation at year-end exchange rates of monetary assets and liabilities denominated in foreign currencies are recognised in the income statement. Foreign exchange gains and losses are presented in the income statement within “fair value gains and losses”.
Changes in the fair value of monetary securities denominated in foreign currency classified as available-for-sale are analysed between translation differences resulting from changes in the amortised cost of the security and other changes in the carrying amount of the security. Translation differences related to changes in amortised cost are recognised in profit or loss, and other changes in carrying amount are recognised in other comprehensive income.
Translation differences on non-monetary financial assets and liabilities, such as equity securities classified as at fair value through profit or loss, are recognised in the income statement as part of the “fair value gain or loss”. Translation differences on non-monetary financial assets, such as equity securities classified as available-for-sale, are included in other comprehensive income.
5.3 Group companies
The results and financial position of all group entities (none of which has the currency of a hyperinflationary economy) that have a functional currency different from the presentation currency are translated into the presentation currency as follows:
– income and expenses for each income statement are translated at average exchange rates (unless this average is not a reasonable approximation of the cumulative effect of the rates prevailing on the transaction dates, in which case income and expenses are translated at the rate on the dates of the transactions);
– assets and liabilities for each statement of financial position presented are translated at the closing rate at the date of that statement of financial position; and
– all resulting exchange differences are recognised in other comprehensive income.
Goodwill and fair value adjustments arising on the acquisition of a foreign entity are treated as assets and liabilities of the foreign entity and translated at the closing rate. Exchange differences arising are recognised in other comprehensive income.
Group entities with functional currencies other than the presentation currency, mainly have the following functional currencies:
2015 2014 2013Average
Rand per foreign
currency unit
Closing Rand per
foreign currency unit
Average Rand per
foreign currency unit
Closing Rand per foreign
currency unit
Average Rand per
foreign currency unit
Closing Rand per foreign
currency unit
British pound 17,83 17,99 15,05 17,11
Chinese yuan renminbi 1,76 1,86 1,56 1,72
Euro 14,14 14,05 12,78 14,32
Hong Kong dollar 1,40 1,49 1,24 1,34
Japanese yen 0,10 0,10 0,10 0,10
Mozambique new metical 0,35 0,34 0,32 0,34
United States dollar 10,84 11,60 9,64 10,50 8,37 8,47
Zambian kwacha 1,77 1,84 1,79 1,89

110
6. PROPERTY, PLANT AND EQUIPMENT
Property, plant and equipment are carried at cost less accumulated depreciation and impairment losses. Cost includes expenditure that is directly attributable to the acquisition of the item of property, plant and equipment.
Subsequent costs are included in the asset’s carrying value or recognised as a separate asset, as appropriate, only when it is probable that future economic benefits associated with the item will flow to the group and the cost of the item can be measured reliably. All other repairs and maintenance are charged to profit or loss during the period in which it is incurred.
Depreciation is calculated on the straight-line method at rates considered appropriate to reduce carrying values to estimated residual values over the useful lives of the assets, as follows:
Land and buildings 25 – 75 yearsMotor vehicles 4 – 5 yearsPlant 5 – 15 yearsOffice equipment (includes computer equipment) 3 – 10 years
Land is not depreciated, except for land held under leasehold rights, which is depreciated over the relevant leasehold term.
The assets’ residual values and useful lives are reviewed, and adjusted if appropriate, at each reporting date. An asset’s carrying value is written down immediately to its recoverable amount if the asset’s carrying value exceeds its recoverable amount. Impairment losses are recognised in the income statement.
Gains and losses on disposals of property, plant and equipment are determined by comparing the asset’s proceeds with its carrying value and are included in the income statement.
7. INTANGIBLE ASSETS
7.1 Goodwill
Goodwill represents the excess of the cost of an acquisition over the fair value of the group’s share of the net identifiable assets of the acquired subsidiary, joint venture or associate at the date of acquisition. Goodwill on the acquisition of a subsidiary is reported in the statement of financial position as an intangible asset. Goodwill on the acquisition of a joint venture or associate is included in the respective investment’s carrying amount. Goodwill is tested annually for impairment and is carried at cost less accumulated impairment losses. Impairment losses on goodwill are not reversed. Gains and losses on the disposal of an entity include the carrying amount of goodwill relating to the entity sold.
Goodwill is allocated to cash-generating units for the purpose of impairment testing. The allocation is made to those cash-generating units or groups of cash-generating units that are expected to benefit from the business combination in which the goodwill arose. The groups of cash-generating units are not larger than operating segments.
An excess of the acquirer’s interest in the net fair value of acquiree’s identifiable assets, liabilities and contingent liabilities arises where the net assets of a subsidiary, joint venture or associate at the date of acquisition, fairly valued, exceed the cost of the acquisition. This excess arising on acquisition is recognised as a gain on bargain purchase in profit or loss.
7.2 Trademarks
Acquired patents, trademarks and licenses are shown at cost less accumulated amortisation and impairment. The carrying amount of each cash-generating unit is reviewed for impairment when an impairment indicator is identified.
7.3 Customer lists
Acquired customer lists are shown at cost less accumulated amortisation and impairment. The carrying amount of each cash-generating unit is reviewed for impairment when an impairment indicator is identified.

111
7. INTANGIBLE ASSETS (continued)
7.4 Computer software
Costs associated with maintaining computer software programmes are recognised as an expense as incurred. Development costs that are directly attributable to the design and testing of identifiable and unique software products controlled by the group are recognised as intangible assets when all of the following criteria are met:
– It is technically feasible to complete the software product so that it will be available for use.
– Management intends to complete the software product and use or sell it.
– There is an ability to use or sell the software product.
– It can be demonstrated how the software product will generate probable future economic benefits.
– Adequate technical, financial and other resources to complete the development and to use or sell the software product are available.
– The expenditure attributable to the software product during its development can be reliably measured.
Directly attributable costs that are capitalised as part of the software product include the software development employee costs and an appropriate portion of relevant overheads. Other development expenditures that do not meet these criteria are recognised as an expense as incurred. Development costs previously recognised as an expense are not recognised as an asset in a subsequent period.
7.5 Capitalised product development costs
Research costs undertaken with the prospect of gaining new scientific or technical knowledge and understanding, is recognised in profit or loss as an expense as incurred. Development costs are expensed when incurred, unless they result in projects that are technically and commercially feasible and the group has sufficient resources to complete development, in which event these development costs are capitalised and amortised over the estimated useful life of the project. Capitalised development costs are stated at cost less accumulated amortisation and impairment losses.
7.6 Amortisation of intangible assets
Amortisation is calculated on the straight-line method at rates considered appropriate to reduce carrying values to estimated residual values over the useful lives of the assets, as follows:
Capitalised product development costs 3 – 10 yearsCustomer lists 4 – 5 yearsTrademarks 25 – 75 yearsComputer software 5 – 15 years
8. IMPAIRMENT OF NON-FINANCIAL ASSETS
Assets that have an indefinite useful life are not subject to amortisation and are tested annually for impairment. Assets that are subject to amortisation are tested for impairment whenever events or changes in circumstances indicate that the carrying amount may not be recoverable. An impairment loss is recognised for the amount by which the asset’s carrying amount exceeds its recoverable amount. The recoverable amount is the higher of an asset’s fair value less costs to sell and value-in-use. For the purposes of assessing impairment, assets are grouped at the lowest levels for which there are separately identifiable cash flows (cash-generating units). Non-financial assets other than goodwill that suffered an impairment are reviewed for possible reversal of the impairment at each reporting date.
9. FINANCIAL INSTRUMENTS
Financial instruments recognised on the statement of financial position include financial assets, consisting of equity securities, loans and advances, derivative financial assets, trade and other receivables, cash, money market investments and other cash equivalents, as well as financial liabilities, consisting of borrowings, derivative financial liabilities and trade and other payables.

112
9. FINANCIAL INSTRUMENTS (continued)
There are group companies that are parties to derivative financial instruments that reduce exposure to financial risks. These instruments mainly comprise forward currency exchange contracts and hedge accounting is applied in some instances. Gains and losses arising from cash flow hedges are recognised through other comprehensive income, while those arising from fair value hedges are recognised in profit or loss in the period in which they arise. Group companies that do not apply hedge accounting, recognise changes in the fair value of these and other derivative instruments in profit or loss in the period in which they arise.
10. OFFSETTING FINANCIAL INSTRUMENTS
Financial assets and liabilities are offset and the net amount reported in the statement of financial position only when there is a legally enforceable right to offset the recognised amounts and there is an intention to settle on a net basis, or to realise the asset and settle the liability simultaneously.
11. FINANCIAL ASSETS
The group classifies its financial assets into the following categories: financial assets at fair value through profit or loss, held-to-maturity financial assets, loans and receivables and available-for-sale financial assets. The classification depends on the purpose for which the financial assets were acquired. Management determines the classification of its financial assets at initial recognition.
11.1 Classification
(a) Financial assets at fair value through profit or loss
This category has two subcategories: financial assets held for trading, and those designated at fair value through profit or loss at inception. A financial asset is classified in this category if acquired principally for the purpose of selling in the short term or if so designated by management. Financial assets designated at fair value through profit or loss at inception are those that are managed and whose performance is evaluated on a fair value basis. Information about these financial assets is provided internally on a fair value basis to the group’s key management personnel. Derivatives are categorised as held for trading.
(b) Held-to-maturity financial assets
Held-to-maturity financial assets are non-derivative financial assets with fixed or determinable payments and fixed maturities – other than those that meet the definition of loans and receivables – that the group’s management has the positive intention and ability to hold to maturity.
(c) Loans and receivables
Loans and receivables are non-derivative financial assets with fixed or determinable payments that are not quoted in an active market other than those that the group intends to sell in the short term.
(d) Available-for-sale financial assets
Available-for-sale financial assets are non-derivative financial assets that are either designated in this category or not classified in any of the other categories.
11.2 Recognition and measurement of financial assets
Purchases and sales of financial assets are recognised on trade date – the date on which the group commits to purchase or sell the asset. Financial assets not carried at fair value through profit or loss, are initially recognised at fair value plus transaction costs that are directly attributable to their acquisition. Financial assets carried at fair value through profit or loss are initially recognised at fair value and transaction costs are expensed in the income statement. Financial assets are derecognised when the rights to receive cash flows from the financial assets have expired or have been transferred and the group has transferred substantially all risks and rewards of ownership.

113
11. FINANCIAL ASSETS (continued)
11.2 Recognition and measurement of financial assets (continued)
Available-for-sale financial assets and financial assets at fair value through profit or loss are subsequently carried at fair value. Realised and unrealised gains and losses arising from changes in the fair value of financial assets classified in the at fair value through profit or loss category are included in the income statement in the period in which they arise. Unrealised gains and losses arising from changes in the fair value of non-monetary securities classified as available-for-sale are recognised in other comprehensive income. When securities classified as available-for-sale are sold or impaired, the accumulated fair value adjustments are included in the income statement as gains and losses from investment activities.
Interest on available-for-sale securities calculated using the effective-interest method is recognised in the income statement as part of investment income. Dividends on available-for-sale equity instruments are recognised in the income statement as part of investment income when the group’s right to receive payment is established.
The fair values of quoted financial assets are based on current bid prices. If the market for a financial asset is not active, the group establishes fair value by using valuation techniques. These include the use of recent arm’s length transactions, reference to other instruments that are substantially the same and discounted cash flow analysis refined to reflect the issuer’s specific circumstances.
Quoted prices are readily and regularly available from an exchange, dealer, broker, industry group, pricing service or regulatory agency and those prices represent actual and regularly occurring market transactions on an arm’s length basis.
Held-to-maturity investments are measured at amortised cost using the effective-interest method less any impairment, with income recognised on such basis.
Loans and receivables are carried at amortised cost using the effective-interest method. Specific provisions are made against identified doubtful receivables.
Loans advanced to associated companies, joint ventures and subsidiaries, which are interest free with no repayment terms, are carried at amortised cost using the effective-interest method.
11.3 Impairment of financial assets
The group assesses at each reporting date whether there is objective evidence that a financial asset or a group of financial assets is impaired. In the case of equity securities classified as available-for-sale, a significant or prolonged decline in the fair value of the security below its cost is considered in determining whether the securities are impaired. If any such evidence exists for available-for-sale financial assets, the cumulative loss – measured as the difference between the acquisition cost and the current fair value, less any impairment loss on that financial asset previously recognised in profit or loss – is removed from equity and recognised in the income statement. Impairment losses recognised in the income statement on equity instruments are not reversed through the income statement.
Loans and receivables are considered impaired if, and only if, there is objective evidence of impairment as a result of events that occurred after initial asset recognition (known as loss events) and these loss events have an adverse impact on the assets’ estimated future cash flows that can be reliably measured. Objective evidence that loans and receivables may be impaired, includes breach of contract, such as a default or delinquency in interest or principal payments. In this regard instalments past due date are considered in breach of contract. The amount of the impairment loss is the difference between the asset’s carrying amount and the present value of estimated future cash flows, discounted at the original effective-interest rate. Impairment losses are recognised in and reversed through the income statement.
Held-to-maturity investments are considered impaired when there is objective evidence that the group will not be able to collect all amounts due according to the original contract terms. Significant financial difficulties of the counterparty, probability that the counterparty will enter bankruptcy or financial reorganisation, and default or delinquency in payments are considered indicators that the investment is impaired. The amount of the impairment provision is the difference between the asset’s carrying amount and the present value of estimated future cash flows, discounted at the original effective-interest rate. The movement in the amount of the provision is recognised in the income statement.

114
12. DERIVATIVE FINANCIAL INSTRUMENTS
Derivative financial instruments are recognised initially at fair value on the date on which a derivative contract is entered into. Subsequent to initial recognition, derivative financial instruments are measured at fair value through profit or loss. Fair values of over-the-counter traded derivatives are obtained using valuation techniques, including discounted cash flow models and option pricing models.
The best evidence of fair value of a derivative at initial recognition is the transaction price (i.e. the fair value of the consideration given or received) unless the fair value of that instrument is evidenced by comparison with other observable current market transactions in the same instrument or based on a valuation technique whose variables include only observable market data.
12.1 Non-controlling interest put option liability
IFRS requires the group to account for a written put option held by non-controlling shareholders of the group’s subsidiaries, which provides them with the right to require the group to acquire their shareholding at fair value. IAS 32 requires that in the circumstances described above, the present value of the future redemption amount be reclassified from equity to financial liabilities and that the financial liability so reclassified subsequently be measured in accordance with IAS 39. In accordance with IAS 39, all subsequent changes in the fair value of the liability together with the related interest charges arising from present valuing the future liability, shall be recognised in profit or loss.
12.2 Derivative financial instruments and hedging activities
The group uses derivative financial instruments to hedge its exposure to foreign exchange risk arising from operational activities. In accordance with its treasury policy, the group does not hold or issue derivative financial instruments for trading purposes. Subsequent to initial recognition, derivatives are measured at fair value. The method of recognising the resulting gain or loss depends on whether the derivative is designated as a hedging instrument and if so, the nature of the item being hedged. Where a derivative financial instrument is used to hedge the variability in cash flows of the foreign exchange exposure of a recognised asset or liability or a highly probable forecast transaction, hedge accounting may be applied. These derivatives are designated as cash flow hedges.
12.3 Cash flow hedges
Hedge relationships are formally documented at inception. The documentation includes identification of the hedged item and the hedging instrument, details of the risk that is being hedged and the way in which effectiveness will be assessed at inception and during the period of the hedge. If the hedge is not highly effective in off-setting changes in fair value or cash flows attributable to the hedge risk, consistent with the documented risk management strategy, hedge accounting is discontinued. Where a derivative financial instrument is designated as a hedge of the variability in cash flow of a recognised asset or liability or a highly probable forecast transaction, the effective portion of the gain or loss on the hedging instrument is recognised in other comprehensive income. The ineffective portion is recognised in profit or loss. When the forecast transaction results in the recognition of a financial asset or financial liability, the cumulative gain or loss is reclassified from other comprehensive income in the same period in which the hedged forecast cash flow/hedged item affects profit or loss. Otherwise the cumulative gain or loss is removed from other comprehensive income and recognised in profit or loss at the same time as the hedge transaction.
When the forecast transaction that is hedged results in the recognition of a non-financial asset (for example, inventory or property, plant and equipment) the gains and losses previously deferred in equity are transferred from equity and included in the initial measurement of the cost of the asset. For example, the deferred amounts are ultimately recognised in cost of goods sold in the case of inventory or in depreciation in the case of property, plant and equipment. Hedge accounting is discontinued if the hedge no longer meets the criteria for hedge accounting; if the hedging instrument expires or is sold, terminated or exercised; if the forecast transaction is no longer expected to occur; or if the hedge designation is revoked. On the discontinuance of hedge accounting (except where a forecast transaction is no longer expected to occur), the cumulative unrealised gain or loss recognised in other comprehensive income is recognised in profit or loss when the forecast transaction occurs and affects profit or loss. Where a forecast transaction is no longer expected to occur, the cumulative gain or loss is recognised immediately in profit or loss.

115
13. BIOLOGICAL ASSETS
Biological assets are measured on initial recognition and at the end of each reporting period at fair value less cost to sell. Changes in the measurement of fair value less cost to sell are included in profit or loss for the period in which they arise. Costs to sell include all costs that would be necessary to sell the assets, including transportation costs and incremental selling costs, including auctioneers’ fees and commission paid to brokers and dealers. All costs incurred in maintaining the assets are included in profit or loss for the period in which they arise. Refer note 9 for further details regarding the valuation fo biological assets.
13.1 Bearer plants
Biological assets that meet the definition of bearer plants are measured either at cost or revalued amounts, less accumulated depreciation and impairment losses. Management elected the cost model and bearer plants are carried at cost less accumulated depreciation and impairment losses. Bearer plants are measured at accumulated costs until maturity, similar to the accounting for a self-constructed item of property, plant and equipment. Agricultural produce growing on bearer plants remain within the scope of IAS 41 Agriculture and are measured at fair value less costs to sell with changes recognised in profit or loss as the produce grows. Production and borrowing costs are included in the cost.
Subsequent production and borrowing costs are included in the bearer plant’s carrying value only when it is probable that future economic benefits associated with the item will flow to the group and the cost of the item can be measured reliably.
The lifespan of the orchards/vineyards begins the day the tree is planted in the ground. Depreciation is calculated on the straight-line method at rates considered appropriate to reduce carrying values to estimated residual values over the useful lives of the assets. The useful life is determined in collaboration with the technical department, and is as follows:
Apples 36 years Oranges and lemons 30 yearsPears 36 years Grapefruit and soft citrus 20 yearsGrapes 18 years Plums 20 years
A distinction is made between non-bearing and partially bearing orchards/vineyards and when the transformation has been sustainably completed (i.e. full bearing orchards/vineyards). In collaboration with the technical department the orchards/vineyards are deemed to be full bearing when they reach the following ages:
Apples 7 years Oranges and lemons 7 yearsPears 7 years Grapefruit and soft citrus 7 yearsGrapes 4 years Plums 3 years
All costs relating to the development of an orchard/vineyard are capitalised to respective orchard/block planted. The establishment costs are allocated per orchard/block based on establishment costs allocated per hectare.
Production costs, capital expenditure and borrowing costs are capitalised to the bearer plant until the plant has reached the age of full bearing. Income that is received related to the orchard/vineyard prior to it becoming full bearing is credited to the capitalised costs.
Depreciation in respect of orchards/vineyards is calculated from the date the orchard/vineyard reaches the state of full bearing and calculated by taking the cost per orchard/vineyard and dividing by the relevant remaining life.
All orchards/vineyards to be removed during a financial year will be deemed to be removed from the date the last crop was harvested from the orchard/vineyard. No depreciation will be charged from that date for the specific orchard that is to be removed. The value of the orchards/vineyards removed is the book value of the orchard/vineyard at the deemed date of removal.

116
14. INVENTORY
Inventories are measured at the lower of cost and net realisable value. The cost of inventories is based on the weighted average principle, and includes expenditure incurred in acquiring the inventories, production or conversion costs and other costs incurred in bringing them to their existing location and condition.
All direct and related expenses incurred in the production of the current harvest have been capitalised against biological assets at cost.
Net realisable value is the estimated selling price in the ordinary course of business, less the estimated costs of completion and selling expenses.
15. TRADE AND OTHER RECEIVABLES
Trade and other receivables are initially measured at fair value and subsequently recognised at amortised cost using the effective-interest method, less provision for impairment. A provision for impairment is established when there is objective evidence that the group will not be able to collect all amounts due according to the original terms of receivables. Significant financial difficulties of the debtor, probability that the debtor will enter bankruptcy or financial reorganisation, and default or delinquency in payments are considered indicators that the receivable is impaired. The amount of the provision is the difference between the asset’s carrying amount and the present value of estimated future cash flows, discounted at the original effective interest rate. The movement in the amount of the provision is recognised in the income statement.
16. CASH, MONEY MARKET INVESTMENTS AND OTHER CASH EQUIVALENTS
Cash and cash equivalents consist of cash held at call with banks and other short-term highly liquid investments with maturities of three months or less. Investments in money market funds are classified as cash equivalents, since these funds are held to meet short-term cash requirements, are highly liquid investments, that are readily convertible to known amounts of cash and which are subject to an insignificant risk of changes in value. Bank overdrafts are included within borrowings in the statement of financial position.
17. STATED AND SHARE CAPITAL
Ordinary shares are classified as equity. Incremental costs directly attributable to the issue of equity instruments are shown in equity as a deduction from the proceeds, net of tax.
Where any group company purchases the company’s equity share capital (treasury shares), the consideration paid, including any directly attributable incremental costs, net of income taxes, is deducted from equity attributable to the company’s equity holders until the shares are cancelled, reissued or disposed of. Where such shares are subsequently sold, reissued or otherwise disposed of, any consideration received is included in equity attributable to the company’s equity holders, net of any directly attributable incremental transaction costs and the related income tax effects.
18. FINANCIAL LIABILITIES
A financial liability is any liability that is a contractual obligation to deliver cash or another financial asset to another entity.
Financial liabilities include borrowings, derivative financial liabilities, investment contracts, third party liabilities arising on consolidation of mutual funds, accrual for other liabilities and charges, and trade and other payables. The group issues investments contracts without fixed terms (unit-linked) and with fixed and guaranteed terms (fixed interest rate).
Financial liabilities are initially recognised at fair value less transaction costs that are directly attributable to the raising of the funds, for all financial liabilities carried at amortised cost. All financial liabilities measured at fair value through profit or loss are initially recognised at fair value. The best evidence of the fair value at initial recognition is the transaction price (i.e. the fair value of the consideration received) unless the fair value of that instrument is evidenced by comparison with other observable current market transactions in the same instrument or based on a valuation technique whose variables include only data from observable markets.

117
18. FINANCIAL LIABILITIES (continued)
18.1 Borrowings
Borrowings are recognised initially at fair value, net of transaction costs incurred. Borrowings are subsequently stated at amortised cost; any difference between the proceeds (net of transaction costs) and the redemption value is recognised in the income statement over the period of the borrowings using the effective-interest method.
Preference shares, which are mandatorily redeemable on a specific date, are classified as liabilities. The dividends on these preference shares are recognised in the income statement as interest expense.
General and specific borrowing costs directly attributable to the acquisition, construction or production of qualifying assets, which are assets that necessarily take a substantial period of time to get ready for their intended use or sale, are added to the cost of those assets, until such time as the assets are substantially ready for their intended use or sale.
Investment income earned on the temporary investment of specific borrowings pending their expenditure on qualifying assets is deducted from the borrowing costs eligible for capitalisation.
All other borrowing costs are recognised in profit or loss in the period in which they are incurred.
18.2 Trade and other payables
Trade and other payables are recognised initially at fair value, net of transaction costs incurred. Trade and other payables are subsequently stated at amortised cost; any difference between the proceeds (net of transaction costs) and the redemption value is recognised in profit or loss over the period using the effective-interest method.
19. TAXATION
19.1 Current and deferred income tax
The tax expense for the year comprises current and deferred tax. Tax is recognised in the income statement, except to the extent that it relates to items recognised in other comprehensive income or directly in equity. In this case the tax is also recognised in other comprehensive income or directly in equity, respectively.
The current income tax charge is calculated on the basis of the tax laws enacted or substantively enacted at the reporting date in the countries where the group’s subsidiaries and associates operate and generate taxable income. Management periodically evaluates positions taken in tax returns with respect to situations in which applicable tax regulations are subject to interpretation and establishes provisions where appropriate on the basis of amounts expected to be paid to the tax authorities.
Deferred income tax is provided in full, using the liability method, on temporary differences arising between the tax bases of assets and liabilities and their carrying amounts in the consolidated financial statements. However, if the deferred income tax arises from initial recognition of an asset or liability in a transaction other than a business combination, that at the time of the transaction affects neither accounting nor taxable profit or loss, it is not accounted for. Deferred income tax is determined using tax rates (and laws) that have been enacted or substantively enacted by the reporting date and are expected to apply when the related deferred income tax asset is realised or the deferred income tax liability is settled.
Deferred income tax assets are recognised to the extent that it is probable that future taxable profit will be available against which the temporary differences can be utilised.
Deferred income tax is provided on temporary differences arising on investments in subsidiaries and associated companies, except where the group controls the timing of the reversal of the temporary difference and it is probable that the temporary difference will not reverse in the foreseeable future.
Deferred income tax assets and liabilities are offset when there is a legally enforceable right to offset current tax assets against current tax liabilities and when the deferred income tax assets and liabilities relate to income taxes levied by the same taxation authority on either the taxable entity or different taxable entities where there is an intention to settle the balances on a net basis.

118
19. TAXATION (continued)
19.2 Secondary tax on companies and dividend withholding tax
Secondary tax on companies was abolished with effect from 1 April 2012 and replaced by a dividends tax, which is not levied on the company but on the beneficial owner of the share and accordingly does not require recognition in profit or loss. Dividends tax withheld by the company on dividends paid to its shareholders (who do not qualify for an exemption from dividends tax) and payable at the reporting date to the South African Revenue Services (where applicable) is included in trade and other payables in the statement of financial position.
20. EMPLOYEE BENEFITS
The group operates various post-employment schemes, including both defined benefit and defined contribution pension plans and post-employment medical plans.
20.1 Pension obligations
A defined contribution plan is a pension plan under which the group pays fixed contributions into a separate entity. The group has no legal or constructive obligations to pay further contributions if the fund does not hold sufficient assets to pay all employees the benefits relating to employee service in the current and prior periods. A defined benefit plan is a pension plan that is not a defined contribution plan.
Typically defined benefit plans define an amount of pension benefit that an employee will receive on retirement, usually dependent on one or more factors such as age, years of service and compensation.
The liability recognised in the statement of financial position in respect of defined benefit pension plans is the present value of the defined benefit obligation at the end of the reporting period less the fair value of plan assets. The defined benefit obligation is calculated annually by independent actuaries using the projected unit credit method. The present value of the defined benefit obligation is determined by discounting the estimated future cash outflows using interest rates of high-quality corporate bonds that are denominated in the currency in which the benefits will be paid, and that have terms to maturity approximating to the terms of the related pension obligation. In countries where there is no deep market in such bonds, the market rates on government bonds are used.
Actuarial gains and losses arising from experience adjustments and changes in actuarial assumptions are charged or credited to equity in other comprehensive income in the period in which they arise.
Past-service costs are recognised immediately in profit or loss.
For defined contribution plans, the group pays contributions to publicly or privately administered pension insurance plans on a mandatory, contractual or voluntary basis. The group has no further payment obligations once the contributions have been paid. The contributions are recognised as employee benefit expense when they are due. Prepaid contributions are recognised as an asset to the extent that a cash refund or a reduction in the future payments is available.
20.2 Other post-retirement benefits
Some group companies provide post-employment healthcare benefits to their retirees. The entitlement to these benefits is usually conditional on the employee remaining in service up to retirement age and the completion of a minimum service period. The expected costs of these benefits are accrued over the period of employment using the same accounting methodology as used for defined benefit pension plans. Actuarial gains and losses arising from experience adjustments and changes in actuarial assumptions are charged or credited to equity in other comprehensive income in the period in which they arise. These obligations are valued annually by independent qualified actuaries.
20.3 Share-based compensation
A subsidiary of the group operates an equity-settled share-based payment scheme.

119
20. EMPLOYEE BENEFITS (continued)
20.3 Share-based compensation (continued)
For the share-based payment scheme, the fair value of the employee services received in exchange for the grant of the scheme share options is recognised as an expense. The total amount to be expensed over the vesting period, which is between three and seven years, is determined by reference to the fair value of the scheme share options granted, excluding the impact of any non-market vesting conditions. Non-market vesting conditions are included in assumptions concerning the number of scheme share options that are expected to become exercisable. At each reporting date, the entity revises its estimates of the number of scheme share options that are expected to become exercisable. It recognises the impact of the revision of original estimates, if any, in the income statement, and a corresponding adjustment to equity over the remaining vesting period.
If the group cancels or settles a grant of equity instruments during the vesting period, the group accounts for the cancellation or settlement of the grant and recognise immediately the amount that otherwise would have been recognised for services received over the remainder of the vesting period.
The share-based payment expense is recognised in the income statement and a share-based payment reserve is recognised in equity (other reserves) and represents the fair value at grant date of the share options that will be delivered on vesting.
20.4 Termination benefits
Termination benefits are payable when employment is terminated by the group before the normal retirement date, or whenever an employee accepts voluntary redundancy in exchange for these benefits. The group recognises termination benefits at the earlier of the following dates: (a) when the group can no longer withdraw the offer of those benefits; and (b) when the entity recognises costs for a restructuring that is within the scope of IAS 37 and involves the payment of termination benefits. In the case of an offer made to encourage voluntary redundancy, the termination benefits are measured based on the number of employees expected to accept the offer. Benefits falling due more than 12 months after the end of the reporting period are discounted to their present value.
20.5 Annual leave
Employee entitlements to annual leave are recognised when they accrue to employees. An accrual is made for the estimated annual leave as a result of services rendered by employees up to reporting date.
20.6 Profit sharing and bonus plans
The group recognises a liability and an expense for bonus plans and profit sharing, where contractually obliged, or where there is a past practice that has created a constructive obligation.
20.7 Other short-term employee benefits
The cost of all other short-term employee benefits is recognised as an expense during the period in which the employee renders the related service. Accruals for employee entitlements to wages, salaries and bonuses represent the amount which the Group has a present obligation to pay as a result of employees’ services provided up to the reporting date. The accruals have been calculated at undiscounted amounts based on current wage and salary rates.
21. PROVISIONS AND CONTINGENT LIABILITIES
21.1 Provisions
Provisions are recognised when:
– the group has a present legal or constructive obligation as a result of past events;
– it is more likely than not that an outflow of resources will be required to settle the obligation; and
– the amount has been reliably estimated.

120
21. PROVISIONS AND CONTINGENT LIABILITIES (continued)
21.1 Provisions (continued)
Provisions are measured at the present value of the expenditures expected to be required to settle the obligation using a pre-tax rate that reflects current market assessments of the time value of money and the risks specific to the obligation. The increase in the provision due to passage of time is recognised as an interest expense.
21.2 Contingent liabilities
A contingent liability is either a possible obligation that arises from past events and whose existence will be confirmed only by the occurrence or non-occurrence of one or more uncertain future events not wholly within the control of the company or a present obligation that arises from past events but it is not probable that an outflow of resources embodying economic benefits will be required to settle the obligation or the amount of the obligation cannot be measured with sufficient reliability. These contingent liabilities are not recognised in the statement of financial position but disclosed in the notes to the financial statements.
A contingent asset is a possible asset that arises from past events and whose existence will be confirmed only by the occurrence or non-occurrence of one or more uncertain future events not wholly within the control of the entity. These contingent assets are not recognised in the statement of financial position but are disclosed in the notes to the financial statements if the inflow of financial benefits is probable.
22. LEASES
Leases in which a significant portion of the risks and rewards of ownership are retained by the lessor are classified as operating leases. Payments made under operating leases are charged to the income statement on a straight-line basis over the period of the lease.
23. DIVIDEND DISTRIBUTIONS
Dividend distributions to the company’s shareholders are recognised as a liability in the period in which the dividends are approved by the company’s board of directors.
24. REVENUE RECOGNITION
Revenue comprises the fair value of the consideration received or receivable for goods sold or services rendered in the ordinary course of the group’s activities. The group’s activities comprise the sale of fruit, agricultural seed, produce, management fees, port charges, shipping and related services.
Revenue is shown net of value-added tax, returns, rebates and discounts and after eliminating sales within the group.
The group recognises revenue when the amount of revenue can be reliably measured, it is probable that future economic benefits will flow to the entity and when specific criteria have been met for each of the group’s activities as described below. The group bases its estimates on historical results, taking into consideration the type of customer, the type of transaction and the specifics of each arrangement.
If circumstances arise that may change the original estimates of revenues, costs or the extent of progress toward completion of services, then estimates are revised. These revisions may result in increases or decreases in estimated revenues or costs and are reflected in income in the period in which the circumstances that gave rise to the revision became known by management.
24.1 Sale of goods
Sale of goods are recognised when the significant risks and rewards of ownership have been transferred to the customer, recovery of the consideration is probable, the associated costs and possible return of goods can be estimated reliably, there is no continuing management involvement with the goods, and the amount of revenue can be measured reliably.

121
24. REVENUE RECOGNITION (continued)
24.2 Services rendered
Revenue arising from services is recognised on an accrual basis in accordance with the substance of the relevant agreements. Revenue from the operation of vessels is recognised on a proportionate basis where voyages have not terminated at year-end.
24.3 Interest income
Interest income is recognised using the effective-interest rate method. When a loan and receivable is impaired, the group reduces the carrying amount to its recoverable amount, being the estimated future cash flow discounted at the original effective-interest rate of the instrument and continues unwinding discount as interest income. Interest income is included as part of investment income in the income statement.
24.4 Dividend income
Dividend income is recognised when the right to receive payment is established. Dividend income is included as part of investment income in the income statement.
25. NON-CURRENT ASSETS (OR DISPOSAL GROUPS) HELD FOR SALE
Non-current assets (or disposal groups) are classified as assets held for sale when their carrying amount is to be recovered principally through a sale transaction and a sale is considered highly probable. They are stated at the lower of carrying amount and fair value less costs to sell.
26. CRITICAL ACCOUNTING ESTIMATES AND JUDGEMENTS IN APPLYING ACCOUNTING POLICIES
Estimates and judgements are continually evaluated and are based on historical experience and other factors, including expectations of future events that are believed to be reasonable under the circumstances.
The group makes estimates and assumptions concerning the future. The resulting accounting estimates will, by definition, seldom equal the related actual results. The estimates and assumptions that have a significant risk of causing a material adjustment to the carrying values of assets and liabilities are addressed below.
26.1 Estimated impairment of goodwill
The group tests annually whether goodwill has suffered any impairment, in accordance with the accounting policy on goodwill. The recoverable amounts of cash-generating units have been determined based on value-in-use and fair value less cost to sell calculations. These calculations require the use of estimates (see note 2 for further detail and disclosure of estimates used).
26.2 Impairment of investment in associates
An impairment of investment in associates is considered when the fair value is below its carrying value. In determination of whether the decline is significant or prolonged, the following factors may be considered: normal volatility in share price, the financial health of the investee, sector performance, changes in operational and financing cash flow.
An impairment loss is recognised for the amount by which the investment in associated company’s carrying amount exceeds its recoverable amount. The recoverable amount is the higher of an asset’s fair value less costs to sell and value in use.
26.3 Acquisition of associates
Details regarding significant new investments in associates are disclosed in note 4. Furthermore, the group’s interest in certain already existing associates were also increased. In accounting for these transactions management had to apply judgement in allocating the purchase price to the identifiable assets and liabilities of the associates acquired, or the portion acquired when an additional interest was acquired.

122
26. CRITICAL ACCOUNTING ESTIMATES AND JUDGEMENTS IN APPLYING ACCOUNTING POLICIES (continued)
26.4 Recognition of intangible assets
With a business combination all identifiable assets are recognised at their respective fair values in the consolidated financial statements. The fair values of intangible assets acquired through business combinations are determined by using a discounted cash flow valuation method. The discount rate is based on the long-term risk-free rate with risk premiums added for market and other company and asset specific risks. Intangible assets acquired through business combinations were valued using a discount rates ranging between 4% and 17% (2014: ranging between 17% and 20%) (2013: 20%).
Trademarks and customers lists acquired through business combinations or acquisitions are valued on acquisition using discounted cash flow methodology based on assumptions and estimates regarding future revenue growth, weighted cost of capital, marketing costs and other economic factors affecting the value in use of these intangible assets. These assumptions reflect management’s best estimates but are subject to inherent uncertainties, which may not be controlled by management.
The cost of the trademarks and customer lists are amortised over their estimated useful lives. The remaining useful lives of intangible assets are re-assessed annually. If the estimate of the remaining useful lives changes, the remaining carrying values are amortised prospectively over that revised remaining useful life.
The main assumptions used in the valuation of key customer lists are the useful lives of these assets and the future profitability and cancellation rate of the underlying revenue streams. The useful life of a key customer list is estimated based on the cancellation experience of the existing business and the useful life of customer lists of other players in the market. For the key customer lists recognised during the year, useful lives ranging between two and five years were assumed and average cancellation rates ranging between 15% and 85% (2014: ranging between 15% and 85%) (2013: 50%) were assumed.
If useful lives were increased/decreased by 10%, the intangible assets recognised would have been approximately R2,5m (2014: approximately R2m) (2013: approximately R1m) higher/lower. Future profit margins used in determining customer contracts and relationships values were consistent with the margins applied in determining the fair value of the related investment.
Refer to the intangible asset accounting policy and note 2 for further detail.
26.5 Recognition of property, plant and equipment
The cost of property, plant and equipment is depreciated over their estimated useful lives to their estimated residual values. The remaining useful lives and residual values of property, plant and equipment are re-assessed annually. If the estimates of the remaining useful lives or residual values change, the remaining carrying values are depreciated prospectively, taking into account the revised estimates. Refer to the property, plant and equipment accounting policy and note 1 for further detail.
26.6 Recognition of biological assets
The fair value of these biological assets were determined using a discounted cash flow model, which incorporates significant variable inputs i.e. discount rate and useful life of the biological assets. Where an insignificant level of biological transformation had taken place since planting, the biological assets are valued at cost (refer note 9 for further details).
26.7 Money market funds
Cash and cash equivalents disclosed on the statement of financial position includes investments in money market funds, being short-term highly liquid investments with maturities of three months or less. Money market funds are classified as cash equivalents, since these funds are held to meet short-term cash requirements, are highly liquid investments, that are readily convertible to known amounts of cash and which are subject to an insignificant risk of changes in value. The classification of money market funds as cash equivalents is only judgemental for purposes of disclosure and judgement applied could not have any impact of disclosed amounts of assets or liabilities.

123
26. CRITICAL ACCOUNTING ESTIMATES AND JUDGEMENTS IN APPLYING ACCOUNTING POLICIES (continued)
26.8 Recoverability of trade and other receivables
Each entity in the group makes assumptions on the recoverability of its financial assets. These instruments mainly cover trade and other receivables and production loans. Where the recoverability of these instruments is considered to be doubtful management applies judgement in the calculation of the amount to be impaired. Capespan establishes an allowance for impairment that represents its estimate of incurred losses in respect of trade and other receivables. The main component of this allowance is a specific loss component that relates to individually significant exposures, and a collective loss component established for groups of similar assets in respect of losses that have been incurred but not yet identified. The collective loss allowance is determined based on historical data of payment statistics for similar financial assets.
26.9 Deferred tax
Each group entity determines the recoverability of deferred tax assets and the recognition of estimated tax losses. The recognition is based on the entities’ ability to utilise these losses based on expected future taxable earnings. The recognised and unrecognised assessed tax losses are disclosed in note 28.
26.10 Contingent consideration
The deferred purchase consideration recognised, at the previous reporting date (refer note 20) relates to an earn-out clause paid during 2014. Calculations are based on the estimated average net profit before tax for three years using average forecast exchange rates and discounted.

124
NOTES TO THE ANNUAL FINANCIAL STATEMENTS
at the year ended 28 February 2015
1. PROPERTY, PLANT AND EQUIPMENTVehicles Office
Land Buildings and plant equipment TotalGROUP R’000 R’000 R’000 R’000 R’000
At 28 February 2015Cost 390 981 389 391 552 464 56 006 1 388 842Accumulated depreciation and impairment (14 903) (15 888) (118 563) (16 279) (165 633)
Balance at end of year 376 078 373 503 433 901 39 727 1 223 209
ReconciliationBalance at beginning of year 289 270 312 395 304 745 18 565 924 975Additions 47 691 44 841 133 090 30 853 256 475Disposals (121) (140) (4 250) (111) (4 622)Depreciation (6 935) (15 016) (65 189) (9 788) (96 928)Reversal of impairment 8 277 3 616 11 893Transfer to held-for-sale (20 454) (9 533) (11) (29 998)Exchange rate movements (2 127) (9 948) 193 (175) (12 057)Subsidiaries acquired 48 300 53 548 71 229 394 173 471
Balance at end of year 376 078 373 503 433 901 39 727 1 223 209
At 28 February 2014Cost 297 238 321 544 361 735 25 056 1 005 573Accumulated depreciation and impairment (7 968) (9 149) (56 990) (6 491) (80 598)
Balance at end of year 289 270 312 395 304 745 18 565 924 975
ReconciliationBalance at beginning of year 194 094 62 112 124 329 1 283 381 818Additions 25 006 32 881 96 087 6 672 160 646Disposals (5 470) (29 117) (22 766) (348) (57 701)Depreciation (5 626) (7 737) (45 780) (6 166) (65 309)Exchange rate movements 32 852 14 733 26 152 (988) 72 749Subsidiaries acquired 48 414 239 523 126 723 18 112 432 772
Balance at end of year 289 270 312 395 304 745 18 565 924 975
At 28 February 2013Cost 196 436 63 524 135 539 1 608 397 107Accumulated depreciation and impairment (2 342) (1 412) (11 210) (325) (15 289)
Balance at end of year 194 094 62 112 124 329 1 283 381 818
ReconciliationBalance at beginning of year –Additions 2 727 14 569 28 576 954 46 826Disposals (6 882) (92) (626) (5) (7 605)Depreciation (2 342) (1 412) (11 210) (325) (15 289)Exchange rate movements 6 703 1 755 4 328 31 12 817Subsidiaries acquired 193 888 47 292 103 261 628 345 069
Balance at end of year 194 094 62 112 124 329 1 283 381 818
Details of land and buildings are available at the registered offices of the relevant group companies. Refer note 18 for details regarding property, plant and equipment that serve as security for borrowings.The reversal of impairment relates to the property, plant and equipment of a Capespan Group Ltd subsidiary, which was subsequently classified as a non-current asset held-for-sale.

125
2. INTANGIBLE ASSETS
Capitalised Trademarks,product computer
development Customer softwarecosts lists and other Goodwill Total
GROUP R’000 R’000 R’000 R’000 R’000
At 28 February 2015Cost 144 884 36 999 67 907 416 110 665 900Accumulated amortisation and impairment (17 324) (17 318) (30 529) (65 171)
Balance at end of year 127 560 19 681 37 378 416 110 600 729
ReconciliationBalance at beginning of year 74 471 22 329 46 058 232 937 375 795Additions 71 598 4 230 75 828Disposals (41) (41)Amortisation (9 272) (6 386) (9 671) (25 329)Impairment (3 894) (9 166) (5 953) (19 013)Exchange rate movement (5 743) 133 250 27 985 22 625Subsidiaries acquired 400 3 605 5 718 161 141 170 864
Balance at end of year 127 560 19 681 37 378 416 110 600 729
At 28 February 2014Cost 78 629 33 261 57 750 232 937 402 577Accumulated amortisation (4 158) (10 932) (11 692) (26 782)
Balance at end of year 74 471 22 329 46 058 232 937 375 795
ReconciliationBalance at beginning of year 4 819 11 008 143 079 158 906Additions 14 433 1 731 16 164Amortisation (4 158) (6 851) (9 345) (20 354)Impairment (1 155) (1 155)Exchange rate movement 4 092 (652) 20 793 24 233Subsidiaries acquired 61 259 24 361 43 316 69 065 198 001
Balance at end of year 74 471 22 329 46 058 232 937 375 795
At 28 February 2013Cost 8 900 13 355 143 079 165 334Accumulated amortisation (4 081) (2 347) (6 428)
Balance at end of year – 4 819 11 008 143 079 158 906
ReconciliationBalance at beginning of year –Amortisation (4 081) (2 347) (6 428)Exchange rate movement 4 088 4 088Subsidiaries acquired 8 900 13 355 138 991 161 246
Balance at end of year – 4 819 11 008 143 079 158 906

126
2. INTANGIBLE ASSETS (continued)Intangible assets other than goodwill
Included in intangible assets other than goodwill are the following significant individual intangible assets and their remaining amortisation periods:
Carrying valueRemaining amortisation period 2015 2014 2013
2015 2014 2013 R’000 R’000 R’000
ZaadCapitalised product development costs < 8 years < 9 years 127 560 74 471
CapespanMetspan Hong Kong customer lists 16 years 17 years 13 372 14 209
140 932 88 680 –
Goodwill allocation
Goodwill is allocated to cash-generating units (“CGUs”), being each operating subsidiary. A summary of the goodwill allocation is as follows:
GROUP2015 2014 2013
R’000 R’000 R’000
ZaadAgricol 51 722 51 722 51 722Klein Karoo Seed Marketing 69 065 69 065
Agrivision AfricaChobe Agrivision 42 883 38 253 29 378Somawhe 78 467 73 897 61 979Mpongwe Milling 173 973
416 110 232 937 143 079
Goodwill is tested for impairment annually by comparing the carrying value to the recoverable amount of the CGUs, being the higher of value-in-use and fair value less cost to sell. Therefore, should fair value less cost to sell exceed the carrying value, goodwill is considered adequately supported.
Zaad – Agricol and Klein Karoo Seed Marketing
The fair value less cost to sell of Agricol and Klein Karoo Seed Marketing is determined using unobservable inputs (level 3), by applying a price/earnings ratio of 12 (2014: 12) (2013: 10). The price/earnings ratio applied was determined with reference to similar listed companies, adjusted for entity specific considerations. Had the price/earnings ratio been decreased by 10%, the recoverable amount would still exceed the carrying value.
Agrivision Africa
The fair value less cost to sell of Agrivision Africa, which consists of three CGUs, namely Chobe Agrivision, Somawhe and Mpongwe Milling, is determined based on the net realisable value of the underlying assets, with reference to the fair value of land, buildings and other tangible assets (level 3 unobservable inputs). This was based mainly on an average value of US$11 840 (2014: US$11 840) (2013: US$10 000) per irrigated hectare of land. Had the price per irrigated hectare been adjusted downward by 10%, the recoverable amount would still exceed the carrying value (2014: still exceed the carrying value) (2013: impairment of R13,7m). Mpongwe Milling’s fair value less cost to sell were determined using a price/earnings ratio of 10 – 15.
At the reporting date, the directors were satisfied that the carrying value of goodwill is adequately supported.

127
COMPANY2015 2014 2013
R’000 R’000 R’000
3. INVESTMENT IN SUBSIDIARY
Unlisted shares at cost less provision for impairment 6 214 060 2 125 732 2 117 521
The company holds 100% (2014: 100%) (2013: 100%) of the issued share capital of Zeder Financial Services Ltd. Refer to note 4.2 for further details.
GROUP2015 2014 2013
R’000 R’000 R’000
4. INVESTMENT IN ASSOCIATES4.1 Investment in ordinary shares of associates
– Listed 4 916 986– Unlisted but quoted 787 003 1 821 814 2 126 535
5 703 989 1 821 814 2 126 535
4.2 Loans to associates1 30 030 18 239 54 470
– Klein Karoo Seed Marketing (Pty) Ltd2 50 470– Klein Karoo Akademie (Pty) Ltd3 2 305 3 472 – Klein Karoo Seed Zimbabwe3 27 725 14 767– Other4 4 000
1 Loans in associates approximate fair value.2 The loan was unsecured, carried interest at a rate of prime less 1%
and has been repaid.3 These loans are unsecured, interest free with no repayment terms.4 The loan was capitalised during the previous year.
Reconciliation of ordinary share investments:Balance at beginning of year 1 821 814 2 126 535 2 567 104Subsidiaries acquired 181 047Acquisitions– Cash 87 301 242 184 124 319– Share issue1 3 335 322 8 209– Other 50 079 6 881Equity accounting– Share of profits of associates2 300 743 164 518 299 024– Loss on dilution of interest in associate (155 276)– Dividends received (126 644) (63 549) (117 437)– Other comprehensive income (12 725) 31 200 32 130Impairment of associates3 (65) (21 421)Fair value gain on step-up acquisition 17 205 22 023Transfer from equity securities 254 387Transfer to non-current asset held for sale4 (311 195) (159 580)Transfer to subsidiaries (7 946) (503 999) (50 409)Disposals (95 543) (435 363)Exchange rate movement 1 723 39 742
Balance at end of year 5 703 989 1 821 814 2 126 535
Market value of listed investments 9 763 816
Market value of unlisted investments [based on a rolling PE basis per associate (2014: based on published over-the-counter prices) (2013: based on published over-the-counter prices)] 962 923 2 513 516 2 475 500
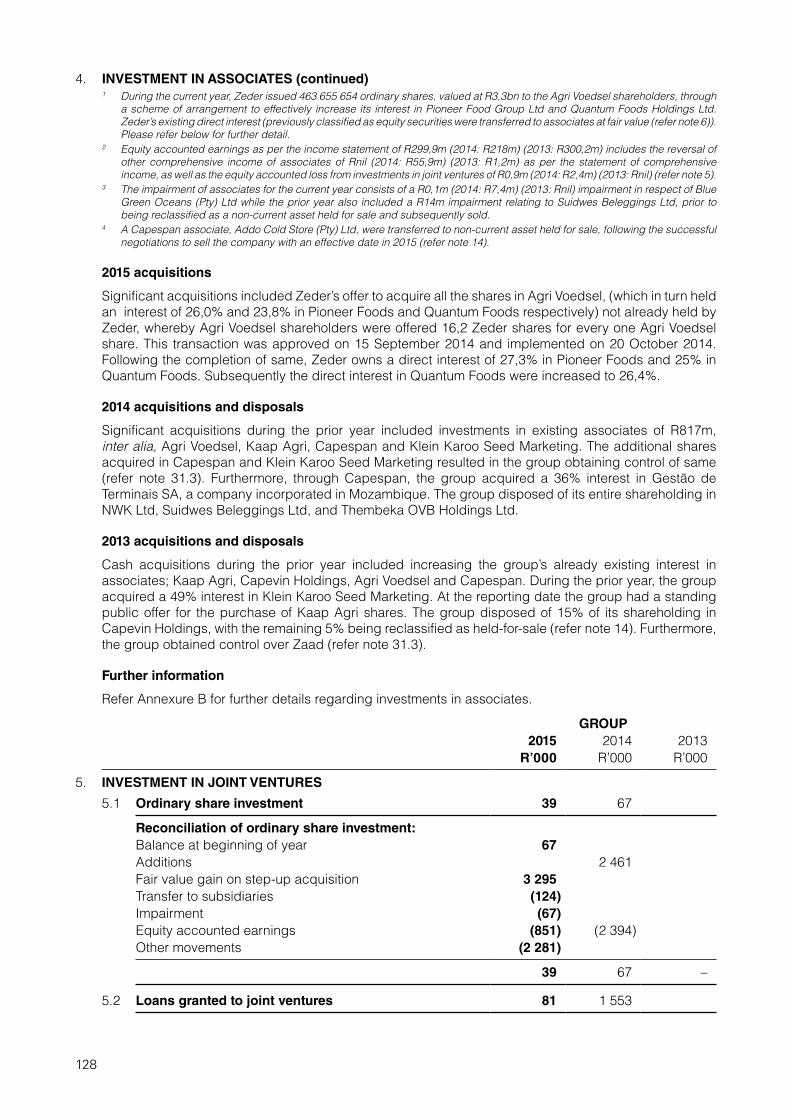
128
4. INVESTMENT IN ASSOCIATES (continued)1 During the current year, Zeder issued 463 655 654 ordinary shares, valued at R3,3bn to the Agri Voedsel shareholders, through
a scheme of arrangement to effectively increase its interest in Pioneer Food Group Ltd and Quantum Foods Holdings Ltd. Zeder’s existing direct interest (previously classified as equity securities were transferred to associates at fair value (refer note 6)). Please refer below for further detail.
2 Equity accounted earnings as per the income statement of R299,9m (2014: R218m) (2013: R300,2m) includes the reversal of other comprehensive income of associates of Rnil (2014: R55,9m) (2013: R1,2m) as per the statement of comprehensive income, as well as the equity accounted loss from investments in joint ventures of R0,9m (2014: R2,4m) (2013: Rnil) (refer note 5).
3 The impairment of associates for the current year consists of a R0,1m (2014: R7,4m) (2013: Rnil) impairment in respect of Blue Green Oceans (Pty) Ltd while the prior year also included a R14m impairment relating to Suidwes Beleggings Ltd, prior to being reclassified as a non-current asset held for sale and subsequently sold.
4 A Capespan associate, Addo Cold Store (Pty) Ltd, were transferred to non-current asset held for sale, following the successful negotiations to sell the company with an effective date in 2015 (refer note 14).
2015 acquisitions
Significant acquisitions included Zeder’s offer to acquire all the shares in Agri Voedsel, (which in turn held an interest of 26,0% and 23,8% in Pioneer Foods and Quantum Foods respectively) not already held by Zeder, whereby Agri Voedsel shareholders were offered 16,2 Zeder shares for every one Agri Voedsel share. This transaction was approved on 15 September 2014 and implemented on 20 October 2014. Following the completion of same, Zeder owns a direct interest of 27,3% in Pioneer Foods and 25% in Quantum Foods. Subsequently the direct interest in Quantum Foods were increased to 26,4%.
2014 acquisitions and disposals
Significant acquisitions during the prior year included investments in existing associates of R817m, inter alia, Agri Voedsel, Kaap Agri, Capespan and Klein Karoo Seed Marketing. The additional shares acquired in Capespan and Klein Karoo Seed Marketing resulted in the group obtaining control of same (refer note 31.3). Furthermore, through Capespan, the group acquired a 36% interest in Gestão de Terminais SA, a company incorporated in Mozambique. The group disposed of its entire shareholding in NWK Ltd, Suidwes Beleggings Ltd, and Thembeka OVB Holdings Ltd.
2013 acquisitions and disposals
Cash acquisitions during the prior year included increasing the group’s already existing interest in associates; Kaap Agri, Capevin Holdings, Agri Voedsel and Capespan. During the prior year, the group acquired a 49% interest in Klein Karoo Seed Marketing. At the reporting date the group had a standing public offer for the purchase of Kaap Agri shares. The group disposed of 15% of its shareholding in Capevin Holdings, with the remaining 5% being reclassified as held-for-sale (refer note 14). Furthermore, the group obtained control over Zaad (refer note 31.3).
Further information
Refer Annexure B for further details regarding investments in associates.
GROUP2015 2014 2013
R’000 R’000 R’000
5. INVESTMENT IN JOINT VENTURES
5.1 Ordinary share investment 39 67
Reconciliation of ordinary share investment:Balance at beginning of year 67Additions 2 461Fair value gain on step-up acquisition 3 295Transfer to subsidiaries (124)Impairment (67)Equity accounted earnings (851) (2 394)Other movements (2 281)
39 67 –
5.2 Loans granted to joint ventures 81 1 553

129
GROUP2015 2014 2013
R’000 R’000 R’000
6. EQUITY SECURITIES
Available-for-sale 4 729 3 756 3 031
– Listed 773– Unlisted but quoted 1 321 1 007 2 258– Unquoted 3 408 2 749
At fair value through profit or loss 46 279 202 772 97 484
– Listed 163 792– Unlisted but quoted 3– Unquoted 46 279 38 980 97 481
51 008 206 528 100 515
The unquoted equity securities include advances which are linked to equity instruments. In terms of these agreements, the group is entitled to the majority of the increase in the market value of the underlying equity securities and the dividends received on these securities. The advances are impaired to the value of the underlying instruments should the market value of the instruments fall below the current carrying value of the advances (refer note 36 for fair value disclosure).
Available-for-sale
Fair value throughprofit or
loss TotalGROUP R’000 R’000 R’000
ReconciliationBalance at 1 March 2012 217 538 217 538Subsidiaries acquired 2 393 2 393Additions 24 24Disposals (142 314) (142 314)Net fair value gains 614 22 260 22 874
Balance at 28 February 2013 3 031 97 484 100 515Subsidiaries acquired 6 190 6 190Additions* 177 797 177 797Disposals (5 929) (60 157) (66 086)Net fair value gains/(losses) 464 (12 352) (11 888)
Balance at 28 February 2014 3 756 202 772 206 528Net fair value gains 973 97 894 98 867Transfer to associates (254 387) (254 387)
Balance at 28 February 2015 4 729 46 279 51 008
* Additions relate mainly to the acquisition of Pioneer Foods ordinary shares.

130
GROUP2015 2014 2013
R’000 R’000 R’000
7. LOANS AND ADVANCESSecured loans 104 191 72 454 16 261Unsecured loans 10 218 6 160
114 409 78 614 16 261
Secured loans include a production loan of R48,7m (2014: R44,9m) (2013: Rnil) from Capespan to Kaspernek Orchards (supplier to Capespan) and loans to non-controlling shareholders of a subsidiary amounting to R29,7m (2014: R16,4m) (2013: R16,3m). The loan to Kaspernek carries interest at rates ranging beween prime plus 1%, has fixed repayment terms and the Kaspernek farm and fruit produces serve as security. The loans to the non-controlling shareholders carry interest at rates ranging between prime and prime less 2%, are repayable during July 2017 and November 2018 and are secured over the non-controlling shareholders’ ordinary shares in the subsidiary company.
8. EMPLOYEE BENEFITS
Assets and liabilities relating to the group’s employee benefits can be summarised as follows:
GROUPAssets R’000
2015 Liabilities
R’000Net
R’000Assets R’000
2014 Liabilities
R’000Net
R’000Assets R’000
2013 Liabilities
R’000Net
R’000
Short-term employee benefits
Performance-based remuneration (45 096) (45 096) (40 800) (40 800) (1 110) (1 110)Leave pay (18 705) (18 705) (17 612) (17 612) (994) (994)Other – (500) (500) –
Long-term incentive scheme – (27 607) (27 607) –Post-employment defined benefit plans 34 462 (132 818) (98 356) 33 090 (111 046) (77 956) (516) (516)Termination employee benefits (2 525) (2 525) – –
34 462 (199 144) (164 682) 33 090 (197 565) (164 475) – (2 620) (2 620)
Non-current portion 34 462 (134 503) (100 041) 33 090 (124 379) (91 289) –Current portion (64 641) (64 641) (73 186) (73 186) (2 620) (2 620)
Short-term employment benefit
These benefits comprise mainly bonus and leave pay accruals.
Long-term incentive scheme
The executive management of Capespan was part of a long-term incentive scheme based on the increase in Capespan’s headline earnings per share, measured over a three-year rolling period. Amounts provided for in terms of this scheme was recognised through profit or loss. During the current year, the long-term incentive scheme has been replaced by a share option scheme for executive directors and senior management (refer note 15).
Post-retirement medical aid benefits – Capespan Group Ltd
The group, through Capespan, provides for post-employment medical aid benefits in respect of certain retired employees. This liability is for a relatively small group of staff and their dependants who were already retired from International Harbour Services (Pty) Ltd, Outspan International Ltd and Unifruco Ltd prior to the merger between Unifruco and Outspan in 1999. To qualify for the scheme they had to be permanently employed, be a member of the company designated scheme at retirement and remain resident in South Africa until their retirement. The obligation was quantified by an independent actuary.

131
8. EMPLOYEE BENEFITS (continued)
Retirement funds and Pension fund scheme – Capespan Europe
The group, through Capespan, operates a number of externally funded defined benefit and defined contribution pension schemes across Europe and Japan. The schemes are set up under trusts and the assets of the schemes are therefore held separately from those of the group.
The accompanying disclosures relate to all of the group’s significant defined benefit retirement schemes in the United Kingdom and Continental Europe: The South African Co-operative Citrus Exchange Ltd pension and life assurance schemes (“SACCE”), and the Capespan Continent NV and Fresh Fruit Services CV plan (“CCNV”). In addition, the group has a pension scheme in Germany called the Capespan Germany GmbH pension scheme.
Actuarial valuations were carried out for the schemes. All calculations were carried out by independent actuaries using the projected unit credit method.
GROUP
The respective employee defined benefit plan deficits can be analysed as follows:
2015 2014 2013Capespan Group Ltd Capespan Group Ltd Capespan Group Ltd
Assets Liabilities Net Asset Liabilities Net Asset Liabilities NetR’000 R’000 R’000 R’000 R’000 R’000 R’000 R’000 R’000
Present value of funded obligations (23 823) (23 823) (21 260) (21 260) –
Opening balance (21 260) (21 260) – –Subsidiaries acquired – (22 243) (22 243) –Interest expense (1 264) (1 264) (1 481) (1 481) –Movement in actuarial (losses)/gains (3 367) (3 367) 515 515 –Employer contributions 2 068 2 068 1 949 1 949 –
Balance at end of year – (23 823) (23 823) – (21 260) (21 260) – – –
2015 2014 2013Capespan Europe Capespan Europe Capespan Europe
Assets R’000
Liabilities R’000
Net R’000
Asset R’000
Liabilities R’000
Net R’000
Asset R’000
Liabilities R’000
Net R’000
Fair value of plan assets 34 462 34 462 33 090 33 090 –Present value of funded obligations (108 155) (108 155) (89 786) (89 786) –
34 462 (108 155) (73 693) 33 090 (89 786) (56 696) – – –
Opening balance 33 090 (89 786) (56 696) – –Subsidiaries acquired – 25 184 (72 139) (46 955) –Interest expense (16 227) (16 227) (14 848) (14 848) –Return on plan assets 12 081 12 081 12 003 12 003 –Movement in actuarial (losses)/gains (17 338) (17 338) 634 634 –Benefits paid (10 709) 12 517 1 808 (4 097) 4 097 – –Employer contributions 3 472 3 472 3 021 3 021 –Exchange differences (793) (793) (10 854) (10 854) –Settlements – 303 303 –
Balance at end of year 34 462 (108 155) (73 693) 33 090 (89 786) (56 696) – – –

132
8. EMPLOYEE BENEFITS (continued)
Principal actuarial assumptions at the reporting date (expressed as weighted averages):
CapespanGroup Ltd SACCE
Capespan Europe
CCNV Germany
28 February 2015Discount rate 0,5% 4,4% 1,2% 1,2%Future salary increases 1,0% 3,0% 3,5%Inflation 2,8% 2,0% 2,2%
28 February 2014Discount rate 0,8% 4,4% 3,3% 3,4%Future salary increases 1,0% 3,0% 3,5%Inflation 2,8% 2,0% 2,2%
Sensitivity analyses for each significant actuarial assumption (i.e. what impact would a change in the actuarial assumption have on the net defined benefit obligation):
Capespan Group Ltd Capespan Europe
Change in Change inassumption Increase Decrease assumption Increase Decrease
28 February 2015Discount rate 0,5% 899 (842) 0,5% 6 645 (6 630)Medical cost trends 1,0% (1 549) 1 726 1,0% (1 569) 3 970Mortality 1 year (1 173) 1 217 1 year (22 298) 21 726
28 February 2014Discount rate 0,5% 765 (817) 0,1% 5 150 (5 275)Inflation 1,0% (1 779) 1 587 0,1% (1 329) 3 502Medical cost trends 1,0% (1 325) 3 502Mortality 1 year (1 105) 1 064 1 year (14 645) 14 105

133
GROUP
2015 2014 2013R’000 R’000 R’000
9. BIOLOGICAL ASSETSBalance at beginning of year 200 568 31 264Subsidiaries acquired 144 106 69 074Exchange rate movement (1 335) 5 622 2 528Additions 172 577 135 640 30 879Harvests (231 617) (209 082) (99 920)Disposals (32 551)Depreciation (9 880) (8 581)Change in fair value due to biological transformation 144 019 134 150 28 703
Balance at end of year 274 332 200 568 31 264
Non-current biological assets – bearer plants 181 524 117 121 –
Orchards1 57 062 48 564Vineyards1 124 462 68 557
Current biological assets4 92 808 83 447 31 264
Maize2 24 127 6 396Soya2 24 797 33 567 31 264Orchards3 17 220 12 885Vineyards3 12 395 14 262Sugar cane3 14 269 16 337
274 332 200 568 31 2641 Bearer plants are carried at cost less accumulated depreciation and impairment losses.2 These current biological assets are valued at cost, since an insignificant level of biological transformation has taken place since
planting.3 These current biological assets, which comprise the grapes on the vineyards, fruit on the orchards and sugar cane have been
valued using the following assumptions:– expected sales realisation of all grapes and pome at free on board value for export fruit and net value for local sales;– budgeted costs to harvest and sell per the approved budget;– packing and cooling costs as per the approved budget; and– overheads directly attributable to the operation for the year.
4 The fair value of biological assets have been calculated using unobservable inputs (level 3).
GROUP
2015 2014 2013 R’000 R’000 R’000
10. INVENTORIESRaw materials 169 699 52 270 15 666Work in progress 8 148 3 996Finished goods 810 258 899 458 158 959
988 105 955 724 174 625
Inventory to the value of R8m (2014: R11m) (2013: Rnil) was written off during the year.

134
GROUP
2015 2014 2013 R’000 R’000 R’000
11. TRADE AND OTHER RECEIVABLESTrade receivables (Gross) 1 044 407 899 131 83 703Provision for impairment (18 967) (18 724) (345)Value added tax 42 031 41 672 3 421Prepayments and sundry receivables* 192 508 122 921 13 950
1 259 979 1 045 000 100 729
* Includes non-financial assets of R74m (2014: R5,4m) (2013:Rnil).
12. DERIVATIVE FINANCIAL ASSETS
Forward currency exchange contracts (refer note 36) 24 1 299
13. CASH, MONEY MARKET INVESTMENTS AND OTHER CASH EQUIVALENTSBank balances 347 478 632 261 390 417Money market fund 422 521 382 507 362 198
769 999 1 014 768 752 615
The money market fund earned interest at money market rates during the period under review. Money market funds are invested in highly liquid instruments with a weighted average maturity of less than 90 days.
14. NON-CURRENT ASSETS HELD FOR SALECarrying value at beginning of year 177 570 287 733Subsidiaries acquired 10 113Transfer from subsidiaries 30 378Transfer from investment in associates 311 195 295 063Net fair value gains 15 888 59 049 (7 330)Disposals (193 458) (490 520)
30 378 177 570 287 733
At 28 February 2014, non-current assets held for sale consisted mainly of JSE-listed Capevin Holdings Ltd shares, which was disposed of during the current year. At 28 February 2015, non-current assets held for sale consisted of a Capespan subsidiary, Addo Cold Storage (Pty) Ltd that were transferred from associates, following the succsesfull negotiations to sell the company with an effective date in 2015. Statement of financial position information are as follows:
Property, plant and equipment 29 998 Cash and cash equivalents 106 Net receivables 274
30 378

135
GROUP COMPANY
2015 2014 2013 2015 2014 2013R’000 R’000 R’000 R’000 R’000 R’000
15. STATED/SHARE CAPITALOrdinary sharesAuthorised
2 000 000 000 (2014: 2 000 000 000) ordinary shares with no par value (2013: 1 500 000 000 ordinary shares with a par value of 1 cent each) 15 000 15 000
Issued
1 443 843 985 (2014: 980 188 331) ordinary shares with no par value (2013: 978 088 517 ordinary shares with a par value of 1 cent each) 5 095 256 1 748 061 9 781 5 095 256 1 748 061 9 781
Cumulative, non-redeemable, non-participating preference sharesAuthorised
250 000 000 (2014: 250 000 000) shares with no par value (2013: 250 000 000 shares with a par value of 1 cent each) 2 500 2 500
During the 2014 year, the company converted its ordinary and preference shares to shares with no par value.
Share incentive schemes of subsidiaries Agrivision Africa
During the current and prior year, Agrivision Africa operated an equity-settled share incentive scheme. In terms of the scheme, share options were granted to executive directors and senior management. The total equity-settled share-based payment charge recognised in profit or loss amounted to R0,1m (2014: R1,6m) (2013: Rnil). This charge was credited to other reserves and non-controlling interest.Reconciliation of outstanding share options:
2015 2014 2013Number Number Number
Opening balance 46 213 84 024Number of share options granted during the year 3 060 84 024Number of share options forfeited during the year (37 811)
Closing balance 49 273 46 213 84 024
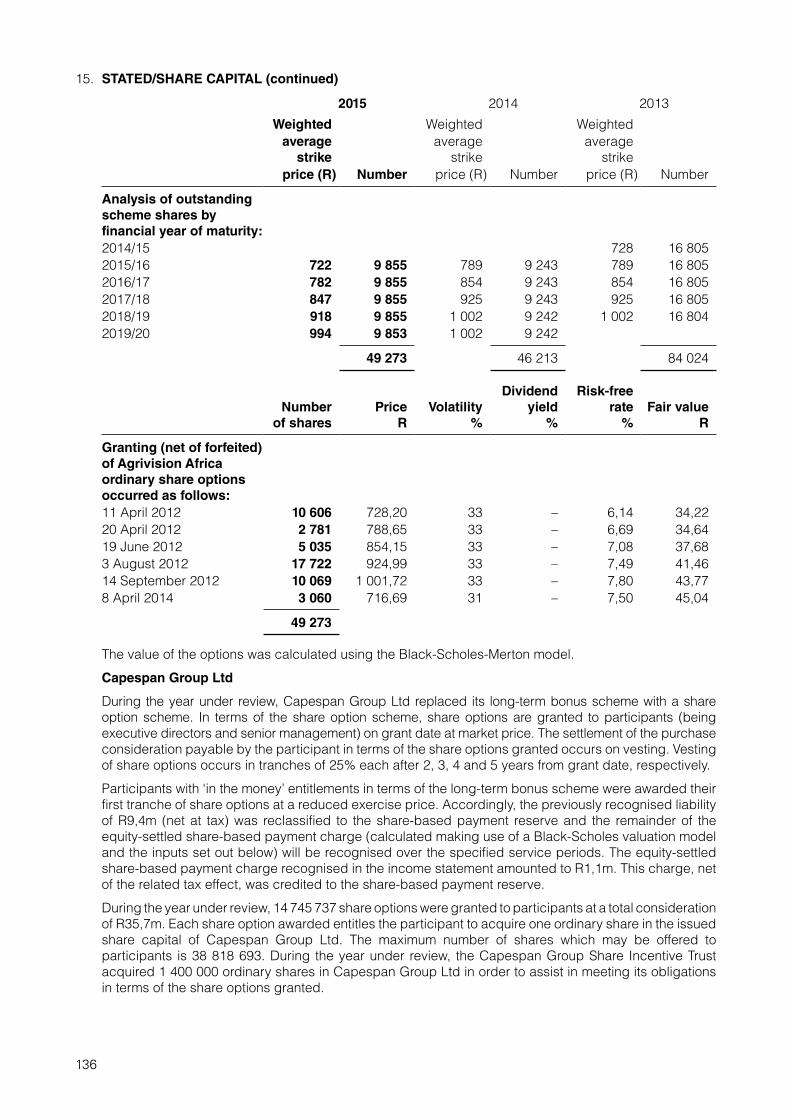
136
15. STATED/SHARE CAPITAL (continued)
2015 2014 2013
Weighted Weighted Weightedaverage
strikeaverage
strikeaverage
strikeprice (R) Number price (R) Number price (R) Number
Analysis of outstanding scheme shares by financial year of maturity: 2014/15 728 16 8052015/16 722 9 855 789 9 243 789 16 8052016/17 782 9 855 854 9 243 854 16 8052017/18 847 9 855 925 9 243 925 16 8052018/19 918 9 855 1 002 9 242 1 002 16 8042019/20 994 9 853 1 002 9 242
49 273 46 213 84 024
Number of shares
PriceR
Volatility%
Dividend yield
%
Risk-free rate
% Fair value
R
Granting (net of forfeited) of Agrivision Africa ordinary share options occurred as follows:11 April 2012 10 606 728,20 33 – 6,14 34,2220 April 2012 2 781 788,65 33 – 6,69 34,6419 June 2012 5 035 854,15 33 – 7,08 37,683 August 2012 17 722 924,99 33 – 7,49 41,4614 September 2012 10 069 1 001,72 33 – 7,80 43,778 April 2014 3 060 716,69 31 – 7,50 45,04
49 273
The value of the options was calculated using the Black-Scholes-Merton model.
Capespan Group Ltd
During the year under review, Capespan Group Ltd replaced its long-term bonus scheme with a share option scheme. In terms of the share option scheme, share options are granted to participants (being executive directors and senior management) on grant date at market price. The settlement of the purchase consideration payable by the participant in terms of the share options granted occurs on vesting. Vesting of share options occurs in tranches of 25% each after 2, 3, 4 and 5 years from grant date, respectively.
Participants with ‘in the money’ entitlements in terms of the long-term bonus scheme were awarded their first tranche of share options at a reduced exercise price. Accordingly, the previously recognised liability of R9,4m (net at tax) was reclassified to the share-based payment reserve and the remainder of the equity-settled share-based payment charge (calculated making use of a Black-Scholes valuation model and the inputs set out below) will be recognised over the specified service periods. The equity-settled share-based payment charge recognised in the income statement amounted to R1,1m. This charge, net of the related tax effect, was credited to the share-based payment reserve.
During the year under review, 14 745 737 share options were granted to participants at a total consideration of R35,7m. Each share option awarded entitles the participant to acquire one ordinary share in the issued share capital of Capespan Group Ltd. The maximum number of shares which may be offered to participants is 38 818 693. During the year under review, the Capespan Group Share Incentive Trust acquired 1 400 000 ordinary shares in Capespan Group Ltd in order to assist in meeting its obligations in terms of the share options granted.

137
15. STATED/SHARE CAPITAL (continued)
2015 Number
Reconciliation of outstanding share options:Number of share options granted during the year 14 745 737Number of share options forfeited during the year (906 344)
Closing balance 13 839 393
2015
Weightedaverage
strike price (R) Number
Analysis of outstanding scheme shares by financial year of maturity:
31 December 2016 2,36 3 459 84831 December 2017 2,36 3 459 84831 December 2018 2,36 3 459 84831 December 2019 2,36 3 459 849
13 839 393
Number of shares
PriceR
Volatility%
Dividend yield
%
Risk-free rate
% Fair value
R
Granting (net of forfeited) of Capespan Group Ltd ordinary share options occurred as follows:1 January 2014 2 256 798 0,99 31,2 4,4 6,1 – 7,3 2,071 January 2014 1 325 801 1,08 31,2 4,4 6,1 – 7,3 2,001 January 2014 2 636 918 1,45 31,2 4,4 6,1 – 7,3 1,721 January 2014 7 619 876 3,31 31,2 4,4 6,1 – 7,3 0,73
13 839 393
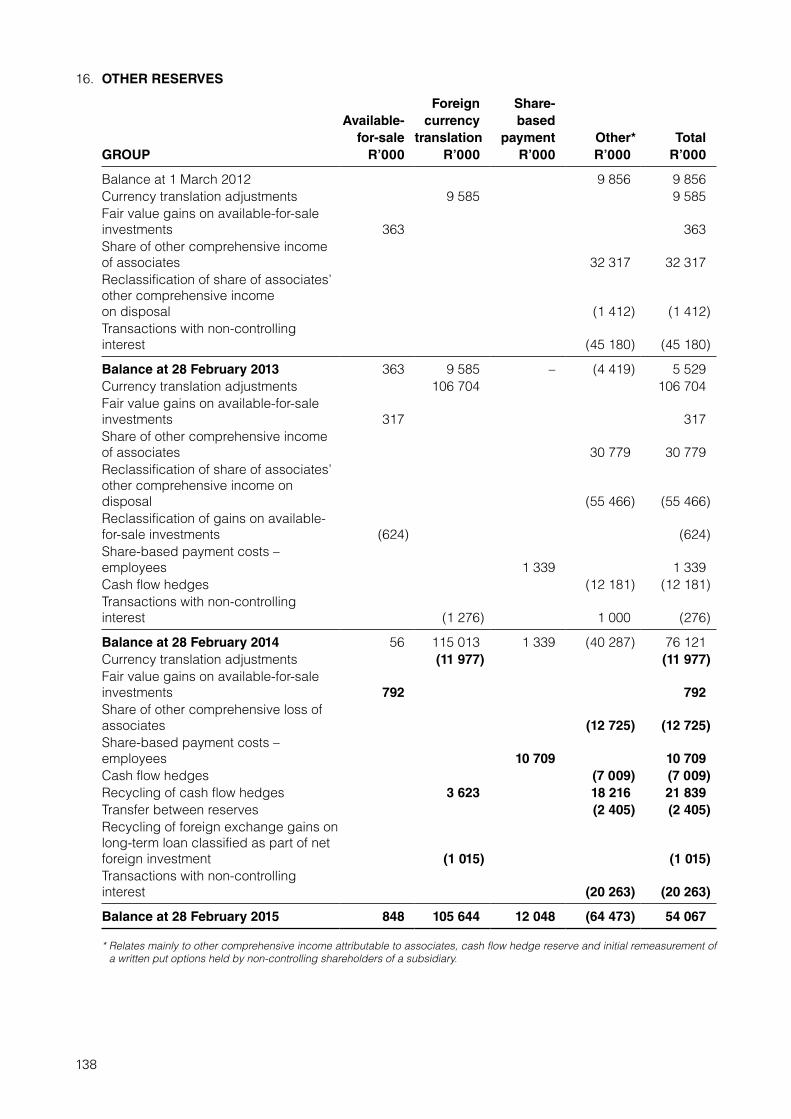
138
16. OTHER RESERVES
Foreign Share-Available- currency based
for-sale translation payment Other* TotalGROUP R’000 R’000 R’000 R’000 R’000
Balance at 1 March 2012 9 856 9 856Currency translation adjustments 9 585 9 585Fair value gains on available-for-sale investments 363 363Share of other comprehensive income of associates 32 317 32 317Reclassification of share of associates’ other comprehensive income on disposal (1 412) (1 412)Transactions with non-controlling interest (45 180) (45 180)
Balance at 28 February 2013 363 9 585 – (4 419) 5 529Currency translation adjustments 106 704 106 704Fair value gains on available-for-sale investments 317 317Share of other comprehensive income of associates 30 779 30 779Reclassification of share of associates’ other comprehensive income on disposal (55 466) (55 466)Reclassification of gains on available-for-sale investments (624) (624)Share-based payment costs – employees 1 339 1 339Cash flow hedges (12 181) (12 181)Transactions with non-controlling interest (1 276) 1 000 (276)
Balance at 28 February 2014 56 115 013 1 339 (40 287) 76 121Currency translation adjustments (11 977) (11 977)Fair value gains on available-for-sale investments 792 792Share of other comprehensive loss of associates (12 725) (12 725)Share-based payment costs – employees 10 709 10 709Cash flow hedges (7 009) (7 009)Recycling of cash flow hedges 3 623 18 216 21 839Transfer between reserves (2 405) (2 405)Recycling of foreign exchange gains on long-term loan classified as part of net foreign investment (1 015) (1 015)Transactions with non-controlling interest (20 263) (20 263)
Balance at 28 February 2015 848 105 644 12 048 (64 473) 54 067
* Relates mainly to other comprehensive income attributable to associates, cash flow hedge reserve and initial remeasurement of a written put options held by non-controlling shareholders of a subsidiary.

139
GROUP
2015 2014 2013R’000 R’000 R’000
17. DEFERRED INCOME TAXDeferred income tax assets 63 869 59 388Deferred income tax liabilities (105 627) (119 768) (53 895)
Net deferred income tax liability (41 758) (60 380) (53 895)
Deferred income tax assets
To be recovered after 12 months 63 869 59 388
Deferred income tax liabilitiesTo be recovered within 12 months (17 302)To be recovered after 12 months (105 627) (102 466) (53 895)
(105 627) (119 768) (53 895)
Intangibleassets
Unrealised and otherTax losses Provisions profits differences Total
GROUP R’000 R’000 R’000 R’000 R’000
Balance at 1 March 2012 (2 636) (2 636)Subsidiaries acquired 1 134 (258) (27 560) (26 684)Reversal of deferred tax on disposal of equity securities 3 830 3 830(Charged)/credited to profit and loss (328) (29 022) 1 841 (27 509)Charged to other comprehensive income (251) (251)Exchange rate movement (645) (645)
Balance at 28 February 2013 806 (28 337) (26 364) (53 895)Subsidiaries acquired 67 823 4 147 (3 519) (64 627) 3 824(Charged)/credited to profit and loss (17 373) 1 917 (4 444) (517) (20 417)(Charged)/credited to other comprehensive income (1 238) 193 (1 045)Exchange rate movement (1 526) (51) 12 730 11 153
Balance at 28 February 2014 50 450 5 344 (37 589) (78 585) (60 380)Subsidiaries acquired 1 116 (2 865) (25 242) (26 991)Credited/(charged) to profit and loss 4 794 (601) 32 138 9 505 45 836Credited to other comprehensive income 1 243 6 506 7 749Exchange rate movement 76 71 (8 119) (7 972)
Balance at 28 February 2015 56 360 1 954 (4 137) (95 935) (41 758)
Deferred income tax on temporary differences relating to equity securities that are classified as at fair value through profit or loss and available-for-sale, are calculated using the effective capital gains tax rate of 18,65% (2014: 18,65%) (2013: 18,67%). Deferred income tax was calculated on other temporary differences using the applicable tax rate as per the tax jurisdiction it relates to.

140
GROUP COMPANY
2015 2014 2013 2015 2014 2013R’000 R’000 R’000 R’000 R’000 R’000
18. BORROWINGSNon-currentSecured redeemable preference shares 300 000 300 000 300 000Secured loans 665 938 414 475 145 351Unsecured loans 4 000 24 058
969 938 738 533 445 351 – – –
CurrentSecured loans 213 684 76 021Unsecured loans 8 547 50 835 701 911 68 051 53 925Bank overdrafts 674 035 377 571Accrued preference dividends 6 107 6 107 9 146
902 373 459 699 59 981 701 911 68 051 53 925
Secured redeemable preference shares
The preference shares, issued by Zeder Financial Services Ltd, a wholly-owned subsidiary, are secured by investments in associates and subsidiaries with a market value of R6,2bn (2014: R3,0bn) (2013: R2,5bn), carry a fixed dividend rate of 8,11% nominal annual compounded monthly and are redeemable during September 2017.
Secured loans
The following significant borrowings are included in secured loans:
Capespan has a R100m (2014: R100m) (2013: Rnil) term loan from ABSA, which carries interest at prime less 1,5% and has fixed repayment terms.
Capespan has a R16m (2014: Rnil) (2013: Rnil) loan from Afgri Operations Ltd, which carries interest at prime and is secured by anotarial bond over equipment and a covering bond over property.
Zaad has a R134m (2014: R50m) (2013: Rnil) term loan from FNB, which carries interest at prime less 1,25%. The balance will be settled with annual repayments of approximately R10m each, commencing July 2014 and is secured by a general covering mortgage bond of R59,3m over the Zaad fixed properties (refer note 1).
Zaad has a R19m (2014: Rnil) (2013: Rnil) loan from Gro Capital Financial Services (Pty) Ltd. The balance is secured by a continuing covering mortgage bond of R27,4m over the Zaad fixed properties (refer note 1).
Agrivision Africa has an United States dollar-denominated loan from the African Agriculture and Trade Investment Fund of R116m (2014: R107m) (2013: Rnil), which carries a fixed interest rate of 5,75% and an additional charge payable if Agrivision Africa’s gross profit exceeds a specified threshold. The loan plus accrued interest will be settled with two repayments in October 2015 and 2016. This loan is secured by farms of Chobe Agrivision, with a carrying value of R75m (refer note 1).
Agrivision Africa also has an United States dollar-denominated loan from Stanbic of R230m (2014: R87m) (2013: Rnil), which amortises over a period of five years with semi-annual repayments. Agrivision Africa’s investment in Somawhe Estates and Mpongwe Milling serves as security for the loan.
Unsecured loan
The group’s unsecured loan, held through Agrivision Africa, related to a 90-day loan from Stanbic Mauritius, which carried interest at Libor plus 3%. The company’s unsecured loan is from Zeder Financial Services Ltd, a wholly-owned subsidiary. The loan is interest-free and repayable on demand. Also included is a unsecured loan, held through Capespan, relating to a R100m term loan and carried interest at JIBAR plus 2,1%.
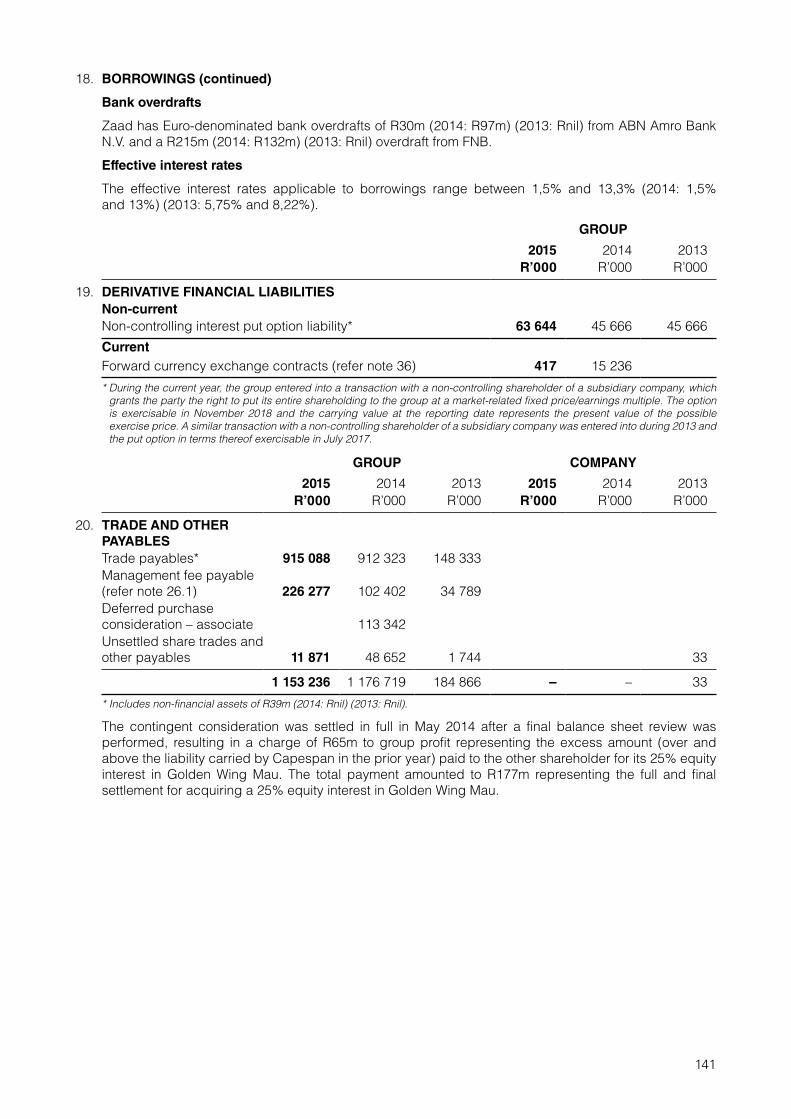
141
18. BORROWINGS (continued)
Bank overdrafts
Zaad has Euro-denominated bank overdrafts of R30m (2014: R97m) (2013: Rnil) from ABN Amro Bank N.V. and a R215m (2014: R132m) (2013: Rnil) overdraft from FNB.
Effective interest rates
The effective interest rates applicable to borrowings range between 1,5% and 13,3% (2014: 1,5% and 13%) (2013: 5,75% and 8,22%).
GROUP
2015 2014 2013R’000 R’000 R’000
19. DERIVATIVE FINANCIAL LIABILITIESNon-currentNon-controlling interest put option liability* 63 644 45 666 45 666
CurrentForward currency exchange contracts (refer note 36) 417 15 236
* During the current year, the group entered into a transaction with a non-controlling shareholder of a subsidiary company, which grants the party the right to put its entire shareholding to the group at a market-related fixed price/earnings multiple. The option is exercisable in November 2018 and the carrying value at the reporting date represents the present value of the possible exercise price. A similar transaction with a non-controlling shareholder of a subsidiary company was entered into during 2013 and the put option in terms thereof exercisable in July 2017.
GROUP COMPANY
2015 2014 2013 2015 2014 2013R’000 R’000 R’000 R’000 R’000 R’000
20. TRADE AND OTHER PAYABLESTrade payables* 915 088 912 323 148 333Management fee payable (refer note 26.1) 226 277 102 402 34 789Deferred purchase consideration – associate 113 342Unsettled share trades and other payables 11 871 48 652 1 744 33
1 153 236 1 176 719 184 866 – – 33
* Includes non-financial assets of R39m (2014: Rnil) (2013: Rnil).
The contingent consideration was settled in full in May 2014 after a final balance sheet review was performed, resulting in a charge of R65m to group profit representing the excess amount (over and above the liability carried by Capespan in the prior year) paid to the other shareholder for its 25% equity interest in Golden Wing Mau. The total payment amounted to R177m representing the full and final settlement for acquiring a 25% equity interest in Golden Wing Mau.

142
GROUP COMPANY
2015 2014 2013 2015 2014 2013R’000 R’000 R’000 R’000 R’000 R’000
21. REVENUEAgricultural produce 8 107 208 5 376 678 328 113Logistical services 584 760 600 830
8 691 968 5 977 508 328 113 – – –
22. COST OF SALESChanges in finished goods 7 119 669 5 052 305 171 440Raw material and consumables used 294 519 129 543 50 673Transportation expenses 4 427 16 385 7 896Commission 5 179 6 300 4 428
7 423 794 5 204 533 234 437 – – –
23. INVESTMENT INCOMEInterest income 68 675 52 275 7 258 – – –Loans and advances 7 062 4 537Trade and other receivables 19 799 2 121Cash and short-term funds 61 594 46 939 5 137
Dividend income 6 173 13 579 5 844 151 380 25 000 50 000
Equity securities held at fair value through profit or loss 3 788 3 496 4 662Equity securities held as available-for-sale 26 140 52Non-current assets held for sale 2 359 9 943Preference share investment in associate 1 130Subsidiary company 151 380 25 000 50 000
74 848 65 854 13 102 151 380 25 000 50 000

143
GROUP
2015 2014 2013R’000 R’000 R’000
24. FAIR VALUE GAINS AND LOSSESUnrealised net fair value gains/(losses)Equity securities – at fair value through profit or loss 97 894 (12 352) 18 573Fair value gain on step-up acquisition of an associate and joint venture to a subsidiary 3 295 17 205 22 023Net foreign exchange (loss)/gains (19 082) 7 566 161Loss on derivative financial instruments 4 777 (906)Non-current asset held for sale (refer note 14) 59 049 (7 330)Fair value loss on contingent consideration adjustment (65 657)
Realised net fair value gains and lossesEquity securities – at fair value through profit or loss 58 481Non-current asset held for sale 16 490 14 004
37 717 143 953 32 521
25. OTHER OPERATING INCOMEManagement and other fee income 3 046 1 818 1 924Profit on sale of property, plant and equipment 4 411 336 1 839Bad debts recovered 780 1 628Reversal of impairment on property, plant and equipment 11 893Gain on bargain purchase 7 414Profit on disposal of available-for-sale financial assets 3 559Recoveries 16 103Sundry income 4 922 5 146 1 717
44 714 16 342 5 480
26. EXPENSES26.1 Management fees
Base fee expense 117 757 59 022 58 560Performance fee expense 117 757 59 022
235 514 118 044 58 560
The base and performance fees are payable to PSG Corporate Services (Pty) Ltd (“PSGCS”), a subsidiary of PSG Group, the company’s ultimate holding company, in terms of a management agreement. In accordance with the management agreement, PSGCS provides management services, including corporate secretarial, advisory, investment and financial services and all related aspects thereto to the Zeder group of companies.
The base management fee is calculated at the end of every half-year as 1,5% p.a. (exclusive of VAT) of the company’s volume weighted average market capitalisation for that half-year. The performance management fee is calculated at the end of the financial year as 20% p.a. on the company’s share price outperformance of the GOVI (comprising the most liquid government bonds, being the government bonds within the top 10 of the All Bond Index) yield plus 4%, adjusted for dividends (“hurdle price”). The performance management fee pertaining to a financial year may not exceed that year’s base management fee. If the performance management fee exceeds the base management fee, the excess performance management fee is carried forward to the following financial year, by adjusting the hurdle price of the following year accordingly. The excess performance management fee at year-end amounted to R634m (2014: R21m) (2013: Rnil). Consequently, the starting hurdle share price at 1 March 2015 is R4,95 (2014: R3,99) (2013: Rnil)).
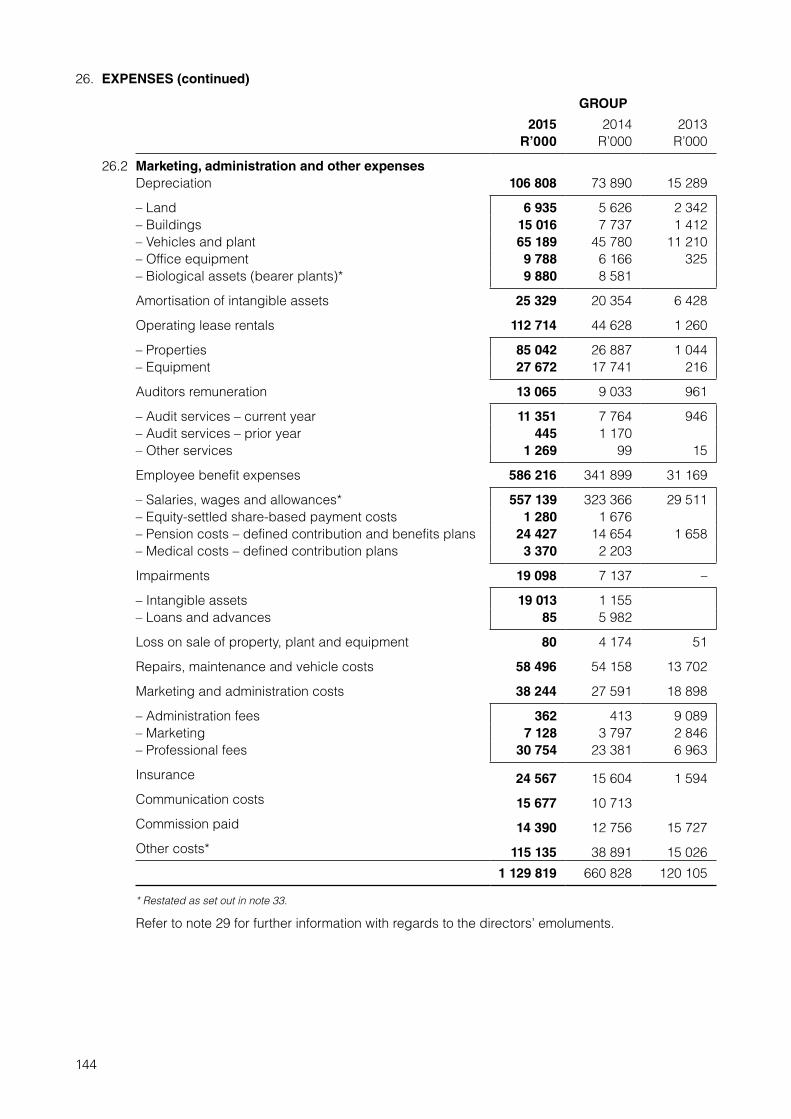
144
26. EXPENSES (continued)
GROUP
2015 2014 2013R’000 R’000 R’000
26.2 Marketing, administration and other expensesDepreciation 106 808 73 890 15 289
– Land 6 935 5 626 2 342– Buildings 15 016 7 737 1 412– Vehicles and plant 65 189 45 780 11 210– Office equipment 9 788 6 166 325– Biological assets (bearer plants)* 9 880 8 581
Amortisation of intangible assets 25 329 20 354 6 428
Operating lease rentals 112 714 44 628 1 260
– Properties 85 042 26 887 1 044– Equipment 27 672 17 741 216
Auditors remuneration 13 065 9 033 961
– Audit services – current year 11 351 7 764 946– Audit services – prior year 445 1 170– Other services 1 269 99 15
Employee benefit expenses 586 216 341 899 31 169
– Salaries, wages and allowances* 557 139 323 366 29 511– Equity-settled share-based payment costs 1 280 1 676– Pension costs – defined contribution and benefits plans 24 427 14 654 1 658– Medical costs – defined contribution plans 3 370 2 203
Impairments 19 098 7 137 –
– Intangible assets 19 013 1 155– Loans and advances 85 5 982
Loss on sale of property, plant and equipment 80 4 174 51
Repairs, maintenance and vehicle costs 58 496 54 158 13 702
Marketing and administration costs 38 244 27 591 18 898
– Administration fees 362 413 9 089– Marketing 7 128 3 797 2 846– Professional fees 30 754 23 381 6 963
Insurance 24 567 15 604 1 594
Communication costs 15 677 10 713
Commission paid 14 390 12 756 15 727
Other costs* 115 135 38 891 15 026
1 129 819 660 828 120 105
* Restated as set out in note 33.
Refer to note 29 for further information with regards to the directors’ emoluments.

145
GROUP COMPANY
2015 2014 2013 2015 2014 2013R’000 R’000 R’000 R’000 R’000 R’000
27. FINANCE COSTSRedeemable preference shares 24 676 24 681 30 992Secured loans 40 157 18 213Unsecured loan 20 812 17 042Bank overdrafts 49 604 25 585PSG Corporate Services (Pty) Ltd bridging loan 3 797Amortisation of structuring fee 1 192Other 7 615 441 1 218
142 864 85 962 37 199 – – –PSG Corporate Services (Pty) Ltd is a fellow subsidiary of the group. Interest was calculated on outstanding balances at market related rates.
28. TAXATIONCurrent taxation– Current year 55 634 48 824 71 516– Prior year 3 402 51 3 000Deferred taxation– Current year (42 231) 24 591 23 455Foreign current taxation– Current year 64 089 35 394 723Foreign deferred taxation– Current year (3 605) (4 174) 224
77 289 104 686 95 918 3 000 – –
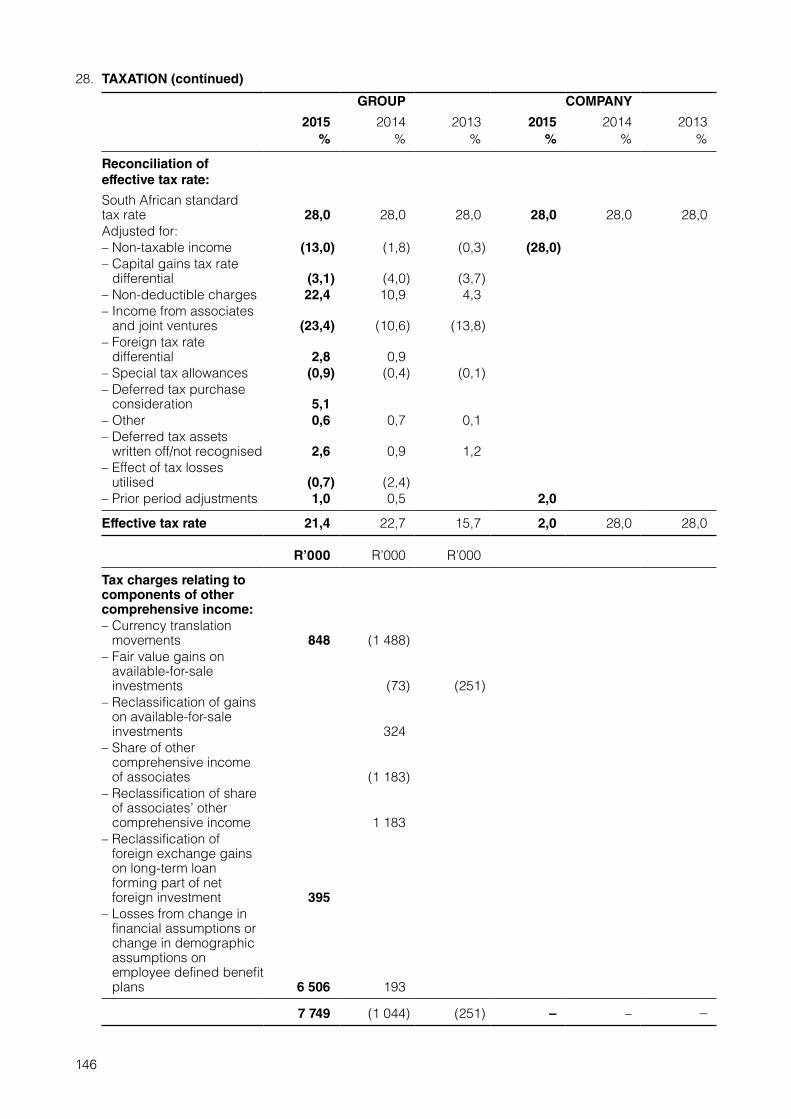
146
GROUP COMPANY
2015 2014 2013 2015 2014 2013% % % % % %
Reconciliation of effective tax rate:
South African standard tax rate 28,0 28,0 28,0 28,0 28,0 28,0Adjusted for:– Non-taxable income (13,0) (1,8) (0,3) (28,0)– Capital gains tax rate
differential (3,1) (4,0) (3,7)– Non-deductible charges 22,4 10,9 4,3– Income from associates
and joint ventures (23,4) (10,6) (13,8)– Foreign tax rate
differential 2,8 0,9– Special tax allowances (0,9) (0,4) (0,1)– Deferred tax purchase
consideration 5,1– Other 0,6 0,7 0,1– Deferred tax assets
written off/not recognised 2,6 0,9 1,2– Effect of tax losses
utilised (0,7) (2,4)– Prior period adjustments 1,0 0,5 2,0
Effective tax rate 21,4 22,7 15,7 2,0 28,0 28,0
R’000 R’000 R’000
Tax charges relating to components of other comprehensive income:– Currency translation
movements 848 (1 488)– Fair value gains on
available-for-sale investments (73) (251)
– Reclassification of gains on available-for-sale investments 324
– Share of other comprehensive income of associates (1 183)
– Reclassification of share of associates’ other comprehensive income 1 183
– Reclassification of foreign exchange gains on long-term loan forming part of net foreign investment 395
– Losses from change in financial assumptions or change in demographic assumptions on employee defined benefit plans 6 506 193
7 749 (1 044) (251) – – –
28. TAXATION (continued)
147
29. RELATED-PARTY TRANSACTIONS AND BALANCES
The following related parties were identified with which the company and/or group transacted during the year, and/or balances were outstanding at year-end:
Party Relationship
PSG Group Ltd Ultimate holding company
Zeder Financial Services Ltd Wholly-owned subsidiary
Zeder Investments Corporate Services (Pty) Ltd Wholly-owned subsidiary of Zeder Financial Services Ltd
Zeder Africa (Pty) Ltd Wholly-owned subsidiary of Zeder Financial Services Ltd
Chayton Corporate Services (Pty) Ltd Wholly-owned subsidiary of Zeder Investments Corporate Services (Pty) Ltd
PSG Corporate Services (Pty) Ltd Fellow subsidiary of ultimate holding company
PSG Online Securities (Pty) Ltd Fellow subsidiary of ultimate holding company
PSG Money Market Fund Fellow subsidiary of ultimate holding company
Related-party transactions during the year included dividends received from associates (refer note 4), the management fee expense (refer note 26.1), professional fees, interest income (refer note 26.2) and interest paid (refer note 27).
Included in the group’s interest income (refer note 23) is R82 000 (2014: R818 000) (2013: R407 000) received from PSG Online Securities and R15 756 000 (2014: R18 681 000) (2013: R955 000) received from PSG Money Market Fund.
Included in the group’s marketing, administration and other expenses is professional fees of R786 000 (2014: R5 208 000) (2013: R5 276 000) paid to PSG Corporate Services for corporate finance and tax services relating to acquisitions made during the year.
Brokerage and administration fees of R15 000 (2014: R15 000) (2013: R1 082 000) were incurred with PSG Online Securities during the year. These fees related to trades that took place via the group’s share trading accounts.
The group previously entered into a written put agreement with AE Jacobs, who is a non-executive director of the company, forms part of the group’s key management personnel, and is also a non-controlling shareholder in a subsidiary of the group. The agreement grants him the right to sell his non-controlling interest to the group at a market-related fixed multiple in 2017 (refer note 19).
Included in revenue are goods sold by Zaad to Kaap Agri amounting to R18 512 000 (2014: R11 907 000) (2013: Rnil) and to Pioneer Foods amounting to R3 150 000 (2014: Rnil) (2013: Rnil) (refer note 21).
Included in cost of goods sold are consumables purchased by Agrivision Africa from Kaap Agri amounting to R5 491 000 (2014: R3 193 000) (2013: Rnil) and by Zaad from Kaap Agri amounting to R1 006 000 (2014: Rnil) (2013: Rnil) (refer note 22).
Included in investment in ordinary shares of associates is R5 728 000 paid to PSG Capital for professional fees and R111 000 paid to Grayston Elliot for tax services in respect of the group’s aformentioned acquisition of the outstanding shares in Agri Voedsel not already held by the group in exchange for Zeder shares (refer note 4).
Related-party balances outstanding at the reporting date included cash invested with PSG Money Market Fund amounting to R337 781 000 (2014: R382 507 000) (2013: R362 198) (refer note 13) and the management fee payable (refer note 20).
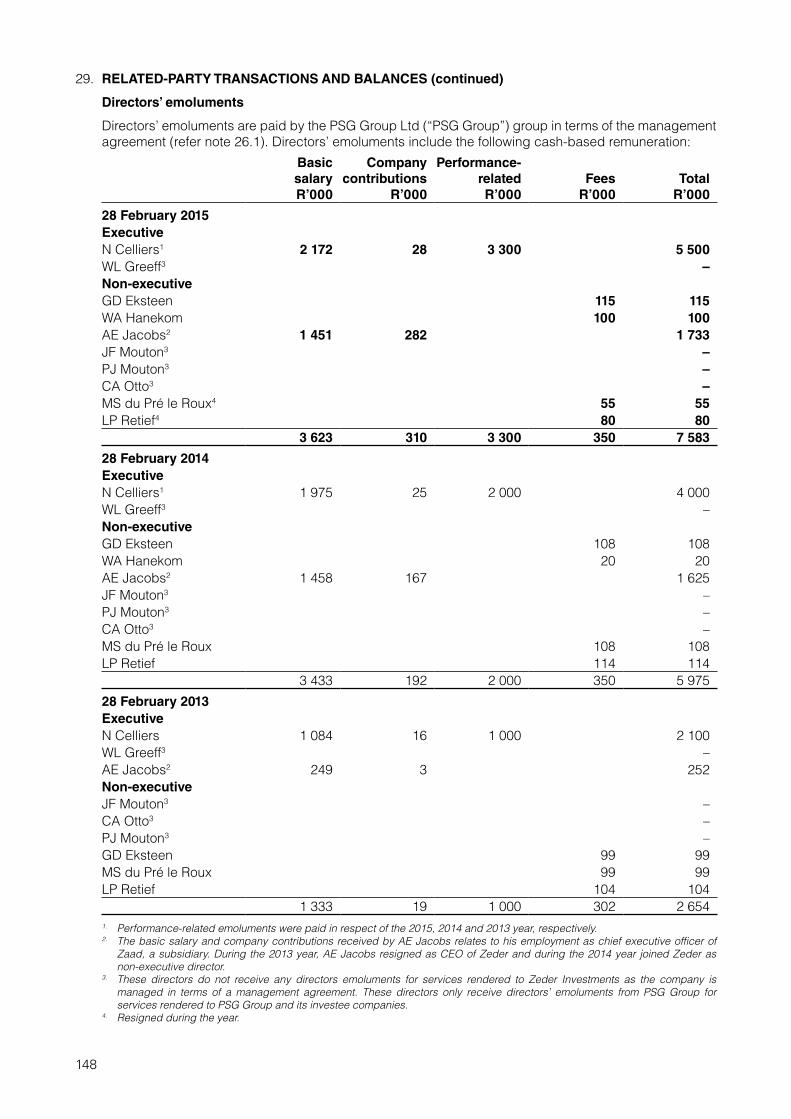
148
29. RELATED-PARTY TRANSACTIONS AND BALANCES (continued)
Directors’ emoluments
Directors’ emoluments are paid by the PSG Group Ltd (“PSG Group”) group in terms of the management agreement (refer note 26.1). Directors’ emoluments include the following cash-based remuneration:
Basic salary R’000
Company contributions
R’000
Performance- related R’000
Fees R’000
Total R’000
28 February 2015ExecutiveN Celliers1 2 172 28 3 300 5 500WL Greeff3 –Non-executiveGD Eksteen 115 115WA Hanekom 100 100AE Jacobs2 1 451 282 1 733JF Mouton3 –PJ Mouton3 –CA Otto3 –MS du Pré le Roux4 55 55LP Retief4 80 80
3 623 310 3 300 350 7 583
28 February 2014ExecutiveN Celliers1 1 975 25 2 000 4 000WL Greeff3 –Non-executiveGD Eksteen 108 108WA Hanekom 20 20AE Jacobs2 1 458 167 1 625JF Mouton3 –PJ Mouton3 –CA Otto3 –MS du Pré le Roux 108 108LP Retief 114 114
3 433 192 2 000 350 5 975
28 February 2013ExecutiveN Celliers 1 084 16 1 000 2 100WL Greeff3 –AE Jacobs2 249 3 252Non-executiveJF Mouton3 –CA Otto3 –PJ Mouton3 –GD Eksteen 99 99MS du Pré le Roux 99 99LP Retief 104 104
1 333 19 1 000 302 2 6541. Performance-related emoluments were paid in respect of the 2015, 2014 and 2013 year, respectively.2. The basic salary and company contributions received by AE Jacobs relates to his employment as chief executive officer of
Zaad, a subsidiary. During the 2013 year, AE Jacobs resigned as CEO of Zeder and during the 2014 year joined Zeder as non-executive director.
3. These directors do not receive any directors emoluments for services rendered to Zeder Investments as the company is managed in terms of a management agreement. These directors only receive directors’ emoluments from PSG Group for services rendered to PSG Group and its investee companies.
4. Resigned during the year.

149
29. RELATED-PARTY TRANSACTIONS AND BALANCES (continued)
Directors’ emoluments (continued)
The company’s prescribed officers include members of PSG Group’s executive committee, which manages the group (as further discussed in the corporate governance section of Zeder’s annual report), and whose remuneration is disclosed in PSG Group’s annual report.
In addition to the cash-based remuneration above, share options have been awarded to Mr N Celliers, the cost of which is carried by PSG Group in terms of the aforementioned management agreement. The cost (determined using an option pricing model) of the share options awarded amounted to R2,7m (2014: R0,9m) for the year.
During the year under review, Mr N Celliers exercised 775 581 (2014: nil) (2013: nil) Zeder and 21 924 (2014: nil) (2013: nil) PSG Group share options at weighted average strike prices of R2,90 and R51,31, respectively. The average market prices on vesting date were R5,73 for the Zeder share options and R126,40 for the PSG Group share options.
Awarded share options will vest as follows:
Number of shares Zeder PSG Group
28 February 2015
FY16 2 024 057 16 039FY17 2 155 380 18 506FY18 2 155 380 10 591FY19 1 379 797 4 493FY20 131 323 2 465
Total 7 845 937 52 094
28 February 2014FY15 775 581 14 011FY16 882 593 15 768FY17 882 593 15 768FY18 882 593 15 768FY19 107 013 1 756
Total 3 530 373 63 071
The weighted average strike price per share for the aforementioned Zeder and PSG Group share options is R3,99 (2014: R3,05) (2013: R2,90) and R74,86 (2014: R56,84) (2013: R53,53), respectively.
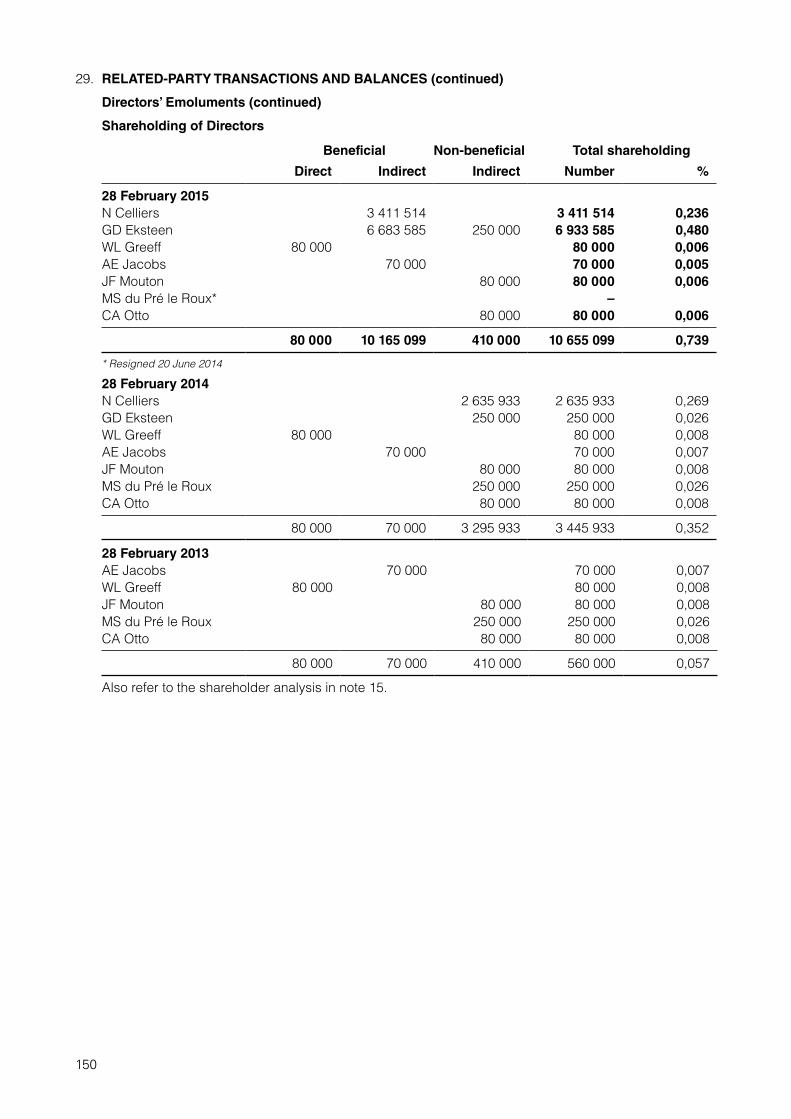
150
29. RELATED-PARTY TRANSACTIONS AND BALANCES (continued)
Directors’ Emoluments (continued)
Shareholding of Directors
Beneficial Non-beneficial Total shareholding
Direct Indirect Indirect Number %
28 February 2015N Celliers 3 411 514 3 411 514 0,236GD Eksteen 6 683 585 250 000 6 933 585 0,480WL Greeff 80 000 80 000 0,006AE Jacobs 70 000 70 000 0,005JF Mouton 80 000 80 000 0,006MS du Pré le Roux* –CA Otto 80 000 80 000 0,006
80 000 10 165 099 410 000 10 655 099 0,739
* Resigned 20 June 2014
28 February 2014N Celliers 2 635 933 2 635 933 0,269GD Eksteen 250 000 250 000 0,026WL Greeff 80 000 80 000 0,008AE Jacobs 70 000 70 000 0,007JF Mouton 80 000 80 000 0,008MS du Pré le Roux 250 000 250 000 0,026CA Otto 80 000 80 000 0,008
80 000 70 000 3 295 933 3 445 933 0,352
28 February 2013AE Jacobs 70 000 70 000 0,007WL Greeff 80 000 80 000 0,008JF Mouton 80 000 80 000 0,008MS du Pré le Roux 250 000 250 000 0,026CA Otto 80 000 80 000 0,008
80 000 70 000 410 000 560 000 0,057
Also refer to the shareholder analysis in note 15.

151
GROUP2015 2014 2013
R’000 R’000 R’000
30. CAPITAL COMMITMENTS AND CONTINGENCIES
Operating lease commitmentsOperating leases – premises– Due within 1 year 89 239 69 396 837– Due within 1 to 5 years 380 776 313 519 292– Due after more than 5 years 514 418 466 259
984 433 849 174 1 129
Operating leases – vehicles and plant– Due within 1 year 19 827 6 586– Due within 1 to 5 years 30 400 8 755
50 227 15 341 –
Operating leases – equipment– Due within one year 6 633 17 378 64– Due within 1 to 5 years 9 659 22 761 52
16 292 40 139 116
Capital expenditure commitmentsProperty, plant and equipment authorised but not yet contracted 580 703 53 369
Property, plant and equipment contracted 8 643 33 098

152
GROUP2015 2014 2013
R’000 R’000 R’000
31. NOTES TO THE STATEMENTS OF CASH FLOWS
31.1 Cash (utilised by)/generated from operations
Profit before taxation 361 035 461 194 605 481Interest income (68 675) (52 275) (7 258)Dividend income (6 173) (13 579) (5 844)Finance costs 142 864 85 962 37 199Depreciation 106 808 73 890 15 289Amortisation 25 329 20 354 6 428Net profit on sale of property, plant and equipment (4 331) 3 838 (1 788)Net fair value gains (122 456) (143 953) (32 521)Change in fair value of biological assets (144 019) (134 150) (28 703)Impairments 7 337 28 558Net gain on disposal of investment in associates 3 836 (502 890)Share of profits of associates (299 892) (218 011) (300 249)Net loss on dilution of interest in associate 155 276Profit on the sale of Investments (3 559)Equity-settled share based payment costs 1 280 1 676Contingent consideration adjustment 65 657Net harvest short term biological assets 43 484 6 697Non-cash translation movements* 19 082 (11 431) 8 912
Sub-total 123 771 112 606 (50 668)Changes in working capital (199 470) 188 036 85 420
(Decrease)/increase in trade and other payables (52 929) 165 920 73 071(Increase)/decrease in trade and other receivables (253 779) 88 863 24 089Decrease in inventories 180 795 24 786 19 139Increase in biological assets (73 764) (128 860) (30 879)Employee benefits 207 37 327
(75 699) 300 642 34 752
* Relates mainly to the foreign exchange rate movements on borrowings and working capital.
31.2 Taxation paidCurrent taxation charged to profit or loss (123 125) (84 269) (72 239)Movement in net taxation liability 14 121 (217) (20 229)
(109 004) (84 486) (92 468)
153
31. NOTES TO THE STATEMENTS OF CASH FLOWS (continued)
31.3 Subsidiaries acquired
2015 acquisitions
Mpongwe Milling (2009) Ltd (“Mpongwe Milling”)
During April 2014, the group, through Agrivision Africa (previously Chayton Africa), acquired the entire issued share capital of Mpongwe Milling, a maize and wheat mill operating in the Copperbelt province of Zambia, for a Zambian kwatcha-denominated cash consideration of R307,6m. Mpongwe Milling compliments the group’s existing farming operations in Zambia and the acquisition provides the group with an opportunity to expand its product offering across the value chain. Goodwill arose in respect of, inter alia, synergies pertaining to the procurement and marketing functions of the mill and farming operations. Accounting for Mpongwe Milling’s business combination has now been finalised.
Animalzone (Pty) Ltd (“Animalzone”)
During July 2014, the group, through Zaad Holdings Ltd, acquired the remaining 50% shareholding not yet held in Animalzone (name has since been changed to Agricol Niche Brands (Pty) Ltd), previously a joint venture, for a nominal cash consideration of R1. Animalzone manufactures seed-based pet food and goodwill arose in respect of, inter alia, expected synergies and its growth potential. Accounting for Animalzone’s business combination has now been finalised. The remeasurement of the previously held interest in the joint venture resulted in a non-headline gain of R3,2m. The goodwill was subsequently impaired in full following management’s reassessment of same.
Gestao de Terminais SA
During October 2014, the group, through Capespan Group Ltd, increased its shareholding in Gestao de Terminais SA, previously an associate by 10% to 50%, for a cash consideration of R7,3m. Gestao de Terminais SA operates a customs terminal in Mozambique. Accounting for Gestao de Terminais SA’s business combination has been finalised.

154
31. NOTES TO THE STATEMENTS OF CASH FLOWS (continued)
31.3 Subsidiaries acquired (continued)
2015 acquisitions (continued)
The summarised assets and liabilities recognised at acquisition date were:
GROUP
Mpongwe Milling R’000
Animalzone R’000
Gestao de Terminais SA
R’000Total
R’000
Property, plant and equipment 118 960 1 399 53 112 173 471Intangible assets 8 653 1 070 9 723Deferred income tax assets 944 944Inventories 26 527 571 27 098Trade and other receivables 23 819 765 14 216 38 800Current income tax receivable 81 81Cash, money market investments and other cash equivalents 13 606 2 2 997 16 605Borrowings (6 650) (9 604) (25 003) (41 257)Deferred income tax liabilities (27 635) (300) (27 935)Trade and other payables (3 774) (676) (24 996) (29 446)Current income tax payables (1 097) (1 097)
Total identifiable net assets/(liabilities) 152 409 (5 829) 20 407 166 987Non-controlling interest (5 190) (5 190)Derecognition of investment in ordinary shares of associates and joint ventures (124) (7 946) (8 070)Goodwill recognised 155 188 5 953 161 141
Total consideration 307 597 – 7 271 314 868
Cash consideration paid (307 597) (7 271) (314 868)Bank overdraft acquired (included in borrowings) (1 970) (1 970)Cash and cash equivalents acquired 13 606 2 2 997 16 605
Net cash outflow from business combination (293 991) (1 968) (4 274) (300 233)
The aforementioned business combinations do not contain any contingent consideration or indemnification asset arrangements.
Had Mpongwe Milling, Animalzone and Gestao de Terminais SA been consolidated with effect from 1 March 2014 instead of their respective acquisition dates, the consolidated income statement would have reflected additional revenue of R248m and profit after tax of R7m.
2014 acquisitions
Capespan Group Ltd (“Capespan”)
During the prior year, the group acquired a further 25,3% shareholding in Capespan and thereby increased its interest to 71,1%. At the prior reporting date, the group held 72,1% in Capespan, which is a global fruit procurement company and South Africa’s largest fruit exporter. The remeasurement of the previously held interest in an associated company resulted in a non-headline gain of R16,1m being recognised in net fair value gains in the income statement.
Klein Karoo Seed Marketing (Pty) Ltd (“KKS”)
The group, through Zaad, acquired the remaining 51% of KKS on 31 October 2013. The remeasurement of the previously held interest in the associate resulted in a non-headline gain of R1,1m being recognised in net fair value gains in the income statement. KKS is a seed company that develops and distributes vegetable, pasture and agronomic seed in developing countries, mainly throughout Africa and the Middle East. KKS has offices and research stations in, inter alia, South Africa, Zambia, Zimbabwe, Jordan and the Netherlands.

155
31. NOTES TO THE STATEMENTS OF CASH FLOWS (continued)
31.3 Subsidiaries acquired (continued)
2014 acquisitions (continued)
The summarised assets and liabilities recognised at acquisition date were:
GROUPCapespan
R’000KKS
R’000Total
R’000
Property, plant and equipment 308 295 124 477 432 772Biological assets 144 106 144 106Intangible assets 58 112 70 824 128 936Investment in associates 181 047 181 047Loans to and preference share investments in associates 9 274 9 274Equity securities 6 190 6 190Loans and advances 64 390 4 346 68 736Derivative financial assets 57 57Deferred tax assets 59 295 1 114 60 409Current income tax receivable 19 583 19 583Inventories 105 734 319 575 425 309Trade and other receivables 973 284 147 421 1 120 705Cash and cash equivalents 350 304 1 365 351 669Non-current assets held for sale 10 113 10 113Borrowings (538 666) (371 907) (910 573)Deferred income tax liabilities (36 195) (12 792) (48 987)Net employee benefits (122 333) (4 815) (127 148)Current income tax payable (14 889) (1 024) (15 913)Trade and other payables (638 823) (91 690) (730 513)
Total identifiable net assets 929 547 196 225 1 125 772Non-controlling interest (268 563) (34 245) (302 808)Previously held investment at fair value (403 004) (100 995) (503 999)Goodwill 69 065 69 065
Total consideration 257 980 130 050 388 030
Cash consideration paid (257 980) (130 050) (388 030)Cash and cash equivalents acquired 350 304 1 365 351 669
Net cash inflow/(outflow) from business combination 92 324 (128 685) (36 361)
Acquisition costs of R4,2m were incurred with the above business combinations, which are included in marketing, administration and other expenses in the income statement.
Had Capespan and KKS been consolidated with effect from 1 March 2013 instead of their acquisition dates, the group income statement would have reflected additional revenue of R1,9bn and profit of R9m for the prior year.
2013 acquisitions
Agricol Holdings Ltd (“Agricol”)
On 28 March 2012, the group acquired the remaining 74,9% of the issued share capital in Agricol (name has since been changed to Zaad Holdings Ltd) for a cash consideration of R150m. Agricol is incorporated in South Africa and its activities include plant breeding, production, international trade, processing and distribution of seed. The identifiable net assets acquired amounted to R149m, with goodwill amounting to R52m. Zeder’s initial 25,1% interest in Agricol was remeasured to its fair value of R50m, which resulted in a gain of R22m (refer note 24). In July 2012 the group sold 8% of its stake in Agricol to a non-controlling shareholder, leaving the group with a 92% shareholding at the reporting date.

156
31. NOTES TO THE STATEMENTS OF CASH FLOWS (continued)
31.3 Subsidiaries acquired 2015 acquisitions (continued)
2013 acquisitions (continued)
Chayton Africa (“Chayton”)
On 10 April 2012, Zeder acquired 100% of the issued share capital in Chayton (name has since been changed to Agrivision Africa), a company incorporated in Mauritius, which operate as a holding company for farming operations in Zambia. A cash consideration of R24m was paid for Chayton’s identifiable net liabilities of R4m, resulting in the recognition of R28m in goodwill. Subsequently, Zeder invested an additional R253m cash in Chayton and held a 73,4% interest in the company at the reporting date.
Somawhe
On 31 July 2012, Zeder, through its subsidiary Chayton, acquired 100% of the issued share capital in Somawhe, a farming operation incorporated in Zambia. Cash consideration of R275m was paid for Somawhe’s identifiable net assets of R215m, resulting in the recognition of R59m in goodwill.
The summarised assets and liabilities recognised at acquisition date were:
Agricol Chayton Somawhe TotalGROUP R’000 R’000 R’000 R’000
Property, plant and equipment 38 892 129 006 177 171 345 069Biological assets 14 033 55 041 69 074Intangible assets 21 574 681 22 255Equity securities 2 393 2 393Inventories 79 181 3 850 10 813 93 844Trade and other receivables 61 377 3 825 5 115 70 317Cash and cash equivalents 31 287 9 948 9 818 51 053Deferred income tax liabilities (8 532) (1 322) (16 830) (26 684)Borrowings (4) (146 364) (18 078) (164 446)Current income tax liabilities (19 679) (1 057) (20 736)Trade and other payables (57 381) (18 058) (6 614) (82 053)
Total identifiable net assets/(liabilities) 149 108 (4 401) 215 379 360 086Previously held investment in Agricol at fair value (50 409) (50 409)Goodwill 51 722 28 063 59 206 138 991
Total consideration 150 421 23 662 274 585 448 668
Cash consideration paid (150 421) (23 662) (274 585) (448 668)Cash and cash equivalents acquired 31 287 9 948 9 818 51 053
Net cash outflow from business combination (119 134) (13 714) (264 767) (397 615)
Goodwill recognised from the business combinations can be attributed to the employee corps and geographical footprint of the respective businesses, as well as expected synergies and growth potential.
Acquisition costs of R6,1m were incurred with the above business combinations, which are included in marketing, administration and other expenses in the income statement (refer note 26.2).

157
GROUP
2015 2014* 2013R’000 R’000 R’000
32. EARNINGS PER SHAREThe calculation of earnings per share is based on the following:Earnings attributable to equity holders of the company 241 816 306 753 511 741Net loss on dilution of interest in associates (gross) 155 276Non-headline items of associates and joint ventures 20 377 11 377 (42 776)
– Gross 20 437 11 561 (42 776)– Non-controlling interest (60) (184)
Net loss on disposal of investments in associates – 3 836 (410 404)
– Gross 3 836 (502 890)– Tax effect 92 486
Net gain on disposal of non-current assets held for sale – (3 758) –
– Gross (14 004)– Tax effect 10 246
Fair value gain on step-up acquisition of an associate to a subsidiary (3 031) (17 120) (22 023)
– Gross (3 295) (17 205) (22 023)– Non-controlling interest 264 85
Reversal of impairment of property, plant and equipment (8 456) – –
– Gross (11 893)– Non-controlling interest 3 437
Reclassification of reserves of associates with step-up to subsidiary or disposal – (55 466) –
– Gross (57 070)– Non-controlling interest 421– Tax effect 1 183
Reclassification of gains on available-for-sale financial assets – (812) –
– Gross (1 010)– Non-controlling interest 71– Tax effect 127
Impairment of investment in associate and joint venture 126 21 421 –
– Gross 131 21 421– Non-controlling interest (5)
Net profit on sale of property, plant and equipment (2 884) (66) (1 433)
– Gross (4 331) 3 838 (1 788)– Non-controlling interest 689 (89) 143– Tax effect 758 (3 815) 212
Impairment of intangible assets and goodwill 12 822 1 063 –
– Gross 19 013 1 155– Non-controlling interest (2 678) (92)– Tax effect (3 513)
Sub-total 260 770 267 228 190 381

158
GROUP
2015 2014* 2013R’000 R’000 R’000
32. EARNINGS PER SHARE (continued)Sub-total 260 770 267 228 190 381Fair value adjustment on non-current asset held for sale – 727 5 961– Gross 1 210 7 330– Non-controlling interest (290)– Tax effect (193) (1 369)
Recycling of foreign exchange gains on long-term loan (935) – –
– Gross (1 410)– Non-controlling interest 81– Tax effect 394
Profit on disposal of available-for-sale financial assets (2 530) – –
– Gross (3 559)– Non-controlling interest 1 029Gain on bargain purchase (gross) (7 414)
Headline earnings 257 305 260 541 196 342
The calculation of the weighted number of shares in issue is as follows:– Number of shares at beginning of year (’000) 980 188 978 089 978 089– Weighted number of shares issued during the year (’000) 191 814 1 674
– Weighted number of shares at end of year (’000) 1 172 002 979 763 978 089
Earnings per share (cents)– Attributable – basic and diluted 20,6 31,3 52,3
– Headline – basic and diluted 22,0 26,6 20,1
* Restatement as set out in note 33.
33. RESTATEMENT OF PRIOR YEAR FIGURES
The prior year figures of Capespan Group Ltd (“Capespan”), a subsidiary, have been restated to account for the following:
Restatement 1: Agriculture: Bearer plants
During the year, amendments were made to IAS 41 Agriculture and IAS 16 Property, plant and equipment that allow companies to account for bearer plants at cost less accumulated depreciation and impairment losses. Long-term biological assets consist of bearer plants used in the production of agricultural produce and are expected to bear produce for more than one period. Management’s intention is to recover the economic benefit of these assets through continued use. Management revised its accounting policy to account for bearer plants in accordance with the cost model under IAS 16.
Restatement 2: Accounting for the sales and cost of sales of product sold
During the year, management reassessed an existing management agreement which was previously accounted for as management fee income, but concluded it to rather fall within IFRIC 4 Determining whether an Arrangement contains a Lease and therefore applied IAS 17 Leases retrospectively. This resulted in Capespan now accounting for this agreement and the related farming operations as principal.
Restatement 3: Reclassification of production costs
Certain production costs were reallocated from other expenses to cost of sales to correctly disclose the nature thereof. This restatement had no impact on previously reported profit.

159
33. RESTATEMENT OF PRIOR YEAR FIGURES (continued)
The effect of these restatements are as follows on the group results:
Previously Currentlyreported reported Difference
R’000 R’000 R’000
Statement of financial position at 28 February 2014AssetsBiological assets1 201 426 200 568 (858)Inventories2 739 763 955 724 215 961Trade and other receivables2 1 127 223 1 045 000 (82 223)
132 880
EquityOrdinary shareholders equity 3 606 929 3 620 512 13 583
Res tatement1 – profit for the year 171Restatement2 – profit for the year 15 264Restatement2 – other movements (1 852)
Non-controlling interest 535 958 544 679 8 721Restatement2 – profit for the year 6 869Restatement2 – other movements 1 852
LiabilitiesDeferred income tax liabilities 104 612 119 768 15 156
Restatement1 (686)Restatement2 15 842
Trade and other payables2 1 081 299 1 176 719 95 420
132 880
Income statement for the year ended 28 February 2014Revenue2 6 010 700 5 977 508 (33 192)Cost of sales (5 134 607) (5 204 533) (69 926)
Restatement1 (37 125)Restatement2 48 854Restatement3 (81 655)
Gross profit (103 118)Change in fair value of biological assets1 90 510 134 150 43 640Investment income1 64 354 65 854 1 500Other operating income2 8 928 16 342 7 414Marketing, administration and other expenses (741 254) (660 828) 80 426
Restatement1 (8 580)Restatement2 7 351Restatement3 81 655
Profit before finance costs and taxation 29 862Taxation (97 128) (104 686) (7 558)
Restatement1 395Restatement2 (7 953)
Profit for the year 22 304
1. Relates to Restatement 1.2. Relates to Restatement 2.

160
33. RESTATEMENT/RECLASSIFICATION OF PRIOR YEAR FIGURES (continued)
Previously Currentlyreported reported Difference
R’000 R’000 R’000
Profit attributable to: Owners of the parent 291 318 306 753 15 435 Non-controlling interest 42 886 49 755 6 869
22 304
Impact on earnings per shareRecurring headline earnings 29,8 30,6 0,8Headline earnings 25,8 26,6 0,8Attributable earnings 29,7 31,3 1,6
During the prior year, the group acquired a further 25,3% shareholding in Capespan and thereby increased its interest to 71,1%. Since Capespan Group Ltd was not a subsidiary in the previous year, no prior year opening balances were restated and disclosed above and therefore the above only reflects post-acquisition restatements.
34. CONTINGENT CONSIDERATION
The deferred purchase consideration recognised at the previous reporting date (refer note 20) relates to an earn-out clause paid during the year. This was calculated by discounting the estimated average net profit before tax for three years using average forecast exchange rates.
35. EVENTS SUBSEQUENT TO THE REPORTING DATE
Following this notice, Zeder will formally announce to the market its conditional firm intention to acquire the remaining 25% shares in Capespan Group Ltd (“Capespan”) held by minority shareholders other than management by means of a scheme of arrangement. In terms of the scheme of arrangement, Zeder will issue 85 ordinary shares for every 100 Capespan ordinary shares acquired.
Subsequent to the reporting date, the group, through Capespan, acquired the following businesses:– Novo Packhouse (Pty) Ltd’s coldstores, packhouse and equipment for a cash purchase
consideration of R100m; and– Theewaterskloof (Pty) Ltd’s business operations, moveable equipment, farm land and biological
assets (being a pome fruit farm) for a cash consideration of R140m.
The directors are, except for the above, unaware of any matter or event which is material to the financial affairs of the group that have occurred between the reporting date and the date of approval of these annual financial statements.
36. FINANCIAL RISK MANAGEMENT
Financial risk factors
The group’s activities expose it to a variety of financial risks: market risk (including price risk, cash flow and fair value interest rate risk and foreign exchange risk), credit risk and liquidity risk. The group’s overall risk management programme focuses on the unpredictability of financial markets and seeks to minimise potential adverse effects on the group’s financial performance.
Risk management is carried out by each major entity within the group under policies approved by the respective boards of directors. Each entity identifies, evaluates and utilises derivative financial instruments to hedge financial risks as appropriate. Each major entity’s board of directors provides principles for overall risk management, as well as policies covering specific areas, such as foreign exchange risk, interest rate risk, credit risk, use of derivative financial instruments and non-derivative financial instruments and investment of excess liquidity.
Financial instruments are grouped into the classes set out below in order to facilitate effective financial risk management and disclosure in terms of IFRS 7 Financial Instruments – Disclosures. The sensitivity analyses presented below are based on reasonable possible changes in market variables for equity prices, interest rates and foreign exchange rates for the group.

161
36. FINANCIAL RISK MANAGEMENT (continued)
GROUP
At fair value through
profit or loss R’000
Available-for-sale
R’000
Loans and receivables
R’000
Held for sale
R’000Total
R’000
Financial assets at 28 February 2015– Loans and preference
share investments in associates 30 030 30 030
– Loan granted to joint ventures 81 81
– Equity securities 46 279 4 729 51 008– Non-current assets held
for sale 30 378 30 378– Loans and advances 114 409 114 409– Trade and other
receivables 1 143 678 1 143 678– Derivative financial assets 24 24– Cash and cash
equivalents 769 999 769 999
46 303 4 729 2 058 197 30 378 2 139 607
Financial assets at 28 February 2014– Loans and preference
share investments in associates 18 239 18 239
– Loan granted to joint ventures 1 553 1 553
– Equity securities 202 772 3 756 206 528– Non-current assets held
for sale 177 570 177 570– Loans and advances 78 614 78 614– Trade and other
receivables 997 928 997 928– Derivative financial assets 1 299 1 299– Cash and cash
equivalents 1 014 768 1 014 768
204 071 3 756 2 111 102 177 570 2 496 499
Financial assets at 28 February 2013– Loans and preference
share investments in associates 54 470 54 470
– Equity securities 97 484 3 031 100 515– Non-current assets held
for sale 287 733 287 733– Loans and advances 16 261 16 261– Trade and other
receivables 97 308 97 308– Cash and cash
equivalents 752 615 752 615
97 484 3 031 920 654 287 733 1 308 902
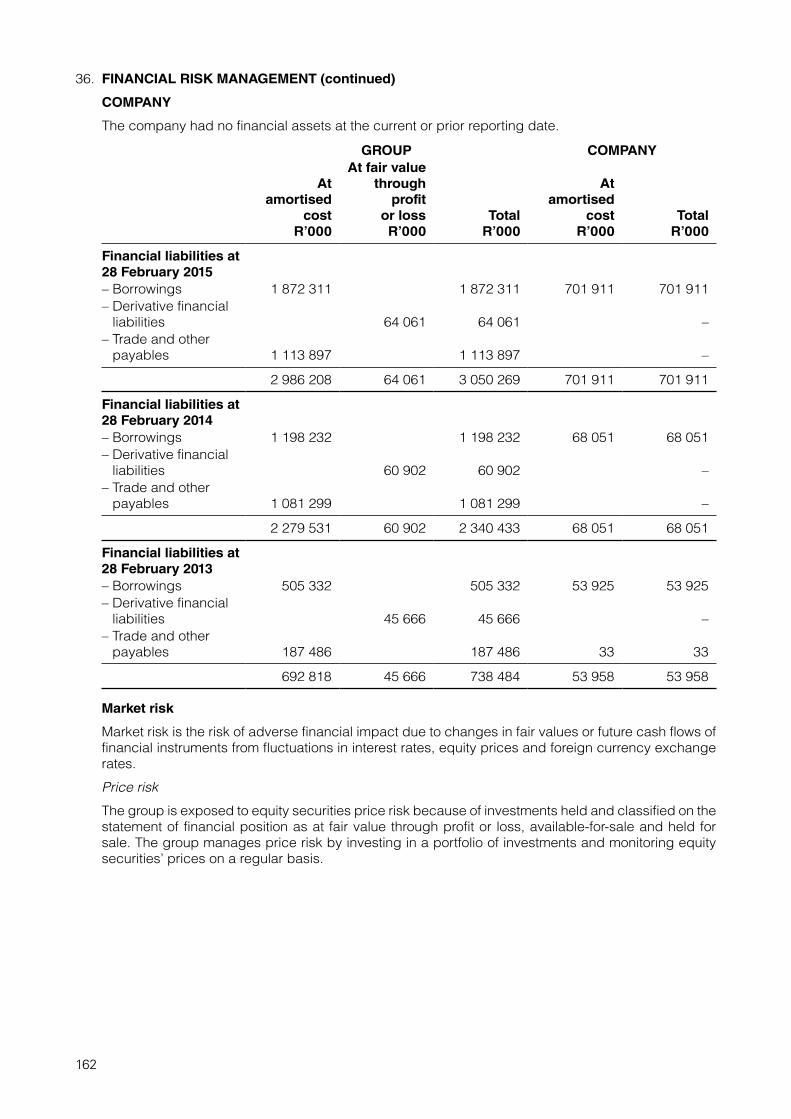
162
36. FINANCIAL RISK MANAGEMENT (continued)
COMPANY
The company had no financial assets at the current or prior reporting date.
GROUP COMPANY
At amortised
costR’000
At fair value through
profit or lossR’000
TotalR’000
At amortised
costR’000
TotalR’000
Financial liabilities at 28 February 2015– Borrowings 1 872 311 1 872 311 701 911 701 911– Derivative financial
liabilities 64 061 64 061 –– Trade and other
payables 1 113 897 1 113 897 –
2 986 208 64 061 3 050 269 701 911 701 911
Financial liabilities at 28 February 2014– Borrowings 1 198 232 1 198 232 68 051 68 051– Derivative financial
liabilities 60 902 60 902 –– Trade and other
payables 1 081 299 1 081 299 –
2 279 531 60 902 2 340 433 68 051 68 051
Financial liabilities at 28 February 2013– Borrowings 505 332 505 332 53 925 53 925– Derivative financial
liabilities 45 666 45 666 –– Trade and other
payables 187 486 187 486 33 33
692 818 45 666 738 484 53 958 53 958
Market risk
Market risk is the risk of adverse financial impact due to changes in fair values or future cash flows of financial instruments from fluctuations in interest rates, equity prices and foreign currency exchange rates.
Price risk
The group is exposed to equity securities price risk because of investments held and classified on the statement of financial position as at fair value through profit or loss, available-for-sale and held for sale. The group manages price risk by investing in a portfolio of investments and monitoring equity securities’ prices on a regular basis.

163
36. FINANCIAL RISK MANAGEMENT (continued)
Market risk (continued)
Price risk (continued)
The table below summarises the sensitivity of the group’s post-tax net profit for the year as a result of market price fluctuations. The analysis is based on the assumption that marked-to-market prices increase/decrease by 20% (2014: 20%) (2013: 20%) at the reporting date, with all other variables (e.g. effective tax rate) held constant.
2015 2014 2013 2015 2014 201320% 20% 20% 20% 20% 20%
increase increase increase decrease decrease decreaseGROUP R’000 R’000 R’000 R’000 R’000 R’000
Impact on post-tax profit 8 299 61 866 62 659 (8 299) (61 866) (62 659)Impact on post-tax other comprehensive income 611 493 (611) (493)
Cash flow and fair value interest rate risk
The group’s interest rate risk arises from interest-bearing investments, receivables and borrowings, which expose the group to cash flow interest rate risk if it is a variable rate instrument, or to fair value interest rate risk if it is a fixed rate instrument.
GROUP2015
R’0002014
R’0002013
R’000
Loans and preference share investments in associates
Floating rate 50 470Fixed rate and interest-free 30 030 18 239 4 000
Loans to and preference share investments in joint ventures
Fixed rate and interest-free 81 1 553Loans and advances
Floating rate 106 998 72 750Fixed rate and interest-free 7 411 5 864
Trade and other receivables Floating rate 733 982 765 801 14 906Fixed rate and interest-free 409 696 232 127 82 402
Cash, money market investments and other cash equivalents
Floating rate 769 999 1 014 768 60 401Borrowings
Floating rate (1 124 213) (797 645) (199 231)Fixed rate and interest-free (748 098) (400 587)
Total 185 886 912 870 12 948
Floating rate 486 766 1 055 674 (73 454)Fixed rate and interest-free (300 880) (142 804) 86 402
The table below summarises the sensitivity of the group’s post-tax net profit for the year to interest rate fluctuations. The analysis is based on the assumption that interest rates were 1% (2014: 1%) (2013: 1%) higher/lower for the full year, with all other variables (e.g. effective tax rate, interest carrying balances) held constant.
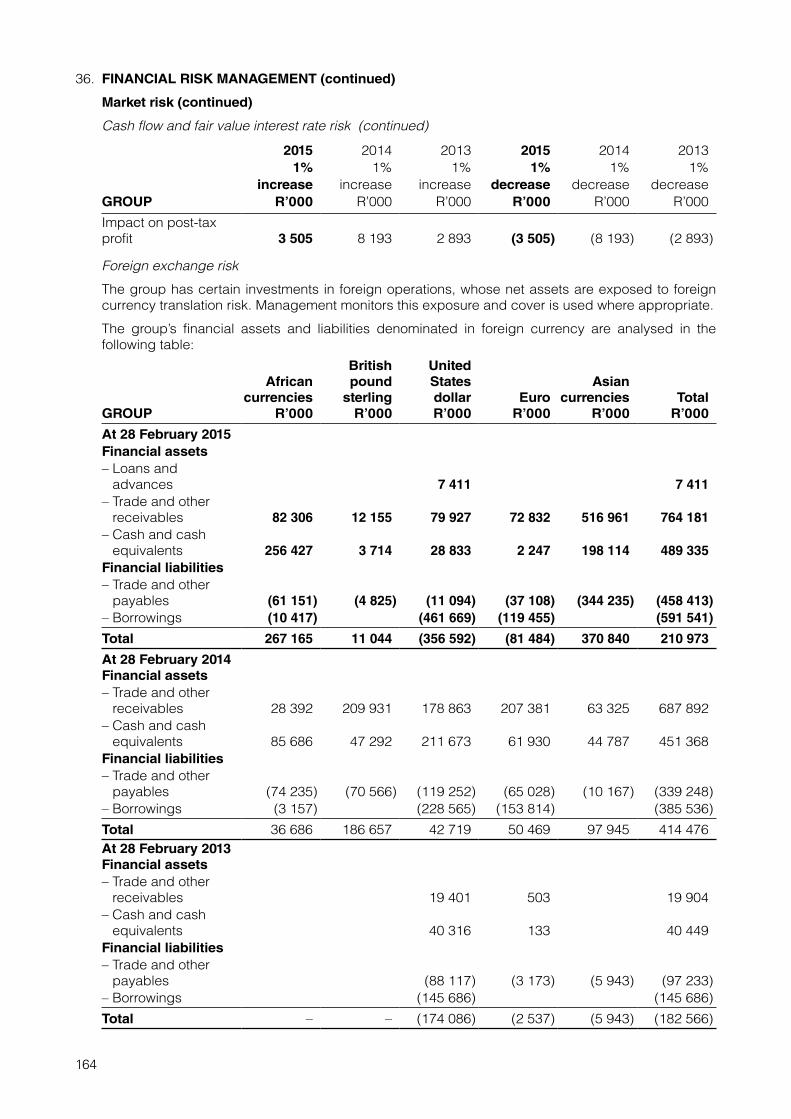
164
36. FINANCIAL RISK MANAGEMENT (continued)
Market risk (continued)
Cash flow and fair value interest rate risk (continued)
2015 2014 2013 2015 2014 20131% 1% 1% 1% 1% 1%
increase increase increase decrease decrease decreaseGROUP R’000 R’000 R’000 R’000 R’000 R’000
Impact on post-tax profit 3 505 8 193 2 893 (3 505) (8 193) (2 893)
Foreign exchange risk
The group has certain investments in foreign operations, whose net assets are exposed to foreign currency translation risk. Management monitors this exposure and cover is used where appropriate.
The group’s financial assets and liabilities denominated in foreign currency are analysed in the following table:
GROUP
African currencies
R’000
British pound
sterling R’000
United States dollar R’000
Euro R’000
Asian currencies
R’000Total
R’000
At 28 February 2015Financial assets– Loans and
advances 7 411 7 411– Trade and other
receivables 82 306 12 155 79 927 72 832 516 961 764 181– Cash and cash
equivalents 256 427 3 714 28 833 2 247 198 114 489 335Financial liabilities– Trade and other
payables (61 151) (4 825) (11 094) (37 108) (344 235) (458 413)– Borrowings (10 417) (461 669) (119 455) (591 541)
Total 267 165 11 044 (356 592) (81 484) 370 840 210 973
At 28 February 2014 Financial assets– Trade and other
receivables 28 392 209 931 178 863 207 381 63 325 687 892– Cash and cash
equivalents 85 686 47 292 211 673 61 930 44 787 451 368Financial liabilities– Trade and other
payables (74 235) (70 566) (119 252) (65 028) (10 167) (339 248)– Borrowings (3 157) (228 565) (153 814) (385 536)
Total 36 686 186 657 42 719 50 469 97 945 414 476At 28 February 2013 Financial assets– Trade and other
receivables 19 401 503 19 904– Cash and cash
equivalents 40 316 133 40 449Financial liabilities– Trade and other
payables (88 117) (3 173) (5 943) (97 233)– Borrowings (145 686) (145 686)
Total – – (174 086) (2 537) (5 943) (182 566)

165
36. FINANCIAL RISK MANAGEMENT (continued)
Market risk (continued)
Foreign exchange risk (continued)
A “cash flow hedge” is a hedge of the exposure to variability in cash flows associated with a recognised asset or liability or a highly probable forecast transaction that is attributable to a particular risk and could affect profit or loss. Capespan entered into forward currency exchange contracts in respect of fruit import/export transactions and Agrivision Africa entered into forward currency exchange contracts in order to mitigate itself against currency exchange risk emanating from the acquisition of Mpongwe Milling. These transactions met the definition of a cash flow hedge and have accordingly been accounted for on the basis set forth in accounting policy note 12.3.
The group has entered into forward currency exchange contracts (some being designated as hedging instruments), which relate to specific foreign commitments in respect of the aforementioned transactions (hedged items). The carrying value of forward currency exchange contracts are set out in notes 12 and 19. Details of forward currency exchange contracts outstanding at the reporting date are as follows:
2015 2014
GROUP
Foreign amount
’000
Average exchange
rate
Rand exposure
translated at closing
rate R’000
Foreign amount
’000
Average exchange
rate
Rand exposure
translated at closing
rate R’000
ExportsUnited States dollar 3 496 10,84 62 909 28 562 10,38 296 555British pound sterling 3 298 17,83 46 347 5 155 17,11 88 190Euro 201 432 14,14 19 454 6 038 14,32 86 436Asian currencies 149 866 0,10 14 817African currencies 16 534 1,77 191 196 154 074 1,84 284 245
319 906 770 243ImportsUnited States dollar 254 10,84 2 834 690 14,45 9 971British pound sterling 160 17,83 2 249Euro 663 14,14 9 330
14 413 9 971
Disclosure became relevant during the 2015 financial year, therefore no disclosure included in 2013 annual financial statements.
The table below shows the sensitivity of post-tax profits of the group to a 20% (2014: 20%) (2013: 20%) appreciation/depreciation in the South African Rand exchange rate at year-end, with all other variables (e.g. effective tax rate) held constant.
2015 2014 2013 2015 2014 201320% 20% 20% 20% 20% 20%
Increase Increase Increase Decrease Decrease DecreaseGROUP R’000 R’000 R’000 R’000 R’000 R’000
Impact on post-tax profit 31 552 27 666 3 687 (31 552) (27 666) (3 687)
Impact on post-tax other comprehensive income 139 939 111 993 64 503 (139 939) (111 993) (64 503)

166
36. FINANCIAL RISK MANAGEMENT (continued)
Credit risk
Financial assets which potentially subject the group to credit risk, consist of loans to associates (refer note 4), loans and advances (refer note 7), trade and other receivables (refer note 11) and cash and cash equivalents (refer note 13). Derivative counterparties and cash transactions are limited to high-credit-quality financial institutions. In the case of loans and advances, management would take or insist on collateral or other form of securitisation as they deem fit.
The following tables provides information regarding the aggregated credit risk exposure for the financial assets:
GROUP
P1 Moody’s
R’000
Baa1 Moody’s
R’000
Baa2 Moody’s
R’000Not rated
R’000
Carrying value R’000
28 February 2015Loans and preference share investments in associates 30 030 30 030Loan granted to joint ventures 81 81Unquoted equity securities 51 008 51 008Non-current assets held for sale 30 378 30 378Loans and advances 114 409 114 409Trade and other receivables 11 700 1 131 978 1 143 678Derivative financial assets 24 24Cash and cash equivalents – bank balances 190 011 157 467 347 478Cash and cash equivalents – money market fund 422 521 422 521
24 201 711 157 467 1 780 405 2 139 607
28 February 2014Loans and preference share investments in associates 18 239 18 239Loan granted to joint ventures 1 553 1 553Unquoted equity securities 41 729 41 729Non-current asset held for sale 177 570 177 570Loans and advances 78 614 78 614Trade and other receivables 1 080 110 1 080 110Derivative financial assets 1 299 1 299Cash and cash equivalents – bank balances 632 261 632 261Cash and cash equivalents – money market fund 382 507 382 507
1 299 632 261 – 1 780 322 2 413 882
28 February 2013Loans and preference share investments in associates 54 470 54 470Unquoted equity securities 97 481 97 481Loans and advances 16 261 16 261Trade and other receivables 100 729 100 729Cash and cash equivalents – bank balances 390 417 390 417Cash and cash equivalents – money market fund 362 198 362 198
– 390 417 – 631 139 1 021 556

167
36. FINANCIAL RISK MANAGEMENT (continued)
Credit risk (continued)
Loans and preference share investments in associates, loan granted to joint ventures and loans and advances consist of secured and unsecured assets. There are no significant concentrations of credit risk. The group assesses all counterparties for creditworthiness before transacting, and monitors creditworthiness on a regular basis.
Trade receivables consist of a large number of customers, spread across diverse industries and geographical areas. Ongoing credit evaluation is performed on the financial condition of receivables and, where appropriate, credit guarantee insurance cover is purchased. Capespan, to whom the majority of trade and other receivables relate, established an allowance for impairment that represents its estimate of incurred losses in respect of trade and other receivables and investments. The main component of this allowance is a specific loss component that relates to individually significant exposures and a collective loss component established for groups of similar assets in respect of losses that have been incurred but not yet identified. The collective loss allowance is determined based on historical data of payment statistics for similar financial assets.
Capespan performs ongoing credit evaluations on the financial condition of trade receivables, and where appropriate, purchases credit guarantee insurance. Capespan’s credit guarantee insurance is limited to an annual aggregate of R300m.
The unquoted equity securities are impaired to the value of the underlying instruments should the market value of the instruments fall below the current carrying value.
The unrated cash and cash equivalents relate to the group’s investment in money market funds of which the underlying instruments are rated in terms of the Collective Investment Schemes Control Act. The mandate of the fund is to invest in cash deposits and highly liquid, fixed-interest securities with a weighted average maturity of less than 90 days. A spread of investments in top-quality financial instruments and institutions moderates the risk through diversification.
Refer to the foreign exchange risk note where the receivables denominated in foreign currencies are disclosed. These receivables are susceptible to credit risk and the currency denominations provide indication of their geographical area.
The table below gives an age analysis of receivables that are past due but not impaired. The other classes of financial assets do not contain assets that are past due but not impaired.
GROUP0 – 2 months
R’0002 – 6 months
R’0006 – 12 months
R’000Total
R’000
At 28 February 2015 31 669 70 110 46 358 148 137At 28 February 2014 96 367 54 058 5 674 156 099At 28 February 2013 19 935 6 051 3 913 29 899
2015 2014 2013GROUP R’000 R’000 R’000
Reconciliation of allowance for impairment of trade receivables:Balance at beginning of year 18 724 345Subsidiaries acquired 28 473 345Amounts written off (85) (11 662)Impairment provision 328 1 568
Balance at end of year 18 967 18 724 345
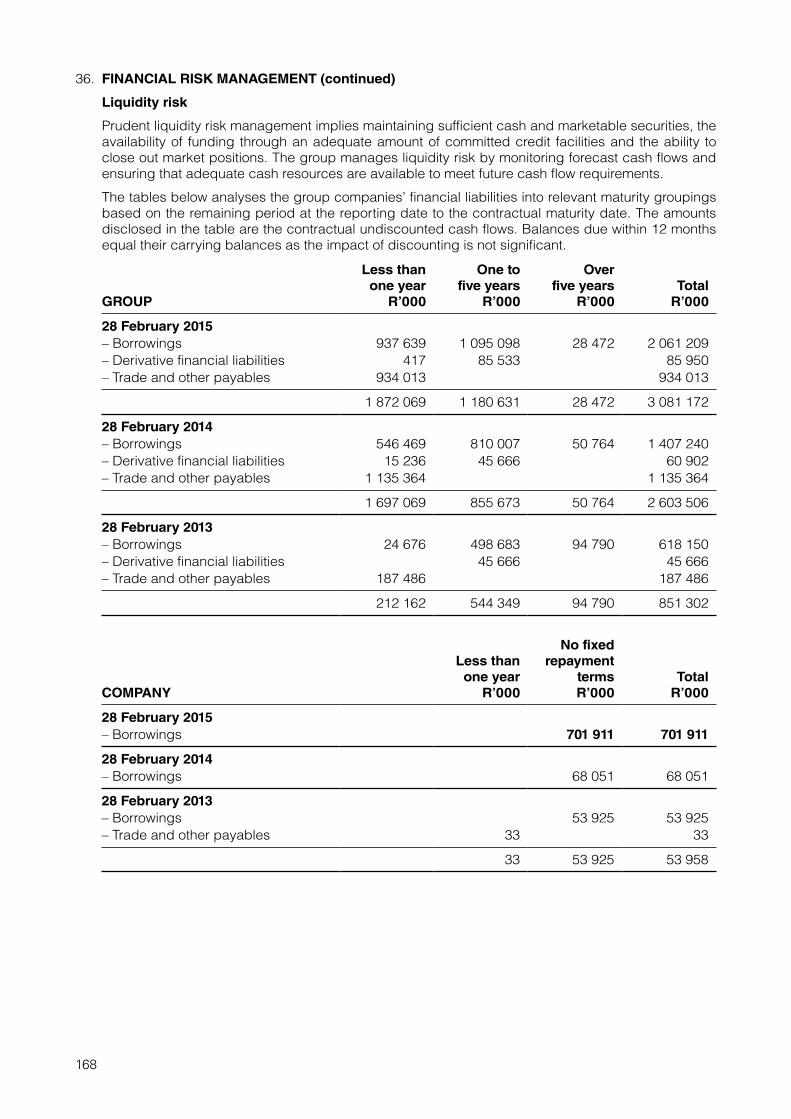
168
36. FINANCIAL RISK MANAGEMENT (continued)
Liquidity risk
Prudent liquidity risk management implies maintaining sufficient cash and marketable securities, the availability of funding through an adequate amount of committed credit facilities and the ability to close out market positions. The group manages liquidity risk by monitoring forecast cash flows and ensuring that adequate cash resources are available to meet future cash flow requirements.
The tables below analyses the group companies’ financial liabilities into relevant maturity groupings based on the remaining period at the reporting date to the contractual maturity date. The amounts disclosed in the table are the contractual undiscounted cash flows. Balances due within 12 months equal their carrying balances as the impact of discounting is not significant.
GROUP
Less than one year
R’000
One to five years
R’000
Over five years
R’000Total
R’000
28 February 2015– Borrowings 937 639 1 095 098 28 472 2 061 209– Derivative financial liabilities 417 85 533 85 950– Trade and other payables 934 013 934 013
1 872 069 1 180 631 28 472 3 081 172
28 February 2014– Borrowings 546 469 810 007 50 764 1 407 240– Derivative financial liabilities 15 236 45 666 60 902– Trade and other payables 1 135 364 1 135 364
1 697 069 855 673 50 764 2 603 506
28 February 2013– Borrowings 24 676 498 683 94 790 618 150– Derivative financial liabilities 45 666 45 666– Trade and other payables 187 486 187 486
212 162 544 349 94 790 851 302
COMPANY
Less thanone year
R’000
No fixed repayment
terms R’000
Total R’000
28 February 2015– Borrowings 701 911 701 911
28 February 2014– Borrowings 68 051 68 051
28 February 2013– Borrowings 53 925 53 925– Trade and other payables 33 33
33 53 925 53 958

169
36. FINANCIAL RISK MANAGEMENT (continued)
Fair value estimation
Financial assets and liabilities carried at fair value are disclosed by level of the following fair value measurement hierarchy:
Level 1
The fair value of financial instruments traded in active markets is based on quoted market prices at the reporting date. A market is regarded as active if quoted prices are readily and regularly available from an exchange, dealer, broker, industry group, pricing service or regulatory agency and those prices represent actual and regularly occurring market transactions on an arm’s length basis. The quoted market price used for financial assets held by the group is the current bid price. These instruments are included in level 1 and comprise primarily JSE-listed equity securities classified as “fair value through profit or loss” or “available-for-sale”.
Level 2
Financial instruments that trade in markets that are not considered to be active but are valued (using valuation techniques) based on quoted market prices, dealer quotations or alternative pricing sources supported by observable inputs are classified within level 2. These include over-the-counter traded derivatives. Since level 2 investments include positions that are not traded in active markets and/or are subject to transfer restrictions, valuations may be adjusted to reflect illiquidity and/or non-transferability, which are generally based on available market information. If all significant inputs in determining an instrument’s fair value are observable, the instrument is included in level 2.
Instrument Valuation technique Main inputs
Derivative financial assets and liabilities Exit price on recognised over-the- counter platforms
Not applicable
Equity securities Closing price on recognised over-the-counter platforms
Not applicable
Level 3
If one or more of the significant inputs is not based on observable market data, the instrument is included in level 3. Investments classified within level 3 have significant unobservable inputs, as they trade infrequently.
Equity securities included in level 3 relate to stock exchange rights and other rights owned. As these rights are unquoted, the valuation technique is based on the fact that the variability in the range of reasonable fair value estimates is not significant for this instrument and that the fair value of these rights is estimated to be equal to the guaranteed amount receivable for these rights, thus equalling the cost.
Other derivative liabilities included in level 3 relate to put options held by non-controlling interests against the group. These fair values are calculated by applying the contractually agreed price/earnings multiple to the relevant subsidiary’s board-approved budgeted profits and discounting it at a market-related interest rate.

170
36. FINANCIAL RISK MANAGEMENT (continued)
Fair value estimation (continued)
The following financial assets are measured at fair value:
GROUPLevel 1
R’000Level 2
R’000Level 3
R’000Total
R’000
Assets28 February 2015Financial assets at fair value through profit or loss– Derivative financial assets 24 24– Equity securities 1 321 49 687 51 008– Non-current assets held for sale 30 378 30 378
– 1 345 80 065 81 410
28 February 2014Financial assets at fair value through profit or loss– Derivative financial assets 990 309 1 299– Equity securities 163 792 1 007 41 729 206 528– Non-current assets held for sale 177 570 177 570
342 352 1 316 41 729 385 397
28 February 2013Financial assets at fair value through profit or loss– Equity securities 290 767 97 481 388 248
Liabilities28 February 2015– Derivative financial liabilities 417 63 644 64 061
28 February 2014– Derivative financial liabilities 15 236 45 666 60 902
Equity securities included in level 3 of the fair value hierarchy as at the most recent reporting date consisted of the unquoted equity securities set out in note 6. The unquoted equity securities include advances which are linked to equity securities traded in over-the-counter markets. In terms of these agreements, the group is entitled to the majority of the increase in the market value of the underlying over-the-counter traded equity securities and the dividends received on these securities. The advances are carried at the fair value of the underlying over-the-counter traded equity securities.
The over-the-counter traded equity securities’ prices are readily available with observable inputs and no significant adjustments were made to the fair value of same. However, following a decline in the trading activity of the relevant over-the-counter traded markets (i.e. less observable inputs), at 28 February 2014, it was considered necessary to reclassify the entire balance of these unquoted equity securities from level 2 (as presented at the previous reporting date) to level 3 of the fair value hierarchy.

171
36. FINANCIAL RISK MANAGEMENT (continued)
Fair value estimation (continued)
Fair value movements in respect of aforementioned equity securities are considered to be “recurring”, as defined by IFRS 13 Fair Value Measurement. Please find below the reconciliation in respect of movements in the carrying value of financial assets included in level 3 of the fair value hierarchy. Furthermore, in light of the transfer between level 2 and level 3, as additional information, please also find below a reconciliation of financial assets, for the prior year, included in level 2 of the fair value hierarchy:
Level 2 Level 32014 2015 2014
GROUP R’000 R’000 R’000
Reconciliation of financial assets:Opening balance 97 481 41 729Additions 8 418 3 531Subsidiaries acquired 3 756Transfer from subsidiaries to non-current assets held for sale 30 378Disposal (87 408) (3 531)Transfer from level 2 to level 3 classification (41 729) 41 729Fair value gain 20 489 7 958
Closing balance 1 007 80 065 41 729
Reconciliation of financial liabilities:Opening balance 45 666 45 666Additions 19 487Fair value gain (4 777) (730)Interest 3 268 730
Closing balance 63 644 45 666
Capital risk management
The group’s objective when managing capital is to safeguard the group’s ability to continue as a going concern in order to provide returns for shareholders.
The group’s dividend policy is to declare and pay dividends according to its free cash flow model, i.e. dividends and interest received less management fees, interest and related taxation paid.
The group’s capital comprises of total equity and borrowings, as shown in the group statement of financial position. When funding is required, the group will either raise additional capital or utilise debt. There is no restriction on the level of gearing. However, the group will continuously assess the extent of gearing employed, in the context of the level of liquidity within the group’s portfolio.
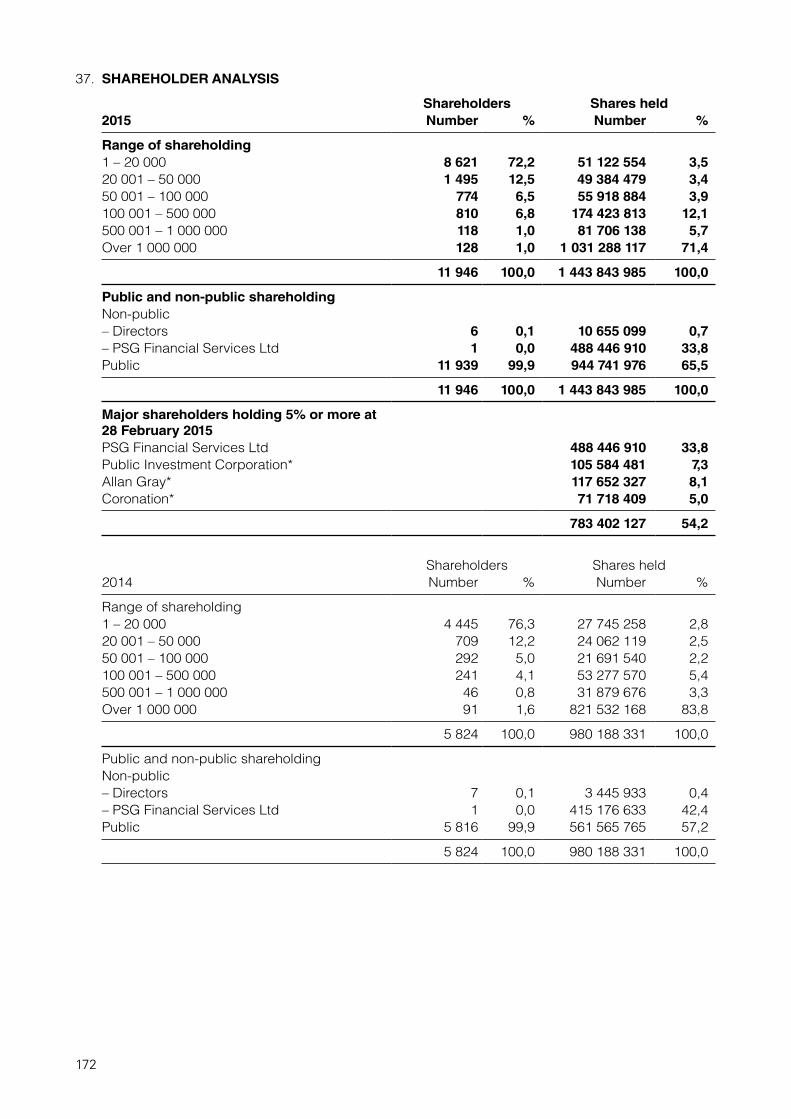
172
37. SHAREHOLDER ANALYSIS
Shareholders Shares held2015 Number % Number %
Range of shareholding1 – 20 000 8 621 72,2 51 122 554 3,520 001 – 50 000 1 495 12,5 49 384 479 3,450 001 – 100 000 774 6,5 55 918 884 3,9100 001 – 500 000 810 6,8 174 423 813 12,1500 001 – 1 000 000 118 1,0 81 706 138 5,7Over 1 000 000 128 1,0 1 031 288 117 71,4
11 946 100,0 1 443 843 985 100,0
Public and non-public shareholdingNon-public– Directors 6 0,1 10 655 099 0,7– PSG Financial Services Ltd 1 0,0 488 446 910 33,8Public 11 939 99,9 944 741 976 65,5
11 946 100,0 1 443 843 985 100,0
Major shareholders holding 5% or more at 28 February 2015PSG Financial Services Ltd 488 446 910 33,8Public Investment Corporation* 105 584 481 7,3Allan Gray* 117 652 327 8,1Coronation* 71 718 409 5,0
783 402 127 54,2
Shareholders Shares held2014 Number % Number %
Range of shareholding1 – 20 000 4 445 76,3 27 745 258 2,820 001 – 50 000 709 12,2 24 062 119 2,550 001 – 100 000 292 5,0 21 691 540 2,2100 001 – 500 000 241 4,1 53 277 570 5,4500 001 – 1 000 000 46 0,8 31 879 676 3,3Over 1 000 000 91 1,6 821 532 168 83,8
5 824 100,0 980 188 331 100,0
Public and non-public shareholdingNon-public– Directors 7 0,1 3 445 933 0,4– PSG Financial Services Ltd 1 0,0 415 176 633 42,4Public 5 816 99,9 561 565 765 57,2
5 824 100,0 980 188 331 100,0

173
37. SHAREHOLDER ANALYSIS (continued)
Shareholders Shares held2013 Number % Number %
Range of shareholding1 – 20 000 3 502 73,9 22 777 633 2,320 001 – 50 000 628 13,2 21 644 437 2,250 001 – 100 000 273 5,8 20 506 324 2,1100 001 – 500 000 191 4,0 41 481 124 4,2500 001 – 1 000 000 56 1,2 39 723 039 4,1Over 1 000 000 90 1,9 831 955 960 85,1
4 740 100,0 978 088 517 100,0
Public and non-public shareholdingNon-public– Directors 4 0,1 490 000 0,1– PSG Financial Services Ltd 1 0,0 415 176 633 42,4Public 4 735 99,9 562 421 884 57,5
4 740 100,0 978 088 517 100,0
* The shareholding includes shares held directly or indirectly by the entity and/or its clients.

174
ZEDER INVESTMENTS LTDANNEXURE A – SIGNIFICANT SUBSIDIARIES FOR THE YEAR ENDED 28 FEBRUARY 2015
Effective interest held directly or indirectly2
Profit or loss attributable to non-controlling interest
Carrying value of non-controlling interest
SubsidiaryCountry of incorporation1 Nature of business
2015%
2014%
2013%
2015R’000
2014R’000
2013R’000
2015R’000
2014R’000
2013R’000
Zeder Financial Services Ltd South Africa Investment holding 100,0 100,0 100,0
Zaad Holdings Ltd (previously Agricol Holdings Ltd) South Africa3 Agricultural 92,0 92,0 92,0 10 043 4 768 1 559 83 889 76 400 24 045
Capespan Group LtdSouth Africa4
Fruit procurement/export 71,1 72,1 38 549 42 830 396 884 318 964
Agrivision Africa (previously Chayton Africa) Mauritius5 Agricultural 76,5 76,7 73,4 (6 991) (4 712) (3 737) 126 602 140 594 85 064
Total 41 601 42 886 (2 178) 607 375 535 958 109 109
1 Principle place of business is the country of incorporation, unless otherwise stated.2 Ownership interest equal voting rights.3 Operating via subsidiaries in Southern Africa, Europe and the Middle East.4 Operating via an associate in China and various subsidiaries throughout the rest of the world. The group obtained control over Capespan Group Ltd during the prior year.5 Operating via subsidiaries in Zambia.
Subsidiary
Profit/(loss)from
continuingoperations
2015R’000
Total compre-hensive
income/(loss)for the year
2015R’000
Revenue2015
R’000
Profit/(loss)from
continuingoperations
2014R’000
Total compre-hensiveincome
for the year2014
R’000
Revenue2014
R’000
Profit/(loss)from
continuingoperations
2013R’000
Total compre-hensive
income/(loss)for the year
2013R’000
Revenue2013
R’000
Zaad Holdings Ltd (previously Agricol Holdings Ltd)1/2 62 406 44 938 946 573 46 875 54 435 465 417 28 437 28 764 294 063
Capespan Group Ltd3/4 117 428 141 382 7 392 421 132 474 276 679 7 149 021
Agrivision Africa (previously Chayton Africa)3 (29 515) (56 154) 352 974 (15 235) 22 807 137 940 (25 344) (17 843) 63 439
1 Represents the year ended 28 February 2015 (2014: 28 February 2014) (2013: 28 February 2013).2 During the 2013 year, Zaad changed its financial year-end to 28 February, therefore the 2013 year represents the eight months ended 28 February 2013.3 Represents the year ended 31 December 2014 (2014: 31 December 2013).4 Prior year include Capespan’s results for the eight months ended 31 December 2013.
Dividends paid
To non-controlling
interestTo owners of
the parent Total
To non- controlling
interestTo owners of
the parent Total
To non- controlling
interestTo owners of
the parent Total
2015 2015 2015 2014 2014 2014 2013 2013 2013
Subsidiary R’000 R’000 R’000 R’000 R’000 R’000 R’000 R’000 R’000
Zaad Holdings Ltd (previously Agricol Holdings Ltd) – – –
Capespan Group Ltd 15 126 33 346 48 472 13 170 18 712 31 882 –
Agrivision Africa (previously Chayton Africa) – – –
Assets
Non-current Current Total Non-current Current Total Non-current Current Total
2015 2015 2015 2014 2014 2014 2013 2013 2013
Subsidiary R’000 R’000 R’000 R’000 R’000 R’000 R’000 R’000 R’000
Zaad Holdings Ltd (previously Agricol Holdings Ltd) 412 286 865 142 1 277 428 336 844 744 401 1 081 245 166 166 188 291 354 457
Capespan Group Ltd 1 486 163 1 501 924 2 988 087 1 123 506 1 581 495 2 705 001 -
Agrivision Africa (previously Chayton Africa) 857 124 291 393 1 148 517 472 992 251 899 724 891 388 917 161 855 550 772
Liabilities
Non-current Current Total Non-current Current Total Non-current Current Total
2015 2015 2015 2014 2014 2014 2013 2013 2013
Subsidiary R’000 R’000 R’000 R’000 R’000 R’000 R’000 R’000 R’000
Zaad Holdings Ltd (previously Agricol Holdings Ltd) 185 822 530 586 716 408 137 555 500 045 637 600 53 023 76 468 129 491
Capespan Group Ltd 323 534 1 137 538 1 461 072 306 509 983 336 1 289 845 -
Agrivision Africa (previously Chayton Africa) 313 652 345 340 658 992 193 093 152 629 345 722 112 467 134 224 246 691

175
ZEDER INVESTMENTS LTDANNEXURE B – SIGNIFICANT ASSOCIATES FOR THE YEAR ENDED 28 FEBRUARY 2015
Effective interest held directly or indirectly**
Dividends received during the year Carrying value at year-end
AssociateCountry of incorporation* Nature of business
2015 %
2014 %
2013 %
2015 R’000
2014 R’000
2013 R’000
2015 R’000
2014 R’000
2013 R’000
Agri Voedsel Ltd2 South Africa Investment company with a voting and economic interest in Pioneer Food Group Ltd of 25% and 30%, respectively 48,0 45,0 17 521 34 320 27 590 1 158 375 1 063 537
Pioneer Food Group Ltd2
South Africa1 Food and beverage distributer 27,3 90 871 4 774 246
Kaap Agri Ltd South Africa1 Agricultural 37,9 37,9 34,9 18 252 13 984 8 766 453 146 412 961 271 555
Quantum Foods Holdings Ltd2
South Africa1 Feeds and poultry business 26,4 142 769
Golden Wing Mau China Fruit procurement/distribution 25,0 25,0 8 339 295 324 231 759
Capespan Group Ltd4 South Africa5 Fruit procurement/export 37,1 10 749 298 255
Klein Karoo Seed Marketing (Pty) Ltd4
South Africa6 Agricultural49,0 90 851
Thembeka OVB (Pty) Ltd3
South Africa Investment company with an
effective interest of 20% in
Overberg Agri Ltd 49,0 975 16 381 79 389
NWK Ltd3 South Africa Agricultural 19,9 5 931 15 503 220 027
Suidwes Investments Ltd3
South Africa Agricultural24,1 4 250 101 405
Capevin Holdings Ltd7 South Africa Beverages 34 198
Bluegreen Oceans (Pty) Ltd
South Africa Aqua culture1 516
Other immaterial associated companies(aggregated) 38 504 18 719
Total 126 644 63 549 117 437 5 703 989 1 821 814 2 126 535
* Principle place of business is the country of incorporation, unless otherwise stated.** Ownership interest equal voting rights.1 Operating via various subsidiaries throughout Southern Africa.2 During the year under review, Zeder made an offer to acquire all of the shares in Agri Voedsel Ltd (which in turn held an interest of 30,3% in JSE-listed Pioneer Food Group
Ltd) not already held by Zeder, whereby Agri Voedsel shareholders were offered 16,2 Zeder shares for every one Agri Voedsel Ltd share. Following completion of same, Zeder now owns a direct interest of 27,3% in Pioneer Food Group Ltd and 24,9% in Quantum Foods Holdings Ltd.
3 The group disposed of its interest in the associate during the prior year.4 The group obtained control over the company during the prior year (refer Annexure A).5 Operating via an associate in China and various subsidiaries throughout the rest of the world. The group obtained control over Capespan Group Ltd during the 2014 year
(refer note 31.3).6 Operating via subsidiaries in Southern Africa, Europe and the Middle East.7 The group disposed of the majority of its interest in the associate during the 2013 year.
Profitability (100%)2
Profit/(loss) for the year
Total comprehensive
Income/(loss) for the year Revenue
Profit for the year
Total comprehensive
Income for the year Revenue
2015 2015 2015 2014 2014 2014
Associate R’000 R’000 R’000 R’000 R’000 R’000
Agri Voedsel Ltd 139 380 169 334
Pioneer Food Group Ltd 966 300 977 700 17 698 600
Kaap Agri Ltd 158 213 158 234 4 874 579 129 054 129 130 4 007 807
Quantum Foods Holdings Ltd (8 487) (28 176) 3 560 943
NWK Ltd 142 100 171 400 1 840 2001 These figures are the latest published full year results available for these companies.
Profitability (group’s interest)*
Profit for the year
2015
Total comprehensive
income for the year
2015
Profit/(loss) for the
year 2014
Total comprehensive
income/(loss) for the
year 2014
Associate R’000 R’000 R’000 R’000
Agri Voedsel Ltd 72 488 94 323
Pioneer Food Group Ltd 77 407 73 670
Kaap Agri Ltd 58 268 58 268 48 879 48 909
Quantum Foods Holdings Ltd 6 999 6 999
NWK Ltd (459) (419)2 Disclosure became relavant during the 2015 financial year, therefore no disclosure included in 2013 annual financial statements.

176
ANNEXURE B – SIGNIFICANT ASSOCIATES FOR THE YEAR ENDED 28 FEBRUARY 2015 (continued)Assets
Non-current Current Total Non-current Current Total Non-current Current Total
2015 2015 2015 2014 2014 2014 2013 2013 2013
Associate R’000 R’000 R’000 R’000 R’000 R’000 R’000 R’000 R’000
Agri Voedsel Ltd – 2 067 645 6 203 2 073 848 1 963 249 4 758 1 968 007
Pioneer Food Group Ltd 5 422 500 5 420 900 10 843 400 – –
Kaap Agri Ltd 529 658 1 840 595 2 370 253 454 567 1 664 015 2 118 582 408 381 1 464 031 1 872 412
Quantum Foods Holdings Ltd 1 061 357 985 291 2 046 648 – –
NWK Ltd – 935 900 1 477 300 2 413 200 763 900 1 532 700 2 296 600
Suidwes Investments Ltd – 853 633 1 386 291 2 239 924 610 624 961 286 1 571 910
Capevin Holdings Ltd – 2 095 530 2 641 2 098 171 1 794 697 3 445 1 798 142
Liabilities
Non-current Current Total Non-current Current Total Non-current Current Total
2015 2015 2015 2014 2014 2014 2013 2013 2013
Associate R’000 R’000 R’000 R’000 R’000 R’000 R’000 R’000 R’000
Agri Voedsel Ltd – 4 177 4 177 4 811 4 811
Pioneer Food Group Ltd 2 308 600 3 920 700 6 229 300 – –
Kaap Agri Ltd 30 875 1 224 010 1 254 885 24 907 1 097 787 1 122 694 21 723 955 746 977 469
Quantum Foods Holdings Ltd 195 922 389 502 585 424 – –
NWK Ltd – 251 600 780 300 1 031 900 72 100 833 900 906 000
Suidwes Investments Ltd – 1 079 863 546 529 1 626 392 797 444 239 175 1 036 619
Capevin Holdings Ltd – 47 5 148 5 195 47 7 069 7 116

177
ANNEXURE B – SIGNIFICANT ASSOCIATES FOR THE YEAR ENDED 28 FEBRUARY 2015 (continued)
Reconciliation of summarised financial information to carrying value of most significant investment:
Pioneer Food Group Ltd1
2015R’000
Total assets reported above 10 843 400Total liabilities reported above (6 229 300)
Net assets reported above 4 614 100Non-controlling interest (10 524)
Equity attributable to owners of the parent 4 603 576Non-current assets and liabilities held for sale2 (1 498 718)
3 104 858
Group’s economic interest in the associate (%) 31,7
Group’s interest in equity attributable to owners of the parent 983 309Deemed goodwill included in associate's carrying value3 3 790 937
Associate carrying value 4 774 2461 Accounts are most recently reported publicly available results as at 30 September 2014.2 Pioneer Foods Ltd unbundled its shareholding in Quantum Foods Ltd subsequent to 30 September 2014 (being classified as a
disposal group held for sale at such reporting date).3 Also include timing differences emanating from lag period accounting adjustments.
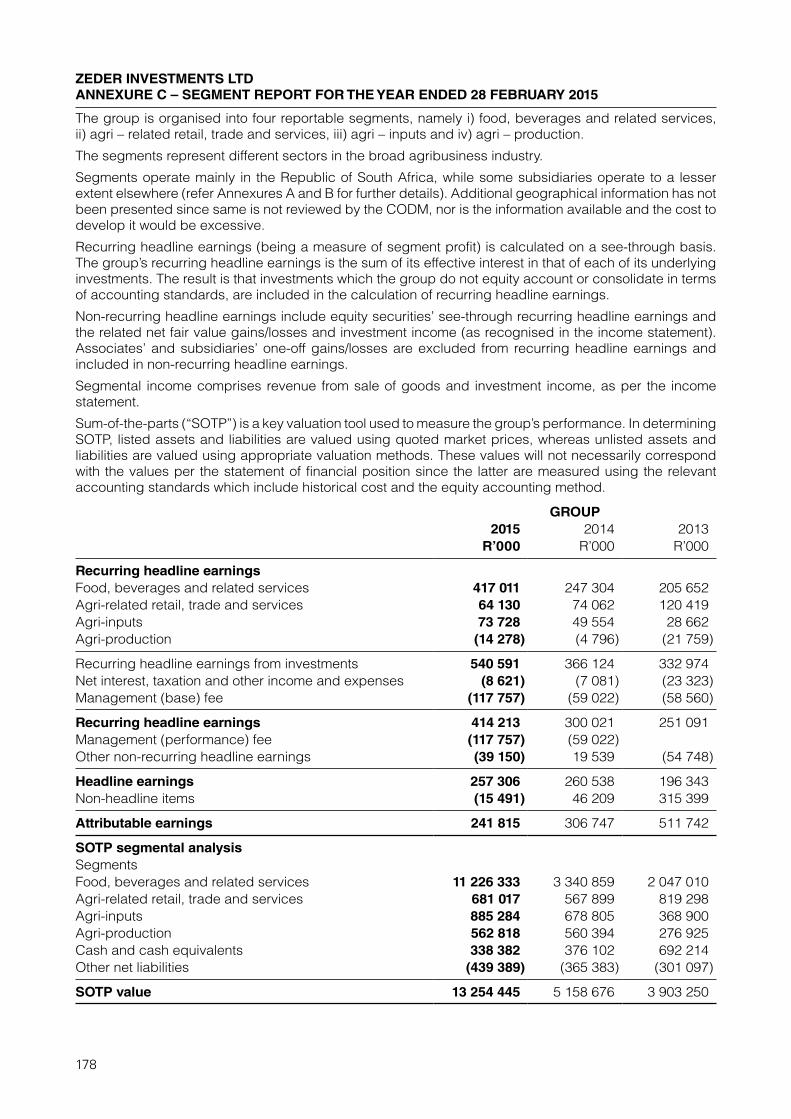
178
ZEDER INVESTMENTS LTDANNEXURE C – SEGMENT REPORT FOR THE YEAR ENDED 28 FEBRUARY 2015
The group is organised into four reportable segments, namely i) food, beverages and related services, ii) agri – related retail, trade and services, iii) agri – inputs and iv) agri – production.
The segments represent different sectors in the broad agribusiness industry.
Segments operate mainly in the Republic of South Africa, while some subsidiaries operate to a lesser extent elsewhere (refer Annexures A and B for further details). Additional geographical information has not been presented since same is not reviewed by the CODM, nor is the information available and the cost to develop it would be excessive.
Recurring headline earnings (being a measure of segment profit) is calculated on a see-through basis. The group’s recurring headline earnings is the sum of its effective interest in that of each of its underlying investments. The result is that investments which the group do not equity account or consolidate in terms of accounting standards, are included in the calculation of recurring headline earnings.
Non-recurring headline earnings include equity securities’ see-through recurring headline earnings and the related net fair value gains/losses and investment income (as recognised in the income statement). Associates’ and subsidiaries’ one-off gains/losses are excluded from recurring headline earnings and included in non-recurring headline earnings.
Segmental income comprises revenue from sale of goods and investment income, as per the income statement.
Sum-of-the-parts (“SOTP”) is a key valuation tool used to measure the group’s performance. In determining SOTP, listed assets and liabilities are valued using quoted market prices, whereas unlisted assets and liabilities are valued using appropriate valuation methods. These values will not necessarily correspond with the values per the statement of financial position since the latter are measured using the relevant accounting standards which include historical cost and the equity accounting method.
GROUP2015 2014 2013
R’000 R’000 R’000
Recurring headline earningsFood, beverages and related services 417 011 247 304 205 652Agri-related retail, trade and services 64 130 74 062 120 419Agri-inputs 73 728 49 554 28 662Agri-production (14 278) (4 796) (21 759)
Recurring headline earnings from investments 540 591 366 124 332 974Net interest, taxation and other income and expenses (8 621) (7 081) (23 323)Management (base) fee (117 757) (59 022) (58 560)
Recurring headline earnings 414 213 300 021 251 091Management (performance) fee (117 757) (59 022)Other non-recurring headline earnings (39 150) 19 539 (54 748)
Headline earnings 257 306 260 538 196 343Non-headline items (15 491) 46 209 315 399
Attributable earnings 241 815 306 747 511 742
SOTP segmental analysisSegmentsFood, beverages and related services 11 226 333 3 340 859 2 047 010Agri-related retail, trade and services 681 017 567 899 819 298Agri-inputs 885 284 678 805 368 900Agri-production 562 818 560 394 276 925Cash and cash equivalents 338 382 376 102 692 214Other net liabilities (439 389) (365 383) (301 097)
SOTP value 13 254 445 5 158 676 3 903 250

179
ANNEXURE C – SEGMENT REPORT FOR THE YEAR ENDED 28 FEBRUARY 2015 (continued)
Income segmental analysis
GROUP2015 2014 2013
R’000 R’000 R’000
Segment profit before taxFood, beverages and related services 358 891 265 516Agri-related retail, trade and services 58 268 75 575Agri-inputs 70 603 46 271Agri-production (29 768) (17 110)Management fees and other income and expenses (96 959) 90 942
Profit before tax 361 035 461 194 –
Food, beverages and related services 7 438 026 5 442 658 –
Revenue from sale of goods 7 392 421 5 407 343Investment income 45 605 35 315Agri-related retail, trade and servicesInvestment income 3 496 5 792Agri-inputs 951 117 467 780 266 602
Revenue from sale of goods 946 573 465 417 264 746Investment income 4 544 2 363 1 856
Agri-production 352 974 137 947 63 684
Revenue from sale of goods 352 974 137 940 63 367Investment income 7 317Unallocated investment income (mainly head office interest income) 24 699 23 173 5 137
IFRS revenue 8 766 816 6 075 054 341 215

180
Annexure 4
PRO FORMA FINANCIAL INFORMATION OF ZEDER
The pro forma financial information of Zeder at 28 February 2015 is set out below. The pro forma financial information has been prepared for illustrative purposes only to provide information on how the Proposed Transaction might have impacted on the financial position, changes in equity and results of operations of Zeder. Due to its nature, the pro forma financial information may not fairly present Zeder’s financial position, changes in equity, results of operations or cash flows after the implementation of the Proposed Transaction. The pro forma financial information is presented in a manner that is consistent with the accounting policies of Zeder.
The pro forma financial information set out below, having been prepared in accordance with the South African Institute of Chartered Accountants’ Guide on Pro Forma Financial Information, should be read in conjunction with the report of the Independent Reporting Accountants, which is included as Annexure 5 to this Circular.
The directors of Zeder are responsible for the preparation of the pro forma financial information. The pro forma statement of financial position of Zeder has been prepared on the assumption that the Proposed Transaction was effected on 28 February 2015, while the pro forma income statement and the pro forma statement of comprehensive income have been prepared on the assumption that the Proposed Transaction was effected on 1 March 2014.
PRO FORMA CONSOLIDATED STATEMENT OF FINANCIAL POSITION AT 28 FEBRUARY 2015
Pro formaZeder1 Scheme2, 3 after4
R’000 R’000 R’000
ASSETSNon-current assets 8 003 349 – 8 003 349
Property, plant and equipment 1 223 209 1 223 209Intangible assets 600 729 600 729Biological assets 181 524 181 524Investment in ordinary shares of associates 5 703 989 5 703 989Loans to associates 30 030 30 030Investment in ordinary shares of joint ventures 39 39Loans to joint ventures 81 81Equity securities 51 008 51 008Loans and advances 114 409 114 409Deferred income tax assets 63 869 63 869Employee benefits 34 462 34 462
Current assets 3 132 123 (4 389) 3 127 734
Biological assets 92 808 92 808Inventories 988 105 988 105Trade and other receivables 1 259 979 1 259 979Derivative financial assets 24 24Current income tax receivables 21 208 21 208Cash, money market investments and other cash equivalents 769 999 (4 389) 765 610
Non-current assets held for sale 30 378 30 378
Total assets 11 165 850 (4 389) 11 161 461

181
Pro formaZeder1 Scheme2, 3 after4
R’000 R’000 R’000
EQUITY AND LIABILITIESEquity attributable to owners of the parentStated capital 5 095 256 607 721 5 702 977Other reserves 54 067 54 067Retained earnings 1 983 375 (316 848) 1 666 527
7 132 698 290 873 7 423 571Non-controlling interest 607 845 (295 262) 312 583
Total equity 7 740 543 (4 389) 7 736 154
Non-current liabilities 1 273 712 – 1 273 712
Deferred income tax liabilities 105 627 105 627Borrowings 969 938 969 938Derivative financial liabilities 63 644 63 644Employee benefits 134 503 134 503
Current liabilities 2 151 595 – 2 151 595
Borrowings 902 373 902 373Trade and other payables 1 153 236 1 153 236Derivative financial liabilities 417 417Current income tax payables 30 928 30 928Employee benefits 64 641 64 641
Total liabilities 3 425 307 – 3 425 307
Total equity and liabilities 11 165 850 (4 389) 11 161 461
Number of shares in issue (’000) 1 443 844 69 558 1 513 402Net asset value per share (cents) 494,0 490,5Net tangible asset value per share (cents) 452,4 450,8
Notes and assumptions:1 Extracted, without adjustment, from the audited consolidated financial statements of Zeder for the year ended 28 February 2015, as
set out in Annexure 3 to this Circular.2 The increase in stated capital represents the acquisition of 81 832 865 Capespan Shares not already held by Zeder or Capespan
management (by way of the Scheme), in exchange for the issue of the Scheme Consideration Shares. The transaction is accounted for at a value of R607 721 000, which is calculated by multiplying the Scheme Consideration Shares with their market value of R8,80 per share, being the JSE-listed share price at the Last Practicable Date, net of estimated transaction costs (including value added tax) of R4 389 000. Transaction costs are capital in nature, not tax deductible and accounted for as a deduction against stated capital.
3 The decrease in retained earnings of R316 848 000 represents the excess of the fair value of the Scheme Consideration Shares, as at the Last Practicable Date, over the accounting carrying value of the non-controlling interest acquired.
4 Represents the pro forma financial results after incorporating the adjustments set out above.
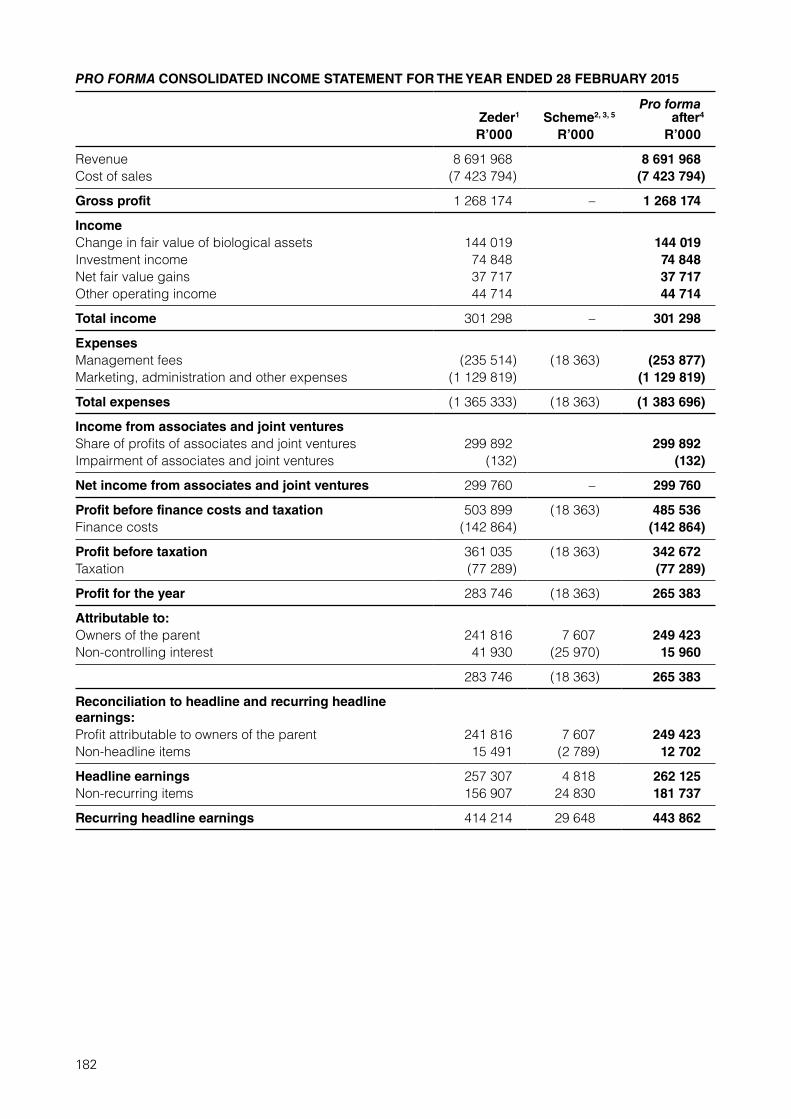
182
PRO FORMA CONSOLIDATED INCOME STATEMENT FOR THE YEAR ENDED 28 FEBRUARY 2015
Pro formaZeder1 Scheme2, 3, 5 after4
R’000 R’000 R’000
Revenue 8 691 968 8 691 968Cost of sales (7 423 794) (7 423 794)
Gross profit 1 268 174 – 1 268 174
IncomeChange in fair value of biological assets 144 019 144 019Investment income 74 848 74 848Net fair value gains 37 717 37 717Other operating income 44 714 44 714
Total income 301 298 – 301 298
ExpensesManagement fees (235 514) (18 363) (253 877)Marketing, administration and other expenses (1 129 819) (1 129 819)
Total expenses (1 365 333) (18 363) (1 383 696)
Income from associates and joint venturesShare of profits of associates and joint ventures 299 892 299 892Impairment of associates and joint ventures (132) (132)
Net income from associates and joint ventures 299 760 – 299 760
Profit before finance costs and taxation 503 899 (18 363) 485 536Finance costs (142 864) (142 864)
Profit before taxation 361 035 (18 363) 342 672Taxation (77 289) (77 289)
Profit for the year 283 746 (18 363) 265 383
Attributable to:Owners of the parent 241 816 7 607 249 423Non-controlling interest 41 930 (25 970) 15 960
283 746 (18 363) 265 383
Reconciliation to headline and recurring headline earnings:Profit attributable to owners of the parent 241 816 7 607 249 423Non-headline items 15 491 (2 789) 12 702
Headline earnings 257 307 4 818 262 125Non-recurring items 156 907 24 830 181 737
Recurring headline earnings 414 214 29 648 443 862

183
Pro formaZeder1 Scheme2, 3, 5 after4
R’000 R’000 R’000
Weighted average number of shares in issue (’000)Basic 1 172 002 69 558 1 241 560Diluted 1 172 002 69 558 1 241 560Earnings per share (cents)Attributable – basic 20,6 20,1Attributable – diluted 20,6 20,1Headline – basic 22,0 21,1Headline – diluted 22,0 21,1Recurring headline 35,3 35,8
Notes and assumptions:1 Extracted, without adjustment, from the audited consolidated financial statements of Zeder for the year ended 28 February 2015, as set
out in Annexure 3 to this Circular.2 The increase of R18 363 000 in management fees was calculated in accordance with Zeder’s existing management fee agreement and
includes both the management base fee, calculated at 1.5% of the increased market capitalisation, as well as the performance fee. The increased market capitalisation was calculated with reference to the Scheme Consideration Shares and the JSE-listed share price at the Last Practicable Date of R8.80 per share. The performance fee is calculated annually, with reference to the Zeder share price, at the rate of 20% above the benchmark, being the GOVI-index plus 4%. The maximum performance fee for any financial year shall not exceed the annual management base fee and any excess is carried forward as a reduction in the benchmark for the next year.
3 The R7 607 000 increase in profit for the year attributable to owners of the parent represents the increased interest of R25 970 000 in Capespan’s earnings, offset by the aforementioned higher management fee expense of R18 363 000.
4 Represents the pro forma financial results after incorporating the adjustments set out above.
5 All adjustments are expected to have a continuing effect on the income statement.

184
PRO FORMA CONSOLIDATED STATEMENT OF COMPREHENSIVE INCOME FOR THE YEAR ENDED 28 FEBRUARY 2015
Pro formaZeder1 Scheme2, 3, 5 after4
R’000 R’000 R’000
Profit for the year 283 746 (18 363) 265 383Other comprehensive loss for the year, net of taxation (30 963) – (30 963)
Items that will be reclassified to profit or lossCurrency translation movements (19 012) (19 012)Reclassification of foreign exchange gains on long-term loan forming part of net foreign investment (1 015) (1 015)Fair value gains on available-for-sale investments 792 792Share of other comprehensive losses of associates (12 725) (12 725)Cash flow hedges (5 709) (5 709)Recycling of cash flow hedges 25 010 25 010
Items that will not be reclassified to profit or lossActuarial losses on employee defined benefit plans (18 304) (18 304)
Total comprehensive income for the year 252 783 (18 363) 234 420
Attributable to:Owners of the parent 217 522 13 679 231 201Non-controlling interest 35 261 (32 042) 3 219
252 783 (18 363) 234 420
Notes and assumptions:1 Extracted, without adjustment, from the audited consolidated financial statements of Zeder for the year ended 28 February 2015, as set
out in Annexure 3 to this Circular.2 The increase in total comprehensive income for the year attributable to owners of the parent represents the R7 607 000 additional profit
for the year attributable to owners of the parent (as set out in the pro forma income statement above), together with the increased interest in Capespan’s other comprehensive income of R6 072 000.
3 The decrease in total comprehensive income for the year attributable to non-controlling interest represents the R25 970 000 decrease in profit for the year attributable to non-controlling interest (as set out in the pro forma income statement above), together with the reduced interest in Capespan’s other comprehensive income of R6 072 000.
4 Represents the pro forma financial results after incorporating the adjustments set out above.5 All adjustments are expected to have a continuing effect on the statement of comprehensive income.

185
Annexure 5
INDEPENDENT REPORTING ACCOUNTANTS’ REPORT ON THE PRO FORMA FINANCIAL INFORMATION OF ZEDER
The Directors
Zeder Investments Limited1st FloorOu Kollege Building35 Kerk StreetStellenbosch7600
INDEPENDENT REPORTING ACCOUNTANTS’ ASSURANCE REPORT ON THE COMPILATION OF PRO FORMA FINANCIAL INFORMATION OF ZEDER INVESTMENTS LIMITED (“CLIENT” OR “THE COMPANY”)
Introduction
The Company and Capespan Group Limited are issuing a combined circular to Capespan Group Limited shareholders (“Combined Circular”) regarding the scheme of arrangement (“the Proposed Transaction”).
At your request and for the purposes of the Combined Circular to be dated on or about 25 May 2015, we present our assurance report on the compilation of the pro forma financial information of the Client by the directors. The pro forma financial information, presented in Annexure 4 to the Combined Circular, consists of the pro forma statement of financial position as at 28 February 2015, the pro forma income statement and the pro forma statement of comprehensive income for the 12 months ended 28 February 2015 and the pro forma financial effects (“the Pro Forma Financial Information”).
The Pro Forma Financial Information has been compiled by the directors to illustrate the impact of the Proposed Transaction on the Company’s reported financial position as at 28 February 2015, and the Company’s financial performance for the period then ended, as if the Proposed Transaction had taken place at 28 February 2015 and 1 March 2014, respectively. As part of this process, information about the Company’s financial position and financial performance has been extracted by the directors from the Company’s financial statements for the year ended 28 February 2015, on which an audit report has been published.
Directors’ responsibility
The directors of the Company are responsible for the compilation, contents and presentation of the Pro Forma Financial Information on the basis of the applicable criteria described in Annexure 4 to the Combined Circular. The directors of the Company are also responsible for the financial information from which it has been prepared.
Reporting accountants’ responsibility
Our responsibility is to express a reasonable assurance opinion about whether the Pro Forma Financial Information has been compiled, in all material respects, by the directors on the basis described in Annexure 4 to the Combined Circular based on our procedures performed. We conducted our engagement in accordance with the International Standard on Assurance Engagements (ISAE) 3420, Assurance Engagements to Report on the Compilation of Pro Forma Financial Information Included in a Prospectus. This standard requires that we comply with ethical requirements and plan and perform our procedures to obtain reasonable assurance about whether the Pro Forma Financial Information has been compiled, in all material respects, on the basis described in Annexure 4 to the Combined Circular.

186
For purposes of this engagement, we are not responsible for updating or reissuing any reports or opinions on any historical financial information used in compiling the Pro Forma Financial Information, nor have we, in the course of this engagement, performed an audit or review of the financial information used in compiling the Pro Forma Financial Information.
As the purpose of Pro Forma Financial Information included in a Combined Circular is solely to illustrate the impact of a significant corporate action or event on unadjusted financial information of the entity as if the corporate action or event had occurred or had been undertaken at an earlier date selected for purposes of the illustration, we do not provide any assurance that the actual outcome of the event or transaction would have been as presented.
A reasonable assurance engagement to report on whether the Pro Forma Financial Information has been compiled, in all material respects, on the basis of the applicable criteria involves performing procedures to assess whether the applicable criteria used in the compilation of the Pro Forma Financial Information provides a reasonable basis for presenting the significant effects directly attributable to the corporate action or event, and to obtain sufficient appropriate evidence about whether:
• the related pro forma adjustments give appropriate effect to those criteria; and• the Pro Forma Financial Information reflects the proper application of those adjustments to the unadjusted
financial information.
Our procedures selected depend on our judgment, having regard to our understanding of the nature of the Company, the corporate action or event in respect of which the Pro Forma Financial Information has been compiled, and other relevant engagement circumstances.
Our engagement also involves evaluating the overall presentation of the Pro Forma Financial Information.
We believe that the evidence we have obtained is sufficient and appropriate to provide a basis for our opinion.
Opinion
In our opinion, the Pro Forma Financial Information has been compiled, in all material respects, on the basis of the applicable criteria described in Annexure 4 to the Combined Circular.
PricewaterhouseCoopers Inc.Director: NH DömanRegistered Auditor
Stellenbosch
19 May 2015

187
Annexure 6
PRO FORMA FINANCIAL EFFECTS OF THE PROPOSED TRANSACTION ON A CAPESPAN SHAREHOLDER
The pro forma financial effects of the Proposed Transaction on a Capespan Shareholder as at the most recent financial reporting date is set out below. The pro forma financial effects have been prepared for illustrative purposes only. Due to its nature, the pro forma financial effects may not fairly present a Capespan Shareholder’s financial position after the implementation of the Proposed Transaction.
The pro forma financial effects set out below, having been prepared in accordance with the South African Institute of Chartered Accountants’ Guide on Pro Forma Financial Information, should be read in conjunction with the report of the Independent Reporting Accountants, which is included as Annexure 7 to this Circular.
The directors of Capespan are responsible for the preparation of the pro forma financial effects.
The pro forma net asset value per share and tangible net asset value per share figures appearing in the table below, have been calculated on the assumption that the Proposed Transaction was effected on 28 February 2015, while the pro forma recurring headline earnings per share, headline earnings per share and attributable earnings per share figures appearing in the table below, have been calculated on the assumption that the Proposed Transaction was effected on 1 March 2014.
Resultsfor the
year ended31 December
20141Pro forma
after2 Change(cents) (cents) (%)
Share price per share (Rand) 3,97 6,50 63,7
The share price per share pro forma financial effect is the most relevant metric for assessment of the Scheme and the following pro forma financial effects do not present the premium at which the offer is made. The rationale for the Proposed Transaction is set out in paragraph 4 of this Circular.
Recurring headline earnings per share 49,4 30,4 (38,5)Headline earnings per share 30,3 17,9 (40,9)Attributable earnings per share 33,7 17,1 (49,3)Net asset value per share 462,3 416,9 (9,8)Tangible net asset value per share 362,6 383,2 5,7
Notes and assumptions:1 Extracted, without adjustment, from the audited results of Capespan for the year ended 31 December 2014, as set out in Annexure 2,
except for the “Before” share price which was Capespan’s 30-day VWAP as at 31 March 2015, while the “Pro forma after” share price was calculated using the ratio of 85 Zeder shares for every 100 Capespan shares disposed of, and Zeder’s JSE-listed 30-day VWAP of R7,64 as at 31 March 2015.
2 The “Pro forma after” column sets out the position of a Capespan Shareholder following the Proposed Transaction, now owning Zeder shares. The financial information is based on Zeder’s financial effects, as set out in Annexure 4, pursuant to the Proposed Transaction (for the year ended 28 February 2015), multiplied by the swap ratio of 0,85 to provide the pro forma financial effects for a Capespan Shareholder. Although Capespan Shareholders will be affected by the Proposed Transaction, the financial results and position of Capespan will not be affected.

188
Annexure 7
INDEPENDENT REPORTING ACCOUNTANTS’ REPORT ON THE PRO FORMA FINANCIAL EFFECTS ON A CAPESPAN SHAREHOLDER
The Directors
Capespan Group LimitedThe Vineyards Square NorthVineyards Office EstateJip de Jager RoadBellville7530
INDEPENDENT REPORTING ACCOUNTANTS’ ASSURANCE REPORT ON THE COMPILATION OF PRO FORMA FINANCIAL EFFECTS OF THE PROPOSED TRANSACTION ON A CAPESPAN GROUP LIMITED (“CAPESPAN” OR “THE COMPANY”) SHAREHOLDER
Introduction
Zeder Investments Limited (“Zeder”) and Capespan are issuing a combined circular to the Company’s shareholders (“Capespan Shareholder”) (“Combined Circular”) regarding the scheme of arrangement (“the Proposed Transaction”).
At your request and for the purposes of the Combined Circular to be dated on or about 25 May 2015, we present our assurance report on the compilation of the pro forma financial effects of a Capespan Shareholder by the directors. The pro forma financial effects, presented in Annexure 6 to the Combined Circular, consists of the net asset value per share, tangible net asset value per share, recurring headline earnings per share, headline earnings per share and attributable earnings per share (“the Pro Forma Financial Effects”).
The Pro Forma Financial Effects have been compiled by the directors to illustrate the impact of the Proposed Transaction on a Capespan Shareholder. The pro forma net asset value per share and tangible net asset value per share have been calculated on the assumption that the Proposed Transaction was effected on 28 February 2015, while the pro forma recurring headline earnings per share, headline earnings per share and attributable earnings per share have been calculated on the assumption that the Proposed Transaction was effected on 1 March 2014. As part of this process, information about Capespan’s financial position and financial performance has been extracted by the directors from the Company’s financial statements for the year ended 31 December 2014, on which an audit report has been published.
Directors’ responsibility
The directors of the Company are responsible for the compilation, contents and presentation of the Pro Forma Financial Effects on the basis of the applicable criteria described in Annexure 6 to the Combined Circular. The directors of the Company are also responsible for the financial information from which it has been prepared.
Reporting accountants responsibility
Our responsibility is to express a reasonable assurance opinion about whether the Pro Forma Financial Effects have been compiled, in all material respects, by the directors on the basis described in Annexure 6 to the Combined Circular based on our procedures performed. We conducted our engagement in accordance with the International Standard on Assurance Engagements (ISAE) 3420, Assurance Engagements to Report on the Compilation of Pro Forma Financial Information Included in a Prospectus. This standard requires that we comply with ethical requirements and plan and perform our procedures to obtain reasonable assurance about whether the Pro Forma Financial Effects have been compiled, in all material respects, on the basis described in Annexure 6 to the Combined Circular.

189
For purposes of this engagement, we are not responsible for updating or reissuing any reports or opinions on any historical financial information used in compiling the Pro Forma Financial Effects, nor have we, in the course of this engagement, performed an audit or review of the financial information used in compiling the Pro Forma Financial Effects.
As the purpose of Pro Forma Financial Effects included in the Combined Circular is solely to illustrate the impact of a significant corporate action or event on unadjusted financial information of the entity as if the corporate action or event had occurred or had been undertaken at an earlier date selected for purposes of the illustration, we do not provide any assurance that the actual outcome of the event or transaction would have been as presented.
A reasonable assurance engagement to report on whether the Pro Forma Financial Effects have been compiled, in all material respects, on the basis of the applicable criteria involves performing procedures to assess whether the applicable criteria used in the compilation of the Pro Forma Financial Effects provide a reasonable basis for presenting the significant effects directly attributable to the corporate action or event, and to obtain sufficient appropriate evidence about whether:
• the related pro forma adjustments give appropriate effect to those criteria; and• the Pro Forma Financial Effects reflect the proper application of those adjustments to the unadjusted
financial information.
Our procedures selected depend on our judgement, having regard to our understanding of the nature of the Company, the corporate action or event in respect of which the Pro Forma Financial Effects have been compiled, and other relevant engagement circumstances.
Our engagement also involves evaluating the overall presentation of the Pro Forma Financial Effects.
We believe that the evidence we have obtained is sufficient and appropriate to provide a basis for our opinion.
Opinion
In our opinion, the Pro Forma Financial Effects have been compiled, in all material respects, on the basis described in Annexure 6 to the Combined Circular.
PricewaterhouseCoopers Inc.Director: NH DömanRegistered Auditor
Stellenbosch
19 May 2015

190
Annexure 8
FOREIGN CAPESPAN SHAREHOLDERS AND EXCHANGE CONTROL REGULATIONS
1. FOREIGN CAPESPAN SHAREHOLDERS
1.1 The Scheme may be affected by the laws of the relevant jurisdiction of a Foreign Capespan Shareholder. A Foreign Capespan Shareholder should acquaint itself about and observe any applicable legal requirements of such jurisdiction in relation to all aspects of this Circular that may affect it. It is the responsibility of each Foreign Capespan Shareholder to satisfy itself as to the full observance of the laws and regulatory requirements of the relevant jurisdiction in connection with the Scheme, including the obtaining of any governmental, exchange control or other consents, the making of any filings which may be required, the compliance with other necessary formalities and the payment of any taxes or other requisite payments due in such jurisdiction.
1.2 The Scheme is governed by the laws of South Africa and is subject to any applicable laws and regulations, including the Exchange Control Regulations.
1.3 Any Capespan Shareholder who is in doubt as to its position, including, without limitation, its tax status, should consult an appropriate independent professional advisor in the relevant jurisdiction without delay.
2. EXCHANGE CONTROL REGULATIONS
The following is a summary of the Exchange Control Regulations. It is intended as a guide only and is not a comprehensive statement of the Exchange Control Regulations which apply to Scheme Participants. Scheme Participants who have any queries regarding the Exchange Control Regulations should contact their own professional advisors without delay.
2.1 Residents of the Common Monetary Area
In the case of Scheme Participants whose registered addresses in the Register are within the Common Monetary Area and whose Documents of Title are not restrictively endorsed in terms of the Exchange Control Regulations, the Scheme Consideration will be settled in the manner detailed in paragraph 4.6 of the Circular.
2.2 Emigrants from the Common Monetary Area
2.2.1 The Scheme Consideration is not freely transferable from South Africa and must be dealt with in terms of the Exchange Control Regulations.
2.2.2 The Scheme Consideration due to a Scheme Participant who is an emigrant from South Africa, whose registered address is outside the Common Monetary Area and whose Documents of Title have been restrictively endorsed under the Exchange Control Regulations, will be deposited in a blocked account with the authorised dealer in foreign exchange in South Africa controlling the Scheme Participant’s blocked assets in accordance with his instructions, against delivery of the relevant documents of title.
2.2.3 In terms of a recent relaxation to the exchange control rulings, emigrants may externalise the Scheme Consideration by making application to the Financial Surveillance Department of the South African Reserve Bank via the requisite authorised dealer channel. Previously, a 10% levy would have been payable on externalisation. This is however no longer the position and the Scheme Consideration may, on application, be externalised free of the levy.
2.2.4 The authorised dealer releasing the relevant documents of title in terms of the Scheme must countersign the form of surrender, transfer and acceptance (blue) thereby indicating that the Scheme Consideration will be placed directly in its control.
2.2.5 The attached form of surrender, transfer and acceptance (blue) makes provision for the details of the authorised dealer concerned to be provided.

191
2.3 All other non-residents of the Common Monetary Area
2.3.1 The Scheme Consideration due to an own-name Scheme Participant who is a non-resident of South Africa and who has never resided in the Common Monetary Area, whose registered address is outside the Common Monetary Area and whose Documents of Title have been restrictively endorsed under the Exchange Control Regulations, will be deposited with the authorised dealer in foreign exchange in South Africa nominated by such Scheme Participant. It will be incumbent on the Scheme Participant concerned to instruct the nominated authorised dealer as to the disposal of the Scheme Consideration against delivery of the relevant documents of title.
2.3.2 The form of surrender, transfer and acceptance (blue) attached to this Circular makes provision for the nomination required in terms of paragraph 2.3.1 above. If the information regarding the authorised dealer is not given in terms of paragraph 2.3.1 above, the Scheme Consideration will be held in trust by Zeder for the Scheme Participants concerned pending receipt of the necessary information or instruction.

192
Annexure 9
WORDING OF SECTION 115 AND SECTION 164 OF THE COMPANIES ACT
“Section 115 : Required approval for transactions contemplated in Part A
(1) Despite section 65, and any provision of a company’s Memorandum of Incorporation, or any resolution adopted by its board or holders of its securities, to the contrary, a company may not dispose of, or give effect to an agreement or series of agreements to dispose of, all or the greater part of its assets or undertaking, implement an amalgamation or a merger, or implement a scheme of arrangement, unless:
(a) the disposal, amalgamation or merger, or scheme of arrangement:
(i) has been approved in terms of this section; or
(ii) is pursuant to or contemplated in an approved business rescue plan for that company, in terms of Chapter 6; and
(b) to the extent that Parts B and C of this Chapter and the Takeover Regulations, apply to a company that proposes to:
(i) dispose of all or the greater part of its assets or undertaking;
(ii) amalgamate or merge with another company; or
(iii) implement a scheme of arrangement,
the Panel has issued a compliance certificate in respect of the transaction, in terms of section 119 4 (b), or exempted the transaction in terms of section 119(6).
(2) A proposed transaction contemplated in subsection (1) must be approved:
(a) by a special resolution adopted by persons entitled to exercise voting rights on such a matter, at a meeting called for that purpose and at which sufficient persons are present to exercise, in aggregate, at least 25% of all of the voting rights that are entitled to be exercised on that matter, or any higher percentage as may be required by the company’s Memorandum of Incorporation, as contemplated in section 64(2); and
(b) by a special resolution, also adopted in the manner required by paragraph (a), by the shareholders of the company’s holding company if any, if:
(i) the holding company is a company or an external company;
(ii) the proposed transaction concerns a disposal of all or the greater part of the assets or undertaking of the subsidiary; and
(iii) having regard to the consolidated financial statements of the holding company, the disposal by the subsidiary constitutes a disposal of all or the greater part of the assets or undertaking of the holding company; and
(c) by the court, to the extent required in the circumstances and manner contemplated in subsections (3) to (6).
(3) Despite a resolution having been adopted as contemplated in subsections (2)(a) and (b), a company may not proceed to implement that resolution without the approval of a court if:
(a) the resolution was opposed by at least 15% of the voting rights that were exercised on that resolution and, within five business days after the vote, any person who voted against the resolution requires the company to seek court approval; or
(b) the court, on an application within 10 business days after the vote by any person who voted against the resolution, grants that person leave, in terms of subsection (6), to apply to a court for a review of the transaction in accordance with subsection (7).

193
(4) For the purposes of subsections (2) and (3), any voting rights controlled by an acquiring party, a person related to an acquiring party, or a person acting in concert with either of them, must not be included in calculating the percentage of voting rights:
(a) required to be present, or actually present, in determining whether the applicable quorum requirements are satisfied; or
(b) required to be voted in support of a resolution, or actually voted in support of the resolution.
(4A) In subsection (4), ‘act in concert’ has the meaning set out in section 117(1)(b).
(5) If a resolution requires approval by a court as contemplated in terms of subsection (3)(a), the company must either:
(a) within 10 business days after the vote, apply to the court for approval, and bear the costs of that application; or
(b) treat the resolution as a nullity.
(6) On an application contemplated in subsection (3)(b), the court may grant leave only if it is satisfied that the applicant:
(a) is acting in good faith;
(b) appears prepared and able to sustain the proceedings; and
(c) has alleged facts which, if proved, would support an order in terms of subsection (7).
(7) On reviewing a resolution that is the subject of an application in terms of subsection (5)(a), or after granting leave in terms of subsection (6), the court may set aside the resolution only if:
(a) the resolution is manifestly unfair to any class of holders of the company’s securities; or
(b) the vote was materially tainted by conflict of interest, inadequate disclosure, failure to comply with the Act, the Memorandum of Incorporation or any applicable rules of the company, or other significant and material procedural irregularity.
(8) The holder of any voting rights in a company is entitled to seek relief in terms of section 164 if that person:
(a) notified the company in advance of the intention to oppose a special resolution contemplated in this section; and
(b) was present at the meeting and voted against that special resolution.
(9) If a transaction contemplated in this Part has been approved, any person to whom assets are, or an undertaking is, to be transferred, may apply to a court for an order to effect:
(a) the transfer of the whole or any part of the undertaking, assets and liabilities of a company contemplated in that transaction;
(b) the allotment and appropriation of any shares or similar interests to be allotted or appropriated as a consequence of the transaction;
(c) the transfer of shares from one person to another;
(d) the dissolution, without winding-up, of a company, as contemplated in the transaction;
(e) incidental, consequential and supplemental matters that are necessary for the effectiveness and completion of the transaction; or
(f) any other relief that may be necessary or appropriate to give effect to, and properly implement, the amalgamation or merger.
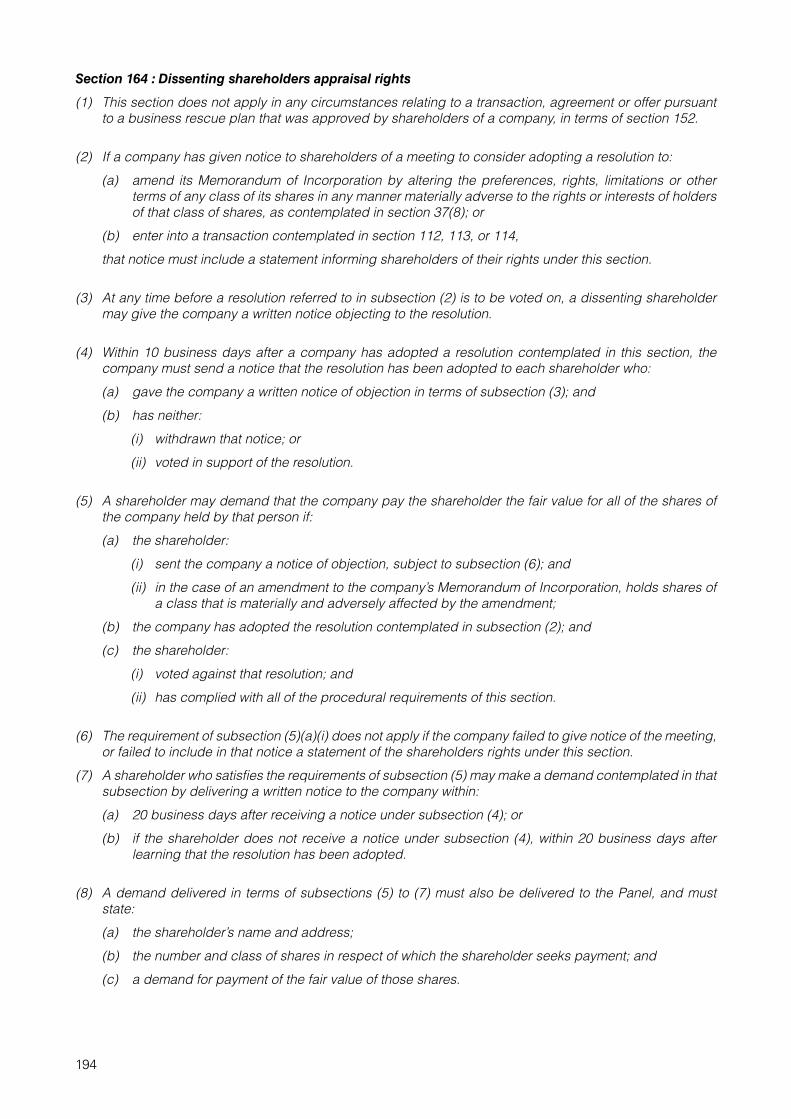
194
Section 164 : Dissenting shareholders appraisal rights
(1) This section does not apply in any circumstances relating to a transaction, agreement or offer pursuant to a business rescue plan that was approved by shareholders of a company, in terms of section 152.
(2) If a company has given notice to shareholders of a meeting to consider adopting a resolution to:
(a) amend its Memorandum of Incorporation by altering the preferences, rights, limitations or other terms of any class of its shares in any manner materially adverse to the rights or interests of holders of that class of shares, as contemplated in section 37(8); or
(b) enter into a transaction contemplated in section 112, 113, or 114,
that notice must include a statement informing shareholders of their rights under this section.
(3) At any time before a resolution referred to in subsection (2) is to be voted on, a dissenting shareholder may give the company a written notice objecting to the resolution.
(4) Within 10 business days after a company has adopted a resolution contemplated in this section, the company must send a notice that the resolution has been adopted to each shareholder who:
(a) gave the company a written notice of objection in terms of subsection (3); and
(b) has neither:
(i) withdrawn that notice; or
(ii) voted in support of the resolution.
(5) A shareholder may demand that the company pay the shareholder the fair value for all of the shares of the company held by that person if:
(a) the shareholder:
(i) sent the company a notice of objection, subject to subsection (6); and
(ii) in the case of an amendment to the company’s Memorandum of Incorporation, holds shares of a class that is materially and adversely affected by the amendment;
(b) the company has adopted the resolution contemplated in subsection (2); and
(c) the shareholder:
(i) voted against that resolution; and
(ii) has complied with all of the procedural requirements of this section.
(6) The requirement of subsection (5)(a)(i) does not apply if the company failed to give notice of the meeting, or failed to include in that notice a statement of the shareholders rights under this section.
(7) A shareholder who satisfies the requirements of subsection (5) may make a demand contemplated in that subsection by delivering a written notice to the company within:
(a) 20 business days after receiving a notice under subsection (4); or
(b) if the shareholder does not receive a notice under subsection (4), within 20 business days after learning that the resolution has been adopted.
(8) A demand delivered in terms of subsections (5) to (7) must also be delivered to the Panel, and must state:
(a) the shareholder’s name and address;
(b) the number and class of shares in respect of which the shareholder seeks payment; and
(c) a demand for payment of the fair value of those shares.

195
(9) A shareholder who has sent a demand in terms of subsections (5) to (8) has no further rights in respect of those shares, other than to be paid their fair value, unless:
(a) the shareholder withdraws that demand before the company makes an offer under subsection (11), or allows an offer made by the company to lapse, as contemplated in subsection (12)(b);
(b) the company fails to make an offer in accordance with subsection (11) and the shareholder withdraws the demand; or
(c) the company, by a subsequent special resolution, revokes the adopted resolution that gave rise to the shareholder’s rights under this section.
(10) If any of the events contemplated in subsection (9) occur, all of the shareholder’s rights in respect of the shares are reinstated without interruption.
(11) Within five business days after the later of:
(a) the day on which the action approved by the resolution is effective;
(b) the last day for the receipt of demands in terms of subsection (7)(a); or
(c) the day the company received a demand as contemplated in subsection (7)(b), if applicable, the company must send to each shareholder who has sent such a demand a written offer to pay an amount considered by the company’s directors to be the fair value of the relevant shares, subject to subsection (16), accompanied by a statement showing how that value was determined.
(12) Every offer made under subsection (11):
(a) in respect of shares of the same class or series must be on the same terms; and
(b) lapses if it has not been accepted within 30 business days after it was made.
(13) If a shareholder accepts an offer made under subsection (12):
(a) the shareholder must either in the case of:
(i) shares evidenced by certificates, tender the relevant share certificates to the company or the company’s transfer agent; or
(ii) uncertificated shares, take the steps required in terms of section 53 to direct the transfer of those shares to the company or the company’s transfer agent; and
(b) the company must pay that shareholder the agreed amount within 10 business days after the shareholder accepted the offer and:
(i) tendered the share certificates; or
(ii) directed the transfer to the company of uncertificated shares.
(14) A shareholder who has made a demand in terms of subsections (5) to (8) may apply to a court to determine a fair value in respect of the shares that were the subject of that demand, and an order requiring the company to pay the shareholder the fair value so determined, if the company has:
(a) failed to make an offer under subsection (11); or
(b) made an offer that the shareholder considers to be inadequate, and that offer has not lapsed.

196
(15) On an application to the court under subsection (14):
(a) all dissenting shareholders who have not accepted an offer from the company as at the date of the application must be joined as parties and are bound by the decision of the court;
(b) the company must notify each affected dissenting shareholder of the date, place and consequences of the application and of their right to participate in the court proceedings; and
(c) the court:
(i) may determine whether any other person is a dissenting shareholder who should be joined as a party;
(ii) must determine a fair value in respect of the shares of all dissenting shareholders, subject to subsection (16);
(iii) in its discretion may:
(aa) appoint one or more appraisers to assist it in determining the fair value in respect of the shares; or
(bb) allow a reasonable rate of interest on the amount payable to each dissenting shareholder from the date the action approved by the resolution is effective, until the date of payment;
(iv) may make an appropriate order of costs, having regard to any offer made by the company, and the final determination of the fair value by the court; and
(v) must make an order requiring:
(aa) the dissenting shareholders to either withdraw their respective demands or to comply with subsection (13)(a); and
(bb) the company to pay the fair value in respect of their shares to each dissenting shareholder who complies with subsection (13)(a), subject to any conditions the court considers necessary to ensure that the company fulfils its obligations under this section.
(15A) At any time before the court has made an order contemplated in subsection (15)(c)(v), a dissenting shareholder may accept the offer made by the company in terms of subsection (11), in which case:
(a) that shareholder must comply with the requirements of subsection 13(a); and
(b) the company must comply with the requirements of subsection 13(b).
(16) The fair value in respect of any shares must be determined as at the date on which, and time immediately before, the company adopted the resolution that gave rise to a shareholder’s rights under this section.
(17) If there are reasonable grounds to believe that compliance by a company with subsection (13)(b), or with a court order in terms of subsection (15)(c)(v)(bb), would result in the company being unable to pays its debts as they fall due and payable for the ensuing 12 months:
(a) the company may apply to a court for an order varying the company’s obligations in terms of the relevant subsection; and
(b) the court may make an order that:
(i) is just and equitable, having regard to the financial circumstances of the company; and
(ii) ensures that the person to whom the company owes money in terms of this section is paid at the earliest possible date compatible with the company satisfying its other financial obligations as they fall due and payable.

197
(18) If the resolution that gave rise to a shareholder’s rights under this section authorised the company to amalgamate or merge with one or more other companies, such that the company whose shares are the subject of a demand in terms of this section has ceased to exist, the obligations of that company under this section are obligations of the successor to that company resulting from the amalgamation or merger.
(19) For greater certainty, the making of a demand, tendering of shares and payment by a company to a shareholder in terms of this section do not constitute a distribution by the company, or an acquisition of its shares by the company within the meaning of section 48, and therefore are not subject to:
(a) the provisions of that section; or
(b) the application by the company of the solvency and liquidity test set out in section 4.
(20) Except to the extent:
(a) expressly provided in this section; or
(b) that the Panel rules otherwise in a particular case,
a payment by a company to a shareholder in terms of this section does not obligate any person to make a comparable offer under section 125 to any other person.”

198
Annexure 10
TABLE OF ENTITLEMENTS
The following table sets out the number of Zeder Shares to which Scheme Participants will be entitled, should the Scheme be implemented. Scheme Participants will be entitled to receive 85 (eighty five) Zeder Shares for every 100 (one hundred) Scheme Shares disposed of by Scheme Participants in terms of the Scheme, as illustrated below:
Number of Scheme Shares held before the Scheme
Zeder Share entitlement
Number of Scheme Shares held before the
SchemeZeder Share entitlement
Number of Scheme Shares held before the
SchemeZeder Share entitlement
1 1 41 35 81 692 2 42 36 82 703 3 43 37 83 714 3 44 37 84 715 4 45 38 85 726 5 46 39 86 737 6 47 40 87 748 7 48 41 88 759 8 49 42 89 7610 9 50 43 90 7711 9 51 43 91 7712 10 52 44 92 7813 11 53 45 93 7914 12 54 46 94 8015 13 55 47 95 8116 14 56 48 96 8217 14 57 48 97 8218 15 58 49 98 8319 16 59 50 99 8420 17 60 51 100 8521 18 61 52 125 10622 19 62 53 150 12823 20 63 54 175 14924 20 64 54 200 17025 21 65 55 1 000 85026 22 66 56 5 000 4 25027 23 67 57 10 000 8 50028 24 68 58 20 000 17 00029 25 69 59 50 000 42 50030 26 70 60 100 000 85 00031 26 71 60 200 000 170 00032 27 72 61 300 000 255 00033 28 73 62 400 000 340 00034 29 74 63 500 000 425 00035 30 75 64 1 000 000 850 00036 31 76 65 2 000 000 1 700 00037 31 77 65 3 000 000 2 550 00038 32 78 66 4 000 000 3 400 00039 33 79 67 5 000 000 4 250 00040 34 80 68 10 000 000 8 500 000

199
Annexure 11A
IRREVOCABLE UNDERTAKINGS BY CAPESPAN SHAREHOLDERS
As at the Last Practicable Date, the following Capespan shareholders have provided irrevocable undertakings to vote in favour of all Capespan Shareholder resolutions necessary to approve and implement the Scheme:
No. Capespan shareholderNumber of
Capespan sharesPercentage of
available vote (%)
1. CP Minnaar en Seun 1 079 188 1.3 2. KF du Toit 10 000 0.0 3. AD Roux 469 271 0.6 4. J Baldie and Sons CC 1 063 416 1.3 5. I Pretorious 288 500 0.3 6. JC Kunz 30 000 0.0 7. CJ de Waal 23 108 0.0 8. CS Botha 23 108 0.0 9. PSG Clients 384 854 0.5 10. Birchmore Trust 96 920 0.1 11. NC de Beer 2 013 0.0 12. J Fourie 8 000 0.0 13. DJ Burger 12 200 0.0 14. M Smith 48 000 0.1 15. Easy Nominees 639 389 0.8 16. Bo – Radyn 363 558 0.4 17. Maritzrak 9 100 000 0.1 18. Boet van der Berg 183 523 0.2 19. PB Reyneke 276 901 0.3 20. Oseiland Boerdery 251 830 0.3 21. LS Marais 160 955 0.2 22. Peregrine Nominees 1 398 328 1.7 23. PM Micklem 596 664 0.7 24. SC Rossouw en Seun trust 1 901 456 2.3 25. Frank le Roux Familietrust 221 533 0.3 26. AE Jordaan 200 000 0.2 27. AP Kuiper 622 295 0.8 28. AF de Villiers 123 038 0.1 29. WJ Bouwer 233 076 0.3 30. La Plaisante Estate 475 399 0.6 31. Damar Boerdery 277 305 0.3 32. Sunny Acres Trust 176 374 0.2 33. JA le Roux en Seuns 283 791 0.3 34. Jenita Landgoed 146 678 0.2 35. HJ Groenewald 22 786 0.0 36. Jennifer Heatlie 97 858 0.1 37. Glen Heatlie Trust 4 464 0.0 38. PJ de Bruyn 113 644 0.1 39. Fairview Landgoed 393 483 0.5 40. Mhlati Sugar 203 949 0.2 41. Stellenpak 3 000 000 3.6 42. PSG Nominees 1 471 027 1.8 43. JM Kriel 57 825 0.1 44. Petrus le Grange 111 653 0.1 45. SL Jordaan Trust 250 000 0.3

200
No. Capespan shareholderNumber of
Capespan sharesPercentage of
available vote (%)
46. DH Hill 200 001 0.2 47. Mahela Boerderye 2 573 552 3.1 48. Candice Segar 11 000 0.0 49. S W B Boerderye, Klipbult, Suiderland plase, Radyn 1 374 164 1.7 50. JP Theron 140 000 0.2 51. BNS Nominees 749 093 0.9 52. Ivy Asset Management 395 534 0.5 53. Seweweeks Farms 97 272 0.1 54. H Brummund 101 482 0.1 55. JDJ Trust 137 536 0.2 56. Andrijak Plase 116 646 0.1 57. Salem Boerdery 154 656 0.2 58. Sugwater Boerdery 41 417 0.1 59. Bestwyk Plase 123 707 0.1 60. Brynarfor Farm 39 271 0.0 61. Gardenview Nominees 1 347 269 1.6 62. ES Moola 122 802 0.1 63. Devsand 10 000 0.0 64. EMAC Corbett 15 000 0.0 65. Louterwater Landgoed 726 653 0.9 66. Raffi Abdoola 29 625 0.0 67. Taryn Orkin 72 000 0.1 68. HF le Roux 22 897 0.0 69. Bakgat Boerdery 43 597 0.1 70. J Hutton Squire 249 101 0.3 71. MA Moola 61 401 0.1 72. I Moola 61 401 0.1 73. Hercules Viljoen 199 650 0.2 74. A Moola 36 841 0.0 75. MA Tarmahomed 122 803 0.1 76. Capital Chip Trading 31 960 0.0 77. Tambankulu Estates 2 343 160 2.8 78. Lujes Trust 137 536 0.279. Mscl Trust 137 536 0.280. Alicedale Estates 481 843 0.681. The G Langton Family Trust 129 803 0.282. Mvutshini Estate 504 552 0.6
Total 31 040 121 37.6

201
Annexure 11B
DEALINGS BY PROVIDERS OF IRREVOCABLE UNDERTAKINGS
The table below details, as far as can be ascertained, the dealings in Capespan Shares, during the six-month period prior to 8 April 2015 and during the period from 8 April 2015 up to the Last Practicable Date, by those Capespan Shareholders who have provided irrevocable undertakings to vote in favour of the Scheme Resolution:
No. Capespan shareholder Date Transaction Volume Price
1. ES Moola 05/02/2015 BUY 122 802 3522. IM Moola 05/02/2015 BUY 61 401 3523. MA Tarmahomed 05/02/2015 BUY 122 803 3524. Capital Chip Trading 05/02/2015 BUY 24 560 3525. AM Moola 05/02/2015 BUY 36 841 3526. MAH Moola 05/02/2015 BUY 61 401 3527. SJ Toerusting Trust (PSG Nominees) 09/02/2015 BUY 21 665 3908. Tebe Beleggings Trust (PSG Nominees) 09/02/2015 BUY 21 665 3909. RA Abdoola 03/03/2015 BUY 29 625 395

202
CAPESPAN GROUP LIMITED
(Incorporated in the Republic of South Africa)(Registration number 2008/016971/06)
(“Capespan” or “the Company”)
NOTICE OF GENERAL MEETING OF CAPESPAN SHAREHOLDERS
NOTICE IS HEREBY GIVEN that a General Meeting of Capespan Shareholders will be held at 11:00 on Wednesday, 24 June 2015 at Spier Wine Estate, Baden Powell Drive, Stellenbosch.
Purpose
The purpose of the General Meeting of Capespan Shareholders is to consider and, if deemed fit, to approve, with or without modification, the resolution set out in this notice of general meeting.
Notes:
– The definitions and interpretations commencing on page 9 of the circular to which this notice of general meeting is attached (“the Circular”), apply mutatis mutandis to this notice and to the resolution set out below.
– For Special Resolution Number 1 to be approved by Capespan Shareholders, it must be supported by at least 75% of the voting rights exercised on the resolution.
– Quorum requirement for Special Resolution Number 1 to be adopted is sufficient persons being present to exercise, in aggregate, at least 25% of all voting rights that are entitled to be exercised on the special resolution.
– The voting rights otherwise exercisable by Zeder and the Capespan Management Shareholders shall not be taken into account for any purposes in respect of Special Resolution Number 1 (i.e. as to whether or not a quorum is present to vote on Special Resolution Number 1 or whether or not the required number of voting rights have been exercised in support of Special Resolution Number 1).
– In terms of Regulation 84 of the Companies Regulations, a presumption exists that Zeder Directors are acting in concert with Zeder in respect of the Scheme. Accordingly, the voting rights otherwise exercisable by any Zeder Directors and any persons who were Zeder Directors at the time the Zeder Board resolved to make the offer to Capespan Shareholders and who hold Capespan Shares on the Scheme Voting Record Date, shall not be taken into account for any purposes in respect of Special Resolution Number 1 (i.e. as to whether or not a quorum is present to vote on Special Resolution Number 1 or whether or not the required number of voting rights have been exercised in support of Special Resolution Number 1).
– The date on which Capespan Shareholders must have been recorded as such in the Register for purposes of being entitled to receive this notice is Friday, 15 May 2015.
SPECIAL RESOLUTION NUMBER 1 – Approval of the Scheme in terms of sections 114 and 115 of the Companies Act
“RESOLVED THAT, as a special resolution in terms of section 115(2)(a) of the Companies Act, the Scheme proposed by the Capespan Board between the Company and its shareholders, be and is hereby APPROVED on the terms set out in the Circular, with the Scheme constituting a scheme of arrangement under section 114 of the Companies Act, in terms of which Zeder will, if the Scheme becomes operative, acquire, for the scheme consideration of 85 (eighty five) Zeder Shares for every 100 (one hundred) Scheme Shares disposed of in terms of the Scheme, all the issued Capespan Shares (save for the Treasury Shares and those Capespan Shares currently held by the Zeder Group, the Capespan Management Shareholders and by Dissenting Shareholders who do not withdraw their respective demands made in terms of sections 164(5) to 164(8) of the Companies Act or allow any offers by the Company to them in terms of section 164(11) of the Companies Act to lapse)”.
Reason and effect
Capespan Shareholders are referred to the content of the Circular for more information relating to the reason for and effect of Special Resolution Number 1.
VOTING AND PROXIES
The date on which Capespan Shareholders must be recorded in the Register for purposes of being entitled to attend and vote at the General Meeting is Friday, 19 June 2015. The last day to trade in order to be entitled to attend and vote at the General Meeting is Friday, 12 June 2015.

203
Section 63(1) of the Companies Act requires that meeting participants provide satisfactory identification. Accordingly, meeting participants will be required to provide proof of identification to the reasonable satisfaction of the chairman of the General Meeting of Capespan Shareholders and must accordingly bring a copy of their identity document, passport or drivers’ license to the General Meeting of Capespan Shareholders. If in doubt as to whether any document will be regarded as satisfactory proof of identification, meeting participants should contact the Transfer Secretaries for guidance.
A Capespan Shareholder entitled to attend, speak and vote at the General Meeting is entitled to appoint one or more proxies to attend, speak and vote in his/her stead. A proxy need not be a shareholder of the Company. For the convenience of Capespan Shareholders, a form of proxy (yellow) is attached hereto. Completion of a form of proxy will not preclude such Capespan Shareholder from attending and voting (in preference to that shareholder’s proxy) at the General Meeting of Capespan Shareholders.
Duly completed forms of proxy and the authority (if any) under which it is signed must reach the Transfer Secretaries (or Capespan’s company secretary) at the address given below by no later than 11:00 on Monday, 22 June 2015 (or by no later than 48 hours before any adjournment of such General Meeting, excluding Saturdays, Sundays and official public holidays) or, alternatively, such forms of proxy may be handed to the chairman of the General Meeting of Capespan Shareholders immediately prior to the commencement of such General Meeting.
APPRAISAL RIGHTS FOR DISSENTING SHAREHOLDERS
In terms of section 164 of the Companies Act, at any time before Special Resolution Number 1 as set out in this notice is voted on, a Dissenting Shareholder may give the Company a written notice objecting to Special Resolution Number 1.
Within 10 Business Days after the Company has adopted Special Resolution Number 1, the Company must send a notice that Special Resolution Number 1 has been adopted to each Capespan Shareholder who:
• gave the Company a written notice of objection as contemplated above;• has not withdrawn that notice; and• has voted against Special Resolution Number 1.
A Capespan Shareholder may, within 20 Business Days after receiving the Company’s aforementioned notice of the adoption of Special Resolution Number 1, demand that the Company pay the Capespan Shareholder the fair value for all of the Capespan Shares of the Company held by that person if:
• the Capespan Shareholder has sent the Company a notice of objection;• the Company has adopted Special Resolution Number 1; and• the Capespan Shareholder voted against Special Resolution Number 1 and has complied with all of the
procedural requirements of section 164 of the Companies Act.
The wording of section 164 of the Companies Act is set out in Annexure 9 to the Circular.
SIGNED AT BELLVILLE ON THURSDAY, 21 MAY 2015 ON BEHALF OF THE CAPESPAN BOARD
AZ FARRDirector
Company Secretary and Registered Office Transfer Secretaries
PB Fourie Computershare Investor Services Proprietary LimitedVineyards Square North Ground FloorVineyards Office Estate 70 Marshall Street99 Jip de Jager Road Johannesburg, 2001Bellville, 7530
(PO Box 6133, Tyger Valley, 7536) (PO Box 61763, Marshalltown, 2107)

204

CAPESPAN GROUP LIMITED
(Incorporated in the Republic of South Africa)(Registration number 2008/016971/06)
(“Capespan”)
FORM OF PROXY IN RESPECT OF THE GENERAL MEETING OF CAPESPAN SHAREHOLDERS
For use by Capespan Shareholders at the General Meeting of Capespan Shareholders convened in terms of the Companies Act to be held at 11:00 on Wednesday, 24 June 2015 at Spier Wine Estate, Baden Powell Drive, Stellenbosch, or any adjourned or postponed meeting.
The definitions and interpretations commencing on page 9 of the circular to which this form of proxy is attached (“the Circular”) apply mutatis mutandis to this form of proxy.
I/We (Please PRINT names in full)
of (address)
being the holder(s) of Capespan Shares
do hereby appoint (see notes 1 and 2):
1. or failing him/her,
2. or failing him/her,
3. the Chairman of the General Meeting of Capespan Shareholders
as my/our proxy to attend, speak and vote for me/us at the General Meeting of Capespan Shareholders (or any adjournment thereof) for purposes of considering and, if deemed fit, passing, with or without modification, the resolutions to be proposed thereat and at each adjournment thereof and to vote for and/or against the resolutions and/or abstain from voting in respect of the shares registered in my/our name(s), in accordance with the following instruction (see notes):
For Against Abstain
Special Resolution Number 1
Approval of scheme of arrangement between Capespan and Capespan Shareholders
* One vote per Capespan Share held by Capespan Shareholders. Capespan Shareholders must insert the relevant number of votes they wish to vote in the appropriate box provided or “X” should they wish to vote all Capespan Shares held by them.
Signed at: on 2015
Signature
Capacity of signatory (where applicable)
Note: Authority of signatory to be attached – see notes 8 and 9.
Assisted by me (where applicable)
Full name
Capacity
Signature

SUMMARY OF RIGHTS CONTAINED IN SECTION 58 OF THE COMPANIES ACTIn terms of section 58 of the Companies Act:• A shareholder of a company may, at any time and in accordance with the provisions of section 58 of the Companies Act, appoint any
individual (including an individual who is not a Capespan Shareholder) as a proxy to participate in, and speak and vote at, a shareholders’ meeting on behalf of such shareholder.
• A shareholder may appoint two or more persons concurrently as proxies, and may appoint more than one proxy to exercise voting rights attached to different securities held by the shareholder.
• A proxy may delegate his authority to act on behalf of a shareholder to another person, subject to any restriction set out in the instrument appointing such proxy.
• Irrespective of the form of instrument used to appoint a proxy, the appointment of a proxy is suspended at any time and to the extent that the relevant shareholder chooses to act directly and in person in the exercise of any of such shareholder’s rights as a shareholder.
• Any appointment by a shareholder of a proxy is revocable, unless the form of instrument used to appoint such proxy states otherwise.• If an appointment of a proxy is revocable, a shareholder may revoke the proxy appointment by (i) cancelling it in writing, or making
a later inconsistent appointment of a proxy and (ii) delivering a copy of the revocation instrument to the proxy and to the relevant company.
• A proxy appointed by a shareholder is entitled to exercise, or abstain from exercising, any voting right of such shareholder without direction, except to the extent that the relevant company’s memorandum of incorporation, or the instrument appointing the proxy, provides otherwise.
• If the instrument appointing a proxy or proxies has been delivered by a shareholder to a company, then, for so long as that appointment remains in effect, any notice that is required in terms of the Companies Act or such company’s memorandum of incorporation to be delivered to a shareholder must be delivered by such company to: – the relevant shareholder; or – the proxy or proxies, if the relevant shareholder has: (i) directed such company to do so, in writing and (ii) paid any reasonable
fee charged by such company for doing so.Notes:1. Each Capespan Shareholder is entitled to appoint 1 (one) (or more) proxies (none of whom need be a Capespan Shareholder) to
attend, speak and vote in place of that Capespan Shareholder at the General Meeting of Capespan Shareholders.2. A Capespan Shareholder may insert the name of a proxy or the names of two alternative proxies of the Capespan Shareholder’s
choice in the space/s provided with or without deleting “the Chairman of the General Meeting of Capespan Shareholders” but the Capespan Shareholder must initial any such deletion. The person whose name stands first on the form of proxy and who is present at the General Meeting of Capespan Shareholders will be entitled to act as proxy to the exclusion of those whose names follow.
3. A Capespan Shareholder’s instructions to the proxy must be indicated by the insertion of the relevant number of votes exercisable by the Capespan Shareholder in the appropriate box provided. Failure to comply with the above will be deemed to authorise and direct the chairman of the General Meeting of Capespan Shareholders, if the chairman is the authorised proxy, or any other proxy, to vote or abstain from voting at the General Meeting of Capespan Shareholders as he/she deems fit, in respect of all the Capespan Shareholder’s votes exercisable at the meeting.
4. Completed forms of proxy and the authority (if any) under which they are signed must be lodged with or posted to the Transfer Secretaries at Ground Floor, 70 Marshall Street, Johannesburg, 2001 (PO Box 61763, Marshalltown, 2107) or Capespan’s company secretary at Vineyards Square North, Vineyards Office Estate, 99 Jip de Jager Road, Bellville, 7530 (PO Box 6133, Tyger Valley, 7536), to be received by them by no later than 48 hours before the commencement of the General Meeting (or any adjournment of the General Meeting), excluding Saturdays, Sundays and official public holidays or, alternatively, such form of proxy may be handed to the chairman of the General Meeting prior to the commencement of the General Meeting.
5. The completion and lodging of this form of proxy will not preclude the relevant Capespan Shareholder from attending the General Meeting of Capespan Shareholders and speaking and voting in person thereat to the exclusion of any proxy appointed in terms hereof, should such Capespan Shareholder wish to do so.
6. The chairman of the General Meeting of Capespan Shareholders may accept or reject any form of proxy not completed and/or received in accordance with these notes or with the memorandum of incorporation of Capespan.
7. Any alteration or correction made to this form of proxy must be initialled by the signatory/ies.8. Documentary evidence establishing the authority of a person signing this form of proxy in a representative capacity (e.g. for a
company, close corporation, trust, pension fund, deceased estate, etc.) must be attached to this form of proxy, unless previously recorded by Capespan.
9. Where this form of proxy is signed under power of attorney, such power of attorney must accompany this form of proxy, unless it has been registered by Capespan or waived by the chairman of the General Meeting of Capespan Shareholders.
10. Where Capespan Shares are held jointly, all joint holders are required to sign this form of proxy.11. A minor Capespan Shareholder must be assisted by his/her parent/guardian, unless the relevant documents establishing his/her
legal capacity are produced or have been registered by Capespan.12. This form of proxy shall be valid at any resumption of an adjourned meeting to which it relates although this form of proxy shall not
be used at the resumption of an adjourned meeting if it could not have been used at the General Meeting of Capespan Shareholders from which it was adjourned for any reason other than it was not lodged timeously for the meeting from which the adjournment took place. This form of proxy shall in addition to the authority conferred by the Companies Act, except insofar as it provides otherwise, be deemed to confer the power generally to act at the General Meeting of Capespan Shareholders in question, subject to any specific direction contained in this form of proxy as to the manner of voting.
13. A vote given in accordance with the terms of an instrument of proxy shall be valid notwithstanding the death or mental disorder of the principal or revocation of the proxy or of the authority under which the proxy was executed, or the transfer of the Capespan Share in respect of which the proxy is given, provided that no notification in writing of such death, insanity, revocation or transfer as aforesaid shall have been received by Capespan before the commencement of the meeting or adjourned meeting at which the proxy is used.
14. Any proxy appointed pursuant to this form of proxy may not delegate her or his authority to act on behalf of the relevant Capespan Shareholder.
15. In terms of section 58 of the Companies Act, unless revoked, an appointment of a proxy pursuant to this form of proxy remains valid only until the end of the General Meeting of Capespan Shareholders or any adjournment of such General Meeting.

CAPESPAN GROUP LIMITED
(Incorporated in the Republic of South Africa)(Registration number 2008/016971/06)
(“Capespan”)
FORM OF SURRENDER, TRANSFER AND ACCEPTANCE
The definitions and interpretations commencing on page 9 of the circular to which this form of surrender, transfer and acceptance is attached (“the Circular”), apply mutatis mutandis to this form of surrender, transfer and acceptance.
This form should be read in conjunction with the Circular.
Instructions:
1. A separate form of surrender, transfer and acceptance is required for each Capespan Shareholder. Capespan Shareholders must complete this form in BLOCK CAPITALS.
2. Part A must be completed by all Capespan Shareholders who return this form and relates to the surrender of Documents of Title.
3. Part B must be completed by Capespan Shareholders who are emigrants from or non-residents of the Common Monetary Area (see note 2).
4. Part C must be completed by all Capespan Shareholders who return this form and relates to the settlement of the Scheme Consideration.
Please also read notes overleaf.

To: The Transfer Secretaries
Hand deliveries to: Postal deliveries to:
Computershare Investor Services Proprietary Limited
Computershare Investor Services Proprietary Limited
Ground Floor PO Box 6176370 Marshall Street MarshalltownJohannesburg 21072001
Capespan Shareholders may return this form of surrender, transfer and acceptance (blue) and (if applicable) their Documents of Title either to:
– the Transfer Secretaries (Computershare Investor Services Proprietary Limited), at the address provided above; OR
– Capespan’s company secretary (Mr PB Fourie) at Vineyards Square North, Vineyards Office Estate, 99 Jip de Jager Road, Bellville, 7530 (PO Box 6133, Tyger Valley, 7536),
whichever is more convenient to Capespan Shareholders.
Dear Sir
PART A – SURRENDER OF DOCUMENTS OF TITLE
ALL CAPESPAN SHAREHOLDERS WHO RETURN THIS FORM MUST PLEASE COMPLETE PART A.
Capespan Shareholders who wish to anticipate the Scheme becoming operative and expedite settlement of the Scheme Consideration should complete and return this form to the Transfer Secretaries together with their Document(s) of Title by no later 12:00 on the Scheme Consideration Record Date.
Should the Scheme not become operative, any Documents of Title surrendered to the Transfer Secretaries will be returned to such shareholders by the Transfer Secretaries, at such shareholders’ own risk, by registered post within five Business Days from the date of receipt of the Documents of Title or the date on which it becomes known that the Scheme will not become operative, whichever is the later.
In any event, should the Scheme become operative, Capespan Shareholders will have to complete and return this form (even if after the Scheme Consideration Record Date) to the Transfer Secretaries together with their Document(s) of Title.
Surname or Name of corporate body
First names (in full)
Title
Identity number
Address (see Part C below)
Postal code
Country
Telephone ( )
Cell phone number ( )
Email address
Fax number ( )
Please note: In order to comply with the requirements of the Financial Intelligence Centre Act, 2001, the Transfer Secretaries will be unable to record any change of address mandated unless the following documentation is received from the relevant Capespan Shareholder: – an original certified copy of your identity document; – an original certified copy of a document issued by the South African Revenue Services to verify your tax
number (if you do not have a tax number, please confirm this in writing and have the letter signed by a Commissioner of Oaths); and
– an original or an original certified copy of a service bill to verify your physical address.

I/WE HEREBY SURRENDER THE ENCLOSED SHARE CERTIFICATE/S, CERTIFIED TRANSFER DEED/S AND/OR OTHER DOCUMENTS OF TITLE, DETAILS OF WHICH HAVE BEEN COMPLETED BELOW, IN RESPECT OF MY/OUR HOLDING OF CAPESPAN SHARES.Share certificate/s and/or other Document(s) of Title to be surrendered (as enclosed)
Name of registered holder(separate form for each holder)
Certificate number(s)(in numerical order)
Number of Capespan Shares covered by each certificate
Total
Signature of Capespan Shareholder Stamp and address of agent lodging this form
Assisted by me (if applicable)
State full name and capacity
Date 2015
Telephone number (Home) ( )
Telephone number (Work) ( )
Cell phone number ( )
Signatories may be called upon for evidence of their authority or capacity to sign this form.
PART B
1. To be completed only by Capespan Shareholders who are emigrants from the Common Monetary Area.
The Scheme Consideration will be forwarded to the authorised dealer nominated below for its control and credited to the emigrant’s blocked account. Accordingly, a non-resident who is an emigrant from South Africa must provide the following information:
Name and address of authorised dealer in South Africa or substitute instruction
Account number
2. To be completed only by all other non-resident Capespan Shareholders who wish to provide a substitute address.
The Scheme Consideration will be posted to the registered address of the non-resident concerned, unless written instructions to the contrary are received and a substitute address provided below:
Substitute address
3. If no nomination is made in terms of 1 above, the Scheme Consideration will be held in trust by the Transfer Secretaries.

PART C – SETTLEMENT OF SCHEME CONSIDERATION
In order to comply with recent legislative changes, the Scheme Consideration Shares may only be issued in Dematerialised form.All Capespan Shareholders# should kindly complete the section below, dealing with the settlement of the Scheme Consideration Shares, in the event that the Capespan Shareholder becomes entitled to the Scheme Consideration Shares as a result of the Scheme becoming operative.
1. Please tick this box if you have an account with a Broker or CSDP and wish such account to be credited with the Scheme Consideration Shares, and insert the details of such account below:
Name of account holder:Name of Broker:Name of CSDP:Account number of Broker:Account number of CSDP:Telephone number of Broker/CSDP:SCA number of Broker/CSDP:
Please note: Should the account details provided by you above be incorrect or incomplete, or should this form and Documents of Title be submitted after 12:00 on the Scheme Consideration Record Date, it will not be possible to credit such account with the Scheme Consideration Shares, in which case you will be issued with a statement of allocation, confirming the number of Scheme Consideration Shares due to you. The statement of allocation will be sent to you, at your risk, at the address set out in the Register.
2. Please tick this box if you do not have an account with a Broker or CSDP, but wish to receive the Scheme Consideration Shares in Dematerialised form and not in certificated form. It will be necessary for you to appoint a Broker or CSDP before the Scheme Consideration Shares can be credited to your Broker or CSDP account. In the meantime, you will be issued with a statement of allocation, confirming the number of Scheme Consideration Shares due to you. The statement of allocation will be sent to you, at your risk, at the address set out in the Register.
3. Please tick this box if you do NOT wish to receive the Scheme Consideration Shares in Dematerialised form and instead wish to withdraw the Dematerialised Scheme Consideration Shares due to you and replace these with a physical Document of Title (share certificate). The Document of Title (share certificate) for the Scheme Consideration Shares will be sent you, at your risk, at the address set out in the Register.
Notes:
1. Emigrants from the Common Monetary Area must complete Part B.2. All other non-residents of the Common Monetary Area must complete Part B if they wish the Scheme Consideration to be sent to
an address other than their address in the Register.3. If Part B is not properly completed, the Scheme Consideration (in the case of emigrants) will be held in trust by the Transfer
Secretaries pending receipt of the necessary nomination or instruction.4. The Scheme Consideration will not be sent to Capespan Shareholders unless and until Documents of Title in respect of the
relevant Capespan Shares have been surrendered to the Transfer Secretaries.5. If a Capespan Shareholder produces evidence to the satisfaction of Capespan and Zeder that Documents of Title in respect of
Capespan Shares have been lost or destroyed, Capespan may waive the surrender of such Documents of Title against delivery of a duly executed indemnity in a form and on terms and conditions approved by Capespan and Zeder, or may in their discretion waive such indemnity.
6. If this form of surrender, transfer and acceptance is not signed by the Capespan Shareholder, the Capespan Shareholder will be deemed to have irrevocably appointed the company secretary of Capespan to implement that Capespan Shareholder’s obligations under the Scheme on his/her behalf.
7. Persons who have acquired Capespan Shares after the date of posting of the Circular to which this form of surrender, transfer and acceptance is attached, can obtain copies of the form of surrender, transfer and acceptance and the Circular from Capespan’s company secretary at Vineyards Square North, Vineyards Office Estate, 99 Jip de Jager Road, Bellville, 7530 (PO Box 6133, Tyger Valley, 7536) and from the Transfer Secretaries at Computershare Investor Services Proprietary Limited, Ground Floor, 70 Marshall Street, Johannesburg, 2001 (PO Box 61763, Marshalltown, 2107).
8. No receipts will be issued for documents lodged, unless specifically requested. In compliance with the requirements of the JSE, lodging agents are requested to prepare special transaction receipts. Signatories may be called upon for evidence of their authority or capacity to sign this form.
9. Any alteration to this form of surrender, transfer and acceptance must be signed in full and should not be merely initialled.10. If this form of surrender, transfer and acceptance is signed under a power of attorney, then such power of attorney, or a notarially
certified copy hereof, must be sent with this form for noting (unless it has already been noted by Capespan or the Transfer Secretaries).
11. Where the Capespan Shareholder is a company or a close corporation, unless it has already been registered with Capespan or the Transfer Secretaries, a certified copy of the directors’ or members’ resolution authorising the signing of this form of surrender, transfer and acceptance must be submitted if so requested by Capespan.
12. Note 11 above does not apply in the event of this form bearing the stamp of a broking member of the JSE.13. Where Capespan Shares are held jointly, all joint holders are required to sign this form of surrender, transfer and acceptance.
# Save for Dissenting Shareholders who have given notice in terms of sections 164(5) to 164(8) of the Companies Act and who do not withdraw their respective demands or allow any offers by the Company to them in terms of section 164(11) of the Companies Act to lapse.

211

212 PRINTEDBYINCE(PTY)LTD REF.JOB0007623
Copyright © 2022 FDOKUMEN